UNITED STATES
SECURITIES AND EXCHANGE COMMISSION
Washington, D.C. 20549
Form N-CSR
CERTIFIED SHAREHOLDER REPORT OF REGISTERED
MANAGEMENT INVESTMENT COMPANIES
Investment Company Act File Number: 811-04015
Eaton Vance Mutual Funds Trust
(Exact Name of Registrant as Specified in Charter)
Two International Place, Boston, Massachusetts 02110
(Address of Principal Executive Offices)
Maureen A. Gemma
Two International Place, Boston, Massachusetts 02110
(Name and Address of Agent for Services)
(617) 482-8260
(Registrant’s Telephone Number)
October 31
Date of Fiscal Year End
October 31, 2012
Date of Reporting Period
Item 1. Reports to Stockholders
| | |
Eaton Vance Multi-Strategy Absolute Return Fund Annual Report October 31, 2012 | | 
|

Fund shares are not insured by the FDIC and are not deposits or other obligations of, or guaranteed by, any depository institution. Shares are subject to investment risks, including possible loss of principal invested.
This report must be preceded or accompanied by a current summary prospectus or prospectus. Before investing, investors should consider carefully the investment objective, risks, and charges and expenses of a mutual fund. This and other important information is contained in the summary prospectus and prospectus, which can be obtained from a financial advisor. Prospective investors should read the prospectus carefully before investing. For further information, please call 1-800-262-1122.
Annual Report October 31, 2012
Eaton Vance
Multi-Strategy Absolute Return Fund
Table of Contents
| | | | |
Management’s Discussion of Fund Performance | | | 2 | |
| |
Performance | | | 3 | |
| |
Fund Profile | | | 4 | |
| |
Endnotes and Additional Disclosures | | | 5 | |
| |
Fund Expenses | | | 6 | |
| |
Financial Statements | | | 7 | |
| |
Report of Independent Registered Public Accounting Firm | | | 21 | |
| |
Federal Tax Information | | | 22 | |
| |
Management and Organization | | | 23 | |
| |
Important Notices | | | 25 | |
Eaton Vance
Multi-Strategy Absolute Return Fund
October 31, 2012
Management’s Discussion of Fund Performance1
Economic and Market Conditions
During the 12 months ended October 31, 2012, financial markets worldwide climbed, despite a less-than-ideal global economic backdrop. In the United States, the economy grew at a disappointing annual pace of 2.7% or less, and unemployment remained stubbornly high — dropping below 8% in September 2012 for the first time in more than three years. A pickup in the U.S. housing market and improved consumer sentiment, however, offered some encouragement. By contrast, economies in the U.K., European Union and many emerging markets weakened, pressured by the sovereign debt crisis in Europe and signs of slowing growth in China.
Financial markets responded positively, as central banks in the United States and Europe undertook stimulus measures aimed at averting further economic deterioration. Last fall, the U.S. Federal Reserve (the Fed) initiated “Operation Twist,” a program aimed at lowering borrowing costs for consumers and businesses, while the European Central Bank (ECB) put in place a long-term refinancing operation giving struggling eurozone banks access to very low interest-rate, three-year loans. By the New Year, the U.S. economy was showing signs of improvement and the fiscal situation in Europe was starting to stabilize, buoying the financial markets. However, investors grew risk-averse in the second quarter, as U.S. economic momentum faded and the sovereign debt crisis in Europe deepened. In the summer, markets benefited, as investors correctly anticipated more monetary stimulus measures in the United States and additional efforts in Europe to address the sovereign debt crisis. The ECB subsequently pledged to do whatever was necessary to save the euro and outlined an aggressive government bond repurchase program to help fiscally strapped eurozone countries. In the United States, the Fed announced a third round of U.S. quantitative easing — involving the open-ended purchase of agency mortgage-backed securities — along with plans to keep short-term interest rates near zero through mid-2015. Markets retreated late in the period amid mounting worries over the U.S. presidential election and looming fiscal cliff.
A combination of declining interest rates and central bank intervention helped bond prices move higher, with the Barclays Capital U.S. Aggregate Index2 returning 5.25% for the year. Within the fixed-income market, the biggest gains came from higher-risk, lower credit quality bonds. Longer-maturity assets also did well, benefiting as yields fell more on longer-maturity than shorter-term issues.
Fund Performance
For the fiscal year ended October 31, 2012, Eaton Vance Multi-Strategy Absolute Return Fund’s (the Fund) Class A shares had a total return of 1.97% at net asset value (NAV), outperforming the 0.08% gain of its benchmark, the BofA Merrill Lynch 3-Month U.S. Treasury Bill Index (the Index).
Nearly all of the Fund’s underlying Portfolios contributed positively to performance.
Some of the biggest contributions to performance versus the Index came from the Floating Rate Portfolio and the option absolute return strategy employed within the MSAR Completion Portfolio. The Floating Rate Portfolio benefited, as investors flocked to the higher-yields offered by floating-rate loans, which are typically issued by below-investment-grade companies. In addition, the prices on the securities appreciated, as credit spreads–the difference between the yields on lower- and higher-quality issues–tightened. The option absolute return strategy–which involves a series of put and call option spread combinations on the S&P 500 Index–performed well during a period of relatively low market volatility.
Elsewhere, foreign exposure through the Global Macro Portfolio and Global Macro Absolute Return Advantage Portfolio aided results versus the Index. These Portfolios, which focus on long and short positions in sovereign debt and currencies, gained due in part to foreign currencies appreciating against the U.S. dollar. To a lesser extent, a stake in commercial mortgage-backed securities (CMBS) within the MSAR Completion Portfolio contributed to performance versus the Index. The Fund’s focus during the period was on high-quality, short-maturity, low-volatility issues that generated higher income rather than similar-maturity U.S. Treasuries. On the margin, a small increase in the Fund’s overall duration–a measure of interest-rate sensitivity–aided performance versus the Index.
The Fund’s conservative positioning relative to its targeted volatility range muted results versus the Index, as higher-risk assets outperformed. The Fund’s stake in the Global Macro Absolute Return Advantage Portfolio and its exposure to the option absolute return strategy was reduced during the period. At the same time, the Fund increased its weighting in the Parametric Structured Absolute Return Portfolio, which is a lower-risk, more market-neutral portfolio. Small stakes in U.S. government agency mortgage-backed securities (through the Short-Term U.S. Government and Government Obligations Portfolios) and investment-grade corporate bonds had minimal impact on overall performance versus the Index. Some of the hedging strategies within the MSAR Completion Portfolio detracted from performance versus the Index. The Fund had some S&P 500 Index put options to manage the risk of owning the floating-rate loans and risk, in general. As the markets went up, the cost of owning these contracts dragged on performance versus the Index.
|
See Endnotes and Additional Disclosures in this report. Past performance is no guarantee of future results. Returns are historical and are calculated by determining the percentage change in net asset value (NAV) or offering price (as applicable) with all distributions reinvested. Investment return and principal value will fluctuate so that shares, when redeemed, may be worth more or less than their original cost. Performance less than one year is cumulative. Performance is for the stated time period only; due to market volatility, the Fund’s current performance may be lower or higher than quoted. Returns are before taxes unless otherwise noted. For performance as of the most recent month end, please refer to www.eatonvance.com. |
Eaton Vance
Multi-Strategy Absolute Return Fund
October 31, 2012
Performance2,3
Portfolio Managers Jeffrey A. Rawlins, CFA, Dan R. Strelow, CFA, Justin H. Bourgette, CFA and Thomas A. Shively
| | | | | | | | | | | | | | | | |
| % Average Annual Total Returns | | Inception Date | | | One Year | | | Five Years | | | Since
Inception | |
Class A at NAV | | | 12/07/2004 | | | | 1.97 | % | | | 3.43 | % | | | 4.11 | % |
Class A with 4.75% Maximum Sales Charge | | | — | | | | –2.90 | | | | 2.43 | | | | 3.47 | |
Class B at NAV | | | 12/07/2004 | | | | 1.21 | | | | 2.66 | | | | 3.32 | |
Class B with 5% Maximum Sales Charge | | | — | | | | –3.75 | | | | 2.32 | | | | 3.32 | |
Class C at NAV | | | 12/07/2004 | | | | 1.32 | | | | 2.69 | | | | 3.34 | |
Class C with 1% Maximum Sales Charge | | | — | | | | 0.33 | | | | 2.69 | | | | 3.34 | |
Class I at NAV | | | 10/01/2009 | | | | 2.33 | | | | — | | | | 4.39 | |
BofA Merrill Lynch 3-Month U.S. Treasury Bill Index | | | 12/07/2004 | | | | 0.08 | % | | | 0.66 | % | | | 1.96 | % |
| | | | |
| | | | | | | | | | | | | | | | |
| % Total Annual Operating Expense Ratios4 | | Class A | | | Class B | | | Class C | | | Class I | |
| | | 1.22 | % | | | 1.96 | % | | | 1.96 | % | | | 0.98 | % |
Performance of $10,000
This graph shows the change in value of a hypothetical investment of $10,000 in Class A of the Fund for the period indicated. For comparison, the same investment is shown in the indicated index.
| | | | | | | | |
| Performance of Investment | | Amount Invested | | Period Beginning | | At NAV | | With Maximum
Sales Charge |
Class B | | $ 10,000 | | 12/07/2004 | | $ 12,948 | | N.A. |
Class C | | $ 10,000 | | 12/07/2004 | | $ 12,962 | | N.A. |
Class I | | $ 250,000 | | 10/01/2009 | | $ 285,475 | | N.A. |
See Endnotes and Additional Disclosures in this report.
Past performance is no guarantee of future results. Returns are historical and are calculated by determining the percentage change in net asset value (NAV) or offering price (as applicable) with all distributions reinvested. Investment return and principal value will fluctuate so that shares, when redeemed, may be worth more or less than their original cost. Performance less than one year is cumulative. Performance is for the stated time period only; due to market volatility, the Fund’s current performance may be lower or higher than quoted. Returns are before taxes unless otherwise noted. For performance as of the most recent month end, please refer to www.eatonvance.com.
Eaton Vance
Multi-Strategy Absolute Return Fund
October 31, 2012
Fund Profile5
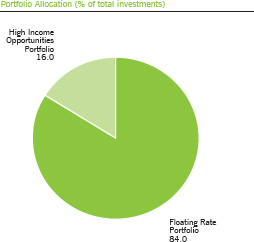
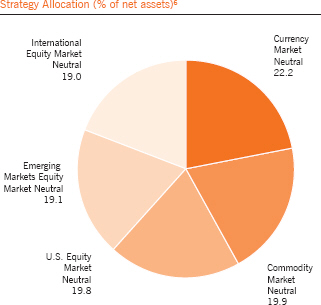
Portfolio Allocation (% of net assets)
Fund Weightings (% of net assets)6
| | | | |
Absolute Return Strategies | | | 52.0 | % |
Global Macro Portfolio | | | 14.9 | |
Global Macro Absolute Return Advantage Portfolio | | | 7.4 | |
Parametric Structured Absolute Return Portfolio | | | 24.8 | |
Option Absolute Return Strategy* | | | 4.9 | |
Income Strategies | | | 40.5 | % |
Short-Term U.S. Government Portfolio | | | 5.1 | |
Government Obligations Portfolio | | | 10.0 | |
CMBS* | | | 11.1 | |
Investment-Grade Corporate Bonds* | | | 1.6 | |
Floating Rate Portfolio | | | 12.7 | |
Other | | | 0.3 | |
Equity Options* | | | -2.4 | |
U.S. Treasury Futures* | | | 2.7 | |
Cash & Cash Equivalents* | | | 12.3 | |
| * | Held in MSAR Completion Portfolio. |
See Endnotes and Additional Disclosures in this report.
Eaton Vance
Multi-Strategy Absolute Return Fund
October 31, 2012
Endnotes and Additional Disclosures
| 1 | The views expressed in this report are those of the portfolio manager(s) and are current only through the date stated at the top of this page. These views are subject to change at any time based upon market or other conditions, and Eaton Vance and the Fund(s) disclaim any responsibility to update such views. These views may not be relied upon as investment advice and, because investment decisions are based on many factors, may not be relied upon as an indication of trading intent on behalf of any Eaton Vance fund. This commentary may contain statements that are not historical facts, referred to as “forward looking statements”. The Fund’s actual future results may differ significantly from those stated in any forward looking statement, depending on factors such as changes in securities or financial markets or general economic conditions, the volume of sales and purchases of Fund shares, the continuation of investment advisory, administrative and service contracts, and other risks discussed from time to time in the Fund’s filings with the Securities and Exchange Commission. |
| 2 | Barclays Capital U.S. Aggregate Index is an unmanaged index of domestic investment-grade bonds, including corporate, government and mortgage-backed securities. BofA Merrill Lynch 3-Month U.S. Treasury Bill Index is an unmanaged index of U.S. Treasury securities maturing in 90 days. BofA Merrill Lynch® indices not for redistribution or other uses; provided “as is”, without warranties, and with no liability. Eaton Vance has prepared this report, BofAML does not endorse it, or guarantee, review, or endorse Eaton Vance’s products. S&P 500 Index is an unmanaged index of large-cap stocks commonly used as a measure of U.S. stock market performance. Unless otherwise stated, index returns do not reflect the effect of any applicable sales charges, commissions, expenses, taxes or leverage, as applicable. It is not possible to invest directly in an index. |
| 3 | Total Returns at NAV do not include applicable sales charges. If sales charges were deducted, the returns would be lower. Total Returns shown with maximum sales charge reflect the stated maximum sales charge. Unless otherwise stated, performance does not reflect the deduction of taxes on Fund distributions or redemptions of Fund shares. |
| 4 | Source: Fund prospectus. |
| 5 | Fund primarily invests in one or more affiliated investment companies (Portfolios) and may also invest directly. Unless otherwise noted, references to investments are to the aggregate holdings of the Fund and the Portfolios. |
| 6 | Economic value is shown for derivatives holdings and, thus, total will not add to 100%. If applicable, CMBS refers to commercial mortgage-backed securities. |
| | Fund profile subject to change due to active management. |
Eaton Vance
Multi-Strategy Absolute Return Fund
October 31, 2012
Fund Expenses
Example: As a Fund shareholder, you incur two types of costs: (1) transaction costs, including sales charges (loads) on purchases and redemption fees (if applicable); and (2) ongoing costs, including management fees; distribution and/or service fees; and other Fund expenses. This Example is intended to help you understand your ongoing costs (in dollars) of Fund investing and to compare these costs with the ongoing costs of investing in other mutual funds. The Example is based on an investment of $1,000 invested at the beginning of the period and held for the entire period (May 1, 2012 – October 31, 2012).
Actual Expenses: The first section of the table below provides information about actual account values and actual expenses. You may use the information in this section, together with the amount you invested, to estimate the expenses that you paid over the period. Simply divide your account value by $1,000 (for example, an $8,600 account value divided by $1,000 = 8.6), then multiply the result by the number in the first section under the heading entitled “Expenses Paid During Period” to estimate the expenses you paid on your account during this period.
Hypothetical Example for Comparison Purposes: The second section of the table below provides information about hypothetical account values and hypothetical expenses based on the actual Fund expense ratio and an assumed rate of return of 5% per year (before expenses), which is not the actual Fund return. The hypothetical account values and expenses may not be used to estimate the actual ending account balance or expenses you paid for the period. You may use this information to compare the ongoing costs of investing in your Fund and other funds. To do so, compare this 5% hypothetical example with the 5% hypothetical examples that appear in the shareholder reports of the other funds.
Please note that the expenses shown in the table are meant to highlight your ongoing costs only and do not reflect any transactional costs, such as sales charges (loads) or redemption fees (if applicable). Therefore, the second section of the table is useful in comparing ongoing costs only, and will not help you determine the relative total costs of owning different funds. In addition, if these transactional costs were included, your costs would be higher.
| | | | | | | | | | | | | | | | |
| | | Beginning
Account Value
(5/1/12) | | | Ending
Account Value
(10/31/12) | | | Expenses Paid
During Period*
(5/1/12 – 10/31/12) | | | Annualized
Expense
Ratio | |
| | | | |
| | | | | | | | | | | | | | | | |
Actual | |
Class A | | $ | 1,000.00 | | | $ | 1,009.60 | | | $ | 6.26 | | | | 1.24 | % |
Class B | | $ | 1,000.00 | | | $ | 1,005.80 | | | $ | 10.08 | | | | 2.00 | % |
Class C | | $ | 1,000.00 | | | $ | 1,006.90 | | | $ | 10.09 | | | | 2.00 | % |
Class I | | $ | 1,000.00 | | | $ | 1,010.80 | | | $ | 5.00 | | | | 0.99 | % |
| | | | | | | | | | | | | | | | | |
| | | | |
| | | | | | | | | | | | | | | | |
Hypothetical | | | | | | | | | | | | | |
(5% return per year before expenses) | | | | | | | | | | | | | |
Class A | | $ | 1,000.00 | | | $ | 1,018.90 | | | $ | 6.29 | | | | 1.24 | % |
Class B | | $ | 1,000.00 | | | $ | 1,015.10 | | | $ | 10.13 | | | | 2.00 | % |
Class C | | $ | 1,000.00 | | | $ | 1,015.10 | | | $ | 10.13 | | | | 2.00 | % |
Class I | | $ | 1,000.00 | | | $ | 1,020.20 | | | $ | 5.03 | | | | 0.99 | % |
| * | Expenses are equal to the Fund’s annualized expense ratio for the indicated Class, multiplied by the average account value over the period, multiplied by 184/366 (to reflect the one-half year period). The Example assumes that the $1,000 was invested at the net asset value per share determined at the close of business on April 30, 2012. The Example reflects the expenses of both the Fund and the Portfolios. |
Eaton Vance
Multi-Strategy Absolute Return Fund
October 31, 2012
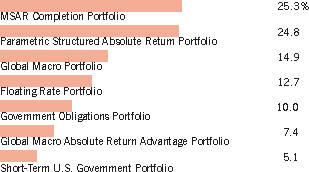
Portfolio of Investments
| | | | | | | | |
| Investments in Affiliated Portfolios | | Value | | | % of Net
Assets | |
Floating Rate Portfolio
(identified cost, $94,164,468) | | $ | 91,694,121 | | | | 12.7 | % |
Global Macro Absolute Return Advantage Portfolio
(identified cost, $53,718,604) | | | 53,204,507 | | | | 7.4 | |
Global Macro Portfolio
(identified cost, $104,108,670) | | | 106,949,270 | | | | 14.9 | |
Government Obligations Portfolio
(identified cost, $66,487,647) | | | 71,726,848 | | | | 10.0 | |
MSAR Completion Portfolio
(identified cost, $180,376,806) | | | 182,337,525 | | | | 25.3 | |
Parametric Structured Absolute Return Portfolio
(identified cost, $172,021,820) | | | 178,543,498 | | | | 24.8 | |
Short-Term U.S. Government Portfolio
(identified cost, $34,910,641) | | | 36,575,713 | | | | 5.1 | |
| | | | | | | | | |
| | |
Total Investments in Affiliated Portfolios
(identified cost $705,788,656) | | | $721,031,482 | | | | 100.2 | % |
| | | | | | | | | |
| | |
Other Assets, Less Liabilities | | | $(1,230,369) | | | | (0.2 | )% |
| | | | | | | | | |
| | |
Net Assets | | $ | 719,801,113 | | | | 100.0 | % |
| | | | | | | | | |
| | | | |
| | 7 | | See Notes to Financial Statements. |
Eaton Vance
Multi-Strategy Absolute Return Fund
October 31, 2012
Statement of Assets and Liabilities
| | | | |
| Assets | | October 31, 2012 | |
Affiliated investments, at value (identified cost, $705,788,656) | | $ | 721,031,482 | |
Receivable for Fund shares sold | | | 2,265,352 | |
Total assets | | $ | 723,296,834 | |
| |
| Liabilities | | | | |
Payable for Fund shares redeemed | | $ | 2,955,230 | |
Distributions payable | | | 241,934 | |
Payable to affiliates: | | | | |
Distribution and service fees | | | 167,745 | |
Trustees’ fees | | | 42 | |
Accrued expenses | | | 130,770 | |
Total liabilities | | $ | 3,495,721 | |
Net Assets | | $ | 719,801,113 | |
| |
| Sources of Net Assets | | | | |
Paid-in capital | | $ | 762,809,947 | |
Accumulated net realized loss | | | (56,765,149 | ) |
Accumulated distributions in excess of net investment income | | | (1,486,511 | ) |
Net unrealized appreciation | | | 15,242,826 | |
Total | | $ | 719,801,113 | |
| |
| Class A Shares | | | | |
Net Assets | | $ | 338,113,840 | |
Shares Outstanding | | | 37,182,065 | |
Net Asset Value and Redemption Price Per Share | | | | |
(net assets ÷ shares of beneficial interest outstanding) | | $ | 9.09 | |
Maximum Offering Price Per Share | | | | |
(100 ÷ 95.25 of net asset value per share) | | $ | 9.54 | |
| |
| Class B Shares | | | | |
Net Assets | | $ | 16,540,682 | |
Shares Outstanding | | | 1,820,710 | |
Net Asset Value and Offering Price Per Share* | | | | |
(net assets ÷ shares of beneficial interest outstanding) | | $ | 9.08 | |
| |
| Class C Shares | | | | |
Net Assets | | $ | 91,682,316 | |
Shares Outstanding | | | 10,090,133 | |
Net Asset Value and Offering Price Per Share* | | | | |
(net assets ÷ shares of beneficial interest outstanding) | | $ | 9.09 | |
| |
| Class I Shares | | | | |
Net Assets | | $ | 273,464,275 | |
Shares Outstanding | | | 30,083,196 | |
Net Asset Value, Offering Price and Redemption Price Per Share | | | | |
(net assets ÷ shares of beneficial interest outstanding) | | $ | 9.09 | |
On sales of $50,000 or more, the offering price of Class A shares is reduced.
| * | Redemption price per share is equal to the net asset value less any applicable contingent deferred sales charge. |
| | | | |
| | 8 | | See Notes to Financial Statements. |
Eaton Vance
Multi-Strategy Absolute Return Fund
October 31, 2012
Statement of Operations
| | | | |
| Investment Income | | Year Ended
October 31, 2012 | |
Interest and other income allocated from affiliated Portfolios (net of foreign taxes, $34,584) | | $ | 22,240,276 | |
Dividends allocated from affiliated Portfolios (net of foreign taxes, $158,816) | | | 2,241,973 | |
Expenses allocated from affiliated Portfolios | | | (7,247,489 | ) |
Total investment income from Portfolios | | $ | 17,234,760 | |
| |
| Expenses | | | | |
Distribution and service fees | | | | |
Class A | | $ | 991,508 | |
Class B | | | 195,161 | |
Class C | | | 1,261,985 | |
Trustees’ fees and expenses | | | 500 | |
Custodian fee | | | 48,143 | |
Transfer and dividend disbursing agent fees | | | 409,871 | |
Legal and accounting services | | | 48,383 | |
Printing and postage | | | 54,290 | |
Registration fees | | | 78,494 | |
Miscellaneous | | | 16,344 | |
Total expenses | | $ | 3,104,679 | |
| |
Net investment income | | $ | 14,130,081 | |
| |
| Realized and Unrealized Gain (Loss) | | | | |
Net realized gain (loss) — | | | | |
Investment transactions | | $ | (1,148,974 | ) |
Net realized gain (loss) allocated from affiliated Portfolios — | | | | |
Investment transactions (including a gain of $6,112 from precious metals) | | | (22,694,589 | ) |
Written options | | | 9,038,220 | |
Securities sold short | | | 264,714 | |
Futures contracts | | | (5,927,963 | ) |
Swap contracts | | | (2,018,777 | ) |
Forward commodity contracts | | | (81,486 | ) |
Foreign currency and forward foreign currency exchange contract transactions | | | 8,194,225 | |
Net realized loss | | $ | (14,374,630 | ) |
Change in unrealized appreciation (depreciation) — | | | | |
Investments | | $ | 1,148,974 | |
Change in unrealized appreciation (depreciation) allocated from affiliated Portfolios — | | | | |
Investments (including net decrease of $76,230 from precious metals) and (net of decrease in accrued foreign capital gains taxes of $1,097) | | | 18,526,682 | |
Written options | | | 452,404 | |
Securities sold short | | | (1,164,055 | ) |
Futures contracts | | | 1,882,261 | |
Swap contracts | | | (2,432,987 | ) |
Forward commodity contracts | | | 84,904 | |
Foreign currency and forward foreign currency exchange contracts | | | (2,982,021 | ) |
Net change in unrealized appreciation (depreciation) | | $ | 15,516,162 | |
| |
Net realized and unrealized gain | | $ | 1,141,532 | |
| |
Net increase in net assets from operations | | $ | 15,271,613 | |
| | | | |
| | 9 | | See Notes to Financial Statements. |
Eaton Vance
Multi-Strategy Absolute Return Fund
October 31, 2012
Statements of Changes in Net Assets
| | | | | | | | |
| | | Year Ended October 31, | |
| Increase (Decrease) in Net Assets | | 2012 | | | 2011 | |
From operations — | | | | | | | | |
Net investment income | | $ | 14,130,081 | | | $ | 9,230,376 | |
Net realized loss from investment transactions, written options, securities sold short, futures contracts, swap contracts, forward commodity contracts, and foreign currency and forward foreign currency exchange contract transactions | | | (14,374,630 | ) | | | (3,831,907 | ) |
Net change in unrealized appreciation (depreciation) from investments, written options, securities sold short, futures contracts, swap contracts, forward commodity contracts, foreign currency and forward foreign currency exchange contracts | | | 15,516,162 | | | | (1,633,329 | ) |
Net increase in net assets from operations | | $ | 15,271,613 | | | $ | 3,765,140 | |
Distributions to shareholders — | | | | | | | | |
From net investment income | | | | | | | | |
Class A | | $ | (8,239,928 | ) | | $ | (5,488,871 | ) |
Class B | | | (294,032 | ) | | | (340,723 | ) |
Class C | | | (1,909,176 | ) | | | (1,713,171 | ) |
Class I | | | (5,268,497 | ) | | | (2,097,769 | ) |
Tax return of capital | | | | | | | | |
Class A | | | (2,631,821 | ) | | | — | |
Class B | | | (93,913 | ) | | | — | |
Class C | | | (609,788 | ) | | | — | |
Class I | | | (1,682,750 | ) | | | — | |
Total distributions to shareholders | | $ | (20,729,905 | ) | | $ | (9,640,534 | ) |
Transactions in shares of beneficial interest — | | | | | | | | |
Proceeds from sale of shares | | | | | | | | |
Class A | | $ | 200,287,569 | | | $ | 379,976,539 | |
Class B | | | 301,830 | | | | 2,668,301 | |
Class C | | | 15,887,489 | | | | 58,882,498 | |
Class I | | | 226,884,615 | | | | 257,347,130 | |
Net asset value of shares issued to shareholders in payment of distributions declared | | | | | | | | |
Class A | | | 10,473,233 | | | | 4,942,008 | |
Class B | | | 333,604 | | | | 251,430 | |
Class C | | | 2,132,149 | | | | 1,373,441 | |
Class I | | | 4,420,408 | | | | 1,230,201 | |
Cost of shares redeemed | | | | | | | | |
Class A | | | (284,458,290 | ) | | | (115,312,350 | ) |
Class B | | | (5,634,199 | ) | | | (7,365,582 | ) |
Class C | | | (69,144,751 | ) | | | (39,239,467 | ) |
Class I | | | (144,431,760 | ) | | | (72,667,527 | ) |
Net asset value of shares exchanged | | | | | | | | |
Class A | | | 779,900 | | | | 1,203,178 | |
Class B | | | (779,900 | ) | | | (1,203,178 | ) |
Net increase (decrease) in net assets from Fund share transactions | | $ | (42,948,103 | ) | | $ | 472,086,622 | |
| | |
Net increase (decrease) in net assets | | $ | (48,406,395 | ) | | $ | 466,211,228 | |
| | |
| Net Assets | | | | | | | | |
At beginning of year | | $ | 768,207,508 | | | $ | 301,996,280 | |
At end of year | | $ | 719,801,113 | | | $ | 768,207,508 | |
| | |
Accumulated undistributed (distributions in excess of) net investment income
included in net assets | | | | | | | | |
At end of year | | $ | (1,486,511 | ) | | $ | 913,668 | |
| | | | |
| | 10 | | See Notes to Financial Statements. |
Eaton Vance
Multi-Strategy Absolute Return Fund
October 31, 2012
Financial Highlights
| | | | | | | | | | | | | | | | | | | | |
| | | Class A | |
| | | Year Ended October 31, | |
| | | 2012 | | | 2011 | | | 2010 | | | 2009 | | | 2008 | |
Net asset value — Beginning of year | | $ | 9.160 | | | $ | 9.200 | | | $ | 8.890 | | | $ | 7.600 | | | $ | 9.630 | |
| | | | | |
| Income (Loss) From Operations | | | | | | | | | | | | | | | | | | | | |
Net investment income(1) | | $ | 0.171 | | | $ | 0.172 | | | $ | 0.350 | | | $ | 0.485 | | | $ | 0.568 | |
Net realized and unrealized gain (loss) | | | 0.007 | | | | (0.023 | ) | | | 0.362 | | | | 1.328 | | | | (1.977 | ) |
| | | | | |
Total income (loss) from operations | | $ | 0.178 | | | $ | 0.149 | | | $ | 0.712 | | | $ | 1.813 | | | $ | (1.409 | ) |
| | | | | |
| Less Distributions | | | | | | | | | | | | | | | | | | | | |
From net investment income | | $ | (0.188 | ) | | $ | (0.189 | ) | | $ | (0.296 | ) | | $ | (0.523 | ) | | $ | (0.588 | ) |
Tax return of capital | | | (0.060 | ) | | | — | | | | (0.106 | ) | | | — | | | | (0.033 | ) |
| | | | | |
Total distributions | | $ | (0.248 | ) | | $ | (0.189 | ) | | $ | (0.402 | ) | | $ | (0.523 | ) | | $ | (0.621 | ) |
| | | | | |
Net asset value — End of year | | $ | 9.090 | | | $ | 9.160 | | | $ | 9.200 | | | $ | 8.890 | | | $ | 7.600 | |
| | | | | |
Total Return(2) | | | 1.97 | % | | | 1.62 | % | | | 8.18 | % | | | 24.98 | % | | | (15.48 | )% |
| | | | | |
| Ratios/Supplemental Data | | | | | | | | | | | | | | | | | | | | |
Net assets, end of year (000’s omitted) | | $ | 338,114 | | | $ | 413,764 | | | $ | 146,073 | | | $ | 139,217 | | | $ | 128,030 | |
Ratios (as a percentage of average daily net assets): | | | | | | | | | | | | | | | | | | | | |
Expenses(3)(4) | | | 1.27 | % | | | 1.22 | % | | | 1.10 | % | | | 1.17 | % | | | 1.14 | % |
Net investment income | | | 1.88 | % | | | 1.86 | % | | | 3.85 | % | | | 6.12 | % | | | 6.22 | % |
Portfolio Turnover of the Fund(5) | | | 68 | % | | | 26 | % | | | 60 | % | | | 61 | % | | | 19 | % |
Portfolio Turnover of Boston Income Portfolio | | | N.A. | | | | 70 | % | | | 75 | % | | | 74 | % | | | 54 | % |
Portfolio Turnover of Floating Rate Portfolio | | | 42 | % | | | 56 | % | | | 39 | % | | | 35 | % | | | 7 | % |
Portfolio Turnover of Global Macro Absolute Return Advantage Portfolio | | | 91 | % | | | 50 | % | | | N.A. | | | | N.A. | | | | N.A. | |
Portfolio Turnover of Global Macro Portfolio | | | 39 | % | | | 33 | % | | | 19 | % | | | 25 | % | | | N.A. | |
Portfolio Turnover of Government Obligations Portfolio | | | 26 | % | | | 19 | % | | | 22 | % | | | 28 | % | | | 19 | % |
Portfolio Turnover of Large-Cap Core Research Portfolio | | | N.A. | | | | 64 | % | | | 51 | % | | | N.A. | | | | N.A. | |
Portfolio Turnover of MSAR Completion Portfolio | | | 37 | % | | | 32 | % | | | 2 | %(6) | | | N.A. | | | | N.A. | |
Portfolio Turnover of Multi-Sector Portfolio | | | N.A. | | | | N.A. | | | | N.A. | | | | 31 | %(7) | | | N.A. | |
Portfolio Turnover of Parametric Structured Absolute Return Portfolio | | | 22 | % | | | N.A. | | | | N.A. | | | | N.A. | | | | N.A. | |
Portfolio Turnover of Short-Term U.S. Government Portfolio | | | 15 | % | | | 6 | % | | | 26 | % | | | N.A. | | | | N.A. | |
| (1) | Computed using average shares outstanding. |
| (2) | Returns are historical and are calculated by determining the percentage change in net asset value with all distributions reinvested and do not reflect the effect of sales charges. |
| (3) | Includes the Fund’s share of the Portfolios’ allocated expenses. |
| (4) | Excludes the effect of custody fee credits, if any, of less than 0.005%. |
| (5) | Percentage includes both the Fund’s contributions to and withdrawals from the Portfolios and purchases and sales of securities held directly by the Fund, if any. |
| (6) | For the period from the Portfolio’s start of business, August 24, 2010, to October 31, 2010. |
| (7) | For the period from the Portfolio’s start of business, July 16, 2009, to October 31, 2009. |
| | | | |
| | 11 | | See Notes to Financial Statements. |
Eaton Vance
Multi-Strategy Absolute Return Fund
October 31, 2012
Financial Highlights — continued
| | | | | | | | | | | | | | | | | | | | |
| | | Class B | |
| | | Year Ended October 31, | |
| | | 2012 | | | 2011 | | | 2010 | | | 2009 | | | 2008 | |
Net asset value — Beginning of year | | $ | 9.150 | | | $ | 9.200 | | | $ | 8.890 | | | $ | 7.590 | | | $ | 9.620 | |
| | | | | |
| Income (Loss) From Operations | | | | | | | | | | | | | | | | | | | | |
Net investment income(1) | | $ | 0.103 | | | $ | 0.115 | | | $ | 0.283 | | | $ | 0.426 | | | $ | 0.500 | |
Net realized and unrealized gain (loss) | | | 0.006 | | | | (0.045 | ) | | | 0.361 | | | | 1.337 | | | | (1.977 | ) |
| | | | | |
Total income (loss) from operations | | $ | 0.109 | | | $ | 0.070 | | | $ | 0.644 | | | $ | 1.763 | | | $ | (1.477 | ) |
| | | | | |
| Less Distributions | | | | | | | | | | | | | | | | | | | | |
From net investment income | | $ | (0.136 | ) | | $ | (0.120 | ) | | $ | (0.246 | ) | | $ | (0.463 | ) | | $ | (0.524 | ) |
Tax return of capital | | | (0.043 | ) | | | — | | | | (0.088 | ) | | | — | | | | (0.029 | ) |
| | | | | |
Total distributions | | $ | (0.179 | ) | | $ | (0.120 | ) | | $ | (0.334 | ) | | $ | (0.463 | ) | | $ | (0.553 | ) |
| | | | | |
Net asset value — End of year | | $ | 9.080 | | | $ | 9.150 | | | $ | 9.200 | | | $ | 8.890 | | | $ | 7.590 | |
| | | | | |
Total Return(2) | | | 1.21 | % | | | 0.75 | % | | | 7.37 | % | | | 24.22 | % | | | (16.13 | )% |
| | | | | |
| Ratios/Supplemental Data | | | | | | | | | | | | | | | | | | | | |
Net assets, end of year (000’s omitted) | | $ | 16,541 | | | $ | 22,469 | | | $ | 28,217 | | | $ | 31,637 | | | $ | 28,616 | |
Ratios (as a percentage of average daily net assets): | | | | | | | | | | | | | | | | | | | | |
Expenses(3)(4) | | | 2.02 | % | | | 1.96 | % | | | 1.85 | % | | | 1.93 | % | | | 1.88 | % |
Net investment income | | | 1.13 | % | | | 1.25 | % | | | 3.12 | % | | | 5.38 | % | | | 5.48 | % |
Portfolio Turnover of the Fund(5) | | | 68 | % | | | 26 | % | | | 60 | % | | | 61 | % | | | 19 | % |
Portfolio Turnover of Boston Income Portfolio | | | N.A. | | | | 70 | % | | | 75 | % | | | 74 | % | | | 54 | % |
Portfolio Turnover of Floating Rate Portfolio | | | 42 | % | | | 56 | % | | | 39 | % | | | 35 | % | | | 7 | % |
Portfolio Turnover of Global Macro Absolute Return Advantage Portfolio | | | 91 | % | | | 50 | % | | | N.A. | | | | N.A. | | | | N.A. | |
Portfolio Turnover of Global Macro Portfolio | | | 39 | % | | | 33 | % | | | 19 | % | | | 25 | % | | | N.A. | |
Portfolio Turnover of Government Obligations Portfolio | | | 26 | % | | | 19 | % | | | 22 | % | | | 28 | % | | | 19 | % |
Portfolio Turnover of Large-Cap Core Research Portfolio | | | N.A. | | | | 64 | % | | | 51 | % | | | N.A. | | | | N.A. | |
Portfolio Turnover of MSAR Completion Portfolio | | | 37 | % | | | 32 | % | | | 2 | %(6) | | | N.A. | | | | N.A. | |
Portfolio Turnover of Multi-Sector Portfolio | | | N.A. | | | | N.A. | | | | N.A. | | | | 31 | %(7) | | | N.A. | |
Portfolio Turnover of Parametric Structured Absolute Return Portfolio | | | 22 | % | | | N.A. | | | | N.A. | | | | N.A. | | | | N.A. | |
Portfolio Turnover of Short-Term U.S. Government Portfolio | | | 15 | % | | | 6 | % | | | 26 | % | | | N.A. | | | | N.A. | |
| (1) | Computed using average shares outstanding. |
| (2) | Returns are historical and are calculated by determining the percentage change in net asset value with all distributions reinvested and do not reflect the effect of sales charges. |
| (3) | Includes the Fund’s share of the Portfolios’ allocated expenses. |
| (4) | Excludes the effect of custody fee credits, if any, of less than 0.005%. |
| (5) | Percentage includes both the Fund’s contributions to and withdrawals from the Portfolios and purchases and sales of securities held directly by the Fund, if any. |
| (6) | For the period from the Portfolio’s start of business, August 24, 2010, to October 31, 2010. |
| (7) | For the period from the Portfolio’s start of business, July 16, 2009, to October 31, 2009. |
| | | | |
| | 12 | | See Notes to Financial Statements. |
Eaton Vance
Multi-Strategy Absolute Return Fund
October 31, 2012
Financial Highlights — continued
| | | | | | | | | | | | | | | | | | | | |
| | | Class C | |
| | | Year Ended October 31, | |
| | | 2012 | | | 2011 | | | 2010 | | | 2009 | | | 2008 | |
Net asset value — Beginning of year | | $ | 9.150 | | | $ | 9.200 | | | $ | 8.890 | | | $ | 7.590 | | | $ | 9.620 | |
| | | | | |
| Income (Loss) From Operations | | | | | | | | | | | | | | | | | | | | |
Net investment income(1) | | $ | 0.103 | | | $ | 0.111 | | | $ | 0.282 | | | $ | 0.426 | | | $ | 0.500 | |
Net realized and unrealized gain (loss) | | | 0.016 | | | | (0.041 | ) | | | 0.362 | | | | 1.337 | | | | (1.978 | ) |
| | | | | |
Total income (loss) from operations | | $ | 0.119 | | | $ | 0.070 | | | $ | 0.644 | | | $ | 1.763 | | | $ | (1.478 | ) |
| | | | | |
| Less Distributions | | | | | | | | | | | | | | | | | | | | |
From net investment income | | $ | (0.136 | ) | | $ | (0.120 | ) | | $ | (0.246 | ) | | $ | (0.463 | ) | | $ | (0.523 | ) |
Tax return of capital | | | (0.043 | ) | | | — | | | | (0.088 | ) | | | — | | | | (0.029 | ) |
| | | | | |
Total distributions | | $ | (0.179 | ) | | $ | (0.120 | ) | | $ | (0.334 | ) | | $ | (0.463 | ) | | $ | (0.552 | ) |
| | | | | |
Net asset value — End of year | | $ | 9.090 | | | $ | 9.150 | | | $ | 9.200 | | | $ | 8.890 | | | $ | 7.590 | |
| | | | | |
Total Return(2) | | | 1.32 | % | | | 0.75 | % | | | 7.37 | % | | | 24.21 | % | | | (16.13 | )% |
| | | | | |
| Ratios/Supplemental Data | | | | | | | | | | | | | | | | | | | | |
Net assets, end of year (000’s omitted) | | $ | 91,682 | | | $ | 143,809 | | | $ | 123,689 | | | $ | 133,596 | | | $ | 120,654 | |
Ratios (as a percentage of average daily net assets): | | | | | | | | | | | | | | | | | | | | |
Expenses(3)(4) | | | 2.02 | % | | | 1.96 | % | | | 1.85 | % | | | 1.93 | % | | | 1.88 | % |
Net investment income | | | 1.13 | % | | | 1.20 | % | | | 3.12 | % | | | 5.37 | % | | | 5.48 | % |
Portfolio Turnover of the Fund(5) | | | 68 | % | | | 26 | % | | | 60 | % | | | 61 | % | | | 19 | % |
Portfolio Turnover of Boston Income Portfolio | | | N.A. | | | | 70 | % | | | 75 | % | | | 74 | % | | | 54 | % |
Portfolio Turnover of Floating Rate Portfolio | | | 42 | % | | | 56 | % | | | 39 | % | | | 35 | % | | | 7 | % |
Portfolio Turnover of Global Macro Absolute Return Advantage Portfolio | | | 91 | % | | | 50 | % | | | N.A. | | | | N.A. | | | | N.A. | |
Portfolio Turnover of Global Macro Portfolio | | | 39 | % | | | 33 | % | | | 19 | % | | | 25 | % | | | N.A. | |
Portfolio Turnover of Government Obligations Portfolio | | | 26 | % | | | 19 | % | | | 22 | % | | | 28 | % | | | 19 | % |
Portfolio Turnover of Large-Cap Core Research Portfolio | | | N.A. | | | | 64 | % | | | 51 | % | | | N.A. | | | | N.A. | |
Portfolio Turnover of MSAR Completion Portfolio | | | 37 | % | | | 32 | % | | | 2 | %(6) | | | N.A. | | | | N.A. | |
Portfolio Turnover of Multi-Sector Portfolio | | | N.A. | | | | N.A. | | | | N.A. | | | | 31 | %(7) | | | N.A. | |
Portfolio Turnover of Parametric Structured Absolute Return Portfolio | | | 22 | % | | | N.A. | | | | N.A. | | | | N.A. | | | | N.A. | |
Portfolio Turnover of Short-Term U.S. Government Portfolio | | | 15 | % | | | 6 | % | | | 26 | % | | | N.A. | | | | N.A. | |
| (1) | Computed using average shares outstanding. |
| (2) | Returns are historical and are calculated by determining the percentage change in net asset value with all distributions reinvested and do not reflect the effect of sales charges. |
| (3) | Includes the Fund’s share of the Portfolios’ allocated expenses. |
| (4) | Excludes the effect of custody fee credits, if any, of less than 0.005%. |
| (5) | Percentage includes both the Fund’s contributions to and withdrawals from the Portfolios and purchases and sales of securities held directly by the Fund, if any. |
| (6) | For the period from the Portfolio’s start of business, August 24, 2010, to October 31, 2010. |
| (7) | For the period from the Portfolio’s start of business, July 16, 2009, to October 31, 2009. |
| | | | |
| | 13 | | See Notes to Financial Statements. |
Eaton Vance
Multi-Strategy Absolute Return Fund
October 31, 2012
Financial Highlights — continued
| | | | | | | | | | | | | | | | |
| | | Class I | |
| | | Year Ended October 31, | | | Period Ended
October 31, 2009(1) | |
| | | 2012 | | | 2011 | | | 2010 | | |
Net asset value — Beginning of period | | $ | 9.150 | | | $ | 9.200 | | | $ | 8.890 | | | $ | 8.830 | |
| | | | |
| Income (Loss) From Operations | | | | | | | | | | | | | | | | |
Net investment income(2) | | $ | 0.196 | | | $ | 0.185 | | | $ | 0.353 | | | $ | 0.027 | |
Net realized and unrealized gain (loss) | | | 0.014 | | | | (0.023 | ) | | | 0.381 | | | | 0.071 | |
| | | | |
Total income from operations | | $ | 0.210 | | | $ | 0.162 | | | $ | 0.734 | | | $ | 0.098 | |
| | | | |
| Less Distributions | | | | | | | | | | | | | | | | |
From net investment income | | $ | (0.205 | ) | | $ | (0.212 | ) | | $ | (0.313 | ) | | $ | (0.038 | ) |
Tax return of capital | | | (0.065 | ) | | | — | | | | (0.111 | ) | | | — | |
| | | | |
Total distributions | | $ | (0.270 | ) | | $ | (0.212 | ) | | $ | (0.424 | ) | | $ | (0.038 | ) |
| | | | |
Net asset value — End of period | | $ | 9.090 | | | $ | 9.150 | | | $ | 9.200 | | | $ | 8.890 | |
| | | | |
Total Return(3) | | | 2.33 | % | | | 1.76 | % | | | 8.45 | % | | | 1.12 | %(4) |
| | | | |
| Ratios/Supplemental Data | | | | | | | | | | | | | | | | |
Net assets, end of period (000’s omitted) | | $ | 273,464 | | | $ | 188,165 | | | $ | 4,018 | | | $ | 1,253 | |
Ratios (as a percentage of average daily net assets): | | | | | | | | | | | | | | | | |
Expenses(5)(6) | | | 1.01 | % | | | 0.98 | % | | | 0.85 | % | | | 0.99 | %(7) |
Net investment income | | | 2.15 | % | | | 2.00 | % | | | 3.86 | % | | | 7.29 | %(7) |
Portfolio Turnover of the Fund(8) | | | 68 | % | | | 26 | % | | | 60 | % | | | 61 | %(9) |
Portfolio Turnover of Boston Income Portfolio | | | N.A. | | | | 70 | % | | | 75 | % | | | 74 | %(10) |
Portfolio Turnover of Floating Rate Portfolio | | | 42 | % | | | 56 | % | | | 39 | % | | | 35 | %(10) |
Portfolio Turnover of Global Macro Absolute Return Advantage Portfolio | | | 91 | % | | | 50 | % | | | N.A. | | | | N.A. | |
Portfolio Turnover of Global Macro Portfolio | | | 39 | % | | | 33 | % | | | 19 | % | | | 25 | %(10) |
Portfolio Turnover of Government Obligations Portfolio | | | 26 | % | | | 19 | % | | | 22 | % | | | 28 | %(10) |
Portfolio Turnover of Large-Cap Core Research Portfolio | | | N.A. | | | | 64 | % | | | 51 | % | | | N.A. | |
Portfolio Turnover of MSAR Completion Portfolio | | | 37 | % | | | 32 | % | | | 2 | %(11) | | | N.A. | |
Portfolio Turnover of Multi-Sector Portfolio | | | N.A. | | | | N.A. | | | | N.A. | | | | 31 | %(12) |
Portfolio Turnover of Parametric Structured Absolute Return Portfolio | | | 22 | % | | | N.A. | | | | N.A. | | | | N.A. | |
Portfolio Turnover of Short-Term U.S. Government Portfolio | | | 15 | % | | | 6 | % | | | 26 | % | | | N.A. | |
| (1) | For the period from commencement of operations on October 1, 2009 to October 31, 2009. |
| (2) | Computed using average shares outstanding. |
| (3) | Returns are historical and are calculated by determining the percentage change in net asset value with all distributions reinvested. |
| (5) | Includes the Fund’s share of the Portfolios’ allocated expenses. |
| (6) | Excludes the effect of custody fee credits, if any, of less than 0.005%. |
| (8) | Percentage includes both the Fund’s contributions to and withdrawals from the Portfolios and purchases and sales of securities held directly by the Fund, if any. |
| (9) | For the Fund’s year ended October 31, 2009. |
| (10) | For the Portfolio’s year ended October 31, 2009. |
| (11) | For the period from the Portfolio’s start of business, August 24, 2010, to October 31, 2010. |
| (12) | For the period from the Portfolio’s start of business, July 16, 2009, to October 31, 2009. |
| | | | |
| | 14 | | See Notes to Financial Statements. |
Eaton Vance
Multi-Strategy Absolute Return Fund
October 31, 2012
Notes to Financial Statements
1 Significant Accounting Policies
Eaton Vance Multi-Strategy Absolute Return Fund (the Fund) is a diversified series of Eaton Vance Mutual Funds Trust (the Trust). The Trust is a Massachusetts business trust registered under the Investment Company Act of 1940, as amended (the 1940 Act), as an open-end management investment company. The Fund offers four classes of shares. Class A shares are generally sold subject to a sales charge imposed at time of purchase. Class B and Class C shares are sold at net asset value and are generally subject to a contingent deferred sales charge (see Note 5). Class I shares are sold at net asset value and are not subject to a sales charge. Class B shares automatically convert to Class A shares eight years after their purchase as described in the Fund’s prospectus. Beginning January 1, 2012, Class B shares are only available for purchase upon exchange from another Eaton Vance fund or through reinvestment of distributions. Each class represents a pro-rata interest in the Fund, but votes separately on class-specific matters and (as noted below) is subject to different expenses. Realized and unrealized gains and losses are allocated daily to each class of shares based on the relative net assets of each class to the total net assets of the Fund. Net investment income, other than class-specific expenses, is allocated daily to each class of shares based upon the ratio of the value of each class’s paid shares to the total value of all paid shares. Each class of shares differs in its distribution plan and certain other class-specific expenses. The Fund’s investment objective is to seek total return. The Fund currently pursues its objective by investing all of its investable assets in interests in the following seven portfolios managed by Eaton Vance Management (EVM) or its affiliates: Floating Rate Portfolio, Global Macro Absolute Return Advantage Portfolio, Global Macro Portfolio, Government Obligations Portfolio, MSAR Completion Portfolio, Parametric Structured Absolute Return Portfolio and Short-Term U.S. Government Portfolio (the Portfolios), which are Massachusetts business trusts. The value of the Fund’s investments in the Portfolios reflects the Fund’s proportionate interest in the net assets of Floating Rate Portfolio, Global Macro Absolute Return Advantage Portfolio, Global Macro Portfolio, Government Obligations Portfolio, MSAR Completion Portfolio, Parametric Structured Absolute Return Portfolio and Short-Term U.S. Government Portfolio (1.0%, 4.5%, 1.5%, 5.6%, 99.7%, 67.7% and 9.1%, respectively, at October 31, 2012). The performance of the Fund is directly affected by the performance of the Portfolios. A copy of each Portfolio’s financial statements is available on the EDGAR database on the Securities and Exchange Commission’s website (www.sec.gov), at the Commission’s public reference room in Washington, DC or upon request from the Fund’s principal underwriter, Eaton Vance Distributors, Inc. (EVD), by calling 1-800-262-1122.
The following is a summary of significant accounting policies of the Fund. The policies are in conformity with accounting principles generally accepted in the United States of America.
A Investment Valuation — The valuation policies common to the Portfolios are as follows:
Debt obligations (including short-term obligations with a remaining maturity of more than sixty days and excluding most seasoned, fixed rate 30-year mortgage-backed securities as noted below) are generally valued on the basis of valuations provided by third party pricing services, as derived from such services’ pricing models. Inputs to the models may include, but are not limited to, reported trades, executable bid and asked prices, broker/dealer quotations, prices or yields of securities with similar characteristics, benchmark curves or information pertaining to the issuer, as well as industry and economic events. The pricing services may use a matrix approach, which considers information regarding securities with similar characteristics to determine the valuation for a security. Short-term obligations purchased with a remaining maturity of sixty days or less (excluding those that are non-U.S. dollar denominated, which typically are valued by a pricing service or dealer quotes) are generally valued at amortized cost, which approximates market value. Equity securities (including common shares of closed-end investment companies) listed on a U.S. securities exchange generally are valued at the last sale or closing price on the day of valuation or, if no sales took place on such date, at the mean between the closing bid and asked prices therefore on the exchange where such securities are principally traded. Equity securities listed on the NASDAQ Global or Global Select Market generally are valued at the NASDAQ official closing price. Unlisted or listed securities for which closing sales prices or closing quotations are not available are valued at the mean between the latest available bid and asked prices or, in the case of preferred equity securities that are not listed or traded in the over-the-counter market, by a third party pricing service that will use various techniques that consider factors including, but not limited to, prices or yields of securities with similar characteristics, benchmark yields, broker/dealer quotes, quotes of underlying common stock, issuer spreads, as well as industry and economic events. The daily valuation of exchange-traded foreign securities generally is determined as of the close of trading on the principal exchange on which such securities trade. Events occurring after the close of trading on foreign exchanges may result in adjustments to the valuation of foreign securities to more accurately reflect their fair value as of the close of regular trading on the New York Stock Exchange. When valuing foreign equity securities that meet certain criteria, the Portfolios’ Trustees have approved the use of a fair value service that values such securities to reflect market trading that occurs after the close of the applicable foreign markets of comparable securities or other instruments that have a strong correlation to the fair-valued securities. Precious metals are valued at the New York composite mean quotation reported by Bloomberg at the valuation time. Exchange-traded options (other than FLexible EXchange traded options) are valued at the mean between the bid and asked prices at valuation time as reported by the Options Price Reporting Authority for U.S. listed options or by the relevant exchange or board of trade for non-U.S. listed options. Over-the-counter options (including options on securities, indices and foreign currencies) and FLexible EXchange traded options traded at the Chicago Board Options Exchange are valued by a third party pricing service using techniques that consider factors including the value of the underlying instrument, the volatility of the underlying instrument and the period of time until option expiration. Financial and commodities futures contracts are valued at the closing settlement price established by the board of trade or exchange on which they are traded. Forward foreign currency exchange contracts are generally valued at the mean of the average bid and average asked prices that are reported by currency dealers to a third party pricing service at the valuation time. Such third party pricing service valuations are supplied for specific settlement periods and the Portfolios’ forward foreign currency exchange contracts are valued at an interpolated rate between the closest preceding and subsequent settlement period reported by the third party pricing service. Forward commodity contracts are generally valued based on the price of the underlying futures or forward contract provided by the exchange on which the underlying instruments are traded or if unavailable, based on forward rates provided by broker/dealers. Interest rate swaps, cross-currency swaps and options on interest rate swaps (“swaptions”) are normally valued using
Eaton Vance
Multi-Strategy Absolute Return Fund
October 31, 2012
Notes to Financial Statements — continued
valuations provided by a third party pricing service. Such pricing service valuations are based on the present value of fixed and projected floating rate cash flows over the term of the swap contract. Future cash flows are discounted to their present value using swap rates provided by electronic data services or by broker/dealers. Alternatively, swaptions may be valued at the valuation provided by the counterparty, so determined using the same techniques as those employed by the pricing service. Credit default swaps are normally valued using valuations provided by a third party pricing service. The pricing services employ electronic data processing techniques to determine the present value based on credit spread quotations obtained from broker/dealers and expected default recovery rates determined by the pricing service using proprietary models. Foreign securities and currencies are valued in U.S. dollars, based on foreign currency exchange rate quotations supplied by a third party pricing service. The pricing service uses a proprietary model to determine the exchange rate. Inputs to the model include reported trades and implied bid/ask spreads. Investments for which valuations or market quotations are not readily available or are deemed unreliable are valued at fair value using methods determined in good faith by or at the direction of the Trustees of the Portfolios in a manner that fairly reflects the security’s value, or the amount that the Portfolios might reasonably expect to receive for the security upon its current sale in the ordinary course. Each such determination is based on a consideration of relevant factors, which are likely to vary from one pricing context to another. These factors may include, but are not limited to, the type of security, the existence of any contractual restrictions on the security’s disposition, the price and extent of public trading in similar securities of the issuer or of comparable companies or entities, quotations or relevant information obtained from broker/dealers or other market participants, information obtained from the issuer, analysts, and/or the appropriate stock exchange (for exchange-traded securities), an analysis of the company’s or entity’s financial condition, and an evaluation of the forces that influence the issuer and the market(s) in which the security is purchased and sold.
Additional valuation policies for Global Macro Absolute Return Advantage Portfolio, Global Macro Portfolio, Government Obligations Portfolio and Short-Term U.S. Government Portfolio are as follows: Most seasoned, fixed-rate 30-year mortgage-backed securities are valued through the use of the investment adviser’s matrix pricing system, which takes into account bond prices, yield differentials, anticipated prepayments and interest rates provided by dealers.
Additional valuation policies for Floating Rate Portfolio (the Portfolio) are as follows: Interests in senior floating-rate loans (Senior Loans) for which reliable market quotations are readily available are valued generally at the average mean of bid and ask quotations obtained from a third party pricing service. Other Senior Loans are valued at fair value by the investment adviser under procedures approved by the Trustees. In fair valuing a Senior Loan, the investment adviser utilizes one or more of the valuation techniques described in (i) through (iii) below to assess the likelihood that the borrower will make a full repayment of the loan underlying such Senior Loan relative to yields on other Senior Loans issued by companies of comparable credit quality. If the investment adviser believes that there is a reasonable likelihood of full repayment, the investment adviser will determine fair value using a matrix pricing approach that considers the yield on the Senior Loan. If the investment adviser believes there is not a reasonable likelihood of full repayment, the investment adviser will determine fair value using analyses that include, but are not limited to: (i) a comparison of the value of the borrower’s outstanding equity and debt to that of comparable public companies; (ii) a discounted cash flow analysis; or (iii) when the investment adviser believes it is likely that a borrower will be liquidated or sold, an analysis of the terms of such liquidation or sale. In certain cases, the investment adviser will use a combination of analytical methods to determine fair value, such as when only a portion of a borrower’s assets are likely to be sold. In conducting its assessment and analyses for purposes of determining fair value of a Senior Loan, the investment adviser will use its discretion and judgment in considering and appraising relevant factors. Fair value determinations are made by the portfolio managers of the Portfolio based on information available to such managers. The portfolio managers of other funds managed by the investment adviser that invest in Senior Loans may not possess the same information about a Senior Loan borrower as the portfolio managers of the Portfolio. At times, the fair value of a Senior Loan determined by the portfolio managers of other funds managed by the investment adviser that invest in Senior Loans may vary from the fair value of the same Senior Loan determined by the portfolio managers of the Portfolio. The fair value of each Senior Loan is periodically reviewed and approved by the investment adviser’s Valuation Committee and by the Trustees based upon procedures approved by the Trustees. Junior Loans (i.e., subordinated loans and second lien loans) are valued in the same manner as Senior Loans.
The Portfolios may invest in Eaton Vance Cash Reserves Fund, LLC (Cash Reserves Fund), an affiliated investment company managed by EVM. Cash Reserves Fund generally values its investment securities utilizing the amortized cost valuation technique in accordance with Rule 2a-7 under the 1940 Act. This technique involves initially valuing a portfolio security at its cost and thereafter assuming a constant amortization to maturity of any discount or premium. If amortized cost is determined not to approximate fair value, Cash Reserves Fund may value its investment securities in the same manner as debt obligations described above.
B Income — The Fund’s net investment income or loss consists of the Fund’s pro-rata share of the net investment income or loss of the Portfolios less all actual and accrued expenses of the Fund.
C Federal Taxes — The Fund’s policy is to comply with the provisions of the Internal Revenue Code applicable to regulated investment companies and to distribute to shareholders each year substantially all of its net investment income, and all or substantially all of its net realized capital gains. Accordingly, no provision for federal income or excise tax is necessary.
At October 31, 2012, the Fund, for federal income tax purposes, had a capital loss carryforward of $31,834,307 and current year deferred capital losses of $16,497,310 which will reduce its taxable income arising from future net realized gains on investment transactions, if any, to the extent permitted by the Internal Revenue Code, and thus will reduce the amount of distributions to shareholders, which would otherwise be necessary to relieve the Fund of any liability for federal income or excise tax. Such capital loss carryforward will expire on October 31, 2013 ($1,057,658), October 31, 2014 ($1,054,697), October 31, 2015 ($1,377,385), October 31, 2016 ($15,304,398), October 31, 2017 ($9,100,702) and October 31, 2018 ($3,939,467). The current year deferred capital losses are treated as arising on the first day of the Fund’s next taxable year and are treated as realized prior to the utilization of the capital loss carryforward.
Additionally, at October 31, 2012, the Fund had a net investment loss of $2,265,508 incurred after December 31, 2011. This net investment loss is treated as arising on the first day of the Fund’s taxable year ending October 31, 2013.
Eaton Vance
Multi-Strategy Absolute Return Fund
October 31, 2012
Notes to Financial Statements — continued
As of October 31, 2012, the Fund had no uncertain tax positions that would require financial statement recognition, de-recognition, or disclosure. The Fund files a U.S. federal income tax return annually after its fiscal year-end, which is subject to examination by the Internal Revenue Service for a period of three years from the date of filing.
D Expenses — The majority of expenses of the Trust are directly identifiable to an individual fund. Expenses which are not readily identifiable to a specific fund are allocated taking into consideration, among other things, the nature and type of expense and the relative size of the funds.
E Expense Reduction — State Street Bank and Trust Company (SSBT) serves as custodian of the Fund. Pursuant to the custodian agreement, SSBT receives a fee reduced by credits, which are determined based on the average daily cash balance the Fund maintains with SSBT. All credit balances, if any, used to reduce the Fund’s custodian fees are reported as a reduction of expenses in the Statement of Operations.
F Use of Estimates — The preparation of the financial statements in conformity with accounting principles generally accepted in the United States of America requires management to make estimates and assumptions that affect the reported amounts of assets and liabilities at the date of the financial statements and the reported amounts of income and expense during the reporting period. Actual results could differ from those estimates.
G Indemnifications — Under the Trust’s organizational documents, its officers and Trustees may be indemnified against certain liabilities and expenses arising out of the performance of their duties to the Fund. Under Massachusetts law, if certain conditions prevail, shareholders of a Massachusetts business trust (such as the Trust) could be deemed to have personal liability for the obligations of the Trust. However, the Trust’s Declaration of Trust contains an express disclaimer of liability on the part of Fund shareholders and the By-laws provide that the Trust shall assume the defense on behalf of any Fund shareholders. Moreover, the By-laws also provide for indemnification out of Fund property of any shareholder held personally liable solely by reason of being or having been a shareholder for all loss or expense arising from such liability. Additionally, in the normal course of business, the Fund enters into agreements with service providers that may contain indemnification clauses. The Fund’s maximum exposure under these arrangements is unknown as this would involve future claims that may be made against the Fund that have not yet occurred.
H Other — Investment transactions are accounted for on a trade date basis. Dividends to shareholders are recorded on the ex-dividend date.
2 Distributions to Shareholders
The Fund declares dividends daily to shareholders of record at the time of declaration. Distributions are generally paid monthly. Distributions of realized capital gains (reduced by available capital loss carryforwards from prior years, if any) are made at least annually. Distributions are declared separately for each class of shares. Shareholders may reinvest income and capital gain distributions in additional shares of the same class of the Fund at the net asset value as of the reinvestment date or, at the election of the shareholder, receive distributions in cash. The Fund distinguishes between distributions on a tax basis and a financial reporting basis. Accounting principles generally accepted in the United States of America require that only distributions in excess of tax basis earnings and profits be reported in the financial statements as a return of capital. Permanent differences between book and tax accounting relating to distributions are reclassified to paid-in capital. For tax purposes, distributions from short-term capital gains are considered to be from ordinary income.
The tax character of distributions declared for the years ended October 31, 2012 and October 31, 2011 was as follows:
| | | | | | | | |
| | | Year Ended October 31, | |
| | | 2012 | | | 2011 | |
|
Distributions declared from: | |
Ordinary income | | $ | 15,711,633 | | | $ | 9,640,534 | |
Tax return of capital | | $ | 5,018,272 | | | | — | |
During the year ended October 31, 2012, accumulated distributions in excess of net investment income was increased by $818,627, accumulated net realized loss was increased by $4,993,975 and paid-in capital was increased by $5,812,602 due to differences between book and tax accounting, primarily for swap contracts, premium amortization, tax accounting for straddle transactions, foreign currency gain (loss), futures contracts, options contracts, investments in passive foreign investment companies (PFICs), investment in partnerships, a Portfolio’s investment in a subsidiary and paydown gain (loss). These reclassifications had no effect on the net assets or net asset value per share of the Fund.
As of October 31, 2012, the components of distributable earnings (accumulated losses) and unrealized appreciation (depreciation) on a tax basis were as follows:
| | | | |
Capital loss carryforward and deferred capital losses | | $ | (48,331,617 | ) |
Late year ordinary losses | | $ | (2,265,508 | ) |
Net unrealized appreciation | | $ | 7,830,225 | |
Other temporary differences | | $ | (241,934 | ) |
Eaton Vance
Multi-Strategy Absolute Return Fund
October 31, 2012
Notes to Financial Statements — continued
The differences between components of distributable earnings (accumulated losses) on a tax basis and the amounts reflected in the Statement of Assets and Liabilities are primarily due to wash sales, tax accounting for straddle transactions, defaulted bond interest, foreign currency transactions, premium amortization, swap contracts, futures contracts, investment in partnerships, options contracts, partnership allocations, PFICs and the timing of recognizing distributions to shareholders.
3 Transactions with Affiliates
EVM serves as the investment adviser and administrator of the Fund, providing investment advisory services (relating to the investment of the Fund’s assets in the Portfolios) and administering the business affairs of the Fund. EVM does not receive a fee for serving as the Fund’s investment adviser and administrator. The Portfolios have engaged Boston Management and Research (BMR), a subsidiary of EVM, to render investment advisory services. For the year ended October 31, 2012, the Fund’s allocated portion of the investment adviser fees paid by the Portfolios amounted to $5,540,428 or 0.71% of the Fund’s average daily net assets.
EVM serves as the sub-transfer agent of the Fund and receives from the transfer agent an aggregate fee based upon the actual expenses incurred by EVM in the performance of these services. For the year ended October 31, 2012, EVM earned $15,406 in sub-transfer agent fees. The Fund was informed that EVD, an affiliate of EVM, received $19,809 as its portion of the sales charge on sales of Class A shares for the year ended October 31, 2012. EVD also received distribution and service fees from Class A, Class B and Class C shares (see Note 4) and contingent deferred sales charges (see Note 5).
Trustees and officers of the Fund and the Portfolios who are members of EVM’s or BMR’s organizations receive remuneration for their services to the Fund out of the investment adviser fee. Certain officers and Trustees of the Fund and the Portfolios are officers of the above organizations.
4 Distribution Plans
The Fund has in effect a distribution plan for Class A shares (Class A Plan) pursuant to Rule 12b-1 under the 1940 Act. Pursuant to the Class A Plan, the Fund pays EVD a distribution and service fee of 0.25% per annum of its average daily net assets attributable to Class A shares for distribution services and facilities provided to the Fund by EVD, as well as for personal services and/or the maintenance of shareholder accounts. Distribution and service fees paid or accrued to EVD for the year ended October 31, 2012 amounted to $991,508 for Class A shares.
The Fund also has in effect distribution plans for Class B shares (Class B Plan) and Class C shares (Class C Plan) pursuant to Rule 12b-1 under the 1940 Act. Pursuant to the Class B and Class C Plans, the Fund pays EVD amounts equal to 0.75% per annum of its average daily net assets attributable to Class B and Class C shares for providing ongoing distribution services and facilities to the Fund. The Fund will automatically discontinue payments to EVD during any period in which there are no outstanding Uncovered Distribution Charges, which are equivalent to the sum of (i) 6.25% of the aggregate amount received by the Fund for Class B and Class C shares sold, plus (ii) interest calculated by applying the rate of 1% over the prevailing prime rate to the outstanding balance of Uncovered Distribution Charges of EVD of each respective class, reduced by the aggregate amount of contingent deferred sales charges (see Note 5) and amounts theretofore paid or payable to EVD by each respective class. For the year ended October 31, 2012, the Fund paid or accrued to EVD $146,371 and $946,489 for Class B and Class C shares, respectively, representing 0.75% of the average daily net assets of Class B and Class C shares. At October 31, 2012, the amounts of Uncovered Distribution Charges of EVD calculated under the Class B and Class C Plans were approximately $970,000 and $14,835,000, respectively.
Pursuant to the Class B and Class C Plans, the Fund also makes payments of service fees to EVD, financial intermediaries and other persons in amounts equal to 0.25% per annum of its average daily net assets attributable to that class. Service fees paid or accrued are for personal services and/or the maintenance of shareholder accounts. They are separate and distinct from the sales commissions and distribution fees payable to EVD and, as such, are not subject to automatic discontinuance when there are no outstanding Uncovered Distribution Charges of EVD. Service fees paid or accrued for the year ended October 31, 2012 amounted to $48,790 and $315,496 for Class B and Class C shares, respectively.
5 Contingent Deferred Sales Charges
A contingent deferred sales charge (CDSC) generally is imposed on redemptions of Class B shares made within six years of purchase and on redemptions of Class C shares made within one year of purchase. Class A shares may be subject to a 1% CDSC if redeemed within 18 months of purchase (depending on the circumstances of purchase). Generally, the CDSC is based upon the lower of the net asset value at date of redemption or date of purchase. No charge is levied on shares acquired by reinvestment of dividends or capital gain distributions. The CDSC for Class B shares is imposed at declining rates that begin at 5% in the case of redemptions in the first and second year after purchase, declining one percentage point each subsequent year. Class C shares are subject to a 1% CDSC if redeemed within one year of purchase. No CDSC is levied on shares which have been sold to EVM or its affiliates or to their respective employees or clients and may be waived under certain other limited conditions. CDSCs received on Class B and Class C redemptions are paid to EVD to reduce the amount of Uncovered Distribution Charges calculated under the Fund’s Class B and Class C Plans. CDSCs received on Class B and Class C redemptions when no Uncovered Distribution Charges exist are credited to the Fund. For the year ended October 31, 2012, the Fund was informed that EVD received approximately $26,000, $33,000 and $36,000 of CDSCs paid by Class A, Class B and Class C shareholders, respectively.
Eaton Vance
Multi-Strategy Absolute Return Fund
October 31, 2012
Notes to Financial Statements — continued
6 Investment Transactions
For the year ended October 31, 2012, increases and decreases in the Fund’s investments in the Portfolios were as follows:
| | | | | | | | |
| Portfolio | | Contributions | | | Withdrawals | |
| | |
Boston Income Portfolio | | $ | — | | | $ | 1 | |
Floating Rate Portfolio | | | 15,561,816 | | | | 68,090,141 | |
Global Macro Absolute Return Advantage Portfolio | | | 7,693,775 | | | | 55,306,238 | |
Global Macro Portfolio | | | 42,746,709 | | | | 36,488,798 | |
Government Obligations Portfolio | | | 82,505,165 | | | | 24,078,703 | |
Large-Cap Core Research Portfolio | | | — | | | | 15,606,868 | |
MSAR Completion Portfolio | | | 160,802,586 | | | | 358,147,502 | |
Parametric Structured Absolute Return Portfolio | | | 196,256,868 | | | | 19,005,394 | |
Short-Term U.S. Government Portfolio | | | 18,846,528 | | | | 12,159,676 | |
7 Shares of Beneficial Interest
The Fund’s Declaration of Trust permits the Trustees to issue an unlimited number of full and fractional shares of beneficial interest (without par value). Such shares may be issued in a number of different series (such as the Fund) and classes. Transactions in Fund shares were as follows:
| | | | | | | | |
| | | Year Ended October 31, | |
| Class A | | 2012 | | | 2011 | |
| | |
Sales | | | 21,974,238 | | | | 41,159,963 | |
Issued to shareholders electing to receive payments of distributions in Fund shares | | | 1,151,032 | | | | 535,404 | |
Redemptions | | | (31,214,623 | ) | | | (12,509,560 | ) |
Exchange from Class B shares | | | 85,585 | | | | 130,037 | |
| | |
Net increase (decrease) | | | (8,003,768 | ) | | | 29,315,844 | |
| | |
| | | | | | | | |
| | | Year Ended October 31, | |
| Class B | | 2012 | | | 2011 | |
| | |
Sales | | | 33,120 | | | | 289,391 | |
Issued to shareholders electing to receive payments of distributions in Fund shares | | | 36,702 | | | | 27,223 | |
Redemptions | | | (619,253 | ) | | | (798,568 | ) |
Exchange to Class A shares | | | (85,623 | ) | | | (130,084 | ) |
| | |
Net decrease | | | (635,054 | ) | | | (612,038 | ) |
| | |
| | | | | | | | |
| | | Year Ended October 31, | |
| Class C | | 2012 | | | 2011 | |
| | |
Sales | | | 1,744,238 | | | | 6,372,782 | |
Issued to shareholders electing to receive payments of distributions in Fund shares | | | 234,563 | | | | 148,719 | |
Redemptions | | | (7,603,790 | ) | | | (4,253,172 | ) |
| | |
Net increase (decrease) | | | (5,624,989 | ) | | | 2,268,329 | |
| | |
| | | | | | | | |
Eaton Vance
Multi-Strategy Absolute Return Fund
October 31, 2012
Notes to Financial Statements — continued
| | | | | | | | |
| | | Year Ended October 31, | |
| Class I | | 2012 | | | 2011 | |
| | |
Sales | | | 24,905,523 | | | | 27,890,271 | |
Issued to shareholders electing to receive payments of distributions in Fund shares | | | 485,942 | | | | 133,437 | |
Redemptions | | | (15,862,419 | ) | | | (7,906,247 | ) |
| | |
Net increase | | | 9,529,046 | | | | 20,117,461 | |
At October 31, 2012, accounts advised by EVM owned 14.5% of the value of the outstanding shares of the Fund.
8 Fair Value Measurements
Under generally accepted accounting principles for fair value measurements, a three-tier hierarchy to prioritize the assumptions, referred to as inputs, is used in valuation techniques to measure fair value. The three-tier hierarchy of inputs is summarized in the three broad levels listed below.
| Ÿ | | Level 1 – quoted prices in active markets for identical investments |
| Ÿ | | Level 2 – other significant observable inputs (including quoted prices for similar investments, interest rates, prepayment speeds, credit risk, etc.) |
| Ÿ | | Level 3 – significant unobservable inputs (including a fund’s own assumptions in determining the fair value of investments) |
In cases where the inputs used to measure fair value fall in different levels of the fair value hierarchy, the level disclosed is determined based on the lowest level input that is significant to the fair value measurement in its entirety. The inputs or methodology used for valuing securities are not necessarily an indication of the risk associated with investing in those securities. At October 31, 2012 and October 31, 2011, the Fund’s investments in the Portfolios were valued based on Level 1 inputs.
Eaton Vance
Multi-Strategy Absolute Return Fund
October 31, 2012
Report of Independent Registered Public Accounting Firm
To the Trustees of Eaton Vance Mutual Funds Trust and Shareholders of Eaton Vance Multi-Strategy Absolute Return Fund:
We have audited the accompanying statement of assets and liabilities of Eaton Vance Multi-Strategy Absolute Return Fund (the “Fund”) (one of the funds constituting Eaton Vance Mutual Funds Trust), including the portfolio of investments, as of October 31, 2012, and the related statement of operations for the year then ended, the statements of changes in net assets for each of the two years in the period then ended, and the financial highlights for each of the five years in the period then ended. These financial statements and financial highlights are the responsibility of the Fund’s management. Our responsibility is to express an opinion on these financial statements and financial highlights based on our audits.
We conducted our audits in accordance with the standards of the Public Company Accounting Oversight Board (United States). Those standards require that we plan and perform the audit to obtain reasonable assurance about whether the financial statements and financial highlights are free of material misstatement. The Fund is not required to have, nor were we engaged to perform, an audit of its internal control over financial reporting. Our audits included consideration of internal control over financial reporting as a basis for designing audit procedures that are appropriate in the circumstances, but not for the purpose of expressing an opinion on the effectiveness of the Fund’s internal control over financial reporting. Accordingly, we express no such opinion. An audit also includes examining, on a test basis, evidence supporting the amounts and disclosures in the financial statements, assessing the accounting principles used and significant estimates made by management, as well as evaluating the overall financial statement presentation. Our procedures included confirmation of securities owned as of October 31, 2012, by correspondence with the custodian. We believe that our audits provide a reasonable basis for our opinion.
In our opinion, such financial statements and financial highlights referred to above present fairly, in all material respects, the financial position of Eaton Vance Multi-Strategy Absolute Return Fund as of October 31, 2012, the results of its operations for the year then ended, the changes in its net assets for each of the two years in the period then ended, and the financial highlights for each of the five years in the period then ended, in conformity with accounting principles generally accepted in the United States of America.
DELOITTE & TOUCHE LLP
Boston, Massachusetts
December 21, 2012
Eaton Vance
Multi-Strategy Absolute Return Fund
October 31, 2012
Federal Tax Information (Unaudited)
The Form 1099-DIV you receive in January 2013 will show the tax status of all distributions paid to your account in calendar year 2012. Shareholders are advised to consult their own tax adviser with respect to the tax consequences of their investment in the Fund. As required by the Internal Revenue Code and/or regulations, shareholders must be notified regarding the status of qualified dividend income for individuals and the dividends received deduction for corporations.
Qualified Dividend Income. The Fund designates approximately $1,873,003, or up to the maximum amount of such dividends allowable pursuant to the Internal Revenue Code, as qualified dividend income eligible for the reduced tax rate of 15%.
Dividends Received Deduction. Corporate shareholders are generally entitled to take the dividends received deduction on the portion of the Fund’s dividend distribution that qualifies under tax law. For the Fund’s fiscal 2012 ordinary income dividends, 16.26% qualifies for the corporate dividends received deduction.
Eaton Vance
Multi-Strategy Absolute Return Fund
October 31, 2012
Management and Organization
Fund Management. The Trustees of Eaton Vance Mutual Funds Trust (the Trust) are responsible for the overall management and supervision of the Trust’s affairs. The Trustees and officers of the Trust are listed below. Except as indicated, each individual has held the office shown or other offices in the same company for the last five years. Trustees and officers of the Trust hold indefinite terms of office. The “Noninterested Trustees” consist of those Trustees who are not “interested persons” of the Trust, as that term is defined under the 1940 Act. The business address of each Trustee and officer is Two International Place, Boston, Massachusetts 02110. As used below, “EVC” refers to Eaton Vance Corp., “EV” refers to Eaton Vance, Inc., “EVM” refers to Eaton Vance Management, “BMR” refers to Boston Management and Research and “EVD” refers to Eaton Vance Distributors, Inc. EVC and EV are the corporate parent and trustee, respectively, of EVM and BMR. EVD is the Fund’s principal underwriter and a wholly-owned subsidiary of EVC. Each officer affiliated with Eaton Vance may hold a position with other Eaton Vance affiliates that is comparable to his or her position with EVM listed below. Each Trustee oversees 187 portfolios in the Eaton Vance Complex (including all master and feeder funds in a master feeder structure). Each officer serves as an officer of certain other Eaton Vance funds. Each Trustee and officer serves until his or her successor is elected.
| | | | | | |
| Name and Year of Birth | | Position(s) with the Trust | | Length of Service | | Principal Occupation(s) and Directorships During Past Five Years and Other Relevant Experience |
Interested Trustee | | | | | | |
| | | |
Thomas E. Faust Jr. 1958 | | Trustee | | Since 2007 | | Chairman, Chief Executive Officer and President of EVC, Director and President of EV, Chief Executive Officer and President of EVM and BMR, and Director of EVD. Trustee and/or officer of 187 registered investment companies. Mr. Faust is an interested person because of his positions with EVM, BMR, EVD, EVC and EV, which are affiliates of the Trust. Directorships in the Last Five Years.(1) Director of EVC and Hexavest Inc. |
| | | |
| | | | | | |
Noninterested Trustees | | | | | | |
| | | |
Scott E. Eston 1956 | | Trustee | | Since 2011 | | Private investor. Formerly held various positions at Grantham, Mayo, Van Otterloo and Co., L.L.C. (investment management firm) (1997-2009), including Chief Operating Officer (2002-2009), Chief Financial Officer (1997-2009) and Chairman of the Executive Committee (2002-2008); President and Principal Executive Officer, GMO Trust (open-end registered investment company) (2006-2009). Former Partner, Coopers and Lybrand L.L.P. (now PricewaterhouseCoopers) (public accounting firm) (1987-1997). Directorships in the Last Five Years. None. |
| | | |
Benjamin C. Esty 1963 | | Trustee | | Since 2005 | | Roy and Elizabeth Simmons Professor of Business Administration and Finance Unit Head, Harvard University Graduate School of Business Administration. Directorships in the Last Five Years.(1) None. |
| | | |
Allen R. Freedman 1940 | | Trustee | | Since 2007 | | Private Investor. Former Chairman (2002-2004) and a Director (1983-2004) of Systems & Computer Technology Corp. (provider of software to higher education). Formerly, a Director of Loring Ward International (fund distributor) (2005-2007). Former Chairman and a Director of Indus International, Inc. (provider of enterprise management software to the power generating industry) (2005-2007). Former Chief Executive Officer of Assurant, Inc. (insurance provider) (1979-2000). Directorships in the Last Five Years.(1) Director of Stonemor Partners, L.P. (owner and operator of cemeteries). Formerly, Director of Assurant, Inc. (insurance provider) (1979-2011). |
| | | |
William H. Park 1947 | | Trustee | | Since 2003 | | Consultant and private investor. Formerly, Chief Financial Officer, Aveon Group L.P. (investment management firm) (2010-2011). Formerly, Vice Chairman, Commercial Industrial Finance Corp. (specialty finance company) (2006-2010). Formerly, President and Chief Executive Officer, Prizm Capital Management, LLC (investment management firm) (2002-2005). Formerly, Executive Vice President and Chief Financial Officer, United Asset Management Corporation (investment management firm) (1982-2001). Formerly, Senior Manager, Price Waterhouse (now PricewaterhouseCoopers) (an independent registered public accounting firm) (1972-1981). Directorships in the Last Five Years.(1) None. |
| | | |
Ronald A. Pearlman 1940 | | Trustee | | Since 2003 | | Professor of Law, Georgetown University Law Center. Formerly, Deputy Assistant Secretary (Tax Policy) and Assistant Secretary (Tax Policy), U.S. Department of the Treasury (1983-1985). Formerly, Chief of Staff, Joint Committee on Taxation, U.S. Congress (1988-1990). Directorships in the Last Five Years.(1) None. |
Eaton Vance
Multi-Strategy Absolute Return Fund
October 31, 2012
Management and Organization — continued
| | | | | | |
| Name and Year of Birth | | Position(s) with the Trust | | Length of Service | | Principal Occupation(s) and Directorships During Past Five Years and Other Relevant Experience |
Noninterested Trustees (continued) |
| | | |
Helen Frame Peters 1948 | | Trustee | | Since 2008 | | Professor of Finance, Carroll School of Management, Boston College. Formerly, Dean, Carroll School of Management, Boston College (2000-2002). Formerly, Chief Investment Officer, Fixed Income, Scudder Kemper Investments (investment management firm) (1998-1999). Formerly, Chief Investment Officer, Equity and Fixed Income, Colonial Management Associates (investment management firm) (1991-1998). Directorships in the Last Five Years.(1) Formerly, Director of BJ’s Wholesale Club, Inc. (wholesale club retailer) (2004-2011). Formerly, Trustee of SPDR Index Shares Funds and SPDR Series Trust (exchange traded funds) (2000-2009). Formerly, Director of Federal Home Loan Bank of Boston (a bank for banks) (2007-2009). |
| | | |
Lynn A. Stout 1957 | | Trustee | | Since 1998 | | Distinguished Professor of Corporate and Business Law, Jack G. Clarke Business Law Institute, Cornell University Law School. Formerly, the Paul Hastings Professor of Corporate and Securities Law (2006-2012) and Professor of Law (2001-2006), University of California at Los Angeles School of Law. Directorships in the Last Five Years.(1) None. |
| | | |
Harriett Tee Taggart 1948 | | Trustee | | Since 2011 | | Managing Director, Taggart Associates (a professional practice firm). Formerly, Partner and Senior Vice President, Wellington Management Company, LLP (investment management firm) (1983-2006). Directorships in the Last Five Years. Director of Albemarle Corporation (chemicals manufacturer) (since 2007) and The Hanover Group (specialty property and casualty insurance company) (since 2009). Formerly, Director of Lubrizol Corporation (specialty chemicals) (2007-2011). |
| | | |
Ralph F. Verni 1943 | | Chairman of the Board and Trustee | | Chairman of the Board since 2007 and Trustee since 2005 | | Consultant and private investor. Formerly, Chief Investment Officer (1982-1992), Chief Financial Officer (1988-1990) and Director (1982-1992), New England Life. Formerly, Chairperson, New England Mutual Funds (1982-1992). Formerly, President and Chief Executive Officer, State Street Management & Research (1992-2000). Formerly, Chairperson, State Street Research Mutual Funds (1992-2000). Formerly, Director, W.P. Carey, LLC (1998-2004) and First Pioneer Farm Credit Corp. (2002-2006). Directorships in the Last Five Years.(1) None. |
| | | |
| | | | | | |
Principal Officers who are not Trustees | | |
| Name and Year of Birth | | Position(s) with the Trust | | Length of Service | | Principal Occupation(s) During Past Five Years |
| | | |
Duncan W. Richardson 1957 | | President | | Since 2011 | | Director of EVC and Executive Vice President and Chief Equity Investment Officer of EVC, EVM and BMR. |
| | | |
Payson F. Swaffield 1956 | | Vice President | | Since 2011 | | Vice President and Chief Income Investment Officer of EVM and BMR. |
| | | |
Barbara E. Campbell 1957 | | Treasurer | | Since 2005 | | Vice President of EVM and BMR. |
| | | |
Maureen A. Gemma 1960 | | Vice President, Secretary and Chief Legal Officer | | Vice President since 2011, Secretary since 2007 and Chief Legal Officer since 2008 | | Vice President of EVM and BMR. |
| | | |
Paul M. O’Neil 1953 | | Chief Compliance Officer | | Since 2004 | | Vice President of EVM and BMR. |
| (1) | During their respective tenures, the Trustees (except Mr. Eston and Ms. Taggart) also served as trustees of one or more of the following Eaton Vance funds (which operated in the years noted): Eaton Vance Credit Opportunities Fund (launched in 2005 and terminated in 2010); Eaton Vance Insured Florida Plus Municipal Bond Fund (launched in 2002 and terminated in 2009); and Eaton Vance National Municipal Income Trust (launched in 1998 and terminated in 2009). |
The SAI for the Fund includes additional information about the Trustees and officers of the Fund and can be obtained without charge on Eaton Vance’s website at www.eatonvance.com or by calling 1-800-262-1122.
Eaton Vance Funds
IMPORTANT NOTICES
Privacy. The Eaton Vance organization is committed to ensuring your financial privacy. Each of the financial institutions identified below has in effect the following policy (“Privacy Policy”) with respect to nonpublic personal information about its customers:
| Ÿ | | Only such information received from you, through application forms or otherwise, and information about your Eaton Vance fund transactions will be collected. This may include information such as name, address, social security number, tax status, account balances and transactions. |
| Ÿ | | None of such information about you (or former customers) will be disclosed to anyone, except as permitted by law (which includes disclosure to employees necessary to service your account). In the normal course of servicing a customer’s account, Eaton Vance may share information with unaffiliated third parties that perform various required services such as transfer agents, custodians and broker-dealers. |
| Ÿ | | Policies and procedures (including physical, electronic and procedural safeguards) are in place that are designed to protect the confidentiality of such information. |
| Ÿ | | We reserve the right to change our Privacy Policy at any time upon proper notification to you. Customers may want to review our Privacy Policy periodically for changes by accessing the link on our homepage: www.eatonvance.com. |
Our pledge of privacy applies to the following entities within the Eaton Vance organization: the Eaton Vance Family of Funds, Eaton Vance Management, Eaton Vance Investment Counsel, Eaton Vance Distributors, Inc., Eaton Vance Trust Company, Eaton Vance Management’s Real Estate Investment Group and Boston Management and Research. In addition, our Privacy Policy applies only to those Eaton Vance customers who are individuals and who have a direct relationship with us. If a customer’s account (i.e., fund shares) is held in the name of a third-party financial advisor/broker-dealer, it is likely that only such advisor’s privacy policies apply to the customer. This notice supersedes all previously issued privacy disclosures. For more information about Eaton Vance’s Privacy Policy, please call 1-800-262-1122.
Delivery of Shareholder Documents. The Securities and Exchange Commission (SEC) permits funds to deliver only one copy of shareholder documents, including prospectuses, proxy statements and shareholder reports, to fund investors with multiple accounts at the same residential or post office box address. This practice is often called “householding” and it helps eliminate duplicate mailings to shareholders. Eaton Vance, or your financial advisor, may household the mailing of your documents indefinitely unless you instruct Eaton Vance, or your financial advisor, otherwise. If you would prefer that your Eaton Vance documents not be householded, please contact Eaton Vance at 1-800-262-1122, or contact your financial advisor. Your instructions that householding not apply to delivery of your Eaton Vance documents will be effective within 30 days of receipt by Eaton Vance or your financial advisor.
Portfolio Holdings. Each Eaton Vance Fund and its underlying Portfolio(s) (if applicable) will file a schedule of portfolio holdings on Form N-Q with the SEC for the first and third quarters of each fiscal year. The Form N-Q will be available on the Eaton Vance website at www.eatonvance.com, by calling Eaton Vance at 1-800-262-1122 or in the EDGAR database on the SEC’s website at www.sec.gov. Form N-Q may also be reviewed and copied at the SEC’s public reference room in Washington, D.C. (call 1-800-732-0330 for information on the operation of the public reference room).
Proxy Voting. From time to time, funds are required to vote proxies related to the securities held by the funds. The Eaton Vance Funds or their underlying Portfolios (if applicable) vote proxies according to a set of policies and procedures approved by the Funds’ and Portfolios’ Boards. You may obtain a description of these policies and procedures and information on how the Funds or Portfolios voted proxies relating to portfolio securities during the most recent 12-month period ended June 30, without charge, upon request, by calling 1-800-262-1122 and by accessing the SEC’s website at www.sec.gov.
This Page Intentionally Left Blank
This Page Intentionally Left Blank
This Page Intentionally Left Blank
Investment Adviser and Administrator
Eaton Vance Management
Two International Place
Boston, MA 02110
Principal Underwriter*
Eaton Vance Distributors, Inc.
Two International Place
Boston, MA 02110
(617) 482-8260
Custodian
State Street Bank and Trust Company
200 Clarendon Street
Boston, MA 02116
Transfer Agent
BNY Mellon Investment Servicing (US) Inc.
Attn: Eaton Vance Funds
P.O. Box 9653
Providence, RI 02940-9653
(800) 262-1122
Independent Registered Public Accounting Firm
Deloitte & Touche LLP
200 Berkeley Street
Boston, MA 02116-5022
Fund Offices
Two International Place
Boston, MA 02110
| * | FINRA BrokerCheck. Investors may check the background of their Investment Professional by contacting the Financial Industry Regulatory Authority (FINRA). FINRA BrokerCheck is a free tool to help investors check the professional background of current and former FINRA-registered securities firms and brokers. FINRA BrokerCheck is available by calling 1-800-289-9999 and at www.FINRA.org. The FINRA BrokerCheck brochure describing this program is available to investors at www.FINRA.org. |
2320-12/12 DISRC
| | |
Eaton Vance Global Macro Absolute Return Fund Annual Report October 31, 2012 | | 
|

Fund shares are not insured by the FDIC and are not deposits or other obligations of, or guaranteed by, any depository institution. Shares are subject to investment risks, including possible loss of principal invested.
This report must be preceded or accompanied by a current summary prospectus or prospectus. Before investing, investors should consider carefully the investment objective, risks, and charges and expenses of a mutual fund. This and other important information is contained in the summary prospectus and prospectus, which can be obtained from a financial advisor. Prospective investors should read the prospectus carefully before investing. For further information, please call 1-800-262-1122.
Annual Report October 31, 2012
Eaton Vance
Global Macro Absolute Return Fund
Table of Contents
| | | | |
Management’s Discussion of Fund Performance | | | 2 | |
| |
Performance | | | 3 | |
| |
Fund Profile | | | 4 | |
| |
Endnotes and Additional Disclosures | | | 5 | |
| |
Fund Expenses | | | 6 | |
| |
Financial Statements | | | 7 | |
| |
Report of Independent Registered Public Accounting Firm | | | 18 and 65 | |
| |
Federal Tax Information | | | 19 | |
| |
Management and Organization | | | 66 | |
| |
Important Notices | | | 69 | |
Eaton Vance
Global Macro Absolute Return Fund
October 31, 2012
Management’s Discussion of Fund Performance1
Economic and Market Conditions
The 12-month period ending October 31, 2012 was a year dominated by central bank easing. The most aggressive action took place in developed-market countries that are burdened with debt. The European Central Bank (ECB) offered low-interest, three-year loans to banks, as the region’s debt crisis made it difficult for banks to fund their operations in the public markets. The ECB also cut its main interest rate three times, to a record low of 0.75%, and unveiled a plan to buy bonds of troubled eurozone governments. With their key policy rates already near zero, the U.S. Federal Reserve (the Fed), Bank of Japan and Bank of England relied on quantitative easing to try to reduce longer-term borrowing costs and spur economic growth. In addition, the Fed continued with “Operation Twist,” a stimulus program that was set to expire in June 2012 but that was extended through the end of 2012.
In the United States, gross domestic product (GDP) growth slid from an annual rate of 4.1% in the fourth quarter of 2011 to 2.7% or less in each of the next three quarters. Growth in Germany and Japan also decelerated, Spain and Italy entered recession, and France appeared to be heading in that direction. Latin American and emerging Asian economies grew faster than their developed-market counterparts. However, their growth rates slowed, causing central banks in Brazil, China and other countries in these regions to reduce interest rates.
The world’s bond markets generally posted positive returns during the fiscal year. Higher-risk securities delivered some of the strongest gains, as investors chased yield in the low-rate environment. For example, local bond prices appreciated throughout much of the emerging world. In the foreign exchange markets, most Latin American and Asian currencies strengthened versus the U.S. dollar, and most Central and Eastern European currencies strengthened versus the euro. On a total return basis, the Mexican peso and Philippine peso did especially well versus the U.S. dollar, while the Polish zloty was a standout performer versus the euro.
Fund Performance
For the fiscal year ending October, 31, 2012, Eaton Vance Global Macro Absolute Return Fund’s (the Fund) Class A shares at net asset value (NAV) had a total return of 3.06%. By comparison, the Fund’s benchmark, the BofA Merrill Lynch 3-Month U.S. Treasury Bill Index (the Index)2, gained 0.08% during the period.
In Asia, the Fund benefited from long positions in several currencies, particularly the Philippine peso. The peso appreciated on reports of better-than-expected economic growth in the Philippines and a narrowing of the country’s budget deficit. Alternatively, a short position in the Japanese yen was unfavorable given the attraction of the yen as a safe-haven currency, as well as positive real rates of return on Japanese government bonds.
In Central and Eastern Europe, exposure to euro-denominated Polish debt was helpful. Poland has been working to meet the Maastricht Treaty criteria so that it can join the eurozone, and these efforts have strengthened the country’s economic fundamentals. In Western Europe, the Fund was short eurozone sovereign credit. A short position in Spain added to performance versus the Index because of Spain’s ongoing debt problems. However, a short position in France detracted from performance versus the Index, as the French credit remained strong during the period due to technical reasons.
One of the biggest contributors in Latin America was a long position in the Mexican peso. Mexico had elections in July 2012, and investors were optimistic that the new administration would institute reforms to improve the country’s long-run economic growth potential. On the negative side, a short position in Argentinian credit default swaps did poorly. The cost to insure Argentina’s bonds spiked near the end of the period due to a surprise court ruling related to the country’s debt restructuring of several years ago.
In Africa, both long and short currency positions contributed to the Fund’s return, although a long position in the Nigerian naira was particularly helpful. Nigeria’s government bills had strong yields, and the country saw increased capital flows based on its ability to export oil. Furthermore, its debt was added to key benchmark indices in the latter part of the fiscal year.
The Fund’s commodity exposure did not have a meaningful impact on performance versus the Index. The Fund was long platinum and short gold, and both precious metals posted relatively flat returns during the period.
See Endnotes and Additional Disclosures in this report.
Past performance is no guarantee of future results. Returns are historical and are calculated by determining the percentage change in net asset value (NAV) or offering price (as applicable) with all distributions reinvested. Investment return and principal value will fluctuate so that shares, when redeemed, may be worth more or less than their original cost. Performance less than one year is cumulative. Performance is for the stated time period only; due to market volatility, the Fund’s current performance may be lower or higher than quoted. Returns are before taxes unless otherwise noted. For performance as of the most recent month end, please refer to www.eatonvance.com.
Eaton Vance
Global Macro Absolute Return Fund
October 31, 2012
Performance2,3
Portfolio Managers John R. Baur, Michael A. Cirami, CFA and Eric Stein, CFA
| | | | | | | | | | | | | | | | |
| % Average Annual Total Returns | | Inception Date | | | One Year | | | Five Years | | | Since
Inception | |
Class A at NAV | | | 06/27/2007 | | | | 3.06 | % | | | 4.40 | % | | | 4.97 | % |
Class A with 4.75% Maximum Sales Charge | | | — | | | | –1.87 | | | | 3.39 | | | | 4.02 | |
Class C at NAV | | | 10/01/2009 | | | | 2.41 | | | | — | | | | 2.31 | |
Class C with 1% Maximum Sales Charge | | | — | | | | 1.41 | | | | — | | | | 2.31 | |
Class I at NAV | | | 06/27/2007 | | | | 3.37 | | | | 4.70 | | | | 5.25 | |
Class R at NAV | | | 04/08/2010 | | | | 2.95 | | | | — | | | | 1.97 | |
BofA Merrill Lynch 3-Month U.S. Treasury Bill Index | | | 06/27/2007 | | | | 0.08 | % | | | 0.66 | % | | | 0.93 | % |
| | | | |
| | | | | | | | | | | | | | | | |
| % Total Annual Operating Expense Ratios4 | | Class A | | | Class C | | | Class I | | | Class R | |
| | | 1.14 | % | | | 1.84 | % | | | 0.85 | % | | | 1.34 | % |
Performance of $250,000
This graph shows the change in value of a hypothetical investment of $250,000 in Class I of the Fund for the period indicated. For comparison, the same investment is shown in the indicated index.
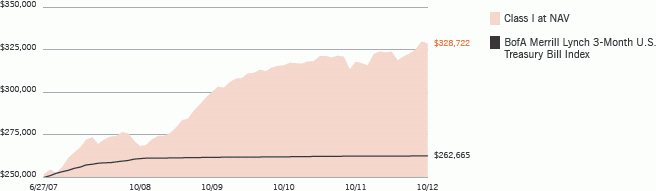
| | | | | | | | |
| Performance of Investment | | Amount Invested | | Period Beginning | | At NAV | | With Maximum Sales Charge |
Class A | | $10,000 | | 06/27/2007 | | $12,962 | | $12,345 |
Class C | | $10,000 | | 10/01/2009 | | $10,731 | | N.A. |
Class R | | $10,000 | | 04/08/2010 | | $10,514 | | N.A. |
See Endnotes and Additional Disclosures in this report.
Past performance is no guarantee of future results. Returns are historical and are calculated by determining the percentage change in net asset value (NAV) or offering price (as applicable) with all distributions reinvested. Investment return and principal value will fluctuate so that shares, when redeemed, may be worth more or less than their original cost. Performance less than one year is cumulative. Performance is for the stated time period only; due to market volatility, the Fund’s current performance may be lower or higher than quoted. Returns are before taxes unless otherwise noted. For performance as of the most recent month end, please refer to www.eatonvance.com.
Eaton Vance
Global Macro Absolute Return Fund
October 31, 2012
Fund Profile5
Asset Allocation (% of net assets)6
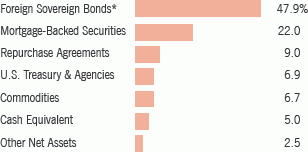
| * | Net securities sold short. |
Foreign Currency Exposure (% of net assets)7
| | | | | | | | | | |
India | | | 6.7 | % | | Poland | | | 1.6 | % |
Malaysia | | | 5.0 | | | Uruguay | | | 1.5 | |
China | | | 4.8 | | | Georgia | | | 1.2 | |
Serbia | | | 4.8 | | | Peru | | | 1.0 | |
Nigeria | | | 4.8 | | | Gold | | | 0.4 | |
Mexico | | | 4.5 | | | New Zealand | | | 0.1 | |
South Korea | | | 4.1 | | | Dominican Republic | | | 0.0 | * |
Hong Kong | | | 3.5 | | | Costa Rica | | | 0.0 | * |
Platinum | | | 3.4 | | | Uganda | | | 0.0 | * |
Turkey | | | 3.1 | | | United Kingdom | | | 0.0 | * |
Philippines | | | 2.9 | | | Chile | | | 0.0 | * |
Norway | | | 2.2 | | | Hungary | | | -0.1 | |
Brazil | | | 2.1 | | | South Africa | | | -2.0 | |
Sri Lanka | | | 2.0 | | | Japan | | | -2.3 | |
Singapore | | | 2.0 | | | Australia | | | -2.9 | |
Sweden | | | 2.0 | | | Taiwan | | | -5.5 | |
| | | | | | Euro | | | -16.7 | |
| | | | | | | |
| | | | | | Total Long | | | 63.7 | |
| | | | | | | |
| | | | | | Total Short | | | -29.5 | |
| | | | | | | |
* Amount is less than 0.05%. | | | | | | Total Net | | | 34.2 | |
| | | | | | | |
See Endnotes and Additional Disclosures in this report.
Eaton Vance
Global Macro Absolute Return Fund
October 31, 2012
Endnotes and Additional Disclosures
| 1 | The views expressed in this report are those of the portfolio manager(s) and are current only through the date stated at the top of this page. These views are subject to change at any time based upon market or other conditions, and Eaton Vance and the Fund(s) disclaim any responsibility to update such views. These views may not be relied upon as investment advice and, because investment decisions are based on many factors, may not be relied upon as an indication of trading intent on behalf of any Eaton Vance fund. This commentary may contain statements that are not historical facts, referred to as “forward looking statements”. The Fund’s actual future results may differ significantly from those stated in any forward looking statement, depending on factors such as changes in securities or financial markets or general economic conditions, the volume of sales and purchases of Fund shares, the continuation of investment advisory, administrative and service contracts, and other risks discussed from time to time in the Fund’s filings with the Securities and Exchange Commission. |
| 2 | BofA Merrill Lynch 3-Month U.S. Treasury Bill Index is an unmanaged index of U.S. Treasury securities maturing in 90 days. BofA Merrill Lynch® indices not for redistribution or other uses; provided “as is”, without warranties, and with no liability. Eaton Vance has prepared this report, BofAML does not endorse it, or guarantee, review, or endorse Eaton Vance’s products. Unless otherwise stated, index returns do not reflect the effect of any applicable sales charges, commissions, expenses, taxes or leverage, as applicable. It is not possible to invest directly in an index. |
| 3 | Total Returns at NAV do not include applicable sales charges. If sales charges were deducted, the returns would be lower. Total Returns shown with maximum sales charge reflect the stated maximum sales charge. Unless otherwise stated, performance does not reflect the deduction of taxes on Fund distributions or redemptions of Fund shares. |
| 4 | Source: Fund prospectus. |
| 5 | Fund primarily invests in an affiliated investment company (Portfolio) with the same objective(s) and policies as the Fund and may also invest directly. Unless otherwise noted, references to investments are to the aggregate holdings of the Fund and the Portfolio. |
| 6 | Other net assets represents other assets less liabilities and includes investment types, if any, each less than 1% of net assets. See Statement of Assets and Liabilities for details. |
| 7 | Currency exposures include all foreign exchange denominated assets, currency derivatives and commodities (including commodity derivatives). Total exposures may exceed 100% due to implicit leverage created by derivatives. |
| | Fund profile subject to change due to active management. |
Eaton Vance
Global Macro Absolute Return Fund
October 31, 2012
Fund Expenses
Example: As a Fund shareholder, you incur two types of costs: (1) transaction costs, including sales charges (loads) on purchases and redemption fees (if applicable); and (2) ongoing costs, including management fees; distribution and/or service fees; and other Fund expenses. This Example is intended to help you understand your ongoing costs (in dollars) of Fund investing and to compare these costs with the ongoing costs of investing in other mutual funds. The Example is based on an investment of $1,000 invested at the beginning of the period and held for the entire period (May 1, 2012 – October 31, 2012).
Actual Expenses: The first section of the table below provides information about actual account values and actual expenses. You may use the information in this section, together with the amount you invested, to estimate the expenses that you paid over the period. Simply divide your account value by $1,000 (for example, an $8,600 account value divided by $1,000 = 8.6), then multiply the result by the number in the first section under the heading entitled “Expenses Paid During Period” to estimate the expenses you paid on your account during this period.
Hypothetical Example for Comparison Purposes: The second section of the table below provides information about hypothetical account values and hypothetical expenses based on the actual Fund expense ratio and an assumed rate of return of 5% per year (before expenses), which is not the actual Fund return. The hypothetical account values and expenses may not be used to estimate the actual ending account balance or expenses you paid for the period. You may use this information to compare the ongoing costs of investing in your Fund and other funds. To do so, compare this 5% hypothetical example with the 5% hypothetical examples that appear in the shareholder reports of the other funds.
Please note that the expenses shown in the table are meant to highlight your ongoing costs only and do not reflect any transactional costs, such as sales charges (loads) or redemption fees (if applicable). Therefore, the second section of the table is useful in comparing ongoing costs only, and will not help you determine the relative total costs of owning different funds. In addition, if these transactional costs were included, your costs would be higher.
| | | | | | | | | | | | | | | | |
| | | Beginning
Account Value
(5/1/12) | | | Ending
Account Value
(10/31/12) | | | Expenses Paid
During Period*
(5/1/12 – 10/31/12) | | | Annualized
Expense
Ratio | |
| | | | |
| | | | | | | | | | | | | | | | |
Actual | | | | | | | | | | | | | | | | |
Class A | | $ | 1,000.00 | | | $ | 1,013.30 | | | $ | 6.88 | | | | 1.36 | % |
Class C | | $ | 1,000.00 | | | $ | 1,009.60 | | | $ | 10.46 | | | | 2.07 | % |
Class I | | $ | 1,000.00 | | | $ | 1,014.90 | | | $ | 5.37 | | | | 1.06 | % |
Class R | | $ | 1,000.00 | | | $ | 1,013.30 | | | $ | 7.89 | | | | 1.56 | % |
| | | | | | | | | | | | | | | | | |
| | | | |
| | | | | | | | | | | | | | | | |
Hypothetical | | | | | | | | | | | | | | | | |
(5% return per year before expenses) | | | | | | | | | | | | | | | | |
Class A | | $ | 1,000.00 | | | $ | 1,018.30 | | | $ | 6.90 | | | | 1.36 | % |
Class C | | $ | 1,000.00 | | | $ | 1,014.70 | | | $ | 10.48 | | | | 2.07 | % |
Class I | | $ | 1,000.00 | | | $ | 1,019.80 | | | $ | 5.38 | | | | 1.06 | % |
Class R | | $ | 1,000.00 | | | $ | 1,017.30 | | | $ | 7.91 | | | | 1.56 | % |
| * | Expenses are equal to the Fund's annualized expense ratio for the indicated Class, multiplied by the average account value over the period, multiplied by 184/366 (to reflect the one-half year period). The Example assumes that the $1,000 was invested at the net asset value per share determined at the close of business on April 30, 2012. The Example reflects the expenses of both the Fund and the Portfolio. |
Eaton Vance
Global Macro Absolute Return Fund
October 31, 2012
Statement of Assets and Liabilities
| | | | |
| Assets | | October 31, 2012 | |
Investment in Global Macro Portfolio, at value (identified cost, $6,429,599,338) | | $ | 6,487,760,513 | |
Receivable for Fund shares sold | | | 28,084,383 | |
Total assets | | $ | 6,515,844,896 | |
| |
| Liabilities | | | | |
Payable for Fund shares redeemed | | $ | 22,535,893 | |
Distributions payable | | | 7,081,090 | |
Payable to affiliates: | | | | |
Distribution and service fees | | | 1,107,149 | |
Trustees’ fees | | | 42 | |
Accrued expenses | | | 1,165,780 | |
Total liabilities | | $ | 31,889,954 | |
Net Assets | | $ | 6,483,954,942 | |
| |
| Sources of Net Assets | | | | |
Paid-in capital | | $ | 6,540,709,400 | |
Accumulated net realized loss from Portfolio | | | (59,170,803 | ) |
Accumulated distributions in excess of net investment income | | | (55,744,830 | ) |
Net unrealized appreciation from Portfolio | | | 58,161,175 | |
Total | | $ | 6,483,954,942 | |
| |
| Class A Shares | | | | |
Net Assets | | $ | 1,557,258,794 | |
Shares Outstanding | | | 157,248,871 | |
Net Asset Value and Redemption Price Per Share | | | | |
(net assets ÷ shares of beneficial interest outstanding) | | $ | 9.90 | |
Maximum Offering Price Per Share | | | | |
(100 ÷ 95.25 of net asset value per share) | | $ | 10.39 | |
| |
| Class C Shares | | | | |
Net Assets | | $ | 818,825,607 | |
Shares Outstanding | | | 82,631,446 | |
Net Asset Value and Offering Price Per Share* | | | | |
(net assets ÷ shares of beneficial interest outstanding) | | $ | 9.91 | |
| |
| Class I Shares | | | | |
Net Assets | | $ | 4,107,110,122 | |
Shares Outstanding | | | 415,108,565 | |
Net Asset Value, Offering Price and Redemption Price Per Share | | | | |
(net assets ÷ shares of beneficial interest outstanding) | | $ | 9.89 | |
| |
| Class R Shares | | | | |
Net Assets | | $ | 760,419 | |
Shares Outstanding | | | 76,694 | |
Net Asset Value, Offering Price and Redemption Price Per Share | | | | |
(net assets ÷ shares of beneficial interest outstanding) | | $ | 9.91 | |
On sales of $50,000 or more, the offering price of Class A shares is reduced.
| * | Redemption price per share is equal to the net asset value less any applicable contingent deferred sales charge. |
| | | | |
| | 7 | | See Notes to Financial Statements. |
Eaton Vance
Global Macro Absolute Return Fund
October 31, 2012
Statement of Operations
| | | | |
| Investment Income | | Year Ended
October 31, 2012 | |
Interest allocated from Portfolio (net of foreign taxes, $1,050,693) | | $ | 326,533,810 | |
Dividends allocated from Portfolio (net of foreign taxes, $49,174) | | | 748,633 | |
Expenses allocated from Portfolio | | | (60,437,130 | ) |
Total investment income from Portfolio | | $ | 266,845,313 | |
| |
| Expenses | | | | |
Distribution and service fees | | | | |
Class A | | $ | 4,984,392 | |
Class C | | | 9,259,355 | |
Class R | | | 3,652 | |
Trustees’ fees and expenses | | | 500 | |
Custodian fee | | | 38,324 | |
Transfer and dividend disbursing agent fees | | | 4,890,121 | |
Legal and accounting services | | | 75,596 | |
Printing and postage | | | 684,607 | |
Registration fees | | | 224,636 | |
Miscellaneous | | | 41,519 | |
Total expenses | | $ | 20,202,702 | |
| |
Net investment income | | $ | 246,642,611 | |
| |
| Realized and Unrealized Gain (Loss) from Portfolio | | | | |
Net realized gain (loss) — | | | | |
Investment transactions | | $ | (197,773,603 | ) |
Securities sold short | | | 1,265,065 | |
Futures contracts | | | (33,248,906 | ) |
Swap contracts | | | (12,961,162 | ) |
Forward commodity contracts | | | (4,399,782 | ) |
Foreign currency and forward foreign currency exchange contract transactions | | | 206,363,464 | |
Net realized loss | | $ | (40,754,924 | ) |
Change in unrealized appreciation (depreciation) — | | | | |
Investments (including net decrease of $872,669 from precious metals) | | $ | 154,842,092 | |
Written options | | | 10,506,399 | |
Securities sold short | | | (34,391,782 | ) |
Futures contracts | | | (1,765,227 | ) |
Swap contracts | | | (78,098,989 | ) |
Forward commodity contracts | | | 3,969,189 | |
Foreign currency and forward foreign currency exchange contracts | | | (64,049,655 | ) |
Net change in unrealized appreciation (depreciation) | | $ | (8,987,973 | ) |
| |
Net realized and unrealized loss | | $ | (49,742,897 | ) |
| |
Net increase in net assets from operations | | $ | 196,899,714 | |
| | | | |
| | 8 | | See Notes to Financial Statements. |
Eaton Vance
Global Macro Absolute Return Fund
October 31, 2012
Statements of Changes in Net Assets
| | | | | | | | |
| | | Year Ended October 31, | |
| Increase (Decrease) in Net Assets | | 2012 | | | 2011 | |
From operations — | | | | | | | | |
Net investment income | | $ | 246,642,611 | | | $ | 211,082,793 | |
Net realized loss from investment transactions, written options, securities sold short, futures contracts, swap contracts, forward commodity contracts, and foreign currency and forward foreign currency exchange contract transactions | | | (40,754,924 | ) | | | (137,096,218 | ) |
Net change in unrealized appreciation (depreciation) from investments, written options, securities sold short, futures contracts, swap contracts, forward commodity contracts, foreign currency and forward foreign currency exchange contracts | | | (8,987,973 | ) | | | (36,650,634 | ) |
Net increase in net assets from operations | | $ | 196,899,714 | | | $ | 37,335,941 | |
Distributions to shareholders — | | | | | | | | |
From net investment income | | | | | | | | |
Class A | | $ | (52,880,208 | ) | | $ | (81,823,188 | ) |
Class C | | | (22,955,635 | ) | | | (37,424,797 | ) |
Class I | | | (134,426,724 | ) | | | (151,730,795 | ) |
Class R | | | (21,425 | ) | | | (32,334 | ) |
From net realized gain | | | | | | | | |
Class A | | | (7,206,882 | ) | | | — | |
Class C | | | (3,806,130 | ) | | | — | |
Class I | | | (18,348,757 | ) | | | — | |
Class R | | | (3,505 | ) | | | — | |
Tax return of capital | | | | | | | | |
Class A | | | — | | | | (6,843,971 | ) |
Class C | | | — | | | | (3,130,338 | ) |
Class I | | | — | | | | (12,691,282 | ) |
Class R | | | — | | | | (2,704 | ) |
Total distributions to shareholders | | $ | (239,649,266 | ) | | $ | (293,679,409 | ) |
Transactions in shares of beneficial interest — | | | | | | | | |
Proceeds from sale of shares | | | | | | | | |
Class A | | $ | 664,508,905 | | | $ | 560,439,123 | |
Class C | | | 144,837,701 | | | | 91,125,513 | |
Class I | | | 2,061,471,528 | | | | 2,141,810,659 | |
Class R | | | 195,997 | | | | 162,203 | |
Net asset value of shares issued to shareholders in payment of distributions declared | | | | | | | | |
Class A | | | 55,665,256 | | | | 75,542,871 | |
Class C | | | 20,259,755 | | | | 28,507,062 | |
Class I | | | 74,607,075 | | | | 74,082,063 | |
Class R | | | 24,897 | | | | 34,733 | |
Cost of shares redeemed | | | | | | | | |
Class A | | | (938,927,068 | ) | | | (1,262,777,663 | ) |
Class C | | | (387,864,331 | ) | | | (379,543,400 | ) |
Class I | | | (1,660,552,010 | ) | | | (2,053,258,833 | ) |
Class R | | | (159,286 | ) | | | (553,696 | ) |
Net increase (decrease) in net assets from Fund share transactions | | $ | 34,068,419 | | | $ | (724,429,365 | ) |
| | |
Net decrease in net assets | | $ | (8,681,133 | ) | | $ | (980,772,833 | ) |
| | |
| Net Assets | | | | | | | | |
At beginning of year | | $ | 6,492,636,075 | | | $ | 7,473,408,908 | |
At end of year | | $ | 6,483,954,942 | | | $ | 6,492,636,075 | |
| | |
Accumulated distributions in excess of net investment income included in net assets | | | | | | | | |
At end of year | | $ | (55,744,830 | ) | | $ | (81,457,605 | ) |
| | | | |
| | 9 | | See Notes to Financial Statements. |
Eaton Vance
Global Macro Absolute Return Fund
October 31, 2012
Financial Highlights
| | | | | | | | | | | | | | | | | | | | |
| | | Class A | |
| | | Year Ended October 31, | |
| | | 2012 | | | 2011 | | | 2010 | | | 2009 | | | 2008 | |
Net asset value — Beginning of year | | $ | 9.960 | | | $ | 10.320 | | | $ | 10.360 | | | $ | 9.830 | | | $ | 10.220 | |
| | | | | |
| Income (Loss) From Operations | | | | | | | | | | | | | | | | | | | | |
Net investment income(1) | | $ | 0.369 | | | $ | 0.289 | | | $ | 0.226 | | | $ | 0.460 | | | $ | 0.499 | |
Net realized and unrealized gain (loss) | | | (0.071 | ) | | | (0.247 | ) | | | 0.269 | | | | 0.649 | | | | (0.247 | ) |
| | | | | |
Total income from operations | | $ | 0.298 | | | $ | 0.042 | | | $ | 0.495 | | | $ | 1.109 | | | $ | 0.252 | |
| | | | | |
| Less Distributions | | | | | | | | | | | | | | | | | | | | |
From net investment income | | $ | (0.313 | ) | | $ | (0.371 | ) | | $ | (0.067 | ) | | $ | (0.571 | ) | | $ | (0.605 | ) |
From net realized gain | | | (0.045 | ) | | | — | | | | — | | | | (0.008 | ) | | | (0.037 | ) |
Tax return of capital | | | — | | | | (0.031 | ) | | | (0.468 | ) | | | — | | | | — | |
| | | | | |
Total distributions | | $ | (0.358 | ) | | $ | (0.402 | ) | | $ | (0.535 | ) | | $ | (0.579 | ) | | $ | (0.642 | ) |
| | | | | |
Net asset value — End of year | | $ | 9.900 | | | $ | 9.960 | | | $ | 10.320 | | | $ | 10.360 | | | $ | 9.830 | |
| | | | | |
Total Return(2) | | | 3.06 | % | | | 0.40 | % | | | 4.89 | % | | | 11.53 | % | | | 2.49 | % |
| | | | | |
| Ratios/Supplemental Data | | | | | | | | | | | | | | | | | | | | |
Net assets, end of year (000's omitted) | | $ | 1,557,259 | | | $ | 1,786,581 | | | $ | 2,489,211 | | | $ | 209,714 | | | $ | 38,178 | |
Ratios (as a percentage of average daily net assets): | | | | | | | | | | | | | | | | | | | | |
Expenses(3)(4) | | | 1.32 | %(5) | | | 1.14 | %(5) | | | 1.00 | % | | | 1.24 | %(6) | | | 1.10 | %(6) |
Net investment income | | | 3.72 | % | | | 2.83 | % | | | 2.18 | % | | | 4.56 | % | | | 4.90 | % |
Portfolio Turnover of the Portfolio | | | 39 | % | | | 33 | % | | | 19 | % | | | 25 | % | | | 26 | % |
| (1) | Computed using average shares outstanding. |
| (2) | Returns are historical and are calculated by determining the percentage change in net asset value with all distributions reinvested and do not reflect the effect of sales charges. |
| (3) | Includes the Fund's share of the Portfolio's allocated expenses. |
| (4) | Excludes the effect of custody fee credits, if any, of less than 0.005%. |
| (5) | Includes interest and dividend expense primarily on securities sold short of 0.30% and 0.10% for the years ended October 31, 2012 and 2011, respectively. |
| (6) | The administrator subsidized certain operating expenses (equal to 0.12% and 0.33% of average daily net assets for the years ended October 31, 2009 and 2008, respectively). |
| | | | |
| | 10 | | See Notes to Financial Statements. |
Eaton Vance
Global Macro Absolute Return Fund
October 31, 2012
Financial Highlights — continued
| | | | | | | | | | | | | | | | |
| | | Class C | |
| | | Year Ended October 31, | | | Period Ended
October 31, 2009(1) | |
| | | 2012 | | | 2011 | | | 2010 | | |
Net asset value — Beginning of period | | $ | 9.960 | | | $ | 10.320 | | | $ | 10.350 | | | $ | 10.300 | |
| | | | |
| Income (Loss) From Operations | | | | | | | | | | | | | | | | |
Net investment income (loss)(2) | | $ | 0.299 | | | $ | 0.217 | | | $ | 0.146 | | | $ | (0.012 | ) |
Net realized and unrealized gain (loss) | | | (0.063 | ) | | | (0.249 | ) | | | 0.282 | | | | 0.104 | |
| | | | |
Total income (loss) from operations | | $ | 0.236 | | | $ | (0.032 | ) | | $ | 0.428 | | | $ | 0.092 | |
| | | | |
| Less Distributions | | | | | | | | | | | | | | | | |
From net investment income | | $ | (0.241 | ) | | $ | (0.303 | ) | | $ | (0.057 | ) | | $ | (0.042 | ) |
From net realized gain | | | (0.045 | ) | | | — | | | | — | | | | — | |
Tax return of capital | | | — | | | | (0.025 | ) | | | (0.401 | ) | | | — | |
| | | | |
Total distributions | | $ | (0.286 | ) | | $ | (0.328 | ) | | $ | (0.458 | ) | | $ | (0.042 | ) |
| | | | |
Net asset value — End of period | | $ | 9.910 | | | $ | 9.960 | | | $ | 10.320 | | | $ | 10.350 | |
| | | | |
Total Return(3) | | | 2.41 | % | | | (0.33 | )% | | | 4.21 | % | | | 0.89 | %(4) |
| | | | |
| Ratios/Supplemental Data | | | | | | | | | | | | | | | | |
Net assets, end of period (000's omitted) | | $ | 818,826 | | | $ | 1,047,345 | | | $ | 1,349,700 | | | $ | 39,020 | |
Ratios (as a percentage of average daily net assets): | | | | | | | | | | | | | | | | |
Expenses(5)(6) | | | 2.02 | %(7) | | | 1.84 | %(7) | | | 1.71 | % | | | 1.97 | %(8)(9) |
Net investment income (loss) | | | 3.02 | % | | | 2.13 | % | | | 1.41 | % | | | (1.41 | )%(8) |
Portfolio Turnover of the Portfolio | | | 39 | % | | | 33 | % | | | 19 | % | | | 25 | %(10) |
| (1) | For the period from commencement of operations on October 1, 2009 to October 31, 2009. |
| (2) | Computed using average shares outstanding. |
| (3) | Returns are historical and are calculated by determining the percentage change in net asset value with all distributions reinvested and do not reflect the effect of sales charges. |
| (5) | Includes the Fund's share of the Portfolio's allocated expenses. |
| (6) | Excludes the effect of custody fee credits, if any, of less than 0.005%. |
| (7) | Includes interest and dividend expense primarily on securities sold short of 0.30% and 0.10% for the years ended October 31, 2012 and 2011, respectively. |
| (9) | The administrator subsidized certain operating expenses (equal to 0.08% of average daily net assets for the period ended October 31, 2009). |
| (10) | For the Portfolio's year ended October 31, 2009. |
| | | | |
| | 11 | | See Notes to Financial Statements. |
Eaton Vance
Global Macro Absolute Return Fund
October 31, 2012
Financial Highlights — continued
| | | | | | | | | | | | | | | | | | | | |
| | | Class I | |
| | | Year Ended October 31, | |
| | | 2012 | | | 2011 | | | 2010 | | | 2009 | | | 2008 | |
Net asset value — Beginning of year | | $ | 9.950 | | | $ | 10.310 | | | $ | 10.340 | | | $ | 9.820 | | | $ | 10.210 | |
| | | | | |
| Income (Loss) From Operations | | | | | | | | | | | | | | | | | | | | |
Net investment income(1) | | $ | 0.398 | | | $ | 0.318 | | | $ | 0.245 | | | $ | 0.504 | | | $ | 0.464 | |
Net realized and unrealized gain (loss) | | | (0.070 | ) | | | (0.247 | ) | | | 0.285 | | | | 0.623 | | | | (0.181 | ) |
| | | | | |
Total income from operations | | $ | 0.328 | | | $ | 0.071 | | | $ | 0.530 | | | $ | 1.127 | | | $ | 0.283 | |
| | | | | |
| Less Distributions | | | | | | | | | | | | | | | | | | | | |
From net investment income | | $ | (0.343 | ) | | $ | (0.398 | ) | | $ | (0.070 | ) | | $ | (0.599 | ) | | $ | (0.636 | ) |
From net realized gain | | | (0.045 | ) | | | — | | | | — | | | | (0.008 | ) | | | (0.037 | ) |
Tax return of capital | | | — | | | | (0.033 | ) | | | (0.490 | ) | | | — | | | | — | |
| | | | | |
Total distributions | | $ | (0.388 | ) | | $ | (0.431 | ) | | $ | (0.560 | ) | | $ | (0.607 | ) | | $ | (0.673 | ) |
| | | | | |
Net asset value — End of year | | $ | 9.890 | | | $ | 9.950 | | | $ | 10.310 | | | $ | 10.340 | | | $ | 9.820 | |
| | | | | |
Total Return(2) | | | 3.37 | % | | | 0.68 | % | | | 5.24 | % | | | 11.87 | % | | | 2.69 | % |
| | | | | |
| Ratios/Supplemental Data | | | | | | | | | | | | | | | | | | | | |
Net assets, end of year (000's omitted) | | $ | 4,107,110 | | | $ | 3,658,008 | | | $ | 3,633,407 | | | $ | 147,589 | | | $ | 16,291 | |
Ratios (as a percentage of average daily net assets): | | | | | | | | | | | | | | | | | | | | |
Expenses(3)(4) | | | 1.02 | %(5) | | | 0.85 | %(5) | | | 0.71 | % | | | 0.94 | %(6) | | | 0.80 | %(6) |
Net investment income | | | 4.03 | % | | | 3.13 | % | | | 2.36 | % | | | 5.01 | % | | | 4.59 | % |
Portfolio Turnover of the Portfolio | | | 39 | % | | | 33 | % | | | 19 | % | | | 25 | % | | | 26 | % |
| (1) | Computed using average shares outstanding. |
| (2) | Returns are historical and are calculated by determining the percentage change in net asset value with all distributions reinvested. |
| (3) | Includes the Fund's share of the Portfolio's allocated expenses. |
| (4) | Excludes the effect of custody fee credits, if any, of less than 0.005%. |
| (5) | Includes interest and dividend expense primarily on securities sold short of 0.30% and 0.11% for the years ended October 31, 2012 and 2011, respectively. |
| (6) | The administrator subsidized certain operating expenses (equal to 0.12% and 0.33% of average daily net assets for the years ended October 31, 2009 and 2008, respectively). |
| | | | |
| | 12 | | See Notes to Financial Statements. |
Eaton Vance
Global Macro Absolute Return Fund
October 31, 2012
Financial Highlights — continued
| | | | | | | | | | | | |
| | | Class R | |
| | | Year Ended October 31, | | | Period Ended
October 31, 2010(1) | |
| | | 2012 | | | 2011 | | |
Net asset value — Beginning of period | | $ | 9.970 | | | $ | 10.330 | | | $ | 10.380 | |
| | | |
| Income (Loss) From Operations | | | | | | | | | | | | |
Net investment income(2) | | $ | 0.350 | | | $ | 0.269 | | | $ | 0.062 | |
Net realized and unrealized gain (loss) | | | (0.072 | ) | | | (0.249 | ) | | | 0.138 | |
| | | |
Total income from operations | | $ | 0.278 | | | $ | 0.020 | | | $ | 0.200 | |
| | | |
| Less Distributions | | | | | | | | | | | | |
From net investment income | | $ | (0.293 | ) | | $ | (0.351 | ) | | $ | (0.031 | ) |
From net realized gain | | | (0.045 | ) | | | — | | | | — | |
Tax return of capital | | | — | | | | (0.029 | ) | | | (0.219 | ) |
| | | |
Total distributions | | $ | (0.338 | ) | | $ | (0.380 | ) | | $ | (0.250 | ) |
| | | |
Net asset value — End of period | | $ | 9.910 | | | $ | 9.970 | | | $ | 10.330 | |
| | | |
Total Return(3) | | | 2.95 | % | | | 0.18 | % | | | 1.94 | %(4) |
| | | |
| Ratios/Supplemental Data | | | | | | | | | | | | |
Net assets, end of period (000's omitted) | | $ | 760 | | | $ | 702 | | | $ | 1,091 | |
Ratios (as a percentage of average daily net assets): | | | | | | | | | | | | |
Expenses(5)(6) | | | 1.52 | %(7) | | | 1.34 | %(7) | | | 1.18 | %(8) |
Net investment income | | | 3.53 | % | | | 2.63 | % | | | 1.06 | %(8) |
Portfolio Turnover of the Portfolio | | | 39 | % | | | 33 | % | | | 19 | %(9) |
| (1) | For the period from commencement of operations on April 8, 2010 to October 31, 2010. |
| (2) | Computed using average shares outstanding. |
| (3) | Returns are historical and are calculated by determining the percentage change in net asset value with all distributions reinvested. |
| (5) | Includes the Fund's share of the Portfolio's allocated expenses. |
| (6) | Excludes the effect of custody fee credits, if any, of less than 0.005%. |
| (7) | Includes interest and dividend expense primarily on securities sold short of 0.30% and 0.10% for the years ended October 31, 2012 and 2011, respectively. |
| (9) | For the Portfolio's year ended October 31, 2010. |
| | | | |
| | 13 | | See Notes to Financial Statements. |
Eaton Vance
Global Macro Absolute Return Fund
October 31, 2012
Notes to Financial Statements
1 Significant Accounting Policies
Eaton Vance Global Macro Absolute Return Fund (the Fund) is a non-diversified series of Eaton Vance Mutual Funds Trust (the Trust). The Trust is a Massachusetts business trust registered under the Investment Company Act of 1940, as amended (the 1940 Act), as an open-end management investment company. The Fund offers four classes of shares. Class A shares are generally sold subject to a sales charge imposed at time of purchase. Class C shares are sold at net asset value and are generally subject to a contingent deferred sales charge (see Note 5). Class I and Class R shares are sold at net asset value and are not subject to a sales charge. Each class represents a pro-rata interest in the Fund, but votes separately on class-specific matters and (as noted below) is subject to different expenses. Realized and unrealized gains and losses are allocated daily to each class of shares based on the relative net assets of each class to the total net assets of the Fund. Net investment income, other than class-specific expenses, is allocated daily to each class of shares based upon the ratio of the value of each class’s paid shares to the total value of all paid shares. Each class of shares differs in its distribution plan and certain other class-specific expenses. The Fund invests all of its investable assets in interests in Global Macro Portfolio (the Portfolio), a Massachusetts business trust, having the same investment objective and policies as the Fund. The value of the Fund’s investment in the Portfolio reflects the Fund’s proportionate interest in the net assets of the Portfolio (89.9% at October 31, 2012). The performance of the Fund is directly affected by the performance of the Portfolio. The consolidated financial statements of the Portfolio, including the consolidated portfolio of investments, are included elsewhere in this report and should be read in conjunction with the Fund’s financial statements.
The following is a summary of significant accounting policies of the Fund. The policies are in conformity with accounting principles generally accepted in the United States of America.
A Investment Valuation — Valuation of securities by the Portfolio is discussed in Note 1A of the Portfolio’s Notes to Consolidated Financial Statements, which are included elsewhere in this report.
B Income — The Fund’s net investment income or loss consists of the Fund’s pro-rata share of the net investment income or loss of the Portfolio, less all actual and accrued expenses of the Fund.
C Federal Taxes — The Fund’s policy is to comply with the provisions of the Internal Revenue Code applicable to regulated investment companies and to distribute to shareholders each year substantially all of its net investment income, and all or substantially all of its net realized capital gains. Accordingly, no provision for federal income or excise tax is necessary.
During the year ended October 31, 2012, a capital loss carryforward of $140,847,058 was utilized to offset net realized gains by the Fund.
At October 31, 2012, the Fund had a net investment loss of $57,508,193 incurred after December 31, 2011. This net loss is treated as arising on the first day of the Fund’s taxable year ending October 31, 2013.
As of October 31, 2012, the Fund had no uncertain tax positions that would require financial statement recognition, de-recognition, or disclosure. The Fund files a U.S. federal income tax return annually after its fiscal year-end, which is subject to examination by the Internal Revenue Service for a period of three years from the date of filing.
D Expenses — The majority of expenses of the Trust are directly identifiable to an individual fund. Expenses which are not readily identifiable to a specific fund are allocated taking into consideration, among other things, the nature and type of expense and the relative size of the funds.
E Expense Reduction — State Street Bank and Trust Company (SSBT) serves as custodian of the Fund. Pursuant to the custodian agreement, SSBT receives a fee reduced by credits, which are determined based on the average daily cash balance the Fund maintains with SSBT. All credit balances, if any, used to reduce the Fund’s custodian fees are reported as a reduction of expenses in the Statement of Operations.
F Use of Estimates — The preparation of the financial statements in conformity with accounting principles generally accepted in the United States of America requires management to make estimates and assumptions that affect the reported amounts of assets and liabilities at the date of the financial statements and the reported amounts of income and expense during the reporting period. Actual results could differ from those estimates.
G Indemnifications — Under the Trust’s organizational documents, its officers and Trustees may be indemnified against certain liabilities and expenses arising out of the performance of their duties to the Fund. Under Massachusetts law, if certain conditions prevail, shareholders of a Massachusetts business trust (such as the Trust) could be deemed to have personal liability for the obligations of the Trust. However, the Trust's Declaration of Trust contains an express disclaimer of liability on the part of Fund shareholders and the By-laws provide that the Trust shall assume the defense on behalf of any Fund shareholders. Moreover, the By-laws also provide for indemnification out of Fund property of any shareholder held personally liable solely by reason of being or having been a shareholder for all loss or expense arising from such liability. Additionally, in the normal course of business, the Fund enters into agreements with service providers that may contain indemnification clauses. The Fund’s maximum exposure under these arrangements is unknown as this would involve future claims that may be made against the Fund that have not yet occurred.
H Other — Investment transactions are accounted for on a trade date basis. Dividends to shareholders are recorded on the ex-dividend date.
Eaton Vance
Global Macro Absolute Return Fund
October 31, 2012
Notes to Financial Statements — continued
2 Distributions to Shareholders
The Fund declares dividends daily to shareholders of record at the time of declaration. Distributions are generally paid monthly. Distributions of realized capital gains (reduced by available capital loss carryforwards from prior years, if any) are made at least annually. Distributions are declared separately for each class of shares. Shareholders may reinvest income and capital gain distributions in additional shares of the same class of the Fund at the net asset value as of the reinvestment date or, at the election of the shareholder, receive distributions in cash. The Fund distinguishes between distributions on a tax basis and a financial reporting basis. Accounting principles generally accepted in the United States of America require that only distributions in excess of tax basis earnings and profits be reported in the financial statements as a return of capital. Permanent differences between book and tax accounting relating to distributions are reclassified to paid-in capital. For tax purposes, distributions from short-term capital gains and current year earnings and profits attributable to realized gains are considered to be from ordinary income.
The tax character of distributions declared for the years ended October 31, 2012 and October 31, 2011 was as follows:
| | | | | | | | |
| | | Year Ended October 31, | |
| | | 2012 | | | 2011 | |
| | |
Distributions declared from: | | | | | | | | |
Ordinary income | | $ | 210,283,992 | | | $ | 271,011,114 | |
Long-term capital gains | | $ | 29,365,274 | | | $ | — | |
Tax return of capital | | $ | — | | | $ | 22,668,295 | |
During the year ended October 31, 2012, accumulated net realized loss was decreased by $76,296,710, accumulated distributions in excess of net investment income was increased by $10,645,844 and paid-in capital was decreased by $65,650,866 due to differences between book and tax accounting, primarily for foreign currency gain (loss), paydown gain (loss), swap contracts, premium amortization, options contracts and investment in the Subsidiary. These reclassifications had no effect on the net assets or net asset value per share of the Fund.
As of October 31, 2012, the components of distributable earnings (accumulated losses) and unrealized appreciation (depreciation) on a tax basis were as follows:
| | | | |
Late year ordinary losses | | $ | (57,508,193 | ) |
Net unrealized appreciation | | $ | 7,834,825 | |
Other temporary differences | | $ | (7,081,090 | ) |
The differences between components of distributable earnings (accumulated losses) on a tax basis and the amounts reflected in the Statement of Assets and Liabilities are primarily due to partnership allocations, foreign currency transactions, futures contracts, swap contracts, tax accounting for straddle transactions, premium amortization and the timing of recognizing distributions to shareholders.
3 Investment Adviser Fee and Other Transactions with Affiliates
The investment adviser fee is earned by Eaton Vance Management (EVM) as compensation for investment advisory services rendered to the Fund. The fee is computed at an annual rate of 0.615% of the Fund’s average daily net assets that are not invested in other investment companies for which EVM or its affiliates serve as investment adviser or administrator (“Investable Assets”) up to $500 million and is payable monthly. On Investable Assets of $500 million and over, the annual fee is reduced. For the year ended October 31, 2012, the Fund incurred no adviser fee on Investable Assets. To the extent the Fund’s assets are invested in the Portfolio, the Fund is allocated its share of the Portfolio’s adviser fee. The Portfolio has engaged Boston Management and Research (BMR), a subsidiary of EVM, to render investment advisory services. See Note 2 of the Portfolio’s Notes to Consolidated Financial Statements which are included elsewhere in this report. EVM also serves as the administrator of the Fund, but receives no compensation.
EVM serves as the sub-transfer agent of the Fund and receives from the transfer agent an aggregate fee based upon the actual expenses incurred by EVM in the performance of these services. For the year ended October 31, 2012, EVM earned $328,983 in sub-transfer agent fees. The Fund was informed that Eaton Vance Distributors, Inc. (EVD), an affiliate of EVM and the Fund’s principal underwriter, received $221,104 as its portion of the sales charge on sales of Class A shares for the year ended October 31, 2012. EVD also received distribution and service fees from Class A, Class C and Class R shares (see Note 4) and contingent deferred sales charges (see Note 5).
Trustees and officers of the Fund who are members of EVM’s or BMR's organizations receive remuneration for their services to the Fund out of the investment adviser fee. Certain officers and Trustees of the Fund and the Portfolio are officers of the above organizations.
Eaton Vance
Global Macro Absolute Return Fund
October 31, 2012
Notes to Financial Statements — continued
4 Distribution Plans
The Fund has in effect a distribution plan for Class A shares (Class A Plan) pursuant to Rule 12b-1 under the 1940 Act. Pursuant to the Class A Plan, the Fund pays EVD a distribution and service fee of 0.30% per annum of its average daily net assets attributable to Class A shares for distribution services and facilities provided to the Fund by EVD, as well as for personal services and/or the maintenance of shareholder accounts. Distribution and service fees paid or accrued to EVD for the year ended October 31, 2012 amounted to $4,984,392 for Class A shares.
The Fund also has in effect distribution plans for Class C shares (Class C Plan) and Class R shares (Class R Plan) pursuant to Rule 12b-1 under the 1940 Act. Pursuant to the Class C Plan, the Fund pays EVD amounts equal to 0.75% per annum of its average daily net assets attributable to Class C shares for providing ongoing distribution services and facilities to the Fund. For the year ended October 31, 2012, the Fund paid or accrued to EVD $6,944,515 for Class C shares. The Class R Plan requires the Fund to pay EVD an amount up to 0.50% per annum of its average daily net assets attributable to Class R shares for providing ongoing distribution services and facilities to the Fund. The Trustees of the Trust have currently limited Class R distribution payments to 0.25% per annum of the average daily net assets attributable to Class R shares. For the year ended October 31, 2012, the Fund paid or accrued to EVD $1,826 for Class R shares.
Pursuant to the Class C and Class R Plans, the Fund also makes payments of service fees to EVD, financial intermediaries and other persons in amounts equal to 0.25% per annum of its average daily net assets attributable to that class. Service fees paid or accrued are for personal services and/or the maintenance of shareholder accounts. They are separate and distinct from the sales commissions and distribution fees payable to EVD. Service fees paid or accrued for the year ended October 31, 2012 amounted to $2,314,840 and $1,826 for Class C and Class R shares, respectively.
5 Contingent Deferred Sales Charges
A contingent deferred sales charge (CDSC) of 1% generally is imposed on redemptions of Class C shares made within one year of purchase. Class A shares may be subject to a 1% CDSC if redeemed within 18 months of purchase (depending on the circumstances of purchase). Generally, the CDSC is based upon the lower of the net asset value at date of redemption or date of purchase. No charge is levied on shares acquired by reinvestment of dividends or capital gain distributions. No CDSC is levied on shares which have been sold to EVM or its affiliates or to their respective employees or clients and may be waived under certain other limited conditions. For the year ended October 31, 2012, the Fund was informed that EVD received approximately $37,000 and $66,000 of CDSCs paid by Class A and Class C shareholders, respectively.
6 Investment Transactions
For the year ended October 31, 2012, increases and decreases in the Fund's investment in the Portfolio aggregated $565,971,128 and $797,272,458, respectively.
7 Shares of Beneficial Interest
The Fund’s Declaration of Trust permits the Trustees to issue an unlimited number of full and fractional shares of beneficial interest (without par value). Such shares may be issued in a number of different series (such as the Fund) and classes. Transactions in Fund shares were as follows:
| | | | | | | | |
| | | Year Ended October 31, | |
| Class A | | 2012 | | | 2011 | |
| | |
Sales | | | 66,988,087 | | | | 54,934,025 | |
Issued to shareholders electing to receive payments of distributions in Fund shares | | | 5,625,231 | | | | 7,417,025 | |
Redemptions | | | (94,734,113 | ) | | | (124,213,440 | ) |
| | |
Net decrease | | | (22,120,795 | ) | | | (61,862,390 | ) |
| | |
| | | | | | | | |
| | | Year Ended October 31, | |
| Class C | | 2012 | | | 2011 | |
| | |
Sales | | | 14,588,293 | | | | 8,910,114 | |
Issued to shareholders electing to receive payments of distributions in Fund shares | | | 2,045,891 | | | | 2,798,435 | |
Redemptions | | | (39,116,700 | ) | | | (37,383,758 | ) |
| | |
Net decrease | | | (22,482,516 | ) | | | (25,675,209 | ) |
Eaton Vance
Global Macro Absolute Return Fund
October 31, 2012
Notes to Financial Statements — continued
| | | | | | | | |
| | | Year Ended October 31, | |
| Class I | | 2012 | | | 2011 | |
| | |
Sales | | | 208,025,038 | | | | 209,885,377 | |
Issued to shareholders electing to receive payments of distributions in Fund shares | | | 7,547,481 | | | | 7,284,871 | |
Redemptions | | | (168,051,394 | ) | | | (202,075,858 | ) |
| | |
Net increase | | | 47,521,125 | | | | 15,094,390 | |
| | |
| | | | | | | | |
| | | Year Ended October 31, | |
| Class R | | 2012 | | | 2011 | |
| | |
Sales | | | 19,755 | | | | 15,924 | |
Issued to shareholders electing to receive payments of distributions in Fund shares | | | 2,513 | | | | 3,405 | |
Redemptions | | | (16,008 | ) | | | (54,533 | ) |
| | |
Net increase (decrease) | | | 6,260 | | | | (35,204 | ) |
Eaton Vance
Global Macro Absolute Return Fund
October 31, 2012
Report of Independent Registered Public Accounting Firm
To the Trustees of Eaton Vance Mutual Funds Trust and Shareholders of Eaton Vance Global Macro Absolute Return Fund:
We have audited the accompanying statement of assets and liabilities of Eaton Vance Global Macro Absolute Return Fund (the “Fund”) (one of the funds constituting Eaton Vance Mutual Funds Trust) as of October 31, 2012, and the related statement of operations for the year then ended, the statements of changes in net assets for each of the two years in the period then ended, and the financial highlights for each of the five years in the period then ended. These financial statements and financial highlights are the responsibility of the Fund’s management. Our responsibility is to express an opinion on these financial statements and financial highlights based on our audits.
We conducted our audits in accordance with the standards of the Public Company Accounting Oversight Board (United States).Those standards require that we plan and perform the audit to obtain reasonable assurance about whether the financial statements and financial highlights are free of material misstatement. The Fund is not required to have, nor were we engaged to perform, an audit of its internal control over financial reporting. Our audits included consideration of internal control over financial reporting as a basis for designing audit procedures that are appropriate in the circumstances, but not for the purpose of expressing an opinion on the effectiveness of the Fund’s internal control over financial reporting. Accordingly, we express no such opinion. An audit also includes examining, on a test basis, evidence supporting the amounts and disclosures in the financial statements, assessing the accounting principles used and significant estimates made by management, as well as evaluating the overall financial statement presentation. We believe that our audits provide a reasonable basis for our opinion.
In our opinion, such financial statements and financial highlights referred to above present fairly, in all material respects, the financial position of Eaton Vance Global Macro Absolute Return Fund as of October 31, 2012, the results of its operations for the year then ended, the changes in its net assets for each of the two years in the period then ended, and the financial highlights for each of the five years in the period then ended, in conformity with accounting principles generally accepted in the United States of America.
DELOITTE & TOUCHE LLP
Boston, Massachusetts
December 21, 2012
Eaton Vance
Global Macro Absolute Return Fund
October 31, 2012
Federal Tax Information (Unaudited)
The Form 1099-DIV you receive in January 2013 will show the tax status of all distributions paid to your account in calendar year 2012. Shareholders are advised to consult their own tax adviser with respect to the tax consequences of their investment in the Fund. As required by the Internal Revenue Code and/or regulations, shareholders must be notified regarding the status of the foreign tax credit and capital gains dividends.
Foreign Tax Credit. The Fund paid foreign taxes of $1,099,867 and recognized foreign source income of $273,513,709.
Capital Gains Dividends. The Fund hereby designates as a capital gain dividend with respect to the taxable year ended October 31, 2012, $151,249,765 or, if subsequently determined to be different, the net capital gain of such year.
Global Macro Portfolio
October 31, 2012
Consolidated Portfolio of Investments
| | | | | | | | | | |
| Foreign Government Bonds — 32.9% | |
| | | |
| | | | | | | | | | |
| Security | | Principal
Amount | | | Value | |
| | | | | | | | | | |
| | | |
Albania — 0.4% | | | | | | | | | | |
Republic of Albania, 7.50%, 11/4/15 | | EUR | | | 24,274,000 | | | $ | 32,115,582 | |
| | | | | | | | | | | |
Total Albania | | | | | | | | $ | 32,115,582 | |
| | | | | | | | | | | |
| | | |
Bermuda — 0.3% | | | | | | | | | | |
Government of Bermuda, 5.603%, 7/20/20(1) | | USD | | | 16,113,000 | | | $ | 19,043,777 | |
| | | | | | | | | | | |
Total Bermuda | | | | | | | | $ | 19,043,777 | |
| | | | | | | | | | | |
| | | |
Brazil — 3.8% | | | | | | | | | | |
Nota do Tesouro Nacional, 6.00%, 5/15/15(2) | | BRL | | | 506,893,992 | | | $ | 272,977,615 | |
| | | | | | | | | | | |
Total Brazil | | | | | | | | $ | 272,977,615 | |
| | | | | | | | | | | |
| | | |
Costa Rica — 0.0%(3) | | | | | | | | | | |
Titulo Propiedad Ud, 1.00%, 1/12/22(2) | | CRC | | | 1,430,564,178 | | | $ | 2,213,733 | |
Titulo Propiedad Ud, 1.63%, 7/13/16(2) | | CRC | | | 159,480,143 | | | | 301,918 | |
| | | | | | | | | | | |
Total Costa Rica | | | | | | | | $ | 2,515,651 | |
| | | | | | | | | | | |
| | | |
Cyprus — 0.7% | | | | | | | | | | |
Republic of Cyprus, 3.75%, 6/3/13 | | EUR | | | 24,090,000 | | | $ | 28,882,421 | |
Republic of Cyprus, 3.75%, 11/1/15 | | EUR | | | 5,360,000 | | | | 5,249,426 | |
Republic of Cyprus, 4.375%, 7/15/14 | | EUR | | | 1,700,000 | | | | 1,854,207 | |
Republic of Cyprus, 4.625%, 2/3/20 | | EUR | | | 13,850,000 | | | | 11,875,029 | |
| | | | | | | | | | | |
Total Cyprus | | | | | | | | $ | 47,861,083 | |
| | | | | | | | | | | |
| | | |
Dominican Republic — 0.0%(3) | | | | | | | | | | |
Dominican Republic "Bonos Internos" Total Return Linked Bond (Citibank NA), 13.00%, 2/25/13(4) | | DOP | | | 118,000,000 | | | $ | 3,024,763 | |
| | | | | | | | | | | |
Total Dominican Republic | | | | | | | | $ | 3,024,763 | |
| | | | | | | | | | | |
| | | |
Georgia — 0.9% | | | | | | | | | | |
Georgia Treasury Bond, 6.80%, 7/12/14 | | GEL | | | 12,000,000 | | | $ | 7,212,698 | |
Georgia Treasury Bond, 7.40%, 4/19/14 | | GEL | | | 19,393,000 | | | | 11,757,931 | |
Georgia Treasury Bond, 8.50%, 7/26/17 | | GEL | | | 5,577,000 | | | | 3,438,620 | |
Georgia Treasury Bond, 8.90%, 1/12/14 | | GEL | | | 14,630,000 | | | | 9,006,330 | |
Georgia Treasury Bond, 9.50%, 11/17/13 | | GEL | | | 1,000,000 | | | | 617,645 | |
Georgia Treasury Bond, 9.80%, 4/26/17 | | GEL | | | 1,600,000 | | | | 1,032,352 | |
Georgia Treasury Bond, 11.30%, 1/26/17 | | GEL | | | 6,000,000 | | | | 4,049,959 | |
Georgia Treasury Bond, 12.00%, 6/15/13 | | GEL | | | 1,000,000 | | | | 622,016 | |
Georgia Treasury Bond, 12.00%, 6/15/14 | | GEL | | | 778,000 | | | | 504,777 | |
Georgia Treasury Bond, 12.00%, 12/15/14 | | GEL | | | 1,500,000 | | | | 989,256 | |
Georgia Treasury Bond, 12.00%, 9/15/15 | | GEL | | | 4,000,000 | | | | 2,708,125 | |
Georgia Treasury Bond, 12.20%, 5/13/13 | | GEL | | | 6,895,000 | | | | 4,275,041 | |
| | | | | | | | | | |
| Security | | Principal
Amount | | | Value | |
| | | | | | | | | | |
|
Georgia (continued) | |
Georgia Treasury Bond, 12.50%, 4/14/13 | | GEL | | | 7,196,000 | | | $ | 4,452,600 | |
Georgia Treasury Bond, 12.80%, 2/10/13 | | GEL | | | 10,400,000 | | | | 6,374,284 | |
Georgia Treasury Bond, 13.00%, 3/15/14 | | GEL | | | 2,500,000 | | | | 1,624,077 | |
Georgia Treasury Bond, 13.80%, 12/16/12 | | GEL | | | 5,788,000 | | | | 3,520,872 | |
| | | | | | | | | | | |
Total Georgia | | | $ | 62,186,583 | |
| | | | | | | | | | | |
| | | |
Germany — 2.0% | | | | | | | | | | |
Bundesrepublik Deutschland, 3.50%, 7/4/19 | | EUR | | | 15,000,000 | | | $ | 22,762,956 | |
Bundesrepublik Deutschland, 4.75%, 7/4/34 | | EUR | | | 66,600,000 | | | | 123,890,523 | |
| | | | | | | | | | | |
Total Germany | | | $ | 146,653,479 | |
| | | | | | | | | | | |
| | | |
Hungary — 1.9% | | | | | | | | | | |
National Bank of Hungary, 8.875%, 11/1/13 | | USD | | | 14,320,000 | | | $ | 14,703,678 | |
Republic of Hungary, 3.50%, 7/18/16 | | EUR | | | 39,283,000 | | | | 49,057,161 | |
Republic of Hungary, 4.375%, 7/4/17 | | EUR | | | 33,420,000 | | | | 42,351,770 | |
Republic of Hungary, 4.50%, 1/29/14 | | EUR | | | 19,886,000 | | | | 26,109,790 | |
Republic of Hungary, 5.50%, 5/6/14 | | GBP | | | 2,983,000 | | | | 4,886,021 | |
| | | | | | | | | | | |
Total Hungary | | | $ | 137,108,420 | |
| | | | | | | | | | | |
| | | |
Mexico — 3.2% | | | | | | | | | | |
Mexican Bonos, 7.00%, 6/19/14 | | MXN | | | 1,253,707,000 | | | $ | 99,312,093 | |
Mexican Bonos, 8.00%, 12/19/13 | | MXN | | | 797,010,000 | | | | 63,086,561 | |
Mexican Bonos, 9.00%, 6/20/13 | | MXN | | | 918,355,000 | | | | 72,049,067 | |
| | | | | | | | | | | |
Total Mexico | | | $ | 234,447,721 | |
| | | | | | | | | | | |
| | | |
New Zealand — 5.8% | | | | | | | | | | |
New Zealand Government Bond, 5.00%, 3/15/19 | | NZD | | | 33,390,000 | | | $ | 30,597,900 | |
New Zealand Government Bond, 5.50%, 4/15/23 | | NZD | | | 177,883,000 | | | | 171,863,125 | |
New Zealand Government Bond, 6.00%, 12/15/17 | | NZD | | | 33,390,000 | | | | 31,618,449 | |
New Zealand Government Bond, 6.00%, 5/15/21 | | NZD | | | 183,930,000 | | | | 181,505,540 | |
| | | | | | | | | | | |
Total New Zealand | | | $ | 415,585,014 | |
| | | | | | | | | | | |
| | | |
Nigeria — 0.1% | | | | | | | | | | |
Nigeria Treasury Bond, 16.39%, 1/27/22 | | NGN | | | 1,392,230,000 | | | $ | 10,308,761 | |
| | | | | | | | | | | |
Total Nigeria | | | $ | 10,308,761 | |
| | | | | | | | | | | |
| | | |
Philippines — 1.4% | | | | | | | | | | |
Republic of the Philippines, 6.25%, 1/14/36 | | PHP | | | 3,078,000,000 | | | $ | 87,839,448 | |
Republic of the Philippines, 8.75%, 3/3/13 | | PHP | | | 456,650,000 | | | | 11,389,269 | |
| | | | | | | | | | | |
Total Philippines | | | $ | 99,228,717 | |
| | | | | | | | | | | |
| | | | |
| | 20 | | See Notes to Consolidated Financial Statements. |
Global Macro Portfolio
October 31, 2012
Consolidated Portfolio of Investments — continued
| | | | | | | | | | |
| Security | | Principal
Amount | | | Value | |
| | | | | | | | | | |
|
Poland — 0.2% | |
Republic of Poland, 3.00%, 3/17/23 | | USD | | | 10,886,000 | | | $ | 10,799,750 | |
| | | | | | | | | | | |
Total Poland | | | $ | 10,799,750 | |
| | | | | | | | | | | |
| | | |
Serbia — 3.4% | | | | | | | | | | |
Serbia Treasury Bill, 0.00%, 11/22/12 | | RSD | | | 5,500,190,000 | | | $ | 62,293,709 | |
Serbia Treasury Bill, 0.00%, 1/24/13 | | RSD | | | 235,430,000 | | | | 2,607,589 | |
Serbia Treasury Bill, 0.00%, 4/4/13 | | RSD | | | 1,297,380,000 | | | | 14,013,628 | |
Serbia Treasury Bill, 0.00%, 4/25/13 | | RSD | | | 2,814,850,000 | | | | 30,234,200 | |
Serbia Treasury Bill, 0.00%, 7/4/13 | | RSD | | | 358,540,000 | | | | 3,751,971 | |
Serbia Treasury Bill, 0.00%, 10/24/13 | | RSD | | | 4,365,640,000 | | | | 43,871,647 | |
Serbia Treasury Bill, 0.00%, 11/8/13 | | RSD | | | 420,000,000 | | | | 4,194,998 | |
Serbia Treasury Bill, 0.00%, 12/12/13 | | RSD | | | 784,600,000 | | | | 7,716,086 | |
Serbia Treasury Bill, 0.00%, 1/30/14 | | RSD | | | 791,300,000 | | | | 7,604,488 | |
Serbia Treasury Bill, 0.00%, 3/6/14 | | RSD | | | 4,181,000,000 | | | | 39,513,099 | |
Serbia Treasury Bill, 0.00%, 3/13/14 | | RSD | | | 765,280,000 | | | | 7,186,107 | |
Serbia Treasury Bond, 10.00%, 4/27/15 | | RSD | | | 996,190,000 | | | | 10,046,146 | |
Serbia Treasury Bond, 10.00%, 9/14/15 | | RSD | | | 1,412,950,000 | | | | 13,976,609 | |
| | | | | | | | | | | |
Total Serbia | | | $ | 247,010,277 | |
| | | | | | | | | | | |
| | | |
Slovenia — 0.5% | | | | | | | | | | |
Republic of Slovenia, 4.125%, 1/26/20 | | EUR | | | 300,000 | | | $ | 361,237 | |
Republic of Slovenia, 4.375%, 1/18/21(5) | | EUR | | | 2,550,000 | | | | 3,060,598 | |
Republic of Slovenia, 5.50%, 10/26/22(1) | | USD | | | 32,882,000 | | | | 33,007,491 | |
| | | | | | | | | | | |
Total Slovenia | | | $ | 36,429,326 | |
| | | | | | | | | | | |
| | | |
Sri Lanka — 1.0% | | | | | | | | | | |
Republic of Sri Lanka, 6.25%, 10/4/20(1) | | USD | | | 36,130,000 | | | $ | 40,646,250 | |
Republic of Sri Lanka, 6.25%, 10/4/20(5) | | USD | | | 1,010,000 | | | | 1,136,250 | |
Sri Lanka Government Bond, 8.50%, 1/15/13 | | LKR | | | 3,173,380,000 | | | | 24,224,745 | |
Sri Lanka Government Bond, 10.50%, 4/1/13 | | LKR | | | 702,670,000 | | | | 5,363,786 | |
| | | | | | | | | | | |
Total Sri Lanka | | | $ | 71,371,031 | |
| | | | | | | | | | | |
| | | |
Turkey — 5.6% | | | | | | | | | | |
Turkey Government Bond, 0.00%, 11/7/12 | | TRY | | | 332,032,400 | | | $ | 185,124,965 | |
Turkey Government Bond, 0.00%, 2/20/13 | | TRY | | | 136,610,000 | | | | 74,905,721 | |
Turkey Government Bond, 3.00%, 1/6/21(2) | | TRY | | | 42,135,120 | | | | 25,751,199 | |
Turkey Government Bond, 4.00%, 4/1/20(2) | | TRY | | | 187,966,192 | | | | 121,063,860 | |
| | | | | | | | | | | |
Total Turkey | | | $ | 406,845,745 | |
| | | | | | | | | | | |
| | | |
Uruguay — 0.7% | | | | | | | | | | |
Monetary Regulation Bill, 0.00%, 1/11/13 | | UYU | | | 94,370,000 | | | $ | 4,689,931 | |
Monetary Regulation Bill, 0.00%, 8/15/13 | | UYU | | | 181,000,000 | | | | 8,496,818 | |
Monetary Regulation Bill, 0.00%, 9/9/13 | | UYU | | | 174,900,000 | | | | 8,159,258 | |
| | | | | | | | | | |
| Security | | Principal
Amount | | | Value | |
| | | | | | | | | | |
|
Uruguay (continued) | |
Monetary Regulation Bill, 0.00%, 2/27/14(2) | | UYU | | | 27,474,442 | | | $ | 1,357,884 | |
Republic of Uruguay, 4.375%, 12/15/28(2) | | UYU | | | 236,640,615 | | | | 14,270,328 | |
Uruguay Notas Del Teso, 10.25%, 8/22/15 | | UYU | | | 228,360,000 | | | | 11,764,876 | |
| | | | | | | | | | | |
Total Uruguay | | | | | | | | $ | 48,739,095 | |
| | | | | | | | | | | |
| | | |
Venezuela — 1.0% | | | | | | | | | | |
Bolivarian Republic of Venezuela, 7.00%, 3/31/38(5) | | USD | | | 24,459,000 | | | $ | 17,610,480 | |
Bolivarian Republic of Venezuela, 9.25%, 5/7/28(5) | | USD | | | 43,665,000 | | | | 38,752,687 | |
Bolivarian Republic of Venezuela, 11.75%, 10/21/26(5) | | USD | | | 13,997,000 | | | | 14,241,948 | |
| | | | | | | | | | | |
Total Venezuela | | | | | | | | $ | 70,605,115 | |
| | | | | | | | | | | |
| | | |
Total Foreign Government Bonds
(identified cost $2,317,555,054) | | | | | | | | $ | 2,374,857,505 | |
| | | | | | | | | | | |
| |
| Foreign Corporate Bonds & Notes — 0.1% | | | | | |
| | | |
| | | | | | | | | | |
| Security | | | | Principal
Amount | | | Value | |
| | | |
Chile — 0.1% | | | | | | | | | | |
JPMorgan Chilean Inflation Linked Note, 3.80%, 11/17/15(2) | | USD | | | 3,802,602 | | | $ | 3,876,433 | |
| | | | | | | | | | | |
| | | |
Total Chile
(identified cost $3,000,000) | | | | | | | | $ | 3,876,433 | |
| | | | | | | | | | | |
| | | |
Total Foreign Corporate Bonds & Notes
(identified cost $3,000,000) | | | | | | | | $ | 3,876,433 | |
| | | | | | | | | | | |
| |
| Debt Obligations – United States — 27.2% | | | | | |
| |
| Corporate Bonds & Notes — 0.0%(3) | | | | | |
| | | |
| | | | | | | | | | |
| Security | | | | Principal
Amount | | | Value | |
Eaton Corp., 8.875%, 6/15/19 | | | | $ | 500,000 | | | $ | 674,836 | |
| | | | | | | | | | | |
| | | |
Total Corporate Bonds & Notes
(identified cost $524,584) | | | | | | | | $ | 674,836 | |
| | | | | | | | | | | |
| |
| Collateralized Mortgage Obligations — 1.5% | | | | | |
| Security | | | | Principal
Amount | | | Value | |
Federal Home Loan Mortgage Corp.: | | | | | | | | | | |
Series 4, Class D, 8.00%, 12/25/22 | | | | $ | 253,084 | | | $ | 294,154 | |
Series 1548, Class Z, 7.00%, 7/15/23 | | | | | 281,042 | | | | 319,808 | |
| | | | |
| | 21 | | See Notes to Consolidated Financial Statements. |
Global Macro Portfolio
October 31, 2012
Consolidated Portfolio of Investments — continued
| | | | | | | | | | |
| Security | | | | Principal
Amount | | | Value | |
| | | | | | | | | | |
Federal Home Loan Mortgage Corp.: (continued) | |
Series 1650, Class K, 6.50%, 1/15/24 | | | | $ | 1,754,758 | | | $ | 1,911,554 | |
Series 1817, Class Z, 6.50%, 2/15/26 | | | | | 231,915 | | | | 250,864 | |
Series 1927, Class ZA, 6.50%, 1/15/27 | | | | | 882,526 | | | | 957,657 | |
Series 2127, Class PG, 6.25%, 2/15/29 | | | | | 1,150,432 | | | | 1,219,749 | |
Series 2344, Class ZD, 6.50%, 8/15/31 | | | | | 1,762,994 | | | | 1,959,236 | |
Series 2458, Class ZB, 7.00%, 6/15/32 | | | | | 2,770,969 | | | | 3,192,384 | |
| | | | | | | | | | | |
| | | | | | | | $ | 10,105,406 | |
| | | | | | | | | | | |
Federal National Mortgage Association: | | | | | | | | | | |
Series 1992-180, Class F, 1.369%, 10/25/22(6) | | | | $ | 1,012,804 | | | $ | 1,032,080 | |
Series 1993-16, Class Z, 7.50%, 2/25/23 | | | | | 994,695 | | | | 1,153,533 | |
Series 1993-79, Class PL, 7.00%, 6/25/23 | | | | | 701,619 | | | | 806,508 | |
Series 1993-104, Class ZB, 6.50%, 7/25/23 | | | | | 270,190 | | | | 309,567 | |
Series 1993-121, Class Z, 7.00%, 7/25/23 | | | | | 4,040,479 | | | | 4,686,830 | |
Series 1993-141, Class Z, 7.00%, 8/25/23 | | | | | 772,637 | | | | 896,655 | |
Series 1994-42, Class ZQ, 7.00%, 4/25/24 | | | | | 4,702,066 | | | | 5,454,251 | |
Series 1994-79, Class Z, 7.00%, 4/25/24 | | | | | 876,832 | | | | 1,023,789 | |
Series 1994-89, Class ZQ, 8.00%, 7/25/24 | | | | | 676,400 | | | | 803,302 | |
Series 1996-35, Class Z, 7.00%, 7/25/26 | | | | | 219,943 | | | | 256,162 | |
Series 1998-16, Class H, 7.00%, 4/18/28 | | | | | 652,187 | | | | 764,695 | |
Series 1998-44, Class ZA, 6.50%, 7/20/28 | | | | | 1,143,484 | | | | 1,328,894 | |
Series 1999-25, Class Z, 6.00%, 6/25/29 | | | | | 1,564,759 | | | | 1,753,479 | |
Series 2000-2, Class ZE, 7.50%, 2/25/30 | | | | | 302,325 | | | | 359,057 | |
Series 2000-49, Class A, 8.00%, 3/18/27 | | | | | 826,429 | | | | 990,584 | |
Series 2001-31, Class ZA, 6.00%, 7/25/31 | | | | | 10,448,254 | | | | 11,715,243 | |
Series 2001-37, Class GA, 8.00%, 7/25/16 | | | | | 64,981 | | | | 69,534 | |
Series 2001-74, Class QE, 6.00%, 12/25/31 | | | | | 3,659,360 | | | | 4,100,602 | |
Series 2009-48, Class WA, 5.86%, 7/25/39(7) | | | | | 11,269,571 | | | | 12,780,039 | |
Series 2011-38, Class SA, 12.868%, 5/25/41(8) | | | | | 15,761,005 | | | | 17,746,385 | |
Series G48, Class Z, 7.10%, 12/25/21 | | | | | 856,800 | | | | 969,515 | |
Series G92-60, Class Z, 7.00%, 10/25/22 | | | | | 1,931,258 | | | | 2,164,083 | |
Series G93-1, Class K, 6.675%, 1/25/23 | | | | | 1,235,975 | | | | 1,406,887 | |
Series G93-31, Class PN, 7.00%, 9/25/23 | | | | | 3,777,336 | | | | 4,349,728 | |
Series G93-41, Class ZQ, 7.00%, 12/25/23 | | | | | 7,765,405 | | | | 8,949,777 | |
Series G94-7, Class PJ, 7.50%, 5/17/24 | | | | | 1,216,894 | | | | 1,430,084 | |
| | | | | | | | | | | |
| | | | | | | | $ | 87,301,263 | |
| | | | | | | | | | | |
Government National Mortgage Association: | | | | | | | | | | |
Series 1994-7, Class PQ, 6.50%, 10/16/24 | | | | $ | 866,992 | | | $ | 984,274 | |
Series 1996-22, Class Z, 7.00%, 10/16/26 | | | | | 693,459 | | | | 792,393 | |
Series 1999-42, Class Z, 8.00%, 11/16/29 | | | | | 1,941,967 | | | | 2,244,875 | |
Series 2000-21, Class Z, 9.00%, 3/16/30 | | | | | 2,796,966 | | | | 3,490,262 | |
| | | | | | | | | | |
| Security | | | | Principal
Amount | | | Value | |
| | | | | | | | | | |
Government National Mortgage Association: (continued) | |
Series 2001-35, Class K, 6.45%, 10/26/23 | | | | $ | 280,422 | | | $ | 317,133 | |
Series 2002-48, Class OC, 6.00%, 9/16/30 | | | | | 667,881 | | | | 674,098 | |
| | | | | | | | | | | |
| | | | | | | | $ | 8,503,035 | |
| | | | | | | | | | | |
| | | |
Total Collateralized Mortgage Obligations
(identified cost $98,486,674) | | | | | | | | $ | 105,909,704 | |
| | | | | | | | | | | |
|
| Commercial Mortgage-Backed Securities — 0.4% | |
| | | |
| | | | | | | | | | |
| Security | | | | Principal
Amount | | | Value | |
JPMCC, Series 2005-LDP5, Class AM, 5.242%, 12/15/44(7) | | | | $ | 9,960,000 | | | $ | 11,059,773 | |
MLMT, Series 2006-C2, Class A2, 5.756%, 8/12/43(7) | | | | | 3,745,488 | | | | 3,906,439 | |
WBCMT, Series 2004-C12, Class MAD, 5.262%, 7/15/41(1)(7) | | | | | 9,465,875 | | | | 9,926,385 | |
WBCMT, Series 2005-C17, Class A4, 5.083%, 3/15/42(7) | | | | | 6,000,000 | | | | 6,540,591 | |
| | | | | | | | | | | |
| | | |
Total Commercial Mortgage-Backed Securities
(identified cost $29,387,052) | | | | | | | | $ | 31,433,188 | |
| | | | | | | | | | | |
| | | |
| Mortgage Pass-Throughs — 20.5% | | | | | | | | | | |
| | | |
| | | | | | | | | | |
| Security | | | | Principal
Amount | | | Value | |
Federal Home Loan Mortgage Corp.: | | | | | | | | | | |
2.90%, with maturity at 2035(9) | | | | $ | 5,784,156 | | | $ | 6,160,768 | |
3.274%, with maturity at 2029(9) | | | | | 1,075,512 | | | | 1,103,702 | |
3.504%, with maturity at 2023(9) | | | | | 281,951 | | | | 297,909 | |
4.315%, with maturity at 2030(9) | | | | | 1,510,219 | | | | 1,648,462 | |
4.50%, with maturity at 2018 | | | | | 2,899,921 | | | | 3,102,654 | |
5.00%, with various maturities to 2019 | | | | | 3,465,327 | | | | 3,737,165 | |
5.50%, with various maturities to 2019 | | | | | 10,239,455 | | | | 10,972,408 | |
6.00%, with various maturities to 2035(10) | | | | | 60,842,167 | | | | 68,762,931 | |
6.50%, with various maturities to 2033 | | | | | 52,083,158 | | | | 60,987,891 | |
6.60%, with maturity at 2030 | | | | | 2,559,187 | | | | 3,121,041 | |
7.00%, with various maturities to 2036 | | | | | 50,590,437 | | | | 60,055,906 | |
7.31%, with maturity at 2026 | | | | | 247,033 | | | | 301,173 | |
7.50%, with various maturities to 2035 | | | | | 27,602,774 | | | | 33,221,231 | |
7.95%, with maturity at 2022 | | | | | 406,384 | | | | 485,307 | |
8.00%, with various maturities to 2031 | | | | | 7,402,289 | | | | 9,242,407 | |
8.15%, with maturity at 2021 | | | | | 198,691 | | | | 235,058 | |
8.30%, with maturity at 2021 | | | | | 62,225 | | | | 72,165 | |
8.47%, with maturity at 2018 | | | | | 102,196 | | | | 112,295 | |
8.50%, with various maturities to 2028 | | | | | 1,012,897 | | | | 1,240,085 | |
9.00%, with various maturities to 2027 | | | | | 1,838,139 | | | | 2,198,700 | |
| | | | |
| | 22 | | See Notes to Consolidated Financial Statements. |
Global Macro Portfolio
October 31, 2012
Consolidated Portfolio of Investments — continued
| | | | | | | | | | |
| Security | | | | Principal
Amount | | | Value | |
| | | | | | | | | | |
Federal Home Loan Mortgage Corp.: (continued) | |
9.50%, with maturity at 2027 | | | | $ | 233,365 | | | $ | 288,969 | |
9.75%, with maturity at 2016 | | | | | 3,580 | | | | 4,045 | |
10.00%, with various maturities to 2020 | | | | | 554,550 | | | | 635,689 | |
10.50%, with maturity at 2021 | | | | | 336,193 | | | | 392,718 | |
11.00%, with maturity at 2016 | | | | | 365,706 | | | | 397,406 | |
| | | | | | | | | | | |
| | | | | | | | $ | 268,778,085 | |
| | | | | | | | | | | |
Federal National Mortgage Association: | | | | | | | | | | |
2.275%, with maturity at 2028(9) | | | | $ | 248,687 | | | $ | 262,645 | |
2.323%, with maturity at 2022(9) | | | | | 1,915,618 | | | | 1,978,809 | |
2.329%, with maturity at 2027(9) | | | | | 387,884 | | | | 402,395 | |
2.344%, with various maturities to 2038(9) | | | | | 27,020,716 | | | | 28,395,455 | |
2.366%, with various maturities to 2033(9) | | | | | 20,376,153 | | | | 21,267,775 | |
2.405%, with maturity at 2035(9) | | | | | 5,251,869 | | | | 5,478,992 | |
2.494%, with maturity at 2025(9) | | | | | 1,346,713 | | | | 1,407,548 | |
2.694%, with maturity at 2024(9) | | | | | 944,607 | | | | 992,059 | |
3.357%, with maturity at 2023(9) | | | | | 133,028 | | | | 139,267 | |
3.664%, with maturity at 2034(9) | | | | | 3,642,611 | | | | 3,976,048 | |
3.798%, with maturity at 2035(9) | | | | | 11,997,238 | | | | 13,095,442 | |
4.154%, with maturity at 2035(9) | | | | | 9,948,587 | | | | 10,859,261 | |
5.00%, with various maturities to 2018 | | | | | 4,083,611 | | | | 4,429,632 | |
5.50%, with various maturities to 2023(10) | | | | | 17,191,997 | | | | 18,563,039 | |
6.00%, with various maturities to 2038(10) | | | | | 419,471,384 | | | | 468,673,230 | |
6.325%, with maturity at 2032(9) | | | | | 3,739,383 | | | | 4,081,678 | |
6.50%, with various maturities to 2036 | | | | | 165,125,005 | | | | 188,395,113 | |
7.00%, with various maturities to 2036 | | | | | 125,096,408 | | | | 148,836,946 | |
7.007%, with maturity at 2025(9) | | | | | 143,101 | | | | 153,923 | |
7.50%, with various maturities to 2037 | | | | | 87,694,415 | | | | 106,609,967 | |
8.00%, with various maturities to 2030 | | | | | 6,474,657 | | | | 7,886,140 | |
8.50%, with various maturities to 2037 | | | | | 10,504,244 | | | | 13,527,892 | |
9.00%, with various maturities to 2032 | | | | | 3,246,445 | | | | 3,942,510 | |
9.089%, with maturity at 2028(7) | | | | | 448,707 | | | | 508,149 | |
9.50%, with various maturities to 2031 | | | | | 2,748,190 | | | | 3,404,695 | |
10.50%, with maturity at 2029 | | | | | 303,525 | | | | 362,327 | |
10.631%, with maturity at 2027(7) | | | | | 444,466 | | | | 512,579 | |
11.00%, with maturity at 2016 | | | | | 10,615 | | | | 11,145 | |
11.50%, with maturity at 2031 | | | | | 414,031 | | | | 500,068 | |
| | | | | | | | | | | |
| | | | | | | | $ | 1,058,654,729 | |
| | | | | | | | | | | |
Government National Mortgage Association: | | | | | | | | | | |
2.00%, with maturity at 2024(9) | | | | $ | 572,023 | | | $ | 600,742 | |
6.00%, with various maturities to 2033 | | | | | 52,647,674 | | | | 61,068,623 | |
6.50%, with various maturities to 2032 | | | | | 5,620,126 | | | | 6,597,292 | |
7.00%, with various maturities to 2035 | | | | | 44,124,565 | | | | 53,364,219 | |
7.50%, with various maturities to 2031 | | | | | 7,097,693 | | | | 8,414,992 | |
7.75%, with maturity at 2019 | | | | | 31,469 | | | | 36,924 | |
8.00%, with various maturities to 2034 | | | | | 17,387,515 | | | | 20,954,969 | |
| | | | | | | | | | |
| Security | | | | Principal
Amount | | | Value | |
| | | | | | | | | | |
Government National Mortgage Association: (continued) | |
8.30%, with various maturities to 2020 | | | | $ | 95,426 | | | $ | 106,814 | |
8.50%, with various maturities to 2021 | | | | | 912,198 | | | | 1,021,275 | |
9.00%, with various maturities to 2025 | | | | | 370,437 | | | | 441,877 | |
9.50%, with various maturities to 2026 | | | | | 1,344,152 | | | | 1,716,972 | |
| | | | | | | | | | | |
| | | | | | | | $ | 154,324,699 | |
| | | | | | | | | | | |
| | | |
Total Mortgage Pass-Throughs
(identified cost $1,428,476,428) | | | | | | | | $ | 1,481,757,513 | |
| | | | | | | | | | | |
|
| U.S. Government Agency Obligations — 4.8% | |
| | | |
| | | | | | | | | | |
| Security | | | | Principal
Amount | | | Value | |
Federal Home Loan Bank: | | | | | | | | | | |
4.125%, 12/13/19(10) | | | | $ | 20,000,000 | | | $ | 23,756,420 | |
4.125%, 3/13/20(10) | | | | | 65,000,000 | | | | 77,116,130 | |
4.625%, 9/11/20 | | | | | 19,325,000 | | | | 23,790,911 | |
5.25%, 12/11/20(10) | | | | | 11,545,000 | | | | 14,774,379 | |
5.25%, 12/9/22(10) | | | | | 14,850,000 | | | | 19,394,516 | |
5.365%, 9/9/24 | | | | | 12,700,000 | | | | 16,881,843 | |
5.375%, 9/30/22 | | | | | 49,780,000 | | | | 65,248,139 | |
5.375%, 8/15/24(10) | | | | | 22,000,000 | | | | 29,135,172 | |
5.625%, 6/11/21(10) | | | | | 12,850,000 | | | | 16,815,613 | |
5.75%, 6/12/26 | | | | | 14,850,000 | | | | 20,233,749 | |
| | | | | | | | | | | |
| | | | | | | | $ | 307,146,872 | |
| | | | | | | | | | | |
United States Agency for International Development — Israel: | | | | | |
5.50%, 12/4/23 | | | | $ | 5,000,000 | | | $ | 6,618,625 | |
5.50%, 4/26/24 | | | | | 22,500,000 | | | | 29,958,435 | |
| | | | | | | | | | | |
| | | | | | | | $ | 36,577,060 | |
| | | | | | | | | | | |
| | | |
Total U.S. Government Agency Obligations
(identified cost $291,217,758) | | | | | | | | $ | 343,723,932 | |
| | | | | | | | | | | |
| |
| U.S. Treasury Obligations — 0.0%(3) | | | | | |
| | | |
| | | | | | | | | | |
| Security | | | | Principal
Amount | | | Value | |
U.S. Treasury Bond, 7.875%, 2/15/21(10) | | | | $ | 1,500,000 | | | $ | 2,271,562 | |
| | | | | | | | | | | |
| | | |
Total U.S. Treasury Obligations
(identified cost $1,711,796) | | | | | | | | $ | 2,271,562 | |
| | | | | | | | | | | |
| | | |
Total Debt Obligations — United States
(identified cost $1,849,804,292) | | | | | | | | $ | 1,965,770,735 | |
| | | | | | | | | | | |
| | | | |
| | 23 | | See Notes to Consolidated Financial Statements. |
Global Macro Portfolio
October 31, 2012
Consolidated Portfolio of Investments — continued
| | | | | | | | | | |
| | | |
| Common Stocks — 0.7% | | | | | | | | | | |
| | | |
| | | | | | | | | | |
| Security | | | | Shares | | | Value | |
| | | | | | | | | | |
| | | |
France — 0.1% | | | | | | | | | | |
Sanofi | | | | | 45,475 | | | $ | 3,993,951 | |
Total SA | | | | | 78,766 | | | | 3,967,460 | |
| | | | | | | | | | | |
Total France | | | | | | | | $ | 7,961,411 | |
| | | | | | | | | | | |
| | | |
Germany — 0.5% | | | | | | | | | | |
Deutsche EuroShop AG | | | | | 286,649 | | | $ | 11,715,344 | |
Deutsche Wohnen AG | | | | | 619,567 | | | | 11,346,914 | |
GSW Immobilien AG | | | | | 280,052 | | | | 11,511,328 | |
| | | | | | | | | | | |
Total Germany | | | | | | | | $ | 34,573,586 | |
| | | | | | | | | | | |
| | | |
Luxembourg — 0.1% | | | | | | | | | | |
GAGFAH SA(11) | | | | | 990,107 | | | $ | 11,268,268 | |
| | | | | | | | | | | |
Total Luxembourg | | | | | | | | $ | 11,268,268 | |
| | | | | | | | | | | |
| | | |
Total Common Stocks
(identified cost $46,106,908) | | | | | | | | $ | 53,803,265 | |
| | | | | | | | | | | |
| | | |
| Precious Metals — 6.7% | | | | | | | | | | |
| | | |
| | | | | | | | | | |
| Description | | | | Troy Ounces | | | Value | |
| | | | | | | | | | |
Gold(11) | | | | | 184,663 | | | $ | 317,884,341 | |
Platinum(11) | | | | | 104,260 | | | | 163,661,884 | |
| | | | | | | | | | | |
| | | |
Total Precious Metals
(identified cost $473,601,481) | | | | | | | | $ | 481,546,225 | |
| | | | | | | | | | | |
| | | | | | | | | | | | | | | | | | |
| | |
| Currency Call Options Purchased — 0.2% | | | | | | | | | |
| | | | | |
| | | | | | | | | | | | | | | | | | |
| Description | | Counterparty | | Principal Amount of Contracts (000's omitted) | | | Strike
Price | | | Expiration
Date | | | Value | |
| | | | | | | | | | | | | | | | | | |
Indian Rupee | | Australia and
New Zealand
Banking Group
Limited | | INR | 2,863,000 | | | | INR 54.00 | | | | 8/12/13 | | | $ | 965,421 | |
Indian Rupee | | Australia and
New Zealand
Banking Group
Limited | | INR | 1,762,000 | | | | INR 54.00 | | | | 8/12/13 | | | | 594,157 | |
Indian Rupee | | Bank of America | | INR | 4,068,093 | | | | INR 52.00 | | | | 5/6/13 | | | | 564,822 | |
Indian Rupee | | Bank of America | | INR | 3,709,482 | | | | INR 52.00 | | | | 5/6/13 | | | | 515,031 | |
Indian Rupee | | Bank of America | | INR | 3,921,500 | | | | INR 55.00 | | | | 7/1/13 | | | | 1,811,566 | |
Indian Rupee | | Bank of America | | INR | 2,904,000 | | | | INR 54.00 | | | | 8/12/13 | | | | 979,246 | |
Indian Rupee | | Bank of America | | | INR 3,432,000 | | | | INR 55.00 | | | | 8/16/13 | | | | 1,579,058 | |
| | | | | | | | | | | | | | | | | | |
| Description | | Counterparty | | Principal Amount of
Contracts (000's omitted) | | | Strike
Price | | | Expiration
Date | | | Value | |
| | | | | | | | | | | | | | | | | | |
Indian Rupee | | Barclays Bank PLC | | | INR 4,073,798 | | | | INR 52.00 | | | | 5/6/13 | | | $ | 565,614 | |
Indian Rupee | | Barclays Bank PLC | | | INR 2,920,000 | | | | INR 54.00 | | | | 8/12/13 | | | | 984,642 | |
Indian Rupee | | Deutsche Bank | | | INR 3,211,300 | | | | INR 51.00 | | | | 5/8/13 | | | | 281,283 | |
Indian Rupee | | Deutsche Bank | | | INR 2,570,000 | | | | INR 54.00 | | | | 8/12/13 | | | | 866,620 | |
Indian Rupee | | Goldman Sachs
International | | | INR 3,725,500 | | | | INR 51.00 | | | | 5/8/13 | | | | 326,323 | |
Indian Rupee | | Goldman Sachs
International | | | INR 3,267,000 | | | | INR 55.00 | | | | 7/1/13 | | | | 1,509,215 | |
Indian Rupee | | Goldman Sachs
International | | | INR 1,700,000 | | | | INR 54.00 | | | | 8/12/13 | | | | 573,250 | |
Indian Rupee | | Goldman Sachs
International | | | INR 2,185,000 | | | | INR 55.00 | | | | 8/19/13 | | | | 1,011,570 | |
Indian Rupee | | HSBC Bank USA | | | INR 3,847,800 | | | | INR 53.00 | | | | 7/3/13 | | | | 891,514 | |
Indian Rupee | | JPMorgan Chase
Bank | | | INR 3,280,700 | | | | INR 53.00 | | | | 7/3/13 | | | | 760,120 | |
Indian Rupee | | JPMorgan Chase
Bank | | | INR 1,951,000 | | | | INR 54.00 | | | | 8/12/13 | | | | 657,889 | |
Indian Rupee | | JPMorgan Chase
Bank | | | INR 1,538,000 | | | | INR 54.00 | | | | 8/12/13 | | | | 518,623 | |
Indian Rupee | | Standard
Chartered Bank | | | INR 3,304,700 | | | | INR 52.00 | | | | 5/6/13 | | | | 458,831 | |
Indian Rupee | | Standard
Chartered Bank | | | INR 2,183,600 | | | | INR 53.00 | | | | 7/3/13 | | | | 505,928 | |
| | | | | | | | | | | | | | | | | | | |
| | |
Total Currency Call Options Purchased
(identified cost $14,123,815) | | | | | | | $ | 16,920,723 | |
| | | | | | | | | | | | | | | | | | | |
| | |
| Currency Put Options Purchased — 0.0%(3) | | | | | | | | | |
| | | | | |
| | | | | | | | | | | | | | | | | | |
| Description | | Counterparty | | Principal Amount of
Contracts (000's omitted) | | | Strike
Price | | | Expiration
Date | | | Value | |
| | | | | | | | | | | | | | | | | | |
Yuan Offshore Renminbi | | Barclays Bank PLC | | | CNH 449,995 | | | | CNH 6.50 | | | | 5/20/13 | | | $ | 170,438 | |
Yuan Offshore Renminbi | | Citibank NA | | | CNH 425,666 | | | | CNH 6.50 | | | | 5/20/13 | | | | 161,223 | |
Yuan Offshore Renminbi | | HSBC Bank USA | | | CNH 481,026 | | | | CNH 6.50 | | | | 5/20/13 | | | | 182,191 | |
Yuan Offshore Renminbi | | Standard
Chartered Bank | | | CNH 403,052 | | | | CNH 6.50 | | | | 5/20/13 | | | | 152,658 | |
| | | | | | | | | | | | | | | | | | | |
| | |
Total Currency Put Options Purchased
(identified cost $2,323,291) | | | | | | | $ | 666,510 | |
| | | | | | | | | | | | | | | | | | | |
| | | | |
| | 24 | | See Notes to Consolidated Financial Statements. |
Global Macro Portfolio
October 31, 2012
Consolidated Portfolio of Investments — continued
| | | | | | | | | | | | | | | | |
| Interest Rate Swaptions — 0.0%(3) | | | | | |
| | | | |
| | | | | | | | | | | | | | | | |
| Description | | Counterparty | | | Expiration
Date | | | Notional
Amount | | | Value | |
| | | | | | | | | | | | | | | | |
Options to receive 3-month USD-LIBOR-BBA Rate and pay 4.60% | | | Deutsche Bank | | | | 8/26/14 | | | $ | 99,600,000 | | | $ | 1,311,533 | |
| | | | | | | | | | | | | | | | | |
| |
Total Interest Rate Swaptions
(identified cost $6,205,080) | | | $ | 1,311,533 | |
| | | | | | | | | | | | | | | | | |
| | | | | | | | | | | | | | | | | | | | |
| | |
| Put Options Purchased — 0.1% | | | | | | | | | |
| | | | | |
| | | | | | | | | | | | | | | | | | | | |
| Description | | Counterparty | | | Number of
Contracts (000's omitted) | | | Strike
Price | | | Expiration
Date | | | Value | |
| | | | | | | | | | | | | | | | | | | | |
Brent Crude Oil Future 9/2013 | | | Not Applicable | | | | 1,360 | | | USD | 95.00 | | | | 8/12/13 | | | $ | 9,520,000 | |
KOSPI 200 Index | | | Bank of America | | | | 134,100 | | | KRW | 200.00 | | | | 12/13/12 | | | | 7,188 | |
| | | | | | | | | | | | | | | | | | | | | |
| | |
Total Put Options Purchased
(identified cost $11,154,843) | | | | | | | $ | 9,527,188 | |
| | | | | | | | | | | | | | | | | | | | | |
| | | | | | | | | | |
|
| Short-Term Investments — 40.0% | |
|
| Foreign Government Securities — 23.9% | |
| | | |
| | | | | | | | | | |
| Security | | Principal Amount (000's omitted) | | | Value | |
| | | | | | | | | | |
| | | |
Croatia — 1.3% | | | | | | | | | | |
Croatia Treasury Bill, 0.00%, 11/8/12 | | EUR | | | 2,368 | | | $ | 3,067,763 | |
Croatia Treasury Bill, 0.00%, 11/15/12 | | EUR | | | 7,010 | | | | 9,077,688 | |
Croatia Treasury Bill, 0.00%, 11/22/12 | | EUR | | | 3,672 | | | | 4,752,492 | |
Croatia Treasury Bill, 0.00%, 11/29/12 | | EUR | | | 9,109 | | | | 11,782,826 | |
Croatia Treasury Bill, 0.00%, 1/24/13 | | EUR | | | 7,340 | | | | 9,451,779 | |
Croatia Treasury Bill, 0.00%, 1/31/13 | | EUR | | | 3,436 | | | | 4,424,624 | |
Croatia Treasury Bill, 0.00%, 2/7/13 | | EUR | | | 3,637 | | | | 4,680,524 | |
Croatia Treasury Bill, 0.00%, 2/28/13 | | EUR | | | 6,953 | | | | 8,930,882 | |
Croatia Treasury Bill, 0.00%, 3/7/13 | | EUR | | | 5,000 | | | | 6,418,148 | |
Croatia Treasury Bill, 0.00%, 3/14/13 | | EUR | | | 7,111 | | | | 9,121,894 | |
Croatia Treasury Bill, 0.00%, 3/28/13 | | EUR | | | 7,396 | | | | 9,474,872 | |
Croatia Treasury Bill, 0.00%, 4/4/13 | | EUR | | | 7,050 | | | | 9,027,444 | |
| | | | | | | | | | | |
Total Croatia | | | $ | 90,210,936 | |
| | | | | | | | | | | |
| | | |
Georgia — 0.8% | | | | | | | | | | |
Bank of Georgia Promissory Note, 7.00%, 3/9/13 | | USD | | | 12,265 | | | $ | 12,456,606 | |
Bank of Georgia Promissory Note, 7.75%, 2/22/13 | | USD | | | 17,671 | | | | 17,964,295 | |
| | | | | | | | | | |
| Security | | Principal Amount (000's omitted) | | | Value | |
| | | | | | | | | | |
|
Georgia (continued) | |
Bank of Georgia Promissory Note, 8.25%, 12/21/12 | | USD | | | 11,970 | | | $ | 12,083,085 | |
Georgia Treasury Bill, 0.00%, 1/17/13 | | GEL | | | 2,000 | | | | 1,189,834 | |
Georgia Treasury Bill, 0.00%, 3/14/13 | | GEL | | | 10,840 | | | | 6,384,852 | |
Georgia Treasury Bill, 0.00%, 5/23/13 | | GEL | | | 9,290 | | | | 5,399,268 | |
Georgia Treasury Bill, 0.00%, 7/18/13 | | GEL | | | 8,033 | | | | 4,623,885 | |
| | | | | | | | | | | |
Total Georgia | | | $ | 60,101,825 | |
| | | | | | | | | | | |
| | | |
Hong Kong — 3.5% | | | | | | | | | | |
Hong Kong Treasury Bill, 0.00%, 11/7/12 | | HKD | | | 980,000 | | | $ | 126,446,857 | |
Hong Kong Treasury Bill, 0.00%, 1/30/13 | | HKD | | | 969,500 | | | | 125,010,902 | |
| | | | | | | | | | | |
Total Hong Kong | | | $ | 251,457,759 | |
| | | | | | | | | | | |
| | | |
Malaysia — 5.2% | | | | | | | | | | |
Bank Negara Monetary Note, 0.00%, 11/6/12 | | MYR | | | 200,519 | | | $ | 65,804,335 | |
Bank Negara Monetary Note, 0.00%, 11/8/12 | | MYR | | | 114,837 | | | | 37,679,907 | |
Bank Negara Monetary Note, 0.00%, 11/22/12 | | MYR | | | 111,725 | | | | 36,617,362 | |
Bank Negara Monetary Note, 0.00%, 11/29/12 | | MYR | | | 69,314 | | | | 22,705,772 | |
Bank Negara Monetary Note, 0.00%, 12/13/12 | | MYR | | | 209,738 | | | | 68,627,917 | |
Bank Negara Monetary Note, 0.00%, 12/20/12 | | MYR | | | 88,472 | | | | 28,932,369 | |
Bank Negara Monetary Note, 0.00%, 1/10/13 | | MYR | | | 143,394 | | | | 46,814,067 | |
Bank Negara Monetary Note, 0.00%, 2/7/13 | | MYR | | | 99,282 | | | | 32,345,119 | |
Bank Negara Monetary Note, 0.00%, 2/19/13 | | MYR | | | 113,214 | | | | 36,846,748 | |
| | | | | | | | | | | |
Total Malaysia | | | $ | 376,373,596 | |
| | | | | | | | | | | |
| | | |
Mexico — 1.1% | | | | | | | | | | |
Mexico Cetes, 0.00%, 2/7/13 | | MXN | | | 952,227 | | | $ | 71,875,903 | |
Mexico Cetes, 0.00%, 2/21/13 | | MXN | | | 129,351 | | | | 9,744,791 | |
| | | | | | | | | | | |
Total Mexico | | | $ | 81,620,694 | |
| | | | | | | | | | | |
|
Nigeria — 4.6% | |
Nigeria Treasury Bill, 0.00%, 2/21/13 | | NGN | | | 1,644,681 | | | $ | 10,053,202 | |
Nigeria Treasury Bill, 0.00%, 3/7/13 | | NGN | | | 7,547,170 | | | | 45,783,495 | |
Nigeria Treasury Bill, 0.00%, 3/28/13 | | NGN | | | 2,761,000 | | | | 16,720,640 | |
Nigeria Treasury Bill, 0.00%, 4/4/13 | | NGN | | | 8,032,600 | | | | 48,525,501 | |
Nigeria Treasury Bill, 0.00%, 4/11/13 | | NGN | | | 2,138,000 | | | | 12,820,152 | |
Nigeria Treasury Bill, 0.00%, 4/25/13 | | NGN | | | 1,467,500 | | | | 8,761,289 | |
Nigeria Treasury Bill, 0.00%, 5/9/13 | | NGN | | | 3,668,200 | | | | 21,815,693 | |
Nigeria Treasury Bill, 0.00%, 5/23/13 | | NGN | | | 1,253,000 | | | | 7,439,729 | |
Nigeria Treasury Bill, 0.00%, 6/27/13 | | NGN | | | 1,000,000 | | | | 5,840,825 | |
Nigeria Treasury Bill, 0.00%, 8/8/13 | | NGN | | | 862,737 | | | | 4,960,849 | |
Nigeria Treasury Bill, 0.00%, 9/5/13 | | NGN | | | 26,180,000 | | | | 149,007,306 | |
Nigeria Treasury Bill, 0.00%, 9/26/13 | | NGN | | | 316,884 | | | | 1,793,665 | |
| | | | | | | | | | | |
Total Nigeria | | | $ | 333,522,346 | |
| | | | | | | | | | | |
| | | | |
| | 25 | | See Notes to Consolidated Financial Statements. |
Global Macro Portfolio
October 31, 2012
Consolidated Portfolio of Investments — continued
| | | | | | | | | | |
| Security | | Principal Amount (000's omitted) | | | Value | |
| | | | | | | | | | |
| | | |
Philippines — 1.1% | | | | | | | | | | |
Philippine Treasury Bill, 0.00%, 11/7/12 | | PHP | | | 74,070 | | | $ | 1,797,944 | |
Philippine Treasury Bill, 0.00%, 11/21/12 | | PHP | | | 273,260 | | | | 6,630,346 | |
Philippine Treasury Bill, 0.00%, 1/2/13 | | PHP | | | 160,410 | | | | 3,889,332 | |
Philippine Treasury Bill, 0.00%, 1/30/13 | | PHP | | | 74,120 | | | | 1,797,646 | |
Philippine Treasury Bill, 0.00%, 2/6/13 | | PHP | | | 193,656 | | | | 4,695,729 | |
Philippine Treasury Bill, 0.00%, 2/20/13 | | PHP | | | 24,740 | | | | 599,825 | |
Philippine Treasury Bill, 0.00%, 3/6/13 | | PHP | | | 1,173,800 | | | | 28,450,088 | |
Philippine Treasury Bill, 0.00%, 4/17/13 | | PHP | | | 60,530 | | | | 1,465,319 | |
Philippine Treasury Bill, 0.00%, 5/2/13 | | PHP | | | 134,160 | | | | 3,246,301 | |
Philippine Treasury Bill, 0.00%, 5/15/13 | | PHP | | | 22,580 | | | | 546,153 | |
Philippine Treasury Bill, 0.00%, 7/10/13 | | PHP | | | 180,240 | | | | 4,351,154 | |
Philippine Treasury Bill, 0.00%, 7/24/13 | | PHP | | | 139,930 | | | | 3,376,471 | |
Philippine Treasury Bill, 0.00%, 8/7/13 | | PHP | | | 603,050 | | | | 14,544,487 | |
Philippine Treasury Bill, 0.00%, 9/18/13 | | PHP | | | 171,260 | | | | 4,124,320 | |
Philippine Treasury Bill, 0.00%, 10/2/13 | | PHP | | | 66,800 | | | | 1,607,846 | |
| | | | | | | | | | | |
Total Philippines | | | $ | 81,122,961 | |
| | | | | | | | | | | |
| | | |
Serbia — 1.7% | | | | | | | | | | |
Serbia Treasury Bill, 0.00%, 1/17/13 | | RSD | | | 147,500 | | | $ | 1,638,584 | |
Serbia Treasury Bill, 0.00%, 2/13/13 | | RSD | | | 2,101,100 | | | | 23,118,305 | |
Serbia Treasury Bill, 0.00%, 3/28/13 | | RSD | | | 598,940 | | | | 6,486,349 | |
Serbia Treasury Bill, 0.00%, 4/11/13 | | RSD | | | 703,090 | | | | 7,575,111 | |
Serbia Treasury Bill, 0.00%, 5/23/13 | | RSD | | | 1,940,860 | | | | 20,621,859 | |
Serbia Treasury Bill, 0.00%, 6/13/13 | | RSD | | | 209,100 | | | | 2,204,859 | |
Serbia Treasury Bill, 0.00%, 6/28/13 | | RSD | | | 734,800 | | | | 7,706,107 | |
Serbia Treasury Bill, 0.00%, 7/12/13 | | RSD | | | 795,400 | | | | 8,299,444 | |
Serbia Treasury Bill, 0.00%, 9/13/13 | | RSD | | | 3,921,200 | | | | 39,993,017 | |
Serbia Treasury Bill, 0.00%, 10/31/13 | | RSD | | | 670,500 | | | | 6,721,067 | |
| | | | | | | | | | | |
Total Serbia | | | $ | 124,364,702 | |
| | | | | | | | | | | |
| | | |
South Korea — 0.8% | | | | | | | | | | |
Korea Monetary Stabilization Bond, 0.00%, 11/6/12 | | KRW | | | 5,903,930 | | | $ | 5,411,044 | |
Korea Monetary Stabilization Bond, 0.00%, 11/13/12 | | KRW | | | 22,504,500 | | | | 20,613,996 | |
Korea Monetary Stabilization Bond, 0.00%, 12/3/12 | | KRW | | | 10,000,000 | | | | 9,143,417 | |
Korea Monetary Stabilization Bond, 0.00%, 12/11/12 | | KRW | | | 16,569,520 | | | | 15,131,766 | |
Korea Monetary Stabilization Bond, 0.00%, 12/18/12 | | KRW | | | 4,553,170 | | | | 4,158,391 | |
Korea Monetary Stabilization Bond, 0.00%, 12/25/12 | | KRW | | | 6,701,120 | | | | 6,117,396 | |
| | | | | | | | | | | |
Total South Korea | | | $ | 60,576,010 | |
| | | | | | | | | | | |
| | | | | | | | | | |
| Security | | Principal Amount (000's omitted) | | | Value | |
| | | | | | | | | | |
| | | |
Sri Lanka — 2.8% | | | | | | | | | | |
Sri Lanka Treasury Bill, 0.00%, 11/2/12 | | LKR | | | 595,080 | | | $ | 4,567,587 | |
Sri Lanka Treasury Bill, 0.00%, 12/7/12 | | LKR | | | 1,320,630 | | | | 10,037,397 | |
Sri Lanka Treasury Bill, 0.00%, 12/21/12 | | LKR | | | 1,657,480 | | | | 12,545,997 | |
Sri Lanka Treasury Bill, 0.00%, 12/28/12 | | LKR | | | 226,620 | | | | 1,711,818 | |
Sri Lanka Treasury Bill, 0.00%, 1/18/13 | | LKR | | | 1,483,200 | | | | 11,136,388 | |
Sri Lanka Treasury Bill, 0.00%, 1/18/13 | | LKR | | | 1,335,940 | | | | 10,030,708 | |
Sri Lanka Treasury Bill, 0.00%, 2/1/13 | | LKR | | | 5,000,000 | | | | 37,394,626 | |
Sri Lanka Treasury Bill, 0.00%, 2/1/13 | | LKR | | | 2,171,530 | | | | 16,240,679 | |
Sri Lanka Treasury Bill, 0.00%, 2/8/13 | | LKR | | | 331,340 | | | | 2,472,347 | |
Sri Lanka Treasury Bill, 0.00%, 2/15/13 | | LKR | | | 659,700 | | | | 4,910,887 | |
Sri Lanka Treasury Bill, 0.00%, 2/22/13 | | LKR | | | 1,827,000 | | | | 13,567,842 | |
Sri Lanka Treasury Bill, 0.00%, 3/1/13 | | LKR | | | 745,000 | | | | 5,519,097 | |
Sri Lanka Treasury Bill, 0.00%, 3/8/13 | | LKR | | | 1,422,520 | | | | 10,512,996 | |
Sri Lanka Treasury Bill, 0.00%, 3/8/13 | | LKR | | | 1,501,000 | | | | 11,092,986 | |
Sri Lanka Treasury Bill, 0.00%, 3/22/13 | | LKR | | | 1,400,000 | | | | 10,296,860 | |
Sri Lanka Treasury Bill, 0.00%, 3/29/13 | | LKR | | | 1,643,490 | | | | 12,058,213 | |
Sri Lanka Treasury Bill, 0.00%, 4/5/13 | | LKR | | | 181,720 | | | | 1,329,998 | |
Sri Lanka Treasury Bill, 0.00%, 4/12/13 | | LKR | | | 264,450 | | | | 1,930,718 | |
Sri Lanka Treasury Bill, 0.00%, 8/30/13 | | LKR | | | 105,900 | | | | 738,300 | |
Sri Lanka Treasury Bill, 0.00%, 10/4/13 | | LKR | | | 882,170 | | | | 6,078,519 | |
Sri Lanka Treasury Bill, 0.00%, 10/18/13 | | LKR | | | 681,000 | | | | 4,671,263 | |
Sri Lanka Treasury Bill, 0.00%, 10/25/13 | | LKR | | | 642,000 | | | | 4,393,846 | |
Sri Lanka Treasury Bill, 0.00%, 11/1/13 | | LKR | | | 669,390 | | | | 4,569,053 | |
| | | | | | | | | | | |
Total Sri Lanka | | | | | | | | $ | 197,808,125 | |
| | | | | | | | | | | |
| | | |
Uganda — 0.1% | | | | | | | | | | |
Uganda Treasury Bill, 0.00%, 1/25/13 | | UGX | | | 17,475,000 | | | $ | 6,620,991 | |
| | | | | | | | | | | |
Total Uganda | | | | | | | | $ | 6,620,991 | |
| | | | | | | | | | | |
| | | |
Uruguay — 0.9% | | | | | | | | | | |
Monetary Regulation Bill, 0.00%, 11/5/12 | | UYU | | | 175,309 | | | $ | 8,867,546 | |
Monetary Regulation Bill, 0.00%, 12/7/12 | | UYU | | | 129,700 | | | | 6,506,809 | |
Monetary Regulation Bill, 0.00%, 2/15/13 | | UYU | | | 32,230 | | | | 1,587,041 | |
Monetary Regulation Bill, 0.00%, 3/22/13(2) | | UYU | | | 228,031 | | | | 11,481,696 | |
Monetary Regulation Bill, 0.00%, 4/26/13(2) | | UYU | | | 239,122 | | | | 12,020,444 | |
Monetary Regulation Bill, 0.00%, 5/31/13(2) | | UYU | | | 320,125 | | | | 16,085,597 | |
Monetary Regulation Bill, 0.00%, 7/5/13(2) | | UYU | | | 105,642 | | | | 5,299,647 | |
| | | | | | | | | | | |
Total Uruguay | | | | | | | | $ | 61,848,780 | |
| | | | | | | | | | | |
| | | |
Total Foreign Government Securities
(identified cost $1,718,367,632) | | | | | | | | $ | 1,725,628,725 | |
| | | | | | | | | | | |
| | | | |
| | 26 | | See Notes to Consolidated Financial Statements. |
Global Macro Portfolio
October 31, 2012
Consolidated Portfolio of Investments — continued
| | | | | | | | | | |
| U.S. Treasury Obligations — 2.1% | |
| | | |
| | | | | | | | | | |
| Security | | Principal Amount (000's omitted) | | | Value | |
| | | | | | | | | | |
U.S. Treasury Bill, 0.00%, 11/15/12(10) | | | | $ | 44,420 | | | $ | 44,418,889 | |
U.S. Treasury Bill, 0.00%, 12/13/12(10) | | | | | 100,000 | | | | 99,989,500 | |
U.S. Treasury Bill, 0.00%, 1/17/13(10) | | | | | 10,000 | | | | 9,998,240 | |
| | | | | | | | | | | |
| | | |
Total U.S. Treasury Obligations
(identified cost $154,402,065) | | | | | | | | $ | 154,406,629 | |
| | | | | | | | | | | |
| | | |
| Repurchase Agreements — 9.0% | | | | | | | | | | |
| | | |
| | | | | | | | | | |
| Description | | Principal Amount (000's omitted) | | | Value | |
| | | | | | | | | | |
Bank of America: | | | | | | | | | | |
Dated 10/17/12 with a maturity date of 11/9/12, an interest rate of 0.10% payable by the Portfolio and repurchase proceeds of EUR 50,014,618, collateralized by EUR 43,520,000 Government of France 3.75%, due 4/25/17 and a market value, including accrued interest, of $64,756,053. | | EUR | | | 50,018 | | | $ | 64,830,199 | |
Dated 10/24/12 with a maturity date of 12/7/12, an interest rate of 0.10% payable by the Portfolio and repurchase proceeds of EUR 55,203,624, collateralized by EUR 48,250,000 Government of France 3.75%, due 10/25/19 and a market value, including accrued interest, of $71,586,329. | | EUR | | | 55,210 | | | | 71,560,489 | |
Dated 10/29/12 with a maturity date of 1/24/13, an interest rate of 0.65% payable by the Portfolio and repurchase proceeds of EUR 24,909,005, collateralized by EUR 20,760,000 European Investment Bank 4.25%, due 4/15/19 and a market value, including accrued interest, of $32,395,118. | | EUR | | | 24,947 | | | | 32,335,418 | |
Dated 10/30/12 with a maturity date of 11/16/12, an interest rate of 0.12% payable by the Portfolio and repurchase proceeds of EUR 75,354,240, collateralized by EUR 65,620,000 Government of France 3.75%, due 4/25/17 and a market value, including accrued interest, of $97,639,986. | | EUR | | | 75,358 | | | | 97,675,237 | |
Dated 10/30/12 with a maturity date of 1/24/13, an interest rate of 0.65% payable by the Portfolio and repurchase proceeds of EUR 17,260,981, collateralized by EUR 14,700,000 European Investment Bank 3.625%, due 1/15/21 and a market value, including accrued interest, of $22,334,861. | | EUR | | | 17,287 | | | | 22,406,794 | |
| | | | | | | | | | |
| Description | | Principal Amount (000's omitted) | | | Value | |
| | | | | | | | | | |
Dated 10/30/12 with a maturity date of 1/24/13, an interest rate of 0.65% payable by the Portfolio and repurchase proceeds of EUR 22,602,767, collateralized by EUR 18,300,000 European Investment Bank 4.625%, due 4/15/20 and a market value, including accrued interest, of $29,397,741. | | EUR | | | 22,637 | | | $ | 29,341,063 | |
Barclays Bank PLC: | | | | | | | | | | |
Dated 10/24/12 with a maturity date of 11/19/12, an interest rate of 0.10% payable by the Portfolio and repurchase proceeds of EUR 56,188,624, collateralized by EUR 48,350,000 Government of France 4.00%, due 10/25/38 and a market value, including accrued interest, of $72,505,768. | | EUR | | | 56,192 | | | | 72,833,707 | |
Citibank NA: | | | | | | | | | | |
Dated 10/24/12 with a maturity date of 11/29/12, an interest rate of 0.08% payable by the Portfolio and repurchase proceeds of EUR 89,152,928, collateralized by EUR 77,194,000 Government of France 4.00%, due 10/25/38 and a market value, including accrued interest, of $115,760,295. | | EUR | | | 89,159 | | | | 115,563,475 | |
Nomura International PLC: | | | | | | | | | | |
Dated 10/15/12 with a maturity date of 11/8/12, an interest rate of 0.15% payable by the Portfolio and repurchase proceeds of EUR 14,738,132, collateralized by EUR 15,000,000 Spain Government Bond 4.60%, due 7/30/19 and a market value, including accrued interest, of $19,391,430. | | EUR | | | 14,739 | | | | 19,104,572 | |
Dated 10/17/12 with a maturity date of 11/12/12, an interest rate of 0.06% payable by the Portfolio and repurchase proceeds of EUR 65,077,664, collateralized by EUR 57,600,000 Belgium Kingdom Government Bond 3.75%, due 9/28/20 and a market value, including accrued interest, of $84,204,239. | | EUR | | | 65,080 | | | | 84,353,749 | |
Dated 10/24/12 with a maturity date of 1/28/13, an interest rate of 0.07% payable by the Portfolio and repurchase proceeds of EUR 31,015,275, collateralized by EUR 30,900,000 Bundesrepublik Deutschland 0.50%, due 4/7/17 and a market value, including accrued interest, of $40,372,198. | | EUR | | | 31,021 | | | | 40,207,545 | |
| | | | | | | | | | | |
| | | |
Total Repurchase Agreements
(identified cost $652,074,955) | | | | | | | | $ | 650,212,248 | |
| | | | | | | | | | | |
| | | | |
| | 27 | | See Notes to Consolidated Financial Statements. |
Global Macro Portfolio
October 31, 2012
Consolidated Portfolio of Investments — continued
| | | | | | | | | | |
| Other — 5.0% | | | | | |
| | | |
| | | | | | | | | | |
| Description | | | | Interest
(000's omitted) | | | Value | |
| | | | | | | | | | |
Eaton Vance Cash Reserves Fund, LLC, 0.12%(12) | | | | $ | 357,358 | | | $ | 357,358,168 | |
| | | | | | | | | | | |
| | | |
Total Other
(identified cost $357,358,168) | | | | | | | | $ | 357,358,168 | |
| | | | | | | | | | | |
| | | |
Total Short-Term Investments
(identified cost $2,882,202,820) | | | | | | | | $ | 2,887,605,770 | |
| | | | | | | | | | | |
| | | |
Total Investments — 107.9%
(identified cost $7,606,077,584) | | | | | | | | $ | 7,795,885,887 | |
| | | | | | | | | | | |
| | | | | | | | | | | | | | | | | | |
| | |
| Currency Call Options Written — (0.1)% | | | | | | | | | |
| | | | | |
| | | | | | | | | | | | | | | | | | |
| Description | | Counterparty | | Principal Amount of
Contracts (000's omitted) | | | Strike
Price | | | Expiration
Date | | | Value | |
| | | | | | | | | | | | | | | | | | |
Indian Rupee | | Bank of
America | | | INR 3,643,326 | | | | INR 54.00 | | | | 8/12/13 | | | $ | (1,228,552 | ) |
Indian Rupee | | Citibank NA | | INR | 3,463,398 | | | | INR 54.00 | | | | 8/12/13 | | | | (1,167,879 | ) |
Indian Rupee | | Deutsche
Bank | | INR | 1,861,654 | | | | INR 54.00 | | | | 8/12/13 | | | | (627,761 | ) |
Indian Rupee | | Goldman
Sachs
International | | INR | 3,432,000 | | | | INR 55.00 | | | | 8/16/13 | | | | (1,586,714 | ) |
Indian Rupee | | HSBC Bank
USA | | INR | 3,780,918 | | | | INR 54.00 | | | | 8/12/13 | | | | (1,274,948 | ) |
Indian Rupee | | JPMorgan
Chase Bank | | INR | 2,185,000 | | | | INR 55.00 | | | | 8/19/13 | | | | (1,011,570 | ) |
Indian Rupee | | Nomura
International
PLC | | INR | 3,780,918 | | | | INR 54.00 | | | | 8/12/13 | | | | (1,274,948 | ) |
Indian Rupee | | Standard
Chartered
Bank | | | INR 1,734,786 | | | | INR 54.00 | | | | 8/12/13 | | | | (584,980 | ) |
| | | | | | | | | | | | | | | | | | | |
| | |
Total Currency Call Options Written
(premiums received $17,480,978) | | | | | | | $ | (8,757,352 | ) |
| | | | | | | | | | | | | | | | | | | |
| | | | | | | | | | | | | | | | | | |
| | |
| Currency Put Options Written — (0.0)%(3) | | | | | | | | | |
| | | | | |
| | | | | | | | | | | | | | | | | | |
| Description | | Counterparty | | Principal Amount of
Contracts (000's omitted) | | | Strike
Price | | | Expiration
Date | | | Value | |
| | | | | | | | | | | | | | | | | | |
Indian Rupee | | Bank of America | | | INR 2,317,250 | | | | INR 65.00 | | | | 7/1/13 | | | $ | (164,893 | ) |
Indian Rupee | | Goldman Sachs
International | | | INR 1,930,500 | | | | INR 65.00 | | | | 7/1/13 | | | | (137,373 | ) |
Indian Rupee | | HSBC Bank USA | | | INR 2,323,200 | | | | INR 64.00 | | | | 7/3/13 | | | | (209,842 | ) |
| | | | | | | | | | | | | | | | | | |
| Description | | Counterparty | | Principal Amount of
Contracts (000's omitted) | | | Strike
Price | | | Expiration
Date | | | Value | |
| | | | | | | | | | | | | | | | | | |
Indian Rupee | | JPMorgan
Chase
Bank | | | INR 1,980,800 | | | | INR 64.00 | | | | 7/3/13 | | | $ | (178,915 | ) |
Indian Rupee | | Standard
Chartered
Bank | | | INR 1,318,400 | | | | INR 64.00 | | | | 7/3/13 | | | | (119,084 | ) |
| | | | | | | | | | | | | | | | | | | |
| | |
Total Currency Put Options Written
(premiums received $4,089,906) | | | | | | | $ | (810,107 | ) |
| | | | | | | | | | | | | | | | | | | |
| | |
Other Assets, Less Liabilities — (7.8)% | | | | | | | $ | (565,978,740 | ) |
| | | | | | | | | | | | | | | | | | | |
| | |
Net Assets — 100.0% | | | | | | | $ | 7,220,339,688 | |
| | | | | | | | | | | | | | | | | | | |
The percentage shown for each investment category in the Consolidated Portfolio of Investments is based on net assets.
| | | | | | | | | | | | | | | | | | |
| JPMCC | | – | | JPMorgan Chase Commercial Mortgage Securities Corp. |
| MLMT | | – | | Merrill Lynch Mortgage Trust |
| WBCMT | | – | | Wachovia Bank Commercial Mortgage Trust |
| BRL | | – | | Brazilian Real |
| CNH | | – | | Yuan Offshore Renminbi |
| CRC | | – | | Costa Rican Colon |
| DOP | | – | | Dominican Peso |
| EUR | | – | | Euro |
| GBP | | – | | British Pound Sterling |
| GEL | | – | | Georgian Lari |
| HKD | | – | | Hong Kong Dollar |
| INR | | – | | Indian Rupee |
| KRW | | – | | South Korean Won |
| LKR | | – | | Sri Lankan Rupee |
| MXN | | – | | Mexican Peso |
| MYR | | – | | Malaysian Ringgit |
| NGN | | – | | Nigerian Naira |
| NZD | | – | | New Zealand Dollar |
| PHP | | – | | Philippine Peso |
| RSD | | – | | Serbian Dinar |
| TRY | | – | | New Turkish Lira |
| UGX | | – | | Ugandan Shilling |
| USD | | – | | United States Dollar |
| UYU | | – | | Uruguayan Peso |
| | (1) | Security exempt from registration under Rule 144A under the Securities Act of 1933. These securities may be sold in certain transactions (normally to qualified institutional buyers) and remain exempt from registration. At October 31, 2012, the aggregate value of these securities is $102,623,903 or 1.4% of the Portfolio's net assets. |
| | (2) | Inflation-linked security whose principal is adjusted for inflation based on changes in a designated inflation index or inflation rate for the applicable country. Interest is calculated based on the inflation-adjusted principal. |
| | (3) | Amount is less than 0.05%. |
| | | | |
| | 28 | | See Notes to Consolidated Financial Statements. |
Global Macro Portfolio
October 31, 2012
Consolidated Portfolio of Investments — continued
| | (4) | Represents a structured security whose market value and interest rate are linked to the performance of the underlying security. |
| | (5) | Security exempt from registration under Regulation S of the Securities Act of 1933, which exempts from registration securities offered and sold outside the United States. Security may not be offered or sold in the United States except pursuant to an exemption from, or in a transaction not subject to, the registration requirements of the Securities Act of 1933. |
| | (6) | Floating-rate security. |
| | (7) | Weighted average fixed-rate coupon that changes/updates monthly. |
| | (8) | Inverse floating-rate security whose coupon varies inversely with changes in the interest rate index. The stated interest rate represents the coupon rate in effect at October 31, 2012. |
| | (9) | Adjustable rate mortgage security. Rate shown is the rate at October 31, 2012. |
| (10) | Security (or a portion thereof) has been pledged to cover collateral requirements on open financial contracts and/or securities sold short. |
| (11) | Non-income producing. |
| (12) | Affiliated investment company available to Eaton Vance portfolios and funds which invests in high quality, U.S. dollar denominated money market instruments. The rate shown is the annualized seven-day yield as of October 31, 2012. |
| | | | | | | | | | |
| |
| Securities Sold Short — (9.9)% | | | | | |
| |
| Foreign Government Bonds — (8.9)% | | | | | |
| | | |
| | | | | | | | | | |
| Security | | | | Principal Amount (000's omitted) | | | Value | |
| | | | | | | | | | |
| | | |
Belgium — (1.2)% | | | | | | | | | | |
Belgium Kingdom Government Bond, 3.75%, 9/28/20 | | EUR | | | (57,600 | ) | | $ | (83,943,446 | ) |
| | | | | | | | | | | |
Total Belgium | | | | | | | | $ | (83,943,446 | ) |
| | | | | | | | | | | |
| | | |
France — (5.8)% | | | | | | | | | | |
Government of France, 3.75%, 4/25/17 | | EUR | | | (109,140 | ) | | $ | (159,634,629 | ) |
Government of France, 3.75%, 10/25/19 | | EUR | | | (48,250 | ) | | | (71,541,352 | ) |
Government of France, 4.00%, 10/25/38 | | EUR | | | (125,544 | ) | | | (188,141,235 | ) |
| | | | | | | | | | | |
Total France | | | | | | | | $ | (419,317,216 | ) |
| | | | | | | | | | | |
| | | |
Germany — (0.5)% | | | | | | | | | | |
Bundesrepublik Deutschland, 0.50%, 4/7/17 | | EUR | | | (30,900 | ) | | $ | (40,258,080 | ) |
| | | | | | | | | | | |
Total Germany | | | | | | | | $ | (40,258,080 | ) |
| �� | | | | | | | | | | |
| | | |
Spain — (0.3)% | | | | | | | | | | |
Spain Government Bond, 4.60%, 7/30/19 | | EUR | | | (15,000 | ) | | $ | (19,161,106 | ) |
| | | | | | | | | | | |
Total Spain | | | | | | | | $ | (19,161,106 | ) |
| | | | | | | | | | | |
| | | | | | | | | | |
| Security | | | | Principal Amount (000's omitted) | | | Value | |
| | | | | | | | | | |
| | | |
Supranational — (1.1)% | | | | | | | | | | |
European Investment Bank, 3.625%, 1/15/21 | | EUR | | | (14,700 | ) | | $ | (21,784,205 | ) |
European Investment Bank, 4.25%, 4/15/19 | | EUR | | | (20,760 | ) | | | (31,768,492 | ) |
European Investment Bank, 4.625%, 4/15/20 | | EUR | | | (18,300 | ) | | | (28,796,629 | ) |
| | | | | | | | | | | |
Total Supranational | | | | | | | | $ | (82,349,326 | ) |
| | | | | | | | | | | |
| | |
Total Foreign Government Bonds
(proceeds $624,225,765) | | | | | | $ | (645,029,174 | ) |
| | | | | | | | | | | |
| |
| Common Stocks — (1.0)% | | | | | |
| | | |
| | | | | | | | | | |
| Security | | | | Shares | | | Value | |
| | | | | | | | | | |
| | | |
China — (1.0)% | | | | | | | | | | |
Agricultural Bank of China, Ltd., Class H | | | | | (43,188,000 | ) | | $ | (18,552,643 | ) |
Bank of China, Ltd., Class H | | | | | (44,592,000 | ) | | | (18,268,551 | ) |
China Construction Bank Corp., Class H | | | | | (24,278,000 | ) | | | (18,231,548 | ) |
Industrial & Commercial Bank of China, Class H | | | | | (27,311,000 | ) | | | (17,984,266 | ) |
| | | | | | | | | | | |
| | |
Total Common Stocks
(proceeds $64,332,418) | | | | | | $ | (73,037,008 | ) |
| | | | | | | | | | | |
| | |
Total Securities Sold Short
(proceeds $688,558,183) | | | | | | $ | (718,066,182 | ) |
| | | | | | | | | | | |
| | | | |
| | 29 | | See Notes to Consolidated Financial Statements. |
Global Macro Portfolio
October 31, 2012
Consolidated Statement of Assets and Liabilities
| | | | |
| Assets | | October 31, 2012 | |
Investments — | | | | |
Securities of unaffiliated issuers, at value (identified cost, $6,775,117,935) | | $ | 6,956,981,494 | |
Affiliated investment, at value (identified cost, $357,358,168) | | | 357,358,168 | |
Precious metals, at value (identified cost, $473,601,481) | | | 481,546,225 | |
Total Investments, at value (identified cost, $7,606,077,584) | | $ | 7,795,885,887 | |
Cash | | $ | 6,065,763 | |
Restricted cash* | | | 3,646,000 | |
Foreign currency, at value (identified cost, $134,864,078) | | | 135,124,256 | |
Cash collateral for securities sold short | | | 89,218,650 | |
Interest receivable | | | 48,076,125 | |
Interest receivable from affiliated investment | | | 23,835 | |
Receivable for investments sold | | | 152,925,377 | |
Receivable for variation margin on open futures contracts | | | 2,179 | |
Receivable for open forward foreign currency exchange contracts | | | 39,293,958 | |
Receivable for closed forward foreign currency exchange contracts | | | 6,762,996 | |
Receivable for open swap contracts | | | 63,615,644 | |
Premium paid on open swap contracts | | | 114,087,849 | |
Total assets | | $ | 8,454,728,519 | |
| |
| Liabilities | | | | |
Written options outstanding, at value (premiums received, $21,570,884) | | $ | 9,567,459 | |
Payable for investments purchased | | | 290,171,413 | |
Payable for open forward commodity contracts | | | 9,488,742 | |
Payable for open forward foreign currency exchange contracts | | | 54,984,708 | |
Payable for closed forward foreign currency exchange contracts | | | 9,416,861 | |
Payable for open swap contracts | | | 100,580,771 | |
Premium payable on open swap contracts | | | 282,183 | |
Premium received on open swap contracts | | | 23,842,996 | |
Payable for securities sold short, at value (proceeds, $688,558,183) | | | 718,066,182 | |
Payable to affiliates: | | | | |
Investment adviser fee | | | 3,199,363 | |
Trustees' fees | | | 5,667 | |
Interest payable | | | 14,123,227 | |
Accrued expenses | | | 659,259 | |
Total liabilities | | $ | 1,234,388,831 | |
Net Assets applicable to investors' interest in Portfolio | | $ | 7,220,339,688 | |
| |
| Sources of Net Assets | | | | |
Investors' capital | | $ | 7,120,543,371 | |
Net unrealized appreciation | | | 99,796,317 | |
Total | | $ | 7,220,339,688 | |
| * | Represents restricted cash as collateral for open financial contracts. |
| | | | |
| | 30 | | See Notes to Consolidated Financial Statements. |
Global Macro Portfolio
October 31, 2012
Consolidated Statement of Operations
| | | | |
| Investment Income | | Year Ended
October 31, 2012 | |
Interest (net of foreign taxes, $1,254,174) | | $ | 384,093,122 | |
Dividends (net of foreign taxes, $56,677) | | | 869,200 | |
Interest allocated from affiliated investment | | | 387,073 | |
Expenses allocated from affiliated investment | | | (54,619 | ) |
Total investment income | | $ | 385,294,776 | |
| |
| Expenses | | | | |
Investment adviser fee | | $ | 39,782,114 | |
Trustees' fees and expenses | | | 69,458 | |
Custodian fee | | | 6,516,473 | |
Legal and accounting services | | | 545,291 | |
Interest expense | | | 1,203,196 | |
Interest and dividends on securities sold short | | | 22,632,627 | |
Miscellaneous | | | 423,393 | |
Total expenses | | $ | 71,172,552 | |
Deduct — | | | | |
Reduction of custodian fee | | $ | 5,990 | |
Total expense reductions | | $ | 5,990 | |
| |
Net expenses | | $ | 71,166,562 | |
| |
Net investment income | | $ | 314,128,214 | |
| |
| Realized and Unrealized Gain (Loss) | | | | |
Net realized gain (loss) — | | | | |
Investment transactions | | $ | (241,840,875 | ) |
Investment transactions allocated from affiliated investment | | | 7,160 | |
Securities sold short | | | 1,520,264 | |
Futures contracts | | | (40,528,590 | ) |
Swap contracts | | | (15,240,766 | ) |
Forward commodity contracts | | | (4,898,042 | ) |
Foreign currency and forward foreign currency exchange contract transactions | | | 246,628,802 | |
Net realized loss | | $ | (54,352,047 | ) |
Change in unrealized appreciation (depreciation) — | | | | |
Investments (including net decrease of $2,775,013 from precious metals) | | $ | 176,092,641 | |
Written options | | | 12,003,425 | |
Securities sold short | | | (39,246,938 | ) |
Futures contracts | | | (1,301,770 | ) |
Swap contracts | | | (86,079,973 | ) |
Forward commodity contracts | | | 5,219,655 | |
Foreign currency and forward foreign currency exchange contracts | | | (73,428,179 | ) |
Net change in unrealized appreciation (depreciation) | | $ | (6,741,139 | ) |
| |
Net realized and unrealized loss | | $ | (61,093,186 | ) |
| |
Net increase in net assets from operations | | $ | 253,035,028 | |
| | | | |
| | 31 | | See Notes to Consolidated Financial Statements. |
Global Macro Portfolio
October 31, 2012
Consolidated Statements of Changes in Net Assets
| | | | | | | | |
| | | Year Ended October 31, | |
| Increase (Decrease) in Net Assets | | 2012 | | | 2011 | |
From operations — | | | | | | | | |
Net investment income | | $ | 314,128,214 | | | $ | 286,262,848 | |
Net realized loss from investment transactions, written options, securities sold short, futures contracts, swap contracts, forward commodity contracts, and foreign currency and forward foreign currency exchange contract transactions | | | (54,352,047 | ) | | | (163,522,030 | ) |
Net change in unrealized appreciation (depreciation) from investments, written options, securities sold short, futures contracts, swap contracts, forward commodity contracts, foreign currency and forward foreign currency exchange contracts | | | (6,741,139 | ) | | | (48,145,524 | ) |
Net increase in net assets from operations | | $ | 253,035,028 | | | $ | 74,595,294 | |
Capital transactions — | | | | | | | | |
Contributions | | $ | 657,956,383 | | | $ | 743,671,640 | |
Withdrawals | | | (1,728,829,247 | ) | | | (1,787,114,297 | ) |
Net decrease in net assets from capital transactions | | $ | (1,070,872,864 | ) | | $ | (1,043,442,657 | ) |
| | |
Net decrease in net assets | | $ | (817,837,836 | ) | | $ | (968,847,363 | ) |
| | |
| Net Assets | | | | | | | | |
At beginning of year | | $ | 8,038,177,524 | | | $ | 9,007,024,887 | |
At end of year | | $ | 7,220,339,688 | | | $ | 8,038,177,524 | |
| | | | |
| | 32 | | See Notes to Consolidated Financial Statements. |
Global Macro Portfolio
October 31, 2012
Consolidated Supplementary Data
| | | | | | | | | | | | | | | | | | | | |
| | | Year Ended October 31, | |
| Ratios/Supplemental Data | | 2012 | | | 2011 | | | 2010 | | | 2009 | | | 2008 | |
Ratios (as a percentage of average daily net assets): | | | | | | | | | | | | | | | | | | | | |
Expenses(1) | | | 0.93 | %(2) | | | 0.75 | %(2) | | | 0.57 | % | | | 0.72 | % | | | 0.63 | % |
Net investment income | | | 4.10 | % | | | 3.22 | % | | | 2.67 | % | | | 4.93 | % | | | 5.25 | % |
Portfolio Turnover | | | 39 | % | | | 33 | % | | | 19 | % | | | 25 | % | | | 26 | % |
| | | | | |
Total Return | | | 3.46 | % | | | 0.79 | % | | | 5.31 | % | | | 12.10 | % | | | 2.97 | % |
| | | | | |
Net assets, end of year (000's omitted) | | $ | 7,220,340 | | | $ | 8,038,178 | | | $ | 9,007,025 | | | $ | 1,319,026 | | | $ | 845,021 | |
| (1) | Excludes the effect of custody fee credits, if any, of less than 0.005%. |
| (2) | Includes interest and dividend expense primarily on securities sold short of 0.30% and 0.11% for the years ended October 31, 2012 and 2011, respectively. |
| | | | |
| | 33 | | See Notes to Consolidated Financial Statements. |
Global Macro Portfolio
October 31, 2012
Notes to Consolidated Financial Statements
1 Significant Accounting Policies
Global Macro Portfolio (the Portfolio) is a Massachusetts business trust registered under the Investment Company Act of 1940, as amended (the 1940 Act), as a non-diversified, open-end management investment company. The Portfolio’s investment objective is total return. The Declaration of Trust permits the Trustees to issue interests in the Portfolio. At October 31, 2012, Eaton Vance Global Macro Absolute Return Fund, Eaton Vance Strategic Income Fund, Eaton Vance International (Cayman Islands) Strategic Income Fund, Eaton Vance Multi-Strategy Absolute Return Fund and Eaton Vance Multi-Strategy All Market Fund held an interest of 89.9%, 7.1%, 1.2%, 1.5% and less than 0.1%, respectively, in the Portfolio.
The Portfolio seeks to gain exposure to the commodity markets, in whole or in part, through investments in Eaton Vance GMP Commodity Subsidiary, Ltd. (the Subsidiary), a wholly-owned subsidiary of the Portfolio organized under the laws of the Cayman Islands with the same objective and investment policies and restrictions as the Portfolio. The Portfolio may invest up to 25% of its total assets in the Subsidiary. The net assets of the Subsidiary at October 31, 2012 were $532,519,564 or 7.4% of the Portfolio's consolidated net assets. The accompanying consolidated financial statements include the accounts of the Subsidiary. Intercompany balances and transactions have been eliminated in consolidation.
The following is a summary of significant accounting policies of the Portfolio. The policies are in conformity with accounting principles generally accepted in the United States of America.
A Investment Valuation — Debt obligations (including short-term obligations with a remaining maturity of more than sixty days and excluding most seasoned, fixed-rate 30-year mortgage-backed securities as noted below) are generally valued on the basis of valuations provided by third party pricing services, as derived from such services’ pricing models. Inputs to the models may include, but are not limited to, reported trades, executable bid and asked prices, broker/dealer quotations, prices or yields of securities with similar characteristics, benchmark curves or information pertaining to the issuer, as well as industry and economic events. The pricing services may use a matrix approach, which considers information regarding securities with similar characteristics to determine the valuation for a security. Most seasoned, fixed-rate 30-year mortgage-backed securities are valued through the use of the investment adviser’s matrix pricing system, which takes into account bond prices, yield differentials, anticipated prepayments and interest rates provided by dealers. Short-term obligations purchased with a remaining maturity of sixty days or less (excluding those that are non-U.S. dollar denominated, which typically are valued by a pricing service or dealer quotes) are generally valued at amortized cost, which approximates market value. Equity securities (including common shares of closed-end investment companies) listed on a U.S. securities exchange generally are valued at the last sale or closing price on the day of valuation or, if no sales took place on such date, at the mean between the closing bid and asked prices therefore on the exchange where such securities are principally traded. Equity securities listed on the NASDAQ Global or Global Select Market generally are valued at the NASDAQ official closing price. Unlisted or listed securities for which closing sales prices or closing quotations are not available are valued at the mean between the latest available bid and asked prices or, in the case of preferred equity securities that are not listed or traded in the over-the-counter market, by a third party pricing service that will use various techniques that consider factors including, but not limited to, prices or yields of securities with similar characteristics, benchmark yields, broker/dealer quotes, quotes of underlying common stock, issuer spreads, as well as industry and economic events. The daily valuation of exchange-traded foreign securities generally is determined as of the close of trading on the principal exchange on which such securities trade. Events occurring after the close of trading on foreign exchanges may result in adjustments to the valuation of foreign securities to more accurately reflect their fair value as of the close of regular trading on the New York Stock Exchange. When valuing foreign equity securities that meet certain criteria, the Trustees have approved the use of a fair value service that values such securities to reflect market trading that occurs after the close of the applicable foreign markets of comparable securities or other instruments that have a strong correlation to the fair-valued securities. Precious metals are valued at the New York composite mean quotation reported by Bloomberg at the valuation time. Exchange-traded options are valued at the mean between the bid and asked prices at valuation time as reported by the Options Price Reporting Authority for U.S. listed options or by the relevant exchange or board of trade for non-U.S. listed options. Over-the-counter options (including options on securities, indices and foreign currencies) are valued by a third party pricing service using techniques that consider factors including the value of the underlying instrument, the volatility of the underlying instrument and the period of time until option expiration. Financial and commodities futures contracts are valued at the closing settlement price established by the board of trade or exchange on which they are traded. Forward foreign currency exchange contracts are generally valued at the mean of the average bid and average asked prices that are reported by currency dealers to a third party pricing service at the valuation time. Such third party pricing service valuations are supplied for specific settlement periods and the Portfolio’s forward foreign currency exchange contracts are valued at an interpolated rate between the closest preceding and subsequent settlement period reported by the third party pricing service. Forward commodity contracts are generally valued based on the price of the underlying futures or forward contract provided by the exchange on which the underlying instruments are traded or if unavailable, based on forward rates provided by broker/dealers. Interest rate swaps, cross-currency swaps and options on interest rate swaps (“swaptions”) are normally valued using valuations provided by a third party pricing service. Such pricing service valuations are based on the present value of fixed and projected floating rate cash flows over the term of the swap contract. Future cash flows are discounted to their present value using swap rates provided by electronic data services or by broker/dealers. Alternatively, swaptions may be valued at the valuation provided by the counterparty, so determined using the same techniques as those employed by the pricing service. Credit default swaps are normally valued using valuations provided by a third party pricing service. The pricing services employ electronic data processing techniques to determine the present value based on credit spread quotations obtained from broker/dealers and expected default recovery rates determined by the pricing service using proprietary models. Foreign securities and currencies are valued in U.S. dollars, based on foreign currency exchange rate quotations supplied by a third party pricing service. The pricing service uses a proprietary model to determine the exchange rate. Inputs to the model include reported trades and implied bid/ask spreads. Investments for which valuations or market quotations are not readily available or are deemed unreliable are valued at fair value using methods determined in good faith by or at the direction of the Trustees of the Portfolio in a manner that fairly reflects the security’s value, or the amount that the Portfolio might reasonably expect to receive for the security upon its current sale in the ordinary course. Each such determination is based on a consideration of relevant factors, which are likely to vary from one pricing context to another. These factors may include, but are not limited to, the type of security, the
Global Macro Portfolio
October 31, 2012
Notes to Consolidated Financial Statements — continued
existence of any contractual restrictions on the security’s disposition, the price and extent of public trading in similar securities of the issuer or of comparable companies or entities, quotations or relevant information obtained from broker/dealers or other market participants, information obtained from the issuer, analysts, and/or the appropriate stock exchange (for exchange-traded securities), an analysis of the company’s or entity's financial condition, and an evaluation of the forces that influence the issuer and the market(s) in which the security is purchased and sold.
The Portfolio may invest in Eaton Vance Cash Reserves Fund, LLC (Cash Reserves Fund), an affiliated investment company managed by Eaton Vance Management (EVM). Cash Reserves Fund generally values its investment securities utilizing the amortized cost valuation technique in accordance with Rule 2a-7 under the 1940 Act. This technique involves initially valuing a portfolio security at its cost and thereafter assuming a constant amortization to maturity of any discount or premium. If amortized cost is determined not to approximate fair value, Cash Reserves Fund may value its investment securities in the same manner as debt obligations described above.
B Investment Transactions — Investment transactions for financial statement purposes are accounted for on a trade date basis. Realized gains and losses on investments sold are determined on the basis of identified cost.
C Income — Interest income is recorded on the basis of interest accrued, adjusted for amortization of premium or accretion of discount. Inflation adjustments to the principal amount of inflation-adjusted bonds and notes are reflected as interest income. Dividend income is recorded on the ex-dividend date for dividends received in cash and/or securities. However, if the ex-dividend date has passed, certain dividends from foreign securities are recorded as the Portfolio is informed of the ex-dividend date. Withholding taxes on foreign dividends, interest, and capital gains have been provided for in accordance with the Portfolio’s understanding of the applicable countries' tax rules and rates.
D Federal Taxes — The Portfolio has elected to be treated as a partnership for federal tax purposes. No provision is made by the Portfolio for federal or state taxes on any taxable income of the Portfolio because each investor in the Portfolio is ultimately responsible for the payment of any taxes on its share of taxable income. Since at least one of the Portfolio's investors is a regulated investment company that invests all or substantially all of its assets in the Portfolio, the Portfolio normally must satisfy the applicable source of income and diversification requirements (under the Internal Revenue Code) in order for its investors to satisfy them. The Portfolio will allocate, at least annually among its investors, each investor's distributive share of the Portfolio's net investment income, net realized capital gains and any other items of income, gain, loss, deduction or credit.
The Subsidiary is treated as a controlled foreign corporation under the Internal Revenue Code and is not expected to be subject to U.S. federal income tax. The Portfolio is treated as a U.S. shareholder of the Subsidiary. As a result, the Portfolio is required to include in gross income for U.S. federal tax purposes all of the Subsidiary’s income, whether or not such income is distributed by the Subsidiary. If a net loss is realized by the Subsidiary, such loss is not generally available to offset the income earned by the Portfolio.
As of October 31, 2012, the Portfolio had no uncertain tax positions that would require financial statement recognition, de-recognition, or disclosure. The Portfolio files a U.S. federal income tax return annually after its fiscal year-end, which is subject to examination by the Internal Revenue Service for a period of three years from the date of filing.
E Expense Reduction — State Street Bank and Trust Company (SSBT) serves as custodian of the Portfolio. Pursuant to the custodian agreement, SSBT receives a fee reduced by credits, which are determined based on the average daily cash balance the Portfolio maintains with SSBT. All credit balances, if any, used to reduce the Portfolio’s custodian fees are reported as a reduction of expenses in the Consolidated Statement of Operations.
F Foreign Currency Translation — Investment valuations, other assets, and liabilities initially expressed in foreign currencies are translated each business day into U.S. dollars based upon current exchange rates. Purchases and sales of foreign investment securities and income and expenses denominated in foreign currencies are translated into U.S. dollars based upon currency exchange rates in effect on the respective dates of such transactions. Recognized gains or losses on investment transactions attributable to changes in foreign currency exchange rates are recorded for financial statement purposes as net realized gains and losses on investments. That portion of unrealized gains and losses on investments that results from fluctuations in foreign currency exchange rates is not separately disclosed.
G Use of Estimates — The preparation of the consolidated financial statements in conformity with accounting principles generally accepted in the United States of America requires management to make estimates and assumptions that affect the reported amounts of assets and liabilities at the date of the consolidated financial statements and the reported amounts of income and expense during the reporting period. Actual results could differ from those estimates.
H Indemnifications — Under the Portfolio’s organizational documents, its officers and Trustees may be indemnified against certain liabilities and expenses arising out of the performance of their duties to the Portfolio. Under Massachusetts law, if certain conditions prevail, interestholders in the Portfolio could be deemed to have personal liability for the obligations of the Portfolio. However, the Portfolio's Declaration of Trust contains an express disclaimer of liability on the part of Portfolio interestholders and the By-laws provide that the Portfolio shall assume the defense on behalf of any Portfolio interestholder. Moreover, the By-laws also provide for indemnification out of Portfolio property of any interestholder held personally liable solely by reason of being or having been an interestholder for all loss or expense arising from such liability. Additionally, in the normal course of business, the Portfolio enters into agreements with service providers that may contain indemnification clauses. The Portfolio’s maximum exposure under these arrangements is unknown as this would involve future claims that may be made against the Portfolio that have not yet occurred.
Global Macro Portfolio
October 31, 2012
Notes to Consolidated Financial Statements — continued
I Financial and Commodities Futures Contracts — Upon entering into a financial or commodities futures contract, the Portfolio is required to deposit with the broker, either in cash or securities, an amount equal to a certain percentage of the purchase price (initial margin). Subsequent payments, known as variation margin, are made or received by the Portfolio each business day, depending on the daily fluctuations in the value of the underlying security, commodity or currency, and are recorded as unrealized gains or losses by the Portfolio. Gains (losses) are realized upon the expiration or closing of the financial or commodities futures contracts. Should market conditions change unexpectedly, the Portfolio may not achieve the anticipated benefits of the financial or commodities futures contracts and may realize a loss. Futures contracts have minimal counterparty risk as they are exchange traded and the clearinghouse for the exchange is substituted as the counterparty, guaranteeing counterparty performance.
J Forward Foreign Currency Exchange and Forward Commodity Contracts — The Portfolio may enter into forward foreign currency exchange contracts for the purchase or sale of a specific foreign currency at a fixed price on a future date. The forward foreign currency exchange contracts are adjusted by the daily exchange rate of the underlying currency and any gains or losses are recorded as unrealized until such time as the contracts have been closed or offset by another contract with the same broker for the same settlement date and currency. Unrealized and realized gains and losses on forward commodity contracts, which are entered into for the purchase or sale of a specific commodity at a fixed price on a future date, are accounted for as described above. Risks may arise upon entering these contracts from the potential inability of counterparties to meet the terms of their contracts and, in the case of forward foreign currency exchange contracts, from movements in the value of a foreign currency relative to the U.S. dollar.
K Written Options — Upon the writing of a call or a put option, the premium received by the Portfolio is included in the Consolidated Statement of Assets and Liabilities as a liability. The amount of the liability is subsequently marked-to-market to reflect the current market value of the option written, in accordance with the Portfolio’s policies on investment valuations discussed above. Premiums received from writing options which expire are treated as realized gains. Premiums received from writing options which are exercised or are closed are added to or offset against the proceeds or amount paid on the transaction to determine the realized gain or loss. When an index option is exercised, the Portfolio is required to deliver an amount of cash determined by the excess of the strike price of the option over the value of the index (in the case of a put) or the excess of the value of the index over the strike price of the option (in the case of a call) at contract termination. If a put option on a security is exercised, the premium reduces the cost basis of the securities purchased by the Portfolio. The Portfolio, as a writer of an option, may have no control over whether the underlying securities or other assets may be sold (call) or purchased (put) and, as a result, bears the market risk of an unfavorable change in the price of the securities or other assets underlying the written option. The Portfolio may also bear the risk of not being able to enter into a closing transaction if a liquid secondary market does not exist.
L Purchased Options — Upon the purchase of a call or put option, the premium paid by the Portfolio is included in the Consolidated Statement of Assets and Liabilities as an investment. The amount of the investment is subsequently marked-to-market to reflect the current market value of the option purchased, in accordance with the Portfolio’s policies on investment valuations discussed above. As the purchaser of an index option, the Portfolio has the right to receive a cash payment equal to any depreciation in the value of the index below the strike price of the option (in the case of a put) or equal to any appreciation in the value of the index over the strike price of the option (in the case of a call) as of the valuation date of the option. If an option which the Portfolio had purchased expires on the stipulated expiration date, the Portfolio will realize a loss in the amount of the cost of the option. If the Portfolio enters into a closing sale transaction, the Portfolio will realize a gain or loss, depending on whether the sales proceeds from the closing sale transaction are greater or less than the cost of the option. If the Portfolio exercises a put option on a security, it will realize a gain or loss from the sale of the underlying security, and the proceeds from such sale will be decreased by the premium originally paid. If the Portfolio exercises a call option on a security, the cost of the security which the Portfolio purchases upon exercise will be increased by the premium originally paid. The risk associated with purchasing options is limited to the premium originally paid.
M Interest Rate Swaps — Pursuant to interest rate swap agreements, the Portfolio either makes floating-rate payments based on a benchmark interest rate in exchange for fixed-rate payments or the Portfolio makes fixed-rate payments in exchange for payments on a floating benchmark interest rate. Payments received or made are recorded as realized gains or losses. During the term of the outstanding swap agreement, changes in the underlying value of the swap are recorded as unrealized gains or losses. The value of the swap is determined by changes in the relationship between two rates of interest. The Portfolio is exposed to credit loss in the event of non-performance by the swap counterparty. Risk may also arise from movements in interest rates.
N Cross-Currency Swaps — Cross-currency swaps are interest rate swaps in which interest cash flows are exchanged between two parties based on the notional amounts of two different currencies. The notional amounts are typically determined based on the spot exchange rates at the inception of the trade. Cross-currency swaps also involve the exchange of the notional amounts at the start of the contract at the current spot rate with an agreement to re-exchange such amounts at a later date at either the same exchange rate, a specified rate or the then current spot rate. The entire principal value of a cross-currency swap is subject to the risk that the counterparty to the swap will default on its contractual delivery obligations.
O Credit Default Swaps — When the Portfolio is the buyer of a credit default swap contract, the Portfolio is entitled to receive the par (or other agreed-upon) value of a referenced debt obligation (or basket of debt obligations) from the counterparty to the contract if a credit event by a third party, such as a U.S. or foreign corporate issuer or sovereign issuer, on the debt obligation occurs. In return, the Portfolio pays the counterparty a periodic stream of payments over the term of the contract provided that no credit event has occurred. If no credit event occurs, the Portfolio would have spent the stream of payments and received no proceeds from the contract. When the Portfolio is the seller of a credit default swap contract, it receives the stream of payments, but is obligated to pay to the buyer of the protection an amount up to the notional amount of the swap and in certain instances take delivery of securities of the reference entity upon the occurrence of a credit event, as defined under the terms of that particular swap agreement. Credit events are contract specific but may include bankruptcy, failure to pay, restructuring, obligation acceleration and repudiation/moratorium. If the Portfolio is a seller of protection and a credit event occurs, the maximum potential amount of future payments that the Portfolio could be required to make would be an amount equal to the notional amount of the agreement. This potential amount would be partially offset by any recovery value of the respective referenced obligation, or net amount received from the settlement of a buy protection credit default swap
Global Macro Portfolio
October 31, 2012
Notes to Consolidated Financial Statements — continued
agreement entered into by the Portfolio for the same referenced obligation. As the seller, the Portfolio may create economic leverage to its portfolio because, in addition to its total net assets, the Portfolio is subject to investment exposure on the notional amount of the swap. The interest fee paid or received on the swap contract, which is based on a specified interest rate on a fixed notional amount, is accrued daily as a component of unrealized appreciation (depreciation) and is recorded as realized gain upon receipt or realized loss upon payment. The Portfolio also records an increase or decrease to unrealized appreciation (depreciation) in an amount equal to the daily valuation. Upfront payments or receipts, if any, are recorded as other assets or other liabilities, respectively, and amortized over the life of the swap contract as realized gains or losses. For financial reporting purposes, unamortized upfront payments, if any, are netted with unrealized appreciation or depreciation on swap contracts to determine the market value of swaps as presented in Notes 5 and 9. The Portfolio segregates assets in the form of cash or liquid securities in an amount equal to the notional amount of the credit default swaps of which it is the seller. The Portfolio segregates assets in the form of cash or liquid securities in an amount equal to any unrealized depreciation of the credit default swaps of which it is the buyer, marked to market on a daily basis. These transactions involve certain risks, including the risk that the seller may be unable to fulfill the transaction.
P Swaptions — A purchased swaption contract grants the Portfolio, in return for payment of the purchase price, the right, but not the obligation, to enter into an interest rate swap, at preset terms, with the seller on the expiration date of the contract. The Portfolio pays a premium to the writer, which is recorded as an investment and subsequently marked to market to reflect the current value of the swaption. Premiums paid for swaptions that expire are treated as realized losses. Premiums paid for swaptions that are exercised or closed are added to the amounts paid or offset against the proceeds on the underlying swap transaction to determine the realized gain or loss. The writer of the swaption bears the risk of unfavorable changes in the preset rate of the underlying interest rate swap. The Portfolio’s risk is limited to the premium paid.
Q Repurchase Agreements — A repurchase agreement is the purchase by the Portfolio of securities from a counterparty in exchange for cash that is coupled with an agreement to resell those securities to the counterparty at a specified date and price. When a repurchase agreement is entered, the Portfolio typically receives securities with a value that equals or exceeds the repurchase price, including any accrued interest earned on the agreement. The value of such securities will be marked to market daily, and cash or additional securities will be exchanged between the parties as needed. Except in the case of a repurchase agreement entered to settle a short sale, the value of the securities delivered to the Portfolio will be at least equal to 90% of the repurchase price during the term of the repurchase agreement. The terms of a repurchase agreement entered to settle a short sale may provide that the cash purchase price paid by the Portfolio is more than the value of purchased securities that effectively collateralize the repurchase price payable by the counterparty. Since in such a transaction, the Portfolio normally will have used the purchased securities to settle the short sale, the Portfolio will segregate liquid assets equal to the marked to market value of the purchased securities that it is obligated to return to the counterparty under the repurchase agreement. In the event of insolvency of the counterparty to a repurchase agreement, recovery of the repurchase price owed to the Portfolio may be delayed. Such an insolvency also may result in a loss to the extent that the value of the purchased securities decreases during the delay or that value has otherwise not been maintained at an amount at least equal to the repurchase price.
R Securities Sold Short — A short sale is a transaction in which the Portfolio sells a security it does not own in anticipation of a decline in the market value of that security. To complete such a transaction, the Portfolio must borrow the security to make delivery to the buyer with an obligation to replace such borrowed security at a later date. Until the security is replaced, the Portfolio is required to repay the lender any dividends or interest, which accrue during the period of the loan. The proceeds received from a short sale are recorded as a liability and the Portfolio records an unrealized gain or loss to the extent of the difference between the proceeds received and the value of the open short position on the day of determination. A gain, limited to the price at which the Portfolio sold the security short, or a loss, potentially unlimited as there is no upward limit on the price of a security, is recorded when the short position is terminated. Interest and dividends payable on securities sold short are recorded as an expense.
S Reverse Repurchase Agreements — Under a reverse repurchase agreement, the Portfolio temporarily transfers possession of a portfolio security to another party, such as a bank or broker/dealer, in return for cash. At the same time, the Portfolio agrees to repurchase the security at an agreed upon time and price, which reflects an interest payment. Because the Portfolio retains effective control over the transferred security, the transaction is accounted for as a secured borrowing. The Portfolio may enter into such agreements when it is able to invest the cash acquired at a rate higher than the cost of the agreement, which would increase earned income. When the Portfolio enters into a reverse repurchase agreement, any fluctuations in the market value of either the securities transferred to another party or the securities in which the proceeds may be invested would affect the market value of the Portfolio’s assets. Because reverse repurchase agreements may be considered to be the practical equivalent of borrowing funds, they constitute a form of leverage. The Portfolio segregates cash or liquid assets equal to its obligation to repurchase the security during the term of the agreement. In the event the counterparty to a reverse repurchase agreement becomes insolvent, recovery of the security transferred by the Portfolio may be delayed or the Portfolio may incur a loss equal to the amount by which the value of the security transferred by the Portfolio exceeds the repurchase price payable by the Fund.
2 Investment Adviser Fee and Other Transactions with Affiliates
The investment adviser fee is earned by Boston Management and Research (BMR), a subsidiary of EVM, as compensation for investment advisory services rendered to the Portfolio and the Subsidiary. Pursuant to the investment advisory agreement between the Portfolio and BMR and the investment advisory agreement between the Subsidiary and BMR, the Portfolio and Subsidiary each pay BMR a fee at an annual rate of 0.615% of its respective average daily net assets up to $500 million, 0.595% from $500 million but less than $1 billion, 0.575% from $1 billion but less than $1.5 billion, 0.555% from $1.5 billion but less than $2 billion, 0.520% from $2 billion but less than $3 billion, and 0.490% of average daily net assets of $3 billion or more, and is payable monthly. In determining the investment adviser fee for the Portfolio and Subsidiary, the applicable advisory fee rate is based on the average daily net assets of the Portfolio (inclusive of its interest in the Subsidiary). Such fee rate is then assessed separately on the Portfolio's average daily net assets (exclusive of its interest in the Subsidiary) and the Subsidiary's average daily net assets to determine the amount of the investment adviser fee. The Portfolio
Global Macro Portfolio
October 31, 2012
Notes to Consolidated Financial Statements — continued
invests its cash in Cash Reserves Fund. EVM does not currently receive a fee for advisory services provided to Cash Reserves Fund. For the year ended October 31, 2012, the Portfolio’s investment adviser fee amounted to $39,782,114 or 0.52% of the Portfolio's consolidated average daily net assets.
Trustees and officers of the Portfolio who are members of EVM's or BMR's organizations receive remuneration for their services to the Portfolio out of the investment adviser fee. Trustees of the Portfolio who are not affiliated with the investment adviser may elect to defer receipt of all or a percentage of their annual fees in accordance with the terms of the Trustees Deferred Compensation Plan. For the year ended October 31, 2012, no significant amounts have been deferred. Certain officers and Trustees of the Portfolio are officers of the above organizations.
3 Purchases and Sales of Investments
Purchases and sales of investments, other than short-term obligations and including maturities, paydowns and securities sold short, for the year ended October 31, 2012 were as follows:
| | | | | | | | |
| | | Purchases | | | Sales | |
| | |
Investments (non-U.S. Government) | | $ | 1,954,260,461 | | | $ | 1,436,068,150 | |
U.S. Government and Agency Securities | | | 891,000,556 | | | | 430,509,091 | |
| | |
| | | $ | 2,845,261,017 | | | $ | 1,866,577,241 | |
4 Federal Income Tax Basis of Investments
The cost and unrealized appreciation (depreciation) of investments of the Portfolio at October 31, 2012, as determined on a federal income tax basis, were as follows:
| | | | |
| |
Aggregate cost | | $ | 7,627,859,664 | |
| |
Gross unrealized appreciation | | $ | 274,340,474 | |
Gross unrealized depreciation | | | (106,314,251 | ) |
| |
Net unrealized appreciation | | $ | 168,026,223 | |
The net unrealized depreciation on written options, securities sold short, futures contracts, swap contracts, forward commodity contracts, foreign currency and forward foreign currency exchange contracts at October 31, 2012 on a federal income tax basis was $38,386,696.
5 Financial Instruments
The Portfolio may trade in financial instruments with off-balance sheet risk in the normal course of its investing activities. These financial instruments may include written options, forward commodity contracts, forward foreign currency exchange contracts, futures contracts and swap contracts and may involve, to a varying degree, elements of risk in excess of the amounts recognized for financial statement purposes. The notional or contractual amounts of these instruments represent the investment the Portfolio has in particular classes of financial instruments and do not necessarily represent the amounts potentially subject to risk. The measurement of the risks associated with these instruments is meaningful only when all related and offsetting transactions are considered.
A summary of obligations under these financial instruments at October 31, 2012 is as follows:
| | | | | | | | | | |
| Forward Commodity Contracts(1) | |
| | | | |
| | | | | | | | | | |
Sales | |
| Settlement Date | | Deliver | | In Exchange For | | Counterparty | | Net Unrealized
Depreciation | |
| | | | |
| 12/27/12 | | Gold
99,393
Troy Ounces | | United States Dollar
163,352,864 | | Citibank NA | | $ | (7,850,531 | ) |
| 12/27/12 | | Gold
29,799
Troy Ounces | | United States Dollar
49,690,762 | | Merrill Lynch International | | | (1,638,211 | ) |
| | | | |
| | | | | | | | | $ | (9,488,742 | ) |
| (1) | Non-deliverable contracts that are settled with the counterparty in cash. |
Global Macro Portfolio
October 31, 2012
Notes to Consolidated Financial Statements — continued
| | | | | | | | | | |
| Forward Foreign Currency Exchange Contracts | |
| | | | |
| | | | | | | | | | |
Sales | | | | | | | | | |
| Settlement Date | | Deliver | | In Exchange For | | Counterparty | | Net Unrealized
Appreciation
(Depreciation) | |
| | | | | | | | | | |
| | | | |
| 11/5/12 | | New Taiwan Dollar
1,031,496,000 | | United States Dollar
34,469,373 | | Australia and New Zealand Banking
Group Limited | | $ | (846,274 | ) |
| 11/5/12 | | New Taiwan Dollar
770,148,000 | | United States Dollar
25,735,940 | | Citibank NA | | | (631,855 | ) |
| 11/5/12 | | New Taiwan Dollar
864,244,000 | | United States Dollar
28,880,334 | | JPMorgan Chase Bank | | | (709,054 | ) |
| 11/5/12 | | New Taiwan Dollar
999,800,000 | | United States Dollar
33,409,076 | | Nomura International PLC | | | (821,386 | ) |
| 11/7/12 | | New Turkish Lira
104,378,599 | | United States Dollar
56,440,974 | | Barclays Bank PLC | | | (1,744,361 | ) |
| 11/7/12 | | New Turkish Lira
50,000,000 | | United States Dollar
25,477,707 | | JPMorgan Chase Bank | | | (2,394,546 | ) |
| 11/7/12 | | Philippine Peso
74,052,000 | | United States Dollar
1,793,504 | | Standard Chartered Bank | | | (4,151 | ) |
| 11/8/12 | | Chilean Peso
1,984,800,000 | | United States Dollar
4,176,240 | | Bank of Nova Scotia | | | 52,323 | |
| 11/8/12 | | Euro
2,368,000 | | United States Dollar
3,265,657 | | JPMorgan Chase Bank | | | 196,215 | |
| 11/8/12 | | Serbian Dinar
102,425,000 | | Euro
917,376 | | Citibank NA | | | 21,842 | |
| 11/8/12 | | Serbian Dinar
74,149,000 | | Euro
648,156 | | Citibank NA | | | (4,881 | ) |
| 11/8/12 | | Serbian Dinar
570,400,000 | | Euro
5,000,000 | | Citibank NA | | | (19,419 | ) |
| 11/8/12 | | Serbian Dinar
96,955,000 | | Euro
848,993 | | Deutsche Bank | | | (4,458 | ) |
| 11/8/12 | | South African Rand
396,504,559 | | United States Dollar
47,778,541 | | Standard Bank | | | 2,088,453 | |
| 11/8/12 | | South African Rand
883,228,210 | | United States Dollar
106,487,450 | | Standard Chartered Bank | | | 4,711,129 | |
| 11/13/12 | | Polish Zloty
106,955,461 | | Euro
26,019,111 | | Barclays Bank PLC | | | 259,786 | |
| 11/15/12 | | Euro
7,010,000 | | United States Dollar
9,513,832 | | Goldman Sachs International | | | 426,796 | |
| 11/15/12 | | Japanese Yen
13,029,000,000 | | United States Dollar
166,440,981 | | Goldman Sachs International | | | 3,214,941 | |
| 11/16/12 | | New Taiwan Dollar
1,200,760,000 | | United States Dollar
40,116,264 | | BNP Paribas SA | | | (1,018,265 | ) |
| 11/16/12 | | New Taiwan Dollar
1,086,403,000 | | United States Dollar
36,289,642 | | JPMorgan Chase Bank | | | (927,350 | ) |
| 11/16/12 | | New Taiwan Dollar
1,153,169,000 | | United States Dollar
38,519,858 | | Nomura International PLC | | | (984,341 | ) |
| 11/19/12 | | Euro
61,070,000 | | United States Dollar
80,193,460 | | Goldman Sachs International | | | 1,025,896 | |
| 11/19/12 | | Singapore Dollar
39,752,000 | | United States Dollar
32,294,019 | | Goldman Sachs International | | | (294,344 | ) |
Global Macro Portfolio
October 31, 2012
Notes to Consolidated Financial Statements — continued
| | | | | | | | | | |
| Forward Foreign Currency Exchange Contracts (continued) | |
| | | | |
| | | | | | | | | | |
Sales | | | | | | | | | |
| Settlement Date | | Deliver | | In Exchange For | | Counterparty | | Net Unrealized
Appreciation
(Depreciation) | |
| | | | | | | | | | |
| | | | |
| 11/20/12 | | Euro
140,997,465 | | United States Dollar
173,568,744 | | Australia and New Zealand Banking
Group Limited | | $ | (9,213,687 | ) |
| 11/20/12 | | Euro
98,224,614 | | United States Dollar
121,498,473 | | Bank of America | | | (5,835,261 | ) |
| 11/20/12 | | Euro
202,820,027 | | United States Dollar
249,230,320 | | Goldman Sachs International | | | (13,695,950 | ) |
| 11/22/12 | | Serbian Dinar
481,500,000 | | Euro
4,220,722 | | Citibank NA | | | 4,196 | |
| 11/22/12 | | Serbian Dinar
328,170,000 | | Euro
2,872,888 | | Citibank NA | | | (2,037 | ) |
| 11/22/12 | | Serbian Dinar
575,000,000 | | Euro
5,000,000 | | Deutsche Bank | | | (47,262 | ) |
| 11/23/12 | | Euro
3,672,000 | | United States Dollar
4,989,918 | | Credit Suisse International | | | 229,586 | |
| 11/28/12 | | British Pound Sterling
2,834,615 | | United States Dollar
4,496,579 | | State Street Bank and Trust Co. | | | (77,375 | ) |
| 11/29/12 | | Euro
9,109,000 | | United States Dollar
12,222,456 | | Standard Chartered Bank | | | 413,055 | |
| 11/29/12 | | Malaysian Ringgit
38,170,000 | | United States Dollar
12,370,766 | | Goldman Sachs International | | | (137,175 | ) |
| 12/3/12 | | New Zealand Dollar
116,495,864 | | United States Dollar
96,244,806 | | Australia and New Zealand Banking
Group Limited | | | 627,306 | |
| 12/3/12 | | New Zealand Dollar
392,136,985 | | United States Dollar
324,356,107 | | Goldman Sachs International | | | 2,497,831 | |
| 12/4/12 | | Brazilian Real
262,589,000 | | United States Dollar
128,663,335 | | BNP Paribas SA | | | (106,104 | ) |
| 12/7/12 | | New Taiwan Dollar
480,127,000 | | United States Dollar
16,106,240 | | Barclays Bank PLC | | | (358,456 | ) |
| 12/7/12 | | New Taiwan Dollar
530,693,000 | | United States Dollar
17,805,502 | | Nomura International PLC | | | (393,222 | ) |
| 12/10/12 | | Euro
142,410,331 | | United States Dollar
185,560,662 | | Deutsche Bank | | | 909,807 | |
| 12/11/12 | | Euro
17,956,785 | | United States Dollar
22,934,047 | | Deutsche Bank | | | (349,212 | ) |
| 12/11/12 | | Euro
262,281,615 | | United States Dollar
334,975,587 | | Goldman Sachs International | | | (5,105,932 | ) |
| 12/17/12 | | Australian Dollar
204,764,000 | | United States Dollar
208,860,304 | | Deutsche Bank | | | (2,926,027 | ) |
| 12/24/12 | | New Taiwan Dollar
1,040,866,200 | | United States Dollar
35,574,223 | | Australia and New Zealand Banking Group Limited | | | (140,373 | ) |
| 12/24/12 | | New Taiwan Dollar
1,301,082,750 | | United States Dollar
44,463,220 | | Citibank NA | | | (180,025 | ) |
| 12/24/12 | | New Taiwan Dollar
1,127,605,050 | | United States Dollar
38,534,791 | | Nomura International PLC | | | (156,022 | ) |
| 1/18/13 | | Sri Lankan Rupee
1,483,200,000 | | United States Dollar
12,360,000 | | HSBC Bank USA | | | 1,227,524 | |
Global Macro Portfolio
October 31, 2012
Notes to Consolidated Financial Statements — continued
| | | | | | | | | | |
| Forward Foreign Currency Exchange Contracts (continued) | |
| | | | |
| | | | | | | | | | |
Sales | | | | | | | | | |
| Settlement Date | | Deliver | | In Exchange For | | Counterparty | | Net Unrealized
Appreciation
(Depreciation) | |
| | | | | | | | | | |
| | | | |
| 1/24/13 | | Euro
7,340,000 | | United States Dollar
9,577,966 | | Standard Chartered Bank | | $ | 56,229 | |
| 1/25/13 | | Ugandan Shilling
16,770,000,000 | | United States Dollar
6,271,503 | | Citibank NA | | | 1,729 | |
| 1/31/13 | | Euro
3,436,000 | | United States Dollar
4,523,425 | | State Street Bank and Trust Co. | | | 65,827 | |
| 2/1/13 | | Sri Lankan Rupee
5,000,000,000 | | United States Dollar
39,984,006 | | HSBC Bank USA | | | 2,598,288 | |
| 2/7/13 | | Euro
3,637,000 | | United States Dollar
4,831,991 | | Standard Chartered Bank | | | 113,326 | |
| 2/15/13 | | Sri Lankan Rupee
659,700,000 | | United States Dollar
5,229,489 | | Standard Chartered Bank | | | 315,228 | |
| 2/22/13 | | Sri Lankan Rupee
1,827,000,000 | | United States Dollar
14,517,282 | | Standard Chartered Bank | | | 932,769 | |
| 2/28/13 | | Euro
6,953,000 | | United States Dollar
9,312,327 | | Standard Chartered Bank | | | 289,685 | |
| 3/7/13 | | Euro
5,000,000 | | United States Dollar
6,574,900 | | State Street Bank and Trust Co. | | | 86,165 | |
| 3/8/13 | | Sri Lankan Rupee
1,422,520,000 | | United States Dollar 10,980,471 | | HSBC Bank USA | | | 442,523 | |
| 3/14/13 | | Euro
7,111,000 | | United States Dollar
9,302,112 | | Deutsche Bank | | | 73,228 | |
| 3/28/13 | | Euro
7,396,000 | | United States Dollar
9,897,105 | | JPMorgan Chase Bank | | | 297,077 | |
| 4/4/13 | | Euro
7,050,000 | | United States Dollar
9,426,449 | | Barclays Bank PLC | | | 274,928 | |
| | | | |
| | | | | | | | | $ | (25,675,117 | ) |
| | | | | | | | | | |
| Forward Foreign Currency Exchange Contracts | |
| | | | |
| | | | | | | | | | |
Purchases | |
| | | | |
| | | | | | | | | | |
| Settlement Date | | In Exchange For | | Deliver | | Counterparty | | Net Unrealized
Appreciation
(Depreciation) | |
| | | | | | | | | | |
| | | | |
| 11/7/12 | | New Turkish Lira
82,014,038 | | United States Dollar
44,512,368 | | Deutsche Bank | | $ | 1,205,952 | |
| 11/9/12 | | Peruvian New Sol
58,175,650 | | United States Dollar
22,381,276 | | Standard Chartered Bank | | | 63,120 | |
| 11/13/12 | | Polish Zloty
205,774,000 | | Euro
50,060,577 | | JPMorgan Chase Bank | | | (502,175 | ) |
| 11/13/12 | | South Korean Won
50,569,365,000 | | United States Dollar
44,435,100 | | HSBC Bank USA | | | 1,909,164 | |
| 11/13/12 | | South Korean Won
23,662,735,000 | | United States Dollar
20,792,351 | | Nomura International PLC | | | 893,348 | |
Global Macro Portfolio
October 31, 2012
Notes to Consolidated Financial Statements — continued
| | | | | | | | | | |
| Forward Foreign Currency Exchange Contracts (continued) | |
| | | | |
| | | | | | | | | | |
Purchases | |
| Settlement Date | | In Exchange For | | Deliver | | Counterparty | | Net Unrealized
Appreciation
(Depreciation) | |
| | | | | | | | | | |
| | | | |
| 11/15/12 | | Indian Rupee
1,355,196,000 | | United States Dollar
24,238,884 | | Goldman Sachs International | | $ | 886,381 | |
| 11/15/12 | | Indian Rupee
1,656,349,000 | | United States Dollar
29,619,975 | | Standard Chartered Bank | | | 1,088,651 | |
| 11/15/12 | | Yuan Offshore Renminbi
273,697,000 | | United States Dollar
43,368,246 | | Australia and New Zealand Banking Group Limited | | | 440,967 | |
| 11/15/12 | | Yuan Offshore Renminbi
275,663,000 | | United States Dollar
43,679,765 | | Bank of America | | | 444,135 | |
| 11/15/12 | | Yuan Offshore Renminbi
310,852,000 | | United States Dollar
49,254,025 | | Deutsche Bank | | | 502,391 | |
| 11/19/12 | | Hong Kong Dollar
563,043,463 | | United States Dollar
72,636,711 | | Goldman Sachs International | | | 15,903 | |
| 11/19/12 | | Indian Rupee
1,814,497,000 | | United States Dollar
34,588,201 | | Deutsche Bank | | | (974,858 | ) |
| 11/19/12 | | Indian Rupee
764,508,000 | | United States Dollar
14,573,161 | | Standard Chartered Bank | | | (410,740 | ) |
| 11/19/12 | | Philippine Peso
990,188,000 | | United States Dollar
23,929,723 | | Australia and New Zealand Banking Group Limited | | | 117,001 | |
| 11/19/12 | | Singapore Dollar
218,540,000 | | United States Dollar
177,758,618 | | Standard Chartered Bank | | | 1,398,678 | |
| 11/19/12 | | Yuan Offshore Renminbi
173,486,000 | | United States Dollar
27,611,969 | | Goldman Sachs International | | | 148,836 | |
| 11/19/12 | | Yuan Offshore Renminbi
191,748,000 | | United States Dollar
30,506,404 | | Standard Chartered Bank | | | 176,642 | |
| 11/20/12 | | Indian Rupee
2,226,400,000 | | United States Dollar
41,145,814 | | Deutsche Bank | | | 89,604 | |
| 11/20/12 | | Indian Rupee
1,655,726,000 | | United States Dollar
30,593,607 | | Goldman Sachs International | | | 72,291 | |
| 11/20/12 | | Yuan Offshore Renminbi
233,189,000 | | United States Dollar
37,099,515 | | Bank of America | | | 212,073 | |
| 11/20/12 | | Yuan Offshore Renminbi
222,084,000 | | United States Dollar
35,332,750 | | Barclays Bank PLC | | | 201,974 | |
| 11/20/12 | | Yuan Offshore Renminbi
226,974,000 | | United States Dollar
36,090,634 | | Citibank NA | | | 226,518 | |
| 11/21/12 | | South Korean Won 54,985,558,000 | | United States Dollar 48,537,369 | | Standard Chartered Bank | | | 1,835,051 | |
| 11/26/12 | | Swedish Krona 412,556,000 | | Euro
48,441,966 | | Barclays Bank PLC | | | (646,461 | ) |
| 11/26/12 | | Swedish Krona 140,300,000 | | Euro
16,475,064 | | Credit Suisse International | | | (221,350 | ) |
| 11/26/12 | | Swedish Krona 412,555,500 | | Euro
48,442,476 | | Deutsche Bank | | | (647,198 | ) |
| 11/27/12 | | Polish Zloty
266,423,945 | | Euro
64,604,851 | | HSBC Bank USA | | | (528,374 | ) |
| 11/29/12 | | South Korean Won
54,982,008,000 | | United States Dollar 49,616,034 | | Standard Chartered Bank | | | 734,088 | |
Global Macro Portfolio
October 31, 2012
Notes to Consolidated Financial Statements — continued
| | | | | | | | | | |
| Forward Foreign Currency Exchange Contracts (continued) | |
| | | | |
| | | | | | | | | | |
Purchases | |
| Settlement Date | | In Exchange For | | Deliver | | Counterparty | | Net Unrealized
Appreciation
(Depreciation) | |
| | | | | | | | | | |
| | | | |
| 12/3/12 | | Georgian Lari
1,704,400 | | United States Dollar
1,000,000 | | Liberty Bank | | $ | 23,861 | |
| 12/10/12 | | South African Rand
43,450,431 | | United States Dollar
5,079,493 | | Credit Suisse International | | | (96,211 | ) |
| 12/10/12 | | South African Rand
8,000,000 | | United States Dollar
930,406 | | Deutsche Bank | | | (12,895 | ) |
| 12/14/12 | | Hungarian Forint
888,740,995 | | United States Dollar
3,733,422 | | Goldman Sachs International | | | 310,746 | |
| 12/14/12 | | Hungarian Forint
380,467,510 | | United States Dollar
1,658,605 | | Goldman Sachs International | | | 72,691 | |
| 12/17/12 | | South Korean Won
43,744,714,000 | | United States Dollar
39,217,100 | | Deutsche Bank | | | 806,610 | |
| 12/17/12 | | South Korean Won
9,971,177,650 | | United States Dollar
8,939,153 | | Goldman Sachs International | | | 183,859 | |
| 12/17/12 | | South Korean Won
18,462,042,350 | | United States Dollar
16,547,497 | | Standard Chartered Bank | | | 344,131 | |
| 1/14/13 | | Indian Rupee
982,902,000 | | United States Dollar
18,327,466 | | Deutsche Bank | | | (291,965 | ) |
| 1/14/13 | | Indian Rupee
1,007,965,000 | | United States Dollar
18,798,303 | | Goldman Sachs International | | | (302,915 | ) |
| 1/29/13 | | Indian Rupee
927,500,000 | | United States Dollar
17,033,976 | | Citibank NA | | | (53,299 | ) |
| 1/29/13 | | Indian Rupee
995,000,000 | | United States Dollar
18,277,002 | | Deutsche Bank | | | (60,535 | ) |
| 1/30/13 | | Yuan Renminbi
213,912,413 | | United States Dollar
33,970,528 | | BNP Paribas SA | | | (5,639 | ) |
| 1/30/13 | | Yuan Renminbi
179,341,650 | | United States Dollar
28,485,014 | | Citibank NA | | | (9,251 | ) |
| 1/30/13 | | Yuan Renminbi
192,889,000 | | United States Dollar
30,631,888 | | Standard Chartered Bank | | | (5,085 | ) |
| 1/31/13 | | Norwegian Krone
454,683,037 | | Euro
60,772,284 | | Barclays Bank PLC | | | 648,792 | |
| 1/31/13 | | Norwegian Krone
454,683,038 | | Euro
60,785,690 | | Deutsche Bank | | | 631,401 | |
| 1/31/13 | | Peruvian New Sol
131,177,650 | | United States Dollar
50,230,768 | | Deutsche Bank | | | 141,966 | |
| 2/19/13 | | Indian Rupee
1,209,523,000 | | United States Dollar
22,519,512 | | Bank of America | | | (446,952 | ) |
| 2/19/13 | | Indian Rupee
1,683,415,000 | | United States Dollar
31,348,510 | | Citibank NA | | | (627,905 | ) |
| 2/28/13 | | Georgian Lari
1,700,900 | | United States Dollar
1,000,000 | | Liberty Bank | | | 13,445 | |
| 5/31/13 | | Georgian Lari
1,671,400 | | United States Dollar
1,000,000 | | Liberty Bank | | | (10,719 | ) |
| 9/3/13 | | Georgian Lari
1,697,200 | | United States Dollar 1,000,000 | | Liberty Bank | | | (1,376 | ) |
| |
| | | $ | 9,984,367 | |
Global Macro Portfolio
October 31, 2012
Notes to Consolidated Financial Statements — continued
| | | | | | | | | | | | | | | | |
| Futures Contracts | |
Expiration
Month/Year | | Contracts | | Position | | Aggregate Cost | | | Value | | | Net Unrealized
Appreciation
(Depreciation) | |
| | | | | |
| 11/12 | | 599
CAC 40 Index | | Short | | $ | (27,270,821 | ) | | $ | (26,591,477 | ) | | $ | 679,344 | |
| 11/12 | | 1,896
Hang Seng H-Shares | | Long | | | 129,884,726 | | | | 129,747,561 | | | | (137,165 | ) |
| 12/12 | | 741
Dow Jones Euro Stoxx 50 Index | | Short | | | (24,347,323 | ) | | | (24,049,585 | ) | | | 297,738 | |
| 12/12 | | 2,453
Euro-Bobl | | Short | | | (399,437,334 | ) | | | (400,070,757 | ) | | | (633,423 | ) |
| 12/12 | | 17
Euro-Bund | | Short | | | (3,076,417 | ) | | | (3,121,854 | ) | | | (45,437 | ) |
| 12/12 | | 169
Euro-Schatz | | Short | | | (24,268,466 | ) | | | (24,248,752 | ) | | | 19,714 | |
| 12/12 | | 389
Gold | | Short | | | (61,493,120 | ) | | | (66,872,990 | ) | | | (5,379,870 | ) |
| 12/12 | | 144
Japan 10-Year Bond | | Short | | | (259,580,568 | ) | | | (260,202,932 | ) | | | (622,364 | ) |
| 12/12 | | 2,844
U.S. 5-Year Treasury Note | | Short | | | (353,078,155 | ) | | | (353,367,000 | ) | | | (288,845 | ) |
| 12/12 | | 3,511
U.S. 10-Year Treasury Note | | Short | | | (466,469,266 | ) | | | (467,072,719 | ) | | | (603,453 | ) |
| 12/12 | | 1,518
U.S. 30-Year Treasury Bond | | Short | | | (227,750,967 | ) | | | (226,656,375 | ) | | | 1,094,592 | |
| 1/13 | | 1,072
Platinum | | Long | | | 89,323,572 | | | | 84,527,200 | | | | (4,796,372 | ) |
| | | | | |
| | | | | | | | | | | | | | | $ | (10,415,541 | ) |
CAC 40 Index: Cotation Assistée en Continu Index comprised of the 40 largest companies listed on the Paris Bourse Exchange.
Dow Jones Euro Stoxx 50 Index: Market capitalization-weighted stock index of 50 large, blue-chip European companies operating within eurozone nations.
Euro-Bobl: Medium-term debt securities issued by the Federal Republic of Germany with a term to maturity of 4.5 to 5 years.
Euro-Bund: Long-term debt securities issued by the Federal Republic of Germany with a term to maturity of 8.5 to 10.5 years.
Euro-Schatz: Short-term debt securities issued by the Federal Republic of Germany with a term to maturity of 1.75 to 2.25 years.
Hang Seng H-Shares: Hang Seng China Enterprises Index comprised of H-Shares listed on the Hong Kong Stock Exchange.
Japan 10-Year Bond: Japanese Government Bonds (JGB) having a maturity of 7 years or more but less than 11 years.
| | | | | | | | | | | | | | | | |
| Interest Rate Swaps | |
| Counterparty | | Notional Amount
(000's omitted) | | Portfolio
Pays/Receives
Floating Rate | | Floating Rate Index | | Annual
Fixed Rate | | Termination
Date | | | Net Unrealized
Appreciation
(Depreciation) | |
| | | | | | |
| Bank of America | | HUF 589,390 | | Receives | | 6-month HUF BUBOR | | 7.32% | | | 12/16/16 | | | $ | (222,438 | ) |
| Bank of America | | HUF 1,166,000 | | Pays | | 6-month HUF BUBOR | | 6.99 | | | 12/19/16 | | | | 272,273 | |
| Bank of America | | HUF 1,166,000 | | Receives | | 6-month HUF BUBOR | | 7.29 | | | 12/19/16 | | | | (439,115 | ) |
| Bank of America | | HUF 1,018,000 | | Pays | | 6-month HUF BUBOR | | 6.97 | | | 12/20/16 | | | | 179,013 | |
| Bank of America | | HUF 1,018,000 | | Receives | | 6-month HUF BUBOR | | 7.34 | | | 12/20/16 | | | | (393,504 | ) |
Global Macro Portfolio
October 31, 2012
Notes to Consolidated Financial Statements — continued
| | | | | | | | | | | | | | | | |
| Interest Rate Swaps (continued) | |
| Counterparty | | Notional Amount
(000's omitted) | | Portfolio
Pays/Receives
Floating Rate | | Floating Rate Index | | Annual
Fixed Rate | | Termination
Date | | | Net Unrealized
Appreciation
(Depreciation) | |
| | | | | | |
| Bank of America | | HUF 1,345,000 | | Pays | | 6-month HUF BUBOR | | 6.91% | | | 12/21/16 | | | $ | 229,425 | |
| Bank of America | | HUF 1,345,000 | | Receives | | 6-month HUF BUBOR | | 7.37 | | | 12/21/16 | | | | (528,397 | ) |
| Bank of America | | HUF 406,800 | | Receives | | 6-month HUF BUBOR | | 7.32 | | | 12/22/16 | | | | (155,570 | ) |
| Bank of America | | HUF 867,000 | | Receives | | 6-month HUF BUBOR | | 7.93 | | | 1/10/17 | | | | (439,208 | ) |
| Bank of America | | HUF 2,415,000 | | Pays | | 6-month HUF BUBOR | | 6.95 | | | 1/17/17 | | | | 488,548 | |
| Bank of America | | HUF 2,415,000 | | Receives | | 6-month HUF BUBOR | | 7.91 | | | 1/17/17 | | | | (1,214,936 | ) |
| Bank of America | | NZD 27,793 | | Pays | | 3-month NZD Bank Bill | | 3.78 | | | 10/30/22 | | | | 176,081 | |
| Bank of America | | PLN 31,619 | | Pays | | 6-month PLN WIBOR | | 4.34 | | | 7/30/17 | | | | 35,090 | |
| Bank of America | | PLN 30,671 | | Pays | | 6-month PLN WIBOR | | 4.31 | | | 8/10/17 | | | | 24,670 | |
| Bank of America | | PLN 59,500 | | Pays | | 6-month PLN WIBOR | | 4.35 | | | 8/23/17 | | | | 84,896 | |
| Bank of America | | PLN 23,960 | | Pays | | 6-month PLN WIBOR | | 4.30 | | | 9/18/17 | | | | 25,439 | |
| Barclays Bank PLC | | PLN 132,540 | | Pays | | 6-month PLN WIBOR | | 4.43 | | | 7/27/17 | | | | 312,826 | |
| Barclays Bank PLC | | PLN 66,483 | | Pays | | 6-month PLN WIBOR | | 4.32 | | | 8/2/17 | | | | 56,476 | |
| Barclays Bank PLC | | PLN 28,300 | | Pays | | 6-month PLN WIBOR | | 4.35 | | | 8/27/17 | | | | 40,855 | |
| BNP Paribas SA | | PLN 69,044 | | Pays | | 6-month PLN WIBOR | | 4.25 | | | 8/7/17 | | | | (7,672 | ) |
| Citibank NA | | NZD 32,614 | | Pays | | 3-month NZD Bank Bill | | 3.78 | | | 10/30/22 | | | | 206,621 | |
| Citibank NA | | PLN 60,754 | | Pays | | 6-month PLN WIBOR | | 4.33 | | | 7/30/17 | | | | 65,304 | |
| Citibank NA | | PLN 41,457 | | Pays | | 6-month PLN WIBOR | | 4.31 | | | 8/2/17 | | | | 32,317 | |
| Citibank NA | | PLN 9,684 | | Pays | | 6-month PLN WIBOR | | 4.24 | | | 8/7/17 | | | | (1,752 | ) |
| Citibank NA | | PLN 29,987 | | Pays | | 6-month PLN WIBOR | | 4.30 | | | 8/10/17 | | | | 19,916 | |
| Citibank NA | | PLN 26,940 | | Pays | | 6-month PLN WIBOR | | 4.40 | | | 8/20/17 | | | | 58,315 | |
| Citibank NA | | PLN 31,670 | | Pays | | 6-month PLN WIBOR | | 4.30 | | | 9/18/17 | | | | 33,624 | |
| Credit Suisse International | | HUF 1,839,440 | | Pays | | 6-month HUF BUBOR | | 6.93 | | | 12/16/16 | | | | 410,432 | |
| Credit Suisse International | | HUF 1,839,440 | | Receives | | 6-month HUF BUBOR | | 7.32 | | | 12/16/16 | | | | (706,873 | ) |
| Credit Suisse International | | HUF 440,700 | | Pays | | 6-month HUF BUBOR | | 6.98 | | | 12/22/16 | | | | 79,381 | |
| Credit Suisse International | | HUF 440,700 | | Receives | | 6-month HUF BUBOR | | 7.29 | | | 12/22/16 | | | | (165,870 | ) |
| Credit Suisse International | | HUF 326,000 | | Pays | | 6-month HUF BUBOR | | 6.99 | | | 12/27/16 | | | | 60,076 | |
| Credit Suisse International | | HUF 326,000 | | Receives | | 6-month HUF BUBOR | | 7.38 | | | 12/27/16 | | | | (128,888 | ) |
| Credit Suisse International | | HUF 2,500,000 | | Receives | | 6-month HUF BUBOR | | 7.92 | | | 1/11/17 | | | | (1,261,551 | ) |
| Credit Suisse International | | HUF 1,437,000 | | Receives | | 6-month HUF BUBOR | | 7.63 | | | 1/16/17 | | | | (641,948 | ) |
| Credit Suisse International | | HUF 1,258,000 | | Pays | | 6-month HUF BUBOR | | 7.10 | | | 1/17/17 | | | | 277,386 | |
| Credit Suisse International | | HUF 1,258,000 | | Receives | | 6-month HUF BUBOR | | 7.83 | | | 1/17/17 | | | | (612,640 | ) |
| Credit Suisse International | | HUF 2,183,000 | | Pays | | 6-month HUF BUBOR | | 5.87 | | | 1/20/17 | | | | (17,073 | ) |
| Credit Suisse International | | HUF 2,183,000 | | Receives | | 6-month HUF BUBOR | | 7.75 | | | 1/20/17 | | | | (1,028,111 | ) |
| Credit Suisse International | | PLN 33,910 | | Pays | | 6-month PLN WIBOR | | 4.40 | | | 8/20/17 | | | | 73,402 | |
| Credit Suisse International | | USD 28,419 | | Receives | | 3-month USD-LIBOR-BBA | | 1.81 | | | 10/23/22 | | | | (189,522 | ) |
| Deutsche Bank | | HUF 2,396,050 | | Pays | | 6-month HUF BUBOR | | 7.01 | | | 1/19/17 | | | | 496,486 | |
| Deutsche Bank | | HUF 2,396,050 | | Receives | | 6-month HUF BUBOR | | 7.98 | | | 1/19/17 | | | | (1,238,958 | ) |
| Deutsche Bank | | NZD 44,566 | | Pays | | 3-month NZD Bank Bill | | 3.79 | | | 10/30/22 | | | | 321,103 | |
| Deutsche Bank | | PLN 35,927 | | Pays | | 6-month PLN WIBOR | | 4.34 | | | 7/30/17 | | | | 42,389 | |
| Deutsche Bank | | PLN 102,951 | | Pays | | 6-month PLN WIBOR | | 4.36 | | | 8/1/17 | | | | 146,715 | |
| Deutsche Bank | | PLN 60,960 | | Pays | | 6-month PLN WIBOR | | 4.28 | | | 8/6/17 | | | | 18,650 | |
| Deutsche Bank | | PLN 43,382 | | Pays | | 6-month PLN WIBOR | | 4.24 | | | 8/7/17 | | | | (7,847 | ) |
| Deutsche Bank | | PLN 34,120 | | Pays | | 6-month PLN WIBOR | | 4.33 | | | 8/17/17 | | | | 35,765 | |
Global Macro Portfolio
October 31, 2012
Notes to Consolidated Financial Statements — continued
| | | | | | | | | | | | | | | | | | |
| Interest Rate Swaps (continued) | |
| Counterparty | | Notional Amount
(000's omitted) | | Portfolio
Pays/Receives
Floating Rate | | Floating Rate Index | | Annual
Fixed Rate | | | Termination
Date | | | Net Unrealized
Appreciation
(Depreciation) | |
| | | | | | |
| Goldman Sachs International | | PLN 20,449 | | Pays | | 6-month PLN WIBOR | | | 4.35% | | | | 8/1/17 | | | $ | 25,703 | |
| JPMorgan Chase Bank | | HUF 6,015,000 | | Pays | | 6-month HUF BUBOR | | | 6.93 | | | | 12/19/16 | | | | 1,356,978 | |
| JPMorgan Chase Bank | | HUF 6,015,000 | | Receives | | 6-month HUF BUBOR | | | 7.26 | | | | 12/19/16 | | | | (2,198,544 | ) |
| JPMorgan Chase Bank | | HUF 2,068,000 | | Pays | | 6-month HUF BUBOR | | | 6.94 | | | | 12/20/16 | | | | 363,709 | |
| JPMorgan Chase Bank | | HUF 2,068,000 | | Receives | | 6-month HUF BUBOR | | | 7.34 | | | | 12/20/16 | | | | (800,290 | ) |
| JPMorgan Chase Bank | | HUF 2,409,000 | | Receives | | 6-month HUF BUBOR | | | 7.36 | | | | 12/21/16 | | | | (943,044 | ) |
| JPMorgan Chase Bank | | HUF 2,292,500 | | Pays | | 6-month HUF BUBOR | | | 6.99 | | | | 12/22/16 | | | | 543,329 | |
| JPMorgan Chase Bank | | HUF 2,292,500 | | Receives | | 6-month HUF BUBOR | | | 7.30 | | | | 12/22/16 | | | | (867,465 | ) |
| JPMorgan Chase Bank | | HUF 1,956,000 | | Receives | | 6-month HUF BUBOR | | | 7.37 | | | | 12/27/16 | | | | (769,386 | ) |
| JPMorgan Chase Bank | | HUF 2,671,000 | | Receives | | 6-month HUF BUBOR | | | 7.75 | | | | 1/20/17 | | | | (1,257,941 | ) |
| JPMorgan Chase Bank | | PLN 26,580 | | Pays | | 6-month PLN WIBOR | | | 4.33 | | | | 8/17/17 | | | | 27,862 | |
| JPMorgan Chase Bank | | PLN 57,360 | | Pays | | 6-month PLN WIBOR | | | 4.25 | | | | 10/8/17 | | | | 24,226 | |
| Morgan Stanley & Co. International PLC | | HUF 2,507,000 | | Pays | | 6-month HUF BUBOR | | | 6.94 | | | | 12/19/16 | | | | 567,959 | |
| Morgan Stanley & Co. International PLC | | HUF 2,507,000 | | Receives | | 6-month HUF BUBOR | | | 7.26 | | | | 12/19/16 | | | | (928,547 | ) |
| Morgan Stanley & Co. International PLC | | HUF 1,035,000 | | Pays | | 6-month HUF BUBOR | | | 7.02 | | | | 12/20/16 | | | | 189,016 | |
| Morgan Stanley & Co. International PLC | | HUF 1,035,000 | | Receives | | 6-month HUF BUBOR | | | 7.36 | | | | 12/20/16 | | | | (404,247 | ) |
| Nomura International PLC | | HUF 1,713,000 | | Pays | | 6-month HUF BUBOR | | | 6.99 | | | | 12/21/16 | | | | 405,008 | |
| Nomura International PLC | | HUF 1,713,000 | | Receives | | 6-month HUF BUBOR | | | 7.39 | | | | 12/21/16 | | | | (679,878 | ) |
| | | | | | |
| | | | | | | | | | | | | | | | | $ | (10,443,951 | ) |
| | | | |
| HUF | | – | | Hungarian Forint |
| NZD | | – | | New Zealand Dollar |
| PLN | | – | | Polish Zloty |
| USD | | – | | United States Dollar |
| | | | | | | | | | | | | | | | | | | | | | | | | | | | | | |
| Credit Default Swaps — Sell Protection | | | | |
| | | | | | | | |
| | | | | | | | | | | | | | | | | | | | | | | | | | | | | | |
Reference
Entity | | Counterparty | | Notional
Amount*
(000's omitted) | | | Contract
Annual
Fixed Rate** | | | Termination
Date | | | Current
Market
Annual
Fixed Rate*** | | | Market Value | | | Upfront
Payments
Received
(Paid) | | | Net Unrealized
Appreciation
(Depreciation) | |
| | | | | | | | | | | | | | | | | | | | | | | | | | | | | | |
| | | | | | | | |
| Argentina | | Bank of America | | $ | 18,980 | | | | 5.00 | %(1) | | | 6/20/13 | | | | 29.91 | % | | $ | (2,572,223 | ) | | $ | (79,261 | ) | | $ | (2,651,484 | ) |
| Argentina | | Bank of America | | | 19,081 | | | | 5.00 | (1) | | | 6/20/13 | | | | 29.91 | | | | (2,585,829 | ) | | | (108,575 | ) | | | (2,694,404 | ) |
| Argentina | | Bank of America | | | 19,202 | | | | 5.00 | (1) | | | 6/20/13 | | | | 29.91 | | | | (2,602,322 | ) | | | (105,771 | ) | | | (2,708,093 | ) |
| Argentina | | Bank of America | | | 37,961 | | | | 5.00 | (1) | | | 6/20/13 | | | | 29.91 | | | | (5,144,460 | ) | | | (153,948 | ) | | | (5,298,408 | ) |
| Argentina | | Bank of America | | | 115,016 | | | | 5.00 | (1) | | | 6/20/13 | | | | 29.91 | | | | (15,587,045 | ) | | | (204,499 | ) | | | (15,791,544 | ) |
| Argentina | | Credit Suisse International | | | 19,169 | | | | 5.00 | (1) | | | 6/20/13 | | | | 29.91 | | | | (2,597,795 | ) | | | (34,083 | ) | | | (2,631,878 | ) |
| Argentina | | Credit Suisse International | | | 18,925 | | | | 5.00 | (1) | | | 6/20/13 | | | | 29.91 | | | | (2,564,729 | ) | | | (79,242 | ) | | | (2,643,971 | ) |
| Argentina | | Credit Suisse International | | | 19,049 | | | | 5.00 | (1) | | | 6/20/13 | | | | 29.91 | | | | (2,581,533 | ) | | | (79,761 | ) | | | (2,661,294 | ) |
Global Macro Portfolio
October 31, 2012
Notes to Consolidated Financial Statements — continued
| | | | | | | | | | | | | | | | | | | | | | | | | | | | | | |
| Credit Default Swaps — Sell Protection (continued) | | | | |
Reference
Entity | | Counterparty | | Notional
Amount*
(000's omitted) | | | Contract
Annual
Fixed Rate** | | | Termination
Date | | | Current
Market
Annual
Fixed Rate*** | | | Market Value | | | Upfront
Payments
Received
(Paid) | | | Net Unrealized
Appreciation
(Depreciation) | |
| | | | | | | | | | | | | | | | | | | | | | | | | | | | | | |
| | | | | | | | |
| Argentina | | Credit Suisse International | | $ | 19,361 | | | | 5.00 | %(1) | | | 6/20/13 | | | | 29.91 | % | | $ | (2,623,816 | ) | | $ | (57,555 | ) | | $ | (2,681,371 | ) |
| Argentina | | Deutsche Bank | | | 10,128 | | | | 5.00 | (1) | | | 6/20/13 | | | | 29.91 | | | | (1,372,608 | ) | | | (42,386 | ) | | | (1,414,994 | ) |
| Argentina | | Deutsche Bank | | | 16,380 | | | | 5.00 | (1) | | | 6/20/13 | | | | 29.91 | | | | (2,219,829 | ) | | | (63,774 | ) | | | (2,283,603 | ) |
| Argentina | | Deutsche Bank | | | 19,049 | | | | 5.00 | (1) | | | 6/20/13 | | | | 29.91 | | | | (2,581,533 | ) | | | (79,761 | ) | | | (2,661,294 | ) |
| Argentina | | Deutsche Bank | | | 19,081 | | | | 5.00 | (1) | | | 6/20/13 | | | | 29.91 | | | | (2,585,816 | ) | | | (108,574 | ) | | | (2,694,390 | ) |
| Poland | | Bank of America | | | 32,910 | | | | 1.00 | (1) | | | 9/20/17 | | | | 0.85 | | | | 268,995 | | | | 1,464,846 | | | | 1,733,841 | |
| Poland | | Bank of America | | | 16,600 | | | | 1.00 | (1) | | | 9/20/17 | | | | 0.85 | | | | 135,683 | | | | 496,596 | | | | 632,279 | |
| Poland | | Barclays Bank PLC | | | 17,300 | | | | 1.00 | (1) | | | 9/20/17 | | | | 0.85 | | | | 141,404 | | | | 860,261 | | | | 1,001,665 | |
| Poland | | Barclays Bank PLC | | | 8,610 | | | | 1.00 | (1) | | | 9/20/17 | | | | 0.85 | | | | 70,375 | | | | 253,695 | | | | 324,070 | |
| Poland | | Citibank NA | | | 92,570 | | | | 1.00 | (1) | | | 9/20/17 | | | | 0.85 | | | | 756,636 | | | | 2,352,873 | | | | 3,109,509 | |
| Poland | | Credit Suisse International | | | 28,990 | | | | 1.00 | (1) | | | 9/20/17 | | | | 0.85 | | | | 236,955 | | | | 1,379,101 | | | | 1,616,056 | |
| Poland | | Deutsche Bank | | | 18,400 | | | | 1.00 | (1) | | | 9/20/17 | | | | 0.85 | | | | 150,395 | | | | 938,956 | | | | 1,089,351 | |
| Poland | | Deutsche Bank | | | 4,750 | | | | 1.00 | (1) | | | 9/20/17 | | | | 0.85 | | | | 38,825 | | | | 131,465 | | | | 170,290 | |
| Poland | | Deutsche Bank | | | 7,400 | | | | 1.00 | (1) | | | 6/20/22 | | | | 1.38 | | | | (235,048 | ) | | | 1,215,636 | | | | 980,588 | |
| Poland | | Goldman Sachs International | | | 13,760 | | | | 1.00 | (1) | | | 9/20/17 | | | | 0.85 | | | | 112,469 | | | | 396,503 | | | | 508,972 | |
| Poland | | JPMorgan Chase Bank | | | 17,700 | | | | 1.00 | (1) | | | 9/20/17 | | | | 0.85 | | | | 144,674 | | | | 496,207 | | | | 640,881 | |
| Poland | | JPMorgan Chase Bank | | | 7,900 | | | | 1.00 | (1) | | | 9/20/17 | | | | 0.85 | | | | 64,572 | | | | 240,107 | | | | 304,679 | |
| Poland | | Morgan Stanley & Co. International PLC | | | 9,180 | | | | 1.00 | (1) | | | 9/20/17 | | | | 0.85 | | | | 75,035 | | | | 270,738 | | | | 345,773 | |
| South Africa | | Bank of America | | | 5,575 | | | | 1.00 | (1) | | | 9/20/15 | | | | 0.95 | | | | 14,811 | | | | 52,554 | | | | 67,365 | |
| South Africa | | Bank of America | | | 16,990 | | | | 1.00 | (1) | | | 12/20/15 | | | | 1.00 | | | | 19,380 | | | | 85,890 | | | | 105,270 | |
| South Africa | | Bank of America | | | 5,160 | | | | 1.00 | (1) | | | 12/20/15 | | | | 1.00 | | | | 5,886 | | | | 27,340 | | | | 33,226 | |
| South Africa | | Bank of America | | | 19,900 | | | | 1.00 | (1) | | | 9/20/17 | | | | 1.46 | | | | (407,698 | ) | | | 637,448 | | | | 229,750 | |
| South Africa | | Bank of America | | | 20,830 | | | | 1.00 | (1) | | | 9/20/17 | | | | 1.46 | | | | (426,751 | ) | | | 347,929 | | | | (78,822 | ) |
| South Africa | | Bank of America | | | 16,100 | | | | 1.00 | (1) | | | 9/20/17 | | | | 1.46 | | | | (329,846 | ) | | | 239,707 | | | | (90,139 | ) |
| South Africa | | Bank of America | | | 29,280 | | | | 1.00 | (1) | | | 9/20/17 | | | | 1.46 | | | | (599,869 | ) | | | 368,224 | | | | (231,645 | ) |
| South Africa | | Barclays Bank PLC | | | 10,000 | | | | 1.00 | (1) | | | 6/20/15 | | | | 0.88 | | | | 42,006 | | | | 231,777 | | | | 273,783 | |
| South Africa | | Barclays Bank PLC | | | 12,000 | | | | 1.00 | (1) | | | 9/20/15 | | | | 0.95 | | | | 31,880 | | | | 256,058 | | | | 287,938 | |
| South Africa | | Barclays Bank PLC | | | 12,010 | | | | 1.00 | (1) | | | 12/20/15 | | | | 1.00 | | | | 13,699 | | | | 71,256 | | | | 84,955 | |
| South Africa | | Barclays Bank PLC | | | 7,340 | | | | 1.00 | (1) | | | 12/20/15 | | | | 1.00 | | | | 8,372 | | | | 43,183 | | | | 51,555 | |
| South Africa | | Barclays Bank PLC | | | 4,000 | | | | 1.00 | (1) | | | 6/20/17 | | | | 1.40 | | | | (66,969 | ) | | | 125,266 | | | | 58,297 | |
| South Africa | | Barclays Bank PLC | | | 11,400 | | | | 1.00 | (1) | | | 9/20/17 | | | | 1.46 | | | | (233,567 | ) | | | 283,255 | | | | 49,688 | |
| South Africa | | Barclays Bank PLC | | | 9,080 | | | | 1.00 | (1) | | | 9/20/17 | | | | 1.46 | | | | (186,025 | ) | | | 210,390 | | | | 24,365 | |
| South Africa | | BNP Paribas SA | | | 19,000 | | | | 1.00 | (1) | | | 9/20/17 | | | | 1.46 | | | | (389,278 | ) | | | 489,241 | | | | 99,963 | |
| South Africa | | BNP Paribas SA | | | 9,200 | | | | 1.00 | (1) | | | 9/20/17 | | | | 1.46 | | | | (188,493 | ) | | | 274,120 | | | | 85,627 | |
| South Africa | | BNP Paribas SA | | | 16,830 | | | | 1.00 | (1) | | | 9/20/17 | | | | 1.46 | | | | (344,801 | ) | | | 366,653 | | | | 21,852 | |
| South Africa | | Citibank NA | | | 5,000 | | | | 1.00 | (1) | | | 6/20/15 | | | | 0.88 | | | | 21,004 | | | | 77,145 | | | | 98,149 | |
| South Africa | | Citibank NA | | | 4,600 | | | | 1.00 | (1) | | | 6/20/17 | | | | 1.40 | | | | (77,015 | ) | | | 142,103 | | | | 65,088 | |
Global Macro Portfolio
October 31, 2012
Notes to Consolidated Financial Statements — continued
| | | | | | | | | | | | | | | | | | | | | | | | | | | | | | |
| Credit Default Swaps — Sell Protection (continued) | | | | |
Reference
Entity | | Counterparty | | Notional
Amount*
(000's omitted) | | | Contract
Annual
Fixed Rate** | | | Termination
Date | | | Current
Market
Annual
Fixed Rate*** | | | Market Value | | | Upfront
Payments
Received
(Paid) | | | Net Unrealized
Appreciation
(Depreciation) | |
| | | | | | | | | | | | | | | | | | | | | | | | | | | | | | |
| | | | | | | | |
| South Africa | | Credit Suisse International | | $ | 10,000 | | | | 1.00 | %(1) | | | 6/20/15 | | | | 0.88 | % | | $ | 42,007 | | | $ | 227,145 | | | $ | 269,152 | |
| South Africa | | Credit Suisse International | | | 5,000 | | | | 1.00 | (1) | | | 6/20/15 | | | | 0.88 | | | | 21,003 | | | | 78,325 | | | | 99,328 | |
| South Africa | | Credit Suisse International | | | 10,450 | | | | 1.00 | (1) | | | 12/20/15 | | | | 1.00 | | | | 11,920 | | | | 138,003 | | | | 149,923 | |
| South Africa | | Credit Suisse International | | | 16,990 | | | | 1.00 | (1) | | | 12/20/15 | | | | 1.00 | | | | 19,379 | | | | 100,945 | | | | 120,324 | |
| South Africa | | Credit Suisse International | | | 7,740 | | | | 1.00 | (1) | | | 12/20/15 | | | | 1.00 | | | | 8,829 | | | | 50,057 | | | | 58,886 | |
| South Africa | | Credit Suisse International | | | 10,000 | | | | 1.00 | (1) | | | 9/20/17 | | | | 1.46 | | | | (204,874 | ) | | | 347,068 | | | | 142,194 | |
| South Africa | | Deutsche Bank | | | 12,500 | | | | 1.00 | (1) | | | 9/20/15 | | | | 0.95 | | | | 33,208 | | | | 172,024 | | | | 205,232 | |
| South Africa | | Deutsche Bank | | | 5,500 | | | | 1.00 | (1) | | | 9/20/15 | | | | 0.95 | | | | 14,612 | | | | 77,885 | | | | 92,497 | |
| South Africa | | Deutsche Bank | | | 5,575 | | | | 1.00 | (1) | | | 9/20/15 | | | | 0.95 | | | | 14,811 | | | | 55,519 | | | | 70,330 | |
| South Africa | | Deutsche Bank | | | 1,450 | | | | 1.00 | (1) | | | 9/20/15 | | | | 0.95 | | | | 3,853 | | | | 18,387 | | | | 22,240 | |
| South Africa | | Deutsche Bank | | | 13,005 | | | | 1.00 | (1) | | | 12/20/15 | | | | 1.00 | | | | 14,834 | | | | 77,160 | | | | 91,994 | |
| South Africa | | Deutsche Bank | | | 16,940 | | | | 1.00 | (1) | | | 9/20/17 | | | | 1.46 | | | | (347,056 | ) | | | 602,722 | | | | 255,666 | |
| South Africa | | Deutsche Bank | | | 15,200 | | | | 1.00 | (1) | | | 9/20/17 | | | | 1.46 | | | | (311,408 | ) | | | 486,895 | | | | 175,487 | |
| South Africa | | Deutsche Bank | | | 9,200 | | | | 1.00 | (1) | | | 9/20/17 | | | | 1.46 | | | | (188,493 | ) | | | 228,592 | | | | 40,099 | |
| South Africa | | Goldman Sachs International | | | 17,335 | | | | 1.00 | (1) | | | 12/20/15 | | | | 1.00 | | | | 19,774 | | | | 107,955 | | | | 127,729 | |
| South Africa | | Goldman Sachs International | | | 8,020 | | | | 1.00 | (1) | | | 12/20/15 | | | | 1.00 | | | | 9,148 | | | | 51,868 | | | | 61,016 | |
| South Africa | | Goldman Sachs International | | | 10,690 | | | | 1.00 | (1) | | | 9/20/17 | | | | 1.46 | | | | (219,009 | ) | | | 361,338 | | | | 142,329 | |
| South Africa | | Goldman Sachs International | | | 8,022 | | | | 1.00 | (1) | | | 12/20/17 | | | | 1.51 | | | | (193,662 | ) | | | 195,329 | | | | 1,667 | |
| South Africa | | HSBC Bank USA | | | 9,200 | | | | 1.00 | (1) | | | 9/20/17 | | | | 1.46 | | | | (188,483 | ) | | | 315,116 | | | | 126,633 | |
| South Africa | | HSBC Bank USA | | | 9,146 | | | | 1.00 | (1) | | | 9/20/17 | | | | 1.46 | | | | (187,386 | ) | | | 227,250 | | | | 39,864 | |
| South Africa | | HSBC Bank USA | | | 7,300 | | | | 1.00 | (1) | | | 12/20/17 | | | | 1.51 | | | | (176,231 | ) | | | 184,732 | | | | 8,501 | |
| South Africa | | JPMorgan Chase Bank | | | 5,000 | | | | 1.00 | (1) | | | 6/20/15 | | | | 0.88 | | | | 21,004 | | | | 117,045 | | | | 138,049 | |
| South Africa | | JPMorgan Chase Bank | | | 5,000 | | | | 1.00 | (1) | | | 6/20/15 | | | | 0.88 | | | | 21,003 | | | | 75,965 | | | | 96,968 | |
| South Africa | | JPMorgan Chase Bank | | | 9,200 | | | | 1.00 | (1) | | | 9/20/17 | | | | 1.46 | | | | (188,484 | ) | | | 265,868 | | | | 77,384 | |
| South Africa | | Morgan Stanley & Co. International PLC | | | 4,400 | | | | 1.00 | (1) | | | 6/20/17 | | | | 1.40 | | | | (73,666 | ) | | | 134,054 | | | | 60,388 | |
| South Africa | | Morgan Stanley & Co. International PLC | | | 9,200 | | | | 1.00 | (1) | | | 9/20/17 | | | | 1.46 | | | | (188,484 | ) | | | 261,738 | | | | 73,254 | |
| South Africa | | Nomura International PLC | | | 8,900 | | | | 1.00 | (1) | | | 9/20/17 | | | | 1.46 | | | | (182,337 | ) | | | 169,828 | | | | (12,509 | ) |
Global Macro Portfolio
October 31, 2012
Notes to Consolidated Financial Statements — continued
| | | | | | | | | | | | | | | | | | | | | | | | | | | | | | |
| Credit Default Swaps — Sell Protection (continued) | | | | |
Reference
Entity | | Counterparty | | Notional
Amount*
(000's omitted) | | | Contract
Annual
Fixed Rate** | | | Termination
Date | | | Current
Market
Annual
Fixed Rate*** | | | Market Value | | | Upfront
Payments
Received
(Paid) | | | Net Unrealized
Appreciation
(Depreciation) | |
| | | | | | | | | | | | | | | | | | | | | | | | | | | | | | |
| | | | | | | | |
| South Africa | | Nomura International PLC | | $ | 4,000 | | | | 1.00 | %(1) | | | 9/20/17 | | | | 1.46 | % | | $ | (81,949 | ) | | $ | 59,692 | | | $ | (22,257 | ) |
| South Africa | | Nomura International PLC | | | 7,068 | | | | 1.00 | (1) | | | 12/20/17 | | | | 1.51 | | | | (170,631 | ) | | | 175,482 | | | | 4,851 | |
| Spain | | Deutsche Bank | | | 3,600 | | | | 1.00 | (1) | | | 3/20/13 | | | | 1.07 | | | | 3,243 | | | | 40,832 | | | | 44,075 | |
| Markit CDX North America High Yield Index | | Citibank NA | | | 36,410 | | | | 5.00 | (1) | | | 12/20/17 | | | | 5.19 | | | | (75,975 | ) | | | 22,351 | | | | (53,624 | ) |
| Markit CDX North America High Yield Index | | Deutsche Bank | | | 45,020 | | | | 5.00 | (1) | | | 12/20/17 | | | | 5.19 | | | | (93,942 | ) | | | 55,273 | | | | (38,669 | ) |
| Markit CDX North America High Yield Index | | JPMorgan Chase Bank | | | 33,020 | | | | 5.00 | (1) | | | 12/20/17 | | | | 5.19 | | | | (68,902 | ) | | | 81,080 | | | | 12,178 | |
| | | | | | | | |
Total | | | | $ | 1,241,828 | | | | | | | | | | | | | | | $ | (51,634,186 | ) | | $ | 19,192,856 | | | $ | (32,441,330 | ) |
| | | | | | | | | | | | | | | | | | | | | | | | | | |
| Credit Default Swaps — Buy Protection | | | | | | | | | | |
Reference
Entity | | Counterparty | | Notional
Amount
(000's omitted) | | | Contract
Annual
Fixed Rate** | | | Termination
Date | | | Market
Value | | | Upfront
Payments
Received
(Paid) | | | Net Unrealized
Appreciation
(Depreciation) | |
| | | | | | | | | | | | | | | | | | | | | | | | | | |
| | | | | | | |
| Austria | | Barclays Bank PLC | | $ | 8,800 | | | | 0.44 | % | | | 12/20/13 | | | $ | (44,909 | ) | | $ | — | | | $ | (44,909 | ) |
| Austria | | Barclays Bank PLC | | | 3,700 | | | | 1.42 | | | | 3/20/14 | | | | (76,792 | ) | | | — | | | | (76,792 | ) |
| Brazil | | Bank of America | | | 18,450 | | | | 1.00 | (1) | | | 6/20/20 | | | | 499,558 | | | | (516,488 | ) | | | (16,930 | ) |
| Brazil | | Bank of America | | | 11,450 | | | | 1.00 | (1) | | | 6/20/20 | | | | 310,024 | | | | (404,441 | ) | | | (94,417 | ) |
| Brazil | | Bank of America | | | 51,475 | | | | 1.00 | (1) | | | 12/20/20 | | | | 1,601,919 | | | | (1,560,616 | ) | | | 41,303 | |
| Brazil | | Bank of America | | | 22,575 | | | | 1.00 | (1) | | | 12/20/20 | | | | 702,473 | | | | (669,471 | ) | | | 33,002 | |
| Brazil | | Bank of America | | | 7,450 | | | | 1.00 | (1) | | | 12/20/20 | | | | 231,831 | | | | (211,354 | ) | | | 20,477 | |
| Brazil | | Bank of America | | | 3,600 | | | | 1.00 | (1) | | | 12/20/20 | | | | 112,033 | | | | (93,354 | ) | | | 18,679 | |
| Brazil | | Barclays Bank PLC | | | 9,000 | | | | 1.65 | | | | 9/20/19 | | | | (197,667 | ) | | | — | | | | (197,667 | ) |
| Brazil | | Barclays Bank PLC | | | 47,170 | | | | 1.00 | (1) | | | 12/20/20 | | | | 1,467,852 | | | | (1,463,459 | ) | | | 4,393 | |
| Brazil | | Citibank NA | | | 9,440 | | | | 1.00 | (1) | | | 12/20/20 | | | | 293,757 | | | | (270,950 | ) | | | 22,807 | |
Global Macro Portfolio
October 31, 2012
Notes to Consolidated Financial Statements — continued
| | | | | | | | | | | | | | | | | | | | | | | | | | |
| Credit Default Swaps — Buy Protection (continued) | | | | | | | | | | |
Reference
Entity | | Counterparty | | Notional
Amount
(000's omitted) | | | Contract
Annual
Fixed Rate** | | | Termination
Date | | | Market
Value | | | Upfront
Payments
Received
(Paid) | | | Net Unrealized
Appreciation
(Depreciation) | |
| | | | | | | | | | | | | | | | | | | | | | | | | | |
| | | | | | | |
| Brazil | | Credit Suisse International | | $ | 20,000 | | | | 1.00 | %(1) | | | 6/20/20 | | | $ | 541,526 | | | $ | (600,685 | ) | | $ | (59,159 | ) |
| Brazil | | Credit Suisse International | | | 14,225 | | | | 1.00 | (1) | | | 6/20/20 | | | | 385,161 | | | | (593,746 | ) | | | (208,585 | ) |
| Brazil | | Deutsche Bank | | | 10,600 | | | | 1.00 | (1) | | | 12/20/20 | | | | 329,876 | | | | (205,120 | ) | | | 124,756 | |
| Brazil | | Deutsche Bank | | | 11,580 | | | | 1.00 | (1) | | | 12/20/20 | | | | 360,339 | | | | (370,763 | ) | | | (10,424 | ) |
| Brazil | | HSBC Bank USA | | | 14,225 | | | | 1.00 | (1) | | | 6/20/20 | | | | 385,161 | | | | (568,974 | ) | | | (183,813 | ) |
| Brazil | | HSBC Bank USA | | | 9,710 | | | | 1.00 | (1) | | | 12/20/20 | | | | 302,149 | | | | (278,700 | ) | | | 23,449 | |
| Brazil | | Standard Chartered Bank | | | 9,440 | | | | 1.00 | (1) | | | 12/20/20 | | | | 293,747 | | | | (270,950 | ) | | | 22,797 | |
| Brazil | | Standard Chartered Bank | | | 2,700 | | | | 1.00 | (1) | | | 12/20/20 | | | | 84,025 | | | | (65,257 | ) | | | 18,768 | |
| China | | Bank of America | | | 22,200 | | | | 1.00 | (1) | | | 3/20/17 | | | | (455,692 | ) | | | (581,089 | ) | | | (1,036,781 | ) |
| China | | Barclays Bank PLC | | | 37,413 | | | | 1.00 | (1) | | | 3/20/17 | | | | (768,001 | ) | | | (891,179 | ) | | | (1,659,180 | ) |
| China | | Deutsche Bank | | | 13,655 | | | | 1.00 | (1) | | | 3/20/17 | | | | (280,292 | ) | | | (309,120 | ) | | | (589,412 | ) |
| China | | Deutsche Bank | | | 15,969 | | | | 1.00 | (1) | | | 3/20/17 | | | | (327,806 | ) | | | (361,504 | ) | | | (689,310 | ) |
| Colombia | | Bank of America | | | 17,400 | | | | 1.00 | (1) | | | 9/20/21 | | | | 464,238 | | | | (694,296 | ) | | | (230,058 | ) |
| Colombia | | Barclays Bank PLC | | | 20,000 | | | | 1.00 | (1) | | | 6/20/17 | | | | (95,533 | ) | | | (608,612 | ) | | | (704,145 | ) |
| Colombia | | Barclays Bank PLC | | | 7,300 | | | | 1.00 | (1) | | | 6/20/22 | | | | 230,025 | | | | (410,099 | ) | | | (180,074 | ) |
| Colombia | | Citibank NA | | | 7,100 | | | | 1.00 | (1) | | | 6/20/22 | | | | 223,717 | | | | (541,225 | ) | | | (317,508 | ) |
| Colombia | | Deutsche Bank | | | 6,250 | | | | 1.00 | (1) | | | 6/20/22 | | | | 196,939 | | | | (419,095 | ) | | | (222,156 | ) |
| Colombia | | Deutsche Bank | | | 7,920 | | | | 1.00 | (1) | | | 6/20/22 | | | | 249,562 | | | | (609,103 | ) | | | (359,541 | ) |
| Colombia | | Deutsche Bank | | | 14,900 | | | | 1.00 | (1) | | | 6/20/22 | | | | 469,504 | | | | (954,734 | ) | | | (485,230 | ) |
| Colombia | | Goldman Sachs International | | | 7,090 | | | | 1.00 | (1) | | | 6/20/17 | | | | (33,866 | ) | | | (215,753 | ) | | | (249,619 | ) |
| Colombia | | Goldman Sachs International | | | 13,390 | | | | 1.00 | (1) | | | 9/20/21 | | | | 357,250 | | | | (524,902 | ) | | | (167,652 | ) |
| Colombia | | Goldman Sachs International | | | 6,900 | | | | 1.00 | (1) | | | 6/20/22 | | | | 217,415 | | | | (525,979 | ) | | | (308,564 | ) |
Global Macro Portfolio
October 31, 2012
Notes to Consolidated Financial Statements — continued
| | | | | | | | | | | | | | | | | | | | | | | | | | |
| Credit Default Swaps — Buy Protection (continued) | | | | | | | | | | |
Reference
Entity | | Counterparty | | Notional
Amount
(000's omitted) | | | Contract
Annual
Fixed Rate** | | | Termination
Date | | | Market
Value | | | Upfront
Payments
Received
(Paid) | | | Net Unrealized
Appreciation
(Depreciation) | |
| | | | | | | | | | | | | | | | | | | | | | | | | | |
| | | | | | | |
| Colombia | | Goldman Sachs International | | $ | 7,700 | | | | 1.00 | %(1) | | | 6/20/22 | | | $ | 242,622 | | | $ | (647,252 | ) | | $ | (404,630 | ) |
| Colombia | | HSBC Bank USA | | | 14,730 | | | | 1.00 | (1) | | | 6/20/17 | | | | (70,360 | ) | | | (454,496 | ) | | | (524,856 | ) |
| Colombia | | HSBC Bank USA | | | 38,410 | | | | 1.00 | (1) | | | 9/20/21 | | | | 1,024,792 | | | | (1,472,003 | ) | | | (447,211 | ) |
| Colombia | | Morgan Stanley & Co. International PLC | | | 19,970 | | | | 1.00 | (1) | | | 9/20/21 | | | | 532,807 | | | | (796,845 | ) | | | (264,038 | ) |
| Croatia | | BNP Paribas SA | | | 2,000 | | | | 1.00 | (1) | | | 12/20/17 | | | | 138,243 | | | | (138,342 | ) | | | (99 | ) |
| Croatia | | Citibank NA | | | 1,500 | | | | 1.00 | (1) | | | 12/20/17 | | | | 101,987 | | | | (102,516 | ) | | | (529 | ) |
| Egypt | | Bank of America | | | 7,050 | | | | 1.00 | (1) | | | 9/20/15 | | | | 461,086 | | | | (194,740 | ) | | | 266,346 | |
| Egypt | | Barclays Bank PLC | | | 9,000 | | | | 1.00 | (1) | | | 9/20/15 | | | | 588,621 | | | | (248,605 | ) | | | 340,016 | |
| Egypt | | Citibank NA | | | 3,050 | | | | 1.00 | (1) | | | 12/20/15 | | | | 224,032 | | | | (128,639 | ) | | | 95,393 | |
| Egypt | | Citibank NA | | | 4,550 | | | | 1.00 | (1) | | | 6/20/20 | | | | 904,577 | | | | (385,122 | ) | | | 519,455 | |
| Egypt | | Citibank NA | | | 50 | | | | 1.00 | (1) | | | 6/20/20 | | | | 9,941 | | | | (4,446 | ) | | | 5,495 | |
| Egypt | | Credit Suisse International | | | 11,000 | | | | 1.00 | (1) | | | 12/20/15 | | | | 807,986 | | | | (434,642 | ) | | | 373,344 | |
| Egypt | | Deutsche Bank | | | 9,540 | | | | 1.00 | (1) | | | 6/20/15 | | | | 544,870 | | | | (202,500 | ) | | | 342,370 | |
| Egypt | | Deutsche Bank | | | 710 | | | | 1.00 | (1) | | | 6/20/15 | | | | 40,551 | | | | (23,620 | ) | | | 16,931 | |
| Egypt | | Deutsche Bank | | | 8,200 | | | | 1.00 | (1) | | | 9/20/15 | | | | 536,299 | | | | (231,268 | ) | | | 305,031 | |
| Egypt | | Deutsche Bank | | | 4,175 | | | | 1.00 | (1) | | | 9/20/15 | | | | 273,054 | | | | (147,966 | ) | | | 125,088 | |
| Egypt | | Deutsche Bank | | | 2,855 | | | | 1.00 | (1) | | | 12/20/15 | | | | 209,709 | | | | (109,539 | ) | | | 100,170 | |
| Egypt | | Deutsche Bank | | | 5,100 | | | | 1.00 | (1) | | | 6/20/20 | | | | 1,013,923 | | | | (383,832 | ) | | | 630,091 | |
| Egypt | | Deutsche Bank | | | 4,600 | | | | 1.00 | (1) | | | 6/20/20 | | | | 914,519 | | | | (391,207 | ) | | | 523,312 | |
| Egypt | | Deutsche Bank | | | 4,550 | | | | 1.00 | (1) | | | 6/20/20 | | | | 904,578 | | | | (387,475 | ) | | | 517,103 | |
| Egypt | | Goldman Sachs International | | | 9,700 | | | | 1.00 | (1) | | | 9/20/15 | | | | 634,403 | | | | (281,914 | ) | | | 352,489 | |
| Guatemala | | Citibank NA | | | 18,256 | | | | 1.00 | (1) | | | 9/20/20 | | | | 1,698,563 | | | | (1,105,536 | ) | | | 593,027 | |
| Hungary | | Bank of America | | | 7,800 | | | | 1.00 | (1) | | | 3/20/17 | | | | 526,932 | | | | (1,226,941 | ) | | | (700,009 | ) |
| Hungary | | Barclays Bank PLC | | | 3,700 | | | | 1.00 | (1) | | | 3/20/17 | | | | 249,954 | | | | (581,961 | ) | | | (332,007 | ) |
Global Macro Portfolio
October 31, 2012
Notes to Consolidated Financial Statements — continued
| | | | | | | | | | | | | | | | | | | | | | | | | | |
| Credit Default Swaps — Buy Protection (continued) | | | | | | | | | | |
Reference
Entity | | Counterparty | | Notional
Amount
(000's omitted) | | | Contract
Annual
Fixed Rate** | | | Termination
Date | | | Market
Value | | | Upfront
Payments
Received
(Paid) | | | Net Unrealized
Appreciation
(Depreciation) | |
| | | | | | | | | | | | | | | | | | | | | | | | | | |
| | | | | | | |
| Hungary | | Barclays Bank PLC | | $ | 10,900 | | | | 1.00 | %(1) | | | 3/20/17 | | | $ | 736,353 | | | $ | (1,720,664 | ) | | $ | (984,311 | ) |
| Hungary | | Deutsche Bank | | | 7,600 | | | | 1.00 | (1) | | | 3/20/17 | | | | 513,421 | | | | (1,190,125 | ) | | | (676,704 | ) |
| Hungary | | Goldman Sachs International | | | 14,600 | | | | 1.00 | (1) | | | 3/20/17 | | | | 986,308 | | | | (2,277,910 | ) | | | (1,291,602 | ) |
| Hungary | | HSBC Bank USA | | | 4,100 | | | | 1.00 | (1) | | | 3/20/17 | | | | 276,977 | | | | (644,876 | ) | | | (367,899 | ) |
| Lebanon | | Barclays Bank PLC | | | 4,200 | | | | 1.00 | (1) | | | 12/20/14 | | | | 153,932 | | | | (138,008 | ) | | | 15,924 | |
| Lebanon | | Barclays Bank PLC | | | 6,700 | | | | 1.00 | (1) | | | 3/20/15 | | | | 301,516 | | | | (225,321 | ) | | | 76,195 | |
| Lebanon | | Barclays Bank PLC | | | 4,900 | | | | 1.00 | (1) | | | 3/20/15 | | | | 220,512 | | | | (167,736 | ) | | | 52,776 | |
| Lebanon | | Barclays Bank PLC | | | 4,900 | | | | 1.00 | (1) | | | 3/20/15 | | | | 220,512 | | | | (191,846 | ) | | | 28,666 | |
| Lebanon | | Barclays Bank PLC | | | 5,000 | | | | 1.00 | (1) | | | 12/20/15 | | | | 348,216 | | | | (276,663 | ) | | | 71,553 | |
| Lebanon | | Citibank NA | | | 4,600 | | | | 3.30 | | | | 9/20/14 | | | | (70,716 | ) | | | — | | | | (70,716 | ) |
| Lebanon | | Citibank NA | | | 4,500 | | | | 1.00 | (1) | | | 12/20/14 | | | | 164,926 | | | | (144,895 | ) | | | 20,031 | |
| Lebanon | | Citibank NA | | | 5,500 | | | | 1.00 | (1) | | | 12/20/14 | | | | 201,577 | | | | (183,451 | ) | | | 18,126 | |
| Lebanon | | Citibank NA | | | 4,300 | | | | 1.00 | (1) | | | 12/20/14 | | | | 157,597 | | | | (141,294 | ) | | | 16,303 | |
| Lebanon | | Citibank NA | | | 2,800 | | | | 1.00 | (1) | | | 3/20/15 | | | | 126,007 | | | | (83,883 | ) | | | 42,124 | |
| Lebanon | | Citibank NA | | | 15,000 | | | | 1.00 | (1) | | | 9/20/15 | | | | 924,545 | | | | (801,094 | ) | | | 123,451 | |
| Lebanon | | Citibank NA | | | 6,000 | | | | 1.00 | (1) | | | 9/20/15 | | | | 369,818 | | | | (345,022 | ) | | | 24,796 | |
| Lebanon | | Credit Suisse International | | | 8,800 | | | | 1.00 | (1) | | | 3/20/15 | | | | 396,021 | | | | (295,776 | ) | | | 100,245 | |
| Lebanon | | Credit Suisse International | | | 4,600 | | | | 1.00 | (1) | | | 3/20/15 | | | | 207,011 | | | | (155,510 | ) | | | 51,501 | |
| Lebanon | | Credit Suisse International | | | 9,900 | | | | 1.00 | (1) | | | 6/20/15 | | | | 528,594 | | | | (344,489 | ) | | | 184,105 | |
| Lebanon | | Credit Suisse International | | | 5,000 | | | | 1.00 | (1) | | | 9/20/15 | | | | 308,182 | | | | (267,512 | ) | | | 40,670 | |
| Lebanon | | Credit Suisse International | | | 22,710 | | | | 1.00 | (1) | | | 12/20/15 | | | | 1,581,600 | | | | (1,271,461 | ) | | | 310,139 | |
| Lebanon | | Credit Suisse International | | | 8,300 | | | | 1.00 | (1) | | | 12/20/15 | | | | 578,040 | | | | (443,322 | ) | | | 134,718 | |
| Lebanon | | Credit Suisse International | | | 5,000 | | | | 1.00 | (1) | | | 12/20/15 | | | | 348,217 | | | | (273,387 | ) | | | 74,830 | |
| Lebanon | | Credit Suisse International | | | 4,450 | | | | 1.00 | (1) | | | 12/20/15 | | | | 309,913 | | | | (237,157 | ) | | | 72,756 | |
| Lebanon | | Deutsche Bank | | | 6,100 | | | | 1.00 | (1) | | | 3/20/15 | | | | 274,514 | | | | (190,368 | ) | | | 84,146 | |
| Lebanon | | Deutsche Bank | | | 4,900 | | | | 1.00 | (1) | | | 6/20/15 | | | | 261,627 | | | | (170,503 | ) | | | 91,124 | |
| Lebanon | | Deutsche Bank | | | 5,000 | | | | 1.00 | (1) | | | 6/20/15 | | | | 266,966 | | | | (176,267 | ) | | | 90,699 | |
Global Macro Portfolio
October 31, 2012
Notes to Consolidated Financial Statements — continued
| | | | | | | | | | | | | | | | | | | | | | | | | | |
| Credit Default Swaps — Buy Protection (continued) | | | | | | | | | | |
Reference
Entity | | Counterparty | | Notional
Amount
(000's omitted) | | | Contract
Annual
Fixed Rate** | | | Termination
Date | | | Market
Value | | | Upfront
Payments
Received
(Paid) | | | Net Unrealized
Appreciation
(Depreciation) | |
| | | | | | | | | | | | | | | | | | | | | | | | | | |
| | | | | | | |
| Lebanon | | Deutsche Bank | | $ | 6,700 | | | | 1.00 | %(1) | | | 9/20/15 | | | $ | 412,957 | | | $ | (319,116 | ) | | $ | 93,841 | |
| Lebanon | | Deutsche Bank | | | 6,890 | | | | 1.00 | (1) | | | 12/20/15 | | | | 479,842 | | | | (382,144 | ) | | | 97,698 | |
| Lebanon | | Deutsche Bank | | | 5,000 | | | | 1.00 | (1) | | | 12/20/15 | | | | 348,217 | | | | (279,934 | ) | | | 68,283 | |
| Lebanon | | Deutsche Bank | | | 3,085 | | | | 1.00 | (1) | | | 12/20/15 | | | | 214,850 | | | | (171,810 | ) | | | 43,040 | |
| Lebanon | | Goldman Sachs International | | | 3,600 | | | | 1.00 | (1) | | | 9/20/15 | | | | 221,891 | | | | (192,609 | ) | | | 29,282 | |
| Lebanon | | HSBC Bank USA | | | 1,250 | | | | 1.00 | (1) | | | 12/20/17 | | | | 180,333 | | | | (182,876 | ) | | | (2,543 | ) |
| Lebanon | | JPMorgan Chase Bank | | | 10,000 | | | | 5.00 | (1) | | | 12/20/17 | | | | (454,674 | ) | | | 219,984 | | | | (234,690 | ) |
| Mexico | | Bank of America | | | 7,100 | | | | 1.00 | (1) | | | 6/20/22 | | | | 224,597 | | | | (442,865 | ) | | | (218,268 | ) |
| Mexico | | Bank of America | | | 14,100 | | | | 1.00 | (1) | | | 6/20/22 | | | | 446,030 | | | | (999,283 | ) | | | (553,253 | ) |
| Mexico | | Barclays Bank PLC | | | 3,900 | | | | 1.00 | (1) | | | 6/20/22 | | | | 123,366 | | | | (289,923 | ) | | | (166,557 | ) |
| Mexico | | Citibank NA | | | 4,150 | | | | 1.00 | (1) | | | 6/20/22 | | | | 131,279 | | | | (265,807 | ) | | | (134,528 | ) |
| Mexico | | Deutsche Bank | | | 6,900 | | | | 1.00 | (1) | | | 6/20/22 | | | | 218,270 | | | | (435,666 | ) | | | (217,396 | ) |
| Mexico | | Deutsche Bank | | | 7,300 | | | | 1.00 | (1) | | | 6/20/22 | | | | 230,923 | | | | (511,802 | ) | | | (280,879 | ) |
| Mexico | | Deutsche Bank | | | 6,680 | | | | 1.00 | (1) | | | 6/20/22 | | | | 211,310 | | | | (506,186 | ) | | | (294,876 | ) |
| Mexico | | Deutsche Bank | | | 14,300 | | | | 1.00 | (1) | | | 6/20/22 | | | | 452,357 | | | | (938,301 | ) | | | (485,944 | ) |
| Mexico | | Goldman Sachs International | | | 6,500 | | | | 1.00 | (1) | | | 6/20/22 | | | | 205,616 | | | | (410,446 | ) | | | (204,830 | ) |
| Mexico | | Goldman Sachs International | | | 7,060 | | | | 1.00 | (1) | | | 6/20/22 | | | | 223,331 | | | | (537,643 | ) | | | (314,312 | ) |
| Philippines | | Bank of America | | | 9,300 | | | | 1.00 | (1) | | | 9/20/15 | | | | (152,702 | ) | | | (118,528 | ) | | | (271,230 | ) |
| Philippines | | Barclays Bank PLC | | | 9,131 | | | | 1.00 | (1) | | | 3/20/15 | | | | (145,445 | ) | | | (126,375 | ) | | | (271,820 | ) |
| Philippines | | Barclays Bank PLC | | | 10,000 | | | | 1.00 | (1) | | | 6/20/15 | | | | (161,747 | ) | | | (152,944 | ) | | | (314,691 | ) |
| Philippines | | Citibank NA | | | 10,000 | | | | 1.00 | (1) | | | 6/20/15 | | | | (161,747 | ) | | | (165,966 | ) | | | (327,713 | ) |
| Philippines | | Deutsche Bank | | | 9,750 | | | | 1.00 | (1) | | | 3/20/15 | | | | (155,304 | ) | | | (146,589 | ) | | | (301,893 | ) |
| Philippines | | Deutsche Bank | | | 10,000 | | | | 1.00 | (1) | | | 6/20/15 | | | | (161,746 | ) | | | (148,454 | ) | | | (310,200 | ) |
Global Macro Portfolio
October 31, 2012
Notes to Consolidated Financial Statements — continued
| | | | | | | | | | | | | | | | | | | | | | | | | | |
| Credit Default Swaps — Buy Protection (continued) | | | | | | | | | | |
Reference
Entity | | Counterparty | | Notional
Amount
(000's omitted) | | | Contract
Annual
Fixed Rate** | | | Termination
Date | | | Market
Value | | | Upfront
Payments
Received
(Paid) | | | Net Unrealized
Appreciation
(Depreciation) | |
| | | | | | | | | | | | | | | | | | | | | | | | | | |
| | | | | | | |
| Philippines | | Deutsche Bank | | $ | 9,500 | | | | 1.00 | %(1) | | | 9/20/15 | | | $ | (155,987 | ) | | $ | (151,683 | ) | | $ | (307,670 | ) |
| Philippines | | Deutsche Bank | | | 10,000 | | | | 1.00 | (1) | | | 9/20/15 | | | | (164,196 | ) | | | (156,426 | ) | | | (320,622 | ) |
| Philippines | | Goldman Sachs International | | | 10,000 | | | | 1.00 | (1) | | | 3/20/15 | | | | (159,286 | ) | | | (160,641 | ) | | | (319,927 | ) |
| Philippines | | Goldman Sachs International | | | 10,000 | | | | 1.00 | (1) | | | 6/20/15 | | | | (161,747 | ) | | | (150,281 | ) | | | (312,028 | ) |
| Philippines | | Goldman Sachs International | | | 7,200 | | | | 1.00 | (1) | | | 9/20/15 | | | | (118,222 | ) | | | (88,099 | ) | | | (206,321 | ) |
| Philippines | | HSBC Bank USA | | | 10,000 | | | | 1.00 | (1) | | | 6/20/15 | | | | (161,746 | ) | | | (148,454 | ) | | | (310,200 | ) |
| Philippines | | HSBC Bank USA | | | 4,400 | | | | 1.00 | (1) | | | 9/20/15 | | | | (72,247 | ) | | | (65,737 | ) | | | (137,984 | ) |
| Philippines | | HSBC Bank USA | | | 10,000 | | | | 1.00 | (1) | | | 9/20/15 | | | | (164,196 | ) | | | (172,522 | ) | | | (336,718 | ) |
| Philippines | | HSBC Bank USA | | | 10,000 | | | | 1.00 | (1) | | | 9/20/15 | | | | (164,196 | ) | | | (182,671 | ) | | | (346,867 | ) |
| Philippines | | JPMorgan Chase Bank | | | 10,000 | | | | 1.00 | (1) | | | 6/20/15 | | | | (161,747 | ) | | | (161,355 | ) | | | (323,102 | ) |
| Philippines | | Standard Chartered Bank | | | 10,000 | | | | 1.00 | (1) | | | 9/20/15 | | | | (164,196 | ) | | | (169,852 | ) | | | (334,048 | ) |
| Russia | | Bank of America | | | 16,600 | | | | 1.00 | (1) | | | 9/20/17 | | | | 367,712 | | | | (608,104 | ) | | | (240,392 | ) |
| Russia | | Bank of America | | | 32,210 | | | | 1.00 | (1) | | | 9/20/17 | | | | 713,495 | | | | (1,672,700 | ) | | | (959,205 | ) |
| Russia | | Barclays Bank PLC | | | 8,610 | | | | 1.00 | (1) | | | 9/20/17 | | | | 190,723 | | | | (307,731 | ) | | | (117,008 | ) |
| Russia | | Barclays Bank PLC | | | 17,300 | | | | 1.00 | (1) | | | 9/20/17 | | | | 383,218 | | | | (957,691 | ) | | | (574,473 | ) |
| Russia | | Citibank NA | | | 13,760 | | | | 1.00 | (1) | | | 9/20/17 | | | | 304,802 | | | | (467,636 | ) | | | (162,834 | ) |
| Russia | | Citibank NA | | | 92,570 | | | | 1.00 | (1) | | | 9/20/17 | | | | 2,050,456 | | | | (2,813,093 | ) | | | (762,637 | ) |
| Russia | | Credit Suisse International | | | 28,990 | | | | 1.00 | (1) | | | 9/20/17 | | | | 642,167 | | | | (1,517,895 | ) | | | (875,728 | ) |
| Russia | | Deutsche Bank | | | 4,750 | | | | 1.00 | (1) | | | 9/20/17 | | | | 105,219 | | | | (154,990 | ) | | | (49,771 | ) |
| Russia | | Deutsche Bank | | | 19,100 | | | | 1.00 | (1) | | | 9/20/17 | | | | 423,090 | | | | (1,057,335 | ) | | | (634,245 | ) |
| Russia | | Deutsche Bank | | | 7,400 | | | | 1.00 | (1) | | | 6/20/22 | | | | 655,020 | | | | (1,267,898 | ) | | | (612,878 | ) |
| Russia | | JPMorgan Chase Bank | | | 7,900 | | | | 1.00 | (1) | | | 9/20/17 | | | | 174,996 | | | | (272,020 | ) | | | (97,024 | ) |
| Russia | | JPMorgan Chase Bank | | | 17,700 | | | | 1.00 | (1) | | | 9/20/17 | | | | 392,079 | | | | (601,733 | ) | | | (209,654 | ) |
Global Macro Portfolio
October 31, 2012
Notes to Consolidated Financial Statements — continued
| | | | | | | | | | | | | | | | | | | | | | | | | | |
| Credit Default Swaps — Buy Protection (continued) | | | | | | | | | | |
Reference
Entity | | Counterparty | | Notional
Amount
(000's omitted) | | | Contract
Annual
Fixed Rate** | | | Termination
Date | | | Market
Value | | | Upfront
Payments
Received
(Paid) | | | Net Unrealized
Appreciation
(Depreciation) | |
| | | | | | | | | | | | | | | | | | | | | | | | | | |
| | | | | | | |
| Russia | | Morgan Stanley & Co. International PLC | | $ | 9,180 | | | | 1.00 | %(1) | | | 9/20/17 | | | $ | 203,350 | | | $ | (320,201 | ) | | $ | (116,851 | ) |
| South Africa | | Bank of America | | | 6,300 | | | | 1.00 | (1) | | | 12/20/19 | | | | 340,385 | | | | (208,497 | ) | | | 131,888 | |
| South Africa | | Bank of America | | | 5,575 | | | | 1.00 | (1) | | | 9/20/20 | | | | 362,371 | | | | (192,462 | ) | | | 169,909 | |
| South Africa | | Bank of America | | | 16,990 | | | | 1.00 | (1) | | | 12/20/20 | | | | 1,163,991 | | | | (532,452 | ) | | | 631,539 | |
| South Africa | | Bank of America | | | 5,160 | | | | 1.00 | (1) | | | 12/20/20 | | | | 353,513 | | | | (177,376 | ) | | | 176,137 | |
| South Africa | | Bank of America | | | 29,280 | | | | 1.00 | (1) | | | 9/20/22 | | | | 2,678,134 | | | | (2,050,665 | ) | | | 627,469 | |
| South Africa | | Bank of America | | | 20,830 | | | | 1.00 | (1) | | | 9/20/22 | | | | 1,905,244 | | | | (1,615,658 | ) | | | 289,586 | |
| South Africa | | Bank of America | | | 16,100 | | | | 1.00 | (1) | | | 9/20/22 | | | | 1,472,608 | | | | (1,192,313 | ) | | | 280,295 | |
| South Africa | | Bank of America | | | 19,900 | | | | 1.00 | (1) | | | 9/20/22 | | | | 1,820,240 | | | | (1,942,041 | ) | | | (121,801 | ) |
| South Africa | | Barclays Bank PLC | | | 6,300 | | | | 1.00 | (1) | | | 12/20/19 | | | | 340,416 | | | | (241,014 | ) | | | 99,402 | |
| South Africa | | Barclays Bank PLC | | | 5,000 | | | | 1.00 | (1) | | | 3/20/20 | | | | 288,637 | | | | (147,506 | ) | | | 141,131 | |
| South Africa | | Barclays Bank PLC | | | 5,000 | | | | 1.00 | (1) | | | 3/20/20 | | | | 288,637 | | | | (167,998 | ) | | | 120,639 | |
| South Africa | | Barclays Bank PLC | | | 5,000 | | | | 1.00 | (1) | | | 3/20/20 | | | | 288,636 | | | | (240,325 | ) | | | 48,311 | |
| South Africa | | Barclays Bank PLC | | | 10,000 | | | | 1.00 | (1) | | | 6/20/20 | | | | 613,974 | | | | (693,552 | ) | | | (79,578 | ) |
| South Africa | | Barclays Bank PLC | | | 12,000 | | | | 1.00 | (1) | | | 9/20/20 | | | | 779,992 | | | | (739,792 | ) | | | 40,200 | |
| South Africa | | Barclays Bank PLC | | | 12,010 | | | | 1.00 | (1) | | | 12/20/20 | | | | 822,809 | | | | (374,987 | ) | | | 447,822 | |
| South Africa | | Barclays Bank PLC | | | 7,340 | | | | 1.00 | (1) | | | 12/20/20 | | | | 502,866 | | | | (242,907 | ) | | | 259,959 | |
| South Africa | | Barclays Bank PLC | | | 10,850 | | | | 1.00 | (1) | | | 9/20/22 | | | | 992,442 | | | | (909,138 | ) | | | 83,304 | |
| South Africa | | Barclays Bank PLC | | | 9,080 | | | | 1.00 | (1) | | | 9/20/22 | | | | 830,515 | | | | (816,030 | ) | | | 14,485 | |
| South Africa | | BNP Paribas SA | | | 16,830 | | | | 1.00 | (1) | | | 9/20/22 | | | | 1,539,378 | | | | (1,426,209 | ) | | | 113,169 | |
| South Africa | | BNP Paribas SA | | | 10,850 | | | | 1.00 | (1) | | | 9/20/22 | | | | 992,442 | | | | (934,094 | ) | | | 58,348 | |
| South Africa | | Citibank NA | | | 3,910 | | | | 1.00 | (1) | | | 12/20/19 | | | | 211,274 | | | | (170,065 | ) | | | 41,209 | |
| South Africa | | Citibank NA | | | 5,300 | | | | 1.00 | (1) | | | 3/20/20 | | | | 305,955 | | | | (244,026 | ) | | | 61,929 | |
| South Africa | | Citibank NA | | | 4,600 | | | | 1.00 | (1) | | | 3/20/20 | | | | 265,546 | | | | (218,599 | ) | | | 46,947 | |
Global Macro Portfolio
October 31, 2012
Notes to Consolidated Financial Statements — continued
| | | | | | | | | | | | | | | | | | | | | | | | | | |
| Credit Default Swaps — Buy Protection (continued) | | | | | | | | | | |
Reference
Entity | | Counterparty | | Notional
Amount
(000's omitted) | | | Contract
Annual
Fixed Rate** | | | Termination
Date | | | Market
Value | | | Upfront
Payments
Received
(Paid) | | | Net Unrealized
Appreciation
(Depreciation) | |
| | | | | | | | | | | | | | | | | | | | | | | | | | |
| | | | | | | |
| South Africa | | Citibank NA | | $ | 5,000 | | | | 1.00 | %(1) | | | 6/20/20 | | | $ | 306,987 | | | $ | (252,241 | ) | | $ | 54,746 | |
| South Africa | | Credit Suisse International | | | 5,100 | | | | 1.00 | (1) | | | 3/20/20 | | | | 294,410 | | | | (164,999 | ) | | | 129,411 | |
| South Africa | | Credit Suisse International | | | 4,600 | | | | 1.00 | (1) | | | 3/20/20 | | | | 265,546 | | | | (181,053 | ) | | | 84,493 | |
| South Africa | | Credit Suisse International | | | 5,000 | | | | 1.00 | (1) | | | 6/20/20 | | | | 306,987 | | | | (255,088 | )�� | | | 51,899 | |
| South Africa | | Credit Suisse International | | | 10,000 | | | | 1.00 | (1) | | | 6/20/20 | | | | 613,973 | | | | (676,994 | ) | | | (63,021 | ) |
| South Africa | | Credit Suisse International | | | 16,990 | | | | 1.00 | (1) | | | 12/20/20 | | | | 1,163,991 | | | | (566,109 | ) | | | 597,882 | |
| South Africa | | Credit Suisse International | | | 10,450 | | | | 1.00 | (1) | | | 12/20/20 | | | | 715,881 | | | | (449,718 | ) | | | 266,163 | |
| South Africa | | Credit Suisse International | | | 7,740 | | | | 1.00 | (1) | | | 12/20/20 | | | | 530,270 | | | | (271,015 | ) | | | 259,255 | |
| South Africa | | Credit Suisse International | | | 10,000 | | | | 1.00 | (1) | | | 9/20/22 | | | | 914,674 | | | | (1,013,345 | ) | | | (98,671 | ) |
| South Africa | | Deutsche Bank | | | 12,500 | | | | 1.00 | (1) | | | 9/20/20 | | | | 812,492 | | | | (560,516 | ) | | | 251,976 | |
| South Africa | | Deutsche Bank | | | 5,575 | | | | 1.00 | (1) | | | 9/20/20 | | | | 362,372 | | | | (190,723 | ) | | | 171,649 | |
| South Africa | | Deutsche Bank | | | 5,500 | | | | 1.00 | (1) | | | 9/20/20 | | | | 357,496 | | | | (228,524 | ) | | | 128,972 | |
| South Africa | | Deutsche Bank | | | 1,450 | | | | 1.00 | (1) | | | 9/20/20 | | | | 94,257 | | | | (60,305 | ) | | | 33,952 | |
| South Africa | | Deutsche Bank | | | 13,005 | | | | 1.00 | (1) | | | 12/20/20 | | | | 890,977 | | | | (423,177 | ) | | | 467,800 | |
| South Africa | | Deutsche Bank | | | 15,200 | | | | 1.00 | (1) | | | 9/20/22 | | | | 1,390,289 | | | | (1,474,228 | ) | | | (83,939 | ) |
| South Africa | | Deutsche Bank | | | 16,940 | | | | 1.00 | (1) | | | 9/20/22 | | | | 1,549,440 | | | | (1,650,060 | ) | | | (100,620 | ) |
| South Africa | | Goldman Sachs International | | | 17,335 | | | | 1.00 | (1) | | | 12/20/20 | | | | 1,187,626 | | | | (575,464 | ) | | | 612,162 | |
| South Africa | | Goldman Sachs International | | | 8,020 | | | | 1.00 | (1) | | | 12/20/20 | | | | 549,453 | | | | (270,553 | ) | | | 278,900 | |
| South Africa | | Goldman Sachs International | | | 10,690 | | | | 1.00 | (1) | | | 9/20/22 | | | | 977,786 | | | | (1,009,119 | ) | | | (31,333 | ) |
| South Africa | | Goldman Sachs International | | | 8,022 | | | | 1.00 | (1) | | | 12/20/22 | | | | 758,162 | | | | (789,611 | ) | | | (31,449 | ) |
| South Africa | | HSBC Bank USA | | | 7,300 | | | | 1.00 | (1) | | | 12/20/22 | | | | 689,925 | | | | (690,026 | ) | | | (101 | ) |
| South Africa | | JPMorgan Chase Bank | | | 5,200 | | | | 1.00 | (1) | | | 12/20/19 | | | | 280,978 | | | | (235,846 | ) | | | 45,132 | |
| South Africa | | JPMorgan Chase Bank | | | 4,590 | | | | 1.00 | (1) | | | 12/20/19 | | | | 248,018 | | | | (249,844 | ) | | | (1,826 | ) |
Global Macro Portfolio
October 31, 2012
Notes to Consolidated Financial Statements — continued
| | | | | | | | | | | | | | | | | | | | | | | | | | |
| Credit Default Swaps — Buy Protection (continued) | | | | | | | | | | |
Reference
Entity | | Counterparty | | Notional
Amount
(000's omitted) | | | Contract
Annual
Fixed Rate** | | | Termination
Date | | | Market
Value | | | Upfront
Payments
Received
(Paid) | | | Net Unrealized
Appreciation
(Depreciation) | |
| | | | | | | | | | | | | | | | | | | | | | | | | | |
| | | | | | | |
| South Africa | | JPMorgan Chase Bank | | $ | 5,100 | | | | 1.00 | %(1) | | | 3/20/20 | | | $ | 294,409 | | | $ | (162,097 | ) | | $ | 132,312 | |
| South Africa | | JPMorgan Chase Bank | | | 5,000 | | | | 1.00 | (1) | | | 3/20/20 | | | | 288,637 | | | | (164,605 | ) | | | 124,032 | |
| South Africa | | JPMorgan Chase Bank | | | 5,200 | | | | 1.00 | (1) | | | 3/20/20 | | | | 300,183 | | | | (236,572 | ) | | | 63,611 | |
| South Africa | | JPMorgan Chase Bank | | | 5,000 | | | | 1.00 | (1) | | | 6/20/20 | | | | 306,986 | | | | (246,534 | ) | | | 60,452 | |
| South Africa | | JPMorgan Chase Bank | | | 5,000 | | | | 1.00 | (1) | | | 6/20/20 | | | | 306,987 | | | | (349,529 | ) | | | (42,542 | ) |
| South Africa | | Nomura International PLC | | | 8,900 | | | | 1.00 | (1) | | | 9/20/22 | | | | 814,050 | | | | (739,884 | ) | | | 74,166 | |
| South Africa | | Nomura International PLC | | | 4,000 | | | | 1.00 | (1) | | | 9/20/22 | | | | 365,866 | | | | (306,494 | ) | | | 59,372 | |
| South Africa | | Nomura International PLC | | | 7,068 | | | | 1.00 | (1) | | | 12/20/22 | | | | 667,999 | | | | (684,685 | ) | | | (16,686 | ) |
| Spain | | Bank of America | | | 15,000 | | | | 1.00 | (1) | | | 6/20/20 | | | | 1,992,005 | | | | (274,946 | ) | | | 1,717,059 | |
| Spain | | Bank of America | | | 7,500 | | | | 1.00 | (1) | | | 9/20/20 | | | | 1,025,065 | | | | (455,441 | ) | | | 569,624 | |
| Spain | | Barclays Bank PLC | | | 11,400 | | | | 1.00 | (1) | | | 3/20/20 | | | | 1,468,655 | | | | (101,048 | ) | | | 1,367,607 | |
| Spain | | Barclays Bank PLC | | | 10,000 | | | | 1.00 | (1) | | | 6/20/20 | | | | 1,328,004 | | | | (649,646 | ) | | | 678,358 | |
| Spain | | Barclays Bank PLC | | | 7,412 | | | | 1.00 | (1) | | | 9/20/20 | | | | 1,013,037 | | | | (570,356 | ) | | | 442,681 | |
| Spain | | Barclays Bank PLC | | | 44,330 | | | | 1.00 | (1) | | | 12/20/20 | | | | 6,225,543 | | | | (3,740,027 | ) | | | 2,485,516 | |
| Spain | | Barclays Bank PLC | | | 4,700 | | | | 1.00 | (1) | | | 12/20/20 | | | | 660,018 | | | | (390,625 | ) | | | 269,393 | |
| Spain | | Citibank NA | | | 11,400 | | | | 1.00 | (1) | | | 3/20/20 | | | | 1,468,654 | | | | (230,733 | ) | | | 1,237,921 | |
| Spain | | Citibank NA | | | 2,500 | | | | 1.00 | (1) | | | 3/20/20 | | | | 322,073 | | | | (104,201 | ) | | | 217,872 | |
| Spain | | Citibank NA | | | 5,000 | | | | 1.00 | (1) | | | 9/20/20 | | | | 683,377 | | | | (223,111 | ) | | | 460,266 | |
| Spain | | Deutsche Bank | | | 9,200 | | | | 1.00 | (1) | | | 3/20/20 | | | | 1,185,230 | | | | (175,833 | ) | | | 1,009,397 | |
| Spain | | Deutsche Bank | | | 13,950 | | | | 1.00 | (1) | | | 6/20/20 | | | | 1,852,565 | | | | (754,404 | ) | | | 1,098,161 | |
| Spain | | Deutsche Bank | | | 10,000 | | | | 1.00 | (1) | | | 6/20/20 | | | | 1,328,003 | | | | (407,598 | ) | | | 920,405 | |
| Spain | | Deutsche Bank | | | 23,922 | | | | 1.00 | (1) | | | 12/20/20 | | | | 3,359,518 | | | | (2,018,248 | ) | | | 1,341,270 | |
| Spain | | Deutsche Bank | | | 12,825 | | | | 1.00 | (1) | | | 12/20/20 | | | | 1,801,096 | | | | (927,939 | ) | | | 873,157 | |
Global Macro Portfolio
October 31, 2012
Notes to Consolidated Financial Statements — continued
| | | | | | | | | | | | | | | | | | | | | | | | | | |
| Credit Default Swaps — Buy Protection (continued) | | | | | | | | | | |
Reference
Entity | | Counterparty | | Notional
Amount
(000's omitted) | | | Contract
Annual
Fixed Rate** | | | Termination
Date | | | Market
Value | | | Upfront
Payments
Received
(Paid) | | | Net Unrealized
Appreciation
(Depreciation) | |
| | | | | | | | | | | | | | | | | | | | | | | | | | |
| | | | | | | |
| Spain | | Goldman Sachs International | | $ | 5,000 | | | | 1.00 | %(1) | | | 6/20/20 | | | $ | 664,001 | | | $ | (327,454 | ) | | $ | 336,547 | |
| Spain | | Goldman Sachs International | | | 8,543 | | | | 1.00 | (1) | | | 9/20/20 | | | | 1,167,617 | | | | (671,399 | ) | | | 496,218 | |
| Spain | | JPMorgan Chase Bank | | | 15,000 | | | | 1.00 | (1) | | | 9/20/20 | | | | 2,050,130 | | | | (1,291,150 | ) | | | 758,980 | |
| Spain | | JPMorgan Chase Bank | | | 5,000 | | | | 1.00 | (1) | | | 9/20/20 | | | | 683,377 | | | | (217,246 | ) | | | 466,131 | |
| Thailand | | Bank of America | | | 4,000 | | | | 1.00 | (1) | | | 9/20/15 | | | | (66,158 | ) | | | (16,186 | ) | | | (82,344 | ) |
| Thailand | | Barclays Bank PLC | | | 7,500 | | | | 0.97 | | | | 9/20/19 | | | | 70,083 | | | | — | | | | 70,083 | |
| Thailand | | Citibank NA | | | 7,700 | | | | 0.86 | | | | 12/20/14 | | | | (97,192 | ) | | | — | | | | (97,192 | ) |
| Thailand | | Citibank NA | | | 3,700 | | | | 0.95 | | | | 9/20/19 | | | | 39,459 | | | | — | | | | 39,459 | |
| Thailand | | Credit Suisse International | | | 5,000 | | | | 1.00 | (1) | | | 9/20/15 | | | | (82,699 | ) | | | (28,289 | ) | | | (110,988 | ) |
| Thailand | | Deutsche Bank | | | 10,000 | | | | 1.00 | (1) | | | 3/20/15 | | | | (160,377 | ) | | | (39,457 | ) | | | (199,834 | ) |
| Thailand | | Goldman Sachs International | | | 4,700 | | | | 1.00 | (1) | | | 9/20/15 | | | | (77,736 | ) | | | (17,721 | ) | | | (95,457 | ) |
| Thailand | | Goldman Sachs International | | | 9,000 | | | | 1.00 | (1) | | | 9/20/15 | | | | (148,857 | ) | | | (33,966 | ) | | | (182,823 | ) |
| Thailand | | HSBC Bank USA | | | 10,000 | | | | 1.00 | (1) | | | 9/20/15 | | | | (165,397 | ) | | | (37,740 | ) | | | (203,137 | ) |
| Thailand | | JPMorgan Chase Bank | | | 3,900 | | | | 0.87 | | | | 12/20/14 | | | | (50,111 | ) | | | — | | | | (50,111 | ) |
| Thailand | | Standard Chartered Bank | | | 5,000 | | | | 1.00 | (1) | | | 9/20/15 | | | | (82,698 | ) | | | (18,852 | ) | | | (101,550 | ) |
| Thailand | | Standard Chartered Bank | | | 5,000 | | | | 1.00 | (1) | | | 9/20/15 | | | | (82,698 | ) | | | (26,954 | ) | | | (109,652 | ) |
| Tunisia | | Barclays Bank PLC | | | 3,700 | | | | 1.00 | (1) | | | 9/20/17 | | | | 403,308 | | | | (316,432 | ) | | | 86,876 | |
| Tunisia | | Barclays Bank PLC | | | 3,330 | | | | 1.00 | (1) | | | 9/20/17 | | | | 362,978 | | | | (299,005 | ) | | | 63,973 | |
| Tunisia | | Citibank NA | | | 3,990 | | | | 1.00 | (1) | | | 9/20/17 | | | | 434,919 | | | | (375,448 | ) | | | 59,471 | |
| Tunisia | | Deutsche Bank | | | 13,700 | | | | 1.00 | (1) | | | 6/20/17 | | | | 1,412,105 | | | | (1,005,284 | ) | | | 406,821 | |
| Tunisia | | Deutsche Bank | | | 7,390 | | | | 1.00 | (1) | | | 6/20/17 | | | | 761,734 | | | | (572,386 | ) | | | 189,348 | |
| Tunisia | | Goldman Sachs International | | | 6,700 | | | | 1.00 | (1) | | | 9/20/17 | | | | 730,282 | | | | (531,039 | ) | | | 199,243 | |
Global Macro Portfolio
October 31, 2012
Notes to Consolidated Financial Statements — continued
| | | | | | | | | | | | | | | | | | | | | | | | | | |
| Credit Default Swaps — Buy Protection (continued) | | | | | | | | | | |
Reference
Entity | | Counterparty | | Notional
Amount
(000's omitted) | | | Contract
Annual
Fixed Rate** | | | Termination
Date | | | Market
Value | | | Upfront
Payments
Received (Paid) | | | Net Unrealized
Appreciation
(Depreciation) | |
| | | | | | | | | | | | | | | | | | | | | | | | | | |
| | | | | | | |
| Tunisia | | Goldman Sachs International | | $ | 7,430 | | | | 1.00 | %(1) | | | 9/20/17 | | | $ | 809,850 | | | $ | (619,843 | ) | | $ | 190,007 | |
| Tunisia | | Goldman Sachs International | | | 6,700 | | | | 1.00 | (1) | | | 9/20/17 | | | | 730,316 | | | | (587,986 | ) | | | 142,330 | |
| Tunisia | | JPMorgan Chase Bank | | | 8,770 | | | | 1.00 | (1) | | | 9/20/17 | | | | 955,933 | | | | (807,416 | ) | | | 148,517 | |
| Tunisia | | Morgan Stanley & Co. International PLC | | | 2,000 | | | | 1.00 | (1) | | | 6/20/17 | | | | 206,146 | | | | (154,799 | ) | | | 51,347 | |
| Tunisia | | Nomura International PLC | | | 5,700 | | | | 1.00 | (1) | | | 12/20/17 | | | | 654,077 | | | | (599,048 | ) | | | 55,029 | |
| Uruguay | | Citibank NA | | | 4,600 | | | | 1.00 | (1) | | | 6/20/20 | | | | 170,790 | | | | (268,017 | ) | | | (97,227 | ) |
| Uruguay | | Deutsche Bank | | | 9,200 | | | | 1.00 | (1) | | | 6/20/20 | | | | 341,580 | | | | (523,474 | ) | | | (181,894 | ) |
| iTraxx Europe Senior Financials 5-Year Index | | Barclays Bank PLC | | | EUR 42,420 | | | | 1.00 | (1) | | | 12/20/17 | | | | 1,894,982 | | | | (2,290,268 | ) | | | (395,286 | ) |
| iTraxx Europe Subordinated Financials 5-Year Index | | Barclays Bank PLC | | | EUR 30,816 | | | | 5.00 | (1) | | | 12/20/17 | | | | (3,804,309 | ) | | | 3,232,966 | | | | (571,343 | ) |
| | | | | | | |
| | | | | | | | | | | | | | | | | $ | 112,331,153 | | | $ | (109,437,709 | ) | | $ | 2,893,444 | |
| * | If the Portfolio is the seller of credit protection, the notional amount is the maximum potential amount of future payments the Portfolio could be required to make if a credit event, as defined in the credit default swap agreement, were to occur. At October 31, 2012, such maximum potential amount for all open credit default swaps in which the Portfolio is the seller was $1,241,828,000. |
| ** | The contract annual fixed rate represents the fixed rate of interest received by the Portfolio (as a seller of protection) or paid by the Portfolio (as a buyer of protection) annually on the notional amount of the credit default swap contract. |
| *** | Current market annual fixed rates, utilized in determining the net unrealized appreciation or depreciation as of year end, serve as an indicator of the market's perception of the current status of the payment/performance risk associated with the credit derivative. The current market annual fixed rate of a particular reference entity reflects the cost, as quoted by the pricing vendor, of selling protection against default of that entity as of period end and may include upfront payments required to be made to enter into the agreement. The higher the fixed rate, the greater the market perceived risk of a credit event involving the reference entity. A rate identified as "Defaulted" indicates a credit event has occurred for the reference entity. |
| (1) | Upfront payment is exchanged with the counterparty as a result of the standardized trading coupon. |
Global Macro Portfolio
October 31, 2012
Notes to Consolidated Financial Statements — continued
| | | | | | | | | | | | | | | | | | | | |
| Cross-Currency Swaps | |
| Counterparty | | Notional
Amount on
Fixed Rate
(Currency
Received)
(000's omitted) | | Notional
Amount on
Floating Rate
(Currency
Delivered)
(000's omitted) | | | Floating Rate | | Fixed Rate | | | Termination
Date | | | Net Unrealized
Appreciation
(Depreciation) | |
| | | | | | |
| Bank of America | | TRY 17,118 | | $ | 11,435 | | | 3-month
USD-LIBOR-BBA | | | 8.28 | % | | | 8/11/20 | | | $ | 470,504 | |
| Bank of America | | TRY 26,000 | | | 14,619 | | | 3-month
USD-LIBOR-BBA | | | 6.97 | | | | 8/18/21 | | | | (836,896 | ) |
| Barclays Bank PLC | | TRY 60,000 | | | 40,080 | | | 3-month
USD-LIBOR-BBA | | | 8.25 | | | | 8/11/20 | | | | 1,712,985 | |
| Barclays Bank PLC | | TRY 25,350 | | | 16,650 | | | 3-month
USD-LIBOR-BBA | | | 8.32 | | | | 8/16/20 | | | | 392,434 | |
| Citibank NA | | TRY 25,000 | | | 16,700 | | | 3-month
USD-LIBOR-BBA | | | 8.20 | | | | 8/11/20 | | | | 758,094 | |
| Citibank NA | | TRY 3,909 | | | 2,449 | | | 3-month
USD-LIBOR-BBA | | | 8.23 | | | | 2/25/21 | | | | (143,172 | ) |
| Credit Suisse International | | TRY 4,446 | | | 2,498 | | | 3-month
USD-LIBOR-BBA | | | 6.90 | | | | 8/18/21 | | | | (133,195 | ) |
| Deutsche Bank | | TRY 22,254 | | | 14,861 | | | 3-month
USD-LIBOR-BBA | | | 8.26 | | | | 8/11/20 | | | | 622,478 | |
| Deutsche Bank | | TRY 14,321 | | | 8,996 | | | 3-month
USD-LIBOR-BBA | | | 8.20 | | | | 2/24/21 | | | | (485,964 | ) |
| Deutsche Bank | | TRY 5,112 | | | 2,871 | | | 3-month
USD-LIBOR-BBA | | | 7.00 | | | | 8/18/21 | | | | (174,533 | ) |
| JPMorgan Chase Bank | | TRY 27,000 | | | 18,012 | | | 3-month
USD-LIBOR-BBA | | | 8.29 | | | | 8/11/20 | | | | 708,436 | |
| JPMorgan Chase Bank | | TRY 20,000 | | | 13,333 | | | 3-month
USD-LIBOR-BBA | | | 8.36 | | | | 8/11/20 | | | | 466,190 | |
| JPMorgan Chase Bank | | TRY 10,000 | | | 5,610 | | | 3-month
USD-LIBOR-BBA | | | 6.96 | | | | 8/18/21 | | | | (330,651 | ) |
| | | | | | |
| | | | | | | | | | | | | | | | | | | $ | 3,026,710 | |
The Portfolio pays interest on the currency received and receives interest on the currency delivered. At the termination date, the notional amount of the currency received will be exchanged for the notional amount of the currency delivered.
Written options activity for the year ended October 31, 2012 was as follows:
| | | | | | | | |
| | | Principal Amount
of Contracts
(000's omitted) | | | Premiums
Received | |
Outstanding, beginning of year | | | INR — | | | $ | — | |
Options written | | | 33,752,150 | | | | 21,570,884 | |
| | |
Outstanding, end of year | | | INR 33,752,150 | | | $ | 21,570,884 | |
At October 31, 2012, the Portfolio had sufficient cash and/or securities to cover commitments under these contracts.
In the normal course of pursuing its investment objective, the Portfolio is subject to the following risks:
Commodity Risk: The Portfolio invests in commodities-linked derivative investments, including commodity futures contracts and options thereon and forward commodity contracts, that provide exposure to the investment returns of certain commodities. Commodities-linked derivative investments are used to enhance total return and/or as a substitute for the purchase or sale of commodities.
Global Macro Portfolio
October 31, 2012
Notes to Consolidated Financial Statements — continued
Credit Risk: The Portfolio enters into credit default swap contracts to manage certain investment risks and/or to enhance total return.
Equity Price Risk: The Portfolio enters into equity index futures and options thereon to enhance total return and/or to manage certain investment risks.
Foreign Exchange Risk: The Portfolio engages in forward foreign currency exchange contracts, options on currencies and cross-currency swaps to enhance total return, to seek to hedge against fluctuations in currency exchange rates and/or as a substitute for the purchase or sale of securities or currencies.
Interest Rate Risk: The Portfolio utilizes various interest rate derivatives including futures, interest rate swaps and swaptions, and cross-currency swaps to enhance total return, to seek to hedge against fluctuations in interest rates, and/or to change the effective duration of its portfilio.
The Portfolio enters into swap contracts, over-the-counter options, forward foreign currency exchange contracts and forward commodity contracts that may contain provisions whereby the counterparty may terminate the contract under certain conditions, including but not limited to a decline in the Portfolio’s net assets below a certain level over a certain period of time, which would trigger a payment by the Portfolio for those derivatives in a liability position. At October 31, 2012, the fair value, excluding upfront payments, of derivatives with credit-related contingent features in a net liability position was $184,026,446. The aggregate fair value of assets pledged as collateral by the Portfolio for such liability was $56,321,427 at October 31, 2012.
The non-exchange traded derivatives in which the Portfolio invests, including swap contracts, over-the counter options, forward commodity contracts and forward foreign currency exchange contracts, are subject to the risk that the counterparty to the contract fails to perform its obligations under the contract. The Portfolio is not subject to counterparty credit risks with respect to its written options as the Portfolio, not the counterparty, is obligated to perform under such derivatives. At October 31, 2012, the maximum amount of loss the Portfolio (and Subsidiary) would incur due to counterparty risk was $128,541,246, with the highest amount from any one counterparty being $21,999,512. Such maximum amount would be reduced by any unamortized upfront payments received by the Portfolio. Such amount would be increased by any unamortized upfront payments made by the Portfolio. To mitigate this risk, the Portfolio (and Subsidiary) has entered into master netting agreements with substantially all its derivative counterparties, which allows it and a counterparty to aggregate amounts owed by each of them for derivative transactions under the agreement into a single net amount payable by either the Portfolio or the counterparty. At October 31, 2012, the maximum amount of loss the Portfolio would incur due to counterparty risk would be reduced by approximately $103,040,000 due to master netting agreements. Counterparties may be required to pledge collateral in the form of cash, U.S. Government securities or highly-rated bonds for the benefit of the Portfolio if the net amount due from the counterparty with respect to a derivative contract exceeds a certain threshold. The amount of collateral posted by the counterparties with respect to such contracts would also reduce the amount of any loss incurred. Because the Subsidiary is not registered under the 1940 Act, it may not be able to negotiate terms with its counterparties that are equivalent to those a registered Portfolio may negotiate. As a result, the Subsidiary may have greater exposure to those counterparties than a registered Portfolio.
The fair value of open derivative instruments (not considered to be hedging instruments for accounting disclosure purposes) by risk exposure at October 31, 2012 was as follows:
| | | | | | | | | | | | | | | | | | | | |
| | | Fair Value | |
| Consolidated Statement of Assets and Liabilities Caption | | Credit | | | Equity Price | | | Foreign
Exchange | | | Interest
Rate | | | Commodity | |
| | | | | |
Securities of unaffiliated issuers, at value | | $ | — | | | $ | 7,188 | | | $ | 17,587,233 | | | $ | 1,311,533 | | | $ | 9,520,000 | |
Net unrealized appreciation* | | | — | | | | 977,082 | | | | — | | | | 1,114,306 | | | | — | |
Receivable for open forward foreign currency exchange contracts | | | — | | | | — | | | | 39,293,958 | | | | — | | | | — | |
Receivable for open swap contracts; Premium paid/received on open swap contracts | | | 125,223,834 | | | | — | | | | — | | | | 12,938,385 | | | | — | |
| | | | | |
Total Asset Derivatives | | $ | 125,223,834 | | | $ | 984,270 | | | $ | 56,881,191 | | | $ | 15,364,224 | | | $ | 9,520,000 | |
| | | | | |
Written options outstanding, at value | | $ | — | | | $ | — | | | $ | (9,567,459 | ) | | $ | — | | | $ | — | |
Net unrealized appreciation* | | | — | | | | (137,165 | ) | | | — | | | | (2,193,522 | ) | | | (10,176,242 | ) |
Payable for open forward commodity contracts | | | — | | | | — | | | | — | | | | — | | | | (9,488,742 | ) |
Payable for open forward foreign currency exchange contracts | | | — | | | | — | | | | (54,984,708 | ) | | | — | | | | — | |
Payable for open swap contracts; Premium paid/received on open swap contracts | | | (64,526,867 | ) | | | — | | | | — | | | | (20,355,626 | ) | | | — | |
| | | | | |
Total Liability Derivatives | | $ | (64,526,867 | ) | | $ | (137,165 | ) | | $ | (64,552,167 | ) | | $ | (22,549,148 | ) | | $ | (19,664,984 | ) |
| * | Amount represents cumulative unrealized appreciation or (depreciation) on futures contracts in the Futures Contracts table above. Only the current day's variation margin on open futures contracts is reported within the Consolidated Statement of Assets and Liabilities as Receivable or Payable for variation margin, as applicable. |
Global Macro Portfolio
October 31, 2012
Notes to Consolidated Financial Statements — continued
The effect of derivative instruments (not considered to be hedging instruments for accounting disclosure purposes) on the Consolidated Statement of Operations by risk exposure for the year ended October 31, 2012 was as follows:
| | | | | | | | | | | | | | | | | | | | |
| Consolidated Statement of Operations Caption | | Credit | | | Equity Price | | | Foreign
Exchange | | | Interest
Rate | | | Commodity | |
| | | | | |
Net realized gain (loss) — | | | | | | | | | | | | | | | | | | | | |
Investment transactions | | $ | — | | | $ | (9,239,369 | ) | | $ | (13,767,653 | ) | | $ | — | | | $ | (1,112,000 | ) |
Futures contracts | | | — | | | | 5,704,473 | | | | — | | | | (51,626,988 | ) | | | 5,393,925 | |
Swap contracts | | | 3,729,981 | | | | — | | | | — | | | | (18,970,747 | ) | | | — | |
Forward commodity contracts | | | — | | | | — | | | | — | | | | — | | | | (4,898,042 | ) |
Foreign currency and forward foreign currency exchange contract transactions | | | — | | | | — | | | | 246,445,335 | | | | — | | | | — | |
| | | | | |
Total | | $ | 3,729,981 | | | $ | (3,534,896 | ) | | $ | 232,677,682 | | | $ | (70,597,735 | ) | | $ | (616,117 | ) |
| | | | | |
Change in unrealized appreciation (depreciation) — Investments | | $ | — | | | $ | 2,092,033 | | | $ | 8,054,641 | | | $ | (3,282,019 | ) | | $ | 965,120 | |
Written options | | | — | | | | — | | | | 12,003,425 | | | | — | | | | — | |
Futures contracts | | | — | | | | 839,917 | | | | — | | | | 5,643,676 | | | | (7,785,363 | ) |
Swap contracts | | | (67,600,696 | ) | | | — | | | | — | | | | (18,479,277 | ) | | | — | |
Forward commodity contracts | | | — | | | | — | | | | — | | | | — | | | | 5,219,655 | |
Foreign currency and forward foreign currency exchange contracts | | | — | | | | — | | | | (69,561,208 | ) | | | — | | | | — | |
| | | | | |
Total | | $ | (67,600,696 | ) | | $ | 2,931,950 | | | $ | (49,503,142 | ) | | $ | (16,117,620 | ) | | $ | (1,600,588 | ) |
The average notional amounts of futures contracts, forward commodity contracts, forward foreign currency exchange contracts and swap contracts outstanding during the year ended October 31, 2012, which are indicative of the volume of these derivative types, were approximately $1,628,874,000, $207,528,000, $5,937,614,000 and $3,457,404,000, respectively.
The average principal amount of purchased currency option contracts, average notional amount of interest rate swaption contracts, and average number of purchased index options contracts and purchased commodity options contracts outstanding during the year ended October 31, 2012, which are indicative of the volume of these derivative types, were approximately $749,955,000, $99,600,000, 874,075,000 contracts and 222 contracts, respectively.
6 Line of Credit
The Portfolio participates with other portfolios and funds managed by EVM and its affiliates in a $600 million unsecured line of credit agreement with a group of banks. Borrowings are made by the Portfolio solely to facilitate the handling of unusual and/or unanticipated short-term cash requirements. Interest is charged to the Portfolio based on its borrowings at an amount above either the Eurodollar rate or Federal Funds rate. In addition, a fee computed at an annual rate of 0.08% on the daily unused portion of the line of credit is allocated among the participating portfolios and funds at the end of each quarter. Because the line of credit is not available exclusively to the Portfolio, it may be unable to borrow some or all of its requested amounts at any particular time. The Portfolio did not have any significant borrowings or allocated fees during the year ended October 31, 2012.
7 Reverse Repurchase Agreements
For the year ended October 31, 2012, the average borrowings under reverse repurchase agreements and the average annual interest rate were $3,204,249 and 0.20%, respectively. At October 31, 2012, the Portfolio did not have any open reverse repurchase agreements.
8 Risks Associated with Foreign Investments
Investing in securities issued by companies whose principal business activities are outside the United States may involve significant risks not present in domestic investments. For example, there is generally less publicly available information about foreign companies, particularly those not subject to the disclosure and reporting requirements of the U.S. securities laws. Certain foreign issuers are generally not bound by uniform accounting, auditing, and financial reporting requirements and standards of practice comparable to those applicable to domestic issuers. Investments in foreign securities also involve the risk of possible adverse changes in investment or exchange control regulations, expropriation or confiscatory taxation, limitation on the removal of funds or other assets of the Portfolio, political or financial instability or diplomatic and other developments which could affect such investments. Foreign
Global Macro Portfolio
October 31, 2012
Notes to Consolidated Financial Statements — continued
securities markets, while growing in volume and sophistication, are generally not as developed as those in the United States, and securities of some foreign issuers (particularly those located in developing countries) may be less liquid and more volatile than securities of comparable U.S. companies. In general, there is less overall governmental supervision and regulation of foreign securities markets, broker/dealers and issuers than in the United States.
9 Fair Value Measurements
Under generally accepted accounting principles for fair value measurements, a three-tier hierarchy to prioritize the assumptions, referred to as inputs, is used in valuation techniques to measure fair value. The three-tier hierarchy of inputs is summarized in the three broad levels listed below.
| Ÿ | | Level 1 – quoted prices in active markets for identical investments |
| Ÿ | | Level 2 – other significant observable inputs (including quoted prices for similar investments, interest rates, prepayment speeds, credit risk, etc.) |
| Ÿ | | Level 3 – significant unobservable inputs (including a fund’s own assumptions in determining the fair value of investments) |
In cases where the inputs used to measure fair value fall in different levels of the fair value hierarchy, the level disclosed is determined based on the lowest level input that is significant to the fair value measurement in its entirety. The inputs or methodology used for valuing securities are not necessarily an indication of the risk associated with investing in those securities.
At October 31, 2012, the hierarchy of inputs used in valuing the Portfolio's investments and open derivative instruments, which are carried at value, were as follows:
| | | | | | | | | | | | | | | | |
| Asset Description | | Level 1 | | | Level 2 | | | Level 3 | | | Total | |
| | | | |
Foreign Government Bonds | | $ | — | | | $ | 2,374,857,505 | | | $ | — | | | $ | 2,374,857,505 | |
Foreign Corporate Bonds & Notes | | | — | | | | 3,876,433 | | | | — | | | | 3,876,433 | |
Corporate Bonds & Notes | | | — | | | | 674,836 | | | | — | | | | 674,836 | |
Collateralized Mortgage Obligations | | | — | | | | 105,909,704 | | | | — | | | | 105,909,704 | |
Commercial Mortgage-Backed Securities | | | — | | | | 31,433,188 | | | | — | | | | 31,433,188 | |
Mortgage Pass-Throughs | | | — | | | | 1,481,757,513 | | | | — | | | | 1,481,757,513 | |
U.S. Government Agency Obligations | | | — | | | | 343,723,932 | | | | — | | | | 343,723,932 | |
U.S. Treasury Obligations | | | — | | | | 2,271,562 | | | | — | | | | 2,271,562 | |
Common Stocks | | | — | | | | 53,803,265 | * | | | — | | | | 53,803,265 | |
Precious Metals | | | 481,546,225 | | | | — | | | | — | | | | 481,546,225 | |
Currency Call Options Purchased | | | — | | | | 16,920,723 | | | | — | | | | 16,920,723 | |
Currency Put Options Purchased | | | — | | | | 666,510 | | | | — | | | | 666,510 | |
Interest Rate Swaptions | | | — | | | | 1,311,533 | | | | — | | | | 1,311,533 | |
Put Options Purchased | | | 9,520,000 | | | | 7,188 | | | | — | | | | 9,527,188 | |
Short-Term Investments — | | | | | | | | | | | | | | | | |
Foreign Government Securities | | | — | | | | 1,725,628,725 | | | | — | | | | 1,725,628,725 | |
U.S. Treasury Obligations | | | — | | | | 154,406,629 | | | | — | | | | 154,406,629 | |
Repurchase Agreements | | | — | | | | 650,212,248 | | | | — | | | | 650,212,248 | |
Other | | | — | | | | 357,358,168 | | | | — | | | | 357,358,168 | |
| | | | |
Total Investments | | $ | 491,066,225 | | | $ | 7,304,819,662 | | | $ | — | | | $ | 7,795,885,887 | |
Forward Foreign Currency Exchange Contracts | | $ | — | | | $ | 39,293,958 | | | $ | — | | | $ | 39,293,958 | |
Swap Contracts | | | — | | | | 138,162,219 | | | | — | | | | 138,162,219 | |
Futures Contracts | | | 2,091,388 | | | | — | | | | — | | | | 2,091,388 | |
| | | | |
Total | | $ | 493,157,613 | | | $ | 7,482,275,839 | | | $ | — | | | $ | 7,975,433,452 | |
Global Macro Portfolio
October 31, 2012
Notes to Consolidated Financial Statements — continued
| | | | | | | | | | | | | | | | |
| Liability Description | | Level 1 | | | Level 2 | | | Level 3 | | | Total | |
| | | | |
Currency Call Options Written | | $ | — | | | $ | (8,757,352 | ) | | $ | — | | | $ | (8,757,352 | ) |
Currency Put Options Written | | | — | | | | (810,107 | ) | | | — | | | | (810,107 | ) |
Securities Sold Short | | | — | | | | (718,066,182 | ) | | | — | | | | (718,066,182 | ) |
Forward Commodity Contracts | | | — | | | | (9,488,742 | ) | | | — | | | | (9,488,742 | ) |
Forward Foreign Currency Exchange Contracts | | | — | | | | (54,984,708 | ) | | | — | | | | (54,984,708 | ) |
Swap Contracts | | | — | | | | (84,882,493 | ) | | | — | | | | (84,882,493 | ) |
Futures Contracts | | | (12,506,929 | ) | | | — | | | | — | | | | (12,506,929 | ) |
| | | | |
Total | | $ | (12,506,929 | ) | | $ | (876,989,584 | ) | | $ | — | | | $ | (889,496,513 | ) |
| * | Includes foreign equity securities whose values were adjusted to reflect market trading of comparable securities or other correlated instruments that occurred after the close of trading in their applicable foreign markets. |
The Portfolio held no investments or other financial instruments as of October 31, 2011 whose fair value was determined using Level 3 inputs. At October 31, 2012, there were no investments transferred between Level 1 and Level 2 during the year then ended.
Global Macro Portfolio
October 31, 2012
Report of Independent Registered Public Accounting Firm
To the Trustees and Investors of Global Macro Portfolio:
We have audited the accompanying consolidated statement of assets and liabilities of Global Macro Portfolio and subsidiary (the “Portfolio”), including the consolidated portfolio of investments, as of October 31, 2012, and the related consolidated statement of operations for the year then ended, the consolidated statements of changes in net assets for each of the two years in the period then ended, and the consolidated supplementary data for each of the five years in the period then ended. These consolidated financial statements and consolidated supplementary data are the responsibility of the Portfolio’s management. Our responsibility is to express an opinion on these consolidated financial statements and consolidated supplementary data based on our audits.
We conducted our audits in accordance with the standards of the Public Company Accounting Oversight Board (United States). Those standards require that we plan and perform the audit to obtain reasonable assurance about whether the consolidated financial statements and consolidated supplementary data are free of material misstatement. The Portfolio is not required to have, nor were we engaged to perform, an audit of its internal control over financial reporting. Our audits included consideration of internal control over financial reporting as a basis for designing audit procedures that are appropriate in the circumstances, but not for the purpose of expressing an opinion on the effectiveness of the Portfolio’s internal control over financial reporting. Accordingly, we express no such opinion. An audit also includes examining, on a test basis, evidence supporting the amounts and disclosures in the financial statements, assessing the accounting principles used and significant estimates made by management, as well as evaluating the overall financial statement presentation. Our procedures included confirmation of securities owned as of October 31, 2012, by correspondence with the custodian and brokers; where replies were not received from brokers, we performed other auditing procedures. We believe that our audits provide a reasonable basis for our opinion.
In our opinion, such consolidated financial statements and consolidated supplementary data referred to above present fairly, in all material respects, the financial position of Global Macro Portfolio and subsidiary as of October 31, 2012, the results of their operations for the year then ended, the changes in their net assets for each of the two years in the period then ended, and the supplementary data for each of the five years in the period then ended, in conformity with accounting principles generally accepted in the United States of America.
DELOITTE & TOUCHE LLP
Boston, Massachusetts
December 21, 2012
Eaton Vance
Global Macro Absolute Return Fund
October 31, 2012
Management and Organization
Fund Management. The Trustees of Eaton Vance Mutual Funds Trust (the Trust) and Global Macro Portfolio (the Portfolio) are responsible for the overall management and supervision of the Trust’s and Portfolio’s affairs. The Trustees and officers of the Trust and the Portfolio are listed below. Except as indicated, each individual has held the office shown or other offices in the same company for the last five years. Trustees and officers of the Trust and the Portfolio hold indefinite terms of office. The “Noninterested Trustees” consist of those Trustees who are not “interested persons” of the Trust and the Portfolio, as that term is defined under the 1940 Act. The business address of each Trustee and officer is Two International Place, Boston, Massachusetts 02110. As used below, “EVC” refers to Eaton Vance Corp., “EV” refers to Eaton Vance, Inc., “EVM” refers to Eaton Vance Management, “BMR” refers to Boston Management and Research and “EVD” refers to Eaton Vance Distributors, Inc. EVC and EV are the corporate parent and trustee, respectively, of EVM and BMR. EVD is the Fund’s principal underwriter, the Portfolio’s placement agent and a wholly-owned subsidiary of EVC. Each officer affiliated with Eaton Vance may hold a position with other Eaton Vance affiliates that is comparable to his or her position with EVM listed below. Each Trustee oversees 187 portfolios in the Eaton Vance Complex (including all master and feeder funds in a master feeder structure). Each officer serves as an officer of certain other Eaton Vance funds. Each Trustee and officer serves until his or her successor is elected.
| | | | | | |
| Name and Year of Birth | | Position(s) with the
Trust and the
Portfolio | | Length of
Service | | Principal Occupation(s) and Directorships
During Past Five Years and Other Relevant Experience |
Interested Trustee | | | | | | |
| | | |
Thomas E. Faust Jr. 1958 | | Trustee | | Since 2007 | | Chairman, Chief Executive Officer and President of EVC, Director and President of EV, Chief Executive Officer and President of EVM and BMR, and Director of EVD. Trustee and/or officer of 187 registered investment companies. Mr. Faust is an interested person because of his positions with EVM, BMR, EVD, EVC and EV, which are affiliates of the Trust and the Portfolio. Directorships in the Last Five Years.(1) Director of EVC and Hexavest Inc. |
| | | |
| | | | | | |
Noninterested Trustees | | | | | | |
| | | |
Scott E. Eston 1956 | | Trustee | | Since 2011 | | Private investor. Formerly held various positions at Grantham, Mayo, Van Otterloo and Co., L.L.C. (investment management firm) (1997-2009), including Chief Operating Officer (2002-2009), Chief Financial Officer (1997-2009) and Chairman of the Executive Committee (2002-2008); President and Principal Executive Officer, GMO Trust (open-end registered investment company) (2006-2009). Former Partner, Coopers and Lybrand L.L.P. (now PricewaterhouseCoopers) (public accounting firm) (1987-1997). Directorships in the Last Five Years. None. |
| | | |
Benjamin C. Esty 1963 | | Trustee | | Since 2005 | | Roy and Elizabeth Simmons Professor of Business Administration and Finance Unit Head, Harvard University Graduate School of Business Administration. Directorships in the Last Five Years.(1) None. |
| | | |
Allen R. Freedman 1940 | | Trustee | | Since 2007 | | Private Investor. Former Chairman (2002-2004) and a Director (1983-2004) of Systems & Computer Technology Corp. (provider of software to higher education). Formerly, a Director of Loring Ward International (fund distributor) (2005-2007). Former Chairman and a Director of Indus International, Inc. (provider of enterprise management software to the power generating industry) (2005-2007). Former Chief Executive Officer of Assurant, Inc. (insurance provider) (1979-2000). Directorships in the Last Five Years.(1) Director of Stonemor Partners, L.P. (owner and operator of cemeteries). Formerly, Director of Assurant, Inc. (insurance provider) (1979-2011). |
| | | |
William H. Park 1947 | | Trustee | | Since 2003 | | Consultant and private investor. Formerly, Chief Financial Officer, Aveon Group L.P. (investment management firm) (2010-2011). Formerly, Vice Chairman, Commercial Industrial Finance Corp. (specialty finance company) (2006-2010). Formerly, President and Chief Executive Officer, Prizm Capital Management, LLC (investment management firm) (2002-2005). Formerly, Executive Vice President and Chief Financial Officer, United Asset Management Corporation (investment management firm) (1982-2001). Formerly, Senior Manager, Price Waterhouse (now PricewaterhouseCoopers) (an independent registered public accounting firm) (1972-1981). Directorships in the Last Five Years.(1) None. |
| | | |
Ronald A. Pearlman 1940 | | Trustee | | Since 2003 | | Professor of Law, Georgetown University Law Center. Formerly, Deputy Assistant Secretary (Tax Policy) and Assistant Secretary (Tax Policy), U.S. Department of the Treasury (1983-1985). Formerly, Chief of Staff, Joint Committee on Taxation, U.S. Congress (1988-1990). Directorships in the Last Five Years.(1) None. |
Eaton Vance
Global Macro Absolute Return Fund
October 31, 2012
Management and Organization — continued
| | | | | | |
| Name and Year of Birth | | Position(s) with the
Trust and the
Portfolio | | Length of
Service | | Principal Occupation(s) and Directorships
During Past Five Years and Other Relevant Experience |
Noninterested Trustees (continued) | | |
| | | |
Helen Frame Peters 1948 | | Trustee | | Since 2008 | | Professor of Finance, Carroll School of Management, Boston College. Formerly, Dean, Carroll School of Management, Boston College (2000-2002). Formerly, Chief Investment Officer, Fixed Income, Scudder Kemper Investments (investment management firm) (1998-1999). Formerly, Chief Investment Officer, Equity and Fixed Income, Colonial Management Associates (investment management firm) (1991-1998). Directorships in the Last Five Years.(1) Formerly, Director of BJ’s Wholesale Club, Inc. (wholesale club retailer) (2004-2011). Formerly, Trustee of SPDR Index Shares Funds and SPDR Series Trust (exchange traded funds) (2000-2009). Formerly, Director of Federal Home Loan Bank of Boston (a bank for banks) (2007-2009). |
| | | |
Lynn A. Stout 1957 | | Trustee | | Since 1998 | | Distinguished Professor of Corporate and Business Law, Jack G. Clarke Business Law Institute, Cornell University Law School. Formerly, the Paul Hastings Professor of Corporate and Securities Law (2006-2012) and Professor of Law (2001-2006), University of California at Los Angeles School of Law. Directorships in the Last Five Years.(1) None. |
| | | |
Harriett Tee Taggart 1948 | | Trustee | | Since 2011 | | Managing Director, Taggart Associates (a professional practice firm). Formerly, Partner and Senior Vice President, Wellington Management Company, LLP (investment management firm) (1983-2006). Directorships in the Last Five Years. Director of Albemarle Corporation (chemicals manufacturer) (since 2007) and The Hanover Group (specialty property and casualty insurance company) (since 2009). Formerly, Director of Lubrizol Corporation (specialty chemicals) (2007-2011). |
| | | |
Ralph F. Verni 1943 | | Chairman of the Board and Trustee | | Chairman of the Board since 2007 and Trustee since 2005 | | Consultant and private investor. Formerly, Chief Investment Officer (1982-1992), Chief Financial Officer (1988-1990) and Director (1982-1992), New England Life. Formerly, Chairperson, New England Mutual Funds (1982-1992). Formerly, President and Chief Executive Officer, State Street Management & Research (1992-2000). Formerly, Chairperson, State Street Research Mutual Funds (1992-2000). Formerly, Director, W.P. Carey, LLC (1998-2004) and First Pioneer Farm Credit Corp. (2002-2006). Directorships in the Last Five Years.(1) None. |
Principal Officers who are not Trustees |
Name and Year of Birth | | Position(s)
with the
Trust and the Portfolio | | Length of Service | | Principal Occupation(s) During Past Five Years |
| | | |
Duncan W. Richardson 1957 | | President of the Trust | | Since 2011 | | Director of EVC and Executive Vice President and Chief Equity Investment Officer of EVC, EVM and BMR. |
| | | |
Michael A. Cirami 1975 | | President of the Portfolio | | Since 2012 | | Vice President of EVM and BMR. |
| | | |
Payson F. Swaffield 1956 | | Vice President | | Since 2011 | | Vice President and Chief Income Investment Officer of EVM and BMR. |
| | | |
Barbara E. Campbell 1957 | | Treasurer | | Of the Trust since 2005 and of the Portfolio since 2008 | | Vice President of EVM and BMR. |
| | | |
Maureen A. Gemma 1960 | | Vice President, Secretary and Chief Legal Officer | | Vice President since 2011, Secretary since 2007 and Chief Legal Officer since 2008 | | Vice President of EVM and BMR. |
Eaton Vance
Global Macro Absolute Return Fund
October 31, 2012
Management and Organization — continued
| | | | | | |
Name and Year of Birth | | Position(s)
with the
Trust and the Portfolio | | Length of Service | | Principal Occupation(s) During Past Five Years |
Principal Officers who are not Trustees (continued) |
| | | |
Paul M. O’Neil 1953 | | Chief Compliance Officer | | Since 2004 | | Vice President of EVM and BMR. |
| (1) | During their respective tenures, the Trustees (except Mr. Eston and Ms. Taggart) also served as trustees of one or more of the following Eaton Vance funds (which operated in the years noted): Eaton Vance Credit Opportunities Fund (launched in 2005 and terminated in 2010); Eaton Vance Insured Florida Plus Municipal Bond Fund (launched in 2002 and terminated in 2009); and Eaton Vance National Municipal Income Trust (launched in 1998 and terminated in 2009). |
The SAI for the Fund includes additional information about the Trustees and officers of the Fund and the Portfolio and can be obtained without charge on Eaton Vance’s website at www.eatonvance.com or by calling 1-800-262-1122.
Eaton Vance Funds
IMPORTANT NOTICES
Privacy. The Eaton Vance organization is committed to ensuring your financial privacy. Each of the financial institutions identified below has in effect the following policy (“Privacy Policy”) with respect to nonpublic personal information about its customers:
| Ÿ | | Only such information received from you, through application forms or otherwise, and information about your Eaton Vance fund transactions will be collected. This may include information such as name, address, social security number, tax status, account balances and transactions. |
| Ÿ | | None of such information about you (or former customers) will be disclosed to anyone, except as permitted by law (which includes disclosure to employees necessary to service your account). In the normal course of servicing a customer’s account, Eaton Vance may share information with unaffiliated third parties that perform various required services such as transfer agents, custodians and broker-dealers. |
| Ÿ | | Policies and procedures (including physical, electronic and procedural safeguards) are in place that are designed to protect the confidentiality of such information. |
| Ÿ | | We reserve the right to change our Privacy Policy at any time upon proper notification to you. Customers may want to review our Privacy Policy periodically for changes by accessing the link on our homepage: www.eatonvance.com. |
Our pledge of privacy applies to the following entities within the Eaton Vance organization: the Eaton Vance Family of Funds, Eaton Vance Management, Eaton Vance Investment Counsel, Eaton Vance Distributors, Inc., Eaton Vance Trust Company, Eaton Vance Management’s Real Estate Investment Group and Boston Management and Research. In addition, our Privacy Policy applies only to those Eaton Vance customers who are individuals and who have a direct relationship with us. If a customer’s account (i.e., fund shares) is held in the name of a third-party financial advisor/broker-dealer, it is likely that only such advisor’s privacy policies apply to the customer. This notice supersedes all previously issued privacy disclosures. For more information about Eaton Vance’s Privacy Policy, please call 1-800-262-1122.
Delivery of Shareholder Documents. The Securities and Exchange Commission (SEC) permits funds to deliver only one copy of shareholder documents, including prospectuses, proxy statements and shareholder reports, to fund investors with multiple accounts at the same residential or post office box address. This practice is often called “householding” and it helps eliminate duplicate mailings to shareholders. Eaton Vance, or your financial advisor, may household the mailing of your documents indefinitely unless you instruct Eaton Vance, or your financial advisor, otherwise. If you would prefer that your Eaton Vance documents not be householded, please contact Eaton Vance at 1-800-262-1122, or contact your financial advisor. Your instructions that householding not apply to delivery of your Eaton Vance documents will be effective within 30 days of receipt by Eaton Vance or your financial advisor.
Portfolio Holdings. Each Eaton Vance Fund and its underlying Portfolio(s) (if applicable) will file a schedule of portfolio holdings on Form N-Q with the SEC for the first and third quarters of each fiscal year. The Form N-Q will be available on the Eaton Vance website at www.eatonvance.com, by calling Eaton Vance at 1-800-262-1122 or in the EDGAR database on the SEC’s website at www.sec.gov. Form N-Q may also be reviewed and copied at the SEC’s public reference room in Washington, D.C. (call 1-800-732-0330 for information on the operation of the public reference room).
Proxy Voting. From time to time, funds are required to vote proxies related to the securities held by the funds. The Eaton Vance Funds or their underlying Portfolios (if applicable) vote proxies according to a set of policies and procedures approved by the Funds’ and Portfolios’ Boards. You may obtain a description of these policies and procedures and information on how the Funds or Portfolios voted proxies relating to portfolio securities during the most recent 12-month period ended June 30, without charge, upon request, by calling 1-800-262-1122 and by accessing the SEC’s website at www.sec.gov.
This Page Intentionally Left Blank
This Page Intentionally Left Blank
This Page Intentionally Left Blank
Investment Adviser of Global Macro Portfolio
Boston Management and Research
Two International Place
Boston, MA 02110
Investment Adviser and Administrator of Eaton Vance Global Macro Absolute Return Fund
Eaton Vance Management
Two International Place
Boston, MA 02110
Principal Underwriter*
Eaton Vance Distributors, Inc.
Two International Place
Boston, MA 02110
(617) 482-8260
Custodian
State Street Bank and Trust Company
200 Clarendon Street
Boston, MA 02116
Transfer Agent
BNY Mellon Investment Servicing (US) Inc.
Attn: Eaton Vance Funds
P.O. Box 9653
Providence, RI 02940-9653
(800) 262-1122
Independent Registered Public Accounting Firm
Deloitte & Touche LLP
200 Berkeley Street
Boston, MA 02116-5022
Fund Offices
Two International Place
Boston, MA 02110
| * | FINRA BrokerCheck. Investors may check the background of their Investment Professional by contacting the Financial Industry Regulatory Authority (FINRA). FINRA BrokerCheck is a free tool to help investors check the professional background of current and former FINRA-registered securities firms and brokers. FINRA BrokerCheck is available by calling 1-800-289-9999 and at www.FINRA.org. The FINRA BrokerCheck brochure describing this program is available to investors at www.FINRA.org. |
| | |
Eaton Vance Tax-Managed Equity Asset Allocation Fund Annual Report October 31, 2012 | | 
|

Fund shares are not insured by the FDIC and are not deposits or other obligations of, or guaranteed by, any depository institution. Shares are subject to investment risks, including possible loss of principal invested.
This report must be preceded or accompanied by a current summary prospectus or prospectus. Before investing, investors should consider carefully the investment objective, risks, and charges and expenses of a mutual fund. This and other important information is contained in the summary prospectus and prospectus, which can be obtained from a financial advisor. Prospective investors should read the prospectus carefully before investing. For further information, please call 1-800-262-1122.
Annual Report October 31, 2012
Eaton Vance
Tax-Managed Equity Asset Allocation Fund
Table of Contents
| | | | |
Management’s Discussion of Fund Performance | | | 2 | |
| |
Performance | | | 3 | |
| |
Fund Profile | | | 4 | |
| |
Endnotes and Additional Disclosures | | | 5 | |
| |
Fund Expenses | | | 6 | |
| |
Financial Statements | | | 7 | |
| |
Report of Independent Registered Public Accounting Firm | | | 18 | |
| |
Federal Tax Information | | | 19 | |
| |
Management and Organization | | | 20 | |
| |
Important Notices | | | 22 | |
Eaton Vance
Tax-Managed Equity Asset Allocation Fund
October 31, 2012
Management’s Discussion of Fund Performance1
Economic and Market Conditions
As the 12-month period began, investors appeared to worry about intensifying debt problems in Europe, high U.S. unemployment and a Congressional deadlock that left businesses perplexed about the direction of tax and regulatory policy. The MSCI World Index,2 a broad measure of global equity market performance, was relatively flat in November 2011.
Beginning in mid-December 2011, however, an equity rally took hold and continued into early April 2012. U.S. stocks were generally fueled by stronger economic growth and falling unemployment. European stocks continued to underperform U.S. issues, but nonetheless moved higher, aided by the Long-Term Refinancing Operation announced by the European Central Bank (ECB) and what the markets perceived as a successful restructuring of Greek debt. Then in May 2012, the third annual mid-year economic slowdown arrived. As U.S. stock prices decreased, stock prices overseas fell even harder. Contributing factors included renewed concerns over Europe and slowing growth in China.
But despite a slowdown in consumer spending, weakening employment data and downward revisions of growth expectations, global equities moved upward intermittently from June through mid-October 2012. Hunting for yield in a low interest-rate environment, investors were driven to stocks that offered higher yields than bonds. Ongoing action by the ECB also helped the market, particularly the Outright Monetary Transactions program to support sovereign debt.
Additional factors led U.S. stocks to generally outperform their non-U.S. counterparts. First, investors anticipated that worsening economic news would prompt the U.S. Federal Reserve to initiate another round of quantitative easing to stimulate the economy — which it did in September 2012. Finally, in an increasingly global marketplace, a case could be made that the U.S. market was relatively attractive versus many other world markets for much of the period. Amid ongoing European turmoil and a slowdown in Chinese growth, the U.S. market was one of the few places investors could find an economy that was growing (albeit slowly); a liquid, transparent and generally well-regulated market; and an opportunity to find companies with large cash reserves and solid profit growth.
In the final weeks of the period, however, stocks gave back some of their gains as the market seemed to have come full
circle; amid uncertainty about the upcoming U.S. elections, investors once again worried about a Congressional deadlock on tax policy — an impasse that has left the United States rushing toward a fiscal cliff that could drag down the U.S. and global economies.
Fund Performance
For the fiscal year ended October 31, 2012, Eaton Vance Tax-Managed Equity Asset Allocation Fund (the Fund) had a total return of 11.81% for Class A shares at net asset value (NAV). By comparison, the Fund’s benchmark, the Russell 3000 Index (the Index), gained 14.75% for the period. The Fund’s performance is a function of the performance of the underlying Portfolios in which it invests, as well as its allocation among these Portfolios.
The biggest detractor from relative Fund performance versus the Index was the Fund’s international equity weighting relative to the Index, which has no international stock exposure. International equities generally underperformed their U.S. counterparts during the period. However, the international portfolio in which the Fund invests outperformed its benchmark, the MSCI EAFE Index. The Fund’s international equity allocation was increased during the period, which helped relative performance versus the Index in the second half of the period, when international stocks rebounded. Also detracting from the Fund’s performance relative to the Index was the Fund’s allocation to Portfolios investing in small-cap stocks, which generally underperformed large-cap stocks during the period.
On the positive side, the Fund’s performance relative to the Index was aided by an overweight position in Tax-Managed Value Portfolio, which invests in large-cap value stocks. During the period, value stocks, and large-cap value stocks in particular, generally outperformed growth stocks.
Adjustments to the underlying Fund allocations occurred once during the 12-month period, in June 2012, and included a 0.50% decrease in each of five portfolios — Tax-Managed Growth Portfolio, Tax-Managed Value Portfolio, Tax-Managed Multi-Cap Growth Portfolio, Tax-Managed Small-Cap Portfolio and Tax-Managed Small-Cap Value Portfolio. Conversely, the Fund’s allocation to the Tax-Managed International Equity Portfolio was increased by 2.50%.
See Endnotes and Additional Disclosures in this report.
Past performance is no guarantee of future results. Returns are historical and are calculated by determining the percentage change in net asset value (NAV) or offering price (as applicable) with all distributions reinvested. Investment return and principal value will fluctuate so that shares, when redeemed, may be worth more or less than their original cost. Performance less than one year is cumulative. Performance is for the stated time period only; due to market volatility, the Fund’s current performance may be lower or higher than quoted. Returns are before taxes unless otherwise noted. For performance as of the most recent month end, please refer to www.eatonvance.com.
Eaton Vance
Tax-Managed Equity Asset Allocation Fund
October 31, 2012
Performance2,3
Portfolio Manager Duncan W. Richardson, CFA
| | | | | | | | | | | | | | | | |
| % Average Annual Total Returns | | Inception Date | | | One Year | | | Five Years | | | Ten Years | |
Class A at NAV | | | 03/04/2002 | | | | 11.81 | % | | | –1.78 | % | | | 7.10 | % |
Class A with 5.75% Maximum Sales Charge | | | — | | | | 5.38 | | | | –2.94 | | | | 6.47 | |
Class B at NAV | | | 03/04/2002 | | | | 10.96 | | | | –2.52 | | | | 6.30 | |
Class B with 5% Maximum Sales Charge | | | — | | | | 5.96 | | | | –2.89 | | | | 6.30 | |
Class C at NAV | | | 03/04/2002 | | | | 11.10 | | | | –2.51 | | | | 6.31 | |
Class C with 1% Maximum Sales Charge | | | — | | | | 10.10 | | | | –2.51 | | | | 6.31 | |
Russell 3000 Index | | | — | | | | 14.75 | % | | | 0.58 | % | | | 7.47 | % |
| | | | |
| | | | | | | | | | | | | | | | |
| % After-Tax Returns with Maximum Sales Charge | | Inception Date | | | One Year | | | Five Years | | | Ten Years | |
Class A After Taxes on Distributions | | | 03/04/2002 | | | | 5.31 | % | | | –3.17 | % | | | 6.26 | % |
Class A After Taxes on Distributions and Sale of Fund Shares | | | — | | | | 3.57 | | | | –2.48 | | | | 5.69 | |
Class B After Taxes on Distributions | | | 03/04/2002 | | | | 5.96 | | | | –3.06 | | | | 6.12 | |
Class B After Taxes on Distributions and Sale of Fund Shares | | | — | | | | 3.88 | | | | –2.42 | | | | 5.54 | |
Class C After Taxes on Distributions | | | 03/04/2002 | | | | 10.10 | | | | –2.68 | | | | 6.13 | |
Class C After Taxes on Distributions and Sale of Fund Shares | | | — | | | | 6.57 | | | | –2.10 | | | | 5.56 | |
| | | | |
| | | | | | | | | | | | | | | | |
| % Total Annual Operating Expense Ratios4 | | | | | Class A | | | Class B | | | Class C | |
| | | | | | | 1.37 | % | | | 2.12 | % | | | 2.12 | % |
Performance of $10,000
This graph shows the change in value of a hypothetical investment of $10,000 in Class A of the Fund for the period indicated. For comparison, the same investment is shown in the indicated index.
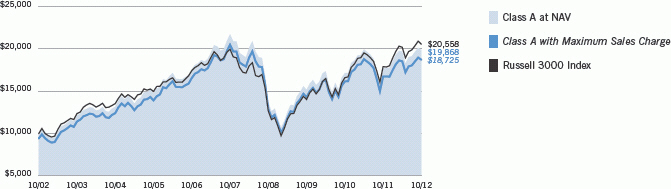
| | | | | | | | |
| Performance of Investment | | Amount Invested | | Period Beginning | | At NAV | | With Maximum Sales Charge |
Class B | | $10,000 | | 10/31/2002 | | $18,425 | | N.A. |
Class C | | $10,000 | | 10/31/2002 | | $18,449 | | N.A. |
See Endnotes and Additional Disclosures in this report.
Past performance is no guarantee of future results. Returns are historical and are calculated by determining the percentage change in net asset value (NAV) or offering price (as applicable) with all distributions reinvested. Investment return and principal value will fluctuate so that shares, when redeemed, may be worth more or less than their original cost. Performance less than one year is cumulative. Performance is for the stated time period only; due to market volatility, the Fund’s current performance may be lower or higher than quoted. Returns are before taxes unless otherwise noted. For performance as of the most recent month end, please refer to www.eatonvance.com.
Eaton Vance
Tax-Managed Equity Asset Allocation Fund
October 31, 2012
Fund Profile5
Portfolio Allocation (% of total investments)
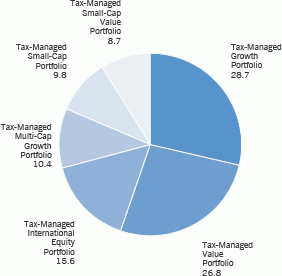
See Endnotes and Additional Disclosures in this report.
Eaton Vance
Tax-Managed Equity Asset Allocation Fund
October 31, 2012
Endnotes and Additional Disclosures
| 1 | The views expressed in this report are those of the portfolio manager(s) and are current only through the date stated at the top of this page. These views are subject to change at any time based upon market or other conditions, and Eaton Vance and the Fund(s) disclaim any responsibility to update such views. These views may not be relied upon as investment advice and, because investment decisions are based on many factors, may not be relied upon as an indication of trading intent on behalf of any Eaton Vance fund. This commentary may contain statements that are not historical facts, referred to as “forward looking statements”. The Fund’s actual future results may differ significantly from those stated in any forward looking statement, depending on factors such as changes in securities or financial markets or general economic conditions, the volume of sales and purchases of Fund shares, the continuation of investment advisory, administrative and service contracts, and other risks discussed from time to time in the Fund’s filings with the Securities and Exchange Commission. |
| 2 | MSCI World Index is an unmanaged index of equity securities in the developed markets. MSCI EAFE Index is an unmanaged index of equities in the developed markets, excluding the U.S. and Canada. MSCI indices are net of foreign withholding taxes. Source: MSCI. MSCI data may not be reproduced or used for any other purpose. MSCI provides no warranties, has not prepared or approved this report, and has no liability hereunder. Russell 3000 Index is an unmanaged index of the 3,000 largest U.S. stocks. Unless otherwise stated, index returns do not reflect the effect of any applicable sales charges, commissions, expenses, taxes or leverage, as applicable. It is not possible to invest directly in an index. |
| 3 | Total Returns at NAV do not include applicable sales charges. If sales charges were deducted, the returns would be lower. Total Returns shown with maximum sales charge reflect the stated maximum sales charge. Unless otherwise stated, performance does not reflect the deduction of taxes on Fund distributions or redemptions of Fund shares. After-tax returns are calculated using certain assumptions, including using the highest historical individual federal income tax rates and do not reflect the impact of state/local taxes. Actual after-tax returns depend on a shareholder’s tax situation and the actual characterization of distributions and may differ from those shown. After-tax returns are not relevant to shareholders who hold shares in tax-deferred accounts or shares held by nontaxable entities. Return After Taxes on Distributions may be the same as Return Before Taxes for the same period because no taxable distributions were made during that period. Return After Taxes on Distributions and Sale of Fund Shares may be greater than or equal to Return After Taxes on Distributions for the same period because of losses realized on the sale of Fund shares. The Fund’s after-tax returns also may reflect foreign tax credits passed by the Fund to its shareholders. |
| 4 | Source: Fund prospectus. |
| 5 | Fund invests in one or more affiliated investment companies (Portfolios). |
| | Fund profile subject to change due to active management. |
Important Notice to Shareholders
Tax code provisions applicable to tax-favored dividends are effective for distributions paid on or before December 31, 2012. Thereafter, dividends will be taxable as ordinary income unless further legislative action is taken.
Eaton Vance
Tax-Managed Equity Asset Allocation Fund
October 31, 2012
Fund Expenses
Example: As a Fund shareholder, you incur two types of costs: (1) transaction costs, including sales charges (loads) on purchases and redemption fees (if applicable); and (2) ongoing costs, including management fees; distribution and/or service fees; and other Fund expenses. This Example is intended to help you understand your ongoing costs (in dollars) of Fund investing and to compare these costs with the ongoing costs of investing in other mutual funds. The Example is based on an investment of $1,000 invested at the beginning of the period and held for the entire period (May 1, 2012 – October 31, 2012).
Actual Expenses: The first section of the table below provides information about actual account values and actual expenses. You may use the information in this section, together with the amount you invested, to estimate the expenses that you paid over the period. Simply divide your account value by $1,000 (for example, an $8,600 account value divided by $1,000 = 8.6), then multiply the result by the number in the first section under the heading entitled “Expenses Paid During Period” to estimate the expenses you paid on your account during this period.
Hypothetical Example for Comparison Purposes: The second section of the table below provides information about hypothetical account values and hypothetical expenses based on the actual Fund expense ratio and an assumed rate of return of 5% per year (before expenses), which is not the actual Fund return. The hypothetical account values and expenses may not be used to estimate the actual ending account balance or expenses you paid for the period. You may use this information to compare the ongoing costs of investing in your Fund and other funds. To do so, compare this 5% hypothetical example with the 5% hypothetical examples that appear in the shareholder reports of the other funds.
Please note that the expenses shown in the table are meant to highlight your ongoing costs only and do not reflect any transactional costs, such as sales charges (loads) or redemption fees (if applicable). Therefore, the second section of the table is useful in comparing ongoing costs only, and will not help you determine the relative total costs of owning different funds. In addition, if these transactional costs were included, your costs would be higher.
| | | | | | | | | | | | | | | | |
| | | Beginning
Account Value
(5/1/12) | | | Ending
Account Value
(10/31/12) | | | Expenses Paid
During Period*
(5/1/12 – 10/31/12) | | | Annualized
Expense
Ratio | |
| | | | |
| | | | | | | | | | | | | | | | |
Actual | | | | | | | | | | | | | |
Class A | | $ | 1,000.00 | | | $ | 1,009.90 | | | $ | 6.82 | | | | 1.35 | % |
Class B | | $ | 1,000.00 | | | $ | 1,006.70 | | | $ | 10.59 | | | | 2.10 | % |
Class C | | $ | 1,000.00 | | | $ | 1,006.80 | | | $ | 10.59 | | | | 2.10 | % |
| | | | | | | | | | | | | | | | | |
| | | | |
| | | | | | | | | | | | | | | | |
Hypothetical | | | | | | | | | | | | | |
(5% return per year before expenses) | | | | | | | | | | | | | |
Class A | | $ | 1,000.00 | | | $ | 1,018.30 | | | $ | 6.85 | | | | 1.35 | % |
Class B | | $ | 1,000.00 | | | $ | 1,014.60 | | | $ | 10.63 | | | | 2.10 | % |
Class C | | $ | 1,000.00 | | | $ | 1,014.60 | | | $ | 10.63 | | | | 2.10 | % |
| * | Expenses are equal to the Fund’s annualized expense ratio for the indicated Class, multiplied by the average account value over the period, multiplied by 184/366 (to reflect the one-half year period). The Example assumes that the $1,000 was invested at the net asset value per share determined at the close of business on April 30, 2012. The Example reflects the expenses of both the Fund and the Portfolios. |
Eaton Vance
Tax-Managed Equity Asset Allocation Fund
October 31, 2012
Statement of Assets and Liabilities
| | | | |
| Assets | | October 31, 2012 | |
Investment in Tax-Managed Growth Portfolio, at value | | | | |
(identified cost, $89,001,409) | | $ | 109,542,280 | |
Investment in Tax-Managed Value Portfolio, at value | | | | |
(identified cost, $76,960,179) | | | 102,509,961 | |
Investment in Tax-Managed International Equity Portfolio, at value | | | | |
(identified cost, $56,624,052) | | | 59,433,390 | |
Investment in Tax-Managed Multi-Cap Growth Portfolio, at value | | | | |
(identified cost, $33,633,353) | | | 39,608,367 | |
Investment in Tax-Managed Small-Cap Portfolio, at value | | | | |
(identified cost, $33,876,496) | | | 37,311,979 | |
Investment in Tax-Managed Small-Cap Value Portfolio, at value | | | | |
(identified cost, $24,067,655) | | | 33,341,085 | |
Receivable for Fund shares sold | | | 59,694 | |
Total assets | | $ | 381,806,756 | |
|
| Liabilities | |
Payable for Fund shares redeemed | | $ | 362,019 | |
Payable to affiliates: | | | | |
Investment adviser fee | | | 38,319 | |
Distribution and service fees | | | 191,010 | |
Administration fee | | | 49,340 | |
Trustees’ fees | | | 42 | |
Accrued expenses | | | 151,286 | |
Total liabilities | | $ | 792,016 | |
Net Assets | | $ | 381,014,740 | |
|
| Sources of Net Assets | |
Paid-in capital | | $ | 288,442,229 | |
Accumulated net realized gain from Portfolios | | | 24,060,598 | |
Accumulated undistributed net investment income | | | 927,995 | |
Net unrealized appreciation from Portfolios | | | 67,583,918 | |
Total | | $ | 381,014,740 | |
|
| Class A Shares | |
Net Assets | | $ | 213,243,563 | |
Shares Outstanding | | | 14,990,759 | |
Net Asset Value and Redemption Price Per Share | | | | |
(net assets ÷ shares of beneficial interest outstanding) | | $ | 14.23 | |
Maximum Offering Price Per Share | | | | |
(100 ÷ 94.25 of net asset value per share) | | $ | 15.10 | |
|
| Class B Shares | |
Net Assets | | $ | 19,055,077 | |
Shares Outstanding | | | 1,415,270 | |
Net Asset Value and Offering Price Per Share* | | | | |
(net assets ÷ shares of beneficial interest outstanding) | | $ | 13.46 | |
|
| Class C Shares | |
Net Assets | | $ | 148,716,100 | |
Shares Outstanding | | | 11,092,691 | |
Net Asset Value and Offering Price Per Share* | | | | |
(net assets ÷ shares of beneficial interest outstanding) | | $ | 13.41 | |
On sales of $50,000 or more, the offering price of Class A shares is reduced.
| * | Redemption price per share is equal to the net asset value less any applicable contingent deferred sales charge. |
| | | | |
| | 7 | | See Notes to Financial Statements. |
Eaton Vance
Tax-Managed Equity Asset Allocation Fund
October 31, 2012
Statement of Operations
| | | | |
| Investment Income | | Year Ended
October 31, 2012 | |
Dividends allocated from Portfolios (net of foreign taxes, $244,452) | | $ | 8,359,383 | |
Interest allocated from Portfolios | | | 6,193 | |
Securities lending income allocated from Portfolios, net | | | 5,497 | |
Expenses allocated from Portfolios | | | (2,858,129 | ) |
Net investment income from Portfolios | | $ | 5,512,944 | |
| |
| Expenses | | | | |
Investment adviser fee | | $ | 392,221 | |
Administration fee | | | 592,755 | |
Distribution and service fees | | | | |
Class A | | | 547,195 | |
Class B | | | 236,767 | |
Class C | | | 1,526,152 | |
Trustees’ fees and expenses | | | 500 | |
Custodian fee | | | 47,814 | |
Transfer and dividend disbursing agent fees | | | 323,057 | |
Legal and accounting services | | | 77,594 | |
Printing and postage | | | 39,375 | |
Registration fees | | | 44,994 | |
Miscellaneous | | | 12,298 | |
Total expenses | | $ | 3,840,722 | |
| |
Net investment income | | $ | 1,672,222 | |
| |
| Realized and Unrealized Gain (Loss) from Portfolios | | | | |
Net realized gain (loss) allocated from Portfolios — | | | | |
Investment transactions | | $ | 33,249,357 | (1) |
Written options | | | 220,661 | |
Foreign currency transactions | | | (29,673 | ) |
Net realized gain | | $ | 33,440,345 | |
Change in unrealized appreciation (depreciation) — | | | | |
Investments | | $ | 8,794,055 | |
Written options | | | (110 | ) |
Foreign currency | | | (884,552 | ) |
Net change in unrealized appreciation (depreciation) | | $ | 7,909,393 | |
| |
Net realized and unrealized gain | | $ | 41,349,738 | |
| |
Net increase in net assets from operations | | $ | 43,021,960 | |
| (1) | Includes $4,739,025 of net realized gains from redemptions in-kind. |
| | | | |
| | 8 | | See Notes to Financial Statements. |
Eaton Vance
Tax-Managed Equity Asset Allocation Fund
October 31, 2012
Statements of Changes in Net Assets
| | | | | | | | |
| | | Year Ended October 31, | |
| Increase (Decrease) in Net Assets | | 2012 | | | 2011 | |
From operations — | | | | | | | | |
Net investment income | | $ | 1,672,222 | | | $ | 725,315 | |
Net realized gain from investment transactions, written options and foreign currency transactions | | | 33,440,345 | (1) | | | 34,903,387 | |
Net change in unrealized appreciation (depreciation) from investments, written options and foreign currency | | | 7,909,393 | | | | (17,055,027 | ) |
Net increase in net assets from operations | | $ | 43,021,960 | | | $ | 18,573,675 | |
Distributions to shareholders — | | | | | | | | |
From net investment income | | | | | | | | |
Class A | | $ | (872,084 | ) | | $ | (531,468 | ) |
Total distributions to shareholders | | $ | (872,084 | ) | | $ | (531,468 | ) |
Transactions in shares of beneficial interest — | | | | | | | | |
Proceeds from sale of shares | | | | | | | | |
Class A | | $ | 7,222,086 | | | $ | 17,235,826 | |
Class B | | | 161,351 | | | | 1,120,023 | |
Class C | | | 6,368,283 | | | | 11,290,463 | |
Net asset value of shares issued to shareholders in payment of distributions declared | | | | | | | | |
Class A | | | 768,823 | | | | 456,927 | |
Cost of shares redeemed | | | | | | | | |
Class A | | | (47,117,694 | ) | | | (71,551,231 | ) |
Class B | | | (4,801,202 | ) | | | (8,726,153 | ) |
Class C | | | (31,393,397 | ) | | | (41,209,065 | ) |
Net asset value of shares exchanged | | | | | | | | |
Class A | | | 8,543,902 | | | | 11,623,805 | |
Class B | | | (8,543,902 | ) | | | (11,623,805 | ) |
Net decrease in net assets from Fund share transactions | | $ | (68,791,750 | ) | | $ | (91,383,210 | ) |
| | |
Net decrease in net assets | | $ | (26,641,874 | ) | | $ | (73,341,003 | ) |
|
| Net Assets | |
At beginning of year | | $ | 407,656,614 | | | $ | 480,997,617 | |
At end of year | | $ | 381,014,740 | | | $ | 407,656,614 | |
|
Accumulated undistributed (distributions in excess of) net investment income included in net assets | |
At end of year | | $ | 927,995 | | | $ | (290,840 | ) |
| (1) | Includes $4,739,025 of net realized gains from redemptions in-kind. |
| | | | |
| | 9 | | See Notes to Financial Statements. |
Eaton Vance
Tax-Managed Equity Asset Allocation Fund
October 31, 2012
Financial Highlights
| | | | | | | | | | | | | | | | | | | | |
| | | Class A | |
| | | Year Ended October 31, | |
| | | 2012 | | | 2011 | | | 2010 | | | 2009 | | | 2008 | |
Net asset value — Beginning of year | | $ | 12.770 | | | $ | 12.350 | | | $ | 11.030 | | | $ | 10.000 | | | $ | 16.900 | |
| | | | | |
| Income (Loss) From Operations | | | | | | | | | | | | | | | | | | | | |
Net investment income(1) | | $ | 0.103 | | | $ | 0.067 | | | $ | 0.032 | | | $ | 0.074 | | | $ | 0.102 | |
Net realized and unrealized gain (loss) | | | 1.409 | | | | 0.379 | | | | 1.392 | | | | 1.011 | | | | (6.018 | ) |
| | | | | |
Total income (loss) from operations | | $ | 1.512 | | | $ | 0.446 | | | $ | 1.424 | | | $ | 1.085 | | | $ | (5.916 | ) |
| | | | | |
| Less Distributions | | | | | | | | | | | | | | | | | | | | |
From net investment income | | $ | (0.052 | ) | | $ | (0.026 | ) | | $ | (0.104 | ) | | $ | (0.055 | ) | | $ | (0.156 | ) |
From net realized gain | | | — | | | | — | | | | — | | | | — | | | | (0.828 | ) |
| | | | | |
Total distributions | | $ | (0.052 | ) | | $ | (0.026 | ) | | $ | (0.104 | ) | | $ | (0.055 | ) | | $ | (0.984 | ) |
| | | | | |
Net asset value — End of year | | $ | 14.230 | | | $ | 12.770 | | | $ | 12.350 | | | $ | 11.030 | | | $ | 10.000 | |
| | | | | |
Total Return(2) | | | 11.81 | % | | | 3.61 | % | | | 12.95 | % | | | 10.98 | % | | | (37.07 | )% |
| | | | | |
| Ratios/Supplemental Data | | | | | | | | | | | | | | | | | | | | |
Net assets, end of year (000’s omitted) | | $ | 213,244 | | | $ | 220,256 | | | $ | 252,522 | | | $ | 250,372 | | | $ | 258,039 | |
Ratios (as a percentage of average daily net assets): | | | | | | | | | | | | | | | | | | | | |
Expenses(3)(4) | | | 1.36 | % | | | 1.37 | % | | | 1.41 | % | | | 1.44 | % | | | 1.36 | % |
Net investment income | | | 0.76 | % | | | 0.51 | % | | | 0.27 | % | | | 0.78 | % | | | 0.72 | % |
Portfolio Turnover of the Fund(5) | | | 0 | %(6) | | | 12 | % | | | 0 | %(6) | | | 2 | % | | | 8 | % |
Portfolio Turnover of Tax-Managed Growth Portfolio | | | 2 | % | | | 3 | % | | | 2 | % | | | 3 | % | | | 1 | % |
Portfolio Turnover of Tax-Managed Value Portfolio | | | 38 | % | | | 40 | % | | | 35 | % | | | 82 | % | | | 84 | % |
Portfolio Turnover of Tax-Managed International Equity Portfolio | | | 117 | % | | | 41 | % | | | 72 | % | | | 57 | % | | | 34 | % |
Portfolio Turnover of Tax-Managed Multi-Cap Growth Portfolio | | | 83 | % | | | 139 | % | | | 200 | % | | | 205 | % | | | 283 | % |
Portfolio Turnover of Tax-Managed Mid-Cap Core Portfolio | | | — | | | | 16 | %(7) | | | 33 | % | | | 42 | % | | | 40 | % |
Portfolio Turnover of Tax-Managed Small-Cap Portfolio | | | 57 | % | | | 89 | % | | | 114 | % | | | 95 | % | | | 93 | % |
Portfolio Turnover of Tax-Managed Small-Cap Value Portfolio | | | 55 | % | | | 66 | % | | | 51 | % | | | 66 | % | | | 103 | % |
| (1) | Computed using average shares outstanding. |
| (2) | Returns are historical and are calculated by determining the percentage change in net asset value with all distributions reinvested and do not reflect the effect of sales charges. |
| (3) | Includes the Fund’s share of the Portfolios’ allocated expenses. |
| (4) | Excludes the effect of custody fee credits, if any, of less than 0.005%. |
| (5) | Percentage is based on the Fund’s contributions to and withdrawals from the Portfolios and excludes the investment activity of the Portfolios. |
| (6) | Amount is less than 0.5%. |
| (7) | For the period from November 1, 2010 through the liquidation date of Tax Managed Mid-Cap Core Portfolio, on April 21, 2011. |
| | | | |
| | 10 | | See Notes to Financial Statements. |
Eaton Vance
Tax-Managed Equity Asset Allocation Fund
October 31, 2012
Financial Highlights — continued
| | | | | | | | | | | | | | | | | | | | |
| | | Class B | |
| | | Year Ended October 31, | |
| | | 2012 | | | 2011 | | | 2010 | | | 2009 | | | 2008 | |
Net asset value — Beginning of year | | $ | 12.130 | | | $ | 11.790 | | | $ | 10.540 | | | $ | 9.570 | | | $ | 16.210 | |
| | | | | |
| Income (Loss) From Operations | | | | | | | | | | | | | | | | | | | | |
Net investment income (loss)(1) | | $ | 0.001 | | | $ | (0.030 | ) | | $ | (0.053 | ) | | $ | 0.022 | | | $ | (0.004 | ) |
Net realized and unrealized gain (loss) | | | 1.329 | | | | 0.370 | | | | 1.325 | | | | 0.948 | | | | (5.775 | ) |
| | | | | |
Total income (loss) from operations | | $ | 1.330 | | | $ | 0.340 | | | $ | 1.272 | | | $ | 0.970 | | | $ | (5.779 | ) |
| | | | | |
| Less Distributions | | | | | | | | | | | | | | | | | | | | |
From net investment income | | $ | — | | | $ | — | | | $ | (0.022 | ) | | $ | — | | | $ | (0.033 | ) |
From net realized gain | | | — | | | | — | | | | — | | | | — | | | | (0.828 | ) |
| | | | | |
Total distributions | | $ | — | | | $ | — | | | $ | (0.022 | ) | | $ | — | | | $ | (0.861 | ) |
| | | | | |
Net asset value — End of year | | $ | 13.460 | | | $ | 12.130 | | | $ | 11.790 | | | $ | 10.540 | | | $ | 9.570 | |
| | | | | |
Total Return(2) | | | 10.96 | % | | | 2.88 | % | | | 12.07 | % | | | 10.14 | % | | | (37.56 | )% |
| | | | | |
| Ratios/Supplemental Data | | | | | | | | | | | | | | | | | | | | |
Net assets, end of year (000’s omitted) | | $ | 19,055 | | | $ | 29,592 | | | $ | 46,862 | | | $ | 61,375 | | | $ | 78,618 | |
Ratios (as a percentage of average daily net assets): | | | | | | | | | | | | | | | | | | | | |
Expenses(3)(4) | | | 2.11 | % | | | 2.12 | % | | | 2.16 | % | | | 2.19 | % | | | 2.11 | % |
Net investment income (loss) | | | 0.01 | % | | | (0.24 | )% | | | (0.47 | )% | | | 0.24 | % | | | (0.03 | )% |
Portfolio Turnover of the Fund(5) | | | 0 | %(6) | | | 12 | % | | | 0 | %(6) | | | 2 | % | | | 8 | % |
Portfolio Turnover of Tax-Managed Growth Portfolio | | | 2 | % | | | 3 | % | | | 2 | % | | | 3 | % | | | 1 | % |
Portfolio Turnover of Tax-Managed Value Portfolio | | | 38 | % | | | 40 | % | | | 35 | % | | | 82 | % | | | 84 | % |
Portfolio Turnover of Tax-Managed International Equity Portfolio | | | 117 | % | | | 41 | % | | | 72 | % | | | 57 | % | | | 34 | % |
Portfolio Turnover of Tax-Managed Multi-Cap Growth Portfolio | | | 83 | % | | | 139 | % | | | 200 | % | | | 205 | % | | | 283 | % |
Portfolio Turnover of Tax-Managed Mid-Cap Core Portfolio | | | — | | | | 16 | %(7) | | | 33 | % | | | 42 | % | | | 40 | % |
Portfolio Turnover of Tax-Managed Small-Cap Portfolio | | | 57 | % | | | 89 | % | | | 114 | % | | | 95 | % | | | 93 | % |
Portfolio Turnover of Tax-Managed Small-Cap Value Portfolio | | | 55 | % | | | 66 | % | | | 51 | % | | | 66 | % | | | 103 | % |
| (1) | Computed using average shares outstanding. |
| (2) | Returns are historical and are calculated by determining the percentage change in net asset value with all distributions reinvested and do not reflect the effect of sales charges. |
| (3) | Includes the Fund’s share of the Portfolios’ allocated expenses. |
| (4) | Excludes the effect of custody fee credits, if any, of less than 0.005%. |
| (5) | Percentage is based on the Fund’s contributions to and withdrawals from the Portfolios and excludes the investment activity of the Portfolios. |
| (6) | Amount is less than 0.5%. |
| (7) | For the period from November 1, 2010 through the liquidation date of Tax Managed Mid-Cap Core Portfolio, on April 21, 2011. |
| | | | |
| | 11 | | See Notes to Financial Statements. |
Eaton Vance
Tax-Managed Equity Asset Allocation Fund
October 31, 2012
Financial Highlights — continued
| | | | | | | | | | | | | | | | | | | | |
| | | Class C | |
| | | Year Ended October 31, | |
| | | 2012 | | | 2011 | | | 2010 | | | 2009 | | | 2008 | |
Net asset value — Beginning of year | | $ | 12.070 | | | $ | 11.740 | | | $ | 10.500 | | | $ | 9.530 | | | $ | 16.180 | |
| | | | | |
| Income (Loss) From Operations | | | | | | | | | | | | | | | | | | | | |
Net investment income (loss)(1) | | $ | 0.001 | | | $ | (0.031 | ) | | $ | (0.053 | ) | | $ | 0.018 | | | $ | (0.004 | ) |
Net realized and unrealized gain (loss) | | | 1.339 | | | | 0.361 | | | | 1.323 | | | | 0.952 | | | | (5.761 | ) |
| | | | | |
Total income (loss) from operations | | $ | 1.340 | | | $ | 0.330 | | | $ | 1.270 | | | $ | 0.970 | | | $ | (5.765 | ) |
| | | | | |
| Less Distributions | | | | | | | | | | | | | | | | | | | | |
From net investment income | | $ | — | | | $ | — | | | $ | (0.030 | ) | | $ | — | | | $ | (0.057 | ) |
From net realized gain | | | — | | | | — | | | | — | | | | — | | | | (0.828 | ) |
| | | | | |
Total distributions | | $ | — | | | $ | — | | | $ | (0.030 | ) | | $ | — | | | $ | (0.885 | ) |
| | | | | |
Net asset value — End of year | | $ | 13.410 | | | $ | 12.070 | | | $ | 11.740 | | | $ | 10.500 | | | $ | 9.530 | |
| | | | | |
Total Return(2) | | | 11.10 | % | | | 2.81 | % | | | 12.11 | % | | | 10.18 | % | | | (37.60 | )% |
| | | | | |
| Ratios/Supplemental Data | | | | | | | | | | | | | | | | | | | | |
Net assets, end of year (000’s omitted) | | $ | 148,716 | | | $ | 157,808 | | | $ | 181,613 | | | $ | 186,912 | | | $ | 195,347 | |
Ratios (as a percentage of average daily net assets): | | | | | | | | | | | | | | | | | | | | |
Expenses(3)(4) | | | 2.11 | % | | | 2.12 | % | | | 2.16 | % | | | 2.19 | % | | | 2.11 | % |
Net investment income (loss) | | | 0.01 | % | | | (0.24 | )% | | | (0.48 | )% | | | 0.20 | % | | | (0.03 | )% |
Portfolio Turnover of the Fund(5) | | | 0 | %(6) | | | 12 | % | | | 0 | %(6) | | | 2 | % | | | 8 | % |
Portfolio Turnover of Tax-Managed Growth Portfolio | | | 2 | % | | | 3 | % | | | 2 | % | | | 3 | % | | | 1 | % |
Portfolio Turnover of Tax-Managed Value Portfolio | | | 38 | % | | | 40 | % | | | 35 | % | | | 82 | % | | | 84 | % |
Portfolio Turnover of Tax-Managed International Equity Portfolio | | | 117 | % | | | 41 | % | | | 72 | % | | | 57 | % | | | 34 | % |
Portfolio Turnover of Tax-Managed Multi-Cap Growth Portfolio | | | 83 | % | | | 139 | % | | | 200 | % | | | 205 | % | | | 283 | % |
Portfolio Turnover of Tax-Managed Mid-Cap Core Portfolio | | | — | | | | 16 | %(7) | | | 33 | % | | | 42 | % | | | 40 | % |
Portfolio Turnover of Tax-Managed Small-Cap Portfolio | | | 57 | % | | | 89 | % | | | 114 | % | | | 95 | % | | | 93 | % |
Portfolio Turnover of Tax-Managed Small-Cap Value Portfolio | | | 55 | % | | | 66 | % | | | 51 | % | | | 66 | % | | | 103 | % |
| (1) | Computed using average shares outstanding. |
| (2) | Returns are historical and are calculated by determining the percentage change in net asset value with all distributions reinvested and do not reflect the effect of sales charges. |
| (3) | Includes the Fund’s share of the Portfolios’ allocated expenses. |
| (4) | Excludes the effect of custody fee credits, if any, of less than 0.005%. |
| (5) | Percentage is based on the Fund’s contributions to and withdrawals from the Portfolios and excludes the investment activity of the Portfolios. |
| (6) | Amount is less than 0.5%. |
| (7) | For the period from November 1, 2010 through the liquidation date of Tax Managed Mid-Cap Core Portfolio, on April 21, 2011. |
| | | | |
| | 12 | | See Notes to Financial Statements. |
Eaton Vance
Tax-Managed Equity Asset Allocation Fund
October 31, 2012
Notes to Financial Statements
1 Significant Accounting Policies
Eaton Vance Tax-Managed Equity Asset Allocation Fund (the Fund) is a diversified series of Eaton Vance Mutual Funds Trust (the Trust). The Trust is a Massachusetts business trust registered under the Investment Company Act of 1940, as amended (the 1940 Act), as an open-end management investment company. The Fund offers three classes of shares. Class A shares are generally sold subject to a sales charge imposed at time of purchase. Class B and Class C shares are sold at net asset value and are generally subject to a contingent deferred sales charge (see Note 5). Class B shares automatically convert to Class A shares eight years after their purchase as described in the Fund’s prospectus. Beginning January 1, 2012, Class B shares are only available for purchase upon exchange from another Eaton Vance fund or through reinvestment of distributions. Each class represents a pro-rata interest in the Fund, but votes separately on class-specific matters and (as noted below) is subject to different expenses. Realized and unrealized gains and losses and net investment income and losses, other than class-specific expenses, are allocated daily to each class of shares based on the relative net assets of each class to the total net assets of the Fund. Each class of shares differs in its distribution plan and certain other class-specific expenses. The Fund’s investment objective is to achieve long-term, after tax returns. The Fund currently pursues its objective by investing all of its investable assets in interests in the following six tax-managed equity portfolios managed by Eaton Vance Management (EVM) or its affiliates: Tax-Managed Growth Portfolio, Tax-Managed Value Portfolio, Tax-Managed International Equity Portfolio, Tax-Managed Multi-Cap Growth Portfolio, Tax-Managed Small-Cap Portfolio and Tax-Managed Small-Cap Value Portfolio (the Portfolios), which are Massachusetts business trusts. The value of the Fund’s investments in the Portfolios reflects the Fund’s proportionate interest in the net assets of Tax-Managed Growth Portfolio, Tax-Managed Value Portfolio, Tax-Managed International Equity Portfolio, Tax-Managed Multi-Cap Growth Portfolio, Tax-Managed Small-Cap Portfolio and Tax-Managed Small-Cap Value Portfolio, (1.4%, 12.0%, 57.5%, 42.0%, 27.5% and 47.6%, respectively, at October 31, 2012). The performance of the Fund is directly affected by the performance of the Portfolios. A copy of each Portfolio’s financial statements is available on the EDGAR database on the Securities and Exchange Commission’s website (www.sec.gov), at the Commission’s public reference room in Washington, DC or upon request from the Fund’s principal underwriter, Eaton Vance Distributors, Inc. (EVD), by calling 1-800-262-1122.
The following is a summary of significant accounting policies of the Fund. The policies are in conformity with accounting principles generally accepted in the United States of America.
A Investment Valuation — The valuation policy of each Portfolio is as follows: Equity securities (including common shares of closed-end investment companies) listed on a U.S. securities exchange generally are valued at the last sale or closing price on the day of valuation or, if no sales took place on such date, at the mean between the closing bid and asked prices therefore on the exchange where such securities are principally traded. Equity securities listed on the NASDAQ Global or Global Select Market generally are valued at the NASDAQ official closing price. Unlisted or listed securities for which closing sales prices or closing quotations are not available are valued at the mean between the latest available bid and asked prices or, in the case of preferred equity securities that are not listed or traded in the over-the-counter market, by a third party pricing service that will use various techniques that consider factors including, but not limited to, prices or yields of securities with similar characteristics, benchmark yields, broker/dealer quotes, quotes of underlying common stock, issuer spreads, as well as industry and economic events. Exchange-traded options are valued at the mean between the bid and asked prices at valuation time as reported by the Options Price Reporting Authority for U.S. listed options or by the relevant exchange or board of trade for non-U.S. listed options. Over-the-counter options are valued by a third party pricing service using techniques that consider factors including the value of the underlying instrument, the volatility of the underlying instrument and the period of time until option expiration. Short-term obligations purchased with a remaining maturity of sixty days or less are generally valued at amortized cost, which approximates market value. Foreign securities and currencies are valued in U.S. dollars, based on foreign currency exchange rate quotations supplied by a third party pricing service. The pricing service uses a proprietary model to determine the exchange rate. Inputs to the model include reported trades and implied bid/ask spreads. The daily valuation of exchange-traded foreign securities generally is determined as of the close of trading on the principal exchange on which such securities trade. Events occurring after the close of trading on foreign exchanges may result in adjustments to the valuation of foreign securities to more accurately reflect their fair value as of the close of regular trading on the New York Stock Exchange. When valuing foreign equity securities that meet certain criteria, the Portfolio’s Trustees have approved the use of a fair value service that values such securities to reflect market trading that occurs after the close of the applicable foreign markets of comparable securities or other instruments that have a strong correlation to the fair-valued securities. Investments for which valuations or market quotations are not readily available or are deemed unreliable are valued at fair value using methods determined in good faith by or at the direction of the Trustees of the Portfolio in a manner that fairly reflects the security’s value, or the amount that the Portfolio might reasonably expect to receive for the security upon its current sale in the ordinary course. Each such determination is based on a consideration of relevant factors, which are likely to vary from one pricing context to another. These factors may include, but are not limited to, the type of security, the existence of any contractual restrictions on the security’s disposition, the price and extent of public trading in similar securities of the issuer or of comparable companies or entities, quotations or relevant information obtained from broker/dealers or other market participants, information obtained from the issuer, analysts, and/or the appropriate stock exchange (for exchange-traded securities), an analysis of the company’s or entity’s financial condition, and an evaluation of the forces that influence the issuer and the market(s) in which the security is purchased and sold.
The Portfolios may invest in Eaton Vance Cash Reserves Fund, LLC (Cash Reserves Fund) and Eaton Vance Cash Collateral Fund, LLC (Cash Collateral Fund), affiliated investment companies managed by EVM. Cash Reserves Fund and Cash Collateral Fund generally value their investment securities utilizing the amortized cost valuation technique in accordance with Rule 2a-7 under the 1940 Act. This technique involves initially valuing a portfolio security at its cost and thereafter assuming a constant amortization to maturity of any discount or premium. If amortized cost is determined not to approximate fair value, Cash Reserves Fund and Cash Collateral Fund may value their investment securities based on available market quotations provided by a third party pricing service.
Eaton Vance
Tax-Managed Equity Asset Allocation Fund
October 31, 2012
Notes to Financial Statements — continued
B Income — The Fund’s net investment income or loss consists of the Fund’s pro-rata share of the net investment income or loss of the Portfolios, less all actual and accrued expenses of the Fund.
C Federal Taxes — The Fund’s policy is to comply with the provisions of the Internal Revenue Code applicable to regulated investment companies and to distribute to shareholders each year substantially all of its net investment income, and all or substantially all of its net realized capital gains. Accordingly, no provision for federal income or excise tax is necessary.
During the year ended October 31, 2012, a capital loss carryforward of $7,166,097 was utilized to offset net realized gains by the Fund.
As of October 31, 2012, the Fund had no uncertain tax positions that would require financial statement recognition, de-recognition, or disclosure. The Fund files a U.S. federal income tax return annually after its fiscal year-end, which is subject to examination by the Internal Revenue Service for a period of three years from the date of filing.
D Expenses — The majority of expenses of the Trust are directly identifiable to an individual fund. Expenses which are not readily identifiable to a specific fund are allocated taking into consideration, among other things, the nature and type of expense and the relative size of the funds.
E Expense Reduction — State Street Bank and Trust Company (SSBT) serves as custodian of the Fund. Pursuant to the custodian agreement, SSBT receives a fee reduced by credits, which are determined based on the average daily cash balance the Fund maintains with SSBT. All credit balances, if any, used to reduce the Fund’s custodian fees are reported as a reduction of expenses in the Statement of Operations.
F Use of Estimates — The preparation of the financial statements in conformity with accounting principles generally accepted in the United States of America requires management to make estimates and assumptions that affect the reported amounts of assets and liabilities at the date of the financial statements and the reported amounts of income and expense during the reporting period. Actual results could differ from those estimates.
G Indemnifications — Under the Trust’s organizational documents, its officers and Trustees may be indemnified against certain liabilities and expenses arising out of the performance of their duties to the Fund. Under Massachusetts law, if certain conditions prevail, shareholders of a Massachusetts business trust (such as the Trust) could be deemed to have personal liability for the obligations of the Trust. However, the Trust’s Declaration of Trust contains an express disclaimer of liability on the part of Fund shareholders and the By-laws provide that the Trust shall assume the defense on behalf of any Fund shareholders. Moreover, the By-laws also provide for indemnification out of Fund property of any shareholder held personally liable solely by reason of being or having been a shareholder for all loss or expense arising from such liability. Additionally, in the normal course of business, the Fund enters into agreements with service providers that may contain indemnification clauses. The Fund’s maximum exposure under these arrangements is unknown as this would involve future claims that may be made against the Fund that have not yet occurred.
H Other — Investment transactions are accounted for on a trade date basis. Dividends to shareholders are recorded on the ex-dividend date.
I Prior Period Adjustments — Subsequent to the issuance of the October 31, 2011 financial statements, management of the Fund determined that the Fund’s identified cost of its investment in Tax-Managed Growth Portfolio was overstated at October 31, 2011 and in prior years as a result of misstatements in the recognition of realized gains. Such misstatements aggregated to a total of approximately $20,000,000. The correction of these misstatements resulted in offsetting decreases to the net realized gain and the net change in unrealized depreciation within the Statement of Changes in Net Assets as previously presented of approximately $3,000,000 for the year ended October 31, 2011 and approximately $17,000,000 for years ending prior to October 31, 2011. These changes had no effect on the Fund’s net asset value, net assets, net increase in net assets from operations, financial highlights, total return, taxable income, taxable realized gain (loss) or distributable earnings of the Fund for any year.
2 Distributions to Shareholders
It is the present policy of the Fund to make at least one distribution annually (normally in December) of all or substantially all of its net investment income and to distribute annually all or substantially all of its net realized capital gains (reduced by available capital loss carryforwards from prior years, if any). Distributions are declared separately for each class of shares. Shareholders may reinvest income and capital gain distributions in additional shares of the same class of the Fund at the net asset value as of the ex-dividend date or, at the election of the shareholder, receive distributions in cash. The Fund distinguishes between distributions on a tax basis and a financial reporting basis. Accounting principles generally accepted in the United States of America require that only distributions in excess of tax basis earnings and profits be reported in the financial statements as a return of capital. Permanent differences between book and tax accounting relating to distributions are reclassified to paid-in capital. For tax purposes, distributions from short-term capital gains are considered to be from ordinary income.
Eaton Vance
Tax-Managed Equity Asset Allocation Fund
October 31, 2012
Notes to Financial Statements — continued
The tax character of distributions declared for the years ended October 31, 2012 and October 31, 2011 was as follows:
| | | | | | | | |
| | | Year Ended October 31, | |
| | | 2012 | | | 2011 | |
| | |
Distributions declared from: | | | | | | | | |
Ordinary income | | $ | 872,084 | | | $ | 531,468 | |
During the year ended October 31, 2012, accumulated net realized gain was decreased by $6,161,543, accumulated undistributed net investment income was increased by $418,697 and paid-in capital was increased by $5,742,846 due to the Fund’s use of equalization accounting and differences between book and tax accounting, primarily for distributions from real estate investment trusts (REITs), investments in partnerships, investments in passive foreign investment companies (PFICs), redemptions in-kind and foreign currency gain (loss). Tax equalization accounting allows the Fund to treat as a distribution that portion of redemption proceeds representing a redeeming shareholder’s portion of undistributed taxable income and net capital gains. These reclassifications had no effect on the net assets or net asset value per share of the Fund.
As of October 31, 2012, the components of distributable earnings (accumulated losses) and unrealized appreciation (depreciation) on a tax basis were as follows:
| | | | |
Undistributed ordinary income | | $ | 1,099,154 | |
Undistributed long-term capital gains | | $ | 18,408,436 | |
Net unrealized appreciation | | $ | 73,064,921 | |
The differences between components of distributable earnings (accumulated losses) on a tax basis and the amounts reflected in the Statement of Assets and Liabilities are primarily due to wash sales, partnership allocations, investments in PFICs, investments in partnerships and distributions from REITs.
3 Investment Adviser Fee and Other Transactions with Affiliates
The investment adviser fee is earned by EVM as compensation for management and investment advisory services rendered to the Fund. Pursuant to the investment advisory agreement and subsequent fee reduction agreement between the Fund and EVM, the fee is computed at an annual rate of 0.75% of the Fund’s average daily net assets up to $500 million, 0.70% on net assets of $500 million but less than $1 billion and at reduced rates on daily net assets of $1 billion or more, and is payable monthly. The fee reduction cannot be terminated without the consent of the Trustees and shareholders. The investment adviser fee payable by the Fund is reduced by the Fund’s allocable portion of the adviser fees paid by the Portfolios in which it invests. For the year ended October 31, 2012, the Fund’s investment adviser fee totaled $2,963,774, of which $2,571,553 was allocated from the Portfolios and $392,221 was paid or accrued directly by the Fund. For the year ended October 31, 2012, the Fund’s investment adviser fee, including the fees allocated from the Portfolios, was 0.75% of the Fund’s average daily net assets. The administration fee is earned by EVM as compensation for administering the business affairs of the Fund and is computed at an annual rate of 0.15% of the Fund’s average daily net assets. For the year ended October 31, 2012, the administration fee amounted to $592,755.
EVM serves as the sub-transfer agent of the Fund and receives from the transfer agent an aggregate fee based upon the actual expenses incurred by EVM in the performance of these services. For the year ended October 31, 2012, EVM earned $27,613 in sub-transfer agent fees. The Fund was informed that EVD, an affiliate of EVM, received $16,414 as its portion of the sales charge on sales of Class A shares for the year ended October 31, 2012. EVD also received distribution and service fees from Class A, Class B and Class C shares (see Note 4) and contingent deferred sales charges (see Note 5).
Trustees and officers of the Fund and the Portfolios who are members of EVM’s organization receive remuneration for their services to the Fund out of the investment adviser fee. Certain officers and Trustees of the Fund and the Portfolios are officers of EVM.
4 Distribution Plans
The Fund has in effect a distribution plan for Class A shares (Class A Plan) pursuant to Rule 12b-1 under the 1940 Act. Pursuant to the Class A Plan, the Fund pays EVD a distribution and service fee of 0.25% per annum of its average daily net assets attributable to Class A shares for distribution services and facilities provided to the Fund by EVD, as well as for personal services and/or the maintenance of shareholder accounts. Distribution and service fees paid or accrued to EVD for the year ended October 31, 2012 amounted to $547,195 for Class A shares.
The Fund also has in effect distribution plans for Class B shares (Class B Plan) and Class C shares (Class C Plan) pursuant to Rule 12b-1 under the 1940 Act. Pursuant to the Class B and Class C Plans, the Fund pays EVD amounts equal to 0.75% per annum of its average daily net assets attributable to Class B and Class C shares for providing ongoing distribution services and facilities to the Fund. The Fund will automatically discontinue payments to
Eaton Vance
Tax-Managed Equity Asset Allocation Fund
October 31, 2012
Notes to Financial Statements — continued
EVD during any period in which there are no outstanding Uncovered Distribution Charges, which are equivalent to the sum of (i) 6.25% of the aggregate amount received by the Fund for Class B and Class C shares sold, plus (ii) interest calculated by applying the rate of 1% over the prevailing prime rate to the outstanding balance of Uncovered Distribution Charges of EVD of each respective class, reduced by the aggregate amount of contingent deferred sales charges (see Note 5) and amounts theretofore paid or payable to EVD by each respective class. For the year ended October 31, 2012, the Fund paid or accrued to EVD $177,575 and $1,144,614 for Class B and Class C shares, respectively, representing 0.75% of the average daily net assets of Class B and Class C shares. At October 31, 2012, the amounts of Uncovered Distribution Charges of EVD calculated under the Class B and Class C Plans were approximately $1,125,000 and $11,647,000, respectively.
Pursuant to the Class B and Class C Plans, the Fund also makes payments of service fees to EVD, financial intermediaries and other persons in amounts equal to 0.25% per annum of its average daily net assets attributable to that class. Service fees paid or accrued are for personal services and/or the maintenance of shareholder accounts. They are separate and distinct from the sales commissions and distribution fees payable to EVD and, as such, are not subject to automatic discontinuance when there are no outstanding Uncovered Distribution Charges of EVD. Service fees paid or accrued for the year ended October 31, 2012 amounted to $59,192 and $381,538 for Class B and Class C shares, respectively.
5 Contingent Deferred Sales Charges
A contingent deferred sales charge (CDSC) generally is imposed on redemptions of Class B shares made within six years of purchase and on redemptions of Class C shares made within one year of purchase. Class A shares may be subject to a 1% CDSC if redeemed within 18 months of purchase (depending on the circumstances of purchase). Generally, the CDSC is based upon the lower of the net asset value at date of redemption or date of purchase. No charge is levied on shares acquired by reinvestment of dividends or capital gain distributions. The CDSC for Class B shares is imposed at declining rates that begin at 5% in the case of redemptions in the first and second year after purchase, declining one percentage point each subsequent year. Class C shares are subject to a 1% CDSC if redeemed within one year of purchase. No CDSC is levied on shares which have been sold to EVM or its affiliates or to their respective employees or clients and may be waived under certain other limited conditions. CDSCs received on Class B and Class C redemptions are paid to EVD to reduce the amount of Uncovered Distribution Charges calculated under the Fund’s Class B and Class C Plans. CDSCs received on Class B and Class C redemptions when no Uncovered Distribution Charges exist are credited to the Fund. For the year ended October 31, 2012, the Fund was informed that EVD received approximately $300, $39,000 and $6,000 of CDSCs paid by Class A, Class B and Class C shareholders, respectively.
6 Investment Transactions
For the year ended October 31, 2012, increases and decreases in the Fund’s investments in the Portfolios were as follows:
| | | | | | | | |
| Portfolio | | Contributions | | | Withdrawals | |
| | |
Tax-Managed Growth Portfolio | | $ | 14,950 | | | $ | 23,838,187 | |
Tax-Managed Value Portfolio | | | — | | | | 23,847,405 | |
Tax-Managed International Equity Portfolio | | | 918,262 | | | | 1,114,104 | |
Tax-Managed Multi-Cap Growth Portfolio | | | — | | | | 10,286,295 | |
Tax-Managed Small-Cap Portfolio | | | 3,270 | | | | 8,274,519 | |
Tax-Managed Small-Cap Value Portfolio | | | 1,869 | | | | 7,643,241 | |
7 Shares of Beneficial Interest
The Fund’s Declaration of Trust permits the Trustees to issue an unlimited number of full and fractional shares of beneficial interest (without par value). Such shares may be issued in a number of different series (such as the Fund) and classes. Transactions in Fund shares were as follows:
| | | | | | | | |
| | | Year Ended October 31, | |
| Class A | | 2012 | | | 2011 | |
| | |
Sales | | | 534,081 | | | | 1,307,086 | |
Issued to shareholders electing to receive payments of distributions in Fund shares | | | 60,970 | | | | 34,696 | |
Redemptions | | | (3,484,525 | ) | | | (5,431,086 | ) |
Exchange from Class B shares | | | 629,198 | | | | 887,058 | |
| | |
Net decrease | | | (2,260,276 | ) | | | (3,202,246 | ) |
Eaton Vance
Tax-Managed Equity Asset Allocation Fund
October 31, 2012
Notes to Financial Statements — continued
| | | | | | | | |
| | | Year Ended October 31, | |
| Class B | | 2012 | | | 2011 | |
| | |
Sales | | | 12,959 | | | | 89,093 | |
Redemptions | | | (375,607 | ) | | | (692,377 | ) |
Exchange to Class A shares | | | (662,326 | ) | | | (930,678 | ) |
| | |
Net decrease | | | (1,024,974 | ) | | | (1,533,962 | ) |
| | | | | | | | |
| | | Year Ended October 31, | |
| Class C | | 2012 | | | 2011 | |
| | |
Sales | | | 500,827 | | | | 901,251 | |
Redemptions | | | (2,477,852 | ) | | | (3,300,611 | ) |
| | |
Net decrease | | | (1,977,025 | ) | | | (2,399,360 | ) |
8 Fair Value Measurements
Under generally accepted accounting principles for fair value measurements, a three-tier hierarchy to prioritize the assumptions, referred to as inputs, is used in valuation techniques to measure fair value. The three-tier hierarchy of inputs is summarized in the three broad levels listed below.
| Ÿ | | Level 1 – quoted prices in active markets for identical investments |
| Ÿ | | Level 2 – other significant observable inputs (including quoted prices for similar investments, interest rates, prepayment speeds, credit risk, etc.) |
| Ÿ | | Level 3 – significant unobservable inputs (including a fund’s own assumptions in determining the fair value of investments) |
In cases where the inputs used to measure fair value fall in different levels of the fair value hierarchy, the level disclosed is determined based on the lowest level input that is significant to the fair value measurement in its entirety. The inputs or methodology used for valuing securities are not necessarily an indication of the risk associated with investing in those securities. At October 31, 2012 and October 31, 2011, the Fund’s investments in the Portfolios were valued based on Level 1 inputs.
Eaton Vance
Tax-Managed Equity Asset Allocation Fund
October 31, 2012
Report of Independent Registered Public Accounting Firm
To the Trustees of Eaton Vance Mutual Funds Trust and Shareholders of Eaton Vance Tax-Managed Equity Asset Allocation Fund:
We have audited the accompanying statement of assets and liabilities of Eaton Vance Tax-Managed Equity Asset Allocation Fund (the “Fund”) (one of the funds constituting Eaton Vance Mutual Funds Trust) as of October 31, 2012, and the related statement of operations for the year then ended, the statements of changes in net assets for each of the two years in the period then ended, and the financial highlights for each of the five years in the period then ended. These financial statements and financial highlights are the responsibility of the Fund’s management. Our responsibility is to express an opinion on these financial statements and financial highlights based on our audits.
We conducted our audits in accordance with standards of the Public Company Accounting Oversight Board (United States). Those standards require that we plan and perform the audit to obtain reasonable assurance about whether the financial statements and financial highlights are free of material misstatement. The Fund is not required to have, nor were we engaged to perform, an audit of its internal control over financial reporting. Our audits included consideration of internal control over financial reporting as a basis for designing audit procedures that are appropriate in the circumstances, but not for the purpose of expressing an opinion of the Fund’s internal control over financial reporting. Accordingly, we express no such opinion. An audit also includes examining, on a test basis, evidence supporting the amounts and disclosures in the financial statements, assessing the accounting principles used and significant estimates made by management, as well as evaluating the overall financial statement presentation. We believe that our audits provide a reasonable basis for our opinion.
In our opinion, such financial statements and financial highlights referred to above present fairly, in all material respects, the financial position of Eaton Vance Tax-Managed Equity Asset Allocation Fund as of October 31, 2012, the results of its operations for the year then ended, the changes in its net assets for each of the two years in the period then ended, and the financial highlights for each of the five years in the period then ended, in conformity with accounting principles generally accepted in the United States of America.
DELOITTE & TOUCHE LLP
Boston, Massachusetts
December 21, 2012
Eaton Vance
Tax-Managed Equity Asset Allocation Fund
October 31, 2012
Federal Tax Information (Unaudited)
The Form 1099-DIV you receive in January 2013 will show the tax status of all distributions paid to your account in calendar year 2012. Shareholders are advised to consult their own tax adviser with respect to the tax consequences of their investment in the Fund. As required by the Internal Revenue Code and/or regulations, shareholders must be notified regarding the status of qualified dividend income for individuals, the dividends received deduction for corporations and capital gains dividends.
Qualified Dividend Income. The Fund designates approximately $9,309,488, or up to the maximum amount of such dividends allowable pursuant to the Internal Revenue Code, as qualified dividend income eligible for the reduced tax rate of 15%.
Dividends Received Deduction. Corporate shareholders are generally entitled to take the dividends received deduction on the portion of the Fund’s dividend distribution that qualifies under tax law. For the Fund’s fiscal 2012 ordinary income dividends, 100% qualifies for the corporate dividends received deduction.
Capital Gains Dividends. The Fund hereby designates as a capital gain dividend with respect to the taxable year ended October 31, 2012, $28,517,207 or, if subsequently determined to be different, the net capital gain of such year.
Eaton Vance
Tax-Managed Equity Asset Allocation Fund
October 31, 2012
Management and Organization
Fund Management. The Trustees of Eaton Vance Mutual Funds Trust (the Trust) are responsible for the overall management and supervision of the Trust’s affairs. The Trustees and officers of the Trust are listed below. Except as indicated, each individual has held the office shown or other offices in the same company for the last five years. Trustees and officers of the Trust hold indefinite terms of office. The “Noninterested Trustees” consist of those Trustees who are not “interested persons” of the Trust, as that term is defined under the 1940 Act. The business address of each Trustee and officer is Two International Place, Boston, Massachusetts 02110. As used below, “EVC” refers to Eaton Vance Corp., “EV” refers to Eaton Vance, Inc., “EVM” refers to Eaton Vance Management, “BMR” refers to Boston Management and Research and “EVD” refers to Eaton Vance Distributors, Inc. EVC and EV are the corporate parent and trustee, respectively, of EVM and BMR. EVD is the Fund’s principal underwriter and a wholly-owned subsidiary of EVC. Each officer affiliated with Eaton Vance may hold a position with other Eaton Vance affiliates that is comparable to his or her position with EVM listed below. Each Trustee oversees 187 portfolios in the Eaton Vance Complex (including all master and feeder funds in a master feeder structure). Each officer serves as an officer of certain other Eaton Vance funds. Each Trustee and officer serves until his or her successor is elected.
| | | | | | |
| Name and Year of Birth | | Position(s) with the
Trust | | Length of
Service | | Principal Occupation(s) and Directorships During Past Five Years and Other Relevant Experience |
Interested Trustee | | | | | | |
| | | |
Thomas E. Faust Jr. 1958 | | Trustee | | Since 2007 | | Chairman, Chief Executive Officer and President of EVC, Director and President of EV, Chief Executive Officer and President of EVM and BMR, and Director of EVD. Trustee and/or officer of 187 registered investment companies. Mr. Faust is an interested person because of his positions with EVM, BMR, EVD, EVC and EV, which are affiliates of the Trust. Directorships in the Last Five Years.(1) Director of EVC and Hexavest Inc. |
| | | |
| | | | | | |
Noninterested Trustees | | | | | | |
| | | |
Scott E. Eston 1956 | | Trustee | | Since 2011 | | Private investor. Formerly held various positions at Grantham, Mayo, Van Otterloo and Co., L.L.C. (investment management firm) (1997-2009), including Chief Operating Officer (2002-2009), Chief Financial Officer (1997-2009) and Chairman of the Executive Committee (2002-2008); President and Principal Executive Officer, GMO Trust (open-end registered investment company) (2006-2009). Former Partner, Coopers and Lybrand L.L.P. (now PricewaterhouseCoopers) (public accounting firm) (1987-1997). Directorships in the Last Five Years. None. |
| | | |
Benjamin C. Esty 1963 | | Trustee | | Since 2005 | | Roy and Elizabeth Simmons Professor of Business Administration and Finance Unit Head, Harvard University Graduate School of Business Administration. Directorships in the Last Five Years.(1) None. |
| | | |
Allen R. Freedman 1940 | | Trustee | | Since 2007 | | Private Investor. Former Chairman (2002-2004) and a Director (1983-2004) of Systems & Computer Technology Corp. (provider of software to higher education). Formerly, a Director of Loring Ward International (fund distributor) (2005-2007). Former Chairman and a Director of Indus International, Inc. (provider of enterprise management software to the power generating industry) (2005-2007). Former Chief Executive Officer of Assurant, Inc. (insurance provider) (1979-2000). Directorships in the Last Five Years.(1) Director of Stonemor Partners, L.P. (owner and operator of cemeteries). Formerly, Director of Assurant, Inc. (insurance provider) (1979-2011). |
| | | |
William H. Park 1947 | | Trustee | | Since 2003 | | Consultant and private investor. Formerly, Chief Financial Officer, Aveon Group L.P. (investment management firm) (2010-2011). Formerly, Vice Chairman, Commercial Industrial Finance Corp. (specialty finance company) (2006-2010). Formerly, President and Chief Executive Officer, Prizm Capital Management, LLC (investment management firm) (2002-2005). Formerly, Executive Vice President and Chief Financial Officer, United Asset Management Corporation (investment management firm) (1982-2001). Formerly, Senior Manager, Price Waterhouse (now PricewaterhouseCoopers) (an independent registered public accounting firm) (1972-1981). Directorships in the Last Five Years.(1) None. |
| | | |
Ronald A. Pearlman 1940 | | Trustee | | Since 2003 | | Professor of Law, Georgetown University Law Center. Formerly, Deputy Assistant Secretary (Tax Policy) and Assistant Secretary (Tax Policy), U.S. Department of the Treasury (1983-1985). Formerly, Chief of Staff, Joint Committee on Taxation, U.S. Congress (1988-1990). Directorships in the Last Five Years.(1) None. |
Eaton Vance
Tax-Managed Equity Asset Allocation Fund
October 31, 2012
Management and Organization — continued
| | | | | | |
| Name and Year of Birth | | Position(s) with the
Trust | | Length of
Service | | Principal Occupation(s) and Directorships During Past Five Years and Other Relevant Experience |
Noninterested Trustees (continued) |
| | | |
Helen Frame Peters 1948 | | Trustee | | Since 2008 | | Professor of Finance, Carroll School of Management, Boston College. Formerly, Dean, Carroll School of Management, Boston College (2000-2002). Formerly, Chief Investment Officer, Fixed Income, Scudder Kemper Investments (investment management firm) (1998-1999). Formerly, Chief Investment Officer, Equity and Fixed Income, Colonial Management Associates (investment management firm) (1991-1998). Directorships in the Last Five Years.(1) Formerly, Director of BJ’s Wholesale Club, Inc. (wholesale club retailer) (2004-2011). Formerly, Trustee of SPDR Index Shares Funds and SPDR Series Trust (exchange traded funds) (2000-2009). Formerly, Director of Federal Home Loan Bank of Boston (a bank for banks) (2007-2009). |
| | | |
Lynn A. Stout 1957 | | Trustee | | Since 1998 | | Distinguished Professor of Corporate and Business Law, Jack G. Clarke Business Law Institute, Cornell University Law School. Formerly, the Paul Hastings Professor of Corporate and Securities Law (2006-2012) and Professor of Law (2001-2006), University of California at Los Angeles School of Law. Directorships in the Last Five Years.(1) None. |
| | | |
Harriett Tee Taggart 1948 | | Trustee | | Since 2011 | | Managing Director, Taggart Associates (a professional practice firm). Formerly, Partner and Senior Vice President, Wellington Management Company, LLP (investment management firm) (1983-2006). Directorships in the Last Five Years. Director of Albemarle Corporation (chemicals manufacturer) (since 2007) and The Hanover Group (specialty property and casualty insurance company) (since 2009). Formerly, Director of Lubrizol Corporation (specialty chemicals) (2007-2011). |
| | | |
Ralph F. Verni 1943 | | Chairman of the Board and Trustee | | Chairman of the Board since 2007 and Trustee since 2005 | | Consultant and private investor. Formerly, Chief Investment Officer (1982-1992), Chief Financial Officer (1988-1990) and Director (1982-1992), New England Life. Formerly, Chairperson, New England Mutual Funds (1982-1992). Formerly, President and Chief Executive Officer, State Street Management & Research (1992-2000). Formerly, Chairperson, State Street Research Mutual Funds (1992-2000). Formerly, Director, W.P. Carey, LLC (1998-2004) and First Pioneer Farm Credit Corp. (2002-2006). Directorships in the Last Five Years.(1) None. |
| | | |
| | | | | | |
Principal Officers who are not Trustees | | |
| Name and Year of Birth | | Position(s)
with the
Trust | | Length of Service | | Principal Occupation(s) During Past Five Years |
Duncan W. Richardson 1957 | | President | | Since 2011 | | Director of EVC and Executive Vice President and Chief Equity Investment Officer of EVC, EVM and BMR. |
Payson F. Swaffield 1956 | | Vice President | | Since 2011 | | Vice President and Chief Income Investment Officer of EVM and BMR. |
Barbara E. Campbell 1957 | | Treasurer | | Since 2005 | | Vice President of EVM and BMR. |
Maureen A. Gemma 1960 | | Vice President, Secretary and Chief Legal Officer | | Vice President since 2011, Secretary since 2007 and Chief Legal Officer since 2008 | | Vice President of EVM and BMR. |
Paul M. O’Neil 1953 | | Chief Compliance Officer | | Since 2004 | | Vice President of EVM and BMR. |
| (1) | During their respective tenures, the Trustees (except Mr. Eston and Ms. Taggart) also served as trustees of one or more of the following Eaton Vance funds (which operated in the years noted): Eaton Vance Credit Opportunities Fund (launched in 2005 and terminated in 2010); Eaton Vance Insured Florida Plus Municipal Bond Fund (launched in 2002 and terminated in 2009); and Eaton Vance National Municipal Income Trust (launched in 1998 and terminated in 2009). |
The SAI for the Fund includes additional information about the Trustees and officers of the Fund and can be obtained without charge on Eaton Vance’s website at www.eatonvance.com or by calling 1-800-262-1122.
Eaton Vance Funds
IMPORTANT NOTICES
Privacy. The Eaton Vance organization is committed to ensuring your financial privacy. Each of the financial institutions identified below has in effect the following policy (“Privacy Policy”) with respect to nonpublic personal information about its customers:
| Ÿ | | Only such information received from you, through application forms or otherwise, and information about your Eaton Vance fund transactions will be collected. This may include information such as name, address, social security number, tax status, account balances and transactions. |
| Ÿ | | None of such information about you (or former customers) will be disclosed to anyone, except as permitted by law (which includes disclosure to employees necessary to service your account). In the normal course of servicing a customer’s account, Eaton Vance may share information with unaffiliated third parties that perform various required services such as transfer agents, custodians and broker/dealers. |
| Ÿ | | Policies and procedures (including physical, electronic and procedural safeguards) are in place that are designed to protect the confidentiality of such information. |
| Ÿ | | We reserve the right to change our Privacy Policy at any time upon proper notification to you. Customers may want to review our Privacy Policy periodically for changes by accessing the link on our homepage: www.eatonvance.com. |
Our pledge of privacy applies to the following entities within the Eaton Vance organization: the Eaton Vance Family of Funds, Eaton Vance Management, Eaton Vance Investment Counsel, Eaton Vance Distributors, Inc., Eaton Vance Trust Company, Eaton Vance Management’s Real Estate Investment Group and Boston Management and Research. In addition, our Privacy Policy applies only to those Eaton Vance customers who are individuals and who have a direct relationship with us. If a customer’s account (i.e., fund shares) is held in the name of a third-party financial advisor/broker-dealer, it is likely that only such advisor’s privacy policies apply to the customer. This notice supersedes all previously issued privacy disclosures. For more information about Eaton Vance’s Privacy Policy, please call 1-800-262-1122.
Delivery of Shareholder Documents. The Securities and Exchange Commission (SEC) permits funds to deliver only one copy of shareholder documents, including prospectuses, proxy statements and shareholder reports, to fund investors with multiple accounts at the same residential or post office box address. This practice is often called “householding” and it helps eliminate duplicate mailings to shareholders. Eaton Vance, or your financial advisor, may household the mailing of your documents indefinitely unless you instruct Eaton Vance, or your financial advisor, otherwise. If you would prefer that your Eaton Vance documents not be householded, please contact Eaton Vance at 1-800-262-1122, or contact your financial advisor. Your instructions that householding not apply to delivery of your Eaton Vance documents will be effective within 30 days of receipt by Eaton Vance or your financial advisor.
Portfolio Holdings. Each Eaton Vance Fund and its underlying Portfolio(s) (if applicable) will file a schedule of portfolio holdings on Form N-Q with the SEC for the first and third quarters of each fiscal year. The Form N-Q will be available on the Eaton Vance website at www.eatonvance.com, by calling Eaton Vance at 1-800-262-1122 or in the EDGAR database on the SEC’s website at www.sec.gov. Form N-Q may also be reviewed and copied at the SEC’s public reference room in Washington, D.C. (call 1-800-732-0330 for information on the operation of the public reference room).
Proxy Voting. From time to time, funds are required to vote proxies related to the securities held by the funds. The Eaton Vance Funds or their underlying Portfolios (if applicable) vote proxies according to a set of policies and procedures approved by the Funds’ and Portfolios’ Boards. You may obtain a description of these policies and procedures and information on how the Funds or Portfolios voted proxies relating to portfolio securities during the most recent 12-month period ended June 30, without charge, upon request, by calling 1-800-262-1122 and by accessing the SEC’s website at www.sec.gov.
This Page Intentionally Left Blank
This Page Intentionally Left Blank
Investment Adviser and Administrator
Eaton Vance Management
Two International Place
Boston, MA 02110
Principal Underwriter*
Eaton Vance Distributors, Inc.
Two International Place
Boston, MA 02110
(617) 482-8260
Custodian
State Street Bank and Trust Company
200 Clarendon Street
Boston, MA 02116
Transfer Agent
BNY Mellon Investment Servicing (US) Inc.
Attn: Eaton Vance Funds
P.O. Box 9653
Providence, RI 02940-9653
(800) 262-1122
Independent Registered Public Accounting Firm
Deloitte & Touche LLP
200 Berkeley Street
Boston, MA 02116-5022
Fund Offices
Two International Place
Boston, MA 02110
| * | FINRA BrokerCheck. Investors may check the background of their Investment Professional by contacting the Financial Industry Regulatory Authority (FINRA). FINRA BrokerCheck is a free tool to help investors check the professional background of current and former FINRA-registered securities firms and brokers. FINRA BrokerCheck is available by calling 1-800-289-9999 and at www.FINRA.org. The FINRA BrokerCheck brochure describing this program is available to investors at www.FINRA.org. |
| | |
Eaton Vance U.S. Government Money Market Fund Annual Report October 31, 2012 | | 
|

Fund shares are not insured by the FDIC and are not deposits or other obligations of, or guaranteed by, any depository institution. Shares are subject to investment risks, including possible loss of principal invested.
This report must be preceded or accompanied by a current summary prospectus or prospectus. Before investing, investors should consider carefully the investment objective, risks, and charges and expenses of a mutual fund. This and other important information is contained in the summary prospectus and prospectus, which can be obtained from a financial advisor. Prospective investors should read the prospectus carefully before investing. For further information, please call 1-800-262-1122.
Annual Report October 31, 2012
Eaton Vance
U.S. Government Money Market Fund
Table of Contents
| | | | |
Management’s Discussion of Fund Performance | | | 2 | |
| |
Performance | | | 3 | |
| |
Fund Profile | | | 3 | |
| |
Endnotes and Additional Disclosures | | | 4 | |
| |
Fund Expenses | | | 5 | |
| |
Financial Statements | | | 6 | |
| |
Report of Independent Registered Public Accounting Firm | | | 17 | |
| |
Federal Tax Information | | | 18 | |
| |
Management and Organization | | | 19 | |
| |
Important Notices | | | 21 | |
Eaton Vance
U.S. Government Money Market Fund
October 31, 2012
Management’s Discussion of Fund Performance1
Economic and Market Conditions
Although short-term yields rose over the period from the all-time lows reached in September and October of 2011, they nonetheless remained near zero. A number of factors combined to keep interest rates at historic lows throughout the one-year period ending October 31, 2012.
The primary factor was the U.S. Federal Reserve Board’s (the Fed’s) interest rate policy. During the fiscal year, the Fed twice extended the period during which it expected to keep the federal funds target rate between 0 and 25 basis points—first into 2014 and then, later in the period, into 2015. This put downward pressure on interest rates across the yield curve.
Another important factor was ongoing strong demand for short-dated issues, as a result of more stringent liquidity regulations for money market funds that took effect in 2010. By increasing demand for paper in shorter maturity ranges, the new regulations have put upward pressure on prices and thus downward pressure on rates for short-term issues.
The Fed’s open-ended program to buy mortgage-backed, agency and Treasury securities, announced in September of 2012 and dubbed “quantitative easing round three” by investors, also increased demand and put further downward pressure on rates.
In contrast, two other factors put upward pressure on short-term rates, but only to a modest degree. The Fed’s “Operation Twist,” in which the central bank sold short-term holdings to buy longer-term Treasury bonds, tended to increase the supply of shorter-dated government securities. In addition, the worldwide “flight to quality,” which had depressed rates to all-time lows at the start of the period, moderated somewhat as the sovereign debt crisis in Europe appeared to become less dire. The net result was that short-term rates increased over the period, but only modestly.
Fund Performance
For the fiscal year ending October 31, 2012, Eaton Vance U.S. Government Money Market Fund (the Fund) Class A shares at net asset value (NAV) had a total return of 0.00%. At period-end, the Fund’s annualized seven-day yield was 0.00%.
Although yields on short-term government paper virtually doubled over the course of the one-year period, rates remained so low that neither the Fund nor the majority of its peers had much opportunity to add yield. To avoid a net negative yield
or investment loss, the Fund’s investment manager voluntarily reimbursed or waived a portion of the Fund’s expenses during the 12-month period.
At the start of the period, the portfolio was heavily concentrated in short-term U.S. government agency obligations, which offered a slight yield advantage over comparable maturity Treasuries. As the period progressed, however, the yield advantage of agencies over comparable maturity Treasuries decreased to the point where, in management’s view, investors were not being as well-compensated for the additional risk of agency securities. In light of the Fund’s goal of preservation of capital, management believed that Treasuries had become more attractive relative to agency debt. For that reason, the Fund’s weighting in Treasuries was increased from 17% at the start of the period to about 50% at period-end. The higher weighting in Treasuries also increased the effective liquidity of the Fund.
See Endnotes and Additional Disclosures in this report.
Past performance is no guarantee of future results. Returns are historical and are calculated by determining the percentage change in net asset value (NAV) or offering price (as applicable) with all distributions reinvested. Investment return and principal value will fluctuate so that shares, when redeemed, may be worth more or less than their original cost. Performance less than one year is cumulative. Performance is for the stated time period only; due to market volatility, the Fund’s current performance may be lower or higher than quoted. Returns are before taxes unless otherwise noted. For performance as of the most recent month end, please refer to www.eatonvance.com.
Eaton Vance
U.S. Government Money Market Fund
October 31, 2012
Performance2
Portfolio Managers Thomas H. Luster, CFA and Maria Cappellano
| | | | | | | | | | | | | | | | | | | | |
| % Average Annual Total Returns | | Inception Date | | | One Year | | | Five Years | | | Ten Years | | | Since Inception | |
Class A at NAV | | | 1/27/1975 | | | | 0.00 | % | | | 0.63 | % | | | 1.52 | % | | | — | |
Class B at NAV | | | 12/7/2009 | | | | 0.00 | | | | — | | | | — | | | | 0.00 | % |
Class B with 5% Maximum Sales Charge | | | — | | | | –5.00 | | | | — | | | | — | | | | –1.39 | |
Class C at NAV | | | 12/7/2009 | | | | 0.00 | | | | — | | | | — | | | | 0.00 | |
Class C with 1% Maximum Sales Charge | | | — | | | | –1.00 | | | | — | | | | — | | | | 0.00 | |
| | | | | |
| | | | | | | | | | | | | | | | | | | | |
| 7-Day SEC Yield3 | | | | | | | | Class A | | | Class B | | | Class C | |
| | | | | | | | | | | 0.00 | % | | | 0.00 | % | | | 0.00 | % |
| | | | | |
| | | | | | | | | | | | | | | | | | | | |
| % Total Annual Operating Expense Ratios4 | | | | | | | | Class A | | | Class B | | | Class C | |
| | | | | | | | | | | 0.68 | % | | | 1.58 | % | | | 1.58 | % |
Fund Profile
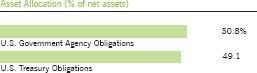
See Endnotes and Additional Disclosures in this report.
Past performance is no guarantee of future results. Returns are historical and are calculated by determining the percentage change in net asset value (NAV) or offering price (as applicable) with all distributions reinvested. Investment return and prin-cipal value will fluctuate so that shares, when redeemed, may be worth more or less than their original cost. Performance less than one year is cumulative. Performance is for the stated time period only; due to market volatility, the Fund’s current perfor-mance may be lower or higher than quoted. Returns are before taxes unless otherwise noted. For performance as of the most recent month end, please refer to www.eatonvance.com.
Eaton Vance
U.S. Government Money Market Fund
October 31, 2012
Endnotes and Additional Disclosures
| 1 | Effective January 1, 2012, Class A, B, and C shares only are offered in exchange for Class A, B and C shares, respectively, of other Eaton Vance funds. The views expressed in this report are those of the portfolio manager(s) and are current only through the date stated at the top of this page. These views are subject to change at any time based upon market or other conditions, and Eaton Vance and the Fund(s) disclaim any responsibility to update such views. These views may not be relied upon as investment advice and, because investment decisions are based on many factors, may not be relied upon as an indication of trading intent on behalf of any Eaton Vance fund. This commentary may contain statements that are not historical facts, referred to as “forward looking statements”. The Fund’s actual future results may differ significantly from those stated in any forward looking statement, depending on factors such as changes in securities or financial markets or general economic conditions, the volume of sales and purchases of Fund shares, the continuation of investment advisory, administrative and service contracts, and other risks discussed from time to time in the Fund’s filings with the Securities and Exchange Commission. |
| 2 | Total Returns at NAV do not include applicable sales charges. If sales charges were deducted, the returns would be lower. Total Returns shown with maximum sales charge reflect the stated maximum sales charge. Unless otherwise stated, performance does not reflect the deduction of taxes on Fund distributions or redemptions of Fund shares. |
| 3 | 7-Day SEC Yield is annualized net investment income per share for the seven days ended on the date shown. Yields are historical, will fluctuate and can more closely reflect the current earnings of a fund than the total return quotation. Absent waiver of fees and reimbursement of expenses by affiliates, the returns would be lower. Although the Fund seeks to maintain a stable net asset value of $1.00 per share, it is possible to lose money by investing in the Fund. An investment in the Fund is not insured or guaranteed by the FDIC or any other government agency. |
| 4 | Source: Fund prospectus. |
| | Fund profile subject to change due to active management. |
Eaton Vance
U.S. Government Money Market Fund
October 31, 2012
Fund Expenses
Example: As a Fund shareholder, you incur two types of costs: (1) transaction costs, including sales charges (loads) on purchases and redemption fees (if applicable); and (2) ongoing costs, including management fees; distribution and/or service fees; and other Fund expenses. This Example is intended to help you understand your ongoing costs (in dollars) of Fund investing and to compare these costs with the ongoing costs of investing in other mutual funds. The Example is based on an investment of $1,000 invested at the beginning of the period and held for the entire period (May 1, 2012 – October 31, 2012).
Actual Expenses: The first section of the table below provides information about actual account values and actual expenses. You may use the information in this section, together with the amount you invested, to estimate the expenses that you paid over the period. Simply divide your account value by $1,000 (for example, an $8,600 account value divided by $1,000 = 8.6), then multiply the result by the number in the first section under the heading entitled “Expenses Paid During Period” to estimate the expenses you paid on your account during this period.
Hypothetical Example for Comparison Purposes: The second section of the table below provides information about hypothetical account values and hypothetical expenses based on the actual Fund expense ratio and an assumed rate of return of 5% per year (before expenses), which is not the actual Fund return. The hypothetical account values and expenses may not be used to estimate the actual ending account balance or expenses you paid for the period. You may use this information to compare the ongoing costs of investing in your Fund and other funds. To do so, compare this 5% hypothetical example with the 5% hypothetical examples that appear in the shareholder reports of the other funds.
Please note that the expenses shown in the table are meant to highlight your ongoing costs only and do not reflect any transactional costs, such as sales charges (loads) or redemption fees (if applicable). Therefore, the second section of the table is useful in comparing ongoing costs only, and will not help you determine the relative total costs of owning different funds. In addition, if these transactional costs were included, your costs would be higher.
| | | | | | | | | | | | | | | | |
| | | Beginning
Account Value
(5/1/12) | | | Ending
Account Value
(10/31/12) | | | Expenses Paid
During Period*
(5/1/12 – 10/31/12) | | | Annualized
Expense
Ratio | |
| | | | |
| | | | | | | | | | | | | | | | |
Actual | | | | | | | | | | | | | |
Class A | | $ | 1,000.00 | | | $ | 1,000.00 | | | $ | 0.70 | ** | | | 0.14 | % |
Class B | | $ | 1,000.00 | | | $ | 1,000.00 | | | $ | 0.70 | ** | | | 0.14 | % |
Class C | | $ | 1,000.00 | | | $ | 1,000.00 | | | $ | 0.70 | ** | | | 0.14 | % |
| | | | | | | | | | | | | | | | | |
| | | | |
| | | | | | | | | | | | | | | | |
Hypothetical | | | | | | | | | | | | | |
(5% return per year before expenses) | | | | | | | | | | | | | |
Class A | | $ | 1,000.00 | | | $ | 1,024.40 | | | $ | 0.71 | ** | | | 0.14 | % |
Class B | | $ | 1,000.00 | | | $ | 1,024.40 | | | $ | 0.71 | ** | | | 0.14 | % |
Class C | | $ | 1,000.00 | | | $ | 1,024.40 | | | $ | 0.71 | ** | | | 0.14 | % |
| * | Expenses are equal to the Fund’s annualized expense ratio for the indicated Class, multiplied by the average account value over the period, multiplied by 184/366 (to reflect the one-half year period). The Example assumes that the $1,000 was invested at the net asset value per share determined at the close of business on April 30, 2012. |
| ** | Absent an allocation of certain expenses to affiliates, the expenses would be higher. |
Eaton Vance
U.S. Government Money Market Fund
October 31, 2012
Portfolio of Investments
| | | | | | | | |
| U.S. Government Agency Obligations — 50.8% | |
| | |
| | | | | | | | |
| Security | | Principal
Amount
(000’s omitted) | | | Value | |
| | | | | | | | |
Federal Farm Credit Bank: | | | | | | | | |
0.237%, 2/21/13(1) | | $ | 1,250 | | | $ | 1,250,000 | |
0.277%, 3/6/13(1) | | | 1,000 | | | | 1,000,050 | |
0.19%, 6/20/13(1) | | | 5,000 | | | | 4,999,525 | |
| | | | | | | | | |
| | | $ | 7,249,575 | |
| | | | | | | | | |
Federal Home Loan Bank: | | | | | | | | |
0.28%, 6/10/13 | | $ | 1,250 | | | $ | 1,250,000 | |
Discount Note, 0.12%, 11/7/12 | | | 512 | | | | 511,990 | |
Discount Note, 0.13%, 11/14/12 | | | 2,710 | | | | 2,709,873 | |
Discount Note, 0.13%, 11/16/12 | | | 1,506 | | | | 1,505,918 | |
Discount Note, 0.125%, 11/30/12 | | | 2,392 | | | | 2,391,759 | |
Discount Note, 0.12%, 12/5/12 | | | 2,368 | | | | 2,367,732 | |
Discount Note, 0.13%, 12/5/12 | | | 3,514 | | | | 3,513,569 | |
Discount Note, 0.135%, 12/5/12 | | | 2,947 | | | | 2,946,624 | |
Discount Note, 0.14%, 12/14/12 | | | 2,187 | | | | 2,186,634 | |
Discount Note, 0.135%, 1/9/13 | | | 1,750 | | | | 1,749,547 | |
Discount Note, 0.14%, 1/11/13 | | | 1,000 | | | | 999,724 | |
| | | | | | | | | |
| | | $ | 22,133,370 | |
| | | | | | | | | |
Federal Home Loan Mortgage Corp.: | | | | | | | | |
0.37%, 1/10/13(1) | | $ | 500 | | | $ | 500,140 | |
0.34%, 1/24/13(1) | | | 3,850 | | | | 3,850,895 | |
Discount Note, 0.15%, 11/2/12 | | | 500 | | | | 499,998 | |
Discount Note, 0.15%, 11/26/12 | | | 1,975 | | | | 1,974,794 | |
Discount Note, 0.125%, 11/28/12 | | | 2,648 | | | | 2,647,752 | |
Discount Note, 0.135%, 12/3/12 | | | 991 | | | | 990,881 | |
Discount Note, 0.15%, 12/10/12 | | | 1,200 | | | | 1,199,805 | |
Discount Note, 0.13%, 1/22/13 | | | 1,931 | | | | 1,930,428 | |
Discount Note, 0.135%, 1/22/13 | | | 2,250 | | | | 2,249,308 | |
Discount Note, 0.14%, 1/29/13 | | | 2,800 | | | | 2,799,031 | |
| | | | | | | | | |
| | | $ | 18,643,032 | |
| | | | | | | | | |
Federal National Mortgage Association: | | | | | | | | |
0.38%, 11/23/12(1) | | $ | 1,200 | | | $ | 1,200,080 | |
1.75%, 2/22/13 | | | 2,500 | | | | 2,512,209 | |
Discount Note, 0.13%, 11/7/12 | | | 1,260 | | | | 1,259,973 | |
Discount Note, 0.12%, 11/29/12 | | | 422 | | | | 421,961 | |
Discount Note, 0.13%, 11/29/12 | | | 384 | | | | 383,961 | |
Discount Note, 0.175%, 12/19/12 | | | 1,260 | | | | 1,259,706 | |
Discount Note, 0.145%, 1/14/13 | | | 1,000 | | | | 999,702 | |
| | | | | | | | | |
| | | $ | 8,037,592 | |
| | | | | | | | | |
| | |
Total U.S. Government Agency Obligations
(amortized cost $56,063,569) | | | | | | $ | 56,063,569 | |
| | | | | | | | | |
| | | | | | | | |
| U.S. Treasury Obligations — 49.1% | | | | | |
| | |
| | | | | | | | |
| Security | | Principal
Amount
(000’s omitted) | | | Value | |
| | | | | | | | |
U.S. Treasury Bill, 0.09%, 11/1/12 | | $ | 1,775 | | | $ | 1,775,000 | |
U.S. Treasury Bill, 0.11%, 11/1/12 | | | 3,000 | | | | 3,000,000 | |
U.S. Treasury Bill, 0.11%, 11/8/12 | | | 2,195 | | | | 2,194,953 | |
U.S. Treasury Bill, 0.10%, 11/15/12 | | | 625 | | | | 624,975 | |
U.S. Treasury Bill, 0.11%, 11/15/12 | | | 1,562 | | | | 1,561,931 | |
U.S. Treasury Bill, 0.12%, 11/15/12 | | | 3,211 | | | | 3,210,850 | |
U.S. Treasury Bill, 0.09%, 11/23/12 | | | 2,000 | | | | 1,999,886 | |
U.S. Treasury Bill, 0.12%, 11/29/12 | | | 2,500 | | | | 2,499,777 | |
U.S. Treasury Bill, 0.10%, 12/6/12 | | | 1,500 | | | | 1,499,849 | |
U.S. Treasury Bill, 0.11%, 12/6/12 | | | 1,500 | | | | 1,499,848 | |
U.S. Treasury Bill, 0.10%, 12/13/12 | | | 1,500 | | | | 1,499,824 | |
U.S. Treasury Bill, 0.10%, 1/3/13 | | | 1,543 | | | | 1,542,722 | |
U.S. Treasury Bill, 0.14%, 1/3/13 | | | 954 | | | | 953,767 | |
U.S. Treasury Bill, 0.14%, 1/10/13 | | | 2,500 | | | | 2,499,319 | |
U.S. Treasury Bill, 0.12%, 1/17/13 | | | 855 | | | | 854,773 | |
U.S. Treasury Bill, 0.13%, 1/17/13 | | | 519 | | | | 518,858 | |
U.S. Treasury Bill, 0.14%, 1/17/13 | | | 1,320 | | | | 1,319,606 | |
U.S. Treasury Bill, 0.14%, 1/24/13 | | | 1,472 | | | | 1,471,523 | |
U.S. Treasury Bill, 0.11%, 1/31/13 | | | 1,923 | | | | 1,922,470 | |
U.S. Treasury Bill, 0.11%, 2/7/13 | | | 1,036 | | | | 1,035,695 | |
U.S. Treasury Bill, 0.12%, 2/7/13 | | | 1,464 | | | | 1,463,544 | |
U.S. Treasury Bill, 0.11%, 2/14/13 | | | 2,000 | | | | 1,999,388 | |
U.S. Treasury Bill, 0.11%, 2/21/13 | | | 1,500 | | | | 1,499,502 | |
U.S. Treasury Bill, 0.13%, 2/28/13 | | | 1,695 | | | | 1,694,277 | |
U.S. Treasury Bill, 0.13%, 3/7/13 | | | 3,425 | | | | 3,423,442 | |
U.S. Treasury Bill, 0.14%, 3/14/13 | | | 1,158 | | | | 1,157,423 | |
U.S. Treasury Bill, 0.14%, 4/4/13 | | | 2,500 | | | | 2,498,508 | |
U.S. Treasury Bill, 0.14%, 4/11/13 | | | 2,000 | | | | 1,998,757 | |
U.S. Treasury Bill, 0.14%, 4/18/13 | | | 881 | | | | 880,408 | |
U.S. Treasury Note, 0.50%, 11/30/12 | | | 2,000 | | | | 2,000,592 | |
U.S. Treasury Note, 0.50%, 5/31/13 | | | 2,000 | | | | 2,003,619 | |
| | | | | | | | | |
| | |
Total U.S. Treasury Obligations
(amortized cost $54,105,086) | | | | | | $ | 54,105,086 | |
| | | | | | | | | |
| | |
Total Investments — 99.9%
(amortized cost $110,168,655)(2) | | | | | | $ | 110,168,655 | |
| | | | | | | | | |
| |
Other Assets, Less Liabilities — 0.1% | | | $ | 141,666 | |
| | | | | | | | | |
| |
Net Assets — 100.0% | | | $ | 110,310,321 | |
| | | | | | | | | |
The percentage shown for each investment category in the Portfolio of Investments is based on net assets.
| (1) | Variable rate security. The stated interest rate represents the rate in effect at October 31, 2012. |
| (2) | Cost for federal income taxes is the same. |
| | | | |
| | 6 | | See Notes to Financial Statements. |
Eaton Vance
U.S. Government Money Market Fund
October 31, 2012
Statement of Assets and Liabilities
| | | | |
| Assets | | October 31, 2012 | |
Investments, at amortized cost | | $ | 110,168,655 | |
Cash | | | 2,197 | |
Interest receivable | | | 20,767 | |
Receivable for Fund shares sold | | | 351,542 | |
Receivable from affiliate | | | 512 | |
Total assets | | $ | 110,543,673 | |
| |
| Liabilities | | | | |
Payable for Fund shares redeemed | | $ | 167,898 | |
Payable to affiliate: | | | | |
Trustees’ fees | | | 483 | |
Accrued expenses | | | 64,971 | |
Total liabilities | | $ | 233,352 | |
Net Assets | | $ | 110,310,321 | |
| |
| Sources of Net Assets | | | | |
Paid-in capital | | $ | 110,504,280 | |
Accumulated net realized loss | | | (193,959 | ) |
Total | | $ | 110,310,321 | |
| |
| Class A Shares | | | | |
Net Assets | | $ | 80,657,479 | |
Shares Outstanding* | | | 80,887,696 | |
Net Asset Value, Offering Price and Redemption Price Per Share | | | | |
(net assets ÷ shares of beneficial interest outstanding) | | $ | 1.00 | |
| |
| Class B Shares | | | | |
Net Assets | | $ | 13,824,395 | |
Shares Outstanding* | | | 13,822,643 | |
Net Asset Value and Offering Price Per Share** | | | | |
(net assets ÷ shares of beneficial interest outstanding) | | $ | 1.00 | |
| |
| Class C Shares | | | | |
Net Assets | | $ | 15,828,447 | |
Shares Outstanding* | | | 15,826,883 | |
Net Asset Value and Offering Price Per Share** | | | | |
(net assets ÷ shares of beneficial interest outstanding) | | $ | 1.00 | |
| * | Shares of beneficial interest have no par value and unlimited authorization. |
| ** | Redemption price per share is equal to the net asset value less any applicable contingent deferred sales charge. |
| | | | |
| | 7 | | See Notes to Financial Statements. |
Eaton Vance
U.S. Government Money Market Fund
October 31, 2012
Statement of Operations
| | | | |
| Investment Income | | Year Ended
October 31, 2012 | |
Interest | | $ | 161,450 | |
Total investment income | | $ | 161,450 | |
| |
| Expenses | | | | |
Investment adviser fee | | $ | 799,739 | |
Distribution and service fees | | | | |
Class B | | | 169,807 | |
Class C | | | 198,932 | |
Trustees’ fees and expenses | | | 6,752 | |
Custodian fee | | | 89,815 | |
Transfer and dividend disbursing agent fees | | | 131,514 | |
Legal and accounting services | | | 28,072 | |
Printing and postage | | | 23,846 | |
Registration fees | | | 70,442 | |
Miscellaneous | | | 15,327 | |
Total expenses | | $ | 1,534,246 | |
Deduct — | | | | |
Reduction of custodian fee | | $ | 70 | |
Waiver of fees and reimbursement of expenses by affiliates | | | 1,372,726 | |
Total expense reductions | | $ | 1,372,796 | |
| |
Net expenses | | $ | 161,450 | |
| |
Net investment income | | $ | — | |
| |
| Realized and Unrealized Gain (Loss) | | | | |
Net realized gain (loss) — | | | | |
Investment transactions | | $ | 6,288 | |
Net realized gain | | $ | 6,288 | |
| |
Net increase in net assets from operations | | $ | 6,288 | |
| | | | |
| | 8 | | See Notes to Financial Statements. |
Eaton Vance
U.S. Government Money Market Fund
October 31, 2012
Statements of Changes in Net Assets
| | | | | | | | |
| | | Year Ended October 31, | |
| Increase (Decrease) in Net Assets | | 2012 | | | 2011 | |
From operations — | | | | | | | | |
Net investment income | | $ | — | | | $ | 49 | |
Net realized gain from investment transactions and disposal of investments in violation of restrictions | | | 6,288 | | | | 4,151 | |
Net increase in net assets from operations | | $ | 6,288 | | | $ | 4,200 | |
Distributions to shareholders — | | | | | | | | |
From net investment income | | | | | | | | |
Class A | | $ | — | | | $ | (46 | ) |
Class B | | | — | | | | (2 | ) |
Class C | | | — | | | | (1 | ) |
Total distributions to shareholders | | $ | — | | | $ | (49 | ) |
Transactions in shares of beneficial interest at Net Asset Value of $1.00 per share — | | | | | | | | |
Proceeds from sale of shares | | | | | | | | |
Class A | | $ | 86,530,785 | | | $ | 672,606,538 | |
Class B | | | 2,298,073 | | | | 13,954,965 | |
Class C | | | 16,546,500 | | | | 55,270,782 | |
Net asset value of shares issued to shareholders in payment of distributions declared | | | | | | | | |
Class A | | | — | | | | 12 | |
Class B | | | — | | | | 2 | |
Class C | | | — | | | | 1 | |
Cost of shares redeemed | | | | | | | | |
Class A | | | (243,715,845 | ) | | | (563,042,896 | ) |
Class B | | | (9,394,232 | ) | | | (17,453,441 | ) |
Class C | | | (30,925,221 | ) | | | (35,394,321 | ) |
Net asset value of shares exchanged | | | | | | | | |
Class A | | | 2,871,330 | | | | 7,990,708 | |
Class B | | | (2,871,330 | ) | | | (7,990,708 | ) |
Net increase (decrease) in net assets from Fund share transactions | | $ | (178,659,940 | ) | | $ | 125,941,642 | |
| | |
Net increase (decrease) in net assets | | $ | (178,653,652 | ) | | $ | 125,945,793 | |
| | |
| Net Assets | | | | | | | | |
At beginning of year | | $ | 288,963,973 | | | $ | 163,018,180 | |
At end of year | | $ | 110,310,321 | | | $ | 288,963,973 | |
| | |
Accumulated undistributed net investment income
included in net assets | | | | | | | | |
At end of year | | $ | — | | | $ | 12 | |
| | | | |
| | 9 | | See Notes to Financial Statements. |
Eaton Vance
U.S. Government Money Market Fund
October 31, 2012
Financial Highlights
| | | | | | | | | | | | | | | | | | | | |
| | | Class A(1) | |
| | | Year Ended October 31, | |
| | | 2012 | | | 2011 | | | 2010 | | | 2009 | | | 2008 | |
Net asset value — Beginning of year | | $ | 1.000 | | | $ | 1.000 | | | $ | 1.000 | | | $ | 1.000 | | | $ | 1.000 | |
| | | | | |
| Income (Loss) From Operations | | | | | | | | | | | | | | | | | | | | |
Net investment income(2) | | $ | — | | | $ | 0.000 | (3) | | $ | 0.000 | (3) | | $ | 0.002 | | | $ | 0.030 | |
| | | | | |
| Less Distributions | | | | | | | | | | | | | | | | | | | | |
From net investment income | | $ | — | | | $ | (0.000 | )(3) | | $ | (0.000 | )(3) | | $ | (0.002 | ) | | $ | (0.030 | ) |
Tax return of capital | | | — | | | | — | | | | — | | | | (0.000 | )(3) | | | — | |
| | | | | |
Total distributions | | $ | — | | | $ | (0.000 | ) | | $ | (0.000 | ) | | $ | (0.002 | ) | | $ | (0.030 | ) |
| | | | | |
Net asset value — End of year | | $ | 1.000 | | | $ | 1.000 | | | $ | 1.000 | | | $ | 1.000 | | | $ | 1.000 | |
| | | | | |
Total Return(4) | | | 0.00 | % | | | 0.00 | %(5)(6) | | | 0.00 | %(5) | | | 0.17 | % | | | 3.02 | % |
| | | | | |
| Ratios/Supplemental Data | | | | | | | | | | | | | | | | | | | | |
Net assets, end of year (000’s omitted) | | $ | 80,657 | | | $ | 234,966 | | | $ | 117,409 | | | $ | 178,584 | | | $ | 342,517 | |
Ratios (as a percentage of average daily net assets): | | | | | | | | | | | | | | | | | | | | |
Expenses(7) | | | 0.10 | %(8) | | | 0.13 | %(8) | | | 0.20 | %(8)(9) | | | 0.58 | %(8)(9) | | | 0.58 | %(9) |
Net investment income | | | — | | | | 0.00 | %(5) | | | 0.00 | %(5) | | | 0.23 | % | | | 2.90 | % |
| (1) | Effective December 7, 2009, the Fund commenced offering multiple classes of shares. Shares outstanding prior to that date were designated as Class A shares. |
| (2) | Computed using average shares outstanding. |
| (3) | Amount is less than $0.0005. |
| (4) | Returns are historical and are calculated by determining the percentage change in net asset value with all distributions reinvested. |
| (5) | Amount is less than 0.005%. |
| (6) | During the year ended October 31, 2011, the Fund realized a gain on the disposal of investments which did not meet the Fund’s investment guidelines. The gain was less than $0.01 per share and had no effect on total return for the year ended October 31, 2011. |
| (7) | Excludes the effect of custody fee credits, if any, of less than 0.005%. |
| (8) | The investment adviser waived its investment adviser fee and reimbursed a portion of the Fund’s expenses and/or the investment adviser waived a portion of its investment adviser fee of the Portfolio during the period that the Fund invested in the Portfolio (equal to 0.63%, 0.55%, 0.50% and 0.18% of average daily net assets for the years ended October 31, 2012, 2011, 2010 and 2009, respectively). Absent this waiver and reimbursement, total return would have been lower. |
| (9) | Includes the Fund’s share of the Portfolio’s allocated expenses for the period when the Fund was making investments directly in the Portfolio. |
References to the Portfolio herein are to Cash Management Portfolio, a New York trust having the same investment objective and policies as the Fund, in which the Fund invested all of its investable assets prior to February 27, 2010.
| | | | |
| | 10 | | See Notes to Financial Statements. |
Eaton Vance
U.S. Government Money Market Fund
October 31, 2012
Financial Highlights — continued
| | | | | | | | | | | | |
| | | Class B | |
| | | Year Ended October 31, | | | Period Ended
October 31, 2010(1) | |
| | | 2012 | | | 2011 | | |
Net asset value — Beginning of period | | $ | 1.000 | | | $ | 1.000 | | | $ | 1.000 | |
| | | |
| Income (Loss) From Operations | | | | | | | | | | | | |
Net investment income(2) | | $ | — | | | $ | 0.000 | (3) | | $ | 0.000 | (3) |
| | | |
| Less Distributions | | | | | | | | | | | | |
From net investment income | | $ | — | | | $ | (0.000 | )(3) | | $ | (0.000 | )(3) |
| | | |
Total distributions | | $ | — | | | $ | (0.000 | ) | | $ | (0.000 | ) |
| | | |
Net asset value — End of period | | $ | 1.000 | | | $ | 1.000 | | | $ | 1.000 | |
| | | |
Total Return(4) | | | 0.00 | % | | | 0.00 | %(5)(6) | | | 0.00 | %(5)(7) |
| | | |
| Ratios/Supplemental Data | | | | | | | | | | | | |
Net assets, end of period (000’s omitted) | | $ | 13,824 | | | $ | 23,791 | | | $ | 35,280 | |
Ratios (as a percentage of average daily net assets): | | | | | | | | | | | | |
Expenses(8) | | | 0.10 | %(9) | | | 0.13 | %(9) | | | 0.20 | %(9)(10)(11) |
Net investment income | | | — | | | | 0.00 | %(5) | | | 0.00 | %(5)(10) |
| (1) | For the period from commencement of operations, December 7, 2009, to October 31, 2010. |
| (2) | Computed using average shares outstanding. |
| (3) | Amount is less than $0.0005. |
| (4) | Returns are historical and are calculated by determining the percentage change in net asset value with all distributions reinvested and do not reflect the effect of sales charges. |
| (5) | Amount is less than 0.005%. |
| (6) | During the year ended October 31, 2011, the Fund realized a gain on the disposal of investments which did not meet the Fund’s investment guidelines. The gain was less than $0.01 per share and had no effect on total return for the year ended October 31, 2011. |
| (8) | Excludes the effect of custody fee credits, if any, of less than 0.005%. |
| (9) | The investment adviser waived its investment adviser fee and reimbursed a portion of the Fund’s expenses, the investment adviser waived a portion of its investment adviser fee of the Portfolio during the period that the Fund invested in the Portfolio, and/or the distributor waived its distribution and service fees (equal to 1.53%, 1.45% and 1.40% of average daily net assets for the years ended October 31, 2012 and 2011 and the period ended October 31, 2010, respectively). Absent this waiver and reimbursement, total return would have been lower. |
| (11) | Includes the Fund’s share of the Portfolio’s allocated expenses for the period when the Fund was making investments directly in the Portfolio. |
References to the Portfolio herein are to Cash Management Portfolio, a New York trust having the same investment objective and policies as the Fund, in which the Fund invested all of its investable assets prior to February 27, 2010.
| | | | |
| | 11 | | See Notes to Financial Statements. |
Eaton Vance
U.S. Government Money Market Fund
October 31, 2012
Financial Highlights — continued
| | | | | | | | | | | | |
| | | Class C | |
| | | Year Ended October 31, | | | Period Ended
October 31, 2010(1) | |
| | | 2012 | | | 2011 | | |
Net asset value — Beginning of period | | $ | 1.000 | | | $ | 1.000 | | | $ | 1.000 | |
| | | |
| Income (Loss) From Operations | | | | | | | | | | | | |
Net investment income(2) | | $ | — | | | $ | 0.000 | (3) | | $ | 0.000 | (3) |
| | | |
| Less Distributions | | | | | | | | | | | | |
From net investment income | | $ | — | | | $ | (0.000 | )(3) | | $ | (0.000 | )(3) |
| | | |
Total distributions | | $ | — | | | $ | (0.000 | ) | | $ | (0.000 | ) |
| | | |
Net asset value — End of period | | $ | 1.000 | | | $ | 1.000 | | | $ | 1.000 | |
| | | |
Total Return(4) | | | 0.00 | % | | | 0.00 | %(5)(6) | | | 0.00 | %(5)(7) |
| | | |
| Ratios/Supplemental Data | | | | | | | | | | | | |
Net assets, end of period (000’s omitted) | | $ | 15,828 | | | $ | 30,206 | | | $ | 10,330 | |
Ratios (as a percentage of average daily net assets): | | | | | | | | | | | | |
Expenses(8) | | | 0.10 | %(9) | | | 0.13 | %(9) | | | 0.20 | %(9)(10)(11) |
Net investment income | | | — | | | | 0.00 | %(5) | | | 0.00 | %(5)(10) |
| (1) | For the period from commencement of operations, December 7, 2009, to October 31, 2010. |
| (2) | Computed using average shares outstanding. |
| (3) | Amount is less than $0.0005. |
| (4) | Returns are historical and are calculated by determining the percentage change in net asset value with all distributions reinvested and do not reflect the effect of sales charges. |
| (5) | Amount is less than 0.005%. |
| (6) | During the year ended October 31, 2011, the Fund realized a gain on the disposal of investments which did not meet the Fund’s investment guidelines. The gain was less than $0.01 per share and had no effect on total return for the year ended October 31, 2011. |
| (8) | Excludes the effect of custody fee credits, if any, of less than 0.005%. |
| (9) | The investment adviser waived its investment adviser fee and reimbursed a portion of the Fund’s expenses, the investment adviser waived a portion of its investment adviser fee of the Portfolio during the period that the Fund invested in the Portfolio, and/or the distributor waived its distribution and service fees (equal to 1.53%, 1.45% and 1.40% of average daily net assets for the years ended October 31, 2012 and 2011 and the period ended October 31, 2010, respectively). Absent this waiver and reimbursement, total return would have been lower. |
| (11) | Includes the Fund’s share of the Portfolio’s allocated expenses for the period when the Fund was making investments directly in the Portfolio. |
References to the Portfolio herein are to Cash Management Portfolio, a New York trust having the same investment objective and policies as the Fund, in which the Fund invested all of its investable assets prior to February 27, 2010.
| | | | |
| | 12 | | See Notes to Financial Statements. |
Eaton Vance
U.S. Government Money Market Fund
October 31, 2012
Notes to Financial Statements
1 Significant Accounting Policies
Eaton Vance U.S. Government Money Market Fund (the Fund) is a diversified series of Eaton Vance Mutual Funds Trust (the Trust). The Trust is a Massachusetts business trust registered under the Investment Company Act of 1940, as amended (the 1940 Act), as an open-end management investment company. The Fund’s investment objective is to provide as high a rate of income as may be consistent with preservation of capital and maintenance of liquidity. The Fund offers three classes of shares. Class A (effective January 1, 2012), Class B and Class C shares are only offered in exchange for Class A, Class B and Class C shares, respectively, of other Eaton Vance funds, except that certain Eaton Vance and third-party sponsored retirement plans may continue to purchase Class A shares until such time as they identify an alternative investment vehicle. Class A shares are offered at net asset value with no front-end sales charge. Class B and Class C shares are offered at net asset value and are generally subject to a contingent deferred sales charge (see Note 5). Class B shares automatically convert to Class A shares eight years after their purchase as described in the Fund’s prospectus. Each class represents a pro-rata interest in the Fund, but votes separately on class-specific matters and (as noted below) is subject to different expenses. Realized and unrealized gains and losses are allocated daily to each class of shares based on the relative net assets of each class to the total net assets of the Fund. Net investment income, other than class-specific expenses, is allocated daily to each class of shares based upon the ratio of the value of each class’s paid shares to the total value of all paid shares. Each class of shares differs in its distribution plan and certain other class-specific expenses.
The following is a summary of significant accounting policies of the Fund. The policies are in conformity with accounting principles generally accepted in the United States of America.
A Investment Valuation — The Fund generally values its investment securities utilizing the amortized cost valuation technique permitted by Rule 2a-7 under the 1940 Act, pursuant to which the Fund must comply with certain conditions. This technique involves initially valuing a portfolio security at its cost and thereafter assuming a constant amortization to maturity of any discount or premium. If amortized cost is determined not to approximate fair value, the Fund may value its investment securities based on available market quotations provided by a third party pricing service.
B Investment Transactions — Investment transactions for financial statement purposes are accounted for on a trade date basis. Realized gains and losses on investments sold are determined on the basis of identified cost.
C Income — Interest income is recorded on the basis of interest accrued, adjusted for amortization of premium or accretion of discount.
D Federal Taxes — The Fund’s policy is to comply with the provisions of the Internal Revenue Code applicable to regulated investment companies and to distribute to shareholders each year substantially all of its net investment income, and all or substantially all of its net realized capital gains. Accordingly, no provision for federal income or excise tax is necessary.
At October 31, 2012, the Fund, for federal income tax purposes, had a capital loss carryforward of $193,959 which will reduce its taxable income arising from future net realized gains on investment transactions, if any, to the extent permitted by the Internal Revenue Code, and thus will reduce the amount of distributions to shareholders, which would otherwise be necessary to relieve the Fund of any liability for federal income or excise tax. The capital loss carryforward will expire on October 31, 2016. In addition, such capital loss carryforward cannot be utilized prior to the utilization of new capital losses, if any, created after October 31, 2012.
During the year ended October 31, 2012, a capital loss carryfoward of $6,288 was utilized to offset net realized gains by the Fund.
As of October 31, 2012, the Fund had no uncertain tax positions that would require financial statement recognition, de-recognition, or disclosure. The Fund files a U.S. federal income tax return annually after its fiscal year-end, which is subject to examination by the Internal Revenue Service for a period of three years from the date of filing.
E Expenses — The majority of expenses of the Trust are directly identifiable to an individual fund. Expenses which are not readily identifiable to a specific fund are allocated taking into consideration, among other things, the nature and type of expense and the relative size of the funds.
F Expense Reduction — State Street Bank and Trust Company (SSBT) serves as custodian of the Fund. Pursuant to the custodian agreement, SSBT receives a fee reduced by credits, which are determined based on the average daily cash balance the Fund maintains with SSBT. All credit balances, if any, used to reduce the Fund’s custodian fees are reported as a reduction of expenses in the Statement of Operations.
G Use of Estimates — The preparation of the financial statements in conformity with accounting principles generally accepted in the United States of America requires management to make estimates and assumptions that affect the reported amounts of assets and liabilities at the date of the financial statements and the reported amounts of income and expense during the reporting period. Actual results could differ from those estimates.
H Indemnifications — Under the Trust’s organizational documents, its officers and Trustees may be indemnified against certain liabilities and expenses arising out of the performance of their duties to the Fund. Under Massachusetts law, if certain conditions prevail, shareholders of a Massachusetts business trust (such as the Trust) could be deemed to have personal liability for the obligations of the Trust. However, the Trust’s Declaration of Trust contains an express disclaimer of liability on the part of Fund shareholders and the By-laws provide that the Trust shall assume the defense on behalf of any Fund shareholders. Moreover, the By-laws also provide for indemnification out of Fund property of any shareholder held personally liable solely by reason of being or having been a shareholder for all loss or expense arising from such liability. Additionally, in the normal course of business, the Fund enters into
Eaton Vance
U.S. Government Money Market Fund
October 31, 2012
Notes to Financial Statements — continued
agreements with service providers that may contain indemnification clauses. The Fund’s maximum exposure under these arrangements is unknown as this would involve future claims that may be made against the Fund that have not yet occurred.
2 Distributions to Shareholders
The net investment income of the Fund is determined daily, and substantially all of the net investment income so determined is declared daily as a dividend to shareholders of record at the time of declaration. Distributions are generally paid monthly. Distributions of realized capital gains (reduced by available capital loss carryforwards from prior years, if any) are made at least annually. Distributions are declared separately for each class of shares. Shareholders may reinvest income and capital gain distributions in additional shares of the same class of the Fund at the net asset value as of the reinvestment date or, at the election of the shareholder, receive distributions in cash. The Fund distinguishes between distributions on a tax basis and a financial reporting basis. Accounting principles generally accepted in the United States of America require that only distributions in excess of tax basis earnings and profits be reported in the financial statements as a return of capital. Permanent differences between book and tax accounting relating to distributions are reclassified to paid-in capital.
The tax character of distributions declared for the years ended October 31, 2012 and October 31, 2011 was as follows:
| | | | | | | | |
| | | Year Ended October 31, | |
| | | 2012 | | | 2011 | |
| | |
Distributions declared from: | | | | | | | | |
Ordinary income | | $ | — | | | $ | 49 | |
During the year ended October 31, 2012, accumulated undistributed net investment income was decreased by $12 and paid-in capital was increased by $12 due to differences between book and tax accounting. These reclassifications had no effect on the net assets or net asset value per share of the Fund.
As of October 31, 2012, the components of distributable earnings (accumulated losses) on a tax basis were as follows:
| | | | |
Capital loss carryforward | | $ | (193,959 | ) |
3 Investment Adviser Fee and Other Transactions with Affiliates
The investment adviser fee is earned by Boston Management and Research (BMR) as compensation for investment advisory services rendered to the Fund. The fee is computed at an annual rate of 0.50% of the Fund’s average daily net assets up to $1 billion and at reduced rates on net assets of $1 billion or more, and is payable monthly. For the year ended October 31, 2012, the Fund’s investment adviser fee amounted to $799,739 or 0.50% of the Fund’s average daily net assets. BMR has voluntarily undertaken to waive fees and reimburse expenses of the Fund to the extent necessary to maintain a yield of not less than zero. For the year ended October 31, 2012, BMR waived investment adviser fees and reimbursed expenses of the Fund of $1,003,987. The Fund’s distributor also waived its fees (see Note 4). Eaton Vance Management (EVM) serves as the administrator of the Fund, but receives no compensation.
EVM serves as the sub-transfer agent of the Fund and receives from the transfer agent an aggregate fee based upon the actual expenses incurred by EVM in the performance of these services. For the year ended October 31, 2012, EVM earned $13,282 in sub-transfer agent fees. Eaton Vance Distributors, Inc. (EVD), an affiliate of EVM and the Fund’s principal underwriter, also receives distribution and service fees from Class B and Class C shares (see Note 4) and contingent deferred sales charges (see Note 5).
Trustees and officers of the Fund who are members of EVM’s or BMR’s organizations receive remuneration for their services to the Fund out of the investment adviser fee. Trustees of the Fund who are not affiliated with the investment adviser may elect to defer receipt of all or a percentage of their annual fees in accordance with the terms of the Trustees Deferred Compensation Plan. For the year ended October 31, 2012, no significant amounts have been deferred. Certain officers and Trustees of the Fund are officers of the above organizations.
4 Distribution Plans
The Fund has in effect distribution plans for Class B shares (Class B Plan) and Class C shares (Class C Plan) pursuant to Rule 12b-1 under the 1940 Act. The Class B and Class C Plans require the Fund to pay EVD amounts equal to 0.75% of its average daily net assets attributable to Class B and Class C shares for providing ongoing distribution services and facilities to the Fund. On issuance of Class B and Class C shares of the Fund in exchange for shares
Eaton Vance
U.S. Government Money Market Fund
October 31, 2012
Notes to Financial Statements — continued
of an Eaton Vance fund, the respective class will assume a portion of the Uncovered Distribution Charges associated with the shares so exchanged. Uncovered Distribution Charges are generally equivalent to the sum of (i) 5% and 6.25% of the aggregate amount received by an Eaton Vance fund for Class B and Class C shares sold, respectively, plus (ii) interest calculated by applying the rate of 1% over the prevailing prime rate to the outstanding balance of Uncovered Distribution Charges of EVD of each respective class, reduced by the aggregate amount of contingent deferred sales charges (see Note 5) and amounts theretofore paid or payable to EVD by each respective class. The Fund will automatically discontinue payments to EVD during any period in which there are no outstanding Uncovered Distribution Charges. For the year ended October 31, 2012, the Fund accrued to EVD $141,506 and $165,777 for Class B and Class C shares, respectively, representing 0.75% of the average daily net assets of Class B and Class C shares, all of which were voluntarily waived by EVD. At October 31, 2012, the amounts of Uncovered Distribution Charges of EVD calculated under the Class B and Class C Plans were approximately $18,045,000 and $3,770,000, respectively.
The Class B and Class C Plans also authorize the Fund to make payments of service fees to EVD, financial intermediaries and other persons in amounts not exceeding 0.25% of its average daily net assets attributable to that class. The Trustees approved service fee payments equal to 0.15% per annum of the Fund’s average daily net assets for Class B and Class C shares. Service fees paid or accrued are for personal services and/or the maintenance of shareholder accounts. They are separate and distinct from the sales commissions and distribution fees payable to EVD. Service fees accrued for the year ended October 31, 2012 amounted to $28,301 and $33,155 for Class B and Class C shares, respectively, all of which were voluntarily waived by EVD.
5 Contingent Deferred Sales Charges
Class B and Class C shares are subject to a contingent deferred sales charge (CDSC) at the original CDSC rate that such shares were subject to prior to their exchange into the Fund. A CDSC generally is imposed on redemptions of Class B shares made within four to six years of purchase, depending on the fund from which shares were exchanged, at declining rates that begin at 3% and 5%, respectively. Class C shares are subject to a 1% CDSC if redeemed within one year of purchase. Generally, the CDSC is based on the lower of the net asset value at date of redemption or date of purchase. No charge is levied on shares acquired by reinvestment of dividends or capital gain distributions. No CDSC is levied on shares which have been sold to EVM or its affiliates or to their respective employees or clients and may be waived under certain other limited conditions. For the year ended October 31, 2012, the Fund was informed that EVD received approximately $50,000 and $7,000 of CDSCs paid by Class B and Class C shareholders, respectively.
6 Purchases and Sales of Investments
Purchases and sales of investments, including maturities, aggregated $764,066,398 and $945,116,758, respectively, for the year ended October 31, 2012.
7 Line of Credit
The Fund participates with other portfolios and funds managed by EVM and its affiliates in a $600 million unsecured line of credit agreement with a group of banks. Borrowings are made by the Fund solely to facilitate the handling of unusual and/or unanticipated short-term cash requirements. Interest is charged to the Fund based on its borrowings at an amount above either the Eurodollar rate or Federal Funds rate. In addition, a fee computed at an annual rate of 0.08% on the daily unused portion of the line of credit is allocated among the participating portfolios and funds at the end of each quarter. Because the line of credit is not available exclusively to the Fund, it may be unable to borrow some or all of its requested amounts at any particular time. The Fund did not have any significant borrowings or allocated fees during the year ended October 31, 2012.
8 Fair Value Measurements
Under generally accepted accounting principles for fair value measurements, a three-tier hierarchy to prioritize the assumptions, referred to as inputs, is used in valuation techniques to measure fair value. The three-tier hierarchy of inputs is summarized in the three broad levels listed below.
| Ÿ | | Level 1 – quoted prices in active markets for identical investments |
| Ÿ | | Level 2 – other significant observable inputs (including quoted prices for similar investments, interest rates, prepayment speeds, credit risk, etc.) |
| Ÿ | | Level 3 – significant unobservable inputs (including a fund’s own assumptions in determining the fair value of investments) |
In cases where the inputs used to measure fair value fall in different levels of the fair value hierarchy, the level disclosed is determined based on the lowest level input that is significant to the fair value measurement in its entirety. The inputs or methodology used for valuing securities are not necessarily an indication of the risk associated with investing in those securities. For example, money market securities are valued using amortized cost, in accordance with rules under the 1940 Act. Generally, amortized cost approximates the current fair value of a security, but since the value is not obtained from a quoted price in an active market, such securities are reflected as Level 2.
Eaton Vance
U.S. Government Money Market Fund
October 31, 2012
Notes to Financial Statements — continued
At October 31, 2012, the hierarchy of inputs used in valuing the Fund’s investments, which are carried at amortized cost, were as follows:
| | | | | | | | | | | | | | | | |
| Asset Description | | Level 1 | | | Level 2 | | | Level 3 | | | Total | |
| | | | |
U.S. Government Agency Obligations | | $ | — | | | $ | 56,063,569 | | | $ | — | | | $ | 56,063,569 | |
U.S. Treasury Obligations | | | — | | | | 54,105,086 | | | | — | | | | 54,105,086 | |
| | | | |
Total Investments | | $ | — | | | $ | 110,168,655 | | | $ | — | | | $ | 110,168,655 | |
The Fund held no investments or other financial instruments as of October 31, 2011 whose fair value was determined using Level 3 inputs. At October 31, 2012, there were no investments transferred between Level 1 and Level 2 during the year then ended.
Eaton Vance
U.S. Government Money Market Fund
October 31, 2012
Report of Independent Registered Public Accounting Firm
To the Trustees of Eaton Vance Mutual Funds Trust and Shareholders of Eaton Vance U.S. Government Money Market Fund:
We have audited the accompanying statement of assets and liabilities of Eaton Vance U.S. Government Money Market Fund (the “Fund”) (one of the funds constituting Eaton Vance Mutual Funds Trust), including the portfolio of investments, as of October 31, 2012, and the related statement of operations for the year then ended, the statements of changes in net assets for each of the two years in the period then ended, and the financial highlights for each of the five years of the period then ended . These financial statements and financial highlights are the responsibility of the Fund’s management. Our responsibility is to express an opinion on these financial statements and financial highlights based on our audits.
We conducted our audits in accordance with the standards of the Public Company Accounting Oversight Board (United States). Those standards require that we plan and perform the audit to obtain reasonable assurance about whether the financial statements and financial highlights are free of material misstatement. The Fund is not required to have, nor were we engaged to perform, an audit of its internal control over financial reporting. Our audits included consideration of internal control over financial reporting as a basis for designing audit procedures that are appropriate in the circumstances, but not for the purpose of expressing an opinion on the effectiveness of the Fund’s internal control over financial reporting. Accordingly, we express no such opinion. An audit also includes examining, on a test basis, evidence supporting the amounts and disclosures in the financial statements, assessing the accounting principles used and significant estimates made by management, as well as evaluating the overall financial statement presentation. Our procedures included confirmation of securities owned as of October 31, 2012, by correspondence with the custodian and brokers. We believe that our audits provide a reasonable basis for our opinion.
In our opinion, such financial statements and financial highlights referred to above present fairly, in all material respects, the financial position of Eaton Vance U.S. Government Money Market Fund as of October 31, 2012, the results of its operations for the year then ended, the changes in its net assets for each of the two years in the period then ended, and the financial highlights for each of the five years in the period then ended, in conformity with accounting principles generally accepted in the United States of America.
DELOITTE & TOUCHE LLP
Boston, Massachusetts
December 17, 2012
Eaton Vance
U.S. Government Money Market Fund
October 31, 2012
Federal Tax Information (Unaudited)
Shareholders are advised to consult their own tax adviser with respect to the tax consequences of their investment in the Fund.
Eaton Vance
U.S. Government Money Market Fund
October 31, 2012
Management and Organization
Fund Management. The Trustees of Eaton Vance Mutual Funds Trust (the Trust) are responsible for the overall management and supervision of the Trust’s affairs. The Trustees and officers of the Trust are listed below. Except as indicated, each individual has held the office shown or other offices in the same company for the last five years. Trustees and officers of the Trust hold indefinite terms of office. The “Noninterested Trustees” consist of those Trustees who are not “interested persons” of the Trust, as that term is defined under the 1940 Act. The business address of each Trustee and officer is Two International Place, Boston, Massachusetts 02110. As used below, “EVC” refers to Eaton Vance Corp., “EV” refers to Eaton Vance, Inc., “EVM” refers to Eaton Vance Management, “BMR” refers to Boston Management and Research and “EVD” refers to Eaton Vance Distributors, Inc. EVC and EV are the corporate parent and trustee, respectively, of EVM and BMR. EVD is the Fund’s principal underwriter and a wholly-owned subsidiary of EVC. Each officer affiliated with Eaton Vance may hold a position with other Eaton Vance affiliates that is comparable to his or her position with EVM listed below. Each Trustee oversees 187 portfolios in the Eaton Vance Complex (including all master and feeder funds in a master feeder structure). Each officer serves as an officer of certain other Eaton Vance funds. Each Trustee and officer serves until his or her successor is elected.
| | | | | | |
| Name and Year of Birth | | Position(s) with the Trust | | Length of
Service | | Principal Occupation(s) and Directorships During Past Five Years and Other Relevant Experience |
Interested Trustee |
| | | |
Thomas E. Faust Jr. 1958 | | Trustee | | Since 2007 | | Chairman, Chief Executive Officer and President of EVC, Director and President of EV, Chief Executive Officer and President of EVM and BMR, and Director of EVD. Trustee and/or officer of 187 registered investment companies. Mr. Faust is an interested person because of his positions with EVM, BMR, EVD, EVC and EV, which are affiliates of the Trust. Directorships in the Last Five Years.(1) Director of EVC and Hexavest Inc. |
| | | |
| | | | | | |
|
Noninterested Trustees |
| | | |
Scott E. Eston 1956 | | Trustee | | Since 2011 | | Private investor. Formerly held various positions at Grantham, Mayo, Van Otterloo and Co., L.L.C. (investment management firm) (1997-2009), including Chief Operating Officer (2002-2009), Chief Financial Officer (1997-2009) and Chairman of the Executive Committee (2002-2008); President and Principal Executive Officer, GMO Trust (open-end registered investment company) (2006-2009). Former Partner, Coopers and Lybrand L.L.P. (now PricewaterhouseCoopers) (public accounting firm) (1987-1997). Directorships in the Last Five Years. None. |
| | | |
Benjamin C. Esty 1963 | | Trustee | | Since 2005 | | Roy and Elizabeth Simmons Professor of Business Administration and Finance Unit Head, Harvard University Graduate School of Business Administration. Directorships in the Last Five Years.(1) None. |
| | | |
Allen R. Freedman 1940 | | Trustee | | Since 2007 | | Private Investor. Former Chairman (2002-2004) and a Director (1983-2004) of Systems & Computer Technology Corp. (provider of software to higher education). Formerly, a Director of Loring Ward International (fund distributor) (2005-2007). Former Chairman and a Director of Indus International, Inc. (provider of enterprise management software to the power generating industry) (2005-2007). Former Chief Executive Officer of Assurant, Inc. (insurance provider) (1979-2000). Directorships in the Last Five Years.(1) Director of Stonemor Partners, L.P. (owner and operator of cemeteries). Formerly, Director of Assurant, Inc. (insurance provider) (1979-2011). |
| | | |
William H. Park 1947 | | Trustee | | Since 2003 | | Consultant and private investor. Formerly, Chief Financial Officer, Aveon Group L.P. (investment management firm) (2010-2011). Formerly, Vice Chairman, Commercial Industrial Finance Corp. (specialty finance company) (2006-2010). Formerly, President and Chief Executive Officer, Prizm Capital Management, LLC (investment management firm) (2002-2005). Formerly, Executive Vice President and Chief Financial Officer, United Asset Management Corporation (investment management firm) (1982-2001). Formerly, Senior Manager, Price Waterhouse (now PricewaterhouseCoopers) (an independent registered public accounting firm) (1972-1981). Directorships in the Last Five Years.(1) None. |
| | | |
Ronald A. Pearlman 1940 | | Trustee | | Since 2003 | | Professor of Law, Georgetown University Law Center. Formerly, Deputy Assistant Secretary (Tax Policy) and Assistant Secretary (Tax Policy), U.S. Department of the Treasury (1983-1985). Formerly, Chief of Staff, Joint Committee on Taxation, U.S. Congress (1988-1990). Directorships in the Last Five Years.(1) None. |
Eaton Vance
U.S. Government Money Market Fund
October 31, 2012
Management and Organization — continued
| | | | | | |
| Name and Year of Birth | | Position(s) with the Trust | | Length of
Service | | Principal Occupation(s) and Directorships During Past Five Years and Other Relevant Experience |
Noninterested Trustees (continued) |
| | | |
Helen Frame Peters 1948 | | Trustee | | Since 2008 | | Professor of Finance, Carroll School of Management, Boston College. Formerly, Dean, Carroll School of Management, Boston College (2000-2002). Formerly, Chief Investment Officer, Fixed Income, Scudder Kemper Investments (investment management firm) (1998-1999). Formerly, Chief Investment Officer, Equity and Fixed Income, Colonial Management Associates (investment management firm) (1991-1998). Directorships in the Last Five Years.(1) Formerly, Director of BJ’s Wholesale Club, Inc. (wholesale club retailer) (2004-2011). Formerly, Trustee of SPDR Index Shares Funds and SPDR Series Trust (exchange traded funds) (2000-2009). Formerly, Director of Federal Home Loan Bank of Boston (a bank for banks) (2007-2009). |
| | | |
Lynn A. Stout 1957 | | Trustee | | Since 1998 | | Distinguished Professor of Corporate and Business Law, Jack G. Clarke Business Law Institute, Cornell University Law School. Formerly, the Paul Hastings Professor of Corporate and Securities Law (2006-2012) and Professor of Law (2001-2006), University of California at Los Angeles School of Law. Directorships in the Last Five Years.(1) None. |
| | | |
Harriett Tee Taggart 1948 | | Trustee | | Since 2011 | | Managing Director, Taggart Associates (a professional practice firm). Formerly, Partner and Senior Vice President, Wellington Management Company, LLP (investment management firm) (1983-2006). Directorships in the Last Five Years. Director of Albemarle Corporation (chemicals manufacturer) (since 2007) and The Hanover Group (specialty property and casualty insurance company) (since 2009). Formerly, Director of Lubrizol Corporation (specialty chemicals) (2007-2011). |
| | | |
Ralph F. Verni 1943 | | Chairman of the Board and Trustee | | Chairman of the Board since 2007 and Trustee since 2005 | | Consultant and private investor. Formerly, Chief Investment Officer (1982-1992), Chief Financial Officer (1988-1990) and Director (1982-1992), New England Life. Formerly, Chairperson, New England Mutual Funds (1982-1992). Formerly, President and Chief Executive Officer, State Street Management & Research (1992-2000). Formerly, Chairperson, State Street Research Mutual Funds (1992-2000). Formerly, Director, W.P. Carey, LLC (1998-2004) and First Pioneer Farm Credit Corp. (2002-2006). Directorships in the Last Five Years.(1) None. |
| | | |
| | | | | | |
Principal Officers who are not Trustees |
| Name and Year of Birth | | Position(s) with the Trust | | Length of Service | | Principal Occupation(s) During Past Five Years |
| | | |
Duncan W. Richardson 1957 | | President | | Since 2011 | | Director of EVC and Executive Vice President and Chief Equity Investment Officer of EVC, EVM and BMR. |
| | | |
Payson F. Swaffield 1956 | | Vice President | | Since 2011 | | Vice President and Chief Income Investment Officer of EVM and BMR. |
| | | |
Barbara E. Campbell 1957 | | Treasurer | | Since 2005 | | Vice President of EVM and BMR. |
| | | |
Maureen A. Gemma 1960 | | Vice President, Secretary and Chief Legal Officer | | Vice President since 2011, Secretary since 2007 and Chief Legal Officer since 2008 | | Vice President of EVM and BMR. |
| | | |
Paul M. O’Neil 1953 | | Chief Compliance Officer | | Since 2004 | | Vice President of EVM and BMR. |
| (1) | During their respective tenures, the Trustees (except Mr. Eston and Ms. Taggart) also served as trustees of one or more of the following Eaton Vance funds (which operated in the years noted): Eaton Vance Credit Opportunities Fund (launched in 2005 and terminated in 2010); Eaton Vance Insured Florida Plus Municipal Bond Fund (launched in 2002 and terminated in 2009); and Eaton Vance National Municipal Income Trust (launched in 1998 and terminated in 2009). |
The SAI for the Fund includes additional information about the Trustees and officers of the Fund and can be obtained without charge on Eaton Vance’s website at www.eatonvance.com or by calling 1-800-262-1122.
Eaton Vance Funds
IMPORTANT NOTICES
Privacy. The Eaton Vance organization is committed to ensuring your financial privacy. Each of the financial institutions identified below has in effect the following policy (“Privacy Policy”) with respect to nonpublic personal information about its customers:
| Ÿ | | Only such information received from you, through application forms or otherwise, and information about your Eaton Vance fund transactions will be collected. This may include information such as name, address, social security number, tax status, account balances and transactions. |
| Ÿ | | None of such information about you (or former customers) will be disclosed to anyone, except as permitted by law (which includes disclosure to employees necessary to service your account). In the normal course of servicing a customer’s account, Eaton Vance may share information with unaffiliated third parties that perform various required services such as transfer agents, custodians and broker-dealers. |
| Ÿ | | Policies and procedures (including physical, electronic and procedural safeguards) are in place that are designed to protect the confidentiality of such information. |
| Ÿ | | We reserve the right to change our Privacy Policy at any time upon proper notification to you. Customers may want to review our Privacy Policy periodically for changes by accessing the link on our homepage: www.eatonvance.com. |
Our pledge of privacy applies to the following entities within the Eaton Vance organization: the Eaton Vance Family of Funds, Eaton Vance Management, Eaton Vance Investment Counsel, Eaton Vance Distributors, Inc., Eaton Vance Trust Company, Eaton Vance Management’s Real Estate Investment Group and Boston Management and Research. In addition, our Privacy Policy applies only to those Eaton Vance customers who are individuals and who have a direct relationship with us. If a customer’s account (i.e., fund shares) is held in the name of a third-party financial advisor/broker-dealer, it is likely that only such advisor’s privacy policies apply to the customer. This notice supersedes all previously issued privacy disclosures. For more information about Eaton Vance’s Privacy Policy, please call 1-800-262-1122.
Delivery of Shareholder Documents. The Securities and Exchange Commission (SEC) permits funds to deliver only one copy of shareholder documents, including prospectuses, proxy statements and shareholder reports, to fund investors with multiple accounts at the same residential or post office box address. This practice is often called “householding” and it helps eliminate duplicate mailings to shareholders. Eaton Vance, or your financial advisor, may household the mailing of your documents indefinitely unless you instruct Eaton Vance, or your financial advisor, otherwise. If you would prefer that your Eaton Vance documents not be householded, please contact Eaton Vance at 1-800-262-1122, or contact your financial advisor. Your instructions that householding not apply to delivery of your Eaton Vance documents will be effective within 30 days of receipt by Eaton Vance or your financial advisor.
Portfolio Holdings. Each Eaton Vance Fund and its underlying Portfolio(s) (if applicable) will file a schedule of portfolio holdings on Form N-Q with the SEC for the first and third quarters of each fiscal year. The Form N-Q will be available on the Eaton Vance website at www.eatonvance.com, by calling Eaton Vance at 1-800-262-1122 or in the EDGAR database on the SEC’s website at www.sec.gov. Form N-Q may also be reviewed and copied at the SEC’s public reference room in Washington, D.C. (call 1-800-732-0330 for information on the operation of the public reference room).
Proxy Voting. From time to time, funds are required to vote proxies related to the securities held by the funds. The Eaton Vance Funds or their underlying Portfolios (if applicable) vote proxies according to a set of policies and procedures approved by the Funds’ and Portfolios’ Boards. You may obtain a description of these policies and procedures and information on how the Funds or Portfolios voted proxies relating to portfolio securities during the most recent 12-month period ended June 30, without charge, upon request, by calling 1-800-262-1122 and by accessing the SEC’s website at www.sec.gov.
This Page Intentionally Left Blank
This Page Intentionally Left Blank
This Page Intentionally Left Blank
Investment Adviser
Boston Management and Research
Two International Place
Boston, MA 02110
Administrator
Eaton Vance Management
Two International Place
Boston, MA 02110
Principal Underwriter*
Eaton Vance Distributors, Inc.
Two International Place
Boston, MA 02110
(617) 482-8260
Custodian
State Street Bank and Trust Company
200 Clarendon Street
Boston, MA 02116
Transfer Agent
BNY Mellon Investment Servicing (US) Inc.
Attn: Eaton Vance Funds
P.O. Box 9653
Providence, RI 02940-9653
(800) 262-1122
Independent Registered Public Accounting Firm
Deloitte & Touche LLP
200 Berkeley Street
Boston, MA 02116-5022
Fund Offices
Two International Place
Boston, MA 02110
| * | FINRA BrokerCheck. Investors may check the background of their Investment Professional by contacting the Financial Industry Regulatory Authority (FINRA). FINRA BrokerCheck is a free tool to help investors check the professional background of current and former FINRA-registered securities firms and brokers. FINRA BrokerCheck is available by calling 1-800-289-9999 and at www.FINRA.org. The FINRA BrokerCheck brochure describing this program is available to investors at www.FINRA.org. |
131-12/12 MMSRC
| | |
Eaton Vance Global Dividend Income Fund Annual Report October 31, 2012 | | 
|

Fund shares are not insured by the FDIC and are not deposits or other obligations of, or guaranteed by, any depository institution. Shares are subject to investment risks, including possible loss of principal invested.
This report must be preceded or accompanied by a current summary prospectus or prospectus. Before investing, investors should consider carefully the investment objective, risks, and charges and expenses of a mutual fund. This and other important information is contained in the summary prospectus and prospectus, which can be obtained from a financial advisor. Prospective investors should read the prospectus carefully before investing. For further information, please call 1-800-262-1122.
Annual Report October 31, 2012
Eaton Vance
Global Dividend Income Fund
Table of Contents
| | | | |
Management’s Discussion of Fund Performance | | | 2 | |
| |
Performance | | | 3 | |
| |
Fund Profile | | | 4 | |
| |
Endnotes and Additional Disclosures | | | 5 | |
| |
Fund Expenses | | | 6 | |
| |
Financial Statements | | | 7 | |
| |
Report of Independent Registered Public Accounting Firm | | | 27 | |
| |
Federal Tax Information | | | 28 | |
| |
Management and Organization | | | 29 | |
| |
Important Notices | | | 31 | |
Eaton Vance
Global Dividend Income Fund
October 31, 2012
Management’s Discussion of Fund Performance1
Economic and Market Conditions
As the 12-month period began, investors appeared to worry about intensifying debt problems in Europe, high U.S. unemployment and a Congressional deadlock that left businesses perplexed about the direction of tax and regulatory policy. The MSCI World Index,2 a broad measure of global equity market performance, was relatively flat in November 2011.
Beginning in mid-December 2011, however, an equity rally took hold and continued into early April 2012. U.S. stocks were generally fueled by stronger economic growth and falling unemployment. European stocks continued to underperform U.S. issues, but nonetheless moved higher, aided by the Long-Term Refinancing Operation announced by the European Central Bank (ECB) and what the markets perceived as a successful restructuring of Greek debt. Then in May 2012, the third annual mid-year economic slowdown arrived. As U.S. stock prices decreased, stock prices overseas fell even harder. Contributing factors included renewed concerns over Europe and slowing growth in China.
But despite a slowdown in consumer spending, weakening employment data and downward revisions of growth expectations, global equities moved upward intermittently from June through mid-October 2012. Hunting for yield in a low interest-rate environment, investors were driven to stocks that offered better yields than bonds. Ongoing action by the ECB also helped the market, particularly the Outright Monetary Transactions program to support sovereign debt.
Additional factors led U.S. stocks to generally outperform their non-U.S. counterparts. First, investors anticipated that worsening economic news would prompt the U.S. Federal Reserve to initiate another round of quantitative easing to stimulate the economy — which it did in September 2012. Finally, in an increasingly global marketplace, a case could be made that the U.S. market was relatively attractive versus many other world markets for much of the period. Amid ongoing European turmoil and a slowdown in Chinese growth, the U.S. market was one of the few places investors could find an economy that was growing (albeit slowly); a liquid, transparent and generally well regulated market; and an opportunity to find companies with large cash reserves and solid profit growth.
In the final weeks of the period, however, stocks gave back some of their gains as the market seemed to have come full circle; amid uncertainty about the upcoming U.S. elections, investors once again worried about a Congressional deadlock on tax policy — an impasse that has left the United States rushing toward a fiscal cliff that could drag down the global economy.
Fund Performance
For the fiscal year ended October 31, 2012, Eaton Vance Global Dividend Income Fund (the Fund) had a total return of 8.35% for Class A shares at net asset value (NAV). By contrast, the Fund’s benchmark, the MSCI World Index (the Index), had a total return of 9.45% for the period. The Fund’s common stock allocation and its preferred securities allocation both outperformed the Index, but not by enough to offset the management expenses of the Fund.
Performance of the Fund’s common stock allocation was helped by stock selection in the materials, consumer discretionary and energy sectors. Within the materials sector, stock selection in chemicals boosted results versus the Index, as did a relative underweighting and stock selection in the poor-performing metals and mining industry. In consumer discretionary, stock selection among specialty retail stocks, as well as an overweighting in the industry, aided Fund performance versus the Index. Stock selection among energy equipment and services stocks and oil, gas and consumable fuels stocks contributed to Fund results versus the Index in the energy sector.
By contrast, stock selection in the health care, industrials and information technology (IT) sectors detracted from Fund performance versus the Index. Positioning in pharmaceuticals and weak stock selection in health care providers and services hurt Fund results versus the Index in the health care sector, as did avoiding the strong-performing biotechnology industry. Positioning in building products and industrial conglomerates detracted from Fund results versus the Index in the industrials sector. Stock selection in communications equipment and an underweight to computers and peripherals stocks, which rose sharply during the period, hurt Fund performance versus the Index in the IT sector.
As of October 31, 2012, the Fund had approximately 5% of its total investments in preferred securities (i.e., preferred stocks and corporate bonds and notes). The preferred securities allocation outperformed the Index as well as the overall preferred market, as measured by the BofA Merrill Lynch Fixed Rate Preferred Securities Index, an index measuring overall preferred markets. This outperformance relative to the preferred market resulted from several factors. The Fund’s bank holdings contributed to performance after bouncing back from lows reached in the summer of 2011. Capital management actions resulted in some of the Fund’s preferred holdings being tendered or called above market price, as issuers retired older, higher-interest preferred stocks in favor of new offerings that paid lower rates. The Fund also participated in a number of new issues that outperformed the overall preferred market. In addition, stock selection among high-yield names helped, as high-yield issues rallied during the period in response to investors’ search for yield.
See Endnotes and Additional Disclosures in this report.
Past performance is no guarantee of future results. Returns are historical and are calculated by determining the percentage change in net asset value (NAV) or offering price (as applicable) with all distributions reinvested. Investment return and principal value will fluctuate so that shares, when redeemed, may be worth more or less than their original cost. Performance less than one year is cumulative. Performance is for the stated time period only; due to market volatility, the Fund’s current performance may be lower or higher than quoted. Returns are before taxes unless otherwise noted. For performance as of the most recent month end, please refer to www.eatonvance.com.
Eaton Vance
Global Dividend Income Fund
October 31, 2012
Performance2,3
Portfolio Managers Judith A. Saryan, CFA, Aamer Khan, CFA and John H. Croft, CFA
| | | | | | | | | | | | | | | | |
| % Average Annual Total Returns | | Inception Date | | | One Year | | | Five Years | | | Since Inception | |
Class A at NAV | | | 11/30/2005 | | | | 8.35 | % | | | –4.58 | % | | | 1.58 | % |
Class A with 5.75% Maximum Sales Charge | | | — | | | | 2.14 | | | | –5.70 | | | | 0.71 | |
Class C at NAV | | | 11/30/2005 | | | | 7.79 | | | | –5.28 | | | | 0.81 | |
Class C with 1% Maximum Sales Charge | | | — | | | | 6.79 | | | | –5.28 | | | | 0.81 | |
Class I at NAV | | | 01/31/2006 | | | | 8.76 | | | | –4.33 | | | | 0.99 | |
Class R at NAV | | | 01/31/2006 | | | | 8.14 | | | | –4.85 | | | | 0.49 | |
MSCI World Index | | | 11/30/2005 | | | | 9.45 | % | | | –2.86 | % | | | 2.94 | % |
| | | | |
| % Total Annual Operating Expense Ratios4 | | Class A | | | Class C | | | Class I | | | Class R | |
| | | 1.27 | % | | | 2.02 | % | | | 1.02 | % | | | 1.52 | % |
Performance of $10,000
This graph shows the change in value of a hypothetical investment of $10,000 in Class A of the Fund for the period indicated. For comparison, the same investment is shown in the indicated index.
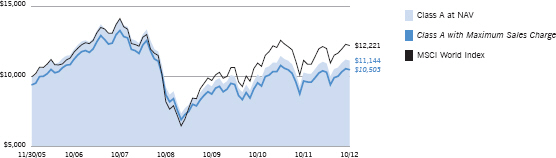
| | | | | | | | |
| Performance of Investment | | Amount Invested | | Period Beginning | | At NAV | | With Maximum
Sales Charge |
Class C | | $10,000 | | 11/30/2005 | | $10,573 | | N.A. |
Class I | | $250,000 | | 01/31/2006 | | $267,200 | | N.A. |
Class R | | $10,000 | | 01/31/2006 | | $10,334 | | N.A. |
See Endnotes and Additional Disclosures in this report.
Past performance is no guarantee of future results. Returns are historical and are calculated by determining the percentage change in net asset value (NAV) or offering price (as applicable) with all distributions reinvested. Investment return and principal value will fluctuate so that shares, when redeemed, may be worth more or less than their original cost. Performance less than one year is cumulative. Performance is for the stated time period only; due to market volatility, the Fund’s current performance may be lower or higher than quoted. Returns are before taxes unless otherwise noted. For performance as of the most recent month end, please refer to www.eatonvance.com.
Eaton Vance
Global Dividend Income Fund
October 31, 2012
Fund Profile
Common Stock Sector Allocation (% of total investments)
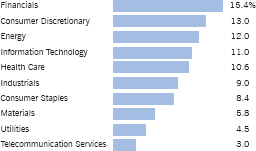
Top 10 Common Stock Holdings (% of total investments)
| | | | | | |
ENI SpA | | | 2.6 | % | | |
U.S. Bancorp | | | 2.5 | | | |
Accenture PLC, Class A | | | 2.5 | | | |
PNC Financial Services Group, Inc. | | | 2.4 | | | |
Covidien PLC | | | 2.4 | | | |
International Business Machines Corp. | | | 2.3 | | | |
Apple, Inc. | | | 2.2 | | | |
Sanofi | | | 2.1 | | | |
Royal Dutch Shell PLC, Class A | | | 2.1 | | | |
Oracle Corp. | | | 2.0 | | | |
Total | | | 23.1 | % | | |
Country Allocation (% of total investments)
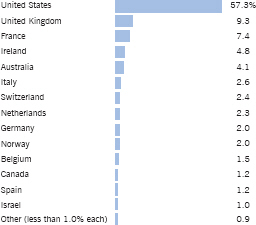
See Endnotes and Additional Disclosures in this report.
Eaton Vance
Global Dividend Income Fund
October 31, 2012
Endnotes and Additional Disclosures
| 1 | The views expressed in this report are those of the portfolio manager(s) and are current only through the date stated at the top of this page. These views are subject to change at any time based upon market or other conditions, and Eaton Vance and the Fund(s) disclaim any responsibility to update such views. These views may not be relied upon as investment advice and, because investment decisions are based on many factors, may not be relied upon as an indication of trading intent on behalf of any Eaton Vance fund. This commentary may contain statements that are not historical facts, referred to as “forward looking statements”. The Fund’s actual future results may differ significantly from those stated in any forward looking statement, depending on factors such as changes in securities or financial markets or general economic conditions, the volume of sales and purchases of Fund shares, the continuation of investment advisory, administrative and service contracts, and other risks discussed from time to time in the Fund’s filings with the Securities and Exchange Commission. |
| 2 | MSCI World Index is an unmanaged index of equity securities in the developed markets. MSCI indices are net of foreign withholding taxes. Source: MSCI. MSCI data may not be reproduced or used for any other purpose. MSCI provides no warranties, has not prepared or approved this report, and has no liability hereunder. BofA Merrill Lynch Fixed Rate Preferred Securities Index is an unmanaged index of fixed-rate, preferred securities issued in the U.S. BofA Merrill Lynch® indices not for redistribution or other uses; provided “as is”, without warranties, and with no liability. Eaton Vance has prepared this report, BofAML does not endorse it, or guarantee, review, or endorse Eaton Vance’s products. Unless otherwise stated, index returns do not reflect the effect of any applicable sales charges, commissions, expenses, taxes or leverage, as applicable. It is not possible to invest directly in an index. |
| 3 | Total Returns at NAV do not include applicable sales charges. If sales charges were deducted, the returns would be lower. Total Returns shown with maximum sales charge reflect the stated maximum sales charge. Unless otherwise stated, performance does not reflect the deduction of taxes on Fund distributions or redemptions of Fund shares. |
| 4 | Source: Fund prospectus. |
| | Fund profile subject to change due to active management. |
Eaton Vance
Global Dividend Income Fund
October 31, 2012
Fund Expenses
Example: As a Fund shareholder, you incur two types of costs: (1) transaction costs, including sales charges (loads) on purchases and redemption fees (if applicable); and (2) ongoing costs, including management fees; distribution and/or service fees; and other Fund expenses. This Example is intended to help you understand your ongoing costs (in dollars) of Fund investing and to compare these costs with the ongoing costs of investing in other mutual funds. The Example is based on an investment of $1,000 invested at the beginning of the period and held for the entire period (May 1, 2012 – October 31, 2012).
Actual Expenses: The first section of the table below provides information about actual account values and actual expenses. You may use the information in this section, together with the amount you invested, to estimate the expenses that you paid over the period. Simply divide your account value by $1,000 (for example, an $8,600 account value divided by $1,000 = 8.6), then multiply the result by the number in the first section under the heading entitled “Expenses Paid During Period” to estimate the expenses you paid on your account during this period.
Hypothetical Example for Comparison Purposes: The second section of the table below provides information about hypothetical account values and hypothetical expenses based on the actual Fund expense ratio and an assumed rate of return of 5% per year (before expenses), which is not the actual Fund return. The hypothetical account values and expenses may not be used to estimate the actual ending account balance or expenses you paid for the period. You may use this information to compare the ongoing costs of investing in your Fund and other funds. To do so, compare this 5% hypothetical example with the 5% hypothetical examples that appear in the shareholder reports of the other funds.
Please note that the expenses shown in the table are meant to highlight your ongoing costs only and do not reflect any transactional costs, such as sales charges (loads) or redemption fees (if applicable). Therefore, the second section of the table is useful in comparing ongoing costs only, and will not help you determine the relative total costs of owning different funds. In addition, if these transactional costs were included, your costs would be higher.
| | | | | | | | | | | | | | | | |
| | | Beginning
Account Value
(5/1/12) | | | Ending
Account Value
(10/31/12) | | | Expenses Paid
During Period*
(5/1/12 – 10/31/12) | | | Annualized
Expense
Ratio | |
| | | | |
| | | | | | | | | | | | | | | | |
Actual | | | | | | | | | | | | | |
Class A | | $ | 1,000.00 | | | $ | 1,017.80 | | | $ | 6.39 | | | | 1.26 | % |
Class C | | $ | 1,000.00 | | | $ | 1,015.80 | | | $ | 10.18 | | | | 2.01 | % |
Class I | | $ | 1,000.00 | | | $ | 1,020.60 | | | $ | 5.13 | | | | 1.01 | % |
Class R | | $ | 1,000.00 | | | $ | 1,016.80 | | | $ | 7.66 | | | | 1.51 | % |
| | | | | | | | | | | | | | | | | |
| | | | |
| | | | | | | | | | | | | | | | |
Hypothetical | | | | | | | | | | | | | |
(5% return per year before expenses) | | | | | | | | | | | | | |
Class A | | $ | 1,000.00 | | | $ | 1,018.80 | | | $ | 6.39 | | | | 1.26 | % |
Class C | | $ | 1,000.00 | | | $ | 1,015.00 | | | $ | 10.18 | | | | 2.01 | % |
Class I | | $ | 1,000.00 | | | $ | 1,020.10 | | | $ | 5.13 | | | | 1.01 | % |
Class R | | $ | 1,000.00 | | | $ | 1,017.50 | | | $ | 7.66 | | | | 1.51 | % |
| * | Expenses are equal to the Fund’s annualized expense ratio for the indicated Class, multiplied by the average account value over the period, multiplied by 184/366 (to reflect the one-half year period). The Example assumes that the $1,000 was invested at the net asset value per share determined at the close of business on April 30, 2012. The Example reflects the expenses of both the Fund and the Portfolio for the period while the Fund was investing in the Portfolio. |
Eaton Vance
Global Dividend Income Fund
October 31, 2012
Portfolio of Investments
| | | | | | | | |
| Common Stocks — 92.8% | |
| | |
| | | | | | | | |
| Security | | Shares | | | Value | |
| | | | | | | | |
|
Aerospace & Defense — 1.5% | |
United Technologies Corp. | | | 77,000 | | | $ | 6,018,320 | |
| | | | | | | | | |
| | | | | | $ | 6,018,320 | |
| | | | | | | | | |
|
Beverages — 2.7% | |
Anheuser-Busch InBev NV | | | 70,000 | | | $ | 5,854,175 | |
Heineken NV | | | 75,000 | | | | 4,628,456 | |
| | | | | | | | | |
| | | | | | $ | 10,482,631 | |
| | | | | | | | | |
|
Capital Markets — 0.5% | |
Credit Suisse Group AG(1) | | | 90,000 | | | $ | 2,092,981 | |
| | | | | | | | | |
| | | | | | $ | 2,092,981 | |
| | | | | | | | | |
|
Chemicals — 3.5% | |
Linde AG | | | 21,000 | | | $ | 3,533,933 | |
LyondellBasell Industries NV, Class A | | | 84,000 | | | | 4,484,760 | |
PPG Industries, Inc. | | | 50,000 | | | | 5,854,000 | |
| | | | | | | | | |
| | | | | | $ | 13,872,693 | |
| | | | | | | | | |
|
Commercial Banks — 7.2% | |
BNP Paribas | | | 85,000 | | | $ | 4,287,822 | |
PNC Financial Services Group, Inc. | | | 161,000 | | | | 9,368,590 | |
U.S. Bancorp | | | 302,907 | | | | 10,059,541 | |
Wells Fargo & Co. | | | 145,000 | | | | 4,885,050 | |
| | | | | | | | | |
| | | | | | $ | 28,601,003 | |
| | | | | | | | | |
|
Commercial Services & Supplies — 1.7% | |
Brambles, Ltd. | | | 900,000 | | | $ | 6,776,750 | |
| | | | | | | | | |
| | | | | | $ | 6,776,750 | |
| | | | | | | | | |
|
Communications Equipment — 0.5% | |
QUALCOMM, Inc. | | | 35,000 | | | $ | 2,050,125 | |
| | | | | | | | | |
| | | | | | $ | 2,050,125 | |
| | | | | | | | | |
|
Computers & Peripherals — 2.2% | |
Apple, Inc. | | | 14,600 | | | $ | 8,688,460 | |
| | | | | | | | | |
| | | | | | $ | 8,688,460 | |
| | | | | | | | | |
|
Consumer Finance — 1.2% | |
Discover Financial Services | | | 120,000 | | | $ | 4,920,000 | |
| | | | | | | | | |
| | | | | | $ | 4,920,000 | |
| | | | | | | | | |
| | | | | | | | |
| Security | | Shares | | | Value | |
| | | | | | | | |
|
Containers & Packaging — 0.7% | |
Amcor, Ltd. | | | 350,000 | | | $ | 2,867,306 | |
| | | | | | | | | |
| | | | | | $ | 2,867,306 | |
| | | | | | | | | |
|
Diversified Financial Services — 1.1% | |
JPMorgan Chase & Co. | | | 100,000 | | | $ | 4,168,000 | |
| | | | | | | | | |
| | | | | | $ | 4,168,000 | |
| | | | | | | | | |
|
Diversified Telecommunication Services — 2.5% | |
BCE, Inc. | | | 45,000 | | | $ | 1,964,700 | |
Deutsche Telekom AG | | | 155,000 | | | | 1,768,317 | |
Telstra Corp., Ltd. | | | 1,420,000 | | | | 6,102,444 | |
| | | | | | | | | |
| | | | | | $ | 9,835,461 | |
| | | | | | | | | |
|
Electric Utilities — 1.4% | |
Edison International | | | 75,000 | | | $ | 3,520,500 | |
Iberdrola SA | | | 400,000 | | | | 2,071,583 | |
| | | | | | | | | |
| | | | | | $ | 5,592,083 | |
| | | | | | | | | |
|
Energy Equipment & Services — 2.0% | |
Schlumberger, Ltd. | | | 60,559 | | | $ | 4,210,667 | |
Seadrill, Ltd. | | | 90,000 | | | | 3,646,823 | |
| | | | | | | | | |
| | | | | | $ | 7,857,490 | |
| | | | | | | | | |
|
Food Products — 3.9% | |
Kraft Foods Group, Inc.(1) | | | 33,333 | | | $ | 1,515,985 | |
Mondelez International, Inc., Class A | | | 240,000 | | | | 6,369,600 | |
Nestle SA | | | 119,000 | | | | 7,555,092 | |
| | | | | | | | | |
| | | | | | $ | 15,440,677 | |
| | | | | | | | | |
|
Health Care Equipment & Supplies — 2.4% | |
Covidien PLC | | | 170,000 | | | $ | 9,341,500 | |
| | | | | | | | | |
| | | | | | $ | 9,341,500 | |
| | | | | | | | | |
|
Health Care Providers & Services — 1.5% | |
HCA Holdings, Inc. | | | 210,447 | | | $ | 5,978,799 | |
| | | | | | | | | |
| | | | | | $ | 5,978,799 | |
| | | | | | | | | |
|
Hotels, Restaurants & Leisure — 2.4% | |
McDonald’s Corp. | | | 76,400 | | | $ | 6,631,520 | |
Wynn Resorts, Ltd. | | | 24,706 | | | | 2,990,908 | |
| | | | | | | | | |
| | | | | | $ | 9,622,428 | |
| | | | | | | | | |
| | | | |
| | 7 | | See Notes to Financial Statements. |
Eaton Vance
Global Dividend Income Fund
October 31, 2012
Portfolio of Investments — continued
| | | | | | | | |
| Security | | Shares | | | Value | |
| | | | | | | | |
|
Industrial Conglomerates — 2.0% | |
General Electric Co. | | | 170,000 | | | $ | 3,580,200 | |
Orkla ASA | | | 530,000 | | | | 4,198,460 | |
| | | | | | | | | |
| | | | | | $ | 7,778,660 | |
| | | | | | | | | |
|
Insurance — 5.3% | |
Aflac, Inc. | | | 60,000 | | | $ | 2,986,800 | |
AXA SA | | | 400,000 | | | | 6,375,480 | |
MetLife, Inc. | | | 50,413 | | | | 1,789,157 | |
Old Mutual PLC | | | 1,301,250 | | | | 3,621,972 | |
Prudential Financial, Inc. | | | 65,000 | | | | 3,708,250 | |
Resolution, Ltd. | | | 750,000 | | | | 2,644,224 | |
| | | | | | | | | |
| | | | | | $ | 21,125,883 | |
| | | | | | | | | |
|
IT Services — 4.8% | |
Accenture PLC, Class A | | | 144,000 | | | $ | 9,707,040 | |
International Business Machines Corp. | | | 46,781 | | | | 9,100,308 | |
| | | | | | | | | |
| | | | | | $ | 18,807,348 | |
| | | | | | | | | |
|
Machinery — 1.9% | |
Deere & Co. | | | 55,000 | | | $ | 4,699,200 | |
PACCAR, Inc. | | | 60,000 | | | | 2,600,400 | |
| | | | | | | | | |
| | | | | | $ | 7,299,600 | |
| | | | | | | | | |
|
Media — 0.6% | |
Time Warner Cable, Inc. | | | 25,000 | | | $ | 2,477,750 | |
| | | | | | | | | |
| | | | | | $ | 2,477,750 | |
| | | | | | | | | |
|
Metals & Mining — 1.6% | |
Freeport-McMoRan Copper & Gold, Inc. | | | 165,000 | | | $ | 6,415,200 | |
| | | | | | | | | |
| | | | | | $ | 6,415,200 | |
| | | | | | | | | |
|
Multi-Utilities — 3.1% | |
GDF Suez | | | 270,000 | | | $ | 6,197,132 | |
National Grid PLC | | | 375,000 | | | | 4,276,705 | |
Sempra Energy | | | 23,000 | | | | 1,604,250 | |
| | | | | | | | | |
| | | | | | $ | 12,078,087 | |
| | | | | | | | | |
|
Oil, Gas & Consumable Fuels — 10.0% | |
Chevron Corp. | | | 18,675 | | | $ | 2,058,172 | |
ENI SpA | | | 455,000 | | | | 10,469,963 | |
Exxon Mobil Corp. | | | 76,529 | | | | 6,977,149 | |
Occidental Petroleum Corp. | | | 43,160 | | | | 3,407,913 | |
Phillips 66 | | | 97,000 | | | | 4,574,520 | |
| | | | | | | | |
| Security | | Shares | | | Value | |
| | | | | | | | |
|
Oil, Gas & Consumable Fuels (continued) | |
Royal Dutch Shell PLC, Class A | | | 241,000 | | | $ | 8,269,363 | |
Total SA | | | 75,000 | | | | 3,777,765 | |
| | | | | | | | | |
| | | | | | $ | 39,534,845 | |
| | | | | | | | | |
|
Pharmaceuticals — 6.8% | |
Abbott Laboratories | | | 78,000 | | | $ | 5,110,560 | |
AstraZeneca PLC | | | 140,000 | | | | 6,492,465 | |
Johnson & Johnson | | | 36,785 | | | | 2,605,114 | |
Sanofi | | | 96,000 | | | | 8,431,431 | |
Teva Pharmaceutical Industries, Ltd. ADR | | | 100,000 | | | | 4,042,000 | |
| | | | | | | | | |
| | | | | | $ | 26,681,570 | |
| | | | | | | | | |
|
Road & Rail — 1.9% | |
Canadian National Railway Co. | | | 54,000 | | | $ | 4,664,520 | |
Union Pacific Corp. | | | 24,000 | | | | 2,952,720 | |
| | | | | | | | | |
| | | | | | $ | 7,617,240 | |
| | | | | | | | | |
|
Software — 3.6% | |
Microsoft Corp. | | | 220,000 | | | $ | 6,277,700 | |
Oracle Corp. | | | 250,000 | | | | 7,762,500 | |
| | | | | | | | | |
| | | | | | $ | 14,040,200 | |
| | | | | | | | | |
|
Specialty Retail — 9.3% | |
American Eagle Outfitters, Inc. | | | 250,000 | | | $ | 5,217,500 | |
DSW, Inc., Class A | | | 20,529 | | | | 1,284,910 | |
Home Depot, Inc. (The) | | | 87,000 | | | | 5,340,060 | |
Industria de Diseno Textil SA | | | 22,000 | | | | 2,809,226 | |
Kingfisher PLC | | | 1,375,000 | | | | 6,437,758 | |
Limited Brands, Inc. | | | 135,000 | | | | 6,465,150 | |
Lowe’s Companies, Inc. | | | 60,000 | | | | 1,942,800 | |
TJX Companies, Inc. (The) | | | 174,434 | | | | 7,261,688 | |
| | | | | | | | | |
| | | | | | $ | 36,759,092 | |
| | | | | | | | | |
|
Textiles, Apparel & Luxury Goods — 0.6% | |
Adidas AG | | | 30,000 | | | $ | 2,557,106 | |
| | | | | | | | | |
| | | | | | $ | 2,557,106 | |
| | | | | | | | | |
|
Tobacco — 1.9% | |
British American Tobacco PLC | | | 50,000 | | | $ | 2,479,978 | |
Japan Tobacco, Inc. | | | 70,000 | | | | 1,935,657 | |
Philip Morris International, Inc. | | | 35,000 | | | | 3,099,600 | |
| | | | | | | | | |
| | | | | | $ | 7,515,235 | |
| | | | | | | | | |
| | | | |
| | 8 | | See Notes to Financial Statements. |
Eaton Vance
Global Dividend Income Fund
October 31, 2012
Portfolio of Investments — continued
| | | | | | | | |
| Security | | Shares | | | Value | |
| | | | | | | | |
|
Wireless Telecommunication Services — 0.5% | |
Vodafone Group PLC ADR | | | 70,000 | | | $ | 1,905,400 | |
| | | | | | | | | |
| | | | | | $ | 1,905,400 | |
| | | | | | | | | |
| | |
Total Common Stocks
(identified cost $318,518,913) | | | | | | $ | 366,799,923 | |
| | | | | | | | | |
|
| Preferred Stocks — 4.3% | |
| | |
| | | | | | | | |
| Security | | Shares | | | Value | |
|
Capital Markets — 0.4% | |
Affiliated Managers Group, Inc., 6.375% | | | 3,105 | | | $ | 80,924 | |
Bank of New York Mellon Corp. (The), 5.20% | | | 12,500 | | | | 314,500 | |
Charles Schwab Corp. (The), 7.00%(2) | | | 600 | | | | 699,858 | |
Goldman Sachs Group, Inc. (The), Series I, 5.95% | | | 7,500 | | | | 187,875 | |
State Street Corp., Series C, 5.25% | | | 18,670 | | | | 482,246 | |
| | | | | | | | | |
| | | | | | $ | 1,765,403 | |
| | | | | | | | | |
|
Commercial Banks — 2.1% | |
Barclays Bank PLC, Series 3, 7.10% | | | 20,500 | | | $ | 517,215 | |
CoBank ACB, Series F, 6.25%(2)(3) | | | 3,100 | | | | 328,019 | |
Countrywide Capital V, 7.00% | | | 10,000 | | | | 250,700 | |
Deutsche Bank Contingent Capital Trust III, 7.60% | | | 20,000 | | | | 535,400 | |
Farm Credit Bank of Texas, Series 1, 10.00% | | | 225 | | | | 258,328 | |
First Niagara Financial Group, Inc., Series B, 8.625%(2) | | | 15,000 | | | | 437,850 | |
First Republic Bank, Series A, 6.70% | | | 14,900 | | | | 404,982 | |
First Republic Bank, Series B, 6.20% | | | 6,000 | | | | 155,250 | |
JPMorgan Chase & Co., Series 1, 7.90%(2) | | | 700 | | | | 809,303 | |
KeyCorp, Series A, 7.75% | | | 4,700 | | | | 580,450 | |
Lloyds Banking Group PLC, 6.657%(2)(3) | | | 795 | | | | 699,272 | |
Morgan Stanley Capital Trust III, 6.25% | | | 23,500 | | | | 586,560 | |
PNC Financial Services Group, Inc., Series O, 6.75%(2) | | | 83 | | | | 97,522 | |
PNC Financial Services Group, Inc., Series P, 6.125%(2) | | | 17,345 | | | | 485,660 | |
Regions Financial Corp., Series A, 6.375% | | | 18,500 | | | | 459,725 | |
Texas Capital Bancshares, Inc., 6.50% | | | 9,005 | | | | 233,004 | |
U.S. Bancorp, Series F, 6.50%(2) | | | 17,000 | | | | 505,750 | |
Wells Fargo & Co., Series L, 7.50% | | | 605 | | | | 756,250 | |
Wells Fargo & Co., Series N, 5.20% | | | 3,382 | | | | 86,545 | |
| | | | | | | | | |
| | | | | | $ | 8,187,785 | |
| | | | | | | | | |
|
Consumer Finance — 0.3% | |
Ally Financial, Inc., Series A, 8.50%(2) | | | 14,555 | | | $ | 372,062 | |
Capital One Financial Corp., Series B, 6.00% | | | 11,300 | | | | 283,743 | |
Discover Financial Services, Series B, 6.50% | | | 14,400 | | | | 365,851 | |
| | | | | | | | | |
| | | | | | $ | 1,021,656 | |
| | | | | | | | | |
| | | | | | | | |
| Security | | Shares | | | Value | |
| | | | | | | | |
|
Diversified Financial Services — 0.3% | |
General Electric Capital Corp., Series A,
7.125% to 6/15/22(4) | | | 2.40 | | | $ | 275,681 | |
General Electric Capital Corp., Series B,
6.25% to 12/15/22(4) | | | 3.05 | | | | 333,902 | |
RBS Capital Funding Trust VII, Series G, 6.08% | | | 15 | | | | 280,500 | |
UBS AG, 7.625% | | | 250 | | | | 273,764 | |
| | | | | | | | | |
| | | | | | $ | 1,163,847 | |
| | | | | | | | | |
|
Electric Utilities — 0.2% | |
NextEra Energy Capital Holdings, Inc., Series G, 5.70% | | | 7,500 | | | $ | 201,562 | |
Southern California Edison Co., Series E, 6.25%(2) | | | 500 | | | | 559,847 | |
| | | | | | | | | |
| | | | | | $ | 761,409 | |
| | | | | | | | | |
|
Food Products — 0.1% | |
Dairy Farmers of America, 7.875%(3) | | | 4,700 | | | $ | 480,428 | |
| | | | | | | | | |
| | | | | | $ | 480,428 | |
| | | | | | | | | |
|
Insurance — 0.2% | |
Arch Capital Group, Ltd., Series C, 6.75% | | | 17,000 | | | $ | 460,595 | |
Endurance Specialty Holdings, Ltd., Series A, 7.75% | | | 5,000 | | | | 137,350 | |
Prudential PLC, 6.50% | | | 170 | | | | 171,166 | |
| | | | | | | | | |
| | | | | | $ | 769,111 | |
| | | | | | | | | |
|
Machinery — 0.1% | |
Stanley Black & Decker, Inc., 5.75% | | | 16,888 | | | $ | 446,477 | |
| | | | | | | | | |
| | | | | | $ | 446,477 | |
| | | | | | | | | |
|
Multi-Utilities — 0.1% | |
DTE Energy Co., Series C, 5.25% | | | 9,400 | | | $ | 239,512 | |
| | | | | | | | | |
| | | | | | $ | 239,512 | |
| | | | | | | | | |
|
Real Estate Investment Trusts (REITs) — 0.5% | |
CapLease, Inc., Series A, 8.125% | | | 13,000 | | | $ | 327,600 | |
Cedar Shopping Centers, Inc., Series A, 8.875% | | | 2,697 | | | | 69,529 | |
Chesapeake Lodging Trust, Series A, 7.75% | | | 15,000 | | | | 400,350 | |
DDR Corp., Series J, 6.50% | | | 16,000 | | | | 399,520 | |
Sunstone Hotel Investors, Inc., Series D, 8.00% | | | 14,000 | | | | 366,625 | |
Vornado Realty Trust, Series K, 5.70% | | | 21,500 | | | | 547,390 | |
| | | | | | | | | |
| | | | | | $ | 2,111,014 | |
| | | | | | | | | |
| | |
Total Preferred Stocks
(identified cost $15,958,404) | | | | | | $ | 16,946,642 | |
| | | | | | | | | |
| | | | |
| | 9 | | See Notes to Financial Statements. |
Eaton Vance
Global Dividend Income Fund
October 31, 2012
Portfolio of Investments — continued
| | | | | | | | |
| Corporate Bonds & Notes — 1.1% | |
| | |
| | | | | | | | |
| Security | | Principal
Amount
(000’s omitted) | | | Value | |
| | | | | | | | |
|
Commercial Banks — 0.2% | |
American Express Co., 6.80% to 9/1/16, 9/1/66(4) | | $ | 350 | | | $ | 381,500 | |
Fifth Third Capital Trust IV,
6.50% to 4/15/17, 4/15/37, 4/15/67(4)(5) | | | 400 | | | | 402,500 | |
Regions Bank, 6.45%, 6/26/37 | | | 20 | | | | 20,700 | |
| | | | | | | | | |
| | | | | | $ | 804,700 | |
| | | | | | | | | |
|
Electric Utilities — 0.1% | |
PPL Capital Funding, Inc., Series A,
6.70% to 3/30/17, 3/30/67(4) | | $ | 400 | | | $ | 421,901 | |
| | | | | | | | | |
| | | | | | $ | 421,901 | |
| | | | | | | | | |
|
Industrial Conglomerates — 0.1% | |
Hutchison Whampoa International 12, Ltd.,
6.00% to 5/7/17, 5/29/49(3)(4) | | $ | 500 | | | $ | 522,500 | |
| | | | | | | | | |
| | | | | | $ | 522,500 | |
| | | | | | | | | |
|
Insurance — 0.4% | |
MetLife, Inc., 10.75% to 8/1/34, 8/1/39, 8/1/69(4)(5) | | $ | 350 | | | $ | 529,375 | |
QBE Capital Funding III, Ltd.,
7.25% to 5/24/21, 5/24/41(3)(4) | | | 550 | | | | 575,665 | |
XL Capital, Ltd., Series E, 6.50% to 4/15/17, 12/29/49(4) | | | 645 | | | | 601,463 | |
| | | | | | | | | |
| | | | | | $ | 1,706,503 | |
| | | | | | | | | |
|
Pipelines — 0.3% | |
Enterprise Products Operating, LLC,
7.00% to 6/1/17, 6/1/67(4) | | $ | 510 | | | $ | 556,368 | |
Southern Union Co., 3.462%, 11/1/66(2) | | | 520 | | | | 430,950 | |
| | | | | | | | | |
| | | | | | $ | 987,318 | |
| | | | | | | | | |
| | |
Total Corporate Bonds & Notes
(identified cost $4,031,254) | | | | | | $ | 4,442,922 | |
| | | | | | | | | |
| | | | | | | | |
| Short-Term Investments — 1.9% | |
| | |
| | | | | | | | |
| Description | | Interest
(000’s omitted) | | | Value | |
| | | | | | | | |
Eaton Vance Cash Reserves Fund, LLC, 0.12%(6) | | $ | 7,457 | | | $ | 7,456,966 | |
| | | | | | | | | |
| | |
Total Short-Term Investments
(identified cost $7,456,966) | | | | | | $ | 7,456,966 | |
| | | | | | | | | |
| | |
Total Investments — 100.1%
(identified cost $345,965,537) | | | | | | $ | 395,646,453 | |
| | | | | | | | | |
| | |
Other Assets, Less Liabilities — (0.1)% | | | | | | $ | (488,295 | ) |
| | | | | | | | | |
| | |
Net Assets — 100.0% | | | | | | $ | 395,158,158 | |
| | | | | | | | | |
The percentage shown for each investment category in the Portfolio of Investments is based on net assets.
| | | | |
| ADR | | – | | American Depositary Receipt |
| (1) | Non-income producing security. |
| (2) | Variable rate security. The stated interest rate represents the rate in effect at October 31, 2012. |
| (3) | Security exempt from registration pursuant to Rule 144A under the Securities Act of 1933. These securities may be sold in certain transactions (normally to qualified institutional buyers) and remain exempt from registration. At October 31, 2012, the aggregate value of these securities is $2,605,884 or 0.7% of the Fund’s net assets. |
| (4) | Security converts to floating rate after the indicated fixed-rate coupon period. |
| (5) | The maturity dates shown are the scheduled maturity date and final maturity date, respectively. The scheduled maturity date is earlier than the final maturity date due to the possibility of earlier repayment. |
| (6) | Affiliated investment company available to Eaton Vance portfolios and funds which invests in high quality, U.S. dollar denominated money market instruments. The rate shown is the annualized seven-day yield as of October 31, 2012. |
| | | | |
| | 10 | | See Notes to Financial Statements. |
Eaton Vance
Global Dividend Income Fund
October 31, 2012
Portfolio of Investments — continued
| | | | | | | | |
| Country Concentration of Portfolio | |
| | |
| | | | | | | | |
| Country | | Percentage of
Total Investments | | | Value | |
United States | | | 57.3 | % | | $ | 226,663,428 | |
United Kingdom | | | 9.3 | | | | 36,645,080 | |
France | | | 7.4 | | | | 29,069,630 | |
Ireland | | | 4.8 | | | | 19,048,540 | |
Australia | | | 4.1 | | | | 16,322,165 | |
Italy | | | 2.6 | | | | 10,469,963 | |
Switzerland | | | 2.4 | | | | 9,648,073 | |
Netherlands | | | 2.3 | | | | 9,113,216 | |
Germany | | | 2.0 | | | | 7,859,356 | |
Norway | | | 2.0 | | | | 7,845,283 | |
Belgium | | | 1.5 | | | | 5,854,175 | |
Canada | | | 1.2 | | | | 4,664,520 | |
Spain | | | 1.2 | | | | 4,880,809 | |
Israel | | | 1.0 | | | | 4,042,000 | |
Japan | | | 0.5 | | | | 1,935,657 | |
Cayman Islands | | | 0.3 | | | | 1,123,963 | |
Bermuda | | | 0.1 | | | | 460,595 | |
| | |
Total Investments | | | 100.0 | % | | $ | 395,646,453 | |
| | |
| | | | |
| | 11 | | See Notes to Financial Statements. |
Eaton Vance
Global Dividend Income Fund
October 31, 2012
Statement of Assets and Liabilities
| | | | |
| Assets | | October 31, 2012 | |
Unaffiliated investments, at value (identified cost, $338,508,571) | | $ | 388,189,487 | |
Affiliated investment, at value (identified cost, $7,456,966) | | | 7,456,966 | |
Restricted cash* | | | 20,389 | |
Foreign currency, at value (identified cost, $552,780) | | | 558,788 | |
Dividends and interest receivable | | | 1,470,526 | |
Interest receivable from affiliated investment | | | 312 | |
Receivable for Fund shares sold | | | 359,586 | |
Receivable for open forward foreign currency exchange contracts | | | 972 | |
Tax reclaims receivable | | | 2,191,156 | |
Total assets | | $ | 400,248,182 | |
| Liabilities | | | | |
Payable for investments purchased | | $ | 3,435,674 | |
Payable for open forward foreign currency exchange contracts | | | 1,263 | |
Payable for Fund shares redeemed | | | 1,043,818 | |
Payable to affiliates: | | | | |
Investment adviser fee | | | 220,933 | |
Administration fee | | | 50,985 | |
Distribution and service fees | | | 166,626 | |
Trustees’ fees | | | 1,390 | |
Accrued expenses | | | 169,335 | |
Total liabilities | | $ | 5,090,024 | |
Net Assets | | $ | 395,158,158 | |
| Sources of Net Assets | | | | |
Paid-in capital | | $ | 550,584,253 | |
Accumulated net realized loss | | | (206,287,532 | ) |
Accumulated undistributed net investment income | | | 1,086,693 | |
Net unrealized appreciation | | | 49,774,744 | |
Total | | $ | 395,158,158 | |
| Class A Shares | | | | |
Net Assets | | $ | 212,233,380 | |
Shares Outstanding | | | 30,006,355 | |
Net Asset Value and Redemption Price Per Share | | | | |
(net assets ÷ shares of beneficial interest outstanding) | | $ | 7.07 | |
Maximum Offering Price Per Share | | | | |
(100 ÷ 94.25 of net asset value per share) | | $ | 7.50 | |
| Class C Shares | | | | |
Net Assets | | $ | 140,506,366 | |
Shares Outstanding | | | 20,024,835 | |
Net Asset Value and Offering Price Per Share** | | | | |
(net assets ÷ shares of beneficial interest outstanding) | | $ | 7.02 | |
| Class I Shares | | | | |
Net Assets | | $ | 41,819,995 | |
Shares Outstanding | | | 5,917,832 | |
Net Asset Value, Offering Price and Redemption Price Per Share | | | | |
(net assets ÷ shares of beneficial interest outstanding) | | $ | 7.07 | |
| Class R Shares | | | | |
Net Assets | | $ | 598,417 | |
Shares Outstanding | | | 84,755 | |
Net Asset Value, Offering Price and Redemption Price Per Share | | | | |
(net assets ÷ shares of beneficial interest outstanding) | | $ | 7.06 | |
On sales of $50,000 or more, the offering price of Class A shares is reduced.
| * | Represents restricted cash on deposit at the custodian for open forward foreign currency exchange contracts. |
| ** | Redemption price per share is equal to the net asset value less any applicable contingent deferred sales charge. |
| | | | |
| | 12 | | See Notes to Financial Statements. |
Eaton Vance
Global Dividend Income Fund
October 31, 2012
Statement of Operations
| | | | |
| Investment Income | | Year Ended
October 31, 2012 | |
Dividends (net of foreign taxes, $355,123) | | $ | 4,909,971 | |
Dividends allocated from Portfolio (net of foreign taxes, $1,939,485) | | | 24,657,475 | |
Interest | | | 60,890 | |
Interest allocated from Portfolio | | | 167,718 | |
Interest allocated from affiliated investment | | | 931 | |
Expenses allocated from Portfolio | | | (2,292,620 | ) |
Expenses allocated from affiliated investment | | | (84 | ) |
Total investment income | | $ | 27,504,281 | |
| |
| Expenses | | | | |
Investment adviser fee | | $ | 507,334 | |
Administration fee | | | 604,076 | |
Distribution and service fees | | | | |
Class A | | | 536,098 | |
Class C | | | 1,432,905 | |
Class R | | | 3,068 | |
Trustees’ fees and expenses | | | 1,848 | |
Custodian fee | | | 101,833 | |
Transfer and dividend disbursing agent fees | | | 355,181 | |
Legal and accounting services | | | 51,572 | |
Printing and postage | | | 77,684 | |
Registration fees | | | 67,240 | |
Miscellaneous | | | 23,177 | |
Total expenses | | $ | 3,762,016 | |
Deduct — | | | | |
Reduction of custodian fee | | $ | 2 | |
Total expense reductions | | $ | 2 | |
| |
Net expenses | | $ | 3,762,014 | |
| |
Net investment income | | $ | 23,742,267 | |
| |
| Realized and Unrealized Gain (Loss) | | | | |
Net realized gain (loss) — | | | | |
Investment transactions | | $ | 9,555,378 | |
Investment transactions allocated from Portfolio | | | (6,478,633 | ) |
Investment transactions allocated from affiliated investment | | | 5 | |
Foreign currency and forward foreign currency exchange contract transactions | | | (1,043,753 | ) |
Foreign currency and forward foreign currency exchange contract transactions allocated from Portfolio | | | (341,306 | ) |
Net realized gain | | $ | 1,691,691 | |
Change in unrealized appreciation (depreciation) — | | | | |
Investments | | $ | (8,989,461 | ) |
Investments allocated from Portfolio | | | 14,355,377 | |
Foreign currency and forward foreign currency exchange contract transactions | | | 328,023 | |
Foreign currency and forward foreign currency exchange contract transactions allocated from Portfolio | | | (375,013 | ) |
Net change in unrealized appreciation (depreciation) | | $ | 5,318,926 | |
| |
Net realized and unrealized gain | | $ | 7,010,617 | |
| |
Net increase in net assets from operations | | $ | 30,752,884 | |
| | | | |
| | 13 | | See Notes to Financial Statements. |
Eaton Vance
Global Dividend Income Fund
October 31, 2012
Statements of Changes in Net Assets
| | | | | | | | |
| | | Year Ended October 31, | |
| Increase (Decrease) in Net Assets | | 2012 | | | 2011 | |
From operations — | | | | | | | | |
Net investment income | | $ | 23,742,267 | | | $ | 25,222,733 | |
Net realized gain (loss) from investment, foreign currency and forward foreign currency exchange contract transactions | | | 1,691,691 | | | | (147,185 | ) |
Net change in unrealized appreciation (depreciation) from investments, foreign currency and forward foreign currency exchange contracts | | | 5,318,926 | | | | (21,157,304 | ) |
Net increase in net assets from operations | | $ | 30,752,884 | | | $ | 3,918,244 | |
Distributions to shareholders — | | | | | | | | |
From net investment income | | | | | | | | |
Class A | | $ | (12,270,292 | ) | | $ | (14,579,555 | ) |
Class C | | | (7,225,284 | ) | | | (8,765,184 | ) |
Class I | | | (2,658,855 | ) | | | (3,065,538 | ) |
Class R | | | (33,862 | ) | | | (32,095 | ) |
Total distributions to shareholders | | $ | (22,188,293 | ) | | $ | (26,442,372 | ) |
Transactions in shares of beneficial interest — | | | | | | | | |
Proceeds from sale of shares | | | | | | | | |
Class A | | $ | 51,630,320 | | | $ | 76,521,304 | |
Class C | | | 27,061,137 | | | | 43,288,325 | |
Class I | | | 18,918,845 | | | | 44,917,138 | |
Class R | | | 96,843 | | | | 324,142 | |
Net asset value of shares issued to shareholders in payment of distributions declared | | | | | | | | |
Class A | | | 11,208,378 | | | | 12,041,277 | |
Class C | | | 5,727,182 | | | | 5,688,100 | |
Class I | | | 2,034,987 | | | | 2,288,131 | |
Class R | | | 31,850 | | | | 28,753 | |
Cost of shares redeemed | | | | | | | | |
Class A | | | (71,022,304 | ) | | | (93,384,415 | ) |
Class C | | | (42,365,864 | ) | | | (43,063,350 | ) |
Class I | | | (26,853,700 | ) | | | (30,004,574 | ) |
Class R | | | (137,228 | ) | | | (203,971 | ) |
Net increase (decrease) in net assets from Fund share transactions | | $ | (23,669,554 | ) | | $ | 18,440,860 | |
| | |
Net decrease in net assets | | $ | (15,104,963 | ) | | $ | (4,083,268 | ) |
| | |
| Net Assets | | | | | | | | |
At beginning of year | | $ | 410,263,121 | | | $ | 414,346,389 | |
At end of year | | $ | 395,158,158 | | | $ | 410,263,121 | |
| | |
Accumulated undistributed net investment income
included in net assets | | | | | | | | |
At end of year | | $ | 1,086,693 | | | $ | — | |
| | | | |
| | 14 | | See Notes to Financial Statements. |
Eaton Vance
Global Dividend Income Fund
October 31, 2012
Financial Highlights
| | | | | | | | | | | | | | | | | | | | |
| | | Class A | |
| | | Year Ended October 31, | |
| | | 2012 | | | 2011 | | | 2010 | | | 2009 | | | 2008 | |
Net asset value — Beginning of year | | $ | 6.900 | | | $ | 7.270 | | | $ | 7.120 | | | $ | 7.720 | | | $ | 12.640 | |
| | | | | |
| Income (Loss) From Operations | | | | | | | | | | | | | | | | | | | | |
Net investment income(1) | | $ | 0.425 | (2) | | $ | 0.448 | (3) | | $ | 0.487 | (4) | | $ | 0.508 | | | $ | 0.923 | |
Net realized and unrealized gain (loss) | | | 0.141 | | | | (0.350 | ) | | | 0.141 | | | | (0.523 | ) | | | (5.087 | ) |
| | | | | |
Total income (loss) from operations | | $ | 0.566 | | | $ | 0.098 | | | $ | 0.628 | | | $ | (0.015 | ) | | $ | (4.164 | ) |
| | | | | |
| Less Distributions | | | | | | | | | | | | | | | | | | | | |
From net investment income | | $ | (0.396 | ) | | $ | (0.468 | ) | | $ | (0.478 | ) | | $ | (0.585 | ) | | $ | (0.756 | ) |
| | | | | |
Total distributions | | $ | (0.396 | ) | | $ | (0.468 | ) | | $ | (0.478 | ) | | $ | (0.585 | ) | | $ | (0.756 | ) |
| | | | | |
Net asset value — End of year | | $ | 7.070 | | | $ | 6.900 | | | $ | 7.270 | | | $ | 7.120 | | | $ | 7.720 | |
| | | | | |
Total Return(5) | | | 8.35 | % | | | 1.36 | % | | | 9.13 | % | | | 0.50 | % | | | (34.35 | )% |
| | | | | |
| Ratios/Supplemental Data | | | | | | | | | | | | | | | | | | | | |
Net assets, end of year (000’s omitted) | | $ | 212,233 | | | $ | 215,735 | | | $ | 231,335 | | | $ | 237,034 | | | $ | 161,744 | |
Ratios (as a percentage of average daily net assets): | | | | | | | | | | | | | | | | | | | | |
Expenses(6)(7) | | | 1.26 | % | | | 1.27 | % | | | 1.31 | % | | | 1.33 | % | | | 1.31 | % |
Net investment income | | | 6.14 | %(2) | | | 6.11 | %(3) | | | 6.79 | %(4) | | | 7.49 | % | | | 8.72 | % |
Portfolio Turnover of the Portfolio(8) | | | 97 | %(9) | | | 124 | % | | | 156 | % | | | 177 | % | | | 256 | % |
Portfolio Turnover of the Fund | | | 35 | %(9)(10) | | | — | | | | — | | | | — | | | | — | |
| (1) | Computed using average shares outstanding. |
| (2) | Net investment income per share reflects special dividends (including allocated from the Portfolio) which amounted to $0.059 per share. Excluding special dividends, the ratio of net investment income to average daily net assets would have been 5.29%. |
| (3) | Net investment income per share reflects special dividends allocated from the Portfolio which amounted to $0.091 per share. Excluding special dividends, the ratio of net investment income to average daily net assets would have been 4.87%. |
| (4) | Net investment income per share reflects special dividends allocated from the Portfolio which amounted to $0.064 per share. Excluding special dividends, the ratio of net investment income to average daily net assets would have been 5.89%. |
| (5) | Returns are historical and are calculated by determining the percentage change in net asset value with all distributions reinvested and do not reflect the effect of sales charges. |
| (6) | Includes the Fund’s share of the Portfolio’s allocated expenses for the period while the Fund was investing in the Portfolio. |
| (7) | Excludes the effect of custody fee credits, if any, of less than 0.005%. |
| (8) | Portfolio turnover represents the rate of portfolio activity for the period while the Fund was investing in the Portfolio. |
| (10) | For the period from August 22, 2012 through October 31, 2012 when the Fund was making investments directly in securities. |
| | | | |
| | 15 | | See Notes to Financial Statements. |
Eaton Vance
Global Dividend Income Fund
October 31, 2012
Financial Highlights — continued
| | | | | | | | | | | | | | | | | | | | |
| | | Class C | |
| | | Year Ended October 31, | |
| | | 2012 | | | 2011 | | | 2010 | | | 2009 | | | 2008 | |
Net asset value — Beginning of year | | $ | 6.850 | | | $ | 7.220 | | | $ | 7.080 | | | $ | 7.680 | | | $ | 12.580 | |
| | | | | |
| Income (Loss) From Operations | | | | | | | | | | | | | | | | | | | | |
Net investment income(1) | | $ | 0.369 | (2) | | $ | 0.391 | (3) | | $ | 0.432 | (4) | | $ | 0.446 | | | $ | 0.837 | |
Net realized and unrealized gain (loss) | | | 0.147 | | | | (0.347 | ) | | | 0.135 | | | | (0.509 | ) | | | (5.061 | ) |
| | | | | |
Total income (loss) from operations | | $ | 0.516 | | | $ | 0.044 | | | $ | 0.567 | | | $ | (0.063 | ) | | $ | (4.224 | ) |
| | | | | |
| Less Distributions | | | | | | | | | | | | | | | | | | | | |
From net investment income | | $ | (0.346 | ) | | $ | (0.414 | ) | | $ | (0.427 | ) | | $ | (0.537 | ) | | $ | (0.676 | ) |
| | | | | |
Total distributions | | $ | (0.346 | ) | | $ | (0.414 | ) | | $ | (0.427 | ) | | $ | (0.537 | ) | | $ | (0.676 | ) |
| | | | | |
Net asset value — End of year | | $ | 7.020 | | | $ | 6.850 | | | $ | 7.220 | | | $ | 7.080 | | | $ | 7.680 | |
| | | | | |
Total Return(5) | | | 7.79 | % | | | 0.47 | % | | | 8.26 | % | | | (0.21 | )% | | | (34.86 | )% |
| | | | | |
| Ratios/Supplemental Data | | | | | | | | | | | | | | | | | | | | |
Net assets, end of year (000’s omitted) | | $ | 140,506 | | | $ | 147,083 | | | $ | 149,034 | | | $ | 137,459 | | | $ | 108,613 | |
Ratios (as a percentage of average daily net assets): | | | | | | | | | | | | | | | | | | | | |
Expenses(6)(7) | | | 2.01 | % | | | 2.02 | % | | | 2.06 | % | | | 2.08 | % | | | 2.06 | % |
Net investment income | | | 5.38 | %(2) | | | 5.36 | %(3) | | | 6.07 | %(4) | | | 6.61 | % | | | 7.94 | % |
Portfolio Turnover of the Portfolio(8) | | | 97 | %(9) | | | 124 | % | | | 156 | % | | | 177 | % | | | 256 | % |
Portfolio Turnover of the Fund | | | 35 | %(9)(10) | | | — | | | | — | | | | — | | | | — | |
| (1) | Computed using average shares outstanding. |
| (2) | Net investment income per share reflects special dividends (including allocated from the Portfolio) which amounted to $0.059 per share. Excluding special dividends, the ratio of net investment income to average daily net assets would have been 4.53%. |
| (3) | Net investment income per share reflects special dividends allocated from the Portfolio which amounted to $0.090 per share. Excluding special dividends, the ratio of net investment income to average daily net assets would have been 4.13%. |
| (4) | Net investment income per share reflects special dividends allocated from the Portfolio which amounted to $0.062 per share. Excluding special dividends, the ratio of net investment income to average daily net assets would have been 5.19%. |
| (5) | Returns are historical and are calculated by determining the percentage change in net asset value with all distributions reinvested and do not reflect the effect of sales charges. |
| (6) | Includes the Fund’s share of the Portfolio’s allocated expenses for the period while the Fund was investing in the Portfolio. |
| (7) | Excludes the effect of custody fee credits, if any, of less than 0.005%. |
| (8) | Portfolio turnover represents the rate of portfolio activity for the period while the Fund was investing in the Portfolio. |
| (10) | For the period from August 22, 2012 through October 31, 2012 when the Fund was making investments directly in securities. |
| | | | |
| | 16 | | See Notes to Financial Statements. |
Eaton Vance
Global Dividend Income Fund
October 31, 2012
Financial Highlights — continued
| | | | | | | | | | | | | | | | | | | | |
| | | Class I | |
| | | Year Ended October 31, | |
| | | 2012 | | | 2011 | | | 2010 | | | 2009 | | | 2008 | |
Net asset value — Beginning of year | | $ | 6.900 | | | $ | 7.260 | | | $ | 7.120 | | | $ | 7.710 | | | $ | 12.640 | |
| | | | | |
| Income (Loss) From Operations | | | | | | | | | | | | | | | | | | | | |
Net investment income(1) | | $ | 0.442 | (2) | | $ | 0.467 | (3) | | $ | 0.509 | (4) | | $ | 0.527 | | | $ | 0.977 | |
Net realized and unrealized gain (loss) | | | 0.140 | | | | (0.337 | ) | | | 0.128 | | | | (0.513 | ) | | | (5.125 | ) |
| | | | | |
Total income (loss) from operations | | $ | 0.582 | | | $ | 0.130 | | | $ | 0.637 | | | $ | 0.014 | | | $ | (4.148 | ) |
| | | | | |
| Less Distributions | | | | | | | | | | | | | | | | | | | | |
From net investment income | | $ | (0.412 | ) | | $ | (0.490 | ) | | $ | (0.497 | ) | | $ | (0.604 | ) | | $ | (0.782 | ) |
| | | | | |
Total distributions | | $ | (0.412 | ) | | $ | (0.490 | ) | | $ | (0.497 | ) | | $ | (0.604 | ) | | $ | (0.782 | ) |
| | | | | |
Net asset value — End of year | | $ | 7.070 | | | $ | 6.900 | | | $ | 7.260 | | | $ | 7.120 | | | $ | 7.710 | |
| | | | | |
Total Return(5) | | | 8.76 | % | | | 1.66 | % | | | 9.27 | % | | | 0.91 | % | | | (34.28 | )% |
| | | | | |
| Ratios/Supplemental Data | | | | | | | | | | | | | | | | | | | | |
Net assets, end of year (000’s omitted) | | $ | 41,820 | | | $ | 46,856 | | | $ | 33,513 | | | $ | 16,221 | | | $ | 2,155 | |
Ratios (as a percentage of average daily net assets): | | | | | | | | | | | | | | | | | | | | |
Expenses(6)(7) | | | 1.01 | % | | | 1.02 | % | | | 1.06 | % | | | 1.08 | % | | | 1.06 | % |
Net investment income | | | 6.39 | %(2) | | | 6.38 | %(3) | | | 7.15 | %(4) | | | 7.59 | % | | | 9.20 | % |
Portfolio Turnover of the Portfolio(8) | | | 97 | %(9) | | | 124 | % | | | 156 | % | | | 177 | % | | | 256 | % |
Portfolio Turnover of the Fund | | | 35 | %(9)(10) | | | — | | | | — | | | | — | | | | — | |
| (1) | Computed using average shares outstanding. |
| (2) | Net investment income per share reflects special dividends (including allocated from the Portfolio) which amounted to $0.060 per share. Excluding special dividends, the ratio of net investment income to average daily net assets would have been 5.53%. |
| (3) | Net investment income per share reflects special dividends allocated from the Portfolio which amounted to $0.080 per share. Excluding special dividends, the ratio of net investment income to average daily net assets would have been 5.28%. |
| (4) | Net investment income per share reflects special dividends allocated from the Portfolio which amounted to $0.056 per share. Excluding special dividends, the ratio of net investment income to average daily net assets would have been 6.37%. |
| (5) | Returns are historical and are calculated by determining the percentage change in net asset value with all distributions reinvested. |
| (6) | Includes the Fund’s share of the Portfolio’s allocated expenses for the period while the Fund was investing in the Portfolio. |
| (7) | Excludes the effect of custody fee credits, if any, of less than 0.005%. |
| (8) | Portfolio turnover represents the rate of portfolio activity for the period while the Fund was investing in the Portfolio. |
| (10) | For the period from August 22, 2012 through October 31, 2012 when the Fund was making investments directly in securities. |
| | | | |
| | 17 | | See Notes to Financial Statements. |
Eaton Vance
Global Dividend Income Fund
October 31, 2012
Financial Highlights — continued
| | | | | | | | | | | | | | | | | | | | |
| | | Class R | |
| | | Year Ended October 31, | |
| | | 2012 | | | 2011 | | | 2010 | | | 2009 | | | 2008 | |
Net asset value — Beginning of year | | $ | 6.900 | | | $ | 7.260 | | | $ | 7.120 | | | $ | 7.720 | | | $ | 12.660 | |
| | | | | |
| Income (Loss) From Operations | | | | | | | | | | | | | | | | | | | | |
Net investment income(1) | | $ | 0.407 | (2) | | $ | 0.427 | (3) | | $ | 0.494 | (4) | | $ | 0.528 | | | $ | 0.847 | |
Net realized and unrealized gain (loss) | | | 0.135 | | | | (0.335 | ) | | | 0.109 | | | | (0.557 | ) | | | (5.057 | ) |
| | | | | |
Total income (loss) from operations | | $ | 0.542 | | | $ | 0.092 | | | $ | 0.603 | | | $ | (0.029 | ) | | $ | (4.210 | ) |
| | | | | |
| Less Distributions | | | | | | | | | | | | | | | | | | | | |
From net investment income | | $ | (0.382 | ) | | $ | (0.452 | ) | | $ | (0.463 | ) | | $ | (0.571 | ) | | $ | (0.730 | ) |
| | | | | |
Total distributions | | $ | (0.382 | ) | | $ | (0.452 | ) | | $ | (0.463 | ) | | $ | (0.571 | ) | | $ | (0.730 | ) |
| | | | | |
Net asset value — End of year | | $ | 7.060 | | | $ | 6.900 | | | $ | 7.260 | | | $ | 7.120 | | | $ | 7.720 | |
| | | | | |
Total Return(5) | | | 8.14 | % | | | 1.13 | % | | | 8.76 | % | | | 0.29 | % | | | (34.63 | )% |
| | | | | |
| Ratios/Supplemental Data | | | | | | | | | | | | | | | | | | | | |
Net assets, end of year (000’s omitted) | | $ | 598 | | | $ | 589 | | | $ | 464 | | | $ | 282 | | | $ | 71 | |
Ratios (as a percentage of average daily net assets): | | | | | | | | | | | | | | | | | | | | |
Expenses(6)(7) | | | 1.51 | % | | | 1.52 | % | | | 1.56 | % | | | 1.58 | % | | | 1.56 | % |
Net investment income | | | 5.89 | %(2) | | | 5.85 | %(3) | | | 6.95 | %(4) | | | 7.88 | % | | | 8.05 | % |
Portfolio Turnover of the Portfolio(8) | | | 97 | %(9) | | | 124 | % | | | 156 | % | | | 177 | % | | | 256 | % |
Portfolio Turnover of the Fund | | | 35 | %(9)(10) | | | — | | | | — | | | | — | | | | — | |
| (1) | Computed using average shares outstanding. |
| (2) | Net investment income per share reflects special dividends (including allocated from the Portfolio) which amounted to $0.058 per share. Excluding special dividends, the ratio of net investment income to average daily net assets would have been 5.05%. |
| (3) | Net investment income per share reflects special dividends allocated from the Portfolio which amounted to $0.088 per share. Excluding special dividends, the ratio of net investment income to average daily net assets would have been 4.64%. |
| (4) | Net investment income per share reflects special dividends allocated from the Portfolio which amounted to $0.055 per share. Excluding special dividends, the ratio of net investment income to average daily net assets would have been 6.18%. |
| (5) | Returns are historical and are calculated by determining the percentage change in net asset value with all distributions reinvested. |
| (6) | Includes the Fund’s share of the Portfolio’s allocated expenses for the period while the Fund was investing in the Portfolio. |
| (7) | Excludes the effect of custody fee credits, if any, of less than 0.005%. |
| (8) | Portfolio turnover represents the rate of portfolio activity for the period while the Fund was investing in the Portfolio. |
| (10) | For the period from August 22, 2012 through October 31, 2012 when the Fund was making investments directly in securities. |
| | | | |
| | 18 | | See Notes to Financial Statements. |
Eaton Vance
Global Dividend Income Fund
October 31, 2012
Notes to Financial Statements
1 Significant Accounting Policies
Eaton Vance Global Dividend Income Fund (the Fund) is a diversified series of Eaton Vance Mutual Funds Trust (the Trust). The Trust is a Massachusetts business trust registered under the Investment Company Act of 1940, as amended (the 1940 Act), as an open-end management investment company. The Fund’s investment objective is to achieve total return by investing primarily in a diversified portfolio of equity securities that pay dividends. Prior to August 22, 2012, the Fund invested all of its investable assets in interests in Global Dividend Income Portfolio (the Portfolio), a Massachusetts business trust, having the same investment objective and policies as the Fund. As of the close of business on August 21, 2012, the Fund received its pro-rata share of cash and securities from the Portfolio as part of a complete liquidation of the Portfolio. As of August 22, 2012, the Fund invests directly in securities. The Fund offers four classes of shares. Class A shares are generally sold subject to a sales charge imposed at time of purchase. Class C shares are sold at net asset value and are generally subject to a contingent deferred sales charge (see Note 5). Class I and Class R shares are sold at net asset value and are not subject to a sales charge. Each class represents a pro-rata interest in the Fund, but votes separately on class-specific matters and (as noted below) is subject to different expenses. Realized and unrealized gains and losses and net investment income and losses, other than class-specific expenses, are allocated daily to each class of shares based on the relative net assets of each class to the total net assets of the Fund. Each class of shares differs in its distribution plan and certain other class-specific expenses.
The following is a summary of significant accounting policies of the Fund. The policies are in conformity with accounting principles generally accepted in the United States of America.
A Investment Valuation — Equity securities (including common shares of closed-end investment companies) listed on a U.S. securities exchange generally are valued at the last sale or closing price on the day of valuation or, if no sales took place on such date, at the mean between the closing bid and asked prices therefore on the exchange where such securities are principally traded. Equity securities listed on the NASDAQ Global or Global Select Market generally are valued at the NASDAQ official closing price. Unlisted or listed securities for which closing sales prices or closing quotations are not available are valued at the mean between the latest available bid and asked prices or, in the case of preferred equity securities that are not listed or traded in the over-the-counter market, by a third party pricing service that will use various techniques that consider factors including, but not limited to, prices or yields of securities with similar characteristics, benchmark yields, broker/dealer quotes, quotes of underlying common stock, issuer spreads, as well as industry and economic events. The value of preferred equity securities that are valued by a pricing service on a bond basis will be adjusted by an income factor, to be determined by the investment adviser, to reflect the next anticipated regular dividend. Debt obligations (including short-term obligations with a remaining maturity of more than sixty days) are generally valued on the basis of valuations provided by third party pricing services, as derived from such services’ pricing models. Inputs to the models may include, but are not limited to, reported trades, executable bid and asked prices, broker/dealer quotations, prices or yields of securities with similar characteristics, benchmark curves or information pertaining to the issuer, as well as industry and economic events. The pricing services may use a matrix approach, which considers information regarding securities with similar characteristics to determine the valuation for a security. Short-term obligations purchased with a remaining maturity of sixty days or less are generally valued at amortized cost, which approximates market value. Foreign securities and currencies are valued in U.S. dollars, based on foreign currency exchange rate quotations supplied by a third party pricing service. The pricing service uses a proprietary model to determine the exchange rate. Inputs to the model include reported trades and implied bid/ask spreads. Forward foreign currency exchange contracts are generally valued at the mean of the average bid and average asked prices that are reported by currency dealers to a third party pricing service at the valuation time. Such third party pricing service valuations are supplied for specific settlement periods and the Fund’s forward foreign currency exchange contracts are valued at an interpolated rate between the closest preceding and subsequent settlement period reported by the third party pricing service. The daily valuation of exchange-traded foreign securities generally is determined as of the close of trading on the principal exchange on which such securities trade. Events occurring after the close of trading on foreign exchanges may result in adjustments to the valuation of foreign securities to more accurately reflect their fair value as of the close of regular trading on the New York Stock Exchange. When valuing foreign equity securities that meet certain criteria, the Fund’s Trustees have approved the use of a fair value service that values such securities to reflect market trading that occurs after the close of the applicable foreign markets of comparable securities or other instruments that have a strong correlation to the fair-valued securities.
Investments for which valuations or market quotations are not readily available or are deemed unreliable are valued at fair value using methods determined in good faith by or at the direction of the Trustees of the Fund in a manner that fairly reflects the security’s value, or the amount that the Fund might reasonably expect to receive for the security upon its current sale in the ordinary course. Each such determination is based on a consideration of relevant factors, which are likely to vary from one pricing context to another. These factors may include, but are not limited to, the type of security, the existence of any contractual restrictions on the security’s disposition, the price and extent of public trading in similar securities of the issuer or of comparable companies or entities, quotations or relevant information obtained from broker/dealers or other market participants, information obtained from the issuer, analysts, and/or the appropriate stock exchange (for exchange-traded securities), an analysis of the company’s or entity’s financial condition, and an evaluation of the forces that influence the issuer and the market(s) in which the security is purchased and sold.
The Fund may invest in Eaton Vance Cash Reserves Fund, LLC (Cash Reserves Fund), an affiliated investment company managed by Eaton Vance Management (EVM). Cash Reserves Fund generally values its investment securities utilizing the amortized cost valuation technique in accordance with Rule 2a-7 under the 1940 Act. This technique involves initially valuing a portfolio security at its cost and thereafter assuming a constant amortization to maturity of any discount or premium. If amortized cost is determined not to approximate fair value, Cash Reserves Fund may value its investment securities in the same manner as debt obligations described above.
Eaton Vance
Global Dividend Income Fund
October 31, 2012
Notes to Financial Statements — continued
B Investment Transactions — Investment transactions for financial statement purposes are accounted for on a trade date basis. Realized gains and losses on investments sold are determined on the basis of identified cost.
C Income — Dividend income is recorded on the ex-dividend date for dividends received in cash and/or securities. However, if the ex-dividend date has passed, certain dividends from foreign securities are recorded as the Fund is informed of the ex-dividend date. Withholding taxes on foreign dividends and capital gains have been provided for in accordance with the Fund’s understanding of the applicable countries’ tax rules and rates. Interest income is recorded on the basis of interest accrued, adjusted for amortization of premium or accretion of discount. Prior to August 22, 2012, the net investment income or loss consisted of the Fund’s pro-rata share of the net investment income or loss of the Portfolio less all actual and accrued expenses of the Fund.
D Federal Taxes — The Fund’s policy is to comply with the provisions of the Internal Revenue Code applicable to regulated investment companies and to distribute to shareholders each year substantially all of its net investment income, and all or substantially all of its net realized capital gains. Accordingly, no provision for federal income or excise tax is necessary.
At October 31, 2012, the Fund, for federal income tax purposes, had a capital loss carryforward of $204,930,274 which will reduce its taxable income arising from future net realized gains on investment transactions, if any, to the extent permitted by the Internal Revenue Code, and thus will reduce the amount of distributions to shareholders, which would otherwise be necessary to relieve the Fund of any liability for federal income or excise tax. Such capital loss carryforward will expire on October 31, 2014 ($481,556), October 31, 2015 ($8,547,018), October 31, 2016 ($89,543,701), October 31, 2017 ($74,538,069), October 31, 2018 ($27,975,696) and October 31, 2019 ($3,844,234). In addition, such capital loss carryforward cannot be utilized prior to the utilization of new capital losses, if any, created after October 31, 2012.
During the year ended October 31, 2012, a capital loss carryforward of $829,700 was utilized to offset net realized gains by the Fund.
As of October 31, 2012, the Fund had no uncertain tax positions that would require financial statement recognition, de-recognition, or disclosure. The Fund files a U.S. federal income tax return annually after its fiscal year-end, which is subject to examination by the Internal Revenue Service for a period of three years from the date of filing.
E Expenses — The majority of expenses of the Trust are directly identifiable to an individual fund. Expenses which are not readily identifiable to a specific fund are allocated taking into consideration, among other things, the nature and type of expense and the relative size of the funds.
F Expense Reduction — State Street Bank and Trust Company (SSBT) serves as custodian of the Fund. Pursuant to the custodian agreement, SSBT receives a fee reduced by credits, which are determined based on the average daily cash balance the Fund maintains with SSBT. All credit balances, if any, used to reduce the Fund’s custodian fees are reported as a reduction of expenses in the Statement of Operations.
G Foreign Currency Translation — Investment valuations, other assets, and liabilities initially expressed in foreign currencies are translated each business day into U.S. dollars based upon current exchange rates. Purchases and sales of foreign investment securities and income and expenses denominated in foreign currencies are translated into U.S. dollars based upon currency exchange rates in effect on the respective dates of such transactions. Recognized gains or losses on investment transactions attributable to changes in foreign currency exchange rates are recorded for financial statement purposes as net realized gains and losses on investments. That portion of unrealized gains and losses on investments that results from fluctuations in foreign currency exchange rates is not separately disclosed.
H Use of Estimates — The preparation of the financial statements in conformity with accounting principles generally accepted in the United States of America requires management to make estimates and assumptions that affect the reported amounts of assets and liabilities at the date of the financial statements and the reported amounts of income and expense during the reporting period. Actual results could differ from those estimates.
I Indemnifications — Under the Trust’s organizational documents, its officers and Trustees may be indemnified against certain liabilities and expenses arising out of the performance of their duties to the Fund. Under Massachusetts law, if certain conditions prevail, shareholders of a Massachusetts business trust (such as the Trust) could be deemed to have personal liability for the obligations of the Trust. However, the Trust’s Declaration of Trust contains an express disclaimer of liability on the part of Fund shareholders and the By-laws provide that the Trust shall assume the defense on behalf of any Fund shareholders. Moreover, the By-laws also provide for indemnification out of Fund property of any shareholder held personally liable solely by reason of being or having been a shareholder for all loss or expense arising from such liability. Additionally, in the normal course of business, the Fund enters into agreements with service providers that may contain indemnification clauses. The Fund’s maximum exposure under these arrangements is unknown as this would involve future claims that may be made against the Fund that have not yet occurred.
J Forward Foreign Currency Exchange Contracts — The Fund may enter into forward foreign currency exchange contracts for the purchase or sale of a specific foreign currency at a fixed price on a future date. The forward foreign currency exchange contracts are adjusted by the daily exchange rate of the underlying currency and any gains or losses are recorded as unrealized until such time as the contracts have been closed or offset by another contract with the same broker for the same settlement date and currency. Risks may arise upon entering these contracts from the potential inability of counterparties to meet the terms of their contracts and from movements in the value of a foreign currency relative to the U.S. dollar.
Eaton Vance
Global Dividend Income Fund
October 31, 2012
Notes to Financial Statements — continued
2 Distributions to Shareholders
It is the present policy of the Fund to make monthly distributions of all or substantially all of its net investment income and to distribute annually all or substantially all of its net realized capital gains (reduced by available capital loss carryforwards from prior years, if any). Distributions to shareholders are recorded on the ex-dividend date. Distributions are declared separately for each class of shares. Shareholders may reinvest income and capital gain distributions in additional shares of the same class of the Fund at the net asset value as of the ex-dividend date or, at the election of the shareholder, receive distributions in cash. The Fund distinguishes between distributions on a tax basis and a financial reporting basis. Accounting principles generally accepted in the United States of America require that only distributions in excess of tax basis earnings and profits be reported in the financial statements as a return of capital. Permanent differences between book and tax accounting relating to distributions are reclassified to paid-in capital. For tax purposes, distributions from short-term capital gains are considered to be from ordinary income.
The tax character of distributions declared for the years ended October 31, 2012 and October 31, 2011 was as follows:
| | | | | | | | |
| | | Year Ended October 31, | |
| | | 2012 | | | 2011 | |
| | |
Distributions declared from: | | | | | | | | |
Ordinary income | | $ | 22,188,293 | | | $ | 26,442,372 | |
During the year ended October 31, 2012, accumulated net realized loss was decreased by $232,216, accumulated undistributed net investment income was decreased by $467,281 and paid-in capital was increased by $235,065 due to differences between book and tax accounting, primarily for foreign currency gain (loss), accretion of market discount, return of capital distributions from securities and distributions from real estate investment trusts (REITs). These reclassifications had no effect on the net assets or net asset value per share of the Fund.
As of October 31, 2012, the components of distributable earnings (accumulated losses) and unrealized appreciation (depreciation) on a tax basis were as follows:
| | | | |
Undistributed ordinary income | | $ | 1,060,286 | |
Capital loss carryforward | | $ | (204,930,274 | ) |
Net unrealized appreciation | | $ | 48,443,893 | |
The differences between components of distributable earnings (accumulated losses) on a tax basis and the amounts reflected in the Statement of Assets and Liabilities are primarily due to wash sales, accretion of market discount, distributions from REITs and foreign currency transactions.
3 Investment Adviser and Administration Fee and Other Transactions with Affiliates
The investment adviser fee is earned by Boston Management and Research (BMR), a subsidiary of EVM, as compensation for investment advisory services rendered to the Fund. The fee is computed at an annual rate of 0.65% of the Fund’s average daily net assets up to $500 million, and is payable monthly. On net assets of $500 million and over, the annual fee is reduced. Prior to August 22, 2012, when the Fund’s assets were invested in the Portfolio, the Fund was allocated its share of the Portfolio’s adviser fee. The Portfolio paid advisory fees to BMR on the same fee schedule as that of the Fund as described above. For the year ended October 31, 2012, the Fund’s allocated portion of the adviser fee paid by the Portfolio totaled $2,113,104 and the adviser fee paid by the Fund amounted to $507,334. For the year ended October 31, 2012, the Fund’s investment adviser fee, including the adviser fee allocated from the Portfolio, was 0.65% of the Fund’s average daily net assets. The Fund invests its cash in Cash Reserves Fund. EVM does not currently receive a fee for advisory services provided to Cash Reserves Fund.
The administration fee is earned by EVM as compensation for administrative services rendered to the Fund. The fee is computed at an annual rate of 0.15% of the Fund’s average daily net assets. For the year ended October 31, 2012, the administration fee amounted to $604,076.
EVM serves as the sub-transfer agent of the Fund and receives from the transfer agent an aggregate fee based upon the actual expenses incurred by EVM in the performance of these services. For the year ended October 31, 2012, EVM earned $14,760 in sub-transfer agent fees. The Fund was informed that Eaton Vance Distributors, Inc. (EVD), an affiliate of EVM and the Fund’s principal underwriter, received $195,569 as its portion of the sales charge on sales of Class A shares for the year ended October 31, 2012. EVD also received distribution and service fees from Class A, Class C and Class R shares (see Note 4) and contingent deferred sales charges (see Note 5).
Trustees and officers of the Fund who are members of EVM’s or BMR’s organizations receive remuneration for their services to the Fund out of the investment adviser fee. Trustees of the Fund who are not affiliated with the investment adviser and administrator may elect to defer receipt of all or a
Eaton Vance
Global Dividend Income Fund
October 31, 2012
Notes to Financial Statements — continued
percentage of their annual fees in accordance with the terms of the Trustees Deferred Compensation Plan. For the year ended October 31, 2012, no significant amounts have been deferred. Certain officers and Trustees of the Fund are officers of the above organizations.
4 Distribution Plans
The Fund has in effect a distribution plan for Class A shares (Class A Plan) pursuant to Rule 12b-1 under the 1940 Act. Pursuant to the Class A Plan, the Fund pays EVD a distribution and service fee of 0.25% per annum of its average daily net assets attributable to Class A shares for distribution services and facilities provided to the Fund by EVD, as well as for personal services and/or the maintenance of shareholder accounts. Distribution and service fees paid or accrued to EVD for the year ended October 31, 2012 amounted to $536,098 for Class A shares.
The Fund also has in effect distribution plans for Class C shares (Class C Plan) and Class R shares (Class R Plan) pursuant to Rule 12b-1 under the 1940 Act. Pursuant to the Class C Plan, the Fund pays EVD amounts equal to 0.75% per annum of its average daily net assets attributable to Class C shares for providing ongoing distribution services and facilities to the Fund. The Fund will automatically discontinue payments to EVD during any period in which there are no outstanding Uncovered Distribution Charges, which are equivalent to the sum of (i) 6.25% of the aggregate amount received by the Fund for Class C shares sold, plus (ii) interest calculated by applying the rate of 1% over the prevailing prime rate to the outstanding balance of Uncovered Distribution Charges of EVD of Class C, reduced by the aggregate amount of contingent deferred sales charges (see Note 5) and amounts theretofore paid or payable to EVD. For the year ended October 31, 2012, the Fund paid or accrued to EVD $1,074,679 for Class C shares, representing 0.75% of the average daily net assets of Class C shares. At October 31, 2012, the amount of Uncovered Distribution Charges of EVD calculated under the Class C Plan was approximately $15,316,000.
The Class R Plan requires the Fund to pay EVD an amount up to 0.50% per annum of its average daily net assets attributable to Class R shares for providing ongoing distribution services and facilities to the Fund. The Trustees of the Trust have currently limited Class R distribution payments to 0.25% per annum of the average daily net assets attributable to Class R shares. For the year ended October 31, 2012, the Fund paid or accrued to EVD $1,534 for Class R shares.
Pursuant to the Class C and Class R Plans, the Fund also makes payments of service fees to EVD, financial intermediaries and other persons in amounts equal to 0.25% per annum of its average daily net assets attributable to that class. Service fees paid or accrued are for personal services and/or the maintenance of shareholder accounts. They are separate and distinct from the sales commissions and distribution fees payable to EVD and, as such, are not subject to automatic discontinuance when there are no outstanding Uncovered Distribution Charges of EVD. Service fees paid or accrued for the year ended October 31, 2012 amounted to $358,226 and $1,534 for Class C and Class R shares, respectively.
5 Contingent Deferred Sales Charges
A contingent deferred sales charge (CDSC) of 1% generally is imposed on redemptions of Class C shares made within one year of purchase. Class A shares may be subject to a 1% CDSC if redeemed within 18 months of purchase (depending on the circumstances of purchase). Generally, the CDSC is based upon the lower of the net asset value at date of redemption or date of purchase. No charge is levied on shares acquired by reinvestment of dividends or capital gain distributions. No CDSC is levied on shares which have been sold to EVM or its affiliates or to their respective employees or clients and may be waived under certain other limited conditions. CDSCs received on Class C redemptions are paid to EVD to reduce the amount of Uncovered Distribution Charges calculated under the Fund’s Class C Plan. CDSCs received on Class C redemptions when no Uncovered Distribution Charges exist are credited to the Fund. For the year ended October 31, 2012, the Fund was informed that EVD received approximately $200 and $22,000 of CDSCs paid by Class A and Class C shareholders, respectively.
6 Purchases and Sales of Investments
Purchases and sales of investments by the Portfolio, other than short-term obligations and investments transferred to the Fund, for the period from November 1, 2011 through August 21, 2012 aggregated $385,796,695 and $396,504,910, respectively. Purchases and sales of investments by the Fund, other than short-term obligations and investments acquired in the transfer of assets from the Portfolio, for the period from August 22, 2012 through October 31, 2012 aggregated $135,680,369 and $144,232,420, respectively. Increases and decreases in the Fund’s investment in the Portfolio for the period from November 1, 2011 through August 21, 2012 were $8,825,199 and $448,859,484, respectively. Included in decreases is $401,364,330, representing the Fund’s interest in the Portfolio as of the close of business on August 21, 2012, which was exchanged for the net assets of the Portfolio having the same fair value, consisting primarily of securities, cash and foreign currency on that date. The Fund’s cost of its investment in the Portfolio on such date of $342,935,779 was carried forward to the net assets acquired from the Portfolio and no gain or loss was recognized on the exchange.
Eaton Vance
Global Dividend Income Fund
October 31, 2012
Notes to Financial Statements — continued
7 Shares of Beneficial Interest
The Fund’s Declaration of Trust permits the Trustees to issue an unlimited number of full and fractional shares of beneficial interest (without par value). Such shares may be issued in a number of different series (such as the Fund) and classes. Transactions in Fund shares were as follows:
| | | | | | | | |
| | | Year Ended October 31, | |
| Class A | | 2012 | | | 2011 | |
| | |
Sales | | | 7,458,906 | | | | 10,431,626 | |
Issued to shareholders electing to receive payments of distributions in Fund shares | | | 1,625,661 | | | | 1,659,554 | |
Redemptions | | | (10,326,061 | ) | | | (12,682,399 | ) |
| | |
Net decrease | | | (1,241,494 | ) | | | (591,219 | ) |
| |
| | | Year Ended October 31, | |
| Class C | | 2012 | | | 2011 | |
| | |
Sales | | | 3,935,447 | | | | 5,937,372 | |
Issued to shareholders electing to receive payments of distributions in Fund shares | | | 837,098 | | | | 791,365 | |
Redemptions | | | (6,208,519 | ) | | | (5,918,937 | ) |
| | |
Net increase (decrease) | | | (1,435,974 | ) | | | 809,800 | |
| |
| | | Year Ended October 31, | |
| Class I | | 2012 | | | 2011 | |
| | |
Sales | | | 2,737,132 | | | | 6,018,771 | |
Issued to shareholders electing to receive payments of distributions in Fund shares | | | 295,489 | | | | 316,085 | |
Redemptions | | | (3,908,430 | ) | | | (4,155,789 | ) |
| | |
Net increase (decrease) | | | (875,809 | ) | | | 2,179,067 | |
| |
| | | Year Ended October 31, | |
| Class R | | 2012 | | | 2011 | |
| | |
Sales | | | 14,217 | | | | 44,877 | |
Issued to shareholders electing to receive payments of distributions in Fund shares | | | 4,621 | | | | 3,976 | |
Redemptions | | | (19,559 | ) | | | (27,292 | ) |
| | |
Net increase (decrease) | | | (721 | ) | | | 21,561 | |
8 Federal Income Tax Basis of Investments
The cost and unrealized appreciation (depreciation) of investments of the Fund at October 31, 2012, as determined on a federal income tax basis, were as follows:
| | | | |
| |
Aggregate cost | | $ | 347,296,678 | |
| |
Gross unrealized appreciation | | $ | 52,686,514 | |
Gross unrealized depreciation | | | (4,336,739 | ) |
| |
Net unrealized appreciation | | $ | 48,349,775 | |
Eaton Vance
Global Dividend Income Fund
October 31, 2012
Notes to Financial Statements — continued
9 Financial Instruments
The Fund may trade in financial instruments with off-balance sheet risk in the normal course of its investing activities. These financial instruments may include forward foreign currency exchange contracts and may involve, to a varying degree, elements of risk in excess of the amounts recognized for financial statement purposes. The notional or contractual amounts of these instruments represent the investment the Fund has in particular classes of financial instruments and do not necessarily represent the amounts potentially subject to risk. The measurement of the risks associated with these instruments is meaningful only when all related and offsetting transactions are considered.
A summary of obligations under these financial instruments at October 31, 2012 is as follows:
| | | | | | | | | | |
| Forward Foreign Currency Exchange Contracts | | | | | |
| | | | |
| | | | | | | | | | |
Sales | |
| Settlement Date | | Deliver | | In Exchange For | | Counterparty | | Net Unrealized
Appreciation
(Depreciation) | |
| | | | |
| 11/30/12 | | Euro
5,418,241 | | United States Dollar
7,023,926 | | Citibank NA | | $ | (637 | ) |
| 11/30/12 | | Euro
5,418,241 | | United States Dollar 7,025,535 | | Standard Chartered Bank | | | 972 | |
| 11/30/12 | | Euro
5,418,241 | | United States Dollar 7,023,937 | | State Street Bank and Trust Co. | | | (626 | ) |
| | | | |
| | | | | | | | | $ | (291 | ) |
At October 31, 2012, the Fund had sufficient cash and/or securities to cover commitments under these contracts.
The Fund is subject to foreign exchange risk in the normal course of pursuing its investment objective. Because the Fund holds foreign currency denominated investments, the value of these investments and related receivables and payables may change due to future changes in foreign currency exchange rates. To hedge against this risk, the Fund enters into forward foreign currency exchange contracts. The Fund also enters into such contracts to hedge the currency risk of investments it anticipates purchasing.
The Fund enters into forward foreign currency exchange contracts that may contain provisions whereby the counterparty may terminate the contract under certain conditions, including but not limited to a decline in the Fund’s net assets below a certain level over a certain period of time, which would trigger a payment by the Fund for those derivatives in a liability position. At October 31, 2012 the fair value of derivatives with credit-related contingent features in a net liability position was $1,263. The aggregate fair value of assets pledged as collateral by the Fund for such liability was $20,389 at October 31, 2012.
The non-exchange traded derivatives in which the Fund invests, including forward foreign currency exchange contracts, are subject to the risk that the counterparty to the contract fails to perform its obligations under the contract. At October 31, 2012, the maximum amount of loss the Fund would incur due to counterparty risk was $972, representing the fair value of such derivatives in an asset position, with the highest amount from any one counterparty being $972. To mitigate this risk, the Fund has entered into master netting agreements with substantially all its derivative counterparties, which allows it and a counterparty to aggregate amounts owed by each of them for derivative transactions under the agreement into a single net amount payable by either the Fund or the counterparty. Counterparties may be required to pledge collateral in the form of cash, U.S. Government securities or highly-rated bonds for the benefit of the Fund if the net amount due from the counterparty with respect to a derivative contract exceeds a certain threshold. The amount of collateral posted by the counterparties with respect to such contracts would also reduce the amount of any loss incurred.
The fair value of open derivative instruments (not considered to be hedging instruments for accounting disclosure purposes) and whose primary underlying risk exposure is foreign exchange risk at October 31, 2012 was as follows:
| | | | | | | | |
| | | Fair Value | |
| Derivative | | Asset Derivative | | | Liability Derivative | |
| | |
Forward foreign currency exchange contracts | | $ | 972 | (1) | | $ | (1,263 | )(2) |
| (1) | Statement of Assets and Liabilities location: Receivable for open forward foreign currency exchange contracts; Net unrealized appreciation. |
| (2) | Statement of Assets and Liabilities location: Payable for open forward foreign currency exchange contracts; Net unrealized appreciation. |
Eaton Vance
Global Dividend Income Fund
October 31, 2012
Notes to Financial Statements — continued
The effect of derivative instruments (not considered to be hedging instruments for accounting disclosure purposes) on the Statement of Operations and whose primary underlying risk exposure is foreign exchange risk for the year ended October 31, 2012 was as follows:
| | | | | | | | |
| Derivative | | Realized Gain (Loss) on Derivatives Recognized in Income | | | Change in Unrealized Appreciation (Depreciation) on Derivatives Recognized in Income | |
| | |
Forward foreign currency exchange contracts | | $ | (990,326 | )(1) | | $ | (291 | )(2) |
| (1) | Statement of Operations location: Net realized gain (loss) – Foreign currency and forward foreign currency exchange contract transactions. |
| (2) | Statement of Operations location: Change in unrealized appreciation (depreciation) – Foreign currency and forward foreign currency exchange contracts. |
The average notional amount of forward foreign currency exchange contracts outstanding during the year ended October 31, 2012, which is indicative of the volume of this derivative type, was approximately $4,275,000.
10 Line of Credit
The Fund participates with other portfolios and funds managed by EVM and its affiliates in a $600 million unsecured line of credit agreement with a group of banks. Borrowings are made by the Fund solely to facilitate the handling of unusual and/or unanticipated short-term cash requirements. Interest is charged to the Fund based on its borrowings at an amount above either the Eurodollar rate or Federal Funds rate. In addition, a fee computed at an annual rate of 0.08% on the daily unused portion of the line of credit is allocated among the participating portfolios and funds at the end of each quarter. Because the line of credit is not available exclusively to the Fund, it may be unable to borrow some or all of its requested amounts at any particular time. The Fund did not have any significant borrowings or allocated fees during the year ended October 31, 2012.
11 Risks Associated with Foreign Investments
Investing in securities issued by companies whose principal business activities are outside the United States may involve significant risks not present in domestic investments. For example, there is generally less publicly available information about foreign companies, particularly those not subject to the disclosure and reporting requirements of the U.S. securities laws. Certain foreign issuers are generally not bound by uniform accounting, auditing, and financial reporting requirements and standards of practice comparable to those applicable to domestic issuers. Investments in foreign securities also involve the risk of possible adverse changes in investment or exchange control regulations, expropriation or confiscatory taxation, limitation on the removal of funds or other assets of the Fund, political or financial instability or diplomatic and other developments which could affect such investments. Foreign securities markets, while growing in volume and sophistication, are generally not as developed as those in the United States, and securities of some foreign issuers (particularly those located in developing countries) may be less liquid and more volatile than securities of comparable U.S. companies. In general, there is less overall governmental supervision and regulation of foreign securities markets, broker/dealers and issuers than in the United States.
12 Fair Value Measurements
Under generally accepted accounting principles for fair value measurements, a three-tier hierarchy to prioritize the assumptions, referred to as inputs, is used in valuation techniques to measure fair value. The three-tier hierarchy of inputs is summarized in the three broad levels listed below.
| Ÿ | | Level 1 – quoted prices in active markets for identical investments |
| Ÿ | | Level 2 – other significant observable inputs (including quoted prices for similar investments, interest rates, prepayment speeds, credit risk, etc.) |
| Ÿ | | Level 3 – significant unobservable inputs (including a fund’s own assumptions in determining the fair value of investments) |
In cases where the inputs used to measure fair value fall in different levels of the fair value hierarchy, the level disclosed is determined based on the lowest level input that is significant to the fair value measurement in its entirety. The inputs or methodology used for valuing securities are not necessarily an indication of the risk associated with investing in those securities.
Eaton Vance
Global Dividend Income Fund
October 31, 2012
Notes to Financial Statements — continued
At October 31, 2012, the hierarchy of inputs used in valuing the Fund’s investments and open derivative instruments, which are carried at value, were as follows:
| | | | | | | | | | | | | | | | |
| Asset Description | | Level 1 | | | Level 2 | | | Level 3 | | | Total | |
| | | | |
Common Stocks | | | | | | | | | | | | | | | | |
Consumer Discretionary | | $ | 39,612,286 | | | $ | 11,804,090 | | | $ | — | | | $ | 51,416,376 | |
Consumer Staples | | | 10,985,185 | | | | 22,453,358 | | | | — | | | | 33,438,543 | |
Energy | | | 21,228,421 | | | | 26,163,914 | | | | — | | | | 47,392,335 | |
Financials | | | 41,885,388 | | | | 19,022,479 | | | | — | | | | 60,907,867 | |
Health Care | | | 27,077,973 | | | | 14,923,896 | | | | — | | | | 42,001,869 | |
Industrials | | | 24,515,360 | | | | 10,975,210 | | | | — | | | | 35,490,570 | |
Information Technology | | | 43,586,133 | | | | — | | | | — | | | | 43,586,133 | |
Materials | | | 16,753,960 | | | | 6,401,239 | | | | — | | | | 23,155,199 | |
Telecommunication Services | | | 3,870,100 | | | | 7,870,761 | | | | — | | | | 11,740,861 | |
Utilities | | | 5,124,750 | | | | 12,545,420 | | | | — | | | | 17,670,170 | |
| | | | |
Total Common Stocks | | $ | 234,639,556 | | | $ | 132,160,367 | * | | $ | — | | | $ | 366,799,923 | |
| | | | |
Preferred Stocks | | | | | | | | | | | | | | | | |
Consumer Staples | | $ | — | | | $ | 480,428 | | | $ | — | | | $ | 480,428 | |
Financials | | | 8,531,940 | | | | 6,486,876 | | | | — | | | | 15,018,816 | |
Industrials | | | — | | | | 446,477 | | | | — | | | | 446,477 | |
Utilities | | | 239,512 | | | | 761,409 | | | | — | | | | 1,000,921 | |
| | | | |
Total Preferred Stocks | | $ | 8,771,452 | | | $ | 8,175,190 | | | $ | — | | | $ | 16,946,642 | |
| | | | |
Corporate Bonds & Notes | | $ | — | | | $ | 4,442,922 | | | $ | — | | | $ | 4,442,922 | |
Short-Term Investments | | | — | | | | 7,456,966 | | | | — | | | | 7,456,966 | |
| | | | |
Total Investments | | $ | 243,411,008 | | | $ | 152,235,445 | | | $ | — | | | $ | 395,646,453 | |
| | | | |
Forward Foreign Currency Exchange Contracts | | $ | — | | | $ | 972 | | | $ | — | | | $ | 972 | |
| | | | |
Total | | $ | 243,411,008 | | | $ | 152,236,417 | | | $ | — | | | $ | 395,647,425 | |
| | | | |
Liability Description | | | | | | | | | | | | | | | | |
| | | | |
Forward Foreign Currency Exchange Contracts | | $ | — | | | $ | (1,263 | ) | | $ | — | | | $ | (1,263 | ) |
| | | | |
Total | | $ | — | | | $ | (1,263 | ) | | $ | — | | | $ | (1,263 | ) |
| * | Includes foreign equity securities whose values were adjusted to reflect market trading of comparable securities or other correlated instruments that occurred after the close of trading in their applicable foreign markets. |
The Fund held no investments or other financial instruments as of October 31, 2011 whose fair value was determined using Level 3 inputs. At October 31, 2012, there were no investments transferred between Level 1 and Level 2 during the year then ended.
Eaton Vance
Global Dividend Income Fund
October 31, 2012
Report of Independent Registered Public Accounting Firm
To the Trustees of Eaton Vance Mutual Funds Trust and Shareholders of Eaton Vance Global Dividend Income Fund:
We have audited the accompanying statement of assets and liabilities of Eaton Vance Global Dividend Income Fund (the “Fund”) (one of the funds constituting Eaton Vance Mutual Funds Trust) including the portfolio of investments, as of October 31, 2012, and the related statement of operations for the year then ended, the statements of changes in net assets for each of the two years in the period then ended, and the financial highlights for each of the five years in the period then ended. These financial statements and financial highlights are the responsibility of the Fund’s management. Our responsibility is to express an opinion on these financial statements and financial highlights based on our audits.
We conducted our audits in accordance with the standards of the Public Company Accounting Oversight Board (United States). Those standards require that we plan and perform the audit to obtain reasonable assurance about whether the financial statements and financial highlights are free of material misstatement. The Fund is not required to have, nor were we engaged to perform, an audit of its internal control over financial reporting. Our audits included consideration of internal control over financial reporting as a basis for designing audit procedures that are appropriate in the circumstances, but not for the purpose of expressing an opinion on the effectiveness of the Fund’s internal control over financial reporting. Accordingly, we express no such opinion. An audit also includes examining, on a test basis, evidence supporting the amounts and disclosures in the financial statements, assessing the accounting principles used and significant estimates made by management, as well as evaluating the overall financial statement presentation. We believe that our audits provide a reasonable basis for our opinion.
In our opinion, such financial statements and financial highlights referred to above present fairly, in all material respects, the financial position of Eaton Vance Global Dividend Income Fund as of October 31, 2012, the results of its operations for the year then ended, the changes in its net assets for each of the two years in the period then ended, and the financial highlights for each of the five years in the period then ended, in conformity with accounting principles generally accepted in the United States of America.
DELOITTE & TOUCHE LLP
Boston, Massachusetts
December 17, 2012
Eaton Vance
Global Dividend Income Fund
October 31, 2012
Federal Tax Information (Unaudited)
The Form 1099-DIV you receive in January 2013 will show the tax status of all distributions paid to your account in calendar year 2012. Shareholders are advised to consult their own tax adviser with respect to the tax consequences of their investment in the Fund. As required by the Internal Revenue Code and/or regulations, shareholders must be notified regarding the status of qualified dividend income for individuals and the dividends received deduction for corporations.
Qualified Dividend Income. The Fund designates approximately $19,803,797 or up to the maximum amount of such dividends allowable pursuant to the Internal Revenue Code, as qualified dividend income eligible for the reduced tax rate of 15%.
Dividends Received Deduction. Corporate shareholders are generally entitled to take the dividends received deduction on the portion of the Fund’s dividend distribution that qualifies under tax law. For the Fund’s fiscal 2011 ordinary income dividends, 30.97% qualifies for the corporate dividends received deduction.
Eaton Vance
Global Dividend Income Fund
October 31, 2012
Management and Organization
Fund Management. The Trustees of Eaton Vance Mutual Funds Trust (the Trust) are responsible for the overall management and supervision of the Trust’s affairs. The Trustees and officers of the Trust are listed below. Except as indicated, each individual has held the office shown or other offices in the same company for the last five years. Trustees and officers of the Trust hold indefinite terms of office. The “Noninterested Trustees” consist of those Trustees who are not “interested persons” of the Trust, as that term is defined under the 1940 Act. The business address of each Trustee and officer is Two International Place, Boston, Massachusetts 02110. As used below, “EVC” refers to Eaton Vance Corp., “EV” refers to Eaton Vance, Inc., “EVM” refers to Eaton Vance Management, “BMR” refers to Boston Management and Research and “EVD” refers to Eaton Vance Distributors, Inc. EVC and EV are the corporate parent and trustee, respectively, of EVM and BMR. EVD is the Fund’s principal underwriter and a wholly-owned subsidiary of EVC. Each officer affiliated with Eaton Vance may hold a position with other Eaton Vance affiliates that is comparable to his or her position with EVM listed below. Each Trustee oversees 187 portfolios in the Eaton Vance Complex (including all master and feeder funds in a master feeder structure). Each officer serves as an officer of certain other Eaton Vance funds. Each Trustee and officer serves until his or her successor is elected.
| | | | | | |
| Name and Year of Birth | | Position(s) with the Trust | | Length of
Service | | Principal Occupation(s) and Directorships During Past Five Years and Other Relevant Experience |
Interested Trustee | | | | | | |
| | | |
Thomas E. Faust Jr. 1958 | | Trustee | | Since 2007 | | Chairman, Chief Executive Officer and President of EVC, Director and President of EV, Chief Executive Officer and President of EVM and BMR, and Director of EVD. Trustee and/or officer of 187 registered investment companies. Mr. Faust is an interested person because of his positions with EVM, BMR, EVD, EVC and EV, which are affiliates of the Trust. Directorships in the Last Five Years.(1) Director of EVC and Hexavest Inc. |
| | | |
| | | | | | |
Noninterested Trustees | | | | | | |
| | | |
Scott E. Eston 1956 | | Trustee | | Since 2011 | | Private investor. Formerly held various positions at Grantham, Mayo, Van Otterloo and Co., L.L.C. (investment management firm) (1997-2009), including Chief Operating Officer (2002-2009), Chief Financial Officer (1997-2009) and Chairman of the Executive Committee (2002-2008); President and Principal Executive Officer, GMO Trust (open-end registered investment company) (2006-2009). Former Partner, Coopers and Lybrand L.L.P. (now PricewaterhouseCoopers) (public accounting firm) (1987-1997). Directorships in the Last Five Years. None. |
| | | |
Benjamin C. Esty 1963 | | Trustee | | Since 2005 | | Roy and Elizabeth Simmons Professor of Business Administration and Finance Unit Head, Harvard University Graduate School of Business Administration. Directorships in the Last Five Years.(1) None. |
| | | |
Allen R. Freedman 1940 | | Trustee | | Since 2007 | | Private Investor. Former Chairman (2002-2004) and a Director (1983-2004) of Systems & Computer Technology Corp. (provider of software to higher education). Formerly, a Director of Loring Ward International (fund distributor) (2005-2007). Former Chairman and a Director of Indus International, Inc. (provider of enterprise management software to the power generating industry) (2005-2007). Former Chief Executive Officer of Assurant, Inc. (insurance provider) (1979-2000). Directorships in the Last Five Years.(1) Director of Stonemor Partners, L.P. (owner and operator of cemeteries). Formerly, Director of Assurant, Inc. (insurance provider) (1979-2011). |
| | | |
William H. Park 1947 | | Trustee | | Since 2003 | | Consultant and private investor. Formerly, Chief Financial Officer, Aveon Group L.P. (investment management firm) (2010-2011). Formerly, Vice Chairman, Commercial Industrial Finance Corp. (specialty finance company) (2006-2010). Formerly, President and Chief Executive Officer, Prizm Capital Management, LLC (investment management firm) (2002-2005). Formerly, Executive Vice President and Chief Financial Officer, United Asset Management Corporation (investment management firm) (1982-2001). Formerly, Senior Manager, Price Waterhouse (now PricewaterhouseCoopers) (an independent registered public accounting firm) (1972-1981). Directorships in the Last Five Years.(1) None. |
| | | |
Ronald A. Pearlman 1940 | | Trustee | | Since 2003 | | Professor of Law, Georgetown University Law Center. Formerly, Deputy Assistant Secretary (Tax Policy) and Assistant Secretary (Tax Policy), U.S. Department of the Treasury (1983-1985). Formerly, Chief of Staff, Joint Committee on Taxation, U.S. Congress (1988-1990). Directorships in the Last Five Years.(1) None. |
Eaton Vance
Global Dividend Income Fund
October 31, 2012
Management and Organization — continued
| | | | | | |
| Name and Year of Birth | | Position(s) with the Trust | | Length of
Service | | Principal Occupation(s) and Directorships During Past Five Years and Other Relevant Experience |
Noninterested Trustees (continued) |
| | | |
Helen Frame Peters 1948 | | Trustee | | Since 2008 | | Professor of Finance, Carroll School of Management, Boston College. Formerly, Dean, Carroll School of Management, Boston College (2000-2002). Formerly, Chief Investment Officer, Fixed Income, Scudder Kemper Investments (investment management firm) (1998-1999). Formerly, Chief Investment Officer, Equity and Fixed Income, Colonial Management Associates (investment management firm) (1991-1998). Directorships in the Last Five Years.(1) Formerly, Director of BJ’s Wholesale Club, Inc. (wholesale club retailer) (2004-2011). Formerly, Trustee of SPDR Index Shares Funds and SPDR Series Trust (exchange traded funds) (2000-2009). Formerly, Director of Federal Home Loan Bank of Boston (a bank for banks) (2007-2009). |
| | | |
Lynn A. Stout 1957 | | Trustee | | Since 1998 | | Distinguished Professor of Corporate and Business Law, Jack G. Clarke Business Law Institute, Cornell University Law School. Formerly, the Paul Hastings Professor of Corporate and Securities Law (2006-2012) and Professor of Law (2001-2006), University of California at Los Angeles School of Law. Directorships in the Last Five Years.(1) None. |
| | | |
Harriett Tee Taggart 1948 | | Trustee | | Since 2011 | | Managing Director, Taggart Associates (a professional practice firm). Formerly, Partner and Senior Vice President, Wellington Management Company, LLP (investment management firm) (1983-2006). Directorships in the Last Five Years. Director of Albemarle Corporation (chemicals manufacturer) (since 2007) and The Hanover Group (specialty property and casualty insurance company) (since 2009). Formerly, Director of Lubrizol Corporation (specialty chemicals) (2007-2011). |
| | | |
Ralph F. Verni 1943 | | Chairman of the Board and Trustee | | Chairman of the Board since 2007 and Trustee since 2005 | | Consultant and private investor. Formerly, Chief Investment Officer (1982-1992), Chief Financial Officer (1988-1990) and Director (1982-1992), New England Life. Formerly, Chairperson, New England Mutual Funds (1982-1992). Formerly, President and Chief Executive Officer, State Street Management & Research (1992-2000). Formerly, Chairperson, State Street Research Mutual Funds (1992-2000). Formerly, Director, W.P. Carey, LLC (1998-2004) and First Pioneer Farm Credit Corp. (2002-2006). Directorships in the Last Five Years.(1) None. |
| | | |
| | | | | | |
Principal Officers who are not Trustees | | |
| Name and Year of Birth | | Position(s)
with the
Trust | | Length of Service | | Principal Occupation(s) During Past Five Years |
| | | |
Duncan W. Richardson 1957 | | President | | Since 2011 | | Director of EVC and Executive Vice President and Chief Equity Investment Officer of EVC, EVM and BMR. |
| | | |
Payson F. Swaffield 1956 | | Vice President | | Since 2011 | | Vice President and Chief Income Investment Officer of EVM and BMR. |
| | | |
Barbara E. Campbell 1957 | | Treasurer | | Since 2005 | | Vice President of EVM and BMR. |
| | | |
Maureen A. Gemma 1960 | | Vice President, Secretary and Chief Legal Officer | | Vice President since 2011, Secretary since 2007 and Chief Legal Officer since 2008 | | Vice President of EVM and BMR. |
| | | |
Paul M. O’Neil 1953 | | Chief Compliance Officer | | Since 2004 | | Vice President of EVM and BMR. |
| (1) | During their respective tenures, the Trustees (except Mr. Eston and Ms. Taggart) also served as trustees of one or more of the following Eaton Vance funds (which operated in the years noted): Eaton Vance Credit Opportunities Fund (launched in 2005 and terminated in 2010); Eaton Vance Insured Florida Plus Municipal Bond Fund (launched in 2002 and terminated in 2009); and Eaton Vance National Municipal Income Trust (launched in 1998 and terminated in 2009). |
The SAI for the Fund includes additional information about the Trustees and officers of the Fund and can be obtained without charge on Eaton Vance’s website at www.eatonvance.com or by calling 1-800-262-1122.
Eaton Vance Funds
IMPORTANT NOTICES
Privacy. The Eaton Vance organization is committed to ensuring your financial privacy. Each of the financial institutions identified below has in effect the following policy (“Privacy Policy”) with respect to nonpublic personal information about its customers:
| Ÿ | | Only such information received from you, through application forms or otherwise, and information about your Eaton Vance fund transactions will be collected. This may include information such as name, address, social security number, tax status, account balances and transactions. |
| Ÿ | | None of such information about you (or former customers) will be disclosed to anyone, except as permitted by law (which includes disclosure to employees necessary to service your account). In the normal course of servicing a customer’s account, Eaton Vance may share information with unaffiliated third parties that perform various required services such as transfer agents, custodians and broker-dealers. |
| Ÿ | | Policies and procedures (including physical, electronic and procedural safeguards) are in place that are designed to protect the confidentiality of such information. |
| Ÿ | | We reserve the right to change our Privacy Policy at any time upon proper notification to you. Customers may want to review our Privacy Policy periodically for changes by accessing the link on our homepage: www.eatonvance.com. |
Our pledge of privacy applies to the following entities within the Eaton Vance organization: the Eaton Vance Family of Funds, Eaton Vance Management, Eaton Vance Investment Counsel, Eaton Vance Distributors, Inc., Eaton Vance Trust Company, Eaton Vance Management’s Real Estate Investment Group and Boston Management and Research. In addition, our Privacy Policy applies only to those Eaton Vance customers who are individuals and who have a direct relationship with us. If a customer’s account (i.e., fund shares) is held in the name of a third-party financial advisor/broker-dealer, it is likely that only such advisor’s privacy policies apply to the customer. This notice supersedes all previously issued privacy disclosures. For more information about Eaton Vance’s Privacy Policy, please call 1-800-262-1122.
Delivery of Shareholder Documents. The Securities and Exchange Commission (SEC) permits funds to deliver only one copy of shareholder documents, including prospectuses, proxy statements and shareholder reports, to fund investors with multiple accounts at the same residential or post office box address. This practice is often called “householding” and it helps eliminate duplicate mailings to shareholders. Eaton Vance, or your financial advisor, may household the mailing of your documents indefinitely unless you instruct Eaton Vance, or your financial advisor, otherwise. If you would prefer that your Eaton Vance documents not be householded, please contact Eaton Vance at 1-800-262-1122, or contact your financial advisor. Your instructions that householding not apply to delivery of your Eaton Vance documents will be effective within 30 days of receipt by Eaton Vance or your financial advisor.
Portfolio Holdings. Each Eaton Vance Fund and its underlying Portfolio(s) (if applicable) will file a schedule of portfolio holdings on Form N-Q with the SEC for the first and third quarters of each fiscal year. The Form N-Q will be available on the Eaton Vance website at www.eatonvance.com, by calling Eaton Vance at 1-800-262-1122 or in the EDGAR database on the SEC’s website at www.sec.gov. Form N-Q may also be reviewed and copied at the SEC’s public reference room in Washington, D.C. (call 1-800-732-0330 for information on the operation of the public reference room).
Proxy Voting. From time to time, funds are required to vote proxies related to the securities held by the funds. The Eaton Vance Funds or their underlying Portfolios (if applicable) vote proxies according to a set of policies and procedures approved by the Funds’ and Portfolios’ Boards. You may obtain a description of these policies and procedures and information on how the Funds or Portfolios voted proxies relating to portfolio securities during the most recent 12-month period ended June 30, without charge, upon request, by calling 1-800-262-1122 and by accessing the SEC’s website at www.sec.gov.
This Page Intentionally Left Blank
Investment Adviser
Boston Management and Research
Two International Place
Boston, MA 02110
Administrator
Eaton Vance Management
Two International Place
Boston, MA 02110
Principal Underwriter*
Eaton Vance Distributors, Inc.
Two International Place
Boston, MA 02110
(617) 482-8260
Custodian
State Street Bank and Trust Company
200 Clarendon Street
Boston, MA 02116
Transfer Agent
BNY Mellon Investment Servicing (US) Inc.
Attn: Eaton Vance Funds
P.O. Box 9653
Providence, RI 02940-9653
(800) 262-1122
Independent Registered Public Accounting Firm
Deloitte & Touche LLP
200 Berkeley Street
Boston, MA 02116-5022
Fund Offices
Two International Place
Boston, MA 02110
| * | FINRA BrokerCheck. Investors may check the background of their Investment Professional by contacting the Financial Industry Regulatory Authority (FINRA). FINRA BrokerCheck is a free tool to help investors check the professional background of current and former FINRA-registered securities firms and brokers. FINRA BrokerCheck is available by calling 1-800-289-9999 and at www.FINRA.org. The FINRA BrokerCheck brochure describing this program is available to investors at www.FINRA.org. |
| | |
Eaton Vance Emerging Markets Local Income Fund Annual Report October 31, 2012 | | 
|

Fund shares are not insured by the FDIC and are not deposits or other obligations of, or guaranteed by, any depository institution. Shares are subject to investment risks, including possible loss of principal invested.
This report must be preceded or accompanied by a current summary prospectus or prospectus. Before investing, investors should consider carefully the investment objective, risks, and charges and expenses of a mutual fund. This and other important information is contained in the summary prospectus and prospectus, which can be obtained from a financial advisor. Prospective investors should read the prospectus carefully before investing. For further information, please call 1-800-262-1122.
Annual Report October 31, 2012
Eaton Vance
Emerging Markets Local Income Fund
Table of Contents
| | | | |
Management’s Discussion of Fund Performance | | | 2 | |
| |
Performance | | | 3 | |
| |
Fund Profile | | | 4 | |
| |
Endnotes and Additional Disclosures | | | 5 | |
| |
Fund Expenses | | | 6 | |
| |
Financial Statements | | | 7 | |
| |
Report of Independent Registered Public Accounting Firm | | | 17 and 53 | |
| |
Federal Tax Information | | | 18 | |
| |
Management and Organization | | | 54 | |
| |
Important Notices | | | 57 | |
Eaton Vance
Emerging Markets Local Income Fund
October 31, 2012
Management’s Discussion of Fund Performance1
Economic and Market Conditions
The 12-month period ending October 31, 2012 was a year dominated by central bank easing. The most aggressive action took place in developed-market countries that are burdened with debt. The European Central Bank (ECB) offered low-interest, three-year loans to banks, as the region’s debt crisis made it difficult for banks to fund their operations in the public markets. The ECB also cut its main interest rate three times, to a record low of 0.75%, and unveiled a plan to buy bonds of troubled eurozone governments. With their key policy rates already near zero, the U.S. Federal Reserve (the Fed), Bank of Japan and Bank of England relied on quantitative easing to try to reduce longer-term borrowing costs and spur economic growth. In addition, the Fed continued with “Operation Twist,” a stimulus program that was set to expire in June 2012 but that was extended through the end of 2012.
In the United States, gross domestic product (GDP) growth slid from an annual rate of 4.1% in the fourth quarter of 2011 to 2.7% or less in each of the next three quarters. Growth in Germany and Japan also decelerated, Spain and Italy entered recession, and France appeared to be heading in that direction. Latin American and emerging Asian economies grew faster than their developed-market counterparts. However, their growth rates slowed, causing central banks in Brazil, China and other countries in these regions to reduce interest rates.
The world’s bond markets generally posted positive returns during the fiscal year. Higher-risk securities delivered some of the strongest gains, as investors chased yield in the low-rate environment. For example, local bond prices appreciated throughout much of the emerging world. In the foreign exchange markets, most Latin American and Asian currencies strengthened versus the U.S. dollar, and most Central and Eastern European currencies strengthened versus the euro. On a total return basis, the Mexican peso and Philippine peso did especially well versus the U.S. dollar, while the Polish zloty was a standout performer versus the euro.
Fund Performance
For the fiscal year ending October, 31, 2012, Eaton Vance Emerging Markets Local Income Fund’s (the Fund) Class A shares at net asset value (NAV) had a total return of 7.31%. By comparison, the Fund’s benchmark, the J.P. Morgan GBI-EM Global Diversified Index (the Index),2 gained 7.25% during the period.
The Fund’s investments in benchmark countries in Asia helped performance versus the Index, led by overweight positions in Malaysia and the Philippines. Malaysia’s economy has been a strong performer in the region, buoyed by robust domestic demand and government spending on infrastructure projects.
In the Philippines, economic growth was better than expected, and the country’s budget deficit narrowed. An underweight in South Africa also added value. Toward the end of the period, illegal strikes in the nation’s mining industry spread to the public sector.
In Latin America, the Fund’s exposure to benchmark countries had minimal impact on relative performance versus the Index. An overweight in Mexico was positive, but the benefit was offset by underweight positions in Brazil and Colombia. Economic data coming out of Mexico was strong, and the country had peaceful elections in July 2012. Brazil’s economy showed signs of improvement following a series of tax and interest-rate cuts, and Colombia’s investor-friendly policies attracted capital flows throughout the period.
In Central and Eastern Europe, the Fund’s benchmark positions detracted from relative results versus the Index because of underweight positions in Russia and Hungary. Despite the business climate in Russia, investors still sought the yields available on the country’s bonds. Yield-hungry investors also gravitated toward Hungarian sovereign debt, even though it was downgraded by all of the major credit ratings agencies.
Investments in non-benchmark countries contributed positively to performance versus the Index, driven by short-duration currency positions in Singapore, Georgia and Uruguay. Singapore’s central bank permitted steady appreciation of the Singapore dollar during the fiscal year to curb import inflation. In the Republic of Georgia, real GDP growth has been about 6% since 2004, unemployment and inflation have fallen, and foreign direct investment flows have been strong. Uruguay is more business-friendly than Brazil and Argentina and has been attracting a significant amount of foreign direct investment as a result.
|
See Endnotes and Additional Disclosures in this report. Past performance is no guarantee of future results. Returns are historical and are calculated by determining the percentage change in net asset value (NAV) or offering price (as applicable) with all distributions reinvested. Investment return and principal value will fluctuate so that shares, when redeemed, may be worth more or less than their original cost. Performance less than one year is cumulative. Performance is for the stated time period only; due to market volatility, the Fund’s current performance may be lower or higher than quoted. Returns are before taxes unless otherwise noted. For performance as of the most recent month end, please refer to www.eatonvance.com. |
Eaton Vance
Emerging Markets Local Income Fund
October 31, 2012
Performance2,3
Portfolio Managers John R. Baur and Michael A. Cirami, CFA
| | | | | | | | | | | | | | | | |
| % Average Annual Total Returns | | Inception Date | | | One Year | | | Five Years | | | Since
Inception | |
Class A at NAV | | | 06/27/2007 | | | | 7.31 | % | | | 7.40 | % | | | 8.91 | % |
Class A with 4.75% Maximum Sales Charge | | | — | | | | 2.22 | | | | 6.36 | | | | 7.92 | |
Class C at NAV | | | 08/03/2010 | | | | 6.57 | | | | — | | | | 4.92 | |
Class C with 1% Maximum Sales Charge | | | — | | | | 5.57 | | | | — | | | | 4.92 | |
Class I at NAV | | | 11/30/2009 | | | | 7.64 | | | | — | | | | 7.90 | |
J.P. Morgan GBI-EM Global Diversified Index | | | 06/27/2007 | | | | 7.25 | % | | | 7.92 | % | | | 9.55 | % |
| | | | |
| | | | | | | | | | | | | | | | |
| % Total Annual Operating Expense Ratios4 | | | | | Class A | | | Class C | | | Class I | |
Gross | | | | | | | 1.40 | % | | | 2.10 | % | | | 1.11 | % |
Net | | | | | | | 1.25 | | | | 1.95 | | | | 0.95 | |
Performance of $10,000
This graph shows the change in value of a hypothetical investment of $10,000 in Class A of the Fund for the period indicated. For comparison, the same investment is shown in the indicated index.
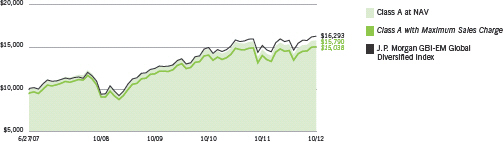
| | | | | | | | |
| Performance of Investment | | Amount
Invested | | Period
Beginning | | At NAV | | With Maximum
Sales Charge |
Class C | | $10,000 | | 08/03/2010 | | $11,141 | | N.A. |
Class I | | $250,000 | | 11/30/2009 | | $312,400 | | N.A. |
See Endnotes and Additional Disclosures in this report.
Past performance is no guarantee of future results. Returns are historical and are calculated by determining the percentage change in net asset value (NAV) or offering price (as applicable) with all distributions reinvested. Investment return and principal value will fluctuate so that shares, when redeemed, may be worth more or less than their original cost. Performance less than one year is cumulative. Performance is for the stated time period only; due to market volatility, the Fund’s current performance may be lower or higher than quoted. Returns are before taxes unless otherwise noted. For performance as of the most recent month end, please refer to www.eatonvance.com.
Eaton Vance
Emerging Markets Local Income Fund
October 31, 2012
Fund Profile5
Asset Allocation (% of net assets)6
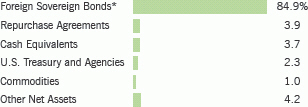
| * | Net securities sold short. |
| | | | | | | | | | |
Foreign Currency Exposure (% of net assets)7 | |
Malaysia | | | 12.6 | % | | Hong Kong | | | 1.7 | % |
Mexico | | | 12.0 | | | Platinum | | | 1.2 | |
Turkey | | | 11.8 | | | Norway | | | 1.0 | |
Brazil | | | 11.0 | | | Singapore | | | 1.0 | |
Poland | | | 10.9 | | | Sweden | | | 1.0 | |
Indonesia | | | 9.8 | | | Uruguay | | | 0.7 | |
Russia | | | 9.1 | | | Georgia | | | 0.7 | |
South Africa | | | 8.6 | | | Dominican Republic | | | 0.4 | |
Thailand | | | 7.3 | | | Bosnia and Herzegovina | | | 0.3 | |
Hungary | | | 5.9 | | | Chile | | | 0.2 | |
Serbia | | | 4.8 | | | Ghana | | | 0.1 | |
Nigeria | | | 4.6 | | | Egypt | | | 0.0 | * |
Colombia | | | 4.0 | | | New Zealand | | | 0.0 | * |
India | | | 3.4 | | | Costa Rica | | | 0.0 | * |
Peru | | | 3.1 | | | Japan | | | -1.1 | |
China | | | 2.2 | | | Australia | | | -1.4 | |
South Korea | | | 2.0 | | | Taiwan | | | -2.6 | |
Sri Lanka | | | 2.0 | | | Euro | | | -11.4 | |
| | | | | | | |
Philippines | | | 2.0 | | | Total Long | | | 135.4 | |
| | | | | | | |
| | | | | | Total Short | | | -16.5 | |
| | | | | | | |
| | | | | | Total Net | | | 118.9 | |
| | | | | | | |
| * | Amount is less than 0.05%. |
See Endnotes and Additional Disclosures in this report.
Eaton Vance
Emerging Markets Local Income Fund
October 31, 2012
Endnotes and Additional Disclosures
| 1 | The views expressed in this report are those of the portfolio manager(s) and are current only through the date stated at the top of this page. These views are subject to change at any time based upon market or other conditions, and Eaton Vance and the Fund(s) disclaim any responsibility to update such views. These views may not be relied upon as investment advice and, because investment decisions are based on many factors, may not be relied upon as an indication of trading intent on behalf of any Eaton Vance fund. This commentary may contain statements that are not historical facts, referred to as “forward looking statements”. The Fund’s actual future results may differ significantly from those stated in any forward looking statement, depending on factors such as changes in securities or financial markets or general economic conditions, the volume of sales and purchases of Fund shares, the continuation of investment advisory, administrative and service contracts, and other risks discussed from time to time in the Fund’s filings with the Securities and Exchange Commission. |
| 2 | J.P. Morgan GBI-EM Global Diversified Index is an unmanaged index of local-currency bonds with maturities of more than one year issued by emerging markets governments. Unless otherwise stated, index returns do not reflect the effect of any applicable sales charges, commissions, expenses, taxes or leverage, as applicable. It is not possible to invest directly in an index. |
| 3 | Total Returns at NAV do not include applicable sales charges. If sales charges were deducted, the returns would be lower. Total Returns shown with maximum sales charge reflect the stated maximum sales charge. Unless otherwise stated, performance does not reflect the deduction of taxes on Fund distributions or redemptions of Fund shares. |
| 4 | The Gross Expense Ratios are as stated in the Fund’s most recent prospectus. Net expense ratios exclude interest expenses associated with certain investment transactions. Net expense ratios reflect contractual expense reimbursements that continue through 2/28/13. Without the reimbursements, performance would have been lower. |
| 5 | Fund primarily invests in an affiliated investment company (Portfolio) with the same objective(s) and policies as the Fund and may also invest directly. Unless otherwise noted, references to investments are to the aggregate holdings of the Fund and the Portfolio. |
| 6 | Other net assets represents other assets less liabilities and includes investment types, if any, each less than 1% of net assets. See Statement of Assets and Liabilities for details. |
| 7 | Currency exposures include all foreign exchange denominated assets, currency derivatives and commodities (including commodity derivatives). Total exposures may exceed 100% due to implicit leverage created by derivatives. |
| | Fund profile subject to change due to active management. |
Eaton Vance
Emerging Markets Local Income Fund
October 31, 2012
Fund Expenses
Example: As a Fund shareholder, you incur two types of costs: (1) transaction costs, including sales charges (loads) on purchases and redemption fees (if applicable); and (2) ongoing costs, including management fees; distribution and/or service fees; and other Fund expenses. This Example is intended to help you understand your ongoing costs (in dollars) of Fund investing and to compare these costs with the ongoing costs of investing in other mutual funds. The Example is based on an investment of $1,000 invested at the beginning of the period and held for the entire period (May 1, 2012 – October 31, 2012).
Actual Expenses: The first section of the table below provides information about actual account values and actual expenses. You may use the information in this section, together with the amount you invested, to estimate the expenses that you paid over the period. Simply divide your account value by $1,000 (for example, an $8,600 account value divided by $1,000 = 8.6), then multiply the result by the number in the first section under the heading entitled “Expenses Paid During Period” to estimate the expenses you paid on your account during this period.
Hypothetical Example for Comparison Purposes: The second section of the table below provides information about hypothetical account values and hypothetical expenses based on the actual Fund expense ratio and an assumed rate of return of 5% per year (before expenses), which is not the actual Fund return. The hypothetical account values and expenses may not be used to estimate the actual ending account balance or expenses you paid for the period. You may use this information to compare the ongoing costs of investing in your Fund and other funds. To do so, compare this 5% hypothetical example with the 5% hypothetical examples that appear in the shareholder reports of the other funds.
Please note that the expenses shown in the table are meant to highlight your ongoing costs only and do not reflect any transactional costs, such as sales charges (loads) or redemption fees (if applicable). Therefore, the second section of the table is useful in comparing ongoing costs only, and will not help you determine the relative total costs of owning different funds. In addition, if these transactional costs were included, your costs would be higher.
| | | | | | | | | | | | | | | | |
| | | Beginning
Account Value
(5/1/12) | | | Ending
Account Value
(10/31/12) | | | Expenses Paid
During Period*
(5/1/12 – 10/31/12) | | | Annualized
Expense
Ratio | |
| | | | |
| | | | | | | | | | | | | | | | |
Actual | | | | | | | | | | | | | |
Class A | | $ | 1,000.00 | | | $ | 1,029.90 | | | $ | 7.14 | ** | | | 1.40 | % |
Class C | | $ | 1,000.00 | | | $ | 1,026.40 | | | $ | 10.70 | ** | | | 2.10 | % |
Class I | | $ | 1,000.00 | | | $ | 1,031.40 | | | $ | 5.62 | ** | | | 1.10 | % |
| | | | | | | | | | | | | | | | | |
| | | | |
| | | | | | | | | | | | | | | | |
Hypothetical | | | | | | | | | | | | | |
(5% return per year before expenses) | | | | | | | | | | | | | |
Class A | | $ | 1,000.00 | | | $ | 1,018.10 | | | $ | 7.10 | ** | | | 1.40 | % |
Class C | | $ | 1,000.00 | | | $ | 1,014.60 | | | $ | 10.63 | ** | | | 2.10 | % |
Class I | | $ | 1,000.00 | | | $ | 1,019.60 | | | $ | 5.58 | ** | | | 1.10 | % |
| * | Expenses are equal to the Fund’s annualized expense ratio for the indicated Class, multiplied by the average account value over the period, multiplied by 184/366 (to reflect the one-half year period). The Example assumes that the $1,000 was invested at the net asset value per share determined at the close of business on April 30, 2012. The Example reflects the expenses of both the Fund and the Portfolio. |
| ** | Absent an allocation of certain expenses to an affiliate, expenses would be higher. |
Eaton Vance
Emerging Markets Local Income Fund
October 31, 2012
Statement of Assets and Liabilities
| | | | |
| Assets | | October 31, 2012 | |
Investment in Emerging Markets Local Income Portfolio, at value (identified cost, $616,240,187) | | $ | 608,455,503 | |
Receivable for Fund shares sold | | | 1,882,151 | |
Receivable from affiliate | | | 2,053 | |
Total assets | | $ | 610,339,707 | |
|
| Liabilities | |
Payable for Fund shares redeemed | | $ | 2,588,013 | |
Distributions payable | | | 745,188 | |
Payable to affiliates: | | | | |
Distribution and service fees | | | 154,195 | |
Trustees’ fees | | | 42 | |
Accrued expenses | | | 177,477 | |
Total liabilities | | $ | 3,664,915 | |
Net Assets | | $ | 606,674,792 | |
|
| Sources of Net Assets | |
Paid-in capital | | $ | 619,270,615 | |
Accumulated net realized loss from Portfolio | | | (4,303,802 | ) |
Accumulated distributions in excess of net investment income | | | (507,337 | ) |
Net unrealized depreciation from Portfolio | | | (7,784,684 | ) |
Total | | $ | 606,674,792 | |
| |
| Class A Shares | | | | |
Net Assets | | $ | 261,861,948 | |
Shares Outstanding | | | 26,265,324 | |
Net Asset Value and Redemption Price Per Share | | | | |
(net assets ÷ shares of beneficial interest outstanding) | | $ | 9.97 | |
Maximum Offering Price Per Share | | | | |
(100 ÷ 95.25 of net asset value per share) | | $ | 10.47 | |
| |
| Class C Shares | | | | |
Net Assets | | $ | 101,084,872 | |
Shares Outstanding | | | 10,128,517 | |
Net Asset Value and Offering Price Per Share* | | | | |
(net assets ÷ shares of beneficial interest outstanding) | | $ | 9.98 | |
| |
| Class I Shares | | | | |
Net Assets | | $ | 243,727,972 | |
Shares Outstanding | | | 24,353,910 | |
Net Asset Value, Offering Price and Redemption Price Per Share | | | | |
(net assets ÷ shares of beneficial interest outstanding) | | $ | 10.01 | |
On sales of $50,000 or more, the offering price of Class A shares is reduced.
| * | Redemption price per share is equal to the net asset value less any applicable contingent deferred sales charge. |
| | | | |
| | 7 | | See Notes to Financial Statements. |
Eaton Vance
Emerging Markets Local Income Fund
October 31, 2012
Statement of Operations
| | | | |
| Investment Income | | Year Ended October 31, 2012 | |
Interest allocated from Portfolio (net of foreign taxes, $772,334) | | $ | 38,513,478 | |
Dividends allocated from Portfolio (net of foreign taxes, $2,231) | | | 33,549 | |
Expenses allocated from Portfolio | | | (5,764,048 | ) |
Total investment income from Portfolio | | $ | 32,782,979 | |
| |
| Expenses | | | | |
Distribution and service fees | | | | |
Class A | | $ | 805,932 | |
Class C | | | 978,749 | |
Trustees’ fees and expenses | | | 500 | |
Custodian fee | | | 38,345 | |
Transfer and dividend disbursing agent fees | | | 496,325 | |
Legal and accounting services | | | 30,830 | |
Printing and postage | | | 186,672 | |
Registration fees | | | 44,381 | |
Miscellaneous | | | 19,651 | |
Total expenses | | $ | 2,601,385 | |
Deduct — | | | | |
Allocation of expenses to affiliate | | $ | 84,637 | |
Total expense reductions | | $ | 84,637 | |
| |
Net expenses | | $ | 2,516,748 | |
| |
Net investment income | | $ | 30,266,231 | |
| |
| Realized and Unrealized Gain (Loss) from Portfolio | | | | |
Net realized gain (loss) — | | | | |
Investment transactions (net of foreign capital gains taxes of $132,957) and (including a gain of $472,461 from precious metals) | | $ | (13,298,469 | ) |
Securities sold short | | | 45,058 | |
Futures contracts | | | (106,978 | ) |
Swap contracts | | | 1,897,332 | |
Forward commodity contracts | | | (318,252 | ) |
Foreign currency and forward foreign currency exchange contract transactions | | | 8,724,684 | |
Net realized loss | | $ | (3,056,625 | ) |
Change in unrealized appreciation (depreciation) — | | | | |
Investments (including net decrease of $837,983 from precious metals) | | $ | 10,589,376 | |
Written options | | | 502,332 | |
Securities sold short | | | (1,649,084 | ) |
Futures contracts | | | 30,214 | |
Swap contracts | | | 1,886,506 | |
Forward commodity contracts | | | 543,136 | |
Foreign currency and forward foreign currency exchange contracts | | | (1,990,426 | ) |
Net change in unrealized appreciation (depreciation) | | $ | 9,912,054 | |
| |
Net realized and unrealized gain | | $ | 6,855,429 | |
| |
Net increase in net assets from operations | | $ | 37,121,660 | |
| | | | |
| | 8 | | See Notes to Financial Statements. |
Eaton Vance
Emerging Markets Local Income Fund
October 31, 2012
Statements of Changes in Net Assets
| | | | | | | | |
| | | Year Ended October 31, | |
| Increase (Decrease) in Net Assets | | 2012 | | | 2011 | |
From operations — | | | | | | | | |
Net investment income | | $ | 30,266,231 | | | $ | 22,683,875 | |
Net realized loss from investment transactions, written options, securities sold short, futures contracts, swap contracts, forward commodity contracts, and foreign currency and forward foreign currency exchange contract transactions | | | (3,056,625 | ) | | | (12,674,560 | ) |
Net change in unrealized appreciation (depreciation) from investments, written options, securities sold short, futures contracts, swap contracts, forward commodity contracts, foreign currency and forward foreign currency exchange contracts | | | 9,912,054 | | | | (21,059,082 | ) |
Net increase (decrease) in net assets from operations | | $ | 37,121,660 | | | $ | (11,049,767 | ) |
Distributions to shareholders — | | | | | | | | |
From net investment income | | | | | | | | |
Class A | | $ | (11,289,147 | ) | | $ | (13,766,599 | ) |
Class C | | | (3,687,596 | ) | | | (3,432,849 | ) |
Class I | | | (9,722,294 | ) | | | (8,012,176 | ) |
From net realized gain | | | | | | | | |
Class A | | | (1,304,242 | ) | | | — | |
Class C | | | (487,295 | ) | | | — | |
Class I | | | (1,167,310 | ) | | | — | |
Tax return of capital | | | | | | | | |
Class A | | | (7,808,080 | ) | | | (6,681,169 | ) |
Class C | | | (2,550,506 | ) | | | (1,666,022 | ) |
Class I | | | (6,724,374 | ) | | | (3,888,448 | ) |
Total distributions to shareholders | | $ | (44,740,844 | ) | | $ | (37,447,263 | ) |
Transactions in shares of beneficial interest — | | | | | | | | |
Proceeds from sale of shares | | | | | | | | |
Class A | | $ | 97,912,655 | | | $ | 334,593,866 | |
Class C | | | 31,119,256 | | | | 80,573,397 | |
Class I | | | 148,261,177 | | | | 259,135,813 | |
Net asset value of shares issued to shareholders in payment of distributions declared | | | | | | | | |
Class A | | | 18,048,485 | | | | 16,566,127 | |
Class C | | | 5,256,990 | | | | 3,845,238 | |
Class I | | | 11,240,745 | | | | 8,032,444 | |
Cost of shares redeemed | | | | | | | | |
Class A | | | (157,644,245 | ) | | | (192,302,074 | ) |
Class C | | | (33,604,560 | ) | | | (12,406,580 | ) |
Class I | | | (129,886,076 | ) | | | (82,306,954 | ) |
Net increase (decrease) in net assets from Fund share transactions | | $ | (9,295,573 | ) | | $ | 415,731,277 | |
| | |
Net increase (decrease) in net assets | | $ | (16,914,757 | ) | | $ | 367,234,247 | |
| | |
| Net Assets | | | | | | | | |
At beginning of year | | $ | 623,589,549 | | | $ | 256,355,302 | |
At end of year | | $ | 606,674,792 | | | $ | 623,589,549 | |
| | |
Accumulated distributions in excess of net investment income
included in net assets | | | | | | | | |
At end of year | | $ | (507,337 | ) | | $ | (1,026,353 | ) |
| | | | |
| | 9 | | See Notes to Financial Statements. |
Eaton Vance
Emerging Markets Local Income Fund
October 31, 2012
Financial Highlights
| | | | | | | | | | | | | | | | | | | | |
| | | Class A | |
| | | Year Ended October 31, | |
| | | 2012 | | | 2011 | | | 2010 | | | 2009 | | | 2008 | |
Net asset value — Beginning of year | | $ | 10.020 | | | $ | 10.830 | | | $ | 9.850 | | | $ | 8.280 | | | $ | 10.770 | |
| | | | | |
| Income (Loss) From Operations | | | | | | | | | | | | | | | | | | | | |
Net investment income(1) | | $ | 0.504 | | | $ | 0.470 | | | $ | 0.450 | | | $ | 0.487 | | | $ | 0.475 | |
Net realized and unrealized gain (loss) | | | 0.190 | | | | (0.498 | ) | | | 1.312 | | | | 1.864 | | | | (1.727 | ) |
| | | | | |
Total income (loss) from operations | | $ | 0.694 | | | $ | (0.028 | ) | | $ | 1.762 | | | $ | 2.351 | | | $ | (1.252 | ) |
| | | | | |
| Less Distributions | | | | | | | | | | | | | | | | | | | | |
From net investment income | | $ | (0.410 | ) | | $ | (0.527 | ) | | $ | (0.658 | ) | | $ | (0.781 | ) | | $ | (0.640 | ) |
From net realized gain | | | (0.050 | ) | | | — | | | | (0.026 | ) | | | — | | | | (0.381 | ) |
Tax return of capital | | | (0.284 | ) | | | (0.255 | ) | | | (0.098 | ) | | | — | | | | (0.217 | ) |
| | | | | |
Total distributions | | $ | (0.744 | ) | | $ | (0.782 | ) | | $ | (0.782 | ) | | $ | (0.781 | ) | | $ | (1.238 | ) |
| | | | | |
Net asset value — End of year | | $ | 9.970 | | | $ | 10.020 | | | $ | 10.830 | | | $ | 9.850 | | | $ | 8.280 | |
| | | | | |
Total Return(2) | | | 7.31 | % | | | (0.33 | )% | | | 18.65 | % | | | 30.05 | % | | | (13.38 | )% |
| | | | | |
| Ratios/Supplemental Data | | | | | | | | | | | | | | | | | | | | |
Net assets, end of year (000’s omitted) | | $ | 261,862 | | | $ | 307,098 | | | $ | 175,501 | | | $ | 5,291 | | | $ | 1,529 | |
Ratios (as a percentage of average daily net assets): | | | | | | | | | | | | | | | | | | | | |
Expenses(3)(4)(5) | | | 1.40 | %(6) | | | 1.33 | %(6) | | | 1.25 | % | | | 1.25 | % | | | 1.25 | % |
Net investment income | | | 5.13 | % | | | 4.48 | % | | | 4.28 | % | | | 5.37 | % | | | 4.73 | % |
Portfolio Turnover of the Portfolio | | | 24 | % | | | 16 | % | | | 17 | % | | | 26 | % | | | 38 | % |
| (1) | Computed using average shares outstanding. |
| (2) | Returns are historical and are calculated by determining the percentage change in net asset value with all distributions reinvested and do not reflect the effect of sales charges. |
| (3) | Includes the Fund’s share of the Portfolio’s allocated expenses. |
| (4) | Excludes the effect of custody fee credits, if any, of less than 0.005%. |
| (5) | The administrator subsidized certain operating expenses (equal to 0.01%, 0.07%, 0.36%, 4.25% and 4.63% of average daily net assets for the years ended October 31, 2012, 2011, 2010, 2009 and 2008, respectively). |
| (6) | Includes interest and dividend expense primarily on securities sold short of 0.15% and 0.08% for the years ended October 31, 2012 and 2011, respectively. |
| | | | |
| | 10 | | See Notes to Financial Statements. |
Eaton Vance
Emerging Markets Local Income Fund
October 31, 2012
Financial Highlights — continued
| | | | | | | | | | | | |
| | | Class C | |
| | | Year Ended October 31, | | | Period Ended
October 31, 2010(1) | |
| | | 2012 | | | 2011 | | |
Net asset value — Beginning of period | | $ | 10.030 | | | $ | 10.840 | | | $ | 10.430 | |
| | | |
| Income (Loss) From Operations | | | | | | | | | | | | |
Net investment income(2) | | $ | 0.435 | | | $ | 0.395 | | | $ | 0.073 | |
Net realized and unrealized gain (loss) | | | 0.191 | | | | (0.497 | ) | | | 0.510 | |
| | | |
Total income (loss) from operations | | $ | 0.626 | | | $ | (0.102 | ) | | $ | 0.583 | |
| | | |
| Less Distributions | | | | | | | | | | | | |
From net investment income | | $ | (0.370 | ) | | $ | (0.477 | ) | | $ | (0.128 | ) |
From net realized gain | | | (0.050 | ) | | | — | | | | (0.026 | ) |
Tax return of capital | | | (0.256 | ) | | | (0.231 | ) | | | (0.019 | ) |
| | | |
Total distributions | | $ | (0.676 | ) | | $ | (0.708 | ) | | $ | (0.173 | ) |
| | | |
Net asset value — End of period | | $ | 9.980 | | | $ | 10.030 | | | $ | 10.840 | |
| | | |
Total Return(3) | | | 6.57 | % | | | (1.02 | )% | | | 5.63 | %(4) |
| | | |
| Ratios/Supplemental Data | | | | | | | | | | | | |
Net assets, end of period (000’s omitted) | | $ | 101,085 | | | $ | 99,260 | | | $ | 34,064 | |
Ratios (as a percentage of average daily net assets): | | | | | | | | | | | | |
Expenses(5)(6)(7) | | | 2.10 | %(8) | | | 2.03 | %(8) | | | 1.95 | %(9) |
Net investment income | | | 4.43 | % | | | 3.77 | % | | | 2.74 | %(9) |
Portfolio Turnover of the Portfolio | | | 24 | % | | | 16 | % | | | 17 | %(10) |
| (1) | For the period from commencement of operations on August 3, 2010 to October 31, 2010. |
| (2) | Computed using average shares outstanding. |
| (3) | Returns are historical and are calculated by determining the percentage change in net asset value with all distributions reinvested and do not reflect the effect of sales charges. |
| (5) | Includes the Fund’s share of the Portfolio’s allocated expenses. |
| (6) | Excludes the effect of custody fee credits, if any, of less than 0.005%. |
| (7) | The administrator subsidized certain operating expenses (equal to 0.01%, 0.07% and 0.36% of average daily net assets for the years ended October 31, 2012 and 2011 and for the period from commencement of operations on August 3, 2010 to October 31, 2010, respectively). |
| (8) | Includes interest and dividend expense primarily on securities sold short of 0.15% and 0.08% for the years ended October 31, 2012 and 2011, respectively. |
| (10) | For the Portfolio’s year ended October 31, 2010. |
| | | | |
| | 11 | | See Notes to Financial Statements. |
Eaton Vance
Emerging Markets Local Income Fund
October 31, 2012
Financial Highlights — continued
| | | | | | | | | | | | |
| | | Class I | |
| | | Year Ended October 31, | | | Period Ended
October 31, 2010(1) | |
| | | 2012 | | | 2011 | | |
Net asset value — Beginning of period | | $ | 10.060 | | | $ | 10.870 | | | $ | 10.060 | |
| | | |
| Income (Loss) From Operations | | | | | | | | | | | | |
Net investment income(2) | | $ | 0.535 | | | $ | 0.507 | | | $ | 0.438 | |
Net realized and unrealized gain (loss) | | | 0.191 | | | | (0.505 | ) | | | 1.115 | |
| | | |
Total income from operations | | $ | 0.726 | | | $ | 0.002 | | | $ | 1.553 | |
| | | |
| Less Distributions | | | | | | | | | | | | |
From net investment income | | $ | (0.429 | ) | | $ | (0.547 | ) | | $ | (0.624 | ) |
From net realized gain | | | (0.050 | ) | | | — | | | | (0.026 | ) |
Tax return of capital | | | (0.297 | ) | | | (0.265 | ) | | | (0.093 | ) |
| | | |
Total distributions | | $ | (0.776 | ) | | $ | (0.812 | ) | | $ | (0.743 | ) |
| | | |
Net asset value — End of period | | $ | 10.010 | | | $ | 10.060 | | | $ | 10.870 | |
| | | |
Total Return(3) | | | 7.64 | % | | | (0.03 | )% | | | 16.13 | %(4) |
| | | |
| Ratios/Supplemental Data | | | | | | | | | | | | |
Net assets, end of period (000’s omitted) | | $ | 243,728 | | | $ | 217,232 | | | $ | 46,791 | |
Ratios (as a percentage of average daily net assets): | | | | | | | | | | | | |
Expenses(5)(6)(7) | | | 1.10 | %(8) | | | 1.04 | %(8) | | | 0.95 | %(9) |
Net investment income | | | 5.43 | % | | | 4.81 | % | | | 4.51 | %(9) |
Portfolio Turnover of the Portfolio | | | 24 | % | | | 16 | % | | | 17 | %(10) |
| (1) | For the period from commencement of operations on November 30, 2009 to October 31, 2010. |
| (2) | Computed using average shares outstanding. |
| (3) | Returns are historical and are calculated by determining the percentage change in net asset value with all distributions reinvested. |
| (5) | Includes the Fund’s share of the Portfolio’s allocated expenses. |
| (6) | Excludes the effect of custody fee credits, if any, of less than 0.005%. |
| (7) | The administrator subsidized certain operating expenses (equal to 0.01%, 0.07% and 0.36% of average daily net assets for the years ended October 31, 2012 and 2011 and for the period from commencement of operations on November 30, 2009 to October 31, 2010, respectively). |
| (8) | Includes interest and dividend expense primarily on securities sold short of 0.15% and 0.09% for the years ended October 31, 2012 and 2011, respectively. |
| (10) | For the Portfolio’s year ended October 31, 2010. |
| | | | |
| | 12 | | See Notes to Financial Statements. |
Eaton Vance
Emerging Markets Local Income Fund
October 31, 2012
Notes to Financial Statements
1 Significant Accounting Policies
Eaton Vance Emerging Markets Local Income Fund (the Fund) is a non-diversified series of Eaton Vance Mutual Funds Trust (the Trust). The Trust is a Massachusetts business trust registered under the Investment Company Act of 1940, as amended (the 1940 Act), as an open-end management investment company. The Fund offers three classes of shares. Class A shares are generally sold subject to a sales charge imposed at time of purchase. Class C shares are sold at net asset value and are generally subject to a contingent deferred sales charge (see Notes 5). Class I shares are sold at net asset value and are not subject to a sales charge. Each class represents a pro-rata interest in the Fund, but votes separately on class-specific matters and (as noted below) is subject to different expenses. Realized and unrealized gains and losses are allocated daily to each class of shares based on the relative net assets of each class to the total net assets of the Fund. Net investment income, other than class-specific expenses, is allocated daily to each class of shares based upon the ratio of the value of each class’s paid shares to the total value of all paid shares. Each class of shares differs in its distribution plan and certain other class-specific expenses. The Fund invests all of its investable assets in interests in Emerging Markets Local Income Portfolio (the Portfolio), a Massachusetts business trust, having the same investment objective and policies as the Fund. The value of the Fund’s investment in the Portfolio reflects the Fund’s proportionate interest in the net assets of the Portfolio (78.5% at October 31, 2012). The performance of the Fund is directly affected by the performance of the Portfolio. The consolidated financial statements of the Portfolio, including the consolidated portfolio of investments, are included elsewhere in this report and should be read in conjunction with the Fund’s financial statements.
The following is a summary of significant accounting policies of the Fund. The policies are in conformity with accounting principles generally accepted in the United States of America.
A Investment Valuation — Valuation of securities by the Portfolio is discussed in Note 1A of the Portfolio’s Notes to Consolidated Financial Statements, which are included elsewhere in this report.
B Income — The Fund’s net investment income or loss consists of the Fund’s pro-rata share of the net investment income or loss of the Portfolio, less all actual and accrued expenses of the Fund.
C Federal Taxes — The Fund’s policy is to comply with the provisions of the Internal Revenue Code applicable to regulated investment companies and to distribute to shareholders each year substantially all of its net investment income, and all or substantially all of its net realized capital gains. Accordingly, no provision for federal income or excise tax is necessary.
During the year ended October 31, 2012, a capital loss carryforward of $8,648,347 was utilized to offset net realized gains by the Fund.
As of October 31, 2012, the Fund had no uncertain tax positions that would require financial statement recognition, de-recognition, or disclosure. The Fund files a U.S. federal income tax return annually after its fiscal year-end, which is subject to examination by the Internal Revenue Service for a period of three years from the date of filing.
D Expenses — The majority of expenses of the Trust are directly identifiable to an individual fund. Expenses which are not readily identifiable to a specific fund are allocated taking into consideration, among other things, the nature and type of expense and the relative size of the funds.
E Expense Reduction — State Street Bank and Trust Company (SSBT) serves as custodian of the Fund. Pursuant to the custodian agreement, SSBT receives a fee reduced by credits, which are determined based on the average daily cash balance the Fund maintains with SSBT. All credit balances, if any, used to reduce the Fund’s custodian fees are reported as a reduction of expenses in the Statement of Operations.
F Use of Estimates — The preparation of the financial statements in conformity with accounting principles generally accepted in the United States of America requires management to make estimates and assumptions that affect the reported amounts of assets and liabilities at the date of the financial statements and the reported amounts of income and expense during the reporting period. Actual results could differ from those estimates.
G Indemnifications — Under the Trust’s organizational documents, its officers and Trustees may be indemnified against certain liabilities and expenses arising out of the performance of their duties to the Fund. Under Massachusetts law, if certain conditions prevail, shareholders of a Massachusetts business trust (such as the Trust) could be deemed to have personal liability for the obligations of the Trust. However, the Trust’s Declaration of Trust contains an express disclaimer of liability on the part of Fund shareholders and the By-laws provide that the Trust shall assume the defense on behalf of any Fund shareholders. Moreover, the By-laws also provide for indemnification out of Fund property of any shareholder held personally liable solely by reason of being or having been a shareholder for all loss or expense arising from such liability. Additionally, in the normal course of business, the Fund enters into agreements with service providers that may contain indemnification clauses. The Fund’s maximum exposure under these arrangements is unknown as this would involve future claims that may be made against the Fund that have not yet occurred.
H Other — Investment transactions are accounted for on a trade date basis. Dividends to shareholders are recorded on the ex-dividend date.
2 Distributions to Shareholders
The Fund declares dividends daily to shareholders of record at the time of declaration. Distributions are generally paid monthly. Distributions of realized capital gains (reduced by available capital loss carryforwards from prior years, if any) are made at least annually. Distributions are declared separately for
Eaton Vance
Emerging Markets Local Income Fund
October 31, 2012
Notes to Financial Statements — continued
each class of shares. Shareholders may reinvest income and capital gain distributions in additional shares of the same class of the Fund at the net asset value as of the reinvestment date or, at the election of the shareholder, receive distributions in cash. The Fund distinguishes between distributions on a tax basis and a financial reporting basis. Accounting principles generally accepted in the United States of America require that only distributions in excess of tax basis earnings and profits be reported in the financial statements as a return of capital. Permanent differences between book and tax accounting relating to distributions are reclassified to paid-in capital. For tax purposes, distributions from short-term capital gains and current year earnings and profits attributable to realized gains are considered to be from ordinary income.
The tax character of distributions declared for the years ended October 31, 2012 and October 31, 2011 was as follows:
| | | | | | | | |
| | | Year Ended October 31, | |
| | | 2012 | | | 2011 | |
| | |
Distributions declared from: | | | | | | | | |
Ordinary income | | $ | 24,699,037 | | | $ | 25,211,624 | |
Long-term capital gains | | $ | 2,958,847 | | | $ | — | |
Tax return of capital | | $ | 17,082,960 | | | $ | 12,235,639 | |
During the year ended October 31, 2012, accumulated net realized loss was decreased by $14,800,340, accumulated undistributed net investment income was decreased by $5,048,178 and paid-in capital was decreased by $9,752,162 due to differences between book and tax accounting, primarily for swap contracts, paydown gain (loss), premium amortization, foreign currency gain (loss), futures contracts, options contracts and the Portfolio’s investment in a subsidiary. These reclassifications had no effect on the net assets or net asset value per share of the Fund.
As of October 31, 2012, the components of distributable earnings (accumulated losses) and unrealized appreciation (depreciation) on a tax basis were as follows:
| | | | |
Net unrealized depreciation | | $ | (11,850,635 | ) |
Other temporary differences | | $ | (745,188 | ) |
The differences between components of distributable earnings (accumulated losses) on a tax basis and the amounts reflected in the Statement of Assets and Liabilities are primarily due to the timing of recognizing distributions to shareholders, swap contracts, wash sales, partnership allocations, foreign currency transactions, tax accounting for straddle transactions, and premium amortization.
3 Investment Adviser Fee and Other Transactions with Affiliates
The investment adviser fee is earned by Eaton Vance Management (EVM) as compensation for investment advisory services rendered to the Fund. The fee is computed at an annual rate of 0.65% of the Fund’s average daily net assets that are not invested in other investment companies for which EVM or its affiliates serve as investment adviser or administrator (“Investable Assets”) up to $1 billion and is payable monthly. On Investable Assets of $1 billion and over, the annual fee is reduced. For the year ended October 31, 2012, the Fund incurred no investment adviser fee on Investable Assets. To the extent the Fund’s assets are invested in the Portfolio, the Fund is allocated its share of the Portfolio’s adviser fee. The Portfolio has engaged Boston Management and Research (BMR), a subsidiary of EVM, to render investment advisory services. See Note 2 of the Portfolio’s Notes to Consolidated Financial Statements which are included elsewhere in this report. EVM also serves as the administrator of the Fund, but receives no compensation. EVM has agreed to reimburse the Fund’s expenses to the extent that total annual operating expenses (relating to ordinary operating expenses only) exceed 1.25%, 1.95% and 0.95% of the Fund’s average daily net assets for Class A, Class C and Class I, respectively. This agreement may be changed or terminated after February 28, 2013. Pursuant to this agreement, EVM was allocated $84,637 of the Fund’s operating expenses for the year ended October 31, 2012.
EVM serves as the sub-transfer agent of the Fund and receives from the transfer agent an aggregate fee based upon the actual expenses incurred by EVM in the performance of these services. For the year ended October 31, 2012, EVM earned $10,792 in sub-transfer agent fees. The Fund was informed that Eaton Vance Distributors, Inc. (EVD), an affiliate of EVM and the Fund’s principal underwriter, received $112,413 as its portion of the sales charge on sales of Class A shares for the year ended October 31, 2012. EVD also received distribution and service fees from Class A and Class C shares (see Note 4) and contingent deferred sales charges (see Note 5).
Trustees and officers of the Fund who are members of EVM’s or BMR’s organizations receive remuneration for their services to the Fund out of the investment adviser fee. Certain officers and Trustees of the Fund and the Portfolio are officers of the above organizations.
Eaton Vance
Emerging Markets Local Income Fund
October 31, 2012
Notes to Financial Statements — continued
4 Distribution Plans
The Fund has in effect a distribution plan for Class A shares (Class A Plan) pursuant to Rule 12b-1 under the 1940 Act. Pursuant to the Class A Plan, the Fund pays EVD a distribution and service fee of 0.30% per annum of its average daily net assets attributable to Class A shares for distribution services and facilities provided to the Fund by EVD, as well as for personal services and/or the maintenance of shareholder accounts. Distribution and service fees paid or accrued to EVD for the year ended October 31, 2012 amounted to $805,932 for Class A shares.
The Fund also has in effect a distribution plan for Class C shares (Class C Plan) pursuant to Rule 12b-1 under the 1940 Act. Pursuant to the Class C Plan, the Fund pays EVD amounts equal to 0.75% per annum of its average daily net assets attributable to Class C shares for providing ongoing distribution services and facilities to the Fund. For the year ended October 31, 2012, the Fund paid or accrued to EVD $734,062 for Class C shares.
Pursuant to the Class C Plan, the Fund also makes payments of service fees to EVD, financial intermediaries and other persons in amounts equal to 0.25% per annum of its average daily net assets attributable to that class. Service fees paid or accrued are for personal services and/or the maintenance of shareholder accounts. They are separate and distinct from the sales commissions and distribution fees payable to EVD. Service fees paid or accrued for the year ended October 31, 2012 amounted to $244,687 for Class C shares.
5 Contingent Deferred Sales Charges
A contingent deferred sales charge (CDSC) of 1% generally is imposed on redemptions of Class C shares made within one year of purchase. Class A shares may be subject to a 1% CDSC if redeemed within 18 months of purchase (depending on the circumstances of purchase). Generally, the CDSC is based upon the lower of the net asset value at date of redemption or date of purchase. No charge is levied on shares acquired by reinvestment of dividends or capital gain distributions. No CDSC is levied on shares which have been sold to EVM or its affiliates or to their respective employees or clients and may be waived under certain other limited conditions. For the year ended October 31, 2012, the Fund was informed that EVD received approximately $77,000 and $6,000 of CDSCs paid by Class A and Class C shareholders, respectively.
6 Investment Transactions
For the year ended October 31, 2012, increases and decreases in the Fund’s investment in the Portfolio aggregated $96,085,220 and $152,857,858, respectively.
7 Shares of Beneficial Interest
The Fund’s Declaration of Trust permits the Trustees to issue an unlimited number of full and fractional shares of beneficial interest (without par value). Such shares may be issued in a number of different series (such as the Fund) and classes. Transactions in Fund shares were as follows:
| | | | | | | | |
| | | Year Ended October 31, | |
| Class A | | 2012 | | | 2011 | |
| | |
Sales | | | 9,941,803 | | | | 31,606,118 | |
Issued to shareholders electing to receive payments of distributions in Fund shares | | | 1,840,583 | | | | 1,584,723 | |
Redemptions | | | (16,163,479 | ) | | | (18,743,298 | ) |
| | |
Net increase (decrease) | | | (4,381,093 | ) | | | 14,447,543 | |
| | |
| | | | | | | | |
| | | Year Ended October 31, | |
| Class C | | 2012 | | | 2011 | |
| | |
Sales | | | 3,147,746 | | | | 7,597,595 | |
Issued to shareholders electing to receive payments of distributions in Fund shares | | | 535,639 | | | | 367,942 | |
Redemptions | | | (3,449,990 | ) | | | (1,211,880 | ) |
| | |
Net increase | | | 233,395 | | | | 6,753,657 | |
| | |
| | | | | | | | |
Eaton Vance
Emerging Markets Local Income Fund
October 31, 2012
Notes to Financial Statements — continued
| | | | | | | | |
| | | Year Ended October 31, | |
| Class I | | 2012 | | | 2011 | |
| | |
Sales | | | 14,947,859 | | | | 24,542,760 | |
Issued to shareholders electing to receive payments of distributions in Fund shares | | | 1,142,432 | | | | 766,509 | |
Redemptions | | | (13,340,483 | ) | | | (8,011,451 | ) |
| | |
Net increase | | | 2,749,808 | | | | 17,297,818 | |
Eaton Vance
Emerging Markets Local Income Fund
October 31, 2012
Report of Independent Registered Public Accounting Firm
To the Trustees of Eaton Vance Mutual Funds Trust and Shareholders of Eaton Vance Emerging Markets Local Income Fund:
We have audited the accompanying statement of assets and liabilities of Eaton Vance Emerging Markets Local Income Fund (the “Fund”) (one of the funds constituting Eaton Vance Mutual Funds Trust) as of October 31, 2012, and the related statement of operations for the year then ended, the statements of changes in net assets for each of the two years in the period then ended, and the financial highlights for each of the five years in the period then ended. These financial statements and financial highlights are the responsibility of the Fund’s management. Our responsibility is to express an opinion on these financial statements and financial highlights based on our audits.
We conducted our audits in accordance with the standards of the Public Company Accounting Oversight Board (United States). Those standards require that we plan and perform the audit to obtain reasonable assurance about whether the financial statements and financial highlights are free of material misstatement. The Fund is not required to have, nor were we engaged to perform, an audit of its internal control over financial reporting. Our audits included consideration of internal control over financial reporting as a basis for designing audit procedures that are appropriate in the circumstances, but not for the purpose of expressing an opinion on the effectiveness of the Fund’s internal control over financial reporting. Accordingly, we express no such opinion. An audit also includes examining, on a test basis, evidence supporting the amounts and disclosures in the financial statements, assessing the accounting principles used and significant estimates made by management, as well as evaluating the overall financial statement presentation. We believe that our audits provide a reasonable basis for our opinion.
In our opinion, such financial statements and financial highlights referred to above present fairly, in all material respects, the financial position of Eaton Vance Emerging Markets Local Income Fund as of October 31, 2012, the results of its operations for the year then ended, the changes in its net assets for each of the two years in the period then ended, and the financial highlights for each of the five years in the period then ended, in conformity with accounting principles generally accepted in the United States of America.
DELOITTE & TOUCHE LLP
Boston, Massachusetts
December 21, 2012
Eaton Vance
Emerging Markets Local Income Fund
October 31, 2012
Federal Tax Information (Unaudited)
The Form 1099-DIV you receive in January 2013 will show the tax status of all distributions paid to your account in calendar year 2012. Shareholders are advised to consult their own tax adviser with respect to the tax consequences of their investment in the Fund. As required by the Internal Revenue Code and/or regulations, shareholders must be notified regarding the status of the foreign tax credit and capital gains dividends.
Foreign Tax Credit. The Fund paid foreign taxes of $774,565 and recognized foreign source income of $37,954,091.
Capital Gains Dividends. The Fund hereby designates as a capital gain dividend with respect to the taxable year ended October 31, 2012, $3,690,126 or, if subsequently determined to be different, the net capital gain of such year.
Emerging Markets Local Income Portfolio
October 31, 2012
Consolidated Portfolio of Investments
| | | | | | | | | | |
| Foreign Government Bonds — 78.4% | |
| | | |
| | | | | | | | | | |
| Security | | | | Principal
Amount | | | Value | |
| | | | | | | | | | |
|
Albania — 0.6% | |
Republic of Albania, 7.50%, 11/4/15 | | EUR | | | 3,500,000 | | | $ | 4,630,656 | |
| | |
Total Albania | | | $ | 4,630,656 | |
| | |
|
Bermuda — 0.1% | |
Government of Bermuda, 5.603%, 7/20/20(1) | | USD | | | 900,000 | | | $ | 1,063,700 | |
| | |
Total Bermuda | | | $ | 1,063,700 | |
| | |
| | | |
Bosnia and Herzegovina — 0.3% | | | | | | | | | | |
Bosnia & Herzegovina Government Bond, 2.50%, 8/31/14 | | BAM | | | 16,594 | | | $ | 9,842 | |
Bosnia & Herzegovina Government Bond, 2.50%, 9/30/14 | | BAM | | | 86,137 | | | | 51,752 | |
Bosnia & Herzegovina Government Bond, 2.50%, 3/31/15 | | BAM | | | 76,307 | | | | 42,982 | |
Bosnia & Herzegovina Government Bond, 2.50%, 8/31/15 | | BAM | | | 120,409 | | | | 66,782 | |
Republic of Srpska, 1.50%, 6/30/23 | | BAM | | | 262,652 | | | | 93,124 | |
Republic of Srpska, 1.50%, 10/30/23 | | BAM | | | 193,820 | | | | 65,379 | |
Republic of Srpska, 1.50%, 12/15/23 | | BAM | | | 47,963 | | | | 16,055 | |
Republic of Srpska, 1.50%, 5/31/25 | | BAM | | | 5,336,944 | | | | 1,547,730 | |
Republic of Srpska, 1.50%, 6/9/25 | | BAM | | | 533,631 | | | | 156,452 | |
| | |
Total Bosnia and Herzegovina | | | $ | 2,050,098 | |
| | |
| | | |
Brazil — 5.7% | | | | | | | | | | |
Letra do Tesouro Nacional, 0.00%, 1/1/15 | | BRL | | | 11,193,000 | | | $ | 4,677,214 | |
Nota do Tesouro Nacional, 6.00%, 5/15/15(2) | | BRL | | | 3,302,663 | | | | 1,778,583 | |
Nota do Tesouro Nacional, 10.00%, 1/1/14 | | BRL | | | 23,509,000 | | | | 11,889,636 | |
Nota do Tesouro Nacional, 10.00%, 1/1/17 | | BRL | | | 21,314,000 | | | | 11,045,019 | |
Nota do Tesouro Nacional, 10.00%, 1/1/21 | | BRL | | | 16,127,000 | | | | 8,376,146 | |
Republic of Brazil, 10.25%, 1/10/28 | | BRL | | | 620,000 | | | | 396,839 | |
Republic of Brazil, 12.50%, 1/5/16 | | BRL | | | 10,030,000 | | | | 6,205,015 | |
| | |
Total Brazil | | | $ | 44,368,452 | |
| | |
| | | |
Chile — 0.2% | | | | | | | | | | |
Government of Chile, 6.00%, 3/1/18 | | CLP | | | 300,000,000 | | | $ | 643,652 | |
Government of Chile, 6.00%, 1/1/20 | | CLP | | | 465,000,000 | | | | 1,006,352 | |
| | |
Total Chile | | | $ | 1,650,004 | |
| | |
| | | |
Colombia — 3.9% | | | | | | | | | | |
Republic of Colombia, 7.75%, 4/14/21 | | COP | | | 6,301,000,000 | | | $ | 4,360,012 | |
Republic of Colombia, 9.85%, 6/28/27 | | COP | | | 8,093,000,000 | | | | 6,914,394 | |
Republic of Colombia, 12.00%, 10/22/15 | | COP | | | 19,718,000,000 | | | | 13,345,265 | |
| | | | | | | | | | |
| Security | | | | Principal
Amount | | | Value | |
| | | | | | | | | | |
|
Colombia (continued) | |
Titulos De Tesoreria B, 9.25%, 5/14/14 | | COP | | | 2,500,000,000 | | | $ | 1,452,561 | |
Titulos De Tesoreria B, 11.25%, 10/24/18 | | COP | | | 5,461,000,000 | | | | 3,831,538 | |
| | |
Total Colombia | | | $ | 29,903,770 | |
| | |
| | | |
Costa Rica — 0.0%(3) | | | | | | | | | | |
Titulo Propiedad Ud, 1.00%, 1/12/22(2) | | CRC | | | 56,227,473 | | | $ | 87,009 | |
Titulo Propiedad Ud, 1.63%, 7/13/16(2) | | CRC | | | 6,316,817 | | | | 11,959 | |
| | |
Total Costa Rica | | | $ | 98,968 | |
| | |
| | | |
Cyprus — 0.2% | | | | | | | | | | |
Republic of Cyprus, 3.75%, 6/3/13 | | EUR | | | 1,110,000 | | | $ | 1,330,821 | |
Republic of Cyprus, 4.625%, 2/3/20 | | EUR | | | 600,000 | | | | 514,442 | |
| | |
Total Cyprus | | | $ | 1,845,263 | |
| | |
| | | |
Dominican Republic — 0.4% | | | | | | | | | | |
Dominican Republic “Bonos Internos” Total Return Linked Bond (Citibank NA), 13.00%, 2/25/13(4) | | DOP | | | 107,000,000 | | | $ | 2,742,794 | |
| | |
Total Dominican Republic | | | $ | 2,742,794 | |
| | |
| | | |
Georgia — 0.6% | | | | | | | | | | |
Georgia Treasury Bond, 7.40%, 4/19/14 | | GEL | | | 1,994,000 | | | $ | 1,208,957 | |
Georgia Treasury Bond, 8.90%, 1/12/14 | | GEL | | | 850,000 | | | | 523,266 | |
Georgia Treasury Bond, 9.10%, 12/8/13 | | GEL | | | 370,000 | | | | 227,969 | |
Georgia Treasury Bond, 9.80%, 4/26/17 | | GEL | | | 403,000 | | | | 260,024 | |
Georgia Treasury Bond, 11.30%, 1/26/17 | | GEL | | | 500,000 | | | | 337,497 | |
Georgia Treasury Bond, 12.20%, 5/13/13 | | GEL | | | 1,484,000 | | | | 920,110 | |
Georgia Treasury Bond, 12.80%, 2/10/13 | | GEL | | | 500,000 | | | | 306,456 | |
Georgia Treasury Bond, 13.80%, 12/16/12 | | GEL | | | 1,246,000 | | | | 757,948 | |
| | |
Total Georgia | | | $ | 4,542,227 | |
| | |
| | | |
Germany — 0.8% | | | | | | | | | | |
Bundesrepublik Deutschland, 4.75%, 7/4/34 | | EUR | | | 3,150,000 | | | $ | 5,859,687 | |
| | |
Total Germany | | | $ | 5,859,687 | |
| | |
| | | |
Ghana — 0.1% | | | | | | | | | | |
Ghana Government Bond, 23.00%, 8/21/17 | | GHS | | | 1,400,000 | | | $ | 837,795 | |
| | |
Total Ghana | | | $ | 837,795 | |
| | |
| | | |
Hungary — 5.9% | | | | | | | | | | |
Hungary Government Bond, 5.50%, 2/12/14 | | HUF | | | 2,120,600,000 | | | $ | 9,666,830 | |
Hungary Government Bond, 5.50%, 2/12/16 | | HUF | | | 367,700,000 | | | | 1,650,751 | |
Hungary Government Bond, 6.00%, 11/24/23 | | HUF | | | 195,000,000 | | | | 824,981 | |
| | | | |
| | 19 | | See Notes to Consolidated Financial Statements. |
Emerging Markets Local Income Portfolio
October 31, 2012
Consolidated Portfolio of Investments — continued
| | | | | | | | | | |
| Security | | | | Principal
Amount | | | Value | |
| | | | | | | | | | |
|
Hungary (continued) | |
Hungary Government Bond, 6.50%, 6/24/19 | | HUF | | | 579,100,000 | | | $ | 2,643,773 | |
Hungary Government Bond, 6.75%, 2/12/13 | | HUF | | | 505,300,000 | | | | 2,310,421 | |
Hungary Government Bond, 6.75%, 2/24/17 | | HUF | | | 1,554,520,000 | | | | 7,217,809 | |
Hungary Government Bond, 6.75%, 11/24/17 | | HUF | | | 1,123,980,000 | | | | 5,231,451 | |
Hungary Government Bond, 7.00%, 6/24/22 | | HUF | | | 435,000,000 | | | | 2,005,057 | |
Hungary Government Bond, 7.50%, 10/24/13 | | HUF | | | 796,000,000 | | | | 3,699,066 | |
Hungary Government Bond, 7.50%, 11/12/20 | | HUF | | | 668,800,000 | | | | 3,203,239 | |
Hungary Government Bond, 8.00%, 2/12/15 | | HUF | | | 455,000,000 | | | | 2,170,503 | |
National Bank of Hungary, 8.875%, 11/1/13 | | USD | | | 710,000 | | | | 729,023 | |
Republic of Hungary, 3.50%, 7/18/16 | | EUR | | | 1,362,000 | | | | 1,700,885 | |
Republic of Hungary, 4.375%, 7/4/17 | | EUR | | | 374,000 | | | | 473,954 | |
Republic of Hungary, 4.50%, 1/29/14 | | EUR | | | 1,539,000 | | | | 2,020,666 | |
| | |
Total Hungary | | | $ | 45,548,409 | |
| | |
| | | |
Indonesia — 9.5% | | | | | | | | | | |
Indonesia Government Bond, 7.00%, 5/15/27 | | IDR | | | 31,377,000,000 | | | $ | 3,534,608 | |
Indonesia Government Bond, 7.375%, 9/15/16 | | IDR | | | 74,748,000,000 | | | | 8,360,873 | |
Indonesia Government Bond, 8.25%, 7/15/21 | | IDR | | | 4,730,000,000 | | | | 578,819 | |
Indonesia Government Bond, 8.25%, 6/15/32 | | IDR | | | 30,296,000,000 | | | | 3,783,452 | |
Indonesia Government Bond, 8.375%, 9/15/26 | | IDR | | | 14,100,000,000 | | | | 1,776,262 | |
Indonesia Government Bond, 9.00%, 9/15/13 | | IDR | | | 26,300,000,000 | | | | 2,834,195 | |
Indonesia Government Bond, 9.00%, 9/15/18 | | IDR | | | 13,080,000,000 | | | | 1,603,122 | |
Indonesia Government Bond, 9.50%, 6/15/15 | | IDR | | | 33,485,000,000 | | | | 3,842,363 | |
Indonesia Government Bond, 9.50%, 7/15/23 | | IDR | | | 35,245,000,000 | | | | 4,733,582 | |
Indonesia Government Bond, 9.50%, 7/15/31 | | IDR | | | 118,958,000,000 | | | | 16,533,985 | |
Indonesia Government Bond, 9.50%, 5/15/41 | | IDR | | | 5,702,000,000 | | | | 810,331 | |
Indonesia Government Bond, 10.00%, 7/15/17 | | IDR | | | 10,200,000,000 | | | | 1,265,153 | |
Indonesia Government Bond, 10.00%, 9/15/24 | | IDR | | | 22,100,000,000 | | | | 3,086,062 | |
Indonesia Government Bond, 10.00%, 2/15/28 | | IDR | | | 8,560,000,000 | | | | 1,218,274 | |
Indonesia Government Bond, 10.25%, 7/15/27 | | IDR | | | 22,325,000,000 | | | | 3,209,089 | |
Indonesia Government Bond, 10.50%, 8/15/30 | | IDR | | | 30,978,000,000 | | | | 4,634,606 | |
Indonesia Government Bond, 10.50%, 7/15/38 | | IDR | | | 10,900,000,000 | | | | 1,671,031 | |
Indonesia Government Bond, 11.00%, 11/15/20 | | IDR | | | 14,560,000,000 | | | | 2,034,366 | |
Indonesia Government Bond, 11.00%, 9/15/25 | | IDR | | | 16,440,000,000 | | | | 2,453,279 | |
Indonesia Government Bond, 11.25%, 5/15/14 | | IDR | | | 16,743,000,000 | | | | 1,903,218 | |
Indonesia Government Bond, 11.50%, 9/15/19 | | IDR | | | 25,200,000,000 | | | | 3,510,201 | |
| | |
Total Indonesia | | | $ | 73,376,871 | |
| | |
| | | |
Malaysia — 4.4% | | | | | | | | | | |
Malaysia Government Bond, 3.502%, 5/31/27 | | MYR | | | 4,125,000 | | | $ | 1,329,149 | |
Malaysia Government Bond, 3.741%, 2/27/15 | | MYR | | | 24,076,000 | | | | 8,027,670 | |
Malaysia Government Bond, 3.814%, 2/15/17 | | MYR | | | 7,003,000 | | | | 2,358,209 | |
Malaysia Government Bond, 4.012%, 9/15/17 | | MYR | | | 10,786,000 | | | | 3,665,678 | |
Malaysia Government Bond, 4.16%, 7/15/21 | | MYR | | | 26,063,000 | | | | 8,969,531 | |
| | | | | | | | | | |
| Security | | | | Principal
Amount | | | Value | |
| | | | | | | | | | |
| | | |
Malaysia (continued) | | | | | | | | | | |
Malaysia Government Bond, 4.24%, 2/7/18 | | MYR | | | 15,775,000 | | | $ | 5,423,803 | |
Malaysia Government Bond, 4.378%, 11/29/19 | | MYR | | | 3,750,000 | | | | 1,308,218 | |
Malaysia Government Bond, 4.392%, 4/15/26 | | MYR | | | 4,047,000 | | | | 1,437,379 | |
Malaysia Government Bond, 4.498%, 4/15/30 | | MYR | | | 3,480,000 | | | | 1,244,666 | |
| | |
Total Malaysia | | | $ | 33,764,303 | |
| | |
| | | |
Mexico — 4.4% | | | | | | | | | | |
Mexican Bonos, 7.25%, 12/15/16 | | MXN | | | 20,800,000 | | | $ | 1,716,726 | |
Mexican Bonos, 7.50%, 6/3/27 | | MXN | | | 30,480,000 | | | | 2,669,530 | |
Mexican Bonos, 7.75%, 12/14/17 | | MXN | | | 9,500,000 | | | | 811,027 | |
Mexican Bonos, 8.00%, 12/19/13 | | MXN | | | 61,900,000 | | | | 4,899,635 | |
Mexican Bonos, 8.00%, 6/11/20 | | MXN | | | 21,018,000 | | | | 1,868,167 | |
Mexican Bonos, 8.50%, 12/13/18 | | MXN | | | 6,832,600 | | | | 608,016 | |
Mexican Bonos, 8.50%, 5/31/29 | | MXN | | | 39,000,000 | | | | 3,703,007 | |
Mexican Bonos, 8.50%, 11/18/38 | | MXN | | | 36,100,000 | | | | 3,425,985 | |
Mexican Bonos, 9.50%, 12/18/14 | | MXN | | | 23,060,000 | | | | 1,923,458 | |
Mexican Bonos, 10.00%, 12/5/24 | | MXN | | | 63,550,000 | | | | 6,716,401 | |
Mexican Bonos, 10.00%, 11/20/36 | | MXN | | | 56,570,000 | | | | 6,125,200 | |
| | |
Total Mexico | | | $ | 34,467,152 | |
| | |
| | | |
New Zealand — 2.8% | | | | | | | | | | |
New Zealand Government Bond, 5.00%, 3/15/19 | | NZD | | | 1,570,000 | | | $ | 1,438,715 | |
New Zealand Government Bond, 5.50%, 4/15/23 | | NZD | | | 7,032,000 | | | | 6,794,025 | |
New Zealand Government Bond, 6.00%, 12/15/17 | | NZD | | | 1,570,000 | | | | 1,486,702 | |
New Zealand Government Bond, 6.00%, 5/15/21 | | NZD | | | 12,363,000 | | | | 12,200,038 | |
| | |
Total New Zealand | | | $ | 21,919,480 | |
| | |
| | | |
Nigeria — 0.4% | | | | | | | | | | |
Nigeria Treasury Bond, 16.00%, 6/29/19 | | NGN | | | 251,000,000 | | | $ | 1,797,720 | |
Nigeria Treasury Bond, 16.39%, 1/27/22 | | NGN | | | 225,472,000 | | | | 1,669,506 | |
| | |
Total Nigeria | | | $ | 3,467,226 | |
| | |
| | | |
Peru — 2.6% | | | | | | | | | | |
Republic of Peru, 6.90%, 8/12/37(1) | | PEN | | | 2,367,000 | | | $ | 1,125,318 | |
Republic of Peru, 6.90%, 8/12/37 | | PEN | | | 2,700,000 | | | | 1,283,633 | |
Republic of Peru, 6.90%, 8/12/37(5) | | PEN | | | 4,730,000 | | | | 2,248,735 | |
Republic of Peru, 6.95%, 8/12/31 | | PEN | | | 2,000,000 | | | | 942,157 | |
Republic of Peru, 7.84%, 8/12/20 | | PEN | | | 1,782,000 | | | | 852,664 | |
Republic of Peru, 7.84%, 8/12/20(5) | | PEN | | | 15,334,000 | | | | 7,337,125 | |
Republic of Peru, 8.20%, 8/12/26 | | PEN | | | 5,775,000 | | | | 3,053,742 | |
Republic of Peru, 8.60%, 8/12/17 | | PEN | | | 5,305,000 | | | | 2,533,258 | |
Republic of Peru, 9.91%, 5/5/15 | | PEN | | | 1,760,000 | | | | 790,795 | |
| | |
Total Peru | | | $ | 20,167,427 | |
| | |
| | | | |
| | 20 | | See Notes to Consolidated Financial Statements. |
Emerging Markets Local Income Portfolio
October 31, 2012
Consolidated Portfolio of Investments — continued
| | | | | | | | | | |
| Security | | | | Principal
Amount | | | Value | |
| | | | | | | | | | |
| | | |
Philippines — 1.1% | | | | | | | | | | |
Republic of the Philippines, 4.95%, 1/15/21 | | PHP | | | 139,000,000 | | | $ | 3,719,886 | |
Republic of the Philippines, 6.25%, 1/14/36 | | PHP | | | 150,000,000 | | | | 4,280,675 | |
Republic of the Philippines, 8.75%, 3/3/13 | | PHP | | | 28,430,000 | | | | 709,070 | |
| | |
Total Philippines | | | $ | 8,709,631 | |
| | |
| | | |
Poland — 0.6% | | | | | | | | | | |
Poland Government Bond, 5.25%, 10/25/17 | | PLN | | | 3,575,000 | | | $ | 1,176,624 | |
Poland Government Bond, 5.75%, 9/23/22 | | PLN | | | 5,420,000 | | | | 1,860,844 | |
Poland Government Bond, 6.25%, 10/24/15 | | PLN | | | 2,900,000 | | | | 966,862 | |
Republic of Poland, 3.00%, 3/17/23 | | USD | | | 662,000 | | | | 656,755 | |
| | |
Total Poland | | | $ | 4,661,085 | |
| | |
| | | |
Russia — 7.8% | | | | | | | | | | |
Russia Foreign Bond, 7.85%, 3/10/18(1) | | RUB | | | 630,000,000 | | | $ | 21,557,045 | |
Russia Foreign Bond, 7.85%, 3/10/18(5) | | RUB | | | 250,000,000 | | | | 8,554,383 | |
Russia Government Bond, 7.00%, 6/3/15 | | RUB | | | 240,063,000 | | | | 7,718,019 | |
Russia Government Bond, 7.10%, 3/13/14 | | RUB | | | 449,000,000 | | | | 14,432,089 | |
Russia Government Bond, 7.35%, 1/20/16 | | RUB | | | 68,000,000 | | | | 2,203,037 | |
Russia Government Bond, 7.40%, 6/14/17 | | RUB | | | 103,974,000 | | | | 3,375,582 | |
Russia Government Bond, 7.60%, 4/14/21 | | RUB | | | 88,535,000 | | | | 2,887,499 | |
| | |
Total Russia | | | $ | 60,727,654 | |
| | |
| | | |
Serbia — 3.0% | | | | | | | | | | |
Serbia Treasury Bill, 0.00%, 11/22/12 | | RSD | | | 401,520,000 | | | $ | 4,547,510 | |
Serbia Treasury Bill, 0.00%, 4/4/13 | | RSD | | | 237,360,000 | | | | 2,563,840 | |
Serbia Treasury Bill, 0.00%, 4/25/13 | | RSD | | | 539,100,000 | | | | 5,790,453 | |
Serbia Treasury Bill, 0.00%, 11/8/13 | | RSD | | | 202,000,000 | | | | 2,017,594 | |
Serbia Treasury Bill, 0.00%, 12/12/13 | | RSD | | | 673,400,000 | | | | 6,622,499 | |
Serbia Treasury Bill, 0.00%, 1/30/14 | | RSD | | | 76,900,000 | | | | 739,019 | |
Serbia Treasury Bill, 0.00%, 3/13/14 | | RSD | | | 23,880,000 | | | | 224,237 | |
Serbia Treasury Bond, 10.00%, 4/27/15 | | RSD | | | 109,590,000 | | | | 1,105,168 | |
| | |
Total Serbia | | | $ | 23,610,320 | |
| | |
| | | |
Slovenia — 0.7% | | | | | | | | | | |
Republic of Slovenia, 4.125%, 1/26/20 | | EUR | | | 300,000 | | | $ | 361,237 | |
Republic of Slovenia, 4.375%, 1/18/21 | | EUR | | | 2,650,000 | | | | 3,180,621 | |
Republic of Slovenia, 5.50%, 10/26/22(1) | | USD | | | 1,852,000 | | | | 1,859,068 | |
| | |
Total Slovenia | | | $ | 5,400,926 | |
| | |
| | | |
South Africa — 5.5% | | | | | | | | | | |
Republic of South Africa, 6.25%, 3/31/36 | | ZAR | | | 64,175,000 | | | $ | 5,725,898 | |
Republic of South Africa, 6.75%, 3/31/21 | | ZAR | | | 45,745,000 | | | | 5,308,533 | |
Republic of South Africa, 7.00%, 2/28/31 | | ZAR | | | 19,600,000 | | | | 1,987,239 | |
| | | | | | | | | | |
| Security | | | | Principal
Amount | | | Value | |
| | | | | | | | | | |
| | | |
South Africa (continued) | | | | | | | | | | |
Republic of South Africa, 7.25%, 1/15/20 | | ZAR | | | 32,400,000 | | | $ | 3,905,275 | |
Republic of South Africa, 7.50%, 1/15/14 | | ZAR | | | 34,500,000 | | | | 4,088,588 | |
Republic of South Africa, 8.25%, 9/15/17 | | ZAR | | | 19,430,000 | | | | 2,468,292 | |
Republic of South Africa, 8.75%, 12/21/14 | | ZAR | | | 29,990,000 | | | | 3,721,103 | |
Republic of South Africa, 10.50%, 12/21/26 | | ZAR | | | 30,356,000 | | | | 4,331,911 | |
Republic of South Africa, 13.50%, 9/15/15 | | ZAR | | | 81,005,000 | | | | 11,315,457 | |
| | |
Total South Africa | | | $ | 42,852,296 | |
| | |
| | | |
Sri Lanka — 0.6% | | | | | | | | | | |
Republic of Sri Lanka, 5.875%, 7/25/22(1) | | USD | | | 1,140,000 | | | $ | 1,266,483 | |
Republic of Sri Lanka, 6.25%, 10/4/20(1) | | USD | | | 950,000 | | | | 1,068,750 | |
Republic of Sri Lanka, 6.25%, 10/4/20(5) | | USD | | | 390,000 | | | | 438,750 | |
Sri Lanka Government Bond, 8.50%, 1/15/13 | | LKR | | | 170,340,000 | | | | 1,300,330 | |
Sri Lanka Government Bond, 10.50%, 4/1/13 | | LKR | | | 49,400,000 | | | | 377,092 | |
| | |
Total Sri Lanka | | | $ | 4,451,405 | |
| | |
| | | |
Thailand — 3.6% | | | | | | | | | | |
Kingdom of Thailand, 3.125%, 12/11/15 | | THB | | | 120,041,000 | | | $ | 3,932,798 | |
Kingdom of Thailand, 3.85%, 12/12/25 | | THB | | | 62,668,000 | | | | 2,106,068 | |
Kingdom of Thailand, 3.875%, 6/13/19 | | THB | | | 44,600,000 | | | | 1,519,155 | |
Kingdom of Thailand, 4.25%, 3/13/13 | | THB | | | 124,861,000 | | | | 4,094,182 | |
Kingdom of Thailand, 4.50%, 4/9/24 | | THB | | | 61,371,000 | | | | 2,192,935 | |
Kingdom of Thailand, 4.75%, 12/20/24 | | THB | | | 30,000,000 | | | | 1,097,571 | |
Kingdom of Thailand, 5.25%, 5/12/14 | | THB | | | 275,409,000 | | | | 9,303,424 | |
Kingdom of Thailand, 5.67%, 3/13/28 | | THB | | | 92,500,000 | | | | 3,753,828 | |
| | |
Total Thailand | | | $ | 27,999,961 | |
| | |
| | | |
Turkey — 11.8% | | | | | | | | | | |
Turkey Government Bond, 0.00%, 7/17/13 | | TRY | | | 25,300,000 | | | $ | 13,504,060 | |
Turkey Government Bond, 4.00%, 4/1/20(2) | | TRY | | | 10,846,458 | | | | 6,985,906 | |
Turkey Government Bond, 8.00%, 10/9/13 | | TRY | | | 15,615,000 | | | | 8,819,230 | |
Turkey Government Bond, 9.00%, 1/27/16 | | TRY | | | 5,100,000 | | | | 2,994,561 | |
Turkey Government Bond, 9.00%, 3/8/17 | | TRY | | | 13,255,000 | | | | 7,860,566 | |
Turkey Government Bond, 9.50%, 1/12/22 | | TRY | | | 2,090,000 | | | | 1,282,566 | |
Turkey Government Bond, 10.00%, 1/9/13 | | TRY | | | 6,225,000 | | | | 3,506,663 | |
Turkey Government Bond, 10.00%, 4/10/13 | | TRY | | | 29,195,000 | | | | 16,608,983 | |
Turkey Government Bond, 10.00%, 6/17/15 | | TRY | | | 23,800,000 | | | | 14,220,251 | |
Turkey Government Bond, 10.50%, 1/15/20 | | TRY | | | 6,051,000 | | | | 3,887,156 | |
Turkey Government Bond, 11.00%, 8/6/14 | | TRY | | | 17,891,000 | | | | 10,649,761 | |
Turkey Government Bond, 16.00%, 8/28/13 | | TRY | | | 1,330,000 | | | | 799,484 | |
| | |
Total Turkey | | | $ | 91,119,187 | |
| | |
| | | | |
| | 21 | | See Notes to Consolidated Financial Statements. |
Emerging Markets Local Income Portfolio
October 31, 2012
Consolidated Portfolio of Investments — continued
| | | | | | | | | | |
| Security | | | | Principal
Amount | | | Value | |
| | | | | | | | | | |
| | | |
Uruguay — 0.3% | | | | | | | | | | |
Monetary Regulation Bill, 0.00%, 1/11/13 | | UYU | | | 7,500,000 | | | $ | 372,730 | |
Monetary Regulation Bill, 0.00%, 8/15/13 | | UYU | | | 5,900,000 | | | | 276,968 | |
Monetary Regulation Bill, 0.00%, 2/27/14(2) | | UYU | | | 1,981,103 | | | | 97,913 | |
Republic of Uruguay, 4.375%, 12/15/28(2) | | UYU | | | 18,296,141 | | | | 1,103,327 | |
Uruguay Notas Del Teso, 10.25%, 8/22/15 | | UYU | | | 7,240,000 | | | | 372,997 | |
| | |
Total Uruguay | | | $ | 2,223,935 | |
| | |
| | | |
Venezuela — 0.5% | | | | | | | | | | |
Bolivarian Republic of Venezuela, 7.00%, 3/31/38(5) | | USD | | | 1,297,000 | | | $ | 933,840 | |
Bolivarian Republic of Venezuela, 9.25%, 5/7/28(5) | | USD | | | 1,368,100 | | | | 1,214,189 | |
Bolivarian Republic of Venezuela, 11.75%, 10/21/26(5) | | USD | | | 1,639,000 | | | | 1,667,682 | |
| | | | | | | | | | | |
Total Venezuela | | | | | | | | $ | 3,815,711 | |
| | | | | | | | | | | |
| | | |
Total Foreign Government Bonds
(identified cost $612,729,617) | | | | | | | | $ | 607,876,393 | |
| | | | | | | | | | | |
| | | |
| Common Stocks — 0.4% | | | | | | | | | | |
| | | |
| | | | | | | | | | |
| Security | | | | Shares | | | Value | |
| | | |
France — 0.1% | | | | | | | | | | |
Sanofi | | | | | 2,403 | | | $ | 211,049 | |
Total SA | | | | | 4,163 | | | | 209,691 | |
| | | | | | | | | | | |
Total France | | | | | | | | $ | 420,740 | |
| | | | | | | | | | | |
| | | |
Germany — 0.2% | | | | | | | | | | |
Deutsche EuroShop AG | | | | | 16,011 | | | $ | 654,369 | |
Deutsche Wohnen AG | | | | | 33,254 | | | | 609,023 | |
GSW Immobilien AG | | | | | 15,096 | | | | 620,510 | |
| | | | | | | | | | | |
Total Germany | | | | | | | | $ | 1,883,902 | |
| | | | | | | | | | | |
| | | |
Luxembourg — 0.1% | | | | | | | | | | |
GAGFAH SA(6) | | | | | 49,517 | | | $ | 563,546 | |
| | | | | | | | | | | |
Total Luxembourg | | | | | | | | $ | 563,546 | |
| | | | | | | | | | | |
| | | |
Total Common Stocks
(identified cost $2,463,626) | | | | | | | | $ | 2,868,188 | |
| | | | | | | | | | | |
| | | |
| | | | | | | | | | |
| Precious Metals — 1.0% | | | | | | | | | | |
| | | |
| | | | | | | | | | |
| Description | | | | Troy Ounces | | | Value | |
Platinum(6) | | | | | 4,784 | | | $ | 7,508,916 | |
| | | | | | | | | | | |
| | | |
Total Precious Metals
(identified cost $8,395,923) | | | | | | | | $ | 7,508,916 | |
| | | | | | | | | | | |
| | | | | | | | | | | | | | | | | | |
| Currency Call Options Purchased — 0.1% | |
| | | | | |
| | | | | | | | | | | | | | | | | | |
| Description | | Counterparty | | Principal
Amount
of
Contracts
(000’s
omitted) | | | Strike
Price | | | Expiration
Date | | | Value | |
| | | | | | | | | | | | | | | | | | |
Indian Rupee | | Australia and New
Zealand Banking
Group
Limited | | | INR
153,000 | | | | INR 54.00 | | | | 8/12/13 | | | $ | 51,592 | |
Indian Rupee | | Australia
and New
Zealand Banking
Group
Limited | | | INR
123,000 | | | | INR 54.00 | | | | 8/12/13 | | | | 41,476 | |
Indian Rupee | | Bank of America | | | INR
204,774 | | | | INR 52.00 | | | | 5/6/13 | | | | 28,431 | |
Indian Rupee | | Bank of
America | | | INR
186,766 | | | | INR 52.00 | | | | 5/6/13 | | | | 25,931 | |
Indian Rupee | | Bank of America | | | INR
187,000 | | | | INR 55.00 | | | | 7/1/13 | | | | 86,386 | |
Indian Rupee | | Bank of America | | | INR
155,000 | | | | INR 54.00 | | | | 8/12/13 | | | | 52,267 | |
Indian Rupee | | Bank of America | | | INR
173,000 | | | | INR 55.00 | | | | 8/16/13 | | | | 79,597 | |
Indian Rupee | | Barclays
Bank PLC | | | INR
205,061 | | | | INR 52.00 | | | | 5/6/13 | | | | 28,471 | |
Indian Rupee | | Barclays Bank PLC | | | INR
153,000 | | | | INR 54.00 | | | | 8/12/13 | | | | 51,593 | |
Indian Rupee | | Deutsche Bank | | | INR
161,200 | | | | INR 51.00 | | | | 5/8/13 | | | | 14,120 | |
Indian Rupee | | Deutsche Bank | | | INR
150,000 | | | | INR 54.00 | | | | 8/12/13 | | | | 50,581 | |
Indian Rupee | | Goldman Sachs
International | | | INR
187,000 | | | | INR 51.00 | | | | 5/8/13 | | | | 16,380 | |
Indian Rupee | | Goldman Sachs
International | | | INR
154,000 | | | | INR 55.00 | | | | 7/1/13 | | | | 71,141 | |
Indian Rupee | | Goldman
Sachs
International | | | INR
100,000 | | | | INR 54.00 | | | | 8/12/13 | | | | 33,721 | |
Indian Rupee | | Goldman Sachs
International | | | INR
110,000 | | | | INR 55.00 | | | | 8/19/13 | | | | 50,926 | |
Indian Rupee | | HSBC Bank USA | | | INR
190,800 | | | | INR 53.00 | | | | 7/3/13 | | | | 44,207 | |
Indian Rupee | | JPMorgan
Chase
Bank | | | INR
159,000 | | | | INR 53.00 | | | | 7/3/13 | | | | 36,839 | |
Indian Rupee | | JPMorgan Chase Bank | | | INR
108,000 | | | | INR 54.00 | | | | 8/12/13 | | | | 36,418 | |
Indian Rupee | | JPMorgan Chase Bank | | | INR
105,000 | | | | INR 54.00 | | | | 8/12/13 | | | | 35,407 | |
Indian Rupee | | Standard Chartered
Bank | | | INR
165,900 | | | | INR 52.00 | | | | 5/6/13 | | | | 23,034 | |
Indian Rupee | | Standard
Chartered
Bank | | | INR
106,000 | | | | INR 53.00 | | | | 7/3/13 | | | | 24,560 | |
| | | | | | | | | | | | | | | | | | | |
| | |
Total Currency Call Options Purchased
(identified cost $733,333) | | | | | | | $ | 883,078 | |
| | | | | | | | | | | | | | | | | | | |
| |
| Currency Put Options Purchased — 0.0%(3) | | | | | |
| | | | | |
| | | | | | | | | | | | | | | | | | |
| Description | | Counterparty | | Principal
Amount
of
Contracts
(000’s
omitted) | | | Strike
Price | | | Expiration
Date | | | Value | |
Yuan
Offshore Renminbi | | Barclays Bank PLC | | | CNH
21,665 | | | | CNH 6.50 | | | | 5/20/13 | | | $ | 8,206 | |
Yuan Offshore Renminbi | | Citibank NA | | | CNH
20,488 | | | | CNH 6.50 | | | | 5/20/13 | | | | 7,760 | |
| | | | |
| | 22 | | See Notes to Consolidated Financial Statements. |
Emerging Markets Local Income Portfolio
October 31, 2012
Consolidated Portfolio of Investments — continued
| | | | | | | | | | | | | | | | | | |
| Description | | Counterparty | | Principal
Amount
of
Contracts
(000’s
omitted) | | | Strike
Price | | | Expiration
Date | | | Value | |
| | | | | | | | | | | | | | | | | | |
Yuan Offshore Renminbi | | HSBC
Bank USA | | | CNH
23,153 | | | | CNH 6.50 | | | | 5/20/13 | | | $ | 8,769 | |
Yuan Offshore Renminbi | | Standard
Chartered Bank | | | CNH
19,403 | | | | CNH 6.50 | | | | 5/20/13 | | | | 7,349 | |
| | | | | | | | | | | | | | | | | | | |
| | |
Total Currency Put Options Purchased
(identified cost $111,836) | | | | | | | $ | 32,084 | |
| | | | | | | | | | | | | | | | | | | |
| | | | | | | | | | | | | | | | |
|
| Put Options Purchased — 0.1% | |
| | | | |
| | | | | | | | | | | | | | | | |
| Description | | Number of
Contracts | | | Strike
Price | | | Expiration
Date | | | Value | |
| | | | | | | | | | | | | | | | |
Brent Crude Oil Future 9/2013 | | | 83 | | | $ | 95.00 | | | | 8/12/13 | | | $ | 581,000 | |
| | | | | | | | | | | | | | | | | |
| | |
Total Put Options Purchased
(identified cost $587,640) | | | | | | | $ | 581,000 | |
| | | | | | | | | | | | | | | | | |
| | | | | | | | | | |
|
| Short-Term Investments — 20.3% | |
|
| Foreign Government Securities — 10.4% | |
| | | |
| | | | | | | | | | |
| Security | | | | Principal
Amount
(000’s omitted) | | | Value | |
| | | | | | | | | | |
| | | |
Bosnia and Herzegovina — 0.0%(3) | | | | | | | | | | |
Bosnia & Herzegovina Government Bond, 2.50%, 8/31/13 | | BAM | | | 6 | | | $ | 4,069 | |
| | | | | | | | | | | |
Total Bosnia and Herzegovina | | | | | | | | $ | 4,069 | |
| | |
|
Croatia — 0.6% | |
Croatia Treasury Bill, 0.00%, 11/15/12 | | EUR | | | 380 | | | $ | 492,086 | |
Croatia Treasury Bill, 0.00%, 11/22/12 | | EUR | | | 173 | | | | 223,906 | |
Croatia Treasury Bill, 0.00%, 11/29/12 | | EUR | | | 422 | | | | 545,873 | |
Croatia Treasury Bill, 0.00%, 1/24/13 | | EUR | | | 410 | | | | 527,960 | |
Croatia Treasury Bill, 0.00%, 1/31/13 | | EUR | | | 225 | | | | 289,738 | |
Croatia Treasury Bill, 0.00%, 2/7/13 | | EUR | | | 180 | | | | 231,645 | |
Croatia Treasury Bill, 0.00%, 2/28/13 | | EUR | | | 389 | | | | 499,657 | |
Croatia Treasury Bill, 0.00%, 3/14/13 | | EUR | | | 463 | | | | 593,930 | |
Croatia Treasury Bill, 0.00%, 3/28/13 | | EUR | | | 389 | | | | 498,340 | |
Croatia Treasury Bill, 0.00%, 4/4/13 | | EUR | | | 320 | | | | 409,756 | |
| | |
Total Croatia | | | $ | 4,312,891 | |
| | |
|
Georgia — 0.1% | |
Georgia Treasury Bill, 0.00%, 5/23/13 | | GEL | | | 570 | | | $ | 331,279 | |
Georgia Treasury Bill, 0.00%, 7/18/13 | | GEL | | | 300 | | | | 172,684 | |
| | |
Total Georgia | | | $ | 503,963 | |
| | |
| | | | | | | | | | |
| Security | | | | Principal
Amount
(000’s omitted) | | | Value | |
| | | | | | | | | | |
|
Nigeria — 4.1% | |
Nigeria Treasury Bill, 0.00%, 2/7/13 | | NGN | | | 143,000 | | | $ | 878,307 | |
Nigeria Treasury Bill, 0.00%, 2/21/13 | | NGN | | | 820,274 | | | | 5,013,969 | |
Nigeria Treasury Bill, 0.00%, 3/7/13 | | NGN | | | 2,163,500 | | | | 13,124,468 | |
Nigeria Treasury Bill, 0.00%, 3/28/13 | | NGN | | | 175,600 | | | | 1,063,435 | |
Nigeria Treasury Bill, 0.00%, 4/4/13 | | NGN | | | 87,800 | | | | 530,406 | |
Nigeria Treasury Bill, 0.00%, 4/11/13 | | NGN | | | 139,000 | | | | 833,490 | |
Nigeria Treasury Bill, 0.00%, 5/9/13 | | NGN | | | 82,600 | | | | 491,243 | |
Nigeria Treasury Bill, 0.00%, 5/23/13 | | NGN | | | 128,000 | | | | 760,004 | |
Nigeria Treasury Bill, 0.00%, 9/5/13 | | NGN | | | 1,633,000 | | | | 9,294,459 | |
| | |
Total Nigeria | | | $ | 31,989,781 | |
| | |
| | | |
Philippines — 0.6% | | | | | | | | | | |
Philippine Treasury Bill, 0.00%, 11/7/12 | | PHP | | | 28,980 | | | $ | 703,448 | |
Philippine Treasury Bill, 0.00%, 3/6/13 | | PHP | | | 82,120 | | | | 1,990,391 | |
Philippine Treasury Bill, 0.00%, 7/24/13 | | PHP | | | 58,940 | | | | 1,422,205 | |
Philippine Treasury Bill, 0.00%, 8/7/13 | | PHP | | | 22,810 | | | | 550,137 | |
| | |
Total Philippines | | | $ | 4,666,181 | |
| | |
| | | |
Serbia — 2.0% | | | | | | | | | | |
Serbia Treasury Bill, 0.00%, 1/17/13 | | RSD | | | 26,350 | | | $ | 292,723 | |
Serbia Treasury Bill, 0.00%, 2/13/13 | | RSD | | | 609,300 | | | | 6,704,099 | |
Serbia Treasury Bill, 0.00%, 4/11/13 | | RSD | | | 10,470 | | | | 112,804 | |
Serbia Treasury Bill, 0.00%, 5/23/13 | | RSD | | | 117,950 | | | | 1,253,232 | |
Serbia Treasury Bill, 0.00%, 6/13/13 | | RSD | | | 19,800 | | | | 208,782 | |
Serbia Treasury Bill, 0.00%, 6/28/13 | | RSD | | | 630,700 | | | | 6,614,374 | |
Serbia Treasury Bill, 0.00%, 10/31/13 | | RSD | | | 44,700 | | | | 448,071 | |
| | |
Total Serbia | | | $ | 15,634,085 | |
| | |
| | | |
South Korea — 0.6% | | | | | | | | | | |
Korea Monetary Stabilization Bond, 0.00%, 11/13/12 | | KRW | | | 533,380 | | | $ | 488,573 | |
Korea Monetary Stabilization Bond, 0.00%, 12/11/12 | | KRW | | | 659,000 | | | | 601,818 | |
Korea Monetary Stabilization Bond, 0.00%, 12/18/12 | | KRW | | | 2,210,520 | | | | 2,018,859 | |
Korea Monetary Stabilization Bond, 0.00%, 12/25/12 | | KRW | | | 1,488,510 | | | | 1,358,848 | |
| | |
Total South Korea | | | $ | 4,468,098 | |
| | |
| | | |
Sri Lanka — 2.0% | | | | | | | | | | |
Sri Lanka Treasury Bill, 0.00%, 11/2/12 | | LKR | | | 164,870 | | | $ | 1,265,474 | |
Sri Lanka Treasury Bill, 0.00%, 12/21/12 | | LKR | | | 214,130 | | | | 1,620,819 | |
Sri Lanka Treasury Bill, 0.00%, 2/1/13 | | LKR | | | 23,440 | | | | 175,306 | |
Sri Lanka Treasury Bill, 0.00%, 3/1/13 | | LKR | | | 531,440 | | | | 3,937,005 | |
Sri Lanka Treasury Bill, 0.00%, 3/8/13 | | LKR | | | 18,920 | | | | 139,826 | |
Sri Lanka Treasury Bill, 0.00%, 3/8/13 | | LKR | | | 134,000 | | | | 990,313 | |
| | | | |
| | 23 | | See Notes to Consolidated Financial Statements. |
Emerging Markets Local Income Portfolio
October 31, 2012
Consolidated Portfolio of Investments — continued
| | | | | | | | | | |
| Security | | | | Principal
Amount
(000’s omitted) | | | Value | |
| | | | | | | | | | |
| | | |
Sri Lanka (continued) | | | | | | | | | | |
Sri Lanka Treasury Bill, 0.00%, 3/29/13 | | LKR | | | 136,490 | | | $ | 1,001,421 | |
Sri Lanka Treasury Bill, 0.00%, 4/12/13 | | LKR | | | 46,830 | | | | 341,900 | |
Sri Lanka Treasury Bill, 0.00%, 8/30/13 | | LKR | | | 586,380 | | | | 4,088,050 | |
Sri Lanka Treasury Bill, 0.00%, 10/4/13 | | LKR | | | 57,530 | | | | 396,406 | |
Sri Lanka Treasury Bill, 0.00%, 11/1/13 | | LKR | | | 185,450 | | | | 1,265,825 | |
| | |
Total Sri Lanka | | | $ | 15,222,345 | |
| | |
| | | |
Uruguay — 0.4% | | | | | | | | | | |
Monetary Regulation Bill, 0.00%, 11/5/12 | | UYU | | | 14,411 | | | $ | 728,943 | |
Monetary Regulation Bill, 0.00%, 2/15/13 | | UYU | | | 3,770 | | | | 185,639 | |
Monetary Regulation Bill, 0.00%, 3/22/13(2) | | UYU | | | 16,562 | | | | 833,933 | |
Monetary Regulation Bill, 0.00%, 4/26/13(2) | | UYU | | | 5,469 | | | | 274,898 | |
Monetary Regulation Bill, 0.00%, 5/31/13(2) | | UYU | | | 10,885 | | | | 546,942 | |
Monetary Regulation Bill, 0.00%, 7/5/13(2) | | UYU | | | 18,643 | | | | 935,232 | |
| | |
Total Uruguay | | | $ | 3,505,587 | |
| | |
| | | |
Total Foreign Government Securities
(identified cost $79,781,611) | | | | | | | | $ | 80,307,000 | |
| | |
|
| U.S. Treasury Obligations — 2.3% | |
| | | |
| | | | | | | | | | |
| Security | | | | Principal
Amount
(000’s omitted) | | | Value | |
U.S. Treasury Bill, 0.00%, 11/15/12(7) | | | | $ | 14,904 | | | $ | 14,903,627 | |
U.S. Treasury Bill, 0.00%, 11/29/12(7) | | | | | 3,000 | | | | 2,999,796 | |
| | |
| |
Total U.S. Treasury Obligations
(identified cost $17,903,007) | | | $ | 17,903,423 | |
| | |
|
| Repurchase Agreements — 3.9% | |
| | | |
| | | | | | | | | | |
| Description | | | | Principal Amount (000’s omitted) | | | Value | |
Bank of America: | | | | | | | | | | |
Dated 10/5/12 with a maturity date of 12/7/12, an interest rate of 0.10% payable by the Portfolio and repurchase proceeds of EUR 965,394, collateralized by EUR 820,000 Government of France 3.75%, due 10/25/19 and a market value, including accrued interest, of $1,216,597. | | EUR | | | 966 | | | $ | 1,251,497 | |
| | | | | | | | | | |
| Description | | | | Principal Amount (000’s omitted) | | | Value | |
| | | | | | | | | | |
Dated 10/15/12 with a maturity date of 11/16/12, an interest rate of 0.12% payable by the Portfolio and repurchase proceeds of EUR 6,280,518, collateralized by EUR 5,450,000 Government of France 3.75%, due 4/25/17 and a market value, including accrued interest, of $8,109,386. | | EUR | | | 6,281 | | | $ | 8,141,277 | |
Dated 10/23/12 with a maturity date of 1/24/13, an interest rate of 0.65% payable by the Portfolio and repurchase proceeds of EUR 812,428, collateralized by EUR 700,000 European Investment Bank 3.625%, due 1/15/21 and a market value, including accrued interest, of $1,063,565. | | EUR | | | 814 | | | | 1,054,742 | |
Dated 10/23/12 with a maturity date of 1/24/13, an interest rate of 0.65% payable by the Portfolio and repurchase proceeds of EUR 1,105,201, collateralized by EUR 900,000 European Investment Bank 4.625%, due 4/15/20 and a market value, including accrued interest, of $1,445,791. | | EUR | | | 1,107 | | | | 1,434,837 | |
Dated 10/23/12 with a maturity date of 1/24/13, an interest rate of 0.65% payable by the Portfolio and repurchase proceeds of EUR 1,171,643, collateralized by EUR 980,000 European Investment Bank 4.25%, due 4/15/19 and a market value, including accrued interest, of $1,529,249. | | EUR | | | 1,174 | | | | 1,521,096 | |
Barclays Bank PLC: | | | | | | | | | | |
Dated 10/15/12 with a maturity date of 11/19/12, an interest rate of 0.10% payable by the Portfolio and repurchase proceeds of EUR 2,708,107, collateralized by EUR 2,225,000 Government of France 4.00%, due 10/25/38 and a market value, including accrued interest, of $3,336,615. | | EUR | | | 2,708 | | | | 3,510,423 | |
Citibank NA: | | | | | | | | | | |
Dated 10/24/12 with a maturity date of 11/29/12, an interest rate of 0.08% payable by the Portfolio and repurchase proceeds of EUR 5,324,183, collateralized by EUR 4,610,000 Government of France 4.00%, due 10/25/38 and a market value, including accrued interest, of $6,913,166. | | EUR | | | 5,325 | | | | 6,901,412 | |
Nomura International PLC: | | | | | | | | | | |
Dated 10/9/12 with a maturity date of 11/12/12, an interest rate of 0.06% payable by the Portfolio and repurchase proceeds of EUR 3,546,208, collateralized by EUR 3,150,000 Belgium Kingdom Government Bond 3.75%, due 9/28/20 and a market value, including accrued interest, of $4,604,919. | | EUR | | | 3,546 | | | | 4,596,652 | |
| | | | |
| | 24 | | See Notes to Consolidated Financial Statements. |
Emerging Markets Local Income Portfolio
October 31, 2012
Consolidated Portfolio of Investments — continued
| | | | | | | | | | |
| Description | | | | Principal Amount (000’s omitted) | | | Value | |
| | | | | | | | | | |
Dated 10/24/12 with a maturity date of 1/28/13, an interest rate of 0.07% payable by the Portfolio and repurchase proceeds of EUR 1,505,596, collateralized by EUR 1,500,000 Bundesrepublik Deutschland 0.50%, due 4/7/17 and a market value, including accrued interest, of $1,959,815 | | EUR | | | 1,506 | | | $ | 1,951,823 | |
| | |
| |
Total Repurchase Agreements
(identified cost $30,335,942) | | | $ | 30,363,759 | |
| | |
| | | |
| Other — 3.7% | | | | | | | | | | |
| Description | | | | Interest (000’s omitted) | | | Value | |
Eaton Vance Cash Reserves Fund, LLC, 0.12%(8) | | | | $ | 28,664 | | | $ | 28,664,279 | |
| | | | | | | | | | | |
| | | |
Total Other
(identified cost $28,664,279) | | | | | | | | $ | 28,664,279 | |
| | | | | | | | | | | |
| | | |
Total Short-Term Investments
(identified cost $156,684,839) | | | | | | | | $ | 157,238,461 | |
| | | | | | | | | | | |
| | | |
Total Investments — 100.3%
(identified cost $781,706,814) | | | | | | | | $ | 776,988,120 | |
| | | | | | | | | | | |
| | | | | | | | | | | | | | | | | | |
| |
| Currency Call Options Written — (0.1)% | | | | | |
| | | | | |
| | | | | | | | | | | | | | | | | | |
| Description | | Counter
party | | Principal
Amount
of
Contracts
(000’s
omitted) | | | Strike
Price | | | Expiration
Date | | | Value | |
| | | | | | | | | | | | | | | | | | |
Indian Rupee | | Bank of
America | | | INR
208,818 | | | | INR 54.00 | | | | 8/12/13 | | | $ | (70,415 | ) |
Indian Rupee | | Citibank NA | | | INR
198,558 | | | | INR 54.00 | | | | 8/12/13 | | | | (66,955 | ) |
Indian Rupee | | Deutsche Bank | | | INR
106,752 | | | | INR 54.00 | | | | 8/12/13 | | | | (35,997 | ) |
Indian Rupee | | Goldman Sachs
International | | | INR
173,000 | | | | INR 55.00 | | | | 8/16/13 | | | | (79,983 | ) |
Indian Rupee | | HSBC Bank USA | | | INR
216,702 | | | | INR 54.00 | | | | 8/12/13 | | | | (73,073 | ) |
Indian Rupee | | JPMorgan Chase
Bank | | | INR
110,000 | | | | INR 55.00 | | | | 8/19/13 | | | | (50,926 | ) |
Indian Rupee | | Nomura
International
PLC | | | INR
216,702 | | | | INR 54.00 | | | | 8/12/13 | | | | (73,073 | ) |
Indian Rupee | | Standard
Chartered Bank | | | INR
99,468 | | | | INR 54.00 | | | | 8/12/13 | | | | (33,541 | ) |
| | | | | | | | | | | | | | | | | | | |
| | |
Total Currency Call Options Written
(premiums received $965,937) | | | | | | | $ | (483,963 | ) |
| | | | | | | | | | | | | | | | | | | |
| | | | | | | | | | | | | | | | | | |
| Currency Put Options Written — (0.0)%(3) | |
| | | | | |
| | | | | | | | | | | | | | | | | | |
| Description | | Counter
party | | Principal
Amount
of
Contracts
(000’s
omitted) | | | Strike
Price | | | Expiration
Date | | | Value | |
| | | | | | | | | | | | | | | | | | |
Indian Rupee | | Bank of
America | | | INR
110,500 | | | | INR 65.00 | | | | 7/1/13 | | | $ | (7,863 | ) |
Indian Rupee | | Goldman Sachs
International | | | INR
91,000 | | | | INR 65.00 | | | | 7/1/13 | | | | (6,476 | ) |
Indian Rupee | | HSBC
Bank
USA | | | INR
115,200 | | | | INR 64.00 | | | | 7/3/13 | | | | (10,405 | ) |
Indian Rupee | | JPMorgan
Chase Bank | | | INR
96,000 | | | | INR 64.00 | | | | 7/3/13 | | | | (8,671 | ) |
Indian Rupee | | Standard
Chartered Bank | | | INR
64,000 | | | | INR 64.00 | | | | 7/3/13 | | | | (5,781 | ) |
| | | | | | | | | | | | | | | | | | | |
| | |
Total Currency Put Options Written
(premiums received $197,403) | | | | | | | $ | (39,196 | ) |
| | | | | | | | | | | | | | | | | | | |
| |
Other Assets, Less Liabilities — (0.2)% | | | $ | (1,372,085 | ) |
| | | | | | | | | | | | | | | | | | | |
| |
Net Assets — 100.0% | | | $ | 775,092,876 | |
| | | | | | | | | | | | | | | | | | | |
The percentage shown for each investment category in the Consolidated Portfolio of Investments is based on net assets.
| | | | |
| BAM | | — | | Bosnia-Herzegovina Convertible Mark |
| BRL | | — | | Brazilian Real |
| CLP | | — | | Chilean Peso |
| CNH | | — | | Yuan Offshore Renminbi |
| COP | | — | | Colombian Peso |
| CRC | | — | | Costa Rican Colon |
| DOP | | — | | Dominican Peso |
| EUR | | — | | Euro |
| GEL | | — | | Georgian Lari |
| GHS | | — | | Ghanaian Cedi |
| HUF | | — | | Hungarian Forint |
| IDR | | — | | Indonesian Rupiah |
| INR | | — | | Indian Rupee |
| KRW | | — | | South Korean Won |
| LKR | | — | | Sri Lankan Rupee |
| MXN | | — | | Mexican Peso |
| MYR | | — | | Malaysian Ringgit |
| NGN | | — | | Nigerian Naira |
| NZD | | — | | New Zealand Dollar |
| PEN | | — | | Peruvian New Sol |
| PHP | | — | | Philippine Peso |
| PLN | | — | | Polish Zloty |
| RSD | | — | | Serbian Dinar |
| RUB | | — | | Russian Ruble |
| THB | | — | | Thai Baht |
| TRY | | — | | New Turkish Lira |
| USD | | — | | United States Dollar |
| | | | |
| | 25 | | See Notes to Consolidated Financial Statements. |
Emerging Markets Local Income Portfolio
October 31, 2012
Consolidated Portfolio of Investments — continued
| | | | |
| UYU | | — | | Uruguayan Peso |
| ZAR | | — | | South African Rand |
| (1) | Security exempt from registration pursuant to Rule 144A under the Securities Act of 1933. These securities may be sold in certain transactions (normally to qualified institutional buyers) and remain exempt from registration. At October 31, 2012, the aggregate value of these securities is $27,940,364 or 3.6% of the Portfolio’s net assets. |
| (2) | Inflation-linked security whose principal is adjusted for inflation based on changes in a designated inflation index or inflation rate for the applicable country. Interest is calculated based on the inflation-adjusted principal. |
| (3) | Amount is less than 0.05%. |
| (4) | Represents a structured security whose market value and interest rate are linked to the performance of the underlying security. |
| (5) | Security exempt from registration under Regulation S of the Securities Act of 1933, which exempts from registration securities offered and sold outside the United States. Security may not be offered or sold in the United States except pursuant to an exemption from, or in a transaction not subject to, the registration requirements of the Securities Act of 1933. |
| (6) | Non-income producing. |
| (7) | Security (or a portion thereof) has been pledged to cover collateral requirements on open financial contracts and/or securities sold short. |
| (8) | Affiliated investment company available to Eaton Vance portfolios and funds which invests in high quality, U.S. dollar denominated money market instruments. The rate shown is the annualized seven-day yield as of October 31, 2012. |
| | | | | | | | | | |
| Securities Sold Short — (4.4)% | |
|
| Foreign Government Bonds — (3.9)% | |
| | | |
| | | | | | | | | | |
| Security | | | | Principal
Amount
(000’s omitted) | | | Value | |
| | | | | | | | | | |
| | | | | | | | | | |
| | | |
Belgium — (0.6)% | | | | | | | | | | |
Belgium Kingdom Government Bond, 3.75%, 9/28/20 | | EUR | | | (3,150 | ) | | $ | (4,590,657 | ) |
| | | | | | | | | | | |
Total Belgium | | | | | | | | $ | (4,590,657 | ) |
| | | | | | | | | | | |
| | | |
France — (2.5)% | | | | | | | | | | |
Government of France, 3.75%, 4/25/17 | | EUR | | | (5,450 | ) | | $ | (7,971,493 | ) |
Government of France, 3.75%, 10/25/19 | | EUR | | | (820 | ) | | | (1,215,832 | ) |
Government of France, 4.00%, 10/25/38 | | EUR | | | (6,835 | ) | | | (10,242,985 | ) |
| | | | | | | | | | | |
Total France | | | | | | | | $ | (19,430,310 | ) |
| | | | | | | | | | | |
| | | |
Germany — (0.3)% | | | | | | | | | | |
Bundesrepublik Deutschland, 0.50%, 4/7/17 | | EUR | | | (1,500 | ) | | $ | (1,954,276 | ) |
| | | | | | | | | | | |
Total Germany | | | | | | | | $ | (1,954,276 | ) |
| | | | | | | | | | | |
| | | | | | | | | | |
| Security | | | | Principal
Amount
(000’s omitted) | | | Value | |
| | | | | | | | | | |
| | | |
Supranational — (0.5)% | | | | | | | | | | |
European Investment Bank, 3.625%, 1/15/21 | | EUR | | | (700 | ) | | $ | (1,037,343 | ) |
European Investment Bank, 4.25%, 4/15/19 | | EUR | | | (980 | ) | | | (1,499,669 | ) |
European Investment Bank, 4.625%, 4/15/20 | | EUR | | | (900 | ) | | | (1,416,228 | ) |
| | | | | | | | | | | |
Total Supranational | | | | | | | | $ | (3,953,240 | ) |
| | | | | | | | | | | |
| | | |
Total Foreign Government Bonds
(proceeds $28,926,403) | | | | | | | | $ | (29,928,483 | ) |
| | | | | | | | | | | |
| | | |
| Common Stocks — (0.5)% | | | | | | | | | | |
| | | |
| | | | | | | | | | |
| Security | | | | Shares | | | Value | |
| | | |
China — (0.5)% | | | | | | | | | | |
Agricultural Bank of China, Ltd., Class H | | | | | (2,120,000 | ) | | $ | (910,707 | ) |
Bank of China, Ltd., Class H | | | | | (2,277,000 | ) | | | (932,846 | ) |
China Construction Bank Corp., Class H | | | | | (1,373,000 | ) | | | (1,031,053 | ) |
Industrial & Commercial Bank of China, Class H | | | | | (1,675,000 | ) | | | (1,102,986 | ) |
| | | | | | | | | | | |
| | | |
Total Common Stocks
(proceeds $3,491,181) | | | | | | | | $ | (3,977,592 | ) |
| | | | | | | | | | | |
| | | |
Total Securities Sold Short
(proceeds $32,417,584) | | | | | | | | $ | (33,906,075 | ) |
| | | | | | | | | | | |
| | | | |
| | 26 | | See Notes to Consolidated Financial Statements. |
Emerging Markets Local Income Portfolio
October 31, 2012
Consolidated Statement of Assets and Liabilities
| | | | |
| Assets | | October 31, 2012 | |
Investments — | | | | |
Securities of unaffiliated issuers, at value (identified cost, $744,646,612) | | $ | 740,814,925 | |
Affiliated investment, at value (identified cost, $28,664,279) | | | 28,664,279 | |
Precious metals, at value (identified cost, $8,395,923) | | | 7,508,916 | |
Total Investments, at value (identified cost, $781,706,814) | | $ | 776,988,120 | |
Cash | | $ | 1,740,296 | |
Foreign currency, at value (identified cost, $7,545,596) | | | 7,560,229 | |
Cash collateral for securities sold short | | | 4,249,550 | |
Interest and dividends receivable | | | 10,904,246 | |
Interest receivable from affiliated investment | | | 3,308 | |
Receivable for variation margin on open futures contracts | | | 121,458 | |
Receivable for open forward foreign currency exchange contracts | | | 2,301,764 | |
Receivable for closed forward foreign currency exchange contracts | | | 415,502 | |
Receivable for open swap contracts | | | 12,455,364 | |
Receivable for closed swap contracts | | | 14,428 | |
Receivable for closed options | | | 23,685 | |
Premium paid on open swap contracts | | | 6,016,940 | |
Total assets | | $ | 822,794,890 | |
|
| Liabilities | |
Written options outstanding, at value (premiums received, $1,163,340) | | $ | 523,159 | |
Payable for investments purchased | | | 1,293,856 | |
Payable for open forward foreign currency exchange contracts | | | 5,135,857 | |
Payable for closed forward foreign currency exchange contracts | | | 376,724 | |
Payable for open swap contracts | | | 3,705,714 | |
Premium payable on open swap contracts | | | 282,184 | |
Premium received on open swap contracts | | | 1,199,337 | |
Payable for securities sold short, at value (proceeds, $32,417,584) | | | 33,906,075 | |
Payable to affiliates: | | | | |
Investment adviser fee | | | 431,059 | |
Trustees’ fees | | | 2,500 | |
Interest payable | | | 638,322 | |
Accrued expenses | | | 207,227 | |
Total liabilities | | $ | 47,702,014 | |
Net Assets applicable to investors’ interest in Portfolio | | $ | 775,092,876 | |
|
| Sources of Net Assets | |
Investors’ capital | | $ | 774,838,454 | |
Net unrealized appreciation | | | 254,422 | |
Total | | $ | 775,092,876 | |
| | | | |
| | 27 | | See Notes to Consolidated Financial Statements. |
Emerging Markets Local Income Portfolio
October 31, 2012
Consolidated Statement of Operations
| | | | |
| Investment Income | | Year Ended
October 31, 2012 | |
Interest (net of foreign taxes, $993,649) | | $ | 49,533,876 | |
Dividends (net of foreign taxes, $2,873) | | | 43,178 | |
Interest allocated from affiliated investment | | | 33,308 | |
Expenses allocated from affiliated investment | | | (4,558 | ) |
Total investment income | | $ | 49,605,804 | |
| |
| Expenses | | | | |
Investment adviser fee | | $ | 4,959,810 | |
Trustees’ fees and expenses | | | 30,478 | |
Custodian fee | | | 1,106,039 | |
Legal and accounting services | | | 134,564 | |
Interest expense | | | 28,270 | |
Interest and dividends on securities sold short | | | 1,114,976 | |
Miscellaneous | | | 41,979 | |
Total expenses | | $ | 7,416,116 | |
Deduct — | | | | |
Reduction of custodian fee | | $ | 944 | |
Total expense reductions | | $ | 944 | |
| |
Net expenses | | $ | 7,415,172 | |
| |
Net investment income | | $ | 42,190,632 | |
| |
| Realized and Unrealized Gain (Loss) | | | | |
Net realized gain (loss) — | | | | |
Investment transactions (net of foreign capital gains taxes of
$170,913) and (including a gain of $614,608 from precious metals) | | $ | (14,972,490 | ) |
Investment transactions allocated from affiliated investment | | | 481 | |
Securities sold short | | | 58,070 | |
Futures contracts | | | (152,535 | ) |
Swap contracts | | | 2,480,491 | |
Forward commodity contracts | | | (414,003 | ) |
Foreign currency and forward foreign currency exchange contract transactions | | | 11,333,574 | |
Net realized loss | | $ | (1,666,412 | ) |
Change in unrealized appreciation (depreciation) — | | | | |
Investments (including net decrease of $1,054,551 from precious metals) | | $ | 12,563,187 | |
Written options | | | 640,181 | |
Securities sold short | | | (2,105,686 | ) |
Futures contracts | | | 60,021 | |
Swap contracts | | | 2,392,371 | |
Forward commodity contracts | | | 705,490 | |
Foreign currency and forward foreign currency exchange contracts | | | (2,173,734 | ) |
Net change in unrealized appreciation (depreciation) | | $ | 12,081,830 | |
| |
Net realized and unrealized gain | | $ | 10,415,418 | |
| |
Net increase in net assets from operations | | $ | 52,606,050 | |
| | | | |
| | 28 | | See Notes to Consolidated Financial Statements. |
Emerging Markets Local Income Portfolio
October 31, 2012
Consolidated Statements of Changes in Net Assets
| | | | | | | | |
| | | Year Ended October 31, | |
| Increase (Decrease) in Net Assets | | 2012 | | | 2011 | |
From operations — | | | | | | | | |
Net investment income | | $ | 42,190,632 | | | $ | 33,035,889 | |
Net realized loss from investment transactions, written options, securities sold short, futures contracts, swap contracts, forward commodity contracts, and foreign currency and forward foreign currency exchange contract transactions | | | (1,666,412 | ) | | | (12,441,570 | ) |
Net change in unrealized appreciation (depreciation) from investments, written options, securities sold short, futures contracts, swap contracts, forward commodity contracts, foreign currency and forward foreign currency exchange contracts | | | 12,081,830 | | | | (30,104,043 | ) |
Net increase (decrease) in net assets from operations | | $ | 52,606,050 | | | $ | (9,509,724 | ) |
Capital transactions — | | | | | | | | |
Contributions | | $ | 100,744,364 | | | $ | 495,269,928 | |
Withdrawals | | | (181,643,952 | ) | | | (83,021,660 | ) |
Net increase (decrease) in net assets from capital transactions | | $ | (80,899,588 | ) | | $ | 412,248,268 | |
| | |
Net increase (decrease) in net assets | | $ | (28,293,538 | ) | | $ | 402,738,544 | |
| | |
| Net Assets | | | | | | | | |
At beginning of year | | $ | 803,386,414 | | | $ | 400,647,870 | |
At end of year | | $ | 775,092,876 | | | $ | 803,386,414 | |
| | | | |
| | 29 | | See Notes to Consolidated Financial Statements. |
Emerging Markets Local Income Portfolio
October 31, 2012
Consolidated Supplementary Data
| | | | | | | | | | | | | | | | | | | | |
| | | Year Ended October 31, | |
| Ratios/Supplemental Data | | 2012 | | | 2011 | | | 2010 | | | 2009 | | | 2008 | |
Ratios (as a percentage of average daily net assets): | | | | | | | | | | | | | | | | | | | | |
Expenses(1) | | | 0.97 | %(2) | | | 0.92 | %(2) | | | 0.93 | % | | | 0.91 | % | | | 0.96 | % |
Net investment income | | | 5.53 | % | | | 4.90 | % | | | 5.30 | % | | | 5.70 | % | | | 5.51 | % |
Portfolio Turnover | | | 24 | % | | | 16 | % | | | 17 | % | | | 26 | % | | | 38 | % |
| | | | | |
Total Return | | | 7.78 | % | | | 0.13 | % | | | 19.03 | % | | | 30.48 | % | | | (13.13 | )% |
| | | | | |
Net assets, end of year (000’s omitted) | | $ | 775,093 | | | $ | 803,386 | | | $ | 400,648 | | | $ | 116,040 | | | $ | 60,837 | |
| (1) | Excludes the effect of custody fee credits, if any, of less than 0.005%. |
| (2) | Includes interest and dividend expense primarily on securities sold short of 0.15% and 0.08% for the years ended October 31, 2012 and 2011, respectively. |
| | | | |
| | 30 | | See Notes to Consolidated Financial Statements. |
Emerging Markets Local Income Portfolio
October 31, 2012
Notes to Consolidated Financial Statements
1 Significant Accounting Policies
Emerging Markets Local Income Portfolio (the Portfolio) is a Massachusetts business trust registered under the Investment Company Act of 1940, as amended (the 1940 Act), as a non-diversified, open-end management investment company. The Portfolio’s investment objective is total return. The Declaration of Trust permits the Trustees to issue interests in the Portfolio. At October 31, 2012, Eaton Vance Emerging Markets Local Income Fund, Eaton Vance Strategic Income Fund, Eaton Vance International (Cayman Islands) Strategic Income Fund and Eaton Vance International (Cayman Islands) Emerging Markets Local Income Fund held an interest of 78.5%, 17.6%, 2.9% and 1.0%, respectively, in the Portfolio.
The Portfolio seeks to gain exposure to the commodity markets, in whole or in part, through investments in Eaton Vance EMLIP Commodity Subsidiary, Ltd. (the Subsidiary), a wholly-owned subsidiary of the Portfolio organized under the laws of the Cayman Islands with the same objective and investment policies and restrictions as the Portfolio. The Portfolio may invest up to 25% of its total assets in the Subsidiary. The net assets of the Subsidiary at October 31, 2012 were $38,702,626 or 5.0% of the Portfolio’s consolidated net assets. The accompanying consolidated financial statements include the accounts of the Subsidiary. Intercompany balances and transactions have been eliminated in consolidation.
The following is a summary of significant accounting policies of the Portfolio. The policies are in conformity with accounting principles generally accepted in the United States of America.
A Investment Valuation — Debt obligations (including short-term obligations with a remaining maturity of more than sixty days and excluding most seasoned, fixed-rate 30-year mortgage-backed securities as noted below) are generally valued on the basis of valuations provided by third party pricing services, as derived from such services’ pricing models. Inputs to the models may include, but are not limited to, reported trades, executable bid and asked prices, broker/dealer quotations, prices or yields of securities with similar characteristics, benchmark curves or information pertaining to the issuer, as well as industry and economic events. The pricing services may use a matrix approach, which considers information regarding securities with similar characteristics to determine the valuation for a security. Most seasoned, fixed-rate 30-year mortgage-backed securities are valued through the use of the investment adviser’s matrix pricing system, which takes into account bond prices, yield differentials, anticipated prepayments and interest rates provided by dealers. Short-term obligations purchased with a remaining maturity of sixty days or less (excluding those that are non-U.S. dollar denominated, which typically are valued by a pricing service or dealer quotes) are generally valued at amortized cost, which approximates market value. Equity securities (including common shares of closed-end investment companies) listed on a U.S. securities exchange generally are valued at the last sale or closing price on the day of valuation or, if no sales took place on such date, at the mean between the closing bid and asked prices therefore on the exchange where such securities are principally traded. Equity securities listed on the NASDAQ Global or Global Select Market generally are valued at the NASDAQ official closing price. Unlisted or listed securities for which closing sales prices or closing quotations are not available are valued at the mean between the latest available bid and asked prices or, in the case of preferred equity securities that are not listed or traded in the over-the-counter market, by a third party pricing service that will use various techniques that consider factors including, but not limited to, prices or yields of securities with similar characteristics, benchmark yields, broker/dealer quotes, quotes of underlying common stock, issuer spreads, as well as industry and economic events. The daily valuation of exchange-traded foreign securities generally is determined as of the close of trading on the principal exchange on which such securities trade. Events occurring after the close of trading on foreign exchanges may result in adjustments to the valuation of foreign securities to more accurately reflect their fair value as of the close of regular trading on the New York Stock Exchange. When valuing foreign equity securities that meet certain criteria, the Portfolio’s Trustees have approved the use of a fair value service that values such securities to reflect market trading that occurs after the close of the applicable foreign markets of comparable securities or other instruments that have a strong correlation to the fair-valued securities. Precious metals are valued at the New York composite mean quotation reported by Bloomberg at the valuation time. Exchange-traded options are valued at the mean between the bid and asked prices at valuation time as reported by the Options Price Reporting Authority for U.S. listed options or by the relevant exchange or board of trade for non-U.S. listed options. Over-the-counter options (including options on securities, indices and foreign currencies) are valued by a third party pricing service using techniques that consider factors including the value of the underlying instrument, the volatility of the underlying instrument and the period of time until option expiration. Financial and commodities futures contracts are valued at the closing settlement price established by the board of trade or exchange on which they are traded. Forward foreign currency exchange contracts are generally valued at the mean of the average bid and average asked prices that are reported by currency dealers to a third party pricing service at the valuation time. Such third party pricing service valuations are supplied for specific settlement periods and the Portfolio’s forward foreign currency exchange contracts are valued at an interpolated rate between the closest preceding and subsequent settlement period reported by the third party pricing service. Forward commodity contracts are generally valued based on the price of the underlying futures or forward contract provided by the exchange on which the underlying instruments are traded or if unavailable, based on forward rates provided by broker/dealers. Interest rate and cross-currency swaps are normally valued using valuations provided by a third party pricing service. Such pricing service valuations are based on the present value of fixed and projected floating rate cash flows over the term of the swap contract. Future cash flows are discounted to their present value using swap rates provided by electronic data services or by broker/dealers. Credit default swaps are normally valued using valuations provided by a third party pricing service. The pricing services employ electronic data processing techniques to determine the present value based on credit spread quotations obtained from broker/dealers and expected default recovery rates determined by the pricing service using proprietary models. Foreign securities and currencies are valued in U.S. dollars, based on foreign currency exchange rate quotations supplied by a third party pricing service. The pricing service uses a proprietary model to determine the exchange rate. Inputs to the model include reported trades and implied bid/ask spreads. Investments for which valuations or market quotations are not readily available or are deemed unreliable are valued at fair value using methods determined in good faith by or at the direction of the Trustees of the Portfolio in a manner that fairly reflects the security’s value, or the amount that the Portfolio might reasonably expect to receive for the security upon its current sale in the ordinary course. Each such determination is based on a consideration of relevant factors, which are likely to vary from one pricing context to another. These factors may include, but are not limited to, the type of security, the existence of any contractual restrictions on the security’s disposition, the price and extent of public trading in similar securities of the issuer or
Emerging Markets Local Income Portfolio
October 31, 2012
Notes to Consolidated Financial Statements — continued
of comparable companies or entities, quotations or relevant information obtained from broker/dealers or other market participants, information obtained from the issuer, analysts, and/or the appropriate stock exchange (for exchange-traded securities), an analysis of the company’s or entity’s financial condition, and an evaluation of the forces that influence the issuer and the market(s) in which the security is purchased and sold.
The Portfolio may invest in Eaton Vance Cash Reserves Fund, LLC (Cash Reserves Fund), an affiliated investment company managed by Eaton Vance Management (EVM). Cash Reserves Fund generally values its investment securities utilizing the amortized cost valuation technique in accordance with Rule 2a-7 under the 1940 Act. This technique involves initially valuing a portfolio security at its cost and thereafter assuming a constant amortization to maturity of any discount or premium. If amortized cost is determined not to approximate fair value, Cash Reserves Fund may value its investment securities in the same manner as debt obligations described above.
B Investment Transactions — Investment transactions for financial statement purposes are accounted for on a trade date basis. Realized gains and losses on investments sold are determined on the basis of identified cost.
C Income — Interest income is recorded on the basis of interest accrued, adjusted for amortization of premium or accretion of discount. Inflation adjustments to the principal amount of inflation-adjusted bonds and notes are reflected as interest income. Dividend income is recorded on the ex-dividend date for dividends received in cash and/or securities. However, if the ex-dividend date has passed, certain dividends from foreign securities are recorded as the Portfolio is informed of the ex-dividend date. Withholding taxes on foreign dividends, interest and capital gains have been provided for in accordance with the Portfolio’s understanding of the applicable countries’ tax rules and rates.
D Federal Taxes — The Portfolio has elected to be treated as a partnership for federal tax purposes. No provision is made by the Portfolio for federal or state taxes on any taxable income of the Portfolio because each investor in the Portfolio is ultimately responsible for the payment of any taxes on its share of taxable income. Since at least one of the Portfolio’s investors is a regulated investment company that invests all or substantially all of its assets in the Portfolio, the Portfolio normally must satisfy the applicable source of income and diversification requirements (under the Internal Revenue Code) in order for its investors to satisfy them. The Portfolio will allocate, at least annually among its investors, each investor’s distributive share of the Portfolio’s net investment income, net realized capital gains and any other items of income, gain, loss, deduction or credit.
The Subsidiary is treated as a controlled foreign corporation under the Internal Revenue Code and is not expected to be subject to U.S. federal income tax. The Portfolio is treated as a U.S. shareholder of the Subsidiary. As a result, the Portfolio is required to include in gross income for U.S. federal tax purposes all of the Subsidiary’s income, whether or not such income is distributed by the Subsidiary. If a net loss is realized by the Subsidiary, such loss is not generally available to offset the income earned by the Portfolio.
As of October 31, 2012, the Portfolio had no uncertain tax positions that would require financial statement recognition, de-recognition, or disclosure. The Portfolio files a U.S. federal income tax return annually after its fiscal year-end, which is subject to examination by the Internal Revenue Service for a period of three years from the date of filing.
E Expense Reduction — State Street Bank and Trust Company (SSBT) serves as custodian of the Portfolio. Pursuant to the custodian agreement, SSBT receives a fee reduced by credits, which are determined based on the average daily cash balance the Portfolio maintains with SSBT. All credit balances, if any, used to reduce the Portfolio’s custodian fees are reported as a reduction of expenses in the Consolidated Statement of Operations.
F Foreign Currency Translation — Investment valuations, other assets, and liabilities initially expressed in foreign currencies are translated each business day into U.S. dollars based upon current exchange rates. Purchases and sales of foreign investment securities and income and expenses denominated in foreign currencies are translated into U.S. dollars based upon currency exchange rates in effect on the respective dates of such transactions. Recognized gains or losses on investment transactions attributable to changes in foreign currency exchange rates are recorded for financial statement purposes as net realized gains and losses on investments. That portion of unrealized gains and losses on investments that results from fluctuations in foreign currency exchange rates is not separately disclosed.
G Use of Estimates — The preparation of the consolidated financial statements in conformity with accounting principles generally accepted in the United States of America requires management to make estimates and assumptions that affect the reported amounts of assets and liabilities at the date of the consolidated financial statements and the reported amounts of income and expense during the reporting period. Actual results could differ from those estimates.
H Indemnifications — Under the Portfolio’s organizational documents, its officers and Trustees may be indemnified against certain liabilities and expenses arising out of the performance of their duties to the Portfolio. Under Massachusetts law, if certain conditions prevail, interestholders in the Portfolio could be deemed to have personal liability for the obligations of the Portfolio. However, the Portfolio’s Declaration of Trust contains an express disclaimer of liability on the part of Portfolio interestholders and the By-laws provide that the Portfolio shall assume the defense on behalf of any Portfolio interestholder. Moreover, the By-laws also provide for indemnification out of Portfolio property of any interestholder held personally liable solely by reason of being or having been an interestholder for all loss or expense arising from such liability. Additionally, in the normal course of business, the Portfolio enters into agreements with service providers that may contain indemnification clauses. The Portfolio’s maximum exposure under these arrangements is unknown as this would involve future claims that may be made against the Portfolio that have not yet occurred.
I Financial and Commodities Futures Contracts — Upon entering into a financial or commodities futures contract, the Portfolio is required to deposit with the broker, either in cash or securities, an amount equal to a certain percentage of the purchase price (initial margin). Subsequent payments, known as
Emerging Markets Local Income Portfolio
October 31, 2012
Notes to Consolidated Financial Statements — continued
variation margin, are made or received by the Portfolio each business day, depending on the daily fluctuations in the value of the underlying security, commodity or currency, and are recorded as unrealized gains or losses by the Portfolio. Gains (losses) are realized upon the expiration or closing of the financial or commodities futures contracts. Should market conditions change unexpectedly, the Portfolio may not achieve the anticipated benefits of the financial or commodities futures contracts and may realize a loss. Futures contracts have minimal counterparty risk as they are exchange traded and the clearinghouse for the exchange is substituted as the counterparty, guaranteeing counterparty performance.
J Forward Foreign Currency Exchange and Forward Commodity Contracts — The Portfolio may enter into forward foreign currency exchange contracts for the purchase or sale of a specific foreign currency at a fixed price on a future date. The forward foreign currency exchange contracts are adjusted by the daily exchange rate of the underlying currency and any gains or losses are recorded as unrealized until such time as the contracts have been closed or offset by another contract with the same broker for the same settlement date and currency. Unrealized and realized gains and losses on forward commodity contracts, which are entered into for the purchase or sale of a specific commodity at a fixed price on a future date, are accounted for as described above. Risks may arise upon entering these contracts from the potential inability of counterparties to meet the terms of their contracts and, in the case of forward foreign currency exchange contracts, from movements in the value of a foreign currency relative to the U.S. dollar.
K Written Options — Upon the writing of a call or a put option, the premium received by the Portfolio is included in the Consolidated Statement of Assets and Liabilities as a liability. The amount of the liability is subsequently marked-to-market to reflect the current market value of the option written, in accordance with the Portfolio’s policies on investment valuations discussed above. Premiums received from writing options which expire are treated as realized gains. Premiums received from writing options which are exercised or are closed are added to or offset against the proceeds or amount paid on the transaction to determine the realized gain or loss. When an index option is exercised, the Portfolio is required to deliver an amount of cash determined by the excess of the strike price of the option over the value of the index (in the case of a put) or the excess of the value of the index over the strike price of the option (in the case of a call) at contract termination. If a put option on a security is exercised, the premium reduces the cost basis of the securities purchased by the Portfolio. The Portfolio, as a writer of an option, may have no control over whether the underlying securities or other assets may be sold (call) or purchased (put) and, as a result, bears the market risk of an unfavorable change in the price of the securities or other assets underlying the written option. The Portfolio may also bear the risk of not being able to enter into a closing transaction if a liquid secondary market does not exist.
L Purchased Options — Upon the purchase of a call or put option, the premium paid by the Portfolio is included in the Consolidated Statement of Assets and Liabilities as an investment. The amount of the investment is subsequently marked-to-market to reflect the current market value of the option purchased, in accordance with the Portfolio’s policies on investment valuations discussed above. As the purchaser of an index option, the Portfolio has the right to receive a cash payment equal to any depreciation in the value of the index below the strike price of the option (in the case of a put) or equal to any appreciation in the value of the index over the strike price of the option (in the case of a call) as of the valuation date of the option. If an option which the Portfolio had purchased expires on the stipulated expiration date, the Portfolio will realize a loss in the amount of the cost of the option. If the Portfolio enters into a closing sale transaction, the Portfolio will realize a gain or loss, depending on whether the sales proceeds from the closing sale transaction are greater or less than the cost of the option. If the Portfolio exercises a put option on a security, it will realize a gain or loss from the sale of the underlying security, and the proceeds from such sale will be decreased by the premium originally paid. If the Portfolio exercises a call option on a security, the cost of the security which the Portfolio purchases upon exercise will be increased by the premium originally paid. The risk associated with purchasing options is limited to the premium originally paid.
M Interest Rate Swaps — Pursuant to interest rate swap agreements, the Portfolio either makes floating-rate payments based on a benchmark interest rate in exchange for fixed-rate payments or the Portfolio makes fixed-rate payments in exchange for payments on a floating benchmark interest rate. Payments received or made are recorded as realized gains or losses. During the term of the outstanding swap agreement, changes in the underlying value of the swap are recorded as unrealized gains or losses. The value of the swap is determined by changes in the relationship between two rates of interest. The Portfolio is exposed to credit loss in the event of non-performance by the swap counterparty. Risk may also arise from movements in interest rates.
N Cross-Currency Swaps — Cross-currency swaps are interest rate swaps in which interest cash flows are exchanged between two parties based on the notional amounts of two different currencies. The notional amounts are typically determined based on the spot exchange rates at the inception of the trade. Cross-currency swaps also involve the exchange of the notional amounts at the start of the contract at the current spot rate with an agreement to re-exchange such amounts at a later date at either the same exchange rate, a specified rate or the then current spot rate. The entire principal value of a cross-currency swap is subject to the risk that the counterparty to the swap will default on its contractual delivery obligations.
O Credit Default Swaps — When the Portfolio is the buyer of a credit default swap contract, the Portfolio is entitled to receive the par (or other agreed-upon) value of a referenced debt obligation (or basket of debt obligations) from the counterparty to the contract if a credit event by a third party, such as a U.S. or foreign corporate issuer or sovereign issuer, on the debt obligation occurs. In return, the Portfolio pays the counterparty a periodic stream of payments over the term of the contract provided that no credit event has occurred. If no credit event occurs, the Portfolio would have spent the stream of payments and received no proceeds from the contract. When the Portfolio is the seller of a credit default swap contract, it receives the stream of payments, but is obligated to pay to the buyer of the protection an amount up to the notional amount of the swap and in certain instances take delivery of securities of the reference entity upon the occurrence of a credit event, as defined under the terms of that particular swap agreement. Credit events are contract specific but may include bankruptcy, failure to pay, restructuring, obligation acceleration and repudiation/moratorium. If the Portfolio is a seller of protection and a credit event occurs, the maximum potential amount of future payments that the Portfolio could be required to make would be an amount equal to the notional amount of the agreement. This potential amount would be partially offset by any recovery value of the respective referenced obligation, or net amount received from the settlement of a buy protection credit default swap agreement entered into by the Portfolio for the same referenced obligation.
Emerging Markets Local Income Portfolio
October 31, 2012
Notes to Consolidated Financial Statements — continued
As the seller, the Portfolio may create economic leverage to its portfolio because, in addition to its total net assets, the Portfolio is subject to investment exposure on the notional amount of the swap. The interest fee paid or received on the swap contract, which is based on a specified interest rate on a fixed notional amount, is accrued daily as a component of unrealized appreciation (depreciation) and is recorded as realized gain upon receipt or realized loss upon payment. The Portfolio also records an increase or decrease to unrealized appreciation (depreciation) in an amount equal to the daily valuation. Upfront payments or receipts, if any, are recorded as other assets or other liabilities, respectively, and amortized over the life of the swap contract as realized gains or losses. For financial reporting purposes, unamortized upfront payments, if any, are netted with unrealized appreciation or depreciation on swap contracts to determine the market value of swaps as presented in Notes 5 and 8. The Portfolio segregates assets in the form of cash or liquid securities in an amount equal to the notional amount of the credit default swaps of which it is the seller. The Portfolio segregates assets in the form of cash or liquid securities in an amount equal to any unrealized depreciation of the credit default swaps of which it is the buyer, marked to market on a daily basis. These transactions involve certain risks, including the risk that the seller may be unable to fulfill the transaction.
P Repurchase Agreements — A repurchase agreement is the purchase by the Portfolio of securities from a counterparty in exchange for cash that is coupled with an agreement to resell those securities to the counterparty at a specified date and price. When a repurchase agreement is entered, the Portfolio typically receives securities with a value that equals or exceeds the repurchase price, including any accrued interest earned on the agreement. The value of such securities will be marked to market daily, and cash or additional securities will be exchanged between the parties as needed. Except in the case of a repurchase agreement entered to settle a short sale, the value of the securities delivered to the Portfolio will be at least equal to 90% of the repurchase price during the term of the repurchase agreement. The terms of a repurchase agreement entered to settle a short sale may provide that the cash purchase price paid by the Portfolio is more than the value of purchased securities that effectively collateralize the repurchase price payable by the counterparty. Since in such a transaction, the Portfolio normally will have used the purchased securities to settle the short sale, the Portfolio will segregate liquid assets equal to the marked to market value of the purchased securities that it is obligated to return to the counterparty under the repurchase agreement. In the event of insolvency of the counterparty to a repurchase agreement, recovery of the repurchase price owed to the Portfolio may be delayed. Such an insolvency also may result in a loss to the extent that the value of the purchased securities decreases during the delay or that value has otherwise not been maintained at an amount at least equal to the repurchase price.
Q Securities Sold Short — A short sale is a transaction in which the Portfolio sells a security it does not own in anticipation of a decline in the market value of that security. To complete such a transaction, the Portfolio must borrow the security to make delivery to the buyer with an obligation to replace such borrowed security at a later date. Until the security is replaced, the Portfolio is required to repay the lender any dividends or interest, which accrue during the period of the loan. The proceeds received from a short sale are recorded as a liability and the Portfolio records an unrealized gain or loss to the extent of the difference between the proceeds received and the value of the open short position on the day of determination. A gain, limited to the price at which the Portfolio sold the security short, or a loss, potentially unlimited as there is no upward limit on the price of a security, is recorded when the short position is terminated. Interest and dividends payable on securities sold short are recorded as an expense.
2 Investment Adviser Fee and Other Transactions with Affiliates
The investment adviser fee is earned by Boston Management and Research (BMR), a subsidiary of EVM, as compensation for investment advisory services rendered to the Portfolio and the Subsidiary. Pursuant to the investment advisory agreement between the Portfolio and BMR and the investment advisory agreement between the Subsidiary and BMR, the Portfolio and Subsidiary each pay BMR a fee at an annual rate of 0.650% of its respective average daily net assets up to $1 billion, 0.625% from $1 billion but less than $2 billion, 0.600% from $2 billion but less than $5 billion, and 0.575% of average daily net assets of $5 billion or more, and is payable monthly. In determining the investment adviser fee for the Portfolio and Subsidiary, the applicable advisory fee rate is based on the average daily net assets of the Portfolio (inclusive of its interest in the Subsidiary). Such fee rate is then assessed separately on the Portfolio’s average daily net assets (exclusive of its interest in the Subsidiary) and the Subsidiary’s average daily net assets to determine the amount of the investment adviser fee. The Portfolio invests its cash in Cash Reserves Fund. EVM does not currently receive a fee for advisory services provided to Cash Reserves Fund. For the year ended October 31, 2012, the Portfolio’s investment adviser amounted to $4,959,810 or 0.65% of the Portfolio’s consolidated average daily net assets.
Trustees and officers of the Portfolio who are members of EVM’s or BMR’s organizations receive remuneration for their services to the Portfolio out of the investment adviser fee. Trustees of the Portfolio who are not affiliated with the investment adviser may elect to defer receipt of all or a percentage of their annual fees in accordance with the terms of the Trustees Deferred Compensation Plan. For the year ended October 31, 2012, no significant amounts have been deferred. Certain officers and Trustees of the Portfolio are officers of the above organizations.
Emerging Markets Local Income Portfolio
October 31, 2012
Notes to Consolidated Financial Statements — continued
3 Purchases and Sales of Investments
Purchases and sales of investments, other than short-term obligations and including maturities, paydowns and securities sold short, for the year ended October 31, 2012 were as follows:
| | | | | | | | |
| | | Purchases | | | Sales | |
| | |
Investments (non-U.S. Government) | | $ | 147,802,374 | | | $ | 137,087,893 | |
U.S. Government and Agency Securities | | | — | | | | 21,012,384 | |
| | |
| | | $ | 147,802,374 | | | $ | 158,100,277 | |
4 Federal Income Tax Basis of Investments
The cost and unrealized appreciation (depreciation) of investments of the Portfolio at October 31, 2012, as determined on a federal income tax basis, were as follows:
| | | | |
| |
Aggregate cost | | $ | 791,595,809 | |
| |
Gross unrealized appreciation | | $ | 21,904,688 | |
Gross unrealized depreciation | | | (36,512,377 | ) |
| |
Net unrealized depreciation | | $ | (14,607,689 | ) |
The net unrealized appreciation on written options, securities sold short, futures contracts, swap contracts, foreign currency and forward foreign currency exchange contracts at October 31, 2012 on a federal income tax basis was $9,153,227.
5 Financial Instruments
The Portfolio may trade in financial instruments with off-balance sheet risk in the normal course of its investing activities. These financial instruments may include written options, forward foreign currency exchange contracts, futures contracts and swap contracts and may involve, to a varying degree, elements of risk in excess of the amounts recognized for financial statement purposes. The notional or contractual amounts of these instruments represent the investment the Portfolio has in particular classes of financial instruments and do not necessarily represent the amounts potentially subject to risk. The measurement of the risks associated with these instruments is meaningful only when all related and offsetting transactions are considered.
A summary of obligations under these financial instruments at October 31, 2012 is as follows:
| | | | | | | | | | |
| Forward Foreign Currency Exchange Contracts | |
| | | | |
| | | | | | | | | | |
Sales | | | | | | | | | |
| Settlement Date | | Deliver | | In Exchange For | | Counterparty | | Net Unrealized
Appreciation
(Depreciation) | |
| | | | | | | | | | |
| | | | |
| 11/5/12 | | New Taiwan Dollar 44,152,000 | | United States Dollar 1,475,422 | | Australia and New Zealand Banking Group Limited | | $ | (35,973 | ) |
| 11/5/12 | | New Taiwan Dollar 32,965,000 | | United States Dollar 1,101,587 | | Citibank NA | | | (26,859 | ) |
| 11/5/12 | | New Taiwan Dollar 36,993,000 | | United States Dollar 1,236,190 | | JPMorgan Chase Bank | | | (30,141 | ) |
| 11/5/12 | | New Taiwan Dollar 42,795,000 | | United States Dollar 1,430,027 | | Nomura International PLC | | | (34,916 | ) |
| 11/7/12 | | New Turkish Lira 3,633,448 | | United States Dollar 1,994,427 | | Barclays Bank PLC | | | (31,020 | ) |
| 11/8/12 | | Serbian Dinar 97,070,000 | | Euro 850,000 | | Deutsche Bank | | | (4,464 | ) |
Emerging Markets Local Income Portfolio
October 31, 2012
Notes to Consolidated Financial Statements — continued
| | | | | | | | | | |
| Forward Foreign Currency Exchange Contracts (continued) | |
| | | | |
| | | | | | | | | | |
Sales | | | | | | | | | |
| Settlement Date | | Deliver | | In Exchange For | | Counterparty | | Net Unrealized
Appreciation
(Depreciation) | |
| | | | |
| 11/13/12 | | Polish Zloty 8,174,691 | | Euro 1,988,661 | | Barclays Bank PLC | | $ | 19,856 | |
| 11/15/12 | | Euro 380,000 | | United States Dollar 515,728 | | Goldman Sachs International | | | 23,136 | |
| 11/15/12 | | Japanese Yen 659,000,000 | | United States Dollar 8,418,498 | | Goldman Sachs International | | | 162,610 | |
| 11/16/12 | | New Taiwan Dollar 51,757,000 | | United States Dollar 1,729,153 | | BNP Paribas SA | | | (42,520 | ) |
| 11/16/12 | | New Taiwan Dollar 46,827,000 | | United States Dollar 1,564,185 | | JPMorgan Chase Bank | | | (38,731 | ) |
| 11/16/12 | | New Taiwan Dollar 49,705,000 | | United States Dollar 1,660,320 | | Nomura International PLC | | | (41,112 | ) |
| 11/19/12 | | Euro
2,360,000 | | United States Dollar 3,099,010 | | Goldman Sachs International | | | 39,645 | |
| 11/19/12 | | Singapore Dollar 1,644,000 | | United States Dollar 1,335,565 | | Goldman Sachs International | | | (12,173 | ) |
| 11/20/12 | | Euro 23,000,332 | | United States Dollar 28,297,242 | | Australia and New Zealand Banking Group Limited | | | (1,519,299 | ) |
| 11/20/12 | | Euro 15,474,650 | | United States Dollar 19,212,558 | | Bank of America | | | (848,045 | ) |
| 11/20/12 | | Euro 997,019 | | United States Dollar 1,225,162 | | Goldman Sachs International | | | (67,326 | ) |
| 11/22/12 | | Serbian Dinar 88,900,000 | | Euro 779,278 | | Citibank NA | | | 775 | |
| 11/22/12 | | Serbian Dinar 47,220,000 | | Euro 413,377 | | Citibank NA | | | (293 | ) |
| 11/23/12 | | Euro 173,000 | | United States Dollar 235,091 | | Credit Suisse International | | | 10,817 | |
| 11/26/12 | | Euro 5,780,926 | | United States Dollar 7,497,861 | | State Street Bank and Trust Co. | | | 3,351 | |
| 11/29/12 | | Euro 422,000 | | United States Dollar 566,240 | | Standard Chartered Bank | | | 19,136 | |
| 11/29/12 | | Malaysian Ringgit 4,710,000 | | United States Dollar 1,526,495 | | Goldman Sachs International | | | (16,618 | ) |
| 12/3/12 | | New Zealand Dollar 6,636,940 | | United States Dollar 5,483,208 | | Australia and New Zealand Banking Group Limited | | | 35,738 | |
| 12/3/12 | | New Zealand Dollar 20,130,638 | | United States Dollar 16,651,057 | | Goldman Sachs International | | | 128,228 | |
| 12/7/12 | | New Taiwan Dollar 61,405,000 | | United States Dollar 2,059,879 | | Barclays Bank PLC | | | (42,034 | ) |
| 12/7/12 | | New Taiwan Dollar 67,873,000 | | United States Dollar 2,277,235 | | Nomura International PLC | | | (46,079 | ) |
| 12/10/12 | | Euro 6,920,745 | | United States Dollar 9,017,731 | | Deutsche Bank | | | 44,214 | |
| 12/17/12 | | Australian Dollar 10,590,000 | | United States Dollar 10,801,853 | | Deutsche Bank | | | (151,329 | ) |
| 12/24/12 | | New Taiwan Dollar 44,080,200 | | United States Dollar 1,506,552 | | Australia and New Zealand Banking Group Limited | | | (2,576 | ) |
Emerging Markets Local Income Portfolio
October 31, 2012
Notes to Consolidated Financial Statements — continued
| | | | | | | | | | |
| Forward Foreign Currency Exchange Contracts (continued) | |
| | | | |
| | | | | | | | | | |
Sales | | | | | | | | | |
| Settlement Date | | Deliver | | In Exchange For | | Counterparty | | Net Unrealized
Appreciation
(Depreciation) | |
| | | | |
| 12/24/12 | | New Taiwan Dollar 55,100,250 | | United States Dollar 1,882,997 | | Citibank NA | | $ | (3,414 | ) |
| 12/24/12 | | New Taiwan Dollar 47,753,550 | | United States Dollar 1,631,930 | | Nomura International PLC | | | (2,958 | ) |
| 1/24/13 | | Euro 410,000 | | United States Dollar 535,009 | | Standard Chartered Bank | | | 3,141 | |
| 1/31/13 | | Euro 225,000 | | United States Dollar 296,208 | | State Street Bank and Trust Co. | | | 4,310 | |
| 2/7/13 | | Euro 180,000 | | United States Dollar 239,142 | | Standard Chartered Bank | | | 5,609 | |
| 2/28/13 | | Euro 389,000 | | United States Dollar 520,997 | | Standard Chartered Bank | | | 16,207 | |
| 3/8/13 | | Sri Lankan Rupee 18,920,000 | | United States Dollar 146,044 | | HSBC Bank USA | | | 5,886 | |
| 3/14/13 | | Euro 463,000 | | United States Dollar 605,664 | | Deutsche Bank | | | 4,768 | |
| 3/28/13 | | Euro 389,000 | | United States Dollar 520,548 | | JPMorgan Chase Bank | | | 15,625 | |
| 4/4/13 | | Euro 320,000 | | United States Dollar 427,867 | | Barclays Bank PLC | | | 12,479 | |
| | | | |
| | | | | | | | | $ | (2,442,349 | ) |
| | | | | | | | | | |
| | | | |
| | | | | | | | | | |
Purchases | |
| Settlement Date | | In Exchange For | | Deliver | | Counterparty | | Net Unrealized
Appreciation
(Depreciation) | |
| | | | |
| 11/8/12 | | Serbian Dinar 66,105,172 | | Euro 592,075 | | Citibank NA | | $ | (14,097 | ) |
| 11/8/12 | | South African Rand 12,600,000 | | United States Dollar 1,407,979 | | Standard Bank | | | 43,947 | |
| 11/8/12 | | South African Rand 31,204,124 | | United States Dollar 3,681,251 | | Standard Bank | | | (85,531 | ) |
| 11/8/12 | | South African Rand 48,559,000 | | United States Dollar 5,851,328 | | Standard Bank | | | (255,768 | ) |
| 11/8/12 | | South African Rand 6,124,479 | | United States Dollar 747,115 | | Standard Chartered Bank | | | (41,378 | ) |
| 11/8/12 | | South African Rand 48,559,516 | | United States Dollar 5,854,635 | | Standard Chartered Bank | | | (259,016 | ) |
| 11/9/12 | | Peruvian New Sol 3,010,200 | | United States Dollar 1,158,081 | | Standard Chartered Bank | | | 3,266 | |
| 11/13/12 | | Hong Kong Dollar 99,984,981 | | United States Dollar 12,891,972 | | Standard Chartered Bank | | | 9,498 | |
| 11/13/12 | | Polish Zloty 9,956,000 | | Euro
2,422,090 | | JPMorgan Chase Bank | | | (24,297 | ) |
| 11/13/12 | | South Korean Won 4,953,000,000 | | United States Dollar 4,352,181 | | Nomura International PLC | | | 186,550 | |
Emerging Markets Local Income Portfolio
October 31, 2012
Notes to Consolidated Financial Statements — continued
| | | | | | | | | | |
| Forward Foreign Currency Exchange Contracts (continued) | |
| | | | |
| | | | | | | | | | |
Purchases | |
| Settlement Date | | In Exchange For | | Deliver | | Counterparty | | Net Unrealized
Appreciation
(Depreciation) | |
| | | | | | | | | | |
| | | | |
| 11/13/12 | | Thai Baht 615,825,000 | | United States Dollar 19,656,080 | | BNP Paribas SA | | $ | 421,910 | |
| 11/13/12 | | Yuan Renminbi 10,940,000 | | United States Dollar 1,743,426 | | Bank of America | | | 8,786 | |
| 11/15/12 | | Indian Rupee 70,844,000 | | United States Dollar 1,267,108 | | Goldman Sachs International | | | 46,387 | |
| 11/15/12 | | Indian Rupee 86,588,000 | | United States Dollar 1,548,426 | | Standard Chartered Bank | | | 56,973 | |
| 11/15/12 | | Yuan Offshore Renminbi 34,164,000 | | United States Dollar 5,413,234 | | Deutsche Bank | | | 55,215 | |
| 11/19/12 | | Hong Kong Dollar 26,759,835 | | United States Dollar 3,452,214 | | Goldman Sachs International | | | 756 | |
| 11/19/12 | | Indian Rupee 215,703,000 | | United States Dollar 4,111,761 | | Deutsche Bank | | | (115,686 | ) |
| 11/19/12 | | Malaysian Ringgit 6,866,000 | | United States Dollar 2,231,322 | | Citibank NA | | | 19,864 | |
| 11/19/12 | | Philippine Peso 81,011,000 | | United States Dollar 1,957,781 | | Australia and New Zealand Banking Group Limited | | | 8,414 | |
| 11/19/12 | | Polish Zloty 161,650,473 | | United States Dollar 50,399,225 | | State Street Bank and Trust Co. | | | 147,139 | |
| 11/19/12 | | Singapore Dollar 11,184,000 | | United States Dollar 9,096,973 | | Standard Chartered Bank | | | 71,579 | |
| 11/19/12 | | Yuan Offshore Renminbi 8,552,000 | | United States Dollar 1,361,133 | | Goldman Sachs International | | | 7,337 | |
| 11/19/12 | | Yuan Offshore Renminbi 9,453,000 | | United States Dollar 1,503,938 | | Standard Chartered Bank | | | 8,708 | |
| 11/20/12 | | Indian Rupee 118,686,000 | | United States Dollar 2,193,421 | | Deutsche Bank | | | 4,895 | |
| 11/20/12 | | Indian Rupee 88,264,000 | | United States Dollar 1,630,894 | | Goldman Sachs International | | | 3,942 | |
| 11/20/12 | | Thai Baht 251,158,000 | | United States Dollar 7,928,593 | | Nomura International PLC | | | 256,337 | |
| 11/20/12 | | Yuan Offshore Renminbi 18,187,000 | | United States Dollar 2,893,485 | | Bank of America | | | 16,540 | |
| 11/20/12 | | Yuan Offshore Renminbi 17,321,000 | | United States Dollar 2,755,708 | | Barclays Bank PLC | | | 15,753 | |
| 11/20/12 | | Yuan Offshore Renminbi 17,703,000 | | United States Dollar 2,814,915 | | Citibank NA | | | 17,667 | |
| 11/21/12 | | South Korean Won 2,199,658,000 | | United States Dollar 1,941,703 | | Standard Chartered Bank | | | 73,070 | |
| 11/26/12 | | Hungarian Forint 748,858,885 | | United States Dollar 3,376,280 | | State Street Bank and Trust Co. | | | 39,055 | |
| 11/26/12 | | Swedish Krona 20,263,000 | | Euro
2,379,264 | | Barclays Bank PLC | | | (31,751 | ) |
| 11/26/12 | | Swedish Krona 9,300,000 | | Euro
1,092,075 | | Credit Suisse International | | | (14,673 | ) |
| 11/26/12 | | Swedish Krona 20,263,800 | | Euro
2,379,386 | | Deutsche Bank | | | (31,789 | ) |
Emerging Markets Local Income Portfolio
October 31, 2012
Notes to Consolidated Financial Statements — continued
| | | | | | | | | | |
| Forward Foreign Currency Exchange Contracts (continued) | |
| | | | |
| | | | | | | | | | |
Purchases | |
| | | | |
| | | | | | | | | | |
| Settlement Date | | In Exchange For | | Deliver | | Counterparty | | Net Unrealized
Appreciation
(Depreciation) | |
| | | | |
| 11/27/12 | | Polish Zloty 82,989,923 | | Euro
20,124,136 | | HSBC Bank USA | | $ | (164,586 | ) |
| 11/29/12 | | South Korean Won 2,199,516,000 | | United States Dollar 1,984,854 | | Standard Chartered Bank | | | 28,885 | |
| 11/30/12 | | Hong Kong Dollar 3,500,000 | | United States Dollar 451,415 | | Standard Chartered Bank | | | 219 | |
| 12/3/12 | | Malaysian Ringgit 5,600,000 | | United States Dollar 1,820,250 | | Citibank NA | | | 13,891 | |
| 12/4/12 | | Brazilian Real 77,294,000 | | United States Dollar 37,872,507 | | BNP Paribas SA | | | 31,232 | |
| 12/10/12 | | South African Rand 24,551,603 | | United States Dollar 2,870,160 | | Credit Suisse International | | | (54,364 | ) |
| 12/10/12 | | South African Rand 4,500,000 | | United States Dollar 523,353 | | Deutsche Bank | | | (7,253 | ) |
| 12/14/12 | | Hungarian Forint 68,091,500 | | United States Dollar 286,039 | | Goldman Sachs International | | | 23,808 | |
| 12/17/12 | | South Korean Won 2,887,426,000 | | United States Dollar 2,587,995 | | Standard Chartered Bank | | | 53,096 | |
| 12/18/12 | | Russian Ruble 264,394,000 | | United States Dollar 8,447,093 | | BNP Paribas SA | | | (86,092 | ) |
| 12/31/12 | | Mexican Peso 729,625,389 | | United States Dollar 55,922,847 | | Toronto-Dominion Bank | | | (510,046 | ) |
| 1/11/13 | | Colombian Peso 1,178,600,000 | | United States Dollar 647,689 | | Bank of Nova Scotia | | | (9,360 | ) |
| 1/14/13 | | Indian Rupee 44,175,000 | | United States Dollar 823,699 | | Deutsche Bank | | | (13,490 | ) |
| 1/14/13 | | Indian Rupee 45,301,000 | | United States Dollar 844,853 | | Goldman Sachs International | | | (13,992 | ) |
| 1/22/13 | | Malaysian Ringgit 184,051,000 | | United States Dollar 60,405,986 | | HSBC Bank USA | | | (333,052 | ) |
| 1/29/13 | | Indian Rupee 51,700,000 | | United States Dollar 949,495 | | Citibank NA | | | (3,557 | ) |
| 1/29/13 | | Indian Rupee 55,500,000 | | United States Dollar 1,019,471 | | Deutsche Bank | | | (4,006 | ) |
| 1/30/13 | | Yuan Renminbi 6,541,350 | | United States Dollar 1,038,969 | | Citibank NA | | | 1,148 | |
| 1/31/13 | | Norwegian Krone 22,382,941 | | Euro
2,991,672 | | Barclays Bank PLC | | | 31,938 | |
| 1/31/13 | | Norwegian Krone 22,382,941 | | Euro
2,992,332 | | Deutsche Bank | | | 31,082 | |
| 1/31/13 | | Peruvian New Sol 6,787,570 | | United States Dollar 2,599,108 | | Deutsche Bank | | | 7,346 | |
| 2/19/13 | | Indian Rupee 69,732,000 | | United States Dollar 1,298,306 | | Bank of America | | | (26,698 | ) |
| 2/19/13 | | Indian Rupee 97,053,000 | | United States Dollar 1,807,318 | | Citibank NA | | | (37,495 | ) |
| | | | |
| | | | | | | | | $ | (391,744 | ) |
Emerging Markets Local Income Portfolio
October 31, 2012
Notes to Consolidated Financial Statements — continued
| | | | | | | | | | | | | | | | |
| Futures Contracts | |
| Expiration Month/Year | | Contracts | | Position | | Aggregate Cost | | | Value | | | Net Unrealized
Appreciation
(Depreciation) | |
| | | | | |
| 11/12 | | 32 CAC 40 Index | | Short | | $ | (1,456,872 | ) | | $ | (1,420,580 | ) | | $ | 36,292 | |
| 11/12 | | 89
Hang Seng H-Shares | | Long | | | 6,089,453 | | | | 6,090,432 | | | | 979 | |
| 12/12 | | 39
Dow Jones Euro Stoxx 50 Index | | Short | | | (1,281,438 | ) | | | (1,265,767 | ) | | | 15,671 | |
| 12/12 | | 140
Euro-Bobl | | Short | | | (22,796,805 | ) | | | (22,833,227 | ) | | | (36,422 | ) |
| 12/12 | | 17
Euro-Bund | | Short | | | (3,076,416 | ) | | | (3,121,853 | ) | | | (45,437 | ) |
| 12/12 | | 11
Euro-Schatz | | Short | | | (1,579,605 | ) | | | (1,578,322 | ) | | | 1,283 | |
| 12/12 | | 8
Japan 10-Year Bond | | Short | | | (14,421,143 | ) | | | (14,455,719 | ) | | | (34,576 | ) |
| 1/13 | | 22
Platinum | | Long | | | 1,833,986 | | | | 1,734,700 | | | | (99,286 | ) |
| | | | | |
| | | | | | | | | | | | | | | $ | (161,496 | ) |
CAC 40 Index: Cotation Assistée en Continu Index comprised of the 40 largest companies listed on the Paris Bourse Exchange.
Dow Jones Euro Stoxx 50 Index: Market capitalization-weighted stock index of 50 large, blue chip European companies operating within eurozone nations.
Euro-Bobl: Medium-term debt securities issued by the Federal Republic of Germany with a term to maturity of 4.5 to 5 years.
Euro-Bund: Long-term debt securities issued by the Federal Republic of Germany with a term to maturity of 8.5 to 10.5 years.
Euro-Schatz: Short-term debt securities issued by the Federal Republic of Germany with a term to maturity of 1.75 to 2.25 years.
Hang Seng H-Shares: Hang Seng China Enterprises Index comprised of H-Shares listed on the Hong Kong Stock Exchange.
Japan 10-Year Bond: Japanese Government Bonds (JGB) having a maturity of 7 years or more but less than 11 years.
| | | | | | | | | | | | | | | | | | |
| Interest Rate Swaps | |
| | | | | | |
| | | | | | | | | | | | | | | | | | |
| Counterparty | | Notional
Amount
(000’s omitted) | | Portfolio
Pays/Receives
Floating Rate | | Floating
Rate Index | | Annual
Fixed Rate | | | Termination
Date | | | Net Unrealized
Appreciation
(Depreciation) | |
| | | | | | |
| Bank of America | | MXN 26,000 | | Pays | | Mexican Interbank Deposit Rate | | | 6.46 | % | | | 9/24/20 | | | $ | 90,138 | |
| Bank of America | | PLN 10,700 | | Pays | | 6-month PLN WIBOR | | | 4.88 | | | | 9/14/14 | | | | 39,843 | |
| Bank of America | | PLN 1,553 | | Pays | | 6-month PLN WIBOR | | | 4.34 | | | | 7/30/17 | | | | 1,723 | |
| Bank of America | | PLN 1,820 | | Pays | | 6-month PLN WIBOR | | | 4.31 | | | | 8/10/17 | | | | 1,464 | |
| Bank of America | | PLN 2,950 | | Pays | | 6-month PLN WIBOR | | | 4.35 | | | | 8/23/17 | | | | 4,209 | |
| Bank of America | | PLN 2,970 | | Pays | | 6-month PLN WIBOR | | | 4.30 | | | | 9/18/17 | | | | 3,153 | |
| Bank of America | | PLN 3,600 | | Pays | | 6-month PLN WIBOR | | | 4.95 | | | | 9/14/20 | | | | 45,871 | |
| Bank of America | | PLN 8,765 | | Pays | | 6-month PLN WIBOR | | | 5.45 | | | | 6/7/21 | | | | 218,487 | |
| Barclays Bank PLC | | MXN 48,400 | | Pays | | Mexican Interbank Deposit Rate | | | 7.11 | | | | 5/21/21 | | | | 328,192 | |
| Barclays Bank PLC | | MYR 26,000 | | Pays | | 3-month MYR KLIBOR | | | 3.39 | | | | 11/23/13 | | | | 26,057 | |
Emerging Markets Local Income Portfolio
October 31, 2012
Notes to Consolidated Financial Statements — continued
| | | | | | | | | | | | | | | | | | |
| Interest Rate Swaps (continued) | |
| | | | | | |
| | | | | | | | | | | | | | | | | | |
| Counterparty | | Notional
Amount
(000’s omitted) | | Portfolio
Pays/Receives
Floating Rate | | Floating
Rate Index | | Annual
Fixed Rate | | | Termination
Date | | | Net Unrealized
Appreciation
(Depreciation) | |
| | | | | | |
| Barclays Bank PLC | | MYR 18,000 | | Pays | | 3-month MYR KLIBOR | | | 3.70 | % | | | 10/19/15 | | | $ | 95,665 | |
| Barclays Bank PLC | | MYR 21,700 | | Pays | | 3-month MYR KLIBOR | | | 3.96 | | | | 7/26/16 | | | | 193,143 | |
| Barclays Bank PLC | | MYR 10,000 | | Pays | | 3-month MYR KLIBOR | | | 4.13 | | | | 10/19/20 | | | | 147,033 | |
| Barclays Bank PLC | | PLN 8,000 | | Pays | | 6-month PLN WIBOR | | | 5.42 | | | | 6/1/14 | | | | 49,025 | |
| Barclays Bank PLC | | PLN 14,300 | | Pays | | 6-month PLN WIBOR | | | 5.02 | | | | 7/30/14 | | | | 57,324 | |
| Barclays Bank PLC | | PLN 24,000 | | Pays | | 6-month PLN WIBOR | | | 5.18 | | | | 11/9/14 | | | | 347,458 | |
| Barclays Bank PLC | | PLN 6,570 | | Pays | | 6-month PLN WIBOR | | | 4.43 | | | | 7/27/17 | | | | 15,507 | |
| Barclays Bank PLC | | PLN 3,893 | | Pays | | 6-month PLN WIBOR | | | 4.32 | | | | 8/2/17 | | | | 3,307 | |
| Barclays Bank PLC | | PLN 2,200 | | Pays | | 6-month PLN WIBOR | | | 4.35 | | | | 8/27/17 | | | | 3,177 | |
| Barclays Bank PLC | | PLN 2,300 | | Pays | | 6-month PLN WIBOR | | | 5.36 | | | | 7/30/20 | | | | 48,420 | |
| Barclays Bank PLC | | THB 143,000 | | Pays | | 6-month THBFIX | | | 3.34 | | | | 2/16/15 | | | | 62,589 | |
| Barclays Bank PLC | | THB 149,550 | | Pays | | 6-month THBFIX | | | 3.21 | | | | 10/4/20 | | | | (40,716 | ) |
| Barclays Bank PLC | | ZAR 53,700 | | Pays | | 3-month JIBAR | | | 7.41 | | | | 9/24/20 | | | | 277,569 | |
| BNP Paribas NA | | PLN 3,946 | | Pays | | 6-month PLN WIBOR | | | 4.25 | | | | 8/7/17 | | | | (437 | ) |
| Citibank NA | | MXN 50,000 | | Pays | | Mexican Interbank Deposit Rate | | | 9.08 | | | | 8/6/13 | | | | 123,899 | |
| Citibank NA | | MXN 48,000 | | Pays | | Mexican Interbank Deposit Rate | | | 6.86 | | | | 11/10/20 | | | | 259,113 | |
| Citibank NA | | MYR 37,000 | | Pays | | 3-month MYR KLIBOR | | | 3.48 | | | | 3/4/13 | | | | 15,912 | |
| Citibank NA | | MYR 17,300 | | Pays | | 3-month MYR KLIBOR | | | 3.72 | | | | 5/7/22 | | | | 77,332 | |
| Citibank NA | | PLN 2,983 | | Pays | | 6-month PLN WIBOR | | | 4.33 | | | | 7/30/17 | | | | 3,206 | |
| Citibank NA | | PLN 2,427 | | Pays | | 6-month PLN WIBOR | | | 4.31 | | | | 8/2/17 | | | | 1,892 | |
| Citibank NA | | PLN 1,780 | | Pays | | 6-month PLN WIBOR | | | 4.30 | | | | 8/10/17 | | | | 1,182 | |
| Citibank NA | | PLN 1,320 | | Pays | | 6-month PLN WIBOR | | | 4.40 | | | | 8/20/17 | | | | 2,858 | |
| Citibank NA | | THB 69,000 | | Pays | | 6-month THBFIX | | | 3.40 | | | | 1/14/15 | | | | 34,787 | |
| Credit Suisse International | | MXN 42,000 | | Pays | | Mexican Interbank Deposit Rate | | | 6.24 | | | | 7/31/15 | | | | 91,953 | |
| Credit Suisse International | | MXN 45,000 | | Pays | | Mexican Interbank Deposit Rate | | | 5.84 | | | | 10/1/15 | | | | 66,784 | |
| Credit Suisse International | | MXN 41,500 | | Pays | | Mexican Interbank Deposit Rate | | | 6.36 | | | | 10/23/20 | | | | 122,715 | |
| Credit Suisse International | | PLN 1,670 | | Pays | | 6-month PLN WIBOR | | | 4.40 | | | | 8/20/17 | | | | 3,615 | |
| Credit Suisse International | | USD 1,614 | | Receives | | 3-month-USD-LIBOR-BBA | | | 1.81 | | | | 10/23/22 | | | | (10,764 | ) |
| Deutsche Bank | | BRL 19,700 | | Pays | | Brazilian Interbank Deposit Rate | | | 10.02 | | | | 7/1/15 | | | | 631,380 | |
| Deutsche Bank | | MXN 85,500 | | Pays | | Mexican Interbank Deposit Rate | | | 6.38 | | | | 6/17/16 | | | | 244,429 | |
| Deutsche Bank | | MYR 10,800 | | Pays | | 3-month MYR KLIBOR | | | 4.38 | | | | 11/23/20 | | | | 228,112 | |
| Deutsche Bank | | PLN 5,400 | | Pays | | 6-month PLN WIBOR | | | 4.85 | | | | 4/23/14 | | | | 54,357 | |
| Deutsche Bank | | PLN 3,100 | | Pays | | 6-month PLN WIBOR | | | 5.11 | | | | 4/23/17 | | | | 60,321 | |
| Deutsche Bank | | PLN 1,764 | | Pays | | 6-month PLN WIBOR | | | 4.34 | | | | 7/30/17 | | | | 2,081 | |
| Deutsche Bank | | PLN 5,339 | | Pays | | 6-month PLN WIBOR | | | 4.36 | | | | 8/1/17 | | | | 7,609 | |
| Deutsche Bank | | PLN 2,880 | | Pays | | 6-month PLN WIBOR | | | 4.28 | | | | 8/6/17 | | | | 881 | |
| Deutsche Bank | | PLN 2,174 | | Pays | | 6-month PLN WIBOR | | | 4.24 | | | | 8/7/17 | | | | (394 | ) |
| Deutsche Bank | | PLN 1,550 | | Pays | | 6-month PLN WIBOR | | | 4.33 | | | | 8/17/17 | | | | 1,625 | |
Emerging Markets Local Income Portfolio
October 31, 2012
Notes to Consolidated Financial Statements — continued
| | | | | | | | | | | | | | | | | | |
| Interest Rate Swaps (continued) | |
| | | | | | |
| | | | | | | | | | | | | | | | | | |
| Counterparty | | Notional
Amount
(000’s omitted) | | Portfolio
Pays/Receives
Floating Rate | | Floating
Rate Index | | Annual
Fixed Rate | | | Termination
Date | | | Net Unrealized
Appreciation
(Depreciation) | |
| | | | | | |
| Deutsche Bank | | PLN 13,900 | | Pays | | 6-month PLN WIBOR | | | 5.04 | % | | | 4/18/22 | | | $ | 330,970 | |
| Goldman Sachs International | | PLN 1,061 | | Pays | | 6-month PLN WIBOR | | | 4.35 | | | | 8/1/17 | | | | 1,334 | |
| Goldman Sachs International | | PLN 17,000 | | Pays | | 6-month PLN WIBOR | | | 5.32 | | | | 7/11/18 | | | | 290,182 | |
| Goldman Sachs International | | PLN 11,000 | | Pays | | 6-month PLN WIBOR | | | 5.54 | | | | 5/10/21 | | | | 300,410 | |
| Goldman Sachs International | | ZAR 31,560 | | Pays | | 3-month JIBAR | | | 8.07 | | | | 7/7/21 | | | | 298,229 | |
| HSBC Bank USA | | MXN 44,030 | | Pays | | Mexican Interbank Deposit Rate | | | 7.28 | | | | 12/23/20 | | | | 335,210 | |
| HSBC Bank USA | | THB 262,000 | | Pays | | 6-month THBFIX | | | 2.67 | | | | 10/21/15 | | | | (38,726 | ) |
| HSBC Bank USA | | THB 94,300 | | Pays | | 6-month THBFIX | | | 3.26 | | | | 8/19/20 | | | | (9,227 | ) |
| HSBC Bank USA | | THB 159,000 | | Pays | | 6-month THBFIX | | | 3.50 | | | | 11/25/20 | | | | 81,316 | |
| JPMorgan Chase Bank | | BRL 41,183 | | Pays | | Brazilian Interbank Deposit Rate | | | 9.63 | | | | 1/2/14 | | | | 721,169 | |
| JPMorgan Chase Bank | | BRL 11,100 | | Pays | | Brazilian Interbank Deposit Rate | | | 9.19 | | | | 1/2/17 | | | | 185,034 | |
| JPMorgan Chase Bank | | MYR 27,300 | | Pays | | 3-month MYR KLIBOR | | | 3.25 | | | | 9/8/14 | | | | 26,823 | |
| JPMorgan Chase Bank | | MYR 4,750 | | Pays | | 3-month MYR KLIBOR | | | 4.44 | | | | 4/8/19 | | | | 95,660 | |
| JPMorgan Chase Bank | | PLN 16,600 | | Pays | | 6-month PLN WIBOR | | | 4.75 | | | | 10/11/13 | | | | 13,315 | |
| JPMorgan Chase Bank | | PLN 31,500 | | Pays | | 6-month PLN WIBOR | | | 5.06 | | | | 11/26/13 | | | | 320,222 | |
| JPMorgan Chase Bank | | PLN 1,210 | | Pays | | 6-month PLN WIBOR | | | 4.33 | | | | 8/17/17 | | | | 1,268 | |
| JPMorgan Chase Bank | | PLN 4,670 | | Pays | | 6-month PLN WIBOR | | | 4.25 | | | | 10/8/17 | | | | 1,972 | |
| JPMorgan Chase Bank | | PLN 16,200 | | Pays | | 6-month PLN WIBOR | | | 4.93 | | | | 10/13/17 | | | | 163,797 | |
| JPMorgan Chase Bank | | PLN 9,900 | | Pays | | 6-month PLN WIBOR | | | 4.91 | | | | 10/11/18 | | | | 106,406 | |
| JPMorgan Chase Bank | | PLN 15,099 | | Pays | | 6-month PLN WIBOR | | | 5.62 | | | | 4/8/21 | | | | 547,788 | |
| JPMorgan Chase Bank | | THB 108,000 | | Pays | | 6-month THBFIX | | | 3.22 | | | | 10/21/20 | | | | (23,778 | ) |
| JPMorgan Chase Bank | | ZAR 36,500 | | Pays | | 3-month JIBAR | | | 9.05 | | | | 10/12/15 | | | | 427,847 | |
| Morgan Stanley & Co. International PLC | | MXN 118,400 | | Pays | | Mexican Interbank Deposit Rate | | | 4.82 | | | | 9/4/14 | | | | (44,200 | ) |
| Morgan Stanley & Co. International PLC | | MXN 29,200 | | Pays | | Mexican Interbank Deposit Rate | | | 7.95 | | | | 12/3/31 | | | | 303,759 | |
| Morgan Stanley & Co. International PLC | | PLN 32,000 | | Pays | | 6-month PLN WIBOR | | | 4.87 | | | | 10/26/16 | | | | 261,691 | |
| Standard Bank | | ZAR 62,500 | | Pays | | 3-month JIBAR | | | 7.98 | | | | 5/20/19 | | | | 643,413 | |
| Standard Bank | | ZAR 22,000 | | Pays | | 3-month JIBAR | | | 7.93 | | | | 6/2/21 | | | | 192,083 | |
| Standard Bank | | ZAR 32,700 | | Pays | | 3-month JIBAR | | | 7.12 | | | | 6/27/22 | | | | 37,411 | |
| Standard Chartered Bank | | BRL 19,000 | | Pays | | Brazilian Interbank Deposit Rate | | | 12.12 | | | | 1/2/13 | | | | 441,395 | |
| | | | | | |
| | | | | | | | | | | | | | | | | $ | 10,055,859 | |
| | | | |
| BRL | | – | | Brazilian Real |
| MXN | | – | | Mexican Peso |
| MYR | | – | | Malaysian Ringgit |
| PLN | | – | | Polish Zloty |
| THB | | – | | Thai Baht |
| USD | | – | | United States Dollar |
| ZAR | | – | | South African Rand |
Emerging Markets Local Income Portfolio
October 31, 2012
Notes to Consolidated Financial Statements —continued
| | | | | | | | | | | | | | | | | | | | | | | | | | | | | | |
| Credit Default Swaps — Sell Protection | |
| | | | | | | | |
| | | | | | | | | | | | | | | | | | | | | | | | | | | | | | |
Reference
Entity | | Counterparty | | Notional
Amount*
(000’s omitted) | | | Contract
Annual
Fixed Rate** | | | Termination
Date | | | Current
Market
Annual
Fixed Rate*** | | | Market
Value | | | Upfront
Payments
Received
(Paid) | | | Net Unrealized
Appreciation
(Depreciation) | |
| | | | | | | | |
| Argentina | | Bank of America | | $ | 667 | | | | 5.00 | %(1) | | | 6/20/13 | | | | 29.91 | % | | $ | (90,433 | ) | | $ | (3,676 | ) | | $ | (94,109 | ) |
| Argentina | | Bank of America | | | 695 | | | | 5.00 | (1) | | | 6/20/13 | | | | 29.91 | | | | (94,146 | ) | | | (3,953 | ) | | | (98,099 | ) |
| Argentina | | Bank of America | | | 760 | | | | 5.00 | (1) | | | 6/20/13 | | | | 29.91 | | | | (102,995 | ) | | | (3,174 | ) | | | (106,169 | ) |
| Argentina | | Bank of America | | | 1,520 | | | | 5.00 | (1) | | | 6/20/13 | | | | 29.91 | | | | (205,992 | ) | | | (6,164 | ) | | | (212,156 | ) |
| Argentina | | Bank of America | | | 4,959 | | | | 5.00 | (1) | | | 6/20/13 | | | | 29.91 | | | | (672,047 | ) | | | (8,817 | ) | | | (680,864 | ) |
| Argentina | | Credit Suisse International | | | 379 | | | | 5.00 | (1) | | | 6/20/13 | | | | 29.91 | | | | (51,362 | ) | | | (1,127 | ) | | | (52,489 | ) |
| Argentina | | Credit Suisse International | | | 734 | | | | 5.00 | (1) | | | 6/20/13 | | | | 29.91 | | | | (99,473 | ) | | | (3,073 | ) | | | (102,546 | ) |
| Argentina | | Credit Suisse International | | | 763 | | | | 5.00 | (1) | | | 6/20/13 | | | | 29.91 | | | | (103,402 | ) | | | (3,195 | ) | | | (106,597 | ) |
| Argentina | | Credit Suisse International | | | 826 | | | | 5.00 | (1) | | | 6/20/13 | | | | 29.91 | | | | (111,940 | ) | | | (1,469 | ) | | | (113,409 | ) |
| Argentina | | Deutsche Bank | | | 668 | | | | 5.00 | (1) | | | 6/20/13 | | | | 29.91 | | | | (90,527 | ) | | | (2,796 | ) | | | (93,323 | ) |
| Argentina | | Deutsche Bank | | | 695 | | | | 5.00 | (1) | | | 6/20/13 | | | | 29.91 | | | | (94,159 | ) | | | (3,954 | ) | | | (98,113 | ) |
| Argentina | | Deutsche Bank | | | 734 | | | | 5.00 | (1) | | | 6/20/13 | | | | 29.91 | | | | (99,473 | ) | | | (3,073 | ) | | | (102,546 | ) |
| Argentina | | Deutsche Bank | | | 1,500 | | | | 5.00 | (1) | | | 6/20/13 | | | | 29.91 | | | | (203,281 | ) | | | (5,840 | ) | | | (209,121 | ) |
| Poland | | Bank of America | | | 2,220 | | | | 1.00 | (1) | | | 9/20/17 | | | | 0.85 | | | | 18,145 | | | | 98,814 | | | | 116,959 | |
| Poland | | Bank of America | | | 1,210 | | | | 1.00 | (1) | | | 9/20/17 | | | | 0.85 | | | | 9,890 | | | | 36,198 | | | | 46,088 | |
| Poland | | Barclays Bank PLC | | | 800 | | | | 1.00 | (1) | | | 9/20/17 | | | | 0.85 | | | | 6,539 | | | | 39,781 | | | | 46,320 | |
| Poland | | Barclays Bank PLC | | | 630 | | | | 1.00 | (1) | | | 9/20/17 | | | | 0.85 | | | | 5,150 | | | | 18,563 | | | | 23,713 | |
| Poland | | Citibank NA | | | 4,800 | | | | 1.00 | (1) | | | 9/20/17 | | | | 0.85 | | | | 39,233 | | | | 122,003 | | | | 161,236 | |
| Poland | | Credit Suisse International | | | 1,330 | | | | 1.00 | (1) | | | 9/20/17 | | | | 0.85 | | | | 10,871 | | | | 63,270 | | | | 74,141 | |
| Poland | | Deutsche Bank | | | 100 | | | | 1.00 | (1) | | | 9/20/17 | | | | 0.85 | | | | 817 | | | | 5,103 | | | | 5,920 | |
| Poland | | Deutsche Bank | | | 300 | | | | 1.00 | (1) | | | 6/20/22 | | | | 1.38 | | | | (9,529 | ) | | | 49,283 | | | | 39,754 | |
| Poland | | Goldman Sachs International | | | 730 | | | | 1.00 | (1) | | | 9/20/17 | | | | 0.85 | | | | 5,967 | | | | 21,035 | | | | 27,002 | |
| Poland | | JPMorgan Chase Bank | | | 900 | | | | 1.00 | (1) | | | 9/20/17 | | | | 0.85 | | | | 7,356 | | | | 25,231 | | | | 32,587 | |
| Poland | | JPMorgan Chase Bank | | | 420 | | | | 1.00 | (1) | | | 9/20/17 | | | | 0.85 | | | | 3,433 | | | | 12,765 | | | | 16,198 | |
| Poland | | Morgan Stanley & Co. International PLC | | | 480 | | | | 1.00 | (1) | | | 9/20/17 | | | | 0.85 | | | | 3,924 | | | | 14,156 | | | | 18,080 | |
| South Africa | | Bank of America | | | 775 | | | | 1.00 | (1) | | | 12/20/15 | | | | 1.00 | | | | 884 | | | | 3,918 | | | | 4,802 | |
| South Africa | | Bank of America | | | 525 | | | | 1.00 | (1) | | | 12/20/15 | | | | 1.00 | | | | 599 | | | | 2,782 | | | | 3,381 | |
| South Africa | | Bank of America | | | 2,600 | | | | 1.00 | (1) | | | 9/20/17 | | | | 1.46 | | | | (53,267 | ) | | | 83,285 | | | | 30,018 | |
| South Africa | | Bank of America | | | 920 | | | | 1.00 | (1) | | | 9/20/17 | | | | 1.46 | | | | (18,848 | ) | | | 15,367 | | | | (3,481 | ) |
| South Africa | | Bank of America | | | 680 | | | | 1.00 | (1) | | | 9/20/17 | | | | 1.46 | | | | (13,931 | ) | | | 10,124 | | | | (3,807 | ) |
| South Africa | | Bank of America | | | 3,040 | | | | 1.00 | (1) | | | 9/20/17 | | | | 1.46 | | | | (62,282 | ) | | | 38,231 | | | | (24,051 | ) |
| South Africa | | Barclays Bank PLC | | | 750 | | | | 1.00 | (1) | | | 12/20/15 | | | | 1.00 | | | | 856 | | | | 4,412 | | | | 5,268 | |
| South Africa | | Barclays Bank PLC | | | 565 | | | | 1.00 | (1) | | | 12/20/15 | | | | 1.00 | | | | 645 | | | | 3,352 | | | | 3,997 | |
| South Africa | | Barclays Bank PLC | | | 450 | | | | 1.00 | (1) | | | 9/20/17 | | | | 1.46 | | | | (9,220 | ) | | | 11,181 | | | | 1,961 | |
| South Africa | | Barclays Bank PLC | | | 431 | | | | 1.00 | (1) | | | 9/20/17 | | | | 1.46 | | | | (8,830 | ) | | | 9,987 | | | | 1,157 | |
| South Africa | | BNP Paribas SA | | | 750 | | | | 1.00 | (1) | | | 9/20/17 | | | | 1.46 | | | | (15,366 | ) | | | 19,312 | | | | 3,946 | |
| South Africa | | BNP Paribas SA | | | 1,140 | | | | 1.00 | (1) | | | 9/20/17 | | | | 1.46 | | | | (23,356 | ) | | | 24,836 | | | | 1,480 | |
| South Africa | | Credit Suisse International | | | 840 | | | | 1.00 | (1) | | | 12/20/15 | | | | 1.00 | | | | 958 | | | | 11,093 | | | | 12,051 | |
| South Africa | | Credit Suisse International | | | 790 | | | | 1.00 | (1) | | | 12/20/15 | | | | 1.00 | | | | 901 | | | | 5,109 | | | | 6,010 | |
| South Africa | | Credit Suisse International | | | 775 | | | | 1.00 | (1) | | | 12/20/15 | | | | 1.00 | | | | 884 | | | | 4,605 | | | | 5,489 | |
| South Africa | | Credit Suisse International | | | 1,300 | | | | 1.00 | (1) | | | 9/20/17 | | | | 1.46 | | | | (26,634 | ) | | | 45,119 | | | | 18,485 | |
Emerging Markets Local Income Portfolio
October 31, 2012
Notes to Consolidated Financial Statements — continued
| | | | | | | | | | | | | | | | | | | | | | | | | | | | | | |
| Credit Default Swaps — Sell Protection (continued) | |
| | | | | | | | |
| | | | | | | | | | | | | | | | | | | | | | | | | | | | | | |
Reference
Entity | | Counterparty | | Notional
Amount*
(000’s omitted) | | | Contract
Annual
Fixed Rate** | | | Termination
Date | | | Current
Market
Annual
Fixed Rate*** | | | Market
Value | | | Upfront
Payments
Received
(Paid) | | | Net Unrealized
Appreciation
(Depreciation) | |
| | | | | | | | |
| South Africa | | Deutsche Bank | | $ | 500 | | | | 1.00 | %(1) | | | 9/20/15 | | | | 0.95 | % | | $ | 1,328 | | | $ | 6,881 | | | $ | 8,209 | |
| South Africa | | Deutsche Bank | | | 610 | | | | 1.00 | (1) | | | 12/20/15 | | | | 1.00 | | | | 696 | | | | 3,619 | | | | 4,315 | |
| South Africa | | Deutsche Bank | | | 2,000 | | | | 1.00 | (1) | | | 9/20/17 | | | | 1.46 | | | | (40,975 | ) | | | 64,065 | | | | 23,090 | |
| South Africa | | Deutsche Bank | | | 810 | | | | 1.00 | (1) | | | 9/20/17 | | | | 1.46 | | | | (16,595 | ) | | | 28,820 | | | | 12,225 | |
| South Africa | | Goldman Sachs International | | | 820 | | | | 1.00 | (1) | | | 12/20/15 | | | | 1.00 | | | | 936 | | | | 5,303 | | | | 6,239 | |
| South Africa | | Goldman Sachs International | | | 815 | | | | 1.00 | (1) | | | 12/20/15 | | | | 1.00 | | | | 930 | | | | 5,075 | | | | 6,005 | |
| South Africa | | Goldman Sachs International | | | 510 | | | | 1.00 | (1) | | | 9/20/17 | | | | 1.46 | | | | (10,449 | ) | | | 17,239 | | | | 6,790 | |
| South Africa | | JPMorgan Chase Bank | | | 1,500 | | | | 1.00 | (1) | | | 9/20/15 | | | | 0.95 | | | | 3,985 | | | | 12,573 | | | | 16,558 | |
| South Africa | | Nomura International PLC | | | 400 | | | | 1.00 | (1) | | | 9/20/17 | | | | 1.46 | | | | (8,195 | ) | | | 7,633 | | | | (562 | ) |
| South Africa | | Nomura International PLC | | | 5,000 | | | | 1.00 | (1) | | | 9/20/17 | | | | 1.46 | | | | (102,437 | ) | | | 74,615 | | | | (27,822 | ) |
| Markit CDX North America High Yield Index | | Citibank NA | | | 1,970 | | | | 5.00 | (1) | | | 12/20/17 | | | | 5.19 | | | | (4,110 | ) | | | 1,209 | | | | (2,901 | ) |
| Markit CDX North America High Yield Index | | Deutsche Bank | | | 2,180 | | | | 5.00 | (1) | | | 12/20/17 | | | | 5.19 | | | | (4,548 | ) | | | 2,676 | | | | (1,872 | ) |
| Markit CDX North America High Yield Index | | JPMorgan Chase Bank | | | 1,590 | | | | 5.00 | (1) | | | 12/20/17 | | | | 5.19 | | | | (3,318 | ) | | | 3,904 | | | | 586 | |
| | | | | | | | |
Total | | | | $ | 63,856 | | | | | | | | | | | | | | | $ | (2,326,193 | ) | | $ | 982,216 | | | $ | (1,343,977 | ) |
| | | | | | | | | | | | | | | | | | | | | | | | | | |
| Credit Default Swaps — Buy Protection | |
| Reference Entity | | Counterparty | | Notional
Amount
(000’s omitted) | | | Contract
Annual
Fixed Rate** | | | Termination
Date | | | Market
Value | | | Upfront
Payments
Received
(Paid) | | | Net Unrealized
Appreciation
(Depreciation) | |
| | | | | | | | | | | | | | | | | | | | | | | | | | |
| | | | | | | |
| Austria | | Barclays Bank PLC | | $ | 300 | | | | 0.44 | % | | | 12/20/13 | | | $ | (1,531 | ) | | $ | — | | | $ | (1,531 | ) |
| Austria | | Barclays Bank PLC | | | 200 | | | | 1.42 | | | | 3/20/14 | | | | (4,151 | ) | | | — | | | | (4,151 | ) |
| Brazil | | Bank of America | | | 350 | | | | 1.00 | (1) | | | 6/20/20 | | | | 9,477 | | | | (9,798 | ) | | | (321 | ) |
| Brazil | | Bank of America | | | 825 | | | | 1.00 | (1) | | | 6/20/20 | | | | 22,338 | | | | (29,141 | ) | | | (6,803 | ) |
| Brazil | | Bank of America | | | 2,900 | | | | 1.00 | (1) | | | 12/20/20 | | | | 90,249 | | | | (75,202 | ) | | | 15,047 | |
| Brazil | | Bank of America | | | 883 | | | | 1.00 | (1) | | | 12/20/20 | | | | 27,480 | | | | (26,771 | ) | | | 709 | |
| Brazil | | Bank of America | | | 387 | | | | 1.00 | (1) | | | 12/20/20 | | | | 12,044 | | | | (11,477 | ) | | | 567 | |
| Brazil | | Bank of America | | | 120 | | | | 1.00 | (1) | | | 12/20/20 | | | | 3,734 | | | | (3,404 | ) | | | 330 | |
| Brazil | | Barclays Bank PLC | | | 450 | | | | 1.65 | | | | 9/20/19 | | | | (9,883 | ) | | | — | | | | (9,883 | ) |
| Brazil | | Barclays Bank PLC | | | 770 | | | | 1.00 | (1) | | | 12/20/20 | | | | 23,960 | | | | (23,889 | ) | | | 71 | |
| Brazil | | Citibank NA | | | 190 | | | | 1.00 | (1) | | | 12/20/20 | | | | 5,912 | | | | (5,453 | ) | | | 459 | |
| Brazil | | Deutsche Bank | | | 1,600 | | | | 1.00 | (1) | | | 12/20/20 | | | | 49,792 | | | | (30,961 | ) | | | 18,831 | |
| Brazil | | Deutsche Bank | | | 190 | | | | 1.00 | (1) | | | 12/20/20 | | | | 5,912 | | | | (6,083 | ) | | | (171 | ) |
| Brazil | | Goldman Sachs International | | | 3,300 | | | | 1.00 | (1) | | | 9/20/22 | | | | 146,356 | | | | (294,185 | ) | | | (147,829 | ) |
Emerging Markets Local Income Portfolio
October 31, 2012
Notes to Consolidated Financial Statements — continued
| | | | | | | | | | | | | | | | | | | | | | | | | | |
| Credit Default Swaps — Buy Protection (continued) | |
| | | | | | | |
| | | | | | | | | | | | | | | | | | | | | | | | | | |
| Reference Entity | | Counterparty | | Notional
Amount
(000’s omitted) | | | Contract
Annual
Fixed Rate** | | | Termination
Date | | | Market
Value | | | Upfront
Payments
Received
(Paid) | | | Net Unrealized
Appreciation
(Depreciation) | |
| | | | | | | | | | | | | | | | | | | | | | | | | | |
| | | | | | | |
| Brazil | | HSBC Bank USA | | $ | 160 | | | | 1.00 | %(1) | | | 12/20/20 | | | $ | 4,978 | | | $ | (4,592 | ) | | $ | 386 | |
| Brazil | | Standard Chartered Bank | | | 800 | | | | 1.00 | (1) | | | 12/20/20 | | | | 24,897 | | | | (19,336 | ) | | | 5,561 | |
| Brazil | | Standard Chartered Bank | | | 150 | | | | 1.00 | (1) | | | 12/20/20 | | | | 4,667 | | | | (4,305 | ) | | | 362 | |
| China | | Bank of America | | | 1,000 | | | | 1.00 | (1) | | | 3/20/17 | | | | (20,528 | ) | | | (26,175 | ) | | | (46,703 | ) |
| China | | Barclays Bank PLC | | | 1,648 | | | | 1.00 | (1) | | | 3/20/17 | | | | (33,830 | ) | | | (39,255 | ) | | | (73,085 | ) |
| China | | Deutsche Bank | | | 703 | | | | 1.00 | (1) | | | 3/20/17 | | | | (14,431 | ) | | | (15,914 | ) | | | (30,345 | ) |
| China | | Deutsche Bank | | | 1,393 | | | | 1.00 | (1) | | | 3/20/17 | | | | (28,593 | ) | | | (31,535 | ) | | | (60,128 | ) |
| Colombia | | Bank of America | | | 950 | | | | 1.00 | (1) | | | 9/20/21 | | | | 25,346 | | | | (37,907 | ) | | | (12,561 | ) |
| Colombia | | Barclays Bank PLC | | | 400 | | | | 1.00 | (1) | | | 6/20/22 | | | | 12,604 | | | | (22,471 | ) | | | (9,867 | ) |
| Colombia | | Citibank NA | | | 500 | | | | 1.00 | (1) | | | 6/20/22 | | | | 15,754 | | | | (38,114 | ) | | | (22,360 | ) |
| Colombia | | Deutsche Bank | | | 400 | | | | 1.00 | (1) | | | 6/20/22 | | | | 12,604 | | | | (25,630 | ) | | | (13,026 | ) |
| Colombia | | Goldman Sachs International | | | 1,410 | | | | 1.00 | (1) | | | 6/20/17 | | | | (6,735 | ) | | | (42,907 | ) | | | (49,642 | ) |
| Colombia | | Goldman Sachs International | | | 740 | | | | 1.00 | (1) | | | 9/20/21 | | | | 19,744 | | | | (29,009 | ) | | | (9,265 | ) |
| Colombia | | Goldman Sachs International | | | 500 | | | | 1.00 | (1) | | | 6/20/22 | | | | 15,754 | | | | (38,114 | ) | | | (22,360 | ) |
| Colombia | | HSBC Bank USA | | | 770 | | | | 1.00 | (1) | | | 6/20/17 | | | | (3,678 | ) | | | (23,758 | ) | | | (27,436 | ) |
| Colombia | | HSBC Bank USA | | | 2,100 | | | | 1.00 | (1) | | | 9/20/21 | | | | 56,029 | | | | (80,479 | ) | | | (24,450 | ) |
| Colombia | | Morgan Stanley & Co. International PLC | | | 1,100 | | | | 1.00 | (1) | | | 9/20/21 | | | | 29,348 | | | | (43,892 | ) | | | (14,544 | ) |
| Croatia | | BNP Paribas SA | | | 1,670 | | | | 1.00 | (1) | | | 12/20/17 | | | | 115,432 | | | | (115,515 | ) | | | (83 | ) |
| Croatia | | Citibank NA | | | 1,500 | | | | 1.00 | (1) | | | 12/20/17 | | | | 101,987 | | | | (102,516 | ) | | | (529 | ) |
| Egypt | | Bank of America | | | 550 | | | | 1.00 | (1) | | | 9/20/15 | | | | 35,972 | | | | (15,193 | ) | | | 20,779 | |
| Egypt | | Citibank NA | | | 650 | | | | 1.00 | (1) | | | 12/20/15 | | | | 47,745 | | | | (27,415 | )�� | | | 20,330 | |
| Egypt | | Citibank NA | | | 100 | | | | 1.00 | (1) | | | 6/20/20 | | | | 19,881 | | | | (8,464 | ) | | | 11,417 | |
| Egypt | | Credit Suisse International | | | 1,085 | | | | 1.00 | (1) | | | 12/20/15 | | | | 79,697 | | | | (45,765 | ) | | | 33,932 | |
| Egypt | | Credit Suisse International | | | 375 | | | | 1.00 | (1) | | | 12/20/15 | | | | 27,545 | | | | (14,817 | ) | | | 12,728 | |
| Egypt | | Deutsche Bank | | | 250 | | | | 1.00 | (1) | | | 6/20/15 | | | | 14,279 | | | | (5,307 | ) | | | 8,972 | |
| Egypt | | Deutsche Bank | | | 125 | | | | 1.00 | (1) | | | 9/20/15 | | | | 8,175 | | | | (4,430 | ) | | | 3,745 | |
| Egypt | | Deutsche Bank | | | 1,400 | | | | 1.00 | (1) | | | 12/20/15 | | | | 102,834 | | | | (44,301 | ) | | | 58,533 | |
| Egypt | | Deutsche Bank | | | 930 | | | | 1.00 | (1) | | | 12/20/15 | | | | 68,312 | | | | (35,682 | ) | | | 32,630 | |
| Egypt | | Deutsche Bank | | | 100 | | | | 1.00 | (1) | | | 6/20/20 | | | | 19,881 | | | | (8,516 | ) | | | 11,365 | |
| Egypt | | Deutsche Bank | | | 50 | | | | 1.00 | (1) | | | 6/20/20 | | | | 9,940 | | | | (4,252 | ) | | | 5,688 | |
| Guatemala | | Citibank NA | | | 458 | | | | 1.00 | (1) | | | 9/20/20 | | | | 42,609 | | | | (27,735 | ) | | | 14,874 | |
| Hungary | | Barclays Bank PLC | | | 500 | | | | 1.00 | (1) | | | 3/20/17 | | | | 33,778 | | | | (78,930 | ) | | | (45,152 | ) |
| Hungary | | Goldman Sachs International | | | 500 | | | | 1.00 | (1) | | | 3/20/17 | | | | 33,778 | | | | (78,011 | ) | | | (44,233 | ) |
| Lebanon | | Barclays Bank PLC | | | 200 | | | | 1.00 | (1) | | | 12/20/14 | | | | 7,330 | | | | (6,572 | ) | | | 758 | |
| Lebanon | | Citibank NA | | | 250 | | | | 3.30 | | | | 9/20/14 | | | | (3,843 | ) | | | — | | | | (3,843 | ) |
| Lebanon | | Citibank NA | | | 150 | | | | 1.00 | (1) | | | 12/20/14 | | | | 5,498 | | | | (4,830 | ) | | | 668 | |
| Lebanon | | Citibank NA | | | 200 | | | | 1.00 | (1) | | | 12/20/14 | | | | 7,330 | | | | (6,671 | ) | | | 659 | |
| Lebanon | | Citibank NA | | | 100 | | | | 1.00 | (1) | | | 12/20/14 | | | | 3,665 | | | | (3,286 | ) | | | 379 | |
| Lebanon | | Credit Suisse International | | | 300 | | | | 1.00 | (1) | | | 3/20/15 | | | | 13,500 | | | | (10,083 | ) | | | 3,417 | |
Emerging Markets Local Income Portfolio
October 31, 2012
Notes to Consolidated Financial Statements — continued
| | | | | | | | | | | | | | | | | | | | | | | | | | |
| Credit Default Swaps — Buy Protection (continued) | |
| | | | | | | |
| | | | | | | | | | | | | | | | | | | | | | | | | | |
| Reference Entity | | Counterparty | | Notional
Amount
(000’s omitted) | | | Contract
Annual
Fixed Rate** | | | Termination
Date | | | Market
Value | | | Upfront
Payments
Received
(Paid) | | | Net Unrealized
Appreciation
(Depreciation) | |
| | | | | | | | | | | | | | | | | | | | | | | | | | |
| | | | | | | |
| Lebanon | | Credit Suisse International | | $ | 100 | | | | 1.00 | %(1) | | | 3/20/15 | | | $ | 4,501 | | | $ | (3,381 | ) | | $ | 1,120 | |
| Lebanon | | Credit Suisse International | | | 1,000 | | | | 1.00 | (1) | | | 12/20/15 | | | | 69,643 | | | | (53,412 | ) | | | 16,231 | |
| Lebanon | | Credit Suisse International | | | 840 | | | | 1.00 | (1) | | | 12/20/15 | | | | 58,500 | | | | (47,029 | ) | | | 11,471 | |
| Lebanon | | Credit Suisse International | | | 350 | | | | 1.00 | (1) | | | 12/20/15 | | | | 24,375 | | | | (18,653 | ) | | | 5,722 | |
| Lebanon | | Deutsche Bank | | | 100 | | | | 1.00 | (1) | | | 3/20/15 | | | | 4,500 | | | | (3,121 | ) | | | 1,379 | |
| Lebanon | | Deutsche Bank | | | 1,140 | | | | 1.00 | (1) | | | 12/20/15 | | | | 79,393 | | | | (63,228 | ) | | | 16,165 | |
| Lebanon | | Deutsche Bank | | | 865 | | | | 1.00 | (1) | | | 12/20/15 | | | | 60,242 | | | | (48,174 | ) | | | 12,068 | |
| Lebanon | | HSBC Bank USA | | | 1,250 | | | | 1.00 | (1) | | | 12/20/17 | | | | 180,333 | | | | (182,876 | ) | | | (2,543 | ) |
| Mexico | | Bank of America | | | 300 | | | | 1.00 | (1) | | | 6/20/22 | | | | 9,490 | | | | (18,713 | ) | | | (9,223 | ) |
| Mexico | | Bank of America | | | 680 | | | | 1.00 | (1) | | | 6/20/22 | | | | 21,510 | | | | (48,192 | ) | | | (26,682 | ) |
| Mexico | | Deutsche Bank | | | 300 | | | | 1.00 | (1) | | | 6/20/22 | | | | 9,490 | | | | (18,942 | ) | | | (9,452 | ) |
| Mexico | | Deutsche Bank | | | 350 | | | | 1.00 | (1) | | | 6/20/22 | | | | 11,071 | | | | (24,538 | ) | | | (13,467 | ) |
| Mexico | | Deutsche Bank | | | 480 | | | | 1.00 | (1) | | | 6/20/22 | | | | 15,184 | | | | (36,373 | ) | | | (21,189 | ) |
| Mexico | | Deutsche Bank | | | 700 | | | | 1.00 | (1) | | | 6/20/22 | | | | 22,144 | | | | (45,931 | ) | | | (23,787 | ) |
| Mexico | | Goldman Sachs International | | | 400 | | | | 1.00 | (1) | | | 6/20/22 | | | | 12,653 | | | | (25,258 | ) | | | (12,605 | ) |
| Mexico | | Goldman Sachs International | | | 500 | | | | 1.00 | (1) | | | 6/20/22 | | | | 15,817 | | | | (38,077 | ) | | | (22,260 | ) |
| Philippines | | Bank of America | | | 700 | | | | 1.00 | (1) | | | 12/20/15 | | | | (11,663 | ) | | | (9,516 | ) | | | (21,179 | ) |
| Philippines | | Barclays Bank PLC | | | 100 | | | | 1.85 | | | | 12/20/14 | | | | (3,491 | ) | | | — | | | | (3,491 | ) |
| Philippines | | Barclays Bank PLC | | | 142 | | | | 1.00 | (1) | | | 3/20/15 | | | | (2,262 | ) | | | (1,965 | ) | | | (4,227 | ) |
| Philippines | | Citibank NA | | | 200 | | | | 1.84 | | | | 12/20/14 | | | | (6,937 | ) | | | — | | | | (6,937 | ) |
| Philippines | | Deutsche Bank | | | 150 | | | | 1.00 | (1) | | | 3/20/15 | | | | (2,389 | ) | | | (2,255 | ) | | | (4,644 | ) |
| Philippines | | HSBC Bank USA | | | 600 | | | | 1.00 | (1) | | | 9/20/15 | | | | (9,852 | ) | | | (8,964 | ) | | | (18,816 | ) |
| Philippines | | JPMorgan Chase Bank | | | 142 | | | | 1.00 | (1) | | | 3/20/15 | | | | (2,262 | ) | | | (1,965 | ) | | | (4,227 | ) |
| Philippines | | Standard Chartered Bank | | | 4,900 | | | | 1.00 | (1) | | | 3/20/16 | | | | (75,287 | ) | | | (57,865 | ) | | | (133,152 | ) |
| Russia | | Bank of America | | | 1,210 | | | | 1.00 | (1) | | | 9/20/17 | | | | 26,803 | | | | (44,326 | ) | | | (17,523 | ) |
| Russia | | Bank of America | | | 2,220 | | | | 1.00 | (1) | | | 9/20/17 | | | | 49,176 | | | | (115,287 | ) | | | (66,111 | ) |
| Russia | | Barclays Bank PLC | | | 630 | | | | 1.00 | (1) | | | 9/20/17 | | | | 13,955 | | | | (22,517 | ) | | | (8,562 | ) |
| Russia | | Barclays Bank PLC | | | 800 | | | | 1.00 | (1) | | | 9/20/17 | | | | 17,721 | | | | (44,286 | ) | | | (26,565 | ) |
| Russia | | Citibank NA | | | 4,800 | | | | 1.00 | (1) | | | 9/20/17 | | | | 106,321 | | | | (145,866 | ) | | | (39,545 | ) |
| Russia | | Citibank NA | | | 730 | | | | 1.00 | (1) | | | 9/20/17 | | | | 16,170 | | | | (24,809 | ) | | | (8,639 | ) |
| Russia | | Credit Suisse International | | | 1,330 | | | | 1.00 | (1) | | | 9/20/17 | | | | 29,461 | | | | (69,638 | ) | | | (40,177 | ) |
| Russia | | Deutsche Bank | | | 100 | | | | 1.00 | (1) | | | 9/20/17 | | | | 2,215 | | | | (5,536 | ) | | | (3,321 | ) |
| Russia | | Deutsche Bank | | | 300 | | | | 1.00 | (1) | | | 6/20/22 | | | | 26,555 | | | | (51,401 | ) | | | (24,846 | ) |
| Russia | | JPMorgan Chase Bank | | | 900 | | | | 1.00 | (1) | | | 9/20/17 | | | | 19,937 | | | | (30,597 | ) | | | (10,660 | ) |
| Russia | | JPMorgan Chase Bank | | | 420 | | | | 1.00 | (1) | | | 9/20/17 | | | | 9,304 | | | | (14,462 | ) | | | (5,158 | ) |
| Russia | | Morgan Stanley & Co. International PLC | | | 480 | | | | 1.00 | (1) | | | 9/20/17 | | | | 10,633 | | | | (16,743 | ) | | | (6,110 | ) |
| South Africa | | Bank of America | | | 300 | | | | 1.00 | (1) | | | 12/20/19 | | | | 16,208 | | | | (9,928 | ) | | | 6,280 | |
| South Africa | | Bank of America | | | 775 | | | | 1.00 | (1) | | | 12/20/20 | | | | 53,096 | | | | (24,288 | ) | | | 28,808 | |
| South Africa | | Bank of America | | | 525 | | | | 1.00 | (1) | | | 12/20/20 | | | | 35,968 | | | | (18,047 | ) | | | 17,921 | |
| South Africa | | Bank of America | | | 3,040 | | | | 1.00 | (1) | | | 9/20/22 | | | | 278,058 | | | | (212,911 | ) | | | 65,147 | |
Emerging Markets Local Income Portfolio
October 31, 2012
Notes to Consolidated Financial Statements — continued
| | | | | | | | | | | | | | | | | | | | | | | | | | |
| Credit Default Swaps — Buy Protection (continued) | |
| | | | | | | |
| | | | | | | | | | | | | | | | | | | | | | | | | | |
| Reference Entity | | Counterparty | | Notional
Amount
(000’s omitted) | | | Contract
Annual
Fixed Rate** | | | Termination
Date | | | Market
Value | | | Upfront
Payments
Received
(Paid) | | | Net Unrealized
Appreciation
(Depreciation) | |
| | | | | | | | | | | | | | | | | | | | | | | | | | |
| | | | | | | |
| South Africa | | Bank of America | | $ | 920 | | | | 1.00 | %(1) | | | 9/20/22 | | | $ | 84,149 | | | $ | (71,359 | ) | | $ | 12,790 | |
| South Africa | | Bank of America | | | 680 | | | | 1.00 | (1) | | | 9/20/22 | | | | 62,198 | | | | (50,359 | ) | | | 11,839 | |
| South Africa | | Bank of America | | | 2,600 | | | | 1.00 | (1) | | | 9/20/22 | | | | 237,820 | | | | (253,734 | ) | | | (15,914 | ) |
| South Africa | | Barclays Bank PLC | | | 300 | | | | 1.00 | (1) | | | 12/20/19 | | | | 16,210 | | | | (11,477 | ) | | | 4,733 | |
| South Africa | | Barclays Bank PLC | | | 100 | | | | 1.00 | (1) | | | 3/20/20 | | | | 5,773 | | | | (2,950 | ) | | | 2,823 | |
| South Africa | | Barclays Bank PLC | | | 750 | | | | 1.00 | (1) | | | 12/20/20 | | | | 51,383 | | | | (24,820 | ) | | | 26,563 | |
| South Africa | | Barclays Bank PLC | | | 565 | | | | 1.00 | (1) | | | 12/20/20 | | | | 38,708 | | | | (17,641 | ) | | | 21,067 | |
| South Africa | | Barclays Bank PLC | | | 431 | | | | 1.00 | (1) | | | 9/20/22 | | | | 39,422 | | | | (38,734 | ) | | | 688 | |
| South Africa | | Barclays Bank PLC | | | 500 | | | | 1.00 | (1) | | | 9/20/22 | | | | 45,735 | | | | (41,896 | ) | | | 3,839 | |
| South Africa | | BNP Paribas SA | | | 1,140 | | | | 1.00 | (1) | | | 9/20/22 | | | | 104,272 | | | | (96,606 | ) | | | 7,666 | |
| South Africa | | BNP Paribas SA | | | 500 | | | | 1.00 | (1) | | | 9/20/22 | | | | 45,735 | | | | (43,046 | ) | | | 2,689 | |
| South Africa | | Citibank NA | | | 150 | | | | 1.00 | (1) | | | 12/20/19 | | | | 8,105 | | | | (6,524 | ) | | | 1,581 | |
| South Africa | | Citibank NA | | | 100 | | | | 1.00 | (1) | | | 3/20/20 | | | | 5,772 | | | | (4,604 | ) | | | 1,168 | |
| South Africa | | Credit Suisse International | | | 100 | | | | 1.00 | (1) | | | 3/20/20 | | | | 5,772 | | | | (3,235 | ) | | | 2,537 | |
| South Africa | | Credit Suisse International | | | 100 | | | | 1.00 | (1) | | | 3/20/20 | | | | 5,773 | | | | (3,936 | ) | | | 1,837 | |
| South Africa | | Credit Suisse International | | | 775 | | | | 1.00 | (1) | | | 12/20/20 | | | | 53,095 | | | | (25,823 | ) | | | 27,272 | |
| South Africa | | Credit Suisse International | | | 790 | | | | 1.00 | (1) | | | 12/20/20 | | | | 54,123 | | | | (27,662 | ) | | | 26,461 | |
| South Africa | | Credit Suisse International | | | 840 | | | | 1.00 | (1) | | | 12/20/20 | | | | 57,545 | | | | (36,150 | ) | | | 21,395 | |
| South Africa | | Credit Suisse International | | | 1,300 | | | | 1.00 | (1) | | | 9/20/22 | | | | 118,908 | | | | (131,735 | ) | | | (12,827 | ) |
| South Africa | | Deutsche Bank | | | 500 | | | | 1.00 | (1) | | | 9/20/20 | | | | 32,500 | | | | (22,421 | ) | | | 10,079 | |
| South Africa | | Deutsche Bank | | | 610 | | | | 1.00 | (1) | | | 12/20/20 | | | | 41,791 | | | | (19,849 | ) | | | 21,942 | |
| South Africa | | Deutsche Bank | | | 810 | | | | 1.00 | (1) | | | 9/20/22 | | | | 74,088 | | | | (78,899 | ) | | | (4,811 | ) |
| South Africa | | Deutsche Bank | | | 2,000 | | | | 1.00 | (1) | | | 9/20/22 | | | | 182,932 | | | | (193,977 | ) | | | (11,045 | ) |
| South Africa | | Goldman Sachs
International | | | 815 | | | | 1.00 | (1) | | | 12/20/20 | | | | 55,836 | | | | (27,055 | ) | | | 28,781 | |
| South Africa | | Goldman Sachs International | | | 820 | | | | 1.00 | (1) | | | 12/20/20 | | | | 56,179 | | | | (27,663 | ) | | | 28,516 | |
| South Africa | | Goldman Sachs International | | | 510 | | | | 1.00 | (1) | | | 9/20/22 | | | | 46,648 | | | | (48,143 | ) | | | (1,495 | ) |
| South Africa | | JPMorgan Chase Bank | | | 100 | | | | 1.00 | (1) | | | 12/20/19 | | | | 5,404 | | | | (4,536 | ) | | | 868 | |
| South Africa | | JPMorgan Chase Bank | | | 100 | | | | 1.00 | (1) | | | 12/20/19 | | | | 5,403 | | | | (5,443 | ) | | | (40 | ) |
| South Africa | | JPMorgan Chase Bank | | | 100 | | | | 1.00 | (1) | | | 3/20/20 | | | | 5,772 | | | | (3,178 | ) | | | 2,594 | |
| South Africa | | JPMorgan Chase Bank | | | 100 | | | | 1.00 | (1) | | | 3/20/20 | | | | 5,773 | | | | (3,292 | ) | | | 2,481 | |
| South Africa | | JPMorgan Chase Bank | | | 100 | | | | 1.00 | (1) | | | 3/20/20 | | | | 5,772 | | | | (4,549 | ) | | | 1,223 | |
| South Africa | | Nomura International PLC | | | 5,000 | | | | 1.00 | (1) | | | 9/20/22 | | | | 457,332 | | | | (383,117 | ) | | | 74,215 | |
| South Africa | | Nomura International PLC | | | 400 | | | | 1.00 | (1) | | | 9/20/22 | | | | 36,586 | | | | (33,253 | ) | | | 3,333 | |
| Spain | | Barclays Bank PLC | | | 167 | | | | 1.00 | (1) | | | 9/20/20 | | | | 22,825 | | | | (12,851 | ) | | | 9,974 | |
| Spain | | Barclays Bank PLC | | | 700 | | | | 1.00 | (1) | | | 12/20/20 | | | | 98,299 | | | | (57,966 | ) | | | 40,333 | |
| Spain | | Barclays Bank PLC | | | 690 | | | | 1.00 | (1) | | | 12/20/20 | | | | 96,901 | | | | (58,214 | ) | | | 38,687 | |
| Spain | | Barclays Bank PLC | | | 300 | | | | 1.00 | (1) | | | 12/20/20 | | | | 42,128 | | | | (24,933 | ) | | | 17,195 | |
| Spain | | Citibank NA | | | 300 | | | | 1.00 | (1) | | | 3/20/20 | | | | 38,649 | | | | (6,072 | ) | | | 32,577 | |
| Spain | | Citibank NA | | | 300 | | | | 1.00 | (1) | | | 3/20/20 | | | | 38,649 | | | | (12,504 | ) | | | 26,145 | |
| Spain | | Deutsche Bank | | | 300 | | | | 1.00 | (1) | | | 3/20/20 | | | | 38,649 | | | | (5,734 | ) | | | 32,915 | |
| Spain | | Deutsche Bank | | | 300 | | | | 1.00 | (1) | | | 3/20/20 | | | | 38,649 | | | | (12,504 | ) | | | 26,145 | |
Emerging Markets Local Income Portfolio
October 31, 2012
Notes to Consolidated Financial Statements — continued
| | | | | | | | | | | | | | | | | | | | | | | | | | |
| Credit Default Swaps — Buy Protection (continued) | |
| | | | | | | |
| | | | | | | | | | | | | | | | | | | | | | | | | | |
| Reference Entity | | Counterparty | | Notional
Amount
(000’s omitted) | | | Contract
Annual
Fixed Rate** | | | Termination
Date | | | Market
Value | | | Upfront
Payments
Received
(Paid) | | | Net Unrealized
Appreciation
(Depreciation) | |
| | | | | | | | | | | | | | | | | | | | | | | | | | |
| | | | | | | |
| Spain | | Deutsche Bank | | $ | 550 | | | | 1.00 | %(1) | | | 6/20/20 | | | $ | 73,041 | | | $ | (29,744 | ) | | $ | 43,297 | |
| Spain | | Deutsche Bank | | | 3,265 | | | | 1.00 | (1) | | | 12/20/20 | | | | 458,525 | | | | (236,236 | ) | | | 222,289 | |
| Spain | | Deutsche Bank | | | 670 | | | | 1.00 | (1) | | | 12/20/20 | | | | 94,092 | | | | (56,526 | ) | | | 37,566 | |
| Spain | | Goldman Sachs International | | | 193 | | | | 1.00 | (1) | | | 9/20/20 | | | | 26,378 | | | | (15,168 | ) | | | 11,210 | |
| Thailand | | Barclays Bank PLC | | | 400 | | | | 0.97 | | | | 9/20/19 | | | | 3,738 | | | | — | | | | 3,738 | |
| Thailand | | Citibank NA | | | 400 | | | | 0.86 | | | | 12/20/14 | | | | (5,049 | ) | | | — | | | | (5,049 | ) |
| Thailand | | Citibank NA | | | 200 | | | | 0.95 | | | | 9/20/19 | | | | 2,133 | | | | — | | | | 2,133 | |
| Thailand | | Goldman Sachs International | | | 1,500 | | | | 1.00 | (1) | | | 3/20/16 | | | | (23,681 | ) | | | (8,461 | ) | | | (32,142 | ) |
| Thailand | | JPMorgan Chase Bank | | | 200 | | | | 0.87 | | | | 12/20/14 | | | | (2,570 | ) | | | — | | | | (2,570 | ) |
| Tunisia | | Barclays Bank PLC | | | 350 | | | | 1.00 | (1) | | | 9/20/17 | | | | 38,151 | | | | (31,427 | ) | | | 6,724 | |
| Tunisia | | Citibank NA | | | 400 | | | | 1.00 | (1) | | | 9/20/17 | | | | 43,601 | | | | (37,639 | ) | | | 5,962 | |
| Tunisia | | Deutsche Bank | | | 600 | | | | 1.00 | (1) | | | 6/20/17 | | | | 61,844 | | | | (44,027 | ) | | | 17,817 | |
| Tunisia | | Deutsche Bank | | | 460 | | | | 1.00 | (1) | | | 6/20/17 | | | | 47,415 | | | | (35,629 | ) | | | 11,786 | |
| Tunisia | | Goldman Sachs International | | | 400 | | | | 1.00 | (1) | | | 9/20/17 | | | | 43,599 | | | | (31,704 | ) | | | 11,895 | |
| Tunisia | | Goldman Sachs International | | | 320 | | | | 1.00 | (1) | | | 9/20/17 | | | | 34,879 | | | | (26,696 | ) | | | 8,183 | |
| Tunisia | | Goldman Sachs International | | | 300 | | | | 1.00 | (1) | | | 9/20/17 | | | | 32,701 | | | | (26,328 | ) | | | 6,373 | |
| Tunisia | | JPMorgan Chase Bank | | | 410 | | | | 1.00 | (1) | | | 9/20/17 | | | | 44,690 | | | | (37,747 | ) | | | 6,943 | |
| Tunisia | | Nomura International PLC | | | 500 | | | | 1.00 | (1) | | | 12/20/17 | | | | 57,375 | | | | (52,548 | ) | | | 4,827 | |
| Uruguay | | Citibank NA | | | 100 | | | | 1.00 | (1) | | | 6/20/20 | | | | 3,712 | | | | (5,826 | ) | | | (2,114 | ) |
| Uruguay | | Deutsche Bank | | | 100 | | | | 1.00 | (1) | | | 6/20/20 | | | | 3,713 | | | | (5,690 | ) | | | (1,977 | ) |
iTraxx Europe
Senior Financials
5-Year Index | | Barclays Bank PLC | | | EUR 920 | | | | 1.00 | (1) | | | 12/20/17 | | | | 41,098 | | | | (49,671 | ) | | | (8,573 | ) |
iTraxx Europe Subordinated Financials
5-Year Index | | Barclays Bank PLC | | | EUR 1,590 | | | | 5.00 | (1) | | | 12/20/17 | | | | (196,289 | ) | | | 166,810 | | | | (29,479 | ) |
| | | |
| | | | $ | 5,837,587 | | | $ | (5,799,819 | ) | | $ | 37,768 | |
| * | If the Portfolio is the seller of credit protection, the notional amount is the maximum potential amount of future payments the Portfolio could be required to make if a credit event, as defined in the credit default swap agreement, were to occur. At October 31, 2012, such maximum potential amount for all open credit default swaps in which the Portfolio is the seller was $63,856,000. |
| ** | The contract annual fixed rate represents the fixed rate of interest received by the Portfolio (as a seller of protection) or paid by the Portfolio (as a buyer of protection) annually on the notional amount of the credit default swap contract. |
| *** | Current market annual fixed rates, utilized in determining the net unrealized appreciation or depreciation as of period end, serve as an indicator of the market’s perception of the current status of the payment/performance risk associated with the credit derivative. The current market annual fixed rate of a particular reference entity reflects the cost, as quoted by the pricing vendor, of selling protection against default of that entity as of period end and may include upfront payments required to be made to enter into the agreement. The higher the fixed rate, the greater the market perceived risk of a credit event involving the reference entity. A rate identified as “Defaulted” indicates a credit event has occurred for the reference entity. |
| (1) | Upfront payment is exchanged with the counterparty as a result of the standardized trading coupon. |
Emerging Markets Local Income Portfolio
October 31, 2012
Notes to Consolidated Financial Statements — continued
Written options activity for the year ended October 31, 2012 was as follows:
| | | | | | | | | | | | |
| | | Principal Amount
of Contracts (000’s omitted) | | | Premiums
Received | |
Outstanding, beginning of year | | | INR | | | | — | | | $ | — | |
Options written | | | | | | | 1,806,700 | | | | 1,163,340 | |
| | | |
Outstanding, end of year | | | INR | | | | 1,806,700 | | | $ | 1,163,340 | |
At October 31, 2012, the Portfolio had sufficient cash and/or securities to cover commitments under these contracts.
In the normal course of pursuing its investment objective, the Portfolio is subject to the following risks:
Commodity Risk: The Portfolio invests in commodities-linked derivative investments, including commodity futures contracts and options thereon and forward commodity contracts, that provide exposure to the investment returns of certain commodities. Commodities-linked derivative investments are used to enhance total return and/or as a substitute for the purchase or sale of commodities.
Credit Risk: The Portfolio enters into credit default swap contracts to manage certain investment risks and/or to enhance total return.
Equity Price Risk: The Portfolio enters into equity index futures and options thereon to enhance total return and/or to manage certain investment risks.
Foreign Exchange Risk: The Portfolio engages in forward foreign currency exchange contracts, options on currencies and cross-currency swaps to enhance total return, to seek to hedge against fluctuations in currency exchange rates and/or as a substitute for the purchase or sale of securities or currencies.
Interest Rate Risk: The Portfolio utilizes various interest rate derivatives including futures, interest rate swaps and cross-currency swaps to enhance total return, to seek to hedge against fluctuations in interest rates, and/or to change the effective duration of its portfolio.
The Portfolio enters into swap contracts, over-the-counter options and forward foreign currency exchange contracts that may contain provisions whereby the counterparty may terminate the contract under certain conditions, including but not limited to a decline in the Portfolio’s net assets below a certain level over a certain period of time, which would trigger a payment by the Portfolio for those derivatives in a liability position. At October 31, 2012, the fair value, excluding upfront payments, of derivatives with credit-related contingent features in a net liability position was $9,741,454. The aggregate fair value of assets pledged as collateral by the Portfolio for such liability was $1,878,951 at October 31, 2012.
The non-exchange traded derivatives in which the Portfolio invests, including swap contracts, over-the-counter options and forward foreign currency exchange contracts, are subject to the risk that the counterparty to the contract fails to perform its obligations under the contract. The Portfolio is not subject to counterparty credit risk with respect to its written options as the Portfolio, not the counterparty, is obligated to perform under such derivatives. At October 31, 2012, the maximum amount of loss the Portfolio would incur due to counterparty risk was $16,087,792, with the highest amount from any one counterparty being $2,815,628. Such maximum amount would be reduced by any unamortized upfront payments received by the Portfolio. Such amount would be increased by any unamortized upfront payments made by the Portfolio. To mitigate this risk, the Portfolio (and Subsidiary) has entered into master netting agreements with substantially all its derivative counterparties, which allows it and a counterparty to aggregate amounts owed by each of them for derivative transactions under the agreement into a single net amount payable by either the Portfolio (and Subsidiary) or the counterparty. At October 31, 2012, the maximum amount of loss the Portfolio would incur due to counterparty risk would be reduced by approximately $5,839,000 due to master netting agreements. Counterparties may be required to pledge collateral in the form of cash, U.S. Government securities or highly-rated bonds for the benefit of the Portfolio if the net amount due from the counterparty with respect to a derivative contract exceeds a certain threshold. The amount of collateral posted by the counterparties with respect to such contracts would also reduce the amount of any loss incurred. Because the Subsidiary is not registered under the 1940 Act, it may not be able to negotiate terms with its counterparties that are equivalent to those a registered Portfolio may negotiate. As a result, the Subsidiary may have greater exposure to those counterparties than a registered Portfolio.
Emerging Markets Local Income Portfolio
October 31, 2012
Notes to Consolidated Financial Statements — continued
The fair value of open derivative instruments (not considered to be hedging instruments for accounting disclosure purposes) by risk exposure at October 31, 2012 was as follows:
| | | | | | | | | | | | | | | | | | | | |
| | | Fair Value | |
| Consolidated Statement of Assets and Liabilities Caption | | Credit | | | Equity
Price | | | Foreign
Exchange | | | Interest
Rate | | | Commodity | |
| | | | | |
Securities of unaffiliated issuers, at value | | $ | — | | | $ | — | | | $ | 915,162 | | | $ | — | | | $ | 581,000 | |
Net unrealized depreciation* | | | — | | | | 52,942 | | | | — | | | | 1,283 | | | | — | |
Receivable for open forward foreign currency exchange contracts | | | — | | | | — | | | | 2,301,764 | | | | — | | | | — | |
Receivable for open swap contracts; Premium paid/received on open swap contracts | | | 6,431,449 | | | | — | | | | — | | | | 10,224,101 | | | | — | |
| | | | | |
Total Asset Derivatives | | $ | 6,431,449 | | | $ | 52,942 | | | $ | 3,216,926 | | | $ | 10,225,384 | | | $ | 581,000 | |
| | | | | |
Written options outstanding, at value | | $ | — | | | $ | — | | | $ | (523,159 | ) | | $ | — | | | $ | — | |
Net unrealized depreciation* | | | — | | | | — | | | | — | | | | (116,435 | ) | | | (99,286 | ) |
Payable for open forward foreign currency exchange contracts | | | — | | | | — | | | | (5,135,857 | ) | | | — | | | | — | |
Payable for open swap contracts; Premium paid/received on open swap contracts | | | (2,920,055 | ) | | | — | | | | — | | | | (168,242 | ) | | | — | |
| | | | | |
Total Liability Derivatives | | $ | (2,920,055 | ) | | $ | — | | | $ | (5,659,016 | ) | | $ | (284,677 | ) | | $ | (99,286 | ) |
| | | | | |
| | | | | | | | | | | | | | | | | | | | |
* Amount represents cumulative unrealized appreciation or (depreciation) on futures contracts in the Futures Contracts table above. Only the current day’s variation margin on open futures contracts is reported within the Consolidated Statement of Assets and Liabilities as Receivable or Payable for variation margin, as applicable. | |
| | | | | |
| | | | | | | | | | | | | | | | | | | | |
| The effect of derivative instruments (not considered to be hedging instruments for accounting disclosure purposes) on the Consolidated Statement of Operations by risk exposure for the year ended October 31, 2012 was as follows: | |
| | | | | |
| | | | | | | | | | | | | | | | | | | | |
| Consolidated Statement of Operations Caption | | Credit | | | Equity
Price | | | Foreign
Exchange | | | Interest
Rate | | | Commodity | |
| | | | | |
Net realized gain (loss) —
Investment transactions | | $ | — | | | $ | (546,221 | ) | | $ | (330,001 | ) | | $ | — | | | $ | (41,700 | ) |
Futures contracts | | | — | | | | — | | | | 305,557 | | | | (554,504 | ) | | | 96,412 | |
Swap contracts | | | (447,728 | ) | | | — | | | | — | | | | 2,928,219 | | | | — | |
Forward commodity contracts | | | — | | | | — | | | | — | | | | — | | | | (414,003 | ) |
Foreign currency and forward foreign currency exchange contract transactions | | | — | | | | — | | | | 11,421,288 | | | | — | | | | — | |
| | | | | |
Total | | $ | (447,728 | ) | | $ | (546,221 | ) | | $ | 11,396,844 | | | $ | 2,373,715 | | | $ | (359,291 | ) |
| | | | | |
Change in unrealized appreciation (depreciation) —
Investments | | $ | — | | | $ | 114,472 | | | $ | 304,505 | | | $ | — | | | $ | 33,380 | |
Written options | | | | | | | | | | | 640,181 | | | | | | | | | |
Futures contracts | | | — | | | | 52,942 | | | | — | | | | 159,290 | | | | (152,211 | ) |
Swap contracts | | | (2,324,098 | ) | | | — | | | | — | | | | 4,716,469 | | | | — | |
Forward commodity contracts | | | — | | | | — | | | | — | | | | — | | | | 705,490 | |
Foreign currency and forward foreign currency exchange contracts | | | — | | | | — | | | | (2,644,166 | ) | | | — | | | | — | |
| | | | | |
Total | | $ | (2,324,098 | ) | | $ | 167,414 | | | $ | (1,699,480 | ) | | $ | 4,875,759 | | | $ | 586,659 | |
Emerging Markets Local Income Portfolio
October 31, 2012
Notes to Consolidated Financial Statements — continued
The average notional amounts of futures contracts, forward commodity contracts, forward foreign currency exchange contracts and swap contracts outstanding during the year ended October 31, 2012, which are indicative of the volume of these derivative types, were approximately $35,010,000, $2,560,000, $607,912,000 and $401,096,000, respectively.
The average principal amount of purchased currency options contracts, average number of purchased index options contracts and average number of purchased commodity options contracts outstanding during the year ended October 31, 2012, which are indicative of the volume of these derivative types, were approximately $35,516,000, 26,446,000 contracts and 7 contracts, respectively.
6 Line of Credit
The Portfolio participates with other portfolios and funds managed by EVM and its affiliates in a $600 million unsecured line of credit agreement with a group of banks. Borrowings are made by the Portfolio solely to facilitate the handling of unusual and/or unanticipated short-term cash requirements. Interest is charged to the Portfolio based on its borrowings at an amount above either the Eurodollar rate or Federal Funds rate. In addition, a fee computed at an annual rate of 0.08% on the daily unused portion of the line of credit is allocated among the participating portfolios and funds at the end of each quarter. Because the line of credit is not available exclusively to the Portfolio, it may be unable to borrow some or all of its requested amounts at any particular time. The Portfolio did not have any significant borrowings or allocated fees during the year ended October 31, 2012.
7 Risks Associated with Foreign Investments
Investing in securities issued by entities whose principal business activities are outside the United States may involve significant risks not present in domestic investments. For example, there is generally less publicly available information about foreign companies, particularly those not subject to the disclosure and reporting requirements of the U.S. securities laws. Certain foreign issuers are generally not bound by uniform accounting, auditing, and financial reporting requirements and standards of practice comparable to those applicable to domestic issuers. Investments in foreign securities also involve the risk of possible adverse changes in investment or exchange control regulations, expropriation or confiscatory taxation, limitation on the removal of funds or other assets of the Portfolio, political or financial instability or diplomatic and other developments which could affect such investments. Foreign securities markets, while growing in volume and sophistication, are generally not as developed as those in the United States, and securities of some foreign issuers (particularly those located in developing countries) may be less liquid and more volatile than securities of comparable U.S. companies. In general, there is less overall governmental supervision and regulation of foreign securities markets, broker/dealers and issuers than in the United States.
8 Fair Value Measurements
Under generally accepted accounting principles for fair value measurements, a three-tier hierarchy to prioritize the assumptions, referred to as inputs, is used in valuation techniques to measure fair value. The three-tier hierarchy of inputs is summarized in the three broad levels listed below.
| Ÿ | | Level 1 – quoted prices in active markets for identical investments |
| Ÿ | | Level 2 – other significant observable inputs (including quoted prices for similar investments, interest rates, prepayment speeds, credit risk, etc.) |
| Ÿ | | Level 3 – significant unobservable inputs (including a fund’s own assumptions in determining the fair value of investments) |
In cases where the inputs used to measure fair value fall in different levels of the fair value hierarchy, the level disclosed is determined based on the lowest level input that is significant to the fair value measurement in its entirety. The inputs or methodology used for valuing securities are not necessarily an indication of the risk associated with investing in those securities.
Emerging Markets Local Income Portfolio
October 31, 2012
Notes to Consolidated Financial Statements — continued
At October 31, 2012, the hierarchy of inputs used in valuing the Portfolio’s investments and open derivative instruments, which are carried at value, were as follows:
| | | | | | | | | | | | | | | | |
| Asset Description | | Level 1 | | | Level 2 | | | Level 3 | | | Total | |
| | | | |
Foreign Government Bonds | | $ | — | | | $ | 607,876,393 | | | $ | — | | | $ | 607,876,393 | |
Common Stocks | | | — | | | | 2,868,188 | * | | | — | | | | 2,868,188 | |
Precious Metals | | | 7,508,916 | | | | — | | | | — | | | | 7,508,916 | |
Currency Call Options Purchased | | | — | | | | 883,078 | | | | — | | | | 883,078 | |
Currency Put Options Purchased | | | — | | | | 32,084 | | | | — | | | | 32,084 | |
Put Options Purchased | | | 581,000 | | | | — | | | | — | | | | 581,000 | |
Short-Term Investments — | | | | | | | | | | | | | | | | |
Foreign Government Securities | | | — | | | | 80,307,000 | | | | — | | | | 80,307,000 | |
U.S. Treasury Obligations | | | — | | | | 17,903,423 | | | | — | | | | 17,903,423 | |
Repurchase Agreements | | | — | | | | 30,363,759 | | | | — | | | | 30,363,759 | |
Other | | | — | | | | 28,664,279 | | | | — | | | | 28,664,279 | |
| | | | |
Total Investments | | $ | 8,089,916 | | | $ | 768,898,204 | | | $ | — | | | $ | 776,988,120 | |
| | | | |
Forward Foreign Currency Exchange Contracts | | $ | — | | | $ | 2,301,764 | | | $ | — | | | $ | 2,301,764 | |
Swap Contracts | | | — | | | | 16,655,550 | | | | — | | | | 16,655,550 | |
Futures Contracts | | | 54,225 | | | | — | | | | — | | | | 54,225 | |
| | | | |
Total | | $ | 8,144,141 | | | $ | 787,855,518 | | | $ | — | | | $ | 795,999,659 | |
| | | | |
Liability Description | | | | | | | | | | | | | | | | |
| | | | |
Securities Sold Short | | $ | — | | | $ | (33,906,075 | ) | | $ | — | | | | (33,906,075 | ) |
Forward Foreign Currency Exchange Contracts | | | — | | | | (5,135,857 | ) | | | — | | | | (5,135,857 | ) |
Swap Contracts | | | — | | | | (3,088,297 | ) | | | — | | | | (3,088,297 | ) |
Futures Contracts | | | (215,721 | ) | | | — | | | | — | | | | (215,721 | ) |
Currency Call Options Written | | | — | | | | (483,963 | ) | | | — | | | | (483,963 | ) |
Currency Put Options Written | | | — | | | | (39,196 | ) | | | — | | | | (39,196 | ) |
| | | | |
Total | | $ | (215,721 | ) | | $ | (42,653,388 | ) | | $ | — | | | $ | (42,869,109 | ) |
| * | Includes foreign equity securities whose values were adjusted to reflect market trading of comparable securities or other correlated instruments that occurred after the close of trading in their applicable foreign markets. |
The Portfolio held no investments or other financial instruments as of October 31, 2011 whose fair value was determined using Level 3 inputs. At October 31, 2012, there were no investments transferred between Level 1 and Level 2 during the year then ended.
Emerging Markets Local Income Portfolio
October 31, 2012
Report of Independent Registered Public Accounting Firm
To the Trustees and Investors of Emerging Markets Local Income Portfolio:
We have audited the accompanying consolidated statement of assets and liabilities of Emerging Markets Local Income Portfolio and subsidiary (the “Portfolio”), including the consolidated portfolio of investments, as of October 31, 2012, and the related consolidated statement of operations for the year then ended, the consolidated statements of changes in net assets for each of the two years in the period then ended, and the consolidated supplementary data for each of the five years in the period then ended. These consolidated financial statements and consolidated supplementary data are the responsibility of the Portfolio’s management. Our responsibility is to express an opinion on these consolidated financial statements and consolidated supplementary data based on our audits.
We conducted our audits in accordance with the standards of the Public Company Accounting Oversight Board (United States). Those standards require that we plan and perform the audit to obtain reasonable assurance about whether the consolidated financial statements and consolidated supplementary data are free of material misstatement. The Portfolio is not required to have, nor were we engaged to perform, an audit of its internal control over financial reporting. Our audits included consideration of internal control over financial reporting as a basis for designing audit procedures that are appropriate in the circumstances, but not for the purpose of expressing an opinion on the effectiveness of the Portfolio’s internal control over financial reporting. Accordingly, we express no such opinion. An audit also includes examining, on a test basis, evidence supporting the amounts and disclosures in the financial statements, assessing the accounting principles used and significant estimates made by management, as well as evaluating the overall financial statement presentation. Our procedures included confirmation of securities owned as of October 31, 2012, by correspondence with the custodian and brokers; where replies were not received from brokers, we performed other auditing procedures. We believe that our audits provide a reasonable basis for our opinion.
In our opinion, such consolidated financial statements and consolidated supplementary data referred to above present fairly, in all material respects, the financial position of Emerging Markets Local Income Portfolio and subsidiary as of October 31, 2012, the results of their operations for the year then ended, the changes in their net assets for each of the two years in the period then ended, and the supplementary data for each of the five years in the period then ended, in conformity with accounting principles generally accepted in the United States of America.
DELOITTE & TOUCHE LLP
Boston, Massachusetts
December 21, 2012
Eaton Vance
Emerging Markets Local Income Fund
October 31, 2012
Management and Organization
Fund Management. The Trustees of Eaton Vance Mutual Funds Trust (the Trust) and Emerging Markets Local Income Portfolio (the Portfolio) are responsible for the overall management and supervision of the Trust’s and Portfolio’s affairs. The Trustees and officers of the Trust and the Portfolio are listed below. Except as indicated, each individual has held the office shown or other offices in the same company for the last five years. Trustees and officers of the Trust and the Portfolio hold indefinite terms of office. The “Noninterested Trustees” consist of those Trustees who are not “interested persons” of the Trust and the Portfolio, as that term is defined under the 1940 Act. The business address of each Trustee and officer is Two International Place, Boston, Massachusetts 02110. As used below, “EVC” refers to Eaton Vance Corp., “EV” refers to Eaton Vance, Inc., “EVM” refers to Eaton Vance Management, “BMR” refers to Boston Management and Research and “EVD” refers to Eaton Vance Distributors, Inc. EVC and EV are the corporate parent and trustee, respectively, of EVM and BMR. EVD is the Fund’s principal underwriter, the Portfolio’s placement agent and a wholly-owned subsidiary of EVC. Each officer affiliated with Eaton Vance may hold a position with other Eaton Vance affiliates that is comparable to his or her position with EVM listed below. Each Trustee oversees 187 portfolios in the Eaton Vance Complex (including all master and feeder funds in a master feeder structure). Each officer serves as an officer of certain other Eaton Vance funds. Each Trustee and officer serves until his or her successor is elected.
| | | | | | |
| Name and Year of Birth | | Position(s) with the
Trust and the
Portfolio | | Length of
Service | | Principal Occupation(s) and Directorships During Past Five Years and Other Relevant Experience |
Interested Trustee | | | | | | |
| | | |
Thomas E. Faust Jr. 1958 | | Trustee | | Since 2007 | | Chairman, Chief Executive Officer and President of EVC, Director and President of EV, Chief Executive Officer and President of EVM and BMR, and Director of EVD. Trustee and/or officer of 187 registered investment companies. Mr. Faust is an interested person because of his positions with EVM, BMR, EVD, EVC and EV, which are affiliates of the Trust and the Portfolio. Directorships in the Last Five Years.(1) Director of EVC and Hexavest Inc. |
| | | |
| | | | | | |
Noninterested Trustees |
| | | |
Scott E. Eston 1956 | | Trustee | | Since 2011 | | Private investor. Formerly held various positions at Grantham, Mayo, Van Otterloo and Co., L.L.C. (investment management firm) (1997-2009), including Chief Operating Officer (2002-2009), Chief Financial Officer (1997-2009) and Chairman of the Executive Committee (2002-2008); President and Principal Executive Officer, GMO Trust (open-end registered investment company) (2006-2009). Former Partner, Coopers and Lybrand L.L.P. (now PricewaterhouseCoopers) (public accounting firm) (1987-1997). Directorships in the Last Five Years. None. |
| | | |
Benjamin C. Esty 1963 | | Trustee | | Of the Trust since 2005 and of the Portfolio since 2007 | | Roy and Elizabeth Simmons Professor of Business Administration and Finance Unit Head, Harvard University Graduate School of Business Administration. Directorships in the Last Five Years.(1) None. |
| | | |
Allen R. Freedman 1940 | | Trustee | | Since 2007 | | Private Investor. Former Chairman (2002-2004) and a Director (1983-2004) of Systems & Computer Technology Corp. (provider of software to higher education). Formerly, a Director of Loring Ward International (fund distributor) (2005-2007). Former Chairman and a Director of Indus International, Inc. (provider of enterprise management software to the power generating industry) (2005-2007). Former Chief Executive Officer of Assurant, Inc. (insurance provider) (1979-2000). Directorships in the Last Five Years.(1) Director of Stonemor Partners, L.P. (owner and operator of cemeteries). Formerly, Director of Assurant, Inc. (insurance provider) (1979-2011). |
| | | |
William H. Park 1947 | | Trustee | | Of the Trust since 2003 and of the Portfolio since 2007 | | Consultant and private investor. Formerly, Chief Financial Officer, Aveon Group L.P. (investment management firm) (2010-2011). Formerly, Vice Chairman, Commercial Industrial Finance Corp. (specialty finance company) (2006-2010). Formerly, President and Chief Executive Officer, Prizm Capital Management, LLC (investment management firm) (2002-2005). Formerly, Executive Vice President and Chief Financial Officer, United Asset Management Corporation (investment management firm) (1982-2001). Formerly, Senior Manager, Price Waterhouse (now PricewaterhouseCoopers) (an independent registered public accounting firm) (1972-1981). Directorships in the Last Five Years.(1) None. |
Eaton Vance
Emerging Markets Local Income Fund
October 31, 2012
Management and Organization — continued
| | | | | | |
| Name and Year of Birth | | Position(s) with the
Trust and the
Portfolio | | Length of
Service | | Principal Occupation(s) and Directorships During Past Five Years and Other Relevant Experience |
Noninterested Trustees (continued) |
| | | |
Ronald A. Pearlman 1940 | | Trustee | | Of the Trust since 2003 and of the Portfolio since 2007 | | Professor of Law, Georgetown University Law Center. Formerly, Deputy Assistant Secretary (Tax Policy) and Assistant Secretary (Tax Policy), U.S. Department of the Treasury (1983-1985). Formerly, Chief of Staff, Joint Committee on Taxation, U.S. Congress (1988-1990). Directorships in the Last Five Years.(1) None. |
| | | |
Helen Frame Peters 1948 | | Trustee | | Since 2008 | | Professor of Finance, Carroll School of Management, Boston College. Formerly, Dean, Carroll School of Management, Boston College (2000-2002). Formerly, Chief Investment Officer, Fixed Income, Scudder Kemper Investments (investment management firm) (1998-1999). Formerly, Chief Investment Officer, Equity and Fixed Income, Colonial Management Associates (investment management firm) (1991-1998). Directorships in the Last Five Years.(1) Formerly, Director of BJ’s Wholesale Club, Inc. (wholesale club retailer) (2004-2011). Formerly, Trustee of SPDR Index Shares Funds and SPDR Series Trust (exchange traded funds) (2000-2009). Formerly, Director of Federal Home Loan Bank of Boston (a bank for banks) (2007-2009). |
| | | |
Lynn A. Stout 1957 | | Trustee | | Of the Trust since 1998 and of the Portfolio since 2007 | | Distinguished Professor of Corporate and Business Law, Jack G. Clarke Business Law Institute, Cornell University Law School. Formerly, the Paul Hastings Professor of Corporate and Securities Law (2006-2012) and Professor of Law (2001-2006), University of California at Los Angeles School of Law. Directorships in the Last Five Years.(1) None. |
| | | |
Harriett Tee Taggart 1948 | | Trustee | | Since 2011 | | Managing Director, Taggart Associates (a professional practice firm). Formerly, Partner and Senior Vice President, Wellington Management Company, LLP (investment management firm) (1983-2006). Directorships in the Last Five Years. Director of Albemarle Corporation (chemicals manufacturer) (since 2007) and The Hanover Group (specialty property and casualty insurance company) (since 2009). Formerly, Director of Lubrizol Corporation (specialty chemicals) (2007-2011). |
| | | |
Ralph F. Verni 1943 | | Chairman of the Board and Trustee | | Chairman of the Board and Trustee of the Portfolio since 2007 and Trustee of the Trust since 2005 | | Consultant and private investor. Formerly, Chief Investment Officer (1982-1992), Chief Financial Officer (1988-1990) and Director (1982-1992), New England Life. Formerly, Chairperson, New England Mutual Funds (1982-1992). Formerly, President and Chief Executive Officer, State Street Management & Research (1992-2000). Formerly, Chairperson, State Street Research Mutual Funds (1992-2000). Formerly, Director, W.P. Carey, LLC (1998-2004) and First Pioneer Farm Credit Corp. (2002-2006). Directorships in the Last Five Years.(1) None. |
| | | |
| | | | | | |
Principal Officers who are not Trustees |
| Name and Year of Birth | | Position(s)
with the
Trust and the Portfolio | | Length of Service | | Principal Occupation(s) During Past Five Years |
Duncan W. Richardson 1957 | | President of the Trust | | Since 2011 | | Director of EVC and Executive Vice President and Chief Equity Investment Officer of EVC, EVM and BMR. |
| | | |
Michael A. Cirami 1975 | | President of the Portfolio | | Since 2012 | | Vice President of EVM and BMR. |
| | | |
Payson F. Swaffield 1956 | | Vice President | | Since 2011 | | Vice President and Chief Income Investment Officer of EVM and BMR. |
| | | |
Barbara E. Campbell 1957 | | Treasurer | | Of the Trust since 2005 and of the Portfolio since 2008 | | Vice President of EVM and BMR. |
Eaton Vance
Emerging Markets Local Income Fund
October 31, 2012
Management and Organization — continued
| | | | | | |
| Name and Year of Birth | | Position(s)
with the
Trust and the Portfolio | | Length of Service | | Principal Occupation(s) During Past Five Years |
Principal Officers who are not Trustees (continued) |
| | | |
Maureen A. Gemma 1960 | | Vice President, Secretary and Chief Legal Officer | | Vice President since 2011, Secretary since 2007 and Chief Legal Officer since 2008 | | Vice President of EVM and BMR. |
| | | |
Paul M. O’Neil 1953 | | Chief Compliance Officer | | Of the Trust since 2004 and of the Portfolio since 2007 | | Vice President of EVM and BMR. |
| (1) | During their respective tenures, the Trustees (except Mr. Eston and Ms. Taggart) also served as trustees of one or more of the following Eaton Vance funds (which operated in the years noted): Eaton Vance Credit Opportunities Fund (launched in 2005 and terminated in 2010); Eaton Vance Insured Florida Plus Municipal Bond Fund (launched in 2002 and terminated in 2009); and Eaton Vance National Municipal Income Trust (launched in 1998 and terminated in 2009). |
The SAI for the Fund includes additional information about the Trustees and officers of the Fund and the Portfolio and can be obtained without charge on Eaton Vance’s website at www.eatonvance.com or by calling 1-800-262-1122.
Eaton Vance Funds
IMPORTANT NOTICES
Privacy. The Eaton Vance organization is committed to ensuring your financial privacy. Each of the financial institutions identified below has in effect the following policy (“Privacy Policy”) with respect to nonpublic personal information about its customers:
| Ÿ | | Only such information received from you, through application forms or otherwise, and information about your Eaton Vance fund transactions will be collected. This may include information such as name, address, social security number, tax status, account balances and transactions. |
| Ÿ | | None of such information about you (or former customers) will be disclosed to anyone, except as permitted by law (which includes disclosure to employees necessary to service your account). In the normal course of servicing a customer’s account, Eaton Vance may share information with unaffiliated third parties that perform various required services such as transfer agents, custodians and broker-dealers. |
| Ÿ | | Policies and procedures (including physical, electronic and procedural safeguards) are in place that are designed to protect the confidentiality of such information. |
| Ÿ | | We reserve the right to change our Privacy Policy at any time upon proper notification to you. Customers may want to review our Privacy Policy periodically for changes by accessing the link on our homepage: www.eatonvance.com. |
Our pledge of privacy applies to the following entities within the Eaton Vance organization: the Eaton Vance Family of Funds, Eaton Vance Management, Eaton Vance Investment Counsel, Eaton Vance Distributors, Inc., Eaton Vance Trust Company, Eaton Vance Management’s Real Estate Investment Group and Boston Management and Research. In addition, our Privacy Policy applies only to those Eaton Vance customers who are individuals and who have a direct relationship with us. If a customer’s account (i.e., fund shares) is held in the name of a third-party financial advisor/broker-dealer, it is likely that only such advisor’s privacy policies apply to the customer. This notice supersedes all previously issued privacy disclosures. For more information about Eaton Vance’s Privacy Policy, please call 1-800-262-1122.
Delivery of Shareholder Documents. The Securities and Exchange Commission (SEC) permits funds to deliver only one copy of shareholder documents, including prospectuses, proxy statements and shareholder reports, to fund investors with multiple accounts at the same residential or post office box address. This practice is often called “householding” and it helps eliminate duplicate mailings to shareholders. Eaton Vance, or your financial advisor, may household the mailing of your documents indefinitely unless you instruct Eaton Vance, or your financial advisor, otherwise. If you would prefer that your Eaton Vance documents not be householded, please contact Eaton Vance at 1-800-262-1122, or contact your financial advisor. Your instructions that householding not apply to delivery of your Eaton Vance documents will be effective within 30 days of receipt by Eaton Vance or your financial advisor.
Portfolio Holdings. Each Eaton Vance Fund and its underlying Portfolio(s) (if applicable) will file a schedule of portfolio holdings on Form N-Q with the SEC for the first and third quarters of each fiscal year. The Form N-Q will be available on the Eaton Vance website at www.eatonvance.com, by calling Eaton Vance at 1-800-262-1122 or in the EDGAR database on the SEC’s website at www.sec.gov. Form N-Q may also be reviewed and copied at the SEC’s public reference room in Washington, D.C. (call 1-800-732-0330 for information on the operation of the public reference room).
Proxy Voting. From time to time, funds are required to vote proxies related to the securities held by the funds. The Eaton Vance Funds or their underlying Portfolios (if applicable) vote proxies according to a set of policies and procedures approved by the Funds’ and Portfolios’ Boards. You may obtain a description of these policies and procedures and information on how the Funds or Portfolios voted proxies relating to portfolio securities during the most recent 12-month period ended June 30, without charge, upon request, by calling 1-800-262-1122 and by accessing the SEC’s website at www.sec.gov.
This Page Intentionally Left Blank
This Page Intentionally Left Blank
This Page Intentionally Left Blank
Investment Adviser of Emerging Markets Local Income Portfolio
Boston Management and Research
Two International Place
Boston, MA 02110
Investment Adviser and Administrator of Eaton Vance Emerging Markets Local Income Fund
Eaton Vance Management
Two International Place
Boston, MA 02110
Principal Underwriter*
Eaton Vance Distributors, Inc.
Two International Place
Boston, MA 02110
(617) 482-8260
Custodian
State Street Bank and Trust Company
200 Clarendon Street
Boston, MA 02116
Transfer Agent
BNY Mellon Investment Servicing (US) Inc.
Attn: Eaton Vance Funds
P.O. Box 9653
Providence, RI 02940-9653
(800) 262-1122
Independent Registered Public Accounting Firm
Deloitte & Touche LLP
200 Berkeley Street
Boston, MA 02116-5022
Fund Offices
Two International Place
Boston, MA 02110
| * | FINRA BrokerCheck. Investors may check the background of their Investment Professional by contacting the Financial Industry Regulatory Authority (FINRA). FINRA BrokerCheck is a free tool to help investors check the professional background of current and former FINRA-registered securities firms and brokers. FINRA BrokerCheck is available by calling 1-800-289-9999 and at www.FINRA.org. The FINRA BrokerCheck brochure describing this program is available to investors at www.FINRA.org. |
| | |
Eaton Vance Floating-Rate Fund Annual Report October 31, 2012 | | 
|

Fund shares are not insured by the FDIC and are not deposits or other obligations of, or guaranteed by, any depository institution. Shares are subject to investment risks, including possible loss of principal invested.
This report must be preceded or accompanied by a current summary prospectus or prospectus. Before investing, investors should consider carefully the investment objective, risks, and charges and expenses of a mutual fund. This and other important information is contained in the summary prospectus and prospectus, which can be obtained from a financial advisor. Prospective investors should read the prospectus carefully before investing. For further information, please call 1-800-262-1122.
Annual Report October 31, 2012
Eaton Vance
Floating-Rate Fund
Table of Contents
| | | | |
Management’s Discussion of Fund Performance | | | 2 | |
| |
Performance | | | 3 | |
| |
Fund Profile | | | 4 | |
| |
Endnotes and Additional Disclosures | | | 5 | |
| |
Fund Expenses | | | 6 | |
| |
Financial Statements | | | 7 | |
| |
Report of Independent Registered Public Accounting Firm | | | 19 and 49 | |
| |
Federal Tax Information | | | 20 | |
| |
Management and Organization | | | 50 | |
| |
Important Notices | | | 53 | |
Eaton Vance
Floating-Rate Fund
October 31, 2012
Management’s Discussion of Fund Performance1
Economic and Market Conditions
The U.S. floating-rate loan market generated solid results for the 12-month period ended October 31, 2012, as measured by the 8.48% return of the S&P/LSTA Leveraged Loan Index,2 a broad barometer of the asset class. Returns of the Index reflected an increase in loan prices, plus investment income.
Throughout the past 12 months, the floating-rate market exhibited resilience amid low U.S. economic growth and uncertainty regarding U.S. fiscal policy. This resilience was due to favorable market technical and fundamental conditions. The net supply of floating-rate loans was moderate, as loan repayments by issuers helped offset new issue supply coming to market. At the same time, demand strengthened. Improved economic data and the U.S. Federal Reserve’s pledge to keep interest rates low appeared to have fueled investors’ appetite for higher-yielding alternatives to government bonds. Other investors turned to floating-rate loans for protection against potentially rising interest rates. In the institutional market, buying by pension funds, hedge funds, structured vehicles and other institutional investors, such as value crossover strategies, also expanded as the period progressed. For the period overall, the modest growth in the overall supply of loans was easily absorbed due to widespread investor demand.
In terms of issuer fundamentals, improving corporate balance sheets and better-than-expected earnings growth also helped bolster loans. Furthermore, the default rate in the market remained well below longer-term averages, ending October 31, 2012 at 1.1% by principal amount on a last-12-months basis, according to S&P Leveraged Commentary & Data (LCD).
Fund Performance
For the fiscal year ended October 31, 2012, Eaton Vance Floating-Rate Fund’s (the Fund) Class A shares at net asset value (NAV) had a total return of 7.17%. By comparison, the Fund’s benchmark, the S&P/LSTA Leveraged Loan Index (the Index), gained 8.48% during the period.
The Fund’s underweight to the lower-quality segment of the market detracted from performance relative to the Index. Specifically, the Fund’s holdings were biased toward higher-quality BB- and B-rated7 loans. At the same time, the Fund had an underweight to CCC-rated loans. For the year, BB-rated loans in the Index returned 6.60%, B-rated loans in the Index gained 10.12% and CCC-rated loans in the Index rose 9.93%. Within the BB- and B-rated space, the Fund had a more
pronounced overweight to the higher-rated BB-ratings tier, providing a further drag on relative results versus the Index.
Additionally, the Fund’s underweight exposure to publishing and financial intermediaries — which outperformed the broad market — and overweight exposure to the leisure goods/ activities/movies segment — which underperformed the broad market — detracted from performance relative to the Index.
Contributing to relative performance versus the Index were the Fund’s underweight exposures to utilities and telecommunications as these segments underperformed the overall loan market.
The Fund generated attractive income during the year, despite ultra low levels of short-term interest rates.
See Endnotes and Additional Disclosures in this report.
Past performance is no guarantee of future results. Returns are historical and are calculated by determining the percentage change in net asset value (NAV) or offering price (as applicable) with all distributions reinvested. Investment return and principal value will fluctuate so that shares, when redeemed, may be worth more or less than their original cost. Performance less than one year is cumulative. Performance is for the stated time period only; due to market volatility, the Fund’s current performance may be lower or higher than quoted. Returns are before taxes unless otherwise noted. For performance as of the most recent month end, please refer to www.eatonvance.com.
Eaton Vance
Floating-Rate Fund
October 31, 2012
Performance2,3
Portfolio Managers Scott H. Page, CFA and Craig P. Russ
| | | | | | | | | | | | | | | | | | | | |
| % Average Annual Total Returns | | Inception Date | | | One Year | | | Five Years | | | Ten Years | | | Since
Inception | |
Advisers Class at NAV | | | 02/07/2001 | | | | 7.16 | % | | | 3.73 | % | | | 4.27 | % | | | — | |
Class A at NAV | | | 05/05/2003 | | | | 7.17 | | | | 3.74 | | | | — | | | | 4.16 | % |
Class A with 2.25% Maximum Sales Charge | | | — | | | | 4.77 | | | | 3.27 | | | | — | | | | 3.91 | |
Class B at NAV | | | 02/05/2001 | | | | 6.36 | | | | 2.96 | | | | 3.49 | | | | — | |
Class B with 5% Maximum Sales Charge | | | — | | | | 1.36 | | | | 2.62 | | | | 3.49 | | | | — | |
Class C at NAV | | | 02/01/2001 | | | | 6.36 | | | | 2.96 | | | | 3.49 | | | | — | |
Class C with 1% Maximum Sales Charge | | | — | | | | 5.36 | | | | 2.96 | | | | 3.49 | | | | — | |
Class I at NAV | | | 01/30/2001 | | | | 7.41 | | | | 4.01 | | | | 4.54 | | | | — | |
S&P/LSTA Leveraged Loan Index | | | — | | | | 8.48 | % | | | 5.21 | % | | | 5.88 | % | | | — | |
| | | | | |
| | | | | | | | | | | | | | | | | | | | |
| % Total Annual Operating Expense Ratios4 | | Advisers Class | | | Class A | | | Class B | | | Class C | | | Class I | |
| | | 1.01 | % | | | 1.01 | % | | | 1.76 | % | | | 1.76 | % | | | 0.76 | % |
Performance of $250,000
This graph shows the change in value of a hypothetical investment of $250,000 in Class I of the Fund for the period indicated. For comparison, the same investment is shown in the indicated index.
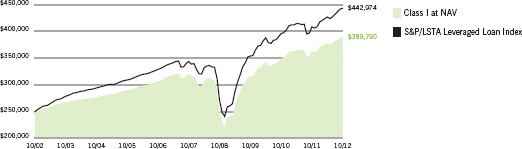
| | | | | | | | |
| Performance of Investment | | Amount Invested | | Period Beginning | | At NAV | | With Maximum
Sales Charge |
Advisers Class | | $10,000 | | 10/31/2002 | | $15,197 | | N.A. |
Class A | | $10,000 | | 05/05/2003 | | $14,722 | | $14,391 |
Class B | | $10,000 | | 10/31/2002 | | $14,097 | | N.A. |
Class C | | $10,000 | | 10/31/2002 | | $14,098 | | N.A. |
See Endnotes and Additional Disclosures in this report.
Past performance is no guarantee of future results. Returns are historical and are calculated by determining the percentage change in net asset value (NAV) or offering price (as applicable) with all distributions reinvested. Investment return and principal value will fluctuate so that shares, when redeemed, may be worth more or less than their original cost. Performance less than one year is cumulative. Performance is for the stated time period only; due to market volatility, the Fund’s current performance may be lower or higher than quoted. Returns are before taxes unless otherwise noted. For performance as of the most recent month end, please refer to www.eatonvance.com.
Eaton Vance
Floating-Rate Fund
October 31, 2012
Fund Profile5
| | | | | | |
Top 10 Holdings (% of total investments)6 |
| | |
Rite Aid Corporation | | | 1.0 | % | | |
Intelsat Jackson Holdings Ltd. | | | 1.0 | | | |
Asurion LLC | | | 1.0 | | | |
HCA, Inc. | | | 0.9 | | | |
Alliance Boots Holdings Limited | | | 0.9 | | | |
Del Monte Foods Company | | | 0.9 | | | |
Hertz Corporation (The) | | | 0.9 | | | |
MetroPCS Wireless, Inc. | | | 0.8 | | | |
Infor (US), Inc. | | | 0.8 | | | |
Chrysler Group LLC | | | 0.7 | | | |
Total | | | 8.9 | % | | |
| | | | | | |
Top 10 Sectors (% of total investments)6 |
| | |
Health Care | | | 12.4 | % | | |
Business Equipment and Services | | | 8.2 | | | |
Electronics/Electrical | | | 5.7 | | | |
Automotive | | | 4.4 | | | |
Chemicals and Plastics | | | 4.0 | | | |
Telecommunications | | | 3.9 | | | |
Publishing | | | 3.8 | | | |
Leisure Goods/Activities/Movies | | | 3.7 | | | |
Food Products | | | 3.5 | | | |
Food Service | | | 3.5 | | | |
Total | | | 53.1 | % | | |
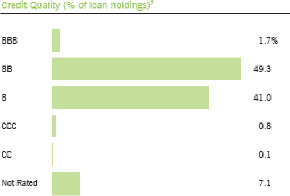
See Endnotes and Additional Disclosures in this report.
Eaton Vance
Floating-Rate Fund
October 31, 2012
Endnotes and Additional Disclosures
| 1 | The views expressed in this report are those of the portfolio manager(s) and are current only through the date stated at the top of this page. These views are subject to change at any time based upon market or other conditions, and Eaton Vance and the Fund(s) disclaim any responsibility to update such views. These views may not be relied upon as investment advice and, because investment decisions are based on many factors, may not be relied upon as an indication of trading intent on behalf of any Eaton Vance fund. This commentary may contain statements that are not historical facts, referred to as “forward looking statements”. The Fund’s actual future results may differ significantly from those stated in any forward looking statement, depending on factors such as changes in securities or financial markets or general economic conditions, the volume of sales and purchases of Fund shares, the continuation of investment advisory, administrative and service contracts, and other risks discussed from time to time in the Fund’s filings with the Securities and Exchange Commission. |
| 2 | S&P/LSTA Leveraged Loan Index is an unmanaged index of the institutional leveraged loan market. Unless otherwise stated, index returns do not reflect the effect of any applicable sales charges, commissions, expenses, taxes or leverage, as applicable. It is not possible to invest directly in an index. |
| 3 | Total Returns at NAV do not include applicable sales charges. If sales charges were deducted, the returns would be lower. Total Returns shown with maximum sales charge reflect the stated maximum sales charge. Unless otherwise stated, performance does not reflect the deduction of taxes on Fund distributions or redemptions of Fund shares. |
| 4 | Source: Fund prospectus. |
| 5 | Fund invests in an affiliated investment company (Portfolio) with the same objective(s) and policies as the Fund. References to investments are to the Portfolio’s holdings. |
| 6 | Excludes cash and cash equivalents. |
| 7 | Ratings are based on Moody’s, S&P or Fitch, as applicable. Credit ratings are based largely on the rating agency’s investment analysis at the time of rating and the rating assigned to any particular security is not necessarily a reflection of the issuer’s current financial condition. The rating assigned to a security by a rating agency does not necessarily reflect its assessment of the volatility of a security’s market value or of the liquidity of an investment in the security. If securities are rated differently by the rating agencies, the higher rating is applied. Ratings of BBB or higher by Standard and Poor’s or Fitch (Baa or higher by Moody’s) are considered to be investment grade quality. |
| | Fund profile subject to change due to active management. |
Eaton Vance
Floating-Rate Fund
October 31, 2012
Fund Expenses
Example: As a Fund shareholder, you incur two types of costs: (1) transaction costs, including sales charges (loads) on purchases and redemption fees (if applicable); and (2) ongoing costs, including management fees; distribution and/or service fees; and other Fund expenses. This Example is intended to help you understand your ongoing costs (in dollars) of Fund investing and to compare these costs with the ongoing costs of investing in other mutual funds. The Example is based on an investment of $1,000 invested at the beginning of the period and held for the entire period (May 1, 2012 – October 31, 2012).
Actual Expenses: The first section of the table below provides information about actual account values and actual expenses. You may use the information in this section, together with the amount you invested, to estimate the expenses that you paid over the period. Simply divide your account value by $1,000 (for example, an $8,600 account value divided by $1,000 = 8.6), then multiply the result by the number in the first section under the heading entitled “Expenses Paid During Period” to estimate the expenses you paid on your account during this period.
Hypothetical Example for Comparison Purposes: The second section of the table below provides information about hypothetical account values and hypothetical expenses based on the actual Fund expense ratio and an assumed rate of return of 5% per year (before expenses), which is not the actual Fund return. The hypothetical account values and expenses may not be used to estimate the actual ending account balance or expenses you paid for the period. You may use this information to compare the ongoing costs of investing in your Fund and other funds. To do so, compare this 5% hypothetical example with the 5% hypothetical examples that appear in the shareholder reports of the other funds.
Please note that the expenses shown in the table are meant to highlight your ongoing costs only and do not reflect any transactional costs, such as sales charges (loads) or redemption fees (if applicable). Therefore, the second section of the table is useful in comparing ongoing costs only, and will not help you determine the relative total costs of owning different funds. In addition, if these transactional costs were included, your costs would be higher.
| | | | | | | | | | | | | | | | |
| | | Beginning
Account Value
(5/1/12) | | | Ending
Account Value
(10/31/12) | | | Expenses Paid
During Period*
(5/1/12 – 10/31/12) | | | Annualized
Expense
Ratio | |
| | | | |
| | | | | | | | | | | | | | | | |
Actual | | | | | | | | | | | | | | | | |
Advisers Class | | $ | 1,000.00 | | | $ | 1,029.00 | | | $ | 5.15 | | | | 1.01 | % |
Class A | | $ | 1,000.00 | | | $ | 1,029.80 | | | $ | 5.15 | | | | 1.01 | % |
Class B | | $ | 1,000.00 | | | $ | 1,026.20 | | | $ | 9.01 | | | | 1.77 | % |
Class C | | $ | 1,000.00 | | | $ | 1,025.10 | | | $ | 8.96 | | | | 1.76 | % |
Class I | | $ | 1,000.00 | | | $ | 1,031.30 | | | $ | 3.88 | | | | 0.76 | % |
| | | | | | | | | | | | | | | | | |
| | | | |
| | | | | | | | | | | | | | | | |
Hypothetical | | | | | | | | | | | | | |
(5% return per year before expenses) | | | | | | | | | | | | | |
Advisers Class | | $ | 1,000.00 | | | $ | 1,020.10 | | | $ | 5.13 | | | | 1.01 | % |
Class A | | $ | 1,000.00 | | | $ | 1,020.10 | | | $ | 5.13 | | | | 1.01 | % |
Class B | | $ | 1,000.00 | | | $ | 1,016.20 | | | $ | 8.97 | | | | 1.77 | % |
Class C | | $ | 1,000.00 | | | $ | 1,016.30 | | | $ | 8.92 | | | | 1.76 | % |
Class I | | $ | 1,000.00 | | | $ | 1,021.30 | | | $ | 3.86 | | | | 0.76 | % |
| * | Expenses are equal to the Fund’s annualized expense ratio for the indicated Class, multiplied by the average account value over the period, multiplied by 184/366 (to reflect the one-half year period). The Example assumes that the $1,000 was invested at the net asset value per share determined at the close of business on April 30, 2012. The Example reflects the expenses of both the Fund and the Portfolio. |
Eaton Vance
Floating-Rate Fund
October 31, 2012
Statement of Assets and Liabilities
| | | | |
| Assets | | October 31, 2012 | |
Investment in Floating Rate Portfolio, at value (identified cost, $7,783,042,696) | | $ | 7,825,509,120 | |
Receivable for Fund shares sold | | | 37,810,245 | |
Total assets | | $ | 7,863,319,365 | |
|
| Liabilities | |
Payable for Fund shares redeemed | | $ | 17,127,509 | |
Distributions payable | | | 11,342,298 | |
Payable to affiliates: | | | | |
Distribution and service fees | | | 1,135,815 | |
Administration fee | | | 977,851 | |
Trustees’ fees | | | 42 | |
Accrued expenses | | | 1,033,634 | |
Total liabilities | | $ | 31,617,149 | |
Net Assets | | $ | 7,831,702,216 | |
|
| Sources of Net Assets | |
Paid-in capital | | $ | 8,063,676,182 | |
Accumulated net realized loss from Portfolio | | | (266,813,554 | ) |
Accumulated distributions in excess of net investment income | | | (7,626,836 | ) |
Net unrealized appreciation from Portfolio | | | 42,466,424 | |
Total | | $ | 7,831,702,216 | |
|
| Advisers Class Shares | |
Net Assets | | $ | 519,542,329 | |
Shares Outstanding | | | 57,128,149 | |
Net Asset Value, Offering Price and Redemption Price Per Share | | | | |
(net assets ÷ shares of beneficial interest outstanding) | | $ | 9.09 | |
|
| Class A Shares | |
Net Assets | | $ | 1,620,674,735 | |
Shares Outstanding | | | 172,305,385 | |
Net Asset Value and Redemption Price Per Share | | | | |
(net assets ÷ shares of beneficial interest outstanding) | | $ | 9.41 | |
Maximum Offering Price Per Share | | | | |
(100 ÷ 97.75 of net asset value per share) | | $ | 9.63 | |
|
| Class B Shares | |
Net Assets | | $ | 25,324,980 | |
Shares Outstanding | | | 2,789,465 | |
Net Asset Value and Offering Price Per Share* | | | | |
(net assets ÷ shares of beneficial interest outstanding) | | $ | 9.08 | |
|
| Class C Shares | |
Net Assets | | $ | 789,511,804 | |
Shares Outstanding | | | 86,921,158 | |
Net Asset Value and Offering Price Per Share* | | | | |
(net assets ÷ shares of beneficial interest outstanding) | | $ | 9.08 | |
|
| Class I Shares | |
Net Assets | | $ | 4,876,648,368 | |
Shares Outstanding | | | 535,947,306 | |
Net Asset Value, Offering Price and Redemption Price Per Share | | | | |
(net assets ÷ shares of beneficial interest outstanding) | | $ | 9.10 | |
| On | sales of $100,000 or more, the offering price of Class A shares is reduced. |
| * | Redemption price per share is equal to the net asset value less any applicable contingent deferred sales charge. |
| | | | |
| | 7 | | See Notes to Financial Statements. |
Eaton Vance
Floating-Rate Fund
October 31, 2012
Statement of Operations
| | | | |
| Investment Income | | Year Ended
October 31, 2012 | |
Interest and other income allocated from Portfolio | | $ | 400,903,716 | |
Dividends allocated from Portfolio | | | 4,918,213 | |
Expenses allocated from Portfolio | | | (41,767,722 | ) |
Total investment income from Portfolio | | $ | 364,054,207 | |
|
| Expenses | |
Administration fee | | $ | 11,549,087 | |
Distribution and service fees | | | | |
Advisers Class | | | 1,212,113 | |
Class A | | | 3,670,269 | |
Class B | | | 325,756 | |
Class C | | | 7,691,904 | |
Trustees’ fees and expenses | | | 500 | |
Custodian fee | | | 38,343 | |
Transfer and dividend disbursing agent fees | | | 4,466,430 | |
Legal and accounting services | | | 72,088 | |
Printing and postage | | | 937,137 | |
Registration fees | | | 96,974 | |
Miscellaneous | | | 48,755 | |
Total expenses | | $ | 30,109,356 | |
| |
Net investment income | | $ | 333,944,851 | |
| |
| Realized and Unrealized Gain (Loss) from Portfolio | | | | |
Net realized gain (loss) — | | | | |
Investment transactions | | $ | 19,683,217 | |
Swap contracts | | | (909,701 | ) |
Foreign currency and forward foreign currency exchange contract transactions | | | 25,637,649 | |
Net realized gain | | $ | 44,411,165 | |
Change in unrealized appreciation (depreciation) — | | | | |
Investments | | $ | 168,855,402 | |
Swap contracts | | | (846,702 | ) |
Foreign currency and forward foreign currency exchange contracts | | | (7,186,295 | ) |
Net change in unrealized appreciation (depreciation) | | $ | 160,822,405 | |
| |
Net realized and unrealized gain | | $ | 205,233,570 | |
| |
Net increase in net assets from operations | | $ | 539,178,421 | |
| | | | |
| | 8 | | See Notes to Financial Statements. |
Eaton Vance
Floating-Rate Fund
October 31, 2012
Statements of Changes in Net Assets
| | | | | | | | |
| | | Year Ended October 31, | |
| Increase (Decrease) in Net Assets | | 2012 | | | 2011 | |
From operations — | | | | | | | | |
Net investment income | | $ | 333,944,851 | | | $ | 289,699,824 | |
Net realized gain (loss) from investment transactions, swap contracts and foreign currency and forward foreign currency exchange contract transactions | | | 44,411,165 | | | | (13,731,371 | ) |
Net change in unrealized appreciation (depreciation) from investments, swap contracts, foreign currency and forward foreign currency exchange contracts | | | 160,822,405 | | | | (85,895,222 | ) |
Net increase in net assets from operations | | $ | 539,178,421 | | | $ | 190,073,231 | |
Distributions to shareholders — | | | | | | | | |
From net investment income | | | | | | | | |
Advisers Class | | $ | (20,585,388 | ) | | $ | (21,432,506 | ) |
Class A | | | (62,390,589 | ) | | | (57,075,853 | ) |
Class B | | | (1,130,752 | ) | | | (1,576,040 | ) |
Class C | | | (26,894,967 | ) | | | (25,501,335 | ) |
Class I | | | (221,889,919 | ) | | | (179,405,173 | ) |
Tax return of capital | | | | | | | | |
Advisers Class | | | — | | | | (815,482 | ) |
Class A | | | — | | | | (2,171,670 | ) |
Class B | | | — | | | | (59,967 | ) |
Class C | | | — | | | | (970,296 | ) |
Class I | | | — | | | | (6,826,160 | ) |
Total distributions to shareholders | | $ | (332,891,615 | ) | | $ | (295,834,482 | ) |
Transactions in shares of beneficial interest — | | | | | | | | |
Proceeds from sale of shares | | | | | | | | |
Advisers Class | | $ | 157,689,418 | | | $ | 399,281,466 | |
Class A | | | 527,302,015 | | | | 996,681,474 | |
Class B | | | 1,647,996 | | | | 11,923,535 | |
Class C | | | 133,094,618 | | | | 275,080,563 | |
Class I | | | 2,142,614,643 | | | | 3,917,813,641 | |
Net asset value of shares issued to shareholders in payment of distributions declared | | | | | | | | |
Advisers Class | | | 19,661,046 | | | | 20,602,176 | |
Class A | | | 56,070,258 | | | | 48,713,299 | |
Class B | | | 942,089 | | | | 1,113,520 | |
Class C | | | 20,295,552 | | | | 18,143,158 | |
Class I | | | 78,063,837 | | | | 58,488,929 | |
Cost of shares redeemed | | | | | | | | |
Advisers Class | | | (162,838,764 | ) | | | (352,091,893 | ) |
Class A | | | (464,571,888 | ) | | | (748,651,194 | ) |
Class B | | | (7,137,703 | ) | | | (13,512,001 | ) |
Class C | | | (166,621,878 | ) | | | (238,003,109 | ) |
Class I | | | (2,585,556,155 | ) | | | (1,590,280,252 | ) |
Net asset value of shares exchanged | | | | | | | | |
Class A | | | 12,055,754 | | | | 13,347,912 | |
Class B | | | (12,055,754 | ) | | | (13,347,912 | ) |
Redemption fees | | | — | | | | 96,079 | |
Net increase (decrease) in net assets from Fund share transactions | | $ | (249,344,916 | ) | | $ | 2,805,399,391 | |
| | |
Net increase (decrease) in net assets | | $ | (43,058,110 | ) | | $ | 2,699,638,140 | |
|
| Net Assets | |
At beginning of year | | $ | 7,874,760,326 | | | $ | 5,175,122,186 | |
At end of year | | $ | 7,831,702,216 | | | $ | 7,874,760,326 | |
|
Accumulated distributions in excess of net investment income
included in net assets | |
At end of year | | $ | (7,626,836 | ) | | $ | (14,738,985 | ) |
| | | | |
| | 9 | | See Notes to Financial Statements. |
Eaton Vance
Floating-Rate Fund
October 31, 2012
Financial Highlights
| | | | | | | | | | | | | | | | | | | | |
| | | Advisers Class | |
| | | Year Ended October 31, | |
| | | 2012 | | | 2011 | | | 2010 | | | 2009 | | | 2008 | |
Net asset value — Beginning of year | | $ | 8.850 | | | $ | 8.880 | | | $ | 8.450 | | | $ | 7.000 | | | $ | 9.590 | |
| | | | | |
| Income (Loss) From Operations | | | | | | | | | | | | | | | | | | | | |
Net investment income(1) | | $ | 0.382 | | | $ | 0.342 | | | $ | 0.345 | | | $ | 0.362 | | | $ | 0.545 | |
Net realized and unrealized gain (loss) | | | 0.239 | | | | (0.018 | ) | | | 0.488 | | | | 1.442 | | | | (2.618 | ) |
| | | | | |
Total income (loss) from operations | | $ | 0.621 | | | $ | 0.324 | | | $ | 0.833 | | | $ | 1.804 | | | $ | (2.073 | ) |
| | | | | |
| Less Distributions | | | | | | | | | | | | | | | | | | | | |
From net investment income | | $ | (0.381 | ) | | $ | (0.341 | ) | | $ | (0.404 | ) | | $ | (0.356 | ) | | $ | (0.435 | ) |
Tax return of capital | | | — | | | | (0.013 | ) | | | — | | | | — | | | | (0.083 | ) |
| | | | | |
Total distributions | | $ | (0.381 | ) | | $ | (0.354 | ) | | $ | (0.404 | ) | | $ | (0.356 | ) | | $ | (0.518 | ) |
| | | | | |
Redemption fees(1) | | $ | — | | | $ | 0.000 | (2) | | $ | 0.001 | | | $ | 0.002 | | | $ | 0.001 | |
| | | | | |
Net asset value — End of year | | $ | 9.090 | | | $ | 8.850 | | | $ | 8.880 | | | $ | 8.450 | | | $ | 7.000 | |
| | | | | |
Total Return(3) | | | 7.16 | % | | | 3.68 | % | | | 10.08 | % | | | 26.83 | % | | | (22.55 | )% |
| | | | | |
| Ratios/Supplemental Data | | | | | | | | | | | | | | | | | | | | |
Net assets, end of year (000’s omitted) | | $ | 519,542 | | | $ | 492,206 | | | $ | 432,169 | | | $ | 355,499 | | | $ | 375,801 | |
Ratios (as a percentage of average daily net assets): | | | | | | | | | | | | | | | | | | | | |
Expenses(4)(5) | | | 1.02 | % | | | 1.01 | % | | | 1.05 | % | | | 1.12 | % | | | 1.19 | % |
Net investment income | | | 4.26 | % | | | 3.82 | % | | | 3.96 | % | | | 4.95 | % | | | 6.11 | % |
Portfolio Turnover of the Portfolio | | | 42 | % | | | 56 | % | | | 39 | % | | | 35 | % | | | 7 | % |
| (1) | Computed using average shares outstanding. |
| (2) | Amount is less than $0.0005. |
| (3) | Returns are historical and are calculated by determining the percentage change in net asset value with all distributions reinvested. |
| (4) | Includes the Fund’s share of the Portfolio’s allocated expenses. |
| (5) | Excludes the effect of custody fee credits, if any, of less than 0.005%. |
| | | | |
| | 10 | | See Notes to Financial Statements. |
Eaton Vance
Floating-Rate Fund
October 31, 2012
Financial Highlights — continued
| | | | | | | | | | | | | | | | | | | | |
| | | Class A | |
| | | Year Ended October 31, | |
| | | 2012 | | | 2011 | | | 2010 | | | 2009 | | | 2008 | |
Net asset value — Beginning of year | | $ | 9.160 | | | $ | 9.180 | | | $ | 8.740 | | | $ | 7.240 | | | $ | 9.920 | |
| | | | | |
| Income (Loss) From Operations | | | | | | | | | | | | | | | | | | | | |
Net investment income(1) | | $ | 0.395 | | | $ | 0.355 | | | $ | 0.356 | | | $ | 0.372 | | | $ | 0.560 | |
Net realized and unrealized gain (loss) | | | 0.248 | | | | (0.010 | ) | | | 0.499 | | | | 1.494 | | | | (2.705 | ) |
| | | | | |
Total income (loss) from operations | | $ | 0.643 | | | $ | 0.345 | | | $ | 0.855 | | | $ | 1.866 | | | $ | (2.145 | ) |
| | | | | |
| Less Distributions | | | | | | | | | | | | | | | | | | | | |
From net investment income | | $ | (0.393 | ) | | $ | (0.352 | ) | | $ | (0.416 | ) | | $ | (0.368 | ) | | $ | (0.450 | ) |
Tax return of capital | | | — | | | | (0.013 | ) | | | — | | | | — | | | | (0.086 | ) |
| | | | | |
Total distributions | | $ | (0.393 | ) | | $ | (0.365 | ) | | $ | (0.416 | ) | | $ | (0.368 | ) | | $ | (0.536 | ) |
| | | | | |
Redemption fees(1) | | $ | — | | | $ | 0.000 | (2) | | $ | 0.001 | | | $ | 0.002 | | | $ | 0.001 | |
| | | | | |
Net asset value — End of year | | $ | 9.410 | | | $ | 9.160 | | | $ | 9.180 | | | $ | 8.740 | | | $ | 7.240 | |
| | | | | |
Total Return(3) | | | 7.17 | % | | | 3.79 | % | | | 10.00 | % | | | 27.01 | % | | | (22.66 | )% |
| | | | | |
| Ratios/Supplemental Data | | | | | | | | | | | | | | | | | | | | |
Net assets, end of year (000’s omitted) | | $ | 1,620,675 | | | $ | 1,450,518 | | | $ | 1,160,014 | | | $ | 946,191 | | | $ | 646,322 | |
Ratios (as a percentage of average daily net assets): | | | | | | | | | | | | | | | | | | | | |
Expenses(4)(5) | | | 1.02 | % | | | 1.01 | % | | | 1.04 | % | | | 1.12 | % | | | 1.19 | % |
Net investment income | | | 4.26 | % | | | 3.83 | % | | | 3.96 | % | | | 4.90 | % | | | 6.08 | % |
Portfolio Turnover of the Portfolio | | | 42 | % | | | 56 | % | | | 39 | % | | | 35 | % | | | 7 | % |
| (1) | Computed using average shares outstanding. |
| (2) | Amount is less than $0.0005. |
| (3) | Returns are historical and are calculated by determining the percentage change in net asset value with all distributions reinvested and do not reflect the effect of sales charges. |
| (4) | Includes the Fund’s share of the Portfolio’s allocated expenses. |
| (5) | Excludes the effect of custody fee credits, if any, of less than 0.005%. |
| | | | |
| | 11 | | See Notes to Financial Statements. |
Eaton Vance
Floating-Rate Fund
October 31, 2012
Financial Highlights — continued
| | | | | | | | | | | | | | | | | | | | |
| | | Class B | |
| | | Year Ended October 31, | |
| | | 2012 | | | 2011 | | | 2010 | | | 2009 | | | 2008 | |
Net asset value — Beginning of year | | $ | 8.840 | | | $ | 8.860 | | | $ | 8.440 | | | $ | 6.990 | | | $ | 9.590 | |
| | | | | |
| Income (Loss) From Operations | | | | | | | | | | | | | | | | | | | | |
Net investment income(1) | | $ | 0.312 | | | $ | 0.275 | | | $ | 0.280 | | | $ | 0.315 | | | $ | 0.469 | |
Net realized and unrealized gain (loss) | | | 0.241 | | | | (0.007 | ) | | | 0.479 | | | | 1.436 | | | | (2.616 | ) |
| | | | | |
Total income (loss) from operations | | $ | 0.553 | | | $ | 0.268 | | | $ | 0.759 | | | $ | 1.751 | | | $ | (2.147 | ) |
| | | | | |
| Less Distributions | | | | | | | | | | | | | | | | | | | | |
From net investment income | | $ | (0.313 | ) | | $ | (0.277 | ) | | $ | (0.340 | ) | | $ | (0.303 | ) | | $ | (0.382 | ) |
Tax return of capital | | | — | | | | (0.011 | ) | | | — | | | | — | | | | (0.072 | ) |
| | | | | |
Total distributions | | $ | (0.313 | ) | | $ | (0.288 | ) | | $ | (0.340 | ) | | $ | (0.303 | ) | | $ | (0.454 | ) |
| | | | | |
Redemption fees(1) | | $ | — | | | $ | 0.000 | (2) | | $ | 0.001 | | | $ | 0.002 | | | $ | 0.001 | |
| | | | | |
Net asset value — End of year | | $ | 9.080 | | | $ | 8.840 | | | $ | 8.860 | | | $ | 8.440 | | | $ | 6.990 | |
| | | | | |
Total Return(3) | | | 6.36 | % | | | 3.04 | % | | | 9.17 | % | | | 25.96 | % | | | (23.22 | )% |
| | | | | |
| Ratios/Supplemental Data | | | | | | | | | | | | | | | | | | | | |
Net assets, end of year (000’s omitted) | | $ | 25,325 | | | $ | 41,084 | | | $ | 55,067 | | | $ | 66,309 | | | $ | 85,386 | |
Ratios (as a percentage of average daily net assets): | | | | | | | | | | | | | | | | | | | | |
Expenses(4)(5) | | | 1.77 | % | | | 1.76 | % | | | 1.80 | % | | | 1.88 | % | | | 1.94 | % |
Net investment income | | | 3.49 | % | | | 3.08 | % | | | 3.23 | % | | | 4.38 | % | | | 5.29 | % |
Portfolio Turnover of the Portfolio | | | 42 | % | | | 56 | % | | | 39 | % | | | 35 | % | | | 7 | % |
| (1) | Computed using average shares outstanding. |
| (2) | Amount is less than $0.0005. |
| (3) | Returns are historical and are calculated by determining the percentage change in net asset value with all distributions reinvested and do not reflect the effect of sales charges. |
| (4) | Includes the Fund’s share of the Portfolio’s allocated expenses. |
| (5) | Excludes the effect of custody fee credits, if any, of less than 0.005%. |
| | | | |
| | 12 | | See Notes to Financial Statements. |
Eaton Vance
Floating-Rate Fund
October 31, 2012
Financial Highlights — continued
| | | | | | | | | | | | | | | | | | | | |
| | | Class C | |
| | | Year Ended October 31, | |
| | | 2012 | | | 2011 | | | 2010 | | | 2009 | | | 2008 | |
Net asset value — Beginning of year | | $ | 8.840 | | | $ | 8.870 | | | $ | 8.440 | | | $ | 6.990 | | | $ | 9.590 | |
| | | | | |
| Income (Loss) From Operations | | | | | | | | | | | | | | | | | | | | |
Net investment income(1) | | $ | 0.314 | | | $ | 0.276 | | | $ | 0.279 | | | $ | 0.308 | | | $ | 0.472 | |
Net realized and unrealized gain (loss) | | | 0.239 | | | | (0.018 | ) | | | 0.491 | | | | 1.443 | | | | (2.619 | ) |
| | | | | |
Total income (loss) from operations | | $ | 0.553 | | | $ | 0.258 | | | $ | 0.770 | | | $ | 1.751 | | | $ | (2.147 | ) |
| | | | | |
| Less Distributions | | | | | | | | | | | | | | | | | | | | |
From net investment income | | $ | (0.313 | ) | | $ | (0.277 | ) | | $ | (0.341 | ) | | $ | (0.303 | ) | | $ | (0.382 | ) |
Tax return of capital | | | — | | | | (0.011 | ) | | | — | | | | — | | | | (0.072 | ) |
| | | | | |
Total distributions | | $ | (0.313 | ) | | $ | (0.288 | ) | | $ | (0.341 | ) | | $ | (0.303 | ) | | $ | (0.454 | ) |
| | | | | |
Redemption fees(1) | | $ | — | | | $ | 0.000 | (2) | | $ | 0.001 | | | $ | 0.002 | | | $ | 0.001 | |
| | | | | |
Net asset value — End of year | | $ | 9.080 | | | $ | 8.840 | | | $ | 8.870 | | | $ | 8.440 | | | $ | 6.990 | |
| | | | | |
Total Return(3) | | | 6.36 | % | | | 2.92 | % | | | 9.29 | % | | | 25.96 | % | | | (23.22 | )% |
| | | | | |
| Ratios/Supplemental Data | | | | | | | | | | | | | | | | | | | | |
Net assets, end of year (000’s omitted) | | $ | 789,512 | | | $ | 782,241 | | | $ | 733,767 | | | $ | 618,351 | | | $ | 512,400 | |
Ratios (as a percentage of average daily net assets): | | | | | | | | | | | | | | | | | | | | |
Expenses(4)(5) | | | 1.77 | % | | | 1.76 | % | | | 1.80 | % | | | 1.87 | % | | | 1.94 | % |
Net investment income | | | 3.51 | % | | | 3.08 | % | | | 3.21 | % | | | 4.22 | % | | | 5.31 | % |
Portfolio Turnover of the Portfolio | | | 42 | % | | | 56 | % | | | 39 | % | | | 35 | % | | | 7 | % |
| (1) | Computed using average shares outstanding. |
| (2) | Amount is less than $0.0005. |
| (3) | Returns are historical and are calculated by determining the percentage change in net asset value with all distributions reinvested and do not reflect the effect of sales charges. |
| (4) | Includes the Fund’s share of the Portfolio’s allocated expenses. |
| (5) | Excludes the effect of custody fee credits, if any, of less than 0.005%. |
| | | | |
| | 13 | | See Notes to Financial Statements. |
Eaton Vance
Floating-Rate Fund
October 31, 2012
Financial Highlights — continued
| | | | | | | | | | | | | | | | | | | | |
| | | Class I | |
| | | Year Ended October 31, | |
| | | 2012 | | | 2011 | | | 2010 | | | 2009 | | | 2008 | |
Net asset value — Beginning of year | | $ | 8.860 | | | $ | 8.880 | | | $ | 8.450 | | | $ | 7.000 | | | $ | 9.590 | |
| | | | | |
| Income (Loss) From Operations | | | | | | | | | | | | | | | | | | | | |
Net investment income(1) | | $ | 0.403 | | | $ | 0.366 | | | $ | 0.363 | | | $ | 0.372 | | | $ | 0.550 | |
Net realized and unrealized gain (loss) | | | 0.240 | | | | (0.011 | ) | | | 0.491 | | | | 1.450 | | | | (2.601 | ) |
| | | | | |
Total income (loss) from operations | | $ | 0.643 | | | $ | 0.355 | | | $ | 0.854 | | | $ | 1.822 | | | $ | (2.051 | ) |
| | | | | |
| Less Distributions | | | | | | | | | | | | | | | | | | | | |
From net investment income | | $ | (0.403 | ) | | $ | (0.361 | ) | | $ | (0.425 | ) | | $ | (0.374 | ) | | $ | (0.456 | ) |
Tax return of capital | | | — | | | | (0.014 | ) | | | — | | | | — | | | | (0.084 | ) |
| | | | | |
Total distributions | | $ | (0.403 | ) | | $ | (0.375 | ) | | $ | (0.425 | ) | | $ | (0.374 | ) | | $ | (0.540 | ) |
| | | | | |
Redemption fees(1) | | $ | — | | | $ | 0.000 | (2) | | $ | 0.001 | | | $ | 0.002 | | | $ | 0.001 | |
| | | | | |
Net asset value — End of year | | $ | 9.100 | | | $ | 8.860 | | | $ | 8.880 | | | $ | 8.450 | | | $ | 7.000 | |
| | | | | |
Total Return(3) | | | 7.41 | % | | | 4.04 | % | | | 10.34 | % | | | 27.14 | % | | | (22.36 | )% |
| | | | | |
| Ratios/Supplemental Data | | | | | | | | | | | | | | | | | | | | |
Net assets, end of year (000’s omitted) | | $ | 4,876,648 | | | $ | 5,108,712 | | | $ | 2,794,104 | | | $ | 879,161 | | | $ | 353,249 | |
Ratios (as a percentage of average daily net assets): | | | | | | | | | | | | | | | | | | | | |
Expenses(4)(5) | | | 0.77 | % | | | 0.76 | % | | | 0.79 | % | | | 0.87 | % | | | 0.92 | % |
Net investment income | | | 4.50 | % | | | 4.09 | % | | | 4.16 | % | | | 4.99 | % | | | 6.22 | % |
Portfolio Turnover of the Portfolio | | | 42 | % | | | 56 | % | | | 39 | % | | | 35 | % | | | 7 | % |
| (1) | Computed using average shares outstanding. |
| (2) | Amount is less than $0.0005. |
| (3) | Returns are historical and are calculated by determining the percentage change in net asset value with all distributions reinvested. |
| (4) | Includes the Fund’s share of the Portfolio’s allocated expenses. |
| (5) | Excludes the effect of custody fee credits, if any, of less than 0.005%. |
| | | | |
| | 14 | | See Notes to Financial Statements. |
Eaton Vance
Floating-Rate Fund
October 31, 2012
Notes to Financial Statements
1 Significant Accounting Policies
Eaton Vance Floating-Rate Fund (the Fund) is a diversified series of Eaton Vance Mutual Funds Trust (the Trust). The Trust is a Massachusetts business trust registered under the Investment Company Act of 1940, as amended (the 1940 Act), as an open-end management investment company. The Fund offers five classes of shares. Class A shares are generally sold subject to a sales charge imposed at time of purchase. Class B and Class C shares are sold at net asset value and are generally subject to a contingent deferred sales charge (see Note 5). The Advisers Class and Class I shares are sold at net asset value and are not subject to a sales charge. Class B shares automatically convert to Class A shares eight years after their purchase as described in the Fund’s prospectus. Beginning January 1, 2012, Class B shares are only available for purchase upon exchange from another Eaton Vance fund or through reinvestment of distributions. Each class represents a pro-rata interest in the Fund, but votes separately on class-specific matters and (as noted below) is subject to different expenses. Realized and unrealized gains and losses are allocated daily to each class of shares based on the relative net assets of each class to the total net assets of the Fund. Net investment income, other than class-specific expenses, is allocated daily to each class of shares based upon the ratio of the value of each class’s paid shares to the total value of all paid shares. Each class of shares differs in its distribution plan and certain other class-specific expenses. The Fund invests all of its investable assets in interests in Floating Rate Portfolio (the Portfolio), a Massachusetts business trust, having the same investment objective and policies as the Fund. The value of the Fund’s investment in the Portfolio reflects the Fund’s proportionate interest in the net assets of the Portfolio (83.0% at October 31, 2012). The performance of the Fund is directly affected by the performance of the Portfolio. The financial statements of the Portfolio, including the portfolio of investments, are included elsewhere in this report and should be read in conjunction with the Fund’s financial statements.
The following is a summary of significant accounting policies of the Fund. The policies are in conformity with accounting principles generally accepted in the United States of America.
A Investment Valuation — Valuation of securities by the Portfolio is discussed in Note 1A of the Portfolio’s Notes to Financial Statements, which are included elsewhere in this report.
B Income — The Fund’s net investment income or loss consists of the Fund’s pro-rata share of the net investment income or loss of the Portfolio, less all actual and accrued expenses of the Fund.
C Federal Taxes — The Fund’s policy is to comply with the provisions of the Internal Revenue Code applicable to regulated investment companies and to distribute to shareholders each year substantially all of its net investment income, and all or substantially all of its net realized capital gains. Accordingly, no provision for federal income or excise tax is necessary. At October 31, 2012, the Fund, for federal income tax purposes, had a capital loss carryforward of $252,389,796 which will reduce its taxable income arising from future net realized gains on investment transactions, if any, to the extent permitted by the Internal Revenue Code, and thus will reduce the amount of distributions to shareholders, which would otherwise be necessary to relieve the Fund of any liability for federal income or excise tax. Such capital loss carryforward will expire on October 31, 2016 ($190,856,000), October 31, 2017 ($32,557,773) and October 31, 2018 ($28,976,023). In addition, such capital loss carryforward cannot be utilized prior to the utilization of new capital losses, if any, created after October 31, 2012.
During the year ended October 31, 2012, a capital loss carryforward of $52,143,879 was utilized to offset net realized gains by the Fund.
As of October 31, 2012, the Fund had no uncertain tax positions that would require financial statement recognition, de-recognition, or disclosure. The Fund files a U.S. federal income tax return annually after its fiscal year-end, which is subject to examination by the Internal Revenue Service for a period of three years from the date of filing.
D Expenses — The majority of expenses of the Trust are directly identifiable to an individual fund. Expenses which are not readily identifiable to a specific fund are allocated taking into consideration, among other things, the nature and type of expense and the relative size of the funds.
E Expense Reduction — State Street Bank and Trust Company (SSBT) serves as custodian of the Fund. Pursuant to the custodian agreement, SSBT receives a fee reduced by credits, which are determined based on the average daily cash balance the Fund maintains with SSBT. All credit balances, if any, used to reduce the Fund’s custodian fees are reported as a reduction of expenses in the Statement of Operations.
F Use of Estimates — The preparation of the financial statements in conformity with accounting principles generally accepted in the United States of America requires management to make estimates and assumptions that affect the reported amounts of assets and liabilities at the date of the financial statements and the reported amounts of income and expense during the reporting period. Actual results could differ from those estimates.
G Indemnifications — Under the Trust’s organizational documents, its officers and Trustees may be indemnified against certain liabilities and expenses arising out of the performance of their duties to the Fund. Under Massachusetts law, if certain conditions prevail, shareholders of a Massachusetts business trust (such as the Trust) could be deemed to have personal liability for the obligations of the Trust. However, the Trust’s Declaration of Trust contains an express disclaimer of liability on the part of Fund shareholders and the By-laws provide that the Trust shall assume the defense on behalf of any Fund shareholders. Moreover, the By-laws also provide for indemnification out of Fund property of any shareholder held personally liable solely by reason of being or having been a shareholder for all loss or expense arising from such liability. Additionally, in the normal course of business, the Fund enters into agreements with service providers that may contain indemnification clauses. The Fund’s maximum exposure under these arrangements is unknown as this would involve future claims that may be made against the Fund that have not yet occurred.
Eaton Vance
Floating-Rate Fund
October 31, 2012
Notes to Financial Statements — continued
H Redemption Fees — Prior to January 1, 2011 and upon the redemption or exchange of shares by Advisers Class, Class A and Class I shareholders within 90 days of the settlement of purchase, a fee of 1% of the current net asset value of these shares was assessed and retained by the Fund for the benefit of the remaining shareholders. The redemption fee was accounted for as an addition to paid-in capital. Effective January 1, 2011, Advisers Class, Class A and Class I shares are no longer subject to a redemption fee.
I Other — Investment transactions are accounted for on a trade date basis. Dividends to shareholders are recorded on the ex-dividend date.
2 Distributions to Shareholders
The Fund declares dividends daily to shareholders of record at the time of declaration. Distributions are generally paid monthly. Distributions of realized capital gains (reduced by available capital loss carryforwards from prior years, if any) are made at least annually. Distributions are declared separately for each class of shares. Shareholders may reinvest income and capital gain distributions in additional shares of the same class of the Fund at the net asset value as of the reinvestment date or, at the election of the shareholder, receive distributions in cash. The Fund distinguishes between distributions on a tax basis and a financial reporting basis. Accounting principles generally accepted in the United States of America require that only distributions in excess of tax basis earnings and profits be reported in the financial statements as a return of capital. Permanent differences between book and tax accounting relating to distributions are reclassified to paid-in capital. For tax purposes, distributions from short-term capital gains are considered to be from ordinary income.
The tax character of distributions declared for the years ended October 31, 2012 and October 31, 2011 was as follows:
| | | | | | | | |
| | | Year Ended October 31, | |
| | | 2012 | | | 2011 | |
| | |
Distributions declared from: | | | | | | | | |
Ordinary income | | $ | 332,891,615 | | | $ | 284,990,907 | |
Tax return of capital | | $ | — | | | $ | 10,843,575 | |
During the year ended October 31, 2012, accumulated net realized loss was decreased by $1,227,911, accumulated distributions in excess of net investment income was decreased by $6,058,913 and paid-in capital was decreased by $7,286,824 due to differences between book and tax accounting, primarily for swap contracts, mixed straddles and foreign currency gain (loss). These reclassifications had no effect on the net assets or net asset value per share of the Fund.
As of October 31, 2012, the components of distributable earnings (accumulated losses) and unrealized appreciation (depreciation) on a tax basis were as follows:
| | | | |
Undistributed ordinary income | | $ | 3,578,273 | |
Capital loss carryforward | | $ | (252,389,796 | ) |
Net unrealized appreciation | | $ | 28,179,855 | |
Other temporary differences | | $ | (11,342,298 | ) |
The differences between components of distributable earnings (accumulated losses) on a tax basis and the amounts reflected in the Statement of Assets and Liabilities are primarily due to wash sales, partnership allocations, defaulted bond interest and the timing of recognizing distributions to shareholders.
3 Transactions with Affiliates
The administration fee is earned by Eaton Vance Management (EVM) as compensation for administrative services rendered to the Fund. The fee is computed at an annual rate of 0.15% of the Fund’s average daily net assets. For the year ended October 31, 2012, the administration fee amounted to $11,549,087. The Portfolio has engaged Boston Management and Research (BMR), a subsidiary of EVM, to render investment advisory services. See Note 2 of the Portfolio’s Notes to Financial Statements which are included elsewhere in this report.
EVM serves as the sub-transfer agent of the Fund and receives from the transfer agent an aggregate fee based upon the actual expenses incurred by EVM in the performance of these services. For the year ended October 31, 2012, EVM earned $306,425 in sub-transfer agent fees. The Fund was informed that Eaton Vance Distributors, Inc. (EVD), an affiliate of EVM and the Fund’s principal underwriter, received $76,228 as its portion of the sales charge on sales of Class A shares for the year ended October 31, 2012. EVD also received distribution and service fees from Advisers Class, Class A, Class B and Class C shares (see Note 4) and contingent deferred sales charges (see Note 5).
Trustees and officers of the Fund who are members of EVM’s or BMR’s organizations receive remuneration for their services to the Fund out of the investment adviser fee. Certain officers and Trustees of the Fund and the Portfolio are officers of the above organizations.
Eaton Vance
Floating-Rate Fund
October 31, 2012
Notes to Financial Statements — continued
4 Distribution Plans
The Fund has in effect distribution plans for the Advisers Class shares and Class A shares (Advisers/Class A Plan) pursuant to Rule 12b-1 under the 1940 Act. Pursuant to the Advisers/Class A Plan, the Fund pays EVD a distribution and service fee of 0.25% per annum of its average daily net assets attributable to Advisers Class and Class A shares for distribution services and facilities provided to the Fund by EVD, as well as for personal services and/or the maintenance of shareholder accounts. Distribution and service fees paid or accrued to EVD for the year ended October 31, 2012 amounted to $1,212,113 for Advisers Class shares and $3,670,269 for Class A shares. The Fund also has in effect distribution plans for Class B shares (Class B Plan) and Class C shares (Class C Plan) pursuant to Rule 12b-1 under the 1940 Act. Pursuant to the Class B and Class C Plans, the Fund pays EVD amounts equal to 0.75% per annum of its average daily net assets attributable to Class B and Class C shares for providing ongoing distribution services and facilities to the Fund. The Fund will automatically discontinue payments to EVD during any period in which there are no outstanding Uncovered Distribution Charges, which are equivalent to the sum of (i) 6.25% of the aggregate amount received by the Fund for Class B and Class C shares sold, plus (ii) interest calculated by applying the rate of 1% over the prevailing prime rate to the outstanding balance of Uncovered Distribution Charges of EVD of each respective class, reduced by the aggregate amount of contingent deferred sales charges (see Note 5) and amounts theretofore paid or payable to EVD by each respective class. For the year ended October 31, 2012, the Fund paid or accrued to EVD $244,317 and $5,768,928 for Class B and Class C shares, respectively, representing 0.75% of the average daily net assets of Class B and Class C shares. At October 31, 2012, the amounts of Uncovered Distribution Charges of EVD calculated under the Class B and Class C Plans were approximately $11,257,000 and $208,726,000, respectively.
Pursuant to the Class B and Class C Plans, the Fund also makes payments of service fees to EVD, financial intermediaries and other persons in amounts equal to 0.25% per annum of its average daily net assets attributable to that class. Service fees paid or accrued are for personal services and/or the maintenance of shareholder accounts. They are separate and distinct from the sales commissions and distribution fees payable to EVD and, as such, are not subject to automatic discontinuance when there are no outstanding Uncovered Distribution Charges of EVD. Service fees paid or accrued for the year ended October 31, 2012 amounted to $81,439 and $1,922,976 for Class B and Class C shares, respectively.
5 Contingent Deferred Sales Charges
A contingent deferred sales charge (CDSC) generally is imposed on redemptions of Class B shares made within six years of purchase and on redemptions of Class C shares made within one year of purchase. Class A shares may be subject to a 1% CDSC if redeemed within 18 months of purchase (depending on the circumstances of purchase). Generally, the CDSC is based upon the lower of the net asset value at date of redemption or date of purchase. No charge is levied on shares acquired by reinvestment of dividends or capital gain distributions. The CDSC for Class B shares is imposed at declining rates that begin at 5% in the case of redemptions in the first and second year after purchase, declining one percentage point each subsequent year. Class C shares are subject to a 1% CDSC if redeemed within one year of purchase. No CDSC is levied on shares which have been sold to EVM or its affiliates or to their respective employees or clients and may be waived under certain other limited conditions. CDSCs received on Class B and Class C redemptions are paid to EVD to reduce the amount of Uncovered Distribution Charges calculated under the Fund’s Class B and Class C Plans. CDSCs received on Class B and Class C redemptions when no Uncovered Distribution Charges exist are credited to the Fund. For the year ended October 31, 2012, the Fund was informed that EVD received approximately $56,000, $42,000 and $107,000 of CDSCs paid by Class A, Class B and Class C shareholders, respectively.
6 Investment Transactions
For the year ended October 31, 2012, increases and decreases in the Fund’s investment in the Portfolio aggregated $890,639,363 and $1,511,414,595, respectively.
7 Shares of Beneficial Interest
The Fund’s Declaration of Trust permits the Trustees to issue an unlimited number of full and fractional shares of beneficial interest (without par value). Such shares may be issued in a number of different series (such as the Fund) and classes. Transactions in Fund shares were as follows:
| | | | | | | | |
| | | Year Ended October 31, | |
| Advisers Class | | 2012 | | | 2011 | |
| | |
Sales | | | 17,543,503 | | | | 44,296,719 | |
Issued to shareholders electing to receive payments of distributions in Fund shares | | | 2,190,892 | | | | 2,300,548 | |
Redemptions | | | (18,198,506 | ) | | | (39,683,951 | ) |
| | |
Net increase | | | 1,535,889 | | | | 6,913,316 | |
Eaton Vance
Floating-Rate Fund
October 31, 2012
Notes to Financial Statements — continued
| | | | | | | | |
| | | Year Ended October 31, | |
| Class A | | 2012 | | | 2011 | |
| | |
Sales | | | 56,750,130 | | | | 106,871,954 | |
Issued to shareholders electing to receive payments of distributions in Fund shares | | | 6,040,041 | | | | 5,268,471 | |
Redemptions | | | (50,194,747 | ) | | | (81,529,341 | ) |
Exchange from Class B shares | | | 1,302,567 | | | | 1,447,361 | |
| | |
Net increase | | | 13,897,991 | | | | 32,058,445 | |
| | |
| | | | | | | | |
| | | Year Ended October 31, | |
| Class B | | 2012 | | | 2011 | |
| | |
Sales | | | 185,443 | | | | 1,326,831 | |
Issued to shareholders electing to receive payments of distributions in Fund shares | | | 105,264 | | | | 124,665 | |
Redemptions | | | (800,251 | ) | | | (1,517,214 | ) |
Exchange to Class A shares | | | (1,349,188 | ) | | | (1,498,631 | ) |
| | |
Net decrease | | | (1,858,732 | ) | | | (1,564,349 | ) |
| | |
| | | | | | | | |
| | | Year Ended October 31, | |
| Class C | | 2012 | | | 2011 | |
| | |
Sales | | | 14,838,143 | | | | 30,556,428 | |
Issued to shareholders electing to receive payments of distributions in Fund shares | | | 2,264,371 | | | | 2,031,564 | |
Redemptions | | | (18,642,279 | ) | | | (26,870,189 | ) |
| | |
Net increase (decrease) | | | (1,539,765 | ) | | | 5,717,803 | |
| | |
| | | | | | | | |
| | | Year Ended October 31, | |
| Class I | | 2012 | | | 2011 | |
| | |
Sales | | | 238,765,116 | | | | 434,691,707 | |
Issued to shareholders electing to receive payments of distributions in Fund shares | | | 8,691,160 | | | | 6,538,780 | |
Redemptions | | | (288,207,256 | ) | | | (179,130,199 | ) |
| | |
Net increase (decrease) | | | (40,750,980 | ) | | | 262,100,288 | |
For the year ended October 31, 2011, the Fund received $96,079 in redemption fees.
Eaton Vance
Floating-Rate Fund
October 31, 2012
Report of Independent Registered Public Accounting Firm
To the Trustees of Eaton Vance Mutual Funds Trust and Shareholders of Eaton Vance Floating-Rate Fund:
We have audited the accompanying statement of assets and liabilities of Eaton Vance Floating-Rate Fund (the “Fund”) (one of the funds constituting Eaton Vance Mutual Funds Trust) as of October 31, 2012, and the related statement of operations for the year then ended, the statements of changes in net assets for each of the two years in the period then ended, and the financial highlights for each of the five years in the period then ended. These financial statements and financial highlights are the responsibility of the Fund’s management. Our responsibility is to express an opinion on these financial statements and financial highlights based on our audits.
We conducted our audits in accordance with the standards of the Public Company Accounting Oversight Board (United States). Those standards require that we plan and perform the audit to obtain reasonable assurance about whether the financial statements and financial highlights are free of material misstatement. The Fund is not required to have, nor were we engaged to perform, an audit of its internal control over financial reporting. Our audits included consideration of internal control over financial reporting as a basis for designing audit procedures that are appropriate in the circumstances, but not for the purpose of expressing an opinion on the effectiveness of the Fund’s internal control over financial reporting. Accordingly, we express no such opinion. An audit also includes examining, on a test basis, evidence supporting the amounts and disclosures in the financial statements, assessing the accounting principles used and significant estimates made by management, as well as evaluating the overall financial statement presentation. We believe that our audits provide a reasonable basis for our opinion.
In our opinion, such financial statements and financial highlights referred to above present fairly, in all material respects, the financial position of Eaton Vance Floating-Rate Fund as of October 31, 2012, the results of its operations for the year then ended, the changes in its net assets for each of the two years in the period then ended, and the financial highlights for each of the five years in the period then ended, in conformity with accounting principles generally accepted in the United States of America.
DELOITTE & TOUCHE LLP
Boston, Massachusetts
December 17, 2012
Eaton Vance
Floating-Rate Fund
October 31, 2012
Federal Tax Information (Unaudited)
The Form 1099-DIV you receive in January 2013 will show the tax status of all distributions paid to your account in calendar year 2012. Shareholders are advised to consult their own tax adviser with respect to the tax consequences of their investment in the Fund. As required by the Internal Revenue Code and/or regulations, shareholders must be notified regarding the status of qualified dividend income for individuals and the dividends received deduction for corporations.
Qualified Dividend Income. The Fund designates approximately $4,918,213, or up to the maximum amount of such dividends allowable pursuant to the Internal Revenue Code, as qualified dividend income eligible for the reduced tax rate of 15%.
Dividends Received Deduction. Corporate shareholders are generally entitled to take the dividends received deduction on the portion of the Fund’s dividend distribution that qualifies under tax law. For the Fund’s fiscal 2012 ordinary income dividends, 1.45% qualifies for the corporate dividends received deduction.
Floating Rate Portfolio
October 31, 2012
Portfolio of Investments
| | | | | | | | | | |
| Senior Floating-Rate Interests — 92.1%(1) | |
| | | |
| | | | | | | | | | |
| Borrower/Tranche Description | | | | Principal
Amount*
(000’s omitted) | | | Value | |
| | | | | | | | | | |
|
Aerospace and Defense — 1.6% | |
Booz Allen Hamilton Inc. | | | | | | | | | | |
Term Loan, 4.50%, Maturing July 31, 2019 | | | | | 8,900 | | | $ | 8,965,824 | |
DAE Aviation Holdings, Inc. | | | | | | | | | | |
Revolving Loan, 3.53%, Maturing July 31, 2013(2) | | | | | 20,000 | | | | 18,650,000 | |
Term Loan, 7.25%, Maturing July 31, 2014 | | | | | 17,676 | | | | 17,675,616 | |
Term Loan, 7.25%, Maturing July 31, 2014 | | | | | 17,963 | | | | 17,963,473 | |
Ducommun Incorporated | | | | | | | | | | |
Term Loan, 5.50%, Maturing June 28, 2017 | | | | | 6,638 | | | | 6,737,129 | |
IAP Worldwide Services, Inc. | | | | | | | | | | |
Term Loan, 9.25%, Maturing December 28, 2012 | | | | | 30,143 | | | | 24,491,339 | |
Sequa Corporation | | | | | | | | | | |
Term Loan, 3.62%, Maturing December 3, 2014 | | | | | 8,989 | | | | 8,984,762 | |
Term Loan, 6.25%, Maturing December 3, 2014 | | | | | 3,002 | | | | 3,009,818 | |
TASC, Inc. | | | | | | | | | | |
Term Loan, 4.50%, Maturing December 18, 2015 | | | | | 11,461 | | | | 11,482,728 | |
Transdigm, Inc. | | | | | | | | | | |
Term Loan, 4.00%, Maturing February 14, 2017 | | | | | 11,227 | | | | 11,277,626 | |
Term Loan, 4.00%, Maturing February 14, 2017 | | | | | 12,857 | | | | 12,909,289 | |
Wesco Aircraft Hardware Corp. | | | | | | | | | | |
Term Loan, 4.25%, Maturing April 7, 2017 | | | | | 1,989 | | | | 1,998,133 | |
Wyle Services Corporation | | | | | | | | | | |
Term Loan, 5.00%, Maturing March 27, 2017 | | | | | 11,189 | | | | 11,259,258 | |
| | | | | | | | | | | |
| | | | | | | | $ | 155,404,995 | |
| | | | | | | | | | | |
|
Air Transport — 0.3% | |
Evergreen International Aviation, Inc. | | | | | | | | | | |
Term Loan, 11.50%, Maturing June 30, 2015 | | | | | 11,051 | | | $ | 10,774,919 | |
Orbitz Worldwide Inc. | | | | | | | | | | |
Term Loan, 3.21%, Maturing July 25, 2014 | | | | | 18,599 | | | | 18,189,469 | |
| | | | | | | | | | | |
| | | | | | | | $ | 28,964,388 | |
| | | | | | | | | | | |
|
Automotive — 4.5% | |
Allison Transmission, Inc. | | | | | | | | | | |
Term Loan, 2.72%, Maturing August 7, 2014 | | | | | 16,237 | | | $ | 16,280,159 | |
Term Loan, 4.25%, Maturing August 23, 2019 | | | | | 43,299 | | | | 43,555,555 | |
Autoparts Holdings Limited | | | | | | | | | | |
Term Loan, 6.50%, Maturing July 28, 2017 | | | | | 8,025 | | | | 7,995,109 | |
Chrysler Group LLC | | | | | | | | | | |
Term Loan, 6.00%, Maturing May 24, 2017 | | | | | 70,187 | | | | 71,902,705 | |
Federal-Mogul Corporation | | | | | | | | | | |
Term Loan, 2.15%, Maturing December 29, 2014 | | | | | 38,295 | | | | 36,104,877 | |
Term Loan, 2.15%, Maturing December 28, 2015 | | | | | 21,990 | | | | 20,732,517 | |
| | | | | | | | | | |
| Borrower/Tranche Description | | | | Principal
Amount*
(000’s omitted) | | | Value | |
| | | | | | | | | | |
|
Automotive (continued) | |
Financiere Truck Investissement SAS | | | | | | | | | | |
Term Loan, 2.35%, Maturing February 15, 2013 | | EUR | | | 1,479 | | | $ | 1,826,537 | |
Ford Motor Company | | | | | | | | | | |
Revolving Loan, 0.25%, Maturing November 30, 2015(2) | | | | | 4,852 | | | | 4,615,851 | |
Goodyear Tire & Rubber Company (The) | | | | | | | | | | |
Term Loan - Second Lien, 4.75%, Maturing April 30, 2019 | | | | | 64,325 | | | | 65,048,656 | |
HHI Holdings LLC | |
Term Loan, 6.00%, Maturing October 3, 2018 | | | | | 23,250 | | | | 23,250,000 | |
Metaldyne Company LLC | | | | | | | | | | |
Term Loan, 5.25%, Maturing May 18, 2017 | | | | | 23,428 | | | | 23,545,410 | |
Remy International, Inc. | | | | | | | | | | |
Term Loan, 6.25%, Maturing December 16, 2016 | | | | | 5,275 | | | | 5,314,584 | |
SRAM, LLC | | | | | | | | | | |
Term Loan, 4.78%, Maturing June 7, 2018 | | | | | 22,516 | | | | 22,741,391 | |
Term Loan - Second Lien, 8.50%, Maturing December 7, 2018 | | | | | 3,000 | | | | 3,060,000 | |
Tomkins LLC | | | | | | | | | | |
Term Loan, 4.25%, Maturing September 29, 2016 | | | | | 31,011 | | | | 31,220,296 | |
TriMas Corporation | | | | | | | | | | |
Term Loan, Maturing October 10, 2019(3) | | | | | 9,775 | | | | 9,799,437 | |
UCI International, Inc. | | | | | | | | | | |
Term Loan, 5.50%, Maturing July 26, 2017 | | | | | 3,402 | | | | 3,435,863 | |
Veyance Technologies, Inc. | | | | | | | | | | |
Term Loan, 2.47%, Maturing July 31, 2014 | | | | | 4,312 | | | | 4,280,419 | |
Term Loan, 2.47%, Maturing July 31, 2014 | | | | | 26,659 | | | | 26,465,513 | |
Term Loan, 5.50%, Maturing July 31, 2014 | | | | | 4,005 | | | | 4,019,893 | |
Term Loan - Second Lien, 5.96%, Maturing July 31, 2015 | | | | | 2,000 | | | | 1,940,000 | |
| | | | | | | | | | | |
| | | $ | 427,134,772 | |
| | | | | | | | | | | |
|
Beverage and Tobacco — 0.0%(4) | |
Maine Beverage Company | | | | | | | | | | |
Term Loan, 2.11%, Maturing March 31, 2013 | | | | | 157 | | | $ | 155,964 | |
| | | | | | | | | | | |
| | | $ | 155,964 | |
| | | | | | | | | | | |
|
Building and Development — 1.2% | |
401 North Wabash Venture LLC | | | | | | | | | | |
Term Loan, 6.75%, Maturing August 1, 2013(5) | | | | | 4,879 | | | $ | 4,882,243 | |
Armstrong World Industries, Inc. | | | | | | | | | | |
Term Loan, 4.00%, Maturing March 9, 2018 | | | | | 19,063 | | | | 19,154,725 | |
Goodman Global Inc. | | | | | | | | | | |
Term Loan, 5.75%, Maturing October 28, 2016 | | | | | 11,950 | | | | 12,001,488 | |
| | | | |
| | 21 | | See Notes to Financial Statements. |
Floating Rate Portfolio
October 31, 2012
Portfolio of Investments — continued
| | | | | | | | | | |
| Borrower/Tranche Description | | | | Principal
Amount*
(000’s omitted) | | | Value | |
| | | | | | | | | | |
|
Building and Development (continued) | |
Preferred Proppants, LLC | | | | | | | | | | |
Term Loan, 7.50%, Maturing December 15, 2016 | | | | | 8,511 | | | $ | 8,074,515 | |
RE/MAX International, Inc. | | | | | | | | | | |
Term Loan, 5.50%, Maturing April 15, 2016 | | | | | 12,230 | | | | 12,321,653 | |
Realogy Corporation | | | | | | | | | | |
Term Loan, 3.24%, Maturing October 10, 2013 | | | | | 2,700 | | | | 2,659,023 | |
Term Loan, 4.46%, Maturing October 10, 2016 | | | | | 9,207 | | | | 9,201,711 | |
Term Loan, 4.46%, Maturing October 10, 2016 | | | | | 719 | | | | 718,202 | |
Summit Materials Companies I, LLC | | | | | | | | | | |
Term Loan, 6.00%, Maturing January 30, 2019 | | | | | 6,990 | | | | 7,060,501 | |
The Woodlands Land Development Company L.P. | | | | | | | | | | |
Term Loan, 5.00%, Maturing March 7, 2014 | | | | | 19,259 | | | | 18,970,370 | |
Tishman Speyer U.S. Office, Inc. | | | | | | | | | | |
Term Loan, 5.21%, Maturing January 8, 2014 | | | | | 13,475 | | | | 13,620,530 | |
| | | | | | | | | | | |
| | | $ | 108,664,961 | |
| | | | | | | | | | | |
|
Business Equipment and Services — 8.5% | |
ACCO Brands Corporation | | | | | | | | | | |
Term Loan, 4.25%, Maturing April 30, 2019 | | | | | 4,796 | | | $ | 4,846,831 | |
Acosta, Inc. | | | | | | | | | | |
Term Loan, 5.00%, Maturing March 1, 2018 | | | | | 32,615 | | | | 32,818,945 | |
Advantage Sales & Marketing, Inc. | | | | | | | | | | |
Term Loan, 5.25%, Maturing December 18, 2017 | | | | | 35,223 | | | | 35,302,274 | |
Affinion Group, Inc. | | | | | | | | | | |
Term Loan, 5.00%, Maturing July 16, 2015 | | | | | 40,942 | | | | 38,664,304 | |
Allied Security Holdings, LLC | | | | | | | | | | |
Term Loan, 5.25%, Maturing February 3, 2017 | | | | | 13,199 | | | | 13,232,058 | |
Altegrity, Inc. | | | | | | | | | | |
Term Loan, 7.75%, Maturing February 20, 2015 | | | | | 4,678 | | | | 4,677,706 | |
Term Loan, 2.96%, Maturing February 21, 2015 | | | | | 14,944 | | | | 13,897,694 | |
BAR/BRI Review Courses, Inc. | | | | | | | | | | |
Term Loan, 6.00%, Maturing June 16, 2017 | | | | | 5,893 | | | | 5,900,246 | |
Brand Energy & Infrastructure Services, Inc. | | | | | | | | | | |
Term Loan, Maturing October 16, 2016(3) | | | | | 1,819 | | | | 1,819,355 | |
Term Loan, Maturing October 16, 2018(3) | | | | | 7,581 | | | | 7,555,379 | |
Brickman Group Holdings Inc. | | | | | | | | | | |
Term Loan, 5.50%, Maturing October 14, 2016 | | | | | 11,499 | | | | 11,671,337 | |
Brock Holdings III, Inc. | | | | | | | | | | |
Term Loan, 6.01%, Maturing March 16, 2017 | | | | | 16,348 | | | | 16,511,221 | |
Catalina Marketing Corporation | | | | | | | | | | |
Term Loan, 2.96%, Maturing October 1, 2014 | | | | | 5,842 | | | | 5,827,299 | |
ClientLogic Corporation | | | | | | | | | | |
Term Loan, 6.86%, Maturing January 30, 2017 | | EUR | | | 569 | | | | 671,651 | |
Term Loan, 7.10%, Maturing January 30, 2017 | | | | | 9,682 | | | | 9,464,497 | |
| | | | | | | | | | |
| Borrower/Tranche Description | | | | Principal
Amount*
(000’s omitted) | | | Value | |
| | | | | | | | | | |
|
Business Equipment and Services (continued) | |
Corporate Executive Board Company, The | | | | | | | | | | |
Term Loan, 5.00%, Maturing July 2, 2019 | | | | | 5,650 | | | $ | 5,692,375 | |
CPM Acquisition Corp. | | | | | | | | | | |
Term Loan, 6.25%, Maturing August 29, 2017 | | | | | 5,375 | | | | 5,418,672 | |
DynCorp International LLC | | | | | | | | | | |
Term Loan, 6.25%, Maturing July 7, 2016 | | | | | 10,003 | | | | 10,061,194 | |
Education Management LLC | | | | | | | | | | |
Term Loan, 4.38%, Maturing June 1, 2016 | | | | | 1,159 | | | | 976,821 | |
Term Loan, 8.25%, Maturing March 29, 2018 | | | | | 24,467 | | | | 21,705,549 | |
EIG Investors Corp. | | | | | | | | | | |
Term Loan, 7.75%, Maturing April 20, 2018 | | | | | 16,209 | | | | 16,300,553 | |
Term Loan - Second Lien, 11.00%, Maturing October 22, 2018 | | | | | 3,125 | | | | 3,156,250 | |
Expert Global Solutions, Inc. | | | | | | | | | | |
Term Loan, 8.00%, Maturing April 3, 2018 | | | | | 24,079 | | | | 24,319,790 | |
Garda World Security Corp. | | | | | | | | | | |
Term Loan, Maturing October 24, 2019(3) | | | | | 4,225 | | | | 4,261,969 | |
Genesys Telecom Holdings, U.S., Inc. | | | | | | | | | | |
Term Loan, 6.75%, Maturing January 31, 2019 | | | | | 7,363 | | | | 7,478,047 | |
Genpact International, Inc. | | | | | | | | | | |
Term Loan, 4.25%, Maturing August 30, 2019 | | | | | 17,350 | | | | 17,415,062 | |
Go Daddy Operating Company, LLC | | | | | | | | | | |
Term Loan, 5.50%, Maturing December 17, 2018 | | | | | 20,497 | | | | 20,443,891 | |
IG Investment Holdings, LLC | | | | | | | | | | |
Term Loan, Maturing October 26, 2019(3) | | | | | 8,850 | | | | 8,838,937 | |
IMS Health Incorporated | | | | | | | | | | |
Term Loan, 4.50%, Maturing August 25, 2017 | | | | | 23,062 | | | | 23,230,429 | |
Infor (US), Inc. | | | | | | | | | | |
Term Loan, 5.25%, Maturing April 5, 2018 | | | | | 72,025 | | | | 72,891,090 | |
KAR Auction Services, Inc. | | | | | | | | | | |
Term Loan, 5.00%, Maturing May 19, 2017 | | | | | 22,985 | | | | 23,147,889 | |
Kronos Incorporated | | | | | | | | | | |
Term Loan, Maturing October 25, 2019(3) | | | | | 17,850 | | | | 17,894,625 | |
Term Loan - Second Lien, Maturing April 24, 2020(3) | | | | | 10,275 | | | | 10,300,687 | |
Language Line, LLC | |
Term Loan, 6.25%, Maturing June 20, 2016 | | | | | 20,081 | | | | 19,967,861 | |
Meritas LLC | | | | | | | | | | |
Term Loan, 7.50%, Maturing July 28, 2017 | | | | | 11,915 | | | | 11,915,413 | |
Mitchell International, Inc. | | | | | | | | | | |
Term Loan, 2.50%, Maturing March 28, 2014 | | | | | 1,856 | | | | 1,850,310 | |
Term Loan - Second Lien, 5.63%, Maturing March 30, 2015 | | | | | 1,500 | | | | 1,481,250 | |
Monitronics International Inc. | | | | | | | | | | |
Term Loan, 5.50%, Maturing March 16, 2018 | | | | | 9,925 | | | | 10,020,237 | |
| | | | |
| | 22 | | See Notes to Financial Statements. |
Floating Rate Portfolio
October 31, 2012
Portfolio of Investments — continued
| | | | | | | | | | |
| Borrower/Tranche Description | | | | Principal
Amount*
(000’s omitted) | | | Value | |
| | | | | | | | | | |
|
Business Equipment and Services (continued) | |
Quintiles Transnational Corp. | | | | | | | | | | |
Term Loan, 4.50%, Maturing June 8, 2018 | | | | | 3,950 | | | $ | 3,964,812 | |
Term Loan, 5.00%, Maturing June 8, 2018 | | | | | 45,017 | | | | 45,388,520 | |
Sabre, Inc. | | | | | | | | | | |
Term Loan, 2.21%, Maturing September 30, 2014 | | | | | 9,730 | | | | 9,714,629 | |
Sensus USA Inc. | | | | | | | | | | |
Term Loan, 4.75%, Maturing May 9, 2017 | | | | | 1,959 | | | | 1,966,402 | |
Softlayer Technologies, Inc. | | | | | | | | | | |
Term Loan, 7.25%, Maturing November 5, 2016 | | | | | 9,162 | | | | 9,219,074 | |
SunGard Data Systems, Inc. | | | | | | | | | | |
Term Loan, 3.90%, Maturing February 26, 2016 | | | | | 35,647 | | | | 35,792,109 | |
Term Loan, 3.97%, Maturing February 28, 2017 | | | | | 24,027 | | | | 24,147,016 | |
SymphonyIRI Group, Inc. | | | | | | | | | | |
Term Loan, 5.00%, Maturing December 1, 2017 | | | | | 5,900 | | | | 5,911,376 | |
Trans Union, LLC | | | | | | | | | | |
Term Loan, 5.50%, Maturing February 12, 2018 | | | | | 30,289 | | | | 30,614,354 | |
Travelport LLC | | | | | | | | | | |
Term Loan, 2.86%, Maturing August 23, 2013 | | | | | 154 | | | | 147,530 | |
Term Loan, 4.65%, Maturing August 21, 2015 | | EUR | | | 1,481 | | | | 1,827,847 | |
Term Loan, 4.86%, Maturing August 21, 2015 | | | | | 13,518 | | | | 12,946,178 | |
Term Loan, 4.86%, Maturing August 21, 2015 | | | | | 20,702 | | | | 19,826,110 | |
Term Loan, 4.86%, Maturing August 21, 2015 | | | | | 8,217 | | | | 7,869,580 | |
U.S. Security Holdings, Inc. | | | | | | | | | | |
Term Loan, 6.00%, Maturing July 28, 2017 | | | | | 1,610 | | | | 1,623,771 | |
Term Loan, 6.00%, Maturing July 28, 2017 | | | | | 8,224 | | | | 8,296,132 | |
West Corporation | | | | | | | | | | |
Term Loan, 5.50%, Maturing July 15, 2016 | | | | | 6,494 | | | | 6,569,403 | |
Term Loan, 5.50%, Maturing July 15, 2016 | | | | | 18,039 | | | | 18,249,185 | |
Term Loan, 5.75%, Maturing June 29, 2018 | | | | | 12,469 | | | | 12,624,609 | |
| | | | | | | | | | | |
| | | $ | 798,328,335 | |
| | | | | | | | | | | |
|
Cable and Satellite Television — 3.4% | |
Atlantic Broadband Finance, LLC | | | | | | | | | | |
Term Loan, 5.25%, Maturing April 4, 2019 | | | | | 15,386 | | | $ | 15,485,357 | |
BBHI Acquisition LLC | | | | | | | | | | |
Term Loan, 4.50%, Maturing December 14, 2017 | | | | | 4,794 | | | | 4,818,350 | |
Bragg Communications Incorporated | | | | | | | | | | |
Term Loan, 4.00%, Maturing February 28, 2018 | | | | | 4,726 | | | | 4,749,881 | |
Cequel Communications, LLC | | | | | | | | | | |
Term Loan, 4.00%, Maturing February 14, 2019 | | | | | 51,054 | | | | 51,213,042 | |
Charter Communications Operating, LLC | | | | | | | | | | |
Term Loan, 3.47%, Maturing September 6, 2016 | | | | | 28,331 | | | | 28,477,442 | |
Term Loan, 4.00%, Maturing May 15, 2019 | | | | | 10,970 | | | | 11,056,263 | |
| | | | | | | | | | |
| Borrower/Tranche Description | | | | Principal
Amount*
(000’s omitted) | | | Value | |
| | | | | | | | | | |
|
Cable and Satellite Television (continued) | |
Crown Media Holdings, Inc. | | | | | | | | | | |
Term Loan, 5.75%, Maturing July 14, 2018 | | | | | 9,055 | | | $ | 9,100,574 | |
CSC Holdings, Inc. | | | | | | | | | | |
Term Loan, 1.96%, Maturing March 29, 2016 | | | | | 23,108 | | | | 23,117,275 | |
Kabel Deutschland GMBH | |
Term Loan, 4.25%, Maturing February 1, 2019 | | | | | 16,825 | | | | 16,889,591 | |
Lavena Holdings 4 GmbH | | | | | | | | | | |
Term Loan, 2.95%, Maturing March 6, 2015 | | EUR | | | 5,072 | | | | 6,180,838 | |
Term Loan, 3.32%, Maturing March 4, 2016 | | EUR | | | 5,072 | | | | 6,180,838 | |
MCC Iowa LLC | | | | | | | | | | |
Term Loan, 1.93%, Maturing January 30, 2015 | | | | | 7,420 | | | | 7,373,226 | |
Term Loan, 1.93%, Maturing January 30, 2015 | | | | | 7,540 | | | | 7,492,875 | |
Mediacom Broadband LLC | | | | | | | | | | |
Term Loan, 4.50%, Maturing October 23, 2017 | | | | | 10,044 | | | | 10,037,535 | |
Mediacom Illinois, LLC | | | | | | | | | | |
Term Loan, 1.68%, Maturing January 30, 2015 | | | | | 18,747 | | | | 18,430,227 | |
Term Loan, 4.50%, Maturing October 23, 2017 | | | | | 10,275 | | | | 10,239,460 | |
P7S1 Broadcasting Holding II B.V. | | | | | | | | | | |
Term Loan, 2.81%, Maturing July 1, 2016 | | EUR | | | 3,546 | | | | 4,495,529 | |
UPC Broadband Holding B.V. | | | | | | | | | | |
Term Loan, 3.87%, Maturing December 31, 2016 | | EUR | | | 37,765 | | | | 48,681,413 | |
Term Loan, 4.12%, Maturing December 29, 2017 | | EUR | | | 2,000 | | | | 2,590,043 | |
UPC Financing Partnership | | | | | | | | | | |
Term Loan, 3.71%, Maturing December 30, 2016 | | | | | 5,061 | | | | 5,040,923 | |
Term Loan, 3.71%, Maturing December 29, 2017 | | | | | 10,793 | | | | 10,776,802 | |
Term Loan, 4.75%, Maturing December 29, 2017 | | | | | 4,575 | | | | 4,609,313 | |
WaveDivision Holdings, LLC | | | | | | | | | | |
Term Loan, 5.50%, Maturing August 9, 2019 | | | | | 3,475 | | | | 3,511,880 | |
YPSO Holding SA | | | | | | | | | | |
Term Loan, 4.86%, Maturing June 6, 2016 | | EUR | | | 3,336 | | | | 4,099,975 | |
Term Loan, 4.86%, Maturing June 6, 2016 | | EUR | | | 5,763 | | | | 7,082,418 | |
| | | | | | | | | | | |
| | | $ | 321,731,070 | |
| | | | | | | | | | | |
|
Chemicals and Plastics — 3.6% | |
AZ Chem US Inc. | | | | | | | | | | |
Term Loan, 7.25%, Maturing December 22, 2017 | | | | | 12,439 | | | $ | 12,714,904 | |
Celanese U.S. Holdings LLC | | | | | | | | | | |
Term Loan, 2.87%, Maturing October 31, 2016 | | EUR | | | 667 | | | | 868,423 | |
Chemtura Corporation | | | | | | | | | | |
Term Loan, 5.50%, Maturing August 27, 2016 | | | | | 10,975 | | | | 11,125,906 | |
Emerald Performance Materials, LLC | | | | | | | | | | |
Term Loan, 6.75%, Maturing May 18, 2018 | | | | | 7,955 | | | | 8,044,557 | |
General Chemical Corporation | | | | | | | | | | |
Term Loan, 5.00%, Maturing October 6, 2015 | | | | | 4,014 | | | | 4,030,949 | |
| | | | |
| | 23 | | See Notes to Financial Statements. |
Floating Rate Portfolio
October 31, 2012
Portfolio of Investments — continued
| | | | | | | | | | |
| Borrower/Tranche Description | | | | Principal
Amount*
(000’s omitted) | | | Value | |
| | | | | | | | | | |
|
Chemicals and Plastics (continued) | |
Harko C.V. | | | | | | | | | | |
Term Loan, 5.75%, Maturing August 2, 2017 | | | | | 7,922 | | | $ | 7,979,428 | |
Term Loan, 6.25%, Maturing August 2, 2017 | | EUR | | | 465 | | | | 602,530 | |
Houghton International, Inc. | | | | | | | | | | |
Revolving Loan, 0.50%, Maturing January 30, 2016(2) | | | | | 1,280 | | | | 1,235,200 | |
Revolving Loan, 2.65%, Maturing January 30, 2016(2) | | | | | 320 | | | | 308,800 | |
Term Loan, 6.75%, Maturing January 29, 2016 | | | | | 13,317 | | | | 13,433,454 | |
Huntsman International, LLC | | | | | | | | | | |
Term Loan, 2.50%, Maturing June 30, 2016 | | | | | 2,285 | | | | 2,282,699 | |
Term Loan, 2.79%, Maturing April 19, 2017 | | | | | 12,358 | | | | 12,342,130 | |
Ineos Finance PLC | | | | | | | | | | |
Term Loan, Maturing May 4, 2018(3) | | EUR | | | 1,824 | | | | 2,378,152 | |
Ineos US Finance LLC | | | | | | | | | | |
Term Loan, 6.50%, Maturing May 4, 2018 | | | | | 48,044 | | | | 48,784,121 | |
Momentive Performance Materials GmbH | | | | | | | | | | |
Term Loan, 3.61%, Maturing May 5, 2015 | | EUR | | | 4,909 | | | | 6,314,889 | |
Momentive Performance Materials Inc. | |
Term Loan, 2.40%, Maturing December 4, 2013 | | | | | 4,750 | | | | 4,726,250 | |
Term Loan, 3.75%, Maturing May 5, 2015 | | | | | 7,662 | | | | 7,651,923 | |
Momentive Performance Materials USA Inc. | | | | | | | | | | |
Term Loan, 3.75%, Maturing May 5, 2015 | | | | | 10,275 | | | | 10,249,486 | |
Momentive Specialty Chemicals Inc. | | | | | | | | | | |
Term Loan, 2.48%, Maturing May 3, 2013 | | | | | 12,237 | | | | 12,152,408 | |
Term Loan, 3.82%, Maturing May 5, 2015 | | EUR | | | 1,071 | | | | 1,339,722 | |
Term Loan, 4.00%, Maturing May 5, 2015 | | | | | 15,947 | | | | 15,907,045 | |
Term Loan, 4.13%, Maturing May 5, 2015 | | | | | 7,023 | | | | 6,812,388 | |
Term Loan, 4.13%, Maturing May 5, 2015 | | | | | 8,060 | | | | 8,040,295 | |
Term Loan, 4.25%, Maturing May 5, 2015 | | | | | 4,061 | | | | 3,979,813 | |
OEP Pearl Dutch Acquisition B.V. | | | | | | | | | | |
Term Loan, 6.50%, Maturing March 30, 2018 | | | | | 1,164 | | | | 1,176,519 | |
Omnova Solutions Inc. | | | | | | | | | | |
Term Loan, 5.50%, Maturing May 31, 2017 | | | | | 10,012 | | | | 10,099,244 | |
PolyOne Corp. | | | | | | | | | | |
Term Loan, 5.00%, Maturing December 20, 2017 | | | | | 10,524 | | | | 10,619,612 | |
Sonneborn LLC | | | | | | | | | | |
Term Loan, 6.50%, Maturing March 30, 2018 | | | | | 6,597 | | | | 6,666,942 | |
Styron S.A.R.L., LLC | | | | | | | | | | |
Term Loan, 8.00%, Maturing August 2, 2017 | | | | | 30,462 | | | | 29,158,104 | |
Taminco Global Chemical Corporation | | | | | | | | | | |
Term Loan, 5.25%, Maturing February 15, 2019 | | | | | 4,527 | | | | 4,580,069 | |
Tronox Pigments (Netherlands) B.V. | | | | | | | | | | |
Term Loan, 4.25%, Maturing February 8, 2018 | | | | | 2,939 | | | | 2,963,992 | |
Term Loan, 4.25%, Maturing February 8, 2018 | | | | | 10,777 | | | | 10,861,234 | |
| | | | | | | | | | |
| Borrower/Tranche Description | | | | Principal
Amount*
(000’s omitted) | | | Value | |
| | | | | | | | | | |
|
Chemicals and Plastics (continued) | |
Univar Inc. | | | | | | | | | | |
Term Loan, 5.00%, Maturing June 30, 2017 | | | | | 63,153 | | | $ | 62,643,957 | |
| | | | | | | | | | | |
| | | $ | 342,075,145 | |
| | | | | | | | | | | |
| | | |
Clothing / Textiles — 0.1% | | | | | | | | | | |
Ascena Retail Group, Inc. | | | | | | | | | | |
Term Loan, 4.75%, Maturing June 14, 2018 | | | | | 1,995 | | | $ | 2,008,716 | |
Warnaco Inc. | | | | | | | | | | |
Term Loan, 3.75%, Maturing June 15, 2018 | | | | | 3,901 | | | | 3,881,122 | |
Wolverine Worldwide, Inc. | | | | | | | | | | |
Term Loan, 5.25%, Maturing July 31, 2019 | | | | | 5,775 | | | | 5,843,578 | |
| | | | | | | | | | | |
| | | $ | 11,733,416 | |
| | | | | | | | | | | |
|
Conglomerates — 1.5% | |
Jason Incorporated | | | | | | | | | | |
Term Loan, 8.25%, Maturing September 21, 2014 | | | | | 1,024 | | | $ | 1,026,733 | |
Term Loan, 7.75%, Maturing September 22, 2014 | | | | | 2,550 | | | | 2,555,918 | |
Term Loan, 8.25%, Maturing September 22, 2014 | | | | | 413 | | | | 413,591 | |
Rexnord Corporation | | | | | | | | | | |
Term Loan, 4.50%, Maturing April 2, 2018 | | | | | 33,162 | | | | 33,431,315 | |
RGIS Services, LLC | | | | | | | | | | |
Term Loan, 4.61%, Maturing October 18, 2016 | | | | | 19,617 | | | | 19,567,498 | |
Term Loan, 5.50%, Maturing October 18, 2017 | | | | | 16,221 | | | | 16,281,417 | |
Rocket Software, Inc. | | | | | | | | | | |
Term Loan, 5.75%, Maturing February 8, 2018 | | | | | 6,585 | | | | 6,630,712 | |
Term Loan, 6.75%, Maturing February 8, 2018 | | | | | 1,500 | | | | 1,500,000 | |
Term Loan - Second Lien, 10.25%, Maturing February 8, 2019 | | | | | 2,750 | | | | 2,770,625 | |
Spectrum Brands, Inc. | | | | | | | | | | |
Term Loan, 5.02%, Maturing June 17, 2016 | | | | | 19,623 | | | | 19,694,895 | |
Walter Energy, Inc. | | | | | | | | | | |
Term Loan, 4.00%, Maturing April 2, 2018 | | | | | 39,415 | | | | 38,954,972 | |
| | | | | | | | | | | |
| | | $ | 142,827,676 | |
| | | | | | | | | | | |
|
Containers and Glass Products — 1.3% | |
Berry Plastics Holding Corporation | | | | | | | | | | |
Term Loan, 2.21%, Maturing April 3, 2015 | | | | | 24,165 | | | $ | 24,044,671 | |
BWAY Corporation | | | | | | | | | | |
Term Loan, 5.25%, Maturing February 23, 2018 | | | | | 2,536 | | | | 2,542,259 | |
Term Loan, 5.25%, Maturing February 23, 2018 | | | | | 22,630 | | | | 22,681,805 | |
Hilex Poly Co. LLC | | | | | | | | | | |
Term Loan, 11.25%, Maturing November 16, 2015 | | | | | 3,840 | | | | 3,916,742 | |
| | | | |
| | 24 | | See Notes to Financial Statements. |
Floating Rate Portfolio
October 31, 2012
Portfolio of Investments — continued
| | | | | | | | | | |
| Borrower/Tranche Description | | | | Principal
Amount*
(000’s omitted) | | | Value | |
| | | | | | | | | | |
|
Containers and Glass Products (continued) | |
Pelican Products, Inc. | | | | | | | | | | |
Term Loan, 7.00%, Maturing July 11, 2018 | | | | | 3,394 | | | $ | 3,419,455 | |
Reynolds Group Holdings Inc. | | | | | | | | | | |
Term Loan, 4.75%, Maturing September 20, 2018 | | | | | 53,475 | | | | 53,772,321 | |
Sealed Air Corporation | | | | | | | | | | |
Term Loan, 5.50%, Maturing October 3, 2018 | | EUR | | | 978 | | | | 1,272,529 | |
TricorBraun, Inc. | | | | | | | | | | |
Term Loan, 5.50%, Maturing May 3, 2018 | | | | | 7,091 | | | | 7,144,075 | |
| | | | | | | | | | | |
| | | $ | 118,793,857 | |
| | | | | | | | | | | |
|
Cosmetics / Toiletries — 0.5% | |
Bausch & Lomb, Inc. | | | | | | | | | | |
Term Loan, 5.25%, Maturing May 17, 2019 | | | | | 35,062 | | | $ | 35,500,402 | |
Huish Detergents, Inc. | | | | | | | | | | |
Term Loan, 2.22%, Maturing April 25, 2014 | | | | | 1,944 | | | | 1,860,987 | |
Prestige Brands, Inc. | | | | | | | | | | |
Term Loan, 5.28%, Maturing January 31, 2019 | | | | | 4,889 | | | | 4,951,054 | |
| | | | | | | | | | | |
| | | $ | 42,312,443 | |
| | | | | | | | | | | |
|
Drugs — 0.8% | |
Aptalis Pharma, Inc. | | | | | | | | | | |
Term Loan, 5.50%, Maturing February 10, 2017 | | | | | 3,982 | | | $ | 3,999,917 | |
Term Loan, 5.50%, Maturing February 10, 2017 | | | | | 20,762 | | | | 20,866,071 | |
Par Pharmaceutical Companies, Inc. | | | | | | | | | | |
Term Loan, 5.00%, Maturing September 30, 2019 | | | | | 12,925 | | | | 12,919,235 | |
Warner Chilcott Company, LLC | | | | | | | | | | |
Term Loan, 3.75%, Maturing March 17, 2016 | | | | | 278 | | | | 279,940 | |
Term Loan, 4.25%, Maturing March 15, 2018 | | | | | 6,647 | | | | 6,680,116 | |
Warner Chilcott Corporation | | | | | | | | | | |
Term Loan, 4.25%, Maturing March 15, 2018 | | | | | 5,048 | | | | 5,073,667 | |
Term Loan, 4.25%, Maturing March 15, 2018 | | | | | 13,294 | | | | 13,360,232 | |
WC Luxco S.a.r.l. | | | | | | | | | | |
Term Loan, 4.25%, Maturing March 15, 2018 | | | | | 9,139 | | | | 9,185,160 | |
| | | | | | | | | | | |
| | | $ | 72,364,338 | |
| | | | | | | | | | | |
|
Ecological Services and Equipment — 0.3% | |
ADS Waste Holdings | | | | | | | | | | |
Term Loan, 5.25%, Maturing September 11, 2019 | | | | | 21,450 | | | $ | 21,675,675 | |
Envirotest Systems Holding Corp. | | | | | | | | | | |
Term Loan - Second Lien, 15.50%, Maturing March 31, 2017(6) | | | | | 93 | | | | 95,365 | |
Progressive Waste Solutions Ltd. | | | | | | | | | | |
Term Loan, Maturing October 11, 2019(3) | | | | | 5,875 | | | | 5,930,078 | |
| | | | | | | | |
| Borrower/Tranche Description | | | | Principal
Amount*
(000’s omitted) | | Value | |
| | | | | | | | |
|
Ecological Services and Equipment (continued) | |
Safety Kleen (SK Holdings) | | | | | | | | |
Term Loan, 5.00%, Maturing February 17, 2017 | | | | 2,479 | | $ | 2,477,102 | |
| | | | | | | | | |
| | $ | 30,178,220 | |
| | | | | | | | | |
|
Electronics / Electrical — 5.9% | |
Aeroflex Incorporated | | | | | | | | |
Term Loan, 5.75%, Maturing May 9, 2018 | | | | 11,848 | | $ | 11,889,011 | |
Aspect Software, Inc. | | | | | | | | |
Term Loan, 6.25%, Maturing May 6, 2016 | | | | 26,499 | | | 26,134,550 | |
Attachmate Corporation | | | | | | | | |
Term Loan, 7.25%, Maturing November 22, 2017 | | | | 34,491 | | | 34,887,583 | |
Cinedigm Digital Funding I, LLC | | | | | | | | |
Term Loan, 5.25%, Maturing April 29, 2016 | | | | 6,711 | | | 6,777,995 | |
CommScope, Inc. | | | | | | | | |
Term Loan, 4.25%, Maturing January 12, 2018 | | | | 34,140 | | | 34,438,926 | |
CompuCom Systems, Inc. | | | | | | | | |
Term Loan, 6.50%, Maturing October 2, 2018 | | | | 14,700 | | | 14,727,562 | |
CPI International Inc. | | | | | | | | |
Term Loan, 5.00%, Maturing February 13, 2017 | | | | 10,341 | | | 10,340,812 | |
Dealer Computer Services, Inc. | | | | | | | | |
Term Loan, 3.75%, Maturing April 20, 2018 | | | | 13,101 | | | 13,193,395 | |
DG FastChannel, Inc. | | | | | | | | |
Term Loan, 5.75%, Maturing July 26, 2018 | | | | 17,598 | | | 16,981,800 | |
Eagle Parent, Inc. | | | | | | | | |
Term Loan, 5.00%, Maturing May 16, 2018 | | | | 33,502 | | | 33,745,319 | |
Edwards (Cayman Islands II) Limited | | | | | | | | |
Term Loan, 5.50%, Maturing May 31, 2016 | | | | 7,294 | | | 7,325,533 | |
Term Loan, 5.50%, Maturing May 31, 2016 | | | | 14,352 | | | 14,415,137 | |
Freescale Semiconductor, Inc. | | | | | | | | |
Term Loan, 4.46%, Maturing December 1, 2016 | | | | 40,483 | | | 39,673,675 | |
Hyland Software, Inc. | | | | | | | | |
Term Loan, Maturing October 29, 2019(3) | | | | 3,900 | | | 3,906,501 | |
InfoGroup Inc. | | | | | | | | |
Term Loan, 5.75%, Maturing May 25, 2018 | | | | 9,642 | | | 8,629,509 | |
Lawson Software Inc. | | | | | | | | |
Term Loan, 5.75%, Maturing October 18, 2016 | | | | 1,850 | | | 1,878,135 | |
Magic Newco LLC | | | | | | | | |
Term Loan, 7.25%, Maturing December 12, 2018 | | | | 8,300 | | | 8,336,313 | |
Microsemi Corporation | | | | | | | | |
Term Loan, 4.00%, Maturing February 2, 2018 | | | | 18,591 | | | 18,742,087 | |
NeuStar, Inc. | | | | | | | | |
Term Loan, 5.00%, Maturing November 8, 2018 | | | | 11,583 | | | 11,713,309 | |
| | | | |
| | 25 | | See Notes to Financial Statements. |
Floating Rate Portfolio
October 31, 2012
Portfolio of Investments — continued
| | | | | | | | | | |
| Borrower/Tranche Description | | | | Principal
Amount*
(000’s omitted) | | | Value | |
| | | | | | | | | | |
|
Electronics / Electrical (continued) | |
Nxp B.V. | | | | | | | | | | |
Term Loan, 4.50%, Maturing March 3, 2017 | | | | | 16,007 | | | $ | 16,260,225 | |
Term Loan, 5.50%, Maturing March 3, 2017 | | | | | 17,251 | | | | 17,646,085 | |
Term Loan, 5.25%, Maturing March 19, 2019 | | | | | 19,154 | | | | 19,457,011 | |
Open Solutions, Inc. | | | | | | | | | | |
Term Loan, 2.44%, Maturing January 23, 2014 | | | | | 11,157 | | | | 10,790,224 | |
Rovi Solutions Corporation | | | | | | | | | | |
Term Loan, 4.00%, Maturing March 29, 2019 | | | | | 9,577 | | | | 9,409,280 | |
SafeNet Inc. | | | | | | | | | | |
Term Loan, 2.71%, Maturing April 12, 2014 | | | | | 10,189 | | | | 10,163,082 | |
Semtech Corporation | | | | | | | | | | |
Term Loan, 4.25%, Maturing March 20, 2017 | | | | | 2,811 | | | | 2,835,470 | |
Sensata Technologies Finance Company, LLC | | | | | | | | | | |
Term Loan, 4.00%, Maturing May 11, 2018 | | | | | 36,508 | | | | 36,690,333 | |
Serena Software, Inc. | | | | | | | | | | |
Term Loan, 4.22%, Maturing March 10, 2016 | | | | | 3,010 | | | | 2,987,366 | |
Term Loan, 5.00%, Maturing March 10, 2016 | | | | | 3,975 | | | | 3,989,906 | |
Shield Finance Co. S.A.R.L. | | | | | | | | | | |
Term Loan, 6.50%, Maturing May 10, 2019 | | | | | 11,721 | | | | 11,793,879 | |
SkillSoft Corporation | | | | | | | | | | |
Term Loan, 5.00%, Maturing May 26, 2017 | | | | | 8,508 | | | | 8,603,726 | |
Sophia, L.P. | | | | | | | | | | |
Term Loan, 6.25%, Maturing July 19, 2018 | | | | | 16,089 | | | | 16,337,209 | |
Spansion LLC | | | | | | | | | | |
Term Loan, 4.75%, Maturing February 9, 2015 | | | | | 8,066 | | | | 8,156,694 | |
VeriFone Inc. | | | | | | | | | | |
Term Loan, 4.25%, Maturing December 28, 2018 | | | | | 4,396 | | | | 4,398,385 | |
Vertafore, Inc. | | | | | | | | | | |
Term Loan, 5.25%, Maturing July 29, 2016 | | | | | 13,936 | | | | 13,993,806 | |
Wall Street Systems, Inc. | | | | | | | | | | |
Term Loan, Maturing October 24, 2019(3) | | | | | 18,425 | | | | 18,194,687 | |
Web.com Group, Inc. | | | | | | | | | | |
Term Loan, 7.00%, Maturing October 27, 2017 | | | | | 24,844 | | | | 24,875,493 | |
| | | | | | | | | | | |
| | | $ | 554,320,013 | |
| | | | | | | | | | | |
|
Equipment Leasing — 0.7% | |
BakerCorp International, Inc. | | | | | | | | | | |
Term Loan, 5.00%, Maturing June 1, 2018 | | | | | 9,890 | | | $ | 9,941,459 | |
Delos Aircraft Inc. | | | | | | | | | | |
Term Loan, 4.75%, Maturing April 12, 2016 | | | | | 15,050 | | | | 15,294,563 | |
Flying Fortress Inc. | | | | | | | | | | |
Term Loan, 5.00%, Maturing June 30, 2017 | | | | | 40,325 | | | | 41,030,687 | |
| | | | | | | | | | | |
| | | $ | 66,266,709 | |
| | | | | | | | | | | |
| | | | | | | | | | |
| Borrower/Tranche Description | | | | Principal
Amount*
(000’s omitted) | | | Value | |
| | | | | | | | | | |
|
Financial Intermediaries — 3.2% | |
American Capital Holdings, Inc. | | | | | | | | | | |
Term Loan, 5.50%, Maturing August 22, 2016 | | | | | 8,925 | | | $ | 8,991,938 | |
Asset Acceptance Capital Corp. | | | | | | | | | | |
Term Loan, 8.75%, Maturing November 14, 2017 | | | | | 10,238 | | | | 10,340,211 | |
CB Richard Ellis Services, Inc. | | | | | | | | | | |
Term Loan, 3.46%, Maturing March 5, 2018 | | | | | 7,935 | | | | 7,955,106 | |
Term Loan, 3.71%, Maturing September 4, 2019 | | | | | 547 | | | | 548,018 | |
Citco III Limited | | | | | | | | | | |
Term Loan, 5.50%, Maturing June 29, 2018 | | | | | 22,308 | | | | 22,516,684 | |
First Data Corporation | | | | | | | | | | |
Term Loan, 2.96%, Maturing September 24, 2014 | | | | | 754 | | | | 754,755 | |
Term Loan, 2.96%, Maturing September 24, 2014 | | | | | 817 | | | | 818,041 | |
Term Loan, 2.96%, Maturing September 24, 2014 | | | | | 879 | | | | 880,744 | |
Term Loan, 4.21%, Maturing March 23, 2018 | | | | | 15,843 | | | | 15,193,968 | |
Term Loan, 5.21%, Maturing September 24, 2018 | | | | | 13,325 | | | | 13,094,584 | |
Grosvenor Capital Management Holdings, LLP | | | | | | | | | | |
Term Loan, 4.25%, Maturing December 5, 2016 | | | | | 8,583 | | | | 8,443,056 | |
Hamilton Lane Advisors, LLC | | | | | | | | | | |
Term Loan, 6.50%, Maturing February 23, 2018 | | | | | 5,655 | | | | 5,655,000 | |
Harbourvest Partners, LLC | | | | | | | | | | |
Term Loan, 6.25%, Maturing December 16, 2016 | | | | | 7,941 | | | | 7,960,390 | |
iPayment, Inc. | | | | | | | | | | |
Term Loan, 5.75%, Maturing May 8, 2017 | | | | | 20,570 | | | | 20,531,748 | |
LPL Holdings, Inc. | | | | | | | | | | |
Term Loan, 2.71%, Maturing March 29, 2017 | | | | | 4,339 | | | | 4,289,939 | |
Term Loan, 4.00%, Maturing March 29, 2019 | | | | | 33,283 | | | | 33,469,965 | |
Mercury Payment Systems Canada, LLC | | | | | | | | | | |
Term Loan, 5.50%, Maturing July 3, 2017 | | | | | 12,714 | | | | 12,841,203 | |
MIP Delaware, LLC | | | | | | | | | | |
Term Loan, 5.50%, Maturing July 12, 2018 | | | | | 6,172 | | | | 6,233,299 | |
Nuveen Investments, Inc. | | | | | | | | | | |
Term Loan, 5.85%, Maturing May 12, 2017 | | | | | 35,459 | | | | 35,503,306 | |
Term Loan, 5.84%, Maturing May 13, 2017 | | | | | 28,556 | | | | 28,627,376 | |
Term Loan, 7.25%, Maturing May 13, 2017 | | | | | 6,250 | | | | 6,275,000 | |
Oz Management LP | | | | | | | | | | |
Term Loan, 1.71%, Maturing November 15, 2016 | | | | | 15,645 | | | | 14,006,531 | |
RJO Holdings Corp. | | | | | | | | | | |
Term Loan, 6.22%, Maturing December 10, 2015(6) | | | | | 63 | | | | 51,347 | |
Term Loan, 6.97%, Maturing December 10, 2015(6) | | | | | 1,980 | | | | 1,526,487 | |
RPI Finance Trust | | | | | | | | | | |
Term Loan, 3.50%, Maturing May 9, 2018 | | | | | 29,430 | | | | 29,564,410 | |
Vantiv, LLC | | | | | | | | | | |
Term Loan, 3.75%, Maturing March 27, 2019 | | | | | 5,458 | | | | 5,475,343 | |
| | | | | | | | | | | |
| | | $ | 301,548,449 | |
| | | | | | | | | | | |
| | | | |
| | 26 | | See Notes to Financial Statements. |
Floating Rate Portfolio
October 31, 2012
Portfolio of Investments — continued
| | | | | | | | | | |
| Borrower/Tranche Description | | | | Principal
Amount*
(000’s omitted) | | | Value | |
| | | | | | | | | | |
|
Food Products — 3.6% | |
AdvancePierre Foods, Inc. | | | | | | | | | | |
Term Loan, 5.75%, Maturing July 10, 2017 | | | | | 14,250 | | | $ | 14,386,558 | |
American Seafoods Group LLC | | | | | | | | | | |
Term Loan, 4.25%, Maturing March 16, 2018 | | | | | 10,093 | | | | 10,005,033 | |
BL Marketing Limited (Weetabix) | | | | | | | | | | |
Term Loan, 7.36%, Maturing June 30, 2017 | | GBP | | | 2,500 | | | | 4,025,969 | |
Blue Buffalo Company, Ltd. | | | | | | | | | | |
Term Loan, 6.50%, Maturing August 8, 2019 | | | | | 12,500 | | | | 12,593,750 | |
Clearwater Seafoods Limited Partnership | | | | | | | | | | |
Term Loan, 6.75%, Maturing June 6, 2018 | | | | | 11,322 | | | | 11,364,081 | |
Del Monte Foods Company | | | | | | | | | | |
Term Loan, 4.50%, Maturing March 8, 2018 | | | | | 86,824 | | | | 86,824,333 | |
Dole Food Company Inc. | | | | | | | | | | |
Term Loan, 5.04%, Maturing July 6, 2018 | | | | | 13,039 | | | | 13,094,392 | |
High Liner Foods Incorporated | | | | | | | | | | |
Term Loan, 7.00%, Maturing December 19, 2017 | | | | | 9,602 | | | | 9,656,451 | |
JBS USA Holdings Inc. | | | | | | | | | | |
Term Loan, 4.25%, Maturing May 25, 2018 | | | | | 29,149 | | | | 29,148,618 | |
Michael Foods Group, Inc. | | | | | | | | | | |
Term Loan, 4.25%, Maturing February 23, 2018 | | | | | 20,557 | | | | 20,672,295 | |
NBTY, Inc. | | | | | | | | | | |
Term Loan, 4.25%, Maturing October 2, 2017 | | | | | 58,920 | | | | 59,299,369 | |
Pinnacle Foods Finance LLC | | | | | | | | | | |
Term Loan, 4.75%, Maturing October 17, 2018 | | | | | 3,358 | | | | 3,379,113 | |
Term Loan, 4.75%, Maturing October 17, 2018 | | | | | 25,337 | | | | 25,442,077 | |
Solvest Ltd. | | | | | | | | | | |
Term Loan, 5.02%, Maturing July 6, 2018 | | | | | 23,332 | | | | 23,432,106 | |
United Biscuits (UK) Limited | | | | | | | | | | |
Term Loan - Second Lien, 4.51%, Maturing June 15, 2016 | | GBP | | | 1,500 | | | | 2,360,108 | |
Windsor Quality Food Company Ltd. | | | | | | | | | | |
Term Loan, 5.00%, Maturing February 16, 2017 | | | | | 15,970 | | | | 15,970,123 | |
| | | | | | | | | | | |
| | | $ | 341,654,376 | |
| | | | | | | | | | | |
|
Food Service — 3.6% | |
Aramark Corporation | | | | | | | | | | |
Term Loan, 3.40%, Maturing July 26, 2016 | | | | | 3,177 | | | $ | 3,184,715 | |
Term Loan, 3.46%, Maturing July 26, 2016 | | | | | 40,817 | | | | 40,934,190 | |
Term Loan, 3.46%, Maturing July 26, 2016 | | | | | 4,574 | | | | 4,586,929 | |
Term Loan, 3.57%, Maturing July 26, 2016 | | | | | 18,087 | | | | 18,129,576 | |
Term Loan, 3.61%, Maturing July 26, 2016 | | | | | 950 | | | | 945,250 | |
Brasa Holdings, Inc. | | | | | | | | | | |
Term Loan, 7.50%, Maturing July 19, 2019 | | | | | 4,825 | | | | 4,873,250 | |
| | | | | | | | | | |
| Borrower/Tranche Description | | | | Principal
Amount*
(000’s omitted) | | | Value | |
| | | | | | | | | | |
|
Food Service (continued) | |
Buffets, Inc. | | | | | | | | | | |
Term Loan, 0.24%, Maturing April 22, 2015(6) | | | | | 998 | | | $ | 997,989 | |
Term Loan, 10.50%, Maturing July 18, 2017 | | | | | 3,456 | | | | 3,559,938 | |
Term Loan, 2.00%, Maturing July 19, 2017(2) | | | | | 1,500 | | | | 1,545,000 | |
Burger King Corporation | | | | | | | | | | |
Term Loan, 3.75%, Maturing September 27, 2019 | | | | | 25,250 | | | | 25,384,153 | |
Centerplate, Inc. | | | | | | | | | | |
Term Loan, 5.75%, Maturing October 15, 2018 | | | | | 4,125 | | | | 4,155,938 | |
DineEquity, Inc. | | | | | | | | | | |
Term Loan, 4.25%, Maturing October 19, 2017 | | | | | 15,786 | | | | 15,918,783 | |
Dunkin’ Brands, Inc. | | | | | | | | | | |
Term Loan, 4.00%, Maturing November 23, 2017 | | | | | 47,982 | | | | 48,199,885 | |
Landry’s, Inc. | | | | | | | | | | |
Term Loan, 6.50%, Maturing April 24, 2018 | | | | | 18,174 | | | | 18,397,161 | |
NPC International, Inc. | | | | | | | | | | |
Term Loan, 5.25%, Maturing December 28, 2018 | | | | | 7,836 | | | | 7,972,748 | |
OSI Restaurant Partners, LLC | | | | | | | | | | |
Term Loan, 4.75%, Maturing October 24, 2019 | | | | | 30,125 | | | | 30,253,031 | |
P.F. Chang’s China Bistro Inc. | | | | | | | | | | |
Term Loan, 6.25%, Maturing July 2, 2019 | | | | | 4,450 | | | | 4,507,481 | |
Sagittarius Restaurants, LLC | | | | | | | | | | |
Term Loan, 7.51%, Maturing May 18, 2015 | | | | | 6,728 | | | | 6,744,319 | |
SSP Financing Limited | | | | | | | | | | |
Term Loan, 2.40%, Maturing December 17, 2016 | | | | | 4,774 | | | | 4,422,287 | |
US Foods, Inc. | | | | | | | | | | |
Term Loan, 2.71%, Maturing July 3, 2014 | | | | | 8,928 | | | | 8,842,201 | |
Term Loan, 5.75%, Maturing March 31, 2017 | | | | | 41,350 | | | | 40,833,493 | |
Weight Watchers International, Inc. | | | | | | | | | | |
Term Loan, 4.00%, Maturing March 15, 2019 | | | | | 15,298 | | | | 15,347,844 | |
Wendy’s International, Inc. | | | | | | | | | | |
Term Loan, 4.75%, Maturing May 15, 2019 | | | | | 26,100 | | | | 26,374,598 | |
| | | | | | | | | | | |
| | | $ | 336,110,759 | |
| | | | | | | | | | | |
|
Food / Drug Retailers — 3.0% | |
Alliance Boots Holdings Limited | | | | | | | | | | |
Term Loan, 3.08%, Maturing July 9, 2015 | | EUR | | | 17,497 | | | $ | 22,192,928 | |
Term Loan, 3.49%, Maturing July 9, 2015 | | GBP | | | 43,250 | | | | 67,663,890 | |
General Nutrition Centers, Inc. | | | | | | | | | | |
Term Loan, 3.75%, Maturing March 2, 2018 | | | | | 69,313 | | | | 69,495,427 | |
Iceland Foods Group Limited | | | | | | | | | | |
Term Loan, 5.11%, Maturing April 12, 2019 | | EUR | | | 7,950 | | | | 10,426,752 | |
Pantry, Inc. (The) | | | | | | | | | | |
Term Loan, 5.75%, Maturing August 2, 2019 | | | | | 4,700 | | | | 4,737,210 | |
| | | | |
| | 27 | | See Notes to Financial Statements. |
Floating Rate Portfolio
October 31, 2012
Portfolio of Investments — continued
| | | | | | | | | | |
| Borrower/Tranche Description | | | | Principal
Amount*
(000’s omitted) | | | Value | |
| | | | | | | | | | |
|
Food / Drug Retailers (continued) | |
Rite Aid Corporation | | | | | | | | | | |
Term Loan, 1.97%, Maturing June 4, 2014 | | | | | 63,142 | | | $ | 62,699,724 | |
Term Loan, 4.50%, Maturing March 2, 2018 | | | | | 36,377 | | | | 36,308,535 | |
Sprouts Farmers Markets Holdings, LLC | | | | | | | | | | |
Term Loan, 6.00%, Maturing April 18, 2018 | | | | | 9,451 | | | | 9,545,826 | |
| | | | | | | | | | | |
| | | $ | 283,070,292 | |
| | | | | | | | | | | |
|
Health Care — 12.3% | |
Alere, Inc. | | | | | | | | | | |
Term Loan, 4.75%, Maturing June 30, 2017 | | | | | 5,497 | | | $ | 5,545,477 | |
Term Loan, 4.75%, Maturing June 30, 2017 | | | | | 6,848 | | | | 6,902,824 | |
Term Loan, 4.75%, Maturing June 30, 2017 | | | | | 27,631 | | | | 27,851,066 | |
Alkermes, Inc. | | | | | | | | | | |
Term Loan, 4.50%, Maturing September 18, 2019 | | | | | 7,025 | | | | 7,077,688 | |
Alliance Healthcare Services, Inc. | | | | | | | | | | |
Term Loan, 7.25%, Maturing June 1, 2016 | | | | | 14,172 | | | | 13,959,322 | |
Ardent Medical Services, Inc. | | | | | | | | | | |
Term Loan, 6.50%, Maturing September 15, 2015 | | | | | 21,322 | | | | 21,375,438 | |
AssuraMed | | | | | | | | | | |
Term Loan, Maturing October 23, 2019(3) | | | | | 9,425 | | | | 9,479,976 | |
Aveta, Inc. | | | | | | | | | | |
Term Loan, 8.50%, Maturing April 4, 2017 | | | | | 5,799 | | | | 5,802,687 | |
Term Loan, 8.50%, Maturing April 4, 2017 | | | | | 5,799 | | | | 5,802,687 | |
Term Loan, Maturing October 9, 2017(3) | | | | | 7,975 | | | | 7,935,125 | |
Term Loan, Maturing October 26, 2017(3) | | | | | 5,800 | | | | 5,771,000 | |
Biomet Inc. | | | | | | | | | | |
Term Loan, 3.96%, Maturing July 25, 2017 | | | | | 43,696 | | | | 44,014,249 | |
BSN Medical Acquisition Holding GmbH | | | | | | | | | | |
Term Loan, 5.25%, Maturing August 28, 2019 | | EUR | | | 2,000 | | | | 2,610,932 | |
Catalent Pharma Solutions Inc. | | | | | | | | | | |
Term Loan, 4.21%, Maturing September 15, 2016 | | | | | 13,093 | | | | 13,158,273 | |
Term Loan, 5.25%, Maturing September 15, 2017 | | | | | 13,464 | | | | 13,606,644 | |
Community Health Systems, Inc. | | | | | | | | | | |
Term Loan, 3.92%, Maturing January 25, 2017 | | | | | 64,848 | | | | 65,213,060 | |
Convatec Inc. | | | | | | | | | | |
Term Loan, 5.00%, Maturing December 22, 2016 | | | | | 18,508 | | | | 18,646,894 | |
CRC Health Corporation | | | | | | | | | | |
Term Loan, 4.86%, Maturing November 16, 2015 | | | | | 29,501 | | | | 28,726,897 | |
DaVita, Inc. | | | | | | | | | | |
Term Loan, 4.50%, Maturing October 20, 2016 | | | | | 10,569 | | | | 10,645,358 | |
Term Loan, Maturing September 2, 2019(3) | | | | | 18,800 | | | | 18,878,340 | |
DJO Finance LLC | | | | | | | | | | |
Term Loan, 5.21%, Maturing November 1, 2016 | | | | | 13,026 | | | | 13,075,293 | |
Term Loan, 6.25%, Maturing September 15, 2017 | | | | | 8,507 | | | | 8,558,294 | |
| | | | | | | | | | |
| Borrower/Tranche Description | | | | Principal
Amount*
(000’s omitted) | | | Value | |
| | | | | | | | | | |
|
Health Care (continued) | |
Drumm Investors LLC | | | | | | | | | | |
Term Loan, 5.00%, Maturing May 4, 2018 | | | | | 30,403 | | | $ | 29,357,705 | |
Emdeon, Inc. | | | | | | | | | | |
Term Loan, 5.00%, Maturing November 2, 2018 | | | | | 9,878 | | | | 9,994,258 | |
Emergency Medical Services Corporation | | | | | | | | | | |
Term Loan, 5.25%, Maturing May 25, 2018 | | | | | 23,200 | | | | 23,438,114 | |
Fenwal, Inc. | | | | | | | | | | |
Term Loan, 2.67%, Maturing February 28, 2014 | | | | | 477 | | | | 476,581 | |
Term Loan, 2.67%, Maturing February 28, 2014 | | | | | 2,782 | | | | 2,779,034 | |
Grifols Inc. | | | | | | | | | | |
Term Loan, 4.50%, Maturing June 1, 2017 | | | | | 39,619 | | | | 40,094,518 | |
Hanger Orthopedic Group, Inc. | | | | | | | | | | |
Term Loan, 4.01%, Maturing December 1, 2016 | | | | | 19,711 | | | | 19,810,025 | |
HCA, Inc. | | | | | | | | | | |
Term Loan, 3.61%, Maturing March 31, 2017 | | | | | 51,019 | | | | 51,168,893 | |
Term Loan, 3.46%, Maturing May 1, 2018 | | | | | 38,600 | | | | 38,693,388 | |
Health Management Associates, Inc. | | | | | | | | | | |
Term Loan, 4.50%, Maturing November 16, 2018 | | | | | 36,127 | | | | 36,498,205 | |
Hologic Inc. | | | | | | | | | | |
Term Loan, 4.50%, Maturing August 1, 2019 | | | | | 21,197 | | | | 21,464,040 | |
Iasis Healthcare LLC | | | | | | | | | | |
Term Loan, 5.00%, Maturing May 3, 2018 | | | | | 15,027 | | | | 15,092,266 | |
inVentiv Health, Inc. | | | | | | | | | | |
Term Loan, 6.50%, Maturing August 4, 2016 | | | | | 35,318 | | | | 34,538,334 | |
Term Loan, 6.75%, Maturing May 15, 2018 | | | | | 16,723 | | | | 16,305,327 | |
Kindred Healthcare, Inc. | | | | | | | | | | |
Term Loan, 5.25%, Maturing June 1, 2018 | | | | | 14,607 | | | | 14,433,871 | |
Term Loan, 6.00%, Maturing June 1, 2018 | | | | | 8,600 | | | | 8,497,806 | |
Kinetic Concepts, Inc. | | | | | | | | | | |
Term Loan, 7.00%, Maturing May 4, 2018 | | | | | 53,595 | | | | 54,398,925 | |
LHP Hospital Group, Inc. | | | | | | | | | | |
Term Loan, 9.00%, Maturing July 3, 2018 | | | | | 5,885 | | | | 5,944,103 | |
MedAssets, Inc. | | | | | | | | | | |
Term Loan, 5.25%, Maturing November 16, 2016 | | | | | 19,553 | | | | 19,772,777 | |
Medpace, Inc. | | | | | | | | | | |
Term Loan, 6.50%, Maturing June 16, 2017 | | | | | 10,745 | | | | 10,369,003 | |
Multiplan, Inc. | | | | | | | | | | |
Term Loan, 4.75%, Maturing August 26, 2017 | | | | | 55,565 | | | | 55,889,091 | |
MX USA, Inc. | | | | | | | | | | |
Term Loan, 6.50%, Maturing April 28, 2017 | | | | | 3,756 | | | | 3,737,344 | |
One Call Medical, Inc. | | | | | | | | | | |
Term Loan, 7.00%, Maturing August 16, 2019 | | | | | 9,525 | | | | 9,572,625 | |
Onex Carestream Finance LP | | | | | | | | | | |
Term Loan, 5.00%, Maturing February 25, 2017 | | | | | 20,341 | | | | 20,164,647 | |
| | | | |
| | 28 | | See Notes to Financial Statements. |
Floating Rate Portfolio
October 31, 2012
Portfolio of Investments — continued
| | | | | | | | | | |
| Borrower/Tranche Description | | | | Principal
Amount*
(000’s omitted) | | | Value | |
| | | | | | | | | | |
|
Health Care (continued) | |
Pharmaceutical Product Development, Inc. | | | | | | | | | | |
Term Loan, 6.25%, Maturing December 5, 2018 | | | | | 27,732 | | | $ | 28,104,511 | |
Physiotherapy Associates Holdings, Inc. | | | | | | | | | | |
Term Loan, 6.01%, Maturing April 30, 2018 | | | | | 3,616 | | | | 3,624,977 | |
Radnet Management, Inc. | | | | | | | | | | |
Term Loan, 5.51%, Maturing September 30, 2018 | | | | | 20,043 | | | | 20,089,064 | |
Select Medical Corporation | | | | | | | | | | |
Term Loan, 5.50%, Maturing June 1, 2018 | | | | | 33,488 | | | | 33,781,337 | |
Sheridan Holdings, Inc. | | | | | | | | | | |
Term Loan, 6.00%, Maturing June 29, 2018 | | | | | 6,135 | | | | 6,192,137 | |
Sunrise Medical Holdings B.V. | | | | | | | | | | |
Term Loan, 7.25%, Maturing May 13, 2014 | | EUR | | | 1,940 | | | | 2,479,333 | |
TriZetto Group, Inc. (The) | | | | | | | | | | |
Term Loan, 4.75%, Maturing May 2, 2018 | | | | | 19,671 | | | | 19,618,455 | |
Truven Health Analytics Inc. | | | | | | | | | | |
Term Loan, 5.75%, Maturing June 1, 2019 | | | | | 18,300 | | | | 18,357,187 | |
Universal Health Services, Inc. | | | | | | | | | | |
Term Loan, 3.75%, Maturing November 15, 2016 | | | | | 4,166 | | | | 4,187,110 | |
Valeant Pharmaceuticals International, Inc. | | | | | | | | | | |
Term Loan, 4.25%, Maturing February 13, 2019 | | | | | 13,170 | | | | 13,241,932 | |
Term Loan, Maturing September 27, 2019(3) | | | | | 33,675 | | | | 33,860,212 | |
Vanguard Health Holding Company II, LLC | | | | | | | | | | |
Term Loan, 5.00%, Maturing January 29, 2016 | | | | | 24,510 | | | | 24,690,817 | |
VWR Funding, Inc. | | | | | | | | | | |
Term Loan, 2.71%, Maturing June 30, 2014 | | | | | 27,722 | | | | 27,768,495 | |
Term Loan, 4.46%, Maturing April 3, 2017 | | | | | 25,727 | | | | 25,872,154 | |
| | | | | | | | | | | |
| | | $ | 1,158,996,125 | |
| | | | | | | | | | | |
|
Home Furnishings — 0.4% | |
Hunter Fan Company | | | | | | | | | | |
Term Loan, 2.83%, Maturing April 16, 2014 | | | | | 2,471 | | | $ | 2,359,956 | |
Oreck Corporation | | | | | | | | | | |
Term Loan - Second Lien, 3.88%, Maturing March 19, 2016(6) | | | | | 797 | | | | 720,753 | |
Serta Simmons Holdings, LLC | | | | | | | | | | |
Term Loan, 5.00%, Maturing September 19, 2019 | | | | | 27,850 | | | | 27,879,020 | |
Sofia III S.a.r.l. | | | | | | | | | | |
Term Loan, 2.61%, Maturing June 24, 2016 | | EUR | | | 3,348 | | | | 3,926,977 | |
| | | | | | | | | | | |
| | | $ | 34,886,706 | |
| | | | | | | | | | | |
|
Industrial Equipment — 1.4% | |
Colfax Corporation | | | | | | | | | | |
Term Loan, 4.50%, Maturing January 11, 2019 | | | | | 14,936 | | | $ | 15,102,581 | |
| | | | | | | | | | |
| Borrower/Tranche Description | | | | Principal
Amount*
(000’s omitted) | | | Value | |
| | | | | | | | | | |
|
Industrial Equipment (continued) | |
Excelitas Technologies Corp. | | | | | | | | | | |
Term Loan, 5.00%, Maturing November 23, 2016 | | | | | 2,895 | | | $ | 2,888,004 | |
Generac Power Systems, Inc. | | | | | | | | | | |
Term Loan, 6.25%, Maturing February 8, 2019 | | | | | 16,484 | | | | 16,875,175 | |
Grede LLC | | | | | | | | | | |
Term Loan, 7.00%, Maturing April 3, 2017 | | | | | 9,482 | | | | 9,505,204 | |
Husky Injection Molding Systems Ltd. | | | | | | | | | | |
Term Loan, 5.75%, Maturing June 29, 2018 | | | | | 10,985 | | | | 11,147,951 | |
Kinetek Acquisitions Corporation | | | | | | | | | | |
Term Loan, 4.50%, Maturing November 11, 2013 | | | | | 275 | | | | 274,380 | |
Term Loan, 4.50%, Maturing November 11, 2013 | | | | | 2,712 | | | | 2,705,283 | |
Kion Group GMBH | | | | | | | | | | |
Term Loan, 3.36%, Maturing December 23, 2014(5) | | EUR | | | 1,058 | | �� | | 1,347,351 | |
Term Loan, 3.46%, Maturing December 23, 2014(5) | | | | | 18,260 | | | | 17,942,991 | |
Term Loan, 3.96%, Maturing December 23, 2015(5) | | | | | 18,260 | | | | 17,942,991 | |
Term Loan, 3.86%, Maturing December 29, 2015(5) | | EUR | | | 1,012 | | | | 1,289,052 | |
Manitowoc Company, Inc. (The) | | | | | | | | | | |
Term Loan, 4.25%, Maturing November 13, 2017 | | | | | 5,236 | | | | 5,274,766 | |
Tank Holding Corp. | | | | | | | | | | |
Term Loan, 5.50%, Maturing July 9, 2019 | | | | | 10,513 | | | | 10,584,894 | |
Terex Corporation | | | | | | | | | | |
Term Loan, 5.00%, Maturing April 28, 2017 | | EUR | | | 9,900 | | | | 12,912,078 | |
Unifrax Corporation | | | | | | | | | | |
Term Loan, 6.50%, Maturing November 28, 2018 | | | | | 6,779 | | | | 6,855,740 | |
| | | | | | | | | | | |
| | | $ | 132,648,441 | |
| | | | | | | | | | | |
|
Insurance — 2.4% | |
Alliant Holdings I, Inc. | | | | | | | | | | |
Term Loan, 3.36%, Maturing August 21, 2014 | | | | | 22,790 | | | $ | 22,761,848 | |
Term Loan, 6.75%, Maturing August 21, 2014 | | | | | 3,816 | | | | 3,853,697 | |
AmWINS Group, Inc. | | | | | | | | | | |
Term Loan, 5.75%, Maturing June 6, 2019 | | | | | 3,990 | | | | 4,004,963 | |
Applied Systems, Inc. | | | | | | | | | | |
Term Loan, 5.50%, Maturing December 8, 2016 | | | | | 7,490 | | | | 7,514,707 | |
Asurion LLC | | | | | | | | | | |
Term Loan, 5.50%, Maturing May 24, 2018 | | | | | 87,497 | | | | 88,230,131 | |
Term Loan - Second Lien, 9.00%, Maturing May 24, 2019 | | | | | 5,573 | | | | 5,774,119 | |
CCC Information Services, Inc. | | | | | | | | | | |
Term Loan, 5.75%, Maturing November 11, 2015 | | | | | 12,125 | | | | 12,190,262 | |
CNO Financial Group, Inc. | | | | | | | | | | |
Term Loan, 5.00%, Maturing September 20, 2018 | | | | | 13,650 | | | | 13,752,375 | |
Cunningham Lindsey Group, Inc. | | | | | | | | | | |
Term Loan, Maturing October 29, 2019(3) | | | | | 14,350 | | | | 14,376,906 | |
| | | | |
| | 29 | | See Notes to Financial Statements. |
Floating Rate Portfolio
October 31, 2012
Portfolio of Investments — continued
| | | | | | | | | | |
| Borrower/Tranche Description | | | | Principal
Amount*
(000’s omitted) | | | Value | |
| | | | | | | | | | |
|
Insurance (continued) | |
Hub International Limited | | | | | | | | | | |
Term Loan, 4.71%, Maturing June 13, 2017 | | | | | 16,992 | | | $ | 17,130,417 | |
Term Loan, 6.75%, Maturing December 13, 2017 | | | | | 3,420 | | | | 3,462,437 | |
Sedgwick CMS Holdings, Inc. | | | | | | | | | | |
Term Loan, 5.00%, Maturing December 30, 2016 | | | | | 7,845 | | | | 7,854,529 | |
USI Holdings Corporation | | | | | | | | | | |
Term Loan, 2.72%, Maturing May 5, 2014 | | | | | 22,231 | | | | 22,245,033 | |
Term Loan, 7.00%, Maturing May 5, 2014 | | | | | 3,880 | | | | 3,899,400 | |
| | | | | | | | | | | |
| | | $ | 227,050,824 | |
| | | | | | | | | | | |
|
Leisure Goods / Activities / Movies — 3.5% | |
Alpha D2 Limited | | | | | | | | | | |
Term Loan, 6.00%, Maturing April 29, 2019 | | | | | 23,432 | | | $ | 23,666,572 | |
AMC Entertainment, Inc. | | | | | | | | | | |
Term Loan, 4.25%, Maturing December 15, 2016 | | | | | 26,605 | | | | 26,787,638 | |
Term Loan, 4.75%, Maturing February 22, 2018 | | | | | 11,687 | | | | 11,789,951 | |
AMC Networks Inc. | | | | | | | | | | |
Term Loan, 4.00%, Maturing December 31, 2018 | | | | | 13,729 | | | | 13,840,355 | |
Bombardier Recreational Products, Inc. | | | | | | | | | | |
Term Loan, 4.46%, Maturing June 28, 2016 | | | | | 34,422 | | | | 34,648,391 | |
Cedar Fair, L.P. | | | | | | | | | | |
Term Loan, 4.00%, Maturing December 15, 2017 | | | | | 25,611 | | | | 25,819,245 | |
Cinemark USA, Inc. | | | | | | | | | | |
Term Loan, 3.47%, Maturing April 29, 2016 | | | | | 3,069 | | | | 3,093,330 | |
Clubcorp Club Operations, Inc. | | | | | | | | | | |
Term Loan, 6.00%, Maturing November 30, 2016 | | | | | 10,857 | | | | 10,945,699 | |
Fender Musical Instruments Corporation | | | | | | | | | | |
Term Loan, 2.47%, Maturing June 9, 2014 | | | | | 1,060 | | | | 1,059,583 | |
Term Loan, 2.47%, Maturing June 9, 2014 | | | | | 3,694 | | | | 3,693,628 | |
Kasima, LLC | | | | | | | | | | |
Term Loan, 4.12%, Maturing March 10, 2015 | | | | | 15,000 | | | | 15,056,250 | |
Term Loan, 5.00%, Maturing March 31, 2017 | | | | | 11,847 | | | | 11,891,737 | |
Live Nation Entertainment, Inc. | | | | | | | | | | |
Term Loan, 4.50%, Maturing November 7, 2016 | | | | | 38,206 | | | | 38,460,193 | |
Merlin Entertainment Group Luxembourg 2 S.a.r.l. | | | | | | | | | | |
Term Loan, 4.46%, Maturing July 21, 2017 | | | | | 13,045 | | | | 13,077,747 | |
Regal Cinemas, Inc. | | | | | | | | | | |
Term Loan, 3.24%, Maturing August 23, 2017 | | | | | 5,803 | | | | 5,829,069 | |
Revolution Studios Distribution Company, LLC | | | | | | | | | | |
Term Loan, 3.97%, Maturing December 21, 2014(6) | | | | | 4,214 | | | | 3,444,956 | |
SeaWorld Parks & Entertainment, Inc. | | | | | | | | | | |
Term Loan, 2.93%, Maturing February 17, 2016 | | | | | 5,885 | | | | 5,881,556 | |
Term Loan, 4.00%, Maturing August 17, 2017 | | | | | 21,641 | | | | 21,796,407 | |
| | | | | | | | | | |
| Borrower/Tranche Description | | | | Principal
Amount*
(000’s omitted) | | | Value | |
| | | | | | | | | | |
|
Leisure Goods / Activities / Movies (continued) | |
Six Flags Theme Parks, Inc. | | | | | | | | | | |
Term Loan, 4.25%, Maturing December 20, 2018 | | | | | 29,800 | | | $ | 30,032,678 | |
Town Sports International Inc. | | | | | | | | | | |
Term Loan, 5.75%, Maturing May 11, 2018 | | | | | 11,061 | | | | 11,195,695 | |
Warner Music Group Corp. | | | | | | | | | | |
Term Loan, Maturing October 25, 2018(3) | | | | | 6,125 | | | | 6,155,625 | |
Zuffa LLC | | | | | | | | | | |
Term Loan, 2.25%, Maturing June 19, 2015 | | | | | 10,751 | | | | 10,598,960 | |
Term Loan, 7.50%, Maturing June 19, 2015 | | | | | 1,990 | | | | 2,004,765 | |
| | | | | | | | | | | |
| | | $ | 330,770,030 | |
| | | | | | | | | | | |
|
Lodging and Casinos — 1.6% | |
Affinity Gaming, LLC | | | | | | | | | | |
Term Loan, 5.50%, Maturing November 9, 2017 | | | | | 5,075 | | | $ | 5,144,274 | |
Ameristar Casinos, Inc. | | | | | | | | | | |
Term Loan, 4.00%, Maturing April 16, 2018 | | | | | 5,503 | | | | 5,543,302 | |
Caesars Entertainment Operating Company | | | | | | | | | | |
Term Loan, 9.50%, Maturing October 31, 2016 | | | | | 9,725 | | | | 9,997,845 | |
Term Loan, 5.46%, Maturing January 26, 2018 | | | | | 49,603 | | | | 44,677,001 | |
Gala Group LTD | | | | | | | | | | |
Term Loan, 5.51%, Maturing May 30, 2018 | | GBP | | | 27,445 | | | | 41,653,474 | |
Isle of Capri Casinos, Inc. | | | | | | | | | | |
Term Loan, 4.75%, Maturing March 24, 2017 | | | | | 6,415 | | | | 6,478,929 | |
Las Vegas Sands LLC | | | | | | | | | | |
Term Loan, 2.72%, Maturing November 23, 2016 | | | | | 3,253 | | | | 3,252,658 | |
Term Loan, 2.72%, Maturing November 23, 2016 | | | | | 3,626 | | | | 3,626,103 | |
LodgeNet Entertainment Corporation | | | | | | | | | | |
Term Loan, 8.50%, Maturing April 4, 2014 | | | | | 6,104 | | | | 4,755,829 | |
Penn National Gaming, Inc. | | | | | | | | | | |
Term Loan, Maturing July 16, 2018(3) | | | | | 3,900 | | | | 3,923,158 | |
Pinnacle Entertainment, Inc. | | | | | | | | | | |
Term Loan, 4.00%, Maturing March 19, 2019 | | | | | 9,257 | | | | 9,314,396 | |
Quidnax AB | | | | | | | | | | |
Term Loan, 2.29%, Maturing April 27, 2015 | | EUR | | | 4,725 | | | | 5,613,436 | |
Term Loan, 2.79%, Maturing June 30, 2016 | | EUR | | | 4,725 | | | | 5,613,436 | |
| | | | | | | | | | | |
| | | $ | 149,593,841 | |
| | | | | | | | | | | |
|
Nonferrous Metals / Minerals — 1.4% | |
Arch Coal Inc. | | | | | | | | | | |
Term Loan, 5.75%, Maturing May 16, 2018 | | | | | 28,653 | | | $ | 28,919,748 | |
Fairmount Minerals LTD | | | | | | | | | | |
Term Loan, 5.25%, Maturing March 15, 2017 | | | | | 34,301 | | | | 34,353,144 | |
Noranda Aluminum Acquisition Corporation | | | | | | | | | | |
Term Loan, 5.75%, Maturing February 24, 2019 | | | | | 11,990 | | | | 12,117,141 | |
| | | | |
| | 30 | | See Notes to Financial Statements. |
Floating Rate Portfolio
October 31, 2012
Portfolio of Investments — continued
| | | | | | | | | | |
| Borrower/Tranche Description | | | | Principal
Amount*
(000’s omitted) | | | Value | |
| | | | | | | | | | |
|
Nonferrous Metals / Minerals (continued) | |
Novelis, Inc. | | | | | | | | | | |
Term Loan, 4.00%, Maturing March 10, 2017 | | | | | 7,920 | | | $ | 7,928,221 | |
Term Loan, 4.00%, Maturing March 10, 2017 | | | | | 15,506 | | | | 15,521,957 | |
Oxbow Carbon and Mineral Holdings LLC | | | | | | | | | | |
Term Loan, 3.71%, Maturing May 8, 2016 | | | | | 14,897 | | | | 14,952,914 | |
United Distribution Group, Inc. | | | | | | | | | | |
Term Loan, 7.50%, Maturing October 9, 2018 | | | | | 13,150 | | | | 12,689,750 | |
Term Loan - Second Lien, 12.50%, Maturing April 12, 2019 | | | | | 2,000 | | | | 1,910,000 | |
| | | | | | | | | | | |
| | | $ | 128,392,875 | |
| | | | | | | | | | | |
|
Oil and Gas — 3.0% | |
Buffalo Gulf Coast Terminals LLC | | | | | | | | | | |
Term Loan, 7.50%, Maturing October 31, 2017 | | | | | 6,806 | | | $ | 6,942,375 | |
Citgo Petroleum Corporation | | | | | | | | | | |
Term Loan, 8.00%, Maturing June 24, 2015 | | | | | 2,244 | | | | 2,262,340 | |
Term Loan, 9.00%, Maturing June 23, 2017 | | | | | 22,740 | | | | 23,180,668 | |
Crestwood Holdings LLC | | | | | | | | | | |
Term Loan, 9.75%, Maturing March 26, 2018 | | | | | 12,884 | | | | 13,077,723 | |
Energy Transfer Equity, L.P. | | | | | | | | | | |
Term Loan, 3.75%, Maturing March 24, 2017 | | | | | 31,825 | | | | 31,853,738 | |
Frac Tech International LLC | | | | | | | | | | |
Term Loan, 8.50%, Maturing May 6, 2016 | | | | | 16,965 | | | | 15,325,259 | |
Gibson Energy ULC | | | | | | | | | | |
Term Loan, 4.75%, Maturing June 15, 2018 | | | | | 24,436 | | | | 24,726,574 | |
MEG Energy Corp. | | | | | | | | | | |
Term Loan, 4.00%, Maturing March 16, 2018 | | | | | 20,825 | | | | 20,948,232 | |
Obsidian Natural Gas Trust | | | | | | | | | | |
Term Loan, 7.00%, Maturing November 2, 2015 | | | | | 29,252 | | | | 29,398,477 | |
Plains Exploration & Production | | | | | | | | | | |
Term Loan, Maturing September 13, 2019(3) | | | | | 27,575 | | | | 27,735,045 | |
Samson Investment Company | | | | | | | | | | |
Term Loan - Second Lien, 6.00%, Maturing September 13, 2018 | | | | | 9,200 | | | | 9,296,315 | |
Sheridan Production Partners I, LLC | | | | | | | | | | |
Term Loan, 5.00%, Maturing September 14, 2019 | | | | | 22,127 | | | | 22,161,495 | |
Term Loan, 5.00%, Maturing September 25, 2019 | | | | | 1,791 | | | | 1,793,679 | |
Term Loan, 5.00%, Maturing September 25, 2019 | | | | | 2,932 | | | | 2,936,578 | |
Tallgrass Energy Partners, LP | | | | | | | | | | |
Term Loan, Maturing October 25, 2018(3) | | | | | 24,300 | | | | 24,345,562 | |
Tervita Corporation | | | | | | | | | | |
Term Loan, 3.21%, Maturing November 14, 2014 | | | | | 3,045 | | | | 2,999,056 | |
Term Loan, 3.21%, Maturing November 14, 2014 | | | | | 17,305 | | | | 17,042,277 | |
Term Loan, 6.50%, Maturing November 14, 2014 | | | | | 6,476 | | | | 6,486,858 | |
| | | | | | | | | | | |
| | | $ | 282,512,251 | |
| | | | | | | | | | | |
| | | | | | | | | | |
| Borrower/Tranche Description | | | | Principal
Amount*
(000’s omitted) | | | Value | |
| | | | | | | | | | |
|
Publishing — 3.6% | |
Ascend Learning, Inc. | | | | | | | | | | |
Term Loan, 5.75%, Maturing May 23, 2017 | | | | | 21,939 | | | $ | 22,010,481 | |
Aster Zweite Beteiligungs GmbH | | | | | | | | | | |
Term Loan, 5.98%, Maturing December 31, 2013 | | | | | 19 | | | | 18,064 | |
Term Loan, 5.98%, Maturing December 31, 2013 | | | | | 33 | | | | 32,247 | |
Term Loan, 5.95%, Maturing December 31, 2014 | | EUR | | | 719 | | | | 910,659 | |
Term Loan, 5.95%, Maturing December 31, 2014 | | EUR | | | 1,235 | | | | 1,565,359 | |
Term Loan, 5.95%, Maturing December 31, 2014 | | EUR | | | 2,435 | | | | 3,085,301 | |
Term Loan, 5.97%, Maturing December 31, 2014 | | | | | 959 | | | | 935,678 | |
Term Loan, 5.97%, Maturing December 31, 2014 | | | | | 2,491 | | | | 2,430,930 | |
Term Loan, 5.97%, Maturing December 31, 2014 | | | | | 7,273 | | | | 7,096,865 | |
Term Loan, 5.97%, Maturing December 31, 2014 | | | | | 9,809 | | | | 9,571,514 | |
Term Loan, 5.97%, Maturing December 31, 2014 | | | | | 13,060 | | | | 12,744,842 | |
Black Press US Partnership | | | | | | | | | | |
Term Loan, 2.42%, Maturing August 2, 2013 | | | | | 784 | | | | 768,802 | |
Term Loan, 2.42%, Maturing August 2, 2013 | | | | | 1,292 | | | | 1,266,263 | |
Cengage Learning Acquisitions, Inc. | | | | | | | | | | |
Term Loan, 2.47%, Maturing July 3, 2014 | | | | | 23,816 | | | | 22,774,080 | |
GateHouse Media Operating, Inc. | | | | | | | | | | |
Term Loan, 2.22%, Maturing August 28, 2014 | | | | | 4,830 | | | | 1,667,577 | |
Term Loan, 2.22%, Maturing August 28, 2014 | | | | | 15,390 | | | | 5,313,388 | |
Term Loan, 2.47%, Maturing August 28, 2014 | | | | | 9,186 | | | | 3,171,624 | |
Getty Images, Inc. | | | | | | | | | | |
Term Loan, 4.75%, Maturing September 13, 2019 | | | | | 53,600 | | | | 53,894,800 | |
Instant Web, Inc. | | | | | | | | | | |
Term Loan, 3.59%, Maturing August 7, 2014 | | | | | 1,614 | | | | 1,259,149 | |
Term Loan, 3.59%, Maturing August 7, 2014 | | | | | 15,486 | | | | 12,078,947 | |
Interactive Data Corporation | | | | | | | | | | |
Term Loan, 4.50%, Maturing February 12, 2018 | | | | | 34,219 | | | | 34,480,043 | |
Laureate Education, Inc. | | | | | | | | | | |
Term Loan, 5.25%, Maturing June 18, 2018 | | | | | 65,723 | | | | 65,559,069 | |
MediaNews Group | | | | | | | | | | |
Term Loan, 8.50%, Maturing March 19, 2014 | | | | | 1,206 | | | | 1,176,167 | |
Merrill Communications, LLC | | | | | | | | | | |
Term Loan, 9.75%, Maturing December 24, 2012 | | | | | 11,854 | | | | 11,824,604 | |
Nelson Education Ltd. | | | | | | | | | | |
Term Loan, 2.86%, Maturing July 3, 2014 | | | | | 277 | | | | 235,032 | |
Newspaper Holdings Inc. | | | | | | | | | | |
Term Loan, 1.88%, Maturing July 24, 2014 | | | | | 17,191 | | | | 15,954,544 | |
Nielsen Finance LLC | | | | | | | | | | |
Term Loan, 3.47%, Maturing May 2, 2016 | | | | | 35,225 | | | | 35,438,626 | |
Term Loan, 3.97%, Maturing May 2, 2016 | | | | | 3,714 | | | | 3,737,206 | |
Source Interlink Companies, Inc. | | | | | | | | | | |
Term Loan, 10.75%, Maturing December 19, 2012 | | | | | 1,627 | | | | 1,631,890 | |
Term Loan, 15.00%, Maturing March 18, 2014(5)(6) | | | | | 1,868 | | | | 797,068 | |
| | | | |
| | 31 | | See Notes to Financial Statements. |
Floating Rate Portfolio
October 31, 2012
Portfolio of Investments — continued
| | | | | | | | | | |
| Borrower/Tranche Description | | | | Principal
Amount*
(000’s omitted) | | | Value | |
| | | | | | | | | | |
|
Publishing (continued) | |
Source Interlink Companies, Inc. (continued) | | | | | | | | | | |
Term Loan - Second Lien, 10.75%, Maturing June 18, 2013 | | | | | 3,981 | | | $ | 3,503,371 | |
Springer Science+Business Media S.A. | | | | | | | | | | |
Term Loan, 4.11%, Maturing July 21, 2016 | | EUR | | | 4,234 | | | | 5,493,807 | |
Star Tribune Company (The) | | | | | | | | | | |
Term Loan, 8.00%, Maturing September 28, 2014 | | | | | 631 | | | | 598,989 | |
Term Loan, 8.00%, Maturing September 29, 2014 | | | | | 841 | | | | 798,652 | |
| | | | | | | | | | | |
| | | $ | 343,825,638 | |
| | | | | | | | | | | |
|
Radio and Television — 2.8% | |
Clear Channel Communications, Inc. | | | | | | | | | | |
Term Loan, 3.86%, Maturing January 29, 2016 | | | | | 17,415 | | | $ | 14,468,130 | |
Cumulus Media Holdings Inc. | | | | | | | | | | |
Term Loan, 5.75%, Maturing September 17, 2018 | | | | | 51,910 | | | | 52,290,039 | |
Entercom Radio, LLC | | | | | | | | | | |
Term Loan, 6.25%, Maturing November 23, 2018 | | | | | 6,255 | | | | 6,298,785 | |
Foxco Acquisition Sub, LLC | | | | | | | | | | |
Term Loan, 5.50%, Maturing July 31, 2017 | | | | | 14,625 | | | | 14,844,722 | |
Gray Television, Inc. | | | | | | | | | | |
Term Loan, 4.51%, Maturing October 15, 2019(2) | | | | | 9,725 | | | | 9,785,781 | |
Hubbard Radio, LLC | | | | | | | | | | |
Term Loan, 5.25%, Maturing April 28, 2017 | | | | | 4,680 | | | | 4,715,150 | |
LIN Television Corp. | | | | | | | | | | |
Term Loan, 5.00%, Maturing December 21, 2018 | | | | | 6,923 | | | | 7,004,894 | |
Local TV Finance, LLC | | | | | | | | | | |
Term Loan, 4.22%, Maturing May 7, 2015 | | | | | 14,108 | | | | 14,178,662 | |
Mission Broadcasting, Inc. | | | | | | | | | | |
Term Loan, 5.00%, Maturing September 30, 2016 | | | | | 3,726 | | | | 3,735,791 | |
Nexstar Broadcasting, Inc. | | | | | | | | | | |
Term Loan, 5.00%, Maturing September 30, 2016 | | | | | 10,754 | | | | 10,780,465 | |
Radio One, Inc. | | | | | | | | | | |
Term Loan, 7.50%, Maturing March 31, 2016 | | | | | 9,806 | | | | 9,879,359 | |
Raycom TV Broadcasting, Inc. | | | | | | | | | | |
Term Loan, 4.25%, Maturing May 31, 2017 | | | | | 12,517 | | | | 12,453,980 | |
Sinclair Television Group Inc. | | | | | | | | | | |
Term Loan, 4.00%, Maturing October 28, 2016 | | | | | 8,719 | | | | 8,780,595 | |
Tyrol Acquisitions 2 SAS | | | | | | | | | | |
Term Loan, 4.11%, Maturing January 29, 2016(5) | | EUR | | | 5,051 | | | | 5,943,467 | |
Term Loan, 4.11%, Maturing January 29, 2016 | | EUR | | | 10,658 | | | | 12,541,765 | |
Term Loan, 4.11%, Maturing January 29, 2016 | | EUR | | | 10,658 | | | | 12,541,765 | |
Univision Communications Inc. | | | | | | | | | | |
Term Loan, 2.21%, Maturing September 29, 2014 | | | | | 6,249 | | | | 6,238,482 | |
Term Loan, 4.46%, Maturing March 31, 2017 | | | | | 46,397 | | | | 45,527,208 | |
| | | | | | | | | | |
| Borrower/Tranche Description | | | | Principal
Amount*
(000’s omitted) | | | Value | |
| | | | | | | | | | |
|
Radio and Television (continued) | |
Weather Channel | | | | | | | | | | |
Term Loan, 4.25%, Maturing February 13, 2017 | | | | | 15,662 | | | $ | 15,792,118 | |
| | | | | | | | | | | |
| | | $ | 267,801,158 | |
| | | | | | | | | | | |
|
Retailers (Except Food and Drug) — 3.6% | |
99 Cents Only Stores | | | | | | | | | | |
Term Loan, 5.25%, Maturing January 11, 2019 | | | | | 12,011 | | | $ | 12,169,919 | |
David’s Bridal, Inc. | | | | | | | | | | |
Term Loan, 5.00%, Maturing October 2, 2019 | | | | | 7,400 | | | | 7,397,691 | |
Evergreen Acqco 1 LP | | | | | | | | | | |
Term Loan, 5.00%, Maturing July 9, 2019 | | | | | 7,157 | | | | 7,189,863 | |
FTD, Inc. | | | | | | | | | | |
Term Loan, 4.75%, Maturing June 11, 2018 | | | | | 16,341 | | | | 16,442,488 | |
Harbor Freight Tools USA, Inc. | | | | | | | | | | |
Term Loan, 5.50%, Maturing November 14, 2017 | | | | | 9,701 | | | | 9,809,820 | |
J Crew Group, Inc. | | | | | | | | | | |
Term Loan, 4.75%, Maturing March 7, 2018 | | | | | 40,453 | | | | 40,543,501 | |
Jo-Ann Stores, Inc. | | | | | | | | | | |
Term Loan, 4.75%, Maturing March 16, 2018 | | | | | 22,742 | | | | 22,778,472 | |
Michaels Stores, Inc. | | | | | | | | | | |
Term Loan, 4.91%, Maturing July 29, 2016 | | | | | 4,629 | | | | 4,677,978 | |
Term Loan, 4.91%, Maturing July 29, 2016 | | | | | 21,592 | | | | 21,821,718 | |
National Vision, Inc. | | | | | | | | | | |
Term Loan, 7.00%, Maturing August 2, 2018 | | | | | 8,554 | | | | 8,681,866 | |
Neiman Marcus Group, Inc. (The) | | | | | | | | | | |
Term Loan, 4.75%, Maturing May 16, 2018 | | | | | 41,075 | | | | 41,247,720 | |
Ollie’s Bargain Outlet, Inc. | | | | | | | | | | |
Term Loan, 6.25%, Maturing September 27, 2019 | | | | | 5,350 | | | | 5,370,063 | |
Pep Boys-Manny, Moe & Jack (The) | | | | | | | | | | |
Term Loan, 5.00%, Maturing October 17, 2018 | | | | | 5,100 | | | | 5,142,498 | |
Petco Animal Supplies, Inc. | | | | | | | | | | |
Term Loan, 4.50%, Maturing November 24, 2017 | | | | | 34,692 | | | | 34,911,995 | |
Pilot Travel Centers LLC | | | | | | | | | | |
Term Loan, 3.75%, Maturing March 30, 2018 | | | | | 11,692 | | | | 11,767,457 | |
Term Loan, 4.25%, Maturing August 7, 2019 | | | | | 3,950 | | | | 3,983,330 | |
ServiceMaster Company | | | | | | | | | | |
Term Loan, 4.46%, Maturing January 31, 2017 | | | | | 32,539 | | | | 32,725,931 | |
Visant Holding Corp. | | | | | | | | | | |
Term Loan, 5.25%, Maturing December 22, 2016 | | | | | 20,266 | | | | 19,578,161 | |
Vivarte SA | | | | | | | | | | |
Term Loan, 2.42%, Maturing March 9, 2015 | | EUR | | | 86 | | | | 90,296 | |
Term Loan, 2.42%, Maturing March 9, 2015 | | EUR | | | 336 | | | | 351,118 | |
Term Loan, 2.42%, Maturing March 9, 2015 | | EUR | | | 9,880 | | | | 10,315,146 | |
Term Loan, 2.92%, Maturing March 8, 2016 | | EUR | | | 86 | | | | 90,287 | |
| | | | |
| | 32 | | See Notes to Financial Statements. |
Floating Rate Portfolio
October 31, 2012
Portfolio of Investments — continued
| | | | | | | | | | |
| Borrower/Tranche Description | | | | Principal
Amount*
(000’s omitted) | | | Value | |
| | | | | | | | | | |
|
Retailers (Except Food and Drug) (continued) | |
Vivarte SA (continued) | | | | | | | | | | |
Term Loan, 2.92%, Maturing March 8, 2016 | | EUR | | | 336 | | | $ | 351,118 | |
Term Loan, 2.92%, Maturing March 8, 2016 | | EUR | | | 9,880 | | | | 10,315,146 | |
Term Loan - Second Lien, 3.92%, Maturing September 8, 2016 | | EUR | | | 13 | | | | 11,773 | |
Term Loan - Second Lien, 3.92%, Maturing September 8, 2016 | | EUR | | | 88 | | | | 82,414 | |
Term Loan - Second Lien, 3.92%, Maturing September 8, 2016 | | EUR | | | 900 | | | | 847,682 | |
Wilton Brands LLC | | | | | | | | | | |
Term Loan, 7.50%, Maturing August 30, 2018 | | | | | 6,850 | | | | 6,922,781 | |
| | | | | | | | | | | |
| | | $ | 335,618,232 | |
| | | | | | | | | | | |
|
Steel — 1.4% | |
Essar Steel Algoma, Inc. | | | | | | | | | | |
Term Loan, 8.75%, Maturing September 19, 2014 | | | | | 16,425 | | | $ | 16,630,312 | |
FMG America Finance, Inc. | | | | | | | | | | |
Term Loan, 5.25%, Maturing October 18, 2017 | | | | | 65,725 | | | | 65,560,687 | |
JMC Steel Group, Inc. | | | | | | | | | | |
Term Loan, 4.75%, Maturing April 3, 2017 | | | | | 23,029 | | | | 23,316,894 | |
Patriot Coal Corporation | | | | | | | | | | |
Term Loan, 9.25%, Maturing October 4, 2013 | | | | | 8,925 | | | | 8,991,938 | |
SunCoke Energy, Inc. | | | | | | | | | | |
Term Loan, 4.00%, Maturing July 26, 2018 | | | | | 7,779 | | | | 7,817,951 | |
Waupaca Foundry, Inc. | | | | | | | | | | |
Term Loan, 8.50%, Maturing June 29, 2017 | | | | | 6,863 | | | | 6,948,914 | |
WireCo WorldGroup, Inc. | | | | | | | | | | |
Term Loan, 6.00%, Maturing February 15, 2017 | | | | | 6,825 | | | | 6,910,313 | |
| | | | | | | | | | | |
| | | $ | 136,177,009 | |
| | | | | | | | | | | |
|
Surface Transport — 1.1% | |
Hertz Corporation (The) | | | | | | | | | | |
Term Loan, 3.75%, Maturing March 9, 2018 | | | | | 29,150 | | | $ | 29,040,688 | |
Term Loan, 3.75%, Maturing March 9, 2018 | | | | | 30,380 | | | | 30,347,096 | |
Term Loan, Maturing March 11, 2018(3) | | | | | 25,200 | | | | 25,152,750 | |
Swift Transportation Co. Inc. | | | | | | | | | | |
Term Loan, 3.96%, Maturing December 21, 2016 | | | | | 1,227 | | | | 1,233,533 | |
Term Loan, 5.00%, Maturing December 21, 2017 | | | | | 21,538 | | | | 21,712,960 | |
| | | | | | | | | | | |
| | | $ | 107,487,027 | |
| | | | | | | | | | | |
|
Telecommunications — 3.8% | |
Alaska Communications Systems Holdings, Inc. | | | | | | | | | | |
Term Loan, 5.50%, Maturing October 21, 2016 | | | | | 13,976 | | | $ | 12,980,268 | |
Cellular South, Inc. | | | | | | | | | | |
Term Loan, 4.50%, Maturing July 27, 2017 | | | | | 6,838 | | | | 6,855,534 | |
| | | | | | | | | | |
| Borrower/Tranche Description | | | | Principal
Amount*
(000’s omitted) | | | Value | |
| | | | | | | | | | |
|
Telecommunications (continued) | |
Cricket Communications, Inc. | | | | | | | | | | |
Term Loan, 4.75%, Maturing October 10, 2019 | | | | | 11,425 | | | $ | 11,496,406 | |
Crown Castle International Corporation | | | | | | | | | | |
Term Loan, 4.00%, Maturing January 31, 2019 | | | | | 16,900 | | | | 17,016,988 | |
Eircom Finco S.a.r.l. | | | | | | | | | | |
Term Loan, 4.27%, Maturing September 30, 2017 | | EUR | | | 9,155 | | | | 8,478,442 | |
Intelsat Jackson Holdings Ltd. | | | | | | | | | | |
Term Loan, 4.50%, Maturing April 2, 2018 | | | | | 94,608 | | | | 95,444,270 | |
IPC Systems, Inc. | | | | | | | | | | |
Term Loan, 2.85%, Maturing May 31, 2014 | | GBP | | | 262 | | | | 414,413 | |
Macquarie UK Broadcast Limited | | | | | | | | | | |
Term Loan, 2.75%, Maturing July 1, 2014 | | GBP | | | 6,000 | | | | 9,198,370 | |
Term Loan, 3.00%, Maturing December 1, 2014 | | GBP | | | 14,352 | | | | 21,925,682 | |
MetroPCS Wireless, Inc. | | | | | | | | | | |
Term Loan, 4.07%, Maturing November 3, 2016 | | | | | 1,984 | | | | 1,990,893 | |
Term Loan, 4.00%, Maturing March 16, 2018 | | | | | 79,674 | | | | 79,989,192 | |
Midcontinent Communications | | | | | | | | | | |
Term Loan, 4.00%, Maturing December 30, 2016 | | | | | 8,717 | | | | 8,716,665 | |
NTELOS Inc. | | | | | | | | | | |
Term Loan, 4.00%, Maturing August 7, 2015 | | | | | 2,912 | | | | 2,924,298 | |
Oberthur Technologies Holding SAS | | | | | | | | | | |
Term Loan, 6.25%, Maturing March 30, 2019 | | | | | 3,700 | | | | 3,688,437 | |
SBA Finance | | | | | | | | | | |
Term Loan, 3.75%, Maturing June 29, 2018 | | | | | 9,507 | | | | 9,536,698 | |
Term Loan, 3.75%, Maturing September 27, 2019 | | | | | 4,725 | | | | 4,754,531 | |
Syniverse Holdings, Inc. | | | | | | | | | | |
Term Loan, 5.00%, Maturing April 23, 2019 | | | | | 21,895 | | | | 22,031,970 | |
Telesat LLC | | | | | | | | | | |
Term Loan, 4.25%, Maturing March 28, 2019 | | | | | 34,688 | | | | 34,887,519 | |
Windstream Corporation | | | | | | | | | | |
Term Loan, 4.00%, Maturing August 8, 2019 | | | | | 10,025 | | | | 10,100,062 | |
| | | | | | | | | | | |
| | | $ | 362,430,638 | |
| | | | | | | | | | | |
|
Utilities — 2.2% | |
AES Corporation | | | | | | | | | | |
Term Loan, 4.25%, Maturing June 1, 2018 | | | | | 27,587 | | | $ | 27,794,036 | |
Calpine Corporation | | | | | | | | | | |
Term Loan, 4.50%, Maturing April 2, 2018 | | | | | 9,655 | | | | 9,698,214 | |
Term Loan, 4.50%, Maturing April 2, 2018 | | | | | 35,753 | | | | 35,891,071 | |
Term Loan, 4.50%, Maturing September 27, 2019 | | | | | 9,275 | | | | 9,305,144 | |
Covanta Energy Corporation | | | | | | | | | | |
Term Loan, 4.00%, Maturing March 28, 2019 | | | | | 4,776 | | | | 4,793,910 | |
Dynegy Midwest Generation LLC | | | | | | | | | | |
Term Loan, 9.25%, Maturing August 4, 2016 | | | | | 9,411 | | | | 9,787,651 | |
| | | | |
| | 33 | | See Notes to Financial Statements. |
Floating Rate Portfolio
October 31, 2012
Portfolio of Investments — continued
| | | | | | | | | | |
| Borrower/Tranche Description | | | | Principal
Amount*
(000’s omitted) | | | Value | |
| | | | | | | | | | |
|
Utilities (continued) | |
Dynegy Power, LLC | | | | | | | | | | |
Term Loan, 9.25%, Maturing August 4, 2016 | | | | | 12,672 | | | $ | 13,269,966 | |
Invenergy LLC | | | | | | | | | | |
Term Loan, 9.00%, Maturing November 21, 2017 | | | | | 8,652 | | | | 8,716,551 | |
LSP Madison Funding, LLC | | | | | | | | | | |
Term Loan, 5.50%, Maturing June 28, 2019 | | | | | 12,120 | | | | 12,240,821 | |
NRG Energy, Inc. | | | | | | | | | | |
Term Loan, 4.00%, Maturing July 2, 2018 | | | | | 34,582 | | | | 34,828,749 | |
Texas Competitive Electric Holdings Company, LLC | | | | | | | | | | |
Term Loan, 4.75%, Maturing October 10, 2017 | | | | | 56,613 | | | | 36,798,188 | |
| | | | | | | | | | | |
| | | $ | 203,124,301 | |
| | | | | | | | | | | |
| | | |
Total Senior Floating-Rate Interests
(identified cost $8,671,318,323) | | | | | | | | $ | 8,684,955,274 | |
| | | | | | | | | | | |
|
| Corporate Bonds & Notes — 3.4% | |
| | | |
| | | | | | | | | | |
| Security | | | | Principal
Amount*
(000’s omitted) | | | Value | |
|
Broadcast Radio and Television — 0.0%(4) | |
Entravision Communications Corp., Sr. Notes | | | | | | | | | | |
8.75%, 8/1/17 | | | | | 2,844 | | | $ | 3,089,295 | |
| | | | | | | | | | | |
| | | $ | 3,089,295 | |
| | | | | | | | | | | |
|
Building and Development — 0.0%(4) | |
Calcipar SA, Sr. Notes | | | | | | | | | | |
6.875%, 5/1/18(7) | | | | | 4,000 | | | $ | 4,030,000 | |
| | | | | | | | | | | |
| | | $ | 4,030,000 | |
| | | | | | | | | | | |
|
Chemicals and Plastics — 0.5% | |
Hexion US Finance Corp., Sr. Notes | | | | | | | | | | |
6.625%, 4/15/20 | | | | | 2,000 | | | $ | 2,005,000 | |
Ineos Finance PLC, Sr. Notes | | | | | | | | | | |
7.25%, 2/15/19(7)(8) | | EUR | | | 8,000 | | | | 10,602,502 | |
8.375%, 2/15/19(7) | | | | | 15,250 | | | | 16,069,687 | |
7.50%, 5/1/20(7) | | | | | 9,525 | | | | 9,691,688 | |
Polymer Group, Inc., Sr. Notes | | | | | | | | | | |
7.75%, 2/1/19 | | | | | 5,000 | | | | 5,375,000 | |
| | | | | | | | | | | |
| | | $ | 43,743,877 | |
| | | | | | | | | | | |
| | | | | | | | | | |
| Security | | | | Principal
Amount*
(000’s omitted) | | | Value | |
| | | | | | | | | | |
|
Containers and Glass Products — 0.5% | |
Reynolds Group Holdings, Inc., Sr. Notes | | | | | | | | | | |
5.75%, 10/15/20(7) | | | | | 42,000 | | | $ | 42,525,000 | |
Smurfit Kappa Acquisitions, Sr. Notes | | | | | | | | | | |
4.875%, 9/15/18(7) | | | | | 4,925 | | | | 4,943,469 | |
| | | | | | | | | | | |
| | | $ | 47,468,469 | |
| | | | | | | | | | | |
|
Diversified Manufacturing Operations — 0.1% | |
Matalan Finance PLC, Sr. Notes | | | | | | | | | | |
8.875%, 4/29/16(9) | | GBP | | | 6,500 | | | $ | 10,515,593 | |
| | | | | | | | | | | |
| | | $ | 10,515,593 | |
| | | | | | | | | | | |
|
Ecological Services and Equipment — 0.0%(4) | |
Environmental Systems Product Holdings, Inc., Jr. Notes | | | | | | | | |
18.00%, 3/31/15(5)(6) | | | 184 | | | $ | 156,179 | |
| | | | | | | | | | | |
| | | $ | 156,179 | |
| | | | | | | | | | | |
|
Electronics / Electrical — 0.0%(4) | |
NXP BV/NXP Funding, LLC | | | | | | | | | | |
3.09%, 10/15/13(8) | | | | | 75 | | | $ | 75,188 | |
| | | | | | | | | | | |
| | | $ | 75,188 | |
| | | | | | | | | | | |
|
Equipment Leasing — 0.1% | |
International Lease Finance Corp., Sr. Notes | | | | | | | | | | |
6.75%, 9/1/16(7) | | | | | 2,325 | | | $ | 2,638,875 | |
7.125%, 9/1/18(7) | | | | | 2,325 | | | | 2,743,500 | |
| | | | | | | | | | | |
| | | $ | 5,382,375 | |
| | | | | | | | | | | |
|
Financial Intermediaries — 0.4% | |
First Data Corp., Sr. Notes | | | | | | | | | | |
6.75%, 11/1/20(7) | | | | | 16,850 | | | $ | 16,934,250 | |
UPCB Finance II, Ltd., Sr. Notes | | | | | | | | | | |
6.375%, 7/1/20(7) | | EUR | | | 6,500 | | | | 8,761,970 | |
6.625%, 7/1/20(7) | | | | | 9,000 | | | | 9,675,000 | |
| | | | | | | | | | | |
| | | $ | 35,371,220 | |
| | | | | | | | | | | |
|
Health Care — 0.4% | |
Accellent, Inc., Sr. Notes | | | | | | | | | | |
8.375%, 2/1/17 | | | | | 3,000 | | | $ | 3,082,500 | |
CHS/Community Health Systems, Inc., Sr. Notes | | | | | | | | | | |
5.125%, 8/15/18 | | | | | 22,625 | | | | 23,530,000 | |
| | | | |
| | 34 | | See Notes to Financial Statements. |
Floating Rate Portfolio
October 31, 2012
Portfolio of Investments — continued
| | | | | | | | | | |
| Security | | | | Principal
Amount*
(000’s omitted) | | | Value | |
| | | | | | | | | | |
|
Health Care (continued) | |
HCA, Inc., Sr. Notes | | | | | | | | | | |
4.75%, 5/1/23 | | | | | 11,975 | | | $ | 12,004,937 | |
| | �� | | | | | | | | | |
| | | $ | 38,617,437 | |
| | | | | | | | | | | |
|
Insurance — 0.1% | |
CNO Financial Group, Inc., Sr. Notes | | | | | | | | | | |
6.375%, 10/1/20(7) | | | | | 7,250 | | | $ | 7,540,000 | |
| | | | | | | | | | | |
| | | $ | 7,540,000 | |
| | | | | | | | | | | |
|
Leisure Goods / Activities / Movies — 0.2% | |
NAI Entertainment Holdings, LLC, Sr. Notes | | | | | | | | | | |
8.25%, 12/15/17(7) | | | | | 6,750 | | | $ | 7,543,125 | |
National CineMedia, LLC, Sr. Notes | | | | | | | | | | |
6.00%, 4/15/22(7) | | | | | 8,250 | | | | 8,745,000 | |
| | | | | | | | | | | |
| | | $ | 16,288,125 | |
| | | | | | | | | | | |
|
Lodging and Casinos — 0.3% | |
Caesars Entertainment Operating Co., Inc., Sr. Notes | | | | | | | | | | |
8.50%, 2/15/20(7) | | | | | 25,250 | | | $ | 24,871,250 | |
| | | | | | | | | | | |
| | | $ | 24,871,250 | |
| | | | | | | | | | | |
|
Radio and Television — 0.1% | |
Clear Channel Communications, Inc., Sr. Notes | | | | | | | | | | |
9.00%, 12/15/19(7) | | | | | 5,219 | | | $ | 4,723,195 | |
Univision Communications, Inc., Sr. Notes | | | | | | | | | | |
6.75%, 9/15/22(7) | | | | | 9,000 | | | | 9,045,000 | |
| | | | | | | | | | | |
| | | $ | 13,768,195 | |
| | | | | | | | | | | |
|
Telecommunications — 0.1% | |
Hughes Satellite Systems Corp., Sr. Notes | | | | | | | | | | |
6.50%, 6/15/19 | | | | | 8,500 | | | $ | 9,137,500 | |
Sunrise Communications International SA, Sr. Notes | | | | | | | | | | |
4.971%, 12/31/17(7)(8) | | EUR | | | 3,000 | | | | 3,966,217 | |
| | | | | | | | | | | |
| | | $ | 13,103,717 | |
| | | | | | | | | | | |
|
Utilities — 0.6% | |
Calpine Corp., Sr. Notes | | | | | | | | | | |
7.50%, 2/15/21(7) | | | | | 25,380 | | | $ | 27,727,650 | |
7.875%, 1/15/23(7) | | | | | 23,490 | | | | 26,073,900 | |
| | | | | | | | | | | |
| | | $ | 53,801,550 | |
| | | | | | | | | | | |
| | | |
Total Corporate Bonds & Notes
(identified cost $303,934,513) | | | | | | | | $ | 317,822,470 | |
| | | | | | | | | | | |
| | | | | | | | | | |
| Asset-Backed Securities — 0.1% | |
| | | |
| | | | | | | | | | |
| Security | | | | Principal
Amount
(000’s omitted) | | | Value | |
| | | | | | | | | | |
Alzette European CLO SA, Series 2004-1A, Class E2, 6.968%, 12/15/20(8) | | | | $ | 465 | | | $ | 414,531 | |
Avalon Capital Ltd. 3, Series 1A, Class D, 2.381%, 2/24/19(7)(8) | | | | | 884 | | | | 790,071 | |
Babson Ltd., Series 2005-1A, Class C1, 2.29%, 4/15/19(7)(8) | | | | | 1,129 | | | | 975,942 | |
Centurion CDO 8 Ltd., Series 2005-8A, Class D, 5.908%, 3/8/17(8) | | | | | 985 | | | | 961,052 | |
Morgan Stanley Investment Management Croton, Ltd., Series 2005-1A, Class D, 2.29%, 1/15/18(7)(8) | | | | | 2,000 | | | | 1,676,921 | |
| | | | | | | | | | | |
| | | |
Total Asset-Backed Securities
(identified cost $5,438,534) | | | | | | | | $ | 4,818,517 | |
| | | | | | | | | | | |
|
| Common Stocks — 0.5% | |
| | | |
| | | | | | | | | | |
| Security | | | | Shares | | | Value | |
|
Automotive — 0.0%(4) | |
Dayco Products, LLC(6)(10)(11) | | | | | 88,506 | | | $ | 2,256,903 | |
| | | | | | | | | | | |
| | | $ | 2,256,903 | |
| | | | | | | | | | | |
|
Building and Development — 0.0%(4) | |
United Subcontractors, Inc.(6) (10)(11) | | | | | 3,646 | | | $ | 151,972 | |
| | | | | | | | | | | |
| | | $ | 151,972 | |
| | | | | | | | | | | |
|
Ecological Services and Equipment — 0.0%(4) | |
Environmental Systems Products Holdings, Inc.(6)(10)(12) | | | | | 2,484 | | | $ | 179,419 | |
| | | | | | | | | | | |
| | | $ | 179,419 | |
| | | | | | | | | | | |
|
Financial Intermediaries — 0.0%(4) | |
RTS Investor Corp.(6)(10)(11) | | | | | 692 | | | $ | 66,112 | |
| | | | | | | | | | | |
| | | $ | 66,112 | |
| | | | | | | | | | | |
|
Food Service — 0.0%(4) | |
Buffets Restaurants Holdings, Inc.(6)(10)(11) | | | | | 329,120 | | | $ | 2,978,536 | |
| | | | | | | | | | | |
| | | $ | 2,978,536 | |
| | | | | | | | | | | |
|
Home Furnishings — 0.0%(4) | |
Oreck Corp.(6) (10)(11) | | | | | 14,217 | | | $ | 247,234 | |
Sanitec Europe Oy B Units(6)(10)(11) | | | | | 235,094 | | | | 1,477,877 | |
Sanitec Europe Oy E Units(6)(10)(11) | | | | | 230,960 | | | | 0 | |
| | | | | | | | | | | |
| | | $ | 1,725,111 | |
| | | | | | | | | | | |
| | | | |
| | 35 | | See Notes to Financial Statements. |
Floating Rate Portfolio
October 31, 2012
Portfolio of Investments — continued
| | | | | | | | | | |
| Security | | | | Shares | | | Value | |
| | | | | | | | | | |
|
Leisure Goods / Activities / Movies — 0.2% | |
Metro-Goldwyn-Mayer Holdings, Inc.(10)(11) | | | | | 414,634 | | | $ | 13,203,522 | |
| | | | | | | | | | | |
| | | $ | 13,203,522 | |
| | | | | | | | | | | |
|
Lodging and Casinos — 0.0%(4) | |
Affinity Gaming, LLC(10)(11) | | | | | 206,125 | | | $ | 2,336,079 | |
| | | | | | | | | | | |
| | | $ | 2,336,079 | |
| | | | | | | | | | | |
|
Publishing — 0.2% | |
Ion Media Networks, Inc.(6)(11) | | | | | 28,605 | | | $ | 18,192,780 | |
MediaNews Group, Inc.(6)(10)(11) | | | | | 162,730 | | | | 3,414,074 | |
Source Interlink Companies, Inc.(6)(10)(11) | | | | | 5,725 | | | | 0 | |
| | | | | | | | | | | |
| | | $ | 21,606,854 | |
| | | | | | | | | | | |
|
Radio and Television — 0.1% | |
New Young Broadcasting Holding Co., Inc.(6)(10)(11) | | | | | 2,310 | | | $ | 8,316,000 | |
| | | | | | | | | | | |
| | | $ | 8,316,000 | |
| | | | | | | | | | | |
| | | |
Total Common Stocks
(identified cost $32,014,031) | | | | | | | | $ | 52,820,508 | |
| | | | | | | | | | | |
|
| Preferred Stocks — 0.0%(4) | |
| | | |
| | | | | | | | | | |
| Security | | | | Shares | | | Value | |
|
Ecological Services and Equipment — 0.0%(4) | |
Environmental Systems Products Holdings, Inc., Series A(6)(10)(12) | | | | | 569 | | | $ | 35,847 | |
| | | | | | | | | | | |
| | | |
Total Preferred Stocks
(identified cost $9,958) | | | | | | | | $ | 35,847 | |
| | | | | | | | | | | |
| | | |
| Warrants — 0.0%(4) | | | | | | | | | | |
| | | |
| | | | | | | | | | |
| Security | | | | Shares | | | Value | |
|
Radio and Television — 0.0%(4) | |
New Young Broadcasting Holding Co., Inc., Expires 12/24/24(6)(10)(11) | | | | | 112 | | | $ | 403,200 | |
| | | | | | | | | | | |
| | | $ | 403,200 | |
| | | | | | | | | | | |
|
Telecommunications — 0.0% | |
ERC Luxembourg Holdings, Ltd., Expires 06/11/32(6)(10)(11) | | | | | 21,381 | | | $ | 0 | |
| | | | | | | | | | | |
| | | $ | 0 | |
| | | | | | | | | | | |
| | | |
Total Warrants
(identified cost $192,476) | | | | | | | | $ | 403,200 | |
| | | | | | | | | | | |
| | | | | | | | | | |
| Short-Term Investments — 6.7% | |
| | | |
| | | | | | | | | | |
| Description | | | | Interest
(000’s omitted) | | | Value | |
| | | | | | | | | | |
Eaton Vance Cash Reserves Fund, LLC, 0.12%(13) | | | | $ | 631,913 | | | $ | 631,913,170 | |
| | | | | | | | | | | |
| | | |
Total Short-Term Investments
(identified cost $631,913,170) | | | | | | | | $ | 631,913,170 | |
| | | | | | | | | | | |
| | | |
Total Investments — 102.8%
(identified cost $9,644,821,005) | | | | | | | | $ | 9,692,768,986 | |
| | | | | | | | | | | |
| | | |
Less Unfunded Loan Commitments — (0.3)% | | | | | | | | $ | (22,317,946 | ) |
| | | | | | | | | | | |
| | | |
Net Investments — 102.5%
(identified cost $9,622,503,059) | | | | | | | | $ | 9,670,451,040 | |
| | | | | | | | | | | |
| | | |
Other Assets, Less Liabilities — (2.5)% | | | | | | | | $ | (237,610,214 | ) |
| | | | | | | | | | | |
| | | |
Net Assets — 100.0% | | | | | | | | $ | 9,432,840,826 | |
| | | | | | | | | | | |
The percentage shown for each investment category in the Portfolio of Investments is based on net assets.
| | | | |
| EUR | | – | | Euro |
| GBP | | – | | British Pound Sterling |
| | * | In U.S. dollars unless otherwise indicated. |
| | (1) | Senior floating-rate interests (Senior Loans) often require prepayments from excess cash flows or permit the borrowers to repay at their election. The degree to which borrowers repay, whether as a contractual requirement or at their election, cannot be predicted with accuracy. As a result, the actual remaining maturity May be substantially less than the stated maturities shown. However, Senior Loans will have an expected average life of approximately two to four years. The stated interest rate represents the weighted average interest rate of all contracts within the senior loan facility and includes commitment fees on unfunded loan commitments, if any. Senior Loans typically have rates of interest which are redetermined either daily, monthly, quarterly or semi-annually by reference to a base lending rate, plus a premium. These base lending rates are primarily the London Interbank Offered Rate (“LIBOR”) and secondarily, the prime rate offered by one or more major United States banks (the “Prime Rate”) and the certificate of deposit (“CD”) rate or other base lending rates used by commercial lenders. |
| | (2) | Unfunded or partially unfunded loan commitments. The Portfolio May enter into certain credit agreements all or a portion of which May be unfunded. The Portfolio is obligated to fund these commitments at the borrower’s discretion. See Note 1G for description. |
| | (3) | This Senior Loan will settle after October 31, 2012, at which time the interest rate will be determined. |
| | (4) | Amount is less than 0.05%. |
| | (5) | Represents a payment-in-kind security which May pay all or a portion of interest in additional par. |
| | (6) | For fair value measurement disclosure purposes, security is categorized as Level 3 (see Note 10). |
| | (7) | Security exempt from registration pursuant to Rule 144A under the Securities Act of 1933. These securities May be sold in certain |
| | | | |
| | 36 | | See Notes to Financial Statements. |
Floating Rate Portfolio
October 31, 2012
Portfolio of Investments — continued
| | transactions (normally to qualified institutional buyers) and remain exempt from registration. At October 31, 2012, the aggregate value of these securities is $252,294,212 or 2.7% of the Portfolio’s net assets. |
| | (8) | Variable rate security. The stated interest rate represents the rate in effect at October 31, 2012. |
| | (9) | Security exempt from registration under Regulation S of the Securities Act of 1933, which exempts from registration securities offered and sold outside the United States. Security May not be offered or sold in the United States except pursuant to an exemption from, or in a transaction not subject to, the registration requirements of the Securities Act of 1933. |
| (10) | Non-income producing security. |
| (11) | Security was acquired in connection with a restructuring of a Senior Loan and May be subject to restrictions on resale. |
| (12) | Restricted security (see Note 5). |
| (13) | Affiliated investment company available to Eaton Vance portfolios and funds which invests in high quality, U.S. dollar denominated money market instruments. The rate shown is the annualized seven-day yield as of October 31, 2012. |
| | | | |
| | 37 | | See Notes to Financial Statements. |
Floating Rate Portfolio
October 31, 2012
Statement of Assets and Liabilities
| | | | |
| Assets | | October 31, 2012 | |
Unaffiliated investments, at value (identified cost, $8,990,589,889) | | $ | 9,038,537,870 | |
Affiliated investment, at value (identified cost, $631,913,170) | | | 631,913,170 | |
Cash | | | 37,130,183 | |
Restricted cash* | | | 13,554,205 | |
Foreign currency, at value (identified cost, $13,651,438) | | | 13,663,520 | |
Interest receivable | | | 33,060,102 | |
Interest receivable from affiliated investment | | | 70,003 | |
Receivable for investments sold | | | 42,668,186 | |
Receivable for open forward foreign currency exchange contracts | | | 94,937 | |
Receivable for closed swap contracts | | | 35,306 | |
Prepaid expenses | | | 530,797 | |
Total assets | | $ | 9,811,258,279 | |
| |
| Liabilities | | | | |
Payable for investments purchased | | $ | 365,093,937 | |
Payable for open forward foreign currency exchange contracts | | | 5,193,917 | |
Payable for open swap contracts | | | 3,803,787 | |
Payable to affiliates: | | | | |
Investment adviser fee | | | 3,966,637 | |
Trustees’ fees | | | 5,663 | |
Accrued expenses | | | 353,512 | |
Total liabilities | | $ | 378,417,453 | |
Net Assets applicable to investors’ interest in Portfolio | | $ | 9,432,840,826 | |
| |
| Sources of Net Assets | | | | |
Investors’ capital | | $ | 9,391,946,290 | |
Net unrealized appreciation | | | 40,894,536 | |
Total | | $ | 9,432,840,826 | |
| * | Represents restricted cash on deposit at the custodian as collateral for open financial contracts. |
| | | | |
| | 38 | | See Notes to Financial Statements. |
Floating Rate Portfolio
October 31, 2012
Statement of Operations
| | | | |
| Investment Income | | Year Ended
October 31, 2012 | |
Interest and other income | | $ | 484,896,737 | |
Dividends | | | 5,990,143 | |
Interest allocated from affiliated investment | | | 446,890 | |
Expenses allocated from affiliated investment | | | (59,158 | ) |
Total investment income | | $ | 491,274,612 | |
| |
| Expenses | | | | |
Investment adviser fee | | $ | 46,845,003 | |
Trustees’ fees and expenses | | | 69,455 | |
Custodian fee | | | 1,841,306 | |
Legal and accounting services | | | 459,434 | |
Miscellaneous | | | 1,290,439 | |
Total expenses | | $ | 50,505,637 | |
Deduct — | | | | |
Reduction of custodian fee | | $ | 128 | |
Total expense reductions | | $ | 128 | |
| |
Net expenses | | $ | 50,505,509 | |
| |
Net investment income | | $ | 440,769,103 | |
| |
| Realized and Unrealized Gain (Loss) | | | | |
Net realized gain (loss) — | | | | |
Investment transactions | | $ | 33,033,340 | |
Investment transactions allocated from affiliated investment | | | 7,041 | |
Swap contracts | | | (1,111,685 | ) |
Foreign currency and forward foreign currency exchange contract transactions | | | 31,101,240 | |
Net realized gain | | $ | 63,029,936 | |
Change in unrealized appreciation (depreciation) — | | | | |
Investments | | $ | 194,665,096 | |
Swap contracts | | | (1,007,489 | ) |
Foreign currency and forward foreign currency exchange contracts | | | (8,718,195 | ) |
Net change in unrealized appreciation (depreciation) | | $ | 184,939,412 | |
| |
Net realized and unrealized gain | | $ | 247,969,348 | |
| |
Net increase in net assets from operations | | $ | 688,738,451 | |
| | | | |
| | 39 | | See Notes to Financial Statements. |
Floating Rate Portfolio
October 31, 2012
Statements of Changes in Net Assets
| | | | | | | | |
| | | Year Ended October 31, | |
| Increase (Decrease) in Net Assets | | 2012 | | | 2011 | |
From operations — | | | | | | | | |
Net investment income | | $ | 440,769,103 | | | $ | 397,412,294 | |
Net realized gain (loss) from investment transactions, swap contracts and foreign currency and forward foreign currency exchange contract transactions | | | 63,029,936 | | | | (18,065,295 | ) |
Net change in unrealized appreciation (depreciation) from investments, swap contracts, foreign currency and forward foreign currency exchange contracts | | | 184,939,412 | | | | (100,433,238 | ) |
Net increase in net assets from operations | | $ | 688,738,451 | | | $ | 278,913,761 | |
Capital transactions — | | | | | | | | |
Contributions | | $ | 1,137,173,133 | | | $ | 4,383,895,129 | |
Withdrawals | | | (2,087,404,801 | ) | | | (1,465,370,574 | ) |
Net increase (decrease) in net assets from capital transactions | | $ | (950,231,668 | ) | | $ | 2,918,524,555 | |
| | |
Net increase (decrease) in net assets | | $ | (261,493,217 | ) | | $ | 3,197,438,316 | |
| | |
| Net Assets | | | | | | | | |
At beginning of year | | $ | 9,694,334,043 | | | $ | 6,496,895,727 | |
At end of year | | $ | 9,432,840,826 | | | $ | 9,694,334,043 | |
| | | | |
| | 40 | | See Notes to Financial Statements. |
Floating Rate Portfolio
October 31, 2012
Supplementary Data
| | | | | | | | | | | | | | | | | | | | |
| | | Year Ended October 31, | |
| Ratios/Supplemental Data | | 2012 | | | 2011 | | | 2010 | | | 2009 | | | 2008 | |
Ratios (as a percentage of average daily net assets): | | | | | | | | | | | | | | | | | | | | |
Expenses(1) | | | 0.54 | % | | | 0.54 | % | | | 0.57 | % | | | 0.61 | % | | | 0.70 | % |
Net investment income | | | 4.72 | % | | | 4.31 | % | | | 4.43 | % | | | 5.41 | % | | | 6.50 | % |
Portfolio Turnover | | | 42 | % | | | 56 | % | | | 39 | % | | | 35 | % | | | 7 | % |
| | | | | |
Total Return | | | 7.67 | % | | | 4.30 | % | | | 10.51 | % | | | 27.54 | % | | | (22.24 | )% |
| | | | | |
Net assets, end of year (000’s omitted) | | $ | 9,432,841 | | | $ | 9,694,334 | | | $ | 6,496,896 | | | $ | 4,294,340 | | | $ | 3,056,210 | |
| (1) | Excludes the effect of custody fee credits, if any, of less than 0.005%. |
| | | | |
| | 41 | | See Notes to Financial Statements. |
Floating Rate Portfolio
October 31, 2012
Notes to Financial Statements
1 Significant Accounting Policies
Floating Rate Portfolio (the Portfolio) is a Massachusetts business trust registered under the Investment Company Act of 1940, as amended (the 1940 Act), as a diversified, open-end management investment company. The Portfolio’s investment objective is to provide a high level of current income. The Declaration of Trust permits the Trustees to issue interests in the Portfolio. At October 31, 2012, Eaton Vance Floating-Rate Fund, Eaton Vance Strategic Income Fund, Eaton Vance Floating-Rate & High Income Fund, Eaton Vance Multi-Strategy Absolute Return Fund, Eaton Vance Low Duration Government Income Fund (formerly, Eaton Vance Low Duration Fund), Eaton Vance Short Term Real Return Fund and Eaton Vance Multi-Strategy All Market Fund held an interest of 83.0%, 4.6%, 10.1%, 1.0%, 0.5%, 0.3% and 0.3%, respectively, in the Portfolio.
The following is a summary of significant accounting policies of the Portfolio. The policies are in conformity with accounting principles generally accepted in the United States of America.
A Investment Valuation — Interests in senior floating-rate loans (Senior Loans) for which reliable market quotations are readily available are valued generally at the average mean of bid and ask quotations obtained from a third party pricing service. Other Senior Loans are valued at fair value by the investment adviser under procedures approved by the Trustees. In fair valuing a Senior Loan, the investment adviser utilizes one or more of the valuation techniques described in (i) through (iii) below to assess the likelihood that the borrower will make a full repayment of the loan underlying such Senior Loan relative to yields on other Senior Loans issued by companies of comparable credit quality. If the investment adviser believes that there is a reasonable likelihood of full repayment, the investment adviser will determine fair value using a matrix pricing approach that considers the yield on the Senior Loan. If the investment adviser believes there is not a reasonable likelihood of full repayment, the investment adviser will determine fair value using analyses that include, but are not limited to: (i) a comparison of the value of the borrower’s outstanding equity and debt to that of comparable public companies; (ii) a discounted cash flow analysis; or (iii) when the investment adviser believes it is likely that a borrower will be liquidated or sold, an analysis of the terms of such liquidation or sale. In certain cases, the investment adviser will use a combination of analytical methods to determine fair value, such as when only a portion of a borrower’s assets are likely to be sold. In conducting its assessment and analyses for purposes of determining fair value of a Senior Loan, the investment adviser will use its discretion and judgment in considering and appraising relevant factors. Fair value determinations are made by the portfolio managers of the Portfolio based on information available to such managers. The portfolio managers of other funds managed by the investment adviser that invest in Senior Loans may not possess the same information about a Senior Loan borrower as the portfolio managers of the Portfolio. At times, the fair value of a Senior Loan determined by the portfolio managers of other funds managed by the investment adviser that invest in Senior Loans may vary from the fair value of the same Senior Loan determined by the portfolio managers of the Portfolio. The fair value of each Senior Loan is periodically reviewed and approved by the investment adviser’s Valuation Committee and by the Trustees based upon procedures approved by the Trustees. Junior Loans (i.e., subordinated loans and second lien loans) are valued in the same manner as Senior Loans.
Debt obligations (including short-term obligations with a remaining maturity of more than sixty days) are generally valued on the basis of valuations provided by third party pricing services, as derived from such services’ pricing models. Inputs to the models may include, but are not limited to, reported trades, executable bid and asked prices, broker/dealer quotations, prices or yields of securities with similar characteristics, benchmark curves or information pertaining to the issuer, as well as industry and economic events. The pricing services may use a matrix approach, which considers information regarding securities with similar characteristics to determine the valuation for a security. Short-term obligations purchased with a remaining maturity of sixty days or less are generally valued at amortized cost, which approximates market value.
Equity securities (including common shares of closed-end investment companies) listed on a U.S. securities exchange generally are valued at the last sale or closing price on the day of valuation or, if no sales took place on such date, at the mean between the closing bid and asked prices therefore on the exchange where such securities are principally traded. Equity securities listed on the NASDAQ Global or Global Select Market generally are valued at the NASDAQ official closing price. Unlisted or listed securities for which closing sales prices or closing quotations are not available are valued at the mean between the latest available bid and asked prices or, in the case of preferred equity securities that are not listed or traded in the over-the-counter market, by a third party pricing service that will use various techniques that consider factors including, but not limited to, prices or yields of securities with similar characteristics, benchmark yields, broker/dealer quotes, quotes of underlying common stock, issuer spreads, as well as industry and economic events. Forward foreign currency exchange contracts are generally valued at the mean of the average bid and average asked prices that are reported by currency dealers to a third party pricing service at the valuation time. Such third party pricing service valuations are supplied for specific settlement periods and the Portfolio’s forward foreign currency exchange contracts are valued at an interpolated rate between the closest preceding and subsequent settlement period reported by the third party pricing service. Interest rate swaps are normally valued using valuations provided by a third party pricing service. Such pricing service valuations are based on the present value of fixed and projected floating rate cash flows over the term of the swap contract. Future cash flows are discounted to their present value using swap rates provided by electronic data services or by broker/dealers. Foreign securities and currencies are valued in U.S. dollars, based on foreign currency exchange rate quotations supplied by a third party pricing service. The pricing service uses a proprietary model to determine the exchange rate. Inputs to the model include reported trades and implied bid/ask spreads. Investments for which valuations or market quotations are not readily available or are deemed unreliable are valued at fair value using methods determined in good faith by or at the direction of the Trustees of the Portfolio in a manner that fairly reflects the security’s value, or the amount that the Portfolio might reasonably expect to receive for the security upon its current sale in the ordinary course. Each such determination is based on a consideration of relevant factors, which are likely to vary from one pricing context to another. These factors may include, but are not limited to, the type of security, the existence of any contractual restrictions on the security’s disposition, the price and extent of public trading in similar securities of the issuer or of comparable companies or entities, quotations or relevant information obtained from broker/dealers or other market participants, information obtained from the issuer, analysts, and/or the appropriate stock
Floating Rate Portfolio
October 31, 2012
Notes to Financial Statements — continued
exchange (for exchange-traded securities), an analysis of the company’s or entity’s financial condition, and an evaluation of the forces that influence the issuer and the market(s) in which the security is purchased and sold.
The Portfolio may invest in Eaton Vance Cash Reserves Fund, LLC (Cash Reserves Fund), an affiliated investment company managed by Eaton Vance Management (EVM). Cash Reserves Fund generally values its investment securities utilizing the amortized cost valuation technique in accordance with Rule 2a-7 under the 1940 Act. This technique involves initially valuing a portfolio security at its cost and thereafter assuming a constant amortization to maturity of any discount or premium. If amortized cost is determined not to approximate fair value, Cash Reserves Fund may value its investment securities in the same manner as debt obligations above.
B Investment Transactions — Investment transactions for financial statement purposes are accounted for on a trade date basis. Realized gains and losses on investments sold are determined on the basis of identified cost.
C Income — Interest income is recorded on the basis of interest accrued, adjusted for amortization of premium or accretion of discount. Fees associated with loan amendments are recognized immediately. Dividend income is recorded on the ex-dividend date for dividends received in cash and/or securities.
D Federal Taxes — The Portfolio has elected to be treated as a partnership for federal tax purposes. No provision is made by the Portfolio for federal or state taxes on any taxable income of the Portfolio because each investor in the Portfolio is ultimately responsible for the payment of any taxes on its share of taxable income. Since at least one of the Portfolio’s investors is a regulated investment company that invests all or substantially all of its assets in the Portfolio, the Portfolio normally must satisfy the applicable source of income and diversification requirements (under the Internal Revenue Code) in order for its investors to satisfy them. The Portfolio will allocate, at least annually among its investors, each investor’s distributive share of the Portfolio’s net investment income, net realized capital gains and any other items of income, gain, loss, deduction or credit.
As of October 31, 2012, the Portfolio had no uncertain tax positions that would require financial statement recognition, de-recognition, or disclosure. The Portfolio files a U.S. federal income tax return annually after its fiscal year-end, which is subject to examination by the Internal Revenue Service for a period of three years from the date of filing.
E Expense Reduction — State Street Bank and Trust Company (SSBT) serves as custodian of the Portfolio. Pursuant to the custodian agreement, SSBT receives a fee reduced by credits, which are determined based on the average daily cash balance the Portfolio maintains with SSBT. All credit balances, if any, used to reduce the Portfolio’s custodian fees are reported as a reduction of expenses in the Statement of Operations.
F Foreign Currency Translation — Investment valuations, other assets, and liabilities initially expressed in foreign currencies are translated each business day into U.S. dollars based upon current exchange rates. Purchases and sales of foreign investment securities and income and expenses denominated in foreign currencies are translated into U.S. dollars based upon currency exchange rates in effect on the respective dates of such transactions. Recognized gains or losses on investment transactions attributable to changes in foreign currency exchange rates are recorded for financial statement purposes as net realized gains and losses on investments. That portion of unrealized gains and losses on investments that results from fluctuations in foreign currency exchange rates is not separately disclosed.
G Unfunded Loan Commitments — The Portfolio may enter into certain credit agreements all or a portion of which may be unfunded. The Portfolio is obligated to fund these commitments at the borrower’s discretion. These commitments are disclosed in the accompanying Portfolio of Investments. At October 31, 2012, the Portfolio had sufficient cash and/or securities to cover these commitments.
H Use of Estimates — The preparation of the financial statements in conformity with accounting principles generally accepted in the United States of America requires management to make estimates and assumptions that affect the reported amounts of assets and liabilities at the date of the financial statements and the reported amounts of income and expense during the reporting period. Actual results could differ from those estimates.
I Indemnifications — Under the Portfolio’s organizational documents, its officers and Trustees may be indemnified against certain liabilities and expenses arising out of the performance of their duties to the Portfolio. Under Massachusetts law, if certain conditions prevail, interestholders in the Portfolio could be deemed to have personal liability for the obligations of the Portfolio. However, the Portfolio’s Declaration of Trust contains an express disclaimer of liability on the part of Portfolio interestholders and the By-laws provide that the Portfolio shall assume the defense on behalf of any Portfolio interestholder. Moreover, the By-laws also provide for indemnification out of Portfolio property of any interestholder held personally liable solely by reason of being or having been an interestholder for all loss or expense arising from such liability. Additionally, in the normal course of business, the Portfolio enters into agreements with service providers that may contain indemnification clauses. The Portfolio’s maximum exposure under these arrangements is unknown as this would involve future claims that may be made against the Portfolio that have not yet occurred.
J Forward Foreign Currency Exchange Contracts — The Portfolio may enter into forward foreign currency exchange contracts for the purchase or sale of a specific foreign currency at a fixed price on a future date. The forward foreign currency exchange contracts are adjusted by the daily exchange rate of the underlying currency and any gains or losses are recorded as unrealized until such time as the contracts have been closed or offset by another contract with the same broker for the same settlement date and currency. Risks may arise upon entering these contracts from the potential inability of counterparties to meet the terms of their contracts and from movements in the value of a foreign currency relative to the U.S. dollar.
Floating Rate Portfolio
October 31, 2012
Notes to Financial Statements — continued
K Interest Rate Swaps — Pursuant to interest rate swap agreements, the Portfolio either makes floating-rate payments based on a benchmark interest rate in exchange for fixed-rate payments or the Portfolio makes fixed-rate payments in exchange for payments on a floating benchmark interest rate. Payments received or made are recorded as realized gains or losses. During the term of the outstanding swap agreement, changes in the underlying value of the swap are recorded as unrealized gains or losses. The value of the swap is determined by changes in the relationship between two rates of interest. The Portfolio is exposed to credit loss in the event of non-performance by the swap counterparty. Risk may also arise from movements in interest rates.
2 Investment Adviser Fee and Other Transactions with Affiliates
The investment adviser fee is earned by Boston Management and Research (BMR), a subsidiary of EVM, as compensation for investment advisory services rendered to the Portfolio. Pursuant to the investment advisory agreement and subsequent fee reduction agreement between the Portfolio and BMR, the fee is computed at an annual rate of 0.575% of the Portfolio’s average daily net assets up to $1 billion, 0.525% from $1 billion up to $2 billion, 0.500% from $2 billion up to $5 billion, 0.480% from $5 billion up to $10 billion and 0.460% of average daily net assets of $10 billion or more, and is payable monthly. Effective May 1, 2012, pursuant to an additional fee reduction agreement between the Portfolio and BMR, the portion of the fee on net assets of $10 billion and over is computed as follows: annual rate of 0.460% of the Portfolio’s average daily net assets from $10 billion up to $15 billion, 0.4475% from $15 billion up to $20 billion, 0.4375% from $20 billion up to $25 billion and 0.430% of average daily net assets of $25 billion or more. The fee reductions cannot be terminated without the consent of the Trustees and shareholders. The Portfolio invests its cash in Cash Reserves Fund. EVM does not currently receive a fee for advisory services provided to Cash Reserves Fund. For the year ended October 31, 2012, the Portfolio’s investment adviser fee amounted to $46,845,003 or 0.50% of the Portfolio’s average daily net assets.
Officers and Trustees of the Portfolio who are members of EVM’s or BMR’s organizations receive remuneration for their services to the Portfolio out of the investment adviser fee. Trustees of the Portfolio who are not affiliated with the investment adviser may elect to defer receipt of all or a percentage of their annual fees in accordance with the terms of the Trustees Deferred Compensation Plan. For the year ended October 31, 2012, no significant amounts have been deferred. Certain officers and Trustees of the Portfolio are officers of the above organizations.
3 Purchases and Sales of Investments
Purchases and sales of investments, other than short-term obligations and including maturities, principal repayments on Senior Loans and paydowns, aggregated $3,746,407,935 and $4,157,870,920, respectively, for the year ended October 31, 2012.
4 Federal Income Tax Basis of Investments
The cost and unrealized appreciation (depreciation) of investments of the Portfolio at October 31, 2012, as determined on a federal income tax basis, were as follows:
| | | | |
| |
Aggregate cost | | $ | 9,622,503,671 | |
| |
Gross unrealized appreciation | | $ | 135,168,501 | |
Gross unrealized depreciation | | | (87,221,132 | ) |
| |
Net unrealized appreciation | | $ | 47,947,369 | |
The net unrealized depreciation on foreign currency and swap contracts at October 31, 2012 on a federal income tax basis was $7,053,445.
Floating Rate Portfolio
October 31, 2012
Notes to Financial Statements — continued
5 Restricted Securities
At October 31, 2012, the Portfolio owned the following securities (representing less than 0.1% of net assets) which were restricted as to public resale and not registered under the Securities Act of 1933 (excluding Rule 144A securities). The Portfolio has various registration rights (exercisable under a variety of circumstances) with respect to these securities. The value of these securities is determined based on valuations provided by brokers when available, or if not available, they are valued at fair value using methods determined in good faith by or at the direction of the Trustees.
| | | | | | | | | | | | | | | | |
| Description | | Date of Acquisition | | | Shares | | | Cost | | | Value | |
| | | | |
Common Stocks | | | | | | | | | | | | | | | | |
Environmental Systems Products Holdings, Inc. | | | 10/25/07 | | | | 2,484 | | | $ | 0 | | | $ | 179,419 | |
| | | | |
Preferred Stocks | | | | | | | | | | | | | | | | |
Environmental Systems Products Holdings, Inc., Series A | | | 10/25/07 | | | | 569 | | | $ | 9,958 | | | $ | 35,847 | |
| | | | |
Total Restricted Securities | | | | | | | | | | $ | 9,958 | | | $ | 215,266 | |
6 Financial Instruments
The Portfolio may trade in financial instruments with off-balance sheet risk in the normal course of its investing activities. These financial instruments may include forward foreign currency exchange contracts and swap contracts and may involve, to a varying degree, elements of risk in excess of the amounts recognized for financial statement purposes. The notional or contractual amounts of these instruments represent the investment the Portfolio has in particular classes of financial instruments and do not necessarily represent the amounts potentially subject to risk. The measurement of the risks associated with these instruments is meaningful only when all related and offsetting transactions are considered.
A summary of obligations under these financial instruments at October 31, 2012 is as follows:
| | | | | | | | | | |
| Forward Foreign Currency Exchange Contracts | | | | | | | |
| | | | |
| | | | | | | | | | |
Sales | |
| Settlement Date | | Deliver | | In Exchange For | | Counterparty | | Net Unrealized Appreciation (Depreciation) | |
| | | | |
| 11/30/12 | | British Pound Sterling 55,768,970 | | United States Dollar 88,250,491 | | JPMorgan Chase Bank NA | | $ | (1,738,073 | ) |
| 11/30/12 | | Euro
61,728,903 | | United States Dollar 77,431,193 | | Citibank NA | | | (2,598,202 | ) |
| 12/31/12 | | British Pound Sterling 26,120,029 | | United States Dollar 42,173,791 | | Goldman Sachs International | | | 30,226 | |
| 12/31/12 | | British Pound Sterling 3,375,625 | | United States Dollar 5,449,920 | | State Street Bank and Trust Co. | | | 3,491 | |
| 12/31/12 | | Euro
71,617,803 | | United States Dollar 92,172,829 | | HSBC Bank USA | | | (711,694 | ) |
| 1/31/13 | | British Pound Sterling 21,666,382 | | United States Dollar 34,823,292 | | HSBC Bank USA | | | (130,695 | ) |
| 1/31/13 | | Euro
70,539,472 | | United States Dollar 91,573,637 | | Deutsche Bank AG | | | 61,220 | |
| 1/31/13 | | Swiss Franc 16,380,316 | | United States Dollar 17,599,126 | | Citibank NA | | | (15,253 | ) |
| | | | |
| | | | | | | | | $ | (5,098,980 | ) |
Floating Rate Portfolio
October 31, 2012
Notes to Financial Statements — continued
| | | | | | | | | | | | | | | | | | |
| Interest Rate Swaps | |
| Counterparty | | Notional Amount (000’s omitted) | | Portfolio Pays/Receives Floating Rate | | Floating Rate Index | | Annual Fixed Rate | | | Termination Date | | | Net Unrealized Depreciation | |
| Citibank NA | | $60,000 | | Receives | | 3-Month
USD-LIBOR-BBA | | | 0.98 | % | | | 6/24/14 | | | $ | (780,299 | ) |
| Citibank NA | | 60,000 | | Receives | | 3-Month
USD-LIBOR-BBA | | | 1.81 | | | | 6/24/16 | | | | (3,023,488 | ) |
| | | | | | |
| | | | | | | | | | | | | | | | | $ | (3,803,787 | ) |
At October 31, 2012, the Portfolio had sufficient cash and/or securities to cover commitments under these contracts.
In the normal course of pursuing its investment objective and its use of derivatives, the Portfolio is subject to the following risks:
Foreign Exchange Risk: Because the Portfolio holds foreign currency denominated investments, the value of these investments and related receivables and payables may change due to future changes in foreign currency exchange rates. To hedge against this risk, the Portfolio enters into forward foreign currency exchange contracts. The Portfolio also enters into such contracts to hedge the currency risk of investments it anticipates purchasing.
Interest Rate Risk: Because the Portfolio holds fixed-rate bonds, the value of these bonds may decrease if interest rates rise. To hedge against this risk, the Portfolio enters into interest rate swap contracts with respect to a portion of the bonds.
The Portfolio enters into swap contracts and forward foreign currency exchange contracts that may contain provisions whereby the counterparty may terminate the contract under certain conditions, including but not limited to a decline in the Portfolio’s net assets below a certain level over a certain period of time, which would trigger a payment by the Portfolio for those derivatives in a liability position. At October 31, 2012 the fair value of derivatives with credit-related contingent features in a net liability position was $8,997,704. At October 31, 2012, the aggregate fair value of assets pledged as collateral by the Portfolio for such liability was $13,554,205.
The non-exchange traded derivatives in which the Portfolio invests, including swap contracts and forward foreign currency exchange contracts, are subject to the risk that the counterparty to the contract fails to perform its obligations under the contract. At October 31, 2012, the maximum amount of loss the Portfolio would incur due to counterparty risk was $94,937, representing the fair value of such derivatives in an asset position, with the highest amount from any one counterparty being $61,220. To mitigate this risk, the Portfolio has entered into master netting agreements with substantially all its derivative counterparties, which allows it and a counterparty to aggregate amounts owed by each of them for derivative transactions under the agreement into a single net amount payable by either the Portfolio or the counterparty. Counterparties may be required to pledge collateral in the form of cash, U.S. Government securities or highly-rated bonds for the benefit of the Portfolio if the net amount due from the counterparty with respect to a derivative contract exceeds a certain threshold. The amount of collateral posted by the counterparties with respect to such contracts would also reduce the amount of any loss incurred.
The fair value of open derivative instruments (not considered to be hedging instruments for accounting disclosure purposes) by risk exposure at October 31, 2012 was as follows:
| | | | | | | | | | |
| | | | | Fair Value | |
| Risk | | Derivative | | Asset Derivative | | | Liability Derivative | |
| | | |
Foreign Exchange | | Forward foreign currency exchange contracts | | $ | 94,937 | (1) | | $ | (5,193,917 | )(2) |
| | | |
| | | | | $ | 94,937 | | | $ | (5,193,917 | ) |
| | | |
Interest Rate | | Swap contracts | | $ | — | | | $ | (3,803,787 | )(2) |
| | | |
| | | | | $ | — | | | $ | (3,803,787 | ) |
| (1) | Statement of Assets and Liabilities location: Receivable for open forward foreign currency exchange contracts; Net unrealized appreciation. |
| (2) | Statement of Assets and Liabilities location: Payable for open forward foreign currency exchange contracts and Payable for open swap contracts, respectively; Net unrealized appreciation. |
Floating Rate Portfolio
October 31, 2012
Notes to Financial Statements — continued
The effect of derivative instruments (not considered to be hedging instruments for accounting disclosure purposes) on the Statement of Operations by risk exposure for the year ended October 31, 2012 was as follows:
| | | | | | | | | | |
| Risk | | Derivative | | Realized Gain (Loss)
on Derivatives Recognized
in Income | | | Change in Unrealized
Appreciation (Depreciation) on
Derivatives Recognized in Income | |
| | | |
Foreign Exchange | | Forward foreign currency exchange contracts | | $ | 31,196,921 | (1) | | $ | (9,036,988 | )(2) |
Interest Rate | | Swap contracts | | | (1,111,685 | )(1) | | | (1,007,489 | )(2) |
| | | |
Total | | | | $ | 30,085,236 | | | $ | (10,044,477 | ) |
| (1) | Statement of Operations location: Net realized gain (loss) – Foreign currency and forward foreign currency exchange contract transactions and swap contracts, respectively. |
| (2) | Statement of Operations location: Change in unrealized appreciation (depreciation) – Foreign currency and forward foreign currency exchange contracts and Swap contracts, respectively. |
The average notional amounts of forward foreign currency exchange contracts and swap contracts outstanding during the year ended October 31, 2012, which are indicative of the volume of these derivative types, were approximately $463,978,000 and $120,000,000, respectively.
7 Line of Credit
The Portfolio participates with another portfolio and fund managed by EVM and its affiliates in a $800 million ($900 million prior to March 19, 2012) unsecured line of credit agreement with a group of banks. Borrowings are made by the Portfolio solely to facilitate the handling of unusual and/or unanticipated short-term cash requirements. Interest is charged to the Portfolio based on its borrowings at a prime rate or an amount above either the London Interbank Offered Rate (LIBOR) or the Federal Funds rate. In addition, a fee computed at an annual rate of 0.08% on the daily unused portion of the line of credit is allocated among the participating portfolios and fund at the end of each quarter. Because the line of credit is not available exclusively to the Portfolio, it may be unable to borrow some or all of its requested amounts at any particular time. The Portfolio did not have any significant borrowings or allocated fees during the year ended October 31, 2012.
8 Risks Associated with Foreign Investments
Investing in securities issued by companies whose principal business activities are outside the United States may involve significant risks not present in domestic investments. For example, there is generally less publicly available information about foreign companies, particularly those not subject to the disclosure and reporting requirements of the U.S. securities laws. Certain foreign issuers are generally not bound by uniform accounting, auditing, and financial reporting requirements and standards of practice comparable to those applicable to domestic issuers. Investments in foreign securities also involve the risk of possible adverse changes in investment or exchange control regulations, expropriation or confiscatory taxation, limitation on the removal of funds or other assets of the Portfolio, political or financial instability or diplomatic and other developments which could affect such investments. Foreign securities markets, while growing in volume and sophistication, are generally not as developed as those in the United States, and securities of some foreign issuers (particularly those located in developing countries) may be less liquid and more volatile than securities of comparable U.S. companies. In general, there is less overall governmental supervision and regulation of foreign securities markets, broker/dealers and issuers than in the United States.
9 Credit Risk
The Portfolio invests primarily in below investment grade floating-rate loans and floating-rate debt obligations, which are considered speculative because of the credit risk of their issuers. Changes in economic conditions or other circumstances are more likely to reduce the capacity of issuers of these securities to make principal and interest payments. Such companies are more likely to default on their payments of interest and principal owed than issuers of investment grade bonds. An economic downturn generally leads to a higher non-payment rate, and a loan or other debt obligation may lose significant value before a default occurs. Lower rated investments also may be subject to greater price volatility than higher rated investments. Moreover, the specific collateral used to secure a loan may decline in value or become illiquid, which would adversely affect the loan’s value.
Floating Rate Portfolio
October 31, 2012
Notes to Financial Statements — continued
10 Fair Value Measurements
Under generally accepted accounting principles for fair value measurements, a three-tier hierarchy to prioritize the assumptions, referred to as inputs, is used in valuation techniques to measure fair value. The three-tier hierarchy of inputs is summarized in the three broad levels listed below.
| Ÿ | | Level 1 – quoted prices in active markets for identical investments |
| Ÿ | | Level 2 – other significant observable inputs (including quoted prices for similar investments, interest rates, prepayment speeds, credit risk, etc.) |
| Ÿ | | Level 3 – significant unobservable inputs (including a fund’s own assumptions in determining the fair value of investments) |
In cases where the inputs used to measure fair value fall in different levels of the fair value hierarchy, the level disclosed is determined based on the lowest level input that is significant to the fair value measurement in its entirety. The inputs or methodology used for valuing securities are not necessarily an indication of the risk associated with investing in those securities.
At October 31, 2012, the hierarchy of inputs used in valuing the Portfolio’s investments and open derivative instruments, which are carried at value, were as follows:
| | | | | | | | | | | | | | | | |
| Asset Description | | Level 1 | | | Level 2 | | | Level 3* | | | Total | |
| | | | |
Senior Floating-Rate Interests (Less Unfunded Loan Commitments) | | $ | — | | | $ | 8,655,003,363 | | | $ | 7,633,965 | | | $ | 8,662,637,328 | |
Corporate Bonds & Notes | | | — | | | | 317,666,291 | | | | 156,179 | | | | 317,822,470 | |
Asset-Backed Securities | | | — | | | | 4,818,517 | | | | — | | | | 4,818,517 | |
Common Stocks | | | — | | | | 15,539,601 | | | | 37,280,907 | | | | 52,820,508 | |
Preferred Stocks | | | — | | | | — | | | | 35,847 | | | | 35,847 | |
Warrants | | | — | | | | — | | | | 403,200 | | | | 403,200 | |
Short-Term Investments | | | — | | | | 631,913,170 | | | | — | | | | 631,913,170 | |
| | | | |
Total Investments | | $ | — | | | $ | 9,624,940,942 | | | $ | 45,510,098 | | | $ | 9,670,451,040 | |
Forward Foreign Currency Exchange Contracts | | $ | — | | | $ | 94,937 | | | $ | — | | | $ | 94,937 | |
| | | | |
Total | | $ | — | | | $ | 9,625,035,879 | | | $ | 45,510,098 | | | $ | 9,670,545,977 | |
| | | | |
Liability Description | | | | | | | | | | | | | | | | |
Forward Foreign Currency Exchange Contracts | | $ | — | | | $ | (5,193,917 | ) | | $ | — | | | $ | (5,193,917 | ) |
Interest Rate Swaps | | | — | | | | (3,803,787 | ) | | | — | | | | (3,803,787 | ) |
| | | | |
Total | | $ | — | | | $ | (8,997,704 | ) | | $ | — | | | $ | (8,997,704 | ) |
| * | None of the unobservable inputs for Level 3 assets, individually or collectively, had a material impact on the Portfolio. |
Level 3 investments at the beginning and/or end of the period in relation to net assets were not significant and accordingly, a reconciliation of Level 3 assets for the year ended October 31, 2012 is not presented.
At October 31, 2012, there were no investments transferred between Level 1 and Level 2 during the year then ended.
Floating Rate Portfolio
October 31, 2012
Report of Independent Registered Public Accounting Firm
To the Trustees and Investors of Floating Rate Portfolio:
We have audited the accompanying statement of assets and liabilities of Floating Rate Portfolio (the “Portfolio”), including the portfolio of investments, as of October 31, 2012, and the related statement of operations for the year then ended, the statements of changes in net assets for each of the two years in the period then ended, and the supplementary data for each of the five years in the period then ended. These financial statements and supplementary data are the responsibility of the Portfolio’s management. Our responsibility is to express an opinion on these financial statements and supplementary data based on our audits.
We conducted our audits in accordance with the standards of the Public Company Accounting Oversight Board (United States). Those standards require that we plan and perform the audit to obtain reasonable assurance about whether the financial statements and supplementary data are free of material misstatement. The Portfolio is not required to have, nor were we engaged to perform, an audit of its internal control over financial reporting. Our audits included consideration of internal control over financial reporting as a basis for designing audit procedures that are appropriate in the circumstances, but not for the purpose of expressing an opinion on the effectiveness of the Portfolio’s internal control over financial reporting. Accordingly, we express no such opinion. An audit also includes examining, on a test basis, evidence supporting the amounts and disclosures in the financial statements, assessing the accounting principles used and significant estimates made by management, as well as evaluating the overall financial statement presentation. Our procedures included confirmation of securities and senior loans owned as of October 31, 2012, by correspondence with the custodian, brokers, and selling or agent banks; where replies were not received from brokers and selling or agent banks, we performed other auditing procedures. We believe that our audits provide a reasonable basis for our opinion.
In our opinion, such financial statements and supplementary data referred to above present fairly, in all material respects, the financial position of Floating Rate Portfolio as of October 31, 2012, the results of its operations for the year then ended, the changes in its net assets for each of the two years in the period then ended, and the supplementary data for each of the five years in the period then ended, in conformity with accounting principles generally accepted in the United States of America.
DELOITTE & TOUCHE LLP
Boston, Massachusetts
December 17, 2012
Eaton Vance
Floating-Rate Fund
October 31, 2012
Management and Organization
Fund Management. The Trustees of Eaton Vance Mutual Funds Trust (the Trust), and Floating Rate Portfolio (the Portfolio) are responsible for the overall management and supervision of the Trust’s and Portfolio’s affairs. The Trustees and officers of the Trust and the Portfolio are listed below. Except as indicated, each individual has held the office shown or other offices in the same company for the last five years. Trustees and officers of the Trust and the Portfolio hold indefinite terms of office. The “Noninterested Trustees” consist of those Trustees who are not “interested persons” of the Trust and the Portfolio, as that term is defined under the 1940 Act. The business address of each Trustee and officer is Two International Place, Boston, Massachusetts 02110. As used below, “EVC” refers to Eaton Vance Corp., “EV” refers to Eaton Vance, Inc., “EVM” refers to Eaton Vance Management, “BMR” refers to Boston Management and Research and “EVD” refers to Eaton Vance Distributors, Inc. EVC and EV are the corporate parent and trustee, respectively, of EVM and BMR. EVD is the Fund’s principal underwriter, the Portfolio’s placement agent and a wholly-owned subsidiary of EVC. Each officer affiliated with Eaton Vance may hold a position with other Eaton Vance affiliates that is comparable to his or her position with EVM listed below. Each Trustee oversees 187 portfolios in the Eaton Vance Complex (including all master and feeder funds in a master feeder structure). Each officer serves as an officer of certain other Eaton Vance funds. Each Trustee and officer serves until his or her successor is elected.
| | | | | | |
| Name and Year of Birth | | Position(s) with the
Trust and the
Portfolio | | Length of
Service | | Principal Occupation(s) and Directorships During Past Five Years and Other Relevant Experience |
Interested Trustee | | | | | | |
| | | |
Thomas E. Faust Jr. 1958 | | Trustee | | Since 2007 | | Chairman, Chief Executive Officer and President of EVC, Director and President of EV, Chief Executive Officer and President of EVM and BMR, and Director of EVD. Trustee and/or officer of 187 registered investment companies. Mr. Faust is an interested person because of his positions with EVM, BMR, EVD, EVC and EV, which are affiliates of the Trust and the Portfolio. Directorships in the Last Five Years.(1) Director of EVC and Hexavest Inc. |
| | | |
| | | | | | |
Noninterested Trustees |
| | | |
Scott E. Eston 1956 | | Trustee | | Since 2011 | | Private investor. Formerly held various positions at Grantham, Mayo, Van Otterloo and Co., L.L.C. (investment management firm) (1997-2009), including Chief Operating Officer (2002-2009), Chief Financial Officer (1997-2009) and Chairman of the Executive Committee (2002-2008); President and Principal Executive Officer, GMO Trust (open-end registered investment company) (2006-2009). Former Partner, Coopers and Lybrand L.L.P. (now PricewaterhouseCoopers) (public accounting firm) (1987-1997). Directorships in the Last Five Years. None. |
| | | |
Benjamin C. Esty 1963 | | Trustee | | Since 2005 | | Roy and Elizabeth Simmons Professor of Business Administration and Finance Unit Head, Harvard University Graduate School of Business Administration. Directorships in the Last Five Years.(1) None. |
| | | |
Allen R. Freedman 1940 | | Trustee | | Since 2007 | | Private Investor. Former Chairman (2002-2004) and a Director (1983-2004) of Systems & Computer Technology Corp. (provider of software to higher education). Formerly, a Director of Loring Ward International (fund distributor) (2005-2007). Former Chairman and a Director of Indus International, Inc. (provider of enterprise management software to the power generating industry) (2005-2007). Former Chief Executive Officer of Assurant, Inc. (insurance provider) (1979-2000). Directorships in the Last Five Years.(1) Director of Stonemor Partners, L.P. (owner and operator of cemeteries). Formerly, Director of Assurant, Inc. (insurance provider) (1979-2011). |
| | | |
William H. Park 1947 | | Trustee | | Since 2003 | | Consultant and private investor. Formerly, Chief Financial Officer, Aveon Group L.P. (investment management firm) (2010-2011). Formerly, Vice Chairman, Commercial Industrial Finance Corp. (specialty finance company) (2006-2010). Formerly, President and Chief Executive Officer, Prizm Capital Management, LLC (investment management firm) (2002-2005). Formerly, Executive Vice President and Chief Financial Officer, United Asset Management Corporation (investment management firm) (1982-2001). Formerly, Senior Manager, Price Waterhouse (now PricewaterhouseCoopers) (an independent registered public accounting firm) (1972-1981). Directorships in the Last Five Years.(1) None. |
Eaton Vance
Floating-Rate Fund
October 31, 2012
Management and Organization — continued
| | | | | | |
| Name and Year of Birth | | Position(s) with the
Trust and the
Portfolio | | Length of
Service | | Principal Occupation(s) and Directorships During Past Five Years and Other Relevant Experience |
Noninterested Trustees (continued) |
| | | |
Ronald A. Pearlman 1940 | | Trustee | | Since 2003 | | Professor of Law, Georgetown University Law Center. Formerly, Deputy Assistant Secretary (Tax Policy) and Assistant Secretary (Tax Policy), U.S. Department of the Treasury (1983-1985). Formerly, Chief of Staff, Joint Committee on Taxation, U.S. Congress (1988-1990). Directorships in the Last Five Years.(1) None. |
| | | |
Helen Frame Peters 1948 | | Trustee | | Since 2008 | | Professor of Finance, Carroll School of Management, Boston College. Formerly, Dean, Carroll School of Management, Boston College (2000-2002). Formerly, Chief Investment Officer, Fixed Income, Scudder Kemper Investments (investment management firm) (1998-1999). Formerly, Chief Investment Officer, Equity and Fixed Income, Colonial Management Associates (investment management firm) (1991-1998). Directorships in the Last Five Years.(1) Formerly, Director of BJ’s Wholesale Club, Inc. (wholesale club retailer) (2004-2011). Formerly, Trustee of SPDR Index Shares Funds and SPDR Series Trust (exchange traded funds) (2000-2009). Formerly, Director of Federal Home Loan Bank of Boston (a bank for banks) (2007-2009). |
| | | |
Lynn A. Stout 1957 | | Trustee | | Of the Trust since 1998 and of the Portfolio since 2000 | | Distinguished Professor of Corporate and Business Law, Jack G. Clarke Business Law Institute, Cornell University Law School. Formerly, the Paul Hastings Professor of Corporate and Securities Law (2006-2012) and Professor of Law (2001-2006), University of California at Los Angeles School of Law. Directorships in the Last Five Years.(1) None. |
| | | |
Harriett Tee Taggart 1948 | | Trustee | | Since 2011 | | Managing Director, Taggart Associates (a professional practice firm). Formerly, Partner and Senior Vice President, Wellington Management Company, LLP (investment management firm) (1983-2006). Directorships in the Last Five Years. Director of Albemarle Corporation (chemicals manufacturer) (since 2007) and The Hanover Group (specialty property and casualty insurance company) (since 2009). Formerly, Director of Lubrizol Corporation (specialty chemicals) (2007-2011). |
| | | |
Ralph F. Verni 1943 | | Chairman of the Board and Trustee | | Chairman of the Board since 2007 and Trustee since 2005 | | Consultant and private investor. Formerly, Chief Investment Officer (1982-1992), Chief Financial Officer (1988-1990) and Director (1982-1992), New England Life. Formerly, Chairperson, New England Mutual Funds (1982-1992). Formerly, President and Chief Executive Officer, State Street Management & Research (1992-2000). Formerly, Chairperson, State Street Research Mutual Funds (1992-2000). Formerly, Director, W.P. Carey, LLC (1998-2004) and First Pioneer Farm Credit Corp. (2002-2006). Directorships in the Last Five Years.(1) None. |
| | | |
| | | | | | |
Principal Officers who are not Trustees |
| Name and Year of Birth | | Position(s) with the
Trust and the
Portfolio | | Length of
Service | | Principal Occupation(s) During Past Five Years |
| | | |
Duncan W. Richardson 1957 | | President of the Trust | | Since 2011 | | Director of EVC and Executive Vice President and Chief Equity Investment Officer of EVC, EVM and BMR. |
| | | |
Scott H. Page 1959 | | President of the Portfolio | | Since 2007 | | Vice President of EVM and BMR. |
| | | |
Payson F. Swaffield 1956 | | Vice President | | Since 2011 | | Vice President and Chief Income Investment Officer of EVM and BMR. |
| | | |
Barbara E. Campbell 1957 | | Treasurer | | Of the Trust since 2005 and of the Portfolio since 2008 | | Vice President of EVM and BMR. |
Eaton Vance
Floating-Rate Fund
October 31, 2012
Management and Organization — continued
| | | | | | |
| Name and Year of Birth | | Position(s) with the
Trust and the
Portfolio | | Length of
Service | | Principal Occupation(s) During Past Five Years |
Principal Officers who are not Trustees (continued) |
| | | |
Maureen A. Gemma 1960 | | Vice President, Secretary and Chief Legal Officer | | Vice President since 2011, Secretary since 2007 and Chief Legal Officer since 2008 | | Vice President of EVM and BMR. |
| | | |
Paul M. O’Neil 1953 | | Chief Compliance Officer | | Since 2004 | | Vice President of EVM and BMR. |
| (1) | During their respective tenures, the Trustees (except Mr. Eston and Ms. Taggart) also served as trustees of one or more of the following Eaton Vance funds (which operated in the years noted): Eaton Vance Credit Opportunities Fund (launched in 2005 and terminated in 2010); Eaton Vance Insured Florida Plus Municipal Bond Fund (launched in 2002 and terminated in 2009); and Eaton Vance National Municipal Income Trust (launched in 1998 and terminated in 2009). |
The SAI for the Fund includes additional information about the Trustees and officers of the Fund and the Portfolio and can be obtained without charge on Eaton Vance’s website at www.eatonvance.com or by calling 1-800-262-1122.
Eaton Vance Funds
IMPORTANT NOTICES
Privacy. The Eaton Vance organization is committed to ensuring your financial privacy. Each of the financial institutions identified below has in effect the following policy (“Privacy Policy”) with respect to nonpublic personal information about its customers:
| Ÿ | | Only such information received from you, through application forms or otherwise, and information about your Eaton Vance fund transactions will be collected. This may include information such as name, address, social security number, tax status, account balances and transactions. |
| Ÿ | | None of such information about you (or former customers) will be disclosed to anyone, except as permitted by law (which includes disclosure to employees necessary to service your account). In the normal course of servicing a customer’s account, Eaton Vance may share information with unaffiliated third parties that perform various required services such as transfer agents, custodians and broker-dealers. |
| Ÿ | | Policies and procedures (including physical, electronic and procedural safeguards) are in place that are designed to protect the confidentiality of such information. |
| Ÿ | | We reserve the right to change our Privacy Policy at any time upon proper notification to you. Customers may want to review our Privacy Policy periodically for changes by accessing the link on our homepage: www.eatonvance.com. |
Our pledge of privacy applies to the following entities within the Eaton Vance organization: the Eaton Vance Family of Funds, Eaton Vance Management, Eaton Vance Investment Counsel, Eaton Vance Distributors, Inc., Eaton Vance Trust Company, Eaton Vance Management’s Real Estate Investment Group and Boston Management and Research. In addition, our Privacy Policy applies only to those Eaton Vance customers who are individuals and who have a direct relationship with us. If a customer’s account (i.e., fund shares) is held in the name of a third-party financial advisor/broker-dealer, it is likely that only such advisor’s privacy policies apply to the customer. This notice supersedes all previously issued privacy disclosures. For more information about Eaton Vance’s Privacy Policy, please call 1-800-262-1122.
Delivery of Shareholder Documents. The Securities and Exchange Commission (SEC) permits funds to deliver only one copy of shareholder documents, including prospectuses, proxy statements and shareholder reports, to fund investors with multiple accounts at the same residential or post office box address. This practice is often called “householding” and it helps eliminate duplicate mailings to shareholders. Eaton Vance, or your financial advisor, may household the mailing of your documents indefinitely unless you instruct Eaton Vance, or your financial advisor, otherwise. If you would prefer that your Eaton Vance documents not be householded, please contact Eaton Vance at 1-800-262-1122, or contact your financial advisor. Your instructions that householding not apply to delivery of your Eaton Vance documents will be effective within 30 days of receipt by Eaton Vance or your financial advisor.
Portfolio Holdings. Each Eaton Vance Fund and its underlying Portfolio(s) (if applicable) will file a schedule of portfolio holdings on Form N-Q with the SEC for the first and third quarters of each fiscal year. The Form N-Q will be available on the Eaton Vance website at www.eatonvance.com, by calling Eaton Vance at 1-800-262-1122 or in the EDGAR database on the SEC’s website at www.sec.gov. Form N-Q may also be reviewed and copied at the SEC’s public reference room in Washington, D.C. (call 1-800-732-0330 for information on the operation of the public reference room).
Proxy Voting. From time to time, funds are required to vote proxies related to the securities held by the funds. The Eaton Vance Funds or their underlying Portfolios (if applicable) vote proxies according to a set of policies and procedures approved by the Funds’ and Portfolios’ Boards. You may obtain a description of these policies and procedures and information on how the Funds or Portfolios voted proxies relating to portfolio securities during the most recent 12-month period ended June 30, without charge, upon request, by calling 1-800-262-1122 and by accessing the SEC’s website at www.sec.gov.
This Page Intentionally Left Blank
This Page Intentionally Left Blank
This Page Intentionally Left Blank
Investment Adviser of Floating Rate Portfolio
Boston Management and Research
Two International Place
Boston, MA 02110
Administrator of Eaton Vance Floating-Rate Fund
Eaton Vance Management
Two International Place
Boston, MA 02110
Principal Underwriter*
Eaton Vance Distributors, Inc.
Two International Place
Boston, MA 02110
(617) 482-8260
Custodian
State Street Bank and Trust Company
200 Clarendon Street
Boston, MA 02116
Transfer Agent
BNY Mellon Investment Servicing (US) Inc.
Attn: Eaton Vance Funds
P.O. Box 9653
Providence, RI 02940-9653
(800) 262-1122
Independent Registered Public Accounting Firm
Deloitte & Touche LLP
200 Berkeley Street
Boston, MA 02116-5022
Fund Offices
Two International Place
Boston, MA 02110
| * | FINRA BrokerCheck. Investors may check the background of their Investment Professional by contacting the Financial Industry Regulatory Authority (FINRA). FINRA BrokerCheck is a free tool to help investors check the professional background of current and former FINRA-registered securities firms and brokers. FINRA BrokerCheck is available by calling 1-800-289-9999 and at www.FINRA.org. The FINRA BrokerCheck brochure describing this program is available to investors at www.FINRA.org. |
1044-12/12 FRSRC
| | |
Eaton Vance Floating-Rate & High Income Fund Annual Report October 31, 2012 | | 
|

Fund shares are not insured by the FDIC and are not deposits or other obligations of, or guaranteed by, any depository institution. Shares are subject to investment risks, including possible loss of principal invested.
This report must be preceded or accompanied by a current summary prospectus or prospectus. Before investing, investors should consider carefully the investment objective, risks, and charges and expenses of a mutual fund. This and other important information is contained in the summary prospectus and prospectus, which can be obtained from a financial advisor. Prospective investors should read the prospectus carefully before investing. For further information, please call 1-800-262-1122.
Annual Report October 31, 2012
Eaton Vance
Floating-Rate & High Income Fund
Table of Contents
| | | | |
Management’s Discussion of Fund Performance | | | 2 | |
| |
Performance | | | 3 | |
| |
Fund Profile | | | 4 | |
| |
Endnotes and Additional Disclosures | | | 5 | |
| |
Fund Expenses | | | 6 | |
| |
Financial Statements | | | 7 | |
| |
Report of Independent Registered Public Accounting Firm | | | 20 and 50 | |
| |
Federal Tax Information | | | 21 | |
| |
Management and Organization | | | 51 | |
| |
Important Notices | | | 54 | |
Eaton Vance
Floating-Rate & High Income Fund
October 31, 2012
Management’s Discussion of Fund Performance1
Economic and Market Conditions
The U.S. floating-rate loan market generated solid results for the 12-month period ended October 31, 2012, as measured by the 8.48% return of the S&P/LSTA Leveraged Loan Index,2 a broad barometer of the asset class. Returns of the Index reflected an increase in loan prices, plus investment income.
Throughout the past 12 months, the floating-rate market exhibited resilience amid low U.S. economic growth and uncertainty regarding U.S. fiscal policy. This resilience was due to favorable market technical and fundamental conditions. The net supply of floating-rate loans was moderate, as loan repayments by issuers helped offset new issue supply coming to market. At the same time, demand strengthened. Improved economic data and the U.S. Federal Reserve’s pledge to keep interest rates low appeared to have fueled investors’ appetite for higher-yielding alternatives to government bonds. Other investors turned to floating-rate loans for protection against potentially rising interest rates. In the institutional market, buying by pension funds, hedge funds, structured vehicles, and other institutional investors, such as value crossover strategies, also expanded as the period progressed. For the period overall, the modest growth in the overall supply of loans was easily absorbed due to widespread investor demand.
In terms of issuer fundamentals, improving corporate balance sheets and better-than-expected earnings growth also helped bolster loans. Furthermore, the default rate in the market remained well below longer-term averages, ending October 31, 2012 at 1.1% by principal amount on a last-12-months basis, according to S&P Leveraged Commentary & Data (LCD).
Fund Performance
For the fiscal year ended October 31, 2012, Eaton Vance Floating-Rate & High Income Fund’s (the Fund) Class A shares at net asset value (NAV) had a total return of 8.04%. By comparison, the Fund’s benchmark, the S&P/LSTA Leveraged Loan Index (the Index), gained 8.48% during the period.
The Fund’s underweight to the lower-quality segment of the loan market detracted from performance relative to the Index. Specifically, the Fund’s holdings were biased toward higher-quality BB- and B-rated7 loans. At the same time, the Fund had an underweight to CCC-rated loans. For the year, BB-rated loans in the Index returned 6.60%, B-rated loans in the Index gained 10.12% and CCC-rated loans in the Index rose 9.93%.
Within the BB- and B-rated space, the Fund had a more pronounced overweight to the higher-rated BB-ratings tier, providing a further drag on relative results versus the Index.
Additionally, the Fund’s underweight exposure to loans of publishing and financial intermediaries — which outperformed the broad market — and overweight exposure to the loans of leisure goods/activities/movies segment — which underperformed the broad market — detracted from performance relative to the Index.
Contributing to relative performance versus the Index was the Fund’s allocation to high-yield bonds, as bonds outperformed loans during the period. Additionally, some notable industry positions bolstered relative results versus the Index. Underweight exposures to utilities and telecommunications helped bolster results versus the Index because these segments underperformed the overall loan market.
See Endnotes and Additional Disclosures in this report.
Past performance is no guarantee of future results. Returns are historical and are calculated by determining the percentage change in net asset value (NAV) or offering price (as applicable) with all distributions reinvested. Investment return and principal value will fluctuate so that shares, when redeemed, may be worth more or less than their original cost. Performance less than one year is cumulative. Performance is for the stated time period only; due to market volatility, the Fund’s current performance may be lower or higher than quoted. Returns are before taxes unless otherwise noted. For performance as of the most recent month end, please refer to www.eatonvance.com.
Eaton Vance
Floating-Rate & High Income Fund
October 31, 2012
Performance2,3
Portfolio Managers Scott H. Page, CFA, Craig P. Russ and Michael W. Weilheimer, CFA
| | | | | | | | | | | | | | | | | | | | |
| % Average Annual Total Returns | | Inception Date | | | One Year | | | Five Years | | | Ten Years | | | Since
Inception | |
Advisers Class at NAV | | | 09/07/2000 | | | | 8.01 | % | | | 4.24 | % | | | 5.10 | % | | | — | |
Class A at NAV | | | 05/07/2003 | | | | 8.04 | | | | 4.24 | | | | — | | | | 4.79 | % |
Class A with 2.25% Maximum Sales Charge | | | — | | | | 5.63 | | | | 3.77 | | | | — | | | | 4.53 | |
Class B at NAV | | | 09/05/2000 | | | | 7.18 | | | | 3.46 | | | | 4.31 | | | | — | |
Class B with 5% Maximum Sales Charge | | | — | | | | 2.18 | | | | 3.13 | | | | 4.31 | | | | — | |
Class C at NAV | | | 09/05/2000 | | | | 7.21 | | | | 3.44 | | | | 4.30 | | | | — | |
Class C with 1% Maximum Sales Charge | | | — | | | | 6.21 | | | | 3.44 | | | | 4.30 | | | | — | |
Class I at NAV | | | 09/15/2000 | | | | 8.28 | | | | 4.49 | | | | 5.36 | | | | — | |
S&P/LSTA Leveraged Loan Index | | | — | | | | 8.48 | % | | | 5.21 | % | | | 5.88 | % | | | — | |
| | | | | |
| | | | | | | | | | | | | | | | | | | | |
| % Total Annual Operating Expense Ratios4 | | Advisers Class | | | Class A | | | Class B | | | Class C | | | Class I | |
| | | 1.09 | % | | | 1.10 | % | | | 1.84 | % | | | 1.84 | % | | | 0.84 | % |
Performance of $10,000
This graph shows the change in value of a hypothetical investment of $10,000 in Class C of the Fund for the period indicated. For comparison, the same investment is shown in the indicated index.
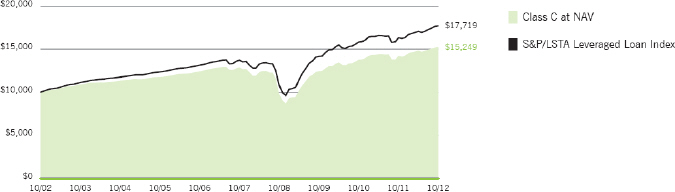
| | | | | | | | |
| Performance of Investment | | Amount Invested | | Period Beginning | | At NAV | | With Maximum
Sales Charge |
Advisers Class | | $10,000 | | 10/31/2002 | | $16,447 | | N.A. |
Class A | | $10,000 | | 05/07/2003 | | $15,583 | | $15,233 |
Class B | | $10,000 | | 10/31/2002 | | $15,260 | | N.A. |
Class I | | $250,000 | | 10/31/2002 | | $421,451 | | N.A. |
See Endnotes and Additional Disclosures in this report.
Past performance is no guarantee of future results. Returns are historical and are calculated by determining the percentage change in net asset value (NAV) or offering price (as applicable) with all distributions reinvested. Investment return and principal value will fluctuate so that shares, when redeemed, may be worth more or less than their original cost. Performance less than one year is cumulative. Performance is for the stated time period only; due to market volatility, the Fund’s current performance may be lower or higher than quoted. Returns are before taxes unless otherwise noted. For performance as of the most recent month end, please refer to www.eatonvance.com.
Eaton Vance
Floating-Rate & High Income Fund
October 31, 2012
Fund Profile
Top 10 Holdings (% of total investments)5,6
| | | | |
Rite Aid Corporation | | | 1.0 | % |
Intelsat Jackson Holdings Ltd. | | | 1.0 | |
Asurion LLC | | | 1.0 | |
HCA, Inc. | | | 0.9 | |
Alliance Boots Holdings Limited | | | 0.9 | |
Del Monte Foods Company | | | 0.9 | |
Hertz Corporation (The) | | | 0.9 | |
MetroPCS Wireless, Inc. | | | 0.8 | |
Infor (US), Inc. | | | 0.8 | |
Chrysler Group LLC | | | 0.7 | |
Total | | | 8.9 | % |
Top 10 Sectors (% of total investments)5,6
| | | | |
Health Care | | | 12.4 | % |
Business Equipment and Services | | | 8.2 | |
Electronics/Electrical | | | 5.7 | |
Automotive | | | 4.4 | |
Chemicals and Plastics | | | 4.0 | |
Telecommunications | | | 3.9 | |
Publishing | | | 3.8 | |
Leisure Goods/Activities/Movies | | | 3.7 | |
Food Products | | | 3.5 | |
Food Service | | | 3.5 | |
Total | | | 53.1 | % |
See Endnotes and Additional Disclosures in this report.
Eaton Vance
Floating-Rate & High Income Fund
October 31, 2012
Endnotes and Additional Disclosures
| 1 | The views expressed in this report are those of the portfolio manager(s) and are current only through the date stated at the top of this page. These views are subject to change at any time based upon market or other conditions, and Eaton Vance and the Fund(s) disclaim any responsibility to update such views. These views may not be relied upon as investment advice and, because investment decisions are based on many factors, may not be relied upon as an indication of trading intent on behalf of any Eaton Vance fund. This commentary may contain statements that are not historical facts, referred to as “forward looking statements”. The Fund’s actual future results may differ significantly from those stated in any forward looking statement, depending on factors such as changes in securities or financial markets or general economic conditions, the volume of sales and purchases of Fund shares, the continuation of investment advisory, administrative and service contracts, and other risks discussed from time to time in the Fund’s filings with the Securities and Exchange Commission. |
| 2 | S&P/LSTA Leveraged Loan Index is an unmanaged index of the institutional leveraged loan market. Unless otherwise stated, index returns do not reflect the effect of any applicable sales charges, commissions, expenses, taxes or leverage, as applicable. It is not possible to invest directly in an index. |
| 3 | Total Returns at NAV do not include applicable sales charges. If sales charges were deducted, the returns would be lower. Total Returns shown with maximum sales charge reflect the stated maximum sales charge. Unless otherwise stated, performance does not reflect the deduction of taxes on Fund distributions or redemptions of Fund shares. |
| 4 | Source: Fund prospectus. |
| 5 | The Fund invests in one or more affiliated investment companies (Portfolios). References to investments are to the Floating Rate Portfolio. |
| 6 | Excludes cash and cash equivalents. |
| 7 | Ratings are based on Moody’s, S&P or Fitch, as applicable. Credit ratings are based largely on the rating agency’s investment analysis at the time of rating and the rating assigned to any particular security is not necessarily a reflection of the issuer’s current financial condition. The rating assigned to a security by a rating agency does not necessarily reflect its assessment of the volatility of a security’s market value or of the liquidity of an investment in the security. If securities are rated differently by the rating agencies, the higher rating is applied. Ratings of BBB or higher by Standard and Poor’s or Fitch (Baa or higher by Moody’s) are considered to be investment grade quality. |
| | Fund profile subject to change due to active management. |
Eaton Vance
Floating-Rate & High Income Fund
October 31, 2012
Fund Expenses
Example: As a Fund shareholder, you incur two types of costs: (1) transaction costs, including sales charges (loads) on purchases and redemption fees (if applicable); and (2) ongoing costs, including management fees; distribution and/or service fees; and other Fund expenses. This Example is intended to help you understand your ongoing costs (in dollars) of Fund investing and to compare these costs with the ongoing costs of investing in other mutual funds. The Example is based on an investment of $1,000 invested at the beginning of the period and held for the entire period (May 1, 2012 – October 31, 2012).
Actual Expenses: The first section of the table below provides information about actual account values and actual expenses. You may use the information in this section, together with the amount you invested, to estimate the expenses that you paid over the period. Simply divide your account value by $1,000 (for example, an $8,600 account value divided by $1,000 = 8.6), then multiply the result by the number in the first section under the heading entitled “Expenses Paid During Period” to estimate the expenses you paid on your account during this period.
Hypothetical Example for Comparison Purposes: The second section of the table below provides information about hypothetical account values and hypothetical expenses based on the actual Fund expense ratio and an assumed rate of return of 5% per year (before expenses), which is not the actual Fund return. The hypothetical account values and expenses may not be used to estimate the actual ending account balance or expenses you paid for the period. You may use this information to compare the ongoing costs of investing in your Fund and other funds. To do so, compare this 5% hypothetical example with the 5% hypothetical examples that appear in the shareholder reports of the other funds.
Please note that the expenses shown in the table are meant to highlight your ongoing costs only and do not reflect any transactional costs, such as sales charges (loads) or redemption fees (if applicable). Therefore, the second section of the table is useful in comparing ongoing costs only, and will not help you determine the relative total costs of owning different funds. In addition, if these transactional costs were included, your costs would be higher.
| | | | | | | | | | | | | | | | |
| | | Beginning
Account Value
(5/1/12) | | | Ending
Account Value
(10/31/12) | | | Expenses Paid
During Period*
(5/1/12 – 10/31/12) | | | Annualized
Expense
Ratio | |
| | | | |
| | | | | | | | | | | | | | | | |
Actual | | | | | | | | | | | | | |
Advisers Class | | $ | 1,000.00 | | | $ | 1,033.10 | | | $ | 5.42 | | | | 1.06 | % |
Class A | | $ | 1,000.00 | | | $ | 1,033.60 | | | $ | 5.42 | | | | 1.06 | % |
Class B | | $ | 1,000.00 | | | $ | 1,030.20 | | | $ | 9.34 | | | | 1.83 | % |
Class C | | $ | 1,000.00 | | | $ | 1,029.20 | | | $ | 9.23 | | | | 1.81 | % |
Class I | | $ | 1,000.00 | | | $ | 1,035.50 | | | $ | 4.14 | | | | 0.81 | % |
| | | | | | | | | | | | | | | | | |
| | | | |
| | | | | | | | | | | | | | | | |
Hypothetical | | | | | | | | | | | | | |
(5% return per year before expenses) | | | | | | | | | | | | | |
Advisers Class | | $ | 1,000.00 | | | $ | 1,019.80 | | | $ | 5.38 | | | | 1.06 | % |
Class A | | $ | 1,000.00 | | | $ | 1,019.80 | | | $ | 5.38 | | | | 1.06 | % |
Class B | | $ | 1,000.00 | | | $ | 1,015.90 | | | $ | 9.27 | | | | 1.83 | % |
Class C | | $ | 1,000.00 | | | $ | 1,016.00 | | | $ | 9.17 | | | | 1.81 | % |
Class I | | $ | 1,000.00 | | | $ | 1,021.10 | | | $ | 4.12 | | | | 0.81 | % |
| * | Expenses are equal to the Fund’s annualized expense ratio for the indicated Class, multiplied by the average account value over the period, multiplied by 184/366 (to reflect the one-half year period). The Example assumes that the $1,000 was invested at the net asset value per share determined at the close of business on April 30, 2012. The Example reflects the expenses of both the Fund and the Portfolios. |
Eaton Vance
Floating-Rate & High Income Fund
October 31, 2012
Statement of Assets and Liabilities
| | | | |
| Assets | | October 31, 2012 | |
Investment in Floating Rate Portfolio, at value (identified cost, $973,376,654) | | $ | 952,853,426 | |
Investment in High Income Opportunities Portfolio, at value (identified cost, $176,169,913) | | | 181,401,442 | |
Receivable for Fund shares sold | | | 2,503,435 | |
Total assets | | $ | 1,136,758,303 | |
|
| Liabilities | |
Payable for Fund shares redeemed | | $ | 2,450,916 | |
Distributions payable | | | 550,541 | |
Payable to affiliates: | | | | |
Distribution and service fees | | | 306,768 | |
Administration fee | | | 141,388 | |
Trustees’ fees | | | 42 | |
Accrued expenses | | | 207,226 | |
Total liabilities | | $ | 3,656,881 | |
Net Assets | | $ | 1,133,101,422 | |
| |
| Sources of Net Assets | | | | |
Paid-in capital | | $ | 1,264,513,972 | |
Accumulated net realized loss from Portfolios | | | (116,255,462 | ) |
Accumulated undistributed net investment income | | | 134,611 | |
Net unrealized depreciation from Portfolios | | | (15,291,699 | ) |
Total | | $ | 1,133,101,422 | |
| |
| Advisers Class Shares | | | | |
Net Assets | | $ | 201,735,338 | |
Shares Outstanding | | | 22,611,662 | |
Net Asset Value, Offering Price and Redemption Price Per Share | | | | |
(net assets ÷ shares of beneficial interest outstanding) | | $ | 8.92 | |
|
| Class A Shares | |
Net Assets | | $ | 386,870,023 | |
Shares Outstanding | | | 40,763,472 | |
Net Asset Value and Redemption Price Per Share | | | | |
(net assets ÷ shares of beneficial interest outstanding) | | $ | 9.49 | |
Maximum Offering Price Per Share | | | | |
(100 ÷ 97.75 of net asset value per share) | | $ | 9.71 | |
|
| Class B Shares | |
Net Assets | | $ | 11,025,801 | |
Shares Outstanding | | | 1,237,349 | |
Net Asset Value and Offering Price Per Share* | | | | |
(net assets ÷ shares of beneficial interest outstanding) | | $ | 8.91 | |
|
| Class C Shares | |
Net Assets | | $ | 205,424,779 | |
Shares Outstanding | | | 23,072,623 | |
Net Asset Value and Offering Price Per Share* | | | | |
(net assets ÷ shares of beneficial interest outstanding) | | $ | 8.90 | |
|
| Class I Shares | |
Net Assets | | $ | 328,045,481 | |
Shares Outstanding | | | 36,746,882 | |
Net Asset Value, Offering Price and Redemption Price Per Share | | | | |
(net assets ÷ shares of beneficial interest outstanding) | | $ | 8.93 | |
On sales of $100,000 or more, the offering price of Class A shares is reduced.
| * | Redemption price per share is equal to the net asset value less any applicable contingent deferred sales charge. |
| | | | |
| | 7 | | See Notes to Financial Statements. |
Eaton Vance
Floating-Rate & High Income Fund
October 31, 2012
Statement of Operations
| | | | |
| Investment Income | | Year Ended
October 31, 2012 | |
Interest and other income allocated from Portfolios | | $ | 57,844,099 | |
Dividends allocated from Portfolios (net of foreign taxes, $3,686) | | | 760,204 | |
Expenses allocated from Portfolios | | | (5,634,085 | ) |
Total investment income from Portfolios | | $ | 52,970,218 | |
| |
| Expenses | | | | |
Administration fee | | $ | 1,545,429 | |
Distribution and service fees | | | | |
Advisers Class | | | 480,448 | |
Class A | | | 889,599 | |
Class B | | | 144,523 | |
Class C | | | 2,045,468 | |
Trustees’ fees and expenses | | | 500 | |
Custodian fee | | | 47,949 | |
Transfer and dividend disbursing agent fees | | | 747,731 | |
Legal and accounting services | | | 38,676 | |
Printing and postage | | | 251,759 | |
Registration fees | | | 130,543 | |
Miscellaneous | | | 19,480 | |
Total expenses | | $ | 6,342,105 | |
| |
Net investment income | | $ | 46,628,113 | |
| |
| Realized and Unrealized Gain (Loss) from Portfolios | | | | |
Net realized gain (loss) — | | | | |
Investment transactions | | $ | 3,806,510 | |
Swap contracts | | | (110,143 | ) |
Foreign currency and forward foreign currency exchange transactions | | | 2,714,071 | |
Net realized gain | | $ | 6,410,438 | |
Change in unrealized appreciation (depreciation) — | | | | |
Investments | | $ | 25,209,578 | |
Swap contracts | | | 188,181 | |
Foreign currency and forward foreign currency exchange contracts | | | (729,188 | ) |
Net change in unrealized appreciation (depreciation) | | $ | 24,668,571 | |
| |
Net realized and unrealized gain | | $ | 31,079,009 | |
| |
Net increase in net assets from operations | | $ | 77,707,122 | |
| | | | |
| | 8 | | See Notes to Financial Statements. |
Eaton Vance
Floating-Rate & High Income Fund
October 31, 2012
Statements of Changes in Net Assets
| | | | | | | | |
| | | Year Ended October 31, | |
| Increase (Decrease) in Net Assets | | 2012 | | | 2011 | |
From operations — | | | | | | | | |
Net investment income | | $ | 46,628,113 | | | $ | 47,065,050 | |
Net realized gain (loss) from investment transactions, securities sold short, swap contracts and foreign currency and forward foreign currency exchange contract transactions | | | 6,410,438 | | | | (12,080,505 | ) |
Net change in unrealized appreciation (depreciation) from investments, swap contracts and foreign currency and forward foreign currency exchange contracts | | | 24,668,571 | | | | (5,706,866 | ) |
Net increase in net assets from operations | | $ | 77,707,122 | | | $ | 29,277,679 | |
Distributions to shareholders — | | | | | | | | |
From net investment income | | | | | | | | |
Advisers Class | | $ | (8,929,879 | ) | | $ | (9,969,342 | ) |
Class A | | | (16,560,429 | ) | | | (17,015,809 | ) |
Class B | | | (557,657 | ) | | | (838,270 | ) |
Class C | | | (7,972,268 | ) | | | (8,047,851 | ) |
Class I | | | (12,901,904 | ) | | | (10,870,097 | ) |
Tax return of capital | | | | | | | | |
Advisers Class | | | — | | | | (421,854 | ) |
Class A | | | — | | | | (720,026 | ) |
Class B | | | — | | | | (35,471 | ) |
Class C | | | — | | | | (340,546 | ) |
Class I | | | — | | | | (459,970 | ) |
Total distributions to shareholders | | $ | (46,922,137 | ) | | $ | (48,719,236 | ) |
Transactions in shares of beneficial interest — | | | | | | | | |
Proceeds from sale of shares | | | | | | | | |
Advisers Class | | $ | 74,518,169 | | | $ | 114,233,761 | |
Class A | | | 128,870,267 | | | | 354,742,048 | |
Class B | | | 328,191 | | | | 3,478,608 | |
Class C | | | 24,612,510 | | | | 57,675,237 | |
Class I | | | 190,333,738 | | | | 261,226,160 | |
Net asset value of shares issued to shareholders in payment of distributions declared | | | | | | | | |
Advisers Class | | | 8,702,411 | | | | 9,578,996 | |
Class A | | | 15,152,443 | | | | 15,137,271 | |
Class B | | | 446,559 | | | | 568,511 | |
Class C | | | 6,055,225 | | | | 5,918,414 | |
Class I | | | 8,860,653 | | | | 5,681,011 | |
Cost of shares redeemed | | | | | | | | |
Advisers Class | | | (74,467,408 | ) | | | (125,611,117 | ) |
Class A | | | (251,668,458 | ) | | | (139,386,614 | ) |
Class B | | | (2,808,462 | ) | | | (5,349,090 | ) |
Class C | | | (43,083,129 | ) | | | (48,179,629 | ) |
Class I | | | (113,649,363 | ) | | | (150,328,532 | ) |
Net asset value of shares exchanged | | | | | | | | |
Class A | | | 5,990,599 | | | | 4,064,580 | |
Class B | | | (5,990,599 | ) | | | (4,064,580 | ) |
Redemption fees | | | — | | | | 11,492 | |
Net increase (decrease) in net assets from Fund share transactions | | $ | (27,796,654 | ) | | $ | 359,396,527 | |
| | |
Net increase in net assets | | $ | 2,988,331 | | | $ | 339,954,970 | |
|
| Net Assets | |
At beginning of year | | $ | 1,130,113,091 | | | $ | 790,158,121 | |
At end of year | | $ | 1,133,101,422 | | | $ | 1,130,113,091 | |
|
Accumulated undistributed (distributions in excess of) net investment income included in net assets | |
At end of year | | $ | 134,611 | | | $ | (868,967 | ) |
| | | | |
| | 9 | | See Notes to Financial Statements. |
Eaton Vance
Floating-Rate & High Income Fund
October 31, 2012
Financial Highlights
| | | | | | | | | | | | | | | | | | | | |
| | | Advisers Class | |
| | | Year Ended October 31, | |
| | | 2012 | | | 2011 | | | 2010 | | | 2009 | | | 2008 | |
Net asset value — Beginning of year | | $ | 8.650 | | | $ | 8.700 | | | $ | 8.260 | | | $ | 6.810 | | | $ | 9.450 | |
| | | | | |
| Income (Loss) From Operations | | | | | | | | | | | | | | | | | | | | |
Net investment income(1) | | $ | 0.405 | | | $ | 0.384 | | | $ | 0.395 | | | $ | 0.390 | | | $ | 0.551 | |
Net realized and unrealized gain (loss) | | | 0.272 | | | | (0.034 | ) | | | 0.519 | | | | 1.444 | | | | (2.662 | ) |
| | | | | |
Total income (loss) from operations | | $ | 0.677 | | | $ | 0.350 | | | $ | 0.914 | | | $ | 1.834 | | | $ | (2.111 | ) |
| | | | | |
| Less Distributions | | | | | | | | | | | | | | | | | | | | |
From net investment income | | $ | (0.407 | ) | | $ | (0.384 | ) | | $ | (0.474 | ) | | $ | (0.388 | ) | | $ | (0.469 | ) |
Tax return of capital | | | — | | | | (0.016 | ) | | | — | | | | — | | | | (0.068 | ) |
| | | | | |
Total distributions | | $ | (0.407 | ) | | $ | (0.400 | ) | | $ | (0.474 | ) | | $ | (0.388 | ) | | $ | (0.537 | ) |
| | | | | |
Redemption fees(1) | | $ | — | | | $ | 0.000 | (2) | | $ | 0.000 | (2) | | $ | 0.004 | | | $ | 0.008 | |
| | | | | |
Net asset value — End of year | | $ | 8.920 | | | $ | 8.650 | | | $ | 8.700 | | | $ | 8.260 | | | $ | 6.810 | |
| | | | | |
Total Return(3) | | | 8.01 | % | | | 4.06 | % | | | 11.50 | % | | | 28.05 | % | | | (23.29 | )% |
| | | | | |
| Ratios/Supplemental Data | | | | | | | | | | | | | | | | | | | | |
Net assets, end of year (000’s omitted) | | $ | 201,735 | | | $ | 187,220 | | | $ | 192,804 | | | $ | 134,367 | | | $ | 154,101 | |
Ratios (as a percentage of average daily net assets): | | | | | | | | | | | | | | | | | | | | |
Expenses(4)(5) | | | 1.07 | % | | | 1.09 | % | | | 1.11 | % | | | 1.20 | % | | | 1.22 | % |
Net investment income | | | 4.62 | % | | | 4.38 | % | | | 4.65 | % | | | 5.56 | % | | | 6.28 | % |
Portfolio Turnover of the Fund(6) | | | 15 | % | | | 20 | % | | | 15 | % | | | 15 | % | | | 8 | % |
Portfolio Turnover of Floating Rate Portfolio | | | 42 | % | | | 56 | % | | | 39 | % | | | 35 | % | | | 7 | % |
Portfolio Turnover of High Income Opportunities Portfolio | | | 76 | % | | | 78 | % | | | 79 | % | | | 72 | % | | | 48 | % |
| (1) | Computed using average shares outstanding. |
| (2) | Amount is less than $0.0005. |
| (3) | Returns are historical and are calculated by determining the percentage change in net asset value with all distributions reinvested. |
| (4) | Includes the Fund’s share of the Portfolios’ allocated expenses. |
| (5) | Excludes the effect of custody fee credits, if any, of less than 0.005%. |
| (6) | Percentage is based on the Fund’s contributions to and withdrawals from the Portfolios and excludes the investment activity of the Portfolios. |
| | | | |
| | 10 | | See Notes to Financial Statements. |
Eaton Vance
Floating-Rate & High Income Fund
October 31, 2012
Financial Highlights — continued
| | | | | | | | | | | | | | | | | | | | |
| | | Class A | |
| | | Year Ended October 31, | |
| | | 2012 | | | 2011 | | | 2010 | | | 2009 | | | 2008 | |
Net asset value — Beginning of year | | $ | 9.200 | | | $ | 9.260 | | | $ | 8.780 | | | $ | 7.240 | | | $ | 10.050 | |
| | | | | |
| Income (Loss) From Operations | | | | | | | | | | | | | | | | | | | | |
Net investment income(1) | | $ | 0.432 | | | $ | 0.405 | | | $ | 0.420 | | | $ | 0.413 | | | $ | 0.591 | |
Net realized and unrealized gain (loss) | | | 0.291 | | | | (0.041 | ) | | | 0.560 | | | | 1.536 | | | | (2.838 | ) |
| | | | | |
Total income (loss) from operations | | $ | 0.723 | | | $ | 0.364 | | | $ | 0.980 | | | $ | 1.949 | | | $ | (2.247 | ) |
| | | | | |
| Less Distributions | | | | | | | | | | | | | | | | | | | | |
From net investment income | | $ | (0.433 | ) | | $ | (0.407 | ) | | $ | (0.500 | ) | | $ | (0.413 | ) | | $ | (0.498 | ) |
Tax return of capital | | | — | | | | (0.017 | ) | | | — | | | | — | | | | (0.073 | ) |
| | | | | |
Total distributions | | $ | (0.433 | ) | | $ | (0.424 | ) | | $ | (0.500 | ) | | $ | (0.413 | ) | | $ | (0.571 | ) |
| | | | | |
Redemption fees(1) | | $ | — | | | $ | 0.000 | (2) | | $ | 0.000 | (2) | | $ | 0.004 | | | $ | 0.008 | |
| | | | | |
Net asset value — End of year | | $ | 9.490 | | | $ | 9.200 | | | $ | 9.260 | | | $ | 8.780 | | | $ | 7.240 | |
| | | | | |
Total Return(3) | | | 8.04 | % | | | 3.97 | % | | | 11.46 | % | | | 28.18 | % | | | (23.31 | )% |
| | | | | |
| Ratios/Supplemental Data | | | | | | | | | | | | | | | | | | | | |
Net assets, end of year (000’s omitted) | | $ | 386,870 | | | $ | 478,213 | | | $ | 252,028 | | | $ | 180,646 | | | $ | 144,591 | |
Ratios (as a percentage of average daily net assets): | | | | | | | | | | | | | | | | | | | | |
Expenses(4)(5) | | | 1.07 | % | | | 1.10 | % | | | 1.11 | % | | | 1.20 | % | | | 1.22 | % |
Net investment income | | | 4.63 | % | | | 4.36 | % | | | 4.65 | % | | | 5.47 | % | | | 6.35 | % |
Portfolio Turnover of the Fund(6) | | | 15 | % | | | 20 | % | | | 15 | % | | | 15 | % | | | 8 | % |
Portfolio Turnover of Floating Rate Portfolio | | | 42 | % | | | 56 | % | | | 39 | % | | | 35 | % | | | 7 | % |
Portfolio Turnover of High Income Opportunities Portfolio | | | 76 | % | | | 78 | % | | | 79 | % | | | 72 | % | | | 48 | % |
| (1) | Computed using average shares outstanding. |
| (2) | Amount is less than $0.0005. |
| (3) | Returns are historical and are calculated by determining the percentage change in net asset value with all distributions reinvested and do not reflect the effect of sales charges. |
| (4) | Includes the Fund’s share of the Portfolios’ allocated expenses. |
| (5) | Excludes the effect of custody fee credits, if any, of less than 0.005%. |
| (6) | Percentage is based on the Fund’s contributions to and withdrawals from the Portfolios and excludes the investment activity of the Portfolios. |
| | | | |
| | 11 | | See Notes to Financial Statements. |
Eaton Vance
Floating-Rate & High Income Fund
October 31, 2012
Financial Highlights — continued
| | | | | | | | | | | | | | | | | | | | |
| | | Class B | |
| | | Year Ended October 31, | |
| | | 2012 | | | 2011 | | | 2010 | | | 2009 | | | 2008 | |
Net asset value — Beginning of year | | $ | 8.640 | | | $ | 8.690 | | | $ | 8.250 | | | $ | 6.810 | | | $ | 9.450 | |
| | | | | |
| Income (Loss) From Operations | | | | | | | | | | | | | | | | | | | | |
Net investment income(1) | | $ | 0.337 | | | $ | 0.319 | | | $ | 0.333 | | | $ | 0.348 | | | $ | 0.487 | |
Net realized and unrealized gain (loss) | | | 0.272 | | | | (0.033 | ) | | | 0.519 | | | | 1.425 | | | | (2.661 | ) |
| | | | | |
Total income (loss) from operations | | $ | 0.609 | | | $ | 0.286 | | | $ | 0.852 | | | $ | 1.773 | | | $ | (2.174 | ) |
| | | | | |
| Less Distributions | | | | | | | | | | | | | | | | | | | | |
From net investment income | | $ | (0.339 | ) | | $ | (0.322 | ) | | $ | (0.412 | ) | | $ | (0.337 | ) | | $ | (0.414 | ) |
Tax return of capital | | | — | | | | (0.014 | ) | | | — | | | | — | | | | (0.060 | ) |
| | | | | |
Total distributions | | $ | (0.339 | ) | | $ | (0.336 | ) | | $ | (0.412 | ) | | $ | (0.337 | ) | | $ | (0.474 | ) |
| | | | | |
Redemption fees(1) | | $ | — | | | $ | 0.000 | (2) | | $ | 0.000 | (2) | | $ | 0.004 | | | $ | 0.008 | |
| | | | | |
Net asset value — End of year | | $ | 8.910 | | | $ | 8.640 | | | $ | 8.690 | | | $ | 8.250 | | | $ | 6.810 | |
| | | | | |
Total Return(3) | | | 7.18 | % | | | 3.31 | % | | | 10.58 | % | | | 27.14 | % | | | (23.84 | )% |
| | | | | |
| Ratios/Supplemental Data | | | | | | | | | | | | | | | | | | | | |
Net assets, end of year (000’s omitted) | | $ | 11,026 | | | $ | 18,615 | | | $ | 24,115 | | | $ | 28,490 | | | $ | 46,480 | |
Ratios (as a percentage of average daily net assets): | | | | | | | | | | | | | | | | | | | | |
Expenses(4)(5) | | | 1.83 | % | | | 1.84 | % | | | 1.86 | % | | | 1.95 | % | | | 1.97 | % |
Net investment income | | | 3.85 | % | | | 3.64 | % | | | 3.93 | % | | | 5.03 | % | | | 5.58 | % |
Portfolio Turnover of the Fund(6) | | | 15 | % | | | 20 | % | | | 15 | % | | | 15 | % | | | 8 | % |
Portfolio Turnover of Floating Rate Portfolio | | | 42 | % | | | 56 | % | | | 39 | % | | | 35 | % | | | 7 | % |
Portfolio Turnover of High Income Opportunities Portfolio | | | 76 | % | | | 78 | % | | | 79 | % | | | 72 | % | | | 48 | % |
| (1) | Computed using average shares outstanding. |
| (2) | Amount is less than $0.0005. |
| (3) | Returns are historical and are calculated by determining the percentage change in net asset value with all distributions reinvested and do not reflect the effect of sales charges. |
| (4) | Includes the Fund’s share of the Portfolios’ allocated expenses. |
| (5) | Excludes the effect of custody fee credits, if any, of less than 0.005%. |
| (6) | Percentage is based on the Fund’s contributions to and withdrawals from the Portfolios and excludes the investment activity of the Portfolios. |
| | | | |
| | 12 | | See Notes to Financial Statements. |
Eaton Vance
Floating-Rate & High Income Fund
October 31, 2012
Financial Highlights — continued
| | | | | | | | | | | | | | | | | | | | |
| | | Class C | |
| | | Year Ended October 31, | |
| | | 2012 | | | 2011 | | | 2010 | | | 2009 | | | 2008 | |
Net asset value — Beginning of year | | $ | 8.630 | | | $ | 8.690 | | | $ | 8.240 | | | $ | 6.810 | | | $ | 9.450 | |
| | | | | |
| Income (Loss) From Operations | | | | | | | | | | | | | | | | | | | | |
Net investment income(1) | | $ | 0.338 | | | $ | 0.317 | | | $ | 0.332 | | | $ | 0.339 | | | $ | 0.488 | |
Net realized and unrealized gain (loss) | | | 0.273 | | | | (0.041 | ) | | | 0.530 | | | | 1.424 | | | | (2.663 | ) |
| | | | | |
Total income (loss) from operations | | $ | 0.611 | | | $ | 0.276 | | | $ | 0.862 | | | $ | 1.763 | | | $ | (2.175 | ) |
| | | | | |
| Less Distributions | | | | | | | | | | | | | | | | | | | | |
From net investment income | | $ | (0.341 | ) | | $ | (0.322 | ) | | $ | (0.412 | ) | | $ | (0.337 | ) | | $ | (0.413 | ) |
Tax return of capital | | | — | | | | (0.014 | ) | | | — | | | | — | | | | (0.060 | ) |
| | | | | |
Total distributions | | $ | (0.341 | ) | | $ | (0.336 | ) | | $ | (0.412 | ) | | $ | (0.337 | ) | | $ | (0.473 | ) |
| | | | | |
Redemption fees(1) | | $ | — | | | $ | 0.000 | (2) | | $ | 0.000 | (2) | | $ | 0.004 | | | $ | 0.008 | |
| | | | | |
Net asset value — End of year | | $ | 8.900 | | | $ | 8.630 | | | $ | 8.690 | | | $ | 8.240 | | | $ | 6.810 | |
| | | | | |
Total Return(3) | | | 7.21 | % | | | 3.19 | % | | | 10.72 | % | | | 26.98 | % | | | (23.84 | )% |
| | | | | |
| Ratios/Supplemental Data | | | | | | | | | | | | | | | | | | | | |
Net assets, end of year (000’s omitted) | | $ | 205,425 | | | $ | 211,581 | | | $ | 198,350 | | | $ | 183,193 | | | $ | 177,628 | |
Ratios (as a percentage of average daily net assets): | | | | | | | | | | | | | | | | | | | | |
Expenses(4)(5) | | | 1.82 | % | | | 1.84 | % | | | 1.86 | % | | | 1.95 | % | | | 1.97 | % |
Net investment income | | | 3.87 | % | | | 3.63 | % | | | 3.92 | % | | | 4.82 | % | | | 5.59 | % |
Portfolio Turnover of the Fund(6) | | | 15 | % | | | 20 | % | | | 15 | % | | | 15 | % | | | 8 | % |
Portfolio Turnover of Floating Rate Portfolio | | | 42 | % | | | 56 | % | | | 39 | % | | | 35 | % | | | 7 | % |
Portfolio Turnover of High Income Opportunities Portfolio | | | 76 | % | | | 78 | % | | | 79 | % | | | 72 | % | | | 48 | % |
| (1) | Computed using average shares outstanding. |
| (2) | Amount is less than $0.0005. |
| (3) | Returns are historical and are calculated by determining the percentage change in net asset value with all distributions reinvested and do not reflect the effect of sales charges. |
| (4) | Includes the Fund’s share of the Portfolios’ allocated expenses. |
| (5) | Excludes the effect of custody fee credits, if any, of less than 0.005%. |
| (6) | Percentage is based on the Fund’s contributions to and withdrawals from the Portfolios and excludes the investment activity of the Portfolios. |
| | | | |
| | 13 | | See Notes to Financial Statements. |
Eaton Vance
Floating-Rate & High Income Fund
October 31, 2012
Financial Highlights — continued
| | | | | | | | | | | | | | | | | | | | |
| | | Class I | |
| | | Year Ended October 31, | |
| | | 2012 | | | 2011 | | | 2010 | | | 2009 | | | 2008 | |
Net asset value — Beginning of year | | $ | 8.660 | | | $ | 8.710 | | | $ | 8.260 | | | $ | 6.820 | | | $ | 9.460 | |
| | | | | |
| Income (Loss) From Operations | | | | | | | | | | | | | | | | | | | | |
Net investment income(1) | | $ | 0.427 | | | $ | 0.404 | | | $ | 0.416 | | | $ | 0.399 | | | $ | 0.563 | |
Net realized and unrealized gain (loss) | | | 0.273 | | | | (0.033 | ) | | | 0.528 | | | | 1.442 | | | | (2.652 | ) |
| | | | | |
Total income (loss) from operations | | $ | 0.700 | | | $ | 0.371 | | | $ | 0.944 | | | $ | 1.841 | | | $ | (2.089 | ) |
| | | | | |
| Less Distributions | | | | | | | | | | | | | | | | | | | | |
From net investment income | | $ | (0.430 | ) | | $ | (0.404 | ) | | $ | (0.494 | ) | | $ | (0.405 | ) | | $ | (0.490 | ) |
Tax return of capital | | | — | | | | (0.017 | ) | | | — | | | | — | | | | (0.069 | ) |
| | | | | |
Total distributions | | $ | (0.430 | ) | | $ | (0.421 | ) | | $ | (0.494 | ) | | $ | (0.405 | ) | | $ | (0.559 | ) |
| | | | | |
Redemption fees(1) | | $ | — | | | $ | 0.000 | (2) | | $ | 0.000 | (2) | | $ | 0.004 | | | $ | 0.008 | |
| | | | | |
Net asset value — End of year | | $ | 8.930 | | | $ | 8.660 | | | $ | 8.710 | | | $ | 8.260 | | | $ | 6.820 | |
| | | | | |
Total Return(3) | | | 8.28 | % | | | 4.31 | % | | | 11.76 | % | | | 28.31 | % | | | (23.06 | )% |
| | | | | |
| Ratios/Supplemental Data | | | | | | | | | | | | | | | | | | | | |
Net assets, end of year (000’s omitted) | | $ | 328,045 | | | $ | 234,483 | | | $ | 122,861 | | | $ | 76,745 | | | $ | 20,854 | |
Ratios (as a percentage of average daily net assets): | | | | | | | | | | | | | | | | | | | | |
Expenses(4)(5) | | | 0.82 | % | | | 0.84 | % | | | 0.86 | % | | | 0.96 | % | | | 0.94 | % |
Net investment income | | | 4.87 | % | | | 4.61 | % | | | 4.89 | % | | | 5.69 | % | | | 6.47 | % |
Portfolio Turnover of the Fund(6) | | | 15 | % | | | 20 | % | | | 15 | % | | | 15 | % | | | 8 | % |
Portfolio Turnover of Floating Rate Portfolio | | | 42 | % | | | 56 | % | | | 39 | % | | | 35 | % | | | 7 | % |
Portfolio Turnover of High Income Opportunities Portfolio | | | 76 | % | | | 78 | % | | | 79 | % | | | 72 | % | | | 48 | % |
| (1) | Computed using average shares outstanding. |
| (2) | Amount is less than $0.0005. |
| (3) | Returns are historical and are calculated by determining the percentage change in net asset value with all distributions reinvested. |
| (4) | Includes the Fund’s share of the Portfolios’ allocated expenses. |
| (5) | Excludes the effect of custody fee credits, if any, of less than 0.005%. |
| (6) | Percentage is based on the Fund’s contributions to and withdrawals from the Portfolios and excludes the investment activity of the Portfolios. |
| | | | |
| | 14 | | See Notes to Financial Statements. |
Eaton Vance
Floating-Rate & High Income Fund
October 31, 2012
Notes to Financial Statements
1 Significant Accounting Policies
Eaton Vance Floating-Rate & High Income Fund (the Fund) is a diversified series of Eaton Vance Mutual Funds Trust (the Trust). The Trust is a Massachusetts business trust registered under the Investment Company Act of 1940, as amended (the 1940 Act), as an open-end management investment company. The Fund offers five classes of shares. Class A shares are generally sold subject to a sales charge imposed at time of purchase. Class B and Class C shares are sold at net asset value and are generally subject to a contingent deferred sales charge (see Note 5). The Advisers Class and Class I shares are sold at net asset value and are not subject to a sales charge. Class B shares automatically convert to Class A shares eight years after their purchase as described in the Fund’s prospectus. Beginning January 1, 2012, Class B shares are only available for purchase upon exchange from another Eaton Vance fund or through reinvestment of distributions. Each class represents a pro-rata interest in the Fund, but votes separately on class-specific matters and (as noted below) is subject to different expenses. Realized and unrealized gains and losses are allocated daily to each class of shares based on the relative net assets of each class to the total net assets of the Fund. Net investment income, other than class-specific expenses, is allocated daily to each class of shares based upon the ratio of the value of each class’s paid shares to the total value of all paid shares. Each class of shares differs in its distribution plan and certain other class-specific expenses. The Fund’s investment objective is to provide a high level of current income. The Fund currently pursues its objective by investing all of its investable assets in interests in the following two portfolios managed by Eaton Vance Management (EVM) or its affiliates: Floating Rate Portfolio and High Income Opportunities Portfolio (the Portfolios), which are Massachusetts business trusts. The value of the Fund’s investments in the Portfolios reflects the Fund’s proportionate interest in the net assets of Floating Rate Portfolio and High Income Opportunities Portfolio (10.1% and 19.1%, respectively, at October 31, 2012). The performance of the Fund is directly affected by the performance of the Portfolios. The financial statements of Floating Rate Portfolio, including the portfolio of investments, are included elsewhere in this report and should be read in conjunction with the Fund’s financial statements. A copy of High Income Opportunities Portfolio’s financial statements is available on the EDGAR database on the Securities and Exchange Commission’s website (www.sec.gov), at the Commission’s public reference room in Washington, D.C. or upon request from the Fund’s principal underwriter, Eaton Vance Distributors, Inc. (EVD), by calling 1-800-262-1122.
The following is a summary of significant accounting policies of the Fund. The policies are in conformity with accounting principles generally accepted in the United States of America.
A Investment Valuation — Valuation of securities by Floating Rate Portfolio is discussed in Note 1A of the Portfolio’s Notes to Financial Statements, which are included elsewhere in this report. Such policies are consistent with those of High Income Opportunities Portfolio.
B Income — The Fund’s net investment income or loss consists of the Fund’s pro-rata share of the net investment income or loss of the Portfolios, less all actual and accrued expenses of the Fund.
C Federal Taxes — The Fund’s policy is to comply with the provisions of the Internal Revenue Code applicable to regulated investment companies and to distribute to shareholders each year substantially all of its net investment income, and all or substantially all of its net realized capital gains. Accordingly, no provision for federal income or excise tax is necessary. At October 31, 2012, the Fund, for federal income tax purposes, had a capital loss carryforward of $105,891,792 which will reduce its taxable income arising from future net realized gains on investment transactions, if any, to the extent permitted by the Internal Revenue Code, and thus will reduce the amount of distributions to shareholders, which would otherwise be necessary to relieve the Fund of any liability for federal income or excise tax. Such capital loss carryforward will expire on October 31, 2013 ($1,505,442), October 31, 2015 ($3,277,415), October 31, 2016 ($60,560,805), October 31, 2017 ($19,014,413), October 31, 2018 ($16,335,693) and October 31, 2019 ($5,198,024). In addition, such capital loss carryforward cannot be utilized prior to the utilization of new capital losses, if any, created after October 31, 2012.
During the year ended October 31, 2012, a capital loss carryforward of $3,036,993 was utilized to offset net realized gains by the Fund.
As of October 31, 2012, the Fund had no uncertain tax positions that would require financial statement recognition, de-recognition, or disclosure. The Fund files a U.S. federal income tax return annually after its fiscal year-end, which is subject to examination by the Internal Revenue Service for a period of three years from the date of filing.
D Expenses — The majority of expenses of the Trust are directly identifiable to an individual fund. Expenses which are not readily identifiable to a specific fund are allocated taking into consideration, among other things, the nature and type of expense and the relative size of the funds.
E Expense Reduction — State Street Bank and Trust Company (SSBT) serves as custodian of the Fund. Pursuant to the custodian agreement, SSBT receives a fee reduced by credits, which are determined based on the average daily cash balance the Fund maintains with SSBT. All credit balances, if any, used to reduce the Fund’s custodian fees are reported as a reduction of expenses in the Statement of Operations.
F Use of Estimates — The preparation of the financial statements in conformity with accounting principles generally accepted in the United States of America requires management to make estimates and assumptions that affect the reported amounts of assets and liabilities at the date of the financial statements and the reported amounts of income and expense during the reporting period. Actual results could differ from those estimates.
G Indemnifications — Under the Trust’s organizational documents, its officers and Trustees may be indemnified against certain liabilities and expenses arising out of the performance of their duties to the Fund. Under Massachusetts law, if certain conditions prevail, shareholders of a Massachusetts business
Eaton Vance
Floating-Rate & High Income Fund
October 31, 2012
Notes to Financial Statements — continued
trust (such as the Trust) could be deemed to have personal liability for the obligations of the Trust. However, the Trust’s Declaration of Trust contains an express disclaimer of liability on the part of Fund shareholders and the By-laws provide that the Trust shall assume the defense on behalf of any Fund shareholders. Moreover, the By-laws also provide for indemnification out of Fund property of any shareholder held personally liable solely by reason of being or having been a shareholder for all loss or expense arising from such liability. Additionally, in the normal course of business, the Fund enters into agreements with service providers that may contain indemnification clauses. The Fund’s maximum exposure under these arrangements is unknown as this would involve future claims that may be made against the Fund that have not yet occurred.
H Redemption Fees — Prior to January 1, 2011 and upon the redemption or exchange of shares by Advisers Class, Class A and Class I shareholders within 90 days of the settlement of purchase, a fee of 1% of the current net asset value of these shares was assessed and retained by the Fund for the benefit of the remaining shareholders. The redemption fee was accounted for as an addition to paid-in capital. Effective January 1, 2011, Advisers Class, Class A and Class I shares are no longer subject to a redemption fee.
I Other — Investment transactions are accounted for on a trade date basis. Dividends to shareholders are recorded on the ex-dividend date.
2 Distributions to Shareholders
The Fund declares dividends daily to shareholders of record at the time of declaration. Distributions are generally paid monthly. Distributions of realized capital gains (reduced by available capital loss carryforwards from prior years, if any) are made at least annually. Distributions are declared separately for each class of shares. Shareholders may reinvest income and capital gain distributions in additional shares of the same class of the Fund at the net asset value as of the reinvestment date or, at the election of the shareholder, receive distributions in cash. The Fund distinguishes between distributions on a tax basis and a financial reporting basis. Accounting principles generally accepted in the United States of America require that only distributions in excess of tax basis earnings and profits be reported in the financial statements as a return of capital. Permanent differences between book and tax accounting relating to distributions are reclassified to paid-in capital. For tax purposes, distributions from short-term capital gains are considered to be from ordinary income.
The tax character of distributions declared for the years ended October 31, 2012 and October 31, 2011 was as follows:
| | | | | | | | |
| | | Year Ended October 31, | |
| | | 2012 | | | 2011 | |
| | |
Distributions declared from: | | | | | | | | |
Ordinary income | | $ | 46,922,137 | | | $ | 46,741,369 | |
Tax return of capital | | $ | — | | | $ | 1,977,867 | |
During the year ended October 31, 2012, accumulated net realized loss was increased by $468,152, accumulated undistributed net investment income was increased by $1,297,602 and paid-in capital was decreased by $829,450 due to differences between book and tax accounting, primarily for swap contracts, premium amortization, defaulted bond interest, mixed straddles, investments in partnerships, paydown gain (loss) and foreign currency gain (loss). These reclassifications had no effect on the net assets or net asset value per share of the Fund.
As of October 31, 2012, the components of distributable earnings (accumulated losses) and unrealized appreciation (depreciation) on a tax basis were as follows:
| | | | |
Undistributed ordinary income | | $ | 765,264 | |
Capital loss carryforward | | $ | (105,891,792 | ) |
Net unrealized depreciation | | $ | (25,735,481 | ) |
Other temporary differences | | $ | (550,541 | ) |
The differences between components of distributable earnings (accumulated losses) on a tax basis and the amounts reflected in the Statements of Assets and Liabilities are primarily due to the timing of recognizing distributions to shareholders, swap contracts, wash sales, partnership allocations, defaulted bond interest and premium amortization.
3 Transactions with Affiliates
The administration fee is earned by EVM as compensation for administrative services rendered to the Fund. The fee is computed at an annual rate of 0.15% of the Fund’s average daily net assets. For the year ended October 31, 2012, the administration fee amounted to $1,545,429. The Portfolios have engaged Boston Management and Research (BMR), a subsidiary of EVM, to render investment advisory services. See Note 2 of the Portfolios’ Notes to
Eaton Vance
Floating-Rate & High Income Fund
October 31, 2012
Notes to Financial Statements — continued
Financial Statements. For the year ended October 31, 2012, the Fund’s allocated portion of adviser fees paid by the Portfolios amounted to $5,209,480 or 0.51% of the Fund’s average daily net assets.
EVM serves as the sub-transfer agent of the Fund and receives from the transfer agent an aggregate fee based upon the actual expenses incurred by EVM in the performance of these services. For the year ended October 31, 2012, EVM earned $27,155 in sub-transfer agent fees. The Fund was informed that EVD, an affiliate of EVM, received $15,192 as its portion of the sales charge on sales of Class A shares for the year ended October 31, 2012. EVD also received distribution and service fees from Advisers Class, Class A, Class B and Class C shares (see Note 4) and contingent deferred sales charges (see Note 5).
Trustees and officers of the Fund who are members of EVM’s or BMR’s organizations receive remuneration for their services to the Fund out of the investment adviser fee. Certain officers and Trustees of the Fund and the Portfolios are officers of the above organizations.
4 Distribution Plans
The Fund has in effect a distribution plan for the Advisers Class shares and Class A shares (Advisers/Class A Plan) pursuant to Rule 12b-1 under the 1940 Act. Pursuant to the Advisers/Class A Plan, the Fund pays EVD a distribution and service fee of 0.25% per annum of its average daily net assets attributable to Advisers Class and Class A shares for distribution services and facilities provided to the Fund by EVD, as well as for personal services and/or the maintenance of shareholder accounts. Distribution and service fees paid or accrued to EVD for the year ended October 31, 2012 amounted to $480,448 for Advisers Class shares and $889,599 for Class A shares. The Fund also has in effect distribution plans for Class B shares (Class B Plan) and Class C shares (Class C Plan) pursuant to Rule 12b-1 under the 1940 Act. Pursuant to the Class B and Class C Plans, the Fund pays EVD amounts equal to 0.75% per annum of its average daily net assets attributable to Class B and Class C shares for providing ongoing distribution services and facilities to the Fund. The Fund will automatically discontinue payments to EVD during any period in which there are no outstanding Uncovered Distribution Charges, which are equivalent to the sum of (i) 6.25% of the aggregate amount received by the Fund for Class B and Class C shares sold, plus (ii) interest calculated by applying the rate of 1% over the prevailing prime rate to the outstanding balance of Uncovered Distribution Charges of EVD of each respective class, reduced by the aggregate amount of contingent deferred sales charges (see Note 5) and amounts theretofore paid or payable to EVD by each respective class. For the year ended October 31, 2012, the Fund paid or accrued to EVD $108,392 and $1,534,101 for Class B and Class C shares, respectively, representing 0.75% of the average daily net assets of Class B and Class C shares. At October 31, 2012, the amounts of Uncovered Distribution Charges of EVD calculated under the Class B and Class C Plans were approximately $7,603,000 and $72,826,000, respectively.
Pursuant to the Class B and Class C Plans, the Fund also makes payments of service fees to EVD, financial intermediaries and other persons in amounts equal to 0.25% per annum of its average daily net assets attributable to that class. Service fees paid or accrued are for personal services and/or the maintenance of shareholder accounts. They are separate and distinct from the sales commissions and distribution fees payable to EVD and, as such, are not subject to automatic discontinuance when there are no outstanding Uncovered Distribution Charges of EVD. Service fees paid or accrued for the year ended October 31, 2012 amounted to $36,131 and $511,367 for Class B and Class C shares, respectively.
5 Contingent Deferred Sales Charges
A contingent deferred sales charge (CDSC) generally is imposed on redemptions of Class B shares made within six years of purchase and on redemptions of Class C shares made within one year of purchase. Class A shares may be subject to a 1% CDSC if redeemed within 18 months of purchase (depending on the circumstances of purchase). Generally, the CDSC is based upon the lower of the net asset value at date of redemption or date of purchase. No charge is levied on shares acquired by reinvestment of dividends or capital gain distributions. The CDSC for Class B shares is imposed at declining rates that begin at 5% in the case of redemptions in the first and second year after purchase, declining one percentage point each subsequent year. Class C shares are subject to a 1% CDSC if redeemed within one year of purchase. No CDSC is levied on shares which have been sold to EVM or its affiliates or to their respective employees or clients and may be waived under certain other limited conditions. CDSCs received on Class B and Class C redemptions are paid to EVD to reduce the amount of Uncovered Distribution Charges calculated under the Fund’s Class B and Class C Plans. CDSCs received on Class B and Class C redemptions when no Uncovered Distribution Charges exist are credited to the Fund. For the year ended October 31, 2012, the Fund was informed that EVD received approximately $8,000, $20,000 and $13,000 of CDSCs paid by Class A, Class B and Class C shareholders, respectively.
6 Investment Transactions
For the year ended October 31, 2012, increases and decreases in the Fund’s investments in the Portfolios were as follows:
| | | | | | | | |
| Portfolio | | Contributions | | | Withdrawals | |
| | |
Floating Rate Portfolio | | $ | 153,484,885 | | | $ | 200,478,984 | |
High Income Opportunities Portfolio | | | 43,755 | | | | 35,253,462 | |
Eaton Vance
Floating-Rate & High Income Fund
October 31, 2012
Notes to Financial Statements — continued
7 Shares of Beneficial Interest
The Fund’s Declaration of Trust permits the Trustees to issue an unlimited number of full and fractional shares of beneficial interest (without par value). Such shares may be issued in a number of different series (such as the Fund) and classes. Transactions in Fund shares were as follows:
| | | | | | | | |
| | | Year Ended October 31, | |
| Advisers Class | | 2012 | | | 2011 | |
| | |
Sales | | | 8,474,195 | | | | 12,958,391 | |
Issued to shareholders electing to receive payments of distributions in Fund shares | | | 990,892 | | | | 1,092,980 | |
Redemptions | | | (8,494,372 | ) | | | (14,560,407 | ) |
| | |
Net increase (decrease) | | | 970,715 | | | | (509,036 | ) |
| | |
| | | | | | | | |
| | | Year Ended October 31, | |
| Class A | | 2012 | | | 2011 | |
| | |
Sales | | | 13,781,890 | | | | 37,759,136 | |
Issued to shareholders electing to receive payments of distributions in Fund shares | | | 1,622,226 | | | | 1,628,820 | |
Redemptions | | | (27,247,670 | ) | | | (15,080,904 | ) |
Exchange from Class B shares | | | 643,038 | | | | 438,600 | |
| | |
Net increase (decrease) | | | (11,200,516 | ) | | | 24,745,652 | |
| | |
| | | | | | | | |
| | | Year Ended October 31, | |
| Class B | | 2012 | | | 2011 | |
| | |
Sales | | | 37,596 | | | | 395,409 | |
Issued to shareholders electing to receive payments of distributions in Fund shares | | | 51,002 | | | | 64,991 | |
Redemptions | | | (321,300 | ) | | | (612,464 | ) |
Exchange to Class A shares | | | (684,890 | ) | | | (466,979 | ) |
| | |
Net decrease | | | (917,592 | ) | | | (619,043 | ) |
| | |
| | | | | | | | |
| | | Year Ended October 31, | |
| Class C | | 2012 | | | 2011 | |
| | |
Sales | | | 2,805,730 | | | | 6,545,587 | |
Issued to shareholders electing to receive payments of distributions in Fund shares | | | 691,077 | | | | 677,303 | |
Redemptions | | | (4,931,572 | ) | | | (5,544,971 | ) |
| | |
Net increase (decrease) | | | (1,434,765 | ) | | | 1,677,919 | |
| | |
| | | | | | | | |
| | | Year Ended October 31, | |
| Class I | | 2012 | | | 2011 | |
| | |
Sales | | | 21,600,464 | | | | 29,548,610 | |
Issued to shareholders electing to receive payments of distributions in Fund shares | | | 1,006,319 | | | | 648,016 | |
Redemptions | | | (12,947,788 | ) | | | (17,219,608 | ) |
| | |
Net increase | | | 9,658,995 | | | | 12,977,018 | |
Eaton Vance
Floating-Rate & High Income Fund
October 31, 2012
Notes to Financial Statements — continued
For the year ended October 31, 2011, the Fund received $11,492 in redemption fees.
8 Fair Value Measurements
Under generally accepted accounting principles for fair value measurements, a three-tier hierarchy to prioritize the assumptions, referred to as inputs, is used in valuation techniques to measure fair value. The three-tier hierarchy of inputs is summarized in the three broad levels listed below.
| Ÿ | | Level 1 – quoted prices in active markets for identical investments |
| Ÿ | | Level 2 – other significant observable inputs (including quoted prices for similar investments, interest rates, prepayment speeds, credit risk, etc.) |
| Ÿ | | Level 3 – significant unobservable inputs (including a fund’s own assumptions in determining the fair value of investments) |
In cases where the inputs used to measure fair value fall in different levels of the fair value hierarchy, the level disclosed is determined based on the lowest level input that is significant to the fair value measurement in its entirety. The inputs or methodology used for valuing securities are not necessarily an indication of the risk associated with investing in those securities.
At October 31, 2012 and October 31, 2011, the Fund’s investment in High Income Opportunities Portfolio, whose financial statements are not included but are available elsewhere as discussed in Note 1, was valued based on Level 1 inputs.
Eaton Vance
Floating-Rate & High Income Fund
October 31, 2012
Report of Independent Registered Public Accounting Firm
To the Trustees of Eaton Vance Mutual Funds Trust and Shareholders of Eaton Vance Floating-Rate & High Income Fund:
We have audited the accompanying statement of assets and liabilities of Eaton Vance Floating-Rate & High Income Fund (the “Fund”) (one of the funds constituting Eaton Vance Mutual Funds Trust) as of October 31, 2012, and the related statement of operations for the year then ended, the statements of changes in net assets for each of the two years in the period then ended, and the financial highlights for each of the five years in the period then ended. These financial statements and financial highlights are the responsibility of the Fund’s management. Our responsibility is to express an opinion on these financial statements and financial highlights based on our audits.
We conducted our audits in accordance with the standards of the Public Company Accounting Oversight Board (United States). Those standards require that we plan and perform the audit to obtain reasonable assurance about whether the financial statements and financial highlights are free of material misstatement. The Fund is not required to have, nor were we engaged to perform, an audit of its internal control over financial reporting. Our audits included consideration of internal control over financial reporting as a basis for designing audit procedures that are appropriate in the circumstances, but not for the purpose of expressing an opinion on the effectiveness of the Fund’s internal control over financial reporting. Accordingly, we express no such opinion. An audit also includes examining, on a test basis, evidence supporting the amounts and disclosures in the financial statements, assessing the accounting principles used and significant estimates made by management, as well as evaluating the overall financial statement presentation. We believe that our audits provide a reasonable basis for our opinion.
In our opinion, such financial statements and financial highlights referred to above present fairly, in all material respects, the financial position of Eaton Vance Floating-Rate & High Income Fund as of October 31, 2012, the results of its operations for the year then ended, the changes in its net assets for each of the two years in the period then ended, and the financial highlights for each of the five years in the period then ended, in conformity with accounting principles generally accepted in the United States of America.
DELOITTE & TOUCHE LLP
Boston, Massachusetts
December 20, 2012
Eaton Vance
Floating-Rate & High Income Fund
October 31, 2012
Federal Tax Information (Unaudited)
The Form 1099-DIV you receive in January 2013 will show the tax status of all distributions paid to your account in calendar year 2012. Shareholders are advised to consult their own tax adviser with respect to the tax consequences of their investment in the Fund. As required by the Internal Revenue Code and/or regulations, shareholders must be notified regarding the status of qualified dividend income for individuals and the dividends received deduction for corporations.
Qualified Dividend Income. The Fund designates approximately $760,204, or up to the maximum amount of such dividends allowable pursuant to the Internal Revenue Code, as qualified dividend income eligible for the reduced tax rate of 15%.
Dividends Received Deduction. Corporate shareholders are generally entitled to take the dividends received deduction on the portion of the Fund’s dividend distribution that qualifies under tax law. For the Fund’s fiscal 2012 ordinary income dividends, 1.53% qualifies for the corporate dividends received deduction.
Floating Rate Portfolio
October 31, 2012
Portfolio of Investments
| | | | | | | | | | |
| Senior Floating-Rate Interests — 92.1%(1) | |
| | | |
| | | | | | | | | | |
| Borrower/Tranche Description | | | | Principal
Amount*
(000’s omitted) | | | Value | |
| | | | | | | | | | |
|
Aerospace and Defense — 1.6% | |
Booz Allen Hamilton Inc. | | | | | | | | | | |
Term Loan, 4.50%, Maturing July 31, 2019 | | | | | 8,900 | | | $ | 8,965,824 | |
DAE Aviation Holdings, Inc. | | | | | | | | | | |
Revolving Loan, 3.53%, Maturing July 31, 2013(2) | | | | | 20,000 | | | | 18,650,000 | |
Term Loan, 7.25%, Maturing July 31, 2014 | | | | | 17,676 | | | | 17,675,616 | |
Term Loan, 7.25%, Maturing July 31, 2014 | | | | | 17,963 | | | | 17,963,473 | |
Ducommun Incorporated | | | | | | | | | | |
Term Loan, 5.50%, Maturing June 28, 2017 | | | | | 6,638 | | | | 6,737,129 | |
IAP Worldwide Services, Inc. | | | | | | | | | | |
Term Loan, 9.25%, Maturing December 28, 2012 | | | | | 30,143 | | | | 24,491,339 | |
Sequa Corporation | | | | | | | | | | |
Term Loan, 3.62%, Maturing December 3, 2014 | | | | | 8,989 | | | | 8,984,762 | |
Term Loan, 6.25%, Maturing December 3, 2014 | | | | | 3,002 | | | | 3,009,818 | |
TASC, Inc. | | | | | | | | | | |
Term Loan, 4.50%, Maturing December 18, 2015 | | | | | 11,461 | | | | 11,482,728 | |
Transdigm, Inc. | | | | | | | | | | |
Term Loan, 4.00%, Maturing February 14, 2017 | | | | | 11,227 | | | | 11,277,626 | |
Term Loan, 4.00%, Maturing February 14, 2017 | | | | | 12,857 | | | | 12,909,289 | |
Wesco Aircraft Hardware Corp. | | | | | | | | | | |
Term Loan, 4.25%, Maturing April 7, 2017 | | | | | 1,989 | | | | 1,998,133 | |
Wyle Services Corporation | | | | | | | | | | |
Term Loan, 5.00%, Maturing March 27, 2017 | | | | | 11,189 | | | | 11,259,258 | |
| | | | | | | | | | | |
| | | | | | | | $ | 155,404,995 | |
| | | | | | | | | | | |
|
Air Transport — 0.3% | |
Evergreen International Aviation, Inc. | | | | | | | | | | |
Term Loan, 11.50%, Maturing June 30, 2015 | | | | | 11,051 | | | $ | 10,774,919 | |
Orbitz Worldwide Inc. | | | | | | | | | | |
Term Loan, 3.21%, Maturing July 25, 2014 | | | | | 18,599 | | | | 18,189,469 | |
| | | | | | | | | | | |
| | | | | | | | $ | 28,964,388 | |
| | | | | | | | | | | |
|
Automotive — 4.5% | |
Allison Transmission, Inc. | | | | | | | | | | |
Term Loan, 2.72%, Maturing August 7, 2014 | | | | | 16,237 | | | $ | 16,280,159 | |
Term Loan, 4.25%, Maturing August 23, 2019 | | | | | 43,299 | | | | 43,555,555 | |
Autoparts Holdings Limited | | | | | | | | | | |
Term Loan, 6.50%, Maturing July 28, 2017 | | | | | 8,025 | | | | 7,995,109 | |
Chrysler Group LLC | | | | | | | | | | |
Term Loan, 6.00%, Maturing May 24, 2017 | | | | | 70,187 | | | | 71,902,705 | |
Federal-Mogul Corporation | | | | | | | | | | |
Term Loan, 2.15%, Maturing December 29, 2014 | | | | | 38,295 | | | | 36,104,877 | |
Term Loan, 2.15%, Maturing December 28, 2015 | | | | | 21,990 | | | | 20,732,517 | |
| | | | | | | | | | |
| Borrower/Tranche Description | | | | Principal
Amount*
(000’s omitted) | | | Value | |
| | | | | | | | | | |
|
Automotive (continued) | |
Financiere Truck Investissement SAS | | | | | | | | | | |
Term Loan, 2.35%, Maturing February 15, 2013 | | EUR | | | 1,479 | | | $ | 1,826,537 | |
Ford Motor Company | | | | | | | | | | |
Revolving Loan, 0.25%, Maturing November 30,
2015(2) | | | | | 4,852 | | | | 4,615,851 | |
Goodyear Tire & Rubber Company (The) | | | | | | | | | | |
Term Loan - Second Lien, 4.75%, Maturing April 30, 2019 | | | | | 64,325 | | | | 65,048,656 | |
HHI Holdings LLC | |
Term Loan, 6.00%, Maturing October 3, 2018 | | | | | 23,250 | | | | 23,250,000 | |
Metaldyne Company LLC | | | | | | | | | | |
Term Loan, 5.25%, Maturing May 18, 2017 | | | | | 23,428 | | | | 23,545,410 | |
Remy International, Inc. | | | | | | | | | | |
Term Loan, 6.25%, Maturing December 16, 2016 | | | | | 5,275 | | | | 5,314,584 | |
SRAM, LLC | | | | | | | | | | |
Term Loan, 4.78%, Maturing June 7, 2018 | | | | | 22,516 | | | | 22,741,391 | |
Term Loan - Second Lien, 8.50%, Maturing December 7, 2018 | | | | | 3,000 | | | | 3,060,000 | |
Tomkins LLC | | | | | | | | | | |
Term Loan, 4.25%, Maturing September 29, 2016 | | | | | 31,011 | | | | 31,220,296 | |
TriMas Corporation | | | | | | | | | | |
Term Loan, Maturing October 10, 2019(3) | | | | | 9,775 | | | | 9,799,437 | |
UCI International, Inc. | | | | | | | | | | |
Term Loan, 5.50%, Maturing July 26, 2017 | | | | | 3,402 | | | | 3,435,863 | |
Veyance Technologies, Inc. | | | | | | | | | | |
Term Loan, 2.47%, Maturing July 31, 2014 | | | | | 4,312 | | | | 4,280,419 | |
Term Loan, 2.47%, Maturing July 31, 2014 | | | | | 26,659 | | | | 26,465,513 | |
Term Loan, 5.50%, Maturing July 31, 2014 | | | | | 4,005 | | | | 4,019,893 | |
Term Loan - Second Lien, 5.96%, Maturing July 31, 2015 | | | | | 2,000 | | | | 1,940,000 | |
| | | | | | | | | | | |
| | | $ | 427,134,772 | |
| | | | | | | | | | | |
|
Beverage and Tobacco — 0.0%(4) | |
Maine Beverage Company | | | | | | | | | | |
Term Loan, 2.11%, Maturing March 31, 2013 | | | | | 157 | | | $ | 155,964 | |
| | | | | | | | | | | |
| | | $ | 155,964 | |
| | | | | | | | | | | |
|
Building and Development — 1.2% | |
401 North Wabash Venture LLC | | | | | | | | | | |
Term Loan, 6.75%, Maturing August 1, 2013(5) | | | | | 4,879 | | | $ | 4,882,243 | |
Armstrong World Industries, Inc. | | | | | | | | | | |
Term Loan, 4.00%, Maturing March 9, 2018 | | | | | 19,063 | | | | 19,154,725 | |
Goodman Global Inc. | | | | | | | | | | |
Term Loan, 5.75%, Maturing October 28, 2016 | | | | | 11,950 | | | | 12,001,488 | |
| | | | |
| | 22 | | See Notes to Financial Statements. |
Floating Rate Portfolio
October 31, 2012
Portfolio of Investments — continued
| | | | | | | | | | |
| Borrower/Tranche Description | | | | Principal
Amount*
(000’s omitted) | | | Value | |
| | | | | | | | | | |
|
Building and Development (continued) | |
Preferred Proppants, LLC | | | | | | | | | | |
Term Loan, 7.50%, Maturing December 15, 2016 | | | | | 8,511 | | | $ | 8,074,515 | |
RE/MAX International, Inc. | | | | | | | | | | |
Term Loan, 5.50%, Maturing April 15, 2016 | | | | | 12,230 | | | | 12,321,653 | |
Realogy Corporation | | | | | | | | | | |
Term Loan, 3.24%, Maturing October 10, 2013 | | | | | 2,700 | | | | 2,659,023 | |
Term Loan, 4.46%, Maturing October 10, 2016 | | | | | 9,207 | | | | 9,201,711 | |
Term Loan, 4.46%, Maturing October 10, 2016 | | | | | 719 | | | | 718,202 | |
Summit Materials Companies I, LLC | | | | | | | | | | |
Term Loan, 6.00%, Maturing January 30, 2019 | | | | | 6,990 | | | | 7,060,501 | |
The Woodlands Land Development Company L.P. | | | | | | | | | | |
Term Loan, 5.00%, Maturing March 7, 2014 | | | | | 19,259 | | | | 18,970,370 | |
Tishman Speyer U.S. Office, Inc. | | | | | | | | | | |
Term Loan, 5.21%, Maturing January 8, 2014 | | | | | 13,475 | | | | 13,620,530 | |
| | | | | | | | | | | |
| | | $ | 108,664,961 | |
| | | | | | | | | | | |
|
Business Equipment and Services — 8.5% | |
ACCO Brands Corporation | | | | | | | | | | |
Term Loan, 4.25%, Maturing April 30, 2019 | | | | | 4,796 | | | $ | 4,846,831 | |
Acosta, Inc. | | | | | | | | | | |
Term Loan, 5.00%, Maturing March 1, 2018 | | | | | 32,615 | | | | 32,818,945 | |
Advantage Sales & Marketing, Inc. | | | | | | | | | | |
Term Loan, 5.25%, Maturing December 18, 2017 | | | | | 35,223 | | | | 35,302,274 | |
Affinion Group, Inc. | | | | | | | | | | |
Term Loan, 5.00%, Maturing July 16, 2015 | | | | | 40,942 | | | | 38,664,304 | |
Allied Security Holdings, LLC | | | | | | | | | | |
Term Loan, 5.25%, Maturing February 3, 2017 | | | | | 13,199 | | | | 13,232,058 | |
Altegrity, Inc. | | | | | | | | | | |
Term Loan, 7.75%, Maturing February 20, 2015 | | | | | 4,678 | | | | 4,677,706 | |
Term Loan, 2.96%, Maturing February 21, 2015 | | | | | 14,944 | | | | 13,897,694 | |
BAR/BRI Review Courses, Inc. | | | | | | | | | | |
Term Loan, 6.00%, Maturing June 16, 2017 | | | | | 5,893 | | | | 5,900,246 | |
Brand Energy & Infrastructure Services, Inc. | | | | | | | | | | |
Term Loan, Maturing October 16, 2016(3) | | | | | 1,819 | | | | 1,819,355 | |
Term Loan, Maturing October 16, 2018(3) | | | | | 7,581 | | | | 7,555,379 | |
Brickman Group Holdings Inc. | | | | | | | | | | |
Term Loan, 5.50%, Maturing October 14, 2016 | | | | | 11,499 | | | | 11,671,337 | |
Brock Holdings III, Inc. | | | | | | | | | | |
Term Loan, 6.01%, Maturing March 16, 2017 | | | | | 16,348 | | | | 16,511,221 | |
Catalina Marketing Corporation | | | | | | | | | | |
Term Loan, 2.96%, Maturing October 1, 2014 | | | | | 5,842 | | | | 5,827,299 | |
ClientLogic Corporation | | | | | | | | | | |
Term Loan, 6.86%, Maturing January 30, 2017 | | EUR | | | 569 | | | | 671,651 | |
Term Loan, 7.10%, Maturing January 30, 2017 | | | | | 9,682 | | | | 9,464,497 | |
| | | | | | | | | | |
| Borrower/Tranche Description | | | | Principal
Amount*
(000’s omitted) | | | Value | |
| | | | | | | | | | |
|
Business Equipment and Services (continued) | |
Corporate Executive Board Company, The | | | | | | | | | | |
Term Loan, 5.00%, Maturing July 2, 2019 | | | | | 5,650 | | | $ | 5,692,375 | |
CPM Acquisition Corp. | | | | | | | | | | |
Term Loan, 6.25%, Maturing August 29, 2017 | | | | | 5,375 | | | | 5,418,672 | |
DynCorp International LLC | | | | | | | | | | |
Term Loan, 6.25%, Maturing July 7, 2016 | | | | | 10,003 | | | | 10,061,194 | |
Education Management LLC | | | | | | | | | | |
Term Loan, 4.38%, Maturing June 1, 2016 | | | | | 1,159 | | | | 976,821 | |
Term Loan, 8.25%, Maturing March 29, 2018 | | | | | 24,467 | | | | 21,705,549 | |
EIG Investors Corp. | | | | | | | | | | |
Term Loan, 7.75%, Maturing April 20, 2018 | | | | | 16,209 | | | | 16,300,553 | |
Term Loan - Second Lien, 11.00%, Maturing October 22, 2018 | | | | | 3,125 | | | | 3,156,250 | |
Expert Global Solutions, Inc. | | | | | | | | | | |
Term Loan, 8.00%, Maturing April 3, 2018 | | | | | 24,079 | | | | 24,319,790 | |
Garda World Security Corp. | | | | | | | | | | |
Term Loan, Maturing October 24, 2019(3) | | | | | 4,225 | | | | 4,261,969 | |
Genesys Telecom Holdings, U.S., Inc. | | | | | | | | | | |
Term Loan, 6.75%, Maturing January 31, 2019 | | | | | 7,363 | | | | 7,478,047 | |
Genpact International, Inc. | | | | | | | | | | |
Term Loan, 4.25%, Maturing August 30, 2019 | | | | | 17,350 | | | | 17,415,062 | |
Go Daddy Operating Company, LLC | | | | | | | | | | |
Term Loan, 5.50%, Maturing December 17, 2018 | | | | | 20,497 | | | | 20,443,891 | |
IG Investment Holdings, LLC | | | | | | | | | | |
Term Loan, Maturing October 26, 2019(3) | | | | | 8,850 | | | | 8,838,937 | |
IMS Health Incorporated | | | | | | | | | | |
Term Loan, 4.50%, Maturing August 25, 2017 | | | | | 23,062 | | | | 23,230,429 | |
Infor (US), Inc. | | | | | | | | | | |
Term Loan, 5.25%, Maturing April 5, 2018 | | | | | 72,025 | | | | 72,891,090 | |
KAR Auction Services, Inc. | | | | | | | | | | |
Term Loan, 5.00%, Maturing May 19, 2017 | | | | | 22,985 | | | | 23,147,889 | |
Kronos Incorporated | | | | | | | | | | |
Term Loan, Maturing October 25, 2019(3) | | | | | 17,850 | | | | 17,894,625 | |
Term Loan - Second Lien, Maturing April 24, 2020(3) | | | | | 10,275 | | | | 10,300,687 | |
Language Line, LLC | |
Term Loan, 6.25%, Maturing June 20, 2016 | | | | | 20,081 | | | | 19,967,861 | |
Meritas LLC | | | | | | | | | | |
Term Loan, 7.50%, Maturing July 28, 2017 | | | | | 11,915 | | | | 11,915,413 | |
Mitchell International, Inc. | | | | | | | | | | |
Term Loan, 2.50%, Maturing March 28, 2014 | | | | | 1,856 | | | | 1,850,310 | |
Term Loan - Second Lien, 5.63%, Maturing March 30, 2015 | | | | | 1,500 | | | | 1,481,250 | |
Monitronics International Inc. | | | | | | | | | | |
Term Loan, 5.50%, Maturing March 16, 2018 | | | | | 9,925 | | | | 10,020,237 | |
| | | | |
| | 23 | | See Notes to Financial Statements. |
Floating Rate Portfolio
October 31, 2012
Portfolio of Investments — continued
| | | | | | | | | | |
| Borrower/Tranche Description | | | | Principal
Amount*
(000’s omitted) | | | Value | |
| | | | | | | | | | |
|
Business Equipment and Services (continued) | |
Quintiles Transnational Corp. | | | | | | | | | | |
Term Loan, 4.50%, Maturing June 8, 2018 | | | | | 3,950 | | | $ | 3,964,812 | |
Term Loan, 5.00%, Maturing June 8, 2018 | | | | | 45,017 | | | | 45,388,520 | |
Sabre, Inc. | | | | | | | | | | |
Term Loan, 2.21%, Maturing September 30, 2014 | | | | | 9,730 | | | | 9,714,629 | |
Sensus USA Inc. | | | | | | | | | | |
Term Loan, 4.75%, Maturing May 9, 2017 | | | | | 1,959 | | | | 1,966,402 | |
Softlayer Technologies, Inc. | | | | | | | | | | |
Term Loan, 7.25%, Maturing November 5, 2016 | | | | | 9,162 | | | | 9,219,074 | |
SunGard Data Systems, Inc. | | | | | | | | | | |
Term Loan, 3.90%, Maturing February 26, 2016 | | | | | 35,647 | | | | 35,792,109 | |
Term Loan, 3.97%, Maturing February 28, 2017 | | | | | 24,027 | | | | 24,147,016 | |
SymphonyIRI Group, Inc. | | | | | | | | | | |
Term Loan, 5.00%, Maturing December 1, 2017 | | | | | 5,900 | | | | 5,911,376 | |
Trans Union, LLC | | | | | | | | | | |
Term Loan, 5.50%, Maturing February 12, 2018 | | | | | 30,289 | | | | 30,614,354 | |
Travelport LLC | | | | | | | | | | |
Term Loan, 2.86%, Maturing August 23, 2013 | | | | | 154 | | | | 147,530 | |
Term Loan, 4.65%, Maturing August 21, 2015 | | EUR | | | 1,481 | | | | 1,827,847 | |
Term Loan, 4.86%, Maturing August 21, 2015 | | | | | 13,518 | | | | 12,946,178 | |
Term Loan, 4.86%, Maturing August 21, 2015 | | | | | 20,702 | | | | 19,826,110 | |
Term Loan, 4.86%, Maturing August 21, 2015 | | | | | 8,217 | | | | 7,869,580 | |
U.S. Security Holdings, Inc. | | | | | | | | | | |
Term Loan, 6.00%, Maturing July 28, 2017 | | | | | 1,610 | | | | 1,623,771 | |
Term Loan, 6.00%, Maturing July 28, 2017 | | | | | 8,224 | | | | 8,296,132 | |
West Corporation | | | | | | | | | | |
Term Loan, 5.50%, Maturing July 15, 2016 | | | | | 6,494 | | | | 6,569,403 | |
Term Loan, 5.50%, Maturing July 15, 2016 | | | | | 18,039 | | | | 18,249,185 | |
Term Loan, 5.75%, Maturing June 29, 2018 | | | | | 12,469 | | | | 12,624,609 | |
| | | | | | | | | | | |
| | | $ | 798,328,335 | |
| | | | | | | | | | | |
|
Cable and Satellite Television — 3.4% | |
Atlantic Broadband Finance, LLC | | | | | | | | | | |
Term Loan, 5.25%, Maturing April 4, 2019 | | | | | 15,386 | | | $ | 15,485,357 | |
BBHI Acquisition LLC | | | | | | | | | | |
Term Loan, 4.50%, Maturing December 14, 2017 | | | | | 4,794 | | | | 4,818,350 | |
Bragg Communications Incorporated | | | | | | | | | | |
Term Loan, 4.00%, Maturing February 28, 2018 | | | | | 4,726 | | | | 4,749,881 | |
Cequel Communications, LLC | | | | | | | | | | |
Term Loan, 4.00%, Maturing February 14, 2019 | | | | | 51,054 | | | | 51,213,042 | |
Charter Communications Operating, LLC | | | | | | | | | | |
Term Loan, 3.47%, Maturing September 6, 2016 | | | | | 28,331 | | | | 28,477,442 | |
Term Loan, 4.00%, Maturing May 15, 2019 | | | | | 10,970 | | | | 11,056,263 | |
| | | | | | | | | | |
| Borrower/Tranche Description | | | | Principal
Amount*
(000’s omitted) | | | Value | |
| | | | | | | | | | |
|
Cable and Satellite Television (continued) | |
Crown Media Holdings, Inc. | | | | | | | | | | |
Term Loan, 5.75%, Maturing July 14, 2018 | | | | | 9,055 | | | $ | 9,100,574 | |
CSC Holdings, Inc. | | | | | | | | | | |
Term Loan, 1.96%, Maturing March 29, 2016 | | | | | 23,108 | | | | 23,117,275 | |
Kabel Deutschland GMBH | |
Term Loan, 4.25%, Maturing February 1, 2019 | | | | | 16,825 | | | | 16,889,591 | |
Lavena Holdings 4 GmbH | | | | | | | | | | |
Term Loan, 2.95%, Maturing March 6, 2015 | | EUR | | | 5,072 | | | | 6,180,838 | |
Term Loan, 3.32%, Maturing March 4, 2016 | | EUR | | | 5,072 | | | | 6,180,838 | |
MCC Iowa LLC | | | | | | | | | | |
Term Loan, 1.93%, Maturing January 30, 2015 | | | | | 7,420 | | | | 7,373,226 | |
Term Loan, 1.93%, Maturing January 30, 2015 | | | | | 7,540 | | | | 7,492,875 | |
Mediacom Broadband LLC | | | | | | | | | | |
Term Loan, 4.50%, Maturing October 23, 2017 | | | | | 10,044 | | | | 10,037,535 | |
Mediacom Illinois, LLC | | | | | | | | | | |
Term Loan, 1.68%, Maturing January 30, 2015 | | | | | 18,747 | | | | 18,430,227 | |
Term Loan, 4.50%, Maturing October 23, 2017 | | | | | 10,275 | | | | 10,239,460 | |
P7S1 Broadcasting Holding II B.V. | | | | | | | | | | |
Term Loan, 2.81%, Maturing July 1, 2016 | | EUR | | | 3,546 | | | | 4,495,529 | |
UPC Broadband Holding B.V. | | | | | | | | | | |
Term Loan, 3.87%, Maturing December 31, 2016 | | EUR | | | 37,765 | | | | 48,681,413 | |
Term Loan, 4.12%, Maturing December 29, 2017 | | EUR | | | 2,000 | | | | 2,590,043 | |
UPC Financing Partnership | | | | | | | | | | |
Term Loan, 3.71%, Maturing December 30, 2016 | | | | | 5,061 | | | | 5,040,923 | |
Term Loan, 3.71%, Maturing December 29, 2017 | | | | | 10,793 | | | | 10,776,802 | |
Term Loan, 4.75%, Maturing December 29, 2017 | | | | | 4,575 | | | | 4,609,313 | |
WaveDivision Holdings, LLC | | | | | | | | | | |
Term Loan, 5.50%, Maturing August 9, 2019 | | | | | 3,475 | | | | 3,511,880 | |
YPSO Holding SA | | | | | | | | | | |
Term Loan, 4.86%, Maturing June 6, 2016 | | EUR | | | 3,336 | | | | 4,099,975 | |
Term Loan, 4.86%, Maturing June 6, 2016 | | EUR | | | 5,763 | | | | 7,082,418 | |
| | | | | | | | | | | |
| | | $ | 321,731,070 | |
| | | | | | | | | | | |
|
Chemicals and Plastics — 3.6% | |
AZ Chem US Inc. | | | | | | | | | | |
Term Loan, 7.25%, Maturing December 22, 2017 | | | | | 12,439 | | | $ | 12,714,904 | |
Celanese U.S. Holdings LLC | | | | | | | | | | |
Term Loan, 2.87%, Maturing October 31, 2016 | | EUR | | | 667 | | | | 868,423 | |
Chemtura Corporation | | | | | | | | | | |
Term Loan, 5.50%, Maturing August 27, 2016 | | | | | 10,975 | | | | 11,125,906 | |
Emerald Performance Materials, LLC | | | | | | | | | | |
Term Loan, 6.75%, Maturing May 18, 2018 | | | | | 7,955 | | | | 8,044,557 | |
General Chemical Corporation | | | | | | | | | | |
Term Loan, 5.00%, Maturing October 6, 2015 | | | | | 4,014 | | | | 4,030,949 | |
| | | | |
| | 24 | | See Notes to Financial Statements. |
Floating Rate Portfolio
October 31, 2012
Portfolio of Investments — continued
| | | | | | | | | | |
| Borrower/Tranche Description | | | | Principal
Amount*
(000’s omitted) | | | Value | |
| | | | | | | | | | |
|
Chemicals and Plastics (continued) | |
Harko C.V. | | | | | | | | | | |
Term Loan, 5.75%, Maturing August 2, 2017 | | | | | 7,922 | | | $ | 7,979,428 | |
Term Loan, 6.25%, Maturing August 2, 2017 | | EUR | | | 465 | | | | 602,530 | |
Houghton International, Inc. | | | | | | | | | | |
Revolving Loan, 0.50%, Maturing January 30, 2016(2) | | | | | 1,280 | | | | 1,235,200 | |
Revolving Loan, 2.65%, Maturing January 30, 2016(2) | | | | | 320 | | | | 308,800 | |
Term Loan, 6.75%, Maturing January 29, 2016 | | | | | 13,317 | | | | 13,433,454 | |
Huntsman International, LLC | | | | | | | | | | |
Term Loan, 2.50%, Maturing June 30, 2016 | | | | | 2,285 | | | | 2,282,699 | |
Term Loan, 2.79%, Maturing April 19, 2017 | | | | | 12,358 | | | | 12,342,130 | |
Ineos Finance PLC | | | | | | | | | | |
Term Loan, Maturing May 4, 2018(3) | | EUR | | | 1,824 | | | | 2,378,152 | |
Ineos US Finance LLC | | | | | | | | | | |
Term Loan, 6.50%, Maturing May 4, 2018 | | | | | 48,044 | | | | 48,784,121 | |
Momentive Performance Materials GmbH | | | | | | | | | | |
Term Loan, 3.61%, Maturing May 5, 2015 | | EUR | | | 4,909 | | | | 6,314,889 | |
Momentive Performance Materials Inc. | |
Term Loan, 2.40%, Maturing December 4, 2013 | | | | | 4,750 | | | | 4,726,250 | |
Term Loan, 3.75%, Maturing May 5, 2015 | | | | | 7,662 | | | | 7,651,923 | |
Momentive Performance Materials USA Inc. | | | | | | | | | | |
Term Loan, 3.75%, Maturing May 5, 2015 | | | | | 10,275 | | | | 10,249,486 | |
Momentive Specialty Chemicals Inc. | | | | | | | | | | |
Term Loan, 2.48%, Maturing May 3, 2013 | | | | | 12,237 | | | | 12,152,408 | |
Term Loan, 3.82%, Maturing May 5, 2015 | | EUR | | | 1,071 | | | | 1,339,722 | |
Term Loan, 4.00%, Maturing May 5, 2015 | | | | | 15,947 | | | | 15,907,045 | |
Term Loan, 4.13%, Maturing May 5, 2015 | | | | | 7,023 | | | | 6,812,388 | |
Term Loan, 4.13%, Maturing May 5, 2015 | | | | | 8,060 | | | | 8,040,295 | |
Term Loan, 4.25%, Maturing May 5, 2015 | | | | | 4,061 | | | | 3,979,813 | |
OEP Pearl Dutch Acquisition B.V. | | | | | | | | | | |
Term Loan, 6.50%, Maturing March 30, 2018 | | | | | 1,164 | | | | 1,176,519 | |
Omnova Solutions Inc. | | | | | | | | | | |
Term Loan, 5.50%, Maturing May 31, 2017 | | | | | 10,012 | | | | 10,099,244 | |
PolyOne Corp. | | | | | | | | | | |
Term Loan, 5.00%, Maturing December 20, 2017 | | | | | 10,524 | | | | 10,619,612 | |
Sonneborn LLC | | | | | | | | | | |
Term Loan, 6.50%, Maturing March 30, 2018 | | | | | 6,597 | | | | 6,666,942 | |
Styron S.A.R.L., LLC | | | | | | | | | | |
Term Loan, 8.00%, Maturing August 2, 2017 | | | | | 30,462 | | | | 29,158,104 | |
Taminco Global Chemical Corporation | | | | | | | | | | |
Term Loan, 5.25%, Maturing February 15, 2019 | | | | | 4,527 | | | | 4,580,069 | |
Tronox Pigments (Netherlands) B.V. | | | | | | | | | | |
Term Loan, 4.25%, Maturing February 8, 2018 | | | | | 2,939 | | | | 2,963,992 | |
Term Loan, 4.25%, Maturing February 8, 2018 | | | | | 10,777 | | | | 10,861,234 | |
| | | | | | | | | | |
| Borrower/Tranche Description | | | | Principal
Amount*
(000’s omitted) | | | Value | |
| | | | | | | | | | |
|
Chemicals and Plastics (continued) | |
Univar Inc. | | | | | | | | | | |
Term Loan, 5.00%, Maturing June 30, 2017 | | | | | 63,153 | | | $ | 62,643,957 | |
| | | | | | | | | | | |
| | | $ | 342,075,145 | |
| | | | | | | | | | | |
| | | |
Clothing / Textiles — 0.1% | | | | | | | | | | |
Ascena Retail Group, Inc. | | | | | | | | | | |
Term Loan, 4.75%, Maturing June 14, 2018 | | | | | 1,995 | | | $ | 2,008,716 | |
Warnaco Inc. | | | | | | | | | | |
Term Loan, 3.75%, Maturing June 15, 2018 | | | | | 3,901 | | | | 3,881,122 | |
Wolverine Worldwide, Inc. | | | | | | | | | | |
Term Loan, 5.25%, Maturing July 31, 2019 | | | | | 5,775 | | | | 5,843,578 | |
| | | | | | | | | | | |
| | | $ | 11,733,416 | |
| | | | | | | | | | | |
|
Conglomerates — 1.5% | |
Jason Incorporated | | | | | | | | | | |
Term Loan, 8.25%, Maturing September 21, 2014 | | | | | 1,024 | | | $ | 1,026,733 | |
Term Loan, 7.75%, Maturing September 22, 2014 | | | | | 2,550 | | | | 2,555,918 | |
Term Loan, 8.25%, Maturing September 22, 2014 | | | | | 413 | | | | 413,591 | |
Rexnord Corporation | | | | | | | | | | |
Term Loan, 4.50%, Maturing April 2, 2018 | | | | | 33,162 | | | | 33,431,315 | |
RGIS Services, LLC | | | | | | | | | | |
Term Loan, 4.61%, Maturing October 18, 2016 | | | | | 19,617 | | | | 19,567,498 | |
Term Loan, 5.50%, Maturing October 18, 2017 | | | | | 16,221 | | | | 16,281,417 | |
Rocket Software, Inc. | | | | | | | | | | |
Term Loan, 5.75%, Maturing February 8, 2018 | | | | | 6,585 | | | | 6,630,712 | |
Term Loan, 6.75%, Maturing February 8, 2018 | | | | | 1,500 | | | | 1,500,000 | |
Term Loan - Second Lien, 10.25%, Maturing February 8, 2019 | | | | | 2,750 | | | | 2,770,625 | |
Spectrum Brands, Inc. | | | | | | | | | | |
Term Loan, 5.02%, Maturing June 17, 2016 | | | | | 19,623 | | | | 19,694,895 | |
Walter Energy, Inc. | | | | | | | | | | |
Term Loan, 4.00%, Maturing April 2, 2018 | | | | | 39,415 | | | | 38,954,972 | |
| | | | | | | | | | | |
| | | $ | 142,827,676 | |
| | | | | | | | | | | |
|
Containers and Glass Products — 1.3% | |
Berry Plastics Holding Corporation | | | | | | | | | | |
Term Loan, 2.21%, Maturing April 3, 2015 | | | | | 24,165 | | | $ | 24,044,671 | |
BWAY Corporation | | | | | | | | | | |
Term Loan, 5.25%, Maturing February 23, 2018 | | | | | 2,536 | | | | 2,542,259 | |
Term Loan, 5.25%, Maturing February 23, 2018 | | | | | 22,630 | | | | 22,681,805 | |
Hilex Poly Co. LLC | | | | | | | | | | |
Term Loan, 11.25%, Maturing November 16, 2015 | | | | | 3,840 | | | | 3,916,742 | |
| | | | |
| | 25 | | See Notes to Financial Statements. |
Floating Rate Portfolio
October 31, 2012
Portfolio of Investments — continued
| | | | | | | | | | |
| Borrower/Tranche Description | | | | Principal
Amount*
(000’s omitted) | | | Value | |
| | | | | | | | | | |
|
Containers and Glass Products (continued) | |
Pelican Products, Inc. | | | | | | | | | | |
Term Loan, 7.00%, Maturing July 11, 2018 | | | | | 3,394 | | | $ | 3,419,455 | |
Reynolds Group Holdings Inc. | | | | | | | | | | |
Term Loan, 4.75%, Maturing September 20, 2018 | | | | | 53,475 | | | | 53,772,321 | |
Sealed Air Corporation | | | | | | | | | | |
Term Loan, 5.50%, Maturing October 3, 2018 | | EUR | | | 978 | | | | 1,272,529 | |
TricorBraun, Inc. | | | | | | | | | | |
Term Loan, 5.50%, Maturing May 3, 2018 | | | | | 7,091 | | | | 7,144,075 | |
| | | | | | | | | | | |
| | | $ | 118,793,857 | |
| | | | | | | | | | | |
|
Cosmetics / Toiletries — 0.5% | |
Bausch & Lomb, Inc. | | | | | | | | | | |
Term Loan, 5.25%, Maturing May 17, 2019 | | | | | 35,062 | | | $ | 35,500,402 | |
Huish Detergents, Inc. | | | | | | | | | | |
Term Loan, 2.22%, Maturing April 25, 2014 | | | | | 1,944 | | | | 1,860,987 | |
Prestige Brands, Inc. | | | | | | | | | | |
Term Loan, 5.28%, Maturing January 31, 2019 | | | | | 4,889 | | | | 4,951,054 | |
| | | | | | | | | | | |
| | | $ | 42,312,443 | |
| | | | | | | | | | | |
|
Drugs — 0.8% | |
Aptalis Pharma, Inc. | | | | | | | | | | |
Term Loan, 5.50%, Maturing February 10, 2017 | | | | | 3,982 | | | $ | 3,999,917 | |
Term Loan, 5.50%, Maturing February 10, 2017 | | | | | 20,762 | | | | 20,866,071 | |
Par Pharmaceutical Companies, Inc. | | | | | | | | | | |
Term Loan, 5.00%, Maturing September 30, 2019 | | | | | 12,925 | | | | 12,919,235 | |
Warner Chilcott Company, LLC | | | | | | | | | | |
Term Loan, 3.75%, Maturing March 17, 2016 | | | | | 278 | | | | 279,940 | |
Term Loan, 4.25%, Maturing March 15, 2018 | | | | | 6,647 | | | | 6,680,116 | |
Warner Chilcott Corporation | | | | | | | | | | |
Term Loan, 4.25%, Maturing March 15, 2018 | | | | | 5,048 | | | | 5,073,667 | |
Term Loan, 4.25%, Maturing March 15, 2018 | | | | | 13,294 | | | | 13,360,232 | |
WC Luxco S.a.r.l. | | | | | | | | | | |
Term Loan, 4.25%, Maturing March 15, 2018 | | | | | 9,139 | | | | 9,185,160 | |
| | | | | | | | | | | |
| | | $ | 72,364,338 | |
| | | | | | | | | | | |
|
Ecological Services and Equipment — 0.3% | |
ADS Waste Holdings | | | | | | | | | | |
Term Loan, 5.25%, Maturing September 11, 2019 | | | | | 21,450 | | | $ | 21,675,675 | |
Envirotest Systems Holding Corp. | | | | | | | | | | |
Term Loan - Second Lien, 15.50%, Maturing March 31, 2017(6) | | | | | 93 | | | | 95,365 | |
Progressive Waste Solutions Ltd. | | | | | | | | | | |
Term Loan, Maturing October 11, 2019(3) | | | | | 5,875 | | | | 5,930,078 | |
| | | | | | | | |
| Borrower/Tranche Description | | | | Principal
Amount*
(000’s omitted) | | Value | |
| | | | | | | | |
|
Ecological Services and Equipment (continued) | |
Safety Kleen (SK Holdings) | | | | | | | | |
Term Loan, 5.00%, Maturing February 17, 2017 | | | | 2,479 | | $ | 2,477,102 | |
| | | | | | | | | |
| | $ | 30,178,220 | |
| | | | | | | �� | | |
|
Electronics / Electrical — 5.9% | |
Aeroflex Incorporated | | | | | | | | |
Term Loan, 5.75%, Maturing May 9, 2018 | | | | 11,848 | | $ | 11,889,011 | |
Aspect Software, Inc. | | | | | | | | |
Term Loan, 6.25%, Maturing May 6, 2016 | | | | 26,499 | | | 26,134,550 | |
Attachmate Corporation | | | | | | | | |
Term Loan, 7.25%, Maturing November 22, 2017 | | | | 34,491 | | | 34,887,583 | |
Cinedigm Digital Funding I, LLC | | | | | | | | |
Term Loan, 5.25%, Maturing April 29, 2016 | | | | 6,711 | | | 6,777,995 | |
CommScope, Inc. | | | | | | | | |
Term Loan, 4.25%, Maturing January 12, 2018 | | | | 34,140 | | | 34,438,926 | |
CompuCom Systems, Inc. | | | | | | | | |
Term Loan, 6.50%, Maturing October 2, 2018 | | | | 14,700 | | | 14,727,562 | |
CPI International Inc. | | | | | | | | |
Term Loan, 5.00%, Maturing February 13, 2017 | | | | 10,341 | | | 10,340,812 | |
Dealer Computer Services, Inc. | | | | | | | | |
Term Loan, 3.75%, Maturing April 20, 2018 | | | | 13,101 | | | 13,193,395 | |
DG FastChannel, Inc. | | | | | | | | |
Term Loan, 5.75%, Maturing July 26, 2018 | | | | 17,598 | | | 16,981,800 | |
Eagle Parent, Inc. | | | | | | | | |
Term Loan, 5.00%, Maturing May 16, 2018 | | | | 33,502 | | | 33,745,319 | |
Edwards (Cayman Islands II) Limited | | | | | | | | |
Term Loan, 5.50%, Maturing May 31, 2016 | | | | 7,294 | | | 7,325,533 | |
Term Loan, 5.50%, Maturing May 31, 2016 | | | | 14,352 | | | 14,415,137 | |
Freescale Semiconductor, Inc. | | | | | | | | |
Term Loan, 4.46%, Maturing December 1, 2016 | | | | 40,483 | | | 39,673,675 | |
Hyland Software, Inc. | | | | | | | | |
Term Loan, Maturing October 29, 2019(3) | | | | 3,900 | | | 3,906,501 | |
InfoGroup Inc. | | | | | | | | |
Term Loan, 5.75%, Maturing May 25, 2018 | | | | 9,642 | | | 8,629,509 | |
Lawson Software Inc. | | | | | | | | |
Term Loan, 5.75%, Maturing October 18, 2016 | | | | 1,850 | | | 1,878,135 | |
Magic Newco LLC | | | | | | | | |
Term Loan, 7.25%, Maturing December 12, 2018 | | | | 8,300 | | | 8,336,313 | |
Microsemi Corporation | | | | | | | | |
Term Loan, 4.00%, Maturing February 2, 2018 | | | | 18,591 | | | 18,742,087 | |
NeuStar, Inc. | | | | | | | | |
Term Loan, 5.00%, Maturing November 8, 2018 | | | | 11,583 | | | 11,713,309 | |
| | | | |
| | 26 | | See Notes to Financial Statements. |
Floating Rate Portfolio
October 31, 2012
Portfolio of Investments — continued
| | | | | | | | | | |
| Borrower/Tranche Description | | | | Principal
Amount*
(000’s omitted) | | | Value | |
| | | | | | | | | | |
|
Electronics / Electrical (continued) | |
Nxp B.V. | | | | | | | | | | |
Term Loan, 4.50%, Maturing March 3, 2017 | | | | | 16,007 | | | $ | 16,260,225 | |
Term Loan, 5.50%, Maturing March 3, 2017 | | | | | 17,251 | | | | 17,646,085 | |
Term Loan, 5.25%, Maturing March 19, 2019 | | | | | 19,154 | | | | 19,457,011 | |
Open Solutions, Inc. | | | | | | | | | | |
Term Loan, 2.44%, Maturing January 23, 2014 | | | | | 11,157 | | | | 10,790,224 | |
Rovi Solutions Corporation | | | | | | | | | | |
Term Loan, 4.00%, Maturing March 29, 2019 | | | | | 9,577 | | | | 9,409,280 | |
SafeNet Inc. | | | | | | | | | | |
Term Loan, 2.71%, Maturing April 12, 2014 | | | | | 10,189 | | | | 10,163,082 | |
Semtech Corporation | | | | | | | | | | |
Term Loan, 4.25%, Maturing March 20, 2017 | | | | | 2,811 | | | | 2,835,470 | |
Sensata Technologies Finance Company, LLC | | | | | | | | | | |
Term Loan, 4.00%, Maturing May 11, 2018 | | | | | 36,508 | | | | 36,690,333 | |
Serena Software, Inc. | | | | | | | | | | |
Term Loan, 4.22%, Maturing March 10, 2016 | | | | | 3,010 | | | | 2,987,366 | |
Term Loan, 5.00%, Maturing March 10, 2016 | | | | | 3,975 | | | | 3,989,906 | |
Shield Finance Co. S.A.R.L. | | | | | | | | | | |
Term Loan, 6.50%, Maturing May 10, 2019 | | | | | 11,721 | | | | 11,793,879 | |
SkillSoft Corporation | | | | | | | | | | |
Term Loan, 5.00%, Maturing May 26, 2017 | | | | | 8,508 | | | | 8,603,726 | |
Sophia, L.P. | | | | | | | | | | |
Term Loan, 6.25%, Maturing July 19, 2018 | | | | | 16,089 | | | | 16,337,209 | |
Spansion LLC | | | | | | | | | | |
Term Loan, 4.75%, Maturing February 9, 2015 | | | | | 8,066 | | | | 8,156,694 | |
VeriFone Inc. | | | | | | | | | | |
Term Loan, 4.25%, Maturing December 28, 2018 | | | | | 4,396 | | | | 4,398,385 | |
Vertafore, Inc. | | | | | | | | | | |
Term Loan, 5.25%, Maturing July 29, 2016 | | | | | 13,936 | | | | 13,993,806 | |
Wall Street Systems, Inc. | | | | | | | | | | |
Term Loan, Maturing October 24, 2019(3) | | | | | 18,425 | | | | 18,194,687 | |
Web.com Group, Inc. | | | | | | | | | | |
Term Loan, 7.00%, Maturing October 27, 2017 | | | | | 24,844 | | | | 24,875,493 | |
| | | | | | | | | | | |
| | | $ | 554,320,013 | |
| | | | | | | | | | | |
|
Equipment Leasing — 0.7% | |
BakerCorp International, Inc. | | | | | | | | | | |
Term Loan, 5.00%, Maturing June 1, 2018 | | | | | 9,890 | | | $ | 9,941,459 | |
Delos Aircraft Inc. | | | | | | | | | | |
Term Loan, 4.75%, Maturing April 12, 2016 | | | | | 15,050 | | | | 15,294,563 | |
Flying Fortress Inc. | | | | | | | | | | |
Term Loan, 5.00%, Maturing June 30, 2017 | | | | | 40,325 | | | | 41,030,687 | |
| | | | | | | | | | | |
| | | $ | 66,266,709 | |
| | | | | | | | | | | |
| | | | | | | | | | |
| Borrower/Tranche Description | | | | Principal
Amount*
(000’s omitted) | | | Value | |
| | | | | | | | | | |
|
Financial Intermediaries — 3.2% | |
American Capital Holdings, Inc. | | | | | | | | | | |
Term Loan, 5.50%, Maturing August 22, 2016 | | | | | 8,925 | | | $ | 8,991,938 | |
Asset Acceptance Capital Corp. | | | | | | | | | | |
Term Loan, 8.75%, Maturing November 14, 2017 | | | | | 10,238 | | | | 10,340,211 | |
CB Richard Ellis Services, Inc. | | | | | | | | | | |
Term Loan, 3.46%, Maturing March 5, 2018 | | | | | 7,935 | | | | 7,955,106 | |
Term Loan, 3.71%, Maturing September 4, 2019 | | | | | 547 | | | | 548,018 | |
Citco III Limited | | | | | | | | | | |
Term Loan, 5.50%, Maturing June 29, 2018 | | | | | 22,308 | | | | 22,516,684 | |
First Data Corporation | | | | | | | | | | |
Term Loan, 2.96%, Maturing September 24, 2014 | | | | | 754 | | | | 754,755 | |
Term Loan, 2.96%, Maturing September 24, 2014 | | | | | 817 | | | | 818,041 | |
Term Loan, 2.96%, Maturing September 24, 2014 | | | | | 879 | | | | 880,744 | |
Term Loan, 4.21%, Maturing March 23, 2018 | | | | | 15,843 | | | | 15,193,968 | |
Term Loan, 5.21%, Maturing September 24, 2018 | | | | | 13,325 | | | | 13,094,584 | |
Grosvenor Capital Management Holdings, LLP | | | | | | | | | | |
Term Loan, 4.25%, Maturing December 5, 2016 | | | | | 8,583 | | | | 8,443,056 | |
Hamilton Lane Advisors, LLC | | | | | | | | | | |
Term Loan, 6.50%, Maturing February 23, 2018 | | | | | 5,655 | | | | 5,655,000 | |
Harbourvest Partners, LLC | | | | | | | | | | |
Term Loan, 6.25%, Maturing December 16, 2016 | | | | | 7,941 | | | | 7,960,390 | |
iPayment, Inc. | | | | | | | | | | |
Term Loan, 5.75%, Maturing May 8, 2017 | | | | | 20,570 | | | | 20,531,748 | |
LPL Holdings, Inc. | | | | | | | | | | |
Term Loan, 2.71%, Maturing March 29, 2017 | | | | | 4,339 | | | | 4,289,939 | |
Term Loan, 4.00%, Maturing March 29, 2019 | | | | | 33,283 | | | | 33,469,965 | |
Mercury Payment Systems Canada, LLC | | | | | | | | | | |
Term Loan, 5.50%, Maturing July 3, 2017 | | | | | 12,714 | | | | 12,841,203 | |
MIP Delaware, LLC | | | | | | | | | | |
Term Loan, 5.50%, Maturing July 12, 2018 | | | | | 6,172 | | | | 6,233,299 | |
Nuveen Investments, Inc. | | | | | | | | | | |
Term Loan, 5.85%, Maturing May 12, 2017 | | | | | 35,459 | | | | 35,503,306 | |
Term Loan, 5.84%, Maturing May 13, 2017 | | | | | 28,556 | | | | 28,627,376 | |
Term Loan, 7.25%, Maturing May 13, 2017 | | | | | 6,250 | | | | 6,275,000 | |
Oz Management LP | | | | | | | | | | |
Term Loan, 1.71%, Maturing November 15, 2016 | | | | | 15,645 | | | | 14,006,531 | |
RJO Holdings Corp. | | | | | | | | | | |
Term Loan, 6.22%, Maturing December 10, 2015(6) | | | | | 63 | | | | 51,347 | |
Term Loan, 6.97%, Maturing December 10, 2015(6) | | | | | 1,980 | | | | 1,526,487 | |
RPI Finance Trust | | | | | | | | | | |
Term Loan, 3.50%, Maturing May 9, 2018 | | | | | 29,430 | | | | 29,564,410 | |
Vantiv, LLC | | | | | | | | | | |
Term Loan, 3.75%, Maturing March 27, 2019 | | | | | 5,458 | | | | 5,475,343 | |
| | | | | | | | | | | |
| | | $ | 301,548,449 | |
| | | | | | | | | | | |
| | | | |
| | 27 | | See Notes to Financial Statements. |
Floating Rate Portfolio
October 31, 2012
Portfolio of Investments — continued
| | | | | | | | | | |
| Borrower/Tranche Description | | | | Principal
Amount*
(000’s omitted) | | | Value | |
| | | | | | | | | | |
|
Food Products — 3.6% | |
AdvancePierre Foods, Inc. | | | | | | | | | | |
Term Loan, 5.75%, Maturing July 10, 2017 | | | | | 14,250 | | | $ | 14,386,558 | |
American Seafoods Group LLC | | | | | | | | | | |
Term Loan, 4.25%, Maturing March 16, 2018 | | | | | 10,093 | | | | 10,005,033 | |
BL Marketing Limited (Weetabix) | | | | | | | | | | |
Term Loan, 7.36%, Maturing June 30, 2017 | | GBP | | | 2,500 | | | | 4,025,969 | |
Blue Buffalo Company, Ltd. | | | | | | | | | | |
Term Loan, 6.50%, Maturing August 8, 2019 | | | | | 12,500 | | | | 12,593,750 | |
Clearwater Seafoods Limited Partnership | | | | | | | | | | |
Term Loan, 6.75%, Maturing June 6, 2018 | | | | | 11,322 | | | | 11,364,081 | |
Del Monte Foods Company | | | | | | | | | | |
Term Loan, 4.50%, Maturing March 8, 2018 | | | | | 86,824 | | | | 86,824,333 | |
Dole Food Company Inc. | | | | | | | | | | |
Term Loan, 5.04%, Maturing July 6, 2018 | | | | | 13,039 | | | | 13,094,392 | |
High Liner Foods Incorporated | | | | | | | | | | |
Term Loan, 7.00%, Maturing December 19, 2017 | | | | | 9,602 | | | | 9,656,451 | |
JBS USA Holdings Inc. | | | | | | | | | | |
Term Loan, 4.25%, Maturing May 25, 2018 | | | | | 29,149 | | | | 29,148,618 | |
Michael Foods Group, Inc. | | | | | | | | | | |
Term Loan, 4.25%, Maturing February 23, 2018 | | | | | 20,557 | | | | 20,672,295 | |
NBTY, Inc. | | | | | | | | | | |
Term Loan, 4.25%, Maturing October 2, 2017 | | | | | 58,920 | | | | 59,299,369 | |
Pinnacle Foods Finance LLC | | | | | | | | | | |
Term Loan, 4.75%, Maturing October 17, 2018 | | | | | 3,358 | | | | 3,379,113 | |
Term Loan, 4.75%, Maturing October 17, 2018 | | | | | 25,337 | | | | 25,442,077 | |
Solvest Ltd. | | | | | | | | | | |
Term Loan, 5.02%, Maturing July 6, 2018 | | | | | 23,332 | | | | 23,432,106 | |
United Biscuits (UK) Limited | | | | | | | | | | |
Term Loan - Second Lien, 4.51%, Maturing June 15, 2016 | | GBP | | | 1,500 | | | | 2,360,108 | |
Windsor Quality Food Company Ltd. | | | | | | | | | | |
Term Loan, 5.00%, Maturing February 16, 2017 | | | | | 15,970 | | | | 15,970,123 | |
| | | | | | | | | | | |
| | | $ | 341,654,376 | |
| | | | | | | | | | | |
|
Food Service — 3.6% | |
Aramark Corporation | | | | | | | | | | |
Term Loan, 3.40%, Maturing July 26, 2016 | | | | | 3,177 | | | $ | 3,184,715 | |
Term Loan, 3.46%, Maturing July 26, 2016 | | | | | 40,817 | | | | 40,934,190 | |
Term Loan, 3.46%, Maturing July 26, 2016 | | | | | 4,574 | | | | 4,586,929 | |
Term Loan, 3.57%, Maturing July 26, 2016 | | | | | 18,087 | | | | 18,129,576 | |
Term Loan, 3.61%, Maturing July 26, 2016 | | | | | 950 | | | | 945,250 | |
Brasa Holdings, Inc. | | | | | | | | | | |
Term Loan, 7.50%, Maturing July 19, 2019 | | | | | 4,825 | | | | 4,873,250 | |
| | | | | | | | | | |
| Borrower/Tranche Description | | | | Principal
Amount*
(000’s omitted) | | | Value | |
| | | | | | | | | | |
|
Food Service (continued) | |
Buffets, Inc. | | | | | | | | | | |
Term Loan, 0.24%, Maturing April 22, 2015(6) | | | | | 998 | | | $ | 997,989 | |
Term Loan, 10.50%, Maturing July 18, 2017 | | | | | 3,456 | | | | 3,559,938 | |
Term Loan, 2.00%, Maturing July 19, 2017(2) | | | | | 1,500 | | | | 1,545,000 | |
Burger King Corporation | | | | | | | | | | |
Term Loan, 3.75%, Maturing September 27, 2019 | | | | | 25,250 | | | | 25,384,153 | |
Centerplate, Inc. | | | | | | | | | | |
Term Loan, 5.75%, Maturing October 15, 2018 | | | | | 4,125 | | | | 4,155,938 | |
DineEquity, Inc. | | | | | | | | | | |
Term Loan, 4.25%, Maturing October 19, 2017 | | | | | 15,786 | | | | 15,918,783 | |
Dunkin’ Brands, Inc. | | | | | | | | | | |
Term Loan, 4.00%, Maturing November 23, 2017 | | | | | 47,982 | | | | 48,199,885 | |
Landry’s, Inc. | | | | | | | | | | |
Term Loan, 6.50%, Maturing April 24, 2018 | | | | | 18,174 | | | | 18,397,161 | |
NPC International, Inc. | | | | | | | | | | |
Term Loan, 5.25%, Maturing December 28, 2018 | | | | | 7,836 | | | | 7,972,748 | |
OSI Restaurant Partners, LLC | | | | | | | | | | |
Term Loan, 4.75%, Maturing October 24, 2019 | | | | | 30,125 | | | | 30,253,031 | |
P.F. Chang’s China Bistro Inc. | | | | | | | | | | |
Term Loan, 6.25%, Maturing July 2, 2019 | | | | | 4,450 | | | | 4,507,481 | |
Sagittarius Restaurants, LLC | | | | | | | | | | |
Term Loan, 7.51%, Maturing May 18, 2015 | | | | | 6,728 | | | | 6,744,319 | |
SSP Financing Limited | | | | | | | | | | |
Term Loan, 2.40%, Maturing December 17, 2016 | | | | | 4,774 | | | | 4,422,287 | |
US Foods, Inc. | | | | | | | | | | |
Term Loan, 2.71%, Maturing July 3, 2014 | | | | | 8,928 | | | | 8,842,201 | |
Term Loan, 5.75%, Maturing March 31, 2017 | | | | | 41,350 | | | | 40,833,493 | |
Weight Watchers International, Inc. | | | | | | | | | | |
Term Loan, 4.00%, Maturing March 15, 2019 | | | | | 15,298 | | | | 15,347,844 | |
Wendy’s International, Inc. | | | | | | | | | | |
Term Loan, 4.75%, Maturing May 15, 2019 | | | | | 26,100 | | | | 26,374,598 | |
| | | | | | | | | | | |
| | | $ | 336,110,759 | |
| | | | | | | | | | | |
|
Food / Drug Retailers — 3.0% | |
Alliance Boots Holdings Limited | | | | | | | | | | |
Term Loan, 3.08%, Maturing July 9, 2015 | | EUR | | | 17,497 | | | $ | 22,192,928 | |
Term Loan, 3.49%, Maturing July 9, 2015 | | GBP | | | 43,250 | | | | 67,663,890 | |
General Nutrition Centers, Inc. | | | | | | | | | | |
Term Loan, 3.75%, Maturing March 2, 2018 | | | | | 69,313 | | | | 69,495,427 | |
Iceland Foods Group Limited | | | | | | | | | | |
Term Loan, 5.11%, Maturing April 12, 2019 | | EUR | | | 7,950 | | | | 10,426,752 | |
Pantry, Inc. (The) | | | | | | | | | | |
Term Loan, 5.75%, Maturing August 2, 2019 | | | | | 4,700 | | | | 4,737,210 | |
| | | | |
| | 28 | | See Notes to Financial Statements. |
Floating Rate Portfolio
October 31, 2012
Portfolio of Investments — continued
| | | | | | | | | | |
| Borrower/Tranche Description | | | | Principal
Amount*
(000’s omitted) | | | Value | |
| | | | | | | | | | |
|
Food / Drug Retailers (continued) | |
Rite Aid Corporation | | | | | | | | | | |
Term Loan, 1.97%, Maturing June 4, 2014 | | | | | 63,142 | | | $ | 62,699,724 | |
Term Loan, 4.50%, Maturing March 2, 2018 | | | | | 36,377 | | | | 36,308,535 | |
Sprouts Farmers Markets Holdings, LLC | | | | | | | | | | |
Term Loan, 6.00%, Maturing April 18, 2018 | | | | | 9,451 | | | | 9,545,826 | |
| | | | | | | | | | | |
| | | $ | 283,070,292 | |
| | | | | | | | | | | |
|
Health Care — 12.3% | |
Alere, Inc. | | | | | | | | | | |
Term Loan, 4.75%, Maturing June 30, 2017 | | | | | 5,497 | | | $ | 5,545,477 | |
Term Loan, 4.75%, Maturing June 30, 2017 | | | | | 6,848 | | | | 6,902,824 | |
Term Loan, 4.75%, Maturing June 30, 2017 | | | | | 27,631 | | | | 27,851,066 | |
Alkermes, Inc. | | | | | | | | | | |
Term Loan, 4.50%, Maturing September 18, 2019 | | | | | 7,025 | | | | 7,077,688 | |
Alliance Healthcare Services, Inc. | | | | | | | | | | |
Term Loan, 7.25%, Maturing June 1, 2016 | | | | | 14,172 | | | | 13,959,322 | |
Ardent Medical Services, Inc. | | | | | | | | | | |
Term Loan, 6.50%, Maturing September 15, 2015 | | | | | 21,322 | | | | 21,375,438 | |
AssuraMed | | | | | | | | | | |
Term Loan, Maturing October 23, 2019(3) | | | | | 9,425 | | | | 9,479,976 | |
Aveta, Inc. | | | | | | | | | | |
Term Loan, 8.50%, Maturing April 4, 2017 | | | | | 5,799 | | | | 5,802,687 | |
Term Loan, 8.50%, Maturing April 4, 2017 | | | | | 5,799 | | | | 5,802,687 | |
Term Loan, Maturing October 9, 2017(3) | | | | | 7,975 | | | | 7,935,125 | |
Term Loan, Maturing October 26, 2017(3) | | | | | 5,800 | | | | 5,771,000 | |
Biomet Inc. | | | | | | | | | | |
Term Loan, 3.96%, Maturing July 25, 2017 | | | | | 43,696 | | | | 44,014,249 | |
BSN Medical Acquisition Holding GmbH | | | | | | | | | | |
Term Loan, 5.25%, Maturing August 28, 2019 | | EUR | | | 2,000 | | | | 2,610,932 | |
Catalent Pharma Solutions Inc. | | | | | | | | | | |
Term Loan, 4.21%, Maturing September 15, 2016 | | | | | 13,093 | | | | 13,158,273 | |
Term Loan, 5.25%, Maturing September 15, 2017 | | | | | 13,464 | | | | 13,606,644 | |
Community Health Systems, Inc. | | | | | | | | | | |
Term Loan, 3.92%, Maturing January 25, 2017 | | | | | 64,848 | | | | 65,213,060 | |
Convatec Inc. | | | | | | | | | | |
Term Loan, 5.00%, Maturing December 22, 2016 | | | | | 18,508 | | | | 18,646,894 | |
CRC Health Corporation | | | | | | | | | | |
Term Loan, 4.86%, Maturing November 16, 2015 | | | | | 29,501 | | | | 28,726,897 | |
DaVita, Inc. | | | | | | | | | | |
Term Loan, 4.50%, Maturing October 20, 2016 | | | | | 10,569 | | | | 10,645,358 | |
Term Loan, Maturing September 2, 2019(3) | | | | | 18,800 | | | | 18,878,340 | |
DJO Finance LLC | | | | | | | | | | |
Term Loan, 5.21%, Maturing November 1, 2016 | | | | | 13,026 | | | | 13,075,293 | |
Term Loan, 6.25%, Maturing September 15, 2017 | | | | | 8,507 | | | | 8,558,294 | |
| | | | | | | | | | |
| Borrower/Tranche Description | | | | Principal
Amount*
(000’s omitted) | | | Value | |
| | | | | | | | | | |
|
Health Care (continued) | |
Drumm Investors LLC | | | | | | | | | | |
Term Loan, 5.00%, Maturing May 4, 2018 | | | | | 30,403 | | | $ | 29,357,705 | |
Emdeon, Inc. | | | | | | | | | | |
Term Loan, 5.00%, Maturing November 2, 2018 | | | | | 9,878 | | | | 9,994,258 | |
Emergency Medical Services Corporation | | | | | | | | | | |
Term Loan, 5.25%, Maturing May 25, 2018 | | | | | 23,200 | | | | 23,438,114 | |
Fenwal, Inc. | | | | | | | | | | |
Term Loan, 2.67%, Maturing February 28, 2014 | | | | | 477 | | | | 476,581 | |
Term Loan, 2.67%, Maturing February 28, 2014 | | | | | 2,782 | | | | 2,779,034 | |
Grifols Inc. | | | | | | | | | | |
Term Loan, 4.50%, Maturing June 1, 2017 | | | | | 39,619 | | | | 40,094,518 | |
Hanger Orthopedic Group, Inc. | | | | | | | | | | |
Term Loan, 4.01%, Maturing December 1, 2016 | | | | | 19,711 | | | | 19,810,025 | |
HCA, Inc. | | | | | | | | | | |
Term Loan, 3.61%, Maturing March 31, 2017 | | | | | 51,019 | | | | 51,168,893 | |
Term Loan, 3.46%, Maturing May 1, 2018 | | | | | 38,600 | | | | 38,693,388 | |
Health Management Associates, Inc. | | | | | | | | | | |
Term Loan, 4.50%, Maturing November 16, 2018 | | | | | 36,127 | | | | 36,498,205 | |
Hologic Inc. | | | | | | | | | | |
Term Loan, 4.50%, Maturing August 1, 2019 | | | | | 21,197 | | | | 21,464,040 | |
Iasis Healthcare LLC | | | | | | | | | | |
Term Loan, 5.00%, Maturing May 3, 2018 | | | | | 15,027 | | | | 15,092,266 | |
inVentiv Health, Inc. | | | | | | | | | | |
Term Loan, 6.50%, Maturing August 4, 2016 | | | | | 35,318 | | | | 34,538,334 | |
Term Loan, 6.75%, Maturing May 15, 2018 | | | | | 16,723 | | | | 16,305,327 | |
Kindred Healthcare, Inc. | | | | | | | | | | |
Term Loan, 5.25%, Maturing June 1, 2018 | | | | | 14,607 | | | | 14,433,871 | |
Term Loan, 6.00%, Maturing June 1, 2018 | | | | | 8,600 | | | | 8,497,806 | |
Kinetic Concepts, Inc. | | | | | | | | | | |
Term Loan, 7.00%, Maturing May 4, 2018 | | | | | 53,595 | | | | 54,398,925 | |
LHP Hospital Group, Inc. | | | | | | | | | | |
Term Loan, 9.00%, Maturing July 3, 2018 | | | | | 5,885 | | | | 5,944,103 | |
MedAssets, Inc. | | | | | | | | | | |
Term Loan, 5.25%, Maturing November 16, 2016 | | | | | 19,553 | | | | 19,772,777 | |
Medpace, Inc. | | | | | | | | | | |
Term Loan, 6.50%, Maturing June 16, 2017 | | | | | 10,745 | | | | 10,369,003 | |
Multiplan, Inc. | | | | | | | | | | |
Term Loan, 4.75%, Maturing August 26, 2017 | | | | | 55,565 | | | | 55,889,091 | |
MX USA, Inc. | | | | | | | | | | |
Term Loan, 6.50%, Maturing April 28, 2017 | | | | | 3,756 | | | | 3,737,344 | |
One Call Medical, Inc. | | | | | | | | | | |
Term Loan, 7.00%, Maturing August 16, 2019 | | | | | 9,525 | | | | 9,572,625 | |
Onex Carestream Finance LP | | | | | | | | | | |
Term Loan, 5.00%, Maturing February 25, 2017 | | | | | 20,341 | | | | 20,164,647 | |
| | | | |
| | 29 | | See Notes to Financial Statements. |
Floating Rate Portfolio
October 31, 2012
Portfolio of Investments — continued
| | | | | | | | | | |
| Borrower/Tranche Description | | | | Principal
Amount*
(000’s omitted) | | | Value | |
| | | | | | | | | | |
|
Health Care (continued) | |
Pharmaceutical Product Development, Inc. | | | | | | | | | | |
Term Loan, 6.25%, Maturing December 5, 2018 | | | | | 27,732 | | | $ | 28,104,511 | |
Physiotherapy Associates Holdings, Inc. | | | | | | | | | | |
Term Loan, 6.01%, Maturing April 30, 2018 | | | | | 3,616 | | | | 3,624,977 | |
Radnet Management, Inc. | | | | | | | | | | |
Term Loan, 5.51%, Maturing September 30, 2018 | | | | | 20,043 | | | | 20,089,064 | |
Select Medical Corporation | | | | | | | | | | |
Term Loan, 5.50%, Maturing June 1, 2018 | | | | | 33,488 | | | | 33,781,337 | |
Sheridan Holdings, Inc. | | | | | | | | | | |
Term Loan, 6.00%, Maturing June 29, 2018 | | | | | 6,135 | | | | 6,192,137 | |
Sunrise Medical Holdings B.V. | | | | | | | | | | |
Term Loan, 7.25%, Maturing May 13, 2014 | | EUR | | | 1,940 | | | | 2,479,333 | |
TriZetto Group, Inc. (The) | | | | | | | | | | |
Term Loan, 4.75%, Maturing May 2, 2018 | | | | | 19,671 | | | | 19,618,455 | |
Truven Health Analytics Inc. | | | | | | | | | | |
Term Loan, 5.75%, Maturing June 1, 2019 | | | | | 18,300 | | | | 18,357,187 | |
Universal Health Services, Inc. | | | | | | | | | | |
Term Loan, 3.75%, Maturing November 15, 2016 | | | | | 4,166 | | | | 4,187,110 | |
Valeant Pharmaceuticals International, Inc. | | | | | | | | | | |
Term Loan, 4.25%, Maturing February 13, 2019 | | | | | 13,170 | | | | 13,241,932 | |
Term Loan, Maturing September 27, 2019(3) | | | | | 33,675 | | | | 33,860,212 | |
Vanguard Health Holding Company II, LLC | | | | | | | | | | |
Term Loan, 5.00%, Maturing January 29, 2016 | | | | | 24,510 | | | | 24,690,817 | |
VWR Funding, Inc. | | | | | | | | | | |
Term Loan, 2.71%, Maturing June 30, 2014 | | | | | 27,722 | | | | 27,768,495 | |
Term Loan, 4.46%, Maturing April 3, 2017 | | | | | 25,727 | | | | 25,872,154 | |
| | | | | | | | | | | |
| | | $ | 1,158,996,125 | |
| | | | | | | | | | | |
|
Home Furnishings — 0.4% | |
Hunter Fan Company | | | | | | | | | | |
Term Loan, 2.83%, Maturing April 16, 2014 | | | | | 2,471 | | | $ | 2,359,956 | |
Oreck Corporation | | | | | | | | | | |
Term Loan - Second Lien, 3.88%, Maturing March 19, 2016(6) | | | | | 797 | | | | 720,753 | |
Serta Simmons Holdings, LLC | | | | | | | | | | |
Term Loan, 5.00%, Maturing September 19, 2019 | | | | | 27,850 | | | | 27,879,020 | |
Sofia III S.a.r.l. | | | | | | | | | | |
Term Loan, 2.61%, Maturing June 24, 2016 | | EUR | | | 3,348 | | | | 3,926,977 | |
| | | | | | | | | | | |
| | | $ | 34,886,706 | |
| | | | | | | | | | | |
|
Industrial Equipment — 1.4% | |
Colfax Corporation | | | | | | | | | | |
Term Loan, 4.50%, Maturing January 11, 2019 | | | | | 14,936 | | | $ | 15,102,581 | |
| | | | | | | | | | |
| Borrower/Tranche Description | | | | Principal
Amount*
(000’s omitted) | | | Value | |
| | | | | | | | | | |
|
Industrial Equipment (continued) | |
Excelitas Technologies Corp. | | | | | | | | | | |
Term Loan, 5.00%, Maturing November 23, 2016 | | | | | 2,895 | | | $ | 2,888,004 | |
Generac Power Systems, Inc. | | | | | | | | | | |
Term Loan, 6.25%, Maturing February 8, 2019 | | | | | 16,484 | | | | 16,875,175 | |
Grede LLC | | | | | | | | | | |
Term Loan, 7.00%, Maturing April 3, 2017 | | | | | 9,482 | | | | 9,505,204 | |
Husky Injection Molding Systems Ltd. | | | | | | | | | | |
Term Loan, 5.75%, Maturing June 29, 2018 | | | | | 10,985 | | | | 11,147,951 | |
Kinetek Acquisitions Corporation | | | | | | | | | | |
Term Loan, 4.50%, Maturing November 11, 2013 | | | | | 275 | | | | 274,380 | |
Term Loan, 4.50%, Maturing November 11, 2013 | | | | | 2,712 | | | | 2,705,283 | |
Kion Group GMBH | | | | | | | | | | |
Term Loan, 3.36%, Maturing December 23, 2014(5) | | EUR | | | 1,058 | | | | 1,347,351 | |
Term Loan, 3.46%, Maturing December 23, 2014(5) | | | | | 18,260 | | | | 17,942,991 | |
Term Loan, 3.96%, Maturing December 23, 2015(5) | | | | | 18,260 | | | | 17,942,991 | |
Term Loan, 3.86%, Maturing December 29, 2015(5) | | EUR | | | 1,012 | | | | 1,289,052 | |
Manitowoc Company, Inc. (The) | | | | | | | | | | |
Term Loan, 4.25%, Maturing November 13, 2017 | | | | | 5,236 | | | | 5,274,766 | |
Tank Holding Corp. | | | | | | | | | | |
Term Loan, 5.50%, Maturing July 9, 2019 | | | | | 10,513 | | | | 10,584,894 | |
Terex Corporation | | | | | | | | | | |
Term Loan, 5.00%, Maturing April 28, 2017 | | EUR | | | 9,900 | | | | 12,912,078 | |
Unifrax Corporation | | | | | | | | | | |
Term Loan, 6.50%, Maturing November 28, 2018 | | | | | 6,779 | | | | 6,855,740 | |
| | | | | | | | | | | |
| | | $ | 132,648,441 | |
| | | | | | | | | | | |
|
Insurance — 2.4% | |
Alliant Holdings I, Inc. | | | | | | | | | | |
Term Loan, 3.36%, Maturing August 21, 2014 | | | | | 22,790 | | | $ | 22,761,848 | |
Term Loan, 6.75%, Maturing August 21, 2014 | | | | | 3,816 | | | | 3,853,697 | |
AmWINS Group, Inc. | | | | | | | | | | |
Term Loan, 5.75%, Maturing June 6, 2019 | | | | | 3,990 | | | | 4,004,963 | |
Applied Systems, Inc. | | | | | | | | | | |
Term Loan, 5.50%, Maturing December 8, 2016 | | | | | 7,490 | | | | 7,514,707 | |
Asurion LLC | | | | | | | | | | |
Term Loan, 5.50%, Maturing May 24, 2018 | | | | | 87,497 | | | | 88,230,131 | |
Term Loan - Second Lien, 9.00%, Maturing May 24, 2019 | | | | | 5,573 | | | | 5,774,119 | |
CCC Information Services, Inc. | | | | | | | | | | |
Term Loan, 5.75%, Maturing November 11, 2015 | | | | | 12,125 | | | | 12,190,262 | |
CNO Financial Group, Inc. | | | | | | | | | | |
Term Loan, 5.00%, Maturing September 20, 2018 | | | | | 13,650 | | | | 13,752,375 | |
Cunningham Lindsey Group, Inc. | | | | | | | | | | |
Term Loan, Maturing October 29, 2019(3) | | | | | 14,350 | | | | 14,376,906 | |
| | | | |
| | 30 | | See Notes to Financial Statements. |
Floating Rate Portfolio
October 31, 2012
Portfolio of Investments — continued
| | | | | | | | | | |
| Borrower/Tranche Description | | | | Principal
Amount*
(000’s omitted) | | | Value | |
| | | | | | | | | | |
|
Insurance (continued) | |
Hub International Limited | | | | | | | | | | |
Term Loan, 4.71%, Maturing June 13, 2017 | | | | | 16,992 | | | $ | 17,130,417 | |
Term Loan, 6.75%, Maturing December 13, 2017 | | | | | 3,420 | | | | 3,462,437 | |
Sedgwick CMS Holdings, Inc. | | | | | | | | | | |
Term Loan, 5.00%, Maturing December 30, 2016 | | | | | 7,845 | | | | 7,854,529 | |
USI Holdings Corporation | | | | | | | | | | |
Term Loan, 2.72%, Maturing May 5, 2014 | | | | | 22,231 | | | | 22,245,033 | |
Term Loan, 7.00%, Maturing May 5, 2014 | | | | | 3,880 | | | | 3,899,400 | |
| | | | | | | | | | | |
| | | $ | 227,050,824 | |
| | | | | | | | | | | |
|
Leisure Goods / Activities / Movies — 3.5% | |
Alpha D2 Limited | | | | | | | | | | |
Term Loan, 6.00%, Maturing April 29, 2019 | | | | | 23,432 | | | $ | 23,666,572 | |
AMC Entertainment, Inc. | | | | | | | | | | |
Term Loan, 4.25%, Maturing December 15, 2016 | | | | | 26,605 | | | | 26,787,638 | |
Term Loan, 4.75%, Maturing February 22, 2018 | | | | | 11,687 | | | | 11,789,951 | |
AMC Networks Inc. | | | | | | | | | | |
Term Loan, 4.00%, Maturing December 31, 2018 | | | | | 13,729 | | | | 13,840,355 | |
Bombardier Recreational Products, Inc. | | | | | | | | | | |
Term Loan, 4.46%, Maturing June 28, 2016 | | | | | 34,422 | | | | 34,648,391 | |
Cedar Fair, L.P. | | | | | | | | | | |
Term Loan, 4.00%, Maturing December 15, 2017 | | | | | 25,611 | | | | 25,819,245 | |
Cinemark USA, Inc. | | | | | | | | | | |
Term Loan, 3.47%, Maturing April 29, 2016 | | | | | 3,069 | | | | 3,093,330 | |
Clubcorp Club Operations, Inc. | | | | | | | | | | |
Term Loan, 6.00%, Maturing November 30, 2016 | | | | | 10,857 | | | | 10,945,699 | |
Fender Musical Instruments Corporation | | | | | | | | | | |
Term Loan, 2.47%, Maturing June 9, 2014 | | | | | 1,060 | | | | 1,059,583 | |
Term Loan, 2.47%, Maturing June 9, 2014 | | | | | 3,694 | | | | 3,693,628 | |
Kasima, LLC | | | | | | | | | | |
Term Loan, 4.12%, Maturing March 10, 2015 | | | | | 15,000 | | | | 15,056,250 | |
Term Loan, 5.00%, Maturing March 31, 2017 | | | | | 11,847 | | | | 11,891,737 | |
Live Nation Entertainment, Inc. | | | | | | | | | | |
Term Loan, 4.50%, Maturing November 7, 2016 | | | | | 38,206 | | | | 38,460,193 | |
Merlin Entertainment Group Luxembourg 2 S.a.r.l. | | | | | | | | | | |
Term Loan, 4.46%, Maturing July 21, 2017 | | | | | 13,045 | | | | 13,077,747 | |
Regal Cinemas, Inc. | | | | | | | | | | |
Term Loan, 3.24%, Maturing August 23, 2017 | | | | | 5,803 | | | | 5,829,069 | |
Revolution Studios Distribution Company, LLC | | | | | | | | | | |
Term Loan, 3.97%, Maturing December 21, 2014(6) | | | | | 4,214 | | | | 3,444,956 | |
SeaWorld Parks & Entertainment, Inc. | | | | | | | | | | |
Term Loan, 2.93%, Maturing February 17, 2016 | | | | | 5,885 | | | | 5,881,556 | |
Term Loan, 4.00%, Maturing August 17, 2017 | | | | | 21,641 | | | | 21,796,407 | |
| | | | | | | | | | |
| Borrower/Tranche Description | | | | Principal
Amount*
(000’s omitted) | | | Value | |
| | | | | | | | | | |
|
Leisure Goods / Activities / Movies (continued) | |
Six Flags Theme Parks, Inc. | | | | | | | | | | |
Term Loan, 4.25%, Maturing December 20, 2018 | | | | | 29,800 | | | $ | 30,032,678 | |
Town Sports International Inc. | | | | | | | | | | |
Term Loan, 5.75%, Maturing May 11, 2018 | | | | | 11,061 | | | | 11,195,695 | |
Warner Music Group Corp. | | | | | | | | | | |
Term Loan, Maturing October 25, 2018(3) | | | | | 6,125 | | | | 6,155,625 | |
Zuffa LLC | | | | | | | | | | |
Term Loan, 2.25%, Maturing June 19, 2015 | | | | | 10,751 | | | | 10,598,960 | |
Term Loan, 7.50%, Maturing June 19, 2015 | | | | | 1,990 | | | | 2,004,765 | |
| | | | | | | | | | | |
| | | $ | 330,770,030 | |
| | | | | | | | | | | |
|
Lodging and Casinos — 1.6% | |
Affinity Gaming, LLC | | | | | | | | | | |
Term Loan, 5.50%, Maturing November 9, 2017 | | | | | 5,075 | | | $ | 5,144,274 | |
Ameristar Casinos, Inc. | | | | | | | | | | |
Term Loan, 4.00%, Maturing April 16, 2018 | | | | | 5,503 | | | | 5,543,302 | |
Caesars Entertainment Operating Company | | | | | | | | | | |
Term Loan, 9.50%, Maturing October 31, 2016 | | | | | 9,725 | | | | 9,997,845 | |
Term Loan, 5.46%, Maturing January 26, 2018 | | | | | 49,603 | | | | 44,677,001 | |
Gala Group LTD | | | | | | | | | | |
Term Loan, 5.51%, Maturing May 30, 2018 | | GBP | | | 27,445 | | | | 41,653,474 | |
Isle of Capri Casinos, Inc. | | | | | | | | | | |
Term Loan, 4.75%, Maturing March 24, 2017 | | | | | 6,415 | | | | 6,478,929 | |
Las Vegas Sands LLC | | | | | | | | | | |
Term Loan, 2.72%, Maturing November 23, 2016 | | | | | 3,253 | | | | 3,252,658 | |
Term Loan, 2.72%, Maturing November 23, 2016 | | | | | 3,626 | | | | 3,626,103 | |
LodgeNet Entertainment Corporation | | | | | | | | | | |
Term Loan, 8.50%, Maturing April 4, 2014 | | | | | 6,104 | | | | 4,755,829 | |
Penn National Gaming, Inc. | | | | | | | | | | |
Term Loan, Maturing July 16, 2018(3) | | | | | 3,900 | | | | 3,923,158 | |
Pinnacle Entertainment, Inc. | | | | | | | | | | |
Term Loan, 4.00%, Maturing March 19, 2019 | | | | | 9,257 | | | | 9,314,396 | |
Quidnax AB | | | | | | | | | | |
Term Loan, 2.29%, Maturing April 27, 2015 | | EUR | | | 4,725 | | | | 5,613,436 | |
Term Loan, 2.79%, Maturing June 30, 2016 | | EUR | | | 4,725 | | | | 5,613,436 | |
| | | | | | | | | | | |
| | | $ | 149,593,841 | |
| | | | | | | | | | | |
|
Nonferrous Metals / Minerals — 1.4% | |
Arch Coal Inc. | | | | | | | | | | |
Term Loan, 5.75%, Maturing May 16, 2018 | | | | | 28,653 | | | $ | 28,919,748 | |
Fairmount Minerals LTD | | | | | | | | | | |
Term Loan, 5.25%, Maturing March 15, 2017 | | | | | 34,301 | | | | 34,353,144 | |
Noranda Aluminum Acquisition Corporation | | | | | | | | | | |
Term Loan, 5.75%, Maturing February 24, 2019 | | | | | 11,990 | | | | 12,117,141 | |
| | | | |
| | 31 | | See Notes to Financial Statements. |
Floating Rate Portfolio
October 31, 2012
Portfolio of Investments — continued
| | | | | | | | | | |
| Borrower/Tranche Description | | | | Principal
Amount*
(000’s omitted) | | | Value | |
| | | | | | | | | | |
|
Nonferrous Metals / Minerals (continued) | |
Novelis, Inc. | | | | | | | | | | |
Term Loan, 4.00%, Maturing March 10, 2017 | | | | | 7,920 | | | $ | 7,928,221 | |
Term Loan, 4.00%, Maturing March 10, 2017 | | | | | 15,506 | | | | 15,521,957 | |
Oxbow Carbon and Mineral Holdings LLC | | | | | | | | | | |
Term Loan, 3.71%, Maturing May 8, 2016 | | | | | 14,897 | | | | 14,952,914 | |
United Distribution Group, Inc. | | | | | | | | | | |
Term Loan, 7.50%, Maturing October 9, 2018 | | | | | 13,150 | | | | 12,689,750 | |
Term Loan - Second Lien, 12.50%, Maturing April 12, 2019 | | | | | 2,000 | | | | 1,910,000 | |
| | | | | | | | | | | |
| | | $ | 128,392,875 | |
| | | | | | | | | | | |
|
Oil and Gas — 3.0% | |
Buffalo Gulf Coast Terminals LLC | | | | | | | | | | |
Term Loan, 7.50%, Maturing October 31, 2017 | | | | | 6,806 | | | $ | 6,942,375 | |
Citgo Petroleum Corporation | | | | | | | | | | |
Term Loan, 8.00%, Maturing June 24, 2015 | | | | | 2,244 | | | | 2,262,340 | |
Term Loan, 9.00%, Maturing June 23, 2017 | | | | | 22,740 | | | | 23,180,668 | |
Crestwood Holdings LLC | | | | | | | | | | |
Term Loan, 9.75%, Maturing March 26, 2018 | | | | | 12,884 | | | | 13,077,723 | |
Energy Transfer Equity, L.P. | | | | | | | | | | |
Term Loan, 3.75%, Maturing March 24, 2017 | | | | | 31,825 | | | | 31,853,738 | |
Frac Tech International LLC | | | | | | | | | | |
Term Loan, 8.50%, Maturing May 6, 2016 | | | | | 16,965 | | | | 15,325,259 | |
Gibson Energy ULC | | | | | | | | | | |
Term Loan, 4.75%, Maturing June 15, 2018 | | | | | 24,436 | | | | 24,726,574 | |
MEG Energy Corp. | | | | | | | | | | |
Term Loan, 4.00%, Maturing March 16, 2018 | | | | | 20,825 | | | | 20,948,232 | |
Obsidian Natural Gas Trust | | | | | | | | | | |
Term Loan, 7.00%, Maturing November 2, 2015 | | | | | 29,252 | | | | 29,398,477 | |
Plains Exploration & Production | | | | | | | | | | |
Term Loan, Maturing September 13, 2019(3) | | | | | 27,575 | | | | 27,735,045 | |
Samson Investment Company | | | | | | | | | | |
Term Loan - Second Lien, 6.00%, Maturing September 13, 2018 | | | | | 9,200 | | | | 9,296,315 | |
Sheridan Production Partners I, LLC | | | | | | | | | | |
Term Loan, 5.00%, Maturing September 14, 2019 | | | | | 22,127 | | | | 22,161,495 | |
Term Loan, 5.00%, Maturing September 25, 2019 | | | | | 1,791 | | | | 1,793,679 | |
Term Loan, 5.00%, Maturing September 25, 2019 | | | | | 2,932 | | | | 2,936,578 | |
Tallgrass Energy Partners, LP | | | | | | | | | | |
Term Loan, Maturing October 25, 2018(3) | | | | | 24,300 | | | | 24,345,562 | |
Tervita Corporation | | | | | | | | | | |
Term Loan, 3.21%, Maturing November 14, 2014 | | | | | 3,045 | | | | 2,999,056 | |
Term Loan, 3.21%, Maturing November 14, 2014 | | | | | 17,305 | | | | 17,042,277 | |
Term Loan, 6.50%, Maturing November 14, 2014 | | | | | 6,476 | | | | 6,486,858 | |
| | | | | | | | | | | |
| | | $ | 282,512,251 | |
| | | | | | | | | | | |
| | | | | | | | | | |
| Borrower/Tranche Description | | | | Principal
Amount*
(000’s omitted) | | | Value | |
| | | | | | | | | | |
|
Publishing — 3.6% | |
Ascend Learning, Inc. | | | | | | | | | | |
Term Loan, 5.75%, Maturing May 23, 2017 | | | | | 21,939 | | | $ | 22,010,481 | |
Aster Zweite Beteiligungs GmbH | | | | | | | | | | |
Term Loan, 5.98%, Maturing December 31, 2013 | | | | | 19 | | | | 18,064 | |
Term Loan, 5.98%, Maturing December 31, 2013 | | | | | 33 | | | | 32,247 | |
Term Loan, 5.95%, Maturing December 31, 2014 | | EUR | | | 719 | | | | 910,659 | |
Term Loan, 5.95%, Maturing December 31, 2014 | | EUR | | | 1,235 | | | | 1,565,359 | |
Term Loan, 5.95%, Maturing December 31, 2014 | | EUR | | | 2,435 | | | | 3,085,301 | |
Term Loan, 5.97%, Maturing December 31, 2014 | | | | | 959 | | | | 935,678 | |
Term Loan, 5.97%, Maturing December 31, 2014 | | | | | 2,491 | | | | 2,430,930 | |
Term Loan, 5.97%, Maturing December 31, 2014 | | | | | 7,273 | | | | 7,096,865 | |
Term Loan, 5.97%, Maturing December 31, 2014 | | | | | 9,809 | | | | 9,571,514 | |
Term Loan, 5.97%, Maturing December 31, 2014 | | | | | 13,060 | | | | 12,744,842 | |
Black Press US Partnership | | | | | | | | | | |
Term Loan, 2.42%, Maturing August 2, 2013 | | | | | 784 | | | | 768,802 | |
Term Loan, 2.42%, Maturing August 2, 2013 | | | | | 1,292 | | | | 1,266,263 | |
Cengage Learning Acquisitions, Inc. | | | | | | | | | | |
Term Loan, 2.47%, Maturing July 3, 2014 | | | | | 23,816 | | | | 22,774,080 | |
GateHouse Media Operating, Inc. | | | | | | | | | | |
Term Loan, 2.22%, Maturing August 28, 2014 | | | | | 4,830 | | | | 1,667,577 | |
Term Loan, 2.22%, Maturing August 28, 2014 | | | | | 15,390 | | | | 5,313,388 | |
Term Loan, 2.47%, Maturing August 28, 2014 | | | | | 9,186 | | | | 3,171,624 | |
Getty Images, Inc. | | | | | | | | | | |
Term Loan, 4.75%, Maturing September 13, 2019 | | | | | 53,600 | | | | 53,894,800 | |
Instant Web, Inc. | | | | | | | | | | |
Term Loan, 3.59%, Maturing August 7, 2014 | | | | | 1,614 | | | | 1,259,149 | |
Term Loan, 3.59%, Maturing August 7, 2014 | | | | | 15,486 | | | | 12,078,947 | |
Interactive Data Corporation | | | | | | | | | | |
Term Loan, 4.50%, Maturing February 12, 2018 | | | | | 34,219 | | | | 34,480,043 | |
Laureate Education, Inc. | | | | | | | | | | |
Term Loan, 5.25%, Maturing June 18, 2018 | | | | | 65,723 | | | | 65,559,069 | |
MediaNews Group | | | | | | | | | | |
Term Loan, 8.50%, Maturing March 19, 2014 | | | | | 1,206 | | | | 1,176,167 | |
Merrill Communications, LLC | | | | | | | | | | |
Term Loan, 9.75%, Maturing December 24, 2012 | | | | | 11,854 | | | | 11,824,604 | |
Nelson Education Ltd. | | | | | | | | | | |
Term Loan, 2.86%, Maturing July 3, 2014 | | | | | 277 | | | | 235,032 | |
Newspaper Holdings Inc. | | | | | | | | | | |
Term Loan, 1.88%, Maturing July 24, 2014 | | | | | 17,191 | | | | 15,954,544 | |
Nielsen Finance LLC | | | | | | | | | | |
Term Loan, 3.47%, Maturing May 2, 2016 | | | | | 35,225 | | | | 35,438,626 | |
Term Loan, 3.97%, Maturing May 2, 2016 | | | | | 3,714 | | | | 3,737,206 | |
Source Interlink Companies, Inc. | | | | | | | | | | |
Term Loan, 10.75%, Maturing December 19, 2012 | | | | | 1,627 | | | | 1,631,890 | |
Term Loan, 15.00%, Maturing March 18, 2014(5)(6) | | | | | 1,868 | | | | 797,068 | |
| | | | |
| | 32 | | See Notes to Financial Statements. |
Floating Rate Portfolio
October 31, 2012
Portfolio of Investments — continued
| | | | | | | | | | |
| Borrower/Tranche Description | | | | Principal
Amount*
(000’s omitted) | | | Value | |
| | | | | | | | | | |
|
Publishing (continued) | |
Source Interlink Companies, Inc. (continued) | | | | | | | | | | |
Term Loan - Second Lien, 10.75%, Maturing June 18, 2013 | | | | | 3,981 | | | $ | 3,503,371 | |
Springer Science+Business Media S.A. | | | | | | | | | | |
Term Loan, 4.11%, Maturing July 21, 2016 | | EUR | | | 4,234 | | | | 5,493,807 | |
Star Tribune Company (The) | | | | | | | | | | |
Term Loan, 8.00%, Maturing September 28, 2014 | | | | | 631 | | | | 598,989 | |
Term Loan, 8.00%, Maturing September 29, 2014 | | | | | 841 | | | | 798,652 | |
| | | | | | | | | | | |
| | | $ | 343,825,638 | |
| | | | | | | | | | | |
|
Radio and Television — 2.8% | |
Clear Channel Communications, Inc. | | | | | | | | | | |
Term Loan, 3.86%, Maturing January 29, 2016 | | | | | 17,415 | | | $ | 14,468,130 | |
Cumulus Media Holdings Inc. | | | | | | | | | | |
Term Loan, 5.75%, Maturing September 17, 2018 | | | | | 51,910 | | | | 52,290,039 | |
Entercom Radio, LLC | | | | | | | | | | |
Term Loan, 6.25%, Maturing November 23, 2018 | | | | | 6,255 | | | | 6,298,785 | |
Foxco Acquisition Sub, LLC | | | | | | | | | | |
Term Loan, 5.50%, Maturing July 31, 2017 | | | | | 14,625 | | | | 14,844,722 | |
Gray Television, Inc. | | | | | | | | | | |
Term Loan, 4.51%, Maturing October 15, 2019(2) | | | | | 9,725 | | | | 9,785,781 | |
Hubbard Radio, LLC | | | | | | | | | | |
Term Loan, 5.25%, Maturing April 28, 2017 | | | | | 4,680 | | | | 4,715,150 | |
LIN Television Corp. | | | | | | | | | | |
Term Loan, 5.00%, Maturing December 21, 2018 | | | | | 6,923 | | | | 7,004,894 | |
Local TV Finance, LLC | | | | | | | | | | |
Term Loan, 4.22%, Maturing May 7, 2015 | | | | | 14,108 | | | | 14,178,662 | |
Mission Broadcasting, Inc. | | | | | | | | | | |
Term Loan, 5.00%, Maturing September 30, 2016 | | | | | 3,726 | | | | 3,735,791 | |
Nexstar Broadcasting, Inc. | | | | | | | | | | |
Term Loan, 5.00%, Maturing September 30, 2016 | | | | | 10,754 | | | | 10,780,465 | |
Radio One, Inc. | | | | | | | | | | |
Term Loan, 7.50%, Maturing March 31, 2016 | | | | | 9,806 | | | | 9,879,359 | |
Raycom TV Broadcasting, Inc. | | | | | | | | | | |
Term Loan, 4.25%, Maturing May 31, 2017 | | | | | 12,517 | | | | 12,453,980 | |
Sinclair Television Group Inc. | | | | | | | | | | |
Term Loan, 4.00%, Maturing October 28, 2016 | | | | | 8,719 | | | | 8,780,595 | |
Tyrol Acquisitions 2 SAS | | | | | | | | | | |
Term Loan, 4.11%, Maturing January 29, 2016(5) | | EUR | | | 5,051 | | | | 5,943,467 | |
Term Loan, 4.11%, Maturing January 29, 2016 | | EUR | | | 10,658 | | | | 12,541,765 | |
Term Loan, 4.11%, Maturing January 29, 2016 | | EUR | | | 10,658 | | | | 12,541,765 | |
Univision Communications Inc. | | | | | | | | | | |
Term Loan, 2.21%, Maturing September 29, 2014 | | | | | 6,249 | | | | 6,238,482 | |
Term Loan, 4.46%, Maturing March 31, 2017 | | | | | 46,397 | | | | 45,527,208 | |
| | | | | | | | | | |
| Borrower/Tranche Description | | | | Principal
Amount*
(000’s omitted) | | | Value | |
| | | | | | | | | | |
|
Radio and Television (continued) | |
Weather Channel | | | | | | | | | | |
Term Loan, 4.25%, Maturing February 13, 2017 | | | | | 15,662 | | | $ | 15,792,118 | |
| | | | | | | | | | | |
| | | $ | 267,801,158 | |
| | | | | | | | | | | |
|
Retailers (Except Food and Drug) — 3.6% | |
99 Cents Only Stores | | | | | | | | | | |
Term Loan, 5.25%, Maturing January 11, 2019 | | | | | 12,011 | | | $ | 12,169,919 | |
David’s Bridal, Inc. | | | | | | | | | | |
Term Loan, 5.00%, Maturing October 2, 2019 | | | | | 7,400 | | | | 7,397,691 | |
Evergreen Acqco 1 LP | | | | | | | | | | |
Term Loan, 5.00%, Maturing July 9, 2019 | | | | | 7,157 | | | | 7,189,863 | |
FTD, Inc. | | | | | | | | | | |
Term Loan, 4.75%, Maturing June 11, 2018 | | | | | 16,341 | | | | 16,442,488 | |
Harbor Freight Tools USA, Inc. | | | | | | | | | | |
Term Loan, 5.50%, Maturing November 14, 2017 | | | | | 9,701 | | | | 9,809,820 | |
J Crew Group, Inc. | | | | | | | | | | |
Term Loan, 4.75%, Maturing March 7, 2018 | | | | | 40,453 | | | | 40,543,501 | |
Jo-Ann Stores, Inc. | | | | | | | | | | |
Term Loan, 4.75%, Maturing March 16, 2018 | | | | | 22,742 | | | | 22,778,472 | |
Michaels Stores, Inc. | | | | | | | | | | |
Term Loan, 4.91%, Maturing July 29, 2016 | | | | | 4,629 | | | | 4,677,978 | |
Term Loan, 4.91%, Maturing July 29, 2016 | | | | | 21,592 | | | | 21,821,718 | |
National Vision, Inc. | | | | | | | | | | |
Term Loan, 7.00%, Maturing August 2, 2018 | | | | | 8,554 | | | | 8,681,866 | |
Neiman Marcus Group, Inc. (The) | | | | | | | | | | |
Term Loan, 4.75%, Maturing May 16, 2018 | | | | | 41,075 | | | | 41,247,720 | |
Ollie’s Bargain Outlet, Inc. | | | | | | | | | | |
Term Loan, 6.25%, Maturing September 27, 2019 | | | | | 5,350 | | | | 5,370,063 | |
Pep Boys-Manny, Moe & Jack (The) | | | | | | | | | | |
Term Loan, 5.00%, Maturing October 17, 2018 | | | | | 5,100 | | | | 5,142,498 | |
Petco Animal Supplies, Inc. | | | | | | | | | | |
Term Loan, 4.50%, Maturing November 24, 2017 | | | | | 34,692 | | | | 34,911,995 | |
Pilot Travel Centers LLC | | | | | | | | | | |
Term Loan, 3.75%, Maturing March 30, 2018 | | | | | 11,692 | | | | 11,767,457 | |
Term Loan, 4.25%, Maturing August 7, 2019 | | | | | 3,950 | | | | 3,983,330 | |
ServiceMaster Company | | | | | | | | | | |
Term Loan, 4.46%, Maturing January 31, 2017 | | | | | 32,539 | | | | 32,725,931 | |
Visant Holding Corp. | | | | | | | | | | |
Term Loan, 5.25%, Maturing December 22, 2016 | | | | | 20,266 | | | | 19,578,161 | |
Vivarte SA | | | | | | | | | | |
Term Loan, 2.42%, Maturing March 9, 2015 | | EUR | | | 86 | | | | 90,296 | |
Term Loan, 2.42%, Maturing March 9, 2015 | | EUR | | | 336 | | | | 351,118 | |
Term Loan, 2.42%, Maturing March 9, 2015 | | EUR | | | 9,880 | | | | 10,315,146 | |
Term Loan, 2.92%, Maturing March 8, 2016 | | EUR | | | 86 | | | | 90,287 | |
| | | | |
| | 33 | | See Notes to Financial Statements. |
Floating Rate Portfolio
October 31, 2012
Portfolio of Investments — continued
| | | | | | | | | | |
| Borrower/Tranche Description | | | | Principal
Amount*
(000’s omitted) | | | Value | |
| | | | | | | | | | |
|
Retailers (Except Food and Drug) (continued) | |
Vivarte SA (continued) | | | | | | | | | | |
Term Loan, 2.92%, Maturing March 8, 2016 | | EUR | | | 336 | | | $ | 351,118 | |
Term Loan, 2.92%, Maturing March 8, 2016 | | EUR | | | 9,880 | | | | 10,315,146 | |
Term Loan - Second Lien, 3.92%, Maturing September 8, 2016 | | EUR | | | 13 | | | | 11,773 | |
Term Loan - Second Lien, 3.92%, Maturing September 8, 2016 | | EUR | | | 88 | | | | 82,414 | |
Term Loan - Second Lien, 3.92%, Maturing September 8, 2016 | | EUR | | | 900 | | | | 847,682 | |
Wilton Brands LLC | | | | | | | | | | |
Term Loan, 7.50%, Maturing August 30, 2018 | | | | | 6,850 | | | | 6,922,781 | |
| | | | | | | | | | | |
| | | $ | 335,618,232 | |
| | | | | | | | | | | |
|
Steel — 1.4% | |
Essar Steel Algoma, Inc. | | | | | | | | | | |
Term Loan, 8.75%, Maturing September 19, 2014 | | | | | 16,425 | | | $ | 16,630,312 | |
FMG America Finance, Inc. | | | | | | | | | | |
Term Loan, 5.25%, Maturing October 18, 2017 | | | | | 65,725 | | | | 65,560,687 | |
JMC Steel Group, Inc. | | | | | | | | | | |
Term Loan, 4.75%, Maturing April 3, 2017 | | | | | 23,029 | | | | 23,316,894 | |
Patriot Coal Corporation | | | | | | | | | | |
Term Loan, 9.25%, Maturing October 4, 2013 | | | | | 8,925 | | | | 8,991,938 | |
SunCoke Energy, Inc. | | | | | | | | | | |
Term Loan, 4.00%, Maturing July 26, 2018 | | | | | 7,779 | | | | 7,817,951 | |
Waupaca Foundry, Inc. | | | | | | | | | | |
Term Loan, 8.50%, Maturing June 29, 2017 | | | | | 6,863 | | | | 6,948,914 | |
WireCo WorldGroup, Inc. | | | | | | | | | | |
Term Loan, 6.00%, Maturing February 15, 2017 | | | | | 6,825 | | | | 6,910,313 | |
| | | | | | | | | | | |
| | | $ | 136,177,009 | |
| | | | | | | | | | | |
|
Surface Transport — 1.1% | |
Hertz Corporation (The) | | | | | | | | | | |
Term Loan, 3.75%, Maturing March 9, 2018 | | | | | 29,150 | | | $ | 29,040,688 | |
Term Loan, 3.75%, Maturing March 9, 2018 | | | | | 30,380 | | | | 30,347,096 | |
Term Loan, Maturing March 11, 2018(3) | | | | | 25,200 | | | | 25,152,750 | |
Swift Transportation Co. Inc. | | | | | | | | | | |
Term Loan, 3.96%, Maturing December 21, 2016 | | | | | 1,227 | | | | 1,233,533 | |
Term Loan, 5.00%, Maturing December 21, 2017 | | | | | 21,538 | | | | 21,712,960 | |
| | | | | | | | | | | |
| | | $ | 107,487,027 | |
| | | | | | | | | | | |
|
Telecommunications — 3.8% | |
Alaska Communications Systems Holdings, Inc. | | | | | | | | | | |
Term Loan, 5.50%, Maturing October 21, 2016 | | | | | 13,976 | | | $ | 12,980,268 | |
Cellular South, Inc. | | | | | | | | | | |
Term Loan, 4.50%, Maturing July 27, 2017 | | | | | 6,838 | | | | 6,855,534 | |
| | | | | | | | | | |
| Borrower/Tranche Description | | | | Principal
Amount*
(000’s omitted) | | | Value | |
| | | | | | | | | | |
|
Telecommunications (continued) | |
Cricket Communications, Inc. | | | | | | | | | | |
Term Loan, 4.75%, Maturing October 10, 2019 | | | | | 11,425 | | | $ | 11,496,406 | |
Crown Castle International Corporation | | | | | | | | | | |
Term Loan, 4.00%, Maturing January 31, 2019 | | | | | 16,900 | | | | 17,016,988 | |
Eircom Finco S.a.r.l. | | | | | | | | | | |
Term Loan, 4.27%, Maturing September 30, 2017 | | EUR | | | 9,155 | | | | 8,478,442 | |
Intelsat Jackson Holdings Ltd. | | | | | | | | | | |
Term Loan, 4.50%, Maturing April 2, 2018 | | | | | 94,608 | | | | 95,444,270 | |
IPC Systems, Inc. | | | | | | | | | | |
Term Loan, 2.85%, Maturing May 31, 2014 | | GBP | | | 262 | | | | 414,413 | |
Macquarie UK Broadcast Limited | | | | | | | | | | |
Term Loan, 2.75%, Maturing July 1, 2014 | | GBP | | | 6,000 | | | | 9,198,370 | |
Term Loan, 3.00%, Maturing December 1, 2014 | | GBP | | | 14,352 | | | | 21,925,682 | |
MetroPCS Wireless, Inc. | | | | | | | | | | |
Term Loan, 4.07%, Maturing November 3, 2016 | | | | | 1,984 | | | | 1,990,893 | |
Term Loan, 4.00%, Maturing March 16, 2018 | | | | | 79,674 | | | | 79,989,192 | |
Midcontinent Communications | | | | | | | | | | |
Term Loan, 4.00%, Maturing December 30, 2016 | | | | | 8,717 | | | | 8,716,665 | |
NTELOS Inc. | | | | | | | | | | |
Term Loan, 4.00%, Maturing August 7, 2015 | | | | | 2,912 | | | | 2,924,298 | |
Oberthur Technologies Holding SAS | | | | | | | | | | |
Term Loan, 6.25%, Maturing March 30, 2019 | | | | | 3,700 | | | | 3,688,437 | |
SBA Finance | | | | | | | | | | |
Term Loan, 3.75%, Maturing June 29, 2018 | | | | | 9,507 | | | | 9,536,698 | |
Term Loan, 3.75%, Maturing September 27, 2019 | | | | | 4,725 | | | | 4,754,531 | |
Syniverse Holdings, Inc. | | | | | | | | | | |
Term Loan, 5.00%, Maturing April 23, 2019 | | | | | 21,895 | | | | 22,031,970 | |
Telesat LLC | | | | | | | | | | |
Term Loan, 4.25%, Maturing March 28, 2019 | | | | | 34,688 | | | | 34,887,519 | |
Windstream Corporation | | | | | | | | | | |
Term Loan, 4.00%, Maturing August 8, 2019 | | | | | 10,025 | | | | 10,100,062 | |
| | | | | | | | | | | |
| | | $ | 362,430,638 | |
| | | | | | | | | | | |
|
Utilities — 2.2% | |
AES Corporation | | | | | | | | | | |
Term Loan, 4.25%, Maturing June 1, 2018 | | | | | 27,587 | | | $ | 27,794,036 | |
Calpine Corporation | | | | | | | | | | |
Term Loan, 4.50%, Maturing April 2, 2018 | | | | | 9,655 | | | | 9,698,214 | |
Term Loan, 4.50%, Maturing April 2, 2018 | | | | | 35,753 | | | | 35,891,071 | |
Term Loan, 4.50%, Maturing September 27, 2019 | | | | | 9,275 | | | | 9,305,144 | |
Covanta Energy Corporation | | | | | | | | | | |
Term Loan, 4.00%, Maturing March 28, 2019 | | | | | 4,776 | | | | 4,793,910 | |
Dynegy Midwest Generation LLC | | | | | | | | | | |
Term Loan, 9.25%, Maturing August 4, 2016 | | | | | 9,411 | | | | 9,787,651 | |
| | | | |
| | 34 | | See Notes to Financial Statements. |
Floating Rate Portfolio
October 31, 2012
Portfolio of Investments — continued
| | | | | | | | | | |
| Borrower/Tranche Description | | | | Principal
Amount*
(000’s omitted) | | | Value | |
| | | | | | | | | | |
|
Utilities (continued) | |
Dynegy Power, LLC | | | | | | | | | | |
Term Loan, 9.25%, Maturing August 4, 2016 | | | | | 12,672 | | | $ | 13,269,966 | |
Invenergy LLC | | | | | | | | | | |
Term Loan, 9.00%, Maturing November 21, 2017 | | | | | 8,652 | | | | 8,716,551 | |
LSP Madison Funding, LLC | | | | | | | | | | |
Term Loan, 5.50%, Maturing June 28, 2019 | | | | | 12,120 | | | | 12,240,821 | |
NRG Energy, Inc. | | | | | | | | | | |
Term Loan, 4.00%, Maturing July 2, 2018 | | | | | 34,582 | | | | 34,828,749 | |
Texas Competitive Electric Holdings Company, LLC | | | | | | | | | | |
Term Loan, 4.75%, Maturing October 10, 2017 | | | | | 56,613 | | | | 36,798,188 | |
| | | | | | | | | | | |
| | | $ | 203,124,301 | |
| | | | | | | | | | | |
| | | |
Total Senior Floating-Rate Interests
(identified cost $8,671,318,323) | | | | | | | | $ | 8,684,955,274 | |
| | | | | | | | | | | |
|
| Corporate Bonds & Notes — 3.4% | |
| | | |
| | | | | | | | | | |
| Security | | | | Principal
Amount*
(000’s omitted) | | | Value | |
|
Broadcast Radio and Television — 0.0%(4) | |
Entravision Communications Corp., Sr. Notes | | | | | | | | | | |
8.75%, 8/1/17 | | | | | 2,844 | | | $ | 3,089,295 | |
| | | | | | | | | | | |
| | | $ | 3,089,295 | |
| | | | | | | | | | | |
|
Building and Development — 0.0%(4) | |
Calcipar SA, Sr. Notes | | | | | | | | | | |
6.875%, 5/1/18(7) | | | | | 4,000 | | | $ | 4,030,000 | |
| | | | | | | | | | | |
| | | $ | 4,030,000 | |
| | | | | | | | | | | |
|
Chemicals and Plastics — 0.5% | |
Hexion US Finance Corp., Sr. Notes | | | | | | | | | | |
6.625%, 4/15/20 | | | | | 2,000 | | | $ | 2,005,000 | |
Ineos Finance PLC, Sr. Notes | | | | | | | | | | |
7.25%, 2/15/19(7)(8) | | EUR | | | 8,000 | | | | 10,602,502 | |
8.375%, 2/15/19(7) | | | | | 15,250 | | | | 16,069,687 | |
7.50%, 5/1/20(7) | | | | | 9,525 | | | | 9,691,688 | |
Polymer Group, Inc., Sr. Notes | | | | | | | | | | |
7.75%, 2/1/19 | | | | | 5,000 | | | | 5,375,000 | |
| | | | | | | | | | | |
| | | $ | 43,743,877 | |
| | | | | | | | | | | |
| | | | | | | | | | |
| Security | | | | Principal
Amount*
(000’s omitted) | | | Value | |
| | | | | | | | | | |
|
Containers and Glass Products — 0.5% | |
Reynolds Group Holdings, Inc., Sr. Notes | | | | | | | | | | |
5.75%, 10/15/20(7) | | | | | 42,000 | | | $ | 42,525,000 | |
Smurfit Kappa Acquisitions, Sr. Notes | | | | | | | | | | |
4.875%, 9/15/18(7) | | | | | 4,925 | | | | 4,943,469 | |
| | | | | | | | | | | |
| | | $ | 47,468,469 | |
| | | | | | | | | | | |
|
Diversified Manufacturing Operations — 0.1% | |
Matalan Finance PLC, Sr. Notes | | | | | | | | | | |
8.875%, 4/29/16(9) | | GBP | | | 6,500 | | | $ | 10,515,593 | |
| | | | | | | | | | | |
| | | $ | 10,515,593 | |
| | | | | | | | | | | |
|
Ecological Services and Equipment — 0.0%(4) | |
Environmental Systems Product Holdings, Inc., Jr. Notes | | | | | | | | |
18.00%, 3/31/15(5)(6) | | | 184 | | | $ | 156,179 | |
| | | | | | | | | | | |
| | | $ | 156,179 | |
| | | | | | | | | | | |
|
Electronics / Electrical — 0.0%(4) | |
NXP BV/NXP Funding, LLC | | | | | | | | | | |
3.09%, 10/15/13(8) | | | | | 75 | | | $ | 75,188 | |
| | | | | | | | | | | |
| | | $ | 75,188 | |
| | | | | | | | | | | |
|
Equipment Leasing — 0.1% | |
International Lease Finance Corp., Sr. Notes | | | | | | | | | | |
6.75%, 9/1/16(7) | | | | | 2,325 | | | $ | 2,638,875 | |
7.125%, 9/1/18(7) | | | | | 2,325 | | | | 2,743,500 | |
| | | | | | | | | | | |
| | | $ | 5,382,375 | |
| | | | | | | | | | | |
|
Financial Intermediaries — 0.4% | |
First Data Corp., Sr. Notes | | | | | | | | | | |
6.75%, 11/1/20(7) | | | | | 16,850 | | | $ | 16,934,250 | |
UPCB Finance II, Ltd., Sr. Notes | | | | | | | | | | |
6.375%, 7/1/20(7) | | EUR | | | 6,500 | | | | 8,761,970 | |
6.625%, 7/1/20(7) | | | | | 9,000 | | | | 9,675,000 | |
| | | | | | | | | | | |
| | | $ | 35,371,220 | |
| | | | | | | | | | | |
|
Health Care — 0.4% | |
Accellent, Inc., Sr. Notes | | | | | | | | | | |
8.375%, 2/1/17 | | | | | 3,000 | | | $ | 3,082,500 | |
CHS/Community Health Systems, Inc., Sr. Notes | | | | | | | | | | |
5.125%, 8/15/18 | | | | | 22,625 | | | | 23,530,000 | |
| | | | |
| | 35 | | See Notes to Financial Statements. |
Floating Rate Portfolio
October 31, 2012
Portfolio of Investments — continued
| | | | | | | | | | |
| Security | | | | Principal
Amount*
(000’s omitted) | | | Value | |
| | | | | | | | | | |
|
Health Care (continued) | |
HCA, Inc., Sr. Notes | | | | | | | | | | |
4.75%, 5/1/23 | | | | | 11,975 | | | $ | 12,004,937 | |
| | | | | | | | | | | |
| | | $ | 38,617,437 | |
| | | | | | | | | | | |
|
Insurance — 0.1% | |
CNO Financial Group, Inc., Sr. Notes | | | | | | | | | | |
6.375%, 10/1/20(7) | | | | | 7,250 | | | $ | 7,540,000 | |
| | | | | | | | | | | |
| | | $ | 7,540,000 | |
| | | | | | | | | | | |
|
Leisure Goods / Activities / Movies — 0.2% | |
NAI Entertainment Holdings, LLC, Sr. Notes | | | | | | | | | | |
8.25%, 12/15/17(7) | | | | | 6,750 | | | $ | 7,543,125 | |
National CineMedia, LLC, Sr. Notes | | | | | | | | | | |
6.00%, 4/15/22(7) | | | | | 8,250 | | | | 8,745,000 | |
| | | | | | | | | | | |
| | | $ | 16,288,125 | |
| | | | | | | | | | | |
|
Lodging and Casinos — 0.3% | |
Caesars Entertainment Operating Co., Inc., Sr. Notes | | | | | | | | | | |
8.50%, 2/15/20(7) | | | | | 25,250 | | | $ | 24,871,250 | |
| | | | | | | | | | | |
| | | $ | 24,871,250 | |
| | | | | | | | | | | |
|
Radio and Television — 0.1% | |
Clear Channel Communications, Inc., Sr. Notes | | | | | | | | | | |
9.00%, 12/15/19(7) | | | | | 5,219 | | | $ | 4,723,195 | |
Univision Communications, Inc., Sr. Notes | | | | | | | | | | |
6.75%, 9/15/22(7) | | | | | 9,000 | | | | 9,045,000 | |
| | | | | | | | | | | |
| | | $ | 13,768,195 | |
| | | | | | | | | | | |
|
Telecommunications — 0.1% | |
Hughes Satellite Systems Corp., Sr. Notes | | | | | | | | | | |
6.50%, 6/15/19 | | | | | 8,500 | | | $ | 9,137,500 | |
Sunrise Communications International SA, Sr. Notes | | | | | | | | | | |
4.971%, 12/31/17(7)(8) | | EUR | | | 3,000 | | | | 3,966,217 | |
| | | | | | | | | | | |
| | | $ | 13,103,717 | |
| | | | | | | | | | | |
|
Utilities — 0.6% | |
Calpine Corp., Sr. Notes | | | | | | | | | | |
7.50%, 2/15/21(7) | | | | | 25,380 | | | $ | 27,727,650 | |
7.875%, 1/15/23(7) | | | | | 23,490 | | | | 26,073,900 | |
| | | | | | | | | | | |
| | | $ | 53,801,550 | |
| | | | | | | | | | | |
| | | |
Total Corporate Bonds & Notes
(identified cost $303,934,513) | | | | | | | | $ | 317,822,470 | |
| | | | | | | | | | | |
| | | | | | | | | | |
| Asset-Backed Securities — 0.1% | |
| | | |
| | | | | | | | | | |
| Security | | | | Principal
Amount
(000’s omitted) | | | Value | |
| | | | | | | | | | |
Alzette European CLO SA, Series 2004-1A, Class E2, 6.968%, 12/15/20(8) | | | | $ | 465 | | | $ | 414,531 | |
Avalon Capital Ltd. 3, Series 1A, Class D, 2.381%, 2/24/19(7)(8) | | | | | 884 | | | | 790,071 | |
Babson Ltd., Series 2005-1A, Class C1, 2.29%, 4/15/19(7)(8) | | | | | 1,129 | | | | 975,942 | |
Centurion CDO 8 Ltd., Series 2005-8A, Class D, 5.908%, 3/8/17(8) | | | | | 985 | | | | 961,052 | |
Morgan Stanley Investment Management Croton, Ltd., Series 2005-1A, Class D, 2.29%, 1/15/18(7)(8) | | | | | 2,000 | | | | 1,676,921 | |
| | | | | | | | | | | |
| | | |
Total Asset-Backed Securities
(identified cost $5,438,534) | | | | | | | | $ | 4,818,517 | |
| | | | | | | | | | | |
|
| Common Stocks — 0.5% | |
| | | |
| | | | | | | | | | |
| Security | | | | Shares | | | Value | |
|
Automotive — 0.0%(4) | |
Dayco Products, LLC(6)(10)(11) | | | | | 88,506 | | | $ | 2,256,903 | |
| | | | | | | | | | | |
| | | $ | 2,256,903 | |
| | | | | | | | | | | |
|
Building and Development — 0.0%(4) | |
United Subcontractors, Inc.(6)(10)(11) | | | | | 3,646 | | | $ | 151,972 | |
| | | | | | | | | | | |
| | | $ | 151,972 | |
| | | | | | | | | | | |
|
Ecological Services and Equipment — 0.0%(4) | |
Environmental Systems Products Holdings, Inc.(6)(10)(12) | | | | | 2,484 | | | $ | 179,419 | |
| | | | | | | | | | | |
| | | $ | 179,419 | |
| | | | | | | | | | | |
|
Financial Intermediaries — 0.0%(4) | |
RTS Investor Corp.(6)(10)(11) | | | | | 692 | | | $ | 66,112 | |
| | | | | | | | | | | |
| | | $ | 66,112 | |
| | | | | | | | | | | |
|
Food Service — 0.0%(4) | |
Buffets Restaurants Holdings, Inc.(6)(10)(11) | | | 329,120 | | | $ | 2,978,536 | |
| | | | | | | | | | | |
| | | $ | 2,978,536 | |
| | | | | | | | | | | |
|
Home Furnishings — 0.0%(4) | |
Oreck Corp.(6)(10)(11) | | | | | 14,217 | | | $ | 247,234 | |
Sanitec Europe Oy B Units(6)(10)(11) | | | | | 235,094 | | | | 1,477,877 | |
Sanitec Europe Oy E Units(6)(10)(11) | | | | | 230,960 | | | | 0 | |
| | | | | | | | | | | |
| | | $ | 1,725,111 | |
| | | | | | | | | | | |
| | | | |
| | 36 | | See Notes to Financial Statements. |
Floating Rate Portfolio
October 31, 2012
Portfolio of Investments — continued
| | | | | | | | | | |
| Security | | | | Shares | | | Value | |
| | | | | | | | | | |
|
Leisure Goods / Activities / Movies — 0.2% | |
Metro-Goldwyn-Mayer Holdings, Inc.(10)(11) | | | | | 414,634 | | | $ | 13,203,522 | |
| | | | | | | | | | | |
| | | $ | 13,203,522 | |
| | | | | | | | | | | |
|
Lodging and Casinos — 0.0%(4) | |
Affinity Gaming, LLC(10)(11) | | | | | 206,125 | | | $ | 2,336,079 | |
| | | | | | | | | | | |
| | | $ | 2,336,079 | |
| | | | | | | | | | | |
|
Publishing — 0.2% | |
Ion Media Networks, Inc.(6)(11) | | | | | 28,605 | | | $ | 18,192,780 | |
MediaNews Group, Inc.(6)(10)(11) | | | | | 162,730 | | | | 3,414,074 | |
Source Interlink Companies, Inc.(6)(10)(11) | | | | | 5,725 | | | | 0 | |
| | | | | | | | | | | |
| | | $ | 21,606,854 | |
| | | | | | | | | | | |
|
Radio and Television — 0.1% | |
New Young Broadcasting Holding Co., Inc.(6)(10)(11) | | | 2,310 | | | $ | 8,316,000 | |
| | | | | | | | | | | |
| | | $ | 8,316,000 | |
| | | | | | | | | | | |
| | | |
Total Common Stocks
(identified cost $32,014,031) | | | | | | | | $ | 52,820,508 | |
| | | | | | | | | | | |
|
| Preferred Stocks — 0.0%(4) | |
| | | |
| | | | | | | | | | |
| Security | | | | Shares | | | Value | |
|
Ecological Services and Equipment — 0.0%(4) | |
Environmental Systems Products Holdings, Inc., Series A(6)(10)(12) | | | | | 569 | | | $ | 35,847 | |
| | | | | | | | | | | |
| | | |
Total Preferred Stocks
(identified cost $9,958) | | | | | | | | $ | 35,847 | |
| | | | | | | | | | | |
| | | |
| Warrants — 0.0%(4) | | | | | | | | | | |
| | | |
| | | | | | | | | | |
| Security | | | | Shares | | | Value | |
|
Radio and Television — 0.0%(4) | |
New Young Broadcasting Holding Co., Inc., Expires 12/24/24(6)(10)(11) | | | | | 112 | | | $ | 403,200 | |
| | | | | | | | | | | |
| | | $ | 403,200 | |
| | | | | | | | | | | |
|
Telecommunications — 0.0% | |
ERC Luxembourg Holdings, Ltd., Expires 06/11/32(6)(10)(11) | | | | | 21,381 | | | $ | 0 | |
| | | | | | | | | | | |
| | | $ | 0 | |
| | | | | | | | | | | |
| | | |
Total Warrants
(identified cost $192,476) | | | | | | | | $ | 403,200 | |
| | | | | | | | | | | |
| | | | | | | | | | |
| Short-Term Investments — 6.7% | |
| | | |
| | | | | | | | | | |
| Description | | | | Interest
(000’s omitted) | | | Value | |
| | | | | | | | | | |
Eaton Vance Cash Reserves Fund, LLC, 0.12%(13) | | | | $ | 631,913 | | | $ | 631,913,170 | |
| | | | | | | | | | | |
| | | |
Total Short-Term Investments
(identified cost $631,913,170) | | | | | | | | $ | 631,913,170 | |
| | | | | | | | | | | |
| | | |
Total Investments — 102.8%
(identified cost $9,644,821,005) | | | | | | | | $ | 9,692,768,986 | |
| | | | | | | | | | | |
| |
Less Unfunded Loan Commitments — (0.3)% | | | $ | (22,317,946 | ) |
| | | | | | | | | | | |
| | | |
Net Investments — 102.5%
(identified cost $9,622,503,059) | | | | | | | | $ | 9,670,451,040 | |
| | | | | | | | | | | |
| |
Other Assets, Less Liabilities — (2.5)% | | | $ | (237,610,214 | ) |
| | | | | | | | | | | |
| | | |
Net Assets — 100.0% | | | | | | | | $ | 9,432,840,826 | |
| | | | | | | | | | | |
The percentage shown for each investment category in the Portfolio of Investments is based on net assets.
| | | | |
| EUR | | – | | Euro |
| GBP | | – | | British Pound Sterling |
| | * | In U.S. dollars unless otherwise indicated. |
| | (1) | Senior floating-rate interests (Senior Loans) often require prepayments from excess cash flows or permit the borrowers to repay at their election. The degree to which borrowers repay, whether as a contractual requirement or at their election, cannot be predicted with accuracy. As a result, the actual remaining maturity May be substantially less than the stated maturities shown. However, Senior Loans will have an expected average life of approximately two to four years. The stated interest rate represents the weighted average interest rate of all contracts within the senior loan facility and includes commitment fees on unfunded loan commitments, if any. Senior Loans typically have rates of interest which are redetermined either daily, monthly, quarterly or semi-annually by reference to a base lending rate, plus a premium. These base lending rates are primarily the London Interbank Offered Rate (“LIBOR”) and secondarily, the prime rate offered by one or more major United States banks (the “Prime Rate”) and the certificate of deposit (“CD”) rate or other base lending rates used by commercial lenders. |
| | (2) | Unfunded or partially unfunded loan commitments. The Portfolio May enter into certain credit agreements all or a portion of which May be unfunded. The Portfolio is obligated to fund these commitments at the borrower’s discretion. See Note 1G for description. |
| | (3) | This Senior Loan will settle after October 31, 2012, at which time the interest rate will be determined. |
| | (4) | Amount is less than 0.05%. |
| | (5) | Represents a payment-in-kind security which May pay all or a portion of interest in additional par. |
| | (6) | For fair value measurement disclosure purposes, security is categorized as Level 3 (see Note 10). |
| | (7) | Security exempt from registration pursuant to Rule 144A under the Securities Act of 1933. These securities May be sold in certain |
| | | | |
| | 37 | | See Notes to Financial Statements. |
Floating Rate Portfolio
October 31, 2012
Portfolio of Investments — continued
| | transactions (normally to qualified institutional buyers) and remain exempt from registration. At October 31, 2012, the aggregate value of these securities is $252,294,212 or 2.7% of the Portfolio’s net assets. |
| | (8) | Variable rate security. The stated interest rate represents the rate in effect at October 31, 2012. |
| | (9) | Security exempt from registration under Regulation S of the Securities Act of 1933, which exempts from registration securities offered and sold outside the United States. Security May not be offered or sold in the United States except pursuant to an exemption from, or in a transaction not subject to, the registration requirements of the Securities Act of 1933. |
| (10) | Non-income producing security. |
| (11) | Security was acquired in connection with a restructuring of a Senior Loan and May be subject to restrictions on resale. |
| (12) | Restricted security (see Note 5). |
| (13) | Affiliated investment company available to Eaton Vance portfolios and funds which invests in high quality, U.S. dollar denominated money market instruments. The rate shown is the annualized seven-day yield as of October 31, 2012. |
| | | | |
| | 38 | | See Notes to Financial Statements. |
Floating Rate Portfolio
October 31, 2012
Statement of Assets and Liabilities
| | | | |
| Assets | | October 31, 2012 | |
Unaffiliated investments, at value (identified cost, $8,990,589,889) | | $ | 9,038,537,870 | |
Affiliated investment, at value (identified cost, $631,913,170) | | | 631,913,170 | |
Cash | | | 37,130,183 | |
Restricted cash* | | | 13,554,205 | |
Foreign currency, at value (identified cost, $13,651,438) | | | 13,663,520 | |
Interest receivable | | | 33,060,102 | |
Interest receivable from affiliated investment | | | 70,003 | |
Receivable for investments sold | | | 42,668,186 | |
Receivable for open forward foreign currency exchange contracts | | | 94,937 | |
Receivable for closed swap contracts | | | 35,306 | |
Prepaid expenses | | | 530,797 | |
Total assets | | $ | 9,811,258,279 | |
| |
| Liabilities | | | | |
Payable for investments purchased | | $ | 365,093,937 | |
Payable for open forward foreign currency exchange contracts | | | 5,193,917 | |
Payable for open swap contracts | | | 3,803,787 | |
Payable to affiliates: | | | | |
Investment adviser fee | | | 3,966,637 | |
Trustees’ fees | | | 5,663 | |
Accrued expenses | | | 353,512 | |
Total liabilities | | $ | 378,417,453 | |
Net Assets applicable to investors’ interest in Portfolio | | $ | 9,432,840,826 | |
| |
| Sources of Net Assets | | | | |
Investors’ capital | | $ | 9,391,946,290 | |
Net unrealized appreciation | | | 40,894,536 | |
Total | | $ | 9,432,840,826 | |
| * | Represents restricted cash on deposit at the custodian as collateral for open financial contracts. |
| | | | |
| | 39 | | See Notes to Financial Statements. |
Floating Rate Portfolio
October 31, 2012
Statement of Operations
| | | | |
| Investment Income | | Year Ended
October 31, 2012 | |
Interest and other income | | $ | 484,896,737 | |
Dividends | | | 5,990,143 | |
Interest allocated from affiliated investment | | | 446,890 | |
Expenses allocated from affiliated investment | | | (59,158 | ) |
Total investment income | | $ | 491,274,612 | |
| |
| Expenses | | | | |
Investment adviser fee | | $ | 46,845,003 | |
Trustees’ fees and expenses | | | 69,455 | |
Custodian fee | | | 1,841,306 | |
Legal and accounting services | | | 459,434 | |
Miscellaneous | | | 1,290,439 | |
Total expenses | | $ | 50,505,637 | |
Deduct — | | | | |
Reduction of custodian fee | | $ | 128 | |
Total expense reductions | | $ | 128 | |
| |
Net expenses | | $ | 50,505,509 | |
| |
Net investment income | | $ | 440,769,103 | |
| |
| Realized and Unrealized Gain (Loss) | | | | |
Net realized gain (loss) — | | | | |
Investment transactions | | $ | 33,033,340 | |
Investment transactions allocated from affiliated investment | | | 7,041 | |
Swap contracts | | | (1,111,685 | ) |
Foreign currency and forward foreign currency exchange contract transactions | | | 31,101,240 | |
Net realized gain | | $ | 63,029,936 | |
Change in unrealized appreciation (depreciation) — | | | | |
Investments | | $ | 194,665,096 | |
Swap contracts | | | (1,007,489 | ) |
Foreign currency and forward foreign currency exchange contracts | | | (8,718,195 | ) |
Net change in unrealized appreciation (depreciation) | | $ | 184,939,412 | |
| |
Net realized and unrealized gain | | $ | 247,969,348 | |
| |
Net increase in net assets from operations | | $ | 688,738,451 | |
| | | | |
| | 40 | | See Notes to Financial Statements. |
Floating Rate Portfolio
October 31, 2012
Statements of Changes in Net Assets
| | | | | | | | |
| | | Year Ended October 31, | |
| Increase (Decrease) in Net Assets | | 2012 | | | 2011 | |
From operations — | | | | | | | | |
Net investment income | | $ | 440,769,103 | | | $ | 397,412,294 | |
Net realized gain (loss) from investment transactions, swap contracts and foreign currency and forward foreign currency exchange contract transactions | | | 63,029,936 | | | | (18,065,295 | ) |
Net change in unrealized appreciation (depreciation) from investments, swap contracts, foreign currency and forward foreign currency exchange contracts | | | 184,939,412 | | | | (100,433,238 | ) |
Net increase in net assets from operations | | $ | 688,738,451 | | | $ | 278,913,761 | |
Capital transactions — | | | | | | | | |
Contributions | | $ | 1,137,173,133 | | | $ | 4,383,895,129 | |
Withdrawals | | | (2,087,404,801 | ) | | | (1,465,370,574 | ) |
Net increase (decrease) in net assets from capital transactions | | $ | (950,231,668 | ) | | $ | 2,918,524,555 | |
| | |
Net increase (decrease) in net assets | | $ | (261,493,217 | ) | | $ | 3,197,438,316 | |
| | |
| Net Assets | | | | | | | | |
At beginning of year | | $ | 9,694,334,043 | | | $ | 6,496,895,727 | |
At end of year | | $ | 9,432,840,826 | | | $ | 9,694,334,043 | |
| | | | |
| | 41 | | See Notes to Financial Statements. |
Floating Rate Portfolio
October 31, 2012
Supplementary Data
| | | | | | | | | | | | | | | | | | | | |
| | | Year Ended October 31, | |
| Ratios/Supplemental Data | | 2012 | | | 2011 | | | 2010 | | | 2009 | | | 2008 | |
Ratios (as a percentage of average daily net assets): | | | | | | | | | | | | | | | | | | | | |
Expenses(1) | | | 0.54 | % | | | 0.54 | % | | | 0.57 | % | | | 0.61 | % | | | 0.70 | % |
Net investment income | | | 4.72 | % | | | 4.31 | % | | | 4.43 | % | | | 5.41 | % | | | 6.50 | % |
Portfolio Turnover | | | 42 | % | | | 56 | % | | | 39 | % | | | 35 | % | | | 7 | % |
| | | | | |
Total Return | | | 7.67 | % | | | 4.30 | % | | | 10.51 | % | | | 27.54 | % | | | (22.24 | )% |
| | | | | |
Net assets, end of year (000’s omitted) | | $ | 9,432,841 | | | $ | 9,694,334 | | | $ | 6,496,896 | | | $ | 4,294,340 | | | $ | 3,056,210 | |
| (1) | Excludes the effect of custody fee credits, if any, of less than 0.005%. |
| | | | |
| | 42 | | See Notes to Financial Statements. |
Floating Rate Portfolio
October 31, 2012
Notes to Financial Statements
1 Significant Accounting Policies
Floating Rate Portfolio (the Portfolio) is a Massachusetts business trust registered under the Investment Company Act of 1940, as amended (the 1940 Act), as a diversified, open-end management investment company. The Portfolio’s investment objective is to provide a high level of current income. The Declaration of Trust permits the Trustees to issue interests in the Portfolio. At October 31, 2012, Eaton Vance Floating-Rate Fund, Eaton Vance Strategic Income Fund, Eaton Vance Floating-Rate & High Income Fund, Eaton Vance Multi-Strategy Absolute Return Fund, Eaton Vance Low Duration Government Income Fund (formerly, Eaton Vance Low Duration Fund), Eaton Vance Short Term Real Return Fund and Eaton Vance Multi-Strategy All Market Fund held an interest of 83.0%, 4.6%, 10.1%, 1.0%, 0.5%, 0.3% and 0.3%, respectively, in the Portfolio.
The following is a summary of significant accounting policies of the Portfolio. The policies are in conformity with accounting principles generally accepted in the United States of America.
A Investment Valuation — Interests in senior floating-rate loans (Senior Loans) for which reliable market quotations are readily available are valued generally at the average mean of bid and ask quotations obtained from a third party pricing service. Other Senior Loans are valued at fair value by the investment adviser under procedures approved by the Trustees. In fair valuing a Senior Loan, the investment adviser utilizes one or more of the valuation techniques described in (i) through (iii) below to assess the likelihood that the borrower will make a full repayment of the loan underlying such Senior Loan relative to yields on other Senior Loans issued by companies of comparable credit quality. If the investment adviser believes that there is a reasonable likelihood of full repayment, the investment adviser will determine fair value using a matrix pricing approach that considers the yield on the Senior Loan. If the investment adviser believes there is not a reasonable likelihood of full repayment, the investment adviser will determine fair value using analyses that include, but are not limited to: (i) a comparison of the value of the borrower’s outstanding equity and debt to that of comparable public companies; (ii) a discounted cash flow analysis; or (iii) when the investment adviser believes it is likely that a borrower will be liquidated or sold, an analysis of the terms of such liquidation or sale. In certain cases, the investment adviser will use a combination of analytical methods to determine fair value, such as when only a portion of a borrower’s assets are likely to be sold. In conducting its assessment and analyses for purposes of determining fair value of a Senior Loan, the investment adviser will use its discretion and judgment in considering and appraising relevant factors. Fair value determinations are made by the portfolio managers of the Portfolio based on information available to such managers. The portfolio managers of other funds managed by the investment adviser that invest in Senior Loans may not possess the same information about a Senior Loan borrower as the portfolio managers of the Portfolio. At times, the fair value of a Senior Loan determined by the portfolio managers of other funds managed by the investment adviser that invest in Senior Loans may vary from the fair value of the same Senior Loan determined by the portfolio managers of the Portfolio. The fair value of each Senior Loan is periodically reviewed and approved by the investment adviser’s Valuation Committee and by the Trustees based upon procedures approved by the Trustees. Junior Loans (i.e., subordinated loans and second lien loans) are valued in the same manner as Senior Loans.
Debt obligations (including short-term obligations with a remaining maturity of more than sixty days) are generally valued on the basis of valuations provided by third party pricing services, as derived from such services’ pricing models. Inputs to the models may include, but are not limited to, reported trades, executable bid and asked prices, broker/dealer quotations, prices or yields of securities with similar characteristics, benchmark curves or information pertaining to the issuer, as well as industry and economic events. The pricing services may use a matrix approach, which considers information regarding securities with similar characteristics to determine the valuation for a security. Short-term obligations purchased with a remaining maturity of sixty days or less are generally valued at amortized cost, which approximates market value.
Equity securities (including common shares of closed-end investment companies) listed on a U.S. securities exchange generally are valued at the last sale or closing price on the day of valuation or, if no sales took place on such date, at the mean between the closing bid and asked prices therefore on the exchange where such securities are principally traded. Equity securities listed on the NASDAQ Global or Global Select Market generally are valued at the NASDAQ official closing price. Unlisted or listed securities for which closing sales prices or closing quotations are not available are valued at the mean between the latest available bid and asked prices or, in the case of preferred equity securities that are not listed or traded in the over-the-counter market, by a third party pricing service that will use various techniques that consider factors including, but not limited to, prices or yields of securities with similar characteristics, benchmark yields, broker/dealer quotes, quotes of underlying common stock, issuer spreads, as well as industry and economic events. Forward foreign currency exchange contracts are generally valued at the mean of the average bid and average asked prices that are reported by currency dealers to a third party pricing service at the valuation time. Such third party pricing service valuations are supplied for specific settlement periods and the Portfolio’s forward foreign currency exchange contracts are valued at an interpolated rate between the closest preceding and subsequent settlement period reported by the third party pricing service. Interest rate swaps are normally valued using valuations provided by a third party pricing service. Such pricing service valuations are based on the present value of fixed and projected floating rate cash flows over the term of the swap contract. Future cash flows are discounted to their present value using swap rates provided by electronic data services or by broker/dealers. Foreign securities and currencies are valued in U.S. dollars, based on foreign currency exchange rate quotations supplied by a third party pricing service. The pricing service uses a proprietary model to determine the exchange rate. Inputs to the model include reported trades and implied bid/ask spreads. Investments for which valuations or market quotations are not readily available or are deemed unreliable are valued at fair value using methods determined in good faith by or at the direction of the Trustees of the Portfolio in a manner that fairly reflects the security’s value, or the amount that the Portfolio might reasonably expect to receive for the security upon its current sale in the ordinary course. Each such determination is based on a consideration of relevant factors, which are likely to vary from one pricing context to another. These factors may include, but are not limited to, the type of security, the existence of any contractual restrictions on the security’s disposition, the price and extent of public trading in similar securities of the issuer or of comparable companies or entities, quotations or relevant information obtained from broker/dealers or other market participants, information obtained from the issuer, analysts, and/or the appropriate stock
Floating Rate Portfolio
October 31, 2012
Notes to Financial Statements — continued
exchange (for exchange-traded securities), an analysis of the company’s or entity’s financial condition, and an evaluation of the forces that influence the issuer and the market(s) in which the security is purchased and sold.
The Portfolio may invest in Eaton Vance Cash Reserves Fund, LLC (Cash Reserves Fund), an affiliated investment company managed by Eaton Vance Management (EVM). Cash Reserves Fund generally values its investment securities utilizing the amortized cost valuation technique in accordance with Rule 2a-7 under the 1940 Act. This technique involves initially valuing a portfolio security at its cost and thereafter assuming a constant amortization to maturity of any discount or premium. If amortized cost is determined not to approximate fair value, Cash Reserves Fund may value its investment securities in the same manner as debt obligations above.
B Investment Transactions — Investment transactions for financial statement purposes are accounted for on a trade date basis. Realized gains and losses on investments sold are determined on the basis of identified cost.
C Income — Interest income is recorded on the basis of interest accrued, adjusted for amortization of premium or accretion of discount. Fees associated with loan amendments are recognized immediately. Dividend income is recorded on the ex-dividend date for dividends received in cash and/or securities.
D Federal Taxes — The Portfolio has elected to be treated as a partnership for federal tax purposes. No provision is made by the Portfolio for federal or state taxes on any taxable income of the Portfolio because each investor in the Portfolio is ultimately responsible for the payment of any taxes on its share of taxable income. Since at least one of the Portfolio’s investors is a regulated investment company that invests all or substantially all of its assets in the Portfolio, the Portfolio normally must satisfy the applicable source of income and diversification requirements (under the Internal Revenue Code) in order for its investors to satisfy them. The Portfolio will allocate, at least annually among its investors, each investor’s distributive share of the Portfolio’s net investment income, net realized capital gains and any other items of income, gain, loss, deduction or credit.
As of October 31, 2012, the Portfolio had no uncertain tax positions that would require financial statement recognition, de-recognition, or disclosure. The Portfolio files a U.S. federal income tax return annually after its fiscal year-end, which is subject to examination by the Internal Revenue Service for a period of three years from the date of filing.
E Expense Reduction — State Street Bank and Trust Company (SSBT) serves as custodian of the Portfolio. Pursuant to the custodian agreement, SSBT receives a fee reduced by credits, which are determined based on the average daily cash balance the Portfolio maintains with SSBT. All credit balances, if any, used to reduce the Portfolio’s custodian fees are reported as a reduction of expenses in the Statement of Operations.
F Foreign Currency Translation — Investment valuations, other assets, and liabilities initially expressed in foreign currencies are translated each business day into U.S. dollars based upon current exchange rates. Purchases and sales of foreign investment securities and income and expenses denominated in foreign currencies are translated into U.S. dollars based upon currency exchange rates in effect on the respective dates of such transactions. Recognized gains or losses on investment transactions attributable to changes in foreign currency exchange rates are recorded for financial statement purposes as net realized gains and losses on investments. That portion of unrealized gains and losses on investments that results from fluctuations in foreign currency exchange rates is not separately disclosed.
G Unfunded Loan Commitments — The Portfolio may enter into certain credit agreements all or a portion of which may be unfunded. The Portfolio is obligated to fund these commitments at the borrower’s discretion. These commitments are disclosed in the accompanying Portfolio of Investments. At October 31, 2012, the Portfolio had sufficient cash and/or securities to cover these commitments.
H Use of Estimates — The preparation of the financial statements in conformity with accounting principles generally accepted in the United States of America requires management to make estimates and assumptions that affect the reported amounts of assets and liabilities at the date of the financial statements and the reported amounts of income and expense during the reporting period. Actual results could differ from those estimates.
I Indemnifications — Under the Portfolio’s organizational documents, its officers and Trustees may be indemnified against certain liabilities and expenses arising out of the performance of their duties to the Portfolio. Under Massachusetts law, if certain conditions prevail, interestholders in the Portfolio could be deemed to have personal liability for the obligations of the Portfolio. However, the Portfolio’s Declaration of Trust contains an express disclaimer of liability on the part of Portfolio interestholders and the By-laws provide that the Portfolio shall assume the defense on behalf of any Portfolio interestholder. Moreover, the By-laws also provide for indemnification out of Portfolio property of any interestholder held personally liable solely by reason of being or having been an interestholder for all loss or expense arising from such liability. Additionally, in the normal course of business, the Portfolio enters into agreements with service providers that may contain indemnification clauses. The Portfolio’s maximum exposure under these arrangements is unknown as this would involve future claims that may be made against the Portfolio that have not yet occurred.
J Forward Foreign Currency Exchange Contracts — The Portfolio may enter into forward foreign currency exchange contracts for the purchase or sale of a specific foreign currency at a fixed price on a future date. The forward foreign currency exchange contracts are adjusted by the daily exchange rate of the underlying currency and any gains or losses are recorded as unrealized until such time as the contracts have been closed or offset by another contract with the same broker for the same settlement date and currency. Risks may arise upon entering these contracts from the potential inability of counterparties to meet the terms of their contracts and from movements in the value of a foreign currency relative to the U.S. dollar.
Floating Rate Portfolio
October 31, 2012
Notes to Financial Statements — continued
K Interest Rate Swaps — Pursuant to interest rate swap agreements, the Portfolio either makes floating-rate payments based on a benchmark interest rate in exchange for fixed-rate payments or the Portfolio makes fixed-rate payments in exchange for payments on a floating benchmark interest rate. Payments received or made are recorded as realized gains or losses. During the term of the outstanding swap agreement, changes in the underlying value of the swap are recorded as unrealized gains or losses. The value of the swap is determined by changes in the relationship between two rates of interest. The Portfolio is exposed to credit loss in the event of non-performance by the swap counterparty. Risk may also arise from movements in interest rates.
2 Investment Adviser Fee and Other Transactions with Affiliates
The investment adviser fee is earned by Boston Management and Research (BMR), a subsidiary of EVM, as compensation for investment advisory services rendered to the Portfolio. Pursuant to the investment advisory agreement and subsequent fee reduction agreement between the Portfolio and BMR, the fee is computed at an annual rate of 0.575% of the Portfolio’s average daily net assets up to $1 billion, 0.525% from $1 billion up to $2 billion, 0.500% from $2 billion up to $5 billion, 0.480% from $5 billion up to $10 billion and 0.460% of average daily net assets of $10 billion or more, and is payable monthly. Effective May 1, 2012, pursuant to an additional fee reduction agreement between the Portfolio and BMR, the portion of the fee on net assets of $10 billion and over is computed as follows: annual rate of 0.460% of the Portfolio’s average daily net assets from $10 billion up to $15 billion, 0.4475% from $15 billion up to $20 billion, 0.4375% from $20 billion up to $25 billion and 0.430% of average daily net assets of $25 billion or more. The fee reductions cannot be terminated without the consent of the Trustees and shareholders. The Portfolio invests its cash in Cash Reserves Fund. EVM does not currently receive a fee for advisory services provided to Cash Reserves Fund. For the year ended October 31, 2012, the Portfolio’s investment adviser fee amounted to $46,845,003 or 0.50% of the Portfolio’s average daily net assets.
Officers and Trustees of the Portfolio who are members of EVM’s or BMR’s organizations receive remuneration for their services to the Portfolio out of the investment adviser fee. Trustees of the Portfolio who are not affiliated with the investment adviser may elect to defer receipt of all or a percentage of their annual fees in accordance with the terms of the Trustees Deferred Compensation Plan. For the year ended October 31, 2012, no significant amounts have been deferred. Certain officers and Trustees of the Portfolio are officers of the above organizations.
3 Purchases and Sales of Investments
Purchases and sales of investments, other than short-term obligations and including maturities, principal repayments on Senior Loans and paydowns, aggregated $3,746,407,935 and $4,157,870,920, respectively, for the year ended October 31, 2012.
4 Federal Income Tax Basis of Investments
The cost and unrealized appreciation (depreciation) of investments of the Portfolio at October 31, 2012, as determined on a federal income tax basis, were as follows:
| | | | |
| |
Aggregate cost | | $ | 9,622,503,671 | |
| |
Gross unrealized appreciation | | $ | 135,168,501 | |
Gross unrealized depreciation | | | (87,221,132 | ) |
| |
Net unrealized appreciation | | $ | 47,947,369 | |
The net unrealized depreciation on foreign currency and swap contracts at October 31, 2012 on a federal income tax basis was $7,053,445.
Floating Rate Portfolio
October 31, 2012
Notes to Financial Statements — continued
5 Restricted Securities
At October 31, 2012, the Portfolio owned the following securities (representing less than 0.1% of net assets) which were restricted as to public resale and not registered under the Securities Act of 1933 (excluding Rule 144A securities). The Portfolio has various registration rights (exercisable under a variety of circumstances) with respect to these securities. The value of these securities is determined based on valuations provided by brokers when available, or if not available, they are valued at fair value using methods determined in good faith by or at the direction of the Trustees.
| | | | | | | | | | | | | | | | |
| Description | | Date of Acquisition | | | Shares | | | Cost | | | Value | |
| | | | |
Common Stocks | | | | | | | | | | | | | | | | |
Environmental Systems Products Holdings, Inc. | | | 10/25/07 | | | | 2,484 | | | $ | 0 | | | $ | 179,419 | |
| | | | |
Preferred Stocks | | | | | | | | | | | | | | | | |
Environmental Systems Products Holdings, Inc., Series A | | | 10/25/07 | | | | 569 | | | $ | 9,958 | | | $ | 35,847 | |
| | | | |
Total Restricted Securities | | | | | | | | | | $ | 9,958 | | | $ | 215,266 | |
6 Financial Instruments
The Portfolio may trade in financial instruments with off-balance sheet risk in the normal course of its investing activities. These financial instruments may include forward foreign currency exchange contracts and swap contracts and may involve, to a varying degree, elements of risk in excess of the amounts recognized for financial statement purposes. The notional or contractual amounts of these instruments represent the investment the Portfolio has in particular classes of financial instruments and do not necessarily represent the amounts potentially subject to risk. The measurement of the risks associated with these instruments is meaningful only when all related and offsetting transactions are considered.
A summary of obligations under these financial instruments at October 31, 2012 is as follows:
| | | | | | | | | | |
| Forward Foreign Currency Exchange Contracts | | | | | | | |
| | | | |
| | | | | | | | | | |
Sales | |
| Settlement Date | | Deliver | | In Exchange For | | Counterparty | | Net Unrealized Appreciation (Depreciation) | |
| | | | |
| 11/30/12 | | British Pound Sterling 55,768,970 | | United States Dollar 88,250,491 | | JPMorgan Chase Bank NA | | $ | (1,738,073 | ) |
| 11/30/12 | | Euro
61,728,903 | | United States Dollar 77,431,193 | | Citibank NA | | | (2,598,202 | ) |
| 12/31/12 | | British Pound Sterling 26,120,029 | | United States Dollar 42,173,791 | | Goldman Sachs International | | | 30,226 | |
| 12/31/12 | | British Pound Sterling 3,375,625 | | United States Dollar 5,449,920 | | State Street Bank and Trust Co. | | | 3,491 | |
| 12/31/12 | | Euro
71,617,803 | | United States Dollar 92,172,829 | | HSBC Bank USA | | | (711,694 | ) |
| 1/31/13 | | British Pound Sterling 21,666,382 | | United States Dollar 34,823,292 | | HSBC Bank USA | | | (130,695 | ) |
| 1/31/13 | | Euro
70,539,472 | | United States Dollar 91,573,637 | | Deutsche Bank AG | | | 61,220 | |
| 1/31/13 | | Swiss Franc 16,380,316 | | United States Dollar 17,599,126 | | Citibank NA | | | (15,253 | ) |
| | | | |
| | | | | | | | | $ | (5,098,980 | ) |
Floating Rate Portfolio
October 31, 2012
Notes to Financial Statements — continued
| | | | | | | | | | | | | | | | | | |
| Interest Rate Swaps | |
| Counterparty | | Notional Amount (000’s omitted) | | Portfolio Pays/Receives Floating Rate | | Floating Rate Index | | Annual Fixed Rate | | | Termination Date | | | Net Unrealized Depreciation | |
| Citibank NA | | $60,000 | | Receives | | 3-Month
USD-LIBOR-BBA | | | 0.98 | % | | | 6/24/14 | | | $ | (780,299 | ) |
| Citibank NA | | 60,000 | | Receives | | 3-Month
USD-LIBOR-BBA | | | 1.81 | | | | 6/24/16 | | | | (3,023,488 | ) |
| | | | | | |
| | | | | | | | | | | | | | | | | $ | (3,803,787 | ) |
At October 31, 2012, the Portfolio had sufficient cash and/or securities to cover commitments under these contracts.
In the normal course of pursuing its investment objective and its use of derivatives, the Portfolio is subject to the following risks:
Foreign Exchange Risk: Because the Portfolio holds foreign currency denominated investments, the value of these investments and related receivables and payables may change due to future changes in foreign currency exchange rates. To hedge against this risk, the Portfolio enters into forward foreign currency exchange contracts. The Portfolio also enters into such contracts to hedge the currency risk of investments it anticipates purchasing.
Interest Rate Risk: Because the Portfolio holds fixed-rate bonds, the value of these bonds may decrease if interest rates rise. To hedge against this risk, the Portfolio enters into interest rate swap contracts with respect to a portion of the bonds.
The Portfolio enters into swap contracts and forward foreign currency exchange contracts that may contain provisions whereby the counterparty may terminate the contract under certain conditions, including but not limited to a decline in the Portfolio’s net assets below a certain level over a certain period of time, which would trigger a payment by the Portfolio for those derivatives in a liability position. At October 31, 2012 the fair value of derivatives with credit-related contingent features in a net liability position was $8,997,704. At October 31, 2012, the aggregate fair value of assets pledged as collateral by the Portfolio for such liability was $13,554,205.
The non-exchange traded derivatives in which the Portfolio invests, including swap contracts and forward foreign currency exchange contracts, are subject to the risk that the counterparty to the contract fails to perform its obligations under the contract. At October 31, 2012, the maximum amount of loss the Portfolio would incur due to counterparty risk was $94,937, representing the fair value of such derivatives in an asset position, with the highest amount from any one counterparty being $61,220. To mitigate this risk, the Portfolio has entered into master netting agreements with substantially all its derivative counterparties, which allows it and a counterparty to aggregate amounts owed by each of them for derivative transactions under the agreement into a single net amount payable by either the Portfolio or the counterparty. Counterparties may be required to pledge collateral in the form of cash, U.S. Government securities or highly-rated bonds for the benefit of the Portfolio if the net amount due from the counterparty with respect to a derivative contract exceeds a certain threshold. The amount of collateral posted by the counterparties with respect to such contracts would also reduce the amount of any loss incurred.
The fair value of open derivative instruments (not considered to be hedging instruments for accounting disclosure purposes) by risk exposure at October 31, 2012 was as follows:
| | | | | | | | | | |
| | | | | Fair Value | |
| Risk | | Derivative | | Asset Derivative | | | Liability Derivative | |
| | | |
Foreign Exchange | | Forward foreign currency exchange contracts | | $ | 94,937 | (1) | | $ | (5,193,917 | )(2) |
| | | |
| | | | | $ | 94,937 | | | $ | (5,193,917 | ) |
| | | |
Interest Rate | | Swap contracts | | $ | — | | | $ | (3,803,787 | )(2) |
| | | |
| | | | | $ | — | | | $ | (3,803,787 | ) |
| (1) | Statement of Assets and Liabilities location: Receivable for open forward foreign currency exchange contracts; Net unrealized appreciation. |
| (2) | Statement of Assets and Liabilities location: Payable for open forward foreign currency exchange contracts and Payable for open swap contracts, respectively; Net unrealized appreciation. |
Floating Rate Portfolio
October 31, 2012
Notes to Financial Statements — continued
The effect of derivative instruments (not considered to be hedging instruments for accounting disclosure purposes) on the Statement of Operations by risk exposure for the year ended October 31, 2012 was as follows:
| | | | | | | | | | |
| Risk | | Derivative | | Realized Gain (Loss)
on Derivatives Recognized
in Income | | | Change in Unrealized
Appreciation (Depreciation) on
Derivatives Recognized in Income | |
| | | |
Foreign Exchange | | Forward foreign currency exchange contracts | | $ | 31,196,921 | (1) | | $ | (9,036,988 | )(2) |
Interest Rate | | Swap contracts | | | (1,111,685 | )(1) | | | (1,007,489 | )(2) |
| | | |
Total | | | | $ | 30,085,236 | | | $ | (10,044,477 | ) |
| (1) | Statement of Operations location: Net realized gain (loss) – Foreign currency and forward foreign currency exchange contract transactions and swap contracts, respectively. |
| (2) | Statement of Operations location: Change in unrealized appreciation (depreciation) – Foreign currency and forward foreign currency exchange contracts and Swap contracts, respectively. |
The average notional amounts of forward foreign currency exchange contracts and swap contracts outstanding during the year ended October 31, 2012, which are indicative of the volume of these derivative types, were approximately $463,978,000 and $120,000,000, respectively.
7 Line of Credit
The Portfolio participates with another portfolio and fund managed by EVM and its affiliates in a $800 million ($900 million prior to March 19, 2012) unsecured line of credit agreement with a group of banks. Borrowings are made by the Portfolio solely to facilitate the handling of unusual and/or unanticipated short-term cash requirements. Interest is charged to the Portfolio based on its borrowings at a prime rate or an amount above either the London Interbank Offered Rate (LIBOR) or the Federal Funds rate. In addition, a fee computed at an annual rate of 0.08% on the daily unused portion of the line of credit is allocated among the participating portfolios and fund at the end of each quarter. Because the line of credit is not available exclusively to the Portfolio, it may be unable to borrow some or all of its requested amounts at any particular time. The Portfolio did not have any significant borrowings or allocated fees during the year ended October 31, 2012.
8 Risks Associated with Foreign Investments
Investing in securities issued by companies whose principal business activities are outside the United States may involve significant risks not present in domestic investments. For example, there is generally less publicly available information about foreign companies, particularly those not subject to the disclosure and reporting requirements of the U.S. securities laws. Certain foreign issuers are generally not bound by uniform accounting, auditing, and financial reporting requirements and standards of practice comparable to those applicable to domestic issuers. Investments in foreign securities also involve the risk of possible adverse changes in investment or exchange control regulations, expropriation or confiscatory taxation, limitation on the removal of funds or other assets of the Portfolio, political or financial instability or diplomatic and other developments which could affect such investments. Foreign securities markets, while growing in volume and sophistication, are generally not as developed as those in the United States, and securities of some foreign issuers (particularly those located in developing countries) may be less liquid and more volatile than securities of comparable U.S. companies. In general, there is less overall governmental supervision and regulation of foreign securities markets, broker/dealers and issuers than in the United States.
9 Credit Risk
The Portfolio invests primarily in below investment grade floating-rate loans and floating-rate debt obligations, which are considered speculative because of the credit risk of their issuers. Changes in economic conditions or other circumstances are more likely to reduce the capacity of issuers of these securities to make principal and interest payments. Such companies are more likely to default on their payments of interest and principal owed than issuers of investment grade bonds. An economic downturn generally leads to a higher non-payment rate, and a loan or other debt obligation may lose significant value before a default occurs. Lower rated investments also may be subject to greater price volatility than higher rated investments. Moreover, the specific collateral used to secure a loan may decline in value or become illiquid, which would adversely affect the loan’s value.
Floating Rate Portfolio
October 31, 2012
Notes to Financial Statements — continued
10 Fair Value Measurements
Under generally accepted accounting principles for fair value measurements, a three-tier hierarchy to prioritize the assumptions, referred to as inputs, is used in valuation techniques to measure fair value. The three-tier hierarchy of inputs is summarized in the three broad levels listed below.
| Ÿ | | Level 1 – quoted prices in active markets for identical investments |
| Ÿ | | Level 2 – other significant observable inputs (including quoted prices for similar investments, interest rates, prepayment speeds, credit risk, etc.) |
| Ÿ | | Level 3 – significant unobservable inputs (including a fund’s own assumptions in determining the fair value of investments) |
In cases where the inputs used to measure fair value fall in different levels of the fair value hierarchy, the level disclosed is determined based on the lowest level input that is significant to the fair value measurement in its entirety. The inputs or methodology used for valuing securities are not necessarily an indication of the risk associated with investing in those securities.
At October 31, 2012, the hierarchy of inputs used in valuing the Portfolio’s investments and open derivative instruments, which are carried at value, were as follows:
| | | | | | | | | | | | | | | | |
| Asset Description | | Level 1 | | | Level 2 | | | Level 3* | | | Total | |
| | | | |
Senior Floating-Rate Interests (Less Unfunded Loan Commitments) | | $ | — | | | $ | 8,655,003,363 | | | $ | 7,633,965 | | | $ | 8,662,637,328 | |
Corporate Bonds & Notes | | | — | | | | 317,666,291 | | | | 156,179 | | | | 317,822,470 | |
Asset-Backed Securities | | | — | | | | 4,818,517 | | | | — | | | | 4,818,517 | |
Common Stocks | | | — | | | | 15,539,601 | | | | 37,280,907 | | | | 52,820,508 | |
Preferred Stocks | | | — | | | | — | | | | 35,847 | | | | 35,847 | |
Warrants | | | — | | | | — | | | | 403,200 | | | | 403,200 | |
Short-Term Investments | | | — | | | | 631,913,170 | | | | — | | | | 631,913,170 | |
| | | | |
Total Investments | | $ | — | | | $ | 9,624,940,942 | | | $ | 45,510,098 | | | $ | 9,670,451,040 | |
Forward Foreign Currency Exchange Contracts | | $ | — | | | $ | 94,937 | | | $ | — | | | $ | 94,937 | |
| | | | |
Total | | $ | — | | | $ | 9,625,035,879 | | | $ | 45,510,098 | | | $ | 9,670,545,977 | |
| | | | |
Liability Description | | | | | | | | | | | | | | | | |
Forward Foreign Currency Exchange Contracts | | $ | — | | | $ | (5,193,917 | ) | | $ | — | | | $ | (5,193,917 | ) |
Interest Rate Swaps | | | — | | | | (3,803,787 | ) | | | — | | | | (3,803,787 | ) |
| | | | |
Total | | $ | — | | | $ | (8,997,704 | ) | | $ | — | | | $ | (8,997,704 | ) |
| * | None of the unobservable inputs for Level 3 assets, individually or collectively, had a material impact on the Portfolio. |
Level 3 investments at the beginning and/or end of the period in relation to net assets were not significant and accordingly, a reconciliation of Level 3 assets for the year ended October 31, 2012 is not presented.
At October 31, 2012, there were no investments transferred between Level 1 and Level 2 during the year then ended.
Floating Rate Portfolio
October 31, 2012
Report of Independent Registered Public Accounting Firm
To the Trustees and Investors of Floating Rate Portfolio:
We have audited the accompanying statement of assets and liabilities of Floating Rate Portfolio (the “Portfolio”), including the portfolio of investments, as of October 31, 2012, and the related statement of operations for the year then ended, the statements of changes in net assets for each of the two years in the period then ended, and the supplementary data for each of the five years in the period then ended. These financial statements and supplementary data are the responsibility of the Portfolio’s management. Our responsibility is to express an opinion on these financial statements and supplementary data based on our audits.
We conducted our audits in accordance with the standards of the Public Company Accounting Oversight Board (United States). Those standards require that we plan and perform the audit to obtain reasonable assurance about whether the financial statements and supplementary data are free of material misstatement. The Portfolio is not required to have, nor were we engaged to perform, an audit of its internal control over financial reporting. Our audits included consideration of internal control over financial reporting as a basis for designing audit procedures that are appropriate in the circumstances, but not for the purpose of expressing an opinion on the effectiveness of the Portfolio’s internal control over financial reporting. Accordingly, we express no such opinion. An audit also includes examining, on a test basis, evidence supporting the amounts and disclosures in the financial statements, assessing the accounting principles used and significant estimates made by management, as well as evaluating the overall financial statement presentation. Our procedures included confirmation of securities and senior loans owned as of October 31, 2012, by correspondence with the custodian, brokers, and selling or agent banks; where replies were not received from brokers and selling or agent banks, we performed other auditing procedures. We believe that our audits provide a reasonable basis for our opinion.
In our opinion, such financial statements and supplementary data referred to above present fairly, in all material respects, the financial position of Floating Rate Portfolio as of October 31, 2012, the results of its operations for the year then ended, the changes in its net assets for each of the two years in the period then ended, and the supplementary data for each of the five years in the period then ended, in conformity with accounting principles generally accepted in the United States of America.
DELOITTE & TOUCHE LLP
Boston, Massachusetts
December 17, 2012
Eaton Vance
Floating-Rate & High Income Fund
October 31, 2012
Management and Organization
Fund Management. The Trustees of Eaton Vance Mutual Funds Trust (the Trust), Boston Income Portfolio (BIP), Floating Rate Portfolio (FRP), High Income Opportunities Portfolio (HIOP) and Short Duration High Income Portfolio (SDHIP) (collectively, the Portfolios) are responsible for the overall management and supervision of the Trust’s and Portfolios’ affairs. The Trustees and officers of the Trust and the Portfolios are listed below. Except as indicated, each individual has held the office shown or other offices in the same company for the last five years. Trustees and officers of the Trust and the Portfolios hold indefinite terms of office. The “Noninterested Trustees” consist of those Trustees who are not “interested persons” of the Trust and the Portfolios, as that term is defined under the 1940 Act. The business address of each Trustee and officer is Two International Place, Boston, Massachusetts 02110. As used below, “EVC” refers to Eaton Vance Corp., “EV” refers to Eaton Vance, Inc., “EVM” refers to Eaton Vance Management, “BMR” refers to Boston Management and Research and “EVD” refers to Eaton Vance Distributors, Inc. EVC and EV are the corporate parent and trustee, respectively, of EVM and BMR. EVD is the Fund’s principal underwriter, the Portfolios’ placement agent and a wholly-owned subsidiary of EVC. Each officer affiliated with Eaton Vance may hold a position with other Eaton Vance affiliates that is comparable to his or her position with EVM listed below. Each Trustee oversees 187 portfolios in the Eaton Vance Complex (including all master and feeder funds in a master feeder structure). Each officer serves as an officer of certain other Eaton Vance funds. Each Trustee and officer serves until his or her successor is elected.
| | | | | | |
| Name and Year of Birth | | Position(s) with the
Trust and the
Portfolios | | Length of
Service | | Principal Occupation(s) and Directorships During Past Five Years and Other Relevant Experience |
Interested Trustee |
| | | |
Thomas E. Faust Jr. 1958 | | Trustee | | Of the Trust and of BIP, FRP and HIOP since 2007 and of SDHIP since 2012 | | Chairman, Chief Executive Officer and President of EVC, Director and President of EV, Chief Executive Officer and President of EVM and BMR, and Director of EVD. Trustee and/or officer of 187 registered investment companies. Mr. Faust is an interested person because of his positions with EVM, BMR, EVD, EVC and EV, which are affiliates of the Trust and the Portfolios. Directorships in the Last Five Years.(1) Director of EVC and Hexavest Inc. |
| | | |
| | | | | | |
Noninterested Trustees |
| | | |
Scott E. Eston 1956 | | Trustee | | Of the Trust and of BIP, FRP and HIOP since 2011 and of SDHIP since 2012 | | Private investor. Formerly held various positions at Grantham, Mayo, Van Otterloo and Co., L.L.C. (investment management firm) (1997-2009), including Chief Operating Officer (2002-2009), Chief Financial Officer (1997-2009) and Chairman of the Executive Committee (2002-2008); President and Principal Executive Officer, GMO Trust (open-end registered investment company) (2006-2009). Former Partner, Coopers and Lybrand L.L.P. (now PricewaterhouseCoopers) (public accounting firm) (1987-1997). Directorships in the Last Five Years. None. |
| | | |
Benjamin C. Esty 1963 | | Trustee | | Of the Trust and of BIP, FRP and HIOP since 2005 and of SDHIP since 2012 | | Roy and Elizabeth Simmons Professor of Business Administration and Finance Unit Head, Harvard University Graduate School of Business Administration. Directorships in the Last Five Years.(1) None. |
| | | |
Allen R. Freedman 1940 | | Trustee | | Of the Trust and of BIP, FRP and HIOP since 2007 and of SDHIP since 2012 | | Private Investor. Former Chairman (2002-2004) and a Director (1983-2004) of Systems & Computer Technology Corp. (provider of software to higher education). Formerly, a Director of Loring Ward International (fund distributor) (2005-2007). Former Chairman and a Director of Indus International, Inc. (provider of enterprise management software to the power generating industry) (2005-2007). Former Chief Executive Officer of Assurant, Inc. (insurance provider) (1979-2000). Directorships in the Last Five Years.(1) Director of Stonemor Partners, L.P. (owner and operator of cemeteries). Formerly, Director of Assurant, Inc. (insurance provider) (1979-2011). |
| | | |
William H. Park 1947 | | Trustee | | Of the Trust and of BIP, FRP and HIOP since 2003 and of SDHIP since 2012 | | Consultant and private investor. Formerly, Chief Financial Officer, Aveon Group L.P. (investment management firm) (2010-2011). Formerly, Vice Chairman, Commercial Industrial Finance Corp. (specialty finance company) (2006-2010). Formerly, President and Chief Executive Officer, Prizm Capital Management, LLC (investment management firm) (2002-2005). Formerly, Executive Vice President and Chief Financial Officer, United Asset Management Corporation (investment management firm) (1982-2001). Formerly, Senior Manager, Price Waterhouse (now PricewaterhouseCoopers) (an independent registered public accounting firm) (1972-1981). Directorships in the Last Five Years.(1) None. |
Eaton Vance
Floating-Rate & High Income Fund
October 31, 2012
Management and Organization — continued
| | | | | | |
| Name and Year of Birth | | Position(s) with the
Trust and the
Portfolios | | Length of
Service | | Principal Occupation(s) and Directorships During Past Five Years and Other Relevant Experience |
Noninterested Trustees (continued) |
| | | |
Ronald A. Pearlman 1940 | | Trustee | | Of the Trust and of BIP, FRP and HIOP since 2003 and of SDHIP since 2012 | | Professor of Law, Georgetown University Law Center. Formerly, Deputy Assistant Secretary (Tax Policy) and Assistant Secretary (Tax Policy), U.S. Department of the Treasury (1983-1985). Formerly, Chief of Staff, Joint Committee on Taxation, U.S. Congress (1988-1990). Directorships in the Last Five Years.(1) None. |
| | | |
Helen Frame Peters 1948 | | Trustee | | Of the Trust and of BIP, FRP and HIOP since 2008 and of SDHIP since 2012 | | Professor of Finance, Carroll School of Management, Boston College. Formerly, Dean, Carroll School of Management, Boston College (2000-2002). Formerly, Chief Investment Officer, Fixed Income, Scudder Kemper Investments (investment management firm) (1998-1999). Formerly, Chief Investment Officer, Equity and Fixed Income, Colonial Management Associates (investment management firm) (1991-1998). Directorships in the Last Five Years.(1) Formerly, Director of BJ’s Wholesale Club, Inc. (wholesale club retailer) (2004-2011). Formerly, Trustee of SPDR Index Shares Funds and SPDR Series Trust (exchange traded funds) (2000-2009). Formerly, Director of Federal Home Loan Bank of Boston (a bank for banks) (2007-2009). |
| | | |
Lynn A. Stout 1957 | | Trustee | | Of the Trust and HIOP since 1998, of FRP since 2000, of BIP since 2001 and of SDHIP since 2012 | | Distinguished Professor of Corporate and Business Law, Jack G. Clarke Business Law Institute, Cornell University Law School. Formerly, the Paul Hastings Professor of Corporate and Securities Law (2006-2012) and Professor of Law (2001-2006), University of California at Los Angeles School of Law. Directorships in the Last Five Years.(1) None. |
| | | |
Harriett Tee Taggart 1948 | | Trustee | | Of the Trust and of BIP, FRP and HIOP since 2011 and of SDHIP since 2012 | | Managing Director, Taggart Associates (a professional practice firm). Formerly, Partner and Senior Vice President, Wellington Management Company, LLP (investment management firm) (1983-2006). Directorships in the Last Five Years. Director of Albemarle Corporation (chemicals manufacturer) (since 2007) and The Hanover Group (specialty property and casualty insurance company) (since 2009). Formerly, Director of Lubrizol Corporation (specialty chemicals) (2007-2011). |
| | | |
Ralph F. Verni 1943 | | Chairman of
the Board
and Trustee | | Chairman of the Board since 2007 and Trustee of the Trust and of BIP, FRP and HIOP since 2005 and of SDHIP since 2012 | | Consultant and private investor. Formerly, Chief Investment Officer (1982-1992), Chief Financial Officer (1988-1990) and Director (1982-1992), New England Life. Formerly, Chairperson, New England Mutual Funds (1982-1992). Formerly, President and Chief Executive Officer, State Street Management & Research (1992-2000). Formerly, Chairperson, State Street Research Mutual Funds (1992-2000). Formerly, Director, W.P. Carey, LLC (1998-2004) and First Pioneer Farm Credit Corp. (2002-2006). Directorships in the Last Five Years.(1) None. |
| | | |
| | | | | | |
Principal Officers who are not Trustees |
| Name and Year of Birth | | Position(s)
with the
Trust and the Portfolios | | Length of Service | | Principal Occupation(s) During Past Five Years |
Duncan W. Richardson 1957 | | President of the Trust | | Since 2011 | | Director of EVC and Executive Vice President and Chief Equity Investment Officer of EVC, EVM and BMR. |
| | | |
Scott H. Page 1959 | | President of FRP | | Since 2007 | | Vice President of EVM and BMR. |
| | | |
Michael W. Weilheimer 1961 | | President of BIP, HIOP and SDHIP | | Of BIP and HIOP since 2002 and of SDHIP since 2012 | | Vice President of EVM and BMR. |
Eaton Vance
Floating-Rate & High Income Fund
October 31, 2012
Management and Organization — continued
| | | | | | |
| Name and Year of Birth | | Position(s)
with the
Trust and the Portfolios | | Length of Service | | Principal Occupation(s) During Past Five Years |
Principal Officers who are not Trustees (continued) |
Payson F. Swaffield 1956 | | Vice President | | Since 2011 | | Vice President and Chief Income Investment Officer of EVM and BMR. |
| | | |
Barbara E. Campbell 1957 | | Treasurer | | Of the Trust since 2005 and of BIP, FRP and HIOP since 2008 and of SDHIP since 2012 | | Vice President of EVM and BMR. |
| | | |
Maureen A. Gemma 1960 | | Vice President, Secretary and Chief Legal Officer | | Vice President of the Trust and of BIP, FRP and HIOP since 2011 and of SDHIP since 2012; Secretary of the Trust and of BIP, FRP and HIOP since 2007 and of SDHIP since 2012; and Chief Legal Officer of the Trust and of BIP, FRP and HIOP since 2008 and of SDHIP since 2012 | | Vice President of EVM and BMR. |
| | | |
Paul M. O’Neil 1953 | | Chief Compliance Officer | | Of the Trust and of BIP, FRP and HIOP since 2004 and of SDHIP since 2012 | | Vice President of EVM and BMR. |
| (1) | During their respective tenures, the Trustees (except Mr. Eston and Ms. Taggart) also served as trustees of one or more of the following Eaton Vance funds (which operated in the years noted): Eaton Vance Credit Opportunities Fund (launched in 2005 and terminated in 2010); Eaton Vance Insured Florida Plus Municipal Bond Fund (launched in 2002 and terminated in 2009); and Eaton Vance National Municipal Income Trust (launched in 1998 and terminated in 2009). |
The SAI for the Fund includes additional information about the Trustees and officers of the Fund and the Portfolios and can be obtained without charge on Eaton Vance’s website at www.eatonvance.com or by calling 1-800-262-1122.
Eaton Vance Funds
IMPORTANT NOTICES
Privacy. The Eaton Vance organization is committed to ensuring your financial privacy. Each of the financial institutions identified below has in effect the following policy (“Privacy Policy”) with respect to nonpublic personal information about its customers:
| Ÿ | | Only such information received from you, through application forms or otherwise, and information about your Eaton Vance fund transactions will be collected. This may include information such as name, address, social security number, tax status, account balances and transactions. |
| Ÿ | | None of such information about you (or former customers) will be disclosed to anyone, except as permitted by law (which includes disclosure to employees necessary to service your account). In the normal course of servicing a customer’s account, Eaton Vance may share information with unaffiliated third parties that perform various required services such as transfer agents, custodians and broker-dealers. |
| Ÿ | | Policies and procedures (including physical, electronic and procedural safeguards) are in place that are designed to protect the confidentiality of such information. |
| Ÿ | | We reserve the right to change our Privacy Policy at any time upon proper notification to you. Customers may want to review our Privacy Policy periodically for changes by accessing the link on our homepage: www.eatonvance.com. |
Our pledge of privacy applies to the following entities within the Eaton Vance organization: the Eaton Vance Family of Funds, Eaton Vance Management, Eaton Vance Investment Counsel, Eaton Vance Distributors, Inc., Eaton Vance Trust Company, Eaton Vance Management’s Real Estate Investment Group and Boston Management and Research. In addition, our Privacy Policy applies only to those Eaton Vance customers who are individuals and who have a direct relationship with us. If a customer’s account (i.e., fund shares) is held in the name of a third-party financial advisor/broker-dealer, it is likely that only such advisor’s privacy policies apply to the customer. This notice supersedes all previously issued privacy disclosures. For more information about Eaton Vance’s Privacy Policy, please call 1-800-262-1122.
Delivery of Shareholder Documents. The Securities and Exchange Commission (SEC) permits funds to deliver only one copy of shareholder documents, including prospectuses, proxy statements and shareholder reports, to fund investors with multiple accounts at the same residential or post office box address. This practice is often called “householding” and it helps eliminate duplicate mailings to shareholders. Eaton Vance, or your financial advisor, may household the mailing of your documents indefinitely unless you instruct Eaton Vance, or your financial advisor, otherwise. If you would prefer that your Eaton Vance documents not be householded, please contact Eaton Vance at 1-800-262-1122, or contact your financial advisor. Your instructions that householding not apply to delivery of your Eaton Vance documents will be effective within 30 days of receipt by Eaton Vance or your financial advisor.
Portfolio Holdings. Each Eaton Vance Fund and its underlying Portfolio(s) (if applicable) will file a schedule of portfolio holdings on Form N-Q with the SEC for the first and third quarters of each fiscal year. The Form N-Q will be available on the Eaton Vance website at www.eatonvance.com, by calling Eaton Vance at 1-800-262-1122 or in the EDGAR database on the SEC’s website at www.sec.gov. Form N-Q may also be reviewed and copied at the SEC’s public reference room in Washington, D.C. (call 1-800-732-0330 for information on the operation of the public reference room).
Proxy Voting. From time to time, funds are required to vote proxies related to the securities held by the funds. The Eaton Vance Funds or their underlying Portfolios (if applicable) vote proxies according to a set of policies and procedures approved by the Funds’ and Portfolios’ Boards. You may obtain a description of these policies and procedures and information on how the Funds or Portfolios voted proxies relating to portfolio securities during the most recent 12-month period ended June 30, without charge, upon request, by calling 1-800-262-1122 and by accessing the SEC’s website at www.sec.gov.
This Page Intentionally Left Blank
This Page Intentionally Left Blank
Investment Adviser of Floating Rate Portfolio
Boston Management and Research
Two International Place
Boston, MA 02110
Administrator of Eaton Vance Floating-Rate & High Income Fund
Eaton Vance Management
Two International Place
Boston, MA 02110
Principal Underwriter*
Eaton Vance Distributors, Inc.
Two International Place
Boston, MA 02110
(617) 482-8260
Custodian
State Street Bank and Trust Company
200 Clarendon Street
Boston, MA 02116
Transfer Agent
BNY Mellon Investment Servicing (US) Inc.
Attn: Eaton Vance Funds
P.O. Box 9653
Providence, RI 02940-9653
(800) 262-1122
Independent Registered Public Accounting Firm
Deloitte & Touche LLP
200 Berkeley Street
Boston, MA 02116-5022
Fund Offices
Two International Place
Boston, MA 02110
| * | FINRA BrokerCheck. Investors may check the background of their Investment Professional by contacting the Financial Industry Regulatory Authority (FINRA). FINRA BrokerCheck is a free tool to help investors check the professional background of current and former FINRA-registered securities firms and brokers. FINRA BrokerCheck is available by calling 1-800-289-9999 and at www.FINRA.org. The FINRA BrokerCheck brochure describing this program is available to investors at www.FINRA.org. |
| | |
Eaton Vance Government Obligations
Fund Annual Report October 31, 2012 | | 
|

Fund shares are not insured by the FDIC and are not deposits or other obligations of, or guaranteed by, any depository institution. Shares are subject to investment risks, including possible loss of principal invested.
This report must be preceded or accompanied by a current summary prospectus or prospectus. Before investing, investors should consider carefully the investment objective, risks, and charges and expenses of a mutual fund. This and other important information is contained in the summary prospectus and prospectus, which can be obtained from a financial advisor. Prospective investors should read the prospectus carefully before investing. For further information, please call 1-800-262-1122.
Annual Report October 31, 2012
Eaton Vance
Government Obligations Fund
Table of Contents
| | | | |
Management’s Discussion of Fund Performance | | | 2 | |
| |
Performance | | | 3 | |
| |
Fund Profile | | | 4 | |
| |
Endnotes and Additional Disclosures | | | 5 | |
| |
Fund Expenses | | | 6 | |
| |
Financial Statements | | | 7 | |
| |
Report of Independent Registered Public Accounting Firm | | | 19 and 33 | |
| |
Federal Tax Information | | | 20 | |
| |
Management and Organization | | | 34 | |
| |
Important Notices | | | 36 | |
Eaton Vance
Government Obligations Fund
October 31, 2012
Management’s Discussion of Fund Performance1
Economic and Market Conditions
During the 12-month period ending October 31, 2012, there were a number of historical events that impacted the fixed-income markets and led to multiple swings in investor sentiment. Returns of U.S. government securities varied based on yield curve positioning. The U.S. Federal Reserve’s (the Fed) ongoing “Operation Twist” program, which involves the sale of shorter Treasurys and the purchase of those at the longer end of the curve, was extended in June 2012 until the end of the calendar year. This pushed yields slightly higher on the short end of the curve, while pressuring yields lower on the longer end. Returns on the three-year and shorter portions of the Treasury curve were muted, with yields already historically low in this part of the curve.
Although the interest-rate backdrop remained favorable throughout the entire year as the Fed held policy rates between 0.00% and 0.25%, U.S. government securities languished during much of the first half of the period. At that time, an improving labor market gave way to stronger economic growth and prompted many investors to lower their exposure to U.S. government securities and seek opportunities among riskier asset classes. With rates at historic lows, investors searching for yield were forced to move further out on the yield curve.
In the beginning of the second half of the period, the investment backdrop became increasingly more favorable for U.S. government securities. The sovereign debt crisis in Europe intensified in the spring, which tempered future expectations of global economic growth and fueled investors’ appetite for investments that historically had provided safe havens amid periods of economic and market uncertainty. In this environment, yields on the 30-year Treasury fell nearly 100 basis points during the spring and summer, touching multi-decade lows and producing equity-like returns over the time period.
Meanwhile, policies from the Fed aimed at keeping interest rates low also bolstered demand for U.S. government-backed investments. At its June 2012 meeting, the Fed announced a continuation of “Operation Twist.” In September 2012, the Fed announced its plan to keep policy rates at or near zero until at least mid-2015 and also announced further monetary stimulus with its third round of quantitative easing (QE3). This new QE3 program came in the form of open-ended U.S. government agency mortgage-backed security (MBS) purchases. Against this already favorable backdrop
for high-quality fixed-income securities, investor demand for agency MBS further increased after the September 2012 announcement, with yield spreads compared to Treasurys tightening to their lows of the year.
Fund Performance
For the fiscal year ending October 31, 2012, Eaton Vance Government Obligations Fund’s (the Fund) Class A shares at net asset value (NAV) had a total return of 2.52%. By comparison, the Fund’s benchmark, the Barclay’s Capital U.S. Intermediate Government Index (the Index)2 returned 2.41% for the period.
The Fund’s outperformance versus the Index was primarily due to its investment in seasoned agency MBS. Agency MBS outperformed comparable-duration Treasurys during the past 12 months as yield spreads tightened. A weak labor market and sluggish growth in the U.S. economy led to the Fed announcing an open-ended program of MBS purchases in September 2012. The Fed’s renewed involvement in the MBS market in the form of QE3 caused a further increase in the prices of MBS investments.
Despite mortgage rates falling to all-time lows, the Fund experienced only a modest increase in prepayment rates on its seasoned MBS investments. The Fund’s seasoned MBS investments were typically comprised of mortgages originated from the early 1990s through 2003. During the period, the Federal Housing Finance Agency (FHFA) announced changes to its Home Affordability Refinance Program (HARP) in an effort to help stimulate the refinance market for borrowers with higher loan-to-value ratios. Relative to the majority of the agency MBS market, the Fund’s seasoned MBS investments generally contain much lower loan-to-value ratio loans and are not usually the target of the HARP program. The impact on the Fund’s prepayment rates from the changes to the HARP program was minimal.
During the period, the Fund’s shorter portfolio duration relative to the Index detracted from performance, as the yield curve flattened and yields on the longer end of the Treasury curve fell more than those on the short end of the curve. Duration is a measure of a portfolio’s price sensitivity to changes in interest rates based on the timing of anticipated principal and interest payments. A shorter portfolio duration normally has less exposure to interest-rate changes.
See Endnotes and Additional Disclosures in this report.
Past performance is no guarantee of future results. Returns are historical and are calculated by determining the percentage change in net asset value (NAV) or offering price (as applicable) with all distributions reinvested. Investment return and principal value will fluctuate so that shares, when redeemed, may be worth more or less than their original cost. Performance less than one year is cumulative. Performance is for the stated time period only; due to market volatility, the Fund’s current performance may be lower or higher than quoted. Returns are before taxes unless otherwise noted. For performance as of the most recent month end, please refer to www.eatonvance.com.
Eaton Vance
Government Obligations Fund
October 31, 2012
Performance2,3
Portfolio Manager Susan Schiff, CFA
| | | | | | | | | | | | | | | | | | | | |
| % Average Annual Total Returns | | Inception Date | | | One Year | | | Five Years | | | Ten Years | | | Since
Inception | |
Class A at NAV | | | 08/24/1984 | | | | 2.52 | % | | | 5.03 | % | | | 3.87 | % | | | — | |
Class A with 4.75% Maximum Sales Charge | | | — | | | | –2.32 | | | | 4.00 | | | | 3.37 | | | | — | |
Class B at NAV | | | 11/01/1993 | | | | 1.75 | | | | 4.25 | | | | 3.09 | | | | — | |
Class B with 5% Maximum Sales Charge | | | — | | | | –3.19 | | | | 3.91 | | | | 3.09 | | | | — | |
Class C at NAV | | | 11/01/1993 | | | | 1.89 | | | | 4.26 | | | | 3.08 | | | | — | |
Class C with 1% Maximum Sales Charge | | | — | | | | 0.90 | | | | 4.26 | | | | 3.08 | | | | — | |
Class I at NAV | | | 04/03/2009 | | | | 2.92 | | | | — | | | | — | | | | 3.89 | % |
Class R at NAV | | | 08/12/2005 | | | | 2.39 | | | | 4.77 | | | | — | | | | 4.48 | |
Barclays Capital U.S. Intermediate Government Index | | | — | | | | 2.41 | % | | | 5.03 | % | | | 4.19 | % | | | — | |
| | | | | |
| | | | | | | | | | | | | | | | | | | | |
| % Total Annual Operating Expense Ratios4 | | Class A | | | Class B | | | Class C | | | Class I | | | Class R | |
| | | 1.14 | % | | | 1.89 | % | | | 1.89 | % | | | 0.89 | % | | | 1.39 | % |
Performance of $10,000
This graph shows the change in value of a hypothetical investment of $10,000 in Class A of the Fund for the period indicated. For comparison, the same investment is shown in the indicated index.

| | | | | | | | |
| Performance of Investment | | Amount Invested | | Period Beginning | | At NAV | | With Maximum
Sales Charge |
Class B | | $10,000 | | 10/31/2002 | | $13,563 | | N.A. |
Class C | | $10,000 | | 10/31/2002 | | $13,550 | | N.A. |
Class I | | $250,000 | | 04/03/2009 | | $286,625 | | N.A. |
Class R | | $10,000 | | 08/12/2005 | | $13,727 | | N.A. |
See Endnotes and Additional Disclosures in this report.
Past performance is no guarantee of future results. Returns are historical and are calculated by determining the percentage change in net asset value (NAV) or offering price (as applicable) with all distributions reinvested. Investment return and principal value will fluctuate so that shares, when redeemed, may be worth more or less than their original cost. Performance less than one year is cumulative. Performance is for the stated time period only; due to market volatility, the Fund’s current performance may be lower or higher than quoted. Returns are before taxes unless otherwise noted. For performance as of the most recent month end, please refer to www.eatonvance.com.
Eaton Vance
Government Obligations Fund
October 31, 2012
Fund Profile5
Asset Allocation (% of total investments)
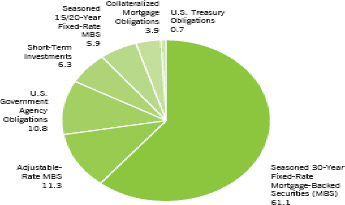
See Endnotes and Additional Disclosures in this report.
Eaton Vance
Government Obligations Fund
October 31, 2012
Endnotes and Additional Disclosures
| 1 | The views expressed in this report are those of the portfolio manager(s) and are current only through the date stated at the top of this page. These views are subject to change at any time based upon market or other conditions, and Eaton Vance and the Fund(s) disclaim any responsibility to update such views. These views may not be relied upon as investment advice and, because investment decisions are based on many factors, may not be relied upon as an indication of trading intent on behalf of any Eaton Vance fund. This commentary may contain statements that are not historical facts, referred to as “forward looking statements”. The Fund’s actual future results may differ significantly from those stated in any forward looking statement, depending on factors such as changes in securities or financial markets or general economic conditions, the volume of sales and purchases of Fund shares, the continuation of investment advisory, administrative and service contracts, and other risks discussed from time to time in the Fund’s filings with the Securities and Exchange Commission. |
| 2 | Barclays Capital U.S. Intermediate Government Index is an unmanaged index of U.S. government bonds with maturities from one year up to (but not including) 10 years. Unless otherwise stated, index returns do not reflect the effect of any applicable sales charges, commissions, expenses, taxes or leverage, as applicable. It is not possible to invest directly in an index. |
| 3 | Total Returns at NAV do not include applicable sales charges. If sales charges were deducted, the returns would be lower. Total Returns shown with maximum sales charge reflect the stated maximum sales charge. Unless otherwise stated, performance does not reflect the deduction of taxes on Fund distributions or redemptions of Fund shares. |
| 4 | Source: Fund prospectus. |
| 5 | Fund invests in an affiliated investment company (Portfolio) with the same objective(s) and policies as the Fund. References to investments are to the Portfolio’s holdings. |
| | Fund profile subject to change due to active management. |
Eaton Vance
Government Obligations Fund
October 31, 2012
Fund Expenses
Example: As a Fund shareholder, you incur two types of costs: (1) transaction costs, including sales charges (loads) on purchases and redemption fees (if applicable); and (2) ongoing costs, including management fees; distribution and/or service fees; and other Fund expenses. This Example is intended to help you understand your ongoing costs (in dollars) of Fund investing and to compare these costs with the ongoing costs of investing in other mutual funds. The Example is based on an investment of $1,000 invested at the beginning of the period and held for the entire period (May 1, 2012 – October 31, 2012).
Actual Expenses: The first section of the table below provides information about actual account values and actual expenses. You may use the information in this section, together with the amount you invested, to estimate the expenses that you paid over the period. Simply divide your account value by $1,000 (for example, an $8,600 account value divided by $1,000 = 8.6), then multiply the result by the number in the first section under the heading entitled “Expenses Paid During Period” to estimate the expenses you paid on your account during this period.
Hypothetical Example for Comparison Purposes: The second section of the table below provides information about hypothetical account values and hypothetical expenses based on the actual Fund expense ratio and an assumed rate of return of 5% per year (before expenses), which is not the actual Fund return. The hypothetical account values and expenses may not be used to estimate the actual ending account balance or expenses you paid for the period. You may use this information to compare the ongoing costs of investing in your Fund and other funds. To do so, compare this 5% hypothetical example with the 5% hypothetical examples that appear in the shareholder reports of the other funds.
Please note that the expenses shown in the table are meant to highlight your ongoing costs only and do not reflect any transactional costs, such as sales charges (loads) or redemption fees (if applicable). Therefore, the second section of the table is useful in comparing ongoing costs only, and will not help you determine the relative total costs of owning different funds. In addition, if these transactional costs were included, your costs would be higher.
| | | | | | | | | | | | | | | | |
| | | Beginning
Account Value
(5/1/12) | | | Ending
Account Value
(10/31/12) | | | Expenses Paid
During Period*
(5/1/12 – 10/31/12) | | | Annualized
Expense
Ratio | |
| | | | |
| | | | | | | | | | | | | | | | |
Actual | | | | | | | | | | | | | | | | |
Class A | | $ | 1,000.00 | | | $ | 1,009.20 | | | $ | 5.45 | | | | 1.08 | % |
Class B | | $ | 1,000.00 | | | $ | 1,005.40 | | | $ | 9.22 | | | | 1.83 | % |
Class C | | $ | 1,000.00 | | | $ | 1,005.40 | | | $ | 9.22 | | | | 1.83 | % |
Class I | | $ | 1,000.00 | | | $ | 1,010.50 | | | $ | 4.19 | | | | 0.83 | % |
Class R | | $ | 1,000.00 | | | $ | 1,007.90 | | | $ | 6.71 | | | | 1.33 | % |
| | | | | | | | | | | | | | | | | |
| | | | |
| | | | | | | | | | | | | | | | |
Hypothetical | | | | | | | | | | | | | | | | |
(5% return per year before expenses) | | | | | | | | | | | | | | | | |
Class A | | $ | 1,000.00 | | | $ | 1,019.70 | | | $ | 5.48 | | | | 1.08 | % |
Class B | | $ | 1,000.00 | | | $ | 1,015.90 | | | $ | 9.27 | | | | 1.83 | % |
Class C | | $ | 1,000.00 | | | $ | 1,015.90 | | | $ | 9.27 | | | | 1.83 | % |
Class I | | $ | 1,000.00 | | | $ | 1,021.00 | | | $ | 4.22 | | | | 0.83 | % |
Class R | | $ | 1,000.00 | | | $ | 1,018.50 | | | $ | 6.75 | | | | 1.33 | % |
| * | Expenses are equal to the Fund’s annualized expense ratio for the indicated Class, multiplied by the average account value over the period, multiplied by 184/366 (to reflect the one-half year period). The Example assumes that the $1,000 was invested at the net asset value per share determined at the close of business on April 30, 2012. The Example reflects the expenses of both the Fund and the Portfolio. |
Eaton Vance
Government Obligations Fund
October 31, 2012
Statement of Assets and Liabilities
| | | | |
| Assets | | October 31, 2012 | |
Investment in Government Obligations Portfolio, at value (identified cost, $1,094,268,115) | | $ | 1,159,899,219 | |
Receivable for Fund shares sold | | | 2,129,117 | |
Miscellaneous receivable | | | 4,114 | |
Total assets | | $ | 1,162,032,450 | |
| |
| Liabilities | | | | |
Payable for Fund shares redeemed | | $ | 3,935,313 | |
Distributions payable | | | 708,564 | |
Payable to affiliates: | | | | |
Distribution and service fees | | | 433,809 | |
Trustees’ fees | | | 42 | |
Accrued expenses | | | 234,920 | |
Total liabilities | | $ | 5,312,648 | |
Net Assets | | $ | 1,156,719,802 | |
| |
| Sources of Net Assets | | | | |
Paid-in capital | | $ | 1,200,118,526 | |
Accumulated net realized loss from Portfolio | | | (111,625,677 | ) |
Accumulated undistributed net investment income | | | 2,595,849 | |
Net unrealized appreciation from Portfolio | | | 65,631,104 | |
Total | | $ | 1,156,719,802 | |
| |
| Class A Shares | | | | |
Net Assets | | $ | 682,140,416 | |
Shares Outstanding | | | 92,433,762 | |
Net Asset Value and Redemption Price Per Share | | | | |
(net assets ÷ shares of beneficial interest outstanding) | | $ | 7.38 | |
Maximum Offering Price Per Share | | | | |
(100 ÷ 95.25 of net asset value per share) | | $ | 7.75 | |
| |
| Class B Shares | | | | |
Net Assets | | $ | 30,042,153 | |
Shares Outstanding | | | 4,071,229 | |
Net Asset Value and Offering Price Per Share* | | | | |
(net assets ÷ shares of beneficial interest outstanding) | | $ | 7.38 | |
| |
| Class C Shares | | | | |
Net Assets | | $ | 300,062,556 | |
Shares Outstanding | | | 40,732,283 | |
Net Asset Value and Offering Price Per Share* | | | | |
(net assets ÷ shares of beneficial interest outstanding) | | $ | 7.37 | |
| |
| Class I Shares | | | | |
Net Assets | | $ | 122,456,370 | |
Shares Outstanding | | | 16,601,704 | |
Net Asset Value, Offering Price and Redemption Price Per Share | | | | |
(net assets ÷ shares of beneficial interest outstanding) | | $ | 7.38 | |
| |
| Class R Shares | | | | |
Net Assets | | $ | 22,018,307 | |
Shares Outstanding | | | 2,996,194 | |
Net Asset Value, Offering Price and Redemption Price Per Share | | | | |
(net assets ÷ shares of beneficial interest outstanding) | | $ | 7.35 | |
| On | sales of $50,000 or more, the offering price of Class A shares is reduced. |
| * | Redemption price per share is equal to the net asset value less any applicable contingent deferred sales charge. |
| | | | |
| | 7 | | See Notes to Financial Statements. |
Eaton Vance
Government Obligations Fund
October 31, 2012
Statement of Operations
| | | | |
| Investment Income | | Year Ended
October 31, 2012 | |
Interest allocated from Portfolio | | $ | 36,845,731 | |
Miscellaneous income | | | 2,591 | |
Expenses allocated from Portfolio | | | (8,380,203 | ) |
Total investment income | | $ | 28,468,119 | |
| |
| Expenses | | | | |
Distribution and service fees | | | | |
Class A | | $ | 1,656,587 | |
Class B | | | 354,525 | |
Class C | | | 3,006,401 | |
Class R | | | 83,912 | |
Trustees’ fees and expenses | | | 500 | |
Custodian fee | | | 38,176 | |
Transfer and dividend disbursing agent fees | | | 908,904 | |
Legal and accounting services | | | 50,284 | |
Printing and postage | | | 113,345 | |
Registration fees | | | 98,715 | |
Miscellaneous | | | 18,889 | |
Total expenses | | $ | 6,330,238 | |
| |
Net investment income | | $ | 22,137,881 | |
| |
| Realized and Unrealized Gain (Loss) from Portfolio | | | | |
Net realized gain (loss) — | | | | |
Investment transactions | | $ | 4,815,274 | |
Financial futures contracts | | | (5,080,814 | ) |
Net realized loss | | $ | (265,540 | ) |
Change in unrealized appreciation (depreciation) — | | | | |
Investments | | $ | 3,886,660 | |
Financial futures contracts | | | (270,726 | ) |
Swap contracts | | | 798,633 | |
Net change in unrealized appreciation (depreciation) | | $ | 4,414,567 | |
| |
Net realized and unrealized gain | | $ | 4,149,027 | |
| |
Net increase in net assets from operations | | $ | 26,286,908 | |
| | | | |
| | 8 | | See Notes to Financial Statements. |
Eaton Vance
Government Obligations Fund
October 31, 2012
Statements of Changes in Net Assets
| | | | | | | | |
| | | Year Ended October 31, | |
| Increase (Decrease) in Net Assets | | 2012 | | | 2011 | |
From operations — | | | | | | | | |
Net investment income | | $ | 22,137,881 | | | $ | 25,633,194 | |
Net realized loss from investment transactions and financial futures contracts | | | (265,540 | ) | | | (10,785,335 | ) |
Net change in unrealized appreciation (depreciation) from investments, financial futures contracts and swap contracts | | | 4,414,567 | | | | (2,021,252 | ) |
Net increase in net assets from operations | | $ | 26,286,908 | | | $ | 12,826,607 | |
Distributions to shareholders — | | | | | | | | |
From net investment income | | | | | | | | |
Class A | | $ | (24,518,831 | ) | | $ | (23,144,852 | ) |
Class B | | | (1,045,792 | ) | | | (1,816,654 | ) |
Class C | | | (8,877,733 | ) | | | (9,193,359 | ) |
Class I | | | (4,435,625 | ) | | | (2,264,140 | ) |
Class R | | | (579,278 | ) | | | (437,846 | ) |
Tax return of capital | | | | | | | | |
Class A | | | — | | | | (1,002,304 | ) |
Class B | | | — | | | | (78,671 | ) |
Class C | | | — | | | | (398,125 | ) |
Class I | | | — | | | | (98,050 | ) |
Class R | | | — | | | | (18,961 | ) |
Total distributions to shareholders | | $ | (39,457,259 | ) | | $ | (38,452,962 | ) |
Transactions in shares of beneficial interest — | | | | | | | | |
Proceeds from sale of shares | | | | | | | | |
Class A | | $ | 264,890,192 | | | $ | 227,007,377 | |
Class B | | | 2,692,950 | | | | 5,713,765 | |
Class C | | | 74,644,821 | | | | 81,085,099 | |
Class I | | | 135,091,469 | | | | 91,310,875 | |
Class R | | | 14,361,635 | | | | 7,958,779 | |
Net asset value of shares issued to shareholders in payment of distributions declared | | | | | | | | |
Class A | | | 19,762,814 | | | | 19,069,407 | |
Class B | | | 891,113 | | | | 1,267,572 | |
Class C | | | 6,733,975 | | | | 6,516,909 | |
Class I | | | 3,434,165 | | | | 1,896,059 | |
Class R | | | 502,218 | | | | 407,131 | |
Cost of shares redeemed | | | | | | | | |
Class A | | | (219,029,843 | ) | | | (314,294,073 | ) |
Class B | | | (8,098,521 | ) | | | (19,867,627 | ) |
Class C | | | (77,559,441 | ) | | | (136,074,306 | ) |
Class I | | | (117,077,271 | ) | | | (39,304,326 | ) |
Class R | | | (5,108,579 | ) | | | (6,506,429 | ) |
Net asset value of shares exchanged | | | | | | | | |
Class A | | | 6,481,032 | | | | 31,673,238 | |
Class B | | | (6,481,032 | ) | | | (31,673,238 | ) |
Net increase (decrease) in net assets from Fund share transactions | | $ | 96,131,697 | | | $ | (73,813,788 | ) |
| | |
Net increase (decrease) in net assets | | $ | 82,961,346 | | | $ | (99,440,143 | ) |
| | |
| Net Assets | | | | | | | | |
At beginning of year | | $ | 1,073,758,456 | | | $ | 1,173,198,599 | |
At end of year | | $ | 1,156,719,802 | | | $ | 1,073,758,456 | |
| | |
Accumulated undistributed (distributions in excess of) net investment income
included in net assets | | | | | | | | |
At end of year | | $ | 2,595,849 | | | $ | (641,351 | ) |
| | | | |
| | 9 | | See Notes to Financial Statements. |
Eaton Vance
Government Obligations Fund
October 31, 2012
Financial Highlights
| | | | | | | | | | | | | | | | | | | | |
| | | Class A | |
| | | Year Ended October 31, | |
| | | 2012 | | | 2011 | | | 2010 | | | 2009 | | | 2008 | |
Net asset value — Beginning of year | | $ | 7.470 | | | $ | 7.630 | | | $ | 7.540 | | | $ | 7.110 | | | $ | 7.160 | |
| | | | | |
| Income (Loss) From Operations | | | | | | | | | | | | | | | | | | | | |
Net investment income(1) | | $ | 0.161 | | | $ | 0.202 | | | $ | 0.233 | | | $ | 0.267 | | | $ | 0.297 | |
Net realized and unrealized gain (loss) | | | 0.024 | | | | (0.068 | ) | | | 0.175 | | | | 0.512 | | | | 0.020 | |
| | | | | |
Total income from operations | | $ | 0.185 | | | $ | 0.134 | | | $ | 0.408 | | | $ | 0.779 | | | $ | 0.317 | |
| | | | | |
| Less Distributions | | | | | | | | | | | | | | | | | | | | |
From net investment income | | $ | (0.275 | ) | | $ | (0.282 | ) | | $ | (0.303 | ) | | $ | (0.330 | ) | | $ | (0.367 | ) |
Tax return of capital | | | — | | | | (0.012 | ) | | | (0.015 | ) | | | (0.019 | ) | | | — | |
| | | | | |
Total distributions | | $ | (0.275 | ) | | $ | (0.294 | ) | | $ | (0.318 | ) | | $ | (0.349 | ) | | $ | (0.367 | ) |
| | | | | |
Net asset value — End of year | | $ | 7.380 | | | $ | 7.470 | | | $ | 7.630 | | | $ | 7.540 | | | $ | 7.110 | |
| | | | | |
Total Return(2) | | | 2.52 | % | | | 1.82 | % | | | 5.54 | % | | | 11.11 | % | | | 4.45 | % |
| | | | | |
| Ratios/Supplemental Data | | | | | | | | | | | | | | | | | | | | |
Net assets, end of year (000’s omitted) | | $ | 682,140 | | | $ | 617,723 | | | $ | 668,799 | | | $ | 472,147 | | | $ | 362,311 | |
Ratios (as a percentage of average daily net assets): | | | | | | | | | | | | | | | | | | | | |
Expenses(3)(4) | | | 1.10 | % | | | 1.14 | % | | | 1.15 | % | | | 1.16 | % | | | 1.19 | % |
Net investment income | | | 2.17 | % | | | 2.70 | % | | | 3.08 | % | | | 3.57 | % | | | 4.09 | % |
Portfolio Turnover of the Portfolio | | | 26 | % | | | 19 | % | | | 22 | % | | | 28 | % | | | 19 | % |
| (1) | Computed using average shares outstanding. |
| (2) | Returns are historical and are calculated by determining the percentage change in net asset value with all distributions reinvested and do not reflect the effect of sales charges. |
| (3) | Excludes the effect of custody fee credits, if any, of less than 0.005%. |
| (4) | Includes the Fund’s share of the Portfolio’s allocated expenses. |
| | | | |
| | 10 | | See Notes to Financial Statements. |
Eaton Vance
Government Obligations Fund
October 31, 2012
Financial Highlights — continued
| | | | | | | | | | | | | | | | | | | | |
| | | Class B | |
| | | Year Ended October 31, | |
| | | 2012 | | | 2011 | | | 2010 | | | 2009 | | | 2008 | |
Net asset value — Beginning of year | | $ | 7.470 | | | $ | 7.630 | | | $ | 7.540 | | | $ | 7.110 | | | $ | 7.160 | |
| | | | | |
| Income (Loss) From Operations | | | | | | | | | | | | | | | | | | | | |
Net investment income(1) | | $ | 0.106 | | | $ | 0.148 | | | $ | 0.180 | | | $ | 0.214 | | | $ | 0.245 | |
Net realized and unrealized gain (loss) | | | 0.023 | | | | (0.070 | ) | | | 0.173 | | | | 0.510 | | | | 0.018 | |
| | | | | |
Total income from operations | | $ | 0.129 | | | $ | 0.078 | | | $ | 0.353 | | | $ | 0.724 | | | $ | 0.263 | |
| | | | | |
| Less Distributions | | | | | | | | | | | | | | | | | | | | |
From net investment income | | $ | (0.219 | ) | | $ | (0.228 | ) | | $ | (0.250 | ) | | $ | (0.278 | ) | | $ | (0.313 | ) |
Tax return of capital | | | — | | | | (0.010 | ) | | | (0.013 | ) | | | (0.016 | ) | | | — | |
| | | | | |
Total distributions | | $ | (0.219 | ) | | $ | (0.238 | ) | | $ | (0.263 | ) | | $ | (0.294 | ) | | $ | (0.313 | ) |
| | | | | |
Net asset value — End of year | | $ | 7.380 | | | $ | 7.470 | | | $ | 7.630 | | | $ | 7.540 | | | $ | 7.110 | |
| | | | | |
Total Return(2) | | | 1.75 | % | | | 1.06 | % | | | 4.76 | % | | | 10.30 | % | | | 3.67 | % |
| | | | | |
| Ratios/Supplemental Data | | | | | | | | | | | | | | | | | | | | |
Net assets, end of year (000’s omitted) | | $ | 30,042 | | | $ | 41,446 | | | $ | 87,803 | | | $ | 126,123 | | | $ | 146,987 | |
Ratios (as a percentage of average daily net assets): | | | | | | | | | | | | | | | | | | | | |
Expenses(3)(4) | | | 1.85 | % | | | 1.89 | % | | | 1.90 | % | | | 1.91 | % | | | 1.94 | % |
Net investment income | | | 1.42 | % | | | 1.97 | % | | | 2.39 | % | | | 2.87 | % | | | 3.37 | % |
Portfolio Turnover of the Portfolio | | | 26 | % | | | 19 | % | | | 22 | % | | | 28 | % | | | 19 | % |
| (1) | Computed using average shares outstanding. |
| (2) | Returns are historical and are calculated by determining the percentage change in net asset value with all distributions reinvested and do not reflect the effect of sales charges. |
| (3) | Excludes the effect of custody fee credits, if any, of less than 0.005%. |
| (4) | Includes the Fund’s share of the Portfolio’s allocated expenses. |
| | | | |
| | 11 | | See Notes to Financial Statements. |
Eaton Vance
Government Obligations Fund
October 31, 2012
Financial Highlights — continued
| | | | | | | | | | | | | | | | | | | | |
| | | Class C | |
| | | Year Ended October 31, | |
| | | 2012 | | | 2011 | | | 2010 | | | 2009 | | | 2008 | |
Net asset value — Beginning of year | | $ | 7.450 | | | $ | 7.610 | | | $ | 7.530 | | | $ | 7.100 | | | $ | 7.150 | |
| | | | | |
| Income (Loss) From Operations | | | | | | | | | | | | | | | | | | | | |
Net investment income(1) | | $ | 0.105 | | | $ | 0.146 | | | $ | 0.176 | | | $ | 0.209 | | | $ | 0.243 | |
Net realized and unrealized gain (loss) | | | 0.034 | | | | (0.069 | ) | | | 0.167 | | | | 0.515 | | | | 0.020 | |
| | | | | |
Total income from operations | | $ | 0.139 | | | $ | 0.077 | | | $ | 0.343 | | | $ | 0.724 | | | $ | 0.263 | |
| | | | | |
| Less Distributions | | | | | | | | | | | | | | | | | | | | |
From net investment income | | $ | (0.219 | ) | | $ | (0.227 | ) | | $ | (0.250 | ) | | $ | (0.278 | ) | | $ | (0.313 | ) |
Tax return of capital | | | — | | | | (0.010 | ) | | | (0.013 | ) | | | (0.016 | ) | | | — | |
| | | | | |
Total distributions | | $ | (0.219 | ) | | $ | (0.237 | ) | | $ | (0.263 | ) | | $ | (0.294 | ) | | $ | (0.313 | ) |
| | | | | |
Net asset value — End of year | | $ | 7.370 | | | $ | 7.450 | | | $ | 7.610 | | | $ | 7.530 | | | $ | 7.100 | |
| | | | | |
Total Return(2) | | | 1.89 | % | | | 1.05 | % | | | 4.63 | % | | | 10.31 | % | | | 3.67 | % |
| | | | | |
| Ratios/Supplemental Data | | | | | | | | | | | | | | | | | | | | |
Net assets, end of year (000’s omitted) | | $ | 300,063 | | | $ | 299,797 | | | $ | 356,084 | | | $ | 259,975 | | | $ | 171,302 | |
Ratios (as a percentage of average daily net assets): | | | | | | | | | | | | | | | | | | | | |
Expenses(3)(4) | | | 1.85 | % | | | 1.89 | % | | | 1.90 | % | | | 1.91 | % | | | 1.94 | % |
Net investment income | | | 1.42 | % | | | 1.96 | % | | | 2.33 | % | | | 2.80 | % | | | 3.35 | % |
Portfolio Turnover of the Portfolio | | | 26 | % | | | 19 | % | | | 22 | % | | | 28 | % | | | 19 | % |
| (1) | Computed using average shares outstanding. |
| (2) | Returns are historical and are calculated by determining the percentage change in net asset value with all distributions reinvested and do not reflect the effect of sales charges. |
| (3) | Excludes the effect of custody fee credits, if any, of less than 0.005%. |
| (4) | Includes the Fund’s share of the Portfolio’s allocated expenses. |
| | | | |
| | 12 | | See Notes to Financial Statements. |
Eaton Vance
Government Obligations Fund
October 31, 2012
Financial Highlights — continued
| | | | | | | | | | | | | | | | |
| | | Class I | |
| | | Year Ended October 31, | | | Period Ended October 31, 2009(1) | |
| | | 2012 | | | 2011 | | | 2010 | | |
Net asset value — Beginning of period | | $ | 7.460 | | | $ | 7.620 | | | $ | 7.540 | | | $ | 7.510 | |
| | | | |
| Income (Loss) From Operations | | | | | | | | | | | | | | | | |
Net investment income(2) | | $ | 0.179 | | | $ | 0.218 | | | $ | 0.242 | | | $ | 0.133 | |
Net realized and unrealized gain (loss) | | | 0.035 | | | | (0.066 | ) | | | 0.175 | | | | 0.111 | |
| | | | |
Total income from operations | | $ | 0.214 | | | $ | 0.152 | | | $ | 0.417 | | | $ | 0.244 | |
| | | | |
| Less Distributions | | | | | | | | | | | | | | | | |
From net investment income | | $ | (0.294 | ) | | $ | (0.299 | ) | | $ | (0.321 | ) | | $ | (0.202 | ) |
Tax return of capital | | | — | | | | (0.013 | ) | | | (0.016 | ) | | | (0.012 | ) |
| | | | |
Total distributions | | $ | (0.294 | ) | | $ | (0.312 | ) | | $ | (0.337 | ) | | $ | (0.214 | ) |
| | | | |
Net asset value — End of period | | $ | 7.380 | | | $ | 7.460 | | | $ | 7.620 | | | $ | 7.540 | |
| | | | |
Total Return(3) | | | 2.92 | % | | | 2.07 | % | | | 5.67 | % | | | 3.29 | %(4) |
| | | | |
| Ratios/Supplemental Data | | | | | | | | | | | | | | | | |
Net assets, end of period (000’s omitted) | | $ | 122,456 | | | $ | 102,320 | | | $ | 49,617 | | | $ | 14,879 | |
Ratios (as a percentage of average daily net assets): | | | | | | | | | | | | | | | | |
Expenses(5)(6) | | | 0.85 | % | | | 0.89 | % | | | 0.90 | % | | | 0.91 | %(7) |
Net investment income | | | 2.41 | % | | | 2.91 | % | | | 3.20 | % | | | 3.06 | %(7) |
Portfolio Turnover of the Portfolio | | | 26 | % | | | 19 | % | | | 22 | % | | | 28 | %(8) |
| (1) | For the period from commencement of operations, April 3, 2009, to October 31, 2009. |
| (2) | Computed using average shares outstanding. |
| (3) | Returns are historical and are calculated by determining the percentage change in net asset value with all distributions reinvested. |
| (5) | Excludes the effect of custody fee credits, if any, of less than 0.005%. |
| (6) | Includes the Fund’s share of the Portfolio’s allocated expenses. |
| (8) | For the Portfolio’s year ended October 31, 2009. |
| | | | |
| | 13 | | See Notes to Financial Statements. |
Eaton Vance
Government Obligations Fund
October 31, 2012
Financial Highlights — continued
| | | | | | | | | | | | | | | | | | | | |
| | | Class R | |
| | | Year Ended October 31, | |
| | | 2012 | | | 2011 | | | 2010 | | | 2009 | | | 2008 | |
Net asset value — Beginning of year | | $ | 7.430 | | | $ | 7.600 | | | $ | 7.510 | | | $ | 7.090 | | | $ | 7.130 | |
| | | | | |
| Income (Loss) From Operations | | | | | | | | | | | | | | | | | | | | |
Net investment income(1) | | $ | 0.142 | | | $ | 0.183 | | | $ | 0.211 | | | $ | 0.239 | | | $ | 0.276 | |
Net realized and unrealized gain (loss) | | | 0.033 | | | | (0.079 | ) | | | 0.177 | | | | 0.510 | | | | 0.032 | |
| | | | | |
Total income from operations | | $ | 0.175 | | | $ | 0.104 | | | $ | 0.388 | | | $ | 0.749 | | | $ | 0.308 | |
| | | | | |
| Less Distributions | | | | | | | | | | | | | | | | | | | | |
From net investment income | | $ | (0.255 | ) | | $ | (0.263 | ) | | $ | (0.284 | ) | | $ | (0.311 | ) | | $ | (0.348 | ) |
Tax return of capital | | | — | | | | (0.011 | ) | | | (0.014 | ) | | | (0.018 | ) | | | — | |
| | | | | |
Total distributions | | $ | (0.255 | ) | | $ | (0.274 | ) | | $ | (0.298 | ) | | $ | (0.329 | ) | | $ | (0.348 | ) |
| | | | | |
Net asset value — End of year | | $ | 7.350 | | | $ | 7.430 | | | $ | 7.600 | | | $ | 7.510 | | | $ | 7.090 | |
| | | | | |
Total Return(2) | | | 2.39 | % | | | 1.42 | % | | | 5.28 | % | | | 10.70 | % | | | 4.33 | % |
| | | | | |
| Ratios/Supplemental Data | | | | | | | | | | | | | | | | | | | | |
Net assets, end of year (000’s omitted) | | $ | 22,018 | | | $ | 12,474 | | | $ | 10,895 | | | $ | 5,065 | | | $ | 827 | |
Ratios (as a percentage of average daily net assets): | | | | | | | | | | | | | | | | | | | | |
Expenses(3)(4) | | | 1.35 | % | | | 1.39 | % | | | 1.40 | % | | | 1.41 | % | | | 1.44 | % |
Net investment income | | | 1.92 | % | | | 2.45 | % | | | 2.80 | % | | | 3.20 | % | | | 3.82 | % |
Portfolio Turnover of the Portfolio | | | 26 | % | | | 19 | % | | | 22 | % | | | 28 | % | | | 19 | % |
| (1) | Computed using average shares outstanding. |
| (2) | Returns are historical and are calculated by determining the percentage change in net asset value with all distributions reinvested. |
| (3) | Excludes the effect of custody fee credits, if any, of less than 0.005%. |
| (4) | Includes the Fund’s share of the Portfolio’s allocated expenses. |
| | | | |
| | 14 | | See Notes to Financial Statements. |
Eaton Vance
Government Obligations Fund
October 31, 2012
Notes to Financial Statements
1 Significant Accounting Policies
Eaton Vance Government Obligations Fund (the Fund) is a diversified series of Eaton Vance Mutual Funds Trust (the Trust). The Trust is a Massachusetts business trust registered under the Investment Company Act of 1940, as amended (the 1940 Act), as an open-end management investment company. The Fund offers five classes of shares. Class A shares are generally sold subject to a sales charge imposed at time of purchase. Class B and Class C shares are sold at net asset value and are generally subject to a contingent deferred sales charge (see Note 5). Class I and Class R shares are sold at net asset value and are not subject to a sales charge. Class B shares automatically convert to Class A shares eight years after their purchase as described in the Fund’s prospectus. Beginning January 1, 2012, Class B shares are only available for purchase upon exchange from another Eaton Vance fund or through reinvestment of distributions. Each class represents a pro-rata interest in the Fund, but votes separately on class-specific matters and (as noted below) is subject to different expenses. Realized and unrealized gains and losses are allocated daily to each class of shares based on the relative net assets of each class to the total net assets of the Fund. Net investment income, other than class-specific expenses, is allocated daily to each class of shares based upon the ratio of the value of each class’s paid shares to the total value of all paid shares. Each class of shares differs in its distribution plan and certain other class-specific expenses. The Fund invests all of its investable assets in interests in Government Obligations Portfolio (the Portfolio), a Massachusetts business trust, having the same investment objective and policies as the Fund. The value of the Fund’s investment in the Portfolio reflects the Fund’s proportionate interest in the net assets of the Portfolio (91.3% at October 31, 2012). The performance of the Fund is directly affected by the performance of the Portfolio. The financial statements of the Portfolio, including the portfolio of investments, are included elsewhere in this report and should be read in conjunction with the Fund’s financial statements.
The following is a summary of significant accounting policies of the Fund. The policies are in conformity with accounting principles generally accepted in the United States of America.
A Investment Valuation — Valuation of securities by the Portfolio is discussed in Note 1A of the Portfolio’s Notes to Financial Statements, which are included elsewhere in this report.
B Income — The Fund’s net investment income or loss consists of the Fund’s pro-rata share of the net investment income or loss of the Portfolio and other income, less all actual and accrued expenses of the Fund.
C Federal Taxes — The Fund’s policy is to comply with the provisions of the Internal Revenue Code applicable to regulated investment companies and to distribute to shareholders each year substantially all of its net investment income, and all or substantially all of its net realized capital gains. Accordingly, no provision for federal income or excise tax is necessary. At October 31, 2012, the Fund, for federal income tax purposes, had a capital loss carryforward of $87,728,739 and current year deferred capital losses of $21,899,905 which will reduce its taxable income arising from future net realized gains on investment transactions, if any, to the extent permitted by the Internal Revenue Code, and thus will reduce the amount of distributions to shareholders, which would otherwise be necessary to relieve the Fund of any liability for federal income or excise tax. Such capital loss carryforward will expire on October 31, 2013 ($23,607,593), October 31, 2014 ($17,522,954), October 31, 2015 ($6,336,492), October 31, 2016 ($1,612,295), October 31, 2018 ($18,778,422) and October 31, 2019 ($19,870,983). The current year deferred capital losses are treated as arising on the first day of the Fund’s next taxable year and are treated as realized prior to the utilization of the capital loss carryforward.
As of October 31, 2012, the Fund had no uncertain tax positions that would require financial statement recognition, de-recognition, or disclosure. The Fund files a U.S. federal income tax return annually after its fiscal year-end, which is subject to examination by the Internal Revenue Service for a period of three years from the date of filing.
D Expenses — The majority of expenses of the Trust are directly identifiable to an individual fund. Expenses which are not readily identifiable to a specific fund are allocated taking into consideration, among other things, the nature and type of expense and the relative size of the funds.
E Expense Reduction — State Street Bank and Trust Company (SSBT) serves as custodian of the Fund. Pursuant to the custodian agreement, SSBT receives a fee reduced by credits, which are determined based on the average daily cash balance the Fund maintains with SSBT. All credit balances, if any, used to reduce the Fund’s custodian fees are reported as a reduction of expenses in the Statement of Operations.
F Use of Estimates — The preparation of the financial statements in conformity with accounting principles generally accepted in the United States of America requires management to make estimates and assumptions that affect the reported amounts of assets and liabilities at the date of the financial statements and the reported amounts of income and expense during the reporting period. Actual results could differ from those estimates.
G Indemnifications — Under the Trust’s organizational documents, its officers and Trustees may be indemnified against certain liabilities and expenses arising out of the performance of their duties to the Fund. Under Massachusetts law, if certain conditions prevail, shareholders of a Massachusetts business trust (such as the Trust) could be deemed to have personal liability for the obligations of the Trust. However, the Trust’s Declaration of Trust contains an express disclaimer of liability on the part of Fund shareholders and the By-laws provide that the Trust shall assume the defense on behalf of any Fund shareholders. Moreover, the By-laws also provide for indemnification out of Fund property of any shareholder held personally liable solely by reason of being or having been a shareholder for all loss or expense arising from such liability. Additionally, in the normal course of business, the Fund enters into agreements with service providers that may contain indemnification clauses. The Fund’s maximum exposure under these arrangements is unknown as this would involve future claims that may be made against the Fund that have not yet occurred.
Eaton Vance
Government Obligations Fund
October 31, 2012
Notes to Financial Statements — continued
H Other — Investment transactions are accounted for on a trade date basis. Dividends to shareholders are recorded on the ex-dividend date.
2 Distributions to Shareholders
The Fund declares dividends daily to shareholders of record at the time of declaration. Distributions are generally paid monthly. Distributions of realized capital gains (reduced by available capital loss carryforwards from prior years, if any) are made at least annually. Distributions are declared separately for each class of shares. Shareholders may reinvest income and capital gain distributions in additional shares of the same class of the Fund at the net asset value as of the reinvestment date or, at the election of the shareholder, receive distributions in cash. The Fund distinguishes between distributions on a tax basis and a financial reporting basis. Accounting principles generally accepted in the United States of America require that only distributions in excess of tax basis earnings and profits be reported in the financial statements as a return of capital. Permanent differences between book and tax accounting relating to distributions are reclassified to paid-in capital. For tax purposes, distributions from short-term capital gains are considered to be from ordinary income.
The tax character of distributions declared for the years ended October 31, 2012 and October 31, 2011 was as follows:
| | | | | | | | |
| | | Year Ended October 31, | |
| | | 2012 | | | 2011 | |
| | |
Distributions declared from: | | | | | | | | |
Ordinary income | | $ | 39,457,259 | | | $ | 36,856,851 | |
Tax return of capital | | $ | — | | | $ | 1,596,111 | |
During the year ended October 31, 2012, accumulated net realized loss was decreased by $46,545,060, accumulated undistributed net investment income was increased by $20,556,578 and paid-in capital was decreased by $67,101,638 due to expired capital loss carryforwards and differences between book and tax accounting, primarily for paydown gain (loss) and premium amortization. These reclassifications had no effect on the net assets or net asset value per share of the Fund.
As of October 31, 2012, the components of distributable earnings (accumulated losses) and unrealized appreciation (depreciation) on a tax basis were as follows:
| | | | |
Undistributed ordinary income | | $ | 3,304,413 | |
Capital loss carryforward and deferred capital losses | | $ | (109,628,644 | ) |
Net unrealized appreciation | | $ | 63,634,071 | |
Other temporary differences | | $ | (708,564 | ) |
The differences between components of distributable earnings (accumulated losses) on a tax basis and the amounts reflected in the Statement of Assets and Liabilities are primarily due to to the timing of recognizing distributions to shareholders, wash sales, partnership allocations, futures contracts and premium amortization.
3 Transactions with Affiliates
Eaton Vance Management (EVM) serves as the administrator to the Fund, but receives no compensation. The Portfolio has engaged Boston Management and Research (BMR), a subsidiary of EVM, to render investment advisory services. See Note 2 of the Portfolio’s Notes to Financial Statements which are included elsewhere in this report. EVM serves as the sub-transfer agent of the Fund and receives from the transfer agent an aggregate fee based upon the actual expenses incurred by EVM in the performance of these services. For the year ended October 31, 2012, EVM earned $42,957 in sub-transfer agent fees. The Fund was informed that Eaton Vance Distributors, Inc. (EVD), an affiliate of EVM and the Fund’s principal underwriter, received $152,144 as its portion of the sales charge on sales of Class A shares for the year ended October 31, 2012. EVD also received distribution and service fees from Class A, Class B, Class C and Class R shares (see Note 4) and contingent deferred sales charges (see Note 5).
Trustees and officers of the Fund who are members of EVM’s or BMR’s organizations receive remuneration for their services to the Fund out of the investment adviser fee. Certain officers and Trustees of the Fund and the Portfolio are officers of the above organizations.
4 Distribution Plans
The Fund has in effect a distribution plan for Class A shares (Class A Plan) pursuant to Rule 12b-1 under the 1940 Act. Pursuant to the Class A Plan, the Fund pays EVD a distribution and service fee of 0.25% per annum of its average daily net assets attributable to Class A shares for distribution services and
Eaton Vance
Government Obligations Fund
October 31, 2012
Notes to Financial Statements — continued
facilities provided to the Fund by EVD, as well as for personal services and/or the maintenance of shareholder accounts. Distribution and service fees paid or accrued to EVD for the year ended October 31, 2012 amounted to $1,656,587 for Class A shares. The Fund also has in effect distribution plans for Class B shares (Class B Plan), Class C shares (Class C Plan) and Class R shares (Class R Plan) pursuant to Rule 12b-1 under the 1940 Act. Pursuant to the Class B and Class C Plans, the Fund pays EVD amounts equal to 0.75% per annum of its average daily net assets attributable to Class B and Class C shares for providing ongoing distribution services and facilities to the Fund. The Fund will automatically discontinue payments to EVD during any period in which there are no outstanding Uncovered Distribution Charges, which are equivalent to the sum of (i) 5% and 6.25% of the aggregate amount received by the Fund for Class B and Class C shares sold, respectively, plus (ii) interest calculated by applying the rate of 1% over the prevailing prime rate to the outstanding balance of Uncovered Distribution Charges of EVD of each respective class, reduced by the aggregate amount of contingent deferred sales charges (see Note 5) and amounts theretofore paid or payable to EVD by each respective class. For the year ended October 31, 2012, the Fund paid or accrued to EVD $265,894 and $2,254,801 for Class B and Class C shares, respectively, representing 0.75% of the average daily net assets of Class B and Class C shares. At October 31, 2012, the amounts of Uncovered Distribution Charges of EVD calculated under the Class B and Class C Plans were approximately $13,701,000 and $97,110,000, respectively. The Class R Plan requires the Fund to pay EVD an amount up to 0.50% per annum of its average daily net assets attributable to Class R shares for providing ongoing distribution services and facilities to the Fund. The Trustees of the Trust have currently limited Class R distribution payments to 0.25% per annum of the average daily net assets attributable to Class R shares. For the year ended October 31, 2012, the Fund paid or accrued to EVD $41,956 for Class R shares.
Pursuant to the Class B, Class C and Class R Plans, the Fund also makes payments of service fees to EVD, financial intermediaries and other persons in amounts equal to 0.25% per annum of its average daily net assets attributable to that class. Service fees paid or accrued are for personal services and/or the maintenance of shareholder accounts. They are separate and distinct from the sales commissions and distribution fees payable to EVD and, as such, are not subject to automatic discontinuance when there are no outstanding Uncovered Distribution Charges of EVD. Service fees paid or accrued for the year ended October 31, 2012 amounted to $88,631, $751,600 and $41,956 for Class B, Class C and Class R shares, respectively.
5 Contingent Deferred Sales Charges
A contingent deferred sales charge (CDSC) generally is imposed on redemptions of Class B shares made within six years of purchase and on redemptions of Class C shares made within one year of purchase. Class A shares may be subject to a 1% CDSC if redeemed within 18 months of purchase (depending on the circumstances of purchase). Generally, the CDSC is based upon the lower of the net asset value at date of redemption or date of purchase. No charge is levied on shares acquired by reinvestment of dividends or capital gain distributions. The CDSC for Class B shares is imposed at declining rates that begin at 5% in the case of redemptions in the first and second year after purchase, declining one percentage point each subsequent year. Class C shares are subject to a 1% CDSC if redeemed within one year of purchase. No CDSC is levied on shares which have been sold to EVM or its affiliates or to their respective employees or clients and may be waived under certain other limited conditions. CDSCs received on Class B and Class C redemptions are paid to EVD to reduce the amount of Uncovered Distribution Charges calculated under the Fund’s Class B and Class C Plans. CDSCs received on Class B and Class C redemptions when no Uncovered Distribution Charges exist are credited to the Fund. For the year ended October 31, 2012, the Fund was informed that EVD received approximately $114,000, $81,000 and $36,000 of CDSCs paid by Class A, Class B and Class C shareholders, respectively.
6 Investment Transactions
For the year ended October 31, 2012, increases and decreases in the Fund’s investment in the Portfolio aggregated $212,999,054 and $162,989,016, respectively.
7 Shares of Beneficial Interest
The Fund’s Declaration of Trust permits the Trustees to issue an unlimited number of full and fractional shares of beneficial interest (without par value). Such shares may be issued in a number of different series (such as the Fund) and classes. Transactions in Fund shares were as follows:
| | | | | | | | |
| | | Year Ended October 31, | |
| Class A | | 2012 | | | 2011 | |
| | |
Sales | | | 35,644,803 | | | | 30,322,173 | |
Issued to shareholders electing to receive payments of distributions in Fund shares | | | 2,659,831 | | | | 2,549,129 | |
Redemptions | | | (29,473,280 | ) | | | (42,053,256 | ) |
Exchange from Class B shares | | | 872,359 | | | | 4,234,082 | |
| | |
Net increase (decrease) | | | 9,703,713 | | | | (4,947,872 | ) |
Eaton Vance
Government Obligations Fund
October 31, 2012
Notes to Financial Statements — continued
| | | | | | | | |
| | | Year Ended October 31, | |
| Class B | | 2012 | | | 2011 | |
| | |
Sales | | | 361,862 | | | | 761,315 | |
Issued to shareholders electing to receive payments of distributions in Fund shares | | | 119,921 | | | | 169,460 | |
Redemptions | | | (1,089,764 | ) | | | (2,659,179 | ) |
Exchange to Class A shares | | | (872,632 | ) | | | (4,232,051 | ) |
| | |
Net decrease | | | (1,480,613 | ) | | | (5,960,455 | ) |
| | |
| | | | | | | | |
| | | Year Ended October 31, | |
| Class C | | 2012 | | | 2011 | |
| | |
Sales | | | 10,059,377 | | | | 10,822,547 | |
Issued to shareholders electing to receive payments of distributions in Fund shares | | | 907,719 | | | | 872,738 | |
Redemptions | | | (10,457,606 | ) | | | (18,234,428 | ) |
| | |
Net increase (decrease) | | | 509,490 | | | | (6,539,143 | ) |
| | |
| | | | | | | | |
| | | Year Ended October 31, | |
| Class I | | 2012 | | | 2011 | |
| | |
Sales | | | 18,173,255 | | | | 12,195,162 | |
Issued to shareholders electing to receive payments of distributions in Fund shares | | | 462,290 | | | | 253,616 | |
Redemptions | | | (15,741,913 | ) | | | (5,248,911 | ) |
| | |
Net increase | | | 2,893,632 | | | | 7,199,867 | |
| | |
| | | | | | | | |
| | | Year Ended October 31, | |
| Class R | | 2012 | | | 2011 | |
| | |
Sales | | | 1,941,398 | | | | 1,063,904 | |
Issued to shareholders electing to receive payments of distributions in Fund shares | | | 67,906 | | | | 54,688 | |
Redemptions | | | (690,872 | ) | | | (875,034 | ) |
| | |
Net increase | | | 1,318,432 | | | | 243,558 | |
Eaton Vance
Government Obligations Fund
October 31, 2012
Report of Independent Registered Public Accounting Firm
To the Trustees of Eaton Vance Mutual Funds Trust and Shareholders of Eaton Vance Government Obligations Fund:
We have audited the accompanying statement of assets and liabilities of Eaton Vance Government Obligations Fund (the “Fund”) (one of the funds constituting Eaton Vance Mutual Funds Trust) as of October 31, 2012, and the related statement of operations for the year then ended, the statements of changes in net assets for each of the two years in the period then ended, and the financial highlights for each of the five years in the period then ended. These financial statements and financial highlights are the responsibility of the Fund’s management. Our responsibility is to express an opinion on these financial statements and financial highlights based on our audits.
We conducted our audits in accordance with the standards of the Public Company Accounting Oversight Board (United States). Those standards require that we plan and perform the audit to obtain reasonable assurance about whether the financial statements and financial highlights are free of material misstatement. The Fund is not required to have, nor were we engaged to perform, an audit of its internal control over financial reporting. Our audits included consideration of internal control over financial reporting as a basis for designing audit procedures that are appropriate in the circumstances, but not for the purpose of expressing an opinion on the effectiveness of the Fund’s internal control over financial reporting. Accordingly, we express no such opinion. An audit also includes examining, on a test basis, evidence supporting the amounts and disclosures in the financial statements, assessing the accounting principles used and significant estimates made by management, as well as evaluating the overall financial statement presentation. We believe that our audits provide a reasonable basis for our opinion.
In our opinion, such financial statements and financial highlights referred to above present fairly, in all material respects, the financial position of Eaton Vance Government Obligations Fund as of October 31, 2012, the results of its operations for the year then ended, the changes in its net assets for each of the two years in the period then ended, and the financial highlights for each of the five years in the period then ended, in conformity with accounting principles generally accepted in the United States of America.
DELOITTE & TOUCHE LLP
Boston, Massachusetts
December 18, 2012
Eaton Vance
Government Obligations Fund
October 31, 2012
Federal Tax Information (Unaudited)
The Form 1099-DIV you receive in January 2013 will show the tax status of all distributions paid to your account in calendar year 2012. Shareholders are advised to consult their own tax adviser with respect to the tax consequences of their investment in the Fund.
Government Obligations Portfolio
October 31, 2012
Portfolio of Investments
| | | | | | | | | | |
| Mortgage Pass-Throughs — 78.9% | | | | | | | | | | |
| | | |
| | | | | | | | | | |
| Security | | Principal
Amount
(000’s omitted) | | | Value | |
| | | | | | | | | | |
Federal Home Loan Mortgage Corp.: | | | | | | | | | | |
2.90%, with maturity at 2035(1) | | | | $ | 9,667 | | | $ | 10,296,630 | |
3.00%, with maturity at 2034(1) | | | | | 2,180 | | | | 2,328,754 | |
4.50%, with maturity at 2035 | | | | | 11,274 | | | | 12,179,621 | |
5.00%, with various maturities to 2018 | | | | | 4,037 | | | | 4,354,068 | |
5.50%, with various maturities to 2032 | | | | | 7,262 | | | | 7,788,429 | |
6.00%, with various maturities to 2035 | | | | | 21,258 | | | | 24,035,610 | |
6.50%, with various maturities to 2036 | | | | | 56,309 | | | | 65,103,629 | |
6.87%, with maturity at 2024 | | | | | 142 | | | | 156,233 | |
7.00%, with various maturities to 2035 | | | | | 26,996 | | | | 31,651,725 | |
7.09%, with maturity at 2023 | | | | | 600 | | | | 685,137 | |
7.25%, with maturity at 2022 | | | | | 905 | | | | 1,054,075 | |
7.31%, with maturity at 2027 | | | | | 244 | | | | 270,858 | |
7.50%, with various maturities to 2035 | | | | | 23,371 | | | | 28,260,976 | |
7.63%, with maturity at 2019 | | | | | 291 | | | | 316,198 | |
7.75%, with maturity at 2018 | | | | | 18 | | | | 20,268 | |
7.78%, with maturity at 2022 | | | | | 136 | | | | 161,183 | |
7.85%, with maturity at 2020 | | | | | 218 | | | | 243,866 | |
8.00%, with various maturities to 2028 | | | | | 7,826 | | | | 9,004,010 | |
8.13%, with maturity at 2019 | | | | | 465 | | | | 532,366 | |
8.15%, with various maturities to 2021 | | | | | 212 | | | | 248,486 | |
8.25%, with maturity at 2017 | | | | | 39 | | | | 43,850 | |
8.50%, with various maturities to 2031 | | | | | 6,912 | | | | 8,486,258 | |
8.75%, with maturity at 2016 | | | | | 6 | | | | 6,303 | |
9.00%, with various maturities to 2027 | | | | | 4,982 | | | | 5,586,361 | |
9.25%, with maturity at 2017 | | | | | 39 | | | | 42,789 | |
9.50%, with various maturities to 2026 | | | | | 1,500 | | | | 1,738,080 | |
9.75%, with maturity at 2018 | | | | | 1 | | | | 622 | |
10.50%, with maturity at 2020 | | | | | 543 | | | | 638,880 | |
11.00%, with maturity at 2015 | | | | | 15 | | | | 16,586 | |
| | | | | | | | | | | |
| | | | | | | | $ | 215,251,851 | |
| | | | | | | | | | | |
Federal National Mortgage Association: | | | | | |
2.319%, with various maturities to 2026(1) | | | | $ | 2,633 | | | $ | 2,728,819 | |
2.344%, with various maturities to 2035(1) | | | | | 26,956 | | | | 28,332,136 | |
2.366%, with various maturities to 2033(1) | | | | | 3,526 | | | | 3,683,958 | |
2.379%, with maturity at 2022(1) | | | | | 1,552 | | | | 1,596,721 | |
2.405%, with maturity at 2035(1) | | | | | 1,648 | | | | 1,719,227 | |
2.417%, with maturity at 2031(1) | | | | | 2,710 | | | | 2,793,822 | |
2.573%, with maturity at 2037(1) | | | | | 5,263 | | | | 5,553,083 | |
2.614%, with maturity at 2040(1) | | | | | 1,714 | | | | 1,817,641 | |
2.877%, with maturity at 2036(1) | | | | | 1,542 | | | | 1,591,472 | |
3.286%, with maturity at 2036(1) | | | | | 1,873 | | | | 1,930,579 | |
3.664%, with maturity at 2034(1) | | | | | 6,577 | | | | 7,178,801 | |
3.712%, with maturity at 2021(1) | | | | | 1,403 | | | | 1,460,509 | |
| | | | | | | | | | |
| Security | | Principal
Amount
(000’s omitted) | | | Value | |
| | | | | | | | | | |
Federal National Mortgage Association: (continued) | |
3.798%, with maturity at 2035(1) | | | | $ | 7,502 | | | $ | 8,188,715 | |
3.835%, with maturity at 2036(1) | | | | | 531 | | | | 558,669 | |
3.949%, with maturity at 2034(1) | | | | | 6,222 | | | | 6,791,939 | |
4.177%, with maturity at 2036(1) | | | | | 23,536 | | | | 25,689,903 | |
4.381%, with maturity at 2035(1) | | | | | 7,556 | | | | 8,248,198 | |
4.758%, with maturity at 2034(1) | | | | | 19,886 | | | | 21,706,689 | |
5.00%, with maturity at 2027 | | | | | 467 | | | | 501,009 | |
5.50%, with various maturities to 2030 | | | | | 20,180 | | | | 21,797,197 | |
6.00%, with various maturities to 2038 | | | | | 66,288 | | | | 74,461,893 | |
6.50%, with various maturities to 2036 | | | | | 189,454 | | | | 217,874,632 | |
6.536%, with maturity at 2025(2) | | | | | 250 | | | | 295,656 | |
7.00%, with various maturities to 2036 | | | | | 107,593 | | | | 126,821,827 | |
7.25%, with maturity at 2023 | | | | | 16 | | | | 16,655 | |
7.50%, with various maturities to 2032 | | | | | 8,382 | | | | 9,953,240 | |
7.875%, with maturity at 2021 | | | | | 682 | | | | 811,373 | |
7.935%, with maturity at 2030(2) | | | | | 17 | | | | 19,501 | |
8.00%, with various maturities to 2032 | | | | | 35,399 | | | | 43,672,927 | |
8.25%, with maturity at 2025 | | | | | 260 | | | | 312,404 | |
8.33%, with maturity at 2020 | | | | | 582 | | | | 682,398 | |
8.50%, with various maturities to 2032 | | | | | 6,619 | | | | 8,277,725 | |
8.566%, with maturity at 2021(2) | | | | | 66 | | | | 73,394 | |
9.00%, with various maturities to 2030 | | | | | 789 | | | | 948,195 | |
9.50%, with various maturities to 2030 | | | | | 1,762 | | | | 2,074,314 | |
9.634%, with maturity at 2025(2) | | | | | 25 | | | | 30,234 | |
9.645%, with maturity at 2021(2) | | | | | 70 | | | | 80,717 | |
9.657%, with maturity at 2020(2) | | | | | 29 | | | | 31,888 | |
9.75%, with maturity at 2019 | | | | | 12 | | | | 14,649 | |
9.90%, with maturity at 2021(2) | | | | | 60 | | | | 72,956 | |
9.994%, with maturity at 2023(2) | | | | | 47 | | | | 55,689 | |
10.10%, with maturity at 2021(2) | | | | | 43 | | | | 51,078 | |
10.178%, with maturity at 2025(2) | | | | | 24 | | | | 27,413 | |
10.311%, with maturity at 2025(2) | | | | | 11 | | | | 12,036 | |
11.00%, with maturity at 2020 | | | | | 392 | | | | 433,837 | |
11.374%, with maturity at 2019(2) | | | | | 38 | | | | 40,083 | |
11.876%, with maturity at 2021(2) | | | | | 10 | | | | 11,409 | |
11.909%, with maturity at 2018(2) | | | | | 30 | | | | 32,879 | |
12.713%, with maturity at 2015(2) | | | | | 40 | | | | 43,067 | |
| | | | | | | | | | | |
| | | | | | | | $ | 641,103,156 | |
| | | | | | | | | | | |
Government National Mortgage Association: | | | | | |
1.625%, with maturity at 2027(1) | | | | $ | 302 | | | $ | 314,532 | |
2.00%, with maturity at 2026(1) | | | | | 321 | | | | 339,517 | |
6.00%, with various maturities to 2033 | | | | | 16,287 | | | | 18,876,217 | |
6.10%, with maturity at 2033 | | | | | 10,609 | | | | 12,725,039 | |
6.50%, with various maturities to 2036 | | | | | 43,396 | | | | 51,682,228 | |
7.00%, with various maturities to 2034 | | | | | 28,674 | | | | 34,043,219 | |
| | | | |
| | 21 | | See Notes to Financial Statements. |
Government Obligations Portfolio
October 31, 2012
Portfolio of Investments — continued
| | | | | | | | | | |
| Security | | Principal
Amount
(000’s omitted) | | | Value | |
| | | | | | | | | | |
Government National Mortgage Association: (continued) | | | | | |
7.25%, with maturity at 2022 | | | | $ | 21 | | | $ | 23,693 | |
7.50%, with various maturities to 2025 | | | | | 5,072 | | | | 5,954,564 | |
8.00%, with various maturities to 2027 | | | | | 7,998 | | | | 9,490,652 | |
8.25%, with maturity at 2019 | | | | | 112 | | | | 128,530 | |
8.30%, with maturity at 2020 | | | | | 34 | | | | 40,251 | |
8.50%, with various maturities to 2018 | | | | | 1,098 | | | | 1,233,218 | |
9.00%, with various maturities to 2027 | | | | | 5,406 | | | | 6,632,330 | |
9.50%, with various maturities to 2026 | | | | | 3,471 | | | | 4,347,802 | |
| | | | | | | | | | | |
| | | | | | | | $ | 145,831,792 | |
| | | | | | | | | | | |
| | | |
Total Mortgage Pass-Throughs
(identified cost $958,803,721) | | | | | | | | $ | 1,002,186,799 | |
| | | | | | | | | | | |
| |
| Collateralized Mortgage Obligations — 3.9% | | | | | |
| | | |
| | | | | | | | | | |
| Security | | Principal
Amount
(000’s omitted) | | | Value | |
Federal Home Loan Mortgage Corp.: | | | | | | | | | | |
Series 30, Class I, 7.50%, 4/25/24 | | | | $ | 210 | | | $ | 222,748 | |
Series 1822, Class Z, 6.90%, 3/15/26 | | | | | 1,154 | | | | 1,228,697 | |
Series 1829, Class ZB, 6.50%, 3/15/26 | | | | | 499 | | | | 556,831 | |
Series 1896, Class Z, 6.00%, 9/15/26 | | | | | 601 | | | | 634,058 | |
Series 2075, Class PH, 6.50%, 8/15/28 | | | | | 279 | | | | 313,580 | |
Series 2091, Class ZC, 6.00%, 11/15/28 | | | | | 1,104 | | | | 1,210,149 | |
Series 2102, Class Z, 6.00%, 12/15/28 | | | | | 269 | | | | 294,158 | |
Series 2115, Class K, 6.00%, 1/15/29 | | | | | 1,815 | | | | 1,949,302 | |
Series 2142, Class Z, 6.50%, 4/15/29 | | | | | 601 | | | | 674,543 | |
Series 2245, Class A, 8.00%, 8/15/27 | | | | | 7,860 | | | | 9,140,761 | |
| | | | | | | | | | | |
| | | | | | | | $ | 16,224,827 | |
| | | | | | | | | | | |
Federal National Mortgage Association: | | | | | | | | | | |
Series G-8, Class E, 9.00%, 4/25/21 | | | | $ | 258 | | | $ | 300,546 | |
Series G92-44, Class ZQ, 8.00%, 7/25/22 | | | | | 240 | | | | 263,495 | |
Series G93-36, Class ZQ, 6.50%, 12/25/23 | | | | | 10,020 | | | | 11,428,391 | |
Series 1993-16, Class Z, 7.50%, 2/25/23 | | | | | 349 | | | | 405,220 | |
Series 1993-39, Class Z, 7.50%, 4/25/23 | | | | | 950 | | | | 1,104,022 | |
Series 1993-45, Class Z, 7.00%, 4/25/23 | | | | | 1,118 | | | | 1,300,594 | |
Series 1993-149, Class M, 7.00%, 8/25/23 | | | | | 408 | | | | 473,451 | |
Series 1993-178, Class PK, 6.50%, 9/25/23 | | | | | 830 | | | | 952,524 | |
Series 1993-250, Class Z, 7.00%, 12/25/23 | | | | | 165 | | | | 174,506 | |
Series 1994-40, Class Z, 6.50%, 3/25/24 | | | | | 833 | | | | 951,339 | |
Series 1994-42, Class K, 6.50%, 4/25/24 | | | | | 3,806 | | | | 4,365,913 | |
Series 1994-82, Class Z, 8.00%, 5/25/24 | | | | | 1,389 | | | | 1,616,465 | |
Series 1997-81, Class PD, 6.35%, 12/18/27 | | | | | 539 | | | | 621,568 | |
Series 2000-49, Class A, 8.00%, 3/18/27 | | | | | 769 | | | | 921,293 | |
Series 2001-81, Class HE, 6.50%, 1/25/32 | | | | | 2,053 | | | | 2,337,002 | |
| | | | | | | | | | |
| Security | | Principal
Amount
(000’s omitted) | | | Value | |
| | | | | | | | | | |
Federal National Mortgage Association: (continued) | |
Series 2002-1, Class G, 7.00%, 7/25/23 | | | | $ | 538 | | | $ | 612,291 | |
Series 2005-37, Class SU, 28.357%, 3/25/35(3) | | | | | 3,621 | | | | 5,502,507 | |
| | | | | | | | | | | |
| | | | | | | | $ | 33,331,127 | |
| | | | | | | | | | | |
Government National Mortgage Association: | | | | | | | | | | |
Series 1998-19, Class ZB, 6.50% , 7/20/28 | | | | $ | 501 | | | $ | 571,178 | |
| | | | | | | | | | | |
| | | |
Total Collateralized Mortgage Obligations
(identified cost $46,304,915) | | | | | | | | $ | 50,127,132 | |
| | | | | | | | | | | |
| |
| U.S. Government Agency Obligations — 10.9% | | | | | |
| | | |
| | | | | | | | | | |
| Security | | Principal
Amount
(000’s omitted) | | | Value | |
Federal Farm Credit Bank: | | | | | | | | | | |
5.75%, 12/7/28 | | | | $ | 5,000 | | | $ | 6,772,205 | |
5.77%, 1/5/27 | | | | | 5,000 | | | | 6,938,045 | |
| | | | | | | | | | | |
| | | | | | | | $ | 13,710,250 | |
| | | | | | | | | | | |
Federal Home Loan Bank: | | | | | | | | | | |
4.125%, 12/13/19 | | | | $ | 5,000 | | | $ | 5,939,105 | |
4.75%, 3/10/23 | | | | | 4,500 | | | | 5,664,051 | |
5.365%, 9/9/24 | | | | | 6,445 | | | | 8,567,203 | |
5.375%, 8/15/24 | | | | | 14,700 | | | | 19,467,592 | |
5.625%, 6/11/21 | | | | | 17,000 | | | | 22,246,336 | |
5.75%, 6/12/26 | | | | | 2,720 | | | | 3,706,114 | |
| | | | | | | | | | | |
| | | | | | | | $ | 65,590,401 | |
| | | | | | | | | | | |
United States Agency for International Development — Israel: | | | | | |
0.00%, 5/1/20 | | | | $ | 2,200 | | | $ | 1,911,611 | |
5.50%, 9/18/23 | | | | | 26,850 | | | | 35,547,762 | |
5.50%, 4/26/24 | | | | | 16,015 | | | | 21,323,749 | |
| | | | | | | | | | | |
| | | | | | | | $ | 58,783,122 | |
| | | | | | | | | | | |
| | | |
Total U.S. Government Agency Obligations
(identified cost $113,802,443) | | | | | | | | $ | 138,083,773 | |
| | | | | | | | | | | |
| |
| U.S. Treasury Obligations — 0.7% | | | | | |
| | | |
| | | | | | | | | | |
| Security | | Principal
Amount
(000’s omitted) | | | Value | |
U.S. Treasury Bond, 7.125%, 2/15/23(4) | | | | $ | 6,000 | | | $ | 9,094,686 | |
| | | | | | | | | | | |
| | | |
Total U.S. Treasury Obligations
(identified cost $6,189,321) | | | | | | | | $ | 9,094,686 | |
| | | | | | | | | | | |
| | | | |
| | 22 | | See Notes to Financial Statements. |
Government Obligations Portfolio
October 31, 2012
Portfolio of Investments — continued
| | | | | | | | | | |
| Short-Term Investments — 6.3% | | | | | | | | | | |
| | | |
| | | | | | | | | | |
| Description | | Interest
(000’s omitted) | | | Value | |
| | | | | | | | | | |
Eaton Vance Cash Reserves Fund, LLC, 0.12%(5) | | | | $ | 80,023 | | | $ | 80,023,322 | |
| | | | | | | | | | | |
| | | |
Total Short-Term Investments
(identified cost $80,023,322) | | | | | | | | $ | 80,023,322 | |
| | | | | | | | | | | |
| | | |
Total Investments — 100.7%
(identified cost $1,205,123,722) | | | | | | | | $ | 1,279,515,712 | |
| | | | | | | | | | | |
| | | |
Other Assets, Less Liabilities — (0.7)% | | | | | | | | $ | (8,505,978 | ) |
| | | | | | | | | | | |
| | | |
Net Assets — 100.0% | | | | | | | | $ | 1,271,009,734 | |
| | | | | | | | | | | |
The percentage shown for each investment category in the Portfolio of Investments is based on net assets.
| (1) | Adjustable rate mortgage security. Rate shown is the rate at October 31, 2012. |
| (2) | Weighted average fixed-rate coupon that changes/updates monthly. |
| (3) | Inverse floating-rate security whose coupon varies inversely with changes in the interest rate index. The stated interest rate represents the coupon rate in effect at October 31, 2012. |
| (4) | Security (or a portion thereof) has been pledged to cover margin requirements on open financial contracts. |
| (5) | Affiliated investment company available to Eaton Vance portfolios and funds which invests in high quality, U.S. dollar denominated money market instruments. The rate shown is the annualized seven-day yield as of October 31, 2012. |
| | | | |
| | 23 | | See Notes to Financial Statements. |
Government Obligations Portfolio
October 31, 2012
Statement of Assets and Liabilities
| | | | |
| Assets | | October 31, 2012 | |
Unaffiliated investments, at value (identified cost, $1,125,100,400) | | $ | 1,199,492,390 | |
Affiliated investment, at value (identified cost, $80,023,322) | | | 80,023,322 | |
Interest receivable | | | 6,037,744 | |
Interest receivable from affiliated investment | | | 6,353 | |
Receivable for investments sold | | | 213,140 | |
Receivable for open swap contracts | | | 877,640 | |
Total assets | | $ | 1,286,650,589 | |
| |
| Liabilities | | | | |
Payable for investments purchased | | $ | 14,625,297 | |
Payable for variation margin on open financial futures contracts | | | 173,441 | |
Payable to affiliates: | | | | |
Investment adviser fee | | | 738,606 | |
Trustees’ fees | | | 4,270 | |
Accrued expenses | | | 99,241 | |
Total liabilities | | $ | 15,640,855 | |
Net Assets applicable to investors’ interest in Portfolio | | $ | 1,271,009,734 | |
| |
| Sources of Net Assets | | | | |
Investors’ capital | | $ | 1,195,745,964 | |
Net unrealized appreciation | | | 75,263,770 | |
Total | | $ | 1,271,009,734 | |
| | | | |
| | 24 | | See Notes to Financial Statements. |
Government Obligations Portfolio
October 31, 2012
Statement of Operations
| | | | |
| Investment Income | | Year Ended
October 31, 2012 | |
Interest | | $ | 39,737,706 | |
Interest allocated from affiliated investment | | | 43,268 | |
Expenses allocated from affiliated investment | | | (5,626 | ) |
Total investment income | | $ | 39,775,348 | |
| |
| Expenses | | | | |
Investment adviser fee | | $ | 8,603,965 | |
Trustees’ fees and expenses | | | 50,863 | |
Custodian fee | | | 306,978 | |
Legal and accounting services | | | 102,785 | |
Miscellaneous | | | 36,675 | |
Total expenses | | $ | 9,101,266 | |
Deduct — | | | | |
Reduction of custodian fee | | $ | 3 | |
Total expense reductions | | $ | 3 | |
| |
Net expenses | | $ | 9,101,263 | |
| |
Net investment income | | $ | 30,674,085 | |
| |
| Realized and Unrealized Gain (Loss) | | | | |
Net realized gain (loss) — | | | | |
Investment transactions | | $ | 5,269,670 | |
Investment transactions allocated from affiliated investment | | | 561 | |
Financial futures contracts | | | (5,463,659 | ) |
Net realized loss | | $ | (193,428 | ) |
Change in unrealized appreciation (depreciation) — | | | | |
Investments | | $ | 4,206,957 | |
Financial futures contracts | | | (287,501 | ) |
Swap contracts | | | 877,640 | |
Net change in unrealized appreciation (depreciation) | | $ | 4,797,096 | |
| |
Net realized and unrealized gain | | $ | 4,603,668 | |
| |
Net increase in net assets from operations | | $ | 35,277,753 | |
| | | | |
| | 25 | | See Notes to Financial Statements. |
Government Obligations Portfolio
October 31, 2012
Statements of Changes in Net Assets
| | | | | | | | |
| | | Year Ended October 31, | |
| Increase (Decrease) in Net Assets | | 2012 | | | 2011 | |
From operations — | | | | | | | | |
Net investment income | | $ | 30,674,085 | | | $ | 33,067,020 | |
Net realized loss from investment transactions and financial futures contracts | | | (193,428 | ) | | | (11,245,982 | ) |
Net change in unrealized appreciation (depreciation) from investments, financial futures contracts, and swap contracts | | | 4,797,096 | | | | (1,589,742 | ) |
Net increase in net assets from operations | | $ | 35,277,753 | | | $ | 20,231,296 | |
Capital transactions — | | | | | | | | |
Contributions | | $ | 306,019,504 | | | $ | 189,445,095 | |
Withdrawals | | | (189,795,922 | ) | | | (289,370,516 | ) |
Net increase (decrease) in net assets from capital transactions | | $ | 116,223,582 | | | $ | (99,925,421 | ) |
| | |
Net increase (decrease) in net assets | | $ | 151,501,335 | | | $ | (79,694,125 | ) |
| | |
| Net Assets | | | | | | | | |
At beginning of year | | $ | 1,119,508,399 | | | $ | 1,199,202,524 | |
At end of year | | $ | 1,271,009,734 | | | $ | 1,119,508,399 | |
| | | | |
| | 26 | | See Notes to Financial Statements. |
Government Obligations Portfolio
October 31, 2012
Supplementary Data
| | | | | | | | | | | | | | | | | | | | |
| | | Year Ended October 31, | |
| Ratios/Supplemental Data | | 2012 | | | 2011 | | | 2010 | | | 2009 | | | 2008 | |
Ratios (as a percentage of average daily net assets): | | | | | | | | | | | | | | | | | | | | |
Expenses(1) | | | 0.74 | % | | | 0.75 | % | | | 0.76 | % | | | 0.77 | % | | | 0.80 | % |
Net investment income | | | 2.50 | % | | | 3.08 | % | | | 3.48 | % | | | 3.97 | % | | | 4.48 | % |
Portfolio Turnover | | | 26 | % | | | 19 | % | | | 22 | % | | | 28 | % | | | 19 | % |
| | | | | |
Total Return | | | 2.89 | % | | | 2.21 | % | | | 5.95 | % | | | 11.54 | % | | | 4.85 | % |
| | | | | |
Net assets, end of year (000’s omitted) | | $ | 1,271,010 | | | $ | 1,119,508 | | | $ | 1,199,203 | | | $ | 957,281 | | | $ | 810,627 | |
| (1) | Excludes the effect of custody fee credits, if any, of less than 0.005%. |
| | | | |
| | 27 | | See Notes to Financial Statements. |
Government Obligations Portfolio
October 31, 2012
Notes to Financial Statements
1 Significant Accounting Policies
Government Obligations Portfolio (the Portfolio) is a Massachusetts business trust registered under the Investment Company Act of 1940, as amended (the 1940 Act), as a diversified, open-end management investment company. The Portfolio’s investment objective is to provide a high current return. The Portfolio invests primarily in mortgage-backed securities (MBS) issued, backed or otherwise guaranteed by the U.S. Government or its agencies or instrumentalities. The Declaration of Trust permits the Trustees to issue interests in the Portfolio. At October 31, 2012, Eaton Vance Government Obligations Fund, Eaton Vance Multi-Strategy Absolute Return Fund, Eaton Vance Low Duration Government Income Fund (formerly, Eaton Vance Low Duration Fund) and Eaton Vance Multi-Strategy All Market Fund held an interest of 91.3%, 5.6%, 2.2% and 0.3%, respectively, in the Portfolio.
The following is a summary of significant accounting policies of the Portfolio. The policies are in conformity with accounting principles generally accepted in the United States of America.
A Investment Valuation — Debt obligations (including short-term obligations with a remaining maturity of more than sixty days and excluding most seasoned, fixed-rate 30-year mortgage-backed securities as noted below) are generally valued on the basis of valuations provided by third party pricing services, as derived from such services’ pricing models. Inputs to the models may include, but are not limited to, reported trades, executable bid and asked prices, broker/dealer quotations, prices or yields of securities with similar characteristics, benchmark curves or information pertaining to the issuer, as well as industry and economic events. The pricing services may use a matrix approach, which considers information regarding securities with similar characteristics to determine the valuation for a security. Most seasoned, fixed-rate 30-year mortgage-backed securities are valued through the use of the investment adviser’s matrix pricing system, which takes into account bond prices, yield differentials, anticipated prepayments and interest rates provided by dealers. Short-term obligations purchased with a remaining maturity of sixty days or less are generally valued at amortized cost, which approximates market value. Financial futures contracts are valued at the closing settlement price established by the board of trade or exchange on which they are traded. Interest rate swaps are normally valued using valuations provided by a third party pricing service. Such pricing service valuations are based on the present value of fixed and projected floating rate cash flows over the term of the swap contract. Future cash flows are discounted to their present value using swap quotations provided by electronic data services or by broker/dealers. Investments for which valuations or market quotations are not readily available or are deemed unreliable are valued at fair value using methods determined in good faith by or at the direction of the Trustees of the Portfolio in a manner that fairly reflects the security’s value, or the amount that the Portfolio might reasonably expect to receive for the security upon its current sale in the ordinary course. Each such determination is based on a consideration of relevant factors, which are likely to vary from one pricing context to another. These factors may include, but are not limited to, the type of security, the existence of any contractual restrictions on the security’s disposition, the price and extent of public trading in similar securities of the issuer or of comparable companies or entities, quotations or relevant information obtained from broker/dealers or other market participants, information obtained from the issuer, analysts, and/or the appropriate stock exchange (for exchange-traded securities), an analysis of the company’s or entity’s financial condition, and an evaluation of the forces that influence the issuer and the market(s) in which the security is purchased and sold.
The Portfolio may invest in Eaton Vance Cash Reserves Fund, LLC (Cash Reserves Fund), an affiliated investment company managed by Eaton Vance Management (EVM). Cash Reserves Fund generally values its investment securities utilizing the amortized cost valuation technique in accordance with Rule 2a-7 under the 1940 Act. This technique involves initially valuing a portfolio security at its cost and thereafter assuming a constant amortization to maturity of any discount or premium. If amortized cost is determined not to approximate fair value, Cash Reserves Fund may value its investment securities in the same manner as debt obligations described above.
B Investment Transactions — Investment transactions for financial statement purposes are accounted for on a trade date basis. Realized gains and losses on investments sold are determined on the basis of identified cost.
C Income — Interest income is recorded on the basis of interest accrued, adjusted for amortization of premium or accretion of discount.
D Federal Taxes — The Portfolio has elected to be treated as a partnership for federal tax purposes. No provision is made by the Portfolio for federal or state taxes on any taxable income of the Portfolio because each investor in the Portfolio is ultimately responsible for the payment of any taxes on its share of taxable income. Since at least one of the Portfolio’s investors is a regulated investment company that invests all or substantially all of its assets in the Portfolio, the Portfolio normally must satisfy the applicable source of income and diversification requirements (under the Internal Revenue Code) in order for its investors to satisfy them. The Portfolio will allocate, at least annually among its investors, each investor’s distributive share of the Portfolio’s net investment income, net realized capital gains and any other items of income, gain, loss, deduction or credit.
As of October 31, 2012, the Portfolio had no uncertain tax positions that would require financial statement recognition, de-recognition, or disclosure. The Portfolio files a U.S. federal income tax return annually after its fiscal year-end, which is subject to examination by the Internal Revenue Service for a period of three years from the date of filing.
E Expense Reduction — State Street Bank and Trust Company (SSBT) serves as custodian of the Portfolio. Pursuant to the custodian agreement, SSBT receives a fee reduced by credits, which are determined based on the average daily cash balance the Portfolio maintains with SSBT. All credit balances, if any, used to reduce the Portfolio’s custodian fees are reported as a reduction of expenses in the Statement of Operations.
Government Obligations Portfolio
October 31, 2012
Notes to Financial Statements — continued
F Use of Estimates — The preparation of the financial statements in conformity with accounting principles generally accepted in the United States of America requires management to make estimates and assumptions that affect the reported amounts of assets and liabilities at the date of the financial statements and the reported amounts of income and expense during the reporting period. Actual results could differ from those estimates.
G Indemnifications — Under the Portfolio’s organizational documents, its officers and Trustees may be indemnified against certain liabilities and expenses arising out of the performance of their duties to the Portfolio. Under Massachusetts law, if certain conditions prevail, interestholders in the Portfolio could be deemed to have personal liability for the obligations of the Portfolio. However, the Portfolio’s Declaration of Trust contains an express disclaimer of liability on the part of Portfolio interestholders and the By-laws provide that the Portfolio shall assume the defense on behalf of any Portfolio interestholder. Moreover, the By-laws also provide for indemnification out of Portfolio property of any interestholder held personally liable solely by reason of being or having been an interestholder for all loss or expense arising from such liability. Additionally, in the normal course of business, the Portfolio enters into agreements with service providers that may contain indemnification clauses. The Portfolio’s maximum exposure under these arrangements is unknown as this would involve future claims that may be made against the Portfolio that have not yet occurred.
H Financial Futures Contracts — Upon entering into a financial futures contract, the Portfolio is required to deposit with the broker, either in cash or securities, an amount equal to a certain percentage of the purchase price (initial margin). Subsequent payments, known as variation margin, are made or received by the Portfolio each business day, depending on the daily fluctuations in the value of the underlying security, and are recorded as unrealized gains or losses by the Portfolio. Gains (losses) are realized upon the expiration or closing of the financial futures contracts. Should market conditions change unexpectedly, the Portfolio may not achieve the anticipated benefits of the financial futures contracts and may realize a loss. Futures contracts have minimal counterparty risk as they are exchange traded and the clearinghouse for the exchange is substituted as the counterparty, guaranteeing counterparty performance.
I Interest Rate Swaps — Pursuant to interest rate swap agreements, the Portfolio either makes floating-rate payments based on a benchmark interest rate in exchange for fixed-rate payments or the Portfolio makes fixed-rate payments in exchange for payments on a floating benchmark interest rate. Payments received or made are recorded as realized gains or losses. During the term of the outstanding swap agreement, changes in the underlying value of the swap are recorded as unrealized gains or losses. The value of the swap is determined by changes in the relationship between two rates of interest. The Portfolio is exposed to credit loss in the event of non-performance by the swap counterparty. Risk may also arise from movements in interest rates.
2 Investment Adviser Fee and Other Transactions with Affiliates
The investment adviser fee is earned by Boston Management and Research (BMR), a subsidiary of EVM, as compensation for investment advisory services rendered to the Portfolio. Pursuant to the investment advisory agreement and subsequent fee reduction agreement between the Portfolio and BMR, the fee is computed at an annual rate of 0.75% of the Portfolio’s average daily net assets up to $500 million, 0.6875% from $500 million up to $1 billion, 0.6250% from $1 billion up to $1.5 billion, 0.5625% from $1.5 billion up to $2 billion, 0.5000% from $2 billion up to $2.5 billion and 0.4375% of average daily net assets of $2.5 billion or more, and is payable monthly. The fee reduction cannot be terminated without the consent of the Trustees and shareholders. The Portfolio invests its cash in Cash Reserves Fund. EVM does not currently receive a fee for advisory services provided to Cash Reserves Fund. For the year ended October 31, 2012, the Portfolio’s investment adviser fee amounted to $8,603,965 or 0.70% of the Portfolio’s average daily net assets.
Trustees and officers of the Portfolio who are members of EVM’s or BMR’s organizations receive remuneration for their services to the Portfolio out of the investment adviser fee. Trustees of the Portfolio who are not affiliated with the investment adviser may elect to defer receipt of all or a percentage of their annual fees in accordance with the terms of the Trustees Deferred Compensation Plan. For the year ended October 31, 2012, no significant amounts have been deferred. Certain officers and Trustees of the Portfolio are officers of the above organizations.
3 Purchases and Sales of Investments
Purchases and sales of investments, other than short-term obligations and including maturities and paydowns, aggregated $392,081,632 and $307,251,739, respectively, for the year ended October 31, 2012.
4 Federal Income Tax Basis of Investments
The cost and unrealized appreciation (depreciation) of investments of the Portfolio at October 31, 2012, as determined on a federal income tax basis, were as follows:
| | | | |
| |
Aggregate cost | | $ | 1,215,814,267 | |
| |
Gross unrealized appreciation | | $ | 65,550,871 | |
Gross unrealized depreciation | | | (1,849,426 | ) |
| |
Net unrealized appreciation | | $ | 63,701,445 | |
Government Obligations Portfolio
October 31, 2012
Notes to Financial Statements — continued
The net unrealized appreciation on swap contracts at October 31, 2012 on a federal income tax basis was $877,640.
5 Financial Instruments
The Portfolio may trade in financial instruments with off-balance sheet risk in the normal course of its investing activities. These financial instruments may include financial futures contracts and swap contracts and may involve, to a varying degree, elements of risk in excess of the amounts recognized for financial statement purposes. The notional or contractual amounts of these instruments represent the investment the Portfolio has in particular classes of financial instruments and do not necessarily represent the amounts potentially subject to risk. The measurement of the risks associated with these instruments is meaningful only when all related and offsetting transactions are considered.
A summary of obligations under these financial instruments at October 31, 2012 is as follows:
| | | | | | | | | | | | | | | | |
| Futures Contracts | | | | | | | | | | | | | |
Expiration
Month/Year | | Contracts | | Position | | Aggregate
Cost | | | Value | | | Net Unrealized
Appreciation
(Depreciation) | |
| | | | | |
| 12/12 | | 550
U.S. 5-Year Treasury Note | | Short | | $ | (68,358,984 | ) | | $ | (68,337,500 | ) | | $ | 21,484 | |
| 12/12 | | 100
U.S. 10-Year Treasury Note | | Short | | | (13,275,781 | ) | | | (13,303,125 | ) | | | (27,344 | ) |
| | | | | |
| | | | | | | | | | | | | | | $ | (5,860 | ) |
| | | | | | | | | | | | | | | | | | | | |
| Interest Rate Swaps | | | | | | | | | | | | | | | | |
| | | | | | |
| | | | | | | | | | | | | | | | | | | | |
| Counterparty | | Notional
Amount
(000’s omitted) | | | Portfolio Pays/
Receives
Floating Rate | | | Floating
Rate Index | | Annual
Fixed Rate | | Effective Date/
Termination
Date | | | Net Unrealized
Appreciation | |
| | | | | | |
| Deutsche Bank AG | | $ | 20,000 | | | | Pays | | | 3-month
USD-LIBOR-BBA | | 2.61% | |
| June 1, 2017/
June 1, 2022 |
| | $ | 26,180 | |
| Deutsche Bank AG | | | 20,000 | | | | Receives | | | 3-month
USD-LIBOR-BBA | | 2.82 | |
| June 1, 2017/
June 1, 2047 |
| | | 851,460 | |
| | | | | | |
| | | | | | | | | | | | | | | | | | | $ | 877,640 | |
The effective date represents the date on which the Portfolio and the counterparty to the interest rate swap contract begin interest payment accruals.
At October 31, 2012, the Portfolio had sufficient cash and/or securities to cover commitments under these contracts.
The Portfolio is subject to interest rate risk in the normal course of pursuing its investment objective. Because the Portfolio holds fixed-rate bonds, the value of these bonds may decrease if interest rates rise. The Portfolio utilizes various interest rate derivatives including U.S. Treasury futures and interest rate swaps to change the overall duration of the portfolio and to hedge against fluctuations in securities prices due to changes in interest rates.
The Portfolio enters into swap contracts that may contain provisions whereby the counterparty may terminate the contract under certain conditions, including but not limited to a decline in the Portfolio’s net assets below a certain level over a certain period of time, which would trigger a payment by the Portfolio for those derivatives in a liability position. At October 31, 2012, the Portfolio had no open derivatives with credit-related contingent features in a net liability position.
The non-exchange traded derivatives in which the Portfolio invests, including swap contracts, are subject to the risk that the counterparty to the contract fails to perform its obligations under the contract. At October 31, 2012, the maximum amount of loss the Portfolio would incur due to counterparty risk was $877,640, representing the fair value of such derivatives in an asset position, with the highest amount from any one counterparty being $877,640. To mitigate this risk, the Portfolio has entered into master netting agreements with substantially all its derivative counterparties, which allows it and a counterparty to aggregate amounts owed by each of them for derivative transactions under the agreement into a single net amount payable by either the Portfolio or the counterparty. Counterparties may be required to pledge collateral in the form of cash, U.S. Government securities or highly-rated bonds for the benefit of the Portfolio if the net amount due from the counterparty with respect to a derivative contract exceeds a certain threshold. The amount of collateral posted by the counterparties with respect to such contracts would reduce the amount of any loss incurred.
Government Obligations Portfolio
October 31, 2012
Notes to Financial Statements — continued
The fair values of open derivative instruments (not considered to be hedging instruments for accounting disclosure purposes) and whose primary underlying risk exposure is interest rate risk at October 31, 2012 were as follows:
| | | | | | | | |
| | | Fair Value | |
| Derivative | | Asset Derivative | | | Liability Derivative | |
| | |
Futures contracts | | $ | 21,484 | (1) | | $ | (27,344 | )(1) |
Swap contracts | | | 877,640 | (2) | | | — | |
| | |
Total | | $ | 899,124 | | | $ | (27,344 | ) |
| (1) | Amount represents cumulative unrealized appreciation or (depreciation) on futures contracts in the Futures Contracts table above. Only the current day’s variation margin on open futures contracts is reported within the Statement of Assets and Liabilities as Receivable or Payable for variation margin, as applicable. |
| (2) | Statement of Assets and Liabilities location: Receivable for open swap contracts; Net unrealized appreciation. |
The effect of derivative instruments (not considered to be hedging instruments for accounting disclosure purposes) on the Statement of Operations and whose primary underlying risk exposure is interest rate risk for the year ended October 31, 2012 was as follows:
| | | | | | | | |
| Derivative | | Realized Gain (Loss) on Derivatives Recognized in Income(1) | | | Change in Unrealized Appreciation (Depreciation) on Derivatives Recognized in Income(2) | |
| | |
Futures contracts | | $ | (5,463,659 | ) | | $ | (287,501 | ) |
Swap contracts | | $ | — | | | $ | 877,640 | |
| (1) | Statement of Operations location: Net realized gain (loss) – Financial futures contracts. |
| (2) | Statement of Operations location: Change in unrealized appreciation (depreciation) – Financial futures contracts and Swap contracts, respectively. |
The average notional amounts of futures contracts and swap contracts outstanding during the year ended October 31, 2012, which are indicative of the volume of these derivative types, were approximately $94,231,000 and $18,462,000, respectively.
6 Line of Credit
The Portfolio participates with other portfolios and funds managed by EVM and its affiliates in a $600 million unsecured line of credit agreement with a group of banks. Borrowings are made by the Portfolio solely to facilitate the handling of unusual and/or unanticipated short-term cash requirements. Interest is charged to the Portfolio based on its borrowings at an amount above either the Eurodollar rate or Federal Funds rate. In addition, a fee computed at an annual rate of 0.08% on the daily unused portion of the line of credit is allocated among the participating portfolios and funds at the end of each quarter. Because the line of credit is not available exclusively to the Portfolio, it may be unable to borrow some or all of its requested amounts at any particular time. The Portfolio did not have any significant borrowings or allocated fees during the year ended October 31, 2012.
7 Fair Value Measurements
Under generally accepted accounting principles for fair value measurements, a three-tier hierarchy to prioritize the assumptions, referred to as inputs, is used in valuation techniques to measure fair value. The three-tier hierarchy of inputs is summarized in the three broad levels listed below.
| Ÿ | | Level 1 – quoted prices in active markets for identical investments |
| Ÿ | | Level 2 – other significant observable inputs (including quoted prices for similar investments, interest rates, prepayment speeds, credit risk, etc.) |
| Ÿ | | Level 3 – significant unobservable inputs (including a fund’s own assumptions in determining the fair value of investments) |
In cases where the inputs used to measure fair value fall in different levels of the fair value hierarchy, the level disclosed is determined based on the lowest level input that is significant to the fair value measurement in its entirety. The inputs or methodology used for valuing securities are not necessarily an indication of the risk associated with investing in those securities.
Government Obligations Portfolio
October 31, 2012
Notes to Financial Statements — continued
At October 31, 2012, the hierarchy of inputs used in valuing the Portfolio’s investments and open derivative instruments, which are carried at value, were as follows:
| | | | | | | | | | | | | | | | |
| Asset Description | | Level 1 | | | Level 2 | | | Level 3 | | | Total | |
| | | | |
Mortgage Pass-Throughs | | $ | — | | | $ | 1,002,186,799 | | | $ | — | | | $ | 1,002,186,799 | |
Collateralized Mortgage Obligations | | | — | | | | 50,127,132 | | | | — | | | | 50,127,132 | |
U.S. Government Agency Obligations | | | — | | | | 138,083,773 | | | | — | | | | 138,083,773 | |
U.S. Treasury Obligations | | | — | | | | 9,094,686 | | | | — | | | | 9,094,686 | |
Short-Term Investments | | | — | | | | 80,023,322 | | | | — | | | | 80,023,322 | |
| | | | |
Total Investments | | $ | — | | | $ | 1,279,515,712 | | | $ | — | | | $ | 1,279,515,712 | |
| | | | |
Futures Contracts | | $ | 21,484 | | | $ | — | | | $ | — | | | $ | 21,484 | |
Interest Rate Swaps | | | — | | | | 877,640 | | | | — | | | | 877,640 | |
| | | | |
Total | | $ | 21,484 | | | $ | 1,280,393,352 | | | $ | — | | | $ | 1,280,414,836 | |
| | | | |
Liability Description | | | | | | | | | | | | | | | | |
Futures Contracts | | $ | (27,344 | ) | | $ | — | | | $ | — | | | $ | (27,344 | ) |
| | | | |
Total | | $ | (27,344 | ) | | $ | — | | | $ | — | | | $ | (27,344 | ) |
The Portfolio held no investments or other financial instruments as of October 31, 2011 whose fair value was determined using Level 3 inputs. At October 31, 2012, there were no investments transferred between Level 1 and Level 2 during the year then ended.
Government Obligations Portfolio
October 31, 2012
Report of Independent Registered Public Accounting Firm
To the Trustees and Investors of Government Obligations Portfolio:
We have audited the accompanying statement of assets and liabilities of Government Obligations Portfolio (the “Portfolio”), including the portfolio of investments, as of October 31, 2012, and the related statement of operations for the year then ended, the statements of changes in net assets for each of the two years in the period then ended, and the supplementary data for each of the five years in the period then ended. These financial statements and supplementary data are the responsibility of the Portfolio’s management. Our responsibility is to express an opinion on these financial statements and supplementary data based on our audits.
We conducted our audits in accordance with the standards of the Public Company Accounting Oversight Board (United States). Those standards require that we plan and perform the audit to obtain reasonable assurance about whether the financial statements and supplementary data are free of material misstatement. The Portfolio is not required to have, nor were we engaged to perform, an audit of its internal control over financial reporting. Our audits included consideration of internal control over financial reporting as a basis for designing audit procedures that are appropriate in the circumstances, but not for the purpose of expressing an opinion on the effectiveness of the Portfolio’s internal control over financial reporting. Accordingly, we express no such opinion. An audit also includes examining, on a test basis, evidence supporting the amounts and disclosures in the financial statements, assessing the accounting principles used and significant estimates made by management, as well as evaluating the overall financial statement presentation. Our procedures included confirmation of securities owned as of October 31, 2012, by correspondence with the custodian and brokers; where replies were not received from brokers, we performed other auditing procedures. We believe that our audits provide a reasonable basis for our opinion.
In our opinion, such financial statements and supplementary data referred to above present fairly, in all material respects, the financial position of Government Obligations Portfolio as of October 31, 2012, the results of its operations for the year then ended, the changes in its net assets for each of the two years in the period then ended, and the supplementary data for each of the five years in the period then ended, in conformity with accounting principles generally accepted in the United States of America.
DELOITTE & TOUCHE LLP
Boston, Massachusetts
December 18, 2012
Eaton Vance
Government Obligations Fund
October 31, 2012
Management and Organization
Fund Management. The Trustees of Eaton Vance Mutual Funds Trust (the Trust) and Government Obligations Portfolio (the Portfolio) are responsible for the overall management and supervision of the Trust’s and Portfolio’s affairs. The Trustees and officers of the Trust and the Portfolio are listed below. Except as indicated, each individual has held the office shown or other offices in the same company for the last five years. Trustees and officers of the Trust and the Portfolio hold indefinite terms of office. The “Noninterested Trustees” consist of those Trustees who are not “interested persons” of the Trust and the Portfolio, as that term is defined under the 1940 Act. The business address of each Trustee and officer is Two International Place, Boston, Massachusetts 02110. As used below, “EVC” refers to Eaton Vance Corp., “EV” refers to Eaton Vance, Inc., “EVM” refers to Eaton Vance Management, “BMR” refers to Boston Management and Research and “EVD” refers to Eaton Vance Distributors, Inc. EVC and EV are the corporate parent and trustee, respectively, of EVM and BMR. EVD is the Fund’s principal underwriter, the Portfolio’s placement agent and a wholly-owned subsidiary of EVC. Each officer affiliated with Eaton Vance may hold a position with other Eaton Vance affiliates that is comparable to his or her position with EVM listed below. Each Trustee oversees 187 portfolios in the Eaton Vance Complex (including all master and feeder funds in a master feeder structure). Each officer serves as an officer of certain other Eaton Vance funds. Each Trustee and officer serves until his or her successor is elected.
| | | | | | |
| Name and Year of Birth | | Position(s) with the Trust
and the Portfolio | | Length of
Service | | Principal Occupation(s) and Directorships During Past Five Years and Other Relevant Experience |
Interested Trustee | | | | | | |
| | | |
Thomas E. Faust Jr. 1958 | | Trustee | | Since 2007 | | Chairman, Chief Executive Officer and President of EVC, Director and President of EV, Chief Executive Officer and President of EVM and BMR, and Director of EVD. Trustee and/or officer of 187 registered investment companies. Mr. Faust is an interested person because of his positions with EVM, BMR, EVD, EVC and EV, which are affiliates of the Trust and the Portfolio. Directorships in the Last Five Years.(1) Director of EVC and Hexavest Inc. |
| | | |
| | | | | | |
Noninterested Trustees | | | | | | |
| | | |
Scott E. Eston 1956 | | Trustee | | Since 2011 | | Private investor. Formerly held various positions at Grantham, Mayo, Van Otterloo and Co., L.L.C. (investment management firm) (1997-2009), including Chief Operating Officer (2002-2009), Chief Financial Officer (1997-2009) and Chairman of the Executive Committee (2002-2008); President and Principal Executive Officer, GMO Trust (open-end registered investment company) (2006-2009). Former Partner, Coopers and Lybrand L.L.P. (now PricewaterhouseCoopers) (public accounting firm) (1987-1997). Directorships in the Last Five Years. None. |
| | | |
Benjamin C. Esty 1963 | | Trustee | | Since 2005 | | Roy and Elizabeth Simmons Professor of Business Administration and Finance Unit Head, Harvard University Graduate School of Business Administration. Directorships in the Last Five Years.(1) None. |
| | | |
Allen R. Freedman 1940 | | Trustee | | Since 2007 | | Private Investor. Former Chairman (2002-2004) and a Director (1983-2004) of Systems & Computer Technology Corp. (provider of software to higher education). Formerly, a Director of Loring Ward International (fund distributor) (2005-2007). Former Chairman and a Director of Indus International, Inc. (provider of enterprise management software to the power generating industry) (2005-2007). Former Chief Executive Officer of Assurant, Inc. (insurance provider) (1979-2000). Directorships in the Last Five Years.(1) Director of Stonemor Partners, L.P. (owner and operator of cemeteries). Formerly, Director of Assurant, Inc. (insurance provider) (1979-2011). |
| | | |
William H. Park 1947 | | Trustee | | Since 2003 | | Consultant and private investor. Formerly, Chief Financial Officer, Aveon Group L.P. (investment management firm) (2010-2011). Formerly, Vice Chairman, Commercial Industrial Finance Corp. (specialty finance company) (2006-2010). Formerly, President and Chief Executive Officer, Prizm Capital Management, LLC (investment management firm) (2002-2005). Formerly, Executive Vice President and Chief Financial Officer, United Asset Management Corporation (investment management firm) (1982-2001). Formerly, Senior Manager, Price Waterhouse (now PricewaterhouseCoopers) (an independent registered public accounting firm) (1972-1981). Directorships in the Last Five Years.(1) None. |
| | | |
Ronald A. Pearlman 1940 | | Trustee | | Since 2003 | | Professor of Law, Georgetown University Law Center. Formerly, Deputy Assistant Secretary (Tax Policy) and Assistant Secretary (Tax Policy), U.S. Department of the Treasury (1983-1985). Formerly, Chief of Staff, Joint Committee on Taxation, U.S. Congress (1988-1990). Directorships in the Last Five Years.(1) None. |
Eaton Vance
Government Obligations Fund
October 31, 2012
Management and Organization — continued
| | | | | | |
| Name and Year of Birth | | Position(s) with the Trust
and the Portfolio | | Length of
Service | | Principal Occupation(s) and Directorships During Past Five Years and Other Relevant Experience |
| | | |
Helen Frame Peters 1948 | | Trustee | | Since 2008 | | Professor of Finance, Carroll School of Management, Boston College. Formerly, Dean, Carroll School of Management, Boston College (2000-2002). Formerly, Chief Investment Officer, Fixed Income, Scudder Kemper Investments (investment management firm) (1998-1999). Formerly, Chief Investment Officer, Equity and Fixed Income, Colonial Management Associates (investment management firm) (1991-1998). Directorships in the Last Five Years.(1) Formerly, Director of BJ’s Wholesale Club, Inc. (wholesale club retailer) (2004-2011). Formerly, Trustee of SPDR Index Shares Funds and SPDR Series Trust (exchange traded funds) (2000-2009). Formerly, Director of Federal Home Loan Bank of Boston (a bank for banks) (2007-2009). |
| | | |
Lynn A. Stout 1957 | | Trustee | | Since 1998 | | Distinguished Professor of Corporate and Business Law, Jack G. Clarke Business Law Institute, Cornell University Law School. Formerly, the Paul Hastings Professor of Corporate and Securities Law (2006-2012) and Professor of Law (2001-2006), University of California at Los Angeles School of Law. Directorships in the Last Five Years.(1) None. |
| | | |
Harriett Tee Taggart 1948 | | Trustee | | Since 2011 | | Managing Director, Taggart Associates (a professional practice firm). Formerly, Partner and Senior Vice President, Wellington Management Company, LLP (investment management firm) (1983-2006). Directorships in the Last Five Years. Director of Albemarle Corporation (chemicals manufacturer) (since 2007) and The Hanover Group (specialty property and casualty insurance company) (since 2009). Formerly, Director of Lubrizol Corporation (specialty chemicals) (2007-2011). |
| | | |
Ralph F. Verni 1943 | | Chairman of the Board and Trustee | | Chairman of the Board since 2007 and Trustee since 2005 | | Consultant and private investor. Formerly, Chief Investment Officer (1982-1992), Chief Financial Officer (1988-1990) and Director (1982-1992), New England Life. Formerly, Chairperson, New England Mutual Funds (1982-1992). Formerly, President and Chief Executive Officer, State Street Management & Research (1992-2000). Formerly, Chairperson, State Street Research Mutual Funds (1992-2000). Formerly, Director, W.P. Carey, LLC (1998-2004) and First Pioneer Farm Credit Corp. (2002-2006). Directorships in the Last Five Years.(1) None. |
| | | |
| | | | | | |
Principal Officers who are not Trustees | | |
| | | |
| Name and Year of Birth | | Position(s)
with the Trust
and the Portfolio | | Length of Service | | Principal Occupation(s) During Past Five Years |
| | | |
Duncan W. Richardson 1957 | | President of the Trust | | Since 2011 | | Director of EVC and Executive Vice President and Chief Equity Investment Officer of EVC, EVM and BMR. |
| | | |
Susan Schiff 1961 | | President of the Portfolio | | Since 2012 | | Vice President of EVM and BMR. |
| | | |
Payson F. Swaffield 1956 | | Vice President | | Since 2011 | | Vice President and Chief Income Investment Officer of EVM and BMR. |
| | | |
Barbara E. Campbell 1957 | | Treasurer | | Of the Trust since 2005 and of the Portfolio since 2008 | | Vice President of EVM and BMR. |
| | | |
Maureen A. Gemma 1960 | | Vice President, Secretary and Chief Legal Officer | | Vice President since 2011; Secretary since 2007 and Chief Legal Officer since 2008 | | Vice President of EVM and BMR. |
| | | |
Paul M. O’Neil 1953 | | Chief Compliance Officer | | Since 2004 | | Vice President of EVM and BMR. |
| (1) | During their respective tenures, the Trustees (except Mr. Eston and Ms. Taggart) also served as trustees of one or more of the following Eaton Vance funds (which operated in the years noted): Eaton Vance Credit Opportunities Fund (launched in 2005 and terminated in 2010); Eaton Vance Insured Florida Plus Municipal Bond Fund (launched in 2002 and terminated in 2009); and Eaton Vance National Municipal Income Trust (launched in 1998 and terminated in 2009). |
The SAI for the Fund includes additional information about the Trustees and officers of the Fund and the Portfolio and can be obtained without charge on Eaton Vance’s website at www.eatonvance.com or by calling 1-800-262-1122.
Eaton Vance Funds
IMPORTANT NOTICES
Privacy. The Eaton Vance organization is committed to ensuring your financial privacy. Each of the financial institutions identified below has in effect the following policy (“Privacy Policy”) with respect to nonpublic personal information about its customers:
| Ÿ | | Only such information received from you, through application forms or otherwise, and information about your Eaton Vance fund transactions will be collected. This may include information such as name, address, social security number, tax status, account balances and transactions. |
| Ÿ | | None of such information about you (or former customers) will be disclosed to anyone, except as permitted by law (which includes disclosure to employees necessary to service your account). In the normal course of servicing a customer’s account, Eaton Vance may share information with unaffiliated third parties that perform various required services such as transfer agents, custodians and broker-dealers. |
| Ÿ | | Policies and procedures (including physical, electronic and procedural safeguards) are in place that are designed to protect the confidentiality of such information. |
| Ÿ | | We reserve the right to change our Privacy Policy at any time upon proper notification to you. Customers may want to review our Privacy Policy periodically for changes by accessing the link on our homepage: www.eatonvance.com. |
Our pledge of privacy applies to the following entities within the Eaton Vance organization: the Eaton Vance Family of Funds, Eaton Vance Management, Eaton Vance Investment Counsel, Eaton Vance Distributors, Inc., Eaton Vance Trust Company, Eaton Vance Management’s Real Estate Investment Group and Boston Management and Research. In addition, our Privacy Policy applies only to those Eaton Vance customers who are individuals and who have a direct relationship with us. If a customer’s account (i.e., fund shares) is held in the name of a third-party financial advisor/broker-dealer, it is likely that only such advisor’s privacy policies apply to the customer. This notice supersedes all previously issued privacy disclosures. For more information about Eaton Vance’s Privacy Policy, please call 1-800-262-1122.
Delivery of Shareholder Documents. The Securities and Exchange Commission (SEC) permits funds to deliver only one copy of shareholder documents, including prospectuses, proxy statements and shareholder reports, to fund investors with multiple accounts at the same residential or post office box address. This practice is often called “householding” and it helps eliminate duplicate mailings to shareholders. Eaton Vance, or your financial advisor, may household the mailing of your documents indefinitely unless you instruct Eaton Vance, or your financial advisor, otherwise. If you would prefer that your Eaton Vance documents not be householded, please contact Eaton Vance at 1-800-262-1122, or contact your financial advisor. Your instructions that householding not apply to delivery of your Eaton Vance documents will be effective within 30 days of receipt by Eaton Vance or your financial advisor.
Portfolio Holdings. Each Eaton Vance Fund and its underlying Portfolio(s) (if applicable) will file a schedule of portfolio holdings on Form N-Q with the SEC for the first and third quarters of each fiscal year. The Form N-Q will be available on the Eaton Vance website at www.eatonvance.com, by calling Eaton Vance at 1-800-262-1122 or in the EDGAR database on the SEC’s website at www.sec.gov. Form N-Q may also be reviewed and copied at the SEC’s public reference room in Washington, D.C. (call 1-800-732-0330 for information on the operation of the public reference room).
Proxy Voting. From time to time, funds are required to vote proxies related to the securities held by the funds. The Eaton Vance Funds or their underlying Portfolios (if applicable) vote proxies according to a set of policies and procedures approved by the Funds’ and Portfolios’ Boards. You may obtain a description of these policies and procedures and information on how the Funds or Portfolios voted proxies relating to portfolio securities during the most recent 12-month period ended June 30, without charge, upon request, by calling 1-800-262-1122 and by accessing the SEC’s website at www.sec.gov.
Investment Adviser of Government Obligations Portfolio
Boston Management and Research
Two International Place
Boston, MA 02110
Administrator of Eaton Vance Government Obligations Fund
Eaton Vance Management
Two International Place
Boston, MA 02110
Principal Underwriter*
Eaton Vance Distributors, Inc.
Two International Place
Boston, MA 02110
(617) 482-8260
Custodian
State Street Bank and Trust Company
200 Clarendon Street
Boston, MA 02116
Transfer Agent
BNY Mellon Investment Servicing (US) Inc.
Attn: Eaton Vance Funds
P.O. Box 9653
Providence, RI 02940-9653
(800) 262-1122
Independent Registered Public Accounting Firm
Deloitte & Touche LLP
200 Berkeley Street
Boston, MA 02116-5022
Fund Offices
Two International Place
Boston, MA 02110
| * | FINRA BrokerCheck. Investors may check the background of their Investment Professional by contacting the Financial Industry Regulatory Authority (FINRA). FINRA BrokerCheck is a free tool to help investors check the professional background of current and former FINRA-registered securities firms and brokers. FINRA BrokerCheck is available by calling 1-800-289-9999 and at www.FINRA.org. The FINRA BrokerCheck brochure describing this program is available to investors at www.FINRA.org. |
| | |
Eaton Vance High Income Opportunities Fund Annual Report October 31, 2012 | | 
|

Fund shares are not insured by the FDIC and are not deposits or other obligations of, or guaranteed by, any depository institution. Shares are subject to investment risks, including possible loss of principal invested.
This report must be preceded or accompanied by a current summary prospectus or prospectus. Before investing, investors should consider carefully the investment objective, risks, and charges and expenses of a mutual fund. This and other important information is contained in the summary prospectus and prospectus, which can be obtained from a financial advisor. Prospective investors should read the prospectus carefully before investing. For further information, please call 1-800-262-1122.
Annual Report October 31, 2012
Eaton Vance
High Income Opportunities Fund
Table of Contents
| | | | |
Management’s Discussion of Fund Performance | | | 2 | |
| |
Performance | | | 3 | |
| |
Fund Profile | | | 4 | |
| |
Endnotes and Additional Disclosures | | | 5 | |
| |
Fund Expenses | | | 6 | |
| |
Financial Statements | | | 7 | |
| |
Report of Independent Registered Public Accounting Firm | | | 18 and 41 | |
| |
Federal Tax Information | | | 19 | |
| |
Management and Organization | | | 42 | |
| |
Important Notices | | | 45 | |
Eaton Vance
High Income Opportunities Fund
October 31, 2012
Management’s Discussion of Fund Performance1
Economic and Market Conditions
The U.S. corporate high-yield bond market generated a positive gain during the 12-month period ended October 31, 2012, as measured by the BofA Merrill Lynch U.S. High Yield Index.2 Favorable supply and demand conditions helped drive the advance. Investors who were frustrated by the ultralow yields offered by U.S. government bonds, wary of equity volatility and encouraged by improving macroeconomic developments poured money into high-yield bonds. Accommodative monetary policies from central banks around the world also bolstered investors’ appetite for riskier asset classes such as high-yield securities.
Robust demand easily offset an increase in supply of high-yield bonds. Supply was particularly heavy in early 2012 and later in the period. Refinancings, rather than new bond issuance, accounted for the bulk of the increase in supply, as issuers opportunistically replaced older, more expensive debt at lower prevailing rates and took advantage of strong demand for high-yield bonds.
Credit metrics on U.S. high-yield issuers remained solid, as default rates at the end of the period appeared to have stabilized at about half their longer-term average. Furthermore, overall leverage continued to be relatively low, and balance sheets generally were sound and liquid. Moderate economic growth appeared to be generating enough cash flow to comfortably meet debt service obligations for the most part, but subpar business activity continued to keep company managements cautious and not pursuing overly ambitious plans.
The technical conditions in the high-yield market were the primary drivers of price appreciation throughout much of the past year, largely due to the unprecedented liquidity provision policies of central banks. As a result, high-yield bond mutual fund inflows reached a fast pace by period-end, according to the Investment Company Institute, as bond investors aggressively pursued a quest for yield.
Fund Performance
For the fiscal year ended October 31, 2012, Eaton Vance High Income Opportunities Fund’s (the Fund) Class A shares at net asset value (NAV) had a total return of 12.53%. By comparison, the Fund’s primary benchmark, the BofA Merrill Lynch U.S. High Yield Index (the Index), gained 13.18% during the period.
Given investors’ increasing appetite for risk and yield, CCC-rated6 bonds outperformed their BB- and B-rated counterparts. BB-rated securities were the second-best-performing ratings category in the high-yield market, followed by B-rated securities. Although the Fund benefited in relative terms from credit selection in the CCC-rated holdings, its overall underweighting in this top-performing credit tier hampered performance versus the Index during the period. The Fund’s overweight position in BBB-rated holdings was a drag on performance versus the Index as well. On the other hand, credit selection among B-rated and CC-rated holdings aided relative performance versus the Index during the period.
Credit selection in the gaming, health care, building materials and metals/mining sectors benefited the Fund’s performance relative to the Index. Overweight positions in other sectors — namely chemicals and retail — also helped bolster relative results versus the Index, as these segments outperformed the overall market. On the other hand, the Fund’s underweight positions relative to the Index in the homebuilders and financial sectors detracted from relative performance versus the Index, as these sectors outperformed. Credit selection in the telecommunication, paper and automotive sectors was also a drag on performance versus the Index, as the Fund’s holdings in these sectors trailed those in the Index.
The Fund’s duration7 of 3.28 years was lower than the Index duration of 3.83 years at period-end, which negatively impacted the Fund’s relative performance versus the Index, as yields fell during the year. An underweight position in the 10+ year duration category also was a drag on performance versus the Index.
The Fund held short-term reserves and senior secured floating-rate loans, both of which lagged the performance of the Index and thereby detracted from performance versus the Index during the period.
See Endnotes and Additional Disclosures in this report.
Past performance is no guarantee of future results. Returns are historical and are calculated by determining the percentage change in net asset value (NAV) or offering price (as applicable) with all distributions reinvested. Investment return and principal value will fluctuate so that shares, when redeemed, may be worth more or less than their original cost. Performance less than one year is cumulative. Performance is for the stated time period only; due to market volatility, the Fund’s current performance may be lower or higher than quoted. Returns are before taxes unless otherwise noted. For performance as of the most recent month end, please refer to www.eatonvance.com.
Eaton Vance
High Income Opportunities Fund
October 31, 2012
Performance2,3
Portfolio Manager Michael W. Weilheimer, CFA
| | | | | | | | | | | | | | | | | | | | |
| % Average Annual Total Returns | | Inception Date | | | One Year | | | Five Years | | | Ten Years | | | Since Inception | |
Class A at NAV | | | 03/11/2004 | | | | 12.53 | % | | | 6.67 | % | | | — | | | | 7.14 | % |
Class A with 4.75% Maximum Sales Charge | | | — | | | | 7.27 | | | | 5.62 | | | | — | | | | 6.54 | |
Class B at NAV | | | 08/19/1986 | | | | 11.94 | | | | 5.91 | | | | 9.26 | % | | | — | |
Class B with 5% Maximum Sales Charge | | | — | | | | 6.94 | | | | 5.63 | | | | 9.26 | | | | — | |
Class C at NAV | | | 06/08/1994 | | | | 11.70 | | | | 5.91 | | | | 9.21 | | | | — | |
Class C with 1% Maximum Sales Charge | | | — | | | | 10.70 | | | | 5.91 | | | | 9.21 | | | | — | |
Class I at NAV | | | 10/01/2009 | | | | 13.06 | | | | — | | | | — | | | | 12.98 | |
BofA Merrill Lynch U.S. High Yield Index | | | — | | | | 13.18 | % | | | 9.11 | % | | | 10.95 | % | | | — | |
BofA Merrill Lynch U.S. High Yield Constrained Index | | | — | | | | 13.15 | | | | 9.26 | | | | 10.93 | | | | — | |
| | | | | |
| | | | | | | | | | | | | | | | | | | | |
| % Total Annual Operating Expense Ratios4 | | | | | Class A | | | Class B | | | Class C | | | Class I | |
| | | | | | | 0.99 | % | | | 1.74 | % | | | 1.74 | % | | | 0.74 | % |
Performance of $10,000
This graph shows the change in value of a hypothetical investment of $10,000 in Class C of the Fund for the period indicated. For comparison, the same investment is shown in the indicated index.
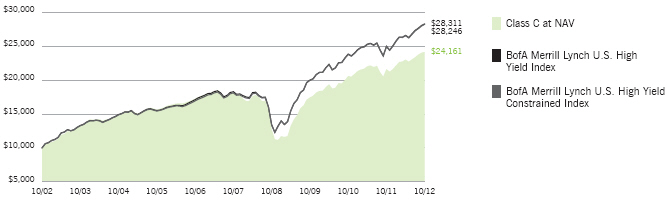
| | | | | | | | |
| Performance of Investment | | Amount Invested | | Period Beginning | | At NAV | | With Maximum Sales Charge |
Class A | | $10,000 | | 03/11/2004 | | $18,151 | | $17,291 |
Class B | | $10,000 | | 10/31/2002 | | $24,262 | | N.A. |
Class I | | $250,000 | | 10/01/2009 | | $364,375 | | N.A. |
See Endnotes and Additional Disclosures in this report.
Past performance is no guarantee of future results. Returns are historical and are calculated by determining the percentage change in net asset value (NAV) or offering price (as applicable) with all distributions reinvested. Investment return and principal value will fluctuate so that shares, when redeemed, may be worth more or less than their original cost. Performance less than one year is cumulative. Performance is for the stated time period only; due to market volatility, the Fund’s current performance may be lower or higher than quoted. Returns are before taxes unless otherwise noted. For performance as of the most recent month end, please refer to www.eatonvance.com.
Eaton Vance
High Income Opportunities Fund
October 31, 2012
Fund Profile5
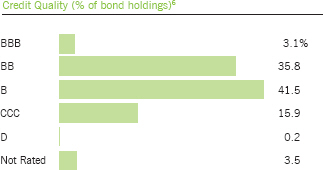
See Endnotes and Additional Disclosures in this report.
Eaton Vance
High Income Opportunities Fund
October 31, 2012
Endnotes and Additional Disclosures
| 1 | The views expressed in this report are those of the portfolio manager(s) and are current only through the date stated at the top of this page. These views are subject to change at any time based upon market or other conditions, and Eaton Vance and the Fund(s) disclaim any responsibility to update such views. These views may not be relied upon as investment advice and, because investment decisions are based on many factors, may not be relied upon as an indication of trading intent on behalf of any Eaton Vance fund. This commentary may contain statements that are not historical facts, referred to as “forward looking statements”. The Fund’s actual future results may differ significantly from those stated in any forward looking statement, depending on factors such as changes in securities or financial markets or general economic conditions, the volume of sales and purchases of Fund shares, the continuation of investment advisory, administrative and service contracts, and other risks discussed from time to time in the Fund’s filings with the Securities and Exchange Commission. |
| 2 | BofA Merrill Lynch U.S. High Yield Index is an unmanaged index of below-investment grade U.S. corporate bonds. BofA Merrill Lynch U.S. High Yield Constrained Index is an unmanaged index of below-investment grade U.S. corporate bonds, with issuer exposure capped at 2%. BofA Merrill Lynch® indices not for redistribution or other uses; provided “as is”, without warranties, and with no liability. Eaton Vance has prepared this report, BofAML does not endorse it, or guarantee, review, or endorse Eaton Vance’s products. Unless otherwise stated, index returns do not reflect the effect of any applicable sales charges, commissions, expenses, taxes or leverage, as applicable. It is not possible to invest directly in an index. |
| 3 | Total Returns at NAV do not include applicable sales charges. If sales charges were deducted, the returns would be lower. Total Returns shown with maximum sales charge reflect the stated maximum sales charge. Unless otherwise stated, performance does not reflect the deduction of taxes on Fund distributions or redemptions of Fund shares. |
| 4 | Source: Fund prospectus. |
| 5 | Fund invests in an affiliated investment company (Portfolio) with the same objective(s) and policies as the Fund. References to investments are to the Portfolio’s holdings. |
| 6 | Ratings are based on Moody’s, S&P or Fitch, as applicable. Credit ratings are based largely on the rating agency’s investment analysis at the time of rating and the rating assigned to any particular security is not necessarily a reflection of the issuer’s current financial condition. The rating assigned to a security by a rating agency does not necessarily reflect its assessment of the volatility of a security’s market value or of the liquidity of an investment in the security. If securities are rated differently by the rating agencies, the higher rating is applied. Ratings of BBB or higher by Standard and Poor’s or Fitch (Baa or higher by Moody’s) are considered to be investment grade quality. |
| 7 | Duration is a measure of the expected change in price of a bond — in percentage terms — given a one percent change in interest rates, all else being constant. Securities with lower durations tend to be less sensitive to interest-rate changes. |
| | Fund profile subject to change due to active management. |
Eaton Vance
High Income Opportunities Fund
October 31, 2012
Fund Expenses
Example: As a Fund shareholder, you incur two types of costs: (1) transaction costs, including sales charges (loads) on purchases and redemption fees (if applicable); and (2) ongoing costs, including management fees; distribution and/or service fees; and other Fund expenses. This Example is intended to help you understand your ongoing costs (in dollars) of Fund investing and to compare these costs with the ongoing costs of investing in other mutual funds. The Example is based on an investment of $1,000 invested at the beginning of the period and held for the entire period (May 1, 2012 – October 31, 2012).
Actual Expenses: The first section of the table below provides information about actual account values and actual expenses. You may use the information in this section, together with the amount you invested, to estimate the expenses that you paid over the period. Simply divide your account value by $1,000 (for example, an $8,600 account value divided by $1,000 = 8.6), then multiply the result by the number in the first section under the heading entitled “Expenses Paid During Period” to estimate the expenses you paid on your account during this period.
Hypothetical Example for Comparison Purposes: The second section of the table below provides information about hypothetical account values and hypothetical expenses based on the actual Fund expense ratio and an assumed rate of return of 5% per year (before expenses), which is not the actual Fund return. The hypothetical account values and expenses may not be used to estimate the actual ending account balance or expenses you paid for the period. You may use this information to compare the ongoing costs of investing in your Fund and other funds. To do so, compare this 5% hypothetical example with the 5% hypothetical examples that appear in the shareholder reports of the other funds.
Please note that the expenses shown in the table are meant to highlight your ongoing costs only and do not reflect any transactional costs, such as sales charges (loads) or redemption fees (if applicable). Therefore, the second section of the table is useful in comparing ongoing costs only, and will not help you determine the relative total costs of owning different funds. In addition, if these transactional costs were included, your costs would be higher.
| | | | | | | | | | | | | | | | |
| | | Beginning
Account Value
(5/1/12) | | | Ending
Account Value
(10/31/12) | | | Expenses Paid
During Period*
(5/1/12 – 10/31/12) | | | Annualized
Expense
Ratio | |
| | | | |
| | | | | | | | | | | | | | | | |
Actual | | | | | | | | | | | | | |
Class A | | $ | 1,000.00 | | | $ | 1,053.20 | | | $ | 4.75 | | | | 0.92 | % |
Class B | | $ | 1,000.00 | | | $ | 1,051.60 | | | $ | 8.66 | | | | 1.68 | % |
Class C | | $ | 1,000.00 | | | $ | 1,049.30 | | | $ | 8.60 | | | | 1.67 | % |
Class I | | $ | 1,000.00 | | | $ | 1,056.80 | | | $ | 3.46 | | | | 0.67 | % |
| | | | | | | | | | | | | | | | | |
| | | | |
| | | | | | | | | | | | | | | | |
Hypothetical | | | | | | | | | | | | | |
(5% return per year before expenses) | | | | | | | | | | | | | |
Class A | | $ | 1,000.00 | | | $ | 1,020.50 | | | $ | 4.67 | | | | 0.92 | % |
Class B | | $ | 1,000.00 | | | $ | 1,016.70 | | | $ | 8.52 | | | | 1.68 | % |
Class C | | $ | 1,000.00 | | | $ | 1,016.70 | | | $ | 8.47 | | | | 1.67 | % |
Class I | | $ | 1,000.00 | | | $ | 1,021.80 | | | $ | 3.41 | | | | 0.67 | % |
| * | Expenses are equal to the Fund’s annualized expense ratio for the indicated Class, multiplied by the average account value over the period, multiplied by 184/366 (to reflect the one-half year period). The Example assumes that the $1,000 was invested at the net asset value per share determined at the close of business on April 30, 2012. The Example reflects the expenses of both the Fund and the Portfolio. |
Eaton Vance
High Income Opportunities Fund
October 31, 2012
Statement of Assets and Liabilities
| | | | |
| Assets | | October 31, 2012 | |
Investment in High Income Opportunities Portfolio, at value (identified cost, $470,946,208) | | $ | 490,297,634 | |
Receivable for Fund shares sold | | | 200,590 | |
Total assets | | $ | 490,498,224 | |
|
| Liabilities | |
Payable for Fund shares redeemed | | $ | 1,432,162 | |
Distributions payable | | | 830,810 | |
Payable to affiliates: | | | | |
Distribution and service fees | | | 187,948 | |
Trustees’ fees | | | 42 | |
Accrued expenses | | | 129,747 | |
Total liabilities | | $ | 2,580,709 | |
Net Assets | | $ | 487,917,515 | |
|
| Sources of Net Assets | |
Paid-in capital | | $ | 575,574,568 | |
Accumulated net realized loss from Portfolio | | | (107,676,626 | ) |
Accumulated undistributed net investment income | | | 668,147 | |
Net unrealized appreciation from Portfolio | | | 19,351,426 | |
Total | | $ | 487,917,515 | |
|
| Class A Shares | |
Net Assets | | $ | 260,870,945 | |
Shares Outstanding | | | 58,057,498 | |
Net Asset Value and Redemption Price Per Share | | | | |
(net assets ÷ shares of beneficial interest outstanding) | | $ | 4.49 | |
Maximum Offering Price Per Share | | | | |
(100 ÷ 95.25 of net asset value per share) | | $ | 4.71 | |
|
| Class B Shares | |
Net Assets | | $ | 31,171,218 | |
Shares Outstanding | | | 6,925,824 | |
Net Asset Value and Offering Price Per Share* | | | | |
(net assets ÷ shares of beneficial interest outstanding) | | $ | 4.50 | |
|
| Class C Shares | |
Net Assets | | $ | 124,389,891 | |
Shares Outstanding | | | 27,681,782 | |
Net Asset Value and Offering Price Per Share* | | | | |
(net assets ÷ shares of beneficial interest outstanding) | | $ | 4.49 | |
|
| Class I Shares | |
Net Assets | | $ | 71,485,461 | |
Shares Outstanding | | | 15,891,189 | |
Net Asset Value, Offering Price and Redemption Price Per Share | | | | |
(net assets ÷ shares of beneficial interest outstanding) | | $ | 4.50 | |
On sales of $50,000 or more, the offering price of Class A shares is reduced.
| * | Redemption price per share is equal to the net asset value less any applicable contingent deferred sales charge. |
| | | | |
| | 7 | | See Notes to Financial Statements. |
Eaton Vance
High Income Opportunities Fund
October 31, 2012
Statement of Operations
| | | | |
| Investment Income | | Year Ended
October 31, 2012 | |
Interest and other income allocated from Portfolio | | $ | 36,310,379 | |
Dividends allocated from Portfolio (net of foreign taxes, $10,087) | | | 462,684 | |
Expenses allocated from Portfolio | | | (2,722,100 | ) |
Total investment income from Portfolio | | $ | 34,050,963 | |
| |
| Expenses | | | | |
Distribution and service fees | | | | |
Class A | | $ | 621,316 | |
Class B | | | 359,521 | |
Class C | | | 1,223,439 | |
Trustees’ fees and expenses | | | 500 | |
Custodian fee | | | 38,149 | |
Transfer and dividend disbursing agent fees | | | 370,580 | |
Legal and accounting services | | | 28,575 | |
Printing and postage | | | 62,938 | |
Registration fees | | | 60,182 | |
Miscellaneous | | | 14,943 | |
Total expenses | | $ | 2,780,143 | |
| |
Net investment income | | $ | 31,270,820 | |
| |
| Realized and Unrealized Gain (Loss) from Portfolio | | | | |
Net realized gain (loss) — | | | | |
Investment transactions | | $ | 88,033 | |
Swap contracts | | | (15,963 | ) |
Net realized gain | | $ | 72,070 | |
Change in unrealized appreciation (depreciation) — | | | | |
Investments | | $ | 24,547,844 | |
Swap contracts | | | 718,123 | |
Net change in unrealized appreciation (depreciation) | | $ | 25,265,967 | |
| |
Net realized and unrealized gain | | $ | 25,338,037 | |
| |
Net increase in net assets from operations | | $ | 56,608,857 | |
| | | | |
| | 8 | | See Notes to Financial Statements. |
Eaton Vance
High Income Opportunities Fund
October 31, 2012
Statements of Changes in Net Assets
| | | | | | | | |
| | | Year Ended October 31, | |
| Increase (Decrease) in Net Assets | | 2012 | | | 2011 | |
From operations — | | | | | | | | |
Net investment income | | $ | 31,270,820 | | | $ | 34,996,777 | |
Net realized gain (loss) from investment transactions, securities sold short and swap contracts | | | 72,070 | | | | (20,068,531 | ) |
Net change in unrealized appreciation (depreciation) from investments and swap contracts | | | 25,265,967 | | | | 11,323,039 | |
Net increase in net assets from operations | | $ | 56,608,857 | | | $ | 26,251,285 | |
Distributions to shareholders — | | | | | | | | |
From net investment income | | | | | | | | |
Class A | | $ | (17,518,977 | ) | | $ | (19,463,539 | ) |
Class B | | | (2,274,715 | ) | | | (3,427,871 | ) |
Class C | | | (7,719,945 | ) | | | (8,807,118 | ) |
Class I | | | (5,338,766 | ) | | | (5,176,910 | ) |
Total distributions to shareholders | | $ | (32,852,403 | ) | | $ | (36,875,438 | ) |
Transactions in shares of beneficial interest — | | | | | | | | |
Proceeds from sale of shares | | | | | | | | |
Class A | | $ | 39,619,688 | | | $ | 31,008,217 | |
Class B | | | 1,751,750 | | | | 6,334,162 | |
Class C | | | 15,947,416 | | | | 19,582,302 | |
Class I | | | 16,339,257 | | | | 32,545,106 | |
Net asset value of shares issued to shareholders in payment of distributions declared | | | | | | | | |
Class A | | | 13,314,776 | | | | 12,585,386 | |
Class B | | | 1,780,478 | | | | 2,030,003 | |
Class C | | | 5,297,845 | | | | 4,880,818 | |
Class I | | | 1,064,608 | | | | 634,836 | |
Cost of shares redeemed | | | | | | | | |
Class A | | | (50,986,784 | ) | | | (78,054,425 | ) |
Class B | | | (6,751,065 | ) | | | (10,005,394 | ) |
Class C | | | (23,983,977 | ) | | | (25,761,310 | ) |
Class I | | | (23,144,333 | ) | | | (16,930,195 | ) |
Net asset value of shares exchanged | | | | | | | | |
Class A | | | 8,242,374 | | | | 13,763,905 | |
Class B | | | (8,242,374 | ) | | | (13,763,905 | ) |
Redemption fees | | | — | | | | 11,566 | |
Net decrease in net assets from Fund share transactions | | $ | (9,750,341 | ) | | $ | (21,138,928 | ) |
| | |
Net increase (decrease) in net assets | | $ | 14,006,113 | | | $ | (31,763,081 | ) |
|
| Net Assets | |
At beginning of year | | $ | 473,911,402 | | | $ | 505,674,483 | |
At end of year | | $ | 487,917,515 | | | $ | 473,911,402 | |
|
Accumulated undistributed net investment income included in net assets | |
At end of year | | $ | 668,147 | | | $ | 843,056 | |
| | | | |
| | 9 | | See Notes to Financial Statements. |
Eaton Vance
High Income Opportunities Fund
October 31, 2012
Financial Highlights
| | | | | | | | | | | | | | | | | | | | |
| | | Class A | |
| | | Year Ended October 31, | |
| | | 2012 | | | 2011 | | | 2010 | | | 2009 | | | 2008 | |
Net asset value — Beginning of year | | $ | 4.280 | | | $ | 4.370 | | | $ | 4.020 | | | $ | 3.310 | | | $ | 5.130 | |
| | | | | |
| Income (Loss) From Operations | | | | | | | | | | | | | | | | | | | | |
Net investment income(1) | | $ | 0.293 | | | $ | 0.320 | | | $ | 0.346 | | | $ | 0.365 | | | $ | 0.419 | |
Net realized and unrealized gain (loss) | | | 0.224 | | | | (0.074 | ) | | | 0.385 | | | | 0.763 | | | | (1.823 | ) |
| | | | | |
Total income (loss) from operations | | $ | 0.517 | | | $ | 0.246 | | | $ | 0.731 | | | $ | 1.128 | | | $ | (1.404 | ) |
| | | | | |
| Less Distributions | | | | | | | | | | | | | | | | | | | | |
From net investment income | | $ | (0.307 | ) | | $ | (0.336 | ) | | $ | (0.381 | ) | | $ | (0.418 | ) | | $ | (0.416 | ) |
Tax return of capital | | | — | | | | — | | | | — | | | | — | | | | (0.000 | )(2) |
| | | | | |
Total distributions | | $ | (0.307 | ) | | $ | (0.336 | ) | | $ | (0.381 | ) | | $ | (0.418 | ) | | $ | (0.416 | ) |
| | | | | |
Redemption fees(1) | | $ | — | | | $ | 0.000 | (2) | | $ | 0.000 | (2) | | $ | 0.000 | (2) | | $ | 0.000 | (2) |
| | | | | |
Net asset value — End of year | | $ | 4.490 | | | $ | 4.280 | | | $ | 4.370 | | | $ | 4.020 | | | $ | 3.310 | |
| | | | | |
Total Return(3) | | | 12.53 | % | | | 5.73 | % | | | 19.05 | % | | | 37.83 | % | | | (29.26 | )% |
| | | | | |
| Ratios/Supplemental Data | | | | | | | | | | | | | | | | | | | | |
Net assets, end of year (000’s omitted) | | $ | 260,871 | | | $ | 238,331 | | | $ | 264,259 | | | $ | 238,485 | | | $ | 161,603 | |
Ratios (as a percentage of average daily net assets): | | | | | | | | | | | | | | | | | | | | |
Expenses(4)(5) | | | 0.94 | % | | | 0.99 | % | | | 1.04 | % | | | 1.27 | % | | | 1.11 | % |
Net investment income | | | 6.72 | % | | | 7.32 | % | | | 8.30 | % | | | 10.93 | % | | | 9.06 | % |
Portfolio Turnover of the Portfolio | | | 76 | % | | | 78 | % | | | 79 | % | | | 72 | % | | | 48 | % |
| (1) | Computed using average shares outstanding. |
| (2) | Amount is less than $0.0005. |
| (3) | Returns are historical and are calculated by determining the percentage change in net asset value with all distributions reinvested and do not reflect the effect of sales charges. |
| (4) | Includes the Fund’s share of the Portfolio’s allocated expenses. |
| (5) | Excludes the effect of custody fee credits, if any, of less than 0.005%. |
| | | | |
| | 10 | | See Notes to Financial Statements. |
Eaton Vance
High Income Opportunities Fund
October 31, 2012
Financial Highlights — continued
| | | | | | | | | | | | | | | | | | | | |
| | | Class B | |
| | | Year Ended October 31, | |
| | | 2012 | | | 2011 | | | 2010 | | | 2009 | | | 2008 | |
Net asset value — Beginning of year | | $ | 4.280 | | | $ | 4.380 | | | $ | 4.030 | | | $ | 3.300 | | | $ | 5.120 | |
| | | | | |
| Income (Loss) From Operations | | | | | | | | | | | | | | | | | | | | |
Net investment income(1) | | $ | 0.262 | | | $ | 0.289 | | | $ | 0.316 | | | $ | 0.345 | | | $ | 0.383 | |
Net realized and unrealized gain (loss) | | | 0.233 | | | | (0.085 | ) | | | 0.385 | | | | 0.773 | | | | (1.826 | ) |
| | | | | |
Total income (loss) from operations | | $ | 0.495 | | | $ | 0.204 | | | $ | 0.701 | | | $ | 1.118 | | | $ | (1.443 | ) |
| | | | | |
| Less Distributions | | | | | | | | | | | | | | | | | | | | |
From net investment income | | $ | (0.275 | ) | | $ | (0.304 | ) | | $ | (0.351 | ) | | $ | (0.388 | ) | | $ | (0.377 | ) |
Tax return of capital | | | — | | | | — | | | | — | | | | — | | | | (0.000 | )(2) |
| | | | | |
Total distributions | | $ | (0.275 | ) | | $ | (0.304 | ) | | $ | (0.351 | ) | | $ | (0.388 | ) | | $ | (0.377 | ) |
| | | | | |
Redemption fees(1) | | $ | — | | | $ | 0.000 | (2) | | $ | 0.000 | (2) | | $ | 0.000 | (2) | | $ | 0.000 | (2) |
| | | | | |
Net asset value — End of year | | $ | 4.500 | | | $ | 4.280 | | | $ | 4.380 | | | $ | 4.030 | | | $ | 3.300 | |
| | | | | |
Total Return(3) | | | 11.94 | % | | | 4.71 | % | | | 18.17 | % | | | 37.31 | % | | | (29.93 | )% |
| | | | | |
| Ratios/Supplemental Data | | | | | | | | | | | | | | | | | | | | |
Net assets, end of year (000’s omitted) | | $ | 31,171 | | | $ | 40,913 | | | $ | 57,156 | | | $ | 72,245 | | | $ | 89,480 | |
Ratios (as a percentage of average daily net assets): | | | | | | | | | | | | | | | | | | | | |
Expenses(4)(5) | | | 1.69 | % | | | 1.74 | % | | | 1.79 | % | | | 2.02 | % | | | 1.86 | % |
Net investment income | | | 6.01 | % | | | 6.58 | % | | | 7.58 | % | | | 10.56 | % | | | 8.23 | % |
Portfolio Turnover of the Portfolio | | | 76 | % | | | 78 | % | | | 79 | % | | | 72 | % | | | 48 | % |
| (1) | Computed using average shares outstanding. |
| (2) | Amount is less than $0.0005. |
| (3) | Returns are historical and are calculated by determining the percentage change in net asset value with all distributions reinvested and do not reflect the effect of sales charges. |
| (4) | Includes the Fund’s share of the Portfolio’s allocated expenses. |
| (5) | Excludes the effect of custody fee credits, if any, of less than 0.005%. |
| | | | |
| | 11 | | See Notes to Financial Statements. |
Eaton Vance
High Income Opportunities Fund
October 31, 2012
Financial Highlights — continued
| | | | | | | | | | | | | | | | | | | | |
| | | Class C | |
| | | Year Ended October 31, | |
| | | 2012 | | | 2011 | | | 2010 | | | 2009 | | | 2008 | |
Net asset value — Beginning of year | | $ | 4.280 | | | $ | 4.370 | | | $ | 4.020 | | | $ | 3.300 | | | $ | 5.110 | |
| | | | | |
| Income (Loss) From Operations | | | | | | | | | | | | | | | | | | | | |
Net investment income(1) | | $ | 0.261 | | | $ | 0.287 | | | $ | 0.315 | | | $ | 0.341 | | | $ | 0.383 | |
Net realized and unrealized gain (loss) | | | 0.224 | | | | (0.073 | ) | | | 0.386 | | | | 0.767 | | | | (1.816 | ) |
| | | | | |
Total income (loss) from operations | | $ | 0.485 | | | $ | 0.214 | | | $ | 0.701 | | | $ | 1.108 | | | $ | (1.433 | ) |
| | | | | |
| Less Distributions | | | | | | | | | | | | | | | | | | | | |
From net investment income | | $ | (0.275 | ) | | $ | (0.304 | ) | | $ | (0.351 | ) | | $ | (0.388 | ) | | $ | (0.377 | ) |
Tax return of capital | | | — | | | | — | | | | — | | | | — | | | | (0.000 | )(2) |
| | | | | |
Total distributions | | $ | (0.275 | ) | | $ | (0.304 | ) | | $ | (0.351 | ) | | $ | (0.388 | ) | | $ | (0.377 | ) |
| | | | | |
Redemption fees(1) | | $ | — | | | $ | 0.000 | (2) | | $ | 0.000 | (2) | | $ | 0.000 | (2) | | $ | 0.000 | (2) |
| | | | | |
Net asset value — End of year | | $ | 4.490 | | | $ | 4.280 | | | $ | 4.370 | | | $ | 4.020 | | | $ | 3.300 | |
| | | | | |
Total Return(3) | | | 11.70 | % | | | 4.96 | % | | | 18.21 | % | | | 36.97 | % | | | (29.79 | )% |
| | | | | |
| Ratios/Supplemental Data | | | | | | | | | | | | | | | | | | | | |
Net assets, end of year (000’s omitted) | | $ | 124,390 | | | $ | 121,128 | | | $ | 125,403 | | | $ | 115,927 | | | $ | 89,841 | |
Ratios (as a percentage of average daily net assets): | | | | | | | | | | | | | | | | | | | | |
Expenses(4)(5) | | | 1.69 | % | | | 1.74 | % | | | 1.79 | % | | | 2.02 | % | | | 1.86 | % |
Net investment income | | | 5.97 | % | | | 6.56 | % | | | 7.55 | % | | | 10.26 | % | | | 8.28 | % |
Portfolio Turnover of the Portfolio | | | 76 | % | | | 78 | % | | | 79 | % | | | 72 | % | | | 48 | % |
| (1) | Computed using average shares outstanding. |
| (2) | Amount is less than $0.0005. |
| (3) | Returns are historical and are calculated by determining the percentage change in net asset value with all distributions reinvested and do not reflect the effect of sales charges. |
| (4) | Includes the Fund’s share of the Portfolio’s allocated expenses. |
| (5) | Excludes the effect of custody fee credits, if any, of less than 0.005%. |
| | | | |
| | 12 | | See Notes to Financial Statements. |
Eaton Vance
High Income Opportunities Fund
October 31, 2012
Financial Highlights — continued
| | | | | | | | | | | | | | | | |
| | | Class I | |
| | | Year Ended October 31, | | | Period Ended October 31, 2009(1) | |
| | | 2012 | | | 2011 | | | 2010 | | |
Net asset value — Beginning of period | | $ | 4.280 | | | $ | 4.380 | | | $ | 4.020 | | | $ | 3.980 | |
| | | | |
| Income (Loss) From Operations | | | | | | | | | | | | | | | | |
Net investment income(2) | | $ | 0.304 | | | $ | 0.331 | | | $ | 0.353 | | | $ | 0.019 | |
Net realized and unrealized gain (loss) | | | 0.234 | | | | (0.083 | ) | | | 0.398 | | | | 0.057 | |
| | | | |
Total income from operations | | $ | 0.538 | | | $ | 0.248 | | | $ | 0.751 | | | $ | 0.076 | |
| | | | |
| Less Distributions | | | | | | | | | | | | | | | | |
From net investment income | | $ | (0.318 | ) | | $ | (0.348 | ) | | $ | (0.391 | ) | | $ | (0.036 | ) |
| | | | |
Total distributions | | $ | (0.318 | ) | | $ | (0.348 | ) | | $ | (0.391 | ) | | $ | (0.036 | ) |
| | | | |
Redemption fees(2) | | $ | — | | | $ | 0.000 | (3) | | $ | 0.000 | (3) | | $ | — | |
| | | | |
Net asset value — End of period | | $ | 4.500 | | | $ | 4.280 | | | $ | 4.380 | | | $ | 4.020 | |
| | | | |
Total Return(4) | | | 13.06 | % | | | 5.76 | % | | | 19.60 | % | | | 1.92 | %(5) |
| | | | |
| Ratios/Supplemental Data | | | | | | | | | | | | | | | | |
Net assets, end of period (000’s omitted) | | $ | 71,485 | | | $ | 73,540 | | | $ | 58,856 | | | $ | 1,099 | |
Ratios (as a percentage of average daily net assets): | | | | | | | | | | | | | | | | |
Expenses(6)(7) | | | 0.69 | % | | | 0.74 | % | | | 0.79 | % | | | 1.02 | %(8) |
Net investment income | | | 6.98 | % | | | 7.55 | % | | | 8.43 | % | | | 11.17 | %(8) |
Portfolio Turnover of the Portfolio | | | 76 | % | | | 78 | % | | | 79 | % | | | 72 | %(9) |
| (1) | For the period from the start of business, October 1, 2009, to October 31, 2009. |
| (2) | Computed using average shares outstanding. |
| (3) | Amount is less than $0.0005. |
| (4) | Returns are historical and are calculated by determining the percentage change in net asset value with all distributions reinvested. |
| (6) | Includes the Fund’s share of the Portfolio’s allocated expenses. |
| (7) | Excludes the effect of custody fee credits, if any, of less than 0.005%. |
| (9) | For the Portfolio’s fiscal year ended October 31, 2009. |
| | | | |
| | 13 | | See Notes to Financial Statements. |
Eaton Vance
High Income Opportunities Fund
October 31, 2012
Notes to Financial Statements
1 Significant Accounting Policies
Eaton Vance High Income Opportunities Fund (the Fund) is a diversified series of Eaton Vance Mutual Funds Trust (the Trust). The Trust is a Massachusetts business trust registered under the Investment Company Act of 1940, as amended (the 1940 Act), as an open-end management investment company. The Fund offers four classes of shares. Class A shares are generally sold subject to a sales charge imposed at time of purchase. Class B and Class C shares are sold at net asset value and are generally subject to a contingent deferred sales charge (see Note 5). Class I shares are sold at net asset value and are not subject to a sales charge. Class B shares automatically convert to Class A shares eight years after their purchase as described in the Fund’s prospectus. Beginning January 1, 2012, Class B shares are only available for purchase upon exchange from another Eaton Vance fund or through reinvestment of distributions. Each class represents a pro-rata interest in the Fund, but votes separately on class-specific matters and (as noted below) is subject to different expenses. Realized and unrealized gains and losses are allocated daily to each class of shares based on the relative net assets of each class to the total net assets of the Fund. Net investment income, other than class-specific expenses, is allocated daily to each class of shares based upon the ratio of the value of each class’s paid shares to the total value of all paid shares. Each class of shares differs in its distribution plan and certain other class-specific expenses. The Fund invests all of its investable assets in interests in High Income Opportunities Portfolio (the Portfolio), a Massachusetts business trust, having the same investment objectives and policies as the Fund. The value of the Fund’s investment in the Portfolio reflects the Fund’s proportionate interest in the net assets of the Portfolio (51.8% at October 31, 2012). The performance of the Fund is directly affected by the performance of the Portfolio. The financial statements of the Portfolio, including the portfolio of investments, are included elsewhere in this report and should be read in conjunction with the Fund’s financial statements.
The following is a summary of significant accounting policies of the Fund. The policies are in conformity with accounting principles generally accepted in the United States of America.
A Investment Valuation — Valuation of securities by the Portfolio is discussed in Note 1A of the Portfolio’s Notes to Financial Statements, which are included elsewhere in this report.
B Income — The Fund’s net investment income or loss consists of the Fund’s pro-rata share of the net investment income or loss of the Portfolio, less all actual and accrued expenses of the Fund.
C Federal Taxes — The Fund’s policy is to comply with the provisions of the Internal Revenue Code applicable to regulated investment companies and to distribute to shareholders each year substantially all of its net investment income, and all or substantially all of its net realized capital gains. Accordingly, no provision for federal income or excise tax is necessary. At October 31, 2012, the Fund, for federal income tax purposes, had a capital loss carryforward of $93,299,806 which will reduce its taxable income arising from future net realized gains on investment transactions, if any, to the extent permitted by the Internal Revenue Code, and thus will reduce the amount of distributions to shareholders, which would otherwise be necessary to relieve the Fund of any liability for federal income or excise tax. Such capital loss carryforward will expire on October 31, 2016 ($32,861,134), October 31, 2017 ($42,283,452) and October 31, 2019 ($18,155,220). In addition, such capital loss carryforward cannot be utilized prior to the utilization of new capital losses, if any, created after October 31, 2012.
During the year ended October 31, 2012, a capital loss carryforward of $306,790 was utilized to offset net realized gains by the Fund.
As of October 31, 2012, the Fund had no uncertain tax positions that would require financial statement recognition, de-recognition, or disclosure. The Fund files a U.S. federal income tax return annually after its fiscal year-end, which is subject to examination by the Internal Revenue Service for a period of three years from the date of filing.
D Expenses — The majority of expenses of the Trust are directly identifiable to an individual fund. Expenses which are not readily identifiable to a specific fund are allocated taking into consideration, among other things, the nature and type of expense and the relative size of the funds.
E Expense Reduction — State Street Bank and Trust Company (SSBT) serves as custodian of the Fund. Pursuant to the custodian agreement, SSBT receives a fee reduced by credits, which are determined based on the average daily cash balance the Fund maintains with SSBT. All credit balances, if any, used to reduce the Fund’s custodian fees are reported as a reduction of expenses in the Statement of Operations.
F Use of Estimates — The preparation of the financial statements in conformity with accounting principles generally accepted in the United States of America requires management to make estimates and assumptions that affect the reported amounts of assets and liabilities at the date of the financial statements and the reported amounts of income and expense during the reporting period. Actual results could differ from those estimates.
G Indemnifications — Under the Trust’s organizational documents, its officers and Trustees may be indemnified against certain liabilities and expenses arising out of the performance of their duties to the Fund. Under Massachusetts law, if certain conditions prevail, shareholders of a Massachusetts business trust (such as the Trust) could be deemed to have personal liability for the obligations of the Trust. However, the Trust’s Declaration of Trust contains an express disclaimer of liability on the part of Fund shareholders and the By-laws provide that the Trust shall assume the defense on behalf of any Fund shareholders. Moreover, the By-laws also provide for indemnification out of Fund property of any shareholder held personally liable solely by reason of being or having been a shareholder for all loss or expense arising from such liability. Additionally, in the normal course of business, the Fund enters into
Eaton Vance
High Income Opportunities Fund
October 31, 2012
Notes to Financial Statements — continued
agreements with service providers that may contain indemnification clauses. The Fund’s maximum exposure under these arrangements is unknown as this would involve future claims that may be made against the Fund that have not yet occurred.
H Redemption Fees — Prior to January 1, 2011 and upon the redemption or exchange of shares by Class A and Class I shareholders within 90 days of the settlement of purchase, a fee of 1% of the current net asset value of these shares was assessed and retained by the Fund for the benefit of the remaining shareholders. The redemption fee was accounted for as an addition to paid-in capital. Effective January 1, 2011, Class A and Class I shares are no longer subject to a redemption fee.
I Other — Investment transactions are accounted for on a trade date basis. Dividends to shareholders are recorded on the ex-dividend date.
2 Distributions to Shareholders
The Fund declares dividends daily to shareholders of record at the time of declaration. Distributions are generally paid monthly. Distributions of realized capital gains (reduced by available capital loss carryforwards from prior years, if any) are made at least annually. Distributions are declared separately for each class of shares. Shareholders may reinvest income and capital gain distributions in additional shares of the same class of the Fund at the net asset value as of the reinvestment date or, at the election of the shareholder, receive distributions in cash. The Fund distinguishes between distributions on a tax basis and a financial reporting basis. Accounting principles generally accepted in the United States of America require that only distributions in excess of tax basis earnings and profits be reported in the financial statements as a return of capital. Permanent differences between book and tax accounting relating to distributions are reclassified to paid-in capital. For tax purposes, distributions from short-term capital gains are considered to be from ordinary income.
The tax character of distributions declared for the years ended October 31, 2012 and October 31, 2011 was as follows:
| | | | | | | | |
| | | Year Ended October 31, | |
| | | 2012 | | | 2011 | |
| | |
Distributions declared from: | | | | | | | | |
Ordinary income | | $ | 32,852,403 | | | $ | 36,875,438 | |
During the year ended October 31, 2012, accumulated undistributed net investment income was increased by $1,406,674 and accumulated net realized loss was increased by $1,406,674 due to differences between book and tax accounting, primarily for swap contracts, premium amortization, investments in partnerships, paydown gain (loss) and defaulted bond interest. These reclassifications had no effect on the net assets or net assets value per share of the Fund.
As of October 31, 2012, the components of distributable earnings (accumulated losses) and unrealized appreciation (depreciation) on a tax basis were as follows:
| | | | |
Undistributed ordinary income | | $ | 2,318,325 | |
Capital loss carryforward | | $ | (93,299,806 | ) |
Net unrealized appreciation | | $ | 4,155,238 | |
Other temporary differences | | $ | (830,810 | ) |
The differences between components of distributable earnings (accumulated losses) on a tax basis and the amounts reflected in the Statement of Assets and Liabilities are primarily due to wash sales, swap contracts, premium amortization, the timing of recognizing distributions to shareholders, defaulted bond interest and partnership allocations.
3 Transactions with Affiliates
Eaton Vance Management (EVM) serves as the administrator to the Fund, but receives no compensation. The Portfolio has engaged Boston Management and Research (BMR), a subsidiary of EVM, to render investment advisory services. See Note 2 of the Portfolio’s Notes to Financial Statements which are included elsewhere in this report. EVM serves as the sub-transfer agent of the Fund and receives from the transfer agent an aggregate fee based upon the actual expenses incurred by EVM in the performance of these services. For the year ended October 31, 2012, EVM earned $23,944 in sub-transfer agent fees. The Fund was informed that Eaton Vance Distributors, Inc. (EVD), an affiliate of EVM and the Fund’s principal underwriter, received $79,901 as its portion of the sales charge on sales of Class A shares for the year ended October 31, 2012. EVD also received distribution and service fees from Class A, Class B and Class C shares (see Note 4) and contingent deferred sales charges (see Note 5).
Eaton Vance
High Income Opportunities Fund
October 31, 2012
Notes to Financial Statements — continued
Trustees and officers of the Fund who are members of EVM’s or BMR’s organizations receive remuneration for their services to the Fund out of the investment adviser fee. Certain officers and Trustees of the Fund and the Portfolio are officers of the above organizations.
4 Distribution Plans
The Fund has in effect a distribution plan for Class A shares (Class A Plan) pursuant to Rule 12b-1 under the 1940 Act. Pursuant to the Class A Plan, the Fund pays EVD a distribution and service fee of 0.25% per annum of its average daily net assets attributable to Class A shares for distribution services and facilities provided to the Fund by EVD, as well as for personal services and/or the maintenance of shareholder accounts. Distribution and service fees paid or accrued to EVD for the year ended October 31, 2012 amounted to $621,316 for Class A shares. The Fund also has in effect distribution plans for Class B shares (Class B Plan) and Class C shares (Class C Plan) pursuant to Rule 12b-1 under the 1940 Act. Pursuant to the Class B and Class C Plans, the Fund pays EVD amounts equal to 0.75% per annum of its average daily net assets attributable to Class B and Class C shares for providing ongoing distribution services and facilities to the Fund. The Fund will automatically discontinue payments to EVD during any period in which there are no outstanding Uncovered Distribution Charges, which are equivalent to the sum of (i) 5% and 6.25% of the aggregate amount received by the Fund for Class B and Class C shares sold, respectively, plus (ii) interest calculated by applying the rate of 1% over the prevailing prime rate to the outstanding balance of Uncovered Distribution Charges of EVD of each respective class, reduced by the aggregate amount of contingent deferred sales charges (see Note 5) and amounts theretofore paid or payable to EVD by each respective class. For the year ended October 31, 2012, the Fund paid or accrued to EVD $269,641 and $917,579 for Class B and Class C shares, respectively, representing 0.75% of the average daily net assets of Class B and Class C shares. At October 31, 2012, the amounts of Uncovered Distribution Charges of EVD calculated under the Class B and Class C Plans were approximately $25,319,000 and $55,301,000, respectively.
Pursuant to the Class B and Class C Plans, the Fund also makes payments of service fees to EVD, financial intermediaries and other persons in amounts equal to 0.25% per annum of its average daily net assets attributable to that class. Service fees paid or accrued are for personal services and/or the maintenance of shareholder accounts. They are separate and distinct from the sales commissions and distribution fees payable to EVD and, as such, are not subject to automatic discontinuance when there are no outstanding Uncovered Distribution Charges of EVD. Service fees paid or accrued for the year ended October 31, 2012 amounted to $89,880 and $305,860 for Class B and Class C shares, respectively.
5 Contingent Deferred Sales Charges
A contingent deferred sales charge (CDSC) generally is imposed on redemptions of Class B shares made within six years of purchase and on redemptions of Class C shares made within one year of purchase. Class A shares may be subject to a 1% CDSC if redeemed within 18 months of purchase (depending on the circumstances of purchase). Generally, the CDSC is based upon the lower of the net asset value at date of redemption or date of purchase. No charge is levied on shares acquired by reinvestment of dividends or capital gain distributions. The CDSC for Class B shares is imposed at declining rates that begin at 5% in the case of redemptions in the first and second year after purchase, declining one percentage point each subsequent year. Class C shares are subject to a 1% CDSC if redeemed within one year of purchase. No CDSC is levied on shares which have been sold to EVM or its affiliates or to their respective employees or clients and may be waived under certain other limited conditions. CDSCs received on Class B and Class C redemptions are paid to EVD to reduce the amount of Uncovered Distribution Charges calculated under the Fund’s Class B and Class C Plans. CDSCs received on Class B and Class C redemptions when no Uncovered Distribution Charges exist are credited to the Fund. For the year ended October 31, 2012, the Fund was informed that EVD received approximately $1,000, $49,000 and $7,000 of CDSCs paid by Class A, Class B and Class C shareholders, respectively.
6 Investment Transactions
For the year ended October 31, 2012, increases and decreases in the Fund’s investment in the Portfolio aggregated $23,262,115 and $69,212,131, respectively.
7 Shares of Beneficial Interest
The Fund’s Declaration of Trust permits the Trustees to issue an unlimited number of full and fractional shares of beneficial interest (without par value). Such shares may be issued in a number of different series (such as the Fund) and classes. Transactions in Fund shares were as follows:
| | | | | | | | |
| | | Year Ended October 31, | |
| Class A | | 2012 | | | 2011 | |
| | |
Sales | | | 9,082,559 | | | | 7,071,920 | |
Issued to shareholders electing to receive payments of distributions in Fund shares | | | 3,046,077 | | | | 2,876,910 | |
Redemptions | | | (11,675,224 | ) | | | (17,782,503 | ) |
Exchange from Class B shares | | | 1,888,923 | | | | 3,134,854 | |
| | |
Net increase (decrease) | | | 2,342,335 | | | | (4,698,819 | ) |
Eaton Vance
High Income Opportunities Fund
October 31, 2012
Notes to Financial Statements — continued
| | | | | | | | |
| | | Year Ended October 31, | |
| Class B | | 2012 | | | 2011 | |
| | |
Sales | | | 406,148 | | | | 1,449,362 | |
Issued to shareholders electing to receive payments of distributions in Fund shares | | | 407,510 | | | | 463,285 | |
Redemptions | | | (1,550,820 | ) | | | (2,281,816 | ) |
Exchange to Class A shares | | | (1,885,762 | ) | | | (3,128,458 | ) |
| | |
Net decrease | | | (2,622,924 | ) | | | (3,497,627 | ) |
| | |
| | | | | | | | |
| | | Year Ended October 31, | |
| Class C | | 2012 | | | 2011 | |
| | |
Sales | | | 3,665,647 | | | | 4,443,358 | |
Issued to shareholders electing to receive payments of distributions in Fund shares | | | 1,212,546 | | | | 1,116,773 | |
Redemptions | | | (5,510,279 | ) | | | (5,911,865 | ) |
| | |
Net decrease | | | (632,086 | ) | | | (351,734 | ) |
| | |
| | | | | | | | |
| | | Year Ended October 31, | |
| Class I | | 2012 | | | 2011 | |
| | |
Sales | | | 3,766,084 | | | | 7,428,164 | |
Issued to shareholders electing to receive payments of distributions in Fund shares | | | 242,897 | | | | 145,854 | |
Redemptions | | | (5,293,124 | ) | | | (3,836,757 | ) |
| | |
Net increase (decrease) | | | (1,284,143 | ) | | | 3,737,261 | |
For the year ended October 31, 2011, the Fund received $11,566 in redemption fees.
At October 31, 2012, pooled income funds (established and maintained by a public charity) managed by EVM owned 10% of the value of the outstanding shares of the Fund.
Eaton Vance
High Income Opportunities Fund
October 31, 2012
Report of Independent Registered Public Accounting Firm
To the Trustees of Eaton Vance Mutual Funds Trust and Shareholders of Eaton Vance High Income Opportunities Fund:
We have audited the accompanying statement of assets and liabilities of Eaton Vance High Income Opportunities Fund (“the Fund”) (one of the funds constituting Eaton Vance Mutual Funds Trust) as of October 31, 2012, and the related statement of operations for the year then ended, the statements of changes in net assets for each of the two years in the period then ended, and the financial highlights for each of the five years in the period then ended. These financial statements and financial highlights are the responsibility of the Fund’s management. Our responsibility is to express an opinion on these financial statements and financial highlights based on our audits.
We conducted our audits in accordance with the standards of the Public Company Accounting Oversight Board (United States). Those standards require that we plan and perform the audit to obtain reasonable assurance about whether the financial statements and financial highlights are free of material misstatement. The Fund is not required to have, nor were we engaged to perform, an audit of its internal control over financial reporting. Our audits included consideration of internal control over financial reporting as a basis for designing audit procedures that are appropriate in the circumstances, but not for the purpose of expressing an opinion on the effectiveness of the Fund’s internal control over financial reporting. Accordingly, we express no such opinion. An audit also includes examining, on a test basis, evidence supporting the amounts and disclosures in the financial statements, assessing the accounting principles used and significant estimates made by management, as well as evaluating the overall financial statement presentation. We believe that our audits provide a reasonable basis for our opinion.
In our opinion, such financial statements and financial highlights referred to above present fairly, in all material respects, the financial position of Eaton Vance High Income Opportunities Fund as of October 31, 2012, the results of its operations for the year then ended, the changes in its net assets for each of the two years in the period then ended, and the financial highlights for each of the five years in the period then ended, in conformity with accounting principles generally accepted in the United States of America.
DELOITTE & TOUCHE LLP
Boston, Massachusetts
December 20, 2012
Eaton Vance
High Income Opportunities Fund
October 31, 2012
Federal Tax Information (Unaudited)
The Form 1099-DIV you receive in January 2013 will show the tax status of all distributions paid to your account in calendar year 2012. Shareholders are advised to consult their own tax adviser with respect to the tax consequences of their investment in the Fund.
High Income Opportunities Portfolio
October 31, 2012
Portfolio of Investments
| | | | | | | | |
| Corporate Bonds & Notes — 84.1% | |
| | |
| | | | | | | | |
| Security | | Principal
Amount
(000’s omitted) | | | Value | |
| | | | | | | | |
|
Aerospace — 0.4% | |
Alliant Techsystems, Inc., Sr. Sub. Notes, 6.875%, 9/15/20 | | $ | 690 | | | $ | 759,000 | |
Huntington Ingalls Industries, Inc., Sr. Notes, 6.875%, 3/15/18 | | | 770 | | | | 835,450 | |
Huntington Ingalls Industries, Inc., Sr. Notes, 7.125%, 3/15/21 | | | 80 | | | | 86,400 | |
TransDigm, Inc., Sr. Sub. Notes, 7.75%, 12/15/18 | | | 2,230 | | | | 2,469,725 | |
| | | | | | | | | |
| | | | | | $ | 4,150,575 | |
| | | | | | | | | |
|
Automotive & Auto Parts — 2.3% | |
Affinia Group, Inc., Sr. Notes, 10.75%, 8/15/16(1) | | $ | 1,132 | | | $ | 1,228,220 | |
American Axle & Manufacturing, Inc., Sr. Notes, 9.25%, 1/15/17(1) | | | 3,072 | | | | 3,452,160 | |
Chrysler Group, LLC, 8.25%, 6/15/21 | | | 1,815 | | | | 1,948,856 | |
Continental Rubber of America Corp., Sr. Notes, 4.50%, 9/15/19(1) | | | 2,920 | | | | 2,990,080 | |
Ford Motor Credit Co., LLC, Sr. Notes, 8.125%, 1/15/20 | | | 1,380 | | | | 1,757,887 | |
Ford Motor Credit Co., LLC, Sr. Notes, 12.00%, 5/15/15 | | | 1,305 | | | | 1,618,200 | |
General Motors Financial Co., Inc., Sr. Notes, 4.75%, 8/15/17(1) | | | 1,575 | | | | 1,613,581 | |
General Motors Financial Co., Inc., Sr. Notes, 6.75%, 6/1/18 | | | 1,375 | | | | 1,525,538 | |
Meritor, Inc., Sr. Notes, 10.625%, 3/15/18 | | | 1,005 | | | | 1,018,819 | |
Tower Automotive Holdings USA, LLC/TA Holding Finance, Inc., Sr. Notes, 10.625%, 9/1/17(1) | | | 2,706 | | | | 2,952,922 | |
Visteon Corp., Sr. Notes, 6.75%, 4/15/19 | | | 1,345 | | | | 1,390,394 | |
| | | | | | | | | |
| | | | | | $ | 21,496,657 | |
| | | | | | | | | |
|
Banks and Thrifts — 1.7% | |
Ally Financial, Inc., Sr. Notes, 0.00%, 6/15/15 | | $ | 1,710 | | | $ | 1,547,550 | |
Ally Financial, Inc., Sr. Notes, 2.618%, 12/1/14(2) | | | 720 | | | | 711,891 | |
Ally Financial, Inc., Sr. Notes, 4.625%, 6/26/15 | | | 3,610 | | | | 3,752,386 | |
Ally Financial, Inc., Sr. Notes, 5.50%, 2/15/17 | | | 1,200 | | | | 1,270,583 | |
Ally Financial, Inc., Sr. Notes, 6.25%, 12/1/17 | | | 4,075 | | | | 4,488,865 | |
Ally Financial, Inc., Sr. Notes, 8.00%, 11/1/31 | | | 3,955 | | | | 4,726,225 | |
| | | | | | | | | |
| | | | | | $ | 16,497,500 | |
| | | | | | | | | |
|
Broadcasting — 0.4% | |
AMC Networks, Inc., Sr. Notes, 7.75%, 7/15/21 | | $ | 1,100 | | | $ | 1,251,250 | |
Crown Media Holdings, Inc., Sr. Notes, 10.50%, 7/15/19 | | | 945 | | | | 1,070,213 | |
Starz, LLC/Starz Finance Corp., Sr. Notes, 5.00%, 9/15/19(1) | | | 1,475 | | | | 1,515,562 | |
| | | | | | | | | |
| | | | | | $ | 3,837,025 | |
| | | | | | | | | |
| | | | | | | | |
| Security | | Principal
Amount
(000’s omitted) | | | Value | |
| | | | | | | | |
|
Building Materials — 1.1% | |
HD Supply, Inc., Sr. Notes, 8.125%, 4/15/19(1) | | $ | 815 | | | $ | 898,538 | |
Interface, Inc., Sr. Notes, 7.625%, 12/1/18 | | | 1,265 | | | | 1,374,106 | |
Isabelle Acquisition Sub, Inc., Sr. Notes, 10.00%, 11/15/18(1)(3) | | | 2,930 | | | | 3,168,063 | |
Nortek, Inc., Sr. Notes, 8.50%, 4/15/21(1) | | | 2,240 | | | | 2,408,000 | |
Nortek, Inc., Sr. Notes, 8.50%, 4/15/21 | | | 765 | | | | 826,200 | |
Nortek, Inc., Sr. Notes, 10.00%, 12/1/18 | | | 1,815 | | | | 2,021,456 | |
| | | | | | | | | |
| | | | | | $ | 10,696,363 | |
| | | | | | | | | |
|
Cable / Satellite TV — 2.3% | |
Cablevision Systems Corp., Sr. Notes, 7.75%, 4/15/18 | | $ | 790 | | | $ | 881,838 | |
CCO Holdings, LLC/CCO Capital Corp., Sr. Notes, 5.25%, 9/30/22 | | | 4,185 | | | | 4,226,850 | |
CCO Holdings, LLC/CCO Capital Corp., Sr. Notes, 7.00%, 1/15/19 | | | 420 | | | | 453,600 | |
CCO Holdings, LLC/CCO Capital Corp., Sr. Notes, 7.875%, 4/30/18 | | | 1,180 | | | | 1,280,300 | |
CCO Holdings, LLC/CCO Capital Corp., Sr. Notes, 8.125%, 4/30/20 | | | 125 | | | | 141,250 | |
Cequel Communications Escrow I, LLC/Cequel Communications Escrow Capital Corp., Sr. Notes,
6.375%, 9/15/20(1) | | | 1,735 | | | | 1,765,362 | |
CSC Holdings, LLC, Sr. Notes, 6.75%, 11/15/21(1) | | | 7,520 | | | | 8,403,600 | |
UPCB Finance V, Ltd., Sr. Notes, 7.25%, 11/15/21(1) | | | 170 | | | | 187,850 | |
UPCB Finance VI, Ltd., Sr. Notes, 6.875%, 1/15/22(1) | | | 1,875 | | | | 2,015,625 | |
Virgin Media Finance PLC, Sr. Notes, 4.875%, 2/15/22 | | | 1,935 | | | | 1,964,025 | |
| | | | | | | | | |
| | | | | | $ | 21,320,300 | |
| | | | | | | | | |
|
Capital Goods — 1.2% | |
American Railcar Industry, Sr. Notes, 7.50%, 3/1/14 | | $ | 1,031 | | | $ | 1,046,465 | |
Amsted Industries, Inc., Sr. Notes, 8.125%, 3/15/18(1) | | | 2,890 | | | | 3,121,200 | |
Belden, Inc., Sr. Sub. Notes, 5.50%, 9/1/22(1) | | | 1,050 | | | | 1,073,625 | |
CNH Capital, LLC, Sr. Notes, 6.25%, 11/1/16(1) | | | 1,910 | | | | 2,072,350 | |
General Cable Corp., Sr. Notes, 5.75%, 10/1/22(1) | | | 1,695 | | | | 1,733,137 | |
Manitowoc Co., Inc. (The), Sr. Notes, 5.875%, 10/15/22 | | | 1,455 | | | | 1,462,275 | |
SPL Logistics Escrow, LLC/SPL Logistics Finance Corp., Sr. Notes, 8.875%, 8/1/20(1) | | | 1,015 | | | | 1,083,513 | |
| | | | | | | | | |
| | | | | | $ | 11,592,565 | |
| | | | | | | | | |
|
Chemicals — 3.0% | |
Ashland, Inc., Sr. Notes, 4.75%, 8/15/22(1) | | $ | 745 | | | $ | 763,625 | |
Celanese US Holdings, LLC, Sr. Notes, 5.875%, 6/15/21 | | | 960 | | | | 1,070,400 | |
Celanese US Holdings, LLC, Sr. Notes, 6.625%, 10/15/18 | | | 805 | | | | 881,475 | |
Chemtura Corp., Sr. Notes, 7.875%, 9/1/18 | | | 1,855 | | | | 1,952,388 | |
Ineos Finance PLC, Sr. Notes, 8.375%, 2/15/19(1) | | | 3,690 | | | | 3,888,337 | |
| | | | |
| | 20 | | See Notes to Financial Statements. |
High Income Opportunities Portfolio
October 31, 2012
Portfolio of Investments — continued
| | | | | | | | |
| Security | | Principal
Amount
(000’s omitted) | | | Value | |
| | | | | | | | |
|
Chemicals (continued) | |
Kraton Polymers, LLC, Sr. Notes, 6.75%, 3/1/19 | | $ | 905 | | | $ | 936,675 | |
LyondellBasell Industries N.V., Sr. Notes, 5.00%, 4/15/19 | | | 4,740 | | | | 5,154,750 | |
LyondellBasell Industries N.V., Sr. Notes, 5.75%, 4/15/24 | | | 4,125 | | | | 4,795,312 | |
NOVA Chemicals Corp., Sr. Notes, 8.375%, 11/1/16 | | | 1,610 | | | | 1,781,063 | |
PolyOne Corp., Sr. Notes, 7.375%, 9/15/20 | | | 535 | | | | 579,138 | |
Polypore International, Inc., Sr. Notes, 7.50%, 11/15/17 | | | 660 | | | | 716,100 | |
Rockwood Specialties Group, Inc., Sr. Notes, 4.625%, 10/15/20 | | | 2,825 | | | | 2,920,344 | |
Taminco Global Chemical Corp., Sr. Sub. Notes, 9.75%, 3/31/20(1) | | | 515 | | | | 561,350 | |
Tronox Finance, LLC, Sr. Notes, 6.375%, 8/15/20(1) | | | 2,345 | | | | 2,347,931 | |
| | | | | | | | | |
| | | | | | $ | 28,348,888 | |
| | | | | | | | | |
|
Consumer Products — 1.4% | |
Libbey Glass, Inc., Sr. Notes, 6.875%, 5/15/20(1) | | $ | 765 | | | $ | 818,550 | |
Mead Products, LLC/ACCO Brands Corp., Sr. Notes, 6.75%, 4/30/20(1) | | | 2,745 | | | | 2,817,056 | |
Radio Systems Corp., Sr. Notes, 8.375%, 11/1/19(1) | | | 1,365 | | | | 1,395,713 | |
Revlon Consumer Products Corp., 9.75%, 11/15/15 | | | 3,560 | | | | 3,769,150 | |
Scotts Miracle-Gro Co. (The), Sr. Notes, 7.25%, 1/15/18 | | | 550 | | | | 596,063 | |
Serta Simmons Holdings, LLC, Sr. Notes, 8.125%, 10/1/20(1) | | | 1,750 | | | | 1,774,062 | |
Spectrum Brands, Inc., Sr. Notes, 9.50%, 6/15/18(1) | | | 1,015 | | | | 1,152,025 | |
Wolverine World Wide, Inc., Sr. Notes, 6.125%, 10/15/20(1) | | | 900 | | | | 941,625 | |
| | | | | | | | | |
| | | | | | $ | 13,264,244 | |
| | | | | | | | | |
|
Containers — 1.8% | |
Ball Corp., Sr. Notes, 5.00%, 3/15/22 | | $ | 1,165 | | | $ | 1,234,900 | |
BOE Merger Corp., Sr. Notes, 9.50%, 11/1/17(1)(3) | | | 1,400 | | | | 1,403,500 | |
BWAY Holding Co., Sr. Notes, 10.00%, 6/15/18 | | | 550 | | | | 613,250 | |
Reynolds Group Holdings, Inc., Sr. Notes, 6.875%, 2/15/21 | | | 3,905 | | | | 4,168,587 | |
Reynolds Group Holdings, Inc., Sr. Notes, 7.125%, 4/15/19 | | | 2,290 | | | | 2,450,300 | |
Reynolds Group Holdings, Inc., Sr. Notes, 7.875%, 8/15/19 | | | 1,145 | | | | 1,248,050 | |
Reynolds Group Holdings, Inc., Sr. Notes, 9.00%, 4/15/19 | | | 815 | | | | 829,263 | |
Reynolds Group Holdings, Inc., Sr. Notes, 9.875%, 8/15/19 | | | 1,850 | | | | 1,947,125 | |
Sealed Air Corp., Sr. Notes, 8.375%, 9/15/21(1) | | | 2,595 | | | | 2,867,475 | |
| | | | | | | | | |
| | | $ | 16,762,450 | |
| | | | | | | | | |
| | | | | | | | |
| Security | | Principal
Amount
(000’s omitted) | | | Value | |
| | | | | | | | |
|
Diversified Financial Services — 2.6% | |
Alliance Data Systems Corp., Sr. Notes, 6.375%, 4/1/20(1) | | $ | 1,155 | | | $ | 1,231,519 | |
AWAS Aviation Capital, Ltd., Sr. Notes, 7.00%, 10/17/16(1) | | | 2,105 | | | | 2,252,179 | |
CIT Group, Inc., Sr. Notes, 5.00%, 8/15/22 | | | 455 | | | | 473,298 | |
CIT Group, Inc., Sr. Notes, 5.25%, 3/15/18 | | | 605 | | | | 645,838 | |
CIT Group, Inc., Sr. Notes, 5.375%, 5/15/20 | | | 230 | | | | 246,675 | |
CIT Group, Inc., Sr. Notes, 5.50%, 2/15/19(1) | | | 1,020 | | | | 1,092,675 | |
E*TRADE Financial Corp., Sr. Notes, 12.50%, 11/30/17 | | | 3,740 | | | | 4,254,250 | |
International Lease Finance Corp., Sr. Notes, 6.25%, 5/15/19 | | | 1,735 | | | | 1,877,367 | |
International Lease Finance Corp., Sr. Notes, 8.25%, 12/15/20 | | | 1,565 | | | | 1,848,656 | |
International Lease Finance Corp., Sr. Notes, 8.625%, 1/15/22 | | | 1,815 | | | | 2,202,956 | |
International Lease Finance Corp., Sr. Notes, 8.75%, 3/15/17 | | | 1,230 | | | | 1,442,360 | |
Neuberger Berman Group, LLC/Neuberger Berman Finance Corp., Sr. Notes, 5.625%, 3/15/20(1) | | | 4,090 | | | | 4,314,950 | |
Nuveen Investments, Inc., Sr. Notes, 9.50%, 10/15/20(1) | | | 2,855 | | | | 2,890,687 | |
| | | | | | | | | |
| | | | | | $ | 24,773,410 | |
| | | | | | | | | |
|
Diversified Media — 3.1% | |
Catalina Marketing Corp., Sr. Notes, 10.50%, 10/1/15(1)(3) | | $ | 4,135 | | | $ | 4,186,687 | |
Catalina Marketing Corp., Sr. Sub. Notes, 11.625%, 10/1/17(1) | | | 3,090 | | | | 3,012,750 | |
Clear Channel Worldwide Holdings, Inc., Sr. Notes, 9.25%, 12/15/17 | | | 1,515 | | | | 1,628,625 | |
Clear Channel Worldwide Holdings, Inc., Series A, Sr. Sub. Notes, 7.625%, 3/15/20 | | | 445 | | | | 421,638 | |
LBI Media, Inc., Sr. Notes, 9.25%, 4/15/19(1) | | | 1,860 | | | | 1,776,300 | |
LBI Media, Inc., Sr. Notes, 11.00%, 10/15/13 | | | 1,080 | | | | 297,000 | |
Logo Merger Sub Corp., Sr. Notes, 8.375%, 10/15/20(1) | | | 1,845 | | | | 1,881,900 | |
MDC Partners, Inc., Sr. Notes, 11.00%, 11/1/16 | | | 2,755 | | | | 3,016,725 | |
National CineMedia, LLC, Sr. Notes, 6.00%, 4/15/22(1) | | | 1,215 | | | | 1,287,900 | |
Nielsen Finance, LLC, Sr. Notes, 4.50%, 10/1/20(1) | | | 2,825 | | | | 2,825,000 | |
Nielsen Finance, LLC, Sr. Notes, 11.625%, 2/1/14 | | | 78 | | | | 88,140 | |
WMG Acquisition Corp., Sr. Notes, 6.00%, 1/15/21(1) | | | 1,140 | | | | 1,148,550 | |
WMG Acquisition Corp., Sr. Notes, 9.50%, 6/15/16 | | | 2,990 | | | | 3,307,687 | |
WMG Acquisition Corp., Sr. Notes, 9.50%, 6/15/16 | | | 600 | | | | 662,250 | |
WMG Acquisition Corp., Sr. Notes, 11.50%, 10/1/18 | | | 3,710 | | | | 4,201,575 | |
| | | | | | | | | |
| | | $ | 29,742,727 | |
| | | | | | | | | |
| | | | |
| | 21 | | See Notes to Financial Statements. |
High Income Opportunities Portfolio
October 31, 2012
Portfolio of Investments — continued
| | | | | | | | |
| Security | | Principal
Amount
(000’s omitted) | | | Value | |
| | | | | | | | |
|
Energy — 13.0% | |
AmeriGas Finance LLC/AmeriGas Finance Corp., Sr. Notes, 6.75%, 5/20/20 | | $ | 2,405 | | | $ | 2,597,400 | |
AmeriGas Finance LLC/AmeriGas Finance Corp., Sr. Notes, 7.00%, 5/20/22 | | | 3,005 | | | | 3,279,206 | |
AmeriGas Partners LP/AmeriGas Finance Corp., Sr. Notes,
6.25%, 8/20/19 | | | 1,260 | | | | 1,329,300 | |
Atwood Oceanics, Inc., Sr. Notes, 6.50%, 2/1/20 | | | 1,205 | | | | 1,301,400 | |
Berry Petroleum Co., Sr. Notes, 6.375%, 9/15/22 | | | 3,185 | | | | 3,336,287 | |
Bristow Group, Inc., Sr. Notes, 6.25%, 10/15/22 | | | 1,775 | | | | 1,863,750 | |
Calfrac Holdings, LP, Sr. Notes, 7.50%, 12/1/20(1) | | | 825 | | | | 820,875 | |
Chesapeake Energy Corp., Sr. Notes, 6.125%, 2/15/21 | | | 1,455 | | | | 1,480,463 | |
Chesapeake Oilfield Operating, LLC/Chesapeake Oilfield Finance, Inc., Sr. Notes, 6.625%, 11/15/19(1) | | | 1,025 | | | | 981,438 | |
Concho Resources, Inc., Sr. Notes, 5.50%, 4/1/23 | | | 1,765 | | | | 1,857,662 | |
Concho Resources, Inc., Sr. Notes, 6.50%, 1/15/22 | | | 1,340 | | | | 1,477,350 | |
Concho Resources, Inc., Sr. Notes, 7.00%, 1/15/21 | | | 1,585 | | | | 1,767,275 | |
Continental Resources, Inc., Sr. Notes, 5.00%, 9/15/22(1) | | | 6,160 | | | | 6,506,500 | |
Continental Resources, Inc., Sr. Notes, 5.00%, 9/15/22 | | | 1,940 | | | | 2,051,550 | |
Continental Resources, Inc., Sr. Notes, 7.125%, 4/1/21 | | | 670 | | | | 757,100 | |
CVR Refining, LLC/Coffeyville Finance, Inc., Sr. Notes, 6.50%, 11/1/22(1) | | | 2,775 | | | | 2,726,437 | |
Denbury Resources, Inc., Sr. Sub. Notes, 8.25%, 2/15/20 | | | 1,639 | | | | 1,864,362 | |
Denbury Resources, Inc., Sr. Sub. Notes, 9.75%, 3/1/16 | | | 3,050 | | | | 3,263,500 | |
EP Energy, LLC/EP Energy Finance, Inc., Sr. Notes, 6.875%, 5/1/19(1) | | | 3,950 | | | | 4,285,750 | |
EP Energy, LLC/EP Energy Finance, Inc., Sr. Notes, 9.375%, 5/1/20(1) | | | 2,880 | | | | 3,196,800 | |
EP Energy, LLC/Everest Acquisition Finance, Inc.,
Sr. Notes, 7.75%, 9/1/22(1) | | | 795 | | | | 826,800 | |
EPL Oil & Gas, Inc., Sr. Notes, 8.25%, 2/15/18(1) | | | 1,690 | | | | 1,681,550 | |
Forest Oil Corp., Sr. Notes, 7.50%, 9/15/20(1) | | | 2,255 | | | | 2,311,375 | |
Frontier Oil Corp., Sr. Notes, 6.875%, 11/15/18 | | | 530 | | | | 567,100 | |
FTS International Services, LLC/FTS International Bonds, Inc., Sr. Notes, 8.125%, 11/15/18(1) | | | 2,908 | | | | 3,053,400 | |
Halcon Resources Corp., Sr. Notes, 8.875%, 5/15/21(1) | | | 1,125 | | | | 1,143,281 | |
Halcon Resources Corp., Sr. Notes, 9.75%, 7/15/20(1) | | | 2,155 | | | | 2,284,300 | |
Harvest Operations Corp., Sr. Notes, 6.875%, 10/1/17 | | | 800 | | | | 880,000 | |
Holly Corp., Sr. Notes, 9.875%, 6/15/17 | | | 1,710 | | | | 1,872,450 | |
Holly Energy Partners LP/Holly Energy Finance Corp.,
Sr. Notes, 6.50%, 3/1/20(1) | | | 575 | | | | 606,625 | |
Kodiak Oil & Gas Corp., Sr. Notes, 8.125%, 12/1/19(1) | | | 3,420 | | | | 3,744,900 | |
Laredo Petroleum, Inc., Sr. Notes, 7.375%, 5/1/22 | | | 2,030 | | | | 2,222,850 | |
MEG Energy Corp., Sr. Notes, 6.375%, 1/30/23(1) | | | 2,190 | | | | 2,354,250 | |
Newfield Exploration Co., Sr. Notes, 5.625%, 7/1/24 | | | 2,585 | | | | 2,765,950 | |
Oasis Petroleum, Inc., Sr. Notes, 6.50%, 11/1/21 | | | 890 | | | | 945,625 | |
Oasis Petroleum, Inc., Sr. Notes, 6.875%, 1/15/23 | | | 2,920 | | | | 3,109,800 | |
| | | | | | | | |
| Security | | Principal
Amount
(000’s omitted) | | | Value | |
| | | | | | | | |
|
Energy (continued) | |
Offshore Group Investment, Ltd., Sr. Notes, 7.50%, 11/1/19(1) | | $ | 2,240 | | | $ | 2,217,600 | |
OGX Austria GmbH, Sr. Notes, 8.50%, 6/1/18(1) | | | 1,785 | | | | 1,566,338 | |
Oil States International, Inc., Sr. Notes, 6.50%, 6/1/19 | | | 1,665 | | | | 1,777,388 | |
PBF Holding Co., LLC/PBF Finance Corp., Sr. Notes, 8.25%, 2/15/20(1) | | | 115 | | | | 121,325 | |
PetroBakken Energy, Ltd., Sr. Notes, 8.625%, 2/1/20(1) | | | 1,640 | | | | 1,681,000 | |
Petroleum Development Corp., Sr. Notes, 12.00%, 2/15/18 | | | 1,570 | | | | 1,717,148 | |
Plains Exploration & Production Co., Sr. Notes, 6.875%, 2/15/23 | | | 4,495 | | | | 4,495,000 | |
Precision Drilling Corp., Sr. Notes, 6.50%, 12/15/21 | | | 2,210 | | | | 2,348,125 | |
Precision Drilling Corp., Sr. Notes, 6.625%, 11/15/20 | | | 1,000 | | | | 1,075,000 | |
QEP Resources, Inc., Sr. Notes, 5.25%, 5/1/23 | | | 1,685 | | | | 1,765,038 | |
Range Resources Corp., Sr. Sub. Notes, 6.75%, 8/1/20 | | | 1,580 | | | | 1,749,850 | |
Rosetta Resources, Inc., Sr. Notes, 9.50%, 4/15/18 | | | 1,015 | | | | 1,125,381 | |
Sabine Pass LNG, LP, Sr. Notes, 6.50%, 11/1/20(1) | | | 2,260 | | | | 2,313,675 | |
Seadrill, Ltd., Sr. Notes, 5.625%, 9/15/17(1) | | | 5,920 | | | | 5,949,600 | |
SESI, LLC, Sr. Notes, 6.375%, 5/1/19 | | | 3,445 | | | | 3,703,375 | |
SESI, LLC, Sr. Notes, 6.875%, 6/1/14 | | | 350 | | | | 350,655 | |
SM Energy Co., Sr. Notes, 6.50%, 1/1/23 | | | 1,685 | | | | 1,769,250 | |
Tesoro Corp., Sr. Notes, 5.375%, 10/1/22 | | | 2,255 | | | | 2,362,112 | |
Venoco, Inc., Sr. Notes, 8.875%, 2/15/19 | | | 3,745 | | | | 3,314,325 | |
Venoco, Inc., Sr. Notes, 11.50%, 10/1/17 | | | 540 | | | | 548,100 | |
WPX Energy, Inc., Sr. Notes, 5.25%, 1/15/17 | | | 715 | | | | 766,838 | |
WPX Energy, Inc., Sr. Notes, 6.00%, 1/15/22 | | | 3,160 | | | | 3,397,000 | |
| | | | | | | | | |
| | | | | | $ | 123,228,784 | |
| | | | | | | | | |
|
Entertainment / Film — 0.5% | |
Cinemark USA, Inc., Sr. Sub. Notes, 7.375%, 6/15/21 | | $ | 695 | | | $ | 769,713 | |
NAI Entertainment Holdings, LLC, Sr. Notes, 8.25%, 12/15/17(1) | | | 743 | | | | 830,302 | |
Regal Cinemas Corp., Sr. Notes, 8.625%, 7/15/19 | | | 545 | | | | 602,225 | |
Regal Entertainment Group, Sr. Notes, 9.125%, 8/15/18 | | | 2,190 | | | | 2,441,850 | |
| | | | | | | | | |
| | | $ | 4,644,090 | |
| | | | | | | | | |
|
Environmental — 0.5% | |
ADS Waste Holdings, Inc., Sr. Notes, 8.25%, 10/1/20(1) | | $ | 1,145 | | | $ | 1,187,937 | |
Casella Waste Systems, Inc., Sr. Sub. Notes, 7.75%, 2/15/19 | | | 195 | | | | 192,075 | |
Clean Harbors, Inc., Sr. Notes, 5.25%, 8/1/20(1) | | | 1,085 | | | | 1,117,550 | |
Covanta Holding Corp., Sr. Notes, 6.375%, 10/1/22 | | | 1,970 | | | | 2,152,761 | |
| | | | | | | | | |
| | | | | | $ | 4,650,323 | |
| | | | | | | | | |
| | | | |
| | 22 | | See Notes to Financial Statements. |
High Income Opportunities Portfolio
October 31, 2012
Portfolio of Investments — continued
| | | | | | | | |
| Security | | Principal
Amount
(000’s omitted) | | | Value | |
| | | | | | | | |
|
Food / Beverage / Tobacco — 2.0% | |
Alphabet Holding Co., Inc., Sr. Notes, 7.75%, 11/1/17(1)(3) | | $ | 2,810 | | | $ | 2,841,612 | |
ASG Consolidated, LLC/ASG Finance, Inc., Sr. Notes, 15.00%, 5/15/17(1)(3) | | | 2,157 | | | | 1,754,166 | |
ASG Consolidated, LLC/ASG Finance, Inc., Sr. Sub. Notes,
10.75%, 5/15/16(1) | | | 4,800 | | | | 4,908,000 | |
Constellation Brands, Inc., Sr. Notes, 4.625%, 3/1/23 | | | 1,580 | | | | 1,617,525 | |
Constellation Brands, Inc., Sr. Notes, 6.00%, 5/1/22 | | | 1,445 | | | | 1,647,300 | |
Innovation Ventures LLC/Innovation Ventures Finance Corp., Sr. Notes, 9.50%, 8/15/19(1) | | | 1,130 | | | | 1,086,213 | |
Michael Foods Group, Inc., Sr. Notes, 9.75%, 7/15/18 | | | 2,695 | | | | 3,011,662 | |
Smithfield Foods, Inc., Sr. Notes, 6.625%, 8/15/22 | | | 2,155 | | | | 2,262,750 | |
| | | | | | | | | |
| | | | | | $ | 19,129,228 | |
| | | | | | | | | |
|
Gaming — 4.8% | |
Boyd Acquisition Sub, LLC/Boyd Acquisition Finance Corp., Sr. Notes, 8.375%, 2/15/18(1) | | $ | 1,065 | | | $ | 1,094,288 | |
Buffalo Thunder Development Authority, Sr. Notes, 9.375%, 12/15/14(1)(4) | | | 5,755 | | | | 2,071,800 | |
Caesars Entertainment Operating Co., Inc., 12.75%, 4/15/18 | | | 1,080 | | | | 788,400 | |
Caesars Entertainment Operating Co., Inc., Sr. Notes, 5.375%, 12/15/13 | | | 550 | | | | 528,688 | |
Caesars Entertainment Operating Co., Inc., Sr. Notes, 5.625%, 6/1/15 | | | 7,170 | | | | 5,951,100 | |
Caesars Entertainment Operating Co., Inc., Sr. Notes, 8.50%, 2/15/20(1) | | | 3,695 | | | | 3,639,575 | |
Caesars Entertainment Operating Co., Inc., Sr. Notes, 11.25%, 6/1/17 | | | 2,375 | | | | 2,582,812 | |
Inn of the Mountain Gods Resort & Casino, Sr. Notes, 8.75%, 11/30/20(1) | | | 679 | | | | 666,269 | |
Mandalay Resort Group, Sr. Sub. Notes, 7.625%, 7/15/13 | | | 855 | | | | 882,788 | |
MCE Finance, Ltd., Sr. Notes, 10.25%, 5/15/18 | | | 2,100 | | | | 2,404,500 | |
MGM Resorts International, Sr. Notes, 5.875%, 2/27/14 | | | 2,110 | | | | 2,194,400 | |
MGM Resorts International, Sr. Notes, 7.75%, 3/15/22 | | | 2,820 | | | | 2,929,275 | |
MGM Resorts International, Sr. Notes, 9.00%, 3/15/20 | | | 680 | | | | 761,600 | |
MGM Resorts International, Sr. Notes, 10.375%, 5/15/14 | | | 1,305 | | | | 1,473,019 | |
MGM Resorts International, Sr. Notes, 11.125%, 11/15/17 | | | 1,350 | | | | 1,495,125 | |
Mohegan Tribal Gaming Authority, 10.50%, 12/15/16(1) | | | 2,019 | | | | 1,923,097 | |
Mohegan Tribal Gaming Authority, 11.50%, 11/1/17(1) | | | 1,620 | | | | 1,737,450 | |
Mohegan Tribal Gaming Authority, Sr. Sub. Notes, 11.00%, 9/15/18(1) | | | 3,130 | | | | 2,351,412 | |
Peninsula Gaming, LLC, 8.375%, 8/15/15 | | | 1,195 | | | | 1,253,256 | |
Peninsula Gaming, LLC, Sr. Notes, 10.75%, 8/15/17 | | | 2,880 | | | | 3,258,000 | |
SugarHouse HSP Gaming Property, LP/SugarHouse HSP Gaming Finance Corp., 8.625%, 4/15/16(1) | | | 745 | | | | 801,806 | |
| | | | | | | | |
| Security | | Principal
Amount
(000’s omitted) | | | Value | |
| | | | | | | | |
|
Gaming (continued) | |
Tunica-Biloxi Gaming Authority, Sr. Notes, 9.00%, 11/15/15(1) | | $ | 3,605 | | | $ | 3,298,575 | |
Waterford Gaming, LLC, Sr. Notes, 8.625%, 9/15/14(1)(5) | | | 3,140 | | | | 1,701,655 | |
| | | | | | | | | |
| | | $ | 45,788,890 | |
| | | | | | | | | |
|
Health Care — 9.6% | |
Accellent, Inc., Sr. Notes, 8.375%, 2/1/17 | | $ | 3,345 | | | $ | 3,436,987 | |
Air Medical Group Holdings, Inc., Sr. Notes, 9.25%, 11/1/18 | | | 1,530 | | | | 1,656,225 | |
Alere, Inc., Sr. Notes, 7.875%, 2/1/16 | | | 1,290 | | | | 1,351,275 | |
American Renal Holdings, Sr. Notes, 8.375%, 5/15/18 | | | 550 | | | | 584,375 | |
Bausch & Lomb, Inc., Sr. Notes, 9.875%, 11/1/15 | | | 1,730 | | | | 1,781,900 | |
Biomet, Inc., Sr. Notes, 6.50%, 8/1/20(1) | | | 2,485 | | | | 2,575,081 | |
CDRT Holding Corp., Sr. Notes, 9.25%, 10/1/17(1)(3) | | | 1,755 | | | | 1,693,575 | |
Community Health Systems, Inc., Sr. Notes, 5.125%, 8/15/18 | | | 2,605 | | | | 2,709,200 | |
Community Health Systems, Inc., Sr. Notes, 7.125%, 7/15/20 | | | 2,685 | | | | 2,842,744 | |
ConvaTec Healthcare E SA, Sr. Notes, 10.50%, 12/15/18(1) | | | 3,420 | | | | 3,727,800 | |
DaVita HealthCare Partners, Inc., Sr. Notes, 5.75%, 8/15/22 | | | 4,640 | | | | 4,872,000 | |
DJO Finance, LLC/DJO Finance Corp., Sr. Notes, 8.75%, 3/15/18(1) | | | 1,445 | | | | 1,549,763 | |
Elan Finance PLC/Elan Finance Corp., Sr. Notes, 6.25%, 10/15/19(1) | | | 1,685 | | | | 1,710,275 | |
Emergency Medical Services Corp., Sr. Notes, 8.125%, 6/1/19 | | | 1,300 | | | | 1,384,500 | |
Endo Pharmaceuticals Holdings, Inc., Sr. Notes, 7.00%, 7/15/19 | | | 1,305 | | | | 1,415,925 | |
Endo Pharmaceuticals Holdings, Inc., Sr. Notes, 7.00%, 12/15/20 | | | 1,200 | | | | 1,296,000 | |
Endo Pharmaceuticals Holdings, Inc., Sr. Notes, 7.25%, 1/15/22 | | | 555 | | | | 602,175 | |
Fresenius Medical Care US Finance II, Inc., Sr. Notes, 5.625%, 7/31/19(1) | | | 1,510 | | | | 1,596,825 | |
Fresenius Medical Care US Finance II, Inc., Sr. Notes, 5.875%, 1/31/22(1) | | | 1,260 | | | | 1,346,625 | |
HCA, Inc., 9.875%, 2/15/17 | | | 1,427 | | | | 1,534,025 | |
HCA, Inc., Sr. Notes, 5.875%, 5/1/23 | | | 1,130 | | | | 1,144,125 | |
HCA, Inc., Sr. Notes, 7.50%, 2/15/22 | | | 1,530 | | | | 1,717,425 | |
Hologic, Inc., Sr. Notes, 6.25%, 8/1/20(1) | | | 5,415 | | | | 5,766,975 | |
IMS Health, Inc., Sr. Notes, 6.00%, 11/1/20(1) | | | 1,710 | | | | 1,744,200 | |
INC Research, LLC., Sr. Notes, 11.50%, 7/15/19(1) | | | 1,145 | | | | 1,156,450 | |
Kinetic Concepts, Inc./KCI USA, Inc., 10.50%, 11/1/18(1) | | | 3,630 | | | | 3,884,100 | |
Kinetic Concepts, Inc./KCI USA, Inc., Sr. Notes, 12.50%, 11/1/19(1) | | | 1,765 | | | | 1,703,225 | |
| | | | |
| | 23 | | See Notes to Financial Statements. |
High Income Opportunities Portfolio
October 31, 2012
Portfolio of Investments — continued
| | | | | | | | |
| Security | | Principal
Amount
(000’s omitted) | | | Value | |
| | | | | | | | |
|
Health Care (continued) | |
Multiplan, Inc., Sr. Notes, 9.875%, 9/1/18(1) | | $ | 2,800 | | | $ | 3,094,000 | |
Patheon, Inc., Sr. Notes, 8.625%, 4/15/17(1) | | | 1,190 | | | | 1,282,225 | |
Pharmaceutical Product Development, Inc., Sr. Notes, 9.50%, 12/1/19(1) | | | 4,700 | | | | 5,275,750 | |
Physio-Control International, Inc., Sr. Notes, 9.875%, 1/15/19(1) | | | 1,510 | | | | 1,661,000 | |
Polymer Group, Inc., Sr. Notes, 7.75%, 2/1/19 | | | 1,870 | | | | 2,010,250 | |
PSS World Medical, Inc., Sr. Notes, 6.375%, 3/1/22 | | | 1,290 | | | | 1,546,388 | |
ResCare, Inc., Sr. Notes, 10.75%, 1/15/19 | | | 2,375 | | | | 2,660,000 | |
Rural/Metro Corp., Sr. Notes, 10.125%, 7/15/19(1) | | | 570 | | | | 537,225 | |
Stewart Enterprises, Inc., Sr. Notes, 6.50%, 4/15/19 | | | 545 | | | | 587,919 | |
STHI Holding Corp., 8.00%, 3/15/18(1) | | | 1,395 | | | | 1,499,625 | |
Teleflex, Inc., Sr. Sub. Notes, 6.875%, 6/1/19 | | | 545 | | | | 588,600 | |
United Surgical Partners International, Inc., Sr. Notes, 9.00%, 4/1/20 | | | 1,775 | | | | 1,952,500 | |
Valeant Pharmaceuticals International, Sr. Notes, 6.375%, 10/15/20(1) | | | 2,300 | | | | 2,426,500 | |
VPI Escrow Corp., Sr. Notes, 6.375%, 10/15/20(1) | | | 2,875 | | | | 3,040,312 | |
VWR Funding, Inc., Sr. Notes, 7.25%, 9/15/17(1) | | | 3,140 | | | | 3,210,650 | |
Warner Chilcott Co., LLC, Sr. Notes, 7.75%, 9/15/18 | | | 2,225 | | | | 2,358,500 | |
| | | | | | | | | |
| | | | | | $ | 90,515,219 | |
| | | | | | | | | |
|
Homebuilders / Real Estate — 1.0% | |
CB Richard Ellis Service, Inc., Sr. Notes, 6.625%, 10/15/20 | | $ | 2,625 | | | $ | 2,861,250 | |
CB Richard Ellis Service, Inc., Sr. Notes, 11.625%, 6/15/17 | | | 5,470 | | | | 6,112,725 | |
| | | | | | | | | |
| | | | | | $ | 8,973,975 | |
| | | | | | | | | |
|
Insurance — 0.4% | |
Alliant Holdings I, Inc., Sr. Notes, 11.00%, 5/1/15(1) | | $ | 1,500 | | | $ | 1,554,000 | |
Hub International, Ltd., Sr. Notes, 8.125%, 10/15/18(1) | | | 1,540 | | | | 1,590,050 | |
USI Holdings Corp., Sr. Notes, 4.185%, 11/15/14(1)(2) | | | 785 | | | | 765,375 | |
| | | | | | | | | |
| | | $ | 3,909,425 | |
| | | | | | | | | |
|
Leisure — 1.4% | |
NCL Corp., Ltd., Sr. Notes, 9.50%, 11/15/18 | | $ | 1,735 | | | $ | 1,925,850 | |
NCL Corp., Ltd., Sr. Notes, 11.75%, 11/15/16 | | | 2,615 | | | | 3,007,250 | |
Royal Caribbean Cruises, Sr. Notes, 7.25%, 6/15/16 | | | 535 | | | | 607,225 | |
Royal Caribbean Cruises, Sr. Notes, 7.25%, 3/15/18 | | | 1,355 | | | | 1,515,906 | |
Royal Caribbean Cruises, Sr. Notes, 11.875%, 7/15/15 | | | 575 | | | | 707,250 | |
Seven Seas Cruises, S. DE R.L., Sr. Notes, 9.125%, 5/15/19 | | | 3,180 | | | | 3,319,125 | |
Vail Resorts, Inc., Sr. Sub. Notes, 6.50%, 5/1/19 | | | 700 | | | | 763,000 | |
Viking Cruises, Ltd., Sr. Notes, 8.50%, 10/15/22(1) | | | 1,370 | | | | 1,421,375 | |
| | | | | | | | | |
| | | | | | $ | 13,266,981 | |
| | | | | | | | | |
| | | | | | | | |
| Security | | Principal
Amount
(000’s omitted) | | | Value | |
| | | | | | | | |
|
Metals / Mining — 3.3% | |
CONSOL Energy, Inc., Sr. Notes, 8.00%, 4/1/17 | | $ | 1,630 | | | $ | 1,735,950 | |
FMG Resources (August 2006) Pty, Ltd., Sr. Notes, 7.00%, 11/1/15(1) | | | 4,030 | | | | 4,090,450 | |
IAMGOLD Corp., Sr. Notes, 6.75%, 10/1/20(1) | | | 2,870 | | | | 2,870,000 | |
Molycorp, Inc., Sr. Notes, 10.00%, 6/1/20(1) | | | 2,265 | | | | 2,191,387 | |
New Gold, Inc., Sr. Notes, 7.00%, 4/15/20(1) | | | 905 | | | | 963,825 | |
Novelis, Inc., Sr. Notes, 8.375%, 12/15/17 | | | 1,025 | | | | 1,119,813 | |
Novelis, Inc., Sr. Notes, 8.75%, 12/15/20 | | | 2,645 | | | | 2,929,337 | |
Peabody Energy Corp., Sr. Notes, 6.00%, 11/15/18 | | | 4,420 | | | | 4,607,850 | |
Peabody Energy Corp., Sr. Notes, 6.25%, 11/15/21 | | | 1,790 | | | | 1,857,125 | |
Penn Virginia Resource Partners, LP/Penn Virginia Resource Finance Corp. II, Sr. Notes, 8.375%, 6/1/20(1) | | | 1,085 | | | | 1,144,675 | |
Quadra FNX Mining, Ltd., Sr. Notes, 7.75%, 6/15/19(1) | | | 3,720 | | | | 3,859,500 | |
Rain CII Carbon, LLC, Sr. Notes, 8.00%, 12/1/18(1) | | | 2,435 | | | | 2,495,875 | |
SunCoke Energy, Inc., Sr. Notes, 7.625%, 8/1/19 | | | 1,315 | | | | 1,351,163 | |
| | | | | | | | | |
| | | | | | $ | 31,216,950 | |
| | | | | | | | | |
|
Paper — 0.8% | |
Boise Cascade, LLC/Boise Cascade Finance Corp., Sr. Notes, 6.375%, 11/1/20(1) | | $ | 340 | | | $ | 345,950 | |
Boise Paper Holdings, LLC/Boise Co-Issuer Co., Sr. Notes, 8.00%, 4/1/20 | | | 545 | | | | 599,500 | |
Boise Paper Holdings, LLC/Boise Finance Co., Sr. Notes, 9.00%, 11/1/17 | | | 2,200 | | | | 2,431,000 | |
Domtar Corp., Sr. Notes, 10.75%, 6/1/17 | | | 2,300 | | | | 2,979,689 | |
Smurfit Kappa Acquisitions, Sr. Notes, 4.875%, 9/15/18(1) | | | 1,255 | | | | 1,259,706 | |
| | | | | | | | | |
| | | $ | 7,615,845 | |
| | | | | | | | | |
|
Railroad — 0.1% | |
Kansas City Southern Mexico, Sr. Notes, 6.125%, 6/15/21 | | $ | 755 | | | $ | 847,488 | |
| | | | | | | | | |
| | | $ | 847,488 | |
| | | | | | | | | |
| | |
Restaurants — 0.6% | | | | | | | | |
NPC International, Inc., Sr. Notes, 10.50%, 1/15/20 | | $ | 3,030 | | | $ | 3,495,862 | |
Ruby Tuesday, Inc., Sr. Notes, 7.625%, 5/15/20(1) | | | 2,310 | | | | 2,203,163 | |
| | | | | | | | | |
| | | | | | $ | 5,699,025 | |
| | | | | | | | | |
|
Services — 5.5% | |
Aramark Holdings Corp., Sr. Notes, 8.625%, 5/1/16(1)(3) | | $ | 930 | | | $ | 953,259 | |
Avis Budget Car Rental, LLC/Avis Budget Finance, Inc., Sr. Notes, 8.25%, 1/15/19 | | | 520 | | | | 570,050 | |
| | | | |
| | 24 | | See Notes to Financial Statements. |
High Income Opportunities Portfolio
October 31, 2012
Portfolio of Investments — continued
| | | | | | | | |
| Security | | Principal
Amount
(000’s omitted) | | | Value | |
| | | | | | | | |
|
Services (continued) | |
Avis Budget Car Rental, LLC/Avis Budget Finance, Inc., Sr. Notes, 9.75%, 3/15/20 | | $ | 2,550 | | | $ | 2,916,562 | |
Carlson Wagonlit BV, Sr. Notes, 6.875%, 6/15/19(1) | | | 2,235 | | | | 2,346,750 | |
Education Management, LLC, Sr. Notes, 8.75%, 6/1/14 | | | 4,475 | | | | 3,512,875 | |
HDTFS, Inc., Sr. Notes, 6.25%, 10/15/22(1) | | | 1,130 | | | | 1,151,188 | |
Hertz Corp., Sr. Notes, 7.50%, 10/15/18 | | | 20 | | | | 21,800 | |
Laureate Education, Inc., Sr. Notes, 9.25%, 9/1/19(1) | | | 13,780 | | | | 13,642,200 | |
Laureate Education, Inc., Sr. Sub Notes, 12.75%, 8/15/17(1) | | | 5,130 | | | | 5,437,800 | |
RSC Equipment Rental, Inc./RSC Holdings III, LLC, Sr. Notes, 8.25%, 2/1/21 | | | 200 | | | | 222,000 | |
RSC Equipment Rental, Inc./RSC Holdings III, LLC, Sr. Notes, 10.25%, 11/15/19 | | | 1,330 | | | | 1,542,800 | |
ServiceMaster Co., Sr. Notes, 7.00%, 8/15/20(1) | | | 2,345 | | | | 2,380,175 | |
ServiceMaster Co., Sr. Notes, 8.00%, 2/15/20 | | | 1,185 | | | | 1,250,175 | |
Sitel, LLC/Sitel Finance Corp., Sr. Notes, 11.50%, 4/1/18 | | | 830 | | | | 597,600 | |
TransUnion Holding Co., Inc., Sr. Notes, 8.125%, 6/15/18(1)(3) | | | 2,335 | | | | 2,358,350 | |
TransUnion Holding Co., Inc., Sr. Notes, 9.625%, 6/15/18 | | | 3,710 | | | | 3,941,875 | |
TransUnion LLC/TransUnion Financing Corp., Sr. Notes, 11.375%, 6/15/18 | | | 3,775 | | | | 4,397,875 | |
UR Merger Sub Corp., Sr. Notes, 7.375%, 5/15/20(1) | | | 4,060 | | | | 4,410,175 | |
| | | | | | | | | |
| | | | | | $ | 51,653,509 | |
| | | | | | | | | |
|
Steel — 0.2% | |
JMC Steel Group, Inc., Sr. Notes, 8.25%, 3/15/18(1) | | $ | 1,880 | | | $ | 1,917,600 | |
| | | | | | | | | |
| | | | | | $ | 1,917,600 | |
| | | | | | | | | |
|
Super Retail — 5.2% | |
Claire’s Stores, Inc., Sr. Notes, 9.00%, 3/15/19(1) | | $ | 1,530 | | | $ | 1,604,587 | |
Dollar General Corp., Sr. Notes, 4.125%, 7/15/17 | | | 760 | | | | 798,000 | |
Dufry Finance SCA, Sr. Notes, 5.50%, 10/15/20(1) | | | 1,770 | | | | 1,809,825 | |
Express, LLC/Express Finance Corp., Sr. Notes, 8.75%, 3/1/18 | | | 6,260 | | | | 6,807,750 | |
Limited Brands, Inc., Sr. Notes, 5.625%, 2/15/22 | | | 3,885 | | | | 4,210,369 | |
Limited Brands, Inc., Sr. Notes, 6.625%, 4/1/21 | | | 5,170 | | | | 5,939,037 | |
Limited Brands, Inc., Sr. Notes, 8.50%, 6/15/19 | | | 3,620 | | | | 4,402,825 | |
Michaels Stores, Inc., Sr. Notes, 7.75%, 11/1/18(1) | | | 1,130 | | | | 1,218,988 | |
Michaels Stores, Inc., Sr. Notes, 7.75%, 11/1/18 | | | 2,525 | | | | 2,723,844 | |
Michaels Stores, Inc., Sr. Sub. Notes, 11.375%, 11/1/16 | | | 1,175 | | | | 1,229,344 | |
Pantry, Inc., Sr. Notes, 8.375%, 8/1/20(1) | | | 1,615 | | | | 1,687,675 | |
Party City Holdings, Inc., Sr. Notes, 8.875%, 8/1/20(1) | | | 2,705 | | | | 2,887,587 | |
Petco Animal Supplies, Inc., Sr. Notes, 9.25%, 12/1/18(1) | | | 3,945 | | | | 4,374,019 | |
Petco Holdings, Inc., Sr. Notes, 8.50%, 10/15/17(1)(3) | | | 4,590 | | | | 4,630,162 | |
Sally Holdings, LLC/Sally Capital, Inc., Sr. Notes, 5.75%, 6/1/22 | | | 4,745 | | | | 5,094,944 | |
| | | | | | | | | |
| | | $ | 49,418,956 | |
| | | | | | | | | |
| | | | | | | | |
| Security | | Principal
Amount
(000’s omitted) | | | Value | |
| | | | | | | | |
|
Technology — 3.4% | |
Avaya, Inc., Sr. Notes, 9.75%, 11/1/15 | | $ | 3,050 | | | $ | 2,729,750 | |
Avaya, Inc., Sr. Notes, 10.125%, 11/1/15 | | | 3,485 | | | | 3,110,362 | |
Brocade Communications Systems, Inc., Sr. Notes, 6.625%, 1/15/18 | | | 680 | | | | 708,900 | |
Brocade Communications Systems, Inc., Sr. Notes, 6.875%, 1/15/20 | | | 855 | | | | 929,813 | |
CommScope, Inc., Sr. Notes, 8.25%, 1/15/19(1) | | | 1,310 | | | | 1,418,075 | |
First Data Corp., Sr. Notes, 7.375%, 6/15/19(1) | | | 2,930 | | | | 3,047,200 | |
First Data Corp., Sr. Notes, 10.55%, 9/24/15 | | | 2,217 | | | | 2,283,062 | |
Infor US, Inc., Sr. Notes, 9.375%, 4/1/19 | | | 2,720 | | | | 3,019,200 | |
Lender Processing Services, Inc., Sr. Notes, 5.75%, 4/15/23 | | | 1,690 | | | | 1,795,625 | |
NCR Corp., Sr. Notes, 5.00%, 7/15/22(1) | | | 1,355 | | | | 1,390,569 | |
Nuance Communications, Inc., Sr. Notes, 5.375%, 8/15/20(1) | | | 2,600 | | | | 2,665,000 | |
Seagate HDD Cayman, Sr. Notes, 7.00%, 11/1/21 | | | 3,435 | | | | 3,606,750 | |
SSI Investments II, Ltd./SSI Co-Issuer, LLC, Sr. Notes, 11.125%, 6/1/18 | | | 5,265 | | | | 5,929,706 | |
| | | | | | | | | |
| | | | | | $ | 32,634,012 | |
| | | | | | | | | |
|
Telecommunications — 6.5% | |
American Tower Corp., Sr. Notes, 5.05%, 9/1/20 | | $ | 2,080 | | | $ | 2,339,276 | |
Crown Castle International Corp., Sr. Notes, 5.25%, 1/15/23(1) | | | 2,250 | | | | 2,337,188 | |
Digicel Group, Ltd., Sr. Notes, 10.50%, 4/15/18(1) | | | 1,210 | | | | 1,349,150 | |
Digicel, Ltd., Sr. Notes, 8.25%, 9/1/17(1) | | | 3,255 | | | | 3,531,675 | |
Digicel, Ltd., Sr. Notes, 12.00%, 4/1/14(1) | | | 1,940 | | | | 2,153,400 | |
Equinix, Inc., Sr. Notes, 7.00%, 7/15/21 | | | 1,335 | | | | 1,486,856 | |
Hughes Satellite Systems Corp., Sr. Notes, 6.50%, 6/15/19 | | | 3,430 | | | | 3,687,250 | |
Intelsat Jackson Holdings, Ltd., Sr. Notes, 7.25%, 10/15/20(1) | | | 2,210 | | | | 2,353,650 | |
Intelsat Luxembourg SA, Sr. Notes, 11.50%, 2/4/17(3) | | | 5,601 | | | | 5,915,825 | |
iPCS, Inc., 3.695%, 5/1/14(2)(3) | | | 1,010 | | | | 1,010,000 | |
Nextel Communications, Inc., Sr. Notes, 5.95%, 3/15/14 | | | 3,820 | | | | 3,834,325 | |
Nextel Communications, Inc., Sr. Notes, 7.375%, 8/1/15 | | | 1,511 | | | | 1,516,666 | |
SBA Communications Corp., Sr. Notes, 5.625%, 10/1/19(1) | | | 2,260 | | | | 2,305,200 | |
SBA Telecommunications, Inc., Sr. Notes, 5.75%, 7/15/20(1) | | | 1,915 | | | | 1,998,781 | |
SBA Telecommunications, Inc., Sr. Notes, 8.25%, 8/15/19 | | | 497 | | | | 557,883 | |
Sprint Capital Corp., Sr. Notes, 8.75%, 3/15/32 | | | 1,255 | | | | 1,487,175 | |
Sprint Nextel Corp., Sr. Notes, 7.00%, 8/15/20 | | | 3,255 | | | | 3,584,569 | |
Sprint Nextel Corp., Sr. Notes, 9.00%, 11/15/18(1) | | | 6,995 | | | | 8,656,312 | |
Sprint Nextel Corp., Sr. Notes, 9.125%, 3/1/17 | | | 1,140 | | | | 1,345,200 | |
| | | | |
| | 25 | | See Notes to Financial Statements. |
High Income Opportunities Portfolio
October 31, 2012
Portfolio of Investments — continued
| | | | | | | | |
| Security | | Principal
Amount
(000’s omitted) | | | Value | |
| | | | | | | | |
|
Telecommunications (continued) | |
Telesat Canada/Telesat, LLC, Sr. Sub. Notes, 12.50%, 11/1/17 | | $ | 4,060 | | | $ | 4,526,900 | |
Wind Acquisition Finance SA, Sr. Notes, 12.25%, 7/15/17(1)(3) | | | 3,103 | | | | 2,540,859 | |
Windstream Corp., Sr. Notes, 7.75%, 10/1/21 | | | 2,445 | | | | 2,655,881 | |
| | | | | | | | | |
| | | | | | $ | 61,174,021 | |
| | | | | | | | | |
|
Textiles / Apparel — 0.4% | |
Phillips-Van Heusen Corp., Sr. Notes, 7.75%, 11/15/23 | | $ | 3,385 | | | $ | 3,918,598 | |
| | | | | | | | | |
| | | | | | $ | 3,918,598 | |
| | | | | | | | | |
|
Transportation Ex Air / Rail — 0.5% | |
CEVA Group PLC, Sr. Notes, 8.375%, 12/1/17(1) | | $ | 2,215 | | | $ | 2,154,088 | |
CEVA Group PLC, Sr. Notes, 11.625%, 10/1/16(1) | | | 2,065 | | | | 2,126,950 | |
| | | | | | | | | |
| | | | | | $ | 4,281,038 | |
| | | | | | | | | |
|
Utilities — 3.1% | |
Calpine Construction Finance Co. LP/CCFC Finance Corp., Sr. Notes, 8.00%, 6/1/16(1) | | $ | 3,315 | | | $ | 3,555,337 | |
Calpine Corp., Sr. Notes, 7.50%, 2/15/21(1) | | | 6,183 | | | | 6,754,927 | |
DPL, Inc., Sr. Notes, 6.50%, 10/15/16 | | | 1,910 | | | | 2,081,900 | |
DPL, Inc., Sr. Notes, 7.25%, 10/15/21 | | | 5,250 | | | | 5,945,625 | |
Edison Mission Energy, Sr. Notes, 7.50%, 6/15/13 | | | 3,255 | | | | 1,651,913 | |
Energy Future Intermediate Holding Co., LLC/EFIH Finance, Inc., Sr. Notes, 6.875%, 8/15/17(1) | | | 745 | | | | 758,038 | |
NRG Energy, Inc., Sr. Notes, 7.875%, 5/15/21 | | | 2,090 | | | | 2,299,000 | |
NRG Energy, Inc., Sr. Notes, 8.25%, 9/1/20 | | | 3,315 | | | | 3,671,362 | |
Reliant Energy, Inc., Sr. Notes, 7.625%, 6/15/14 | | | 370 | | | | 397,750 | |
Texas Competitive Electric Holdings Co., LLC, Sr. Notes, 11.50%, 10/1/20(1) | | | 3,665 | | | | 2,638,800 | |
| | | | | | | | | |
| | | $ | 29,754,652 | |
| | | | | | | | | |
| |
Total Corporate Bonds & Notes
(identified cost $763,379,507) | | | $ | 796,721,313 | |
| | | | | | | | | |
|
| Senior Floating-Rate Interests — 7.5%(6) | |
| | |
| | | | | | | | |
| Borrower/Tranche Description | | Principal
Amount
(000’s omitted) | | | Value | |
|
Automotive & Auto Parts — 0.2% | |
Chrysler Group LLC, Term Loan,
6.00%, Maturing 5/24/17 | | $ | 1,679 | | | $ | 1,719,782 | |
| | | | | | | | | |
| | | | | | $ | 1,719,782 | |
| | | | | | | | | |
| | | | | | | | |
| Borrower/Tranche Description | | Principal
Amount
(000’s omitted) | | | Value | |
| | | | | | | | |
|
Cable / Satellite TV — 0.1% | |
WideOpenWest Finance LLC, Term Loan,
6.25%, Maturing 7/17/18 | | $ | 698 | | | $ | 705,787 | |
| | | | | | | | | |
| | | | | | $ | 705,787 | |
| | | | | | | | | |
|
Chemicals — 0.6% | |
Ineos US Finance LLC, Term Loan,
5.50%, Maturing 5/4/15 | | $ | 1,990 | | | $ | 2,022,337 | |
Ineos US Finance LLC, Term Loan,
6.50%, Maturing 5/4/18 | | | 2,289 | | | | 2,323,773 | |
PetroLogistics LP, Term Loan, 7.00%, Maturing 3/23/17 | | | 1,443 | | | | 1,482,426 | |
| | | | | | | | | |
| | | | | | $ | 5,828,536 | |
| | | | | | | | | |
|
Consumer Products — 0.4% | |
Revlon Consumer Products Corp., Term Loan, 4.75%, Maturing 11/17/17 | | $ | 3,798 | | | $ | 3,811,441 | |
| | | | | | | | | |
| | | | | | $ | 3,811,441 | |
| | | | | | | | | |
|
Diversified Financial Services — 0.3% | |
Nuveen Investments, Inc., Term Loan - Second Lien, 8.25%, Maturing 2/28/19 | | $ | 2,400 | | | $ | 2,425,999 | |
| | | | | | | | | |
| | | | | | $ | 2,425,999 | |
| | | | | | | | | |
|
Energy — 0.4% | |
Chesapeake Energy Corp., Term Loan,
8.50%, Maturing 12/1/17 | | $ | 1,622 | | | $ | 1,627,565 | |
Everest Acquisition, LLC, Term Loan,
5.00%, Maturing 5/24/18 | | | 2,000 | | | | 2,018,126 | |
| | | | | | | | | |
| | | | | | $ | 3,645,691 | |
| | | | | | | | | |
|
Environmental — 0.4% | |
ADS Waste Holdings, Term Loan,
5.25%, Maturing 9/11/19 | | $ | 3,700 | | | $ | 3,738,928 | |
| | | | | | | | | |
| | | | | | $ | 3,738,928 | |
| | | | | | | | | |
|
Food / Beverage / Tobacco — 0.3% | |
Del Monte Foods Co., Term Loan,
4.50%, Maturing 3/8/18 | | $ | 3,260 | | | $ | 3,259,781 | |
| | | | | | | | | |
| | | | | | $ | 3,259,781 | |
| | | | | | | | | |
|
Gaming — 0.4% | |
Peninsula Gaming, LLC, Term Loan, Maturing 8/3/17(7) | | $ | 4,000 | | | $ | 4,055,000 | |
| | | | | | | | | |
| | | | | | $ | 4,055,000 | |
| | | | | | | | | |
| | | | |
| | 26 | | See Notes to Financial Statements. |
High Income Opportunities Portfolio
October 31, 2012
Portfolio of Investments — continued
| | | | | | | | |
| Borrower/Tranche Description | | Principal
Amount
(000’s omitted) | | | Value | |
| | | | | | | | |
|
Health Care — 0.7% | |
Hologic, Inc., Term Loan, 4.50%, Maturing 8/1/19 | | $ | 1,995 | | | $ | 2,020,145 | |
Quintiles Transnational Corp., Term Loan, 7.50%, Maturing 2/22/17 | | | 4,400 | | | | 4,455,000 | |
| | | | | | | | | |
| | | | | | $ | 6,475,145 | |
| | | | | | | | | |
|
Metals / Mining — 0.9% | |
FMG America Finance, Inc., Term Loan,
5.25%, Maturing 10/18/17 | | $ | 8,600 | | | $ | 8,578,500 | |
| | | | | | | | | |
| | | | | | $ | 8,578,500 | |
| | | | | | | | | |
|
Services — 0.5% | |
AlixPartners, LLP, Term Loan - Second Lien,
10.75%, Maturing 12/27/19 | | $ | 2,700 | | | $ | 2,733,750 | |
Education Management LLC, Term Loan,
4.38%, Maturing 6/1/16 | | | 1,981 | | | | 1,670,163 | |
| | | | | | | | | |
| | | | | | $ | 4,403,913 | |
| | | | | | | | | |
|
Super Retail — 0.7% | |
BJ’s Wholesale Club, Inc., Term Loan,
5.75%, Maturing 9/26/19 | | $ | 1,900 | | | $ | 1,922,760 | |
BJ’s Wholesale Club, Inc., Term Loan - Second Lien, 9.75%, Maturing 3/26/20 | | | 900 | | | | 920,925 | |
Party City Holdings, Inc., Term Loan,
5.75%, Maturing 7/26/19 | | | 4,200 | | | | 4,245,675 | |
| | | | | | | | | |
| | | | | | $ | 7,089,360 | |
| | | | | | | | | |
|
Technology — 0.0%(8) | |
First Data Corp., Term Loan, 2.96%, Maturing 9/24/14 | | $ | 71 | | | $ | 70,933 | |
| | | | | | | | | |
| | | | | | $ | 70,933 | |
| | | | | | | | | |
|
Telecommunications — 1.0% | |
Asurion LLC, Term Loan, 4.75%, Maturing 7/18/17 | | $ | 1,200 | | | $ | 1,207,500 | |
Asurion LLC, Term Loan, 5.50%, Maturing 5/24/18 | | | 2,000 | | | | 2,016,750 | |
Asurion LLC, Term Loan - Second Lien,
9.00%, Maturing 5/24/19 | | | 1,025 | | | | 1,062,438 | |
Lonestar Intermediate Super Holdings, LLC, Term Loan, 11.00%, Maturing 9/2/19 | | | 5,000 | | | | 5,337,500 | |
| | | | | | | | | |
| | | | | | $ | 9,624,188 | |
| | | | | | | | | |
|
Transportation Ex Air / Rail — 0.2% | |
CEVA Group PLC, Term Loan, 5.31%, Maturing 8/31/16 | | $ | 523 | | | $ | 502,005 | |
CEVA Group PLC, Term Loan, 5.31%, Maturing 8/31/16 | | | 1,170 | | | | 1,123,545 | |
CEVA Group PLC, Term Loan, 5.36%, Maturing 8/31/16 | | | 590 | | | | 566,314 | |
| | | | | | | | | |
| | | | | | $ | 2,191,864 | |
| | | | | | | | | |
| | | | | | | | |
| Borrower/Tranche Description | | Principal
Amount
(000’s omitted) | | | Value | |
| | | | | | | | |
|
Utilities — 0.4% | |
Texas Competitive Electric Holdings Co., LLC, Term Loan, 3.75%, Maturing 10/10/14 | | $ | 5,240 | | | $ | 3,540,465 | |
| | | | | | | | | |
| | | | | | $ | 3,540,465 | |
| | | | | | | | | |
| |
Total Senior Floating-Rate Interests
(identified cost $71,062,585) | | | $ | 71,165,313 | |
| | | | | | | | | |
|
| Convertible Bonds — 0.3% | |
| | |
| | | | | | | | |
| Security | | Principal
Amount
(000’s omitted) | | | Value | |
|
Automotive & Auto Parts — 0.3% | |
Ford Motor Co., 4.25%, 11/15/16 | | $ | 2,180 | | | $ | 3,219,587 | |
| | | | | | | | | |
| | | | | | $ | 3,219,587 | |
| | | | | | | | | |
|
Services — 0.0%(8) | |
Mood Media Corp., 10.00%, 10/31/15(5)(9) | | $ | 37 | | | $ | 38,332 | |
| | | | | | | | | |
| | | | | | $ | 38,332 | |
| | | | | | | | | |
| |
Total Convertible Bonds
(identified cost $3,771,613) | | | $ | 3,257,919 | |
| | | | | | | | | |
|
| Common Stocks — 1.9% | |
| | |
| | | | | | | | |
| Security | | Shares | | | Value | |
|
Building Materials — 0.6% | |
Panolam Holdings Co.(5)(9)(10) | | | 3,117 | | | $ | 5,502,066 | |
| | | | | | | | | |
| | | | | | $ | 5,502,066 | |
| | | | | | | | | |
|
Chemicals — 0.6% | |
LyondellBasell Industries NV, Class A | | | 100,000 | | | $ | 5,339,000 | |
| | | | | | | | | |
| | | | | | $ | 5,339,000 | |
| | | | | | | | | |
|
Consumer Products — 0.0%(8) | |
HF Holdings, Inc.(5)(9)(10) | | | 13,600 | | | $ | 158,576 | |
| | | | | | | | | |
| | | | | | $ | 158,576 | |
| | | | | | | | | |
|
Energy — 0.1% | |
SemGroup Corp.(10) | | | 16,378 | | | $ | 632,846 | |
| | | | | | | | | |
| | | | | | $ | 632,846 | |
| | | | | | | | | |
| | | | |
| | 27 | | See Notes to Financial Statements. |
High Income Opportunities Portfolio
October 31, 2012
Portfolio of Investments — continued
| | | | | | | | |
| Security | | Shares | | | Value | |
| | | | | | | | |
|
Gaming — 0.3% | |
Greektown Superholdings, Inc.(10) | | | 892 | | | $ | 45,492 | |
Las Vegas Sands Corp. | | | 54,500 | | | | 2,530,980 | |
| | | | | | | | | |
| | | | | | $ | 2,576,472 | |
| | | | | | | | | |
|
Super Retail — 0.3% | |
GNC Holdings, Inc., Class A | | | 57,157 | | | $ | 2,210,261 | |
Sally Beauty Holdings, Inc.(10) | | | 50,000 | | | | 1,204,000 | |
| | | | | | | | | |
| | | | | | $ | 3,414,261 | |
| | | | | | | | | |
| |
Total Common Stocks
(identified cost $11,064,669) | | | $ | 17,623,221 | |
| | | | | | | | | |
|
| Convertible Preferred Stocks — 0.1% | |
| | |
| | | | | | | | |
| Security | | Shares | | | Value | |
|
Energy — 0.1% | |
Chesapeake Energy Corp., 4.50% | | | 10,851 | | | $ | 933,620 | |
| | | | | | | | | |
| | | | | | $ | 933,620 | |
| | | | | | | | | |
| |
Total Convertible Preferred Stocks
(identified cost $1,085,100) | | | $ | 933,620 | |
| | | | | | | | | |
|
| Preferred Stocks — 0.4% | |
| | |
| | | | | | | | |
| Security | | Shares | | | Value | |
|
Banks and Thrifts — 0.4% | |
GMAC Capital Trust I, 8.125% to 2/15/16(11) | | | 129,800 | | | $ | 3,392,972 | |
| | | | | | | | | |
| | | | | | $ | 3,392,972 | |
| | | | | | | | | |
| |
Total Preferred Stocks
(identified cost $3,273,233) | | | $ | 3,392,972 | |
| | | | | | | | | |
|
| Miscellaneous — 0.0%(8) | |
| | |
| | | | | | | | |
| Security | | Shares | | | Value | |
|
Cable / Satellite TV — 0.0%(8) | |
Adelphia, Inc., Escrow Certificate(10) | | | 3,555,000 | | | $ | 31,106 | |
Adelphia, Inc., Escrow Certificate(10) | | | 7,585,000 | | | | 66,369 | |
Adelphia Recovery Trust(5)(10) | | | 10,758,837 | | | | 0 | |
| | | | | | | | | |
| | | | | | $ | 97,475 | |
| | | | | | | | | |
| | | | | | | | |
| Security | | Shares | | | Value | |
| | | | | | | | |
| | |
Energy — 0.0%(8) | | | | | | | | |
SemGroup Corp., Escrow Certificate(10) | | | 6,330,000 | | | $ | 284,850 | |
| | | | | | | | | |
| | | | | | $ | 284,850 | |
| | | | | | | | | |
|
Gaming — 0.0%(8) | |
BLB Worldwide Holdings, Inc., Contingent Value Rights, Expires 11/5/17(9)(10) | | | 5,410 | | | $ | 36,518 | |
| | | | | | | | | |
| | | | | | $ | 36,518 | |
| | | | | | | | | |
|
Health Care — 0.0%(8) | |
US Oncology, Inc., Escrow Certificate(10) | | | 705,000 | | | $ | 17,625 | |
| | | | | | | | | |
| | | | | | $ | 17,625 | |
| | | | | | | | | |
| |
Total Miscellaneous
(identified cost $9,891,232) | | | $ | 436,468 | |
| | | | | | | | | |
|
| Warrants — 1.4% | |
| | |
| | | | | | | | |
| Security | | Shares | | | Value | |
|
Energy — 0.0%(8) | |
SemGroup Corp., Expires 11/30/14(10) | | | 17,240 | | | $ | 259,548 | |
| | | | | | | | | |
| | | | | | $ | 259,548 | |
| | | | | | | | | |
|
Food / Beverage / Tobacco — 0.0%(8) | |
ASG Consolidated, LLC/ASG Finance, Inc., Expires 5/15/18 | | | 1,610 | | | $ | 48,300 | |
| | | | | | | | | |
| | | | | | $ | 48,300 | |
| | | | | | | | | |
|
Gaming — 1.4% | |
Peninsula Gaming, LLC, Convertible Preferred Membership
Interests(5)(9)(10) | | | 25,351 | | | $ | 8,872,920 | |
PGP Investors, LLC, Membership Interests(5)(9)(10) | | | 11,429 | | | | 4,000,000 | |
| | | | | | | | | |
| | | | | | $ | 12,872,920 | |
| | | | | | | | | |
|
Publishing / Printing — 0.0% | |
Reader’s Digest Association, Inc. (The), Expires 2/14/19(5)(9)(10) | | | 17,588 | | | $ | 0 | |
| | | | | | | | | |
| | | | | | $ | 0 | |
| | | | | | | | | |
| |
Total Warrants
(identified cost $4,000,172) | | | $ | 13,180,768 | |
| | | | | | | | | |
| | | | |
| | 28 | | See Notes to Financial Statements. |
High Income Opportunities Portfolio
October 31, 2012
Portfolio of Investments — continued
| | | | | | | | |
| Short-Term Investments — 1.8% | |
| | |
| | | | | | | | |
| Description | | Interest
(000’s omitted) | | | Value | |
| | | | | | | | |
Eaton Vance Cash Reserves Fund, LLC, 0.12%(12) | | $ | 16,680 | | | $ | 16,680,162 | |
| | | | | | | | | |
| |
Total Short-Term Investments
(identified cost $16,680,162) | | | $ | 16,680,162 | |
| | | | | | | | | |
| |
Total Investments — 97.5%
(identified cost $884,208,273) | | | $ | 923,391,756 | |
| | | | | | | | | |
| |
Other Assets, Less Liabilities — 2.5% | | | $ | 23,926,419 | |
| | | | | | | | | |
| |
Net Assets — 100.0% | | | $ | 947,318,175 | |
| | | | | | | | | |
The percentage shown for each investment category in the Portfolio of Investments is based on net assets.
| | (1) | Security exempt from registration pursuant to Rule 144A under the Securities Act of 1933. These securities may be sold in certain transactions (normally to qualified institutional buyers) and remain exempt from registration. At October 31, 2012, the aggregate value of these securities is $357,484,311 or 37.7% of the Portfolio’s net assets. |
| | (2) | Variable rate security. The stated interest rate represents the rate in effect at October 31, 2012. |
| | (3) | Represents a payment-in-kind security which may pay all or a portion of interest in additional par. |
| | (4) | Currently the issuer is in default with respect to interest payments. For a variable rate security, interest rate has been adjusted to reflect non-accrual status. |
| | (5) | For fair value measurement disclosure purposes, security is categorized as Level 3 (see Note 9). |
| | (6) | Senior floating-rate interests (Senior Loans) often require prepayments from excess cash flows or permit the borrowers to repay at their election. The degree to which borrowers repay, whether as a contractual requirement or at their election, cannot be predicted with accuracy. As a result, the actual remaining maturity may be substantially less than the stated maturities shown. However, Senior Loans will have an expected average life of approximately two to four years. The stated interest rate represents the weighted average interest rate of all contracts within the senior loan facility and includes commitment fees on unfunded loan commitments, if any. Senior Loans typically have rates of interest which are redetermined either daily, monthly, quarterly or semi-annually by reference to a base lending rate, plus a premium. These base lending rates are primarily the London Interbank Offered Rate (“LIBOR”) and secondarily, the prime rate offered by one or more major United States banks (the “Prime Rate”) and the certificate of deposit (“CD”) rate or other base lending rates used by commercial lenders. |
| | (7) | This Senior Loan will settle after October 31, 2012, at which time the interest rate will be determined. |
| | (8)�� | Amount is less than 0.05%. |
| | (9) | Restricted security (see Note 5). |
| (10) | Non-income producing security. |
| (11) | Security converts to floating rate after the indicated fixed-rate coupon period. |
| (12) | Affiliated investment company available to Eaton Vance portfolios and funds which invests in high quality, U.S. dollar denominated money market instruments. The rate shown is the annualized seven-day yield as of October 31, 2012. |
| | | | |
| | 29 | | See Notes to Financial Statements. |
High Income Opportunities Portfolio
October 31, 2012
Statement of Assets and Liabilities
| | | | |
| Assets | | October 31, 2012 | |
Unaffiliated investments, at value (identified cost, $867,528,111) | | $ | 906,711,594 | |
Affiliated investment, at value (identified cost, $16,680,162) | | | 16,680,162 | |
Cash | | | 209,325 | |
Restricted cash* | | | 252,988 | |
Interest receivable | | | 16,626,173 | |
Interest receivable from affiliated investment | | | 2,944 | |
Receivable for investments sold | | | 26,430,108 | |
Receivable for open swap contracts | | | 947,678 | |
Premium paid on open swap contracts | | | 303,299 | |
Miscellaneous receivable | | | 222,285 | |
Total assets | | $ | 968,386,556 | |
|
| Liabilities | |
Payable for investments purchased | | $ | 20,342,945 | |
Payable for open swap contracts | | | 30,697 | |
Premium received on open swap contracts | | | 174,613 | |
Payable to affiliates: | | | | |
Investment adviser fee | | | 400,045 | |
Trustees’ fees | | | 3,015 | |
Accrued expenses | | | 117,066 | |
Total liabilities | | $ | 21,068,381 | |
Net Assets applicable to investors’ interest in Portfolio | | $ | 947,318,175 | |
|
| Sources of Net Assets | |
Investors’ capital | | $ | 907,217,711 | |
Net unrealized appreciation | | | 40,100,464 | |
Total | | $ | 947,318,175 | |
| * | Represents restricted cash on deposit at the custodian for open swap contracts. |
| | | | |
| | 30 | | See Notes to Financial Statements. |
High Income Opportunities Portfolio
October 31, 2012
Statement of Operations
| | | | |
| Investment Income | | Year Ended
October 31, 2012 | |
Interest and other income | | $ | 66,971,990 | |
Dividends (net of foreign taxes, $18,582) | | | 850,628 | |
Interest allocated from affiliated investment | | | 43,914 | |
Expenses allocated from affiliated investment | | | (5,973 | ) |
Total investment income | | $ | 67,860,559 | |
| |
| Expenses | | | | |
Investment adviser fee | | $ | 4,597,545 | |
Trustees’ fees and expenses | | | 36,104 | |
Custodian fee | | | 264,582 | |
Legal and accounting services | | | 96,321 | |
Miscellaneous | | | 28,048 | |
Total expenses | | $ | 5,022,600 | |
Deduct — | | | | |
Reduction of custodian fee | | $ | 284 | |
Total expense reductions | | $ | 284 | |
| |
Net expenses | | $ | 5,022,316 | |
| |
Net investment income | | $ | 62,838,243 | |
| |
| Realized and Unrealized Gain (Loss) | | | | |
Net realized gain (loss) — | | | | |
Investment transactions | | $ | 6,932,166 | |
Investment transactions allocated from affiliated investment | | | 599 | |
Swap contracts | | | (57,900 | ) |
Net realized gain | | $ | 6,874,865 | |
Change in unrealized appreciation (depreciation) — | | | | |
Investments | | $ | 39,057,381 | |
Swap contracts | | | 1,346,663 | |
Net change in unrealized appreciation (depreciation) | | $ | 40,404,044 | |
| |
Net realized and unrealized gain | | $ | 47,278,909 | |
| |
Net increase in net assets from operations | | $ | 110,117,152 | |
| | | | |
| | 31 | | See Notes to Financial Statements. |
High Income Opportunities Portfolio
October 31, 2012
Statements of Changes in Net Assets
| | | | | | | | |
| | | Year Ended October 31, | |
| Increase (Decrease) in Net Assets | | 2012 | | | 2011 | |
From operations — | | | | | | | | |
Net investment income | | $ | 62,838,243 | | | $ | 68,383,991 | |
Net realized gain (loss) from investment transactions, securities sold short and swap contracts | | | 6,874,865 | | | | (16,354,565 | ) |
Net change in unrealized appreciation (depreciation) from investments and swap contracts | | | 40,404,044 | | | | (1,758,985 | ) |
Net increase in net assets from operations | | $ | 110,117,152 | | | $ | 50,270,441 | |
Capital transactions — | | | | | | | | |
Contributions | | $ | 97,628,296 | | | $ | 185,626,627 | |
Withdrawals | | | (127,424,451 | ) | | | (221,059,169 | ) |
Net decrease in net assets from capital transactions | | $ | (29,796,155 | ) | | $ | (35,432,542 | ) |
| | |
Net increase in net assets | | $ | 80,320,997 | | | $ | 14,837,899 | |
| | |
| Net Assets | | | | | | | | |
At beginning of year | | $ | 866,997,178 | | | $ | 852,159,279 | |
At end of year | | $ | 947,318,175 | | | $ | 866,997,178 | |
| | | | |
| | 32 | | See Notes to Financial Statements. |
High Income Opportunities Portfolio
October 31, 2012
Supplementary Data
| | | | | | | | | | | | | | | | | | | | |
| | | Year Ended October 31, | |
| Ratios/Supplemental Data | | 2012 | | | 2011 | | | 2010 | | | 2009 | | | 2008 | |
Ratios (as a percentage of average daily net assets): | | | | | | | | | | | | | | | | | | | | |
Expenses(1) | | | 0.56 | % | | | 0.60 | % | | | 0.64 | % | | | 0.79 | % | | | 0.70 | % |
Net investment income | | | 7.06 | % | | | 7.67 | % | | | 8.65 | % | | | 11.34 | % | | | 9.38 | % |
Portfolio Turnover | | | 76 | % | | | 78 | % | | | 79 | % | | | 72 | % | | | 48 | % |
| | | | | |
Total Return | | | 13.20 | % | | | 5.90 | % | | | 19.52 | % | | | 38.97 | % | | | (29.08 | )% |
| | | | | |
Net assets, end of year (000’s omitted) | | $ | 947,318 | | | $ | 866,997 | | | $ | 852,159 | | | $ | 710,856 | | | $ | 480,061 | |
| (1) | Excludes the effect of custody fee credits, if any, of less than 0.005%. |
| | | | |
| | 33 | | See Notes to Financial Statements. |
High Income Opportunities Portfolio
October 31, 2012
Notes to Financial Statements
1 Significant Accounting Policies
High Income Opportunities Portfolio (the Portfolio) is a Massachusetts business trust registered under the Investment Company Act of 1940, as amended (the 1940 Act), as a diversified, open-end management investment company. The Portfolio’s investment objective is to provide a high level of current income. The Portfolio also seeks growth of capital as a secondary investment objective. The Declaration of Trust permits the Trustees to issue interests in the Portfolio. At October 31, 2012, Eaton Vance High Income Opportunities Fund, Eaton Vance Floating-Rate & High Income Fund, Eaton Vance Strategic Income Fund and Eaton Vance International (Cayman Islands) Strategic Income Fund held an interest of 51.8%, 19.1%, 22.8% and 3.8%, respectively, in the Portfolio.
The following is a summary of significant accounting policies of the Portfolio. The policies are in conformity with accounting principles generally accepted in the United States of America.
A Investment Valuation — Debt obligations (including short-term obligations with a remaining maturity of more than sixty days) are generally valued on the basis of valuations provided by third party pricing services, as derived from such services’ pricing models. Inputs to the models may include, but are not limited to, reported trades, executable bid and asked prices, broker/dealer quotations, prices or yields of securities with similar characteristics, benchmark curves or information pertaining to the issuer, as well as industry and economic events. The pricing services may use a matrix approach, which considers information regarding securities with similar characteristics to determine the valuation for a security. Short-term obligations purchased with a remaining maturity of sixty days or less are generally valued at amortized cost, which approximates market value. Interests in senior floating-rate loans (Senior Loans) for which reliable market quotations are readily available are valued generally at the average mean of bid and ask quotations obtained from a third party pricing service. Other Senior Loans are valued at fair value by the investment adviser under procedures approved by the Trustees. In fair valuing a Senior Loan, the investment adviser utilizes one or more of the valuation techniques described in (i) through (iii) below to assess the likelihood that the borrower will make a full repayment of the loan underlying such Senior Loan relative to yields on other Senior Loans issued by companies of comparable credit quality. If the investment adviser believes that there is a reasonable likelihood of full repayment, the investment adviser will determine fair value using a matrix pricing approach that considers the yield on the Senior Loan. If the investment adviser believes there is not a reasonable likelihood of full repayment, the investment adviser will determine fair value using analyses that include, but are not limited to: (i) a comparison of the value of the borrower’s outstanding equity and debt to that of comparable public companies; (ii) a discounted cash flow analysis; or (iii) when the investment adviser believes it is likely that a borrower will be liquidated or sold, an analysis of the terms of such liquidation or sale. In certain cases, the investment adviser will use a combination of analytical methods to determine fair value, such as when only a portion of a borrower’s assets are likely to be sold. In conducting its assessment and analyses for purposes of determining fair value of a Senior Loan, the investment adviser will use its discretion and judgment in considering and appraising relevant factors. Fair value determinations are made by the portfolio managers of the Portfolio based on information available to such managers. The portfolio managers of other funds managed by the investment adviser that invest in Senior Loans may not possess the same information about a Senior Loan borrower as the portfolio managers of the Portfolio. At times, the fair value of a Senior Loan determined by the portfolio managers of other funds managed by the investment adviser that invest in Senior Loans may vary from the fair value of the same Senior Loan determined by the portfolio managers of the Portfolio. The fair value of each Senior Loan is periodically reviewed and approved by the investment adviser’s Valuation Committee and by the Trustees based upon procedures approved by the Trustees. Junior Loans (i.e., subordinated loans and second lien loans) are valued in the same manner as Senior Loans. Equity securities (including common shares of closed-end investment companies) listed on a U.S. securities exchange generally are valued at the last sale or closing price on the day of valuation or, if no sales took place on such date, at the mean between the closing bid and asked prices therefore on the exchange where such securities are principally traded. Equity securities listed on the NASDAQ Global or Global Select Market generally are valued at the NASDAQ official closing price. Unlisted or listed securities for which closing sales prices or closing quotations are not available are valued at the mean between the latest available bid and asked prices or, in the case of preferred equity securities that are not listed or traded in the over-the-counter market, by a third party pricing service that will use various techniques that consider factors including, but not limited to, prices or yields of securities with similar characteristics, benchmark yields, broker/dealer quotes, quotes of underlying common stock, issuer spreads, as well as industry and economic events. Credit default swaps are normally valued using valuations provided by a third party pricing service. The pricing services employ electronic data processing techniques to determine the present value based on credit spread quotations obtained from broker/dealers and expected default recovery rates determined by the pricing service using proprietary models. Investments for which valuations or market quotations are not readily available or are deemed unreliable are valued at fair value using methods determined in good faith by or at the direction of the Trustees of the Portfolio in a manner that fairly reflects the security’s value, or the amount that the Portfolio might reasonably expect to receive for the security upon its current sale in the ordinary course. Each such determination is based on a consideration of relevant factors, which are likely to vary from one pricing context to another. These factors may include, but are not limited to, the type of security, the existence of any contractual restrictions on the security’s disposition, the price and extent of public trading in similar securities of the issuer or of comparable companies or entities, quotations or relevant information obtained from broker/dealers or other market participants, information obtained from the issuer, analysts, and/or the appropriate stock exchange (for exchange-traded securities), an analysis of the company’s or entity’s financial condition, and an evaluation of the forces that influence the issuer and the market(s) in which the security is purchased and sold.
The Portfolio may invest in Eaton Vance Cash Reserves Fund, LLC (Cash Reserves Fund), an affiliated investment company managed by Eaton Vance Management (EVM). Cash Reserves Fund generally values its investment securities utilizing the amortized cost valuation technique in accordance with Rule 2a-7 under the 1940 Act. This technique involves initially valuing a portfolio security at its cost and thereafter assuming a constant amortization to maturity of any discount or premium. If amortized cost is determined not to approximate fair value, Cash Reserves Fund may value its investment securities in the same manner as debt obligations described above.
High Income Opportunities Portfolio
October 31, 2012
Notes to Financial Statements — continued
B Investment Transactions — Investment transactions for financial statement purposes are accounted for on a trade date basis. Realized gains and losses on investments sold are determined on the basis of identified cost.
C Income — Interest income is recorded on the basis of interest accrued, adjusted for amortization of premium or accretion of discount. Fees associated with loan amendments are recognized immediately. Dividend income is recorded on the ex-dividend date for dividends received in cash and/or securities. Withholding taxes on foreign dividends have been provided for in accordance with the Portfolio’s understanding of the applicable countries’ tax rules and rates.
D Federal Taxes — The Portfolio has elected to be treated as a partnership for federal tax purposes. No provision is made by the Portfolio for federal or state taxes on any taxable income of the Portfolio because each investor in the Portfolio is ultimately responsible for the payment of any taxes on its share of taxable income. Since at least one of the Portfolio’s investors is a regulated investment company that invests all or substantially all of its assets in the Portfolio, the Portfolio normally must satisfy the applicable source of income and diversification requirements (under the Internal Revenue Code) in order for its investors to satisfy them. The Portfolio will allocate, at least annually among its investors, each investor’s distributive share of the Portfolio’s net investment income, net realized capital gains and any other items of income, gain, loss, deduction or credit.
As of October 31, 2012, the Portfolio had no uncertain tax positions that would require financial statement recognition, de-recognition, or disclosure. The Portfolio files a U.S. federal income tax return annually after its fiscal year-end, which is subject to examination by the Internal Revenue Service for a period of three years from the date of filing.
E Expense Reduction — State Street Bank and Trust Company (SSBT) serves as custodian of the Portfolio. Pursuant to the custodian agreement, SSBT receives a fee reduced by credits, which are determined based on the average daily cash balance the Portfolio maintains with SSBT. All credit balances, if any, used to reduce the Portfolio’s custodian fees are reported as a reduction of expenses in the Statement of Operations.
F Use of Estimates — The preparation of the financial statements in conformity with accounting principles generally accepted in the United States of America requires management to make estimates and assumptions that affect the reported amounts of assets and liabilities at the date of the financial statements and the reported amounts of income and expense during the reporting period. Actual results could differ from those estimates.
G Indemnifications — Under the Portfolio’s organizational documents, its officers and Trustees may be indemnified against certain liabilities and expenses arising out of the performance of their duties to the Portfolio. Under Massachusetts law, if certain conditions prevail, interestholders in the Portfolio could be deemed to have personal liability for the obligations of the Portfolio. However, the Portfolio’s Declaration of Trust contains an express disclaimer of liability on the part of Portfolio interestholders and the By-laws provide that the Portfolio shall assume the defense on behalf of any Portfolio interestholder. Moreover, the By-laws also provide for indemnification out of Portfolio property of any interestholder held personally liable solely by reason of being or having been an interestholder for all loss or expense arising from such liability. Additionally, in the normal course of business, the Portfolio enters into agreements with service providers that may contain indemnification clauses. The Portfolio’s maximum exposure under these arrangements is unknown as this would involve future claims that may be made against the Portfolio that have not yet occurred.
H Credit Default Swaps — When the Portfolio is the buyer of a credit default swap contract, the Portfolio is entitled to receive the par (or other agreed-upon) value of a referenced debt obligation (or basket of debt obligations) from the counterparty to the contract if a credit event by a third party, such as a U.S. or foreign corporate issuer, on the debt obligation occurs. In return, the Portfolio pays the counterparty a periodic stream of payments over the term of the contract provided that no credit event has occurred. If no credit event occurs, the Portfolio would have spent the stream of payments and received no proceeds from the contract. When the Portfolio is the seller of a credit default swap contract, it receives the stream of payments, but is obligated to pay to the buyer of the protection an amount up to the notional amount of the swap and in certain instances take delivery of securities of the reference entity upon the occurrence of a credit event, as defined under the terms of that particular swap agreement. Credit events are contract specific but may include bankruptcy, failure to pay, restructuring, obligation acceleration and repudiation/moratorium. If the Portfolio is a seller of protection and a credit event occurs, the maximum potential amount of future payments that the Portfolio could be required to make would be an amount equal to the notional amount of the agreement. This potential amount would be partially offset by any recovery value of the respective referenced obligation, or net amount received from the settlement of a buy protection credit default swap agreement entered into by the Portfolio for the same referenced obligation. As the seller, the Portfolio may create economic leverage to its portfolio because, in addition to its total net assets, the Portfolio is subject to investment exposure on the notional amount of the swap. The interest fee paid or received on the swap contract, which is based on a specified interest rate on a fixed notional amount, is accrued daily as a component of unrealized appreciation (depreciation) and is recorded as realized gain upon receipt or realized loss upon payment. The Portfolio also records an increase or decrease to unrealized appreciation (depreciation) in an amount equal to the daily valuation. Upfront payments or receipts, if any, are recorded as other assets or other liabilities, respectively, and amortized over the life of the swap contract as realized gains or losses. For financial reporting purposes, unamortized upfront payments, if any, are netted with unrealized appreciation or depreciation on swap contracts to determine the market value of swaps as presented in Note 6 and 9. The Portfolio segregates assets in the form of cash or liquid securities in an amount equal to the notional amount of the credit default swaps of which it is the seller. The Portfolio segregates assets in the form of cash or liquid securities in an amount equal to any unrealized depreciation of the credit default swaps of which it is the buyer, marked to market on a daily basis. These transactions involve certain risks, including the risk that the seller may be unable to fulfill the transaction.
I Securities Sold Short — A short sale is a transaction in which the Portfolio sells a security it does not own in anticipation of a decline in the market value of that security. To complete such a transaction, the Portfolio must borrow the security to make delivery to the buyer with an obligation to replace such borrowed security at a later date. Until the security is replaced, the Portfolio is required to repay the lender any interest, which accrues during the period of
High Income Opportunities Portfolio
October 31, 2012
Notes to Financial Statements — continued
the loan. The proceeds received from a short sale are recorded as a liability and the Portfolio records an unrealized gain or loss to the extent of the difference between the proceeds received and the value of the open short position on the day of determination. A gain, limited to the price at which the Portfolio sold the security short, or a loss, potentially unlimited as there is no upward limit on the price of a security, is recorded when the short position is terminated. Interest payable on securities sold short is recorded as an expense.
2 Investment Adviser Fee and Other Transactions with Affiliates
The investment adviser fee is earned by Boston Management and Research (BMR), a subsidiary of EVM, as compensation for investment advisory services rendered to the Portfolio. The fee is computed at an annual rate of 0.30% of the Portfolio’s average daily net assets up to $500 million, 0.275% from $500 million up to $1 billion and at reduced rates on daily net assets of $1 billion or more; plus 3.00% of the Portfolio’s daily gross income (i.e., income other than gains from the sale of securities) when daily net assets are less than $500 million, 2.75% when daily net assets are $500 million but less than $1 billion, and at reduced rates on daily net assets of $1 billion or more, and is payable monthly. The Portfolio invests its cash in Cash Reserves Fund. EVM does not currently receive a fee for advisory services provided to Cash Reserves Fund. For the year ended October 31, 2012, the Portfolio’s investment adviser fee amounted to $4,597,545 or 0.52% of the Portfolio’s average daily net assets.
Trustees and officers of the Portfolio who are members of EVM’s or BMR’s organizations receive remuneration for their services to the Portfolio out of the investment adviser fee. Trustees of the Portfolio who are not affiliated with the investment adviser may elect to defer receipt of all or a percentage of their annual fees in accordance with the terms of the Trustees Deferred Compensation Plan. For the year ended October 31, 2012, no significant amounts have been deferred. Certain officers and Trustees of the Portfolio are officers of the above organizations.
3 Purchases and Sales of Investments
Purchases and sales of investments, other than short-term obligations and including maturities, paydowns and principal repayments on Senior Loans, aggregated $700,575,280 and $645,354,977, respectively, for the year ended October 31, 2012.
4 Federal Income Tax Basis of Investments
The cost and unrealized appreciation (depreciation) of investments of the Portfolio at October 31, 2012, as determined on a federal income tax basis, were as follows:
| | | | |
| |
Aggregate cost | | $ | 887,522,227 | |
| |
Gross unrealized appreciation | | $ | 62,388,349 | |
Gross unrealized depreciation | | | (26,518,820 | ) |
| |
Net unrealized appreciation | | $ | 35,869,529 | |
5 Restricted Securities
At October 31, 2012, the Portfolio owned the following securities (representing 2.0% of net assets) which were restricted as to public resale and not registered under the Securities Act of 1933 (excluding Rule 144A securities). The Portfolio has various registration rights (exercisable under a variety of circumstances) with respect to these securities. The value of these securities is determined based on valuations provided by brokers when available, or if not available, they are valued at fair value using methods determined in good faith by or at the direction of the Trustees.
| | | | | | | | | | | | | | | | |
| Description | | Date of Acquisition | | | Principal Amount/ Shares | | | Cost | | | Value | |
| | | |
Convertible Bonds | | | | | | | | | | | | | |
Mood Media Corp. | | | 7/30/12 | | | $ | 37,000 | | | $ | 0 | | | $ | 38,332 | |
| | | | |
Total Convertible Bonds | | | | | | | | | | $ | 0 | | | $ | 38,332 | |
| | | |
Common Stocks | | | | | | | | | | | | | |
HF Holdings, Inc. | | | 10/27/09 | | | | 13,600 | | | $ | 730,450 | | | $ | 158,576 | |
Panolam Holdings Co. | | | 12/30/09 | | | | 3,117 | | | | 1,712,791 | | | | 5,502,066 | |
| | | | |
Total Common Stocks | | | | | | | | | | $ | 2,443,241 | | | $ | 5,660,642 | |
High Income Opportunities Portfolio
October 31, 2012
Notes to Financial Statements — continued
| | | | | | | | | | | | | | | | |
| Description | | Date of Acquisition | | | Principal Amount/ Shares | | | Cost | | | Value | |
| | | |
Miscellaneous | | | | | | | | | | | | | |
BLB Worldwide Holdings, Inc., Contingent Value Rights, Expires 11/5/17 | | | 11/22/10 | | | | 5,410 | | | $ | 94,675 | | | $ | 36,518 | |
| | | | |
Total Miscellaneous | | | | | | | | | | $ | 94,675 | | | $ | 36,518 | |
| | | |
Warrants | | | | | | | | | | | | | |
Peninsula Gaming, LLC, Convertible Preferred Membership Interests | | | 7/8/99 | | | | 25,351 | | | $ | 0 | | | $ | 8,872,920 | |
PGP Investors, LLC, Membership Interests | | | 10/23/12 | | | | 11,429 | | | | 4,000,000 | | | | 4,000,000 | |
Reader’s Digest Association, Inc. (The), Expires 2/14/19 | | | 4/26/10 | | | | 17,588 | | | | 0 | | | | 0 | |
| | | | |
Total Warrants | | | | | | | | | | $ | 4,000,000 | | | $ | 12,872,920 | |
| | | |
Total Restricted Securities | | | | | | | $ | 6,537,916 | | | $ | 18,608,412 | |
6 Financial Instruments
The Portfolio may trade in financial instruments with off-balance sheet risk in the normal course of its investing activities. These financial instruments may include swap contracts and may involve, to a varying degree, elements of risk in excess of the amounts recognized for financial statement purposes. The notional or contractual amounts of these instruments represent the investment the Portfolio has in particular classes of financial instruments and do not necessarily represent the amounts potentially subject to risk. The measurement of the risks associated with these instruments is meaningful only when all related and offsetting transactions are considered.
A summary of obligations under these financial instruments at October 31, 2012 is as follows:
| | | | | | | | | | | | | | | | | | | | | | | | | | | | |
| Credit Default Swaps — Sell Protection | |
| Counterparty | | Reference Entity | | Credit
Rating* | | Notional
Amount**
(000’s
omitted) | | | Receive
Annual
Fixed
Rate | | | Termination
Date | | | Market
Value | | | Upfront
Payments
Received
(Paid) | | | Net
Unrealized
Appreciation
(Depreciation) | |
| | | | | | | | |
| Bank of America NA | | Amkor Technology, Inc. | | Ba3/BB | | $ | 1,150 | | | | 5.00 | %(1) | | | 6/20/15 | | | $ | 34,932 | | | $ | 26,897 | | | $ | 61,829 | |
| Barclays Bank PLC | | Amkor Technology, Inc. | | Ba3/BB | | | 2,000 | | | | 5.00 | (1) | | | 6/20/15 | | | | 60,751 | | | | 72,685 | | | | 133,436 | |
| Citibank NA | | Meritor, Inc. | | B3/B- | | | 1,745 | | | | 5.00 | (1) | | | 6/20/15 | | | | (90,218 | ) | | | 61,974 | | | | (28,244 | ) |
| Credit Suisse International | | Ford Motor Co. | | Baa3/BB+ | | | 1,000 | | | | 5.00 | (1) | | | 12/20/16 | | | | 125,703 | | | | (1,667 | ) | | | 124,036 | |
| Deutsche Bank | | Ford Motor Co. | | Baa3/BB+ | | | 1,100 | | | | 5.00 | (1) | | | 9/20/16 | | | | 134,019 | | | | (37,648 | ) | | | 96,371 | |
| Deutsche Bank | | Ford Motor Co. | | Baa3/BB+ | | | 1,100 | | | | 5.00 | (1) | | | 9/20/16 | | | | 134,019 | | | | (67,379 | ) | | | 66,640 | |
| Deutsche Bank | | Ford Motor Co. | | Baa3/BB+ | | | 2,100 | | | | 5.00 | (1) | | | 12/20/16 | | | | 263,976 | | | | (87,893 | ) | | | 176,083 | |
| Goldman Sachs International | | Ford Motor Co. | | Baa3/BB+ | | | 1,100 | | | | 5.00 | (1) | | | 9/20/16 | | | | 134,019 | | | | (43,602 | ) | | | 90,417 | |
| Goldman Sachs International | | Ford Motor Co. | | Baa3/BB+ | | | 2,100 | | | | 5.00 | (1) | | | 12/20/16 | | | | 263,976 | | | | (65,110 | ) | | | 198,866 | |
| JPMorgan Chase Bank NA | | Meritor, Inc. | | B3/B- | | | 300 | | | | 5.00 | (1) | | | 6/20/15 | | | | (15,510 | ) | | | 13,057 | | | | (2,453 | ) |
| | | | | | | | |
Total | | | | | | $ | 13,695 | | | | | | | | | | | $ | 1,045,667 | | | $ | (128,686 | ) | | $ | 916,981 | |
| * | Credit ratings are those of Moody’s Investors Service, Inc. and Standard & Poor’s Corp. The credit rating of the reference debt obligation (together with the unrealized appreciation or depreciation on the swap) are a representative measure of the current payment/performance risk of the credit default swap. A lower credit rating increases the probability of the occurrence of a credit event. |
| ** | If the Portfolio is the seller of credit protection, the notional amount is the maximum potential amount of future payments the Portfolio could be required to make if a credit event, as defined in the credit default swap agreement, were to occur. At October 31, 2012, such maximum potential amount for all open credit default swaps in which the Portfolio is the seller was $13,695,000. |
| (1) | Upfront payment is exchanged with the counterparty as a result of the standardized trading coupon. |
At October 31, 2012, the Portfolio had sufficient cash and/or securities to cover commitments under these contracts.
The Portfolio is subject to credit risk in the normal course of pursuing its investment objectives. The Portfolio enters into credit default swap contracts to manage its credit risk, to gain exposure to a credit in which it may otherwise invest, or to enhance return.
High Income Opportunities Portfolio
October 31, 2012
Notes to Financial Statements — continued
The Portfolio enters into swap contracts that may contain provisions whereby the counterparty may terminate the contract under certain conditions, including but not limited to a decline in the Portfolio’s net assets below a certain level over a certain period of time, which would trigger a payment by the Portfolio for those swaps in a liability position. At October 31, 2012, the fair value, excluding upfront payments, of derivatives with credit-related contingent features in a net liability position was $30,697.
The non-exchange traded derivatives in which the Portfolio invests, including swap contracts, are subject to the risk that the counterparty to the contract fails to perform its obligations under the contract. At October 31, 2012, the maximum amount of loss the Portfolio would incur due to counterparty risk was $947,678, with the highest amount from any one counterparty being $339,094. Such maximum amount would be reduced by any unamortized upfront payments received by the Portfolio. Such amount would be increased by any unamortized upfront payments made by the Portfolio. To mitigate this risk, the Portfolio has entered into master netting agreements with substantially all its derivative counterparties, which allows it and a counterparty to aggregate amounts owed by each of them for derivative transactions under the agreement into a single net amount payable by either the Portfolio or the counterparty. Counterparties may be required to pledge collateral in the form of cash, U.S. Government securities or highly-rated bonds for the benefit of the Portfolio if the net amount due from the counterparty with respect to a derivative contract exceeds a certain threshold. The amount of collateral posted by the counterparties with respect to such contracts would also reduce the amount of any loss incurred.
The fair value of open derivative instruments (not considered to be hedging instruments for accounting disclosure purposes) and whose primary underlying risk exposure is credit risk at October 31, 2012 was as follows:
| | | | | | | | |
| | | Fair Value | |
| Derivative | | Asset Derivative | | | Liability Derivative | |
| | |
Credit default swap contracts | | $ | 1,151,395 | (1) | | $ | (105,728 | )(2) |
| (1) | Statement of Assets and Liabilities location: Receivable for open swap contracts; Premium paid/received on open swap contracts. |
| (2) | Statement of Assets and Liabilities location: Payable for open swap contracts; Premium paid/received on open swap contracts. |
The effect of derivative instruments (not considered to be hedging instruments for accounting disclosure purposes) on the Statement of Operations and whose primary underlying risk exposure is credit risk for the year ended October 31, 2012 was as follows:
| | | | | | | | |
| Derivative | | Realized Gain (Loss)
on Derivatives Recognized
in Income | | | Change in Unrealized
Appreciation (Depreciation) on
Derivatives Recognized in Income | |
| | |
Credit default swap contracts | | $ | (57,900 | )(1) | | $ | 1,346,663 | (2) |
| (1) | Statement of Operations location: Net realized gain (loss) – Swap contracts. |
| (2) | Statement of Operations location: Change in unrealized appreciation (depreciation) – Swap contracts. |
The average notional amount of credit default swap contracts outstanding during the year ended October 31, 2012, which is indicative of the volume of this derivative type, was approximately $33,582,000.
7 Line of Credit
The Portfolio participates with other portfolios and funds managed by EVM and its affiliates in a $600 million unsecured line of credit agreement with a group of banks. Borrowings are made by the Portfolio solely to facilitate the handling of unusual and/or unanticipated short-term cash requirements. Interest is charged to the Portfolio based on its borrowings at an amount above either the Eurodollar rate or Federal Funds rate. In addition, a fee computed at an annual rate of 0.08% on the daily unused portion of the line of credit is allocated among the participating portfolios and funds at the end of each quarter. Because the line of credit is not available exclusively to the Portfolio, it may be unable to borrow some or all of its requested amounts at any particular time. The Portfolio did not have any significant borrowings or allocated fees during the year ended October 31, 2012.
8 Credit Risk
The Portfolio regularly invests in lower rated and comparable quality unrated high yield securities. These investments have different risks than investments in debt securities rated investment grade and held by the Portfolio. Risk of loss upon default by the borrower is significantly greater with respect to such debt than with other debt securities because these securities are generally unsecured and are more sensitive to adverse economic conditions, such as recession or increasing interest rates, than are investment grade issuers.
High Income Opportunities Portfolio
October 31, 2012
Notes to Financial Statements — continued
9 Fair Value Measurements
Under generally accepted accounting principles for fair value measurements, a three-tier hierarchy to prioritize the assumptions, referred to as inputs, is used in valuation techniques to measure fair value. The three-tier hierarchy of inputs is summarized in the three broad levels listed below.
| Ÿ | | Level 1 – quoted prices in active markets for identical investments |
| Ÿ | | Level 2 – other significant observable inputs (including quoted prices for similar investments, interest rates, prepayment speeds, credit risk, etc.) |
| Ÿ | | Level 3 – significant unobservable inputs (including a fund’s own assumptions in determining the fair value of investments) |
In cases where the inputs used to measure fair value fall in different levels of the fair value hierarchy, the level disclosed is determined based on the lowest level input that is significant to the fair value measurement in its entirety. The inputs or methodology used for valuing securities are not necessarily an indication of the risk associated with investing in those securities.
At October 31, 2012, the hierarchy of inputs used in valuing the Portfolio’s investments and open derivative instruments, which are carried at value, were as follows:
| | | | | | | | | | | | | | | | |
| Asset Description | | Level 1 | | | Level 2 | | | Level 3 | | | Total | |
| | | | |
Corporate Bonds & Notes | | $ | — | | | $ | 795,019,658 | | | $ | 1,701,655 | | | $ | 796,721,313 | |
Senior Floating-Rate Interests | | | — | | | | 71,165,313 | | | | — | | | | 71,165,313 | |
Convertible Bonds | | | — | | | | 3,219,587 | | | | 38,332 | | | | 3,257,919 | |
Common Stocks | | | 11,917,087 | | | | 45,492 | | | | 5,660,642 | | | | 17,623,221 | |
Convertible Preferred Stocks | | | 933,620 | | | | — | | | | — | | | | 933,620 | |
Preferred Stocks | | | 3,392,972 | | | | — | | | | — | | | | 3,392,972 | |
Miscellaneous | | | — | | | | 436,468 | | | | 0 | | | | 436,468 | |
Warrants | | | — | | | | 307,848 | | | | 12,872,920 | | | | 13,180,768 | |
Short-Term Investments | | | — | | | | 16,680,162 | | | | — | | | | 16,680,162 | |
| | | | |
Total Investments | | $ | 16,243,679 | | | $ | 886,874,528 | | | $ | 20,273,549 | | | $ | 923,391,756 | |
Credit Default Swaps | | $ | — | | | $ | 1,151,395 | | | $ | — | | | $ | 1,151,395 | |
| | | | |
Total | | $ | 16,243,679 | | | $ | 888,025,923 | | | $ | 20,273,549 | | | $ | 924,543,151 | |
| | | | |
Liability Description | | | | | | | | | | | | | | | | |
Credit Default Swaps | | $ | — | | | $ | (105,728 | ) | | $ | — | | | $ | (105,728 | ) |
| | | | |
Total | | $ | — | | | $ | (105,728 | ) | | $ | — | | | $ | (105,728 | ) |
High Income Opportunities Portfolio
October 31, 2012
Notes to Financial Statements — continued
The following is a reconciliation of Level 3 assets for which significant unobservable inputs were used to determine fair value:
| | | | | | | | | | | | | | | | | | | | | | | | |
| | | Investments
in Corporate
Bonds &
Notes | | | Investments
in Convertible
Bonds | | | Investments
in Common
Stocks | | | Investments
in Miscellaneous | | | Investments
in Warrants | | | Total | |
| | | | | | |
Balance as of October 31, 2011 | | $ | 2,176,783 | | | $ | — | | | $ | 9,929,384 | | | $ | 182,028 | | | $ | 2,307,466 | | | $ | 14,595,661 | |
Realized gains (losses) | | | (5,194,283 | ) | | | — | | | | 8,779,712 | | | | (93,725 | ) | | | — | | | | 3,491,704 | |
Change in net unrealized appreciation (depreciation)* | | | 5,356,152 | | | | 38,332 | | | | (3,025,207 | ) | | | (152,856 | ) | | | 6,565,454 | | | | 8,781,875 | |
Cost of purchases(1) | | | — | | | | 0 | | | | — | | | | — | | | | 4,000,000 | | | | 4,000,000 | |
Proceeds from sales(1) | | | (641,446 | ) | | | — | | | | (10,023,247 | ) | | | — | | | | — | | | | (10,664,693 | ) |
Accrued discount (premium) | | | 4,449 | | | | — | | | | — | | | | — | | | | — | | | | 4,449 | |
Transfers to Level 3** | | | — | | | | — | | | | — | | | | 64,553 | | | | — | | | | 64,553 | |
Transfers from Level 3** | | | — | | | | — | | | | — | | | | — | | | | — | | | | — | |
| | | | | | |
Balance as of October 31, 2012 | | $ | 1,701,655 | | | $ | 38,332 | | | $ | 5,660,642 | | | $ | 0 | | | $ | 12,872,920 | | | $ | 20,273,549 | |
| | | | | | |
Change in net unrealized appreciation (depreciation) on investments still held as of October 31, 2012* | | $ | (108,335 | ) | | $ | 38,332 | | | $ | 2,932,367 | | | $ | (64,553 | ) | | $ | 6,565,454 | | | $ | 9,363,265 | |
| * | Amount is included in the related amount on investments in the Statement of Operations. |
| ** | Transfers are reflected at the value of the securities at the beginning of the period. Transfers from Level 2 to Level 3 were due to a reduction in the availability of significant observable inputs in determining the fair value of these investments. |
| (1) | Cost of purchases may include securities received in corporate actions; proceeds from sales may include securities delivered in corporate actions. |
The valuation techniques and significant amounts of unobservable inputs used in the fair value measurements of the Portfolio’s Level 3 securities are outlined below:
| | | | | | | | | | |
| Asset | | ($ in thousands) | | | Valuation Technique | | Unobservable Inputs | | Range (Weighted
Average) |
| | | | |
Corporate Bonds & Notes | | | 1,702 | | | Discounted cash flow | | Yield | | 15% – 25% (20%) |
| | | | | | | | Probability of default | | 50% – 100% (100%) |
| | | | | | | | Loss severity | | 10% – 50% (20%) |
Convertible Bonds | | | 38 | | | Market comparable bond pricing model | | Spread | | 1% – 3% (2%) |
| | | | | | | | Discount for lack of marketability | | 10% – 25% (15%) |
Common Stocks | | | 5,661 | | | Market comparable companies | | EBITDA multiple | | 3.8 – 12.2 (7.8) |
| | | | | | | | Discount for lack of marketability | | 10% – 25% (15%) |
Warrants | | | 12,873 | | | Consensus pricing | | Share tender offered quote | | $350 |
| | | | | | | | Discount for lack of marketability | | 0% – 10% (0%) |
EBITDA - Earnings Before Interest, Taxes, Depreciation and Amortization
For the unobservable inputs listed in the table above, a significant increase in the loss severity or discount for lack of marketability, or a decrease in the tender price offered could result in a decrease to the fair value measurement. A significant increase in EBITDA multiples could result in an increase to the fair value measurement. Conversely, significant movements in the opposite direction in each of these unobservable inputs could have the inverse effect on the fair value measurement.
At October 31, 2012, there were no investments transferred between Level 1 and Level 2 during the year then ended.
High Income Opportunities Portfolio
October 31, 2012
Report of Independent Registered Public Accounting Firm
To the Trustees and Investors of High Income Opportunities Portfolio:
We have audited the accompanying statement of assets and liabilities of High Income Opportunities Portfolio (“the Portfolio”), including the portfolio of investments, as of October 31, 2012, and the related statement of operations for the year then ended, the statements of changes in net assets for each of the two years in the period then ended, and the supplementary data for each of the five years in the period then ended. These financial statements and supplementary data are the responsibility of the Portfolio’s management. Our responsibility is to express an opinion on these financial statements and supplementary data based on our audits.
We conducted our audits in accordance with the standards of the Public Company Accounting Oversight Board (United States). Those standards require that we plan and perform the audit to obtain reasonable assurance about whether the financial statements and supplementary data are free of material misstatement. The Portfolio is not required to have, nor were we engaged to perform, an audit of its internal control over financial reporting. Our audits included consideration of internal control over financial reporting as a basis for designing audit procedures that are appropriate in the circumstances, but not for the purpose of expressing an opinion on the effectiveness of the Portfolio’s internal control over financial reporting. Accordingly, we express no such opinion. An audit also includes examining, on a test basis, evidence supporting the amounts and disclosures in the financial statements, assessing the accounting principles used and significant estimates made by management, as well as evaluating the overall financial statement presentation. Our procedures included confirmation of securities and senior loans owned as of October 31, 2012, by correspondence with the custodian, brokers, and selling or agent banks; where replies were not received from brokers and selling or agent banks, we performed other auditing procedures. We believe that our audits provide a reasonable basis for our opinion.
In our opinion, such financial statements and supplementary data referred to above present fairly, in all material respects, the financial position of High Income Opportunities Portfolio as of October 31, 2012, the results of its operations for the year then ended, the changes in its net assets for each of the two years in the period then ended, and the supplementary data for each of the five years in the period then ended, in conformity with accounting principles generally accepted in the United States of America.
DELOITTE & TOUCHE LLP
Boston, Massachusetts
December 20, 2012
Eaton Vance
High Income Opportunities Fund
October 31, 2012
Management and Organization
Fund Management. The Trustees of Eaton Vance Mutual Funds Trust (the Trust) and High Income Opportunities Portfolio (the Portfolio) are responsible for the overall management and supervision of the Trust’s and Portfolio’s affairs. The Trustees and officers of the Trust and the Portfolio are listed below. Except as indicated, each individual has held the office shown or other offices in the same company for the last five years. Trustees and officers of the Trust and the Portfolio hold indefinite terms of office. The “Noninterested Trustees” consist of those Trustees who are not “interested persons” of the Trust and the Portfolio, as that term is defined under the 1940 Act. The business address of each Trustee and officer is Two International Place, Boston, Massachusetts 02110. As used below, “EVC” refers to Eaton Vance Corp., “EV” refers to Eaton Vance, Inc., “EVM” refers to Eaton Vance Management, “BMR” refers to Boston Management and Research and “EVD” refers to Eaton Vance Distributors, Inc. EVC and EV are the corporate parent and trustee, respectively, of EVM and BMR. EVD is the Fund’s principal underwriter, the Portfolio’s placement agent and a wholly-owned subsidiary of EVC. Each officer affiliated with Eaton Vance may hold a position with other Eaton Vance affiliates that is comparable to his or her position with EVM listed below. Each Trustee oversees 187 portfolios in the Eaton Vance Complex (including all master and feeder funds in a master feeder structure). Each officer serves as an officer of certain other Eaton Vance funds. Each Trustee and officer serves until his or her successor is elected.
| | | | | | |
| Name and Year of Birth | | Position(s) with the Trust and the
Portfolio | | Length of
Service | �� | Principal Occupation(s) and Directorships
During Past Five Years and Other Relevant Experience |
Interested Trustee |
| | | |
Thomas E. Faust Jr. 1958 | | Trustee | | Since 2007 | | Chairman, Chief Executive Officer and President of EVC, Director and President of EV, Chief Executive Officer and President of EVM and BMR, and Director of EVD. Trustee and/or officer of 187 registered investment companies. Mr. Faust is an interested person because of his positions with EVM, BMR, EVD, EVC and EV, which are affiliates of the Trust and the Portfolio. Directorships in the Last Five Years.(1) Director of EVC and Hexavest Inc. |
| | | |
| | | | | | |
Noninterested Trustees |
| | | |
Scott E. Eston 1956 | | Trustee | | Since 2011 | | Private investor. Formerly held various positions at Grantham, Mayo, Van Otterloo and Co., L.L.C. (investment management firm) (1997-2009), including Chief Operating Officer (2002-2009), Chief Financial Officer (1997-2009) and Chairman of the Executive Committee (2002-2008); President and Principal Executive Officer, GMO Trust (open-end registered investment company) (2006-2009). Former Partner, Coopers and Lybrand L.L.P. (now PricewaterhouseCoopers) (public accounting firm) (1987-1997). Directorships in the Last Five Years. None. |
| | | |
Benjamin C. Esty 1963 | | Trustee | | Since 2005 | | Roy and Elizabeth Simmons Professor of Business Administration and Finance Unit Head, Harvard University Graduate School of Business Administration. Directorships in the Last Five Years.(1) None. |
| | | |
Allen R. Freedman 1940 | | Trustee | | Since 2007 | | Private Investor. Former Chairman (2002-2004) and a Director (1983-2004) of Systems & Computer Technology Corp. (provider of software to higher education). Formerly, a Director of Loring Ward International (fund distributor) (2005-2007). Former Chairman and a Director of Indus International, Inc. (provider of enterprise management software to the power generating industry) (2005-2007). Former Chief Executive Officer of Assurant, Inc. (insurance provider) (1979-2000). Directorships in the Last Five Years.(1) Director of Stonemor Partners, L.P. (owner and operator of cemeteries). Formerly, Director of Assurant, Inc. (insurance provider) (1979-2011). |
| | | |
William H. Park 1947 | | Trustee | | Since 2003 | | Consultant and private investor. Formerly, Chief Financial Officer, Aveon Group L.P. (investment management firm) (2010-2011). Formerly, Vice Chairman, Commercial Industrial Finance Corp. (specialty finance company) (2006-2010). Formerly, President and Chief Executive Officer, Prizm Capital Management, LLC (investment management firm) (2002-2005). Formerly, Executive Vice President and Chief Financial Officer, United Asset Management Corporation (investment management firm) (1982-2001). Formerly, Senior Manager, Price Waterhouse (now PricewaterhouseCoopers) (an independent registered public accounting firm) (1972-1981). Directorships in the Last Five Years.(1) None. |
Eaton Vance
High Income Opportunities Fund
October 31, 2012
Management and Organization — continued
| | | | | | |
| Name and Year of Birth | | Position(s) with the Trust and the
Portfolio | | Length of
Service | | Principal Occupation(s) and Directorships
During Past Five Years and Other Relevant Experience |
Noninterested Trustees (continued) |
| | | |
Ronald A. Pearlman 1940 | | Trustee | | Since 2003 | | Professor of Law, Georgetown University Law Center. Formerly, Deputy Assistant Secretary (Tax Policy) and Assistant Secretary (Tax Policy), U.S. Department of the Treasury (1983-1985). Formerly, Chief of Staff, Joint Committee on Taxation, U.S. Congress (1988-1990). Directorships in the Last Five Years.(1) None. |
| | | |
Helen Frame Peters 1948 | | Trustee | | Since 2008 | | Professor of Finance, Carroll School of Management, Boston College. Formerly, Dean, Carroll School of Management, Boston College (2000-2002). Formerly, Chief Investment Officer, Fixed Income, Scudder Kemper Investments (investment management firm) (1998-1999). Formerly, Chief Investment Officer, Equity and Fixed Income, Colonial Management Associates (investment management firm) (1991-1998). Directorships in the Last Five Years.(1) Formerly, Director of BJ’s Wholesale Club, Inc. (wholesale club retailer) (2004-2011). Formerly, Trustee of SPDR Index Shares Funds and SPDR Series Trust (exchange traded funds) (2000-2009). Formerly, Director of Federal Home Loan Bank of Boston (a bank for banks) (2007-2009). |
| | | |
Lynn A. Stout 1957 | | Trustee | | Since 1998 | | Distinguished Professor of Corporate and Business Law, Jack G. Clarke Business Law Institute, Cornell University Law School. Formerly, the Paul Hastings Professor of Corporate and Securities Law (2006-2012) and Professor of Law (2001-2006), University of California at Los Angeles School of Law. Directorships in the Last Five Years.(1) None. |
| | | |
Harriett Tee Taggart 1948 | | Trustee | | Since 2011 | | Managing Director, Taggart Associates (a professional practice firm). Formerly, Partner and Senior Vice President, Wellington Management Company, LLP (investment management firm) (1983-2006). Directorships in the Last Five Years. Director of Albemarle Corporation (chemicals manufacturer) (since 2007) and The Hanover Group (specialty property and casualty insurance company) (since 2009). Formerly, Director of Lubrizol Corporation (specialty chemicals) (2007-2011). |
| | | |
Ralph F. Verni 1943 | | Chairman of the Board and Trustee | | Chairman of the Board since 2007 and Trustee since 2005 | | Consultant and private investor. Formerly, Chief Investment Officer (1982-1992), Chief Financial Officer (1988-1990) and Director (1982-1992), New England Life. Formerly, Chairperson, New England Mutual Funds (1982-1992). Formerly, President and Chief Executive Officer, State Street Management & Research (1992-2000). Formerly, Chairperson, State Street Research Mutual Funds (1992-2000). Formerly, Director, W.P. Carey, LLC (1998-2004) and First Pioneer Farm Credit Corp. (2002-2006). Directorships in the Last Five Years.(1) None. |
| | | |
| | | | | | |
Principal Officers who are not Trustees | | |
| Name and Year of Birth | | Position(s)
with the Trust and the
Portfolio | | Length of Service | | Principal Occupation(s) During Past Five Years |
Duncan W. Richardson 1957 | | President of the Trust | | Since 2011 | | Director of EVC and Executive Vice President and Chief Equity Investment Officer of EVC, EVM and BMR. |
| | | |
Michael W. Weilheimer 1961 | | President of the Portfolio | | Since 2002 | | Vice President of EVM and BMR. |
| | | |
Payson F. Swaffield 1956 | | Vice President | | Since 2011 | | Vice President and Chief Income Investment Officer of EVM and BMR. |
| | | |
Barbara E. Campbell 1957 | | Treasurer | | Of the Trust since 2005 and of the Portfolio since 2008 | | Vice President of EVM and BMR. |
Eaton Vance
High Income Opportunities Fund
October 31, 2012
Management and Organization — continued
| | | | | | |
| Name and Year of Birth | | Position(s)
with the Trust and the
Portfolio | | Length of Service | | Principal Occupation(s) During Past Five Years |
Principal Officers who are not Trustees (continued) |
| | | |
Maureen A. Gemma 1960 | | Vice President, Secretary and Chief Legal Officer | | Vice President since 2011; Secretary since 2007 and Chief Legal Officer since 2008 | | Vice President of EVM and BMR. |
| | | |
Paul M. O’Neil 1953 | | Chief Compliance Officer | | Since 2004 | | Vice President of EVM and BMR. |
| (1) | During their respective tenures, the Trustees (except Mr. Eston and Ms. Taggart) also served as trustees of one or more of the following Eaton Vance funds (which operated in the years noted): Eaton Vance Credit Opportunities Fund (launched in 2005 and terminated in 2010); Eaton Vance Insured Florida Plus Municipal Bond Fund (launched in 2002 and terminated in 2009); and Eaton Vance National Municipal Income Trust (launched in 1998 and terminated in 2009). |
The SAI for the Fund includes additional information about the Trustees and officers of the Fund and the Portfolio and can be obtained without charge on Eaton Vance’s website at www.eatonvance.com or by calling 1-800-262-1122.
Eaton Vance Funds
IMPORTANT NOTICES
Privacy. The Eaton Vance organization is committed to ensuring your financial privacy. Each of the financial institutions identified below has in effect the following policy (“Privacy Policy”) with respect to nonpublic personal information about its customers:
| Ÿ | | Only such information received from you, through application forms or otherwise, and information about your Eaton Vance fund transactions will be collected. This may include information such as name, address, social security number, tax status, account balances and transactions. |
| Ÿ | | None of such information about you (or former customers) will be disclosed to anyone, except as permitted by law (which includes disclosure to employees necessary to service your account). In the normal course of servicing a customer’s account, Eaton Vance may share information with unaffiliated third parties that perform various required services such as transfer agents, custodians and broker-dealers. |
| Ÿ | | Policies and procedures (including physical, electronic and procedural safeguards) are in place that are designed to protect the confidentiality of such information. |
| Ÿ | | We reserve the right to change our Privacy Policy at any time upon proper notification to you. Customers may want to review our Privacy Policy periodically for changes by accessing the link on our homepage: www.eatonvance.com. |
Our pledge of privacy applies to the following entities within the Eaton Vance organization: the Eaton Vance Family of Funds, Eaton Vance Management, Eaton Vance Investment Counsel, Eaton Vance Distributors, Inc., Eaton Vance Trust Company, Eaton Vance Management’s Real Estate Investment Group and Boston Management and Research. In addition, our Privacy Policy applies only to those Eaton Vance customers who are individuals and who have a direct relationship with us. If a customer’s account (i.e., fund shares) is held in the name of a third-party financial advisor/broker-dealer, it is likely that only such advisor’s privacy policies apply to the customer. This notice supersedes all previously issued privacy disclosures. For more information about Eaton Vance’s Privacy Policy, please call 1-800-262-1122.
Delivery of Shareholder Documents. The Securities and Exchange Commission (SEC) permits funds to deliver only one copy of shareholder documents, including prospectuses, proxy statements and shareholder reports, to fund investors with multiple accounts at the same residential or post office box address. This practice is often called “householding” and it helps eliminate duplicate mailings to shareholders. Eaton Vance, or your financial advisor, may household the mailing of your documents indefinitely unless you instruct Eaton Vance, or your financial advisor, otherwise. If you would prefer that your Eaton Vance documents not be householded, please contact Eaton Vance at 1-800-262-1122, or contact your financial advisor. Your instructions that householding not apply to delivery of your Eaton Vance documents will be effective within 30 days of receipt by Eaton Vance or your financial advisor.
Portfolio Holdings. Each Eaton Vance Fund and its underlying Portfolio(s) (if applicable) will file a schedule of portfolio holdings on Form N-Q with the SEC for the first and third quarters of each fiscal year. The Form N-Q will be available on the Eaton Vance website at www.eatonvance.com, by calling Eaton Vance at 1-800-262-1122 or in the EDGAR database on the SEC’s website at www.sec.gov. Form N-Q may also be reviewed and copied at the SEC’s public reference room in Washington, D.C. (call 1-800-732-0330 for information on the operation of the public reference room).
Proxy Voting. From time to time, funds are required to vote proxies related to the securities held by the funds. The Eaton Vance Funds or their underlying Portfolios (if applicable) vote proxies according to a set of policies and procedures approved by the Funds’ and Portfolios’ Boards. You may obtain a description of these policies and procedures and information on how the Funds or Portfolios voted proxies relating to portfolio securities during the most recent 12-month period ended June 30, without charge, upon request, by calling 1-800-262-1122 and by accessing the SEC’s website at www.sec.gov.
This Page Intentionally Left Blank
This Page Intentionally Left Blank
This Page Intentionally Left Blank
Investment Adviser of High Income Opportunities Portfolio
Boston Management and Research
Two International Place
Boston, MA 02110
Administrator of Eaton Vance High Income Opportunities Fund
Eaton Vance Management
Two International Place
Boston, MA 02110
Principal Underwriter*
Eaton Vance Distributors, Inc.
Two International Place
Boston, MA 02110
(617) 482-8260
Custodian
State Street Bank and Trust Company
200 Clarendon Street
Boston, MA 02116
Transfer Agent
BNY Mellon Investment Servicing (US) Inc.
Attn: Eaton Vance Funds
P.O. Box 9653
Providence, RI 02940-9653
(800) 262-1122
Independent Registered Public Accounting Firm
Deloitte & Touche LLP
200 Berkeley Street
Boston, MA 02116-5022
Fund Offices
Two International Place
Boston, MA 02110
| * | FINRA BrokerCheck. Investors may check the background of their Investment Professional by contacting the Financial Industry Regulatory Authority (FINRA). FINRA BrokerCheck is a free tool to help investors check the professional background of current and former FINRA-registered securities firms and brokers. FINRA BrokerCheck is available by calling 1-800-289-9999 and at www.FINRA.org. The FINRA BrokerCheck brochure describing this program is available to investors at www.FINRA.org. |
446-12/12 HISRC
| | |
Eaton Vance Diversified Currency Income Fund Annual Report October 31, 2012 | | 
|

Fund shares are not insured by the FDIC and are not deposits or other obligations of, or guaranteed by, any depository institution. Shares are subject to investment risks, including possible loss of principal invested.
This report must be preceded or accompanied by a current summary prospectus or prospectus. Before investing, investors should consider carefully the investment objective, risks, and charges and expenses of a mutual fund. This and other important information is contained in the summary prospectus and prospectus, which can be obtained from a financial advisor. Prospective investors should read the prospectus carefully before investing. For further information, please call 1-800-262-1122.
Annual Report October 31, 2012
Eaton Vance
Diversified Currency Income Fund
Table of Contents
| | | | |
Management’s Discussion of Fund Performance | | | 2 | |
| |
Performance | | | 3 | |
| |
Fund Profile | | | 4 | |
| |
Endnotes and Additional Disclosures | | | 5 | |
| |
Fund Expenses | | | 6 | |
| |
Financial Statements | | | 7 | |
| |
Report of Independent Registered Public Accounting Firm | | | 17 and 36 | |
| |
Federal Tax Information | | | 18 | |
| |
Management and Organization | | | 37 | |
| |
Important Notices | | | 40 | |
Eaton Vance
Diversified Currency Income Fund
October 31, 2012
Management’s Discussion of Fund Performance1
Economic and Market Conditions
The 12-month period ending October 31, 2012 was a year dominated by central bank easing. The most aggressive action took place in developed-market countries that are burdened with debt. The European Central Bank (ECB) offered low-interest, three-year loans to banks, as the region’s debt crisis made it difficult for banks to fund their operations in the public markets. The ECB also cut its main interest rate three times, to a record low of 0.75%, and unveiled a plan to buy bonds of troubled eurozone governments. With their key policy rates already near zero, the U.S. Federal Reserve (the Fed), Bank of Japan and Bank of England relied on quantitative easing to try to reduce longer-term borrowing costs and spur economic growth. In addition, the Fed continued with “Operation Twist,” a stimulus program that was set to expire in June 2012 but that was extended through the end of 2012.
In the United States, gross domestic product (GDP) growth slid from an annual rate of 4.1% in the fourth quarter of 2011 to 2.7% or less in each of the next three quarters. Growth in Germany and Japan also decelerated, Spain and Italy entered recession, and France appeared to be heading in that direction. Latin American and emerging Asian economies grew faster than their developed-market counterparts. However, their growth rates slowed, causing central banks in Brazil, China and other countries in these regions to reduce interest rates.
The world’s bond markets generally posted positive returns during the fiscal year. Higher-risk securities delivered some of the strongest gains, as investors chased yield in the low-rate environment. For example, local bond prices appreciated throughout much of the emerging world. In the foreign exchange markets, most Latin American and Asian currencies strengthened versus the U.S. dollar, and most Central and Eastern European currencies strengthened versus the euro. On a total return basis, the Mexican peso and Philippine peso did especially well versus the U.S. dollar, while the Polish zloty was a standout performer versus the euro.
Fund Performance
For the fiscal year ending October, 31, 2012, Eaton Vance Diversified Currency Income Fund’s (the Fund) Class A shares at net asset value (NAV) had a total return of 3.71%. By comparison, the Fund’s primary benchmark, the Barclays Capital Global Ex-USD Benchmark Currency (Trade-Weighted) Index (the Index),2 lost 0.45% during the period.
The Fund’s investments, which are mainly long positions in foreign currencies, produced positive returns in all regions of the world. Gains in Central and Eastern Europe were driven by appreciation of the Georgian lari relative to the U.S. dollar. In the Republic of Georgia, real GDP growth has been about 6% since 2004, unemployment and inflation have fallen, and foreign direct investment flows have been strong. In Western Europe, the Fund benefited from exposure to the Swedish kronor and Norwegian krone, which strengthened versus the dollar. In addition, the Fund’s strategy of cross-hedging the dollar versus the euro generated incremental positive returns on these positions.
The top contributors in Africa and Asia were the Nigerian naira and Philippine peso. Nigeria’s government bills had strong yields, and the country saw increased capital flows based on its ability to export oil. Furthermore, its debt was added to key benchmark indexes in the latter part of the fiscal year. Economic growth in the Philippines was better than expected, and the country’s budget deficit narrowed. In Latin America, exposure to the Mexican peso and Colombian peso were particularly helpful. The economic data coming out of Mexico was strong, and the country had peaceful elections in July 2012. Colombia’s investor-friendly policies attracted capital flows throughout the fiscal year.
On the minus side, long positions in the Indian rupee, Indonesian rupiah and Moroccan dirham detracted from performance versus the Index. The Indian rupee declined versus the dollar due to rising inflation, stagnating economic growth and, until recently, policies that discouraged foreign direct investment in India. Indonesia’s central bank intervened to weaken the rupiah after the currency started to appreciate. The dirham was impacted by concerns that Morocco would be pulled into the turmoil brought on by the Arab awakening in North Africa.
The Fund had some exposure to commodities during the fiscal year, namely long positions in platinum and gold. These positions had minimal impact on performance versus the Index, as returns for both precious metals were essentially flat.
See Endnotes and Additional Disclosures in this report.
Past performance is no guarantee of future results. Returns are historical and are calculated by determining the percentage change in net asset value (NAV) or offering price (as applicable) with all distributions reinvested. Investment return and principal value will fluctuate so that shares, when redeemed, may be worth more or less than their original cost. Performance less than one year is cumulative. Performance is for the stated time period only; due to market volatility, the Fund’s current performance may be lower or higher than quoted. Returns are before taxes unless otherwise noted. For performance as of the most recent month end, please refer to www.eatonvance.com.
Eaton Vance
Diversified Currency Income Fund
October 31, 2012
Performance2,3
Portfolio Managers John R. Baur and Michael A. Cirami, CFA
| | | | | | | | | | | | | | | | |
| % Average Annual Total Returns | | Inception Date | | | One Year | | | Five Years | | | Since
Inception | |
Class A at NAV | | | 06/27/2007 | | | | 3.71 | % | | | 5.58 | % | | | 7.11 | % |
Class A with 4.75% Maximum Sales Charge | | | — | | | | –1.18 | | | | 4.56 | | | | 6.14 | |
Class C at NAV | | | 03/01/2011 | | | | 2.97 | | | | — | | | | 2.28 | |
Class C with 1% Maximum Sales Charge | | | — | | | | 1.99 | | | | — | | | | 2.28 | |
Class I at NAV | | | 03/01/2011 | | | | 4.04 | | | | — | | | | 3.48 | |
Barclays Capital Global Ex-USD Benchmark Currency (Trade-Weighted) Index | | | 06/27/2007 | | | | –0.45 | % | | | 1.26 | % | | | 2.14 | % |
J.P. Morgan GBI-Global ex U.S. 1–3 Year Index | | | 06/27/2007 | 2 | | | –1.80 | | | | 4.83 | | | | 6.19 | |
| | | | |
| | | | | | | | | | | | | | | | |
| % Total Annual Operating Expense Ratios4 | | | | | Class A | | | Class C | | | Class I | |
Gross | | | | | | | 1.92 | % | | | 2.62 | % | | | 1.62 | % |
Net | | | | | | | 1.10 | | | | 1.80 | | | | 0.80 | |
Performance of $10,000
This graph shows the change in value of a hypothetical investment of $10,000 in Class A of the Fund for the period indicated. For comparison, the same investment is shown in the indicated index.
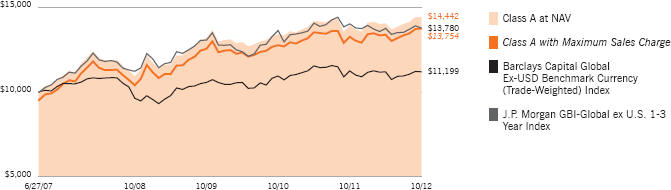
| | | | | | | | | | | | |
| Performance of Investment | | Amount Invested | | | Period Beginning | | At NAV | | | With Maximum Sales Charge |
Class C | | $ | 10,000 | | | 03/01/2011 | | $ | 10,385 | | | N.A. |
Class I | | $ | 250,000 | | | 03/01/2011 | | $ | 264,725 | | | N.A. |
See Endnotes and Additional Disclosures in this report.
Past performance is no guarantee of future results. Returns are historical and are calculated by determining the percentage change in net asset value (NAV) or offering price (as applicable) with all distributions reinvested. Investment return and principal value will fluctuate so that shares, when redeemed, may be worth more or less than their original cost. Performance less than one year is cumulative. Performance is for the stated time period only; due to market volatility, the Fund’s current performance may be lower or higher than quoted. Returns are before taxes unless otherwise noted. For performance as of the most recent month end, please refer to www.eatonvance.com.
Eaton Vance
Diversified Currency Income Fund
October 31, 2012
Fund Profile5
| | | | | | | | | | |
Foreign Currency Exposure (% of net assets)6 | |
| | | |
India | | | 4.5 | % | | Uruguay | | | 2.6 | % |
Nigeria | | | 4.5 | | | Canada | | | 2.5 | |
Norway | | | 4.4 | | | Platinum | | | 2.3 | |
Serbia | | | 4.2 | | | Guatemala | | | 1.8 | |
Sri Lanka | | | 4.1 | | | Hong Kong | | | 1.8 | |
Malaysia | | | 4.1 | | | Croatia | | | 1.6 | |
South Korea | | | 3.8 | | | Indonesia | | | 1.4 | |
Philippines | | | 3.8 | | | Ghana | | | 1.0 | |
China | | | 3.7 | | | Bosnia and Herzegovina | | | 1.0 | |
Gold | | | 3.7 | | | Mauritius | | | 1.0 | |
Georgia | | | 3.7 | | | Russia | | | 1.0 | |
Singapore | | | 3.4 | | | Hungary | | | 0.9 | |
Sweden | | | 3.4 | | | Denmark | | | 0.9 | |
Colombia | | | 3.3 | | | United Kingdom | | | 0.5 | |
Mexico | | | 3.3 | | | Israel | | | 0.5 | |
Brazil | | | 3.2 | | | Switzerland | | | 0.5 | |
Peru | | | 3.1 | | | Costa Rica | | | 0.4 | |
Turkey | | | 2.9 | | | Azerbaijan | | | 0.3 | |
Thailand | | | 2.7 | | | Dominican Republic | | | 0.2 | |
Poland | | | 2.7 | | | Australia | | | 0.1 | |
Vietnam | | | 2.7 | | | Euro | | | -21.0 | |
| | | | | | Total Long | | | 97.5 | |
| | | | | | Total Short | | | -21.0 | |
| | | | | | Total Net | | | 76.5 | |
See Endnotes and Additional Disclosures in this report.
Eaton Vance
Diversified Currency Income Fund
October 31, 2012
Endnotes and Additional Disclosures
| 1 | The views expressed in this report are those of the portfolio manager(s) and are current only through the date stated at the top of this page. These views are subject to change at any time based upon market or other conditions, and Eaton Vance and the Fund(s) disclaim any responsibility to update such views. These views may not be relied upon as investment advice and, because investment decisions are based on many factors, may not be relied upon as an indication of trading intent on behalf of any Eaton Vance fund. This commentary may contain statements that are not historical facts, referred to as “forward looking statements”. The Fund’s actual future results may differ significantly from those stated in any forward looking statement, depending on factors such as changes in securities or financial markets or general economic conditions, the volume of sales and purchases of Fund shares, the continuation of investment advisory, administrative and service contracts, and other risks discussed from time to time in the Fund’s filings with the Securities and Exchange Commission. |
| 2 | Barclays Capital Global Ex-USD Benchmark Currency (Trade- Weighted) Index is an unmanaged index tracking the performance of 1-month FX positions in a basket of currencies versus the U.S. dollar. J.P. Morgan GBI-Global ex U.S. 1-3 Year Index is an unmanaged index of foreign-denominated 1-3 year government bonds of developed countries outside the U.S. Index data is available as of month-end only. Unless otherwise stated, index returns do not reflect the effect of any applicable sales charges, commissions, expenses, taxes or leverage, as applicable. It is not possible to invest directly in an index. | |
| 3 | Total Returns at NAV do not include applicable sales charges. If sales charges were deducted, the returns would be lower. Total Returns shown with maximum sales charge reflect the stated maximum sales charge. Unless otherwise stated, performance does not reflect the deduction of taxes on Fund distributions or redemptions of Fund shares. |
| 4 | Source: Fund prospectus. Net expense ratio reflects a contractual expense reimbursement that continues through 2/28/13. Without the reimbursement, performance would have been lower. |
| 5 | Fund primarily invests in an affiliated investment company (Portfolio) with the same objective(s) and policies as the Fund and may also invest directly. Unless otherwise noted, references to investments are to the aggregate holdings of the Fund and the Portfolio. |
| 6 | Currency exposures include all foreign exchange denominated assets, currency derivatives and commodities (including commodity derivatives). Total exposures may exceed 100% due to implicit leverage created by derivatives. |
| | Fund profile subject to change due to active management. |
Eaton Vance
Diversified Currency Income Fund
October 31, 2012
Fund Expenses
Example: As a Fund shareholder, you incur two types of costs: (1) transaction costs, including sales charges (loads) on purchases and redemption fees (if applicable); and (2) ongoing costs, including management fees; distribution and/or service fees; and other Fund expenses. This Example is intended to help you understand your ongoing costs (in dollars) of Fund investing and to compare these costs with the ongoing costs of investing in other mutual funds. The Example is based on an investment of $1,000 invested at the beginning of the period and held for the entire period (May 1, 2012 – October 31, 2012).
Actual Expenses: The first section of the table below provides information about actual account values and actual expenses. You may use the information in this section, together with the amount you invested, to estimate the expenses that you paid over the period. Simply divide your account value by $1,000 (for example, an $8,600 account value divided by $1,000 = 8.6), then multiply the result by the number in the first section under the heading entitled “Expenses Paid During Period” to estimate the expenses you paid on your account during this period.
Hypothetical Example for Comparison Purposes: The second section of the table below provides information about hypothetical account values and hypothetical expenses based on the actual Fund expense ratio and an assumed rate of return of 5% per year (before expenses), which is not the actual Fund return. The hypothetical account values and expenses may not be used to estimate the actual ending account balance or expenses you paid for the period. You may use this information to compare the ongoing costs of investing in your Fund and other funds. To do so, compare this 5% hypothetical example with the 5% hypothetical examples that appear in the shareholder reports of the other funds.
Please note that the expenses shown in the table are meant to highlight your ongoing costs only and do not reflect any transactional costs, such as sales charges (loads) or redemption fees (if applicable). Therefore, the second section of the table is useful in comparing ongoing costs only, and will not help you determine the relative total costs of owning different funds. In addition, if these transactional costs were included, your costs would be higher.
| | | | | | | | | | | | | | | | |
| | | Beginning
Account Value
(5/1/12) | | | Ending
Account Value
(10/31/12) | | | Expenses Paid
During Period*
(5/1/12 – 10/31/12) | | | Annualized
Expense
Ratio | |
| | | | |
| | | | | | | | | | | | | | | | |
Actual* | | | | | | | | | | | | | | | | |
Class A | | $ | 1,000.00 | | | $ | 1,027.40 | | | $ | 5.61 | ** | | | 1.10 | % |
Class C | | $ | 1,000.00 | | | $ | 1,023.80 | | | $ | 9.16 | ** | | | 1.80 | % |
Class I | | $ | 1,000.00 | | | $ | 1,029.10 | | | $ | 4.08 | ** | | | 0.80 | % |
| | | | | | | | | | | | | | | | | |
| | | | |
| | | | | | | | | | | | | | | | |
Hypothetical | | | | | | | | | | | | | | | | |
(5% return per year before expenses) | | | | | | | | | | | | | | | | |
Class A | | $ | 1,000.00 | | | $ | 1,019.60 | | | $ | 5.58 | ** | | | 1.10 | % |
Class C | | $ | 1,000.00 | | | $ | 1,016.10 | | | $ | 9.12 | ** | | | 1.80 | % |
Class I | | $ | 1,000.00 | | | $ | 1,021.10 | | | $ | 4.06 | ** | | | 0.80 | % |
| * | Expenses are equal to the Fund’s annualized expense ratio for the indicated Class, multiplied by the average account value over the period, multiplied by 184/366 (to reflect the one-half year period). The Example assumes that the $1,000 was invested at the net asset value per share determined at the close of business on April 30, 2012. The Example reflects the expenses of both the Fund and the Portfolio. |
| ** | Absent an allocation of certain expenses to the administrator, expenses would be higher. |
Eaton Vance
Diversified Currency Income Fund
October 31, 2012
Statement of Assets and Liabilities
| | | | |
| Assets | | October 31, 2012 | |
Investment in International Income Portfolio, at value (identified cost, $89,782,852) | | $ | 90,051,141 | |
Receivable for Fund shares sold | | | 881,110 | |
Receivable from affiliate | | | 13,248 | |
Total assets | | $ | 90,945,499 | |
| |
| Liabilities | | | | |
Payable for Fund shares redeemed | | $ | 412,756 | |
Distributions payable | | | 38,763 | |
Payable to affiliates: | | | | |
Distribution and service fees | | | 13,037 | |
Trustees’ fees | | | 42 | |
Accrued expenses | | | 43,414 | |
Total liabilities | | $ | 508,012 | |
Net Assets | | $ | 90,437,487 | |
| |
| Sources of Net Assets | | | | |
Paid-in capital | | $ | 90,564,522 | |
Accumulated net realized loss from Portfolio | | | (426,733 | ) |
Accumulated undistributed net investment income | | | 31,409 | |
Net unrealized appreciation from Portfolio | | | 268,289 | |
Total | | $ | 90,437,487 | |
| |
| Class A Shares | | | | |
Net Assets | | $ | 42,251,188 | |
Shares Outstanding | | | 3,785,595 | |
Net Asset Value and Redemption Price Per Share | | | | |
(net assets ÷ shares of beneficial interest outstanding) | | $ | 11.16 | |
Maximum Offering Price Per Share | | | | |
(100 ÷ 95.25 of net asset value per share) | | $ | 11.72 | |
| |
| Class C Shares | | | | |
Net Assets | | $ | 3,728,565 | |
Shares Outstanding | | | 335,158 | |
Net Asset Value and Offering Price Per Share* | | | | |
(net assets ÷ shares of beneficial interest outstanding) | | $ | 11.12 | |
| |
| Class I Shares | | | | |
Net Assets | | $ | 44,457,734 | |
Shares Outstanding | | | 3,986,260 | |
Net Asset Value, Offering Price and Redemption Price Per Share | | | | |
(net assets ÷ shares of beneficial interest outstanding) | | $ | 11.15 | |
| On | sales of $50,000 or more, the offering price of Class A shares is reduced. |
| * | Redemption price per share is equal to the net asset value less any applicable contingent deferred sales charge. |
| | | | |
| | 7 | | See Notes to Financial Statements. |
Eaton Vance
Diversified Currency Income Fund
October 31, 2012
Statement of Operations
| | | | |
| Investment Income | | Year Ended
October 31, 2012 | |
Interest allocated from Portfolio (net of foreign taxes, $50,843) | | $ | 2,384,371 | |
Expenses allocated from Portfolio | | | (465,578 | ) |
Total investment income from Portfolio | | $ | 1,918,793 | |
| |
| Expenses | | | | |
Distribution and service fees | | | | |
Class A | | $ | 75,131 | |
Class C | | | 16,811 | |
Trustees’ fees and expenses | | | 500 | |
Custodian fee | | | 18,748 | |
Transfer and dividend disbursing agent fees | | | 36,308 | |
Legal and accounting services | | | 23,646 | |
Printing and postage | | | 25,253 | |
Registration fees | | | 54,115 | |
Miscellaneous | | | 14,880 | |
Total expenses | | $ | 265,392 | |
Deduct — | | | | |
Allocation of expenses to affiliate | | $ | 211,522 | |
Total expense reductions | | $ | 211,522 | |
| |
Net expenses | | $ | 53,870 | |
| |
Net investment income | | $ | 1,864,923 | |
| |
| Realized and Unrealized Gain (Loss) from Portfolio | | | | |
Net realized gain (loss) — | | | | |
Investment transactions | | $ | (867,040 | ) |
Financial futures contracts | | | (82,343 | ) |
Swap contracts | | | 36,629 | |
Foreign currency and forward foreign currency exchange contract transactions | | | 781,127 | |
Net realized loss | | $ | (131,627 | ) |
Change in unrealized appreciation (depreciation) — | | | | |
Investments (including net decrease of $19,336 from precious metals) | | $ | 581,448 | |
Financial futures contracts | | | 7,747 | |
Swap contracts | | | (30,034 | ) |
Foreign currency and forward foreign currency exchange contracts | | | 39,146 | |
Net change in unrealized appreciation (depreciation) | | $ | 598,307 | |
| |
Net realized and unrealized gain | | $ | 466,680 | |
| |
Net increase in net assets from operations | | $ | 2,331,603 | |
| | | | |
| | 8 | | See Notes to Financial Statements. |
Eaton Vance
Diversified Currency Income Fund
October 31, 2012
Statements of Changes in Net Assets
| | | | | | | | |
| | | Year Ended October 31, | |
| Increase (Decrease) in Net Assets | | 2012 | | | 2011 | |
From operations — | | | | | | | | |
Net investment income | | $ | 1,864,923 | | | $ | 608,198 | |
Net realized gain (loss) from investment transactions, financial futures contracts, swap contracts, foreign currency and forward foreign currency exchange contract transactions | | | (131,627 | ) | | | 504,436 | |
Net change in unrealized appreciation (depreciation) from investments, financial futures contracts, swap contracts, foreign currency and forward foreign currency exchange contracts | | | 598,307 | | | | (583,528 | ) |
Net increase in net assets from operations | | $ | 2,331,603 | | | $ | 529,106 | |
Distributions to shareholders — | | | | | | | | |
From net investment income | | | | | | | | |
Class A | | $ | (842,107 | ) | | $ | (391,761 | ) |
Class C | | | (42,305 | ) | | | (7,751 | ) |
Class I | | | (976,049 | ) | | | (580,210 | ) |
From net realized gain | | | | | | | | |
Class A | | | (224,499 | ) | | | — | |
Class C | | | (18,927 | ) | | | — | |
Class I | | | (231,816 | ) | | | — | |
Tax return of capital | | | | | | | | |
Class A | | | (148,709 | ) | | | — | |
Class C | | | (7,471 | ) | | | — | |
Class I | | | (172,363 | ) | | | — | |
Total distributions to shareholders | | $ | (2,664,246 | ) | | $ | (979,722 | ) |
Transactions in shares of beneficial interest — | | | | | | | | |
Proceeds from sale of shares | | | | | | | | |
Class A | | $ | 37,496,502 | | | $ | 8,629,272 | |
Class C | | | 3,409,823 | | | | 1,049,590 | |
Class I | | | 43,848,522 | | | | 20,685,720 | |
Net asset value of shares issued to shareholders in payment of distributions declared | | | | | | | | |
Class A | | | 947,346 | | | | 282,327 | |
Class C | | | 42,467 | | | | 1,769 | |
Class I | | | 721,835 | | | | 149,410 | |
Cost of shares redeemed | | | | | | | | |
Class A | | | (8,549,941 | ) | | | (5,016,610 | ) |
Class C | | | (740,452 | ) | | | (17,100 | ) |
Class I | | | (19,774,211 | ) | | | (498,006 | ) |
Net increase in net assets from Fund share transactions | | $ | 57,401,891 | | | $ | 25,266,372 | |
| | |
Net increase in net assets | | $ | 57,069,248 | | | $ | 24,815,756 | |
| | |
| Net Assets | | | | | | | | |
At beginning of year | | $ | 33,368,239 | | | $ | 8,552,483 | |
At end of year | | $ | 90,437,487 | | | $ | 33,368,239 | |
| | |
Accumulated undistributed net investment income included in net assets | | | | | | | | |
At end of year | | $ | 31,409 | | | $ | 116,457 | |
| | | | |
| | 9 | | See Notes to Financial Statements. |
Eaton Vance
Diversified Currency Income Fund
October 31, 2012
Financial Highlights
| | | | | | | | | | | | | | | | | | | | |
| | | Class A | |
| | | Year Ended October 31, | |
| | | 2012 | | | 2011 | | | 2010 | | | 2009 | | | 2008 | |
Net asset value — Beginning of year | | $ | 11.310 | | | $ | 11.360 | | | $ | 11.690 | | | $ | 10.350 | | | $ | 10.850 | |
| | | | | |
| Income (Loss) From Operations | | | | | | | | | | | | | | | | | | | | |
Net investment income(1) | | $ | 0.374 | | | $ | 0.299 | | | $ | 0.309 | | | $ | 0.328 | | | $ | 0.435 | |
Net realized and unrealized gain (loss) | | | 0.027 | | | | 0.139 | | | | (0.114 | ) | | | 1.738 | | | | (0.490 | ) |
| | | | | |
Total income (loss) from operations | | $ | 0.401 | | | $ | 0.438 | | | $ | 0.195 | | | $ | 2.066 | | | $ | (0.055 | ) |
| | | | | |
| Less Distributions | | | | | | | | | | | | | | | | | | | | |
From net investment income | | $ | (0.409 | ) | | $ | (0.488 | ) | | $ | (0.050 | ) | | $ | (0.496 | ) | | $ | (0.434 | ) |
From net realized gain | | | (0.070 | ) | | | — | | | | (0.007 | ) | | | (0.230 | ) | | | (0.013 | ) |
Tax return of capital | | | (0.072 | ) | | | — | | | | (0.468 | ) | | | — | | | | — | |
| | | | | |
Total distributions | | $ | (0.551 | ) | | $ | (0.488 | ) | | $ | (0.525 | ) | | $ | (0.726 | ) | | $ | (0.447 | ) |
| | | | | |
Capital contribution from administrator(1) | | $ | — | | | $ | — | | | $ | — | | | $ | — | | | $ | 0.002 | |
| | | | | |
Net asset value — End of year | | $ | 11.160 | | | $ | 11.310 | | | $ | 11.360 | | | $ | 11.690 | | | $ | 10.350 | |
| | | | | |
Total Return(2) | | | 3.71 | % | | | 3.86 | % | | | 1.70 | % | | | 20.67 | % | | | (0.73 | )%(3) |
| | | | | |
| Ratios/Supplemental Data | | | | | | | | | | | | | | | | | | | | |
Net assets, end of year (000’s omitted) | | $ | 42,251 | | | $ | 12,397 | | | $ | 8,552 | | | $ | 6,196 | | | $ | 5,517 | |
Ratios (as a percentage of average daily net assets): | | | | | | | | | | | | | | | | | | | | |
Expenses(4)(5)(6) | | | 1.10 | % | | | 1.10 | % | | | 1.10 | % | | | 1.10 | % | | | 1.10 | % |
Net investment income | | | 3.38 | % | | | 2.60 | % | | | 2.73 | % | | | 3.01 | % | | | 3.86 | % |
Portfolio Turnover of the Portfolio | | | 37 | % | | | 31 | % | | | 45 | % | | | 28 | % | | | 14 | % |
| (1) | Computed using average shares outstanding. |
| (2) | Returns are historical and are calculated by determining the percentage change in net asset value with all distributions reinvested and do not reflect the effect of sales charges. |
| (3) | The impact of the capital contribution by the administrator on total return for the year ended October 31, 2008 was less than 0.005%. |
| (4) | Excludes the effect of custody fee credits, if any, of less than 0.005%. |
| (5) | Includes the Fund’s share of the Portfolio’s allocated expenses. |
| (6) | The administrator subsidized certain operating expenses (equal to 0.40%, 0.82%, 1.74%, 1.76% and 1.99% of average daily net assets for the years ended October 31, 2012, 2011, 2010, 2009 and 2008, respectively). |
| | | | |
| | 10 | | See Notes to Financial Statements. |
Eaton Vance
Diversified Currency Income Fund
October 31, 2012
Financial Highlights — continued
| | | | | | | | |
| | | Class C | |
| | | Year Ended
October 31, 2012 | | | Period Ended October 31, 2011(1) | |
Net asset value — Beginning of period | | $ | 11.270 | | | $ | 11.460 | |
| | |
| Income (Loss) From Operations | | | | | | | | |
Net investment income(2) | | $ | 0.297 | | | $ | 0.150 | |
Net realized and unrealized gain (loss) | | | 0.024 | | | | (0.050 | ) |
| | |
Total income from operations | | $ | 0.321 | | | $ | 0.100 | |
| | |
| Less Distributions | | | | | | | | |
From net investment income | | $ | (0.341 | ) | | $ | (0.290 | ) |
From net realized gain | | | (0.070 | ) | | | — | |
Tax return of capital | | | (0.060 | ) | | | — | |
| | |
Total distributions | | $ | (0.471 | ) | | $ | (0.290 | ) |
| | |
Net asset value — End of period | | $ | 11.120 | | | $ | 11.270 | |
| | |
Total Return(3) | | | 2.97 | % | | | 0.85 | %(4) |
| | |
| Ratios/Supplemental Data | | | | | | | | |
Net assets, end of period (000’s omitted) | | $ | 3,729 | | | $ | 1,012 | |
Ratios (as a percentage of average daily net assets): | | | | | | | | |
Expenses(5)(6)(7) | | | 1.80 | % | | | 1.80 | %(8) |
Net investment income | | | 2.70 | % | | | 1.97 | %(8) |
Portfolio Turnover of the Portfolio | | | 37 | % | | | 31 | %(9) |
| (1) | For the period from commencement of operations on March 1, 2011 to October 31, 2011. |
| (2) | Computed using average shares outstanding. |
| (3) | Returns are historical and are calculated by determining the percentage change in net asset value with all distributions reinvested and do not reflect the effect of sales charges. |
| (5) | Excludes the effect of custody fee credits, if any, of less than 0.005%. |
| (6) | Includes the Fund’s share of the Portfolio’s allocated expenses. |
| (7) | The administrator subsidized certain operating expenses (equal to 0.40% and 0.82% of average daily net assets for the year ended October 31, 2012 and the period from commencement of operations on March 1, 2011 to October 31, 2011). |
| (9) | For the Portfolio’s year ended October 31, 2011. |
| | | | |
| | 11 | | See Notes to Financial Statements. |
Eaton Vance
Diversified Currency Income Fund
October 31, 2012
Financial Highlights — continued
| | | | | | | | |
| | | Class I | |
| | | Year Ended
October 31, 2012 | | | Period Ended October 31, 2011(1) | |
Net asset value — Beginning of period | | $ | 11.300 | | | $ | 11.460 | |
| | |
| Income (Loss) From Operations | | | | | | | | |
Net investment income(2) | | $ | 0.402 | | | $ | 0.231 | |
Net realized and unrealized gain (loss) | | | 0.034 | | | | (0.024 | ) |
| | |
Total income from operations | | $ | 0.436 | | | $ | 0.207 | |
| | |
| Less Distributions | | | | | | | | |
From net investment income | | $ | (0.439 | ) | | $ | (0.367 | ) |
From net realized gain | | | (0.070 | ) | | | — | |
Tax return of capital | | | (0.077 | ) | | | — | |
| | |
Total distributions | | $ | (0.586 | ) | | $ | (0.367 | ) |
| | |
Net asset value — End of period | | $ | 11.150 | | | $ | 11.300 | |
| | |
Total Return(3) | | | 4.04 | % | | | 1.78 | %(4) |
| | |
| Ratios/Supplemental Data | | | | | | | | |
Net assets, end of period (000’s omitted) | | $ | 44,458 | | | $ | 19,959 | |
Ratios (as a percentage of average daily net assets): | | | | | | | | |
Expenses(5)(6)(7) | | | 0.80 | % | | | 0.80 | %(8) |
Net investment income | | | 3.64 | % | | | 2.98 | %(8) |
Portfolio Turnover of the Portfolio | | | 37 | % | | | 31 | %(9) |
| (1) | For the period from commencement of operations on March 1, 2011 to October 31, 2011. |
| (2) | Computed using average shares outstanding. |
| (3) | Returns are historical and are calculated by determining the percentage change in net asset value with all distributions reinvested. |
| (5) | Excludes the effect of custody fee credits, if any, of less than 0.005%. |
| (6) | Includes the Fund’s share of the Portfolio’s allocated expenses. |
| (7) | The administrator subsidized certain operating expenses (equal to 0.40% and 0.82% of average daily net assets for the year ended October 31, 2012 and the period from commencement of operations on March 1, 2011 to October 31, 2011). |
| (9) | For the Portfolio’s year ended October 31, 2011. |
| | | | |
| | 12 | | See Notes to Financial Statements. |
Eaton Vance
Diversified Currency Income Fund
October 31, 2012
Notes to Financial Statements
1 Significant Accounting Policies
Eaton Vance Diversified Currency Income Fund (the Fund) is a diversified series of Eaton Vance Mutual Funds Trust (the Trust). The Trust is a Massachusetts business trust registered under the Investment Company Act of 1940, as amended (the 1940 Act), as an open-end management investment company. The Fund offers three classes of shares. Class A shares are generally sold subject to a sales charge imposed at time of purchase. Class C shares are sold at net asset value and are generally subject to a contingent deferred sales charge (see Note 5). Class I shares are sold at net asset value and are not subject to a sales charge. Each class represents a pro-rata interest in the Fund, but votes separately on class-specific matters and (as noted below) is subject to different expenses. Realized and unrealized gains and losses are allocated daily to each class of shares based on the relative net assets of each class to the total net assets of the Fund. Net investment income, other than class-specific expenses, is allocated daily to each class of shares based upon the ratio of the value of each class’s paid shares to the total value of all paid shares. Each class of shares differs in its distribution plan and certain other class-specific expenses. The Fund invests all of its investable assets in interests in International Income Portfolio (the Portfolio), a Massachusetts business trust, having the same investment objective and policies as the Fund. The value of the Fund’s investment in the Portfolio reflects the Fund’s proportionate interest in the net assets of the Portfolio (30.8% at October 31, 2012). The performance of the Fund is directly affected by the performance of the Portfolio. The consolidated financial statements of the Portfolio, including the consolidated portfolio of investments, are included elsewhere in this report and should be read in conjunction with the Fund’s financial statements.
The following is a summary of significant accounting policies of the Fund. The policies are in conformity with accounting principles generally accepted in the United States of America.
A Investment Valuation — Valuation of securities by the Portfolio is discussed in Note 1A of the Portfolio’s Notes to Consolidated Financial Statements, which are included elsewhere in this report.
B Income — The Fund’s net investment income or loss consists of the Fund’s pro-rata share of the net investment income or loss of the Portfolio, less all actual and accrued expenses of the Fund.
C Federal Taxes — The Fund’s policy is to comply with the provisions of the Internal Revenue Code applicable to regulated investment companies and to distribute to shareholders each year substantially all of its net investment income, and all or substantially all of its net realized capital gains. Accordingly, no provision for federal income or excise tax is necessary.
During the year ended October 31, 2012, a capital loss carryforward of $218,139 was utilized to offset net realized gains of the Fund.
As of October 31, 2012, the Fund had no uncertain tax positions that would require financial statement recognition, de-recognition, or disclosure. The Fund files a U.S. federal income tax return annually after its fiscal year-end, which is subject to examination by the Internal Revenue Service for a period of three years from the date of filing.
D Expenses — The majority of expenses of the Trust are directly identifiable to an individual fund. Expenses which are not readily identifiable to a specific fund are allocated taking into consideration, among other things, the nature and type of expense and the relative size of the funds.
E Expense Reduction — State Street Bank and Trust Company (SSBT) serves as custodian of the Fund. Pursuant to the custodian agreement, SSBT receives a fee reduced by credits, which are determined based on the average daily cash balance the Fund maintains with SSBT. All credit balances, if any, used to reduce the Fund’s custodian fees are reported as a reduction of expenses in the Statement of Operations.
F Use of Estimates — The preparation of the financial statements in conformity with accounting principles generally accepted in the United States of America requires management to make estimates and assumptions that affect the reported amounts of assets and liabilities at the date of the financial statements and the reported amounts of income and expense during the reporting period. Actual results could differ from those estimates.
G Indemnifications — Under the Trust’s organizational documents, its officers and Trustees may be indemnified against certain liabilities and expenses arising out of the performance of their duties to the Fund. Under Massachusetts law, if certain conditions prevail, shareholders of a Massachusetts business trust (such as the Trust) could be deemed to have personal liability for the obligations of the Trust. However, the Trust’s Declaration of Trust contains an express disclaimer of liability on the part of Fund shareholders and the By-laws provide that the Trust shall assume the defense on behalf of any Fund shareholders. Moreover, the By-laws also provide for indemnification out of Fund property of any shareholder held personally liable solely by reason of being or having been a shareholder for all loss or expense arising from such liability. Additionally, in the normal course of business, the Fund enters into agreements with service providers that may contain indemnification clauses. The Fund’s maximum exposure under these arrangements is unknown as this would involve future claims that may be made against the Fund that have not yet occurred.
H Other — Investment transactions are accounted for on a trade date basis. Dividends to shareholders are recorded on the ex-dividend date.
2 Distributions to Shareholders
The Fund declares dividends daily to shareholders of record at the time of declaration. Distributions are generally paid monthly. Distributions of realized capital gains are made at least annually. Distributions are declared separately for each class of shares. Shareholders may reinvest income and capital gain
Eaton Vance
Diversified Currency Income Fund
October 31, 2012
Notes to Financial Statements — continued
distributions in additional shares of the same class of the Fund at the net asset value as of the reinvestment date or, at the election of the shareholder, receive distributions in cash. The Fund distinguishes between distributions on a tax basis and a financial reporting basis. Accounting principles generally accepted in the United States of America require that only distributions in excess of tax basis earnings and profits be reported in the financial statements as a return of capital. Permanent differences between book and tax accounting relating to distributions are reclassified to paid-in capital. For tax purposes, distributions from short-term capital gains and current year earnings and profits attributable to realized gains are considered to be from ordinary income.
The tax character of distributions declared for the years ended October 31, 2012 and October 31, 2011 was as follows:
| | | | | | | | |
| | | Year Ended October 31, | |
| | | 2012 | | | 2011 | |
| | |
Distributions declared from: | | | | | | | | |
Ordinary income | | $ | 1,860,461 | | | $ | 979,722 | |
Long-term capital gains | | $ | 475,242 | | | $ | — | |
Tax return of capital | | $ | 328,543 | | | $ | — | |
| | | $ | 2,664,246 | | | $ | 979,722 | |
During the year ended October 31, 2012, accumulated net realized loss was decreased by $399,084, accumulated undistributed net investment income was decreased by $89,510 and paid-in capital was decreased by $309,574 due to differences between book and tax accounting, primarily for foreign currency gain (loss), swap contracts, paydown gain (loss), premium amortization and the Portfolio’s investment in a subsidiary. These reclassifications had no effect on the net assets or net asset value per share of the Fund.
As of October 31, 2012, the components of distributable earnings (accumulated losses) and unrealized appreciation (depreciation) on a tax basis were as follows:
| | | | |
Net unrealized depreciation | | $ | (88,272 | ) |
Other temporary differences | | $ | (38,763 | ) |
The differences between components of distributable earnings (accumulated losses) on a tax basis and the amounts reflected in the Statement of Assets and Liabilities are primarily due to partnership allocations, futures contracts, foreign currency transactions, the timing of recognizing distributions to shareholders, premium amortization and tax accounting for straddle transactions.
3 Investment Adviser Fee and Other Transactions with Affiliates
The investment adviser fee is earned by Eaton Vance Management (EVM) as compensation for investment advisory services rendered to the Fund. The fee is computed at an annual rate of 0.625% of the Fund’s average daily net assets that are not invested in other investment companies for which EVM or its affiliates serve as investment adviser or administrator (“Investable Assets”) up to $1 billion and is payable monthly. On Investable Assets of $1 billion and over, the annual fee is reduced. For the year ended October 31, 2012, the Fund incurred no adviser fee on Investable Assets. To the extent the Fund’s assets are invested in the Portfolio, the Fund is allocated its share of the Portfolio’s adviser fee. The Portfolio has engaged Boston Management and Research (BMR), a subsidiary of EVM, to render investment advisory services. See Note 2 of the Portfolio’s Notes to Consolidated Financial Statements which are included elsewhere in this report. EVM also serves as the administrator of the Fund, but receives no compensation. EVM has agreed to reimburse the Fund’s expenses to the extent that total annual operating expenses (relating to ordinary operating expenses only) exceed 1.10%, 1.80% and 0.80% of the Fund’s average daily net assets for Class A, Class C and Class I, respectively. This agreement may be changed or terminated after February 28, 2013. Pursuant to this agreement, EVM was allocated $211,522 of the Fund’s operating expenses for the year ended October 31, 2012.
EVM serves as the sub-transfer agent of the Fund and receives from the transfer agent an aggregate fee based upon the actual expenses incurred by EVM in the performance of these services. For the year ended October 31, 2012, EVM earned $1,585 in sub-transfer agent fees. The Fund was informed that Eaton Vance Distributors, Inc. (EVD), an affiliate of EVM and the Fund’s principal underwriter, received $16,693 as its portion of the sales charge on sales of Class A shares for the year ended October 31, 2012. EVD also received distribution and service fees from Class A and Class C shares (see Note 4) and contingent deferred sales charges (see Note 5).
Trustees and officers of the Fund who are members of EVM’s or BMR’s organizations receive remuneration for their services to the Fund out of the investment adviser fee. Certain officers and Trustees of the Fund and the Portfolio are officers of the above organizations.
Eaton Vance
Diversified Currency Income Fund
October 31, 2012
Notes to Financial Statements — continued
4 Distribution Plans
The Fund has in effect a distribution plan for Class A shares (Class A Plan) pursuant to Rule 12b-1 under the 1940 Act. Pursuant to the Class A Plan, the Fund pays EVD a distribution and service fee of 0.30% per annum of its average daily net assets attributable to Class A shares for distribution services and facilities provided to the Fund by EVD, as well as for personal services and/or the maintenance of shareholder accounts. Distribution and service fees paid or accrued to EVD for the year ended October 31, 2012 amounted to $75,131 for Class A shares.
The Fund also has in effect a distribution plan for Class C shares (Class C Plan) pursuant to Rule 12b-1 under the 1940 Act. Pursuant to the Class C Plan, the Fund pays EVD amounts equal to 0.75% per annum of its average daily net assets attributable to Class C shares for providing ongoing distribution services and facilities to the Fund. For the year ended October 31, 2012, the Fund paid or accrued to EVD $12,608 for Class C shares.
Pursuant to the Class C Plan, the Fund also makes payments of service fees to EVD, financial intermediaries and other persons in amounts equal to 0.25% per annum of its average daily net assets attributable to that class. Service fees paid or accrued are for personal services and/or the maintenance of shareholder accounts. They are separate and distinct from the sales commissions and distribution fees payable to EVD. Service fees paid or accrued for the year ended October 31, 2012 amounted to $4,203 for Class C shares.
5 Contingent Deferred Sales Charges
A contingent deferred sales charge (CDSC) of 1% generally is imposed on redemptions of Class C shares made within one year of purchase. Class A shares may be subject to a 1% CDSC if redeemed within 18 months of purchase (depending on the circumstances of purchase). Generally, the CDSC is based upon the lower of the net asset value at date of redemption or date of purchase. No charge is levied on shares acquired by reinvestment of dividends or capital gain distributions. No CDSC is levied on shares which have been sold to EVM or its affiliates or to their respective employees or clients and may be waived under certain other limited conditions. For the year ended October 31, 2012, the Fund was informed that EVD received no CDSCs paid by Class A and Class C shareholders.
6 Investment Transactions
For the year ended October 31, 2012, increases and decreases in the Fund’s investment in the Portfolio aggregated $68,307,256 and $14,136,736, respectively.
7 Shares of Beneficial Interest
The Fund’s Declaration of Trust permits the Trustees to issue an unlimited number of full and fractional shares of beneficial interest (without par value). Such shares may be issued in a number of different series (such as the Fund) and classes. Transactions in Fund shares were as follows:
| | | | | | | | |
| | | Year Ended October 31, | |
| Class A | | 2012 | | | 2011 | |
| | |
Sales | | | 3,377,385 | | | | 756,993 | |
Issued to shareholders electing to receive payments of distributions in Fund shares | | | 85,742 | | | | 24,563 | |
Redemptions | | | (773,668 | ) | | | (438,238 | ) |
| | |
Net increase | | | 2,689,459 | | | | 343,318 | |
| | |
| | | | | | | | |
| Class C | | Year Ended
October 31, 2012 | | | Period Ended
October 31, 2011(1) | |
| | |
Sales | | | 308,626 | | | | 91,210 | |
Issued to shareholders electing to receive payments of distributions in Fund shares | | | 3,859 | | | | 157 | |
Redemptions | | | (67,142 | ) | | | (1,552 | ) |
| | |
Net increase | | | 245,343 | | | | 89,815 | |
Eaton Vance
Diversified Currency Income Fund
October 31, 2012
Notes to Financial Statements — continued
| | | | | | | | |
| Class I | | Year Ended
October 31, 2012 | | | Period Ended
October 31, 2011(1) | |
| | |
Sales | | | 3,967,467 | | | | 1,796,227 | |
Issued to shareholders electing to receive payments of distributions in Fund shares | | | 65,402 | | | | 12,841 | |
Redemptions | | | (1,812,479 | ) | | | (43,198 | ) |
| | |
Net increase | | | 2,220,390 | | | | 1,765,870 | |
| (1) | For the period from commencement of operations on March 1, 2011 to October 31, 2011. |
Eaton Vance
Diversified Currency Income Fund
October 31, 2012
Report of Independent Registered Public Accounting Firm
To the Trustees of Eaton Vance Mutual Funds Trust and Shareholders of Eaton Vance Diversified Currency Income Fund:
We have audited the accompanying statement of assets and liabilities of Eaton Vance Diversified Currency Income Fund (the “Fund”) (one of the funds constituting Eaton Vance Mutual Funds Trust) as of October 31, 2012, and the related statement of operations for the year then ended, the statements of changes in net assets for each of the two years in the period then ended, and the financial highlights for each of the five years in the period then ended. These financial statements and financial highlights are the responsibility of the Fund’s management. Our responsibility is to express an opinion on these financial statements and financial highlights based on our audits.
We conducted our audits in accordance with the standards of the Public Company Accounting Oversight Board (United States). Those standards require that we plan and perform the audit to obtain reasonable assurance about whether the financial statements and financial highlights are free of material misstatement. The Fund is not required to have, nor were we engaged to perform, an audit of its internal control over financial reporting. Our audits included consideration of internal control over financial reporting as a basis for designing audit procedures that are appropriate in the circumstances, but not for the purpose of expressing an opinion on the effectiveness of the Fund’s internal control over financial reporting. Accordingly, we express no such opinion. An audit also includes examining, on a test basis, evidence supporting the amounts and disclosures in the financial statements, assessing the accounting principles used and significant estimates made by management, as well as evaluating the overall financial statement presentation. We believe that our audits provide a reasonable basis for our opinion.
In our opinion, such financial statements and financial highlights referred to above present fairly, in all material respects, the financial position of Eaton Vance Diversified Currency Income Fund as of October 31, 2012, the results of its operations for the year then ended, the changes in its net assets for each of the two years in the period then ended, and the financial highlights for each of the five years in the period then ended, in conformity with accounting principles generally accepted in the United States of America.
DELOITTE & TOUCHE LLP
Boston, Massachusetts
December 21, 2012
Eaton Vance
Diversified Currency Income Fund
October 31, 2012
Federal Tax Information (Unaudited)
The Form 1099-DIV you receive in January 2013 will show the tax status of all distributions paid to your account in calendar year 2012. Shareholders are advised to consult their own tax adviser with respect to the tax consequences of their investment in the Fund. As required by the Internal Revenue Code and/or regulations, shareholders must be notified regarding the status of the foreign tax credit and capital gains dividends.
Foreign Tax Credit. The Fund paid foreign taxes of $50,843 and recognized foreign source income of $2,279,013.
Capital Gains Dividends. The Fund hereby designates as a capital gain dividend with respect to the taxable year ended October 31, 2012, $541,544 or, if subsequently determined to be different, the net capital gain of such year.
International Income Portfolio
October 31, 2012
Consolidated Portfolio of Investments
| | | | | | | | | | |
| Foreign Government Bonds — 29.6% | |
| | | |
| | | | | | | | | | |
| Security | | | | Principal
Amount | | | Value | |
| | | | | | | | | | |
|
Australia — 0.1% | |
Commonwealth of Australia, 6.25%, 4/15/15 | | AUD | | | 146,000 | | | $ | 164,792 | |
Commonwealth of Australia, 6.50%, 5/15/13 | | AUD | | | 152,000 | | | | 160,867 | |
| | |
Total Australia | | | | | | | | $ | 325,659 | |
| | |
|
Bosnia and Herzegovina — 0.9% | |
Republic of Srpska, 1.50%, 6/30/23 | | BAM | | | 1,430,229 | | | $ | 507,089 | |
Republic of Srpska, 1.50%, 10/30/23 | | BAM | | | 1,518,328 | | | | 512,164 | |
Republic of Srpska, 1.50%, 12/15/23 | | BAM | | | 724,245 | | | | 242,431 | |
Republic of Srpska, 1.50%, 5/31/25 | | BAM | | | 4,620,722 | | | | 1,340,023 | |
Republic of Srpska, 1.50%, 6/9/25 | | BAM | | | 105,000 | | | | 30,784 | |
| | |
Total Bosnia and Herzegovina | | | | | | | | $ | 2,632,491 | |
| | |
|
Brazil — 2.1% | |
Nota do Tesouro Nacional, 6.00%, 5/15/15(1) | | BRL | | | 11,400,221 | | | $ | 6,139,361 | |
| | |
Total Brazil | | | | | | | | $ | 6,139,361 | |
| | |
|
Canada — 1.2% | |
Canada Housing Trust, 2.20%, 3/15/14(2) | | CAD | | | 135,000 | | | $ | 137,191 | |
Canada Housing Trust, 3.60%, 6/15/13(2) | | CAD | | | 2,001,000 | | | | 2,034,599 | |
Canada Housing Trust, 3.75%, 3/15/20(2) | | CAD | | | 665,000 | | | | 745,519 | |
Canada Housing Trust, 4.10%, 12/15/18(2) | | CAD | | | 475,000 | | | | 537,465 | |
| | |
Total Canada | | | | | | | | $ | 3,454,774 | |
| | |
|
Colombia — 3.0% | |
Titulos De Tesoreria B, 6.00%, 4/17/13 | | COP | | | 6,500,000,000 | | | $ | 3,570,544 | |
Titulos De Tesoreria B, 7.25%, 6/15/16 | | COP | | | 9,100,000,000 | | | | 5,290,799 | |
| | |
Total Colombia | | | | | | | | $ | 8,861,343 | |
| | |
|
Costa Rica — 0.4% | |
Titulo Propiedad Ud, 1.00%, 1/12/22(1) | | CRC | | | 480,702,006 | | | $ | 743,864 | |
Titulo Propiedad Ud, 1.63%, 7/13/16(1) | | CRC | | | 266,476,112 | | | | 504,477 | |
| | |
Total Costa Rica | | | | | | | | $ | 1,248,341 | |
| | |
|
Denmark — 0.9% | |
Kingdom of Denmark, 4.00%, 11/15/15 | | DKK | | | 215,000 | | | $ | 41,804 | |
Kingdom of Denmark, 4.00%, 11/15/17 | | DKK | | | 1,008,000 | | | | 206,117 | |
Kingdom of Denmark, 5.00%, 11/15/13 | | DKK | | | 10,898,000 | | | | 1,993,215 | |
Kingdom of Denmark, 7.00%, 11/10/24 | | DKK | | | 790,000 | | | | 221,921 | |
| | |
Total Denmark | | | | | | | | $ | 2,463,057 | |
| | |
| | | | | | | | | | |
| Security | | | | Principal
Amount | | | Value | |
| | | | | | | | | | |
|
Dominican Republic — 0.2% | |
Dominican Republic “Bonos Internos” Total Return Linked Bond (Citibank NA), 13.00%, 2/25/13(3) | | DOP | | | 25,000,000 | | | $ | 640,840 | |
| | |
Total Dominican Republic | | | | | | | | $ | 640,840 | |
| | |
|
Georgia — 2.8% | |
Georgia Treasury Bond, 7.40%, 4/19/14 | | GEL | | | 5,880,000 | | | $ | 3,565,030 | |
Georgia Treasury Bond, 8.50%, 7/26/17 | | GEL | | | 516,000 | | | | 318,151 | |
Georgia Treasury Bond, 8.90%, 1/12/14 | | GEL | | | 810,000 | | | | 498,642 | |
Georgia Treasury Bond, 9.10%, 12/8/13 | | GEL | | | 400,000 | | | | 246,453 | |
Georgia Treasury Bond, 9.80%, 4/26/17 | | GEL | | | 490,000 | | | | 316,158 | |
Georgia Treasury Bond, 11.30%, 1/26/17 | | GEL | | | 500,000 | | | | 337,497 | |
Georgia Treasury Bond, 12.00%, 6/15/13 | | GEL | | | 500,000 | | | | 311,008 | |
Georgia Treasury Bond, 12.00%, 6/15/14 | | GEL | | | 3,222,000 | | | | 2,090,478 | |
Georgia Treasury Bond, 12.00%, 9/15/15 | | GEL | | | 500,000 | | | | 338,515 | |
Georgia Treasury Bond, 13.80%, 12/16/12 | | GEL | | | 332,000 | | | | 201,957 | |
| | |
Total Georgia | | | | | | | | $ | 8,223,889 | |
| | |
|
Ghana — 1.0% | |
Ghana Government Bond, 23.00%, 8/21/17 | | GHS | | | 2,000,000 | | | $ | 1,196,850 | |
Ghana Government Bond, 26.00%, 6/5/17 | | GHS | | | 2,600,000 | | | | 1,679,060 | |
| | |
Total Ghana | | | | | | | | $ | 2,875,910 | |
| | |
|
Mexico — 2.2% | |
Mexican Bonos, 8.00%, 12/19/13 | | MXN | | | 42,279,000 | | | $ | 3,346,554 | |
Mexican Bonos, 9.00%, 12/20/12 | | MXN | | | 41,212,200 | | | | 3,168,687 | |
| | |
Total Mexico | | | | | | | | $ | 6,515,241 | |
| | |
|
Peru — 3.0% | |
Republic of Peru, 9.91%, 5/5/15 | | PEN | | | 16,241,000 | | | $ | 7,297,326 | |
Republic of Peru, 9.91%, 5/5/15(4) | | PEN | | | 3,174,000 | | | | 1,426,126 | |
| | |
Total Peru | | | | | | | | $ | 8,723,452 | |
| | |
|
Philippines — 1.6% | |
Republic of the Philippines, 4.95%, 1/15/21 | | PHP | | | 106,000,000 | | | $ | 2,836,747 | |
Republic of the Philippines, 8.75%, 3/3/13 | | PHP | | | 75,770,000 | | | | 1,889,773 | |
| | |
Total Philippines | | | | | | | | $ | 4,726,520 | |
| | |
|
Serbia — 2.7% | |
Serbia Treasury Bill, 0.00%, 11/22/12 | | RSD | | | 121,470,000 | | | $ | 1,375,737 | |
Serbia Treasury Bill, 0.00%, 7/4/13 | | RSD | | | 329,070,000 | | | | 3,443,580 | |
Serbia Treasury Bond, 10.00%, 9/14/15 | | RSD | | | 300,080,000 | | | | 2,968,329 | |
| | |
Total Serbia | | | | | | | | $ | 7,787,646 | |
| | |
| | | | |
| | 19 | | See Notes to Consolidated Financial Statements. |
International Income Portfolio
October 31, 2012
Consolidated Portfolio of Investments — continued
| | | | | | | | | | |
| Security | | | | Principal
Amount | | | Value | |
| | | | | | | | | | |
|
Sweden — 0.4% | |
Government of Sweden, 3.75%, 8/12/17 | | SEK | | | 5,510,000 | | | $ | 936,331 | |
Government of Sweden, 6.75%, 5/5/14 | | SEK | | | 395,000 | | | | 64,841 | |
| | |
Total Sweden | | | | | | | | $ | 1,001,172 | |
| | |
|
Turkey — 2.9% | |
Turkey Government Bond, 0.00%, 11/7/12 | | TRY | | | 15,276,000 | | | $ | 8,517,148 | |
| | |
Total Turkey | | | | | | | | $ | 8,517,148 | |
| | |
|
United Kingdom — 0.5% | |
United Kingdom Government Bond, 4.25%, 12/7/27 | | GBP | | | 230,000 | | | $ | 459,432 | |
United Kingdom Government Bond, 4.75%, 3/7/20 | | GBP | | | 285,000 | | | | 570,943 | |
United Kingdom Government Bond, 5.00%, 9/7/14 | | GBP | | | 266,000 | | | | 466,686 | |
| | |
Total United Kingdom | | | | | | | | $ | 1,497,061 | |
| | |
|
Uruguay — 1.1% | |
Monetary Regulation Bill, 0.00%, 8/15/13 | | UYU | | | 47,300,000 | | | $ | 2,220,439 | |
Monetary Regulation Bill, 0.00%, 2/27/14(1) | | UYU | | | 3,604,265 | | | | 178,136 | |
Republic of Uruguay, 4.375%, 12/15/28(1) | | UYU | | | 7,010,016 | | | | 422,731 | |
Uruguay Notas Del Teso, 10.25%, 8/22/15 | | UYU | | | 9,980,000 | | | | 514,159 | |
| | |
Total Uruguay | | | | | | | | $ | 3,335,465 | |
| | |
|
Vietnam — 2.6% | |
Vietnam Government Bond, 8.80%, 6/15/14 | | VND | | | 55,000,000,000 | | | $ | 2,616,666 | |
Vietnam Government Bond, 11.25%, 5/13/13 | | VND | | | 46,250,000,000 | | | | 2,236,200 | |
Vietnam Government Bond, 11.40%, 4/19/13 | | VND | | | 45,359,500,000 | | | | 2,191,569 | |
Vietnam Government Bond, 11.59%, 2/20/14 | | VND | | | 8,696,500,000 | | | | 429,009 | |
| | |
Total Vietnam | | | | | | | | $ | 7,473,444 | |
| | |
| |
Total Foreign Government Bonds
(identified cost $84,823,225) | | | $ | 86,442,814 | |
| | | | | | | | | | | |
|
| Collateralized Mortgage Obligations — 0.5% | |
| | | |
| | | | | | | | | | |
| Security | | | | Principal
Amount | | | Value | |
Federal Home Loan Mortgage Corp.: | | | | | |
Series 2127, Class PG, 6.25%, 2/15/29 | | | | $ | 364,593 | | | $ | 386,561 | |
Federal National Mortgage Association: | | | | | |
Series 2009-62, Class WA, 5.55%, 8/25/39(5) | | | | | 901,385 | | | | 1,016,453 | |
| | |
| |
Total Collateralized Mortgage Obligations
(identified cost $1,314,968) | | | $ | 1,403,014 | |
| | |
| | | | | | | | | | |
| Mortgage Pass-Throughs — 3.9% | |
| Security | | | | Principal
Amount | | | Value | |
| | | | | | | | | | |
Federal National Mortgage Association: | | | | | |
2.344%, with maturity at 2035(6) | | | | $ | 1,392,975 | | | $ | 1,466,732 | |
4.154%, with maturity at 2035(6) | | | | | 1,326,150 | | | | 1,447,543 | |
6.50%, with various maturities to 2036 | | | | | 2,639,352 | | | | 3,070,697 | |
7.00%, with maturity at 2033 | | | | | 944,381 | | | | 1,104,203 | |
7.50%, with maturity at 2035 | | | | | 522,711 | | | | 642,282 | |
8.50%, with maturity at 2032 | | | | | 468,934 | | | | 598,437 | |
| | | | | | | | | | | |
| | | | | | | | $ | 8,329,894 | |
| | | | | | | | | | | |
Government National Mortgage Association: | | | | | |
7.00%, with maturity at 2035 | | | | $ | 1,301,984 | | | $ | 1,572,615 | |
8.00%, with maturity at 2016 | | | | | 356,225 | | | | 379,024 | |
9.00%, with various maturities to 2024 | | | | | 886,919 | | | | 1,050,800 | |
| | | | | | | | | | | |
| | | | | | | | $ | 3,002,439 | |
| | | | | | | | | | | |
| |
Total Mortgage Pass-Throughs
(identified cost $10,474,553) | | | $ | 11,332,333 | |
| | | | | | | | | | | |
|
| Precious Metals — 6.0% | |
| | | |
| | | | | | | | | | |
| Description | | | | Troy Ounces | | | Value | |
Gold(7) | | | | | 6,349 | | | $ | 10,929,966 | |
Platinum(7) | | | | | 4,250 | | | | 6,671,323 | |
| | |
| |
Total Precious Metals
(identified cost $17,123,704) | | | $ | 17,601,289 | |
| | |
|
| Short-Term Investments — 58.6% | |
|
| Foreign Government Securities — 31.8% | |
| | | |
| | | | | | | | | | |
| Security | | | | Principal
Amount
(000’s omitted) | | | Value | |
|
Croatia — 1.6% | |
Republic of Croatia Ministry of Finance, 0.00%, 5/9/13 | | HRK | | | 28,000 | | | $ | 4,775,178 | |
| | |
Total Croatia | | | | | | | | $ | 4,775,178 | |
| | |
|
Georgia — 1.2% | |
Bank of Georgia Promissory Note, 1.00%, 12/20/12(4) | | AZN | | | 901 | | | $ | 1,149,142 | |
Georgia Treasury Bill, 0.00%, 1/17/13 | | GEL | | | 3,000 | | | | 1,784,752 | |
Georgia Treasury Bill, 0.00%, 3/14/13 | | GEL | | | 980 | | | | 577,228 | |
| | |
Total Georgia | | | | | | | | $ | 3,511,122 | |
| | |
| | | | |
| | 20 | | See Notes to Consolidated Financial Statements. |
International Income Portfolio
October 31, 2012
Consolidated Portfolio of Investments — continued
| | | | | | | | | | |
| Security | | | | Principal
Amount
(000’s omitted) | | | Value | |
| | | | | | | | | | |
|
Hong Kong — 1.8% | |
Hong Kong Treasury Bill, 0.00%, 11/7/12 | | HKD | | | 20,000 | | | $ | 2,580,548 | |
Hong Kong Treasury Bill, 0.00%, 1/30/13 | | HKD | | | 20,000 | | | | 2,578,874 | |
| | |
Total Hong Kong | | | | | | | | $ | 5,159,422 | |
| | |
|
Hungary — 0.9% | |
Hungary Treasury Bill, 0.00%, 12/12/12 | | HUF | | | 593,320 | | | $ | 2,702,008 | |
| | |
Total Hungary | | | | | | | | $ | 2,702,008 | |
| | |
|
Malaysia — 4.1% | |
Bank Negara Monetary Note, 0.00%, 11/22/12 | | MYR | | | 10,823 | | | $ | 3,547,189 | |
Bank Negara Monetary Note, 0.00%, 12/20/12 | | MYR | | | 17,534 | | | | 5,734,020 | |
Bank Negara Monetary Note, 0.00%, 1/10/13 | | MYR | | | 8,005 | | | | 2,613,405 | |
| | |
Total Malaysia | | | | | | | | $ | 11,894,614 | |
| | |
|
Mauritius — 1.0% | |
Mauritius Treasury Bill, 0.00%, 1/24/13 | | MUR | | | 54,700 | | | $ | 1,756,678 | |
Mauritius Treasury Bill, 0.00%, 4/26/13 | | MUR | | | 36,300 | | | | 1,153,340 | |
| | |
Total Mauritius | | | | | | | | $ | 2,910,018 | |
| | |
|
Mexico — 1.0% | |
Mexico Cetes, 0.00%, 9/19/13 | | MXN | | | 39,750 | | | $ | 2,916,224 | |
| | |
Total Mexico | | | | | | | | $ | 2,916,224 | |
| | |
|
Nigeria — 4.5% | |
Nigeria Treasury Bill, 0.00%, 2/7/13 | | NGN | | | 98,200 | | | $ | 603,145 | |
Nigeria Treasury Bill, 0.00%, 2/21/13 | | NGN | | | 168,070 | | | | 1,027,337 | |
Nigeria Treasury Bill, 0.00%, 3/7/13 | | NGN | | | 145,800 | | | | 884,469 | |
Nigeria Treasury Bill, 0.00%, 3/28/13 | | NGN | | | 97,400 | | | | 589,855 | |
Nigeria Treasury Bill, 0.00%, 4/4/13 | | NGN | | | 377,600 | | | | 2,281,108 | |
Nigeria Treasury Bill, 0.00%, 4/25/13 | | NGN | | | 52,900 | | | | 315,824 | |
Nigeria Treasury Bill, 0.00%, 5/9/13 | | NGN | | | 45,800 | | | | 272,384 | |
Nigeria Treasury Bill, 0.00%, 5/23/13 | | NGN | | | 285,000 | | | | 1,692,197 | |
Nigeria Treasury Bill, 0.00%, 10/24/13 | | NGN | | | 975,000 | | | | 5,416,661 | |
| | |
Total Nigeria | | | | | | | | $ | 13,082,980 | |
| | |
|
Philippines — 2.1% | |
Philippine Treasury Bill, 0.00%, 11/7/12 | | PHP | | | 37,880 | | | $ | 919,483 | |
Philippine Treasury Bill, 0.00%, 2/6/13 | | PHP | | | 71,520 | | | | 1,734,202 | |
Philippine Treasury Bill, 0.00%, 8/7/13 | | PHP | | | 149,240 | | | | 3,599,402 | |
| | |
Total Philippines | | | | | | | | $ | 6,253,087 | |
| | |
| | | | | | | | | | |
| Security | | | | Principal
Amount
(000’s omitted) | | | Value | |
| | | | | | | | | | |
|
Serbia — 1.5% | |
Serbia Treasury Bill, 0.00%, 1/17/13 | | RSD | | | 310,500 | | | $ | 3,449,359 | |
Serbia Treasury Bill, 0.00%, 3/28/13 | | RSD | | | 79,350 | | | | 859,338 | |
| | |
Total Serbia | | | | | | | | $ | 4,308,697 | |
| | |
|
South Korea — 3.8% | |
Korea Monetary Stabilization Bond, 0.00%, 11/13/12 | | KRW | | | 4,505,800 | | | $ | 4,127,287 | |
Korea Monetary Stabilization Bond, 0.00%, 12/25/12 | | KRW | | | 7,706,910 | | | | 7,035,573 | |
| | |
Total South Korea | | | | | | | | $ | 11,162,860 | |
| | |
|
Sri Lanka — 4.1% | |
Sri Lanka Treasury Bill, 0.00%, 12/7/12 | | LKR | | | 244,000 | | | $ | 1,854,513 | |
Sri Lanka Treasury Bill, 0.00%, 2/1/13 | | LKR | | | 18,260 | | | | 136,565 | |
Sri Lanka Treasury Bill, 0.00%, 3/8/13 | | LKR | | | 859,290 | | | | 6,350,494 | |
Sri Lanka Treasury Bill, 0.00%, 3/29/13 | | LKR | | | 8,590 | | | | 63,025 | |
Sri Lanka Treasury Bill, 0.00%, 6/7/13 | | LKR | | | 465,550 | | | | 3,335,618 | |
Sri Lanka Treasury Bill, 0.00%, 10/4/13 | | LKR | | | 50,880 | | | | 350,584 | |
| | |
Total Sri Lanka | | | | | | | | $ | 12,090,799 | |
| | |
|
Thailand — 2.7% | |
Bank of Thailand, 0.00%, 11/8/12 | | THB | | | 110,050 | | | $ | 3,589,306 | |
Bank of Thailand, 0.00%, 11/15/12 | | THB | | | 134,029 | | | | 4,369,608 | |
| | |
Total Thailand | | | | | | | | $ | 7,958,914 | |
| | |
|
Uruguay — 1.5% | |
Monetary Regulation Bill, 0.00%, 2/15/13 | | UYU | | | 52,100 | | | $ | 2,565,462 | |
Monetary Regulation Bill, 0.00%, 4/26/13(1) | | UYU | | | 33,758 | | | | 1,696,999 | |
| | |
Total Uruguay | | | | | | | | $ | 4,262,461 | |
| | |
| |
Total Foreign Government Securities
(identified cost $92,511,167) | | | $ | 92,988,384 | |
| | |
|
| U.S. Treasury Obligations — 6.9% | |
| | | |
| | | | | | | | | | |
| Security | | | | Principal
Amount
(000s omitted) | | | Value | |
U.S. Treasury Bill, 0.00%, 11/15/12(8) | | | | $ | 20,200 | | | $ | 20,199,495 | |
| | |
| |
Total U.S. Treasury Obligations
(identified cost $20,199,368) | | | $ | 20,199,495 | |
| | |
| | | | |
| | 21 | | See Notes to Consolidated Financial Statements. |
International Income Portfolio
October 31, 2012
Consolidated Portfolio of Investments — continued
| | | | | | | | | | |
| Other — 19.9% | |
| | | |
| | | | | | | | | | |
| Description | | | | Interest
(000’s omitted) | | | Value | |
| | | | | | | | | | |
Eaton Vance Cash Reserves Fund, LLC, 0.12%(9) | | | | $ | 58,129 | | | $ | 58,129,189 | |
| | |
| | |
Total Other
(identified cost $58,129,189) | | | | | | $ | 58,129,189 | |
| | |
| |
Total Short-Term Investments
(identified cost $170,839,724) | | | $ | 171,317,068 | |
| | |
| |
Total Investments — 98.6%
(identified cost $284,576,174) | | | $ | 288,096,518 | |
| | |
| |
Other Assets, Less Liabilities — 1.4% | | | $ | 4,237,442 | |
| | |
| |
Net Assets — 100.0% | | | $ | 292,333,960 | |
| | |
The percentage shown for each investment category in the Consolidated Portfolio of Investments is based on net assets.
| | | | |
| AUD | | – | | Australian Dollar |
| AZN | | – | | Azerbaijani Manat |
| BAM | | – | | Bosnia-Herzegovina Convertible Mark |
| BRL | | – | | Brazilian Real |
| CAD | | – | | Canadian Dollar |
| COP | | – | | Colombian Peso |
| CRC | | – | | Costa Rican Colon |
| DKK | | – | | Danish Krone |
| DOP | | – | | Dominican Peso |
| GBP | | – | | British Pound Sterling |
| GEL | | – | | Georgian Lari |
| GHS | | – | | Ghanaian Cedi |
| HKD | | – | | Hong Kong Dollar |
| HRK | | – | | Croatian Kuna |
| HUF | | – | | Hungarian Forint |
| KRW | | – | | South Korean Won |
| LKR | | – | | Sri Lankan Rupee |
| MUR | | – | | Mauritian Rupee |
| MXN | | – | | Mexican Peso |
| MYR | | – | | Malaysian Ringgit |
| NGN | | – | | Nigerian Naira |
| PEN | | – | | Peruvian New Sol |
| PHP | | – | | Philippine Peso |
| RSD | | – | | Serbian Dinar |
| SEK | | – | | Swedish Krona |
| THB | | – | | Thai Baht |
| TRY | | – | | New Turkish Lira |
| UYU | | – | | Uruguayan Peso |
| VND | | – | | Vietnamese Dong |
| | (1) | Inflation-linked security whose principal is adjusted for inflation based on changes in a designated inflation index or inflation rate for the applicable country. Interest is calculated based on the inflation-adjusted principal. |
| | (2) | Security exempt from registration pursuant to Rule 144A under the Securities Act of 1933. These securities may be sold in certain transactions (normally to qualified institutional buyers) and remain exempt from registration. At October 31, 2012, the aggregate value of these securities is $3,454,774 or 1.2% of the Portfolio’s net assets. |
| | (3) | Represents a structured security whose market value and interest rate are linked to the performance of the underlying security. |
| | (4) | Security exempt from registration under Regulation S of the Securities Act of 1933, which exempts from registration securities offered and sold outside the United States. Security may not be offered or sold in the United States except pursuant to an exemption from, or in a transaction not subject to, the registration requirements of the Securities Act of 1933. |
| | (5) | Weighted average fixed-rate coupon that changes/updates monthly. |
| | (6) | Adjustable rate mortgage security. Rate shown is the rate at October 31, 2012. |
| | (7) | Non-income producing security. |
| | (8) | Security (or a portion thereof) has been pledged to cover collateral requirements on open financial contracts. |
| | (9) | Affiliated investment company available to Eaton Vance portfolios and funds which invests in high quality, U.S. dollar denominated money market instruments. The rate shown is the annualized seven-day yield as of October 31, 2012. |
| | | | |
| | 22 | | See Notes to Consolidated Financial Statements. |
International Income Portfolio
October 31, 2012
Consolidated Statement of Assets and Liabilities
| | | | |
| Assets | | October 31, 2012 | |
Investments — | | | | |
Securities of unaffiliated issuers, at value (identified cost, $209,323,281) | | $ | 212,366,040 | |
Affiliated investment, at value (identified cost, $58,129,189) | | | 58,129,189 | |
Precious metals, at value (identified cost, $17,123,704) | | | 17,601,289 | |
Total Investments, at value (identified cost, $284,576,174) | | $ | 288,096,518 | |
Cash | | $ | 449,792 | |
Restricted cash* | | | 10,000 | |
Foreign currency, at value (identified cost, $4,464,719) | | | 4,454,433 | |
Interest receivable | | | 1,940,763 | |
Interest receivable from affiliated investment | | | 7,241 | |
Receivable for open forward foreign currency exchange contracts | | | 510,703 | |
Receivable for closed forward foreign currency exchange contracts | | | 18,515 | |
Receivable for closed swap contracts | | | 8,270 | |
Receivable for closed options | | | 13,126 | |
Tax reclaims receivable | | | 2,664 | |
Total assets | | $ | 295,512,025 | |
| |
| Liabilities | | | | |
Payable for investments purchased | | $ | 2,579,928 | |
Payable for variation margin on open financial futures contracts | | | 18,344 | |
Payable for open forward foreign currency exchange contracts | | | 276,358 | |
Payable for closed forward foreign currency exchange contracts | | | 2,784 | |
Payable to affiliates: | | | | |
Investment adviser fee | | | 149,981 | |
Trustees’ fees | | | 890 | |
Accrued expenses | | | 149,780 | |
Total liabilities | | $ | 3,178,065 | |
Net Assets applicable to investors’ interest in Portfolio | | $ | 292,333,960 | |
| |
| Sources of Net Assets | | | | |
Investors’ capital | | $ | 288,576,070 | |
Net unrealized appreciation | | | 3,757,890 | |
Total | | $ | 292,333,960 | |
| * | Represents restricted cash on deposit at the custodian as collateral for open financial contracts. |
| | | | |
| | 23 | | See Notes to Consolidated Financial Statements. |
International Income Portfolio
October 31, 2012
Consolidated Statement of Operations
| | | | |
| Investment Income | | Year Ended
October 31, 2012 | |
Interest (net of foreign taxes, $266,150) | | $ | 10,801,614 | |
Interest allocated from affiliated investment | | | 52,796 | |
Expenses allocated from affiliated investment | | | (7,011 | ) |
Total investment income | | $ | 10,847,399 | |
| |
| Expenses | | | | |
Investment adviser fee | | $ | 1,522,808 | |
Trustees’ fees and expenses | | | 10,203 | |
Custodian fee | | | 480,713 | |
Legal and accounting services | | | 104,396 | |
Miscellaneous | | | 18,352 | |
Total expenses | | $ | 2,136,472 | |
Deduct — | | | | |
Reduction of custodian fee | | $ | 355 | |
Total expense reductions | | $ | 355 | |
| |
Net expenses | | $ | 2,136,117 | |
| |
Net investment income | | $ | 8,711,282 | |
| |
| Realized and Unrealized Gain (Loss) | | | | |
Net realized gain (loss) — | | | | |
Investment transactions | | $ | (3,985,371 | ) |
Investment transactions allocated from affiliated investment | | | 671 | |
Financial futures contracts | | | (400,129 | ) |
Swap contracts | | | 210,431 | |
Foreign currency and forward foreign currency exchange contract transactions | | | 3,575,479 | |
Net realized loss | | $ | (598,919 | ) |
Change in unrealized appreciation (depreciation) — | | | | |
Investments (including net decrease of $70,230 from precious metals) | | $ | 1,537,837 | |
Financial futures contracts | | | 27,822 | |
Swap contracts | | | (275,074 | ) |
Foreign currency and forward foreign currency exchange contracts | | | 407,805 | |
Net change in unrealized appreciation (depreciation) | | $ | 1,698,390 | |
| |
Net realized and unrealized gain | | $ | 1,099,471 | |
| |
Net increase in net assets from operations | | $ | 9,810,753 | |
| | | | |
| | 24 | | See Notes to Consolidated Financial Statements. |
International Income Portfolio
October 31, 2012
Consolidated Statements of Changes in Net Assets
| | | | | | | | |
| | | Year Ended October 31, | |
| Increase (Decrease) in Net Assets | | 2012 | | | 2011 | |
From operations — | | | | | | | | |
Net investment income | | $ | 8,711,282 | | | $ | 5,290,442 | |
Net realized gain (loss) from investment transactions, financial futures contracts, swap contracts, foreign currency and forward foreign currency exchange contract transactions | | | (598,919 | ) | | | 7,529,517 | |
Net change in unrealized appreciation (depreciation) from investments, financial futures contracts, swap contracts, foreign currency and forward foreign currency exchange contracts | | | 1,698,390 | | | | (6,091,788 | ) |
Net increase in net assets from operations | | $ | 9,810,753 | | | $ | 6,728,171 | |
Capital transactions — | | | | | | | | |
Contributions | | $ | 95,846,225 | | | $ | 35,325,507 | |
Withdrawals | | | (19,978,899 | ) | | | (4,103,246 | ) |
Net increase in net assets from capital transactions | | $ | 75,867,326 | | | $ | 31,222,261 | |
| | |
Net increase in net assets | | $ | 85,678,079 | | | $ | 37,950,432 | |
| | |
| Net Assets | | | | | | | | |
At beginning of year | | $ | 206,655,881 | | | $ | 168,705,449 | |
At end of year | | $ | 292,333,960 | | | $ | 206,655,881 | |
| | | | |
| | 25 | | See Notes to Consolidated Financial Statements. |
International Income Portfolio
October 31, 2012
Consolidated Supplementary Data
| | | | | | | | | | | | | | | | | | | | |
| | | Year Ended October 31, | |
| Ratios/Supplemental Data | | 2012 | | | 2011 | | | 2010 | | | 2009 | | | 2008 | |
Ratios (as a percentage of average daily net assets): | | | | | | | | | | | | | | | | | | | | |
Expenses(1) | | | 0.88 | % | | | 0.92 | % | | | 0.96 | % | | | 0.90 | % | | | 1.01 | % |
Net investment income | | | 3.57 | % | | | 2.81 | % | | | 2.51 | % | | | 3.34 | % | | | 4.01 | % |
Portfolio Turnover | | | 37 | % | | | 31 | % | | | 45 | % | | | 28 | % | | | 14 | % |
| | | | | |
Total Return | | | 3.93 | % | | | 4.05 | % | | | 1.85 | % | | | 20.91 | % | | | (0.64 | )% |
| | | | | |
Net assets, end of year (000’s omitted) | | $ | 292,334 | | | $ | 206,656 | | | $ | 168,705 | | | $ | 69,581 | | | $ | 33,755 | |
| (1) | Excludes the effect of custody fee credits, if any, of less than 0.005%. |
| | | | |
| | 26 | | See Notes to Consolidated Financial Statements. |
International Income Portfolio
October 31, 2012
Notes to Consolidated Financial Statements
1 Significant Accounting Policies
International Income Portfolio (the Portfolio) is a Massachusetts business trust registered under the Investment Company Act of 1940, as amended (the 1940 Act), as a diversified, open-end management investment company. The Portfolio’s investment objective is total return. The Declaration of Trust permits the Trustees to issue interests in the Portfolio. At October 31, 2012, Eaton Vance Diversified Currency Income Fund, Eaton Vance International (Cayman Islands) Strategic Income Fund and Eaton Vance Strategic Income Fund held an interest of 30.8%, 10.8% and 57.4%, respectively, in the Portfolio.
The Portfolio seeks to gain exposure to the commodity markets, in whole or in part, through investments in Eaton Vance IIP Commodity Subsidiary, Ltd. (the Subsidiary), a wholly-owned subsidiary of the Portfolio organized under the laws of the Cayman Islands with the same objective and investment policies and restrictions as the Portfolio. The Portfolio may invest up to 25% of its total assets in the Subsidiary. The net assets of the Subsidiary at October 31, 2012 were $18,019,780 or 6.2% of the Portfolio’s consolidated net assets. The accompanying consolidated financial statements include the accounts of the Subsidiary. Intercompany balances and transactions have been eliminated in consolidation.
The following is a summary of significant accounting policies of the Portfolio. The policies are in conformity with accounting principles generally accepted in the United States of America.
A Investment Valuation — Debt obligations (including short-term obligations with a remaining maturity of more than sixty days and excluding most seasoned, fixed-rate 30-year mortgage-backed securities as noted below) are generally valued on the basis of valuations provided by third party pricing services, as derived from such services’ pricing models. Inputs to the models may include, but are not limited to, reported trades, executable bid and asked prices, broker/dealer quotations, prices or yields of securities with similar characteristics, benchmark curves or information pertaining to the issuer, as well as industry and economic events. The pricing services may use a matrix approach, which considers information regarding securities with similar characteristics to determine the valuation for a security. Most seasoned, fixed-rate 30-year mortgage-backed securities are valued through the use of the investment adviser’s matrix pricing system, which takes into account bond prices, yield differentials, anticipated prepayments and interest rates provided by dealers. Short-term obligations purchased with a remaining maturity of sixty days or less (excluding those that are non-U.S. dollar denominated, which typically are valued by a pricing service or dealer quotes) are generally valued at amortized cost, which approximates market value. Precious metals are valued at the New York composite mean quotation reported by Bloomberg at the valuation time. Exchange-traded options are valued at the mean between the bid and asked prices at valuation time as reported by the Options Price Reporting Authority for U.S. listed options or by the relevant exchange or board of trade for non-U.S. listed options. Over-the-counter options (including options on securities, indices and foreign currencies) are valued by a third party pricing service using techniques that consider factors including the value of the underlying instrument, the volatility of the underlying instrument and the period of time until option expiration. Financial futures contracts are valued at the closing settlement price established by the board of trade or exchange on which they are traded. Forward foreign currency exchange contracts are generally valued at the mean of the average bid and average asked prices that are reported by currency dealers to a third party pricing service at the valuation time. Such third party pricing service valuations are supplied for specific settlement periods and the Portfolio’s forward foreign currency exchange contracts are valued at an interpolated rate between the closest preceding and subsequent settlement period reported by the third party pricing service. Interest rate swaps are normally valued using valuations provided by a third party pricing service. Such pricing service valuations are based on the present value of fixed and projected floating rate cash flows over the term of the swap contract. Future cash flows are discounted to their present value using swap rates provided by electronic data services or by broker/dealers. Credit default swaps are normally valued using valuations provided by a third party pricing service. The pricing services employ electronic data processing techniques to determine the present value based on credit spread quotations obtained from broker/dealers and expected default recovery rates determined by the pricing service using proprietary models. Foreign securities and currencies are valued in U.S. dollars, based on foreign currency exchange rate quotations supplied by a third party pricing service. The pricing service uses a proprietary model to determine the exchange rate. Inputs to the model include reported trades and implied bid/ask spreads. Investments for which valuations or market quotations are not readily available or are deemed unreliable are valued at fair value using methods determined in good faith by or at the direction of the Trustees of the Portfolio in a manner that fairly reflects the security’s value, or the amount that the Portfolio might reasonably expect to receive for the security upon its current sale in the ordinary course. Each such determination is based on a consideration of relevant factors, which are likely to vary from one pricing context to another. These factors may include, but are not limited to, the type of security, the existence of any contractual restrictions on the security’s disposition, the price and extent of public trading in similar securities of the issuer or of comparable companies or entities, quotations or relevant information obtained from broker/dealers or other market participants, information obtained from the issuer, analysts, and/or the appropriate stock exchange (for exchange-traded securities), an analysis of the company’s or entity’s financial condition, and an evaluation of the forces that influence the issuer and the market(s) in which the security is purchased and sold.
The Portfolio may invest in Eaton Vance Cash Reserves Fund, LLC (Cash Reserves Fund), an affiliated investment company managed by Eaton Vance Management (EVM). Cash Reserves Fund generally values its investment securities utilizing the amortized cost valuation technique in accordance with Rule 2a-7 under the 1940 Act. This technique involves initially valuing a portfolio security at its cost and thereafter assuming a constant amortization to maturity of any discount or premium. If amortized cost is determined not to approximate fair value, Cash Reserves Fund may value its investment securities in the same manner as debt obligations described above.
B Investment Transactions — Investment transactions for financial statement purposes are accounted for on a trade date basis. Realized gains and losses on investments sold are determined on the basis of identified cost.
International Income Portfolio
October 31, 2012
Notes to Consolidated Financial Statements — continued
C Income — Interest income is recorded on the basis of interest accrued, adjusted for amortization of premium or accretion of discount. Inflation adjustments to the principal amount of inflation-adjusted bonds and notes are reflected as interest income. Withholding taxes on foreign interest have been provided for in accordance with the Portfolio’s understanding of the applicable countries’ tax rules and rates.
D Federal Taxes — The Portfolio has elected to be treated as a partnership for federal tax purposes. No provision is made by the Portfolio for federal or state taxes on any taxable income of the Portfolio because each investor in the Portfolio is ultimately responsible for the payment of any taxes on its share of taxable income. Since at least one of the Portfolio’s investors is a regulated investment company that invests all or substantially all of its assets in the Portfolio, the Portfolio normally must satisfy the applicable source of income and diversification requirements (under the Internal Revenue Code) in order for its investors to satisfy them. The Portfolio will allocate, at least annually among its investors, each investor’s distributive share of the Portfolio’s net investment income, net realized capital gains and any other items of income, gain, loss, deduction or credit.
The Subsidiary is treated as a controlled foreign corporation under the Internal Revenue Code and is not expected to be subject to U.S. federal income tax. The Portfolio is treated as a U.S. shareholder of the Subsidiary. As a result, the Portfolio is required to include in gross income for U.S. federal tax purposes all of the Subsidiary’s income, whether or not such income is distributed by the Subsidiary. If a net loss is realized by the Subsidiary, such loss is not generally available to offset the income earned by the Portfolio.
As of October 31, 2012, the Portfolio had no uncertain tax positions that would require financial statement recognition, de-recognition, or disclosure. The Portfolio files a U.S. federal income tax return annually after its fiscal year-end, which is subject to examination by the Internal Revenue Service for a period of three years from the date of filing.
E Expense Reduction — State Street Bank and Trust Company (SSBT) serves as custodian of the Portfolio. Pursuant to the custodian agreement, SSBT receives a fee reduced by credits, which are determined based on the average daily cash balance the Portfolio maintains with SSBT. All credit balances, if any, used to reduce the Portfolio’s custodian fees are reported as a reduction of expenses in the Consolidated Statement of Operations.
F Foreign Currency Translation — Investment valuations, other assets, and liabilities initially expressed in foreign currencies are translated each business day into U.S. dollars based upon current exchange rates. Purchases and sales of foreign investment securities and income and expenses denominated in foreign currencies are translated into U.S. dollars based upon currency exchange rates in effect on the respective dates of such transactions. Recognized gains or losses on investment transactions attributable to changes in foreign currency exchange rates are recorded for financial statement purposes as net realized gains and losses on investments. That portion of unrealized gains and losses on investments that results from fluctuations in foreign currency exchange rates is not separately disclosed.
G Use of Estimates — The preparation of the consolidated financial statements in conformity with accounting principles generally accepted in the United States of America requires management to make estimates and assumptions that affect the reported amounts of assets and liabilities at the date of the consolidated financial statements and the reported amounts of income and expense during the reporting period. Actual results could differ from those estimates.
H Indemnifications — Under the Portfolio’s organizational documents, its officers and Trustees may be indemnified against certain liabilities and expenses arising out of the performance of their duties to the Portfolio. Under Massachusetts law, if certain conditions prevail, interestholders in the Portfolio could be deemed to have personal liability for the obligations of the Portfolio. However, the Portfolio’s Declaration of Trust contains an express disclaimer of liability on the part of Portfolio interestholders and the By-laws provide that the Portfolio shall assume the defense on behalf of any Portfolio interestholder. Moreover, the By-laws also provide for indemnification out of Portfolio property of any interestholder held personally liable solely by reason of being or having been an interestholder for all loss or expense arising from such liability. Additionally, in the normal course of business, the Portfolio enters into agreements with service providers that may contain indemnification clauses. The Portfolio’s maximum exposure under these arrangements is unknown as this would involve future claims that may be made against the Portfolio that have not yet occurred.
I Financial Futures Contracts — Upon entering into a financial futures contract, the Portfolio is required to deposit with the broker, either in cash or securities, an amount equal to a certain percentage of the purchase price (initial margin). Subsequent payments, known as variation margin, are made or received by the Portfolio each business day, depending on the daily fluctuations in the value of the underlying security, and are recorded as unrealized gains or losses by the Portfolio. Gains (losses) are realized upon the expiration or closing of the financial futures contracts. Should market conditions change unexpectedly, the Portfolio may not achieve the anticipated benefits of the financial futures contracts and may realize a loss. Futures contracts have minimal counterparty risk as they are exchange traded and the clearinghouse for the exchange is substituted as the counterparty, guaranteeing counterparty performance.
J Forward Foreign Currency Exchange Contracts — The Portfolio may enter into forward foreign currency exchange contracts for the purchase or sale of a specific foreign currency at a fixed price on a future date. The forward foreign currency exchange contracts are adjusted by the daily exchange rate of the underlying currency and any gains or losses are recorded as unrealized until such time as the contracts have been closed or offset by another contract with the same broker for the same settlement date and currency. Risks may arise upon entering these contracts from the potential inability of counterparties to meet the terms of their contracts and from movements in the value of a foreign currency relative to the U.S. dollar.
K Written Options — Upon the writing of a call or a put option, the premium received by the Portfolio is included in the Consolidated Statement of Assets and Liabilities as a liability. The amount of the liability is subsequently marked-to-market to reflect the current market value of the option written, in
International Income Portfolio
October 31, 2012
Notes to Consolidated Financial Statements — continued
accordance with the Portfolio’s policies on investment valuations discussed above. Premiums received from writing options which expire are treated as realized gains. Premiums received from writing options which are exercised or are closed are added to or offset against the proceeds or amount paid on the transaction to determine the realized gain or loss. When an index option is exercised, the Portfolio is required to deliver an amount of cash determined by the excess of the strike price of the option over the value of the index (in the case of a put) or the excess of the value of the index over the strike price of the option (in the case of a call) at contract termination. If a put option on a security is exercised, the premium reduces the cost basis of the securities purchased by the Portfolio. The Portfolio, as a writer of an option, may have no control over whether the underlying securities or other assets may be sold (call) or purchased (put) and, as a result, bears the market risk of an unfavorable change in the price of the securities or other assets underlying the written option. The Portfolio may also bear the risk of not being able to enter into a closing transaction if a liquid secondary market does not exist.
L Purchased Options — Upon the purchase of a call or put option, the premium paid by the Portfolio is included in the Consolidated Statement of Assets and Liabilities as an investment. The amount of the investment is subsequently marked-to-market to reflect the current market value of the option purchased, in accordance with the Portfolio’s policies on investment valuations discussed above. As the purchaser of an index option, the Portfolio has the right to receive a cash payment equal to any depreciation in the value of the index below the strike price of the option (in the case of a put) or equal to any appreciation in the value of the index over the strike price of the option (in the case of a call) as of the valuation date of the option. If an option which the Portfolio had purchased expires on the stipulated expiration date, the Portfolio will realize a loss in the amount of the cost of the option. If the Portfolio enters into a closing sale transaction, the Portfolio will realize a gain or loss, depending on whether the sales proceeds from the closing sale transaction are greater or less than the cost of the option. If the Portfolio exercises a put option on a security, it will realize a gain or loss from the sale of the underlying security, and the proceeds from such sale will be decreased by the premium originally paid. If the Portfolio exercises a call option on a security, the cost of the security which the Portfolio purchases upon exercise will be increased by the premium originally paid. The risk associated with purchasing options is limited to the premium originally paid.
M Interest Rate Swaps — Pursuant to interest rate swap agreements, the Portfolio either makes floating-rate payments based on a benchmark interest rate in exchange for fixed-rate payments or the Portfolio makes fixed-rate payments in exchange for payments on a floating benchmark interest rate. Payments received or made are recorded as realized gains or losses. During the term of the outstanding swap agreement, changes in the underlying value of the swap are recorded as unrealized gains or losses. The value of the swap is determined by changes in the relationship between two rates of interest. The Portfolio is exposed to credit loss in the event of non-performance by the swap counterparty. Risk may also arise from movements in interest rates.
N Cross-Currency Swaps — Cross-currency swaps are interest rate swaps in which interest cash flows are exchanged between two parties based on the notional amounts of two different currencies. The notional amounts are typically determined based on the spot exchange rates at the inception of the trade. Cross-currency swaps also involve the exchange of the notional amounts at the start of the contract at the current spot rate with an agreement to re-exchange such amounts at a later date at either the same exchange rate, a specified rate or the then current spot rate. The entire principal value of a cross-currency swap is subject to the risk that the counterparty to the swap will default on its contractual delivery obligations.
O Credit Default Swaps — When the Portfolio is the buyer of a credit default swap contract, the Portfolio is entitled to receive the par (or other agreed-upon) value of a referenced debt obligation (or basket of debt obligations) from the counterparty to the contract if a credit event by a third party, such as a U.S. or foreign corporate issuer or sovereign issuer, on the debt obligation occurs. In return, the Portfolio pays the counterparty a periodic stream of payments over the term of the contract provided that no credit event has occurred. If no credit event occurs, the Portfolio would have spent the stream of payments and received no proceeds from the contract. When the Portfolio is the seller of a credit default swap contract, it receives the stream of payments, but is obligated to pay to the buyer of the protection an amount up to the notional amount of the swap and in certain instances take delivery of securities of the reference entity upon the occurrence of a credit event, as defined under the terms of that particular swap agreement. Credit events are contract specific but may include bankruptcy, failure to pay, restructuring, obligation acceleration and repudiation/moratorium. If the Portfolio is a seller of protection and a credit event occurs, the maximum potential amount of future payments that the Portfolio could be required to make would be an amount equal to the notional amount of the agreement. This potential amount would be partially offset by any recovery value of the respective referenced obligation, or net amount received from the settlement of a buy protection credit default swap agreement entered into by the Portfolio for the same referenced obligation. As the seller, the Portfolio may create economic leverage to its portfolio because, in addition to its total net assets, the Portfolio is subject to investment exposure on the notional amount of the swap. The interest fee paid or received on the swap contract, which is based on a specified interest rate on a fixed notional amount, is accrued daily as a component of unrealized appreciation (depreciation) and is recorded as realized gain upon receipt or realized loss upon payment. The Portfolio also records an increase or decrease to unrealized appreciation (depreciation) in an amount equal to the daily valuation. Upfront payments or receipts, if any, are recorded as other assets or other liabilities, respectively, and amortized over the life of the swap contract as realized gains or losses. For financial reporting purposes, unamortized upfront payments, if any, are netted with unrealized appreciation or depreciation on swap contracts to determine the market value of swaps as presented in Notes 5 and 8. The Portfolio segregates assets in the form of cash or liquid securities in an amount equal to the notional amount of the credit default swaps of which it is the seller. The Portfolio segregates assets in the form of cash or liquid securities in an amount equal to any unrealized depreciation of the credit default swaps of which it is the buyer, marked to market on a daily basis. These transactions involve certain risks, including the risk that the seller may be unable to fulfill the transaction.
P Repurchase Agreements — A repurchase agreement is the purchase by the Portfolio of securities from a counterparty in exchange for cash that is coupled with an agreement to resell those securities to the counterparty at a specified date and price. When a repurchase agreement is entered, the Portfolio typically receives securities with a value that equals or exceeds the repurchase price, including any accrued interest earned on the agreement. The value of such securities will be marked to market daily, and cash or additional securities will be exchanged between the parties as needed. Except in the case of a repurchase agreement entered to settle a short sale, the value of the securities delivered to the Portfolio will be at least equal to 90% of the
International Income Portfolio
October 31, 2012
Notes to Consolidated Financial Statements — continued
repurchase price during the term of the repurchase agreement. The terms of a repurchase agreement entered to settle a short sale may provide that the cash purchase price paid by the Portfolio is more than the value of purchased securities that effectively collateralize the repurchase price payable by the counterparty. Since in such a transaction, the Portfolio normally will have used the purchased securities to settle the short sale, the Portfolio will segregate liquid assets equal to the marked to market value of the purchased securities that it is obligated to return to the counterparty under the repurchase agreement. In the event of insolvency of the counterparty to a repurchase agreement, recovery of the repurchase price owed to the Portfolio may be delayed. Such an insolvency also may result in a loss to the extent that the value of the purchased securities decreases during the delay or that value has otherwise not been maintained at an amount at least equal to the repurchase price.
2 Investment Adviser Fee and Other Transactions with Affiliates
The investment adviser fee is earned by Boston Management and Research (BMR), a subsidiary of EVM, as compensation for investment advisory services rendered to the Portfolio and the Subsidiary. Pursuant to the investment advisory agreement between the Portfolio and BMR and the investment advisory agreement between the Subsidiary and BMR, the Portfolio and Subsidiary each pay BMR a fee at an annual rate of 0.625% of its respective average daily net assets up to $1 billion and at reduced rates on daily net assets of $1 billion or more, and is payable monthly. In determining the investment adviser fee for the Portfolio and Subsidiary, the applicable advisory fee rate is based on the average daily net assets of the Portfolio (inclusive of its interest in the Subsidiary). Such fee rate is then assessed separately on the Portfolio’s average daily net assets (exclusive of its interest in the Subsidiary) and the Subsidiary’s average daily net assets to determine the amount of the investment adviser fee. The Portfolio invests its cash in Cash Reserves Fund. EVM does not currently receive a fee for advisory services provided to Cash Reserves Fund. For the year ended October 31, 2012, the Portfolio’s investment adviser fee amounted to $1,522,808 or 0.625% of the Portfolio’s consolidated average daily net assets.
Trustees and officers of the Portfolio who are members of EVM’s or BMR’s organizations receive remuneration for their services to the Portfolio out of the investment adviser fee. Trustees of the Portfolio who are not affiliated with the investment adviser may elect to defer receipt of all or a percentage of their annual fees in accordance with the terms of the Trustees Deferred Compensation Plan. For the year ended October 31, 2012, no significant amounts have been deferred. Certain officers and Trustees of the Portfolio are officers of the above organizations.
3 Purchases and Sales of Investments
Purchases and sales of investments, other than short-term obligations and including maturities and paydowns, for the year ended October 31, 2012 were as follows:
| | | | | | | | |
| | | Purchases | | | Sales | |
| | |
Investments (non-U.S. Government) | | $ | 69,113,703 | | | $ | 39,980,276 | |
U.S. Government and Agency Securities | | | — | | | | 2,557,333 | |
| | |
| | | $ | 69,113,703 | | | $ | 42,537,609 | |
4 Federal Income Tax Basis of Investments
The cost and unrealized appreciation (depreciation) of investments of the Portfolio at October 31, 2012, as determined on a federal income tax basis, were as follows:
| | | | |
| |
Aggregate cost | | $ | 285,042,039 | |
| |
Gross unrealized appreciation | | $ | 6,383,530 | |
Gross unrealized depreciation | | | (3,329,051 | ) |
| |
Net unrealized appreciation | | $ | 3,054,479 | |
The net unrealized appreciation on futures contracts, foreign currency and forward foreign currency exchange contracts at October 31, 2012 on a federal income tax basis was $170,662.
5 Financial Instruments
The Portfolio may trade in financial instruments with off-balance sheet risk in the normal course of its investing activities. These financial instruments may include forward foreign currency exchange contracts, financial futures contracts and swap contracts and may involve, to a varying degree, elements of risk
International Income Portfolio
October 31, 2012
Notes to Consolidated Financial Statements — continued
in excess of the amounts recognized for financial statement purposes. The notional or contractual amounts of these instruments represent the investment the Portfolio has in particular classes of financial instruments and do not necessarily represent the amounts potentially subject to risk. The measurement of the risks associated with these instruments is meaningful only when all related and offsetting transactions are considered.
A summary of obligations under these financial instruments at October 31, 2012 is as follows:
| | | | | | | | | | |
| Forward Foreign Currency Exchange Contracts | | | | | |
| | | | |
| | | | | | | | | | |
Sales | |
| Settlement Date | | Deliver | | In Exchange For | | Counterparty | | Net Unrealized Appreciation (Depreciation) | |
| | | | |
| 11/26/12 | | Euro
22,473,624 | | United States Dollar 29,148,290 | | State Street Bank and Trust Co. | | $ | 13,027 | |
| 11/26/12 | | Euro
883,149 | | United States Dollar 1,145,745 | | State Street Bank and Trust Co. | | | 812 | |
| 12/17/12 | | Canadian Dollar
1,300,000 | | United States Dollar 1,290,943 | | Citibank NA | | | (9,444 | ) |
| | | | |
| | | | | | | | | $ | 4,395 | |
| | | | |
| | | | | | | | | | |
Purchases | | | | | | | | | |
| Settlement Date | | In Exchange For | | Deliver | | Counterparty | | Net Unrealized Appreciation (Depreciation) | |
| | | | |
| 11/7/12 | | Guatemalan Quetzal
41,100,000 | | United States Dollar 5,227,411 | | Citibank NA | | $ | 15,367 | |
| 11/13/12 | | Polish Zloty 12,636,408 | | Euro 3,073,580 | | Barclays Bank PLC | | | (30,063 | ) |
| 11/13/12 | | Polish Zloty 12,636,000 | | Euro 3,074,079 | | JPMorgan Chase Bank | | | (30,837 | ) |
| 11/19/12 | | Singapore Dollar 12,290,244 | | United States Dollar 9,996,782 | | Standard Chartered Bank | | | 78,658 | |
| 11/19/12 | | Yuan Renminbi 32,484,000 | | United States Dollar 5,170,142 | | Goldman Sachs International | | | 27,869 | |
| 11/19/12 | | Yuan Renminbi 35,902,000 | | United States Dollar 5,711,877 | | Standard Chartered Bank | | | 33,074 | |
| 11/26/12 | | Swedish Krona 36,809,000 | | Euro 4,322,081 | | Barclays Bank PLC | | | (57,678 | ) |
| 11/26/12 | | Swedish Krona 22,708,923 | | Euro 2,666,493 | | Deutsche Bank | | | (35,625 | ) |
| 11/27/12 | | Norwegian Krone 52,604,281 | | Euro 7,133,267 | | Citibank NA | | | (29,331 | ) |
| 11/27/12 | | Norwegian Krone 20,290,000 | | Euro 2,743,753 | | Deutsche Bank | | | (1,435 | ) |
| 11/30/12 | | Swiss Franc 1,240,000 | | Euro 1,033,204 | | Deutsche Bank | | | (7,486 | ) |
| 12/4/12 | | Brazilian Real 6,050,000 | | United States Dollar 2,964,378 | | BNP Paribas SA | | | 2,445 | |
| 12/10/12 | | Indonesian Rupiah 38,304,000,000 | | United States Dollar 3,988,338 | | JPMorgan Chase Bank | | | (20,602 | ) |
| 12/14/12 | | Indian Rupee 272,100,000 | | United States Dollar 4,848,928 | | BNP Paribas SA | | | 168,390 | |
International Income Portfolio
October 31, 2012
Notes to Consolidated Financial Statements — continued
| | | | | | | | | | |
| Forward Foreign Currency Exchange Contracts (continued) | | | | | |
| | | | |
| | | | | | | | | | |
Purchases | |
| Settlement Date | | In Exchange For | | Deliver | | Counterparty | | Net Unrealized Appreciation (Depreciation) | |
| | | | |
| 12/14/12 | | Indian Rupee 155,140,000 | | United States Dollar 2,862,679 | | BNP Paribas SA | | $ | (2,015 | ) |
| 12/14/12 | | Israeli Shekel 5,247,000 | | United States Dollar 1,323,980 | | BNP Paribas SA | | | 24,683 | |
| 12/17/12 | | Canadian Dollar 3,650,795 | | United States Dollar 3,553,085 | | Australia and New Zealand Banking Group Limited | | | 98,796 | |
| 12/26/12 | | Indian Rupee 294,310,000 | | United States Dollar 5,468,108 | | Citibank NA | | | (51,842 | ) |
| 4/30/13 | | Russian Ruble 93,900,000 | | United States Dollar 2,896,807 | | BNP Paribas SA | | | 10,025 | |
| 6/14/13 | | Canadian Dollar 1,430,000 | | United States Dollar 1,386,901 | | Barclays Bank PLC | | | 37,557 | |
| | | | |
| | | | | | | | | $ | 229,950 | |
| | | | | | | | | | | | | | | | |
| Futures Contracts | | | | | | | | | | | | | |
| Expiration Month/Year | | Contracts | | Position | | Aggregate Cost | | | Value | | | Net Unrealized Appreciation (Depreciation) | |
| | | | | |
| 12/12 | | 34
U.S. 5-Year Treasury Note | | Short | | $ | (4,226,625 | ) | | $ | (4,224,500 | ) | | $ | 2,125 | |
| 12/12 | | 14
U.S. 10-Year Treasury Note | | Short | | | (1,860,031 | ) | | | (1,862,437 | ) | | | (2,406 | ) |
| 12/12 | | 7
U.S. 30-Year Treasury Bond | | Short | | | (1,050,235 | ) | | | (1,045,188 | ) | | | 5,047 | |
| | | | | |
| | | | | | | | | | | | | | | $ | 4,766 | |
At October 31, 2012, the Portfolio had sufficient cash and/or securities to cover commitments under these contracts.
In the normal course of pursuing its investment objective and its use of derivatives, the Portfolio is subject to the following risks:
Credit Risk: The Portfolio entered into credit default swap contracts to manage certain investment risks and/or to enhance total return.
Foreign Exchange Risk: The Portfolio engages in forward foreign currency exchange contracts to enhance total return, to seek to hedge against fluctuations in currency exchange rates and/or as a substitute for the purchase or sale of securities or currencies.
Interest Rate Risk: The Portfolio utilizes various interest rate derivatives including futures and interest rate swaps to enhance total return, to seek to hedge against fluctuations in interest rates and/or to change the effective duration of its portfolio.
The Portfolio enters into swap contracts and forward foreign currency exchange contracts that may contain provisions whereby the counterparty may terminate the contract under certain conditions, including but not limited to a decline in the Portfolio’s net assets below a certain level over a certain period of time, which would trigger a payment by the Portfolio for those derivatives in a liability position. At October 31, 2012, the fair value of derivatives with credit-related contingent features in a net liability position was $279,142. The aggregate fair value of assets pledged as collateral by the Portfolio for such liability was $159,996 at October 31, 2012.
The non-exchange traded derivatives in which the Portfolio invests, including swap contracts and forward foreign currency exchange contracts, are subject to the risk that the counterparty to the contract fails to perform its obligations under the contract. At October 31, 2012, the maximum amount of loss the
International Income Portfolio
October 31, 2012
Notes to Consolidated Financial Statements — continued
Portfolio would incur due to counterparty risk was $529,218 with the highest amount from any one counterparty being $205,910. Such maximum amount would be reduced by any unamortized upfront payments received by the Portfolio. Such amount would be increased by any unamortized upfront payments made by the Portfolio. To mitigate this risk, the Portfolio has entered into master netting agreements with substantially all its derivative counterparties, which allows it and a counterparty to aggregate amounts owed by each of them for derivative transactions under the agreement into a single net amount payable by either the Portfolio or the counterparty. At October 31, 2012, the maximum amount of loss the Portfolio would incur due to counterparty risk would be reduced by approximately $58,000 due to master netting agreements. Counterparties may be required to pledge collateral in the form of cash, U.S. Government securities or highly-rated bonds for the benefit of the Portfolio if the net amount due from the counterparty with respect to a derivative contract exceeds a certain threshold. The amount of collateral posted by the counterparties with respect to such contracts would also reduce the amount of any loss incurred.
The fair value of open derivative instruments (not considered to be hedging instruments for accounting disclosure purposes) by risk exposure at October 31, 2012 was as follows:
| | | | | | | | | | | | |
| | | Fair Value | |
| Consolidated Statement of Assets and Liabilities Caption | | Credit | | | Foreign Exchange | | | Interest
Rate | |
| | | |
Net unrealized appreciation* | | $ | — | | | $ | — | | | $ | 7,172 | |
Receivable for open forward foreign currency exchange contracts | | | — | | | | 510,703 | | | | — | |
| | | |
Total Asset Derivatives | | $ | — | | | $ | 510,703 | | | $ | 7,172 | |
| | | |
Net unrealized appreciation* | | $ | — | | | $ | — | | | $ | (2,406 | ) |
Payable for open forward foreign currency exchange contracts | | | — | | | | (276,358 | ) | | | — | |
| | | |
Total Liability Derivatives | | $ | — | | | $ | (276,358 | ) | | $ | (2,406 | ) |
| | | |
| | | | | | | | | | | | |
* Amount represents cumulative unrealized appreciation or (depreciation) on futures contracts in the Futures Contracts table above. Only the current day’s variation margin on open futures contracts is reported within the Consolidated Statement of Assets and Liabilities as Receivable or Payable for variation margin, as applicable. | |
|
| The effect of derivative instruments (not considered to be hedging instruments for accounting disclosure purposes) on the Consolidated Statement of Operations by risk exposure for the year ended October 31, 2012 was as follows: | |
| | | |
| | | | | | | | | | | | |
| Consolidated Statement of Operations Caption | | Credit | | | Foreign Exchange | | | Interest
Rate | |
| | | |
Net realized gain (loss) — | | | | | | | | | | | | |
Financial futures contracts | | $ | — | | | $ | — | | | $ | (400,129 | ) |
Swap contracts | | | 133,419 | | | | — | | | | 77,012 | |
| | | |
Foreign currency and forward foreign currency exchange contract transactions | | | — | | | | 3,340,507 | | | | — | |
| | | |
Total | | $ | 133,419 | | | $ | 3,340,507 | | | $ | (323,117 | ) |
| | | |
Change in unrealized appreciation (depreciation) — | | | | | | | | | | | | |
Financial futures contracts | | $ | — | | | $ | — | | | $ | 27,822 | |
Swap contracts | | | (143,418 | ) | | | — | | | | (131,656 | ) |
| | | |
Foreign currency and forward foreign currency exchange contracts | | | — | | | | 563,092 | | | | — | |
| | | |
Total | | $ | (143,418 | ) | | $ | 563,092 | | | $ | (103,834 | ) |
The average notional amounts of futures contracts, forward foreign currency exchange contracts and swap contracts outstanding during the year ended October 31, 2012, which are indicative of the volume of these derivative types, were approximately $5,985,000, $113,193,000 and $2,664,000, respectively.
International Income Portfolio
October 31, 2012
Notes to Consolidated Financial Statements — continued
6 Line of Credit
The Portfolio participates with other portfolios and funds managed by EVM and its affiliates in a $600 million unsecured line of credit agreement with a group of banks. Borrowings are made by the Portfolio solely to facilitate the handling of unusual and/or unanticipated short-term cash requirements. Interest is charged to the Portfolio based on its borrowings at an amount above either the Eurodollar rate or Federal Funds rate. In addition, a fee computed at an annual rate of 0.08% on the daily unused portion of the line of credit is allocated among the participating portfolios and funds at the end of each quarter. Because the line of credit is not available exclusively to the Portfolio, it may be unable to borrow some or all of its requested amounts at any particular time. The Portfolio did not have any significant borrowings or allocated fees during the year ended October 31, 2012.
7 Risks Associated with Foreign Investments
Investing in securities issued by companies whose principal business activities are outside the United States may involve significant risks not present in domestic investments. For example, there is generally less publicly available information about foreign companies, particularly those not subject to the disclosure and reporting requirements of the U.S. securities laws. Certain foreign issuers are generally not bound by uniform accounting, auditing, and financial reporting requirements and standards of practice comparable to those applicable to domestic issuers. Investments in foreign securities also involve the risk of possible adverse changes in investment or exchange control regulations, expropriation or confiscatory taxation, limitation on the removal of funds or other assets of the Portfolio, political or financial instability or diplomatic and other developments which could affect such investments. Foreign securities markets, while growing in volume and sophistication, are generally not as developed as those in the United States, and securities of some foreign issuers (particularly those located in developing countries) may be less liquid and more volatile than securities of comparable U.S. companies. In general, there is less overall governmental supervision and regulation of foreign securities markets, broker/dealers and issuers than in the United States.
8 Fair Value Measurements
Under generally accepted accounting principles for fair value measurements, a three-tier hierarchy to prioritize the assumptions, referred to as inputs, is used in valuation techniques to measure fair value. The three-tier hierarchy of inputs is summarized in the three broad levels listed below.
| Ÿ | | Level 1 – quoted prices in active markets for identical investments |
| Ÿ | | Level 2 – other significant observable inputs (including quoted prices for similar investments, interest rates, prepayment speeds, credit risk, etc.) |
| Ÿ | | Level 3 – significant unobservable inputs (including a fund’s own assumptions in determining the fair value of investments) |
In cases where the inputs used to measure fair value fall in different levels of the fair value hierarchy, the level disclosed is determined based on the lowest level input that is significant to the fair value measurement in its entirety. The inputs or methodology used for valuing securities are not necessarily an indication of the risk associated with investing in those securities.
International Income Portfolio
October 31, 2012
Notes to Consolidated Financial Statements — continued
At October 31, 2012, the hierarchy of inputs used in valuing the Portfolio’s investments and open derivative instruments, which are carried at value, were as follows:
| | | | | | | | | | | | | | | | |
| Asset Description | | Level 1 | | | Level 2 | | | Level 3 | | | Total | |
| | | | |
Foreign Government Bonds | | $ | — | | | $ | 86,442,814 | | | $ | — | | | $ | 86,442,814 | |
Collateralized Mortgage Obligations | | | — | | | | 1,403,014 | | | | — | | | | 1,403,014 | |
Mortgage Pass-Throughs | | | — | | | | 11,332,333 | | | | — | | | | 11,332,333 | |
Precious Metals | | | 17,601,289 | | | | — | | | | — | | | | 17,601,289 | |
Short-Term Investments — | | | | | | | | | | | | | | | | |
Foreign Government Securities | | | — | | | | 92,988,384 | | | | — | | | | 92,988,384 | |
U.S. Treasury Obligations | | | — | | | | 20,199,495 | | | | — | | | | 20,199,495 | |
Other | | | — | | | | 58,129,189 | | | | — | | | | 58,129,189 | |
| | | | |
Total Investments | | $ | 17,601,289 | | | $ | 270,495,229 | | | $ | — | | | $ | 288,096,518 | |
| | | | |
Forward Foreign Currency Exchange Contracts | | $ | — | | | $ | 510,703 | | | $ | — | | | $ | 510,703 | |
Futures Contracts | | | 7,172 | | | | — | | | | — | | | | 7,172 | |
| | | | |
Total | | $ | 17,608,461 | | | $ | 271,005,932 | | | $ | — | | | $ | 288,614,393 | |
| | | | |
Liability Description | | | | | | | | | | | | | | | | |
| | | | |
Forward Foreign Currency Exchange Contracts | | $ | — | | | $ | (276,358 | ) | | $ | — | | | $ | (276,358 | ) |
Futures Contracts | | | (2,406 | ) | | | — | | | | — | | | | (2,406 | ) |
| | | | |
Total | | $ | (2,406 | ) | | $ | (276,358 | ) | | $ | — | | | $ | (278,764 | ) |
The Portfolio held no investments or other financial instruments as of October 31, 2011 whose fair value was determined using Level 3 inputs. At October 31, 2012, there were no investments transferred between Level 1 and Level 2 during the year then ended.
International Income Portfolio
October 31, 2012
Report of Independent Registered Public Accounting Firm
To the Trustees and Investors of International Income Portfolio:
We have audited the accompanying consolidated statement of assets and liabilities of International Income Portfolio and subsidiary (the “Portfolio”), including the consolidated portfolio of investments, as of October 31, 2012, and the related consolidated statement of operations for the year then ended, the consolidated statements of changes in net assets for each of the two years in the period then ended, and the consolidated supplementary data for each of the five years in the period then ended. These consolidated financial statements and consolidated supplementary data are the responsibility of the Portfolio’s management. Our responsibility is to express an opinion on these consolidated financial statements and consolidated supplementary data based on our audits.
We conducted our audits in accordance with the standards of the Public Company Accounting Oversight Board (United States). Those standards require that we plan and perform the audit to obtain reasonable assurance about whether the consolidated financial statements and consolidated supplementary data are free of material misstatement. The Portfolio is not required to have, nor were we engaged to perform, an audit of its internal control over financial reporting. Our audits included consideration of internal control over financial reporting as a basis for designing audit procedures that are appropriate in the circumstances, but not for the purpose of expressing an opinion on the effectiveness of the Portfolio’s internal control over financial reporting. Accordingly, we express no such opinion. An audit also includes examining, on a test basis, evidence supporting the amounts and disclosures in the financial statements, assessing the accounting principles used and significant estimates made by management, as well as evaluating the overall financial statement presentation. Our procedures included confirmation of securities owned as of October 31, 2012, by correspondence with the custodian and brokers; where replies were not received from brokers, we performed other auditing procedures. We believe that our audits provide a reasonable basis for our opinion.
In our opinion, such consolidated financial statements and consolidated supplementary data referred to above present fairly, in all material respects, the financial position of International Income Portfolio and subsidiary as of October 31, 2012, the results of their operations for the year then ended, the changes in their net assets for each of the two years in the period then ended, and the supplementary data for each of the five years in the period then ended, in conformity with accounting principles generally accepted in the United States of America.
DELOITTE & TOUCHE LLP
Boston, Massachusetts
December 21, 2012
Eaton Vance
Diversified Currency Income Fund
October 31, 2012
Management and Organization
Fund Management. The Trustees of Eaton Vance Mutual Funds Trust (the Trust) and International Income Portfolio (the Portfolio) are responsible for the overall management and supervision of the Trust’s and Portfolio’s affairs. The Trustees and officers of the Trust and the Portfolio are listed below. Except as indicated, each individual has held the office shown or other offices in the same company for the last five years. Trustees and officers of the Trust and the Portfolio hold indefinite terms of office. The “Noninterested Trustees” consist of those Trustees who are not “interested persons” of the Trust and the Portfolio, as that term is defined under the 1940 Act. The business address of each Trustee and officer is Two International Place, Boston, Massachusetts 02110. As used below, “EVC” refers to Eaton Vance Corp., “EV” refers to Eaton Vance, Inc., “EVM” refers to Eaton Vance Management, “BMR” refers to Boston Management and Research and “EVD” refers to Eaton Vance Distributors, Inc. EVC and EV are the corporate parent and trustee, respectively, of EVM and BMR. EVD is the Fund’s principal underwriter, the Portfolio’s placement agent and a wholly-owned subsidiary of EVC. Each officer affiliated with Eaton Vance may hold a position with other Eaton Vance affiliates that is comparable to his or her position with EVM listed below. Each Trustee oversees 187 portfolios in the Eaton Vance Complex (including all master and feeder funds in a master feeder structure). Each officer serves as an officer of certain other Eaton Vance funds. Each Trustee and officer serves until his or her successor is elected.
| | | | | | |
| Name and Year of Birth | | Position(s) with the Trust and the
Portfolio | | Length of
Service | | Principal Occupation(s) and Directorships During Past Five Years and Other Relevant Experience |
Interested Trustee | | | | |
| | | |
Thomas E. Faust Jr. 1958 | | Trustee | | Since 2007 | | Chairman, Chief Executive Officer and President of EVC, Director and President of EV, Chief Executive Officer and President of EVM and BMR, and Director of EVD. Trustee and/or officer of 187 registered investment companies. Mr. Faust is an interested person because of his positions with EVM, BMR, EVD, EVC and EV, which are affiliates of the Trust and the Portfolio. Directorships in the Last Five Years.(1) Director of EVC and Hexavest Inc. |
| | | |
| | | | | | |
Noninterested Trustees |
| | | |
Scott E. Eston 1956 | | Trustee | | Since 2011 | | Private investor. Formerly held various positions at Grantham, Mayo, Van Otterloo and Co., L.L.C. (investment management firm) (1997-2009), including Chief Operating Officer (2002-2009), Chief Financial Officer (1997-2009) and Chairman of the Executive Committee (2002-2008); President and Principal Executive Officer, GMO Trust (open-end registered investment company) (2006-2009). Former Partner, Coopers and Lybrand L.L.P. (now PricewaterhouseCoopers) (public accounting firm) (1987-1997). Directorships in the Last Five Years. None. |
| | | |
Benjamin C. Esty 1963 | | Trustee | | Of the Trust since 2005 and of the Portfolio since 2007 | | Roy and Elizabeth Simmons Professor of Business Administration and Finance Unit Head, Harvard University Graduate School of Business Administration. Directorships in the Last Five Years.(1) None. |
| | | |
Allen R. Freedman 1940 | | Trustee | | Since 2007 | | Private Investor. Former Chairman (2002-2004) and a Director (1983-2004) of Systems & Computer Technology Corp. (provider of software to higher education). Formerly, a Director of Loring Ward International (fund distributor) (2005-2007). Former Chairman and a Director of Indus International, Inc. (provider of enterprise management software to the power generating industry) (2005-2007). Former Chief Executive Officer of Assurant, Inc. (insurance provider) (1979-2000). Directorships in the Last Five Years.(1) Director of Stonemor Partners, L.P. (owner and operator of cemeteries). Formerly, Director of Assurant, Inc. (insurance provider) (1979-2011). |
| | | |
William H. Park 1947 | | Trustee | | Of the Trust since 2003 and of the Portfolio since 2007 | | Consultant and private investor. Formerly, Chief Financial Officer, Aveon Group L.P. (investment management firm) (2010-2011). Formerly, Vice Chairman, Commercial Industrial Finance Corp. (specialty finance company) (2006-2010). Formerly, President and Chief Executive Officer, Prizm Capital Management, LLC (investment management firm) (2002-2005). Formerly, Executive Vice President and Chief Financial Officer, United Asset Management Corporation (investment management firm) (1982-2001). Formerly, Senior Manager, Price Waterhouse (now PricewaterhouseCoopers) (an independent registered public accounting firm) (1972-1981). Directorships in the Last Five Years.(1) None. |
| | | |
Ronald A. Pearlman 1940 | | Trustee | | Of the Trust since 2003 and of the Portfolio since 2007 | | Professor of Law, Georgetown University Law Center. Formerly, Deputy Assistant Secretary (Tax Policy) and Assistant Secretary (Tax Policy), U.S. Department of the Treasury (1983-1985). Formerly, Chief of Staff, Joint Committee on Taxation, U.S. Congress (1988-1990). Directorships in the Last Five Years.(1) None. |
Eaton Vance
Diversified Currency Income Fund
October 31, 2012
Management and Organization — continued
| | | | | | |
| Name and Year of Birth | | Position(s) with the Trust and the
Portfolio | | Length of
Service | | Principal Occupation(s) and Directorships During Past Five Years and Other Relevant Experience |
Noninterested Trustees (continued) |
| | | |
Helen Frame Peters 1948 | | Trustee | | Since 2008 | | Professor of Finance, Carroll School of Management, Boston College. Formerly, Dean, Carroll School of Management, Boston College (2000-2002). Formerly, Chief Investment Officer, Fixed Income, Scudder Kemper Investments (investment management firm) (1998-1999). Formerly, Chief Investment Officer, Equity and Fixed Income, Colonial Management Associates (investment management firm) (1991-1998). Directorships in the Last Five Years.(1) Formerly, Director of BJ’s Wholesale Club, Inc. (wholesale club retailer) (2004-2011). Formerly, Trustee of SPDR Index Shares Funds and SPDR Series Trust (exchange traded funds) (2000-2009). Formerly, Director of Federal Home Loan Bank of Boston (a bank for banks) (2007-2009). |
| | | |
Lynn A. Stout 1957 | | Trustee | | Of the Trust since 1998 and of the Portfolio since 2007 | | Distinguished Professor of Corporate and Business Law, Jack G. Clarke Business Law Institute, Cornell University Law School. Formerly, the Paul Hastings Professor of Corporate and Securities Law (2006-2012) and Professor of Law (2001-2006), University of California at Los Angeles School of Law. Directorships in the Last Five Years.(1) None. |
| | | |
Harriett Tee Taggart 1948 | | Trustee | | Since 2011 | | Managing Director, Taggart Associates (a professional practice firm). Formerly, Partner and Senior Vice President, Wellington Management Company, LLP (investment management firm) (1983-2006). Directorships in the Last Five Years. Director of Albemarle Corporation (chemicals manufacturer) (since 2007) and The Hanover Group (specialty property and casualty insurance company) (since 2009). Formerly, Director of Lubrizol Corporation (specialty chemicals) (2007-2011). |
| | | |
Ralph F. Verni 1943 | | Chairman of the Board and Trustee | | Chairman of the Board and Trustee of the Portfolio since 2007 and Trustee of the Trust since 2005 | | Consultant and private investor. Formerly, Chief Investment Officer (1982-1992), Chief Financial Officer (1988-1990) and Director (1982-1992), New England Life. Formerly, Chairperson, New England Mutual Funds (1982-1992). Formerly, President and Chief Executive Officer, State Street Management & Research (1992-2000). Formerly, Chairperson, State Street Research Mutual Funds (1992-2000). Formerly, Director, W.P. Carey, LLC (1998-2004) and First Pioneer Farm Credit Corp. (2002-2006). Directorships in the Last Five Years.(1) None. |
| | | |
| | | | | | |
Principal Officers who are not Trustees | | |
| Name and Year of Birth | | Position(s) with the Trust and the Portfolio | | Length of Service | | Principal Occupation(s) During Past Five Years |
Duncan W. Richardson 1957 | | President of the Trust | | Since 2011 | | Director of EVC and Executive Vice President and Chief Equity Investment Officer of EVC, EVM and BMR. |
| | | |
John R. Baur 1970 | | President of the Portfolio | | Since 2012 | | Vice President of EVM and BMR. |
| | | |
Payson F. Swaffield 1956 | | Vice President | | Since 2011 | | Vice President and Chief Income Investment Officer of EVM and BMR. |
| | | |
Barbara E. Campbell 1957 | | Treasurer | | Of the Trust since 2005 and of the Portfolio since 2008 | | Vice President of EVM and BMR. |
| | | |
Maureen A. Gemma 1960 | | Vice President, Secretary and Chief Legal Officer | | Vice President since 2011, Secretary since 2007 and Chief Legal Officer since 2008 | | Vice President of EVM and BMR. |
Eaton Vance
Diversified Currency Income Fund
October 31, 2012
Management and Organization — continued
| | | | | | |
| Name and Year of Birth | | Position(s) with the Trust and the Portfolio | | Length of Service | | Principal Occupation(s) During Past Five Years |
Principal Officers who are not Trustees (continued) | | |
| | | |
Paul M. O’Neil 1953 | | Chief Compliance Officer | | Of the Trust since 2004 and of the Portfolio since 2007 | | Vice President of EVM and BMR. |
| (1) | During their respective tenures, the Trustees (except Mr. Eston and Ms. Taggart) also served as trustees of one or more of the following Eaton Vance funds (which operated in the years noted): Eaton Vance Credit Opportunities Fund (launched in 2005 and terminated in 2010); Eaton Vance Insured Florida Plus Municipal Bond Fund (launched in 2002 and terminated in 2009); and Eaton Vance National Municipal Income Trust (launched in 1998 and terminated in 2009). |
The SAI for the Fund includes additional information about the Trustees and officers of the Fund and the Portfolio and can be obtained without charge on Eaton Vance’s website at www.eatonvance.com or by calling 1-800-262-1122.
Eaton Vance Funds
IMPORTANT NOTICES
Privacy. The Eaton Vance organization is committed to ensuring your financial privacy. Each of the financial institutions identified below has in effect the following policy (“Privacy Policy”) with respect to nonpublic personal information about its customers:
| Ÿ | | Only such information received from you, through application forms or otherwise, and information about your Eaton Vance fund transactions will be collected. This may include information such as name, address, social security number, tax status, account balances and transactions. |
| Ÿ | | None of such information about you (or former customers) will be disclosed to anyone, except as permitted by law (which includes disclosure to employees necessary to service your account). In the normal course of servicing a customer’s account, Eaton Vance may share information with unaffiliated third parties that perform various required services such as transfer agents, custodians and broker-dealers. |
| Ÿ | | Policies and procedures (including physical, electronic and procedural safeguards) are in place that are designed to protect the confidentiality of such information. |
| Ÿ | | We reserve the right to change our Privacy Policy at any time upon proper notification to you. Customers may want to review our Privacy Policy periodically for changes by accessing the link on our homepage: www.eatonvance.com. |
Our pledge of privacy applies to the following entities within the Eaton Vance organization: the Eaton Vance Family of Funds, Eaton Vance Management, Eaton Vance Investment Counsel, Eaton Vance Distributors, Inc., Eaton Vance Trust Company, Eaton Vance Management’s Real Estate Investment Group and Boston Management and Research. In addition, our Privacy Policy applies only to those Eaton Vance customers who are individuals and who have a direct relationship with us. If a customer’s account (i.e., fund shares) is held in the name of a third-party financial advisor/broker-dealer, it is likely that only such advisor’s privacy policies apply to the customer. This notice supersedes all previously issued privacy disclosures. For more information about Eaton Vance’s Privacy Policy, please call 1-800-262-1122.
Delivery of Shareholder Documents. The Securities and Exchange Commission (SEC) permits funds to deliver only one copy of shareholder documents, including prospectuses, proxy statements and shareholder reports, to fund investors with multiple accounts at the same residential or post office box address. This practice is often called “householding” and it helps eliminate duplicate mailings to shareholders. Eaton Vance, or your financial advisor, may household the mailing of your documents indefinitely unless you instruct Eaton Vance, or your financial advisor, otherwise. If you would prefer that your Eaton Vance documents not be householded, please contact Eaton Vance at 1-800-262-1122, or contact your financial advisor. Your instructions that householding not apply to delivery of your Eaton Vance documents will be effective within 30 days of receipt by Eaton Vance or your financial advisor.
Portfolio Holdings. Each Eaton Vance Fund and its underlying Portfolio(s) (if applicable) will file a schedule of portfolio holdings on Form N-Q with the SEC for the first and third quarters of each fiscal year. The Form N-Q will be available on the Eaton Vance website at www.eatonvance.com, by calling Eaton Vance at 1-800-262-1122 or in the EDGAR database on the SEC’s website at www.sec.gov. Form N-Q may also be reviewed and copied at the SEC’s public reference room in Washington, D.C. (call 1-800-732-0330 for information on the operation of the public reference room).
Proxy Voting. From time to time, funds are required to vote proxies related to the securities held by the funds. The Eaton Vance Funds or their underlying Portfolios (if applicable) vote proxies according to a set of policies and procedures approved by the Funds’ and Portfolios’ Boards. You may obtain a description of these policies and procedures and information on how the Funds or Portfolios voted proxies relating to portfolio securities during the most recent 12-month period ended June 30, without charge, upon request, by calling 1-800-262-1122 and by accessing the SEC’s website at www.sec.gov.
Investment Adviser of International Income Portfolio
Boston Management and Research
Two International Place
Boston, MA 02110
Investment Adviser and Administrator of Eaton Vance Diversified Currency Income Fund
Eaton Vance Management
Two International Place
Boston, MA 02110
Principal Underwriter*
Eaton Vance Distributors, Inc.
Two International Place
Boston, MA 02110
(617) 482-8260
Custodian
State Street Bank and Trust Company
200 Clarendon Street
Boston, MA 02116
Transfer Agent
BNY Mellon Investment Servicing (US) Inc.
Attn: Eaton Vance Funds
P.O. Box 9653
Providence, RI 02940-9653
(800) 262-1122
Independent Registered Public Accounting Firm
Deloitte & Touche LLP
200 Berkeley Street
Boston, MA 02116-5022
Fund Offices
Two International Place
Boston, MA 02110
| * | FINRA BrokerCheck. Investors may check the background of their Investment Professional by contacting the Financial Industry Regulatory Authority (FINRA). FINRA BrokerCheck is a free tool to help investors check the professional background of current and former FINRA-registered securities firms and brokers. FINRA BrokerCheck is available by calling 1-800-289-9999 and at www.FINRA.org. The FINRA BrokerCheck brochure describing this program is available to investors at www.FINRA.org. |
| | |
Eaton Vance Low Duration Government Income Fund Annual Report October 31, 2012 | | 
|

Fund shares are not insured by the FDIC and are not deposits or other obligations of, or guaranteed by, any depository institution. Shares are subject to investment risks, including possible loss of principal invested.
This report must be preceded or accompanied by a current summary prospectus or prospectus. Before investing, investors should consider carefully the investment objective, risks, and charges and expenses of a mutual fund. This and other important information is contained in the summary prospectus and prospectus, which can be obtained from a financial advisor. Prospective investors should read the prospectus carefully before investing. For further information, please call 1-800-262-1122.
Annual Report October 31, 2012
Eaton Vance
Low Duration Government Income Fund1
| | | | |
| Table of Contents | | | | |
| |
Management’s Discussion of Fund Performance | | | 2 | |
| |
Performance | | | 3 | |
| |
Fund Profile | | | 4 | |
| |
Endnotes and Additional Disclosures | | | 5 | |
| |
Fund Expenses | | | 6 | |
| |
Financial Statements | | | 7 | |
| |
Report of Independent Registered Public Accounting Firm | | | 19 and 33 | |
| |
Federal Tax Information | | | 20 | |
| |
Management and Organization | | | 34 | |
| |
Important Notices | | | 38 | |
Eaton Vance
Low Duration Government Income Fund
October 31, 2012
Management’s Discussion of Fund Performance2
Economic and Market Conditions
During the 12-month period ending October 31, 2012, there were a number of historical events that impacted the fixed-income markets and led to multiple swings in investor sentiment. Returns of U.S. government securities varied based on yield curve positioning. The U.S. Federal Reserve’s (the Fed) ongoing “Operation Twist” program, which involves the sale of shorter Treasurys and the purchase of those at the longer end of the curve, was extended in June 2012 until the end of the calendar year. This pushed yields slightly higher on the short end of the curve, while pressuring yields lower on the longer end. Returns on the three-year and shorter portions of the Treasury curve were muted, with yields already historically low in this part of the curve.
Although the interest-rate backdrop remained favorable throughout the entire year as the Fed held policy rates between 0.00% and 0.25%, U.S. government securities languished during much of the first half of the period. At that time, an improving labor market gave way to stronger economic growth and prompted many investors to lower their exposure to U.S. government securities and seek opportunities among riskier asset classes. With rates at historic lows, investors searching for yield were forced to move further out on the yield curve.
In the beginning of the second half of the period, the investment backdrop became increasingly more favorable for U.S. government securities. The sovereign debt crisis in Europe intensified in the spring, which tempered future expectations of global economic growth and fueled investors’ appetite for investments that historically had provided safe havens amid periods of economic and market uncertainty. In the environment, yields on the 30-year Treasury fell nearly 100 basis points during the spring and summer, touching multidecade lows and producing equity-like returns over the time period.
Meanwhile, policies from the Fed aimed at keeping interest rates low also bolstered demand for U.S. government-backed investments. At its June 2012 meeting, the Fed announced a continuation of “Operation Twist.” In September 2012, the Fed announced its plan to keep policy rates at or near zero until at least mid-2015 and also announced further monetary stimulus with its third round of quantitative easing (QE3). This new QE3 program came in the form of open-ended U.S. government agency mortgage-backed security (MBS) purchases. Against this already favorable backdrop for high-quality fixed-income securities, investor demand for agency MBS further increased after the September 2012
announcement, with yield spreads compared to Treasurys tightening to their lows of the year.
Fund Performance
For the fiscal year ending October 31, 2012, Eaton Vance Low Duration Government Income Fund’s (the Fund) Class A shares at net asset value (NAV) had a total return of 3.71%. By comparison, the Fund’s benchmark, the BofA Merrill Lynch 1-3 Year U.S. Treasury Index (the Index)3 returned 0.41% for the period.
The Fund’s outperformance versus the Index was primarily due to its investment in seasoned agency MBS. Agency MBS outperformed comparable-duration Treasurys during the past 12 months as yield spreads tightened. The Fund also benefited from its investment in seasoned interest only and inverse floating-rate interest only MBS, as there was substantial spread tightening in the sector over the year. A weak labor market and sluggish growth in the U.S. economy led to the Fed announcing an open-ended program of MBS purchases in September 2012. The Fed’s renewed involvement in the MBS market in the form of QE3 caused a further increase in the prices of MBS investments.
Despite mortgage rates falling to all-time lows, the Fund experienced only a modest increase in prepayment rates on its seasoned MBS investments. The Fund’s seasoned MBS investments were typically comprised of mortgages originated from the early 1990s through 2003. During the period, the Federal Housing Finance Agency (FHFA) announced changes to its Home Affordability Refinance Program (HARP) in an effort to help stimulate the refinance market for borrowers with higher loan-to-value ratios. Relative to the majority of the agency MBS market, the Fund’s seasoned MBS investments generally contain much lower loan-to-value ratio loans and are not usually the target of the HARP program. The impact on the Fund’s prepayment rates from the changes to the HARP program was minimal.
Also boosting relative performance versus the Index in the period was the Fund’s exposure to senior secured floating-rate bank loans through its investment in Floating Rate Portfolio. At the start of the period, the asset class was recovering from a late-summer 2011 sell-off. Prices continued to appreciate during the 12-month period, as favorable macroeconomic developments and positive technical trends provided a supportive environment for risk assets. Improving company fundamentals, earnings growth and low new default rates also favorably impacted the performance of loans in the Floating Rate Portfolio.
See Endnotes and Additional Disclosures in this report.
Past performance is no guarantee of future results. Returns are historical and are calculated by determining the percentage change in net asset value (NAV) or offering price (as applicable) with all distributions reinvested. Investment return and principal value will fluctuate so that shares, when redeemed, may be worth more or less than their original cost. Performance less than one year is cumulative. Performance is for the stated time period only; due to market volatility, the Fund’s current performance may be lower or higher than quoted. Returns are before taxes unless otherwise noted. For performance as of the most recent month end, please refer to www.eatonvance.com.
Eaton Vance
Low Duration Government Income Fund
October 31, 2012
Performance3,4
Portfolio Manager Susan Schiff, CFA
| | | | | | | | | | | | | | | | | | | | |
| % Average Annual Total Returns | | Inception Date | | | One Year | | | Five Years | | | Ten Years | | | Since Inception | |
Class A at NAV | | | 09/30/2002 | | | | 3.71 | % | | | 3.84 | % | | | 3.12 | % | | | — | |
Class A with 2.25% Maximum Sales Charge | | | — | | | | 1.34 | | | | 3.36 | | | | 2.88 | | | | — | |
Class B at NAV | | | 09/30/2002 | | | | 2.93 | | | | 3.05 | | | | 2.35 | | | | — | |
Class B with 3% Maximum Sales Charge | | | — | | | | –0.07 | | | | 3.05 | | | | 2.35 | | | | — | |
Class C at NAV | | | 09/30/2002 | | | | 3.08 | | | | 3.20 | | | | 2.50 | | | | — | |
Class C with 1% Maximum Sales Charge | | | — | | | | 2.08 | | | | 3.20 | | | | 2.50 | | | | — | |
Class I at NAV | | | 05/04/2009 | | | | 3.98 | | | | — | | | | — | | | | 3.78 | % |
BofA Merrill Lynch 1–3 Year U.S. Treasury Index | | | — | | | | 0.41 | % | | | 2.70 | % | | | 2.77 | % | | | — | |
| | | | | |
| % Total Annual Operating Expense Ratios5 | | | | | Class A | | | Class B | | | Class C | | | Class I | |
| | | | | | | 0.93 | % | | | 1.68 | % | | | 1.53 | % | | | 0.68 | % |
Performance of $10,000
This graph shows the change in value of a hypothetical investment of $10,000 in Class A of the Fund for the period indicated. For comparison, the same investment is shown in the indicated index.
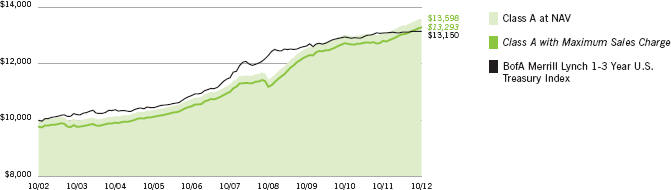
| | | | | | | | | | | | |
| Performance of Investment | | Amount Invested | | | Period Beginning | | At NAV | | | With Maximum Sales Charge |
Class B | | $ | 10,000 | | | 10/31/2002 | | $ | 12,615 | | | N.A. |
Class C | | $ | 10,000 | | | 10/31/2002 | | $ | 12,808 | | | N.A. |
Class I | | $ | 250,000 | | | 05/04/2009 | | $ | 284,625 | | | N.A. |
See Endnotes and Additional Disclosures in this report.
Past performance is no guarantee of future results. Returns are historical and are calculated by determining the percentage change in net asset value (NAV) or offering price (as applicable) with all distributions reinvested. Investment return and principal value will fluctuate so that shares, when redeemed, may be worth more or less than their original cost. Performance less than one year is cumulative. Performance is for the stated time period only; due to market volatility, the Fund’s current performance may be lower or higher than quoted. Returns are before taxes unless otherwise noted. For performance as of the most recent month end, please refer to www.eatonvance.com.
Eaton Vance
Low Duration Government Income Fund
October 31, 2012
Fund Profile 6
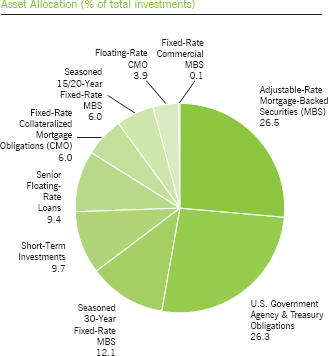
See Endnotes and Additional Disclosures in this report.
Eaton Vance
Low Duration Government Income Fund
October 31, 2012
Endnotes and Additional Disclosures
| 1 | Prior to 11/13/12, the Fund was called Eaton Vance Low Duration Fund. |
| 2 | The views expressed in this report are those of the portfolio manager(s) and are current only through the date stated at the top of this page. These views are subject to change at any time based upon market or other conditions, and Eaton Vance and the Fund(s) disclaim any responsibility to update such views. These views may not be relied upon as investment advice and, because investment decisions are based on many factors, may not be relied upon as an indication of trading intent on behalf of any Eaton Vance fund. This commentary may contain statements that are not historical facts, referred to as “forward looking statements”. The Fund’s actual future results may differ significantly from those stated in any forward looking statement, depending on factors such as changes in securities or financial markets or general economic conditions, the volume of sales and purchases of Fund shares, the continuation of investment advisory, administrative and service contracts, and other risks discussed from time to time in the Fund’s filings with the Securities and Exchange Commission. |
| 3 | BofA Merrill Lynch 1-3 Year U.S. Treasury Index is an unmanaged index of short-term U.S. Treasury securities. BofA Merrill Lynch® indices not for redistribution or other uses; provided “as is”, without warranties, and with no liability. Eaton Vance has prepared this report, BofAML does not endorse it, or guarantee, review, or endorse Eaton Vance’s products. Unless otherwise stated, index returns do not reflect the effect of any applicable sales charges, commissions, expenses, taxes or leverage, as applicable. It is not possible to invest directly in an index. |
| 4 | Total Returns at NAV do not include applicable sales charges. If sales charges were deducted, the returns would be lower. Total Returns shown with maximum sales charge reflect the stated maximum sales charge. Unless otherwise stated, performance does not reflect the deduction of taxes on Fund distributions or redemptions of Fund shares. |
| 5 | Source: Fund prospectus. |
| 6 | Fund primarily invests in one or more affiliated investment companies (Portfolios) and may also invest directly. Unless otherwise noted, references to investments are to the aggregate holdings of the Fund and the Portfolios. |
| | Fund profile subject to change due to active management. |
Eaton Vance
Low Duration Government Income Fund
October 31, 2012
Fund Expenses
Example: As a Fund shareholder, you incur two types of costs: (1) transaction costs, including sales charges (loads) on purchases and redemption fees (if applicable); and (2) ongoing costs, including management fees; distribution and/or service fees; and other Fund expenses. This Example is intended to help you understand your ongoing costs (in dollars) of Fund investing and to compare these costs with the ongoing costs of investing in other mutual funds. The Example is based on an investment of $1,000 invested at the beginning of the period and held for the entire period (May 1, 2012 – October 31, 2012).
Actual Expenses: The first section of the table below provides information about actual account values and actual expenses. You may use the information in this section, together with the amount you invested, to estimate the expenses that you paid over the period. Simply divide your account value by $1,000 (for example, an $8,600 account value divided by $1,000 = 8.6), then multiply the result by the number in the first section under the heading entitled “Expenses Paid During Period” to estimate the expenses you paid on your account during this period.
Hypothetical Example for Comparison Purposes: The second section of the table below provides information about hypothetical account values and hypothetical expenses based on the actual Fund expense ratio and an assumed rate of return of 5% per year (before expenses), which is not the actual Fund return. The hypothetical account values and expenses may not be used to estimate the actual ending account balance or expenses you paid for the period. You may use this information to compare the ongoing costs of investing in your Fund and other funds. To do so, compare this 5% hypothetical example with the 5% hypothetical examples that appear in the shareholder reports of the other funds.
Please note that the expenses shown in the table are meant to highlight your ongoing costs only and do not reflect any transactional costs, such as sales charges (loads) or redemption fees (if applicable). Therefore, the second section of the table is useful in comparing ongoing costs only, and will not help you determine the relative total costs of owning different funds. In addition, if these transactional costs were included, your costs would be higher.
| | | | | | | | | | | | | | | | |
| | | Beginning
Account Value
(5/1/12) | | | Ending
Account Value
(10/31/12) | | | Expenses Paid
During Period*
(5/1/12 – 10/31/12) | | | Annualized
Expense
Ratio | |
| | | | |
| | | | | | | | | | | | | | | | |
Actual | | | | | | | | | | | | | | | | |
Class A | | $ | 1,000.00 | | | $ | 1,018.50 | | | $ | 4.72 | | | | 0.93 | % |
Class B | | $ | 1,000.00 | | | $ | 1,014.60 | | | $ | 8.56 | | | | 1.69 | % |
Class C | | $ | 1,000.00 | | | $ | 1,015.30 | | | $ | 7.75 | | | | 1.53 | % |
Class I | | $ | 1,000.00 | | | $ | 1,019.80 | | | $ | 3.45 | | | | 0.68 | % |
| | | | | | | | | | | | | | | | | |
| | | | |
| | | | | | | | | | | | | | | | |
Hypothetical | | | | | | | | | | | | | |
(5% return per year before expenses) | | | | | | | | | | | | | |
Class A | | $ | 1,000.00 | | | $ | 1,020.50 | | | $ | 4.72 | | | | 0.93 | % |
Class B | | $ | 1,000.00 | | | $ | 1,016.60 | | | $ | 8.57 | | | | 1.69 | % |
Class C | | $ | 1,000.00 | | | $ | 1,017.40 | | | $ | 7.76 | | | | 1.53 | % |
Class I | | $ | 1,000.00 | | | $ | 1,021.70 | | | $ | 3.46 | | | | 0.68 | % |
| * | Expenses are equal to the Fund’s annualized expense ratio for the indicated Class, multiplied by the average account value over the period, multiplied by 184/366 (to reflect the one-half year period). The Example assumes that the $1,000 was invested at the net asset value per share determined at the close of business on April 30, 2012. The Example reflects the expenses of both the Fund and the Portfolios. |
Eaton Vance
Low Duration Government Income Fund
October 31, 2012
Statement of Assets and Liabilities
| | | | |
| Assets | | October 31, 2012 | |
Investment in Short-Term U.S. Government Portfolio, at value (identified cost, $326,075,820) | | $ | 354,874,971 | |
Investment in Floating Rate Portfolio, at value (identified cost, $40,226,073) | | | 43,050,908 | |
Investment in Government Obligations Portfolio, at value (identified cost, $26,822,506) | | | 28,285,467 | |
Receivable for Fund shares sold | | | 796,299 | |
Total assets | | $ | 427,007,645 | |
|
| Liabilities | |
Payable for Fund shares redeemed | | $ | 1,018,557 | |
Distributions payable | | | 201,840 | |
Payable to affiliates: | | | | |
Distribution and service fees | | | 143,622 | |
Trustees’ fees | | | 42 | |
Accrued expenses | | | 115,275 | |
Total liabilities | | $ | 1,479,336 | |
Net Assets | | $ | 425,528,309 | |
|
| Sources of Net Assets | |
Paid-in capital | | $ | 428,809,738 | |
Accumulated net realized loss from Portfolios | | | (36,369,423 | ) |
Accumulated undistributed net investment income | | | 1,047 | |
Net unrealized appreciation from Portfolios | | | 33,086,947 | |
Total | | $ | 425,528,309 | |
|
| Class A Shares | |
Net Assets | | $ | 216,429,603 | |
Shares Outstanding | | | 24,004,775 | |
Net Asset Value and Redemption Price Per Share | | | | |
(net assets ÷ shares of beneficial interest outstanding) | | $ | 9.02 | |
Maximum Offering Price Per Share | | | | |
(100 ÷ 97.75 of net asset value per share) | | $ | 9.23 | |
|
| Class B Shares | |
Net Assets | | $ | 7,565,062 | |
Shares Outstanding | | | 837,991 | |
Net Asset Value and Offering Price Per Share* | | | | |
(net assets ÷ shares of beneficial interest outstanding) | | $ | 9.03 | |
|
| Class C Shares | |
Net Assets | | $ | 127,146,370 | |
Shares Outstanding | | | 14,084,105 | |
Net Asset Value and Offering Price Per Share* | | | | |
(net assets ÷ shares of beneficial interest outstanding) | | $ | 9.03 | |
|
| Class I Shares | |
Net Assets | | $ | 74,387,274 | |
Shares Outstanding | | | 8,257,950 | |
Net Asset Value, Offering Price and Redemption Price Per Share | | | | |
(net assets ÷ shares of beneficial interest outstanding) | | $ | 9.01 | |
On sales of $50,000 or more, the offering price of Class A shares is reduced.
| * | Redemption price per share is equal to the net asset value less any applicable contingent deferred sales charge. |
| | | | |
| | 7 | | See Notes to Financial Statements. |
Eaton Vance
Low Duration Government Income Fund
October 31, 2012
Statement of Operations
| | | | |
| Investment Income | | Year Ended
October 31, 2012 | |
Interest and other income allocated from Portfolios | | $ | 14,517,907 | |
Dividends allocated from Portfolios | | | 27,486 | |
Expenses allocated from Portfolios | | | (2,450,441 | ) |
Total investment income from Portfolios | | $ | 12,094,952 | |
| |
| Expenses | | | | |
Distribution and service fees | | | | |
Class A | | $ | 561,088 | |
Class B | | | 89,328 | |
Class C | | | 1,086,692 | |
Trustees’ fees and expenses | | | 500 | |
Custodian fee | | | 52,612 | |
Transfer and dividend disbursing agent fees | | | 262,991 | |
Legal and accounting services | | | 50,948 | |
Printing and postage | | | 42,332 | |
Registration fees | | | 67,921 | |
Miscellaneous | | | 13,819 | |
Total expenses | | $ | 2,228,231 | |
| |
Net investment income | | $ | 9,866,721 | |
| |
| Realized and Unrealized Gain (Loss) from Portfolios | | | | |
Net realized gain (loss) — | | | | |
Investment transactions | | $ | 4,517,755 | |
Financial futures contracts | | | (5,711,249 | ) |
Swap contracts | | | (4,907 | ) |
Foreign currency and forward foreign currency exchange contract transactions | | | 144,568 | |
Net realized loss | | $ | (1,053,833 | ) |
Change in unrealized appreciation (depreciation) — | | | | |
Investments | | $ | 5,266,684 | |
Financial futures contracts | | | 93,366 | |
Swap contracts | | | 397,555 | |
Foreign currency and forward foreign currency exchange contracts | | | (49,505 | ) |
Net change in unrealized appreciation (depreciation) | | $ | 5,708,100 | |
| |
Net realized and unrealized gain | | $ | 4,654,267 | |
| |
Net increase in net assets from operations | | $ | 14,520,988 | |
| | | | |
| | 8 | | See Notes to Financial Statements. |
Eaton Vance
Low Duration Government Income Fund
October 31, 2012
Statements of Changes in Net Assets
| | | | | | | | |
| | | Year Ended October 31, | |
| Increase (Decrease) in Net Assets | | 2012 | | | 2011 | |
From operations — | | | | | | | | |
Net investment income | | $ | 9,866,721 | | | $ | 11,484,295 | |
Net realized loss from investment transactions, financial futures contracts, swap contracts and foreign currency and forward foreign currency exchange contract transactions | | | (1,053,833 | ) | | | (9,210,179 | ) |
Net change in unrealized appreciation (depreciation) from investments, financial futures contracts, swap contracts, foreign currency and forward foreign currency exchange contracts | | | 5,708,100 | | | | (190,944 | ) |
Net increase in net assets from operations | | $ | 14,520,988 | | | $ | 2,083,172 | |
Distributions to shareholders — | | | | | | | | |
From net investment income | | | | | | | | |
Class A | | $ | (7,209,986 | ) | | $ | (9,161,117 | ) |
Class B | | | (218,870 | ) | | | (218,468 | ) |
Class C | | | (3,316,212 | ) | | | (3,692,155 | ) |
Class I | | | (2,221,283 | ) | | | (2,399,395 | ) |
Total distributions to shareholders | | $ | (12,966,351 | ) | | $ | (15,471,135 | ) |
Transactions in shares of beneficial interest — | | | | | | | | |
Proceeds from sale of shares | | | | | | | | |
Class A | | $ | 75,001,079 | | | $ | 93,465,231 | |
Class B | | | 1,149,551 | | | | 5,423,778 | |
Class C | | | 31,358,205 | | | | 37,126,813 | |
Class I | | | 68,554,133 | | | | 39,025,233 | |
Net asset value of shares issued to shareholders in payment of distributions declared | | | | | | | | |
Class A | | | 6,332,109 | | | | 7,380,984 | |
Class B | | | 188,383 | | | | 171,682 | |
Class C | | | 2,800,930 | | | | 2,828,326 | |
Class I | | | 951,630 | | | | 701,064 | |
Cost of shares redeemed | | | | | | | | |
Class A | | | (117,017,463 | ) | | | (190,042,162 | ) |
Class B | | | (2,830,007 | ) | | | (3,141,525 | ) |
Class C | | | (39,764,935 | ) | | | (69,281,431 | ) |
Class I | | | (61,503,035 | ) | | | (38,476,110 | ) |
Net asset value of shares exchanged | | | | | | | | |
Class A | | | 971,399 | | | | 1,820,910 | |
Class B | | | (971,399 | ) | | | (1,820,910 | ) |
Net decrease in net assets from Fund share transactions | | $ | (34,779,420 | ) | | $ | (114,818,117 | ) |
| | |
Net decrease in net assets | | $ | (33,224,783 | ) | | $ | (128,206,080 | ) |
|
| Net Assets | |
At beginning of year | | $ | 458,753,092 | | | $ | 586,959,172 | |
At end of year | | $ | 425,528,309 | | | $ | 458,753,092 | |
|
Accumulated undistributed (distributions in excess of) net investment income
included in net assets | |
At end of year | | $ | 1,047 | | | $ | (121,320 | ) |
| | | | |
| | 9 | | See Notes to Financial Statements. |
Eaton Vance
Low Duration Government Income Fund
October 31, 2012
Financial Highlights
| | | | | | | | | | | | | | | | | | | | |
| | | Class A | |
| | | Year Ended October 31, | |
| | | 2012 | | | 2011 | | | 2010 | | | 2009 | | | 2008 | |
Net asset value — Beginning of year | | $ | 8.980 | | | $ | 9.210 | | | $ | 9.160 | | | $ | 8.720 | | | $ | 8.990 | |
| | | | | |
| Income (Loss) From Operations | | | | | | | | | | | | | | | | | | | | |
Net investment income(1) | | $ | 0.223 | | | $ | 0.218 | | | $ | 0.245 | | | $ | 0.270 | | | $ | 0.344 | |
Net realized and unrealized gain (loss) | | | 0.105 | | | | (0.160 | ) | | | 0.102 | | | | 0.549 | | | | (0.191 | ) |
| | | | | |
Total income from operations | | $ | 0.328 | | | $ | 0.058 | | | $ | 0.347 | | | $ | 0.819 | | | $ | 0.153 | |
| | | | | |
| Less Distributions | | | | | | | | | | | | | | | | | | | | |
From net investment income | | $ | (0.288 | ) | | $ | (0.288 | ) | | $ | (0.297 | ) | | $ | (0.339 | ) | | $ | (0.423 | ) |
Tax return of capital | | | — | | | | — | | | | — | | | | (0.040 | ) | | | — | |
| | | | | |
Total distributions | | $ | (0.288 | ) | | $ | (0.288 | ) | | $ | (0.297 | ) | | $ | (0.379 | ) | | $ | (0.423 | ) |
| | | | | |
Net asset value — End of year | | $ | 9.020 | | | $ | 8.980 | | | $ | 9.210 | | | $ | 9.160 | | | $ | 8.720 | |
| | | | | |
Total Return(2) | | | 3.71 | % | | | 0.65 | % | | | 3.86 | % | | | 9.57 | % | | | 1.65 | % |
| | | | | |
| Ratios/Supplemental Data | | | | | | | | | | | | | | | | | | | | |
Net assets, end of year (000’s omitted) | | $ | 216,430 | | | $ | 250,375 | | | $ | 345,385 | | | $ | 254,074 | | | $ | 71,284 | |
Ratios (as a percentage of average daily net assets): | | | | | | | | | | | | | | | | | | | | |
Expenses(3)(4) | | | 0.94 | % | | | 0.93 | % | | | 0.95 | % | | | 1.00 | %(5) | | | 1.00 | %(5) |
Net investment income | | | 2.48 | % | | | 2.40 | % | | | 2.67 | % | | | 2.99 | % | | | 3.83 | % |
Portfolio Turnover of the Fund(6) | | | 17 | % | | | 18 | % | | | 17 | % | | | 38 | % | | | 83 | % |
Portfolio Turnover of Short-Term U.S. Government Portfolio | | | 15 | % | | | 6 | % | | | 26 | % | | | 34 | % | | | 24 | % |
Portfolio Turnover of Floating Rate Portfolio | | | 42 | % | | | 56 | % | | | 39 | % | | | 35 | % | | | 7 | % |
Portfolio Turnover of Government Obligations Portfolio | | | 26 | % | | | 19 | % | | | 22 | % | | | 28 | % | | | 19 | % |
| (1) | Computed using average shares outstanding. |
| (2) | Returns are historical and are calculated by determining the percentage change in net asset value with all distributions reinvested and do not reflect the effect of sales charges. |
| (3) | Includes the Fund’s share of the Portfolios’ allocated expenses. |
| (4) | Excludes the effect of custody fee credits, if any, of less than 0.005%. |
| (5) | The investment adviser waived its investment adviser and administration fee and/or the administrator reimbursed expenses (equal to 0.05% and 0.30% of average daily net assets for the years ended October 31, 2009 and 2008, respectively). |
| (6) | Percentage is based on the Fund’s contributions to and withdrawals from the Portfolios and excludes the investment activity of the Portfolios. |
| | | | |
| | 10 | | See Notes to Financial Statements. |
Eaton Vance
Low Duration Government Income Fund
October 31, 2012
Financial Highlights — continued
| | | | | | | | | | | | | | | | | | | | |
| | | Class B | |
| | | Year Ended October 31, | |
| | | 2012 | | | 2011 | | | 2010 | | | 2009 | | | 2008 | |
Net asset value — Beginning of year | | $ | 8.990 | | | $ | 9.220 | | | $ | 9.170 | | | $ | 8.730 | | | $ | 9.000 | |
| | | | | |
| Income (Loss) From Operations | | | | | | | | | | | | | | | | | | | | |
Net investment income(1) | | $ | 0.156 | | | $ | 0.150 | | | $ | 0.177 | | | $ | 0.219 | | | $ | 0.290 | |
Net realized and unrealized gain (loss) | | | 0.104 | | | | (0.160 | ) | | | 0.102 | | | | 0.530 | | | | (0.208 | ) |
| | | | | |
Total income (loss) from operations | | $ | 0.260 | | | $ | (0.010 | ) | | $ | 0.279 | | | $ | 0.749 | | | $ | 0.082 | |
| | | | | |
| Less Distributions | | | | | | | | | | | | | | | | | | | | |
From net investment income | | $ | (0.220 | ) | | $ | (0.220 | ) | | $ | (0.229 | ) | | $ | (0.277 | ) | | $ | (0.352 | ) |
Tax return of capital | | | — | | | | — | | | | — | | | | (0.032 | ) | | | — | |
| | | | | |
Total distributions | | $ | (0.220 | ) | | $ | (0.220 | ) | | $ | (0.229 | ) | | $ | (0.309 | ) | | $ | (0.352 | ) |
| | | | | |
Net asset value — End of year | | $ | 9.030 | | | $ | 8.990 | | | $ | 9.220 | | | $ | 9.170 | | | $ | 8.730 | |
| | | | | |
Total Return(2) | | | 2.93 | % | | | (0.10 | )% | | | 3.09 | % | | | 8.71 | % | | | 0.85 | % |
| | | | | |
| Ratios/Supplemental Data | | | | | | | | | | | | | | | | | | | | |
Net assets, end of year (000’s omitted) | | $ | 7,565 | | | $ | 9,997 | | | $ | 9,589 | | | $ | 8,338 | | | $ | 7,290 | |
Ratios (as a percentage of average daily net assets): | | | | | | | | | | | | | | | | | | | | |
Expenses(3)(4) | | | 1.70 | % | | | 1.68 | % | | | 1.70 | % | | | 1.75 | %(5) | | | 1.75 | %(5) |
Net investment income | | | 1.74 | % | | | 1.66 | % | | | 1.93 | % | | | 2.44 | % | | | 3.22 | % |
Portfolio Turnover of the Fund(6) | | | 17 | % | | | 18 | % | | | 17 | % | | | 38 | % | | | 83 | % |
Portfolio Turnover of Short-Term U.S. Government Portfolio | | | 15 | % | | | 6 | % | | | 26 | % | | | 34 | % | | | 24 | % |
Portfolio Turnover of Floating Rate Portfolio | | | 42 | % | | | 56 | % | | | 39 | % | | | 35 | % | | | 7 | % |
Portfolio Turnover of Government Obligations Portfolio | | | 26 | % | | | 19 | % | | | 22 | % | | | 28 | % | | | 19 | % |
| (1) | Computed using average shares outstanding. |
| (2) | Returns are historical and are calculated by determining the percentage change in net asset value with all distributions reinvested and do not reflect the effect of sales charges. |
| (3) | Includes the Fund’s share of the Portfolios’ allocated expenses. |
| (4) | Excludes the effect of custody fee credits, if any, of less than 0.005%. |
| (5) | The investment adviser waived its investment adviser and administration fee and/or the administrator reimbursed expenses (equal to 0.05% and 0.30% of average daily net assets for the years ended October 31, 2009 and 2008, respectively). |
| (6) | Percentage is based on the Fund’s contributions to and withdrawals from the Portfolios and excludes the investment activity of the Portfolios. |
| | | | |
| | 11 | | See Notes to Financial Statements. |
Eaton Vance
Low Duration Government Income Fund
October 31, 2012
Financial Highlights — continued
| | | | | | | | | | | | | | | | | | | | |
| | | Class C | |
| | | Year Ended October 31, | |
| | | 2012 | | | 2011 | | | 2010 | | | 2009 | | | 2008 | |
Net asset value — Beginning of year | | $ | 8.990 | | | $ | 9.220 | | | $ | 9.170 | | | $ | 8.730 | | | $ | 9.000 | |
| | | | | |
| Income (Loss) From Operations | | | | | | | | | | | | | | | | | | | | |
Net investment income(1) | | $ | 0.169 | | | $ | 0.163 | | | $ | 0.190 | | | $ | 0.218 | | | $ | 0.299 | |
Net realized and unrealized gain (loss) | | | 0.104 | | | | (0.160 | ) | | | 0.103 | | | | 0.546 | | | | (0.203 | ) |
| | | | | |
Total income from operations | | $ | 0.273 | | | $ | 0.003 | | | $ | 0.293 | | | $ | 0.764 | | | $ | 0.096 | |
| | | | | |
| Less Distributions | | | | | | | | | | | | | | | | | | | | |
From net investment income | | $ | (0.233 | ) | | $ | (0.233 | ) | | $ | (0.243 | ) | | $ | (0.290 | ) | | $ | (0.366 | ) |
Tax return of capital | | | — | | | | — | | | | — | | | | (0.034 | ) | | | — | |
| | | | | |
Total distributions | | $ | (0.233 | ) | | $ | (0.233 | ) | | $ | (0.243 | ) | | $ | (0.324 | ) | | $ | (0.366 | ) |
| | | | | |
Net asset value — End of year | | $ | 9.030 | | | $ | 8.990 | | | $ | 9.220 | | | $ | 9.170 | | | $ | 8.730 | |
| | | | | |
Total Return(2) | | | 3.08 | % | | | 0.04 | % | | | 3.23 | % | | | 8.89 | % | | | 1.02 | % |
| | | | | |
| Ratios/Supplemental Data | | | | | | | | | | | | | | | | | | | | |
Net assets, end of year (000’s omitted) | | $ | 127,146 | | | $ | 132,240 | | | $ | 165,285 | | | $ | 100,970 | | | $ | 34,447 | |
Ratios (as a percentage of average daily net assets): | | | | | | | | | | | | | | | | | | | | |
Expenses(3)(4) | | | 1.54 | % | | | 1.53 | % | | | 1.55 | % | | | 1.60 | %(5) | | | 1.60 | %(5) |
Net investment income | | | 1.88 | % | | | 1.80 | % | | | 2.07 | % | | | 2.42 | % | | | 3.32 | % |
Portfolio Turnover of the Fund(6) | | | 17 | % | | | 18 | % | | | 17 | % | | | 38 | % | | | 83 | % |
Portfolio Turnover of Short-Term U.S. Government Portfolio | | | 15 | % | | | 6 | % | | | 26 | % | | | 34 | % | | | 24 | % |
Portfolio Turnover of Floating Rate Portfolio | | | 42 | % | | | 56 | % | | | 39 | % | | | 35 | % | | | 7 | % |
Portfolio Turnover of Government Obligations Portfolio | | | 26 | % | | | 19 | % | | | 22 | % | | | 28 | % | | | 19 | % |
| (1) | Computed using average shares outstanding. |
| (2) | Returns are historical and are calculated by determining the percentage change in net asset value with all distributions reinvested and do not reflect the effect of sales charges. |
| (3) | Includes the Fund’s share of the Portfolios’ allocated expenses. |
| (4) | Excludes the effect of custody fee credits, if any, of less than 0.005%. |
| (5) | The investment adviser waived its investment adviser and administration fee and/or the administrator reimbursed expenses (equal to 0.05% and 0.30% of average daily net assets for the years ended October 31, 2009 and 2008, respectively). |
| (6) | Percentage is based on the Fund’s contributions to and withdrawals from the Portfolios and excludes the investment activity of the Portfolios. |
| | | | |
| | 12 | | See Notes to Financial Statements. |
Eaton Vance
Low Duration Government Income Fund
October 31, 2012
Financial Highlights — continued
| | | | | | | | | | | | | | | | |
| | | Class I | |
| | | Year Ended October 31, | | | Period Ended October 31, 2009(1) | |
| | | 2012 | | | 2011 | | | 2010 | | |
Net asset value — Beginning of period | | $ | 8.970 | | | $ | 9.200 | | | $ | 9.150 | | | $ | 8.970 | |
| | | | |
| Income (Loss) From Operations | | | | | | | | | | | | | | | | |
Net investment income(2) | | $ | 0.244 | | | $ | 0.239 | | | $ | 0.267 | | | $ | 0.134 | |
Net realized and unrealized gain (loss) | | | 0.107 | | | | (0.158 | ) | | | 0.103 | | | | 0.242 | |
| | | | |
Total income from operations | | $ | 0.351 | | | $ | 0.081 | | | $ | 0.370 | | | $ | 0.376 | |
| | | | |
| Less Distributions | | | | | | | | | | | | | | | | |
From net investment income | | $ | (0.311 | ) | | $ | (0.311 | ) | | $ | (0.320 | ) | | $ | (0.175 | ) |
Tax return of capital | | | — | | | | — | | | | — | | | | (0.021 | ) |
| | | | |
Total distributions | | $ | (0.311 | ) | | $ | (0.311 | ) | | $ | (0.320 | ) | | $ | (0.196 | ) |
| | | | |
Net asset value — End of period | | $ | 9.010 | | | $ | 8.970 | | | $ | 9.200 | | | $ | 9.150 | |
| | | | |
Total Return(3) | | | 3.98 | % | | | 0.91 | % | | | 4.00 | % | | | 4.34 | %(4) |
| | | | |
| Ratios/Supplemental Data | | | | | | | | | | | | | | | | |
Net assets, end of period (000’s omitted) | | $ | 74,387 | | | $ | 66,141 | | | $ | 66,700 | | | $ | 14,356 | |
Ratios (as a percentage of average daily net assets): | | | | | | | | | | | | | | | | |
Expenses(5)(6) | | | 0.69 | % | | | 0.68 | % | | | 0.70 | % | | | 0.75 | %(7)(8) |
Net investment income | | | 2.72 | % | | | 2.64 | % | | | 2.91 | % | | | 2.95 | %(7) |
Portfolio Turnover of the Fund(9) | | | 17 | % | | | 18 | % | | | 17 | % | | | 38 | %(10) |
Portfolio Turnover of Short-Term U.S. Government Portfolio | | | 15 | % | | | 6 | % | | | 26 | % | | | 34 | %(11) |
Portfolio Turnover of Floating Rate Portfolio | | | 42 | % | | | 56 | % | | | 39 | % | | | 35 | %(11) |
Portfolio Turnover of Government Obligations Portfolio | | | 26 | % | | | 19 | % | | | 22 | % | | | 28 | %(11) |
| (1) | For the period from the start of business, May 4, 2009, to October 31, 2009. |
| (2) | Computed using average shares outstanding. |
| (3) | Returns are historical and are calculated by determining the percentage change in net asset value with all distributions reinvested. |
| (5) | Includes the Fund’s share of the Portfolios’ allocated expenses. |
| (6) | Excludes the effect of custody fee credits, if any, of less than 0.005%. |
| (8) | The administrator reimbursed expenses (equal to 0.07% for the period ended October 31, 2009). |
| (9) | Percentage is based on the Fund’s contributions to and withdrawals from the Portfolios and excludes the investment activity of the Portfolios. |
| (10) | For the Fund’s year ended October 31, 2009. |
| (11) | For the Portfolio’s year ended October 31, 2009. |
| | | | |
| | 13 | | See Notes to Financial Statements. |
Eaton Vance
Low Duration Government Income Fund
October 31, 2012
Notes to Financial Statements
1 Significant Accounting Policies
Eaton Vance Low Duration Government Income Fund (formerly, Eaton Vance Low Duration Fund) (the Fund) is a diversified series of Eaton Vance Mutual Funds Trust (the Trust). The Trust is a Massachusetts business trust registered under the Investment Company Act of 1940, as amended (the 1940 Act), as an open-end management investment company. The Fund offers four classes of shares. Class A shares are generally sold subject to a sales charge imposed at time of purchase. Class B and Class C shares are sold at net asset value and are generally subject to a contingent deferred sales charge (see Note 5). Class I shares are sold at net asset value and are not subject to a sales charge. Class B shares automatically convert to Class A shares four years after their purchase as described in the Fund’s prospectus. Beginning January 1, 2012, Class B shares are only available for purchase upon exchange from another Eaton Vance fund or through reinvestment of distributions. Each class represents a pro-rata interest in the Fund, but votes separately on class-specific matters and (as noted below) is subject to different expenses. Realized and unrealized gains and losses are allocated daily to each class of shares based on the relative net assets of each class to the total net assets of the Fund. Net investment income, other than class specific expenses, is allocated daily to each class of shares based upon the ratio of the value of each class’s paid shares to the total value of all paid shares. Each class of shares differs in its distribution plan and certain other class-specific expenses. The Fund’s investment objective is to seek total return. At October 31, 2012, the Fund pursued its objective by investing all of its investable assets in interests in the following three portfolios managed by Eaton Vance Management (EVM) or its affiliates: Short-Term U.S. Government Portfolio, Floating Rate Portfolio and Government Obligations Portfolio (the Portfolios), which are Massachusetts business trusts. The value of the Fund’s investment in the Portfolios reflects the Fund’s proportionate interest in the net assets of Short-Term U.S. Government Portfolio, Floating Rate Portfolio and Government Obligations Portfolio (87.9%, 0.5% and 2.2%, respectively, at October 31, 2012). Effective November 1, 2012, the Fund began investing in the CMBS Portfolio managed by an affiliate of EVM. The performance of the Fund is directly affected by the performance of the Portfolios. The financial statements of Short-Term U.S. Government Portfolio, including the portfolio of investments, are included elsewhere in this report and should be read in conjunction with the Fund’s financial statements. A copy of each Portfolio’s financial statements is available on the EDGAR database on the Securities and Exchange Commission’s website (www.sec.gov), at the Commission’s public reference room in Washington, D.C. or upon request from the Fund’s principal underwriter, Eaton Vance Distributors, Inc. (EVD), by calling 1-800-262-1122.
The following is a summary of significant accounting policies of the Fund. The policies are in conformity with accounting principles generally accepted in the United States of America.
A Investment Valuation — Valuation of securities by Short-Term U.S. Government Portfolio is discussed in Note 1A of such Portfolio’s Notes to Financial Statements, which are included elsewhere in this report. Such policies are consistent with those of Floating Rate Portfolio, CMBS Portfolio and Government Obligations Portfolio for applicable investments.
Additional valuation policies for Floating Rate Portfolio (the Portfolio) are as follows: The Portfolio’s investments are primarily in interests in senior floating-rate loans (Senior Loans) of domestic and foreign issues. Interests in Senior Loans for which reliable market quotations are readily available are valued generally at the average mean of bid and ask quotations obtained from a third party pricing service. Other Senior Loans are valued at fair value by the investment adviser under procedures approved by the Trustees. In fair valuing a Senior Loan, the investment adviser utilizes one or more of the valuation techniques described in (i) through (iii) below to assess the likelihood that the borrower will make a full repayment of the loan underlying such Senior Loan relative to yields on other Senior Loans issued by companies of comparable credit quality. If the investment adviser believes that there is a reasonable likelihood of full repayment, the investment adviser will determine fair value using a matrix pricing approach that considers the yield on the Senior Loan. If the investment adviser believes there is not a reasonable likelihood of full repayment, the investment adviser will determine fair value using analyses that include, but are not limited to: (i) a comparison of the value of the borrower’s outstanding equity and debt to that of comparable public companies; (ii) a discounted cash flow analysis; or (iii) when the investment adviser believes it is likely that a borrower will be liquidated or sold, an analysis of the terms of such liquidation or sale. In certain cases, the investment adviser will use a combination of analytical methods to determine fair value, such as when only a portion of a borrower’s assets are likely to be sold. In conducting its assessment and analyses for purposes of determining fair value of a Senior Loan, the investment adviser will use its discretion and judgment in considering and appraising relevant factors. Fair value determinations are made by the portfolio managers of the Portfolio based on information available to such managers. The portfolio managers of other funds managed by the investment adviser that invest in Senior Loans may not possess the same information about a Senior Loan borrower as the portfolio managers of the Portfolio. At times, the fair value of a Senior Loan determined by the portfolio managers of other funds managed by the investment adviser that invest in Senior Loans may vary from the fair value of the same Senior Loan determined by the portfolio managers of the Portfolio. The fair value of each Senior Loan is periodically reviewed and approved by the investment adviser’s Valuation Committee and by the Trustees based upon procedures approved by the Trustees. Junior Loans (i.e., subordinated loans and second lien loans) are valued in the same manner as Senior Loans. Equity securities (including common shares of closed-end investment companies) listed on a U.S. securities exchange generally are valued at the last sale or closing price on the day of valuation or, if no sales took place on such date, at the mean between the closing bid and asked prices therefore on the exchange where such securities are principally traded. Equity securities listed on the NASDAQ Global or Global Select Market generally are valued at the NASDAQ official closing price. Unlisted or listed securities for which closing sales prices or closing quotations are not available are valued at the mean between the latest available bid and asked prices or, in the case of preferred equity securities that are not listed or traded in the over-the-counter market, by a third party pricing service that will use various techniques that consider factors including, but not limited to, prices or yields of securities with similar characteristics, benchmark yields, broker/dealer quotes, quotes of underlying common stock, issuer spreads, as well as industry and economic events. Forward foreign currency exchange contracts are generally valued at the mean of the average bid and average asked prices that are reported by currency dealers to a third party pricing service at the valuation time. Such third party pricing service valuations are supplied for specific settlement periods and the Portfolio’s forward foreign currency exchange contracts are valued at an interpolated rate between the closest preceding and subsequent settlement period reported by the third party pricing service. Foreign securities and currencies are valued in U.S. dollars, based on foreign currency exchange rate quotations supplied by a third party pricing service. The pricing service uses a proprietary model to determine the exchange rate. Inputs to the model include reported trades and implied bid/ask spreads.
Eaton Vance
Low Duration Government Income Fund
October 31, 2012
Notes to Financial Statements — continued
B Income — The Fund’s net investment income or loss consists of the Fund’s pro-rata share of the net investment income or loss of the Portfolio, less all actual and accrued expenses of the Fund.
C Federal Taxes — The Fund’s policy is to comply with the provisions of the Internal Revenue Code applicable to regulated investment companies and to distribute to shareholders each year substantially all of its net investment income, and all or substantially all of its net realized capital gains. Accordingly, no provision for federal income or excise tax is necessary. At October 31, 2012, the Fund, for federal income tax purposes, had a capital loss carryforward of $32,525,247 and current year deferred capital losses of $3,712,374 which will reduce its taxable income arising from future net realized gains on investment transactions, if any, to the extent permitted by the Internal Revenue Code, and thus will reduce the amount of distributions to shareholders, which would otherwise be necessary to relieve the Fund of any liability for federal income or excise tax. Such capital loss carryforward will expire on October 31, 2013 ($1,016,104), October 31, 2014 ($811,882), October 31, 2015 ($374,820), October 31, 2016 ($594,536), October 31, 2017 ($766,153), October 31, 2018 ($16,698,377) and October 31, 2019 ($12,263,375), respectively. The current year deferred capital losses are treated as arising on the first day of the Fund’s next taxable year and are treated as realized prior to the utilization of the capital loss carryforward.
As of October 31, 2012, the Fund had no uncertain tax positions that would require financial statement recognition, de-recognition, or disclosure. The Fund files a U.S. federal income tax return annually after its fiscal year-end, which is subject to examination by the Internal Revenue Service for a period of three years from the date of filing.
D Expenses — The majority of expenses of the Trust are directly identifiable to an individual fund. Expenses which are not readily identifiable to a specific fund are allocated taking into consideration, among other things, the nature and type of expense and the relative size of the funds.
E Expense Reduction — State Street Bank and Trust Company (SSBT) serves as custodian of the Fund. Pursuant to the custodian agreement, SSBT receives a fee reduced by credits, which are determined based on the average daily cash balance the Fund maintains with SSBT. All credit balances, if any, used to reduce the Fund’s custodian fees are reported as a reduction of expenses in the Statement of Operations.
F Use of Estimates — The preparation of the financial statements in conformity with accounting principles generally accepted in the United States of America requires management to make estimates and assumptions that affect the reported amounts of assets and liabilities at the date of the financial statements and the reported amounts of income and expense during the reporting period. Actual results could differ from those estimates.
G Indemnifications — Under the Trust’s organizational documents, its officers and Trustees may be indemnified against certain liabilities and expenses arising out of the performance of their duties to the Fund. Under Massachusetts law, if certain conditions prevail, shareholders of a Massachusetts business trust (such as the Trust) could be deemed to have personal liability for the obligations of the Trust. However, the Trust’s Declaration of Trust contains an express disclaimer of liability on the part of Fund shareholders and the By-laws provide that the Trust shall assume the defense on behalf of any Fund shareholders. Moreover, the By-laws also provide for indemnification out of Fund property of any shareholder held personally liable solely by reason of being or having been a shareholder for all loss or expense arising from such liability. Additionally, in the normal course of business, the Fund enters into agreements with service providers that may contain indemnification clauses. The Fund’s maximum exposure under these arrangements is unknown as this would involve future claims that may be made against the Fund that have not yet occurred.
H Other — Investment transactions are accounted for on a trade date basis. Dividends to shareholders are recorded on the ex-dividend date.
2 Distributions to Shareholders
The Fund declares dividends daily to shareholders of record at the time of declaration. Distributions are generally paid monthly. Distributions of realized capital gains are made at least annually. Distributions are declared separately for each class of shares. Shareholders may reinvest income and capital gain distributions in additional shares of the same class of the Fund at the net asset value as of the reinvestment date or, at the election of the shareholder, receive distributions in cash. The Fund distinguishes between distributions on a tax basis and a financial reporting basis. Accounting principles generally accepted in the United States of America require that only distributions in excess of tax basis earnings and profits be reported in the financial statements as a return of capital. Permanent differences between book and tax accounting relating to distributions are reclassified to paid-in capital. For tax purposes, distributions from short-term capital gains are considered to be from ordinary income.
The tax character of distributions declared for the years ended October 31, 2012 and October 31, 2011 was as follows:
| | | | | | | | |
| | | Year Ended October 31, | |
| | | 2012 | | | 2011 | |
| | |
Distributions declared from: | | | | | | | | |
Ordinary income | | $ | 12,966,351 | | | $ | 15,471,135 | |
During the period ended October 31, 2012, accumulated net realized loss was decreased by $520,447, accumulated undistributed net investment income was increased by $3,221,997 and paid-in capital was decreased by $3,742,444 due to expired capital loss carryforwards and differences between book
Eaton Vance
Low Duration Government Income Fund
October 31, 2012
Notes to Financial Statements — continued
and tax accounting, primarily for paydown gain (loss), premium amortization, mixed straddles, swap contracts and foreign currency gain (loss). These reclassifications had no effect on the net assets or net asset value per share of the Fund.
As of October 31, 2012, the components of distributable earnings (accumulated losses) and unrealized appreciation (depreciation) on a tax basis were as follows:
| | | | |
Undistributed ordinary income | | $ | 201,740 | |
Capital loss carryforward and deferred capital losses | | $ | (36,237,621 | ) |
Net unrealized appreciation | | $ | 32,956,292 | |
Other temporary differences | | $ | (201,840 | ) |
The differences between components of distributable earnings (accumulated losses) on a tax basis and the amounts reflected in the Statement of Assets and Liabilities are primarily due to partnership allocations, futures contracts, premium amortization, defaulted bond interest and the timing of recognizing distributions to shareholders.
3 Transactions with Affiliates
EVM serves as the investment adviser and administrator of the Fund, providing investment advisory services (relating to the investment of the Fund’s assets in the Portfolios) and administering the business affairs of the Fund. Pursuant to the investment advisory and administrative agreement and subsequent fee waiver agreement between the Fund and EVM, the fee is computed at an annual rate of 0.15% of the Fund’s average daily net assets, all of which is waived. The fee waiver agreement may not be amended or terminated without the approval of the Fund’s Trustees and shareholders. The Portfolios have engaged BMR to render investment advisory services. For the year ended October 31, 2012, the Fund’s allocated portion of the adviser fees paid by the Portfolios amounted to $2,187,591 or 0.51% of the Fund’s average daily net assets. EVM serves as the sub-transfer agent of the Fund and receives from the transfer agent an aggregate fee based upon the actual expenses incurred by EVM in the performance of these services. For the year ended October 31, 2012, EVM earned $10,920 in sub-transfer agent fees. The Fund was informed that EVD, an affiliate of EVM and the Fund’s principal underwriter, received $22,689 as its portion of the sales charge on sales of Class A shares for the year ended October 31, 2012. EVD also received distribution and service fees from Class A, Class B and Class C shares (see Note 4) and contingent deferred sales charges (see Note 5).
Trustees and officers of the Fund who are members of EVM’s and BMR’s organizations receive remuneration for their services to the Fund out of the investment adviser fee. Certain officers and Trustees of the Fund and Portfolios are officers of the above organizations.
4 Distribution Plans
The Fund has in effect a distribution plan for Class A shares (Class A Plan) pursuant to Rule 12b-1 under the 1940 Act. Pursuant to the Class A Plan, the Fund pays EVD a distribution and service fee of 0.25% per annum of its average daily net assets attributable to Class A shares for distribution services and facilities provided to the Fund by EVD, as well as for personal services and/or the maintenance of shareholder accounts. Distribution and service fees paid or accrued to EVD for the year ended October 31, 2012 amounted to $561,088 for Class A shares. The Fund also has in effect distribution plans for Class B shares (Class B Plan) and Class C shares (Class C Plan) pursuant to Rule 12b-1 under the 1940 Act. Pursuant to the Class B and Class C Plans, the Fund pays EVD amounts equal to 0.75% and 0.60% per annum of its average daily net assets attributable to Class B and Class C shares, respectively, for providing ongoing distribution services and facilities to the Fund. The Fund will automatically discontinue payments to EVD during any period in which there are no outstanding Uncovered Distribution Charges, which are equivalent to the sum of (i) 6.25% of the aggregate amount received by the Fund for Class B and Class C shares sold, plus (ii) interest calculated by applying the rate of 1% over the prevailing prime rate to the outstanding balance of Uncovered Distribution Charges of EVD of each respective class, reduced by the aggregate amount of contingent deferred sales charges (see Note 5) and amounts therefore paid or payable to EVD by each respective class. For the year ended October 31, 2012, the Fund paid or accrued to EVD $66,996 and $767,077 for Class B and Class C shares, respectively, representing 0.75% and 0.60% of the average daily net assets of Class B and Class C shares, respectively. At October 31, 2012, the amounts of Uncovered Distribution Charges of EVD calculated under the Class B and Class C Plans were approximately $1,478,000 and $16,836,000, respectively.
Pursuant to the Class B and Class C Plans, the Fund also makes payments of service fees to EVD, financial intermediaries and other persons in amounts equal to 0.25% per annum of its average daily net assets attributable to that class. Service fees paid or accrued are for personal services and/or the maintenance of shareholder accounts. They are separate and distinct from the sales commissions and distribution fees payable to EVD and, as such, are not subject to automatic discontinuance when there are no outstanding Uncovered Distribution Charges of EVD. Service fees paid or accrued for the year ended October 31, 2012 amounted to $22,332 and $319,615 for Class B and Class C shares, respectively.
5 Contingent Deferred Sales Charges
A contingent deferred sales charge (CDSC) generally is imposed on redemptions of Class B shares made within four years of purchase and on redemptions of Class C shares made within one year of purchase. Class A shares may be subject to a 1% CDSC if redeemed within 18 months of purchase (depending
Eaton Vance
Low Duration Government Income Fund
October 31, 2012
Notes to Financial Statements — continued
on the circumstances of purchase). Generally, the CDSC is based upon the lower of the net asset value at date of redemption or date of purchase. No charge is levied on shares acquired by reinvestment of dividends or capital gain distributions. The CDSC for Class B shares is imposed at declining rates that begin at 3% in the case of redemptions in the first year of purchase, declining to 2.5% in the second year, 2.0% in the third year, 1.0% in the fourth year and 0.0% thereafter. Class C shares are subject to a 1% CDSC if redeemed within one year of purchase. No CDSC is levied on shares which have been sold to EVM or its affiliates or to their respective employees or clients and may be waived under certain other limited conditions. CDSCs received on Class B and Class C redemptions are paid to EVD to reduce the amount of Uncovered Distribution Charges calculated under the Fund’s Class B and Class C Plans. CDSCs received on Class B and Class C redemptions when no Uncovered Distribution Charges exist are credited to the Fund. For the year ended October 31, 2012, the Fund was informed that EVD received approximately $4,000, $24,000 and $14,000 of CDSCs paid by Class A, Class B and Class C shareholders, respectively.
6 Investment Transactions
For the year ended October 31, 2012, increases and decreases in the Fund’s investment in the Portfolios were as follows:
| | | | | | | | |
| Portfolio | | Contributions | | | Withdrawals | |
| | |
Short-Term U.S. Government Portfolio | | $ | 65,162,781 | | | $ | 111,718,276 | |
Floating Rate Portfolio | | | 6,707,450 | | | | 10,552,906 | |
Government Obligations Portfolio | | | — | | | | — | |
7 Shares of Beneficial Interest
The Fund’s Declaration of Trust permits the Trustees to issue an unlimited number of full and fractional shares of beneficial interest (without par value). Such shares may be issued in a number of different series (such as the Fund) and classes. Transactions in Fund shares were as follows:
| | | | | | | | |
| | | Year Ended October 31, | |
| Class A | | 2012 | | | 2011 | |
| | |
Sales | | | 8,345,934 | | | | 10,289,717 | |
Issued to shareholders electing to receive payments of distributions in Fund shares | | | 704,746 | | | | 814,774 | |
Redemptions | | | (13,034,312 | ) | | | (20,930,005 | ) |
Exchange from Class B shares | | | 108,080 | | | | 201,016 | |
| | |
Net decrease | | | (3,875,552 | ) | | | (9,624,498 | ) |
| | |
| | | | | | | | |
| | | Year Ended October 31, | |
| Class B | | 2012 | | | 2011 | |
| | |
Sales | | | 127,901 | | | | 599,651 | |
Issued to shareholders electing to receive payments of distributions in Fund shares | | | 20,943 | | | | 18,945 | |
Redemptions | | | (314,775 | ) | | | (346,081 | ) |
Exchange to Class A shares | | | (107,927 | ) | | | (200,748 | ) |
| | |
Net increase (decrease) | | | (273,858 | ) | | | 71,767 | |
Eaton Vance
Low Duration Government Income Fund
October 31, 2012
Notes to Financial Statements — continued
| | | | | | | | |
| | | Year Ended October 31, | |
| Class C | | 2012 | | | 2011 | |
| | |
Sales | | | 3,486,609 | | | | 4,094,291 | |
Issued to shareholders electing to receive payments of distributions in Fund shares | | | 311,363 | | | | 312,018 | |
Redemptions | | | (4,423,211 | ) | | | (7,627,521 | ) |
| | |
Net decrease | | | (625,239 | ) | | | (3,221,212 | ) |
| | |
| | | | | | | | |
| | | Year Ended October 31, | |
| Class I | | 2012 | | | 2011 | |
| | |
Sales | | | 7,633,964 | | | | 4,302,116 | |
Issued to shareholders electing to receive payments of distributions in Fund shares | | | 105,975 | | | | 77,544 | |
Redemptions | | | (6,855,392 | ) | | | (4,256,734 | ) |
| | |
Net increase | | | 884,547 | | | | 122,926 | |
8 Name Change
Effective November 13, 2012, the name of Eaton Vance Low Duration Government Income Fund was changed from Eaton Vance Low Duration Fund.
9 Fair Value Measurements
Under generally accepted accounting principles for fair value measurements, a three-tier hierarchy to prioritize the assumptions, referred to as inputs, is used in valuation techniques to measure fair value. The three-tier hierarchy of inputs is summarized in the three broad levels listed below.
| Ÿ | | Level 1 – quoted prices in active markets for identical investments |
| Ÿ | | Level 2 – other significant observable inputs (including quoted prices for similar investments, interest rates, prepayment speeds, credit risk, etc.) |
| Ÿ | | Level 3 – significant unobservable inputs (including a fund’s own assumptions in determining the fair value of investments) |
In cases where the inputs used to measure fair value fall in different levels of the fair value hierarchy, the level disclosed is determined based on the lowest level input that is significant to the fair value measurement in its entirety. The inputs or methodology used for valuing securities are not necessarily an indication of the risk associated with investing in those securities.
At October 31, 2012 and October 31, 2011, the Fund’s investments in Floating Rate Portfolio and Government Obligations Portfolio, whose financial statements are not included but are available elsewhere as discussed in Note 1, were valued based on Level 1 inputs.
Eaton Vance
Low Duration Government Income Fund
October 31, 2012
Report of Independent Registered Public Accounting Firm
To the Trustees of Eaton Vance Mutual Funds Trust and Shareholders of Eaton Vance Low Duration Government Income Fund (formerly, Eaton Vance Low Duration Fund):
We have audited the accompanying statement of assets and liabilities of Eaton Vance Low Duration Government Income Fund (formerly, Eaton Vance Low Duration Fund) (the “Fund”) (one of the funds constituting Eaton Vance Mutual Funds Trust) as of October 31, 2012, and the related statement of operations for the year then ended, the statements of changes in net assets for each of the two years in the period then ended, and the financial highlights for each of the five years in the period then ended. These financial statements and financial highlights are the responsibility of the Fund’s management. Our responsibility is to express an opinion on these financial statements and financial highlights based on our audits.
We conducted our audits in accordance with the standards of the Public Company Accounting Oversight Board (United States). Those standards require that we plan and perform the audit to obtain reasonable assurance about whether the financial statements and financial highlights are free of material misstatement. The Fund is not required to have, nor were we engaged to perform, an audit of its internal control over financial reporting. Our audits included consideration of internal control over financial reporting as a basis for designing audit procedures that are appropriate in the circumstances, but not for the purpose of expressing an opinion on the effectiveness of the Fund’s internal control over financial reporting. Accordingly, we express no such opinion. An audit also includes examining, on a test basis, evidence supporting the amounts and disclosures in the financial statements, assessing the accounting principles used and significant estimates made by management, as well as evaluating the overall financial statement presentation. We believe that our audits provide a reasonable basis for our opinion.
In our opinion, such financial statements and financial highlights referred to above present fairly, in all material respects, the financial position of Eaton Vance Low Duration Government Income Fund as of October 31, 2012, the results of its operations for the year then ended, the changes in its net assets for each of the two years in the period then ended, and the financial highlights for each of the five years in the period then ended, in conformity with accounting principles generally accepted in the United States of America.
DELOITTE & TOUCHE LLP
Boston, Massachusetts
December 20, 2012
Eaton Vance
Low Duration Government Income Fund
October 31, 2012
Federal Tax Information (Unaudited)
The Form 1099-DIV you receive in January 2013 will show the tax status of all distributions paid to your account in calendar year 2012. Shareholders are advised to consult their own tax adviser with respect to the tax consequences of their investment in the Fund.
Short-Term U.S. Government Portfolio
October 31, 2012
Portfolio of Investments
| | | | | | | | |
| Mortgage Pass-Throughs — 47.8% | |
| | |
| | | | | | | | |
| Security | | Principal
Amount
(000’s omitted) | | | Value | |
| | | | | | | | |
Federal Home Loan Mortgage Corp.: | |
2.24%, with maturity at 2020(1) | | $ | 638 | | | $ | 657,009 | |
2.344%, with various maturities to 2037(1) | | | 2,266 | | | | 2,377,818 | |
2.366%, with various maturities to 2022(1) | | | 3,687 | | | | 3,805,607 | |
2.417%, with maturity at 2023(1) | | | 1,821 | | | | 1,893,801 | |
2.529%, with maturity at 2035(1) | | | 5,746 | | | | 5,994,193 | |
2.90%, with maturity at 2035(1) | | | 4,224 | | | | 4,499,438 | |
3.00%, with maturity at 2034(1) | | | 2,180 | | | | 2,328,754 | |
3.129%, with maturity at 2022(1) | | | 369 | | | | 383,090 | |
3.274%, with maturity at 2029(1) | | | 1,076 | | | | 1,103,702 | |
3.281%, with maturity at 2032(1) | | | 1,585 | | | | 1,628,881 | |
3.409%, with maturity at 2025(1) | | | 1,549 | | | | 1,647,627 | |
3.858%, with maturity at 2034(1) | | | 949 | | | | 1,035,868 | |
4.072%, with maturity at 2037(1) | | | 4,591 | | | | 5,011,788 | |
4.315%, with maturity at 2030(1) | | | 1,568 | | | | 1,711,950 | |
4.50%, with various maturities to 2035 | | | 7,851 | | | | 8,451,563 | |
4.712%, with maturity at 2033(1) | | | 5,769 | | | | 6,297,617 | |
4.896%, with maturity at 2032(1) | | | 794 | | | | 854,965 | |
5.00%, with various maturities to 2018 | | | 4,760 | | | | 5,133,935 | |
5.50%, with various maturities to 2018 | | | 2,818 | | | | 3,018,271 | |
6.00%, with various maturities to 2035 | | | 8,331 | | | | 9,540,936 | |
6.50%, with various maturities to 2030 | | | 2,144 | | | | 2,352,694 | |
7.00%, with various maturities to 2035 | | | 1,751 | | | | 2,092,870 | |
7.50%, with various maturities to 2017 | | | 516 | | | | 542,119 | |
8.00%, with various maturities to 2025 | | | 303 | | | | 336,533 | |
9.25%, with maturity at 2017 | | | 4 | | | | 4,717 | |
| | | | | | | | | |
| | | | | | $ | 72,705,746 | |
| | | | | | | | | |
Federal National Mortgage Association: | | | | | | | | |
2.264%, with maturity at 2031(1) | | $ | 4,501 | | | $ | 4,719,243 | |
2.319%, with various maturities to 2037(1) | | | 1,539 | | | | 1,608,224 | |
2.344%, with various maturities to 2035(1) | | | 5,279 | | | | 5,556,516 | |
2.366%, with maturity at 2032(1) | | | 2,406 | | | | 2,525,024 | |
2.417%, with maturity at 2031(1) | | | 5,635 | | | | 5,809,150 | |
2.504%, with maturity at 2018(1) | | | 60 | | | | 61,533 | |
2.573%, with maturity at 2037(1) | | | 5,263 | | | | 5,553,083 | |
2.606%, with maturity at 2019(1) | | | 1,845 | | | | 1,914,099 | |
2.614%, with maturity at 2040(1) | | | 1,623 | | | | 1,720,658 | |
2.627%, with maturity at 2020(1) | | | 920 | | | | 951,410 | |
2.69%, with maturity at 2018(1) | | | 417 | | | | 430,390 | |
2.824%, with maturity at 2029(1) | | | 369 | | | | 379,609 | |
2.875%, with maturity at 2018(1) | | | 38 | | | | 38,868 | |
2.877%, with maturity at 2036(1) | | | 514 | | | | 530,491 | |
3.002%, with maturity at 2030(1) | | | 894 | | | | 927,525 | |
3.223%, with maturity at 2030(1) | | | 3,299 | | | | 3,447,978 | |
| | | | | | | | |
| Security | | Principal
Amount
(000’s omitted) | | | Value | |
| | | | | | | | |
Federal National Mortgage Association: (continued) | |
3.229%, with maturity at 2034(1) | | $ | 4,105 | | | $ | 4,418,204 | |
3.286%, with maturity at 2036(1) | | | 1,873 | | | | 1,930,579 | |
3.299%, with maturity at 2030(1) | | | 1,435 | | | | 1,533,721 | |
3.432%, with maturity at 2021(1) | | | 819 | | | | 857,084 | |
3.651%, with maturity at 2021(1) | | | 863 | | | | 897,715 | |
3.664%, with maturity at 2034(1) | | | 6,577 | | | | 7,178,801 | |
3.712%, with maturity at 2021(1) | | | 1,403 | | | | 1,460,509 | |
3.798%, with maturity at 2035(1) | | | 2,602 | | | | 2,839,975 | |
3.835%, with maturity at 2036(1) | | | 509 | | | | 535,300 | |
3.949%, with maturity at 2034(1) | | | 4,211 | | | | 4,596,301 | |
4.103%, with maturity at 2033(1) | | | 1,500 | | | | 1,637,583 | |
4.154%, with maturity at 2035(1) | | | 1,849 | | | | 2,018,045 | |
4.177%, with maturity at 2036(1) | | | 3,476 | | | | 3,794,439 | |
4.381%, with maturity at 2035(1) | | | 3,425 | | | | 3,738,984 | |
4.581%, with maturity at 2029(1) | | | 3,226 | | | | 3,521,765 | |
4.618%, with maturity at 2034(1) | | | 1,938 | | | | 2,115,113 | |
4.758%, with maturity at 2034(1) | | | 3,794 | | | | 4,141,088 | |
5.00%, with various maturities to 2019(2) | | | 6,670 | | | | 7,234,915 | |
6.00%, with various maturities to 2031 | | | 4,664 | | | | 5,206,022 | |
6.325%, with maturity at 2032(1) | | | 573 | | | | 625,857 | |
6.50%, with various maturities to 2019 | | | 348 | | | | 368,906 | |
7.00%, with various maturities to 2035 | | | 14,045 | | | | 16,598,128 | |
8.00%, with various maturities to 2034 | | | 1,756 | | | | 2,184,537 | |
9.224%, with maturity at 2018(3) | | | 240 | | | | 266,132 | |
9.50%, with maturity at 2022 | | | 420 | | | | 482,063 | |
| | | | | | | | | |
| | | $ | 116,355,567 | |
| | | | | | | | | |
Government National Mortgage Association: | | | | | |
1.625%, with various maturities to 2027(1) | | $ | 648 | | | $ | 671,135 | |
2.00%, with maturity at 2026(1) | | | 321 | | | | 339,517 | |
5.00%, with maturity at 2018 | | | 2,220 | | | | 2,402,718 | |
8.25%, with maturity at 2020 | | | 222 | | | | 259,981 | |
9.00%, with maturity at 2017 | | | 253 | | | | 282,982 | |
| | | | | | | | | |
| | | $ | 3,956,333 | |
| | | | | | | | | |
| |
Total Mortgage Pass-Throughs
(identified cost $186,382,555) | | | $ | 193,017,646 | |
| | |
|
| Collateralized Mortgage Obligations — 11.8% | |
| | |
| | | | | | | | |
| Security | | Principal
Amount
(000’s omitted) | | | Value | |
Federal Home Loan Mortgage Corp.: | |
Series 228, (Interest Only), Class IO, 6.00%, 2/1/35(4) | | $ | 7,802 | | | $ | 1,250,194 | |
Series 1395, Class F, 1.719%, 10/15/22(5) | | | 71 | | | | 71,317 | |
Series 2135, Class JZ, 6.00%, 3/15/29 | | | 3,386 | | | | 3,697,650 | |
| | | | |
| | 21 | | See Notes to Financial Statements. |
Short-Term U.S. Government Portfolio
October 31, 2012
Portfolio of Investments — continued
| | | | | | | | |
| Security | | Principal
Amount
(000’s omitted) | | | Value | |
| | | | | | | | |
Federal Home Loan Mortgage Corp.: (continued) | |
Series 3030, (Interest Only), Class SL, 5.886%, 9/15/35(4)(6) | | $ | 12,131 | | | $ | 2,249,241 | |
Series 3114, (Interest Only), Class TS, 6.436%, 9/15/30(4)(6) | | | 24,373 | | | | 4,960,659 | |
Series 3339, (Interest Only), Class JI, 6.376%, 7/15/37(4)(6) | | | 9,834 | | | | 1,812,191 | |
Series 3872, (Interest Only), Class NI, 5.50%, 12/15/21(4) | | | 21,992 | | | | 3,037,294 | |
| | | | | | | | | |
| | | $ | 17,078,546 | |
| | | | | | | | | |
Federal National Mortgage Association: | | | | | | | | |
Series G93-17, Class FA, 1.219%, 4/25/23(5) | | $ | 169 | | | $ | 172,125 | |
Series G93-36, Class ZQ, 6.50%, 12/25/23 | | | 768 | | | | 875,403 | |
Series G97-4, Class FA, 1.019%, 6/17/27(5) | | | 585 | | | | 593,850 | |
Series 296, (Interest Only), Class 2, 8.00%, 4/1/24(4) | | | 2,222 | | | | 460,872 | |
Series 1993-203, Class PL, 6.50%, 10/25/23 | | | 867 | | | | 980,775 | |
Series 1993-250, Class Z, 7.00%, 12/25/23 | | | 197 | | | | 207,746 | |
Series 1994-14, Class F, 2.669%, 10/25/23(5) | | | 895 | | | | 921,727 | |
Series 2001-4, Class GA, 9.646%, 4/17/25(3) | | | 150 | | | | 171,443 | |
Series 2005-68, (Interest Only), Class XI, 6.00%, 8/25/35(4) | | | 10,099 | | | | 2,146,001 | |
Series 2006-65, (Interest Only), Class PS, 7.009%, 7/25/36(4)(6) | | | 9,066 | | | | 1,665,168 | |
Series 2007-99, (Interest Only), Class SD, 6.189%, 10/25/37(4)(6) | | | 15,107 | | | | 2,223,187 | |
Series 2009-48, Class WA, 5.86%, 7/25/39(3) | | | 2,138 | | | | 2,424,379 | |
Series 2009-62, Class WA, 5.552%, 8/25/39(3) | | | 3,005 | | | | 3,388,178 | |
Series 2009-93, (Interest Only), Class SC, 5.939%, 11/25/39(4)(6) | | | 22,835 | | | | 3,673,952 | |
Series 2010-13, (Interest Only), Class PI, 5.00%, 11/25/38(4) | | | 21,575 | | | | 1,681,786 | |
Series 2010-54, (Interest Only), Class EI, 6.00%, 6/25/40(4) | | | 9,715 | | | | 1,713,069 | |
Series 2011-13, (Interest Only), Class AI, 4.50%, 7/25/21(4) | | | 19,350 | | | | 1,749,010 | |
Series 2011-59, (Interest Only), Class IW, 6.00%, 7/25/41(4) | | | 9,896 | | | | 1,954,107 | |
Series 2011-82, (Interest Only), Class AI, 5.50%, 8/25/26(4) | | | 23,192 | | | | 2,669,864 | |
| | | | | | | | | |
| | | $ | 29,672,642 | |
| | | | | | | | | |
Government National Mortgage Association: | | | | | | | | |
Series 2000-30, Class F, 0.764% , 12/16/22(5) | | $ | 950 | | | $ | 958,280 | |
| | | | | | | | | |
| |
Total Collateralized Mortgage Obligations
(identified cost $45,457,004) | | | $ | 47,709,468 | |
| | |
|
| Commercial Mortgage-Backed Securities — 0.1% | |
| | |
| | | | | | | | |
| Security | | Principal
Amount
(000’s omitted) | | | Value | |
GMACC, Series 2003-C2, Class A1, 4.576%, 5/10/40 | | $ | 270 | | | $ | 271,572 | |
| | | | | | | | | |
| | |
Total Commercial Mortgage-Backed Securities
(identified cost $271,304) | | | | | | $ | 271,572 | |
| | | | | | | | | |
| | | | | | | | |
| U.S. Government Agency Obligations — 31.2% | |
| Security | | Principal
Amount
(000’s omitted) | | | Value | |
| | | | | | | | |
Federal Farm Credit Bank: | | | | | | | | |
5.75%, 12/7/28 | | $ | 5,000 | | | $ | 6,772,205 | |
5.77%, 1/5/27 | | | 3,000 | | | | 4,162,827 | |
| | | | | | | | | |
| | | $ | 10,935,032 | |
| | | | | | | | | |
Federal Home Loan Bank: | | | | | | | | |
4.125%, 3/13/20 | | $ | 10,000 | | | $ | 11,864,020 | |
4.625%, 9/11/20 | | | 1,735 | | | | 2,135,950 | |
5.365%, 9/9/24 | | | 8,000 | | | | 10,634,232 | |
5.375%, 9/30/22 | | | 10,135 | | | | 13,284,248 | |
5.375%, 8/15/24 | | | 3,500 | | | | 4,635,141 | |
5.75%, 6/12/26 | | | 12,000 | | | | 16,350,504 | |
| | | | | | | | | |
| | | $ | 58,904,095 | |
| | | | | | | | | |
United States Agency for International Development — Israel: | |
0.00%, 5/1/20 | | $ | 1,100 | | | $ | 955,805 | |
0.00%, 3/15/21 | | | 20,000 | | | | 17,100,900 | |
5.50%, 12/4/23 | | | 6,775 | | | | 8,968,237 | |
5.50%, 4/26/24 | | | 22,000 | | | | 29,292,692 | |
| | | | | | | | | |
| | | | | | $ | 56,317,634 | |
| | | | | | | | | |
| |
Total U.S. Government Agency Obligations
(identified cost $103,382,864) | | | $ | 126,156,761 | |
| | |
|
| Short-Term Investments — 10.4% | |
| | |
| | | | | | | | |
| Description | | Interest
(000’s omitted) | | | Value | |
Eaton Vance Cash Reserves Fund, LLC, 0.12%(7) | | $ | 42,080 | | | $ | 42,079,772 | |
| | |
| |
Total Short-Term Investments
(identified cost $42,079,772) | | | $ | 42,079,772 | |
| | |
| |
Total Investments — 101.3%
(identified cost $377,573,499) | | | $ | 409,235,219 | |
| | |
| |
Other Assets, Less Liabilities — (1.3)% | | | $ | (5,366,256 | ) |
| | |
| |
Net Assets — 100.0% | | | $ | 403,868,963 | |
| | | | | | | | | |
The percentage shown for each investment category in the Portfolio of Investments is based on net assets.
| | | | |
| GMACC | | – | | GMAC Commercial Mortgage Securities, Inc. |
| | (1) | Adjustable rate mortgage security. Rate shown is the rate at October 31, 2012. |
| | (2) | Security (or a portion thereof) has been pledged to cover margin requirements on open financial futures contracts. |
| | | | |
| | 22 | | See Notes to Financial Statements. |
Short-Term U.S. Government Portfolio
October 31, 2012
Portfolio of Investments — continued
| | (3) | Weighted average fixed-rate coupon that changes/updates monthly. |
| | (4) | Interest only security that entitles the holder to receive only interest payments on the underlying mortgages. Principal amount shown is the notional amount of the underlying mortgages on which coupon interest is calculated. |
| | (5) | Variable rate security. The stated interest rate represents the rate in effect at October 31, 2012. |
| | (6) | Inverse floating-rate security whose coupon varies inversely with changes in the interest rate index. The stated interest rate represents the coupon rate in effect at October 31, 2012. |
| | (7) | Affiliated investment company available to Eaton Vance portfolios and funds which invests in high quality, U.S. dollar denominated money market instruments. The rate shown is the annualized seven-day yield as of October 31, 2012. |
| | | | |
| | 23 | | See Notes to Financial Statements. |
Short-Term U.S. Government Portfolio
October 31, 2012
Statement of Assets and Liabilities
| | | | |
| Assets | | October 31, 2012 | |
Unaffiliated investments, at value (identified cost, $335,493,727) | | $ | 367,155,447 | |
Affiliated investment, at value (identified cost, $42,079,772) | | | 42,079,772 | |
Interest receivable | | | 2,334,650 | |
Interest receivable from affiliated investment | | | 4,035 | |
Receivable for investments sold | | | 445,108 | |
Receivable for open swap contracts | | | 438,820 | |
Total assets | | $ | 412,457,832 | |
|
| Liabilities | |
Payable for investments purchased | | $ | 8,159,426 | |
Payable for variation margin on open financial futures contracts | | | 206,244 | |
Payable to affiliate: | | | | |
Investment adviser fee | | | 169,728 | |
Trustees’ fees | | | 1,323 | |
Accrued expenses | | | 52,148 | |
Total liabilities | | $ | 8,588,869 | |
Net Assets applicable to investors’ interest in Portfolio | | $ | 403,868,963 | |
|
| Sources of Net Assets | |
Investors’ capital | | $ | 371,868,033 | |
Net unrealized appreciation | | | 32,000,930 | |
Total | | $ | 403,868,963 | |
| | | | |
| | 24 | | See Notes to Financial Statements. |
Short-Term U.S. Government Portfolio
October 31, 2012
Statement of Operations
| | | | |
| Investment Income | | Year Ended
October 31, 2012 | |
Interest | | $ | 12,988,944 | |
Interest allocated from affiliated investment | | | 21,600 | |
Expenses allocated from affiliated investment | | | (2,541 | ) |
Total investment income | | $ | 13,008,003 | |
| |
| Expenses | | | | |
Investment adviser fee | | $ | 2,035,119 | |
Trustees’ fees and expenses | | | 16,943 | |
Custodian fee | | | 183,733 | |
Legal and accounting services | | | 48,659 | |
Miscellaneous | | | 16,460 | |
Total expenses | | $ | 2,300,914 | |
Deduct — | | | | |
Reduction of custodian fee | | $ | 30 | |
Total expense reductions | | $ | 30 | |
| |
Net expenses | | $ | 2,300,884 | |
| |
Net investment income | | $ | 10,707,119 | |
| |
| Realized and Unrealized Gain (Loss) | | | | |
Net realized gain (loss) — | | | | |
Investment transactions | | $ | 4,360,292 | |
Investment transactions allocated from affiliated investment | | | 301 | |
Financial futures contracts | | | (6,338,523 | ) |
Net realized loss | | $ | (1,977,930 | ) |
Change in unrealized appreciation (depreciation) — | | | | |
Investments | | $ | 5,443,334 | |
Financial futures contracts | | | 99,218 | |
Swap contracts | | | 438,820 | |
Net change in unrealized appreciation (depreciation) | | $ | 5,981,372 | |
| |
Net realized and unrealized gain | | $ | 4,003,442 | |
| |
Net increase in net assets from operations | | $ | 14,710,561 | |
| | | | |
| | 25 | | See Notes to Financial Statements. |
Short-Term U.S. Government Portfolio
October 31, 2012
Statements of Changes in Net Assets
| | | | | | | | |
| | | Year Ended October 31, | |
| Increase (Decrease) in Net Assets | | 2012 | | | 2011 | |
From operations — | | | | | | | | |
Net investment income | | $ | 10,707,119 | | | $ | 12,793,160 | |
Net realized loss from investment transactions and financial futures contracts | | | (1,977,930 | ) | | | (11,326,819 | ) |
Net change in unrealized appreciation (depreciation) from investments, financial futures contracts and swap contracts | | | 5,981,372 | | | | 851,118 | |
Net increase in net assets from operations | | $ | 14,710,561 | | | $ | 2,317,459 | |
Capital transactions — | | | | | | | | |
Contributions | | $ | 87,470,108 | | | $ | 97,340,902 | |
Withdrawals | | | (130,503,370 | ) | | | (194,170,292 | ) |
Net decrease in net assets from capital transactions | | $ | (43,033,262 | ) | | $ | (96,829,390 | ) |
| | |
Net decrease in net assets | | $ | (28,322,701 | ) | | $ | (94,511,931 | ) |
|
| Net Assets | |
At beginning of year | | $ | 432,191,664 | | | $ | 526,703,595 | |
At end of year | | $ | 403,868,963 | | | $ | 432,191,664 | |
| | | | |
| | 26 | | See Notes to Financial Statements. |
Short-Term U.S. Government Portfolio
October 31, 2012
Supplementary Data
| | | | | | | | | | | | | | | | | | | | |
| | | Year Ended October 31, | |
| Ratios/Supplemental Data | | 2012 | | | 2011 | | | 2010 | | | 2009 | | | 2008 | |
Ratios (as a percentage of average daily net assets): | | | | | | | | | | | | | | | | | | | | |
Expenses(1) | | | 0.57 | % | | | 0.56 | % | | | 0.57 | % | | | 0.58 | % | | | 0.63 | % |
Net investment income | | | 2.63 | % | | | 2.68 | % | | | 2.87 | % | | | 3.23 | % | | | 3.96 | % |
Portfolio Turnover | | | 15 | % | | | 6 | % | | | 26 | % | | | 34 | % | | | 24 | % |
| | | | | |
Total Return | | | 3.72 | % | | | 0.63 | % | | | 3.65 | % | | | 7.76 | % | | | 4.34 | % |
| | | | | |
Net assets, end of year (000’s omitted) | | $ | 403,869 | | | $ | 432,192 | | | $ | 526,704 | | | $ | 333,865 | | | $ | 116,214 | |
| (1) | Excludes the effect of custody fee credits, if any, of less than 0.005%. |
| | | | |
| | 27 | | See Notes to Financial Statements. |
Short-Term U.S. Government Portfolio
October 31, 2012
Notes to Financial Statements
1 Significant Accounting Policies
Short-Term U.S. Government Portfolio (the Portfolio) is a Massachusetts business trust registered under the Investment Company Act of 1940, as amended (the 1940 Act), as a diversified, open-end management investment company. The Portfolio’s investment objective is to seek total return. The Declaration of Trust permits the Trustees to issue interests in the Portfolio. At October 31, 2012, Eaton Vance Low Duration Government Income Fund (formerly, Eaton Vance Low Duration Fund), Eaton Vance Multi-Strategy Absolute Return Fund, Eaton Vance Short Term Real Return Fund, Eaton Vance Strategic Income Fund and Eaton Vance International (Cayman Islands) Strategic Income Fund held an interest of 87.9%, 9.1%, 0.02%, 0.03% and 0.03%, respectively, in the Portfolio.
The following is a summary of significant accounting policies of the Portfolio. The policies are in conformity with accounting principles generally accepted in the United States of America.
A Investment Valuation — Debt obligations (including short-term obligations with a remaining maturity of more than sixty days and excluding most seasoned, fixed-rate 30-year mortgage-backed securities as noted below) are generally valued on the basis of valuations provided by third party pricing services, as derived from such services’ pricing models. Inputs to the models may include, but are not limited to, reported trades, executable bid and asked prices, broker/dealer quotations, prices or yields of securities with similar characteristics, benchmark curves or information pertaining to the issuer, as well as industry and economic events. The pricing services may use a matrix approach, which considers information regarding securities with similar characteristics to determine the valuation for a security. Most seasoned, fixed-rate 30-year mortgage-backed securities are valued through the use of the investment adviser’s matrix pricing system, which takes into account bond prices, yield differentials, anticipated prepayments and interest rates provided by dealers. Short-term obligations purchased with a remaining maturity of sixty days or less are generally valued at amortized cost, which approximates market value. Financial futures contracts are valued at the settlement price established by the board of trade or exchange on which they are traded. Interest rate swaps are normally valued using valuations provided by a third party pricing service. Such pricing service valuations are based on the present value of fixed and projected floating rate cash flows over the term of the swap contract. Future cash flows are discounted to their present value using swap quotations provided by electronic data services or by broker/dealers. Investments for which valuations or market quotations are not readily available or are deemed unreliable are valued at fair value using methods determined in good faith by or at the direction of the Trustees of the Portfolio in a manner that fairly reflects the security’s value, or the amount that the Portfolio might reasonably expect to receive for the security upon its current sale in the ordinary course. Each such determination is based on a consideration of relevant factors, which are likely to vary from one pricing context to another. These factors may include, but are not limited to, the type of security, the existence of any contractual restrictions on the security’s disposition, the price and extent of public trading in similar securities of the issuer or of comparable companies or entities, quotations or relevant information obtained from broker/dealers or other market participants, information obtained from the issuer, analysts, and/or the appropriate stock exchange (for exchange-traded securities), an analysis of the company’s or entity’s financial condition, and an evaluation of the forces that influence the issuer and the market(s) in which the security is purchased and sold.
The Portfolio may invest in Eaton Vance Cash Reserves Fund, LLC (Cash Reserves Fund), an affiliated investment company managed by Eaton Vance Management (EVM). Cash Reserves Fund generally values its investment securities utilizing the amortized cost valuation technique in accordance with Rule 2a-7 under the 1940 Act. This technique involves initially valuing a portfolio security at its cost and thereafter assuming a constant amortization to maturity of any discount or premium. If amortized cost is determined not to approximate fair value, Cash Reserves Fund may value its investment securities in the same manner as debt obligations described above.
B Investment Transactions — Investment transactions for financial statement purposes are accounted for on a trade date basis. Realized gains and losses on investments sold are determined on the basis of identified cost.
C Income — Interest income is recorded on the basis of interest accrued, adjusted for amortization of premium or accretion of discount.
D Federal Taxes — The Portfolio has elected to be treated as a partnership for federal tax purposes. No provision is made by the Portfolio for federal or state taxes on any taxable income of the Portfolio because each investor in the Portfolio is ultimately responsible for the payment of any taxes on its share of taxable income. Since at least one of the Portfolio’s investors is a regulated investment company that invests all or substantially all of its assets in the Portfolio, the Portfolio normally must satisfy the applicable source of income and diversification requirements (under the Internal Revenue Code) in order for its investors to satisfy them. The Portfolio will allocate, at least annually among its investors, each investor’s distributive share of the Portfolio’s net investment income, net realized capital gains and any other items of income, gain, loss, deduction or credit.
As of October 31, 2012, the Portfolio had no uncertain tax positions that would require financial statement recognition, de-recognition, or disclosure. The Portfolio files a U.S. federal income tax return annually after its fiscal year-end, which is subject to examination by the Internal Revenue Service for a period of three years from the date of filing.
E Expense Reduction — State Street Bank and Trust Company (SSBT) serves as custodian of the Portfolio. Pursuant to the custodian agreement, SSBT receives a fee reduced by credits, which are determined based on the average daily cash balance the Portfolio maintains with SSBT. All credit balances, if any, used to reduce the Portfolio’s custodian fees are reported as a reduction of expenses in the Statement of Operations.
F Use of Estimates — The preparation of the financial statements in conformity with accounting principles generally accepted in the United States of America requires management to make estimates and assumptions that affect the reported amounts of assets and liabilities at the date of the financial statements and the reported amounts of income and expense during the reporting period. Actual results could differ from those estimates.
Short-Term U.S. Government Portfolio
October 31, 2012
Notes to Financial Statements — continued
G Indemnifications — Under the Portfolio’s organizational documents, its officers and Trustees may be indemnified against certain liabilities and expenses arising out of the performance of their duties to the Portfolio. Under Massachusetts law, if certain conditions prevail, interestholders in the Portfolio could be deemed to have personal liability for the obligations of the Portfolio. However, the Portfolio’s Declaration of Trust contains an express disclaimer of liability on the part of Portfolio interestholders and the By-laws provide that the Portfolio shall assume the defense on behalf of any Portfolio interestholder. Moreover, the By-laws also provide for indemnification out of Portfolio property of any interestholder held personally liable solely by reason of being or having been an interestholder for all loss or expense arising from such liability. Additionally, in the normal course of business, the Portfolio enters into agreements with service providers that may contain indemnification clauses. The Portfolio’s maximum exposure under these arrangements is unknown as this would involve future claims that may be made against the Portfolio that have not yet occurred.
H Financial Futures Contracts — Upon entering into a financial futures contract, the Portfolio is required to deposit with the broker, either in cash or securities, an amount equal to a certain percentage of the purchase price (initial margin). Subsequent payments, known as variation margin, are made or received by the Portfolio each business day, depending on the daily fluctuations in the value of the underlying security, and are recorded as unrealized gains or losses by the Portfolio. Gains (losses) are realized upon the expiration or closing of the financial futures contracts. Should market conditions change unexpectedly, the Portfolio may not achieve the anticipated benefits of the financial futures contracts and may realize a loss. Futures contracts have minimal counterparty risk as they are exchange traded and the clearinghouse for the exchange is substituted as the counterparty, guaranteeing counterparty performance.
I Interest Rate Swaps — Pursuant to interest rate swap agreements, the Portfolio either makes floating-rate payments based on a benchmark interest rate in exchange for fixed-rate payments or the Portfolio makes fixed-rate payments in exchange for payments on a floating benchmark interest rate. Payments received or made are recorded as realized gains or losses. During the term of the outstanding swap agreement, changes in the underlying value of the swap are recorded as unrealized gains or losses. The value of the swap is determined by changes in the relationship between two rates of interest. The Portfolio is exposed to credit loss in the event of non-performance by the swap counterparty. Risk may also arise from movements in interest rates.
J Stripped Mortgage-Backed Securities — The Fund may invest in Interest Only (IO) securities, a form of stripped mortgage-backed securities, whereby the IO security receives all the interest on a pool of mortgage assets. The yield to maturity on an IO security is extremely sensitive to the rate of principal payments (including pre-payments) on the related underlying mortgage assets, and a rapid rate of principal payments may have a material adverse effect on the yield to maturity from these securities. If the underlying mortgages experience greater than anticipated prepayments of principal, the Fund may fail to recoup its initial investment in an IO security. The market value of IO securities can be unusually volatile to changes in interest rates.
2 Investment Adviser Fee and Other Transactions with Affiliates
The investment adviser fee is earned by Boston Management and Research (BMR), a subsidiary of EVM, as compensation for investment advisory services rendered to the Portfolio. The fee is computed at an annual rate of 0.50% of the Portfolio’s average daily net assets and is payable monthly. The Portfolio invests its cash in Cash Reserves Fund. EVM does not currently receive a fee for advisory services provided to Cash Reserves Fund. For the year ended October 31, 2012, the Portfolio’s investment adviser fee amounted to $2,035,119.
Trustees and officers of the Portfolio who are members of EVM’s or BMR’s organizations receive remuneration for their services to the Portfolio out of the investment adviser fee. Trustees of the Portfolio who are not affiliated with the investment adviser and administrator may elect to defer receipt of all or a percentage of their annual fees in accordance with the terms of the Trustees Deferred Compensation Plan. For the year ended October 31, 2012, no significant amounts have been deferred. Certain officers and Trustees of the Portfolio are officers of the above organizations.
3 Purchases and Sales of Investments
Purchases and sales of investments, other than short-term obligations and including maturities and paydowns, for the year ended October 31, 2012 were as follows:
| | | | | | | | |
| | | Purchases | | | Sales | |
| | |
Investments (non-U.S. Government) | | $ | — | | | $ | 11,541,949 | |
U.S. Government and Agency Securities | | | 57,125,974 | | | | 89,596,932 | |
| | |
| | | $ | 57,125,974 | | | $ | 101,138,881 | |
Short-Term U.S. Government Portfolio
October 31, 2012
Notes to Financial Statements — continued
4 Federal Income Tax Basis of Investments
The cost and unrealized appreciation (depreciation) of investments of the Portfolio at October 31, 2012, as determined on a federal income tax basis, were as follows:
| | | | |
| |
Aggregate cost | | $ | 380,205,645 | |
| |
Gross unrealized appreciation | | $ | 31,300,087 | |
Gross unrealized depreciation | | | (2,270,513 | ) |
| |
Net unrealized appreciation | | $ | 29,029,574 | |
The net unrealized appreciation on swap contracts at October 31, 2012 on a federal income tax basis was $438,820.
5 Financial Instruments
The Portfolio may trade in financial instruments with off-balance sheet risk in the normal course of its investing activities. These financial instruments may include financial futures contracts and swap contracts may involve, to a varying degree, elements of risk in excess of the amounts recognized for financial statement purposes. The notional or contractual amounts of these instruments represent the investment the Portfolio has in particular classes of financial instruments and do not necessarily represent the amounts potentially subject to risk. The measurement of the risks associated with these instruments is meaningful only when all related and offsetting transactions are considered.
A summary of obligations under these financial instruments at October 31, 2012 is as follows:
| | | | | | | | | | | | | | | | |
| Futures Contracts | |
Expiration Month/Year | | Contracts | | Position | | Aggregate Cost | | | Value | | | Net Unrealized
Appreciation
(Depreciation) | |
| | | | | |
| 12/12 | | 250
U.S. 5-Year Treasury Note | | Short | | $ | (31,072,265 | ) | | $ | (31,062,500 | ) | | $ | 9,765 | |
| 12/12 | | 400 U.S. 10-Year Treasury Note | | Short | | | (53,103,125 | ) | | | (53,212,500 | ) | | | (109,375 | ) |
| | | | | |
| | | | | | | | | | | | | | | $ | (99,610 | ) |
| | | | | | | | | | | | | | | | | | | | |
| Interest Rate Swaps | |
| Counterparty | | Notional
Amount
(000’s omitted) | | | Portfolio
Pays/Receives
Floating Rate | | Floating
Rate Index | | Annual
Fixed Rate | | | Effective Date/
Termination Date | | | Net
Unrealized
Appreciation | |
| | | | | | |
| Deutsche Bank AG | | $ | 10,000 | | | Pays | | 3-month USD-LIBOR-BBA | | | 2.61 | % | | | June 1, 2017/June 1, 2022 | | | $ | 13,090 | |
| Deutsche Bank AG | | | 10,000 | | | Receives | | 3-month USD-LIBOR-BBA | | | 2.82 | | | | June 1, 2017/June 1, 2047 | | | | 425,730 | |
| | | | | | |
| | | | | | | | | | | | | | | | | | | $ | 438,820 | |
The effective date represents the date on which the Portfolio and the counterparty to the interest rate swap contract begin interest payment accruals.
At October 31, 2012, the Portfolio had sufficient cash and/or securities to cover commitments under these contracts.
The Portfolio is subject to interest rate risk in the normal course of pursuing its investment objective. Because the Portfolio holds fixed rate bonds, the value of these bonds may decrease if interest rates rise. The Portfolio utilizes various interest rate derivatives including U.S. Treasury futures and interest rate swaps to change the overall duration of the portfolio and to hedge against fluctuations in securities prices due to change in interest rates.
The Portfolio enters into swap contracts that may contain provisions whereby the counterparty may terminate the contract under certain conditions, including but not limited to a decline in the Portfolio’s net assets below a certain level over a certain period of time, which would trigger a payment by the
Short-Term U.S. Government Portfolio
October 31, 2012
Notes to Financial Statements — continued
Portfolio for those derivatives in a liability position. At October 31, 2012, the Portfolio had no open derivatives with credit-related contingent features in a net liability position.
The non-exchange traded derivatives in which the Portfolio invests, including swap contracts, are subject to the risk that the counterparty to the contract fails to perform its obligations under the contract. At October 31, 2012, the maximum amount of loss the Portfolio would incur due to counterparty risk was $438,820, representing the fair value of such derivatives in an asset position, with the highest amount from any one counterparty being $438,820. To mitigate this risk, the Portfolio has entered into master netting agreements with substantially all its derivative counterparties, which allows it and a counterparty to aggregate amounts owed by each of them for derivative transactions under the agreement into a single net amount payable by either the Portfolio or the counterparty. Counterparties may be required to pledge collateral in the form of cash, U.S. Government securities or highly-rated bonds for the benefit of the Portfolio if the net amount due from the counterparty with respect to a derivative contract exceeds a certain threshold. The amount of collateral posted by the counterparties with respect to such contracts would reduce the amount of any loss incurred.
The fair value of open derivative instruments (not considered to be hedging instruments for accounting disclosure purposes) and whose primary underlying risk exposure is interest rate risk at October 31, 2012 were as follows:
| | | | | | | | |
| | | Fair Value | |
| Derivative | | Asset Derivatives | | | Liability Derivatives | |
| | |
Futures contracts | | $ | 9,765 | (1) | | $ | (109,375 | )(1) |
Swap contracts | | | 438,820 | (2) | | | — | |
| | |
Total | | $ | 448,585 | | | $ | (109,375 | ) |
| (1) | Amount represents cumulative unrealized appreciation or (depreciation) on futures contracts in the Futures Contracts table above. Only the current day’s variation margin on open futures contracts is reported within the Statement of Assets and Liabilities as Receivable or Payable for variation margin, as applicable. |
| (2) | Statement of Assets and Liabilities location: Receivable for open swap contracts; Net unrealized appreciation. |
The effect of derivative instruments (not considered to be hedging instruments for accounting disclosure purposes) on the Statement of Operations and whose primary underlying risk exposure is interest rate risk for the year ended October 31, 2012 was as follows:
| | | | | | | | |
| Derivative | | Realized Gain (Loss) on Derivatives Recognized in Income(1) | | | Change in Unrealized Appreciation (Depreciation) on Derivatives Recognized in Income(2) | |
| | |
Futures contracts | | $ | (6,338,523 | ) | | $ | 99,218 | |
Swap contracts | | $ | — | | | $ | 438,820 | |
| (1) | Statement of Operations location: Net realized gain (loss) – Financial futures contracts. |
| (2) | Statement of Operations location: Change in unrealized appreciation (depreciation) – Financial futures contracts and Swap contracts, respectively. |
The average notional amounts of futures contracts and swap contracts outstanding during the year ended October 31, 2012, which are indicative of the volume of these derivative types, were approximately $83,500,000 and $9,231,000, respectively.
6 Line of Credit
The Portfolio participates with other portfolios and funds managed by EVM and its affiliates in a $600 million unsecured line of credit agreement with a group of banks. Borrowings are made by the Portfolio solely to facilitate the handling of unusual and/or unanticipated short-term cash requirements. Interest is charged to the Portfolio based on its borrowings at an amount above either the Eurodollar rate or Federal Funds rate. In addition, a fee computed at an annual rate of 0.08% on the daily unused portion of the line of credit is allocated among the participating portfolios and funds at the end of each quarter. Because the line of credit is not available exclusively to the Portfolio, it may be unable to borrow some or all of its requested amounts at any particular time. The Portfolio did not have any significant borrowings or allocated fees during the year ended October 31, 2012.
7 Fair Value Measurements
Under generally accepted accounting principles for fair value measurements, a three-tier hierarchy to prioritize the assumptions, referred to as inputs, is used in valuation techniques to measure fair value. The three-tier hierarchy of inputs is summarized in the three broad levels listed below.
| Ÿ | | Level 1 – quoted prices in active markets for identical investments |
Short-Term U.S. Government Portfolio
October 31, 2012
Notes to Financial Statements — continued
| Ÿ | | Level 2 – other significant observable inputs (including quoted prices for similar investments, interest rates, prepayment speeds, credit risk, etc.) |
| Ÿ | | Level 3 – significant unobservable inputs (including a fund’s own assumptions in determining the fair value of investments) |
In cases where the inputs used to measure fair value fall in different levels of the fair value hierarchy, the level disclosed is determined based on the lowest level input that is significant to the fair value measurement in its entirety. The inputs or methodology used for valuing securities are not necessarily an indication of the risk associated with investing in those securities.
At October 31, 2012, the hierarchy of inputs used in valuing the Portfolio’s investments and open derivative instruments, which are carried at value, were as follows:
| | | | | | | | | | | | | | | | |
| Asset Description | | Level 1 | | | Level 2 | | | Level 3 | | | Total | |
| | | | |
Mortgage Pass-Throughs | | $ | — | | | $ | 193,017,646 | | | $ | — | | | $ | 193,017,646 | |
Collateralized Mortgage Obligations | | | — | | | | 47,709,468 | | | | — | | | | 47,709,468 | |
Commercial Mortgage-Backed Securities | | | — | | | | 271,572 | | | | — | | | | 271,572 | |
U.S. Government Agency Obligations | | | — | | | | 126,156,761 | | | | — | | | | 126,156,761 | |
Short-Term Investments | | | — | | | | 42,079,772 | | | | — | | | | 42,079,772 | |
| | | | |
Total Investments | | $ | — | | | $ | 409,235,219 | | | $ | — | | | $ | 409,235,219 | |
Futures Contracts | | $ | 9,765 | | | $ | — | | | $ | — | | | $ | 9,765 | |
Interest Rate Swaps | | | — | | | | 438,820 | | | | — | | | | 438,820 | |
| | | | |
Total | | $ | 9,765 | | | $ | 409,674,039 | | | $ | — | | | $ | 409,683,804 | |
| | | | |
Liability Description | | | | | | | | | | | | | | | | |
Futures Contracts | | $ | (109,375 | ) | | $ | — | | | $ | — | | | $ | (109,375 | ) |
| | | | |
Total | | $ | (109,375 | ) | | $ | — | | | $ | — | | | $ | (109,375 | ) |
The Portfolio held no investments or other financial instruments as of October 31, 2011 whose fair value was determined using Level 3 inputs. At October 31, 2012, there were no investments transferred between Level 1 and Level 2 during the year then ended.
Short-Term U.S. Government Portfolio
October 31, 2012
Report of Independent Registered Public Accounting Firm
To the Trustees and Investors of Short-Term U.S. Government Portfolio:
We have audited the accompanying statement of assets and liabilities of Short-Term U.S. Government Portfolio (the “Portfolio”), including the portfolio of investments, as of October 31, 2012, and the related statement of operations for the year then ended, the statements of changes in net assets for each of the two years in the period then ended, and the supplementary data for each of the five years in the period then ended. These financial statements and supplementary data are the responsibility of the Portfolio’s management. Our responsibility is to express an opinion on these financial statements and supplementary data based on our audits.
We conducted our audits in accordance with the standards of the Public Company Accounting Oversight Board (United States). Those standards require that we plan and perform the audit to obtain reasonable assurance about whether the financial statements and supplementary data are free of material misstatement. The Portfolio is not required to have, nor were we engaged to perform, an audit of its internal control over financial reporting. Our audits included consideration of internal control over financial reporting as a basis for designing audit procedures that are appropriate in the circumstances, but not for the purpose of expressing an opinion on the effectiveness of the Portfolio’s internal control over financial reporting. Accordingly, we express no such opinion. An audit also includes examining, on a test basis, evidence supporting the amounts and disclosures in the financial statements, assessing the accounting principles used and significant estimates made by management, as well as evaluating the overall financial statement presentation. Our procedures include confirmation of securities owned as of October 31, 2012, by correspondence with the custodian and brokers; where replies were not received from brokers, we performed other audit procedures. We believe that our audits provide a reasonable basis for our opinion.
In our opinion, such financial statements and supplementary data referred to above present fairly, in all material respects, the financial position of Short- Term U.S. Government Portfolio as of October 31, 2012, the results of its operations for the year then ended, the changes in its net assets for each of the two years in the period then ended, and the supplementary data for each of the five years in the period then ended, in conformity with accounting principles generally accepted in the United States of America.
DELOITTE & TOUCHE LLP
Boston, Massachusetts
December 20, 2012
Eaton Vance
Low Duration Government Income Fund
October 31, 2012
Management and Organization
Fund Management. The Trustees of Eaton Vance Mutual Funds Trust (the Trust), Floating Rate Portfolio (FRP), Government Obligations Portfolio (GOP), MSAR Completion Portfolio (MSARCP), Short Duration High Income Portfolio (SDHIP) and Short-Term U.S. Government Portfolio (STUSGP) (collectively, the Portfolios) are responsible for the overall management and supervision of the Trust’s and Portfolios’ affairs. The Trustees and officers of the Trust and the Portfolios are listed below. Except as indicated, each individual has held the office shown or other offices in the same company for the last five years. Trustees and officers of the Trust and the Portfolios hold indefinite terms of office. The “Noninterested Trustees” consist of those Trustees who are not “interested persons” of the Trust and the Portfolios, as that term is defined under the 1940 Act. The business address of each Trustee and officer is Two International Place, Boston, Massachusetts 02110. As used below, “EVC” refers to Eaton Vance Corp., “EV” refers to Eaton Vance, Inc., “EVM” refers to Eaton Vance Management, “BMR” refers to Boston Management and Research and “EVD” refers to Eaton Vance Distributors, Inc. EVC and EV are the corporate parent and trustee, respectively, of EVM and BMR. EVD is the Fund’s principal underwriter, the Portfolios’ placement agent and a wholly-owned subsidiary of EVC. Each officer affiliated with Eaton Vance may hold a position with other Eaton Vance affiliates that is comparable to his or her position with EVM listed below. Each Trustee oversees 187 portfolios in the Eaton Vance Complex (including all master and feeder funds in a master feeder structure). Each officer serves as an officer of certain other Eaton Vance funds. Each Trustee and officer serves until his or her successor is elected.
| | | | | | |
| Name and Year of Birth | | Position(s)
with the
Trust and the Portfolios | | Length of Service | | Principal Occupation(s) and Directorships During Past Five Years and Other Relevant Experience |
Interested Trustee |
| | | |
Thomas E. Faust Jr. 1958 | | Trustee | | Of the Trust, FRP, GOP and STUSGP since 2007, of MSARCP since 2010 and of SDHIP since 2012 | | Chairman, Chief Executive Officer and President of EVC, Director and President of EV, Chief Executive Officer and President of EVM and BMR, and Director of EVD. Trustee and/or officer of 187 registered investment companies. Mr. Faust is an interested person because of his positions with EVM, BMR, EVD, EVC and EV, which are affiliates of the Trust and the Portfolios. Directorships in the Last Five Years.(1) Director of EVC and Hexavest Inc. |
| | | |
| | | | | | |
Noninterested Trustees |
| | | |
Scott E. Eston 1956 | | Trustee | | Of the Trust and of each Portfolio except SDHIP since 2011 and of SDHIP since 2012 | | Private investor. Formerly held various positions at Grantham, Mayo, Van Otterloo and Co., L.L.C. (investment management firm) (1997-2009), including Chief Operating Officer (2002-2009), Chief Financial Officer (1997-2009) and Chairman of the Executive Committee (2002-2008); President and Principal Executive Officer, GMO Trust (open-end registered investment company) (2006-2009). Former Partner, Coopers and Lybrand L.L.P. (now PricewaterhouseCoopers) (public accounting firm) (1987-1997). Directorships in the Last Five Years. None. |
| | | |
Benjamin C. Esty 1963 | | Trustee | | Of the Trust, FRP, GOP and STUSGP since 2005, of MSARCP since 2010 and of SDHIP since 2012 | | Roy and Elizabeth Simmons Professor of Business Administration and Finance Unit Head, Harvard University Graduate School of Business Administration. Directorships in the Last Five Years.(1) None. |
| | | |
Allen R. Freedman 1940 | | Trustee | | Of the Trust, FRP, GOP and STUSGP since 2007, of MSARCP since 2010 and of SDHIP since 2012 | | Private Investor. Former Chairman (2002-2004) and a Director (1983-2004) of Systems & Computer Technology Corp. (provider of software to higher education). Formerly, a Director of Loring Ward International (fund distributor) (2005-2007). Former Chairman and a Director of Indus International, Inc. (provider of enterprise management software to the power generating industry) (2005-2007). Former Chief Executive Officer of Assurant, Inc. (insurance provider) (1979-2000). Directorships in the Last Five Years.(1) Director of Stonemor Partners, L.P. (owner and operator of cemeteries). Formerly, Director of Assurant, Inc. (insurance provider) (1979-2011). |
Eaton Vance
Low Duration Government Income Fund
October 31, 2012
Management and Organization — continued
| | | | | | |
| Name and Year of Birth | | Position(s)
with the
Trust and the Portfolios | | Length of Service | | Principal Occupation(s) and Directorships During Past Five Years and Other Relevant Experience |
Noninterested Trustees (continued) |
| | | |
William H. Park 1947 | | Trustee | | Of the Trust, FRP, GOP and STUSGP since 2003, of MSARCP since 2010 and of SDHIP since 2012 | | Consultant and private investor. Formerly, Chief Financial Officer, Aveon Group L.P. (investment management firm) (2010-2011). Formerly, Vice Chairman, Commercial Industrial Finance Corp. (specialty finance company) (2006-2010). Formerly, President and Chief Executive Officer, Prizm Capital Management, LLC (investment management firm) (2002-2005). Formerly, Executive Vice President and Chief Financial Officer, United Asset Management Corporation (investment management firm) (1982-2001). Formerly, Senior Manager, Price Waterhouse (now PricewaterhouseCoopers) (an independent registered public accounting firm) (1972-1981). Directorships in the Last Five Years.(1) None. |
| | | |
Ronald A. Pearlman 1940 | | Trustee | | Of the Trust, FRP, GOP and STUSGP since 2003, of MSARCP since 2010 and of SDHIP since 2012 | | Professor of Law, Georgetown University Law Center. Formerly, Deputy Assistant Secretary (Tax Policy) and Assistant Secretary (Tax Policy), U.S. Department of the Treasury (1983-1985). Formerly, Chief of Staff, Joint Committee on Taxation, U.S. Congress (1988-1990). Directorships in the Last Five Years.(1) None. |
| | | |
Helen Frame Peters 1948 | | Trustee | | Of the Trust, FRP, GOP and STUSGP since 2008, of MSARCP since 2010 and of SDHIP since 2012 | | Professor of Finance, Carroll School of Management, Boston College. Formerly, Dean, Carroll School of Management, Boston College (2000-2002). Formerly, Chief Investment Officer, Fixed Income, Scudder Kemper Investments (investment management firm) (1998-1999). Formerly, Chief Investment Officer, Equity and Fixed Income, Colonial Management Associates (investment management firm) (1991-1998). Directorships in the Last Five Years.(1) Formerly, Director of BJ’s Wholesale Club, Inc. (wholesale club retailer) (2004-2011). Formerly, Trustee of SPDR Index Shares Funds and SPDR Series Trust (exchange traded funds) (2000-2009). Formerly, Director of Federal Home Loan Bank of Boston (a bank for banks) (2007-2009). |
| | | |
Lynn A. Stout 1957 | | Trustee | | Of the Trust and GOP since 1998, of FRP since 2000, of STUSGP since 2002, of MSARCP since 2010 and of SDHIP since 2012 | | Distinguished Professor of Corporate and Business Law, Jack G. Clarke Business Law Institute, Cornell University Law School. Formerly, the Paul Hastings Professor of Corporate and Securities Law (2006-2012) and Professor of Law (2001-2006), University of California at Los Angeles School of Law. Directorships in the Last Five Years.(1) None. |
| | | |
Harriett Tee Taggart 1948 | | Trustee | | Of the Trust and of each Portfolio except SDHIP since 2011 and of SDHIP since 2012 | | Managing Director, Taggart Associates (a professional practice firm). Formerly, Partner and Senior Vice President, Wellington Management Company, LLP (investment management firm) (1983-2006). Directorships in the Last Five Years. Director of Albemarle Corporation (chemicals manufacturer) (since 2007) and The Hanover Group (specialty property and casualty insurance company) (since 2009). Formerly, Director of Lubrizol Corporation (specialty chemicals) (2007-2011). |
| | | |
Ralph F. Verni 1943 | | Chairman of the Board and Trustee | | Chairman of the Board since 2007 and Trustee of the Trust, FRP, GOP and STUSGP since 2005, of MSARCP since 2010 and of SDHIP since 2012 | | Consultant and private investor. Formerly, Chief Investment Officer (1982-1992), Chief Financial Officer (1988-1990) and Director (1982-1992), New England Life. Formerly, Chairperson, New England Mutual Funds (1982-1992). Formerly, President and Chief Executive Officer, State Street Management & Research (1992-2000). Formerly, Chairperson, State Street Research Mutual Funds (1992-2000). Formerly, Director, W.P. Carey, LLC (1998-2004) and First Pioneer Farm Credit Corp. (2002-2006). Directorships in the Last Five Years.(1) None. |
Eaton Vance
Low Duration Government Income Fund
October 31, 2012
Management and Organization — continued
| | | | | | |
Principal Officers who are not Trustees |
| Name and Year of Birth | | Position(s)
with the
Trust and the Portfolios | | Length of Service | | Principal Occupation(s) During Past Five Years |
Duncan W. Richardson 1957 | | President of the Trust | | Since 2011 | | Director of EVC and Executive Vice President and Chief Equity Investment Officer of EVC, EVM and BMR. |
| | | |
Scott H. Page 1959 | | President of FRP | | Since 2007 | | Vice President of EVM and BMR. |
| | | |
Susan Schiff 1961 | | President of GOP and STUSGP | | Since 2012 | | Vice President of EVM and BMR. |
| | | |
Payson F. Swaffield 1956 | | President of MSARCP and Vice President of the Trust, FRP, GOP, SDHIP and STUSGP | | President of MSARCP since 2010 and Vice President of the Trust, FRP, GOP and STUSGP since 2011 and of SDHIP since 2012 | | Vice President and Chief Income Investment Officer of EVM and BMR. |
| | | |
Michael W. Weilheimer 1961 | | President of SDHIP | | Since 2012 | | Vice President of EVM and BMR. |
| | | |
Barbara E. Campbell 1957 | | Treasurer | | Of the Trust since 2005, of FRP, GOP and STUSGP since 2008, of MSARCP since 2010 and of SDHIP since 2012 | | Vice President of EVM and BMR. |
| | | |
Maureen A. Gemma 1960 | | Vice President, Secretary and Chief Legal Officer | | Vice President of the Trust and each Portfolio except SDHIP since 2011 and of SDHIP since 2012; Secretary of the Trust, FRP, GOP and STUSGP since 2007, of MSARCP since 2010 and of SDHIP since 2012; and Chief Legal Officer of the Trust, FRP, GOP and STUSGP since 2008, of MSARCP since 2010 and of SDHIP since 2012 | | Vice President of EVM and BMR. |
Eaton Vance
Low Duration Government Income Fund
October 31, 2012
Management and Organization — continued
| | | | | | |
| Name and Year of Birth | | Position(s)
with the
Trust and the Portfolios | | Length of Service | | Principal Occupation(s) During Past Five Years |
Principal Officers who are not Trustees (continued) |
| | | |
Paul M. O’Neil 1953 | | Chief Compliance Officer | | Of the Trust, FRP, GOP and STUSGP since 2004, of MSARCP since 2010 and of SDHIP since 2012 | | Vice President of EVM and BMR. |
| (1) | During their respective tenures, the Trustees (except Mr. Eston and Ms. Taggart) also served as trustees of one or more of the following Eaton Vance funds (which operated in the years noted): Eaton Vance Credit Opportunities Fund (launched in 2005 and terminated in 2010); Eaton Vance Insured Florida Plus Municipal Bond Fund (launched in 2002 and terminated in 2009); and Eaton Vance National Municipal Income Trust (launched in 1998 and terminated in 2009). |
The SAI for the Fund includes additional information about the Trustees and officers of the Fund and the Portfolios and can be obtained without charge on Eaton Vance’s website at www.eatonvance.com or by calling 1-800-262-1122.
Eaton Vance Funds
IMPORTANT NOTICES
Privacy. The Eaton Vance organization is committed to ensuring your financial privacy. Each of the financial institutions identified below has in effect the following policy (“Privacy Policy”) with respect to nonpublic personal information about its customers:
| Ÿ | | Only such information received from you, through application forms or otherwise, and information about your Eaton Vance fund transactions will be collected. This may include information such as name, address, social security number, tax status, account balances and transactions. |
| Ÿ | | None of such information about you (or former customers) will be disclosed to anyone, except as permitted by law (which includes disclosure to employees necessary to service your account). In the normal course of servicing a customer’s account, Eaton Vance may share information with unaffiliated third parties that perform various required services such as transfer agents, custodians and broker-dealers. |
| Ÿ | | Policies and procedures (including physical, electronic and procedural safeguards) are in place that are designed to protect the confidentiality of such information. |
| Ÿ | | We reserve the right to change our Privacy Policy at any time upon proper notification to you. Customers may want to review our Privacy Policy periodically for changes by accessing the link on our homepage: www.eatonvance.com. |
Our pledge of privacy applies to the following entities within the Eaton Vance organization: the Eaton Vance Family of Funds, Eaton Vance Management, Eaton Vance Investment Counsel, Eaton Vance Distributors, Inc., Eaton Vance Trust Company, Eaton Vance Management’s Real Estate Investment Group and Boston Management and Research. In addition, our Privacy Policy applies only to those Eaton Vance customers who are individuals and who have a direct relationship with us. If a customer’s account (i.e., fund shares) is held in the name of a third-party financial advisor/broker-dealer, it is likely that only such advisor’s privacy policies apply to the customer. This notice supersedes all previously issued privacy disclosures. For more information about Eaton Vance’s Privacy Policy, please call 1-800-262-1122.
Delivery of Shareholder Documents. The Securities and Exchange Commission (SEC) permits funds to deliver only one copy of shareholder documents, including prospectuses, proxy statements and shareholder reports, to fund investors with multiple accounts at the same residential or post office box address. This practice is often called “householding” and it helps eliminate duplicate mailings to shareholders. Eaton Vance, or your financial advisor, may household the mailing of your documents indefinitely unless you instruct Eaton Vance, or your financial advisor, otherwise. If you would prefer that your Eaton Vance documents not be householded, please contact Eaton Vance at 1-800-262-1122, or contact your financial advisor. Your instructions that householding not apply to delivery of your Eaton Vance documents will be effective within 30 days of receipt by Eaton Vance or your financial advisor.
Portfolio Holdings. Each Eaton Vance Fund and its underlying Portfolio(s) (if applicable) will file a schedule of portfolio holdings on Form N-Q with the SEC for the first and third quarters of each fiscal year. The Form N-Q will be available on the Eaton Vance website at www.eatonvance.com, by calling Eaton Vance at 1-800-262-1122 or in the EDGAR database on the SEC’s website at www.sec.gov. Form N-Q may also be reviewed and copied at the SEC’s public reference room in Washington, D.C. (call 1-800-732-0330 for information on the operation of the public reference room).
Proxy Voting. From time to time, funds are required to vote proxies related to the securities held by the funds. The Eaton Vance Funds or their underlying Portfolios (if applicable) vote proxies according to a set of policies and procedures approved by the Funds’ and Portfolios’ Boards. You may obtain a description of these policies and procedures and information on how the Funds or Portfolios voted proxies relating to portfolio securities during the most recent 12-month period ended June 30, without charge, upon request, by calling 1-800-262-1122 and by accessing the SEC’s website at www.sec.gov.
This Page Intentionally Left Blank
This Page Intentionally Left Blank
Investment Adviser of Short-Term U.S. Government Portfolio
Boston Management and Research
Two International Place
Boston, MA 02110
Investment Adviser and Administrator of Eaton Vance Low Duration Government Income Fund
Eaton Vance Management
Two International Place
Boston, MA 02110
Principal Underwriter*
Eaton Vance Distributors, Inc.
Two International Place
Boston, MA 02110
(617) 482-8260
Custodian
State Street Bank and Trust Company
200 Clarendon Street
Boston, MA 02116
Transfer Agent
BNY Mellon Investment Servicing (US) Inc.
Attn: Eaton Vance Funds
P.O. Box 9653
Providence, RI 02940-9653
(800) 262-1122
Independent Registered Public Accounting Firm
Deloitte & Touche LLP
200 Berkeley Street
Boston, MA 02116-5022
Fund Offices
Two International Place
Boston, MA 02110
| * | FINRA BrokerCheck. Investors may check the background of their Investment Professional by contacting the Financial Industry Regulatory Authority (FINRA). FINRA BrokerCheck is a free tool to help investors check the professional background of current and former FINRA-registered securities firms and brokers. FINRA BrokerCheck is available by calling 1-800-289-9999 and at www.FINRA.org. The FINRA BrokerCheck brochure describing this program is available to investors at www.FINRA.org. |
1560-12/12 LDSRC
| | |
Eaton Vance Global Macro Absolute Return Advantage Fund Annual Report October 31, 2012 | | 
|

Fund shares are not insured by the FDIC and are not deposits or other obligations of, or guaranteed by, any depository institution. Shares are subject to investment risks, including possible loss of principal invested.
This report must be preceded or accompanied by a current summary prospectus or prospectus. Before investing, investors should consider carefully the investment objective, risks, and charges and expenses of a mutual fund. This and other important information is contained in the summary prospectus and prospectus, which can be obtained from a financial advisor. Prospective investors should read the prospectus carefully before investing. For further information, please call 1-800-262-1122.
Annual Report October 31, 2012
Eaton Vance
Global Macro Absolute Return Advantage Fund
Table of Contents
| | | | |
Management’s Discussion of Fund Performance | | | 2 | |
| |
Performance | | | 3 | |
| |
Fund Profile | | | 4 | |
| |
Endnotes and Additional Disclosures | | | 5 | |
| |
Fund Expenses | | | 6 | |
| |
Financial Statements | | | 7 | |
| |
Report of Independent Registered Public Accounting Firm | | | 18 and 54 | |
| |
Federal Tax Information | | | 19 | |
| |
Management and Organization | | | 55 | |
| |
Important Notices | | | 58 | |
Eaton Vance
Global Macro Absolute Return Advantage Fund
October 31, 2012
Management’s Discussion of Fund Performance1
Economic and Market Conditions
The 12-month period ending October 31, 2012 was a year dominated by central bank easing. The most aggressive action took place in developed-market countries that are burdened with debt. The European Central Bank (ECB) offered low-interest, three-year loans to banks, as the region’s debt crisis made it difficult for banks to fund their operations in the public markets. The ECB also cut its main interest rate three times, to a record low of 0.75%, and unveiled a plan to buy bonds of troubled eurozone governments. With their key policy rates already near zero, the U.S. Federal Reserve (the Fed), Bank of Japan and Bank of England relied on quantitative easing to try to reduce longer-term borrowing costs and spur economic growth. In addition, the Fed continued with “Operation Twist,” a stimulus program that was set to expire in June 2012 but that was extended through the end of 2012.
In the United States, gross domestic product (GDP) growth slid from an annual rate of 4.1% in the fourth quarter of 2011 to 2.7% or less in each of the next three quarters. Growth in Germany and Japan also decelerated, Spain and Italy entered recession, and France appeared to be heading in that direction. Latin American and emerging Asian economies grew faster than their developed-market counterparts. However, their growth rates slowed, causing central banks in Brazil, China and other countries in these regions to reduce interest rates.
The world’s bond markets generally posted positive returns during the fiscal year. Higher-risk securities delivered some of the strongest gains, as investors chased yield in the low-rate environment. For example, local bond prices appreciated throughout much of the emerging world. In the foreign exchange markets, most Latin American and Asian currencies strengthened versus the U.S. dollar, and most Central and Eastern European currencies strengthened versus the euro. On a total return basis, the Mexican peso and Philippine peso did especially well versus the U.S. dollar, while the Polish zloty was a standout performer versus the euro.
Fund Performance
For the fiscal year ending October, 31, 2012, Eaton Vance Global Macro Absolute Return Advantage Fund’s (the Fund) Class A shares at net asset value (NAV) had a total return of 4.79%. By comparison, the Fund’s benchmark, the BofA Merrill Lynch 3-Month U.S. Treasury Bill Index (the Index)2, gained 0.08% during the period.
In Asia, the Fund benefited from long positions in several currencies, particularly the Philippine peso. The peso appreciated on reports of better-than-expected economic growth in the Philippines and a narrowing of the country’s budget deficit. Alternatively, a short position in the Japanese yen was unfavorable given the attraction of the yen as a safe-haven currency, as well as positive real rates of return on Japanese government bonds.
In Central and Eastern Europe, exposure to euro-denominated Polish debt was helpful. Poland has been working to meet the Maastricht Treaty criteria so that it can join the eurozone, and these efforts have strengthened the country’s economic fundamentals. In Western Europe, the Fund was short eurozone sovereign credit. A short position in Spain added to performance versus the Index because of Spain’s ongoing debt problems. However, a short position in France detracted from performance versus the Index, as the French credit remained strong during the period due to technical reasons.
One of the biggest contributors in Latin America was a long position in the Mexican peso. Mexico had elections in July 2012, and investors were optimistic that the new administration would institute reforms to improve the country’s long-run economic growth potential. On the negative side, a short position in Argentinian credit default swaps did poorly. The cost to insure Argentina’s bonds spiked near the end of the period due to a surprise court ruling related to the country’s debt restructuring of several years ago.
In Africa, both long and short currency positions contributed to the Fund’s return, although a long position in the Nigerian naira was particularly helpful. Nigeria’s government bills had strong yields, and the country saw increased capital flows based on its ability to export oil. Furthermore, its debt was added to key benchmark indices in the latter part of the fiscal year.
The Fund’s commodity exposure did not have a meaningful impact on performance versus the Index. The Fund was long platinum and short gold, and both precious metals posted relatively flat returns during the period.
See Endnotes and Additional Disclosures in this report.
Past performance is no guarantee of future results. Returns are historical and are calculated by determining the percentage change in net asset value (NAV) or offering price (as applicable) with all distributions reinvested. Investment return and principal value will fluctuate so that shares, when redeemed, may be worth more or less than their original cost. Performance less than one year is cumulative. Performance is for the stated time period only; due to market volatility, the Fund’s current performance may be lower or higher than quoted. Returns are before taxes unless otherwise noted. For performance as of the most recent month end, please refer to www.eatonvance.com.
Eaton Vance
Global Macro Absolute Return Advantage Fund
October 31, 2012
Performance2,3
Portfolio Managers John R. Baur, Michael A. Cirami, CFA and Eric Stein, CFA
| | | | | | | | | | | | | | | | |
| % Average Annual Total Returns | | | | | Inception Date | | | One Year | | | Since
Inception | |
Class A at NAV | | | | | | | 08/31/2010 | | | | 4.79 | % | | | 2.50 | % |
Class A with 4.75% Maximum Sales Charge | | | | | | | — | | | | –0.18 | | | | 0.22 | |
Class C at NAV | | | | | | | 08/31/2010 | | | | 4.02 | | | | 1.82 | |
Class C with 1% Maximum Sales Charge | | | | | | | — | | | | 3.02 | | | | 1.82 | |
Class I at NAV | | | | | | | 08/31/2010 | | | | 5.09 | | | | 2.82 | |
Class R at NAV | | | | | | | 12/01/2010 | | | | 4.48 | | | | 2.09 | |
BofA Merrill Lynch 3-Month U.S. Treasury Bill Index | | | | | | | 08/31/2010 | | | | 0.08 | % | | | 0.11 | % |
| | | | |
| | | | | | | | | | | | | | | | |
| % Total Annual Operating Expense Ratios4 | | Class A | | | Class C | | | Class I | | | Class R | |
Gross | | | 1.87 | % | | | 2.56 | % | | | 1.57 | % | | | 2.17 | % |
Net | | | 1.55 | | | | 2.25 | | | | 1.25 | | | | 1.75 | |
Performance of $250,000
This graph shows the change in value of a hypothetical investment of $250,000 in Class I of the Fund for the period indicated. For comparison, the same investment is shown in the indicated index.
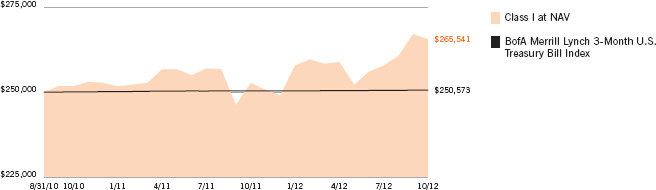
| | | | | | | | |
| Performance of Investment | | Amount
Invested | | Period
Beginning | | At NAV | | With Maximum
Sales Charge |
Class A | | $ 10,000 | | 08/31/2010 | | $10,549 | | $10,047 |
Class C | | $ 10,000 | | 08/31/2010 | | $10,400 | | N.A. |
Class R | | $10,000 | | 12/01/2010 | | $10,404 | | N.A. |
See Endnotes and Additional Disclosures in this report.
Past performance is no guarantee of future results. Returns are historical and are calculated by determining the percentage change in net asset value (NAV) or offering price (as applicable) with all distributions reinvested. Investment return and principal value will fluctuate so that shares, when redeemed, may be worth more or less than their original cost. Performance less than one year is cumulative. Performance is for the stated time period only; due to market volatility, the Fund’s current performance may be lower or higher than quoted. Returns are before taxes unless otherwise noted. For performance as of the most recent month end, please refer to www.eatonvance.com.
Eaton Vance
Global Macro Absolute Return Advantage Fund
October 31, 2012
Fund Profile5
Asset Allocation (% of net assets)6
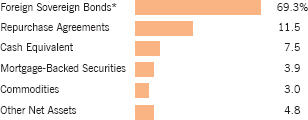
| * | Net securities sold short. |
Foreign Currency Exposure (% of net assets)7
| | | | | | | | | | |
India | �� | | 13.6 | % | | Sri Lanka | | | 3.6 | % |
Malaysia | | | 10.0 | | | Poland | | | 3.0 | |
China | | | 9.9 | | | Georgia | | | 2.4 | |
Serbia | | | 9.6 | | | Peru | | | 2.0 | |
Nigeria | | | 9.2 | | | Ghana | | | 0.4 | |
Mexico | | | 9.0 | | | New Zealand | | | 0.2 | |
South Korea | | | 8.1 | | | Hong Kong | | | 0.1 | |
Turkey | | | 6.3 | | | United Kingdom | | | 0.0 | * |
Philippines | | | 5.7 | | | Hungary | | | -0.1 | |
Platinum | | | 5.1 | | | Gold | | | -1.0 | |
Singapore | | | 4.1 | | | South Africa | | | -3.9 | |
Brazil | | | 4.1 | | | Japan | | | -4.6 | |
Norway | | | 3.9 | | | Australia | | | -5.6 | |
Sweden | | | 3.9 | | | Taiwan | | | -9.6 | |
| | | | | | Euro | | | -29.5 | |
| | | | | | | |
| | | | | | Total Long | | | 114.2 | |
| | | | | | | |
| | | | | | Total Short | | | -54.3 | |
| | | | | | | |
| | | | | | Total Net | | | 59.9 | |
| | | | | | | |
| * | Amount is less than 0.05%. |
See Endnotes and Additional Disclosures in this report.
Eaton Vance
Global Macro Absolute Return Advantage Fund
October 31, 2012
Endnotes and Additional Disclosures
| 1 | The views expressed in this report are those of the portfolio manager(s) and are current only through the date stated at the top of this page. These views are subject to change at any time based upon market or other conditions, and Eaton Vance and the Fund(s) disclaim any responsibility to update such views. These views may not be relied upon as investment advice and, because investment decisions are based on many factors, may not be relied upon as an indication of trading intent on behalf of any Eaton Vance fund. This commentary may contain statements that are not historical facts, referred to as “forward looking statements”. The Fund’s actual future results may differ significantly from those stated in any forward looking statement, depending on factors such as changes in securities or financial markets or general economic conditions, the volume of sales and purchases of Fund shares, the continuation of investment advisory, administrative and service contracts, and other risks discussed from time to time in the Fund’s filings with the Securities and Exchange Commission. |
| 2 | BofA Merrill Lynch 3-Month U.S. Treasury Bill Index is an unmanaged index of U.S. Treasury securities maturing in 90 days. BofA Merrill Lynch® indices not for redistribution or other uses; provided “as is”, without warranties, and with no liability. Eaton Vance has prepared this report, BofAML does not endorse it, or guarantee, review, or endorse Eaton Vance’s products. Unless otherwise stated, index returns do not reflect the effect of any applicable sales charges, commissions, expenses, taxes or leverage, as applicable. It is not possible to invest directly in an index. |
| 3 | Total Returns at NAV do not include applicable sales charges. If sales charges were deducted, the returns would be lower. Total Returns shown with maximum sales charge reflect the stated maximum sales charge. Unless otherwise stated, performance does not reflect the deduction of taxes on Fund distributions or redemptions of Fund shares. |
| 4 | The Gross Expense Ratios are as stated in the Fund’s most recent prospectus. Net expense ratios exclude interest expenses associated with certain investment transactions. Net expense ratios reflect contractual expense reimbursements that continue through 2/28/13. Without the reimbursements, performance would have been lower. |
| 5 | Fund primarily invests in an affiliated investment company (Portfolio) with the same objective(s) and policies as the Fund and may also invest directly. Unless otherwise noted, references to investments are to the aggregate holdings of the Fund and the Portfolio. |
| 6 | Other net assets represents other assets less liabilities and includes investment types, if any, each less than 1% of net assets. See Statement of Assets and Liabilities for details. |
| 7 | Currency exposures include all foreign exchange denominated assets, currency derivatives and commodities (including commodity derivatives). Total exposures may exceed 100% due to implicit leverage created by derivatives. |
| | Fund profile subject to change due to active management. |
Eaton Vance
Global Macro Absolute Return Advantage Fund
October 31, 2012
Fund Expenses
Example: As a Fund shareholder, you incur two types of costs: (1) transaction costs, including sales charges (loads) on purchases and redemption fees (if applicable); and (2) ongoing costs, including management fees; distribution and/or service fees; and other Fund expenses. This Example is intended to help you understand your ongoing costs (in dollars) of Fund investing and to compare these costs with the ongoing costs of investing in other mutual funds. The Example is based on an investment of $1,000 invested at the beginning of the period and held for the entire period (May 1, 2012 – October 31, 2012).
Actual Expenses: The first section of the table below provides information about actual account values and actual expenses. You may use the information in this section, together with the amount you invested, to estimate the expenses that you paid over the period. Simply divide your account value by $1,000 (for example, an $8,600 account value divided by $1,000 = 8.6), then multiply the result by the number in the first section under the heading entitled “Expenses Paid During Period” to estimate the expenses you paid on your account during this period.
Hypothetical Example for Comparison Purposes: The second section of the table below provides information about hypothetical account values and hypothetical expenses based on the actual Fund expense ratio and an assumed rate of return of 5% per year (before expenses), which is not the actual Fund return. The hypothetical account values and expenses may not be used to estimate the actual ending account balance or expenses you paid for the period. You may use this information to compare the ongoing costs of investing in your Fund and other funds. To do so, compare this 5% hypothetical example with the 5% hypothetical examples that appear in the shareholder reports of the other funds.
Please note that the expenses shown in the table are meant to highlight your ongoing costs only and do not reflect any transactional costs, such as sales charges (loads) or redemption fees (if applicable). Therefore, the second section of the table is useful in comparing ongoing costs only, and will not help you determine the relative total costs of owning different funds. In addition, if these transactional costs were included, your costs would be higher.
| | | | | | | | | | | | | | | | |
| | | Beginning
Account Value
(5/1/12) | | | Ending
Account Value
(10/31/12) | | | Expenses Paid
During Period*
(5/1/12 – 10/31/12) | | | Annualized
Expense
Ratio | |
| | | | |
| | | | | | | | | | | | | | | | |
Actual | | | | | | | | | | | | | |
Class A | | $ | 1,000.00 | | | $ | 1,023.90 | | | $ | 10.43 | ** | | | 2.05 | % |
Class C | | $ | 1,000.00 | | | $ | 1,020.10 | | | $ | 13.96 | ** | | | 2.75 | % |
Class I | | $ | 1,000.00 | | | $ | 1,025.90 | | | $ | 8.91 | ** | | | 1.75 | % |
Class R | | $ | 1,000.00 | | | $ | 1,022.00 | | | $ | 11.44 | ** | | | 2.25 | % |
| | | | | | | | | | | | | | | | | |
| | | | |
| | | | | | | | | | | | | | | | |
Hypothetical | | | | | | | | | | | | | |
(5% return per year before expenses) | | | | | | | | | | | | | |
Class A | | $ | 1,000.00 | | | $ | 1,014.80 | | | $ | 10.38 | ** | | | 2.05 | % |
Class C | | $ | 1,000.00 | | | $ | 1,011.30 | | | $ | 13.90 | ** | | | 2.75 | % |
Class I | | $ | 1,000.00 | | | $ | 1,016.30 | | | $ | 8.87 | ** | | | 1.75 | % |
Class R | | $ | 1,000.00 | | | $ | 1,013.80 | | | $ | 11.39 | ** | | | 2.25 | % |
| * | Expenses are equal to the Fund’s annualized expense ratio for the indicated Class, multiplied by the average account value over the period, multiplied by 184/366 (to reflect the one-half year period). The Example assumes that the $1,000 was invested at the net asset value per share determined at the close of business on April 30, 2012. The Example reflects the expenses of both the Fund and the Portfolio. |
| ** | Absent an allocation of certain expenses to an affiliate, expenses would be higher. |
Eaton Vance
Global Macro Absolute Return Advantage Fund
October 31, 2012
Statement of Assets and Liabilities
| | | | |
| Assets | | October 31, 2012 | |
Investment in Global Macro Absolute Return Advantage Portfolio, at value (identified cost, $800,433,670) | | $ | 792,230,081 | |
Receivable for Fund shares sold | | | 1,801,636 | |
Total assets | | $ | 794,031,717 | |
| |
| Liabilities | | | | |
Payable for Fund shares redeemed | | $ | 945,167 | |
Payable to affiliates: | | | | |
Distribution and service fees | | | 148,447 | |
Trustees’ fees | | | 42 | |
Due to Affiliate | | | 23,588 | |
Accrued expenses | | | 186,763 | |
Total liabilities | | $ | 1,304,007 | |
Net Assets | | $ | 792,727,710 | |
| |
| Sources of Net Assets | | | | |
Paid-in capital | | $ | 773,884,235 | |
Accumulated net realized gain from Portfolio | | | 37,280,189 | |
Accumulated distributions in excess of net investment income | | | (10,233,125 | ) |
Net unrealized depreciation from Portfolio | | | (8,203,589 | ) |
Total | | $ | 792,727,710 | |
| |
| Class A Shares | | | | |
Net Assets | | $ | 243,609,332 | |
Shares Outstanding | | | 23,740,744 | |
Net Asset Value and Redemption Price Per Share | | | | |
(net assets ÷ shares of beneficial interest outstanding) | | $ | 10.26 | |
Maximum Offering Price Per Share | | | | |
(100 ÷ 95.25 of net asset value per share) | | $ | 10.77 | |
| |
| Class C Shares | | | | |
Net Assets | | $ | 98,230,050 | |
Shares Outstanding | | | 9,657,613 | |
Net Asset Value and Offering Price Per Share* | | | | |
(net assets ÷ shares of beneficial interest outstanding) | | $ | 10.17 | |
| |
| Class I Shares | | | | |
Net Assets | | $ | 448,056,790 | |
Shares Outstanding | | | 43,509,501 | |
Net Asset Value, Offering Price and Redemption Price Per Share | | | | |
(net assets ÷ shares of beneficial interest outstanding) | | $ | 10.30 | |
| |
| Class R Shares | | | | |
Net Assets | | $ | 2,831,538 | |
Shares Outstanding | | | 277,175 | |
Net Asset Value, Offering Price and Redemption Price Per Share | | | | |
(net assets ÷ shares of beneficial interest outstanding) | | $ | 10.22 | |
| On | sales of $50,000 or more, the offering price of Class A shares is reduced. |
| * | Redemption price per share is equal to the net asset value less any applicable contingent deferred sales charge. |
| | | | |
| | 7 | | See Notes to Financial Statements. |
Eaton Vance
Global Macro Absolute Return Advantage Fund
October 31, 2012
Statement of Operations
| | | | |
| Investment Income | | Year Ended
October 31, 2012 | |
Interest allocated from Portfolio (net of foreign taxes, $176,076) | | $ | 46,292,693 | |
Dividends allocated from Portfolio (net of foreign taxes, $11,342) | | | 171,749 | |
Expenses allocated from Portfolio | | | (12,752,904 | ) |
Total investment income from Portfolio | | $ | 33,711,538 | |
| |
| Expenses | | | | |
Distribution and service fees | | | | |
Class A | | $ | 729,162 | |
Class C | | | 1,058,447 | |
Class R | | | 11,216 | |
Trustees’ fees and expenses | | | 500 | |
Custodian fee | | | 38,236 | |
Transfer and dividend disbursing agent fees | | | 570,220 | |
Legal and accounting services | | | 46,859 | |
Printing and postage | | | 77,607 | |
Registration fees | | | 53,701 | |
Miscellaneous | | | 15,180 | |
Total expenses | | $ | 2,601,128 | |
| |
Net investment income | | $ | 31,110,410 | |
| |
| Realized and Unrealized Gain (Loss) from Portfolio | | | | |
Net realized gain (loss) — | | | | |
Investment transactions (including a gain of $50,029 from precious metals) | | $ | (29,998,986 | ) |
Securities sold short | | | 2,395,177 | |
Futures contracts | | | 3,774,344 | |
Swap contracts | | | (4,750,813 | ) |
Forward commodity contracts | | | (90,106 | ) |
Foreign currency and forward foreign currency exchange contract transactions | | | 40,395,733 | |
Net realized gain | | $ | 11,725,349 | |
Change in unrealized appreciation (depreciation) — | | | | |
Investments (including net decrease of $308,090 from precious metals) | | $ | 28,195,981 | |
Written options | | | 2,554,742 | |
Securities sold short | | | (7,884,423 | ) |
Futures contracts | | | (2,990,626 | ) |
Swap contracts | | | (12,353,461 | ) |
Forward commodity contracts | | | 194,368 | |
Foreign currency and forward foreign currency exchange contracts | | | (14,344,105 | ) |
Net change in unrealized appreciation (depreciation) | | $ | (6,627,524 | ) |
| |
Net realized and unrealized gain | | $ | 5,097,825 | |
| |
Net increase in net assets from operations | | $ | 36,208,235 | |
| | | | |
| | 8 | | See Notes to Financial Statements. |
Eaton Vance
Global Macro Absolute Return Advantage Fund
October 31, 2012
Statements of Changes in Net Assets
| | | | | | | | |
| | | Year Ended October 31, | |
| Increase (Decrease) in Net Assets | | 2012 | | | 2011 | |
From operations — | | | | | | | | |
Net investment income | | $ | 31,110,410 | | | $ | 10,830,753 | |
Net realized gain (loss) from investment transactions, written options, securities sold short, futures contracts, swap contracts, forward commodity contracts, and foreign currency and forward foreign currency exchange contract transactions | | | 11,725,349 | | | | (11,809,261 | ) |
Net change in unrealized appreciation (depreciation) from investments, written options, securities sold short, futures contracts, swap contracts, forward commodity contracts, foreign currency and forward foreign currency exchange contracts | | | (6,627,524 | ) | | | (1,642,657 | ) |
Net increase (decrease) in net assets from operations | | $ | 36,208,235 | | | $ | (2,621,165 | ) |
Distributions to shareholders — | | | | | | | | |
From net investment income | | | | | | | | |
Class A | | $ | (6,346,535 | ) | | $ | — | |
Class C | | | (2,183,186 | ) | | | — | |
Class I | | | (12,792,634 | ) | | | — | |
Class R | | | (49,483 | ) | | | — | |
From net realized gain | | | | | | | | |
Class A | | | — | | | | (225,570 | ) |
Class C | | | — | | | | (73,599 | ) |
Class I | | | — | | | | (260,981 | ) |
Class R | | | — | | | | (132 | ) |
Total distributions to shareholders | | $ | (21,371,838 | ) | | $ | (560,282 | ) |
Transactions in shares of beneficial interest — | | | | | | | | |
Proceeds from sale of shares | | | | | | | | |
Class A | | $ | 125,831,134 | | | $ | 359,517,372 | |
Class C | | | 20,529,855 | | | | 116,978,555 | |
Class I | | | 225,780,742 | | | | 620,698,978 | |
Class R | | | 1,441,511 | | | | 1,817,382 | |
Net asset value of shares issued to shareholders in payment of distributions declared | | | | | | | | |
Class A | | | 5,778,419 | | | | 201,497 | |
Class C | | | 1,461,426 | | | | 51,842 | |
Class I | | | 7,791,018 | | | | 156,721 | |
Class R | | | 49,457 | | | | 131 | |
Cost of shares redeemed | | | | | | | | |
Class A | | | (161,233,028 | ) | | | (125,933,928 | ) |
Class C | | | (38,429,113 | ) | | | (11,865,026 | ) |
Class I | | | (257,049,122 | ) | | | (212,911,428 | ) |
Class R | | | (333,566 | ) | | | (183,140 | ) |
Net increase (decrease) in net assets from Fund share transactions | | $ | (68,381,267 | ) | | $ | 748,528,956 | |
| | |
Net increase (decrease) in net assets | | $ | (53,544,870 | ) | | $ | 745,347,509 | |
| | |
| Net Assets | | | | | | | | |
At beginning of year | | $ | 846,272,580 | | | $ | 100,925,071 | |
At end of year | | $ | 792,727,710 | | | $ | 846,272,580 | |
| | |
Accumulated undistributed (distributions in excess of)
net investment income included in net assets | | | | | | | | |
At end of year | | $ | (10,233,125 | ) | | $ | 11,446,150 | |
| | | | |
| | 9 | | See Notes to Financial Statements. |
Eaton Vance
Global Macro Absolute Return Advantage Fund
October 31, 2012
Financial Highlights
| | | | | | | | | | | | |
| | | Class A | |
| | | Year Ended October 31, | | | Period Ended October 31, 2010(1) | |
| | | 2012 | | | 2011 | | |
Net asset value — Beginning of period | | $ | 10.050 | | | $ | 10.060 | | | $ | 10.000 | |
| | | |
| Income (Loss) From Operations | | | | | | | | | | | | |
Net investment income(2) | | $ | 0.387 | | | $ | 0.171 | | | $ | 0.028 | |
Net realized and unrealized gain (loss) | | | 0.078 | | | | (0.163 | ) | | | 0.032 | |
| | | |
Total income from operations | | $ | 0.465 | | | $ | 0.008 | | | $ | 0.060 | |
| | | |
| Less Distributions | | | | | | | | | | | | |
From net investment income | | $ | (0.255 | ) | | $ | — | | | $ | — | |
From net realized gain | | | — | | | | (0.018 | ) | | | — | |
| | | |
Total distributions | | $ | (0.255 | ) | | $ | (0.018 | ) | | $ | — | |
| | | |
Net asset value — End of period | | $ | 10.260 | | | $ | 10.050 | | | $ | 10.060 | |
| | | |
Total Return(3) | | | 4.79 | % | | | 0.07 | % | | | 0.60 | %(4) |
| | | |
| Ratios/Supplemental Data | | | | | | | | | | | | |
Net assets, end of period (000’s omitted) | | $ | 243,609 | | | $ | 268,739 | | | $ | 36,143 | |
Ratios (as a percentage of average daily net assets): | | | | | | | | | | | | |
Expenses(5)(6)(7) | | | 2.02 | %(8) | | | 1.80 | %(8) | | | 1.55 | %(9) |
Net investment income | | | 3.87 | % | | | 1.69 | % | | | 1.69 | %(9) |
Portfolio Turnover of the Portfolio | | | 91 | % | | | 50 | % | | | 7 | %(4) |
| (1) | For the period from the start of business, August 31, 2010, to October 31, 2010. |
| (2) | Computed using average shares outstanding. |
| (3) | Returns are historical and are calculated by determining the percentage change in net asset value with all distributions reinvested and do not reflect the effect of sales charges. |
| (5) | Includes the Fund’s share of the Portfolio’s allocated expenses. |
| (6) | Excludes the effect of custody fee credits, if any, of less than 0.005%. |
| (7) | The investment adviser and administrator reimbursed certain operating expenses (equal to 0.07% and 1.38% of average daily net assets for the year ended October 31, 2011 and for the period from the start of business, August 31, 2010, to October 31, 2010, respectively). Absent this reimbursement, total return would be lower. |
| (8) | Includes interest and dividend expense primarily on securities sold short of 0.47% and 0.25% for the years ended October 31, 2012 and 2011, respectively. |
| | | | |
| | 10 | | See Notes to Financial Statements. |
Eaton Vance
Global Macro Absolute Return Advantage Fund
October 31, 2012
Financial Highlights — continued
| | | | | | | | | | | | |
| | | Class C | |
| | | Year Ended October 31, | | | Period Ended October 31, 2010(1) | |
| | | 2012 | | | 2011 | | |
Net asset value — Beginning of period | | $ | 9.980 | | | $ | 10.060 | | | $ | 10.000 | |
| | | |
| Income (Loss) From Operations | | | | | | | | | | | | |
Net investment income(2) | | $ | 0.315 | | | $ | 0.101 | | | $ | 0.015 | |
Net realized and unrealized gain (loss) | | | 0.075 | | | | (0.163 | ) | | | 0.045 | |
| | | |
Total income (loss) from operations | | $ | 0.390 | | | $ | (0.062 | ) | | $ | 0.060 | |
| | | |
| Less Distributions | | | | | | | | | | | | |
From net investment income | | $ | (0.200 | ) | | $ | — | | | $ | — | |
From net realized gain | | | — | | | | (0.018 | ) | | | — | |
| | | |
Total distributions | | $ | (0.200 | ) | | $ | (0.018 | ) | | $ | — | |
| | | |
Net asset value — End of period | | $ | 10.170 | | | $ | 9.980 | | | $ | 10.060 | |
| | | |
Total Return(3) | | | 4.02 | % | | | (0.62 | )% | | | 0.60 | %(4) |
| | | |
| Ratios/Supplemental Data | | | | | | | | | | | | |
Net assets, end of period (000’s omitted) | | $ | 98,230 | | | $ | 112,833 | | | $ | 8,747 | |
Ratios (as a percentage of average daily net assets): | | | | | | | | | | | | |
Expenses(5)(6)(7) | | | 2.72 | %(8) | | | 2.49 | %(8) | | | 2.25 | %(9) |
Net investment income | | | 3.17 | % | | | 1.01 | % | | | 0.89 | %(9) |
Portfolio Turnover of the Portfolio | | | 91 | % | | | 50 | % | | | 7 | %(4) |
| (1) | For the period from the start of business, August 31, 2010, to December 31, 2010. |
| (2) | Computed using average shares outstanding. |
| (3) | Returns are historical and are calculated by determining the percentage change in net asset value with all distributions reinvested and do not reflect the effect of sales charges. |
| (5) | Includes the Fund’s share of the Portfolio’s allocated expenses. |
| (6) | Excludes the effect of custody fee credits, if any, of less than 0.005%. |
| (7) | The investment adviser and administrator reimbursed certain operating expenses (equal to 0.07% and 1.38% of average daily net assets for the year ended October 31, 2011 and for the period from the start of business, August 31, 2010, to October 31, 2010, respectively). Absent this reimbursement, total return would be lower. |
| (8) | Includes interest and dividend expense primarily on securities sold short of 0.47% and 0.24% for the years ended October 31, 2012 and 2011, respectively. |
| | | | |
| | 11 | | See Notes to Financial Statements. |
Eaton Vance
Global Macro Absolute Return Advantage Fund
October 31, 2012
Financial Highlights — continued
| | | | | | | | | | | | |
| | | Class I | |
| | | Year Ended October 31, | | | Period Ended October 31, 2010(1) | |
| | | 2012 | | | 2011 | | |
Net asset value — Beginning of period | | $ | 10.090 | | | $ | 10.070 | | | $ | 10.000 | |
| | | |
| Income (Loss) From Operations | | | | | | | | | | | | |
Net investment income(2) | | $ | 0.419 | | | $ | 0.204 | | | $ | 0.025 | |
Net realized and unrealized gain (loss) | | | 0.076 | | | | (0.166 | ) | | | 0.045 | |
| | | |
Total income from operations | | $ | 0.495 | | | $ | 0.038 | | | $ | 0.070 | |
| | | |
| Less Distributions | | | | | | | | | | | | |
From net investment income | | $ | (0.285 | ) | | $ | — | | | $ | — | |
From net realized gain | | | — | | | | (0.018 | ) | | | — | |
| | | |
Total distributions | | $ | (0.285 | ) | | $ | (0.018 | ) | | $ | — | |
| | | |
Net asset value — End of period | | $ | 10.300 | | | $ | 10.090 | | | $ | 10.070 | |
| | | |
Total Return(3) | | | 5.09 | % | | | 0.37 | % | | | 0.70 | %(4) |
| | | |
| Ratios/Supplemental Data | | | | | | | | | | | | |
Net assets, end of period (000’s omitted) | | $ | 448,057 | | | $ | 463,076 | | | $ | 56,036 | |
Ratios (as a percentage of average daily net assets): | | | | | | | | | | | | |
Expenses(5)(6)(7) | | | 1.72 | %(8) | | | 1.50 | %(8) | | | 1.25 | %(9) |
Net investment income | | | 4.17 | % | | | 2.02 | % | | | 1.50 | %(9) |
Portfolio Turnover of the Portfolio | | | 91 | % | | | 50 | % | | | 7 | %(4) |
| (1) | For the period from the start of business, August 31, 2010, to October 31, 2010. |
| (2) | Computed using average shares outstanding. |
| (3) | Returns are historical and are calculated by determining the percentage change in net asset value with all distributions reinvested. |
| (5) | Includes the Fund’s share of the Portfolio’s allocated expenses. |
| (6) | Excludes the effect of custody fee credits, if any, of less than 0.005%. |
| (7) | The investment adviser and administrator reimbursed certain operating expenses (equal to 0.07% and 1.38% of average daily net assets for the year ended October 31, 2011 and for the period from the start of business, August 31, 2010, to October 31, 2010, respectively). Absent this reimbursement, total return would be lower. |
| (8) | Includes interest and dividend expense primarily on securities sold short of 0.47% and 0.25% for the years ended October 31, 2012 and 2011, respectively. |
| | | | |
| | 12 | | See Notes to Financial Statements. |
Eaton Vance
Global Macro Absolute Return Advantage Fund
October 31, 2012
Financial Highlights — continued
| | | | | | | | |
| | | Class R | |
| | | Year Ended
October 31, 2012 | | | Period Ended October 31, 2011(1) | |
Net asset value — Beginning of period | | $ | 10.040 | | | $ | 10.100 | |
| | |
| Income (Loss) From Operations | | | | | | | | |
Net investment income(2) | | $ | 0.373 | | | $ | 0.138 | |
Net realized and unrealized gain (loss) | | | 0.071 | | | | (0.180 | ) |
| | |
Total income (loss) from operations | | $ | 0.444 | | | $ | (0.042 | ) |
| | |
| Less Distributions | | | | | | | | |
From net investment income | | $ | (0.264 | ) | | $ | — | |
From net realized gain | | | — | | | | (0.018 | ) |
| | |
Total distributions | | $ | (0.264 | ) | | $ | (0.018 | ) |
| | |
Net asset value — End of period | | $ | 10.220 | | | $ | 10.040 | |
| | |
Total Return(3) | | | 4.48 | % | | | (0.42 | )%(4) |
| | |
| Ratios/Supplemental Data | | | | | | | | |
Net assets, end of period (000’s omitted) | | $ | 2,832 | | | $ | 1,625 | |
Ratios (as a percentage of average daily net assets): | | | | | | | | |
Expenses(5)(6)(7) | | | 2.22 | %(8) | | | 2.10 | %(8)(9) |
Net investment income | | | 3.74 | % | | | 1.50 | %(9) |
Portfolio Turnover of the Portfolio | | | 91 | % | | | 50 | %(10) |
| (1) | For the period from commencement of operations on December 1, 2010 to October 31, 2011. |
| (2) | Computed using average shares outstanding. |
| (3) | Returns are historical and are calculated by determining the percentage change in net asset value with all distributions reinvested. |
| (5) | Includes the Fund’s share of the Portfolio’s allocated expenses. |
| (6) | Excludes the effect of custody fee credits, if any, of less than 0.005%. |
| (7) | The investment adviser and administrator reimbursed certain operating expenses (equal to 0.07% of average daily net assets for the period from commencement of operations on December 1, 2010 to October 31, 2011). Absent this reimbursement, total return would be lower. |
| (8) | Includes interest and dividend expense primarily on securities sold short of 0.47% and 0.35% for the year ended October 31, 2012 and the period from commencement of operations on December 1, 2010 to October 31, 2011, respectively. |
| (10) | For the Portfolio’s year ended October 31, 2011. |
| | | | |
| | 13 | | See Notes to Financial Statements. |
Eaton Vance
Global Macro Absolute Return Advantage Fund
October 31, 2012
Notes to Financial Statements
1 Significant Accounting Policies
Eaton Vance Global Macro Absolute Return Advantage Fund (the Fund) is a non-diversified series of Eaton Vance Mutual Funds Trust (the Trust). The Trust is a Massachusetts business trust registered under the Investment Company Act of 1940, as amended (the 1940 Act), as an open-end management investment company. The Fund offers four classes of shares. Class A shares are generally sold subject to a sales charge imposed at time of purchase. Class C shares are sold at net asset value and are generally subject to a contingent deferred sales charge (see Note 5). Class I and Class R shares are sold at net asset value and are not subject to a sales charge. Each class represents a pro-rata interest in the Fund, but votes separately on class-specific matters and (as noted below) is subject to different expenses. Realized and unrealized gains and losses and net investment income and losses, other than class-specific expenses, are allocated daily to each class of shares based on the relative net assets of each class to the total net assets of the Fund. Each class of shares differs in its distribution plan and certain other class-specific expenses. The Fund invests all of its investable assets in interests in Global Macro Absolute Return Advantage Portfolio (the Portfolio), a Massachusetts business trust, having the same investment objective and policies as the Fund. The value of the Fund’s investment in the Portfolio reflects the Fund’s proportionate interest in the net assets of the Portfolio (66.7% at October 31, 2012). The performance of the Fund is directly affected by the performance of the Portfolio. The consolidated financial statements of the Portfolio, including the consolidated portfolio of investments, are included elsewhere in this report and should be read in conjunction with the Fund’s financial statements.
The following is a summary of significant accounting policies of the Fund. The policies are in conformity with accounting principles generally accepted in the United States of America.
A Investment Valuation — Valuation of securities by the Portfolio is discussed in Note 1A of the Portfolio’s Notes to Consolidated Financial Statements, which are included elsewhere in this report.
B Income — The Fund’s net investment income or loss consists of the Fund’s pro-rata share of the net investment income or loss of the Portfolio, less all actual and accrued expenses of the Fund.
C Federal Taxes — The Fund’s policy is to comply with the provisions of the Internal Revenue Code applicable to regulated investment companies and to distribute to shareholders each year substantially all of its net investment income, and all or substantially all of its net realized capital gains. Accordingly, no provision for federal income or excise tax is necessary.
At October 31, 2012, the Fund had a net investment loss of $19,248,844 incurred after December 31, 2011. This net loss is treated as arising on the first day of the Fund’s taxable year ending October 31, 2013.
As of October 31, 2012, the Fund had no uncertain tax positions that would require financial statement recognition, de-recognition, or disclosure. The Fund files a U.S. federal income tax return annually after its fiscal year-end which is subjet to examination by the Internal Revenue Service for a period of three years from the date of filing.
D Expenses — The majority of expenses of the Trust are directly identifiable to an individual fund. Expenses which are not readily identifiable to a specific fund are allocated taking into consideration, among other things, the nature and type of expense and the relative size of the funds.
E Expense Reduction — State Street Bank and Trust Company (SSBT) serves as custodian of the Fund. Pursuant to the custodian agreement, SSBT receives a fee reduced by credits, which are determined based on the average daily cash balance the Fund maintains with SSBT. All credit balances, if any, used to reduce the Fund’s custodian fees are reported as a reduction of expenses in the Statement of Operations.
F Use of Estimates — The preparation of the financial statements in conformity with accounting principles generally accepted in the United States of America requires management to make estimates and assumptions that affect the reported amounts of assets and liabilities at the date of the financial statements and the reported amounts of income and expense during the reporting period. Actual results could differ from those estimates.
G Indemnifications — Under the Trust’s organizational documents, its officers and Trustees may be indemnified against certain liabilities and expenses arising out of the performance of their duties to the Fund. Under Massachusetts law, if certain conditions prevail, shareholders of a Massachusetts business trust (such as the Trust) could be deemed to have personal liability for the obligations of the Trust. However, the Trust’s Declaration of Trust contains an express disclaimer of liability on the part of Fund shareholders and the By-laws provide that the Trust shall assume the defense on behalf of any Fund shareholders. Moreover, the By-laws also provide for indemnification out of Fund property of any shareholder held personally liable solely by reason of being or having been a shareholder for all loss or expense arising from such liability. Additionally, in the normal course of business, the Fund enters into agreements with service providers that may contain indemnification clauses. The Fund’s maximum exposure under these arrangements is unknown as this would involve future claims that may be made against the Fund that have not yet occurred.
H Other — Investment transactions are accounted for on a trade date basis. Dividends to shareholders are recorded on the ex-dividend date.
2 Distributions to Shareholders
It is the present policy of the Fund to make at least one distribution annually (normally in December) of all or substantially all of its net investment income and to distribute annually all or substantially all of its net realized capital gains. Distributions are declared separately for each class of shares. Shareholders may reinvest income and capital gain distributions in additional shares of the same class of the Fund at the net asset value as of the ex-dividend date or, at the election of the
Eaton Vance
Global Macro Absolute Return Advantage Fund
October 31, 2012
Notes to Financial Statements — continued
shareholder, receive distributions in cash. The Fund distinguishes between distributions on a tax basis and a financial reporting basis. Accounting principles generally accepted in the United States of America require that only distributions in excess of tax basis earnings and profits be reported in the financial statements as a return of capital. Permanent differences between book and tax accounting relating to distributions are reclassified to paid-in capital. For tax purposes, distributions from short-term capital gains are considered to be from ordinary income.
The tax character of distributions declared for the years ended October 31, 2012 and October 31, 2011 was as follows:
| | | | | | | | |
| | | Year Ended October 31, | |
| | | 2012 | | | 2011 | |
| | |
Distributions declared from: | | | | | | | | |
Ordinary income | | $ | 21,371,838 | | | $ | 94,314 | |
Long-term capital gains | | $ | 0 | | | $ | 465,968 | |
During the year ended October 31, 2012, accumulated net realized gain was increased by $30,161,680, accumulated undistributed net investment income was decreased by $31,417,847 and paid-in capital was increased by $1,256,167 due to differences between book and tax accounting, primarily for swap contracts, premium amortization, dividend redesignations, foreign currency gain (loss), futures contracts, option contracts and the Portfolio’s investment in a subsidiary. These reclassifications had no effect on the net assets or net asset value per share of the Fund.
As of October 31, 2012, the components of distributable earnings (accumulated losses) and unrealized appreciation (depreciation) on a tax basis were as follows:
| | | | |
Undistributed long-term capital gains | | $ | 41,627,057 | |
Late year ordinary losses | | $ | (19,248,844 | ) |
Net unrealized depreciation | | $ | (3,534,738 | ) |
The differences between components of distributable earnings (accumulated losses) on a tax basis and the amounts reflected in the Statement of Assets and Liabilities are primarily due to foreign currency transactions, tax accounting for straddle transactions, swap contracts, partnership allocations and premium amortization.
3 Investment Adviser and Administration Fee and Other Transactions with Affiliates
The investment adviser and administration fee is earned by Eaton Vance Management (EVM) as compensation for investment advisory and administrative services rendered to the Fund. The fee is computed at an annual rate of 1.00% of the Fund’s average daily net assets that are not invested in other investment companies for which EVM or its affiliates serve as investment adviser or administrator (“Investable Assets”) up to $500 million, and is payable monthly. On Investable Assets of $500 million and over, the annual fee is reduced. For the year ended October 31, 2012, the Fund incurred no investment adviser and administration fee on Investable Assets. To the extent the Fund’s assets are invested in the Portfolio, the Fund is allocated its share of the Portfolio’s adviser fee. The Portfolio has engaged Boston Management and Research (BMR), a subsidiary of EVM, to render investment advisory services. See Note 2 of the Portfolio’s Notes to Consolidated Financial Statements which are included elsewhere in this report. EVM has agreed to reimburse the Fund’s expenses to the extent that total annual operating expenses (relating to ordinary operating expenses only) exceed 1.55%, 2.25%, 1.25% and 1.75% of the Fund’s average daily net assets for Class A, Class C, Class I and Class R, respectively. This agreement may be changed or terminated after February 28, 2013.
EVM serves as the sub-transfer agent of the Fund and receives from the transfer agent an aggregate fee based upon the actual expenses incurred by EVM in the performance of these services. For the year ended October 31, 2012, EVM earned $13,444 in sub-transfer agent fees. The Fund was informed that Eaton Vance Distributors, Inc. (EVD), an affiliate of EVM and the Fund’s principal underwriter, received $15,637 as its portion of the sales charge on sales of Class A shares for the year ended October 31, 2012. EVD also received distribution and service fees from Class A, Class C and Class R shares (see Note 4) and contingent deferred sales charges (see Note 5).
Trustees and officers of the Fund who are members of EVM’s or BMR’s organizations receive remuneration for their services to the Fund out of the investment adviser fee. Certain officers and Trustees of the Fund and the Portfolio are officers of the above organizations.
4 Distribution Plans
The Fund has in effect a distribution plan for Class A shares (Class A Plan) pursuant to Rule 12b-1 under the 1940 Act. Pursuant to the Class A Plan, the Fund pays EVD a distribution and service fee of 0.30% per annum of its average daily net assets attributable to Class A shares for distribution services and facilities provided to the Fund by EVD, as well as for personal services and/or the maintenance of shareholder accounts. Distribution and service fees paid or accrued to EVD for the year ended October 31, 2012 amounted to $729,162 for Class A shares.
Eaton Vance
Global Macro Absolute Return Advantage Fund
October 31, 2012
Notes to Financial Statements — continued
The Fund also has in effect distribution plans for Class C shares (Class C Plan) and Class R shares (Class R Plan) pursuant to Rule 12b-1 under the 1940 Act. Pursuant to the Class C Plan, the Fund pays EVD amounts equal to 0.75% per annum of its average daily net assets attributable to Class C shares for providing ongoing distribution services and facilities to the Fund. For the year ended October 31, 2012, the Fund paid or accrued to EVD $793,835 for Class C shares. The Class R Plan requires the Fund to pay EVD an amount up to 0.50% per annum of its average daily net assets attributable to Class R shares for providing ongoing distribution services and facilities to the Fund. The Trustees of the Trust have currently limited Class R distribution payments to 0.25% per annum of the average daily net assets attributable to Class R shares. For the year ended October 31, 2012, the Fund paid or accrued to EVD $5,608 for Class R shares.
Pursuant to the Class C and Class R Plans, the Fund also makes payments of service fees to EVD, financial intermediaries and other persons in amounts equal to 0.25% per annum of its average daily net assets attributable to that class. Service fees paid or accrued are for personal services and/or the maintenance of shareholder accounts. They are separate and distinct from the sales commissions and distribution fees payable to EVD. Service fees paid or accrued for the year ended October 31, 2012 amounted to $264,612 and $5,608 for Class C and Class R shares, respectively.
5 Contingent Deferred Sales Charges
A contingent deferred sales charge (CDSC) of 1% generally is imposed on redemptions of Class C shares made within one year of purchase. Class A shares may be subject to a 1% CDSC if redeemed within 18 months of purchase (depending on the circumstances of purchase). Generally, the CDSC is based upon the lower of the net asset value at date of redemption or date of purchase. No charge is levied on shares acquired by reinvestment of dividends or capital gain distributions. No CDSC is levied on shares which have been sold to EVM or its affiliates or to their respective employees or clients and may be waived under certain other limited conditions. For the year ended October 31, 2012, the Fund was informed that EVD received approximately $52,000 and $7,000 of CDSCs paid by Class A and Class C shareholders, respectively.
6 Investment Transactions
For the year ended October 31, 2012, increases and decreases in the Fund’s investment in the Portfolio aggregated $111,608,611 and $203,503,201, respectively.
7 Shares of Beneficial Interest
The Fund’s Declaration of Trust permits the Trustees to issue an unlimited number of full and fractional shares of beneficial interest (without par value). Such shares may be issued in a number of different series (such as the Fund) and classes. Transactions in Fund shares were as follows:
| | | | | | | | |
| | | Year Ended October 31, | |
| Class A | | 2012 | | | 2011 | |
| | |
Sales | | | 12,579,645 | | | | 35,604,483 | |
Issued to shareholders electing to receive payments of distributions in Fund shares | | | 598,800 | | | | 20,049 | |
Redemptions | | | (16,166,942 | ) | | | (12,486,972 | ) |
| | |
Net increase (decrease) | | | (2,988,497 | ) | | | 23,137,560 | |
| | |
| | | | | | | | |
| | | Year Ended October 31, | |
| Class C | | 2012 | | | 2011 | |
| | |
Sales | | | 2,067,110 | | | | 11,610,484 | |
Issued to shareholders electing to receive payments of distributions in Fund shares | | | 151,758 | | | | 5,168 | |
Redemptions | | | (3,865,007 | ) | | | (1,181,384 | ) |
| | |
Net increase (decrease) | | | (1,646,139 | ) | | | 10,434,268 | |
Eaton Vance
Global Macro Absolute Return Advantage Fund
October 31, 2012
Notes to Financial Statements — continued
| | | | | | | | |
| | | Year Ended October 31, | |
| Class I | | 2012 | | | 2011 | |
| | |
Sales | | | 22,506,690 | | | | 61,387,710 | |
Issued to shareholders electing to receive payments of distributions in Fund shares | | | 806,523 | | | | 15,578 | |
Redemptions | | | (25,695,039 | ) | | | (21,077,892 | ) |
| | |
Net increase (decrease) | | | (2,381,826 | ) | | | 40,325,396 | |
| | |
| | | | | | | | |
| Class R | | Year Ended
October 31, 2012 | | | Period Ended
October 31, 2011(1) | |
| | |
Sales | | | 143,847 | | | | 179,969 | |
Issued to shareholders electing to receive payments of distributions in Fund shares | | | 5,136 | | | | 13 | |
Redemptions | | | (33,632 | ) | | | (18,158 | ) |
| | |
Net increase | | | 115,351 | | | | 161,824 | |
| (1) | For the period from commencement of operations on December 1, 2010 to October 31, 2011. |
Eaton Vance
Global Macro Absolute Return Advantage Fund
October 31, 2012
Report of Independent Registered Public Accounting Firm
To the Trustees of Eaton Vance Mutual Funds Trust and Shareholders of Eaton Vance Global Macro Absolute Return Advantage Fund:
We have audited the accompanying statement of assets and liabilities of Eaton Vance Global Macro Absolute Return Advantage Fund (the “Fund”) (one of the funds constituting Eaton Vance Mutual Funds Trust) as of October 31, 2012, and the related statement of operations for the year then ended, the statements of changes in net assets for each of the two years in the period then ended, and the financial highlights for each of the two years in the period then ended and for the period from the start of business, August 31, 2010, to October 31, 2010. These financial statements and financial highlights are the responsibility of the Fund’s management. Our responsibility is to express an opinion on these financial statements and financial highlights based on our audits.
We conducted our audits in accordance with the standards of the Public Company Accounting Oversight Board (United States). Those standards require that we plan and perform the audit to obtain reasonable assurance about whether the financial statements and financial highlights are free of material misstatement. The Fund is not required to have, nor were we engaged to perform, an audit of its internal control over financial reporting. Our audits included consideration of internal control over financial reporting as a basis for designing audit procedures that are appropriate in the circumstances, but not for the purpose of expressing an opinion on the effectiveness of the Fund’s internal control over financial reporting. Accordingly, we express no such opinion. An audit also includes examining, on a test basis, evidence supporting the amounts and disclosures in the financial statements, assessing the accounting principles used and significant estimates made by management, as well as evaluating the overall financial statement presentation. We believe that our audits provide a reasonable basis for our opinion.
In our opinion, such financial statements and financial highlights referred to above present fairly, in all material respects, the financial position of Eaton Vance Global Macro Absolute Return Advantage Fund as of October 31, 2012, the results of its operations for the year then ended, the changes in its net assets for each of the two years in the period then ended, and the financial highlights for each of the two years in the period then ended and for the period from the start of business, August 31, 2010, to October 31, 2010, in conformity with accounting principles generally accepted in the United States of America.
DELOITTE & TOUCHE LLP
Boston, Massachusetts
December 21, 2012
Eaton Vance
Global Macro Absolute Return Advantage Fund
October 31, 2012
Federal Tax Information (Unaudited)
The Form 1099-DIV you receive in January 2013 will show the tax status of all distributions paid to your account in calendar year 2012. Shareholders are advised to consult their own tax adviser with respect to the tax consequences of their investment in the Fund. As required by the Internal Revenue Code and/or regulations, shareholders must be notified regarding the status of the foreign tax credit and capital gains dividends.
Foreign Tax Credit. The Fund paid foreign taxes of $187,418 and recognized foreign source income of $44,119,625.
Capital Gains Dividends. The Fund designates $28,350,886 as a capital gain dividend.
Global Macro Absolute Return Advantage Portfolio
October 31, 2012
Consolidated Portfolio of Investments
| | | | | | | | | | |
| Foreign Government Bonds — 41.0% | | | | | |
| | | |
| | | | | | | | | | |
| Security | | Principal
Amount | | | Value | |
| | | | | | | | | | |
| | | |
Albania — 0.3% | | | | | | | | | | |
Republic of Albania, 7.50%, 11/4/15 | | EUR | | | 2,776,000 | | | $ | 3,672,772 | |
| | | | | | | | | | | |
Total Albania | | | | | | | | $ | 3,672,772 | |
| | | | | | | | | | | |
| | | |
Brazil — 0.8% | | | | | | | | | | |
Nota do Tesouro Nacional, 6.00%, 5/15/15(1) | | BRL | | | 17,693,933 | | | $ | 9,528,714 | |
| | | | | | | | | | | |
Total Brazil | | | | | | | | $ | 9,528,714 | |
| | | | | | | | | | | |
| | | |
Cyprus — 1.2% | | | | | | | | | | |
Republic of Cyprus, 3.75%, 6/3/13 | | EUR | | | 7,636,000 | | | $ | 9,155,092 | |
Republic of Cyprus, 3.75%, 11/1/15 | | EUR | | | 1,290,000 | | | | 1,263,388 | |
Republic of Cyprus, 4.375%, 7/15/14 | | EUR | | | 300,000 | | | | 327,213 | |
Republic of Cyprus, 4.625%, 2/3/20 | | EUR | | | 3,759,000 | | | | 3,222,977 | |
| | | | | | | | | | | |
Total Cyprus | | | | | | | | $ | 13,968,670 | |
| | | | | | | | | | | |
| | | |
Georgia — 1.7% | | | | | | | | | | |
Georgia Treasury Bond, 6.80%, 7/12/14 | | GEL | | | 3,000,000 | | | $ | 1,803,174 | |
Georgia Treasury Bond, 7.40%, 4/19/14 | | GEL | | | 8,633,000 | | | | 5,234,168 | |
Georgia Treasury Bond, 8.50%, 7/26/17 | | GEL | | | 2,257,000 | | | | 1,391,602 | |
Georgia Treasury Bond, 8.90%, 1/12/14 | | GEL | | | 3,710,000 | | | | 2,283,902 | |
Georgia Treasury Bond, 9.10%, 12/8/13 | | GEL | | | 2,030,000 | | | | 1,250,747 | |
Georgia Treasury Bond, 9.80%, 4/26/17 | | GEL | | | 1,290,000 | | | | 832,334 | |
Georgia Treasury Bond, 11.30%, 1/26/17 | | GEL | | | 2,100,000 | | | | 1,417,486 | |
Georgia Treasury Bond, 12.00%, 6/15/13 | | GEL | | | 500,000 | | | | 311,008 | |
Georgia Treasury Bond, 12.00%, 9/15/15 | | GEL | | | 500,000 | | | | 338,516 | |
Georgia Treasury Bond, 12.20%, 5/13/13 | | GEL | | | 3,421,000 | | | | 2,121,090 | |
Georgia Treasury Bond, 12.80%, 2/10/13 | | GEL | | | 3,100,000 | | | | 1,900,027 | |
Georgia Treasury Bond, 13.80%, 12/16/12 | | GEL | | | 2,871,000 | | | | 1,746,445 | |
| | | | | | | | | | | |
Total Georgia | | | | | | | | $ | 20,630,499 | |
| | | | | | | | | | | |
| | | |
Germany — 2.9% | | | | | | | | | | |
Bundesrepublik Deutschland, 4.75%, 7/4/34 | | EUR | | | 18,400,000 | | | $ | 34,228,012 | |
| | | | | | | | | | | |
Total Germany | | | | | | | | $ | 34,228,012 | |
| | | | | | | | | | | |
| | | |
Ghana — 0.4% | | | | | | | | | | |
Ghana Government Bond, 23.00%, 8/21/17 | | GHS | | | 8,200,000 | | | $ | 4,907,086 | |
| | | | | | | | | | | |
Total Ghana | | | | | | | | $ | 4,907,086 | |
| | | | | | | | | | | |
|
Hungary — 3.4% | |
National Bank of Hungary, 8.875%, 11/1/13 | | USD | | | 3,820,000 | | | $ | 3,922,350 | |
Republic of Hungary, 3.50%, 7/18/16 | | EUR | | | 6,304,000 | | | | 7,872,524 | |
Republic of Hungary, 4.375%, 7/4/17 | | EUR | | | 8,864,000 | | | | 11,232,977 | |
| | | | | | | | | | |
| Security | | Principal
Amount | | | Value | |
| | | | | | | | | | |
|
Hungary (continued) | |
Republic of Hungary, 4.50%, 1/29/14 | | EUR | | | 11,286,000 | | | $ | 14,818,218 | |
Republic of Hungary, 5.50%, 5/6/14 | | GBP | | | 1,181,000 | | | | 1,934,425 | |
| | | | | | | | | | | |
Total Hungary | | | $ | 39,780,494 | |
| | | | | | | | | | | |
| | | |
Mexico — 5.0% | | | | | | | | | | |
Mexican Bonos, 7.00%, 6/19/14 | | MXN | | | 233,240,000 | | | $ | 18,476,049 | |
Mexican Bonos, 8.00%, 12/19/13 | | MXN | | | 220,530,000 | | | | 17,455,841 | |
Mexican Bonos, 9.00%, 6/20/13 | | MXN | | | 162,200,000 | | | | 12,725,317 | |
Mexican Bonos, 9.50%, 12/18/14 | | MXN | | | 132,350,000 | | | | 11,039,450 | |
| | | | | | | | | | | |
Total Mexico | | | $ | 59,696,657 | |
| | | | | | | | | | | |
| | | |
New Zealand — 4.5% | | | | | | | | | | |
New Zealand Government Bond, 5.00%, 3/15/19 | | NZD | | | 9,220,000 | | | $ | 8,449,016 | |
New Zealand Government Bond, 5.50%, 4/15/23 | | NZD | | | 3,690,000 | | | | 3,565,124 | |
New Zealand Government Bond, 6.00%, 12/15/17 | | NZD | | | 9,220,000 | | | | 8,730,820 | |
New Zealand Government Bond, 6.00%, 5/15/21 | | NZD | | | 33,297,000 | | | | 32,858,098 | |
| | | | | | | | | | | |
Total New Zealand | | | $ | 53,603,058 | |
| | | | | | | | | | | |
| | | |
Nigeria — 0.3% | | | | | | | | | | |
Nigeria Treasury Bond, 16.39%, 1/27/22 | | NGN | | | 422,331,000 | | | $ | 3,127,148 | |
| | | | | | | | | | | |
Total Nigeria | | | $ | 3,127,148 | |
| | | | | | | | | | | |
| | | |
Philippines — 1.4% | | | | | | | | | | |
Republic of the Philippines, 6.25%, 1/14/36 | | PHP | | | 417,000,000 | | | $ | 11,900,276 | |
Republic of the Philippines, 8.75%, 3/3/13 | | PHP | | | 205,250,000 | | | | 5,119,123 | |
| | | | | | | | | | | |
Total Philippines | | | $ | 17,019,399 | |
| | | | | | | | | | | |
| | | |
Poland — 0.3% | | | | | | | | | | |
Republic of Poland, 3.00%, 3/17/23 | | USD | | | 3,840,000 | | | $ | 3,809,576 | |
| | | | | | | | | | | |
Total Poland | | | $ | 3,809,576 | |
| | | | | | | | | | | |
| | | |
Serbia — 5.9% | | | | | | | | | | |
Serbia Treasury Bill, 0.00%, 2/21/13 | | RSD | | | 1,315,000,000 | | | $ | 14,426,962 | |
Serbia Treasury Bill, 0.00%, 4/4/13 | | RSD | | | 321,270,000 | | | | 3,470,193 | |
Serbia Treasury Bill, 0.00%, 7/4/13 | | RSD | | | 256,210,000 | | | | 2,681,130 | |
Serbia Treasury Bill, 0.00%, 8/9/13 | | RSD | | | 737,400,000 | | | | 7,616,661 | |
Serbia Treasury Bill, 0.00%, 10/24/13 | | RSD | | | 1,335,090,000 | | | | 13,416,726 | |
Serbia Treasury Bill, 0.00%, 11/8/13 | | RSD | | | 785,000,000 | | | | 7,840,651 | |
Serbia Treasury Bill, 0.00%, 12/12/13 | | RSD | | | 206,500,000 | | | | 2,030,808 | |
Serbia Treasury Bill, 0.00%, 1/30/14 | | RSD | | | 105,900,000 | | | | 1,017,712 | |
Serbia Treasury Bill, 0.00%, 2/21/14 | | RSD | | | 316,200,000 | | | | 3,007,060 | |
Serbia Treasury Bill, 0.00%, 3/6/14 | | RSD | | | 990,000,000 | | | | 9,356,127 | |
Serbia Treasury Bill, 0.00%, 3/13/14 | | RSD | | | 106,120,000 | | | | 996,485 | |
| | | | |
| | 20 | | See Notes to Consolidated Financial Statements. |
Global Macro Absolute Return Advantage Portfolio
October 31, 2012
Consolidated Portfolio of Investments — continued
| | | | | | | | | | |
| Security | | Principal
Amount | | | Value | |
| | | | | | | | | | |
| | | |
Serbia (continued) | | | | | | | | | | |
Serbia Treasury Bond, 10.00%, 4/27/15 | | RSD | | | 138,930,000 | | | $ | 1,401,049 | |
Serbia Treasury Bond, 10.00%, 9/14/15 | | RSD | | | 301,680,000 | | | | 2,984,156 | |
| | | | | | | | | | | |
Total Serbia | | | | | | | | $ | 70,245,720 | |
| | | | | | | | | | | |
| | | |
Slovenia — 1.2% | | | | | | | | | | |
Republic of Slovenia, 4.125%, 1/26/20 | | EUR | | | 300,000 | | | $ | 361,237 | |
Republic of Slovenia, 4.375%, 1/18/21 | | EUR | | | 2,548,000 | | | | 3,058,197 | |
Republic of Slovenia, 5.50%, 10/26/22(2) | | USD | | | 10,857,000 | | | | 10,898,435 | |
| | | | | | | | | | | |
Total Slovenia | | | | | | | | $ | 14,317,869 | |
| | | | | | | | | | | |
| | | |
Sri Lanka — 1.4% | | | | | | | | | | |
Republic of Sri Lanka, 5.875%, 7/25/22(2) | | USD | | | 3,970,000 | | | $ | 4,410,471 | |
Republic of Sri Lanka, 6.25%, 10/4/20(2) | | USD | | | 8,040,000 | | | | 9,045,000 | |
Republic of Sri Lanka, 6.25%, 10/4/20(3) | | USD | | | 2,460,000 | | | | 2,767,500 | |
| | | | | | | | | | | |
Total Sri Lanka | | | | | | | | $ | 16,222,971 | |
| | | | | | | | | | | |
| | | |
Turkey — 8.3% | | | | | | | | | | |
Turkey Government Bond, 0.00%, 7/17/13 | | TRY | | | 92,500,000 | | | $ | 49,372,552 | |
Turkey Government Bond, 3.00%, 1/6/21(1) | | TRY | | | 67,299,423 | | | | 41,130,554 | |
Turkey Government Bond, 4.00%, 4/1/20(1) | | TRY | | | 12,619,415 | | | | 8,127,818 | |
| | | | | | | | | | | |
Total Turkey | | | | | | | | $ | 98,630,924 | |
| | | | | | | | | | | |
| | | |
Venezuela — 2.0% | | | | | | | | | | |
Bolivarian Republic of Venezuela, 7.00%, 3/31/38(3) | | USD | | | 8,138,000 | | | $ | 5,859,360 | |
Bolivarian Republic of Venezuela, 9.25%, 5/7/28(3) | | USD | | | 4,816,900 | | | | 4,274,999 | |
Bolivarian Republic of Venezuela, 11.75%, 10/21/26(3) | | USD | | | 13,364,000 | | | | 13,597,870 | |
| | | | | | | | | | | |
Total Venezuela | | | | | | | | $ | 23,732,229 | |
| | | | | | | | | | | |
| | | |
Total Foreign Government Bonds
(identified cost $466,585,188) | | | | | | | | $ | 487,121,798 | |
| | | | | | | | | | | |
| |
| Collateralized Mortgage Obligations — 3.3% | | | | | |
| | | |
| | | | | | | | | | |
| Security | | | | Principal
Amount | | | Value | |
| | | | | | | | | | |
Federal Home Loan Mortgage Corp.: | | | | | | | | | | |
Series 228, (Interest Only), Class IO, 6.00%, 2/1/35(4) | | | | $ | 13,452,718 | | | $ | 2,155,648 | |
Series 2770, (Interest Only), Class SH, 6.886%, 3/15/34(4)(5) | | | | | 7,598,862 | | | | 1,415,592 | |
Series 2877, (Interest Only), Class WS, 6.386%, 10/15/34(4)(5) | | | | | 12,426,316 | | | | 824,750 | |
| | | | | | | | | | |
| Security | | | | Principal
Amount | | | Value | |
| | | | | | | | | | |
Federal Home Loan Mortgage Corp.: (continued) | | | | | |
Series 3572, (Interest Only), Class JS, 6.586%, 9/15/39(4)(5) | | | | $ | 12,887,067 | | | $ | 2,408,061 | |
Series 3871, (Interest Only), Class MS, 6.986%, 6/15/41(4)(5) | | | | | 9,293,527 | | | | 1,806,493 | |
| | | | | | | | | | | |
| | | | | | | | $ | 8,610,544 | |
| | | | | | | | | | | |
Federal National Mortgage Association: | | | | | |
Series 2005-85, (Interest Only), Class SC, 6.289%, 10/25/35(4)(5)(6) | | | | $ | 22,301,204 | | | $ | 3,656,485 | |
Series 2006-56, (Interest Only), Class CS, 6.999%, 7/25/36(4)(5) | | | | | 10,267,378 | | | | 2,013,400 | |
Series 2006-72, (Interest Only), Class GI, 6.369%, 8/25/36(4)(5)(6) | | | | | 37,850,638 | | | | 6,201,416 | |
Series 2006-96, (Interest Only), Class SM, 7.039%, 10/25/36(4)(5) | | | | | 22,984,472 | | | | 4,403,983 | |
Series 2007-36, (Interest Only), Class SG, 6.389%, 4/25/37(4)(5) | | | | | 16,176,259 | | | | 2,784,393 | |
Series 2010-54, (Interest Only), Class EI, 6.00%, 6/25/40(4)(6) | | | | | 23,897,112 | | | | 4,213,919 | |
Series 2010-67, (Interest Only), Class BI, 5.50%, 6/25/25(4) | | | | | 12,549,425 | | | | 1,311,468 | |
Series 2010-109, (Interest Only), Class PS, 6.389%, 10/25/40(4)(5) | | | | | 23,998,226 | | | | 3,420,615 | |
Series 2010-147, (Interest Only), Class KS, 5.739%, 1/25/41(4)(5) | | | | | 16,031,447 | | | | 2,401,990 | |
| | | | | | | | | | | |
| | | | | | | | $ | 30,407,669 | |
| | | | | | | | | | | |
| | | |
Total Collateralized Mortgage Obligations
(identified cost $36,429,742) | | | | | | | | $ | 39,018,213 | |
| | | | | | | | | | | |
| | | |
| Mortgage Pass-Throughs — 0.6% | | | | | | | | | | |
| | | |
| | | | | | | | | | |
| Security | | | | Principal
Amount | | | Value | |
| | | | | | | | | | |
Federal National Mortgage Association: | | | | | | | | | | |
6.00%, with various maturities to 2038(6) | | | | $ | 6,458,095 | | | $ | 7,263,296 | |
| | | | | | | | | | | |
| | | |
Total Mortgage Pass-Throughs
(identified cost $7,306,460) | | | | | | | | $ | 7,263,296 | |
| | | | | | | | | | | |
| | | |
| Common Stocks — 1.5% | | | | | | | | | | |
| | | |
| | | | | | | | | | |
| Security | | | | Shares | | | Value | |
| | | | | | | | | | |
| | | |
France — 0.2% | | | | | | | | | | |
Sanofi | | | | | 14,429 | | | $ | 1,267,262 | |
Total SA | | | | | 24,993 | | | | 1,258,902 | |
| | | | | | | | | | | |
Total France | | | | | | | | $ | 2,526,164 | |
| | | | | | | | | | | |
| | | | |
| | 21 | | See Notes to Consolidated Financial Statements. |
Global Macro Absolute Return Advantage Portfolio
October 31, 2012
Consolidated Portfolio of Investments — continued
| | | | | | | | | | |
| Security | | | | Shares | | | Value | |
| | | | | | | | | | |
| | | |
Germany — 1.0% | | | | | | | | | | |
Deutsche EuroShop AG | | | | | 92,887 | | | $ | 3,796,292 | |
Deutsche Wohnen AG | | | | | 200,764 | | | | 3,676,845 | |
GSW Immobilien AG | | | | | 92,980 | | | | 3,821,873 | |
| | | | | | | | | | | |
Total Germany | | | | | | | | $ | 11,295,010 | |
| | | | | | | | | | | |
| | | |
Luxembourg — 0.3% | | | | | | | | | | |
GAGFAH SA(7) | | | | | 314,472 | | | $ | 3,578,962 | |
| | | | | | | | | | | |
Total Luxembourg | | | | | | | | $ | 3,578,962 | |
| | | | | | | | | | | |
| | | |
Total Common Stocks
(identified cost $14,987,554) | | | | | | | | $ | 17,400,136 | |
| | | | | | | | | | | |
| | | |
| Precious Metals — 3.0% | | | | | | | | | | |
| | | |
| | | | | | | | | | |
| Description | | | | Troy Ounces | | | Value | |
Gold(7) | | | | | 4,800 | | | $ | 8,263,000 | |
Platinum(7) | | | | | 17,693 | | | | 27,773,631 | |
| | | | | | | | | | | |
| | | |
Total Precious Metals
(identified cost $39,419,034) | | | | | | | | $ | 36,036,631 | |
| | | | | | | | | | | |
| | | | | | | | | | | | | | | | | | |
|
| Currency Call Options Purchased — 0.5% | |
| | | | | |
| | | | | | | | | | | | | | | | | | |
| Description | | Counterparty | | Principal Amount of Contracts (000’s omitted) | | | Strike Price | | | Expiration Date | | | Value | |
| | | | | | | | | | | | | | | | | | |
Indian Rupee | | Australia and
New Zealand
Banking Group
Limited | | INR | 896,000 | | | INR | 54.00 | | | | 8/12/13 | | | $ | 302,137 | |
Indian Rupee | | Australia and
New Zealand
Banking Group
Limited | | INR | 787,000 | | | INR | 54.00 | | | | 8/12/13 | | | | 265,381 | |
Indian Rupee | | Bank of America | | INR | 1,131,103 | | | INR | 52.00 | | | | 5/6/13 | | | | 157,044 | |
Indian Rupee | | Bank of America | | INR | 1,030,095 | | | INR | 52.00 | | | | 5/6/13 | | | | 143,020 | |
Indian Rupee | | Bank of America | | INR | 1,127,500 | | | INR | 55.00 | | | | 7/1/13 | | | | 520,857 | |
Indian Rupee | | Bank of America | | INR | 908,000 | | | INR | 54.00 | | | | 8/12/13 | | | | 306,183 | |
Indian Rupee | | Bank of America | | INR | 1,065,000 | | | INR | 55.00 | | | | 8/16/13 | | | | 490,005 | |
Indian Rupee | | Barclays Bank
PLC | | INR | 1,132,690 | | | INR | 52.00 | | | | 5/6/13 | | | | 157,265 | |
Indian Rupee | | Barclays Bank
PLC | | INR | 896,000 | | | INR | 54.00 | | | | 8/12/13 | | | | 302,137 | |
Indian Rupee | | Deutsche Bank | | INR | 890,900 | | | INR | 51.00 | | | | 5/8/13 | | | | 78,035 | |
Indian Rupee | | Deutsche Bank | | INR | 860,000 | | | INR | 54.00 | | | | 8/12/13 | | | | 289,997 | |
Indian Rupee | | Goldman Sachs
International | | INR | 1,033,600 | | | INR | 51.00 | | | | 5/8/13 | | | | 90,535 | |
| | | | | | | | | | | | | | | | | | |
| Description | | Counterparty | | Principal Amount of Contracts (000’s omitted) | | | Strike Price | | | Expiration Date | | | Value | |
| | | | | | | | | | | | | | | | | | |
Indian Rupee | | Goldman Sachs
International | | INR | 940,500 | | | INR | 55.00 | | | | 7/1/13 | | | $ | 434,471 | |
Indian Rupee | | Goldman Sachs
International | | INR | 570,000 | | | INR | 54.00 | | | | 8/12/13 | | | | 192,207 | |
Indian Rupee | | Goldman Sachs
International | | INR | 678,000 | | | INR | 55.00 | | | | 8/19/13 | | | | 313,888 | |
Indian Rupee | | HSBC Bank USA | | | INR 1,107,700 | | | INR | 53.00 | | | | 7/3/13 | | | | 256,648 | |
Indian Rupee | | JPMorgan Chase
Bank | | INR | 943,400 | | | INR | 53.00 | | | | 7/3/13 | | | | 218,580 | |
Indian Rupee | | JPMorgan Chase
Bank | | INR | 610,000 | | | INR | 54.00 | | | | 8/12/13 | | | | 205,696 | |
Indian Rupee | | JPMorgan Chase
Bank | | INR | 687,000 | | | INR | 54.00 | | | | 8/12/13 | | | | 231,661 | |
Indian Rupee | | Standard
Chartered Bank | | INR | 904,600 | | | INR | 52.00 | | | | 5/6/13 | | | | 125,596 | |
Indian Rupee | | Standard
Chartered Bank | | INR | 630,700 | | | INR | 53.00 | | | | 7/3/13 | | | | 146,130 | |
| | | | | | | | | | | | | | | | | | | |
| |
Total Currency Call Options Purchased
(identified cost $4,270,673) | | | $ | 5,227,473 | |
| | | | | | | | | | | | | | | | | | | |
|
| Currency Put Options Purchased — 0.0%(8) | |
| | | | | |
| | | | | | | | | | | | | | | | | | |
| Description | | Counterparty | | Principal Amount of Contracts (000’s omitted) | | | Strike Price | | | Expiration Date | | | Value | |
| | | | | | | | | | | | | | | | | | |
Yuan Offshore Renminbi | | Barclays Bank PLC | | CNH | 124,807 | | | CNH | 6.50 | | | | 5/20/13 | | | $ | 47,271 | |
Yuan Offshore Renminbi | | Citibank NA | | CNH | 118,060 | | | CNH | 6.50 | | | | 5/20/13 | | | | 44,715 | |
Yuan Offshore Renminbi | | HSBC Bank USA | | CNH | 133,413 | | | CNH | 6.50 | | | | 5/20/13 | | | | 50,531 | |
Yuan Offshore Renminbi | | Standard
Chartered Bank | | CNH | 111,787 | | | CNH | 6.50 | | | | 5/20/13 | | | | 42,340 | |
| | | | | | | | | | | | | | | | | | | |
| | |
Total Currency Put Options Purchased
(identified cost $644,366) | | | | | | | $ | 184,857 | |
| | | | | | | | | | | | | | | | | | | |
| | | | | | | | | | | | | | |
| |
| Interest Rate Swaptions — 0.0%(8) | | | | | |
| | | | |
| | | | | | | | | | | | | | |
| Description | | Counterparty | | Expiration
Date | | | Notional Amount | | | Value | |
| | | | | | | | | | | | | | |
Options to receive 3-month USD-LIBOR-BBA Rate and pay 4.60% | | Deutsche Bank | | | 8/26/14 | | | $ | 24,000,000 | | | $ | 316,032 | |
| | | | | | | | | | | | | | | |
| |
Total Interest Rate Swaptions
(identified cost $1,495,200) | | | $ | 316,032 | |
| | | | | | | | | | | | | | | |
| | | | |
| | 22 | | See Notes to Consolidated Financial Statements. |
Global Macro Absolute Return Advantage Portfolio
October 31, 2012
Consolidated Portfolio of Investments — continued
| | | | | | | | | | | | | | | | | | | | |
| Put Options Purchased — 0.3% | | | | | | | | | |
| | | | | |
| | | | | | | | | | | | | | | | | | | | |
| Description | | Counterparty | | | Number of
Contracts (000’s omitted) | | | Strike
Price | | | Expiration
Date | | | Value | |
| | | | | | | | | | | | | | | | | | | | |
Brent Crude Oil Future 9/2013 | | | Not Applicable | | | | 421 | | | USD | 95.00 | | | | 8/12/13 | | | $ | 2,947,000 | |
KOSPI 200 Index | | | Bank of America | | | | 66,800 | | | KRW | 200.00 | | | | 12/13/12 | | | | 3,580 | |
| | | | | | | | | | | | | | | | | | | | | |
| |
Total Put Options Purchased
(identified cost $3,744,204) | | | $ | 2,950,580 | |
| | | | | | | | | | | | | | | | | | | | | |
| | | | | | | | | | |
| | | |
| Short-Term Investments — 59.7% | | | | | | | | | | |
| | | |
| Foreign Government Securities — 39.8% | | | | | | | | | | |
| Security | | Principal
Amount
(000’s omitted) | | | Value | |
| | | | | | | | | | |
| | | |
Croatia — 1.9% | | | | | | | | | | |
Croatia Treasury Bill, 0.00%, 11/8/12 | | EUR | | | 632 | | | $ | 818,761 | |
Croatia Treasury Bill, 0.00%, 11/15/12 | | EUR | | | 1,885 | | | | 2,441,005 | |
Croatia Treasury Bill, 0.00%, 11/22/12 | | EUR | | | 982 | | | | 1,270,955 | |
Croatia Treasury Bill, 0.00%, 11/29/12 | | EUR | | | 2,515 | | | | 3,253,245 | |
Croatia Treasury Bill, 0.00%, 1/24/13 | | EUR | | | 1,910 | | | | 2,459,523 | |
Croatia Treasury Bill, 0.00%, 1/31/13 | | EUR | | | 839 | | | | 1,080,401 | |
Croatia Treasury Bill, 0.00%, 2/7/13 | | EUR | | | 973 | | | | 1,252,172 | |
Croatia Treasury Bill, 0.00%, 2/28/13 | | EUR | | | 1,989 | | | | 2,554,800 | |
Croatia Treasury Bill, 0.00%, 3/14/13 | | EUR | | | 1,716 | | | | 2,201,261 | |
Croatia Treasury Bill, 0.00%, 3/28/13 | | EUR | | | 2,215 | | | | 2,837,594 | |
Croatia Treasury Bill, 0.00%, 4/4/13 | | EUR | | | 2,000 | | | | 2,560,977 | |
| | | | | | | | | | | |
Total Croatia | | | | | | | | $ | 22,730,694 | |
| | | | | | | | | | | |
| | | |
Georgia — 1.6% | | | | | | | | | | |
Bank of Georgia Promissory Note, 7.00%, 3/9/13 | | USD | | | 1,928 | | | $ | 1,958,244 | |
Bank of Georgia Promissory Note, 7.75%, 2/22/13 | | USD | | | 1,606 | | | | 1,633,118 | |
Bank of Georgia Promissory Note, 8.25%, 12/21/12 | | USD | | | 8,920 | | | | 9,004,270 | |
Georgia Treasury Bill, 0.00%, 3/14/13 | | GEL | | | 3,180 | | | | 1,873,047 | |
Georgia Treasury Bill, 0.00%, 5/23/13 | | GEL | | | 4,580 | | | | 2,661,856 | |
Georgia Treasury Bill, 0.00%, 7/18/13 | | GEL | | | 3,892 | | | | 2,240,279 | |
| | | | | | | | | | | |
Total Georgia | | | | | | | | $ | 19,370,814 | |
| | | | | | | | | | | |
| | | |
Malaysia — 9.2% | | | | | | | | | | |
Bank Negara Monetary Note, 0.00%, 11/6/12 | | MYR | | | 28,881 | | | $ | 9,477,880 | |
Bank Negara Monetary Note, 0.00%, 11/8/12 | | MYR | | | 39,265 | | | | 12,883,492 | |
Bank Negara Monetary Note, 0.00%, 11/22/12 | | MYR | | | 32,403 | | | | 10,619,936 | |
Bank Negara Monetary Note, 0.00%, 11/29/12 | | MYR | | | 71,664 | | | | 23,475,581 | |
Bank Negara Monetary Note, 0.00%, 12/13/12 | | MYR | | | 23,893 | | | | 7,817,977 | |
Bank Negara Monetary Note, 0.00%, 12/20/12 | | MYR | | | 28,746 | | | | 9,400,600 | |
| | | | | | | | | | |
| Security | | Principal
Amount
(000’s omitted) | | | Value | |
| | | | | | | | | | |
| | | |
Malaysia (continued) | | | | | | | | | | |
Bank Negara Monetary Note, 0.00%, 1/10/13 | | MYR | | | 41,587 | | | $ | 13,576,974 | |
Bank Negara Monetary Note, 0.00%, 2/7/13 | | MYR | | | 32,258 | | | | 10,509,346 | |
Bank Negara Monetary Note, 0.00%, 2/19/13 | | MYR | | | 36,786 | | | | 11,972,410 | |
| | | | | | | | | | | |
Total Malaysia | | | | | | | | $ | 109,734,196 | |
| | | | | | | | | | | |
| | | |
Mexico — 2.4% | | | | | | | | | | |
Mexico Cetes, 0.00%, 2/7/13 | | MXN | | | 373,241 | | | $ | 28,172,940 | |
| | | | | | | | | | | |
Total Mexico | | | | | | | | $ | 28,172,940 | |
| | | | | | | | | | | |
| | | |
Nigeria — 8.9% | | | | | | | | | | |
Nigeria Treasury Bill, 0.00%, 2/7/13 | | NGN | | | 745,500 | | | $ | 4,578,868 | |
Nigeria Treasury Bill, 0.00%, 2/21/13 | | NGN | | | 1,573,326 | | | | 9,617,041 | |
Nigeria Treasury Bill, 0.00%, 3/7/13 | | NGN | | | 1,318,730 | | | | 7,999,829 | |
Nigeria Treasury Bill, 0.00%, 3/28/13 | | NGN | | | 767,200 | | | | 4,646,170 | |
Nigeria Treasury Bill, 0.00%, 4/4/13 | | NGN | | | 2,274,300 | | | | 13,739,206 | |
Nigeria Treasury Bill, 0.00%, 4/11/13 | | NGN | | | 586,000 | | | | 3,513,849 | |
Nigeria Treasury Bill, 0.00%, 4/25/13 | | NGN | | | 426,900 | | | | 2,548,684 | |
Nigeria Treasury Bill, 0.00%, 5/9/13 | | NGN | | | 1,008,800 | | | | 5,999,583 | |
Nigeria Treasury Bill, 0.00%, 5/23/13 | | NGN | | | 327,000 | | | | 1,941,573 | |
Nigeria Treasury Bill, 0.00%, 9/5/13 | | NGN | | | 8,299,000 | | | | 47,234,975 | |
Nigeria Treasury Bill, 0.00%, 10/10/13 | | NGN | | | 694,200 | | | | 3,899,615 | |
| | | | | | | | | | | |
Total Nigeria | | | | | | | | $ | 105,719,393 | |
| | | | | | | | | | | |
| | | |
Philippines — 2.9% | | | | | | | | | | |
Philippine Treasury Bill, 0.00%, 11/7/12 | | PHP | | | 59,070 | | | $ | 1,433,840 | |
Philippine Treasury Bill, 0.00%, 11/21/12 | | PHP | | | 207,040 | | | | 5,023,592 | |
Philippine Treasury Bill, 0.00%, 1/2/13 | | PHP | | | 79,590 | | | | 1,929,755 | |
Philippine Treasury Bill, 0.00%, 1/30/13 | | PHP | | | 59,120 | | | | 1,433,848 | |
Philippine Treasury Bill, 0.00%, 2/6/13 | | PHP | | | 157,180 | | | | 3,811,267 | |
Philippine Treasury Bill, 0.00%, 2/20/13 | | PHP | | | 22,020 | | | | 533,879 | |
Philippine Treasury Bill, 0.00%, 3/6/13 | | PHP | | | 60,040 | | | | 1,455,225 | |
Philippine Treasury Bill, 0.00%, 4/17/13 | | PHP | | | 42,690 | | | | 1,033,445 | |
Philippine Treasury Bill, 0.00%, 5/2/13 | | PHP | | | 94,620 | | | | 2,289,543 | |
Philippine Treasury Bill, 0.00%, 5/15/13 | | PHP | | | 15,930 | | | | 385,306 | |
Philippine Treasury Bill, 0.00%, 7/10/13 | | PHP | | | 127,110 | | | | 3,068,549 | |
Philippine Treasury Bill, 0.00%, 7/24/13 | | PHP | | | 98,690 | | | | 2,381,361 | |
Philippine Treasury Bill, 0.00%, 8/7/13 | | PHP | | | 255,780 | | | | 6,168,956 | |
Philippine Treasury Bill, 0.00%, 9/18/13 | | PHP | | | 128,890 | | | | 3,103,957 | |
Philippine Treasury Bill, 0.00%, 10/2/13 | | PHP | | | 33,200 | | | | 799,109 | |
| | | | | | | | | | | |
Total Philippines | | | | | | | | $ | 34,851,632 | |
| | | | | | | | | | | |
| | | | |
| | 23 | | See Notes to Consolidated Financial Statements. |
Global Macro Absolute Return Advantage Portfolio
October 31, 2012
Consolidated Portfolio of Investments — continued
| | | | | | | | | | |
| Security | | Principal
Amount
(000’s omitted) | | | Value | |
| | | | | | | | | | |
| | | |
Serbia — 3.8% | | | | | | | | | | |
Serbia Treasury Bill, 0.00%, 1/17/13 | | RSD | | | 19,080 | | | $ | 211,960 | |
Serbia Treasury Bill, 0.00%, 2/13/13 | | RSD | | | 2,048,000 | | | | 22,534,048 | |
Serbia Treasury Bill, 0.00%, 3/28/13 | | RSD | | | 225,310 | | | | 2,440,043 | |
Serbia Treasury Bill, 0.00%, 4/11/13 | | RSD | | | 190,060 | | | | 2,047,712 | |
Serbia Treasury Bill, 0.00%, 5/23/13 | | RSD | | | 516,360 | | | | 5,486,384 | |
Serbia Treasury Bill, 0.00%, 6/13/13 | | RSD | | | 28,900 | | | | 304,736 | |
Serbia Treasury Bill, 0.00%, 6/28/13 | | RSD | | | 193,500 | | | | 2,029,303 | |
Serbia Treasury Bill, 0.00%, 9/13/13 | | RSD | | | 928,600 | | | | 9,470,957 | |
| | | | | | | | | | | |
Total Serbia | | | | | | | | $ | 44,525,143 | |
| | | | | | | | | | | |
| | | |
Singapore — 3.7% | | | | | | | | | | |
Monetary Authority of Singapore Bill, 0.00%, 11/23/12 | | SGD | | | 9,292 | | | $ | 7,616,804 | |
Monetary Authority of Singapore Bill, 0.00%, 12/7/12 | | SGD | | | 43,865 | | | | 35,954,423 | |
| | | | | | | | | | | |
Total Singapore | | | | | | | | $ | 43,571,227 | |
| | | | | | | | | | | |
| | | |
South Korea — 1.8% | | | | | | | | | | |
Korea Monetary Stabilization Bond, 0.00%, 11/6/12 | | KRW | | | 2,671,920 | | | $ | 2,448,857 | |
Korea Monetary Stabilization Bond, 0.00%, 11/13/12 | | KRW | | | 10,386,610 | | | | 9,514,077 | |
Korea Monetary Stabilization Bond, 0.00%, 12/11/12 | | KRW | | | 1,954,370 | | | | 1,784,787 | |
Korea Monetary Stabilization Bond, 0.00%, 12/18/12 | | KRW | | | 1,595,100 | | | | 1,456,798 | |
Korea Monetary Stabilization Bond, 0.00%, 12/25/12 | | KRW | | | 6,296,230 | | | | 5,747,775 | |
| | | | | | | | | | | |
Total South Korea | | | | | | | | $ | 20,952,294 | |
| | | | | | | | | | | |
| | | |
Sri Lanka — 3.6% | | | | | | | | | | |
Sri Lanka Treasury Bill, 0.00%, 1/4/13 | | LKR | | | 705,000 | | | $ | 5,314,460 | |
Sri Lanka Treasury Bill, 0.00%, 1/11/13 | | LKR | | | 2,908,560 | | | | 21,881,862 | |
Sri Lanka Treasury Bill, 0.00%, 4/12/13 | | LKR | | | 1,993,810 | | | | 14,556,573 | |
Sri Lanka Treasury Bill, 0.00%, 10/11/13 | | LKR | | | 165,030 | | | | 1,134,560 | |
| | | | | | | | | | | |
Total Sri Lanka | | | | | | | | $ | 42,887,455 | |
| | | | | | | | | | | |
| | | |
Total Foreign Government Securities
(identified cost $468,569,603) | | | | | | | | $ | 472,515,788 | |
| | | | | | | | | | | |
| | | | | | | | | | |
| U.S. Treasury Obligations — 0.9% | | | | | | | | | | |
| | | |
| | | | | | | | | | |
| Security | | | | Principal
Amount
(000’s omitted) | | | Value | |
| | | | | | | | | | |
U.S. Treasury Bill, 0.00%, 11/15/12(6) | | | | $ | 8,000 | | | $ | 7,999,800 | |
U.S. Treasury Bill, 0.00%, 11/29/12(6) | | | | | 3,000 | | | | 2,999,796 | |
| | | | | | | | | | | |
| | | |
Total U.S. Treasury Obligations
(identified cost $10,999,452) | | | | | | | | $ | 10,999,596 | |
| | | | | | | | | | | |
| | | |
| Repurchase Agreements — 11.5% | | | | | | | | | | |
| | | |
| | | | | | | | | | |
| Description | | | | Principal
Amount
(000’s omitted) | | | Value | |
| | | | | | | | | | |
Bank of America: | | | | | | | | | | |
Dated 10/30/12 with a maturity date of 11/9/12, an interest rate of 0.50% payable by the Portfolio and repurchase proceeds of EUR 6,554,403, collateralized by EUR 5,300,000 European Investment Bank 4.625%, due 4/15/20 and a market value, including accrued interest, of $8,514,100. | | EUR | | | 6,555 | | | $ | 8,496,311 | |
Dated 10/30/12 with a maturity date of 11/9/12, an interest rate of 0.55% payable by the Portfolio and repurchase proceeds of EUR 4,913,894, collateralized by EUR 4,200,000 European Investment Bank 3.625%, due 1/15/21 and a market value, including accrued interest, of $6,381,389. | | EUR | | | 4,914 | | | | 6,369,823 | |
Dated 10/30/12 with a maturity date of 11/9/12, an interest rate of 0.65% payable by the Portfolio and repurchase proceeds of EUR 7,278,440, collateralized by EUR 6,050,000 European Investment Bank 4.25%, due 4/15/19 and a market value, including accrued interest, of $9,440,774. | | EUR | | | 7,279 | | | | 9,435,138 | |
Barclays Bank PLC: | | | | | | | | | | |
Dated 10/31/12 with a maturity date of 11/9/12, an interest rate of 0.08% payable by the Portfolio and repurchase proceeds of EUR 29,065,871, collateralized by EUR 25,152,000 Government of France 4.00%, due 10/25/38 and a market value, including accrued interest, of $37,717,996. | | EUR | | | 29,066 | | | | 37,674,297 | |
| | | | |
| | 24 | | See Notes to Consolidated Financial Statements. |
Global Macro Absolute Return Advantage Portfolio
October 31, 2012
Consolidated Portfolio of Investments — continued
| | | | | | | | | | |
| Description | | | | Principal
Amount
(000’s omitted) | | | Value | |
| | | | | | | | | | |
Citibank NA: | | | | | | | | | | |
Dated 10/31/12 with a maturity date of 11/12/12, an interest rate of 0.10% payable by the Portfolio and repurchase proceeds of EUR 22,385,615, collateralized by EUR 19,340,000 Government of France 4.00%, due 10/25/38 and a market value, including accrued interest, of $29,002,307. | | EUR | | | 22,386 | | | $ | 29,015,665 | |
Nomura International PLC: | | | | | | | | | | |
Dated 10/26/12 with a maturity date of 11/7/12, an interest rate of 0.05% payable by the Portfolio and repurchase proceeds of EUR 16,966,287, collateralized by EUR 15,060,000 Belgium Kingdom Government Bond 3.75%, due 9/28/20 and a market value, including accrued interest, of $22,015,900. | | EUR | | | 16,966 | | | | 21,991,056 | |
Dated 10/26/12 with a maturity date of 11/7/12, an interest rate of 0.15% payable by the Portfolio and repurchase proceeds of EUR 3,965,966, collateralized by EUR 4,000,000 Spain Government Bond 4.60%, due 7/30/19 and a market value, including accrued interest, of $5,171,048. | | EUR | | | 3,966 | | | | 5,140,635 | |
Dated 10/31/12 with a maturity date of 11/12/12, an interest rate of 0.05% payable by the Portfolio and repurchase proceeds of EUR 14,569,966, collateralized by EUR 12,738,000 Government of France 3.75%, due 10/25/19 and a market value, including accrued interest, of $18,898,791. | | EUR | | | 14,570 | | | | 18,885,037 | |
| | | | | | | | | | | |
| | | |
Total Repurchase Agreements
(identified cost $136,983,451) | | | | | | | | $ | 137,007,962 | |
| | | | | | | | | | | |
| | | |
| Other — 7.5% | | | | | | | | | | |
| | | |
| | | | | | | | | | |
| Description | | | | Interest (000’s omitted) | | | Value | |
| | | | | | | | | | |
Eaton Vance Cash Reserves Fund, LLC, 0.12%(9) | | | | $ | 88,480 | | | $ | 88,479,972 | |
| | | | | | | | | | | |
| | | |
Total Other
(identified cost $88,479,972) | | | | | | | | $ | 88,479,972 | |
| | | | | | | | | | | |
| | | |
Total Short-Term Investments
(identified cost $705,032,478) | | | | | | | | $ | 709,003,318 | |
| | | | | | | | | | | |
| | | |
Total Investments — 109.9%
(identified cost $1,279,914,899) | | | | | | | | $ | 1,304,522,334 | |
| | | | | | | | | | | |
| | | | | | | | | | | | | | | | | | |
| Currency Call Options Written — (0.3)% | | | | | |
| | | | | |
| | | | | | | | | | | | | | | | | | |
| Description | | Counterparty | | Principal
Amount
of Contracts (000’s omitted) | | | Strike Price | | | Expiration Date | | | Value | |
Indian Rupee | | Bank of America | | INR | 1,239,462 | | | INR | 54.00 | | | | 8/12/13 | | | $ | (417,954 | ) |
Indian Rupee | | Citibank NA | | INR | 1,178,280 | | | INR | 54.00 | | | | 8/12/13 | | | | (397,323 | ) |
Indian Rupee | | Deutsche Bank | | INR | 633,478 | | | INR | 54.00 | | | | 8/12/13 | | | | (213,613 | ) |
Indian Rupee | | Goldman Sachs
International | | INR | 1,065,000 | | | INR | 55.00 | | | | 8/16/13 | | | | (492,381 | ) |
Indian Rupee | | HSBC Bank USA | | INR | 1,286,280 | | | INR | 54.00 | | | | 8/12/13 | | | | (433,741 | ) |
Indian Rupee | | JPMorgan Chase
Bank | | INR | 678,000 | | | INR | 55.00 | | | | 8/19/13 | | | | (313,888 | ) |
Indian Rupee | | Nomura International
PLC | | INR | 1,286,280 | | | INR | 54.00 | | | | 8/12/13 | | | | (433,741 | ) |
Indian Rupee | | Standard Chartered
Bank | | INR | 590,220 | | | INR | 54.00 | | | | 8/12/13 | | | | (199,026 | ) |
| | | | | | | | | | | | | | | | | | | |
| |
Total Currency Call Options Written
(premiums received $5,791,622) | | | $ | (2,901,667 | ) |
| | | | | | | | | | | | | | | | | | | |
| |
| Currency Put Options Written — (0.0)%(8) | | | | | |
| | | | | |
| | | | | | | | | | | | | | | | | | |
| Description | | Counterparty | | Principal
Amount of
Contracts (000’s omitted) | | | Strike
Price | | | Expiration
Date | | | Value | |
Indian Rupee | | Bank of America | | INR | 666,250 | | | INR | 65.00 | | | | 7/1/13 | | | $ | (47,410 | ) |
Indian Rupee | | Goldman Sachs
International | | INR | 555,750 | | | INR | 65.00 | | | | 7/1/13 | | | | (39,547 | ) |
Indian Rupee | | HSBC Bank USA | | INR | 668,800 | | | INR | 64.00 | | | | 7/3/13 | | | | (60,409 | ) |
Indian Rupee | | JPMorgan Chase
Bank | | INR | 569,600 | | | INR | 64.00 | | | | 7/3/13 | | | | (51,449 | ) |
Indian Rupee | | Standard Chartered
Bank | | INR | 380,800 | | | INR | 64.00 | | | | 7/3/13 | | | | (34,395 | ) |
| | | | | | | | | | | | | | | | | | | |
| |
Total Currency Put Options Written
(premiums received $1,177,318) | | | $ | (233,210 | ) |
| | | | | | | | | | | | | | | | | | | |
| |
Other Assets, Less Liabilities — (9.6)% | | | $ | (113,922,445 | ) |
| | | | | | | | | | | | | | | | | | | |
| |
Net Assets — 100.0% | | | $ | 1,187,465,012 | |
| | | | | | | | | | | | | | | | | | | |
The percentage shown for each investment category in the Consolidated Portfolio of Investments is based on net assets.
| | | | |
| | 25 | | See Notes to Consolidated Financial Statements. |
Global Macro Absolute Return Advantage Portfolio
October 31, 2012
Consolidated Portfolio of Investments — continued
| | | | |
| BRL | | – | | Brazilian Real |
| CNH | | – | | Yuan Offshore Renminbi |
| EUR | | – | | Euro |
| GBP | | – | | British Pound Sterling |
| GEL | | – | | Georgian Lari |
| GHS | | – | | Ghanaian Cedi |
| INR | | – | | Indian Rupee |
| KRW | | – | | South Korean Won |
| LKR | | – | | Sri Lankan Rupee |
| MXN | | – | | Mexican Peso |
| MYR | | – | | Malaysian Ringgit |
| NGN | | – | | Nigerian Naira |
| NZD | | – | | New Zealand Dollar |
| PHP | | – | | Philippine Peso |
| RSD | | – | | Serbian Dinar |
| SGD | | – | | Singapore Dollar |
| TRY | | – | | New Turkish Lira |
| USD | | – | | United States Dollar |
| | (1) | Inflation-linked security whose principal is adjusted for inflation based on changes in a designated inflation index or inflation rate for the applicable country. Interest is calculated based on the inflation-adjusted principal. |
| | (2) | Security exempt from registration pursuant to Rule 144A under the Securities Act of 1933. These securities may be sold in certain transactions (normally to qualified institutional buyers) and remain exempt from registration. At October 31, 2012, the aggregate value of these securities is $24,353,906 or 2.1% of the Portfolio’s net assets. |
| | (3) | Security exempt from registration under Regulation S of the Securities Act of 1933, which exempts from registration securities offered and sold outside the United States. Security may not be offered or sold in the United States except pursuant to an exemption from, or in a transaction not subject to, the registration requirements of the Securities Act of 1933. |
| | (4) | Interest only security that entitles the holder to receive only interest payments on the underlying mortgages. Principal amount shown is the notional amount of the underlying mortgages on which coupon interest is calculated. |
| | (5) | Inverse floating-rate security whose coupon varies inversely with changes in the interest rate index. The stated interest rate represents the coupon rate in effect at October 31, 2012. |
| | (6) | Security (or a portion thereof) has been pledged to cover collateral requirements on open financial contracts and/or securities sold short. |
| | (7) | Non-income producing. |
| | (8) | Amount is less than 0.05%. |
| | (9) | Affiliated investment company available to Eaton Vance portfolios and funds which invests in high quality, U.S. dollar denominated money market instruments. The rate shown is the annualized seven-day yield as of October 31, 2012. |
| | | | | | | | | | |
| Securities Sold Short — (12.6)% | |
|
| Foreign Government Bonds — (11.5)% | |
| | | |
| | | | | | | | | | |
| Security | | | | Principal Amount
(000’s omitted) | | | Value | |
| | | | | | | | | | |
| | | |
Belgium — (1.9)% | | | | | | | | | | |
Belgium Kingdom Government Bond, 3.75%, 9/28/20 | | EUR | | | (15,060 | ) | | $ | (21,947,714 | ) |
| | | | | | | | | | | |
Total Belgium | | | | | | | | $ | (21,947,714 | ) |
| | | | | | | | | | | |
| | | |
France — (7.2)% | | | | | | | | | | |
Government of France, 3.75%, 10/25/19 | | EUR | | | (12,738 | ) | | $ | (18,886,917 | ) |
Government of France, 4.00%, 10/25/38 | | EUR | | | (44,492 | ) | | | (66,676,064 | ) |
| | | | | | | | | | | |
Total France | | | | | | | | $ | (85,562,981 | ) |
| | | | | | | | | | | |
| | | |
Spain — (0.4)% | | | | | | | | | | |
Spain Government Bond, 4.60%, 7/30/19 | | EUR | | | (4,000 | ) | | $ | (5,109,628 | ) |
| | | | | | | | | | | |
Total Spain | | | | | | | | $ | (5,109,628 | ) |
| | | | | | | | | | | |
| | | |
Supranational — (2.0)% | | | | | | | | | | |
European Investment Bank, 3.625%, 1/15/21 | | EUR | | | (4,200 | ) | | $ | (6,224,059 | ) |
European Investment Bank, 4.25%, 4/15/19 | | EUR | | | (6,050 | ) | | | (9,258,159 | ) |
European Investment Bank, 4.625%, 4/15/20 | | EUR | | | (5,300 | ) | | | (8,340,007 | ) |
| | | | | | | | | | | |
Total Supranational | | | | | | | | $ | (23,822,225 | ) |
| | | | | | | | | | | |
| |
Total Foreign Government Bonds
(proceeds $129,128,894) | | | $ | (136,442,548 | ) |
| | | | | | | | | | | |
| |
| Common Stocks — (1.1)% | | | | | |
| | | |
| | | | | | | | | | |
| Security | | | | Shares | | | Value | |
| | | |
China — (1.1)% | | | | | | | | | | |
Agricultural Bank of China, Ltd., Class H | | | | | (7,105,000 | ) | | $ | (3,052,156 | ) |
Bank of China, Ltd., Class H | | | | | (7,858,000 | ) | | | (3,219,283 | ) |
China Construction Bank Corp., Class H | | | | | (4,367,000 | ) | | | (3,279,396 | ) |
Industrial & Commercial Bank of China, Class H | | | | | (5,211,000 | ) | | | (3,431,438 | ) |
| | | | | | | | | | | |
Total China | | | | | | | | $ | (12,982,273 | ) |
| | | | | | | | | | | |
| | | |
Total Common Stocks
(proceeds $11,006,171) | | | | | | | | $ | (12,982,273 | ) |
| | | | | | | | | | | |
| | | |
Total Securities Sold Short
(proceeds $140,135,065) | | | | | | | | $ | (149,424,821 | ) |
| | | | | | | | | | | |
| | | | |
| | 26 | | See Notes to Consolidated Financial Statements. |
Global Macro Absolute Return Advantage Portfolio
October 31, 2012
Consolidated Statement of Assets and Liabilities
| | | | |
| Assets | | October 31, 2012 | |
Investments — | | | | |
Securities of unaffiliated issuers, at value (identified cost, $1,152,015,893) | | $ | 1,180,005,731 | |
Affiliated investment, at value (identified cost, $88,479,972) | | | 88,479,972 | |
Precious metals, at value (identified cost, $39,419,034) | | | 36,036,631 | |
Total Investments, at value (identified cost, $1,279,914,899) | | $ | 1,304,522,334 | |
Cash | | $ | 2,838,465 | |
Restricted cash* | | | 7,857,657 | |
Foreign currency, at value (identified cost, $871,793) | | | 941,207 | |
Cash collateral for securities sold short | | | 13,874,650 | |
Interest and dividends receivable | | | 8,440,222 | |
Interest receivable from affiliated investment | | | 7,834 | |
Receivable for investments sold | | | 110,863,734 | |
Receivable for variation margin on open futures contracts | | | 895,795 | |
Receivable for open forward foreign currency exchange contracts | | | 9,064,069 | |
Receivable for closed forward foreign currency exchange contracts | | | 1,955,898 | |
Receivable for open swap contracts | | | 12,836,469 | |
Premium paid on open swap contracts | | | 42,764,946 | |
Total assets | | $ | 1,516,863,280 | |
| |
| Liabilities | | | | |
Written options outstanding, at value (premiums received, $6,968,940) | | $ | 3,134,877 | |
Payable for investments purchased | | | 110,028,244 | |
Payable for open forward commodity contracts | | | 833,663 | |
Payable for open forward foreign currency exchange contracts | | | 16,679,833 | |
Payable for closed forward foreign currency exchange contracts | | | 1,382,749 | |
Payable for open swap contracts | | | 31,920,313 | |
Premium payable for open swap contracts | | | 282,184 | |
Premium received on open swap contracts | | | 10,795,357 | |
Payable for securities sold short, at value (proceeds, $140,135,065) | | | 149,424,821 | |
Payable to affiliates: | | | | |
Investment adviser fee | | | 982,542 | |
Trustees’ fees | | | 3,673 | |
Interest payable | | | 3,603,754 | |
Accrued expenses | | | 326,258 | |
Total liabilities | | $ | 329,398,268 | |
Net Assets applicable to investors’ interest in Portfolio | | $ | 1,187,465,012 | |
| |
| Sources of Net Assets | | | | |
Investors’ capital | | $ | 1,197,892,066 | |
Net unrealized depreciation | | | (10,427,054 | ) |
Total | | $ | 1,187,465,012 | |
| * | Represents restricted cash as collateral for open financial contracts. |
| | | | |
| | 27 | | See Notes to Consolidated Financial Statements. |
Global Macro Absolute Return Advantage Portfolio
October 31, 2012
Consolidated Statement of Operations
| | | | |
| Investment Income | | Year Ended
October 31, 2012 | |
Interest (net of foreign taxes, $228,800) | | $ | 64,355,882 | |
Dividends (net of foreign taxes, $16,618) | | | 249,321 | |
Interest allocated from affiliated investment | | | 95,551 | |
Expenses allocated from affiliated investment | | | (12,473 | ) |
Total investment income | | $ | 64,688,281 | |
| |
| Expenses | | | | |
Investment adviser fee | | $ | 10,642,020 | |
Trustees’ fees and expenses | | | 44,344 | |
Custodian fee | | | 1,643,659 | |
Legal and accounting services | | | 158,994 | |
Interest expense | | | 132,239 | |
Interest and dividends on securities sold short | | | 4,970,126 | |
Miscellaneous | | | 121,130 | |
Total expenses | | $ | 17,712,512 | |
Deduct — | | | | |
Reduction of custodian fee | | $ | 2,630 | |
Total expense reductions | | $ | 2,630 | |
| |
Net expenses | | $ | 17,709,882 | |
| |
Net investment income | | $ | 46,978,399 | |
| |
| Realized and Unrealized Gain (Loss) | | | | |
Net realized gain (loss) — | | | | |
Investment transactions (including a gain of $65,246 from precious metals) | | $ | (37,901,812 | ) |
Investment transactions allocated from affiliated investment | | | 1,562 | |
Securities sold short | | | 3,151,333 | |
Futures contracts | | | 5,229,797 | |
Swap contracts | | | (6,479,073 | ) |
Forward commodity contracts | | | (174,331 | ) |
Foreign currency and forward foreign currency exchange contract transactions | | | 54,590,847 | |
Net realized gain | | $ | 18,418,323 | |
Change in unrealized appreciation (depreciation) — | | | | |
Investments (including net decrease of $182,562 from precious metals) | | $ | 40,851,042 | |
Written options | | | 3,834,063 | |
Securities sold short | | | (11,416,238 | ) |
Futures contracts | | | (4,080,576 | ) |
Swap contracts | | | (19,427,835 | ) |
Forward commodity contracts | | | 204,462 | |
Foreign currency and forward foreign currency exchange contracts | | | (19,697,955 | ) |
Net change in unrealized appreciation (depreciation) | | $ | (9,733,037 | ) |
| |
Net realized and unrealized gain | | $ | 8,685,286 | |
| |
Net increase in net assets from operations | | $ | 55,663,685 | |
| | | | |
| | 28 | | See Notes to Consolidated Financial Statements. |
Global Macro Absolute Return Advantage Portfolio
October 31, 2012
Consolidated Statements of Changes in Net Assets
| | | | | | | | |
| | | Year Ended October 31, | |
| Increase (Decrease) in Net Assets | | 2012 | | | 2011 | |
From operations — | | | | | | | | |
Net investment income | | $ | 46,978,399 | | | $ | 16,209,447 | |
Net realized gain (loss) from investment transactions, written options, securities sold short, futures contracts, swap contracts, forward commodity contracts, and foreign currency and forward foreign currency exchange contract transactions | | | 18,418,323 | | | | (14,676,966 | ) |
Net change in unrealized appreciation (depreciation) from investments, written options, securities sold short, futures contracts, swap contracts, forward commodity contracts, foreign currency and forward foreign currency exchange contracts | | | (9,733,037 | ) | | | (1,796,351 | ) |
Net increase (decrease) in net assets from operations | | $ | 55,663,685 | | | $ | (263,870 | ) |
Capital transactions — | | | | | | | | |
Contributions | | $ | 332,353,874 | | | $ | 961,628,976 | |
Withdrawals | | | (266,295,812 | ) | | | (78,026,445 | ) |
Net increase in net assets from capital transactions | | $ | 66,058,062 | | | $ | 883,602,531 | |
| | |
Net increase in net assets | | $ | 121,721,747 | | | $ | 883,338,661 | |
| | |
| Net Assets | | | | | | | | |
At beginning of year | | $ | 1,065,743,265 | | | $ | 182,404,604 | |
At end of year | | $ | 1,187,465,012 | | | $ | 1,065,743,265 | |
| | | | |
| | 29 | | See Notes to Consolidated Financial Statements. |
Global Macro Absolute Return Advantage Portfolio
October 31, 2012
Consolidated Supplementary Data
| | | | | | | | | | | | |
| | | Year Ended October 31, | | | Period Ended
October 31, 2010(1) | |
| Ratios/Supplemental Data | | 2012 | | | 2011 | | |
Ratios (as a percentage of average daily net assets): | | | | | | | | | | | | |
Expenses(2) | | | 1.62 | %(3) | | | 1.42 | %(3) | | | 1.47 | %(4) |
Net investment income | | | 4.28 | % | | | 2.10 | % | | | 1.30 | %(4) |
Portfolio Turnover | | | 91 | % | | | 50 | % | | | 7 | %(5) |
| | | |
Total Return | | | 5.20 | % | | | 0.45 | % | | | 0.63 | %(5) |
| | | |
Net assets, end of period (000’s omitted) | | $ | 1,187,465 | | | $ | 1,065,743 | | | $ | 182,405 | |
| (1) | For the period from the start of business, August 31, 2010, to October 31, 2010. |
| (2) | Excludes the effect of custody fee credits, if any, of less than 0.005%. |
| (3) | Includes interest and dividend expense primarily on securities sold short of 0.47% and 0.25% for the years ended October 31, 2012 and 2011, respectively. |
| | | | |
| | 30 | | See Notes to Consolidated Financial Statements. |
Global Macro Absolute Return Advantage Portfolio
October 31, 2012
Notes to Consolidated Financial Statements
1 Significant Accounting Policies
Global Macro Absolute Return Advantage Portfolio (the Portfolio) is a Massachusetts business trust registered under the Investment Company Act of 1940, as amended (the 1940 Act), as a non-diversified, open-end management investment company. The Portfolio’s investment objective is total return. The Declaration of Trust permits the Trustees to issue interests in the Portfolio. At October 31, 2012, Eaton Vance Global Macro Absolute Return Advantage Fund, Eaton Vance Strategic Income Fund, Eaton Vance Multi-Strategy Absolute Return Fund, Eaton Vance International (Cayman Islands) Strategic Income Fund and Eaton Vance Multi-Strategy All Market Fund held an interest of 66.7%, 23.2%, 4.5%, 4.3% and 1.3%, respectively, in the Portfolio.
The Portfolio seeks to gain exposure to the commodity markets, in whole or in part, through investments in Eaton Vance GMAP Commodity Subsidiary, Ltd. (the Subsidiary), a wholly-owned subsidiary of the Portfolio organized under the laws of the Cayman Islands with the same objective and investment policies and restrictions as the Portfolio. The Portfolio may invest up to 25% of its total assets in the Subsidiary. The net assets of the Subsidiary at October 31, 2012 were $49,419,604 or 4.2% of the Portfolio’s consolidated net assets. The accompanying consolidated financial statements include the accounts of the Subsidiary. Intercompany balances and transactions have been eliminated in consolidation.
The following is a summary of significant accounting policies of the Portfolio. The policies are in conformity with accounting principles generally accepted in the United States of America.
A Investment Valuation — Debt obligations (including short-term obligations with a remaining maturity of more than sixty days) are generally valued on the basis of valuations provided by third party pricing services, as derived from such services’ pricing models. Inputs to the models may include, but are not limited to, reported trades, executable bid and asked prices, broker/dealer quotations, prices or yields of securities with similar characteristics, benchmark curves or information pertaining to the issuer, as well as industry and economic events. The pricing services may use a matrix approach, which considers information regarding securities with similar characteristics to determine the valuation for a security. Most seasoned, fixed-rate 30-year mortgage-backed securities are valued through the use of the investment adviser’s matrix pricing system, which takes into account bond prices, yield differentials, anticipated prepayments and interest rates provided by dealers. Short-term obligations purchased with a remaining maturity of sixty days or less (excluding those that are non-U.S. dollar denominated, which typically are valued by a pricing service or dealer quotes) are generally valued at amortized cost, which approximates market value. Equity securities (including common shares of closed-end investment companies) listed on a U.S. securities exchange generally are valued at the last sale or closing price on the day of valuation or, if no sales took place on such date, at the mean between the closing bid and asked prices therefore on the exchange where such securities are principally traded. Equity securities listed on the NASDAQ Global or Global Select Market generally are valued at the NASDAQ official closing price. Unlisted or listed securities for which closing sales prices or closing quotations are not available are valued at the mean between the latest available bid and asked prices or, in the case of preferred equity securities that are not listed or traded in the over-the-counter market, by a third party pricing service that will use various techniques that consider factors including, but not limited to, prices or yields of securities with similar characteristics, benchmark yields, broker/dealer quotes, quotes of underlying common stock, issuer spreads, as well as industry and economic events. The daily valuation of exchange-traded foreign securities generally is determined as of the close of trading on the principal exchange on which such securities trade. Events occurring after the close of trading on foreign exchanges may result in adjustments to the valuation of foreign securities to more accurately reflect their fair value as of the close of regular trading on the New York Stock Exchange. When valuing foreign equity securities that meet certain criteria, the Portfolio’s Trustees have approved the use of a fair value service that values such securities to reflect market trading that occurs after the close of the applicable foreign markets of comparable securities or other instruments that have a strong correlation to the fair-valued securities. Precious metals are valued at the New York composite mean quotation reported by Bloomberg at the valuation time. Exchange-traded options are valued at the mean between the bid and asked prices at valuation time as reported by the Options Price Reporting Authority for U.S. listed options or by the relevant exchange or board of trade for non-U.S. listed options. Over-the-counter options (including options on securities, indices and foreign currencies) are valued by a third party pricing service using techniques that consider factors including the value of the underlying instrument, the volatility of the underlying instrument and the period of time until option expiration. Financial and commodities futures contracts are valued at the closing settlement price established by the board of trade or exchange on which they are traded. Forward foreign currency exchange contracts are generally valued at the mean of the average bid and average asked prices that are reported by currency dealers to a third party pricing service at the valuation time. Such third party pricing service valuations are supplied for specific settlement periods and the Portfolio’s forward foreign currency exchange contracts are valued at an interpolated rate between the closest preceding and subsequent settlement period reported by the third party pricing service. Forward commodity contracts are generally valued based on the price of the underlying futures or forward contract provided by the exchange on which the underlying instruments are traded or if unavailable, based on forward rates provided by broker/dealers. Interest rate swaps, cross-currency swaps and options on interest rate swaps (“swaptions”) are normally valued using valuations provided by a third party pricing service. Such pricing service valuations are based on the present value of fixed and projected floating rate cash flows over the term of the swap contract. Future cash flows are discounted to their present value using swap rates provided by electronic data services or by broker/dealers. Alternatively, swaptions may be valued at the valuation provided by the counterparty, so determined using the same techniques as those employed by the pricing service. Credit default swaps are normally valued using valuations provided by a third party pricing service. The pricing services employ electronic data processing techniques to determine the present value based on credit spread quotations obtained from broker/dealers and expected default recovery rates determined by the pricing service using proprietary models. Foreign securities and currencies are valued in U.S. dollars, based on foreign currency exchange rate quotations supplied by a third party pricing service. The pricing service uses a proprietary model to determine the exchange rate. Inputs to the model include reported trades and implied bid/ask spreads. Investments for which valuations or market quotations are not readily available or are deemed unreliable are valued at fair value using methods determined in good faith by or at the direction of the Trustees of the Portfolio in a manner that fairly reflects the security’s value, or the amount that the Portfolio might reasonably expect to receive for the security upon its current sale in the ordinary course. Each such determination is based on a consideration of relevant factors, which are likely to vary from one pricing context to another. These factors may include, but are not limited to,
Global Macro Absolute Return Advantage Portfolio
October 31, 2012
Notes to Consolidated Financial Statements — continued
the type of security, the existence of any contractual restrictions on the security’s disposition, the price and extent of public trading in similar securities of the issuer or of comparable companies or entities, quotations or relevant information obtained from broker/dealers or other market participants, information obtained from the issuer, analysts, and/or the appropriate stock exchange (for exchange-traded securities), an analysis of the company’s or entity’s financial condition, and an evaluation of the forces that influence the issuer and the market(s) in which the security is purchased and sold.
The Portfolio may invest in Eaton Vance Cash Reserves Fund, LLC (Cash Reserves Fund), an affiliated investment company managed by Eaton Vance Management (EVM). Cash Reserves Fund generally values its investment securities utilizing the amortized cost valuation technique in accordance with Rule 2a-7 under the 1940 Act. This technique involves initially valuing a portfolio security at its cost and thereafter assuming a constant amortization to maturity of any discount or premium. If amortized cost is determined not to approximate fair value, Cash Reserves Fund may value its investment securities in the same manner as debt obligations described above.
B Investment Transactions — Investment transactions for financial statement purposes are accounted for on a trade date basis. Realized gains and losses on investments sold are determined on the basis of identified cost.
C Income — Interest income is recorded on the basis of interest accrued, adjusted for amortization of premium or accretion of discount. Inflation adjustments to the principal amount of inflation-adjusted bonds and notes are reflected as interest income. Dividend income is recorded on the ex-dividend date for dividends received in cash and/or securities. However, if the ex-dividend date has passed, certain dividends from foreign securities are recorded as the Portfolio is informed of the ex-dividend date. Withholding taxes on foreign dividends, interest and capital gains have been provided for in accordance with the Portfolio’s understanding of the applicable countries’ tax rules and rates.
D Federal Taxes — The Portfolio has elected to be treated as a partnership for federal tax purposes. No provision is made by the Portfolio for federal or state taxes on any taxable income of the Portfolio because each investor in the Portfolio is ultimately responsible for the payment of any taxes on its share of taxable income. Since at least one of the Portfolio’s investors is a regulated investment company that invests all or substantially all of its assets in the Portfolio, the Portfolio normally must satisfy the applicable source of income and diversification requirements (under the Internal Revenue Code) in order for its investors to satisfy them. The Portfolio will allocate, at least annually among its investors, each investor’s distributive share of the Portfolio’s net investment income, net realized capital gains and any other items of income, gain, loss, deduction or credit.
The Subsidiary is treated as a controlled foreign corporation under the Internal Revenue Code and is not expected to be subject to U.S. federal income tax. The Portfolio is treated as a U.S. shareholder of the Subsidiary. As a result, the Portfolio is required to include in gross income for U.S. federal tax purposes all of the Subsidiary’s income, whether or not such income is distributed by the Subsidiary. If a net loss is realized by the Subsidiary, such loss is not generally available to offset the income earned by the Portfolio.
As of October 31, 2012, the Portfolio had no uncertain tax positions that would require financial statement recognition, de-recognition, or disclosure. The Portfolio files a U.S. federal income tax return annually after its fiscal year-end which is subject to examination by the Internal Revenue Service for a period of three years from the date of filing.
E Expense Reduction — State Street Bank and Trust Company (SSBT) serves as custodian of the Portfolio. Pursuant to the custodian agreement, SSBT receives a fee reduced by credits, which are determined based on the average daily cash balance the Portfolio maintains with SSBT. All credit balances, if any, used to reduce the Portfolio’s custodian fees are reported as a reduction of expenses in the Consolidated Statement of Operations.
F Foreign Currency Translation — Investment valuations, other assets, and liabilities initially expressed in foreign currencies are translated each business day into U.S. dollars based upon current exchange rates. Purchases and sales of foreign investment securities and income and expenses denominated in foreign currencies are translated into U.S. dollars based upon currency exchange rates in effect on the respective dates of such transactions. Recognized gains or losses on investment transactions attributable to changes in foreign currency exchange rates are recorded for financial statement purposes as net realized gains and losses on investments. That portion of unrealized gains and losses on investments that results from fluctuations in foreign currency exchange rates is not separately disclosed.
G Use of Estimates — The preparation of the consolidated financial statements in conformity with accounting principles generally accepted in the United States of America requires management to make estimates and assumptions that affect the reported amounts of assets and liabilities at the date of the consolidated financial statements and the reported amounts of income and expense during the reporting period. Actual results could differ from those estimates.
H Indemnifications — Under the Portfolio’s organizational documents, its officers and Trustees may be indemnified against certain liabilities and expenses arising out of the performance of their duties to the Portfolio. Under Massachusetts law, if certain conditions prevail, interestholders in the Portfolio could be deemed to have personal liability for the obligations of the Portfolio. However, the Portfolio’s Declaration of Trust contains an express disclaimer of liability on the part of Portfolio interestholders and the By-laws provide that the Portfolio shall assume the defense on behalf of any Portfolio interestholder. Moreover, the By-laws also provide for indemnification out of Portfolio property of any interestholder held personally liable solely by reason of being or having been an interestholder for all loss or expense arising from such liability. Additionally, in the normal course of business, the Portfolio enters into agreements with service providers that may contain indemnification clauses. The Portfolio’s maximum exposure under these arrangements is unknown as this would involve future claims that may be made against the Portfolio that have not yet occurred.
Global Macro Absolute Return Advantage Portfolio
October 31, 2012
Notes to Consolidated Financial Statements — continued
I Financial and Commodities Futures Contracts — Upon entering into a financial or commodities futures contract, the Portfolio is required to deposit with the broker, either in cash or securities, an amount equal to a certain percentage of the purchase price (initial margin). Subsequent payments, known as variation margin, are made or received by the Portfolio each business day, depending on the daily fluctuations in the value of the underlying security, commodity, index or currency, and are recorded as unrealized gains or losses by the Portfolio. Gains (losses) are realized upon the expiration or closing of the financial or commodities futures contracts. Should market conditions change unexpectedly, the Portfolio may not achieve the anticipated benefits of the financial or commodities futures contracts and may realize a loss. Futures contracts have minimal counterparty risk as they are exchange traded and the clearinghouse for the exchange is substituted as the counterparty, guaranteeing counterparty performance.
J Forward Foreign Currency Exchange and Forward Commodity Contracts — The Portfolio may enter into forward foreign currency exchange contracts for the purchase or sale of a specific foreign currency at a fixed price on a future date. The forward foreign currency exchange contracts are adjusted by the daily exchange rate of the underlying currency and any gains or losses are recorded as unrealized until such time as the contracts have been closed or offset by another contract with the same broker for the same settlement date and currency. Unrealized and realized gains and losses on forward commodity contracts, which are entered into for the purchase or sale of a specific commodity at a fixed price on a future date, are accounted for as described above. Risks may arise upon entering these contracts from the potential inability of counterparties to meet the terms of their contracts and, in the case of forward foreign currency exchange contracts, from movements in the value of a foreign currency relative to the U.S. dollar.
K Written Options — Upon the writing of a call or a put option, the premium received by the Portfolio is included in the Consolidated Statement of Assets and Liabilities as a liability. The amount of the liability is subsequently marked-to-market to reflect the current market value of the option written, in accordance with the Portfolio’s policies on investment valuations discussed above. Premiums received from writing options which expire are treated as realized gains. Premiums received from writing options which are exercised or are closed are added to or offset against the proceeds or amount paid on the transaction to determine the realized gain or loss. When an index option is exercised, the Portfolio is required to deliver an amount of cash determined by the excess of the strike price of the option over the value of the index (in the case of a put) or the excess of the value of the index over the strike price of the option (in the case of a call) at contract termination. If a put option on a security is exercised, the premium reduces the cost basis of the securities purchased by the Portfolio. The Portfolio, as a writer of an option, may have no control over whether the underlying securities or other assets may be sold (call) or purchased (put) and, as a result, bears the market risk of an unfavorable change in the price of the securities or other assets underlying the written option. The Portfolio may also bear the risk of not being able to enter into a closing transaction if a liquid secondary market does not exist.
L Purchased Options — Upon the purchase of a call or put option, the premium paid by the Portfolio is included in the Consolidated Statement of Assets and Liabilities as an investment. The amount of the investment is subsequently marked-to-market to reflect the current market value of the option purchased, in accordance with the Portfolio’s policies on investment valuations discussed above. As the purchaser of an index option, the Portfolio has the right to receive a cash payment equal to any depreciation in the value of the index below the strike price of the option (in the case of a put) or equal to any appreciation in the value of the index over the strike price of the option (in the case of a call) as of the valuation date of the option. If an option which the Portfolio had purchased expires on the stipulated expiration date, the Portfolio will realize a loss in the amount of the cost of the option. If the Portfolio enters into a closing sale transaction, the Portfolio will realize a gain or loss, depending on whether the sales proceeds from the closing sale transaction are greater or less than the cost of the option. If the Portfolio exercises a put option on a security, it will realize a gain or loss from the sale of the underlying security, and the proceeds from such sale will be decreased by the premium originally paid. If the Portfolio exercises a call option on a security, the cost of the security which the Portfolio purchases upon exercise will be increased by the premium originally paid. The risk associated with purchasing options is limited to the premium originally paid.
M Interest Rate Swaps — Pursuant to interest rate swap agreements, the Portfolio either makes floating-rate payments based on a benchmark interest rate in exchange for fixed-rate payments or the Portfolio makes fixed-rate payments in exchange for payments on a floating benchmark interest rate. Payments received or made are recorded as realized gains or losses. During the term of the outstanding swap agreement, changes in the underlying value of the swap are recorded as unrealized gains or losses. The value of the swap is determined by changes in the relationship between two rates of interest. The Portfolio is exposed to credit loss in the event of non-performance by the swap counterparty. Risk may also arise from movements in interest rates.
N Cross-Currency Swaps — Cross-currency swaps are interest rate swaps in which interest cash flows are exchanged between two parties based on the notional amounts of two different currencies. The notional amounts are typically determined based on the spot exchange rates at the inception of the trade. Cross-currency swaps also involve the exchange of the notional amounts at the start of the contract at the current spot rate with an agreement to re-exchange such amounts at a later date at either the same exchange rate, a specified rate or the then current spot rate. The entire principal value of a cross-currency swap is subject to the risk that the counterparty to the swap will default on its contractual delivery obligations.
O Credit Default Swaps — When the Portfolio is the buyer of a credit default swap contract, the Portfolio is entitled to receive the par (or other agreed-upon) value of a referenced debt obligation (or basket of debt obligations) from the counterparty to the contract if a credit event by a third party, such as a U.S. or foreign corporate issuer or sovereign issuer, on the debt obligation occurs. In return, the Portfolio pays the counterparty a periodic stream of payments over the term of the contract provided that no credit event has occurred. If no credit event occurs, the Portfolio would have spent the stream of payments and received no proceeds from the contract. When the Portfolio is the seller of a credit default swap contract, it receives the stream of payments, but is obligated to pay to the buyer of the protection an amount up to the notional amount of the swap and in certain instances take delivery of securities of the reference entity upon the occurrence of a credit event, as defined under the terms of that particular swap agreement. Credit events are contract specific but may include bankruptcy, failure to pay, restructuring, obligation acceleration and repudiation/moratorium. If the Portfolio is a seller of protection and a
Global Macro Absolute Return Advantage Portfolio
October 31, 2012
Notes to Consolidated Financial Statements — continued
credit event occurs, the maximum potential amount of future payments that the Portfolio could be required to make would be an amount equal to the notional amount of the agreement. This potential amount would be partially offset by any recovery value of the respective referenced obligation, or net amount received from the settlement of a buy protection credit default swap agreement entered into by the Portfolio for the same referenced obligation. As the seller, the Portfolio may create economic leverage to its portfolio because, in addition to its total net assets, the Portfolio is subject to investment exposure on the notional amount of the swap. The interest fee paid or received on the swap contract, which is based on a specified interest rate on a fixed notional amount, is accrued daily as a component of unrealized appreciation (depreciation) and is recorded as realized gain upon receipt or realized loss upon payment. The Portfolio also records an increase or decrease to unrealized appreciation (depreciation) in an amount equal to the daily valuation. Upfront payments or receipts, if any, are recorded as other assets or other liabilities, respectively, and amortized over the life of the swap contract as realized gains or losses. For financial reporting purposes, unamortized upfront payments, if any, are netted with unrealized appreciation or depreciation on swap contracts to determine the market value of swaps as presented in Notes 5 and 8. The Portfolio segregates assets in the form of cash or liquid securities in an amount equal to the notional amount of the credit default swaps of which it is the seller. The Portfolio segregates assets in the form of cash or liquid securities in an amount equal to any unrealized depreciation of the credit default swaps of which it is the buyer, marked to market on a daily basis. These transactions involve certain risks, including the risk that the seller may be unable to fulfill the transaction.
P Swaptions — A purchased swaption contract grants the Portfolio, in return for payment of the purchase price, the right, but not the obligation, to enter into an interest rate swap, at preset terms, with the seller on the expiration date of the contract. The Portfolio pays a premium to the writer, which is recorded as an investment and subsequently marked to market to reflect the current value of the swaption. Premiums paid for swaptions that expire are treated as realized losses. Premiums paid for swaptions that are exercised or closed are added to the amounts paid or offset against the proceeds on the underlying swap transaction to determine the realized gain or loss. The writer of the swaption bears the risk of unfavorable changes in the preset rate of the underlying interest rate swap. The Portfolio’s risk is limited to the premium paid.
Q Repurchase Agreements — A repurchase agreement is the purchase by the Portfolio of securities from a counterparty in exchange for cash that is coupled with an agreement to resell those securities to the counterparty at a specified date and price. When a repurchase agreement is entered, the Portfolio typically receives securities with a value that equals or exceeds the repurchase price, including any accrued interest earned on the agreement. The value of such securities will be marked to market daily, and cash or additional securities will be exchanged between the parties as needed. Except in the case of a repurchase agreement entered to settle a short sale, the value of the securities delivered to the Portfolio will be at least equal to 90% of the repurchase price during the term of the repurchase agreement. The terms of a repurchase agreement entered to settle a short sale may provide that the cash purchase price paid by the Portfolio is more than the value of purchased securities that effectively collateralize the repurchase price payable by the counterparty. Since in such a transaction, the Portfolio normally will have used the purchased securities to settle the short sale, the Portfolio will segregate liquid assets equal to the marked to market value of the purchased securities that it is obligated to return to the counterparty under the repurchase agreement. In the event of insolvency of the counterparty to a repurchase agreement, recovery of the repurchase price owed to the Portfolio may be delayed. Such an insolvency also may result in a loss to the extent that the value of the purchased securities decreases during the delay or that value has otherwise not been maintained at an amount at least equal to the repurchase price.
R Securities Sold Short — A short sale is a transaction in which the Portfolio sells a security it does not own in anticipation of a decline in the market value of that security. To complete such a transaction, the Portfolio must borrow the security to make delivery to the buyer with an obligation to replace such borrowed security at a later date. Until the security is replaced, the Portfolio is required to repay the lender any dividends or interest, which accrue during the period of the loan. The proceeds received from a short sale are recorded as a liability and the Portfolio records an unrealized gain or loss to the extent of the difference between the proceeds received and the value of the open short position on the day of determination. A gain, limited to the price at which the Portfolio sold the security short, or a loss, potentially unlimited as there is no upward limit on the price of a security, is recorded when the short position is terminated. Interest and dividends payable on securities sold short are recorded as an expense.
2 Investment Adviser Fee and Other Transactions with Affiliates
The investment adviser fee is earned by Boston Management and Research (BMR), a subsidiary of EVM, as compensation for investment advisory services rendered to the Portfolio and the Subsidiary. Pursuant to the investment advisory agreement between the Portfolio and BMR and the investment advisory agreement between the Subsidiary and BMR, the Portfolio and Subsidiary each pay BMR a fee at an annual rate of 1.00% of its respective average daily net assets up to $500 million, 0.95% from $500 million but less than $1 billion, 0.925% from $1 billion but less than $2.5 billion, 0.90% from $2.5 billion but less than $5 billion, and 0.88% of average daily net assets of $5 billion or more, and is payable monthly. In determining the investment adviser fee for the Portfolio and Subsidiary, the applicable advisory fee rate is based on the average daily net assets of the Portfolio (inclusive of its interest in the Subsidiary). Such fee rate is then assessed separately on the Portfolio’s average daily net assets (exclusive of its interest in the Subsidiary) and the Subsidiary’s average daily net assets to determine the amount of the investment adviser fee. The Portfolio invests its cash in Cash Reserves Fund. EVM does not currently receive a fee for advisory services provided to Cash Reserves Fund. For the year ended October 31, 2012, the Portfolio’s investment adviser fee amounted to $10,642,020 or 0.97% of the Portfolio’s consolidated average daily net assets.
Trustees and officers of the Portfolio who are members of EVM’s or BMR’s organizations receive remuneration for their services to the Portfolio out of the investment adviser fee. Trustees of the Portfolio who are not affiliated with the investment adviser may elect to defer receipt of all or a percentage of their annual fees in accordance with the terms of the Trustees Deferred Compensation Plan. For the year ended October 31, 2012, no significant amounts have been deferred. Certain officers and Trustees of the Portfolio are officers of the above organizations.
Global Macro Absolute Return Advantage Portfolio
October 31, 2012
Notes to Consolidated Financial Statements — continued
3 Purchases and Sales of Investments
Purchases and sales of investments, other than short-term obligations and including maturities and securities sold short, for the year ended October 31, 2012 were as follows:
| | | | | | | | |
| | | Purchases | | | Sales | |
| | |
Investments (non-U.S. Government) | | $ | 685,493,560 | | | $ | 424,303,866 | |
U.S. Government and Agency Securities | | | 52,430,892 | | | | 750,290 | |
| | |
| | | $ | 737,924,452 | | | $ | 425,054,156 | |
4 Federal Income Tax Basis of Investments
The cost and unrealized appreciation (depreciation) of investments of the Portfolio at October 31, 2012, as determined on a federal income tax basis, were as follows:
| | | | |
| |
Aggregate cost | | $ | 1,283,243,706 | |
| |
Gross unrealized appreciation | | $ | 37,286,459 | |
Gross unrealized depreciation | | | (16,007,831 | ) |
| |
Net unrealized appreciation | | $ | 21,278,628 | |
The net unrealized depreciation on written options, securities sold short, futures contracts, swap contracts, forward commodity contracts, foreign currency and forward foreign currency exchange contracts at October 31, 2012 on a federal income tax basis was $14,408,391.
5 Financial Instruments
The Portfolio may trade in financial instruments with off-balance sheet risk in the normal course of its investing activities. These financial instruments may include written options, forward commodity contracts, forward foreign currency exchange contracts, futures contracts and swap contracts and may involve, to a varying degree, elements of risk in excess of the amounts recognized for financial statement purposes. The notional or contractual amounts of these instruments represent the investment the Portfolio has in particular classes of financial instruments and do not necessarily represent the amounts potentially subject to risk. The measurement of the risks associated with these instruments is meaningful only when all related and offsetting transactions are considered.
A summary of obligations under these financial instruments at October 31, 2012 is as follows:
| | | | | | | | | | |
| Forward Commodity Contracts(1) | | | | | | | |
| | | | |
| | | | | | | | | | |
Sales | |
| Settlement Date | | Deliver | | In Exchange For | | Counterparty | | Net
Unrealized
Depreciation | |
| | | | |
| 12/27/12 | | Gold
8,388 Troy Ounces | | United States Dollar 13,785,269 | | Citibank NA | | $ | (608,014 | ) |
| 12/27/12 | | Gold
3,113 Troy Ounces | | United States Dollar 5,191,707 | | Merrill Lynch International | | | (225,649 | ) |
| | | | |
| | | | | | | | | $ | (833,663 | ) |
| (1) | Non-deliverable contracts that are settled with the counterparty in cash. |
Global Macro Absolute Return Advantage Portfolio
October 31, 2012
Notes to Consolidated Financial Statements — continued
| | | | | | | | | | |
| Forward Foreign Currency Exchange Contracts | | | | | |
| | | | |
| | | | | | | | | | |
Sales | |
| Settlement Date | | Deliver | | In Exchange For | | Counterparty | | Net Unrealized
Appreciation
(Depreciation) | |
| | | | | | | | | | |
| 11/5/12 | | New Taiwan Dollar
341,774,000 | | United States Dollar
11,421,019 | | Australia and New Zealand Banking Group Limited | | $ | (280,403 | ) |
| 11/5/12 | | New Taiwan Dollar
255,180,000 | | United States Dollar
8,527,318 | | Citibank NA | | | (209,358 | ) |
| 11/5/12 | | New Taiwan Dollar
286,357,000 | | United States Dollar
9,569,156 | | JPMorgan Chase Bank | | | (234,937 | ) |
| 11/5/12 | | New Taiwan Dollar
331,272,000 | | United States Dollar
11,069,705 | | Nomura International PLC | | | (272,156 | ) |
| 11/7/12 | | New Turkish Lira
21,000,000 | | United States Dollar
10,649,087 | | Barclays Bank PLC | | | (1,057,259 | ) |
| 11/7/12 | | Philippine Peso
59,066,000 | | United States Dollar
1,430,551 | | Standard Chartered Bank | | | (3,311 | ) |
| 11/8/12 | | Euro
632,000 | | United States Dollar
871,577 | | JPMorgan Chase Bank | | | 52,368 | |
| 11/8/12 | | Serbian Dinar
97,070,000 | | Euro
850,000 | | Deutsche Bank | | | (4,464 | ) |
| 11/8/12 | | South African Rand
118,706,634 | | United States Dollar
14,304,072 | | Standard Bank | | | 625,247 | |
| 11/8/12 | | South African Rand
241,865,285 | | United States Dollar
29,160,773 | | Standard Chartered Bank | | | 1,290,107 | |
| 11/15/12 | | Euro
1,885,000 | | United States Dollar
2,558,284 | | Goldman Sachs International | | | 114,766 | |
| 11/15/12 | | Japanese Yen
3,582,000,000 | | United States Dollar
45,758,815 | | Goldman Sachs International | | | 883,868 | |
| 11/15/12 | | Japanese Yen
743,000,000 | | United States Dollar
9,249,024 | | Goldman Sachs International | | | (59,207 | ) |
| 11/16/12 | | New Taiwan Dollar
208,988,000 | | United States Dollar
6,982,093 | | BNP Paribas SA | | | (177,225 | ) |
| 11/16/12 | | New Taiwan Dollar
189,084,000 | | United States Dollar
6,316,064 | | JPMorgan Chase Bank | | | (161,402 | ) |
| 11/16/12 | | New Taiwan Dollar
200,705,000 | | United States Dollar
6,704,246 | | Nomura International PLC | | | (171,321 | ) |
| 11/19/12 | | Euro
9,680,000 | | United States Dollar
12,711,195 | | Goldman Sachs International | | | 162,611 | |
| 11/20/12 | | Euro
51,545,079 | | United States Dollar
63,364,366 | | Australia and New Zealand Banking Group Limited | | | (3,456,231 | ) |
| 11/20/12 | | Euro
30,357,761 | | United States Dollar
37,602,830 | | Bank of America | | | (1,751,532 | ) |
| 11/20/12 | | Euro
8,417,000 | | United States Dollar
10,873,670 | | Citibank NA | | | (37,730 | ) |
| 11/20/12 | | Euro
44,812,071 | | United States Dollar
55,066,194 | | Goldman Sachs International | | | (3,026,052 | ) |
| 11/22/12 | | Serbian Dinar 148,740,000 | | Euro
1,302,110 | | Citibank NA | | | (923 | ) |
| 11/23/12 | | Euro
982,000 | | United States Dollar
1,334,450 | | Credit Suisse International | | | 61,398 | |
Global Macro Absolute Return Advantage Portfolio
October 31, 2012
Notes to Consolidated Financial Statements — continued
| | | | | | | | | | |
| Forward Foreign Currency Exchange Contracts (continued) | | | | | |
| | | | |
| | | | | | | | | | |
Sales | |
| Settlement Date | | Deliver | | In Exchange For | | Counterparty | | Net Unrealized
Appreciation
(Depreciation) | |
| | | | | | | | | | |
| 11/26/12 | | Euro
13,720,660 | | Swedish Krona
116,852,000 | | Barclays Bank PLC | | $ | (183,103 | ) |
| 11/28/12 | | British Pound Sterling
1,122,392 | | United States Dollar
1,780,462 | | State Street Bank and Trust Co. | | | (30,637 | ) |
| 11/29/12 | | Euro
2,515,000 | | United States Dollar
3,374,627 | | Standard Chartered Bank | | | 114,045 | |
| 12/3/12 | | New Zealand Dollar
65,858,776 | | United States Dollar
54,475,087 | | Goldman Sachs International | | | 419,507 | |
| 12/7/12 | | New Taiwan Dollar
457,748,000 | | United States Dollar
15,355,518 | | Barclays Bank PLC | | | (341,749 | ) |
| 12/7/12 | | New Taiwan Dollar
505,958,000 | | United States Dollar
16,975,608 | | Nomura International PLC | | | (374,894 | ) |
| 12/10/12 | | Euro
41,009,250 | | United States Dollar
53,435,052 | | Deutsche Bank | | | 261,993 | |
| 12/10/12 | | South African Rand
38,725,725 | | United States Dollar
4,527,159 | | Credit Suisse International | | | 85,749 | |
| 12/10/12 | | South African Rand
7,200,000 | | United States Dollar
837,365 | | Deutsche Bank | | | 11,605 | |
| 12/11/12 | | Euro
78,784,000 | | United States Dollar
100,619,773 | | Goldman Sachs International | | | (1,533,717 | ) |
| 12/11/12 | | Euro
1,820,000 | | United States Dollar
2,350,994 | | JPMorgan Chase Bank | | | (8,868 | ) |
| 12/17/12 | | Australian Dollar
37,381,000 | | United States Dollar
38,030,682 | | Citibank NA | | | (632,290 | ) |
| 12/17/12 | | Australian Dollar
27,291,000 | | United States Dollar
27,820,582 | | Goldman Sachs International | | | (406,356 | ) |
| 12/24/12 | | New Taiwan Dollar
164,276,100 | | United States Dollar
5,614,549 | | Australia and New Zealand Banking Group Limited | | | (22,155 | ) |
| 12/24/12 | | New Taiwan Dollar
205,345,125 | | United States Dollar
7,017,467 | | Citibank NA | | | (28,413 | ) |
| 12/24/12 | | New Taiwan Dollar
177,965,775 | | United States Dollar
6,081,805 | | Nomura International PLC | | | (24,624 | ) |
| 1/24/13 | | Euro
1,910,000 | | United States Dollar
2,492,359 | | Standard Chartered Bank | | | 14,632 | |
| 1/31/13 | | Euro
839,000 | | United States Dollar
1,104,527 | | State Street Bank and Trust Co. | | | 16,073 | |
| 2/7/13 | | Euro
973,000 | | United States Dollar
1,292,694 | | Standard Chartered Bank | | | 30,318 | |
| 2/28/13 | | Euro
1,989,000 | | United States Dollar
2,663,917 | | Standard Chartered Bank | | | 82,868 | |
| 3/14/13 | | Euro
1,716,000 | | United States Dollar
2,241,645 | | Goldman Sachs International | | | 14,565 | |
| 3/28/13 | | Euro
2,215,000 | | United States Dollar
2,954,256 | | Goldman Sachs International | | | 79,180 | |
| 4/4/13 | | Euro
2,000,000 | | United States Dollar
2,656,040 | | Goldman Sachs International | | | 59,863 | |
| | | | |
| | | | | | | | | $ | (10,109,554 | ) |
Global Macro Absolute Return Advantage Portfolio
October 31, 2012
Notes to Consolidated Financial Statements — continued
| | | | | | | | | | |
| Forward Foreign Currency Exchange Contracts (continued) | | | | | |
| | | | |
| | | | | | | | | | |
Purchases | |
| Settlement Date | | In Exchange For | | Deliver | | Counterparty | | Net Unrealized
Appreciation
(Depreciation) | |
| | | | | | | | | | |
| 11/5/12 | | Yuan Offshore Renminbi
4,480,000 | | United States Dollar
709,422 | | Bank of America | | $ | 8,194 | |
| 11/5/12 | | Yuan Offshore Renminbi
15,060,000 | | United States Dollar
2,368,111 | | JPMorgan Chase Bank | | | 44,233 | |
| 11/7/12 | | New Turkish Lira
21,003,595 | | United States Dollar
11,399,509 | | Deutsche Bank | | | 308,841 | |
| 11/8/12 | | Serbian Dinar
184,641,795 | | Euro
1,653,755 | | Citibank NA | | | (39,375 | ) |
| 11/9/12 | | Peruvian New Sol
20,597,180 | | United States Dollar
7,924,126 | | Standard Chartered Bank | | | 22,348 | |
| 11/13/12 | | Polish Zloty
24,486,958 | | Euro
5,956,014 | | Barclays Bank PLC | | | (58,256 | ) |
| 11/13/12 | | Polish Zloty
39,499,000 | | Euro
9,609,293 | | JPMorgan Chase Bank | | | (96,394 | ) |
| 11/13/12 | | South Korean Won
18,175,000,000 | | United States Dollar
15,970,300 | | Nomura International PLC | | | 686,167 | |
| 11/13/12 | | Yuan Offshore Renminbi
7,080,000 | | United States Dollar
1,128,287 | | Bank of America | | | 3,053 | |
| 11/15/12 | | Indian Rupee
429,698,000 | | United States Dollar
7,685,530 | | Goldman Sachs International | | | 281,049 | |
| 11/15/12 | | Indian Rupee
525,187,000 | | United States Dollar
9,391,756 | | Standard Chartered Bank | | | 345,184 | |
| 11/15/12 | | Yuan Offshore Renminbi
42,397,000 | | United States Dollar
6,717,953 | | Australia and New Zealand Banking Group Limited | | | 68,308 | |
| 11/15/12 | | Yuan Offshore Renminbi
42,701,000 | | United States Dollar
6,766,123 | | Bank of America | | | 68,798 | |
| 11/15/12 | | Yuan Offshore Renminbi
48,153,000 | | United States Dollar
7,629,769 | | Deutsche Bank | | | 77,824 | |
| 11/19/12 | | Hong Kong Dollar
85,165,748 | | United States Dollar
10,987,002 | | Goldman Sachs International | | | 2,406 | |
| 11/19/12 | | Indian Rupee
1,689,593,000 | | United States Dollar
32,207,263 | | Standard Chartered Bank | | | (907,752 | ) |
| 11/19/12 | | Malaysian Ringgit
12,686,000 | | United States Dollar
4,057,572 | | Nomura International PLC | | | 102,366 | |
| 11/19/12 | | Philippine Peso
698,325,000 | | United States Dollar
16,876,314 | | Australia and New Zealand Banking Group Limited | | | 82,515 | |
| 11/19/12 | | Singapore Dollar
5,891,242 | | United States Dollar
4,791,887 | | Standard Chartered Bank | | | 37,705 | |
| 11/19/12 | | Yuan Offshore Renminbi
3,100,000 | | United States Dollar
488,574 | | Deutsche Bank | | | 5,888 | |
| 11/19/12 | | Yuan Offshore Renminbi
33,295,000 | | United States Dollar
5,299,220 | | Goldman Sachs International | | | 28,564 | |
| 11/19/12 | | Yuan Offshore Renminbi 36,800,000 | | United States Dollar 5,854,745 | | Standard Chartered Bank | | | 33,901 | |
| 11/19/12 | | Yuan Renminbi
1,970,000 | | United States Dollar
312,465 | | Goldman Sachs International | | | 1,757 | |
Global Macro Absolute Return Advantage Portfolio
October 31, 2012
Notes to Consolidated Financial Statements — continued
| | | | | | | | | | |
| Forward Foreign Currency Exchange Contracts (continued) | | | | | |
| | | | |
| | | | | | | | | | |
Purchases | |
| Settlement Date | | In Exchange For | | Deliver | | Counterparty | | Net Unrealized
Appreciation
(Depreciation) | |
| | | | | | | | | | |
| 11/20/12 | | Indian Rupee
709,912,000 | | United States Dollar
13,119,793 | | Deutsche Bank | | $ | 28,571 | |
| 11/20/12 | | Indian Rupee
527,947,000 | | United States Dollar
9,755,118 | | Goldman Sachs International | | | 23,051 | |
| 11/20/12 | | Yuan Offshore Renminbi
83,489,000 | | United States Dollar
13,282,794 | | Bank of America | | | 75,929 | |
| 11/20/12 | | Yuan Offshore Renminbi
79,513,500 | | United States Dollar
12,650,306 | | Barclays Bank PLC | | | 72,313 | |
| 11/20/12 | | Yuan Offshore Renminbi
81,265,000 | | United States Dollar
12,921,768 | | Citibank NA | | | 81,102 | |
| 11/21/12 | | South Korean Won
17,639,284,000 | | United States Dollar
15,570,715 | | Standard Chartered Bank | | | 588,681 | |
| 11/26/12 | | Swedish Krona
70,900,000 | | Euro
8,325,603 | | Credit Suisse International | | | (111,858 | ) |
| 11/26/12 | | Swedish Krona
116,851,890 | | Euro
13,720,808 | | Deutsche Bank | | | (183,312 | ) |
| 11/27/12 | | Polish Zloty
47,454,500 | | Euro
11,507,190 | | HSBC Bank USA | | | (94,112 | ) |
| 11/29/12 | | Malaysian Ringgit
13,972,000 | | United States Dollar
4,528,277 | | Goldman Sachs International | | | 50,212 | |
| 11/29/12 | | South Korean Won
17,638,144,000 | | United States Dollar
15,916,748 | | Standard Chartered Bank | | | 235,494 | |
| 12/4/12 | | Brazilian Real
78,293,000 | | United States Dollar
38,361,997 | | BNP Paribas SA | | | 31,636 | |
| 12/14/12 | | Hungarian Forint
258,409,906 | | United States Dollar
1,085,528 | | Goldman Sachs International | | | 90,352 | |
| 12/14/12 | | Hungarian Forint
37,843,748 | | United States Dollar
164,976 | | Goldman Sachs International | | | 7,230 | |
| 12/17/12 | | South Korean Won
14,033,238,200 | | United States Dollar
12,580,786 | | Deutsche Bank | | | 258,759 | |
| 12/17/12 | | South Korean Won
3,198,738,600 | | United States Dollar
2,867,667 | | Goldman Sachs International | | | 58,982 | |
| 12/17/12 | | South Korean Won
5,922,595,200 | | United States Dollar
5,308,412 | | Standard Chartered Bank | | | 110,397 | |
| 12/24/12 | | Yuan Renminbi
96,431,000 | | United States Dollar
15,294,127 | | Nomura International PLC | | | 22,957 | |
| 12/31/12 | | Mexican Peso
220,659,713 | | United States Dollar
16,912,678 | | Toronto-Dominion Bank | | | (154,253 | ) |
| 1/8/13 | | South Korean Won
5,772,226,000 | | United States Dollar
5,127,677 | | Nomura International PLC | | | 147,682 | |
| 1/9/13 | | New Turkish Lira
43,831,533 | | United States Dollar
24,074,380 | | HSBC Bank USA | | | 160,704 | |
| 1/14/13 | | Indian Rupee
263,906,000 | | United States Dollar
4,920,865 | | Deutsche Bank | | | (78,392 | ) |
| 1/14/13 | | Indian Rupee
270,635,000 | | United States Dollar
5,047,277 | | Goldman Sachs International | | | (81,332 | ) |
| 1/29/13 | | Indian Rupee
276,100,000 | | United States Dollar
5,070,707 | | Citibank NA | | | (15,866 | ) |
Global Macro Absolute Return Advantage Portfolio
October 31, 2012
Notes to Consolidated Financial Statements — continued
| | | | | | | | | | |
| Forward Foreign Currency Exchange Contracts (continued) | | | | | |
| | | | |
| | | | | | | | | | |
Purchases | |
| Settlement Date | | In Exchange For | | Deliver | | Counterparty | | Net Unrealized
Appreciation
(Depreciation) | |
| | | | | | | | | | |
| 1/29/13 | | Indian Rupee
296,300,000 | | United States Dollar
5,442,689 | | Deutsche Bank | | $ | (18,027 | ) |
| 1/30/13 | | Yuan Offshore Renminbi
40,759,600 | | United States Dollar
6,472,860 | | BNP Paribas SA | | | (1,074 | ) |
| 1/30/13 | | Yuan Offshore Renminbi
34,172,000 | | United States Dollar
5,427,573 | | Citibank NA | | | (1,763 | ) |
| 1/30/13 | | Yuan Offshore Renminbi
36,753,000 | | United States Dollar
5,836,589 | | Standard Chartered Bank | | | (969 | ) |
| 1/31/13 | | Norwegian Krone
133,148,315 | | Euro
17,796,413 | | Barclays Bank PLC | | | 189,991 | |
| 1/31/13 | | Norwegian Krone
133,148,315 | | Euro
17,800,339 | | Deutsche Bank | | | 184,898 | |
| 1/31/13 | | Peruvian New Sol
41,519,050 | | United States Dollar
15,898,545 | | Deutsche Bank | | | 44,934 | |
| 2/4/13 | | Yuan Offshore Renminbi
136,664,000 | | United States Dollar
21,687,535 | | BNP Paribas SA | | | 10,330 | |
| 2/19/13 | | Indian Rupee
390,229,000 | | United States Dollar
7,265,481 | | Bank of America | | | (144,200 | ) |
| 2/19/13 | | Indian Rupee
543,121,000 | | United States Dollar
10,113,985 | | Citibank NA | | | (202,581 | ) |
| | | | |
| | | | | | | | | $ | 2,493,790 | |
| | | | | | | | | | | | | | | | |
| Futures Contracts | |
Expiration
Month/Year | | Contracts | | Position | | Aggregate Cost | | | Value | | | Net Unrealized
Appreciation
(Depreciation) | |
| | | | | |
| 11/12 | | 190
CAC 40 Index | | Short | | $ | (8,650,177 | ) | | $ | (8,434,692 | ) | | $ | 215,485 | |
| 11/12 | | 559
Hang Seng H-Shares | | Long | | | 38,293,790 | | | | 38,253,386 | | | | (40,404 | ) |
| 12/12 | | 236
Dow Jones Euro Stoxx 50 Index | | Short | | | (7,754,343 | ) | | | (7,659,517 | ) | | | 94,826 | |
| 12/12 | | 757
Euro-Bobl | | Short | | | (123,256,029 | ) | | | (123,462,521 | ) | | | (206,492 | ) |
| 12/12 | | 17
Euro-Bund | | Short | | | (3,076,417 | ) | | | (3,121,854 | ) | | | (45,437 | ) |
| 12/12 | | 114
Euro-Schatz | | Short | | | (16,370,445 | ) | | | (16,357,146 | ) | | | 13,299 | |
| 12/12 | | 42
Japan 10-Year Bond | | Short | | | (75,710,999 | ) | | | (75,892,522 | ) | | | (181,523 | ) |
| 1/13 | | 424
Platinum | | Long | | | 35,329,112 | | | | 33,432,400 | | | | (1,896,712 | ) |
| | | | | |
| | | | | | | | | | | | | | | $ | (2,046,958 | ) |
Global Macro Absolute Return Advantage Portfolio
October 31, 2012
Notes to Consolidated Financial Statements — continued
CAC 40 Index: Cotation Assistée en Continu Index comprised of 40 largest companies listed on the Paris Bourse Exchange.
Dow Jones Euro Stoxx 50 Index: Market capitalization-weighted stock index of 50 large, blue-chip European companies operating within eurozone nations.
Euro-Bobl: Medium-term debt securities issued by the Federal Republic of Germany with a term to maturity of 4.5 to 5 years.
Euro-Bund: Long-term debt securities issued by the Federal Republic of Germany with a term to maturity of 8.5 to 10.5 years.
Euro-Schatz: Short-term debt securities issued by the Federal Republic of Germany with a term to maturity of 1.75 to 2.25 years.
Hang Seng H-Shares: Hang Seng China Enterprises Index comprised of H-Shares listed on the Hong Kong Stock Exchange.
Japan 10-Year Bond: Japanese Government Bonds (JGB) having a maturity of 7 years or more but less than 11 years.
| | | | | | | | | | | | | | | | | | |
| Interest Rate Swaps | |
| Counterparty | | Notional
Amount
(000’s omitted) | | Portfolio
Pays/Receives
Floating Rate | | Floating
Rate Index | | Annual
Fixed Rate | | | Termination
Date | | | Net Unrealized
Appreciation
(Depreciation) | |
| | | | | | |
| Bank of America | | HUF 787,130 | | Receives | | 6-month HUF BUBOR | | | 7.32 | % | | | 12/16/16 | | | $ | (302,136 | ) |
| Bank of America | | HUF 312,000 | | Pays | | 6-month HUF BUBOR | | | 6.99 | | | | 12/19/16 | | | | 72,855 | |
| Bank of America | | HUF 312,000 | | Receives | | 6-month HUF BUBOR | | | 7.29 | | | | 12/19/16 | | | | (117,447 | ) |
| Bank of America | | HUF 260,000 | | Pays | | 6-month HUF BUBOR | | | 6.97 | | | | 12/20/16 | | | | 45,720 | |
| Bank of America | | HUF 260,000 | | Receives | | 6-month HUF BUBOR | | | 7.34 | | | | 12/20/16 | | | | (100,502 | ) |
| Bank of America | | HUF 358,000 | | Pays | | 6-month HUF BUBOR | | | 6.91 | | | | 12/21/16 | | | | 61,066 | |
| Bank of America | | HUF 358,000 | | Receives | | 6-month HUF BUBOR | | | 7.37 | | | | 12/21/16 | | | | (142,459 | ) |
| Bank of America | | HUF 111,400 | | Receives | | 6-month HUF BUBOR | | | 7.32 | | | | 12/22/16 | | | | (42,602 | ) |
| Bank of America | | HUF 233,000 | | Receives | | 6-month HUF BUBOR | | | 7.93 | | | | 1/10/17 | | | | (118,364 | ) |
| Bank of America | | HUF 339,000 | | Pays | | 6-month HUF BUBOR | | | 6.95 | | | | 1/17/17 | | | | 68,579 | |
| Bank of America | | HUF 339,000 | | Receives | | 6-month HUF BUBOR | | | 7.91 | | | | 1/17/17 | | | | (170,544 | ) |
| Bank of America | | NZD 12,749 | | Pays | | 3-month NZD Bank Bill | | | 3.78 | | | | 10/30/22 | | | | 80,767 | |
| Bank of America | | PLN 12,640 | | Pays | | 6-month PLN WIBOR | | | 4.34 | | | | 7/30/17 | | | | 14,028 | |
| Bank of America | | PLN 9,114 | | Pays | | 6-month PLN WIBOR | | | 4.31 | | | | 8/10/17 | | | | 7,331 | |
| Bank of America | | PLN 18,180 | | Pays | | 6-month PLN WIBOR | | | 4.35 | | | | 8/23/17 | | | | 25,940 | |
| Bank of America | | PLN 17,740 | | Pays | | 6-month PLN WIBOR | | | 4.30 | | | | 9/18/17 | | | | 18,835 | |
| Barclays Bank PLC | | PLN 39,020 | | Pays | | 6-month PLN WIBOR | | | 4.43 | | | | 7/27/17 | | | | 92,096 | |
| Barclays Bank PLC | | PLN 21,490 | | Pays | | 6-month PLN WIBOR | | | 4.32 | | | | 8/2/17 | | | | 18,255 | |
| Barclays Bank PLC | | PLN 10,800 | | Pays | | 6-month PLN WIBOR | | | 4.35 | | | | 8/27/17 | | | | 15,591 | |
| BNP Paribas NA | | PLN 20,724 | | Pays | | 6-month PLN WIBOR | | | 4.25 | | | | 8/7/17 | | | | (2,303 | ) |
| Citibank NA | | NZD 19,788 | | Pays | | 3-month NZD Bank Bill | | | 3.97 | | | | 8/13/22 | | | | 442,897 | |
| Citibank NA | | NZD 15,674 | | Pays | | 3-month NZD Bank Bill | | | 3.90 | | | | 8/13/22 | | | | 275,916 | |
| Citibank NA | | NZD 17,922 | | Pays | | 3-month NZD Bank Bill | | | 3.86 | | | | 8/13/22 | | | | 273,144 | |
| Citibank NA | | NZD 13,065 | | Pays | | 3-month NZD Bank Bill | | | 3.82 | | | | 8/13/22 | | | | 157,902 | |
| Citibank NA | | NZD 20,593 | | Pays | | 3-month NZD Bank Bill | | | 3.80 | | | | 8/30/22 | | | | 212,297 | |
| Citibank NA | | NZD 7,279 | | Pays | | 3-month NZD Bank Bill | | | 3.78 | | | | 10/30/22 | | | | 46,112 | |
| Citibank NA | | PLN 17,853 | | Pays | | 6-month PLN WIBOR | | | 4.33 | | | | 7/30/17 | | | | 19,190 | |
| Citibank NA | | PLN 13,400 | | Pays | | 6-month PLN WIBOR | | | 4.31 | | | | 8/2/17 | | | | 10,446 | |
| Citibank NA | | PLN 2,906 | | Pays | | 6-month PLN WIBOR | | | 4.24 | | | | 8/7/17 | | | | (527 | ) |
| Citibank NA | | PLN 8,910 | | Pays | | 6-month PLN WIBOR | | | 4.30 | | | | 8/10/17 | | | | 5,918 | |
| Citibank NA | | PLN 8,170 | | Pays | | 6-month PLN WIBOR | | | 4.40 | | | | 8/20/17 | | | | 17,685 | |
| Credit Suisse International | | HUF 492,670 | | Pays | | 6-month HUF BUBOR | | | 6.93 | | | | 12/16/16 | | | | 109,929 | |
| Credit Suisse International | | HUF 492,670 | | Receives | | 6-month HUF BUBOR | | | 7.32 | | | | 12/16/16 | | | | (189,327 | ) |
Global Macro Absolute Return Advantage Portfolio
October 31, 2012
Notes to Consolidated Financial Statements — continued
| | | | | | | | | | | | | | | | | | |
| Interest Rate Swaps (continued) | |
| Counterparty | | Notional
Amount
(000’s omitted) | | Portfolio
Pays/Receives
Floating Rate | | Floating Rate Index | | Annual
Fixed Rate | | | Termination
Date | | | Net Unrealized
Appreciation
(Depreciation) | |
| Credit Suisse International | | HUF 120,600 | | Pays | | 6-month HUF BUBOR | | | 6.98% | | | | 12/22/16 | | | $ | 21,723 | |
| Credit Suisse International | | HUF 120,600 | | Receives | | 6-month HUF BUBOR | | | 7.29 | | | | 12/22/16 | | | | (45,391 | ) |
| Credit Suisse International | | HUF 103,000 | | Pays | | 6-month HUF BUBOR | | | 6.99 | | | | 12/27/16 | | | | 18,981 | |
| Credit Suisse International | | HUF 103,000 | | Receives | | 6-month HUF BUBOR | | | 7.38 | | | | 12/27/16 | | | | (40,722 | ) |
| Credit Suisse International | | HUF 400,000 | | Receives | | 6-month HUF BUBOR | | | 7.92 | | | | 1/11/17 | | | | (201,848 | ) |
| Credit Suisse International | | HUF 514,000 | | Receives | | 6-month HUF BUBOR | | | 7.63 | | | | 1/16/17 | | | | (229,618 | ) |
| Credit Suisse International | | HUF 176,000 | | Pays | | 6-month HUF BUBOR | | | 7.10 | | | | 1/17/17 | | | | 38,643 | |
| Credit Suisse International | | HUF 176,000 | | Receives | | 6-month HUF BUBOR | | | 7.83 | | | | 1/17/17 | | | | (85,711 | ) |
| Credit Suisse International | | HUF 186,000 | | Pays | | 6-month HUF BUBOR | | | 5.87 | | | | 1/20/17 | | | | (1,455 | ) |
| Credit Suisse International | | HUF 186,000 | | Receives | | 6-month HUF BUBOR | | | 7.75 | | | | 1/20/17 | | | | (87,599 | ) |
| Credit Suisse International | | PLN 10,290 | | Pays | | 6-month PLN WIBOR | | | 4.40 | | | | 8/20/17 | | | | 22,274 | |
| Credit Suisse International | | USD 9,461 | | Receives | | 3-month USD-LIBOR-BBA | | | 1.81 | | | | 10/23/22 | | | | (63,094 | ) |
| Deutsche Bank | | HUF 182,820 | | Pays | | 6-month HUF BUBOR | | | 7.01 | | | | 1/19/17 | | | | 37,882 | |
| Deutsche Bank | | HUF 182,820 | | Receives | | 6-month HUF BUBOR | | | 7.98 | | | | 1/19/17 | | | | (94,533 | ) |
| Deutsche Bank | | NZD 14,775 | | Pays | | 3-month NZD Bank Bill | | | 3.79 | | | | 10/30/22 | | | | 106,456 | |
| Deutsche Bank | | PLN 7,207 | | Pays | | 6-month PLN WIBOR | | | 4.34 | | | | 7/30/17 | | | | 8,503 | |
| Deutsche Bank | | PLN 31,119 | | Pays | | 6-month PLN WIBOR | | | 4.36 | | | | 8/1/17 | | | | 44,348 | |
| Deutsche Bank | | PLN 18,850 | | Pays | | 6-month PLN WIBOR | | | 4.28 | | | | 8/6/17 | | | | 5,767 | |
| Deutsche Bank | | PLN 13,020 | | Pays | | 6-month PLN WIBOR | | | 4.24 | | | | 8/7/17 | | | | (2,355 | ) |
| Deutsche Bank | | PLN 10,750 | | Pays | | 6-month PLN WIBOR | | | 4.33 | | | | 8/17/17 | | | | 11,268 | |
| Goldman Sachs International | | PLN 6,181 | | Pays | | 6-month PLN WIBOR | | | 4.35 | | | | 8/1/17 | | | | 7,769 | |
| JPMorgan Chase Bank | | HUF 1,612,000 | | Pays | | 6-month HUF BUBOR | | | 6.93 | | | | 12/19/16 | | | | 363,666 | |
| JPMorgan Chase Bank | | HUF 1,612,000 | | Receives | | 6-month HUF BUBOR | | | 7.26 | | | | 12/19/16 | | | | (597,057 | ) |
| JPMorgan Chase Bank | | HUF 529,000 | | Pays | | 6-month HUF BUBOR | | | 6.94 | | | | 12/20/16 | | | | 93,038 | |
| JPMorgan Chase Bank | | HUF 529,000 | | Receives | | 6-month HUF BUBOR | | | 7.34 | | | | 12/20/16 | | | | (204,716 | ) |
| JPMorgan Chase Bank | | HUF 642,000 | | Receives | | 6-month HUF BUBOR | | | 7.36 | | | | 12/21/16 | | | | (251,322 | ) |
| JPMorgan Chase Bank | | HUF 627,500 | | Pays | | 6-month HUF BUBOR | | | 6.99 | | | | 12/22/16 | | | | 148,719 | |
| JPMorgan Chase Bank | | HUF 627,500 | | Receives | | 6-month HUF BUBOR | | | 7.30 | | | | 12/22/16 | | | | (237,441 | ) |
| JPMorgan Chase Bank | | HUF 616,000 | | Receives | | 6-month HUF BUBOR | | | 7.37 | | | | 12/27/16 | | | | (242,302 | ) |
| JPMorgan Chase Bank | | HUF 227,000 | | Receives | | 6-month HUF BUBOR | | | 7.75 | | | | 1/20/17 | | | | (106,909 | ) |
| JPMorgan Chase Bank | | PLN 8,370 | | Pays | | 6-month PLN WIBOR | | | 4.33 | | | | 8/17/17 | | | | 8,774 | |
| JPMorgan Chase Bank | | PLN 41,260 | | Pays | | 6-month PLN WIBOR | | | 4.25 | | | | 10/8/17 | | | | 17,426 | |
| Morgan Stanley & Co. International PLC | | HUF 671,000 | | Pays | | 6-month HUF BUBOR | | | 6.94 | | | | 12/19/16 | | | | 152,015 | |
| Morgan Stanley & Co. International PLC | | HUF 671,000 | | Receives | | 6-month HUF BUBOR | | | 7.26 | | | | 12/19/16 | | | | (248,528 | ) |
| Morgan Stanley & Co. International PLC | | HUF 265,000 | | Pays | | 6-month HUF BUBOR | | | 7.02 | | | | 12/20/16 | | | | 48,396 | |
| Morgan Stanley & Co. International PLC | | HUF 265,000 | | Receives | | 6-month HUF BUBOR | | | 7.36 | | | | 12/20/16 | | | | (103,503 | ) |
| Nomura International PLC | | HUF 457,000 | | Pays | | 6-month HUF BUBOR | | | 6.99 | | | | 12/21/16 | | | | 108,049 | |
| Nomura International PLC | | HUF 457,000 | | Receives | | 6-month HUF BUBOR | | | 7.39 | | | | 12/21/16 | | | | (181,380 | ) |
| | | | | | |
| | | | | | | | | | | | | | | | | $ | (855,499 | ) |
Global Macro Absolute Return Advantage Portfolio
October 31, 2012
Notes to Consolidated Financial Statements — continued
| | | | |
| HUF | | – | | Hungarian Forint |
| NZD | | – | | New Zealand Dollar |
| PLN | | – | | Polish Zloty |
| USD | | – | | United States Dollar |
| | | | | | | | | | | | | | | | | | | | | | | | | | | | | | |
| Credit Default Swaps — Sell Protection | | | | |
| | | | | | | | |
| | | | | | | | | | | | | | | | | | | | | | | | | | | | | | |
Reference
Entity | | Counterparty | | Notional
Amount*
(000’s omitted) | | | Contract
Annual
Fixed Rate** | | | Termination
Date | | | Current
Market
Annual
Fixed Rate*** | | | Market
Value | | | Upfront
Payments
Received
(Paid) | | | Net Unrealized
Appreciation
(Depreciation) | |
| Argentina | | Bank of America | | $ | 3,370 | | | | 5.00 | %(1) | | | 6/20/13 | | | | 29.91 | % | | $ | (456,677 | ) | | $ | (18,562 | ) | | $ | (475,239 | ) |
| Argentina | | Bank of America | | | 3,476 | | | | 5.00 | (1) | | | 6/20/13 | | | | 29.91 | | | | (471,030 | ) | | | (14,514 | ) | | | (485,544 | ) |
| Argentina | | Bank of America | | | 3,468 | | | | 5.00 | (1) | | | 6/20/13 | | | | 29.91 | | | | (470,026 | ) | | | (19,736 | ) | | | (489,762 | ) |
| Argentina | | Bank of America | | | 6,951 | | | | 5.00 | (1) | | | 6/20/13 | | | | 29.91 | | | | (942,045 | ) | | | (28,191 | ) | | | (970,236 | ) |
| Argentina | | Bank of America | | | 19,517 | | | | 5.00 | (1) | | | 6/20/13 | | | | 29.91 | | | | (2,644,957 | ) | | | (34,701 | ) | | | (2,679,658 | ) |
| Argentina | | Bank of America | | | 13,100 | | | | 5.00 | (1) | | | 9/20/13 | | | | 29.14 | | | | (2,320,935 | ) | | | 409,448 | | | | (1,911,487 | ) |
| Argentina | | Citibank NA | | | 5,490 | | | | 5.00 | (1) | | | 9/20/13 | | | | 29.14 | | | | (972,667 | ) | | | 171,563 | | | | (801,104 | ) |
| Argentina | | Credit Suisse International | | | 3,253 | | | | 5.00 | (1) | | | 6/20/13 | | | | 29.91 | | | | (440,849 | ) | | | (5,784 | ) | | | (446,633 | ) |
| Argentina | | Credit Suisse International | | | 3,464 | | | | 5.00 | (1) | | | 6/20/13 | | | | 29.91 | | | | (469,444 | ) | | | (14,504 | ) | | | (483,948 | ) |
| Argentina | | Credit Suisse International | | | 3,552 | | | | 5.00 | (1) | | | 6/20/13 | | | | 29.91 | | | | (481,370 | ) | | | (10,559 | ) | | | (491,929 | ) |
| Argentina | | Credit Suisse International | | | 3,688 | | | | 5.00 | (1) | | | 6/20/13 | | | | 29.91 | | | | (499,800 | ) | | | (15,442 | ) | | | (515,242 | ) |
| Argentina | | Deutsche Bank | | | 3,219 | | | | 5.00 | (1) | | | 6/20/13 | | | | 29.91 | | | | (436,295 | ) | | | (13,473 | ) | | | (449,768 | ) |
| Argentina | | Deutsche Bank | | | 3,464 | | | | 5.00 | (1) | | | 6/20/13 | | | | 29.91 | | | | (469,444 | ) | | | (14,504 | ) | | | (483,948 | ) |
| Argentina | | Deutsche Bank | | | 3,468 | | | | 5.00 | (1) | | | 6/20/13 | | | | 29.91 | | | | (470,040 | ) | | | (19,736 | ) | | | (489,776 | ) |
| Argentina | | Deutsche Bank | | | 5,680 | | | | 5.00 | (1) | | | 6/20/13 | | | | 29.91 | | | | (769,757 | ) | | | (22,115 | ) | | | (791,872 | ) |
| Argentina | | Goldman Sachs International | | | 10,000 | | | | 5.00 | (1) | | | 9/20/13 | | | | 29.14 | | | | (1,771,707 | ) | | | 312,501 | | | | (1,459,206 | ) |
| Argentina | | Morgan Stanley & Co. International PLC | | | 5,000 | | | | 5.00 | (1) | | | 9/20/13 | | | | 29.14 | | | | (885,853 | ) | | | (39,131 | ) | | | (924,984 | ) |
| Poland | | Barclays Bank PLC | | | 9,440 | | | | 1.00 | (1) | | | 9/20/22 | | | | 1.39 | | | | (316,828 | ) | | | 1,065,456 | | | | 748,628 | |
| Poland | | Barclays Bank PLC | | | 4,800 | | | | 1.00 | (1) | | | 9/20/22 | | | | 1.39 | | | | (161,100 | ) | | | 584,453 | | | | 423,353 | |
| Poland | | Citibank NA | | | 43,370 | | | | 1.00 | (1) | | | 9/20/22 | | | | 1.39 | | | | (1,455,555 | ) | | | 2,425,417 | | | | 969,862 | |
| Poland | | Deutsche Bank | | | 2,000 | | | | 1.00 | (1) | | | 6/20/22 | | | | 1.38 | | | | (63,526 | ) | | | 328,550 | | | | 265,024 | |
| Poland | | Goldman Sachs International | | | 11,560 | | | | 1.00 | (1) | | | 9/20/22 | | | | 1.39 | | | | (387,980 | ) | | | 1,254,044 | | | | 866,064 | |
| South Africa | | Bank of America | | | 3,190 | | | | 1.00 | (1) | | | 12/20/15 | | | | 1.00 | | | | 3,639 | | | | 16,902 | | | | 20,541 | |
| South Africa | | Bank of America | | | 890 | | | | 1.00 | (1) | | | 12/20/15 | | | | 1.00 | | | | 1,015 | | | | 4,499 | | | | 5,514 | |
| South Africa | | Bank of America | | | 7,500 | | | | 1.00 | (1) | | | 9/20/17 | | | | 1.46 | | | | (153,655 | ) | | | 240,244 | | | | 86,589 | |
| South Africa | | Bank of America | | | 5,000 | | | | 1.00 | (1) | | | 9/20/17 | | | | 1.46 | | | | (102,436 | ) | | | 74,443 | | | | (27,993 | ) |
| South Africa | | Bank of America | | | 26,320 | | | | 1.00 | (1) | | | 9/20/17 | | | | 1.46 | | | | (539,227 | ) | | | 439,630 | | | | (99,597 | ) |
| South Africa | | Bank of America | | | 14,640 | | | | 1.00 | (1) | | | 9/20/17 | | | | 1.46 | | | | (299,935 | ) | | | 184,112 | | | | (115,823 | ) |
| South Africa | | Barclays Bank PLC | | | 3,830 | | | | 1.00 | (1) | | | 12/20/15 | | | | 1.00 | | | | 4,369 | | | | 22,533 | | | | 26,902 | |
Global Macro Absolute Return Advantage Portfolio
October 31, 2012
Notes to Consolidated Financial Statements — continued
| | | | | | | | | | | | | | | | | | | | | | | | | | | | | | |
| Credit Default Swaps — Sell Protection (continued) | | | | |
| | | | | | | | |
| | | | | | | | | | | | | | | | | | | | | | | | | | | | | | |
Reference
Entity | | Counterparty | | Notional
Amount*
(000’s omitted) | | | Contract
Annual
Fixed Rate** | | | Termination
Date | | | Current
Market
Annual
Fixed Rate*** | | | Market
Value | | | Upfront
Payments
Received
(Paid) | | | Net Unrealized
Appreciation
(Depreciation) | |
| South Africa | | Barclays Bank PLC | | $ | 2,280 | | | | 1.00 | %(1) | | | 12/20/15 | | | | 1.00 | % | | $ | 2,601 | | | $ | 13,527 | | | $ | 16,128 | |
| South Africa | | Barclays Bank PLC | | | 5,000 | | | | 1.00 | (1) | | | 9/20/17 | | | | 1.46 | | | | (102,442 | ) | | | 133,441 | | | | 30,999 | |
| South Africa | | Barclays Bank PLC | | | 2,510 | | | | 1.00 | (1) | | | 9/20/17 | | | | 1.46 | | | | (51,426 | ) | | | 62,366 | | | | 10,940 | |
| South Africa | | BNP Paribas SA | | | 4,190 | | | | 1.00 | (1) | | | 9/20/17 | | | | 1.46 | | | | (85,847 | ) | | | 107,891 | | | | 22,044 | |
| South Africa | | Citibank NA | | | 4,800 | | | | 1.00 | (1) | | | 9/20/15 | | | | 0.95 | | | | 12,752 | | | | 77,474 | | | | 90,226 | |
| South Africa | | Credit Suisse International | | | 4,785 | | | | 1.00 | (1) | | | 12/20/15 | | | | 1.00 | | | | 5,458 | | | | 30,946 | | | | 36,404 | |
| South Africa | | Credit Suisse International | | | 2,000 | | | | 1.00 | (1) | | | 12/20/15 | | | | 1.00 | | | | 2,282 | | | | 11,139 | | | | 13,421 | |
| South Africa | | Credit Suisse International | | | 890 | | | | 1.00 | (1) | | | 12/20/15 | | | | 1.00 | | | | 1,015 | | | | 5,288 | | | | 6,303 | |
| South Africa | | Credit Suisse International | | | 9,000 | | | | 1.00 | (1) | | | 3/20/16 | | | | 1.08 | | | | (13,188 | ) | | | 95,531 | | | | 82,343 | |
| South Africa | | Credit Suisse International | | | 8,100 | | | | 1.00 | (1) | | | 3/20/16 | | | | 1.08 | | | | (11,869 | ) | | | 48,613 | | | | 36,744 | |
| South Africa | | Credit Suisse International | | | 3,700 | | | | 1.00 | (1) | | | 9/20/17 | | | | 1.46 | | | | (75,803 | ) | | | 128,415 | | | | 52,612 | |
| South Africa | | Deutsche Bank | | | 4,860 | | | | 1.00 | (1) | | | 9/20/17 | | | | 1.46 | | | | (99,569 | ) | | | 172,918 | | | | 73,349 | |
| South Africa | | Deutsche Bank | | | 5,700 | | | | 1.00 | (1) | | | 9/20/17 | | | | 1.46 | | | | (116,778 | ) | | | 182,586 | | | | 65,808 | |
| South Africa | | Goldman Sachs International | | | 15,000 | | | | 1.00 | (1) | | | 9/20/17 | | | | 1.46 | | | | (307,310 | ) | | | 513,776 | | | | 206,466 | |
| South Africa | | Goldman Sachs International | | | 3,070 | | | | 1.00 | (1) | | | 9/20/17 | | | | 1.46 | | | | (62,896 | ) | | | 103,771 | | | | 40,875 | |
| South Africa | | Goldman Sachs International | | | 2,647 | | | | 1.00 | (1) | | | 12/20/17 | | | | 1.51 | | | | (63,902 | ) | | | 64,452 | | | | 550 | |
| South Africa | | HSBC Bank USA | | | 5,000 | | | | 1.00 | (1) | | | 9/20/17 | | | | 1.46 | | | | (102,442 | ) | | | 131,185 | | | | 28,743 | |
| South Africa | | HSBC Bank USA | | | 2,500 | | | | 1.00 | (1) | | | 12/20/17 | | | | 1.51 | | | | (60,353 | ) | | | 63,264 | | | | 2,911 | |
| South Africa | | JPMorgan Chase Bank | | | 7,500 | | | | 1.00 | (1) | | | 9/20/17 | | | | 1.46 | | | | (153,663 | ) | | | 196,778 | | | | 43,115 | |
| South Africa | | Nomura International PLC | | | 1,000 | | | | 1.00 | (1) | | | 9/20/17 | | | | 1.46 | | | | (20,487 | ) | | | 14,923 | | | | (5,564 | ) |
| South Africa | | Nomura International PLC | | | 7,571 | | | | 1.00 | (1) | | | 12/20/17 | | | | 1.51 | | | | (182,774 | ) | | | 187,970 | | | | 5,196 | |
| Spain | | Deutsche Bank | | | 1,100 | | | | 1.00 | (1) | | | 3/20/13 | | | | 1.07 | | | | 990 | | | | 12,477 | | | | 13,467 | |
| Markit CDX North America High Yield Index | | Barclays Bank PLC | | | 1,670 | | | | 5.00 | (1) | | | 12/20/17 | | | | 5.19 | | | | (3,484 | ) | | | 2,050 | | | | (1,434 | ) |
| Markit CDX North America High Yield Index | | Citibank NA | | | 10,350 | | | | 5.00 | (1) | | | 12/20/17 | | | | 5.19 | | | | (21,597 | ) | | | 6,354 | | | | (15,243 | ) |
| Markit CDX North America High Yield Index | | Deutsche Bank | | | 12,460 | | | | 5.00 | (1) | | | 12/20/17 | | | | 5.19 | | | | (26,000 | ) | | | 15,298 | | | | (10,702 | ) |
Global Macro Absolute Return Advantage Portfolio
October 31, 2012
Notes to Consolidated Financial Statements — continued
| | | | | | | | | | | | | | | | | | | | | | | | | | | | | | |
| Credit Default Swaps — Sell Protection (continued) | | | | |
| | | | | | | | |
| | | | | | | | | | | | | | | | | | | | | | | | | | | | | | |
Reference
Entity | | Counterparty | | Notional
Amount*
(000’s omitted) | | | Contract
Annual
Fixed Rate** | | | Termination
Date | | | Current
Market
Annual
Fixed Rate*** | | | Market Value | | | Upfront
Payments
Received
(Paid) | | | Net Unrealized
Appreciation
(Depreciation) | |
| Markit CDX North America High Yield Index | | JPMorgan Chase Bank | | $ | 9,130 | | | | 5.00 | %(1) | | | 12/20/17 | | | | 5.19 | % | | $ | (19,051 | ) | | $ | 22,418 | | | $ | 3,367 | |
| | | | | | | | |
Total | | | | $ | 369,513 | | | | | | | | | | | | | | | $ | (19,999,898 | ) | | $ | 9,667,694 | | | $ | (10,332,204 | ) |
| | | | | | | | | | | | | | | | | | | | | | | | | | |
| Credit Default Swaps — Buy Protection | | | | | | | | | | |
Reference
Entity | | Counterparty | | Notional
Amount
(000’s omitted) | | | Contract
Annual
Fixed Rate** | | | Termination
Date | | | Market
Value | | | Upfront
Payments
Received
(Paid) | | | Net Unrealized
Appreciation
(Depreciation) | |
| Brazil | | Bank of America | | $ | 4,600 | | | | 1.00 | %(1) | | | 12/20/20 | | | $ | 143,154 | | | $ | (119,286 | ) | | $ | 23,868 | |
| Brazil | | Bank of America | | | 1,217 | | | | 1.00 | (1) | | | 12/20/20 | | | | 37,874 | | | | (36,897 | ) | | | 977 | |
| Brazil | | Bank of America | | | 533 | | | | 1.00 | (1) | | | 12/20/20 | | | | 16,587 | | | | (15,806 | ) | | | 781 | |
| Brazil | | Bank of America | | | 280 | | | | 1.00 | (1) | | | 12/20/20 | | | | 8,713 | | | | (7,944 | ) | | | 769 | |
| Brazil | | Barclays Bank PLC | | | 1,430 | | | | 1.00 | (1) | | | 12/20/20 | | | | 44,498 | | | | (44,366 | ) | | | 132 | |
| Brazil | | Barclays Bank PLC | | | 35,000 | | | | 1.00 | (1) | | | 6/20/21 | | | | 1,225,921 | | | | (1,357,232 | ) | | | (131,311 | ) |
| Brazil | | Barclays Bank PLC | | | 15,000 | | | | 1.00 | (1) | | | 6/20/22 | | | | 637,925 | | | | (1,350,173 | ) | | | (712,248 | ) |
| Brazil | | Citibank NA | | | 2,400 | | | | 1.00 | (1) | | | 9/20/20 | | | | 69,891 | | | | (91,202 | ) | | | (21,311 | ) |
| Brazil | | Citibank NA | | | 270 | | | | 1.00 | (1) | | | 12/20/20 | | | | 8,402 | | | | (7,750 | ) | | | 652 | |
| Brazil | | Citibank NA | | | 11,000 | | | | 1.00 | (1) | | | 9/20/21 | | | | 406,553 | | | | (422,238 | ) | | | (15,685 | ) |
| Brazil | | Goldman Sachs International | | | 12,800 | | | | 1.00 | (1) | | | 9/20/22 | | | | 567,684 | | | | (1,141,081 | ) | | | (573,397 | ) |
| Brazil | | HSBC Bank USA | | | 1,000 | | | | 1.00 | (1) | | | 6/20/21 | | | | 35,027 | | | | (37,449 | ) | | | (2,422 | ) |
| Brazil | | Standard Chartered Bank | | | 2,400 | | | | 1.00 | (1) | | | 9/20/20 | | | | 69,891 | | | | (77,146 | ) | | | (7,255 | ) |
| Brazil | | Standard Chartered Bank | | | 280 | | | | 1.00 | (1) | | | 12/20/20 | | | | 8,713 | | | | (8,037 | ) | | | 676 | |
| China | | Bank of America | | | 6,100 | | | | 1.00 | (1) | | | 3/20/17 | | | | (125,218 | ) | | | (159,669 | ) | | | (284,887 | ) |
| China | | Barclays Bank PLC | | | 10,076 | | | | 1.00 | (1) | | | 3/20/17 | | | | (206,836 | ) | | | (240,011 | ) | | | (446,847 | ) |
| China | | Deutsche Bank | | | 3,700 | | | | 1.00 | (1) | | | 3/20/17 | | | | (75,949 | ) | | | (83,760 | ) | | | (159,709 | ) |
| China | | Deutsche Bank | | | 4,300 | | | | 1.00 | (1) | | | 3/20/17 | | | | (88,269 | ) | | | (97,343 | ) | | | (185,612 | ) |
| Colombia | | Bank of America | | | 3,900 | | | | 1.00 | (1) | | | 9/20/21 | | | | 104,053 | | | | (155,618 | ) | | | (51,565 | ) |
| Colombia | | Barclays Bank PLC | | | 2,000 | | | | 1.00 | (1) | | | 6/20/22 | | | | 63,021 | | | | (112,356 | ) | | | (49,335 | ) |
| Colombia | | Citibank NA | | | 2,100 | | | | 1.00 | (1) | | | 6/20/22 | | | | 66,170 | | | | (160,081 | ) | | | (93,911 | ) |
| Colombia | | Deutsche Bank | | | 2,500 | | | | 1.00 | (1) | | | 6/20/22 | | | | 78,776 | | | | (167,638 | ) | | | (88,862 | ) |
| Colombia | | Deutsche Bank | | | 2,080 | | | | 1.00 | (1) | | | 6/20/22 | | | | 65,541 | | | | (159,966 | ) | | | (94,425 | ) |
| Colombia | | Deutsche Bank | | | 4,100 | | | | 1.00 | (1) | | | 6/20/22 | | | | 129,192 | | | | (262,712 | ) | | | (133,520 | ) |
| Colombia | | Goldman Sachs International | | | 7,410 | | | | 1.00 | (1) | | | 6/20/17 | | | | (35,395 | ) | | | (225,491 | ) | | | (260,886 | ) |
| Colombia | | Goldman Sachs International | | | 2,990 | | | | 1.00 | (1) | | | 9/20/21 | | | | 79,774 | | | | (117,211 | ) | | | (37,437 | ) |
| Colombia | | Goldman Sachs International | | | 2,000 | | | | 1.00 | (1) | | | 6/20/22 | | | | 63,019 | | | | (152,458 | ) | | | (89,439 | ) |
| Colombia | | Goldman Sachs International | | | 2,000 | | | | 1.00 | (1) | | | 6/20/22 | | | | 63,018 | | | | (168,117 | ) | | | (105,099 | ) |
| Colombia | | HSBC Bank USA | | | 4,040 | | | | 1.00 | (1) | | | 6/20/17 | | | | (19,297 | ) | | | (124,655 | ) | | | (143,952 | ) |
| Colombia | | HSBC Bank USA | | | 8,590 | | | | 1.00 | (1) | | | 9/20/21 | | | | 229,184 | | | | (329,198 | ) | | | (100,014 | ) |
| Colombia | | Morgan Stanley & Co.
International PLC | | | 4,000 | | | | 1.00 | (1) | | | 6/20/22 | | | | 126,041 | | | | (249,479 | ) | | | (123,438 | ) |
Global Macro Absolute Return Advantage Portfolio
October 31, 2012
Notes to Consolidated Financial Statements — continued
| | | | | | | | | | | | | | | | | | | | | | | | | | |
| Credit Default Swaps — Buy Protection (continued) | | | | | | | | | | |
| | | | | | | |
| | | | | | | | | | | | | | | | | | | | | | | | | | |
| Reference Entity | | Counterparty | | Notional
Amount
(000’s omitted) | | | Contract
Annual
Fixed Rate** | | | Termination
Date | | | Market
Value | | | Upfront
Payments
Received
(Paid) | | | Net Unrealized
Appreciation
(Depreciation) | |
| Colombia | | Morgan Stanley & Co.
International PLC | | $ | 4,470 | | | | 1.00 | %(1) | | | 9/20/21 | | | $ | 119,261 | | | $ | (178,362 | ) | | $ | (59,101 | ) |
| Croatia | | BNP Paribas SA | | | 2,000 | | | | 1.00 | (1) | | | 12/20/17 | | | | 138,243 | | | | (138,342 | ) | | | (99 | ) |
| Croatia | | Citibank NA | | | 1,500 | | | | 1.00 | (1) | | | 12/20/17 | | | | 101,987 | | | | (102,516 | ) | | | (529 | ) |
| Egypt | | Citibank NA | | | 1,300 | | | | 1.00 | (1) | | | 12/20/15 | | | | 95,490 | | | | (54,830 | ) | | | 40,660 | |
| Egypt | | Credit Suisse International | | | 2,130 | | | | 1.00 | (1) | | | 12/20/15 | | | | 156,456 | | | | (84,163 | ) | | | 72,293 | |
| Egypt | | Credit Suisse International | | | 2,155 | | | | 1.00 | (1) | | | 12/20/15 | | | | 158,292 | | | | (90,898 | ) | | | 67,394 | |
| Egypt | | Deutsche Bank | | | 4,600 | | | | 1.00 | (1) | | | 12/20/15 | | | | 337,885 | | | | (145,561 | ) | | | 192,324 | |
| Hungary | | Bank of America | | | 1,800 | | | | 1.00 | (1) | | | 3/20/17 | | | | 121,599 | | | | (283,140 | ) | | | (161,541 | ) |
| Hungary | | Barclays Bank PLC | | | 900 | | | | 1.00 | (1) | | | 3/20/17 | | | | 60,800 | | | | (141,558 | ) | | | (80,758 | ) |
| Hungary | | Barclays Bank PLC | | | 2,500 | | | | 1.00 | (1) | | | 3/20/17 | | | | 168,889 | | | | (394,648 | ) | | | (225,759 | ) |
| Hungary | | Deutsche Bank | | | 1,700 | | | | 1.00 | (1) | | | 3/20/17 | | | | 114,844 | | | | (266,212 | ) | | | (151,368 | ) |
| Hungary | | Goldman Sachs International | | | 3,400 | | | | 1.00 | (1) | | | 3/20/17 | | | | 229,688 | | | | (530,472 | ) | | | (300,784 | ) |
| Hungary | | HSBC Bank USA | | | 900 | | | | 1.00 | (1) | | | 3/20/17 | | | | 60,800 | | | | (141,558 | ) | | | (80,758 | ) |
| Lebanon | | HSBC Bank USA | | | 1,250 | | | | 1.00 | (1) | | | 12/20/17 | | | | 180,333 | | | | (182,876 | ) | | | (2,543 | ) |
| Mexico | | Bank of America | | | 1,900 | | | | 1.00 | (1) | | | 6/20/22 | | | | 60,103 | | | | (118,513 | ) | | | (58,410 | ) |
| Mexico | | Bank of America | | | 3,910 | | | | 1.00 | (1) | | | 6/20/22 | | | | 123,686 | | | | (277,106 | ) | | | (153,420 | ) |
| Mexico | | Barclays Bank PLC | | | 1,000 | | | | 1.00 | (1) | | | 6/20/22 | | | | 31,632 | | | | (74,339 | ) | | | (42,707 | ) |
| Mexico | | Citibank NA | | | 1,250 | | | | 1.00 | (1) | | | 6/20/22 | | | | 39,541 | | | | (80,062 | ) | | | (40,521 | ) |
| Mexico | | Deutsche Bank | | | 1,900 | | | | 1.00 | (1) | | | 6/20/22 | | | | 60,103 | | | | (119,966 | ) | | | (59,863 | ) |
| Mexico | | Deutsche Bank | | | 2,020 | | | | 1.00 | (1) | | | 6/20/22 | | | | 63,899 | | | | (141,622 | ) | | | (77,723 | ) |
| Mexico | | Deutsche Bank | | | 1,850 | | | | 1.00 | (1) | | | 6/20/22 | | | | 58,521 | | | | (140,186 | ) | | | (81,665 | ) |
| Mexico | | Deutsche Bank | | | 3,900 | | | | 1.00 | (1) | | | 6/20/22 | | | | 123,370 | | | | (255,900 | ) | | | (132,530 | ) |
| Mexico | | Goldman Sachs International | | | 1,900 | | | | 1.00 | (1) | | | 6/20/22 | | | | 60,104 | | | | (119,977 | ) | | | (59,873 | ) |
| Mexico | | Goldman Sachs International | | | 1,950 | | | | 1.00 | (1) | | | 6/20/22 | | | | 61,685 | | | | (148,499 | ) | | | (86,814 | ) |
| Philippines | | Bank of America | | | 1,400 | | | | 1.00 | (1) | | | 12/20/15 | | | | (23,325 | ) | | | (12,254 | ) | | | (35,579 | ) |
| Philippines | | Bank of America | | | 2,000 | | | | 1.00 | (1) | | | 12/20/15 | | | | (33,321 | ) | | | (16,413 | ) | | | (49,734 | ) |
| Philippines | | Barclays Bank PLC | | | 2,400 | | | | 1.00 | (1) | | | 12/20/15 | | | | (39,985 | ) | | | (29,903 | ) | | | (69,888 | ) |
| Philippines | | Barclays Bank PLC | | | 1,000 | | | | 1.00 | (1) | | | 3/20/16 | | | | (15,364 | ) | | | (13,539 | ) | | | (28,903 | ) |
| Philippines | | Barclays Bank PLC | | | 1,400 | | | | 1.00 | (1) | | | 3/20/16 | | | | (21,511 | ) | | | (13,516 | ) | | | (35,027 | ) |
| Philippines | | Barclays Bank PLC | | | 1,600 | | | | 1.00 | (1) | | | 3/20/16 | | | | (24,583 | ) | | | (11,982 | ) | | | (36,565 | ) |
| Philippines | | Barclays Bank PLC | | | 1,600 | | | | 1.00 | (1) | | | 3/20/16 | | | | (24,583 | ) | | | (17,894 | ) | | | (42,477 | ) |
| Philippines | | Barclays Bank PLC | | | 2,100 | | | | 1.00 | (1) | | | 3/20/16 | | | | (32,266 | ) | | | (22,091 | ) | | | (54,357 | ) |
| Philippines | | Barclays Bank PLC | | | 2,500 | | | | 1.00 | (1) | | | 3/20/16 | | | | (38,411 | ) | | | (33,239 | ) | | | (71,650 | ) |
| Philippines | | Citibank NA | | | 6,600 | | | | 1.00 | (1) | | | 9/20/15 | | | | (108,370 | ) | | | (105,133 | ) | | | (213,503 | ) |
| Philippines | | Citibank NA | | | 2,000 | | | | 1.00 | (1) | | | 3/20/16 | | | | (30,729 | ) | | | (21,731 | ) | | | (52,460 | ) |
| Philippines | | Credit Suisse International | | | 8,100 | | | | 1.00 | (1) | | | 12/20/16 | | | | (93,342 | ) | | | (185,161 | ) | | | (278,503 | ) |
| Philippines | | Deutsche Bank | | | 1,000 | | | | 1.00 | (1) | | | 12/20/15 | | | | (16,661 | ) | | | (9,372 | ) | | | (26,033 | ) |
| Philippines | | Deutsche Bank | | | 1,300 | | | | 1.00 | (1) | | | 12/20/15 | | | | (21,659 | ) | | | (11,398 | ) | | | (33,057 | ) |
| Philippines | | Deutsche Bank | | | 2,300 | | | | 1.00 | (1) | | | 12/20/15 | | | | (38,320 | ) | | | (21,477 | ) | | | (59,797 | ) |
| Philippines | | Goldman Sachs International | | | 2,000 | | | | 1.00 | (1) | | | 3/20/16 | | | | (30,730 | ) | | | (22,355 | ) | | | (53,085 | ) |
| Philippines | | Standard Chartered Bank | | | 1,000 | | | | 1.00 | (1) | | | 12/20/15 | | | | (16,660 | ) | | | (7,839 | ) | | | (24,499 | ) |
| Philippines | | Standard Chartered Bank | | | 2,600 | | | | 1.00 | (1) | | | 3/20/16 | | | | (39,948 | ) | | | (30,704 | ) | | | (70,652 | ) |
| Russia | | Barclays Bank PLC | | | 4,800 | | | | 1.00 | (1) | | | 9/20/22 | | | | 439,038 | | | | (661,294 | ) | | | (222,256 | ) |
Global Macro Absolute Return Advantage Portfolio
October 31, 2012
Notes to Consolidated Financial Statements — continued
| | | | | | | | | | | | | | | | | | | | | | | | | | |
| Credit Default Swaps — Buy Protection (continued) | | | | | | | | | | |
| | | | | | | |
| | | | | | | | | | | | | | | | | | | | | | | | | | |
Reference
Entity | | Counterparty | | Notional
Amount
(000’s omitted) | | | Contract
Annual
Fixed Rate** | | | Termination
Date | | | Market
Value | | | Upfront
Payments
Received
(Paid) | | | Net Unrealized
Appreciation
(Depreciation) | |
| Russia | | Citibank NA | | $ | 43,370 | | | | 1.00 | %(1) | | | 9/20/22 | | | $ | 3,966,808 | | | $ | (3,597,181 | ) | | $ | 369,627 | |
| Russia | | Deutsche Bank | | | 2,000 | | | | 1.00 | (1) | | | 6/20/22 | | | | 177,032 | | | | (342,675 | ) | | | (165,643 | ) |
| Russia | | Morgan Stanley & Co.
International PLC | | | 9,440 | | | | 1.00 | (1) | | | 9/20/22 | | | | 863,442 | | | | (1,316,103 | ) | | | (452,661 | ) |
| Russia | | Morgan Stanley & Co.
International PLC | | | 11,560 | | | | 1.00 | (1) | | | 9/20/22 | | | | 1,057,350 | | | | (1,604,194 | ) | | | (546,844 | ) |
| South Africa | | Bank of America | | | 3,190 | | | | 1.00 | (1) | | | 12/20/20 | | | | 218,548 | | | | (109,657 | ) | | | 108,891 | |
| South Africa | | Bank of America | | | 890 | | | | 1.00 | (1) | | | 12/20/20 | | | | 60,974 | | | | (27,892 | ) | | | 33,082 | |
| South Africa | | Bank of America | | | 26,320 | | | | 1.00 | (1) | | | 9/20/22 | | | | 2,407,394 | | | | (2,041,484 | ) | | | 365,910 | |
| South Africa | | Bank of America | | | 14,640 | | | | 1.00 | (1) | | | 9/20/22 | | | | 1,339,067 | | | | (1,025,332 | ) | | | 313,735 | |
| South Africa | | Bank of America | | | 5,000 | | | | 1.00 | (1) | | | 9/20/22 | | | | 457,332 | | | | (370,284 | ) | | | 87,048 | |
| South Africa | | Bank of America | | | 7,500 | | | | 1.00 | (1) | | | 9/20/22 | | | | 686,020 | | | | (731,925 | ) | | | (45,905 | ) |
| South Africa | | Barclays Bank PLC | | | 3,830 | | | | 1.00 | (1) | | | 12/20/20 | | | | 262,394 | | | | (126,748 | ) | | | 135,646 | |
| South Africa | | Barclays Bank PLC | | | 2,280 | | | | 1.00 | (1) | | | 12/20/20 | | | | 156,203 | | | | (71,188 | ) | | | 85,015 | |
| South Africa | | Barclays Bank PLC | | | 3,100 | | | | 1.00 | (1) | | | 9/20/22 | | | | 283,555 | | | | (259,754 | ) | | | 23,801 | |
| South Africa | | BNP Paribas | | | 3,100 | | | | 1.00 | (1) | | | 9/20/22 | | | | 283,555 | | | | (266,884 | ) | | | 16,671 | |
| South Africa | | Citibank NA | | | 4,800 | | | | 1.00 | (1) | | | 9/20/20 | | | | 311,997 | | | | (248,178 | ) | | | 63,819 | |
| South Africa | | Credit Suisse International | | | 4,785 | | | | 1.00 | (1) | | | 12/20/20 | | | | 327,822 | | | | (167,546 | ) | | | 160,276 | |
| South Africa | | Credit Suisse International | | | 2,000 | | | | 1.00 | (1) | | | 12/20/20 | | | | 137,021 | | | | (69,222 | ) | | | 67,799 | |
| South Africa | | Credit Suisse International | | | 890 | | | | 1.00 | (1) | | | 12/20/20 | | | | 60,974 | | | | (29,655 | ) | | | 31,319 | |
| South Africa | | Credit Suisse International | | | 8,100 | | | | 1.00 | (1) | | | 3/20/21 | | | | 582,538 | | | | (300,274 | ) | | | 282,264 | |
| South Africa | | Credit Suisse International | | | 9,000 | | | | 1.00 | (1) | | | 3/20/21 | | | | 647,229 | | | | (391,041 | ) | | | 256,188 | |
| South Africa | | Credit Suisse International | | | 20,000 | | | | 1.00 | (1) | | | 12/20/21 | | | | 1,639,407 | | | | (1,705,967 | ) | | | (66,560 | ) |
| South Africa | | Credit Suisse International | | | 3,700 | | | | 1.00 | (1) | | | 9/20/22 | | | | 338,426 | | | | (374,938 | ) | | | (36,512 | ) |
| South Africa | | Deutsche Bank | | | 4,860 | | | | 1.00 | (1) | | | 9/20/22 | | | | 444,527 | | | | (473,394 | ) | | | (28,867 | ) |
| South Africa | | Deutsche Bank | | | 5,700 | | | | 1.00 | (1) | | | 9/20/22 | | | | 521,358 | | | | (552,835 | ) | | | (31,477 | ) |
| South Africa | | Goldman Sachs International | | | 3,070 | | | | 1.00 | (1) | | | 9/20/22 | | | | 280,805 | | | | (289,803 | ) | | | (8,998 | ) |
| South Africa | | Goldman Sachs International | | | 15,000 | | | | 1.00 | (1) | | | 9/20/22 | | | | 1,372,010 | | | | (1,461,904 | ) | | | (89,894 | ) |
| South Africa | | Goldman Sachs International | | | 2,647 | | | | 1.00 | (1) | | | 12/20/22 | | | | 250,169 | | | | (260,546 | ) | | | (10,377 | ) |
| South Africa | | HSBC Bank USA | | | 2,500 | | | | 1.00 | (1) | | | 12/20/22 | | | | 236,276 | | | | (236,310 | ) | | | (34 | ) |
| South Africa | | Nomura International PLC | | | 1,000 | | | | 1.00 | (1) | | | 9/20/22 | | | | 91,466 | | | | (76,623 | ) | | | 14,843 | |
| South Africa | | Nomura International PLC | | | 7,571 | | | | 1.00 | (1) | | | 12/20/22 | | | | 715,538 | | | | (733,411 | ) | | | (17,873 | ) |
| Spain | | Bank of America | | | 2,400 | | | | 1.00 | (1) | | | 9/20/20 | | | | 328,021 | | | | (210,795 | ) | | | 117,226 | |
| Spain | | Barclays Bank PLC | | | 2,421 | | | | 1.00 | (1) | | | 9/20/20 | | | | 330,891 | | | | (186,297 | ) | | | 144,594 | |
| Spain | | Barclays Bank PLC | | | 3,900 | | | | 1.00 | (1) | | | 12/20/20 | | | | 547,702 | | | | (329,035 | ) | | | 218,667 | |
| Spain | | Barclays Bank PLC | | | 1,100 | | | | 1.00 | (1) | | | 12/20/20 | | | | 154,470 | | | | (91,090 | ) | | | 63,380 | |
| Spain | | Barclays Bank PLC | | | 3,200 | | | | 1.00 | (1) | | | 12/20/20 | | | | 449,396 | | | | (387,215 | ) | | | 62,181 | |
| Spain | | Barclays Bank PLC | | | 5,000 | | | | 1.00 | (1) | | | 6/20/21 | | | | 738,576 | | | | (426,592 | ) | | | 311,984 | |
| Spain | | Barclays Bank PLC | | | 5,000 | | | | 1.00 | (1) | | | 6/20/21 | | | | 738,436 | | | | (480,519 | ) | | | 257,917 | |
| Spain | | Barclays Bank PLC | | | 5,000 | | | | 1.00 | (1) | | | 3/20/22 | | | | 789,887 | | | | (932,268 | ) | | | (142,381 | ) |
| Spain | | Credit Suisse International | | | 2,200 | | | | 1.00 | (1) | | | 3/20/21 | | | | 316,946 | | | | (286,207 | ) | | | 30,739 | |
| Spain | | Credit Suisse International | | | 5,000 | | | | 1.00 | (1) | | | 6/20/21 | | | | 738,576 | | | | (465,777 | ) | | | 272,799 | |
| Spain | | Deutsche Bank | | | 3,500 | | | | 1.00 | (1) | | | 12/20/20 | | | | 491,527 | | | | (338,652 | ) | | | 152,875 | |
| Spain | | Deutsche Bank | | | 10,730 | | | | 1.00 | (1) | | | 6/20/22 | | | | 1,730,538 | | | | (2,865,798 | ) | | | (1,135,260 | ) |
Global Macro Absolute Return Advantage Portfolio
October 31, 2012
Notes to Consolidated Financial Statements — continued
| | | | | | | | | | | | | | | | | | | | | | | | | | |
| Credit Default Swaps — Buy Protection (continued) | | | | | | | | | | |
| | | | | | | |
| | | | | | | | | | | | | | | | | | | | | | | | | | |
Reference
Entity | | Counterparty | | Notional
Amount
(000’s omitted) | | | Contract
Annual
Fixed Rate** | | | Termination
Date | | | Market Value | | | Upfront
Payments
Received
(Paid) | | | Net Unrealized
Appreciation
(Depreciation) | |
| Thailand | | Bank of America | | | $ 1,000 | | | | 1.00 | %(1) | | | 3/20/16 | | | $ | (15,789 | ) | | $ | (3,141 | ) | | $ | (18,930 | ) |
| Thailand | | Barclays Bank PLC | | | 1,400 | | | | 1.00 | (1) | | | 3/20/16 | | | | (22,102 | ) | | | (6,535 | ) | | | (28,637 | ) |
| Thailand | | Barclays Bank PLC | | | 3,000 | | | | 1.00 | (1) | | | 3/20/16 | | | | (47,366 | ) | | | (1,889 | ) | | | (49,255 | ) |
| Thailand | | Citibank NA | | | 7,900 | | | | 1.00 | (1) | | | 12/20/16 | | | | (101,322 | ) | | | (258,658 | ) | | | (359,980 | ) |
| Thailand | | Goldman Sachs International | | | 4,100 | | | | 1.00 | (1) | | | 3/20/16 | | | | (64,730 | ) | | | (23,126 | ) | | | (87,856 | ) |
| Thailand | | Standard Chartered Bank | | | 3,300 | | | | 1.00 | (1) | | | 9/20/15 | | | | (54,581 | ) | | | (24,856 | ) | | | (79,437 | ) |
| Tunisia | | Barclays Bank PLC | | | 970 | | | | 1.00 | (1) | | | 9/20/17 | | | | 105,733 | | | | (87,098 | ) | | | 18,635 | |
| Tunisia | | Barclays Bank PLC | | | 1,000 | | | | 1.00 | (1) | | | 9/20/17 | | | | 109,002 | | | | (85,522 | ) | | | 23,480 | |
| Tunisia | | Deutsche Bank | | | 3,800 | | | | 1.00 | (1) | | | 6/20/17 | | | | 391,679 | | | | (278,841 | ) | | | 112,838 | |
| Tunisia | | Deutsche Bank | | | 2,150 | | | | 1.00 | (1) | | | 6/20/17 | | | | 221,614 | | | | (166,526 | ) | | | 55,088 | |
| Tunisia | | Goldman Sachs International | | | 2,100 | | | | 1.00 | (1) | | | 9/20/17 | | | | 228,894 | | | | (166,445 | ) | | | 62,449 | |
| Tunisia | | Goldman Sachs International | | | 2,250 | | | | 1.00 | (1) | | | 9/20/17 | | | | 245,244 | | | | (187,705 | ) | | | 57,539 | |
| Tunisia | | Goldman Sachs International | | | 2,100 | | | | 1.00 | (1) | | | 9/20/17 | | | | 228,905 | | | | (184,294 | ) | | | 44,611 | |
| Tunisia | | JPMorgan Chase Bank | | | 4,520 | | | | 1.00 | (1) | | | 9/20/17 | | | | 492,691 | | | | (406,613 | ) | | | 86,078 | |
| Tunisia | | Morgan Stanley & Co.
International PLC | | | 500 | | | | 1.00 | (1) | | | 6/20/17 | | | | 51,537 | | | | (38,700 | ) | | | 12,837 | |
| Tunisia | | Nomura International PLC | | | 3,400 | | | | 1.00 | (1) | | | 12/20/17 | | | | 390,151 | | | | (357,327 | ) | | | 32,824 | |
| iTraxx Europe Senior Financials 5-Year Index | | Barclays Bank PLC | | | EUR 15,050 | | | | 1.00 | (1) | | | 12/20/17 | | | | 672,312 | | | | (812,554 | ) | | | (140,242 | ) |
| iTraxx Europe Subordinated Financials 5-Year Index | | Barclays Bank PLC | | | EUR 8,166 | | | | 5.00 | (1) | | | 12/20/17 | | | | (1,008,112 | ) | | | 856,711 | | | | (151,401 | ) |
| | | | | | | |
| | | | | | | | | | | | | | | | | $ | 35,670,102 | | | $ | (41,637,283 | ) | | $ | (5,967,181 | ) |
| * | If the Portfolio is the seller of credit protection, the notional amount is the maximum potential amount of future payments the Portfolio could be required to make if a credit event, as defined in the credit default swap agreement, were to occur. At October 31, 2012, such maximum potential amount for all open credit default swaps in which the Portfolio is the seller was $369,513,000. |
| ** | The contract annual fixed rate represents the fixed rate of interest received by the Portfolio (as a seller of protection) or paid by the Portfolio (as a buyer of protection) annually on the notional amount of the credit default swap contract. |
| *** | Current market annual fixed rates, utilized in determining the net unrealized appreciation or depreciation as of period end, serve as an indicator of the market’s perception of the current status of the payment/performance risk associated with the credit derivative. The current market annual fixed rate of a particular reference entity reflects the cost, as quoted by the pricing vendor, of selling protection against default of that entity as of period end and may include upfront payments required to be made to enter into the agreement. The higher the fixed rate, the greater the market perceived risk of a credit event involving the reference entity. A rate identified as “Defaulted” indicates a credit event has occurred for the reference entity. |
| (1) | Upfront payment is exchanged with the counterparty as a result of the standardized trading coupon. |
Global Macro Absolute Return Advantage Portfolio
October 31, 2012
Notes to Consolidated Financial Statements — continued
| | | | | | | | | | | | | | | | | | | | |
| Cross-Currency Swaps | |
| Counterparty | | Notional
Amount on
Fixed Rate
(Currency
Received)
(000’s omitted) | | Notional
Amount on
Floating Rate
(Currency
Delivered)
(000’s omitted) | | | Floating Rate | | Fixed Rate | | | Termination
Date | | | Net
Unrealized
Appreciation
(Depreciation) | |
| | | | | | |
| Bank of America | | TRY 700 | | $ | 394 | | | 3-month
USD-LIBOR-BBA | | | 6.97 | % | | | 8/18/21 | | | $ | (22,531 | ) |
| Citibank NA | | TRY 10,951 | | | 7,200 | | | 3-month
USD-LIBOR-BBA | | | 8.23 | | | | 9/3/20 | | | | 230,584 | |
| Citibank NA | | TRY 7,310 | | | 3,999 | | | 3-month
USD-LIBOR-BBA | | | 6.45 | | | | 1/6/21 | | | | (168,489 | ) |
| Citibank NA | | TRY 5,133 | | | 3,216 | | | 3-month
USD-LIBOR-BBA | | | 8.23 | | | | 2/25/21 | | | | (188,030 | ) |
| Citibank NA | | TRY 5,600 | | | 3,094 | | | 3-month
USD-LIBOR-BBA | | | 6.26 | | | | 10/18/21 | | | | (52,788 | ) |
| Credit Suisse International | | TRY 10,104 | | | 5,676 | | | 3-month
USD-LIBOR-BBA | | | 6.90 | | | | 8/18/21 | | | | (302,667 | ) |
| Deutsche Bank | | TRY 14,469 | | | 7,920 | | | 3-month
USD-LIBOR-BBA | | | 6.45 | | | | 1/6/21 | | | | (328,786 | ) |
| Deutsche Bank | | TRY 18,837 | | | 11,832 | | | 3-month
USD-LIBOR-BBA | | | 8.20 | | | | 2/24/21 | | | | (639,191 | ) |
| Deutsche Bank | | TRY 13,388 | | | 7,517 | | | 3-month
USD-LIBOR-BBA | | | 7.00 | | | | 8/18/21 | | | | (457,062 | ) |
| | | | | | |
| | | | | | | | | | | | | | | | | | | $ | (1,928,960 | ) |
The Portfolio pays interest on the currency received and receives interest on the currency delivered. At the termination date, the notional amount of the currency received will be exchanged for the notional amount of the currency delivered.
Written options activity for the year ended October 31, 2012 was as follows:
| | | | | | | | | | | | |
| | | Principal Amount
of Contracts
(000’s Omitted) | | | Premiums
Received | |
Outstanding, beginning of year | | | INR | | | | — | | | $ | — | |
Options written | | | | | | | 10,798,200 | | | | 6,968,940 | |
| | | |
Outstanding, end of year | | | INR | | | | 10,798,200 | | | $ | 6,968,940 | |
At October 31, 2012, the Portfolio had sufficient cash and/or securities to cover commitments under these contracts.
In the normal course of pursuing its investment objective, the Portfolio is subject to the following risks:
Commodity Risk: The Portfolio invests in commodities-linked derivative investments, including commodity futures contracts and options thereon and forward commodity contracts, that provide exposure to the investment returns of certain commodities. Commodities-linked derivative investments are used to enhance total return and/or as a substitute for the purchase or sale of commodities.
Credit Risk: The Portfolio enters into credit default swap contracts to manage certain investment risks and/or to enhance total return.
Global Macro Absolute Return Advantage Portfolio
October 31, 2012
Notes to Consolidated Financial Statements — continued
Equity Price Risk: The Portfolio enters into equity index futures and options thereon to enhance total return and/or to manage certain investment risks.
Foreign Exchange Risk: The Portfolio engages in forward foreign currency exchange contracts, options on currencies and cross-currency swaps to enhance total return, to seek to hedge against fluctuations in currency exchange rates and/or as a substitute for the purchase or sale of securities or currencies.
Interest Rate Risk: The Portfolio utilizes various interest rate derivatives including futures, interest rate swaps and swaptions, and cross-currency swaps to enhance total return, to seek to hedge against fluctuations in interest rates, and/or to change the effective duration of its portfolio.
The Portfolio enters into swap contracts, over-the-counter options, forward foreign currency exchange contracts and forward commodity contracts that may contain provisions whereby the counterparty may terminate the contract under certain conditions, including but not limited to a decline in the Portfolio’s net assets below a certain level over a certain period of time, which would trigger a payment by the Portfolio for those derivatives in a liability position. At October 31, 2012, the fair value, excluding upfront payments, of derivatives with credit-related contingent features in a net liability position was $53,951,435. The aggregate fair value of assets pledged as collateral by the Portfolio for such liability was $10,575,272 at October 31, 2012.
The non-exchange traded derivatives in which the Portfolio invests, including swap contracts, over-the-counter options, forward commodity contracts and forward foreign currency exchange contracts, are subject to the risk that the counterparty to the contract fails to perform its obligations under the contract. The Portfolio is not subject to counterparty credit risk with respect to its written options as the Portfolio, not the counterparty, is obligated to perform under such derivatives. At October 31, 2012, the maximum amount of loss the Portfolio would incur due to counterparty risk was $29,588,378 with the highest amount from any one counterparty being $4,595,387. Such maximum amount would be reduced by any unamortized upfront payments received by the Portfolio. Such amount would be increased by any unamortized upfront payments made by the Portfolio. To mitigate this risk, the Portfolio (and Subsidiary) has entered into master netting agreements with substantially all its derivative counterparties, which allows it and a counterparty to aggregate amounts owed by each of them for derivative transactions under the agreement into a single net amount payable by either the Portfolio (and Subsidiary) or the counterparty. At October 31, 2012, the maximum amount of loss the Portfolio would incur due to counterparty risk would be reduced by approximately $25,556,000 due to master netting agreements. Counterparties may be required to pledge collateral in the form of cash, U.S. Government securities or highly-rated bonds for the benefit of the Portfolio if the net amount due from the counterparty with respect to a derivative contract exceeds a certain threshold. The amount of collateral posted by the counterparties with respect to such contracts would also reduce the amount of any loss incurred. Because the Subsidiary is not registered under the 1940 Act, it may not be able to negotiate terms with its counterparties that are equivalent to those a registered Portfolio may negotiate. As a result, the Subsidiary may have greater exposure to those counterparties than a registered Portfolio.
The fair value of open derivative instruments (not considered to be hedging instruments for accounting disclosure purposes) by risk exposure at October 31, 2012 was as follows:
| | | | | | | | | | | | | | | | | | | | |
| | | Fair Value | |
| Consolidated Statement of Assets and Liabilities Caption | | Credit | | | Equity Price | | | Foreign
Exchange | | | Interest
Rate | | | Commodity | |
| | | | | |
Securities of unaffiliated issuers, at value | | $ | — | | | $ | 3,580 | | | $ | 5,412,330 | | | $ | 316,032 | | | $ | 2,947,000 | |
Net unrealized depreciation* | | | — | | | | 310,311 | | | | — | | | | 13,299 | | | | — | |
Receivable for open forward foreign currency exchange contracts | | | — | | | | — | | | | 9,064,069 | | | | — | | | | — | |
Receivable for open swap contracts; Premium paid/received on open swap contracts | | | 38,218,957 | | | | — | | | | — | | | | 3,586,780 | | | | — | |
| | | | | |
Total Asset Derivatives | | $ | 38,218,957 | | | $ | 313,891 | | | $ | 14,476,399 | | | $ | 3,916,111 | | | $ | 2,947,000 | |
| | | | | |
Written options | | $ | — | | | $ | — | | | $ | (3,134,877 | ) | | $ | — | | | $ | — | |
Net unrealized depreciation* | | | — | | | | (40,404 | ) | | | — | | | | (433,452 | ) | | $ | (1,896,712 | ) |
Payable for open forward commodity contracts | | | — | | | | — | | | | — | | | | — | | | | (833,663 | ) |
Payable for open forward foreign currency exchange contracts | | | — | | | | — | | | | (16,679,833 | ) | | | — | | | | — | |
| | | | | |
Payable for open swap contracts; Premium paid/received on open swap contracts | | | (22,548,753 | ) | | | — | | | | — | | | | (6,371,239 | ) | | | — | |
| | | | | |
Total Liability Derivatives | | $ | (22,548,753 | ) | | $ | (40,404 | ) | | $ | (19,814,710 | ) | | $ | (6,804,691 | ) | | $ | (2,730,375 | ) |
| | | | | |
| | | | | | | | | | | | | | | | | | | | |
* Amount represents cumulative unrealized appreciation or (depreciation) on futures contracts in the Futures Contracts table above. Only the current day’s variation margin on open futures contracts is reported within the Consolidated Statement of Assets and Liabilities as Receivable or Payable for variation margin, as applicable. | |
Global Macro Absolute Return Advantage Portfolio
October 31, 2012
Notes to Consolidated Financial Statements — continued
| | | | | | | | | | | | | | | | | | | | |
| | | | | |
| | | | | | | | | | | | | | | | | | | | |
| The effect of derivative instruments (not considered to be hedging instruments for accounting disclosure purposes) on the Consolidated Statement of Operations by risk exposure for the year ended October 31, 2012 was as follows: | |
| | | | | |
| | | | | | | | | | | | | | | | | | | | |
| Consolidated Statement of Operations Caption | | Credit | | | Equity Price | | | Foreign Exchange | | | Interest Rate | | | Commodity | |
| | | | | |
Net realized gain (loss) —
Investment transactions | | $ | — | | | $ | (2,259,795 | ) | | $ | — | | | $ | — | | | $ | — | |
Futures contracts | | | — | | | | 1,956,181 | | | | — | | | | 1,316,827 | | | | 1,956,789 | |
Swap contracts | | | (3,709,211 | ) | | | — | | | | — | | | | (2,769,862 | ) | | | — | |
Forward commodity contracts | | | — | | | | — | | | | — | | | | — | | | | (174,331 | ) |
| | | | | |
Foreign currency and forward foreign currency exchange contract transactions | | | — | | | | — | | | | 55,094,672 | | | | — | | | | — | |
| | | | | |
Total | | $ | (3,709,211 | ) | | $ | (303,614 | ) | | $ | 55,094,672 | | | $ | (1,453,035 | ) | | $ | 1,782,458 | |
| | | | | |
Change in unrealized appreciation (depreciation) —
Investments | | $ | — | | | $ | (422,189 | ) | | $ | 497,291 | | | $ | (790,848 | ) | | $ | 6,340 | |
Written options | | | — | | | | | | | | 3,834,063 | | | | — | | | | — | |
Futures contracts | | | — | | | | 269,907 | | | | — | | | | (1,039,026 | ) | | | (3,311,457 | ) |
Swap contracts | | | (16,188,149 | ) | | | — | | | | — | | | | (3,239,686 | ) | | | — | |
Forward commodity contracts | | | — | | | | — | | | | — | | | | — | | | | 204,462 | |
| | | | | |
Foreign currency and forward foreign currency exchange contracts | | | — | | | | — | | | | (18,457,791 | ) | | | — | | | | — | |
| | | | | |
Total | | $ | (16,188,149 | ) | | $ | (152,282 | ) | | $ | (14,126,437 | ) | | $ | (5,069,560 | ) | | $ | (3,100,655 | ) |
The average notional amounts of futures contracts, forward commodity contracts, forward foreign currency exchange contracts and swap contracts outstanding during the year ended October 31, 2012, which are indicative of the volume of these derivative types, were approximately $162,963,000, $18,603,000, $1,377,578,000 and $1,227,446,000, respectively.
The average principal amount of purchased currency options contracts, average notional amount of interest rate swaption contracts, average number of purchased index options contracts and average number of purchased commodity options contracts outstanding during the year ended October 31, 2012, which are indicative of the volume of these derivative types, were approximately $175,281,000, $24,000,000, 116,661,000 contracts and 65 contracts, respectively.
6 Line of Credit
The Portfolio participates with other portfolios and funds managed by EVM and its affiliates in a $600 million unsecured line of credit agreement with a group of banks. Borrowings are made by the Portfolio solely to facilitate the handling of unusual and/or unanticipated short-term cash requirements. Interest is charged to the Portfolio based on its borrowings at an amount above either the Eurodollar rate or Federal Funds rate. In addition, a fee computed at an annual rate of 0.08% on the daily unused portion of the line of credit is allocated among the participating portfolios and funds at the end of each quarter. Because the line of credit is not available exclusively to the Portfolio, it may be unable to borrow some or all of its requested amounts at any particular time. If measured at fair value, borrowings under the line of credit would have been considered as Level 2 in the fair value hierarchy (see Note 8) at October 31, 2012. The Portfolio did not have any significant borrowings or allocated fees during the year ended October 31, 2012.
7 Risks Associated with Foreign Investments and Currencies
Investing in securities issued by entities whose principal business activities are outside the United States may involve significant risks not present in domestic investments. For example, there is generally less publicly available information about foreign companies, particularly those not subject to the disclosure and reporting requirements of the U.S. securities laws. Certain foreign issuers are generally not bound by uniform accounting, auditing, and financial reporting requirements and standards of practice comparable to those applicable to domestic issuers. Investments in foreign securities and currencies also involve the risk of possible adverse changes in investment or exchange control regulations, expropriation or confiscatory taxation, limitation on the removal of funds or other assets of the Portfolio, political or financial instability or diplomatic and other developments which could affect such investments. Foreign securities markets, while growing in volume and sophistication, are generally not as developed as those in the United States, and
Global Macro Absolute Return Advantage Portfolio
October 31, 2012
Notes to Consolidated Financial Statements — continued
securities of some foreign issuers (particularly those located in developing countries) may be less liquid and more volatile than securities of comparable U.S. companies. In general, there is less overall governmental supervision and regulation of foreign securities markets, broker/dealers and issuers than in the United States.
8 Fair Value Measurements
Under generally accepted accounting principles for fair value measurements, a three-tier hierarchy to prioritize the assumptions, referred to as inputs, is used in valuation techniques to measure fair value. The three-tier hierarchy of inputs is summarized in the three broad levels listed below.
| Ÿ | | Level 1 – quoted prices in active markets for identical investments |
| Ÿ | | Level 2 – other significant observable inputs (including quoted prices for similar investments, interest rates, prepayment speeds, credit risk, etc.) |
| Ÿ | | Level 3 – significant unobservable inputs (including a fund’s own assumptions in determining the fair value of investments) |
In cases where the inputs used to measure fair value fall in different levels of the fair value hierarchy, the level disclosed is determined based on the lowest level input that is significant to the fair value measurement in its entirety. The inputs or methodology used for valuing securities are not necessarily an indication of the risk associated with investing in those securities.
At October 31, 2012, the hierarchy of inputs used in valuing the Portfolio’s investments and open derivative instruments, which are carried at value, were as follows:
| | | | | | | | | | | | | | | | |
| Asset Description | | | Level 1 | | | | Level 2 | | | | Level 3 | | | | Total | |
| | | | | | | | | | | | | | | | |
| | | | |
Foreign Government Bonds | | $ | — | | | $ | 487,121,798 | | | $ | — | | | $ | 487,121,798 | |
Collateralized Mortgage Obligations | | | — | | | | 39,018,213 | | | | — | | | | 39,018,213 | |
Mortgage Pass-Throughs | | | — | | | | 7,263,296 | | | | — | | | | 7,263,296 | |
Common Stocks | | | — | | | | 17,400,136 | * | | | — | | | | 17,400,136 | |
Precious Metals | | | 36,036,631 | | | | — | | | | — | | | | 36,036,631 | |
Currency Call Options Purchased | | | — | | | | 5,227,473 | | | | — | | | | 5,227,473 | |
Currency Put Options Purchased | | | — | | | | 184,857 | | | | — | | | | 184,857 | |
Interest Rate Swaptions | | | — | | | | 316,032 | | | | — | | | | 316,032 | |
Put Options Purchased | | | 2,947,000 | | | | 3,580 | | | | — | | | | 2,950,580 | |
Short-Term Investments — | | | | | | | | | | | | | | | | |
Foreign Government Securities | | | — | | | | 472,515,788 | | | | — | | | | 472,515,788 | |
U.S. Treasury Obligations | | | — | | | | 10,999,596 | | | | — | | | | 10,999,596 | |
Repurchase Agreements | | | — | | | | 137,007,962 | | | | — | | | | 137,007,962 | |
Other | | | — | | | | 88,479,972 | | | | — | | | | 88,479,972 | |
| | | | |
Total Investments | | $ | 38,983,631 | | | $ | 1,265,538,703 | | | $ | — | | | $ | 1,304,522,334 | |
| | | | |
Forward Foreign Currency Exchange Contracts | | $ | — | | | $ | 9,064,069 | | | $ | — | | | $ | 9,064,069 | |
Swap Contracts | | | — | | | | 41,805,737 | | | | — | | | | 41,805,737 | |
Futures Contracts | | | 323,610 | | | | — | | | | — | | | | 323,610 | |
| | | | |
Total | | $ | 39,307,241 | | | $ | 1,316,408,509 | | | $ | — | | | $ | 1,355,715,750 | |
Global Macro Absolute Return Advantage Portfolio
October 31, 2012
Notes to Consolidated Financial Statements — continued
| | | | | | | | | | | | | | | | |
| Liability Description | | Level 1 | | | Level 2 | | | Level 3 | | | Total | |
| | | | | | | | | | | | | | | | |
| | | | |
Currency Call Options Written | | $ | — | | | $ | (2,901,667 | ) | | $ | — | | | $ | (2,901,667 | ) |
Currency Put Options Written | | | — | | | | (233,210 | ) | | | — | | | | (233,210 | ) |
Securities Sold Short | | | — | | | | (149,424,821 | ) | | | — | | | | (149,424,821 | ) |
Forward Commodity Contracts | | | — | | | | (833,663 | ) | | | — | | | | (833,663 | ) |
Forward Foreign Currency Exchange Contracts | | | — | | | | (16,679,833 | ) | | | — | | | | (16,679,833 | ) |
Swap Contracts | | | — | | | | (28,919,992 | ) | | | — | | | | (28,919,992 | ) |
Futures Contracts | | | (2,370,568 | ) | | | — | | | | — | | | | (2,370,568 | ) |
| | | | |
Total | | $ | (2,370,568 | ) | | $ | (198,993,186 | ) | | $ | — | | | $ | (201,363,754 | ) |
| * | Includes foreign equity securities whose values were adjusted to reflect market trading of comparable securities or other correlated instruments that occurred after the close of trading in their applicable foreign markets. |
The Portfolio held no investments or other financial instruments as of October 31, 2011 whose fair value was determined using Level 3 inputs. At October 31, 2012, there were no investments transferred between Level 1 and Level 2 during the year then ended.
Global Macro Absolute Return Advantage Portfolio
October 31, 2012
Report of Independent Registered Public Accounting Firm
To the Trustees and Investors of Global Macro Absolute Return Advantage Portfolio:
We have audited the accompanying consolidated statement of assets and liabilities of Global Macro Absolute Return Advantage Portfolio and subsidiary (the “Portfolio”), including the consolidated portfolio of investments as of October 31, 2012, and the related consolidated statement of operations for the year then ended, the consolidated statements of changes in net assets for each of the two years in the period then ended, and the consolidated supplementary data for each of the two years in the period then ended and for the period from the start of business, August 31, 2010, to October 31, 2010. These consolidated financial statements and consolidated supplementary data are the responsibility of the Portfolio’s management. Our responsibility is to express an opinion on these consolidated financial statements and consolidated supplementary data based on our audits.
We conducted our audits in accordance with the standards of the Public Company Accounting Oversight Board (United States). Those standards require that we plan and perform the audit to obtain reasonable assurance about whether the consolidated financial statements and consolidated supplementary data are free of material misstatement. The Portfolio is not required to have, nor were we engaged to perform, an audit of its internal control over financial reporting. Our audits included consideration of internal control over financial reporting as a basis for designing audit procedures that are appropriate in the circumstances, but not for the purpose of expressing an opinion on the effectiveness of the Portfolio’s internal control over financial reporting. Accordingly, we express no such opinion. An audit also includes examining, on a test basis, evidence supporting the amounts and disclosures in the financial statements, assessing the accounting principles used and significant estimates made by management, as well as evaluating the overall financial statement presentation. Our procedures included confirmation of securities owned as of October 31, 2012, by correspondence with the custodian and brokers; where replies were not received from brokers, we performed other auditing procedures. We believe that our audits provide a reasonable basis for our opinion.
In our opinion, such consolidated financial statements and consolidated supplementary data referred to above present fairly, in all material respects, the financial position of Global Macro Absolute Return Advantage Portfolio and subsidiary as of October 31, 2012, the results of their operations for the year then ended, the changes in their net assets for each of the two years in the period then ended, and the supplementary data for each of the two years in the period then ended and for the period from the start of business, August 31, 2010, to October 31, 2010, in conformity with accounting principles generally accepted in the United States of America.
DELOITTE & TOUCHE LLP
Boston, Massachusetts
December 21, 2012
Eaton Vance
Global Macro Absolute Return Advantage Fund
October 31, 2012
Management and Organization
Fund Management. The Trustees of Eaton Vance Mutual Funds Trust (the Trust) and Global Macro Absolute Return Advantage Portfolio (the Portfolio) are responsible for the overall management and supervision of the Trust’s and Portfolio’s affairs. The Trustees and officers of the Trust and the Portfolio are listed below. Except as indicated, each individual has held the office shown or other offices in the same company for the last five years. Trustees and officers of the Trust and the Portfolio hold indefinite terms of office. The “Noninterested Trustees” consist of those Trustees who are not “interested persons” of the Trust and the Portfolio, as that term is defined under the 1940 Act. The business address of each Trustee and officer is Two International Place, Boston, Massachusetts 02110. As used below, “EVC” refers to Eaton Vance Corp., “EV” refers to Eaton Vance, Inc., “EVM” refers to Eaton Vance Management, “BMR” refers to Boston Management and Research and “EVD” refers to Eaton Vance Distributors, Inc. EVC and EV are the corporate parent and trustee, respectively, of EVM and BMR. EVD is the Fund’s principal underwriter, the Portfolio’s placement agent and a wholly-owned subsidiary of EVC. Each officer affiliated with Eaton Vance may hold a position with other Eaton Vance affiliates that is comparable to his or her position with EVM listed below. Each Trustee oversees 187 portfolios in the Eaton Vance Complex (including all master and feeder funds in a master feeder structure). Each officer serves as an officer of certain other Eaton Vance funds. Each Trustee and officer serves until his or her successor is elected.
| | | | | | |
| Name and Year of Birth | | Position(s) with the Trust and the Portfolio | | Length of
Service | | Principal Occupation(s) and Directorships During Past Five Years and Other Relevant Experience |
Interested Trustee |
| | | |
Thomas E. Faust Jr. 1958 | | Trustee | | Of the Trust since 2007 and of the Portfolio since 2010 | | Chairman, Chief Executive Officer and President of EVC, Director and President of EV, Chief Executive Officer and President of EVM and BMR, and Director of EVD. Trustee and/or officer of 187 registered investment companies. Mr. Faust is an interested person because of his positions with EVM, BMR, EVD, EVC and EV, which are affiliates of the Trust and the Portfolio. Directorships in the Last Five Years.(1) Director of EVC and Hexavest Inc. |
| | | |
| | | | | | |
Noninterested Trustees |
| | | |
Scott E. Eston 1956 | | Trustee | | Since 2011 | | Private investor. Formerly held various positions at Grantham, Mayo, Van Otterloo and Co., L.L.C. (investment management firm) (1997-2009), including Chief Operating Officer (2002-2009), Chief Financial Officer (1997-2009) and Chairman of the Executive Committee (2002-2008); President and Principal Executive Officer, GMO Trust (open-end registered investment company) (2006-2009). Former Partner, Coopers and Lybrand L.L.P. (now PricewaterhouseCoopers) (public accounting firm) (1987-1997). Directorships in the Last Five Years. None. |
| | | |
Benjamin C. Esty 1963 | | Trustee | | Of the Trust since 2005 and of the Portfolio since 2010 | | Roy and Elizabeth Simmons Professor of Business Administration and Finance Unit Head, Harvard University Graduate School of Business Administration. Directorships in the Last Five Years.(1) None. |
| | | |
Allen R. Freedman 1940 | | Trustee | | Of the Trust since 2007 and of the Portfolio since 2010 | | Private Investor. Former Chairman (2002-2004) and a Director (1983-2004) of Systems & Computer Technology Corp. (provider of software to higher education). Formerly, a Director of Loring Ward International (fund distributor) (2005-2007). Former Chairman and a Director of Indus International, Inc. (provider of enterprise management software to the power generating industry) (2005-2007). Former Chief Executive Officer of Assurant, Inc. (insurance provider) (1979-2000). Directorships in the Last Five Years.(1) Director of Stonemor Partners, L.P. (owner and operator of cemeteries). Formerly, Director of Assurant, Inc. (insurance provider) (1979-2011). |
| | | |
William H. Park 1947 | | Trustee | | Of the Trust since 2003 and of the Portfolio since 2010 | | Consultant and private investor. Formerly, Chief Financial Officer, Aveon Group L.P. (investment management firm) (2010-2011). Formerly, Vice Chairman, Commercial Industrial Finance Corp. (specialty finance company) (2006-2010). Formerly, President and Chief Executive Officer, Prizm Capital Management, LLC (investment management firm) (2002-2005). Formerly, Executive Vice President and Chief Financial Officer, United Asset Management Corporation (investment management firm) (1982-2001). Formerly, Senior Manager, Price Waterhouse (now PricewaterhouseCoopers) (an independent registered public accounting firm) (1972-1981). Directorships in the Last Five Years.(1) None. |
| | | |
Ronald A. Pearlman 1940 | | Trustee | | Of the Trust since 2003 and of the Portfolio since 2010 | | Professor of Law, Georgetown University Law Center. Formerly, Deputy Assistant Secretary (Tax Policy) and Assistant Secretary (Tax Policy), U.S. Department of the Treasury (1983-1985). Formerly, Chief of Staff, Joint Committee on Taxation, U.S. Congress (1988-1990). Directorships in the Last Five Years.(1) None. |
Eaton Vance
Global Macro Absolute Return Advantage Fund
October 31, 2012
Management and Organization — continued
| | | | | | |
| Name and Year of Birth | | Position(s) with the Trust and the Portfolio | | Length of
Service | | Principal Occupation(s) and Directorships During Past Five Years and Other Relevant Experience |
Noninterested Trustees (continued) |
Helen Frame Peters 1948 | | Trustee | | Of the Trust since 2008 and of the Portfolio since 2010 | | Professor of Finance, Carroll School of Management, Boston College. Formerly, Dean, Carroll School of Management, Boston College (2000-2002). Formerly, Chief Investment Officer, Fixed Income, Scudder Kemper Investments (investment management firm) (1998-1999). Formerly, Chief Investment Officer, Equity and Fixed Income, Colonial Management Associates (investment management firm) (1991-1998). Directorships in the Last Five Years.(1) Formerly, Director of BJ’s Wholesale Club, Inc. (wholesale club retailer) (2004-2011). Formerly, Trustee of SPDR Index Shares Funds and SPDR Series Trust (exchange traded funds) (2000-2009). Formerly, Director of Federal Home Loan Bank of Boston (a bank for banks) (2007-2009). |
Lynn A. Stout 1957 | | Trustee | | Of the Trust since 1998 and of the Portfolio since 2010 | | Distinguished Professor of Corporate and Business Law, Jack G. Clarke Business Law Institute, Cornell University Law School. Formerly, the Paul Hastings Professor of Corporate and Securities Law (2006-2012) and Professor of Law (2001-2006), University of California at Los Angeles School of Law. Directorships in the Last Five Years.(1) None. |
Harriett Tee Taggart 1948 | | Trustee | | Since 2011 | | Managing Director, Taggart Associates (a professional practice firm). Formerly, Partner and Senior Vice President, Wellington Management Company, LLP (investment management firm) (1983-2006). Directorships in the Last Five Years. Director of Albemarle Corporation (chemicals manufacturer) (since 2007) and The Hanover Group (specialty property and casualty insurance company) (since 2009). Formerly, Director of Lubrizol Corporation (specialty chemicals) (2007-2011). |
Ralph F. Verni 1943 | | Chairman of the Board and Trustee | | Chairman of the Board since 2007; Trustee of the Trust since 2005 and of the Portfolio since 2010 | | Consultant and private investor. Formerly, Chief Investment Officer (1982-1992), Chief Financial Officer (1988-1990) and Director (1982-1992), New England Life. Formerly, Chairperson, New England Mutual Funds (1982-1992). Formerly, President and Chief Executive Officer, State Street Management & Research (1992-2000). Formerly, Chairperson, State Street Research Mutual Funds (1992-2000). Formerly, Director, W.P. Carey, LLC (1998-2004) and First Pioneer Farm Credit Corp. (2002-2006). Directorships in the Last Five Years.(1) None. |
| | | |
| | | | | | |
Principal Officers who are not Trustees |
| Name and Year of Birth | | Position(s) with the Trust and the Portfolio | | Length of Service | | Principal Occupation(s) During Past Five Years |
Duncan W. Richardson 1957 | | President of the Trust | | Since 2011 | | Director of EVC and Executive Vice President and Chief Equity Investment Officer of EVC, EVM and BMR. |
Eric A. Stein 1980 | | President of the Portfolio | | Since 2012 | | Vice President of EVM and BMR. |
Payson F. Swaffield 1956 | | Vice President | | Since 2011 | | Vice President and Chief Income Investment Officer of EVM and BMR. |
Barbara E. Campbell 1957 | | Treasurer | | Of the Trust since 2005 and of the Portfolio since 2010 | | Vice President of EVM and BMR. |
Maureen A. Gemma 1960 | | Vice President, Secretary and Chief Legal Officer | | Vice President since 2011; Secretary of the Trust since 2007 and of the Portfolio since 2010; and Chief Legal Officer of the Trust since 2008 and of the Portfolio since 2010 | | Vice President of EVM and BMR. |
Eaton Vance
Global Macro Absolute Return Advantage Fund
October 31, 2012
Management and Organization — continued
| | | | | | |
| Name and Year of Birth | | Position(s) with the Trust and the Portfolio | | Length of Service | | Principal Occupation(s) During Past Five Years |
Principal Officers who are not Trustees (continued) |
| | | |
Paul M. O’Neil 1953 | | Chief Compliance Officer | | Of the Trust since 2004 and of the Portfolio since 2010 | | Vice President of EVM and BMR. |
| (1) | During their respective tenures, the Trustees (except Mr. Eston and Ms. Taggart) also served as trustees of one or more of the following Eaton Vance funds (which operated in the years noted): Eaton Vance Credit Opportunities Fund (launched in 2005 and terminated in 2010); Eaton Vance Insured Florida Plus Municipal Bond Fund (launched in 2002 and terminated in 2009); and Eaton Vance National Municipal Income Trust (launched in 1998 and terminated in 2009). |
The SAI for the Fund includes additional information about the Trustees and officers of the Fund and the Portfolio and can be obtained without charge on Eaton Vance’s website at www.eatonvance.com or by calling 1-800-262-1122.
Eaton Vance Funds
IMPORTANT NOTICES
Privacy. The Eaton Vance organization is committed to ensuring your financial privacy. Each of the financial institutions identified below has in effect the following policy (“Privacy Policy”) with respect to nonpublic personal information about its customers:
| Ÿ | | Only such information received from you, through application forms or otherwise, and information about your Eaton Vance fund transactions will be collected. This may include information such as name, address, social security number, tax status, account balances and transactions. |
| Ÿ | | None of such information about you (or former customers) will be disclosed to anyone, except as permitted by law (which includes disclosure to employees necessary to service your account). In the normal course of servicing a customer’s account, Eaton Vance may share information with unaffiliated third parties that perform various required services such as transfer agents, custodians and broker-dealers. |
| Ÿ | | Policies and procedures (including physical, electronic and procedural safeguards) are in place that are designed to protect the confidentiality of such information. |
| Ÿ | | We reserve the right to change our Privacy Policy at any time upon proper notification to you. Customers may want to review our Privacy Policy periodically for changes by accessing the link on our homepage: www.eatonvance.com. |
Our pledge of privacy applies to the following entities within the Eaton Vance organization: the Eaton Vance Family of Funds, Eaton Vance Management, Eaton Vance Investment Counsel, Eaton Vance Distributors, Inc., Eaton Vance Trust Company, Eaton Vance Management’s Real Estate Investment Group and Boston Management and Research. In addition, our Privacy Policy applies only to those Eaton Vance customers who are individuals and who have a direct relationship with us. If a customer’s account (i.e., fund shares) is held in the name of a third-party financial advisor/broker-dealer, it is likely that only such advisor’s privacy policies apply to the customer. This notice supersedes all previously issued privacy disclosures. For more information about Eaton Vance’s Privacy Policy, please call 1-800-262-1122.
Delivery of Shareholder Documents. The Securities and Exchange Commission (SEC) permits funds to deliver only one copy of shareholder documents, including prospectuses, proxy statements and shareholder reports, to fund investors with multiple accounts at the same residential or post office box address. This practice is often called “householding” and it helps eliminate duplicate mailings to shareholders. Eaton Vance, or your financial advisor, may household the mailing of your documents indefinitely unless you instruct Eaton Vance, or your financial advisor, otherwise. If you would prefer that your Eaton Vance documents not be householded, please contact Eaton Vance at 1-800-262-1122, or contact your financial advisor. Your instructions that householding not apply to delivery of your Eaton Vance documents will be effective within 30 days of receipt by Eaton Vance or your financial advisor.
Portfolio Holdings. Each Eaton Vance Fund and its underlying Portfolio(s) (if applicable) will file a schedule of portfolio holdings on Form N-Q with the SEC for the first and third quarters of each fiscal year. The Form N-Q will be available on the Eaton Vance website at www.eatonvance.com, by calling Eaton Vance at 1-800-262-1122 or in the EDGAR database on the SEC’s website at www.sec.gov. Form N-Q may also be reviewed and copied at the SEC’s public reference room in Washington, D.C. (call 1-800-732-0330 for information on the operation of the public reference room).
Proxy Voting. From time to time, funds are required to vote proxies related to the securities held by the funds. The Eaton Vance Funds or their underlying Portfolios (if applicable) vote proxies according to a set of policies and procedures approved by the Funds’ and Portfolios’ Boards. You may obtain a description of these policies and procedures and information on how the Funds or Portfolios voted proxies relating to portfolio securities during the most recent 12-month period ended June 30, without charge, upon request, by calling 1-800-262-1122 and by accessing the SEC’s website at www.sec.gov.
This Page Intentionally Left Blank
This Page Intentionally Left Blank
Investment Adviser of Global Macro Absolute Return Advantage Portfolio
Boston Management and Research
Two International Place
Boston, MA 02110
Investment Adviser and Administrator of Eaton Vance Global Macro Absolute Return Advantage Fund
Eaton Vance Management
Two International Place
Boston, MA 02110
Principal Underwriter*
Eaton Vance Distributors, Inc.
Two International Place
Boston, MA 02110
(617) 482-8260
Custodian
State Street Bank and Trust Company
200 Clarendon Street
Boston, MA 02116
Transfer Agent
BNY Mellon Investment Servicing (US) Inc.
Attn: Eaton Vance Funds
P.O. Box 9653
Providence, RI 02940-9653
(800) 262-1122
Independent Registered Public Accounting Firm
Deloitte & Touche LLP
200 Berkeley Street
Boston, MA 02116-5022
Fund Offices
Two International Place
Boston, MA 02110
| * | FINRA BrokerCheck. Investors may check the background of their Investment Professional by contacting the Financial Industry Regulatory Authority (FINRA). FINRA BrokerCheck is a free tool to help investors check the professional background of current and former FINRA-registered securities firms and brokers. FINRA BrokerCheck is available by calling 1-800-289-9999 and at www.FINRA.org. The FINRA BrokerCheck brochure describing this program is available to investors at www.FINRA.org. |
| | |
Eaton Vance Tax-Managed Global Dividend Income Fund Annual Report October 31, 2012 | | 
|

Fund shares are not insured by the FDIC and are not deposits or other obligations of, or guaranteed by, any depository institution. Shares are subject to investment risks, including possible loss of principal invested.
This report must be preceded or accompanied by a current summary prospectus or prospectus. Before investing, investors should consider carefully the investment objective, risks, and charges and expenses of a mutual fund. This and other important information is contained in the summary prospectus and prospectus, which can be obtained from a financial advisor. Prospective investors should read the prospectus carefully before investing. For further information, please call 1-800-262-1122.
Annual Report October 31, 2012
Eaton Vance
Tax-Managed Global Dividend Income Fund
| | | | |
| Table of Contents | | | |
| |
Management’s Discussion of Fund Performance | | | 2 | |
| |
Performance | | | 3 | |
| |
Fund Profile | | | 4 | |
| |
Endnotes and Additional Disclosures | | | 5 | |
| |
Fund Expenses | | | 6 | |
| |
Financial Statements | | | 7 | |
| |
Report of Independent Registered Public Accounting Firm | | | 27 | |
| |
Federal Tax Information | | | 28 | |
| |
Management and Organization | | | 29 | |
| |
Important Notices | | | 31 | |
Eaton Vance
Tax-Managed Global Dividend Income Fund
October 31, 2012
Management’s Discussion of Fund Performance1
Economic and Market Conditions
As the 12-month period began, investors appeared to worry about intensifying debt problems in Europe, high U.S. unemployment and a Congressional deadlock that left businesses perplexed about the direction of tax and regulatory policy. The MSCI World Index,2 a broad measure of global equity market performance, was relatively flat in November 2011.
Beginning in mid-December 2011, however, an equity rally took hold and continued into early April 2012. U.S. stocks were generally fueled by stronger economic growth and falling unemployment. European stocks continued to underperform U.S. issues, but nonetheless moved higher, aided by the Long-Term Refinancing Operation announced by the European Central Bank (ECB) and what the markets perceived as a successful restructuring of Greek debt. Then in May 2012, the third annual mid-year economic slowdown arrived. As U.S. stock prices decreased, stock prices overseas fell even harder. Contributing factors included renewed concerns over Europe and slowing growth in China.
But despite a slowdown in consumer spending, weakening employment data and downward revisions of growth expectations, global equities moved upward intermittently from June through mid-October 2012. Hunting for yield in a low interest-rate environment, investors were driven to stocks that offered better yields than bonds. Ongoing action by the ECB also helped the market, particularly the Outright Monetary Transactions program to support sovereign debt.
Additional factors led U.S. stocks to generally outperform their non-U.S. counterparts. First, investors anticipated that worsening economic news would prompt the U.S. Federal Reserve to initiate another round of quantitative easing to stimulate the economy—which it did in September 2012. Finally, in an increasingly global marketplace, a case could be made that the U.S. market was relatively attractive versus many other world markets for much of the period. Amid ongoing European turmoil and a slowdown in Chinese growth, the U.S. market was one of the few places investors could find an economy that was growing (albeit slowly); a liquid, transparent and generally well regulated market; and an opportunity to find companies with large cash reserves and solid profit growth.
In the final weeks of the period, however, stocks gave back some of their gains as the market seemed to have come full circle; amid uncertainty about the upcoming U.S. elections, investors once again worried about a Congressional deadlock on tax policy—an impasse that has left the United States rushing toward a fiscal cliff that could drag down the global economy.
Fund Performance
For the fiscal year ended October 31, 2012, Eaton Vance Tax- Managed Global Dividend Income Fund (the Fund) had a total return of 10.74% for Class A shares at net asset value (NAV). By contrast, the Fund’s benchmark, the MSCI World Index (the Index), had a total return of 9.45% for the period. Relative outperformance by the Fund’s common stock allocation and its preferred securities allocation both contributed to the Fund’s outperformance of the Index.
Performance of the Fund’s common stock allocation was helped by stock selection in the materials, consumer discretionary and consumer staples sectors. Within the materials sector, stock selection in chemicals boosted results versus the Index, as did a relative underweighting and stock selection in the poor-performing metals and mining industry. In consumer discretionary, stock selection among specialty retail stocks, as well as an overweighting in the industry, aided Fund performance versus the Index. An overweight in tobacco stocks, which performed well for the period, and stock selection among beverage stocks contributed to Fund results versus the Index in the consumer discretionary sector.
By contrast, stock selection in the health care, information technology (IT) and industrials sectors detracted from Fund performance versus the Index. Positioning in pharmaceuticals and in health care providers and services hurt Fund results versus the Index in the health care sector, as did avoiding the strong-performing biotechnology industry. Stock selection in communications equipment and an underweight in computers and peripherals stocks, which rose sharply during the period, held back Fund performance versus the Index in the IT sector. Positioning in building products, as well as industrial conglomerates, detracted from Fund results versus the Index in the industrials sector.
As of October 31, 2012, the Fund had approximately 24% of its total investments in preferred securities (i.e., preferred stocks and corporate bonds and notes). The return of the preferred securities allocation outperformed both the Index and the return of the BofA Merrill Lynch Fixed Rate Preferred Securities Index, an index measuring the overall preferred market. This outperformance relative to the preferred market resulted from several factors. The Fund’s bank holdings contributed to performance after bouncing back from lows reached in the summer of 2011. Capital management actions resulted in several of the Fund’s preferred holdings being tendered or called above market price, as issuers retired older, higher-interest preferred stocks in favor of new offerings that paid lower rates. The Fund also participated in a number of new issues that outperformed the preferred market. In addition, stock selection among high-yield names helped, as high-yield issues rallied during the period in response to investors’ search for yield.
See Endnotes and Additional Disclosures in this report.
Past performance is no guarantee of future results. Returns are historical and are calculated by determining the percentage change in net asset value (NAV) or offering price (as applicable) with all distributions reinvested. Investment return and principal value will fluctuate so that shares, when redeemed, may be worth more or less than their original cost. Performance less than one year is cumulative. Performance is for the stated time period only; due to market volatility, the Fund’s current performance may be lower or higher than quoted. Returns are before taxes unless otherwise noted. For performance as of the most recent month end, please refer to www.eatonvance.com.
Eaton Vance
Tax-Managed Global Dividend Income Fund
October 31, 2012
Performance2,3
Portfolio Managers Judith A. Saryan, CFA, Aamer Khan, CFA and John H. Croft, CFA
| | | | | | | | | | | | | | | | |
| % Average Annual Total Returns | | Inception Date | | | One Year | | | Five Years | | | Since
Inception | |
Class A at NAV | | | 05/30/2003 | | | | 10.74 | % | | | –1.84 | % | | | 5.35 | % |
Class A with 5.75% Maximum Sales Charge | | | — | | | | 4.34 | | | | –3.00 | | | | 4.69 | |
Class B at NAV | | | 05/30/2003 | | | | 9.93 | | | | –2.57 | | | | 4.57 | |
Class B with 5% Maximum Sales Charge | | | — | | | | 4.93 | | | | –2.87 | | | | 4.57 | |
Class C at NAV | | | 05/30/2003 | | | | 9.93 | | | | –2.57 | | | | 4.58 | |
Class C with 1% Maximum Sales Charge | | | — | | | | 8.93 | | | | –2.57 | | | | 4.58 | |
Class I at NAV | | | 08/27/2007 | | | | 11.01 | | | | –1.58 | | | | –0.77 | |
MSCI World Index | | | 05/30/2003 | | | | 9.45 | % | | | –2.86 | % | | | 6.62 | % |
| | | | |
| | | | | | | | | | | | | | | | |
| % After-Tax Returns with Maximum Sales Charge | | Inception Date | | | One Year | | | Five Years | | | Since
Inception | |
Class A After Taxes on Distributions | | | 05/30/2003 | | | | 3.55 | % | | | –3.88 | % | | | 3.84 | % |
Class A After Taxes on Distributions and Sale of Fund Shares | | | — | | | | 3.78 | | | | –2.63 | | | | 3.98 | |
Class B After Taxes on Distributions | | | 05/30/2003 | | | | 4.22 | | | | –3.65 | | | | 3.84 | |
Class B After Taxes on Distributions and Sale of Fund Shares | | | — | | | | 4.07 | | | | –2.50 | | | | 3.91 | |
Class C After Taxes on Distributions | | | 05/30/2003 | | | | 8.23 | | | | –3.34 | | | | 3.84 | |
Class C After Taxes on Distributions and Sale of Fund Shares | | | — | | | | 6.67 | | | | –2.25 | | | | 3.91 | |
Class I After Taxes on Distributions | | | 08/27/2007 | | | | 10.13 | | | | –2.50 | | | | –1.69 | |
Class I After Taxes on Distributions and Sale of Fund Shares | | | — | | | | 8.22 | | | | –1.45 | | | | –0.76 | |
| | | | |
| | | | | | | | | | | | | | | | |
| % Total Annual Operating Expense Ratios4 | | Class A | | | Class B | | | Class C | | | Class I | |
| | | 1.17 | % | | | 1.92 | % | | | 1.92 | % | | | 0.93 | % |
Performance of $10,000
This graph shows the change in value of a hypothetical investment of $10,000 in Class A of the Fund for the period indicated. For comparison, the same investment is shown in the indicated index.
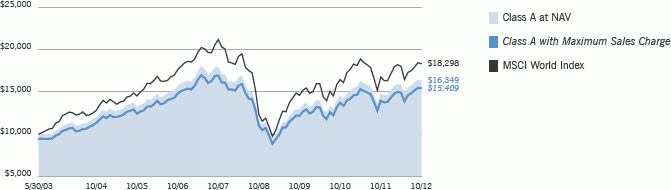
| | | | | | | | |
| Performance of Investment | | Amount Invested | | Period Beginning | | At NAV | | With Maximum
Sales Charge |
Class B | | $10,000 | | 05/30/2003 | | $15,247 | | N.A. |
Class C | | $10,000 | | 05/30/2003 | | $15,248 | | N.A. |
Class I | | $250,000 | | 08/27/2007 | | $240,200 | | N.A. |
See Endnotes and Additional Disclosures in this report.
Past performance is no guarantee of future results. Returns are historical and are calculated by determining the percentage change in net asset value (NAV) or offering price (as applicable) with all distributions reinvested. Investment return and principal value will fluctuate so that shares, when redeemed, may be worth more or less than their original cost. Performance less than one year is cumulative. Performance is for the stated time period only; due to market volatility, the Fund’s current performance may be lower or higher than quoted. Returns are before taxes unless otherwise noted. For performance as of the most recent month end, please refer to www.eatonvance.com.
Eaton Vance
Tax-Managed Global Dividend Income Fund
October 31, 2012
Fund Profile
| | | | |
Top 10 Common Stock Holdings (% of total investments) | |
Accenture PLC, Class A | | | 2.1 | % |
U.S. Bancorp | | | 2.0 | |
Covidien PLC | | | 2.0 | |
International Business Machines Corp. | | | 1.9 | |
Oracle Corp. | | | 1.9 | |
TJX Companies, Inc. (The) | | | 1.8 | |
Anheuser-Busch InBev NV | | | 1.7 | |
Royal Dutch Shell PLC, Class A | | | 1.7 | |
Apple, Inc. | | | 1.7 | |
Sanofi | | | 1.7 | |
Total | | | 18.5 | % |
See Endnotes and Additional Disclosures in this report.
Eaton Vance
Tax-Managed Global Dividend Income Fund
October 31, 2012
Endnotes and Additional Disclosures
| 1 | The views expressed in this report are those of the portfolio manager(s) and are current only through the date stated at the top of this page. These views are subject to change at any time based upon market or other conditions, and Eaton Vance and the Fund(s) disclaim any responsibility to update such views. These views may not be relied upon as investment advice and, because investment decisions are based on many factors, may not be relied upon as an indication of trading intent on behalf of any Eaton Vance fund. This commentary may contain statements that are not historical facts, referred to as “forward looking statements”. The Fund’s actual future results may differ significantly from those stated in any forward looking statement, depending on factors such as changes in securities or financial markets or general economic conditions, the volume of sales and purchases of Fund shares, the continuation of investment advisory, administrative and service contracts, and other risks discussed from time to time in the Fund’s filings with the Securities and Exchange Commission. |
| 2 | MSCI World Index is an unmanaged index of equity securities in the developed markets. MSCI indices are net of foreign withholding taxes. Source: MSCI. MSCI data may not be reproduced or used for any other purpose. MSCI provides no warranties, has not prepared or approved this report, and has no liability hereunder. BofA Merrill Lynch Fixed Rate Preferred Securities Index is an unmanaged index of fixed-rate, preferred securities issued in the U.S. BofA Merrill Lynch® indices not for redistribution or other uses; provided “as is”, without warranties, and with no liability. Eaton Vance has prepared this report, BofAML does not endorse it, or guarantee, review, or endorse Eaton Vance’s products. Unless otherwise stated, index returns do not reflect the effect of any applicable sales charges, commissions, expenses, taxes or leverage, as applicable. It is not possible to invest directly in an index. |
| 3 | Total Returns at NAV do not include applicable sales charges. If sales charges were deducted, the returns would be lower. Total Returns shown with maximum sales charge reflect the stated maximum sales charge. Unless otherwise stated, performance does not reflect the deduction of taxes on Fund distributions or redemptions of Fund shares. After-tax returns are calculated using certain assumptions, including using the highest historical individual federal income tax rates and do not reflect the impact of state/local taxes. Actual after-tax returns depend on a shareholder’s tax situation and the actual characterization of distributions and may differ from those shown. After-tax returns are not relevant to shareholders who hold shares in tax-deferred accounts or shares held by nontaxable entities. Return After |
| | Taxes on Distributions may be the same as Return Before Taxes for the same period because no taxable distributions were made during that period. Return After Taxes on Distributions and Sale of Fund Shares may be greater than or equal to Return After Taxes on Distributions for the same period because of losses realized on the sale of Fund shares. The Fund’s after-tax returns also may reflect foreign tax credits passed by the Fund to its shareholders. |
| 4 | Source: Fund prospectus. |
| | Fund profile subject to change due to active management. |
Important Notice to Shareholders
Tax code provisions applicable to tax-favored dividends are effective for distributions paid on or before December 31, 2012. Thereafter, dividends will be taxable as ordinary income unless further legislative action is taken.
Eaton Vance
Tax-Managed Global Dividend Income Fund
October 31, 2012
Fund Expenses
Example: As a Fund shareholder, you incur two types of costs: (1) transaction costs, including sales charges (loads) on purchases and redemption fees (if applicable); and (2) ongoing costs, including management fees; distribution and/or service fees; and other Fund expenses. This Example is intended to help you understand your ongoing costs (in dollars) of Fund investing and to compare these costs with the ongoing costs of investing in other mutual funds. The Example is based on an investment of $1,000 invested at the beginning of the period and held for the entire period (May 1, 2012 – October 31, 2012).
Actual Expenses: The first section of the table below provides information about actual account values and actual expenses. You may use the information in this section, together with the amount you invested, to estimate the expenses that you paid over the period. Simply divide your account value by $1,000 (for example, an $8,600 account value divided by $1,000 = 8.6), then multiply the result by the number in the first section under the heading entitled “Expenses Paid During Period” to estimate the expenses you paid on your account during this period.
Hypothetical Example for Comparison Purposes: The second section of the table below provides information about hypothetical account values and hypothetical expenses based on the actual Fund expense ratio and an assumed rate of return of 5% per year (before expenses), which is not the actual Fund return. The hypothetical account values and expenses may not be used to estimate the actual ending account balance or expenses you paid for the period. You may use this information to compare the ongoing costs of investing in your Fund and other funds. To do so, compare this 5% hypothetical example with the 5% hypothetical examples that appear in the shareholder reports of the other funds.
Please note that the expenses shown in the table are meant to highlight your ongoing costs only and do not reflect any transactional costs, such as sales charges (loads) or redemption fees (if applicable). Therefore, the second section of the table is useful in comparing ongoing costs only, and will not help you determine the relative total costs of owning different funds. In addition, if these transactional costs were included, your costs would be higher.
| | | | | | | | | | | | | | | | |
| | | Beginning
Account Value
(5/1/12) | | | Ending
Account Value
(10/31/12) | | | Expenses Paid
During Period*
(5/1/12 – 10/31/12) | | | Annualized
Expense
Ratio | |
| | | | |
| | | | | | | | | | | | | | | | |
Actual | | | | | | | | | | | | | |
Class A | | $ | 1,000.00 | | | $ | 1,035.50 | | | $ | 6.09 | | | | 1.19 | % |
Class B | | $ | 1,000.00 | | | $ | 1,031.70 | | | $ | 9.91 | | | | 1.94 | % |
Class C | | $ | 1,000.00 | | | $ | 1,031.70 | | | $ | 9.91 | | | | 1.94 | % |
Class I | | $ | 1,000.00 | | | $ | 1,036.80 | | | $ | 4.81 | | | | 0.94 | % |
| | | | | | | | | | | | | | | | | |
| | | | |
| | | | | | | | | | | | | | | | |
Hypothetical | | | | | | | | | | | | | |
(5% return per year before expenses) | | | | | | | | | | | | | |
Class A | | $ | 1,000.00 | | | $ | 1,019.20 | | | $ | 6.04 | | | | 1.19 | % |
Class B | | $ | 1,000.00 | | | $ | 1,015.40 | | | $ | 9.83 | | | | 1.94 | % |
Class C | | $ | 1,000.00 | | | $ | 1,015.40 | | | $ | 9.83 | | | | 1.94 | % |
Class I | | $ | 1,000.00 | | | $ | 1,020.40 | | | $ | 4.77 | | | | 0.94 | % |
| * | Expenses are equal to the Fund’s annualized expense ratio for the indicated Class, multiplied by the average account value over the period, multiplied by 184/366 (to reflect the one-half year period). The Example assumes that the $1,000 was invested at the net asset value per share determined at the close of business on April 30, 2012. |
Eaton Vance
Tax-Managed Global Dividend Income Fund
October 31, 2012
Portfolio of Investments
| | | | | | | | |
| Common Stocks — 75.2% | | | | | | | | |
| | |
| | | | | | | | |
| Security | | Shares | | | Value | |
| | | | | | | | |
|
Aerospace & Defense — 1.4% | |
United Technologies Corp. | | | 175,000 | | | $ | 13,678,000 | |
| | | | | | | | | |
| | | | | | $ | 13,678,000 | |
| | | | | | | | | |
|
Beverages — 2.4% | |
Anheuser-Busch InBev NV | | | 200,000 | | | $ | 16,726,214 | |
Heineken NV | | | 100,000 | | | | 6,171,275 | |
| | | | | | | | | |
| | | | | | $ | 22,897,489 | |
| | | | | | | | | |
|
Capital Markets — 0.6% | |
Credit Suisse Group AG(1) | | | 260,000 | | | $ | 6,046,391 | |
| | | | | | | | | |
| | | | | | $ | 6,046,391 | |
| | | | | | | | | |
|
Chemicals — 3.1% | |
Linde AG | | | 45,000 | | | $ | 7,572,713 | |
LyondellBasell Industries NV, Class A | | | 200,000 | | | | 10,678,000 | |
PPG Industries, Inc. | | | 99,000 | | | | 11,590,920 | |
| | | | | | | | | |
| | | | | | $ | 29,841,633 | |
| | | | | | | | | |
|
Commercial Banks — 7.1% | |
BNP Paribas | | | 155,000 | | | $ | 7,818,969 | |
Commonwealth Bank of Australia | | | 200,000 | | | | 11,977,101 | |
PNC Financial Services Group, Inc. | | | 265,000 | | | | 15,420,350 | |
U.S. Bancorp | | | 588,421 | | | | 19,541,461 | |
Wells Fargo & Co. | | | 420,000 | | | | 14,149,800 | |
| | | | | | | | | |
| | | | | | $ | 68,907,681 | |
| | | | | | | | | |
|
Commercial Services & Supplies — 0.4% | |
Brambles, Ltd. | | | 550,000 | | | $ | 4,141,347 | |
| | | | | | | | | |
| | | | | | $ | 4,141,347 | |
| | | | | | | | | |
|
Communications Equipment — 0.9% | |
QUALCOMM, Inc. | | | 145,000 | | | $ | 8,493,375 | |
| | | | | | | | | |
| | | | | | $ | 8,493,375 | |
| | | | | | | | | |
|
Computers & Peripherals — 1.7% | |
Apple, Inc. | | | 28,000 | | | $ | 16,662,800 | |
| | | | | | | | | |
| | | | | | $ | 16,662,800 | |
| | | | | | | | | |
|
Consumer Finance — 0.8% | |
Discover Financial Services | | | 200,000 | | | $ | 8,200,000 | |
| | | | | | | | | |
| | | | | | $ | 8,200,000 | |
| | | | | | | | | |
| | | | | | | | |
| Security | | Shares | | | Value | |
| | | | | | | | |
|
Diversified Financial Services — 0.9% | |
JPMorgan Chase & Co. | | | 205,000 | | | $ | 8,544,400 | |
| | | | | | | | | |
| | | | | | $ | 8,544,400 | |
| | | | | | | | | |
|
Diversified Telecommunication Services — 2.3% | |
CenturyLink, Inc. | | | 100,000 | | | $ | 3,838,000 | |
Deutsche Telekom AG | | | 440,000 | | | | 5,019,739 | |
France Telecom SA | | | 135,542 | | | | 1,515,021 | |
Telstra Corp., Ltd. | | | 2,725,000 | | | | 11,710,676 | |
| | | | | | | | | |
| | | | | | $ | 22,083,436 | |
| | | | | | | | | |
|
Electric Utilities — 1.9% | |
Edison International | | | 140,000 | | | $ | 6,571,600 | |
Iberdrola SA | | | 1,000,000 | | | | 5,178,958 | |
SSE PLC | | | 300,000 | | | | 7,016,765 | |
| | | | | | | | | |
| | | | | | $ | 18,767,323 | |
| | | | | | | | | |
|
Energy Equipment & Services — 1.5% | |
Schlumberger, Ltd. | | | 125,000 | | | $ | 8,691,250 | |
Seadrill, Ltd. | | | 150,000 | | | | 6,078,038 | |
| | | | | | | | | |
| | | | | | $ | 14,769,288 | |
| | | | | | | | | |
|
Food Products — 2.9% | |
Kraft Foods Group, Inc.(1) | | | 63,333 | | | $ | 2,880,385 | |
Mondelez International, Inc., Class A | | | 390,000 | | | | 10,350,600 | |
Nestle SA | | | 230,000 | | | | 14,602,279 | |
| | | | | | | | | |
| | | | | | $ | 27,833,264 | |
| | | | | | | | | |
|
Health Care Equipment & Supplies — 2.0% | |
Covidien PLC | | | 355,000 | | | $ | 19,507,250 | |
| | | | | | | | | |
| | | | | | $ | 19,507,250 | |
| | | | | | | | | |
|
Health Care Providers & Services — 0.8% | |
HCA Holdings, Inc. | | | 272,802 | | | $ | 7,750,305 | |
| | | | | | | | | |
| | | | | | $ | 7,750,305 | |
| | | | | | | | | |
|
Hotels, Restaurants & Leisure — 1.3% | |
McDonald’s Corp. | | | 140,000 | | | $ | 12,152,000 | |
| | | | | | | | | |
| | | | | | $ | 12,152,000 | |
| | | | | | | | | |
|
Industrial Conglomerates — 1.6% | |
General Electric Co. | | | 335,000 | | | $ | 7,055,100 | |
Orkla ASA | | | 1,000,000 | | | | 7,921,622 | |
| | | | | | | | | |
| | | | | | $ | 14,976,722 | |
| | | | | | | | | |
| | | | |
| | 7 | | See Notes to Financial Statements. |
Eaton Vance
Tax-Managed Global Dividend Income Fund
October 31, 2012
Portfolio of Investments — continued
| | | | | | | | |
| Security | | Shares | | | Value | |
| | | | | | | | |
|
Insurance — 3.3% | |
Aflac, Inc. | | | 100,000 | | | $ | 4,978,000 | |
AXA SA | | | 250,000 | | | | 3,984,675 | |
MetLife, Inc. | | | 140,248 | | | | 4,977,402 | |
Old Mutual PLC | | | 3,675,000 | | | | 10,229,200 | |
Prudential Financial, Inc. | | | 131,000 | | | | 7,473,550 | |
| | | | | | | | | |
| | | | | | $ | 31,642,827 | |
| | | | | | | | | |
|
IT Services — 3.9% | |
Accenture PLC, Class A | | | 300,000 | | | $ | 20,223,000 | |
International Business Machines Corp. | | | 92,000 | | | | 17,896,760 | |
| | | | | | | | | |
| | | | | | $ | 38,119,760 | |
| | | | | | | | | |
|
Machinery — 1.5% | |
Deere & Co. | | | 115,000 | | | $ | 9,825,600 | |
PACCAR, Inc. | | | 100,000 | | | | 4,334,000 | |
| | | | | | | | | |
| | | | | | $ | 14,159,600 | |
| | | | | | | | | |
|
Media — 0.7% | |
Time Warner Cable, Inc. | | | 70,000 | | | $ | 6,937,700 | |
| | | | | | | | | |
| | | | | | $ | 6,937,700 | |
| | | | | | | | | |
|
Metals & Mining — 1.4% | |
Freeport-McMoRan Copper & Gold, Inc. | | | 345,000 | | | $ | 13,413,600 | |
| | | | | | | | | |
| | | | | | $ | 13,413,600 | |
| | | | | | | | | |
|
Multi-Utilities — 2.5% | |
GDF Suez | | | 370,000 | | | $ | 8,492,366 | |
National Grid PLC | | | 1,000,000 | | | | 11,404,546 | |
Sempra Energy | | | 65,000 | | | | 4,533,750 | |
| | | | | | | | | |
| | | | | | $ | 24,430,662 | |
| | | | | | | | | |
|
Oil, Gas & Consumable Fuels — 7.4% | |
Chevron Corp. | | | 40,000 | | | $ | 4,408,400 | |
ENI SpA | | | 660,000 | | | | 15,187,199 | |
Exxon Mobil Corp. | | | 137,000 | | | | 12,490,290 | |
Occidental Petroleum Corp. | | | 100,000 | | | | 7,896,000 | |
Phillips 66 | | | 180,000 | | | | 8,488,800 | |
Royal Dutch Shell PLC, Class A | | | 487,000 | | | | 16,710,289 | |
Total SA | | | 120,000 | | | | 6,044,425 | |
| | | | | | | | | |
| | | | | | $ | 71,225,403 | |
| | | | | | | | | |
| | | | | | | | |
| Security | | Shares | | | Value | |
| | | | | | | | |
|
Pharmaceuticals — 5.4% | |
Abbott Laboratories | | | 147,000 | | | $ | 9,631,440 | |
AstraZeneca PLC | | | 200,000 | | | | 9,274,951 | |
Johnson & Johnson | | | 55,000 | | | | 3,895,100 | |
Sanofi | | | 182,000 | | | | 15,984,588 | |
Takeda Pharmaceutical Co., Ltd.(1) | | | 100,000 | | | | 4,648,082 | |
Teva Pharmaceutical Industries, Ltd. ADR | | | 214,000 | | | | 8,649,880 | |
| | | | | | | | | |
| | | | | | $ | 52,084,041 | |
| | | | | | | | | |
|
Road & Rail — 2.5% | |
Canadian National Railway Co. | | | 130,000 | | | $ | 11,229,400 | |
Union Pacific Corp. | | | 108,000 | | | | 13,287,240 | |
| | | | | | | | | |
| | | | | | $ | 24,516,640 | |
| | | | | | | | | |
|
Software — 3.2% | |
Microsoft Corp. | | | 450,000 | | | $ | 12,840,750 | |
Oracle Corp. | | | 575,000 | | | | 17,853,750 | |
| | | | | | | | | |
| | | | | | $ | 30,694,500 | |
| | | | | | | | | |
|
Specialty Retail — 7.4% | |
American Eagle Outfitters, Inc. | | | 400,000 | | | $ | 8,348,000 | |
DSW, Inc., Class A | | | 49,135 | | | | 3,075,360 | |
Home Depot, Inc. (The) | | | 183,000 | | | | 11,232,540 | |
Industria de Diseno Textil SA | | | 70,000 | | | | 8,938,446 | |
Kingfisher PLC | | | 1,000,000 | | | | 4,682,006 | |
Limited Brands, Inc. | | | 304,372 | | | | 14,576,375 | |
Lowe’s Companies, Inc. | | | 125,000 | | | | 4,047,500 | |
TJX Companies, Inc. (The) | | | 410,000 | | | | 17,068,300 | |
| | | | | | | | | |
| | | | | | $ | 71,968,527 | |
| | | | | | | | | |
|
Textiles, Apparel & Luxury Goods — 0.5% | |
Adidas AG | | | 55,000 | | | $ | 4,688,028 | |
| | | | | | | | | |
| | | | | | $ | 4,688,028 | |
| | | | | | | | | |
|
Tobacco — 1.3% | |
British American Tobacco PLC | | | 114,000 | | | $ | 5,654,350 | |
Japan Tobacco, Inc.(1) | | | 150,000 | | | | 4,147,835 | |
Philip Morris International, Inc. | | | 30,000 | | | | 2,656,800 | |
| | | | | | | | | |
| | | | | | $ | 12,458,985 | |
| | | | | | | | | |
|
Wireless Telecommunication Services — 0.6% | |
Vodafone Group PLC ADR | | | 225,000 | | | $ | 6,124,500 | |
| | | | | | | | | |
| | | | | | $ | 6,124,500 | |
| | | | | | | | | |
| | |
Total Common Stocks
(identified cost $601,280,423) | | | | | | $ | 727,717,477 | |
| | | | | | | | | |
| | | | |
| | 8 | | See Notes to Financial Statements. |
Eaton Vance
Tax-Managed Global Dividend Income Fund
October 31, 2012
Portfolio of Investments — continued
| | | | | | | | |
| Preferred Stocks — 19.2% | |
| | |
| | | | | | | | |
| Security | | Shares | | | Value | |
| | | | | | | | |
|
Capital Markets — 1.1% | |
Affiliated Managers Group, Inc., 6.375% | | | 35,210 | | | $ | 917,661 | |
Bank of New York Mellon Corp. (The), 5.20% | | | 138,300 | | | | 3,479,628 | |
Charles Schwab Corp. (The), 7.00%(2) | | | 900 | | | | 1,049,787 | |
State Street Corp., Series C, 5.25% | | | 209,940 | | | | 5,422,750 | |
| | |
| | | | | | $ | 10,869,826 | |
| | |
|
Commercial Banks — 7.2% | |
CoBank ACB, Series F, 6.25%(2))(3) | | | 34,500 | | | $ | 3,650,531 | |
Countrywide Capital V, 7.00% | | | 58,000 | | | | 1,454,060 | |
Farm Credit Bank of Texas, Series 1, 10.00% | | | 5,123 | | | | 5,881,844 | |
First Niagara Financial Group, Inc., Series B, 8.625%(2) | | | 91,790 | | | | 2,679,350 | |
First Republic Bank, Series B, 6.20% | | | 47,000 | | | | 1,216,125 | |
HSBC Capital Funding LP, 10.176%(2)(3) | | | 3,250 | | | | 4,595,240 | |
JPMorgan Chase & Co., Series 1, 7.90%(2) | | | 6,177 | | | | 7,141,517 | |
KeyCorp, Series A, 7.75% | | | 46,488 | | | | 5,741,268 | |
Landsbanki Islands HF, 7.431%(1)(2)(3)(4)(5) | | | 14,750 | | | | 0 | |
Lloyds Banking Group PLC, 6.267%(2)(3) | | | 1,694 | | | | 1,315,513 | |
Lloyds Banking Group PLC, 6.657%(2)(3) | | | 6,276 | | | | 5,520,286 | |
PNC Financial Services Group, Inc., Series O, 6.75%(2) | | | 835 | | | | 981,097 | |
PNC Financial Services Group, Inc., Series P, 6.125%(2) | | | 174,261 | | | | 4,879,308 | |
Regions Financial Corp., Series A, 6.375% | | | 204,500 | | | | 5,081,825 | |
Royal Bank of Scotland Group PLC, Series Q, 6.75% | | | 14,575 | | | | 328,666 | |
Royal Bank of Scotland Group PLC, Series T, 7.25% | | | 50,150 | | | | 1,191,063 | |
Standard Chartered PLC, 6.409%(2)(3) | | | 24.56 | | | | 2,521,805 | |
Standard Chartered PLC, 7.014%(2)(3) | | | 42.03 | | | | 4,491,371 | |
Texas Capital Bancshares, Inc., 6.50% | | | 99,990 | | | | 2,587,241 | |
U.S. Bancorp, Series F, 6.50%(2) | | | 69,372 | | | | 2,063,817 | |
Wells Fargo & Co., Series L, 7.50% | | | 4,500 | | | | 5,625,000 | |
Wells Fargo & Co., Series N, 5.20% | | | 39,070 | | | | 999,801 | |
| | |
| | | | | | $ | 69,946,728 | |
| | |
|
Consumer Finance — 1.2% | |
Ally Financial, Inc., Series A, 8.50%(2) | | | 157,684 | | | $ | 4,030,797 | |
Capital One Financial Corp., Series B, 6.00% | | | 125,000 | | | | 3,138,750 | |
Discover Financial Services, Series B, 6.50% | | | 158,400 | | | | 4,024,358 | |
| | |
| | | | | | $ | 11,193,905 | |
| | |
|
Diversified Financial Services — 3.3% | |
General Electric Capital Corp., Series A, 7.125% to 6/15/22(6) | | | 3,674,000 | | | $ | 4,220,217 | |
General Electric Capital Corp., Series B, 6.25% to 12/15/22(6) | | | 4,365,000 | | | | 4,778,632 | |
PPTT, 2006-A GS, Class A, 5.925%(2)(3) | | | 70 | | | | 14,183,912 | |
| | | | | | | | |
| Security | | Shares | | | Value | |
| | | | | | | | |
|
Diversified Financial Services (continued) | |
RBS Capital Funding Trust VII, Series G, 6.08% | | | 263,000 | | | $ | 4,918,100 | |
UBS AG, 7.625% | | | 3,515 | | | | 3,849,124 | |
| | |
| | | | | | $ | 31,949,985 | |
| | |
|
Electric Utilities — 2.0% | |
Entergy Louisiana, LLC, 6.95% | | | 53,425 | | | $ | 5,412,620 | |
Southern California Edison Co., Series C, 6.00% | | | 7,757 | | | | 781,033 | |
Southern California Edison Co., Series D, 6.50% | | | 52,870 | | | | 5,709,960 | |
Southern California Edison Co., Series E, 6.25%(2) | | | 2,016 | | | | 2,257,303 | |
Virginia Electric and Power Co., 6.12% | | | 48 | | | | 5,058,740 | |
| | |
| | | | | | $ | 19,219,656 | |
| | |
|
Food Products — 0.1% | |
Ocean Spray Cranberries, Inc., 6.25%(3) | | | 13,250 | | | $ | 1,216,516 | |
| | |
| | | | | | $ | 1,216,516 | |
| | |
|
Insurance — 1.9% | |
American Overseas Group, Ltd., Series A, 7.50%(2) | | | 5,000 | | | $ | 1,900,313 | |
Aspen Insurance Holdings, Ltd., 7.25% | | | 72,965 | | | | 1,955,462 | |
Aspen Insurance Holdings, Ltd., 7.401%(2) | | | 48,300 | | | | 1,283,331 | |
Endurance Specialty Holdings, Ltd., Series B, 7.50% | | | 167,475 | | | | 4,582,116 | |
Montpelier Re Holdings, Ltd., 8.875% | | | 257,184 | | | | 7,098,278 | |
Prudential PLC, 6.50% | | | 1,830 | | | | 1,842,556 | |
| | |
| | | | | | $ | 18,662,056 | |
| | |
|
Machinery — 0.5% | |
Stanley Black & Decker, Inc., 5.75% | | | 191,264 | | | $ | 5,056,542 | |
| | |
| | | | | | $ | 5,056,542 | |
| | |
|
Multi-Utilities — 0.3% | |
DTE Energy Co., Series C, 5.25% | | | 103,300 | | | $ | 2,632,084 | |
| | |
| | | | | | $ | 2,632,084 | |
| | |
|
Real Estate Investment Trusts (REITs) — 1.2% | |
CapLease, Inc., Series A, 8.125% | | | 225,000 | | | $ | 5,670,000 | |
Cedar Shopping Centers, Inc., Series A, 8.875% | | | 27,972 | | | | 721,118 | |
Chesapeake Lodging Trust, Series A, 7.75% | | | 18,179 | | | | 485,198 | |
DDR Corp., Series H, 7.375% | | | 68,500 | | | | 1,729,625 | |
Sunstone Hotel Investors, Inc., Series D, 8.00% | | | 92,700 | | | | 2,427,581 | |
| | |
| | | | | | $ | 11,033,522 | |
| | |
| | | | |
| | 9 | | See Notes to Financial Statements. |
Eaton Vance
Tax-Managed Global Dividend Income Fund
October 31, 2012
Portfolio of Investments — continued
| | | | | | | | |
| Security | | Shares | | | Value | |
| | | | | | | | |
|
Telecommunications — 0.2% | |
Centaur Funding Corp., 9.08%(3) | | | 1,632 | | | $ | 2,074,170 | |
| | |
| | | | | | $ | 2,074,170 | |
| | |
|
Thrifts & Mortgage Finance — 0.2% | |
Elmira Savings Bank FSB (The), 8.998%(2) | | | 1,880 | | | $ | 1,673,200 | |
| | |
| | | | | | $ | 1,673,200 | |
| | |
| |
Total Preferred Stocks
(identified cost $190,367,548) | | | $ | 185,528,190 | |
| | |
|
| Corporate Bonds & Notes — 4.7% | |
| | |
| | | | | | | | |
| Security | | Principal
Amount
(000’s omitted) | | | Value | |
|
Commercial Banks — 0.9% | |
Citigroup Capital III, 7.625%, 12/1/36 | | $ | 1,935 | | | $ | 2,133,337 | |
Groupe BPCE, 12.50% to 9/30/19, 8/29/49(3)(6) | | | 5,320 | | | | 6,095,667 | |
Regions Bank, 6.45%, 6/26/37 | | | 200 | | | | 207,000 | |
| | |
| | | | | | $ | 8,436,004 | |
| | |
|
Diversified Financial Services — 0.3% | |
Textron Financial Corp., 6.00% to 2/15/17, 2/15/67(3)(6) | | $ | 3,000 | | | $ | 2,625,000 | |
| | |
| | | | | | $ | 2,625,000 | |
| | |
|
Electric Utilities — 0.5% | |
PPL Capital Funding, Inc., Series A,
6.70% to 3/30/17, 3/30/67(6) | | $ | 5,000 | | | $ | 5,273,760 | |
| | |
| | | | | | $ | 5,273,760 | |
| | |
|
Industrial Conglomerates — 0.3% | |
Hutchison Whampoa International 12, Ltd.,
6.00% to 5/7/17, 5/29/49(3)(6) | | $ | 2,700 | | | $ | 2,821,500 | |
| | |
| | | | | | $ | 2,821,500 | |
| | |
|
Insurance — 1.9% | |
MetLife, Inc., 10.75% to 8/1/34, 8/1/39, 8/1/69(6)(7) | | $ | 3,865 | | | $ | 5,845,812 | |
QBE Capital Funding II, LP, 6.797% to 6/1/17, 6/29/49(3)(6) | | | 2,290 | | | | 2,293,394 | |
QBE Capital Funding III, Ltd., 7.25% to 5/24/21, 5/24/41(3)(6) | | | 1,157 | | | | 1,210,990 | |
Swiss Re Capital I, LP, 6.854% to 5/25/16, 5/29/49(3)(6) | | | 2,014 | | | | 2,102,115 | |
XL Capital, Ltd., Series E, 6.50% to 4/15/17, 12/29/49(6) | | | 7,602 | | | | 7,088,865 | |
| | |
| | | | | | $ | 18,541,176 | |
| | | | | | | | | |
| | | | | | | | |
| Security | | Principal
Amount
(000’s omitted) | | | Value | |
| | | | | | | | |
|
Pipelines — 0.8% | |
Enterprise Products Operating, LLC,
7.00% to 6/1/17, 6/1/67(6) | | $ | 2,975 | | | $ | 3,245,481 | |
Southern Union Co., 3.462%, 11/1/66(2) | | | 5,800 | | | | 4,806,750 | |
| | |
| | | | | | $ | 8,052,231 | |
| | |
| |
Total Corporate Bonds & Notes
(identified cost $41,372,236) | | | $ | 45,749,671 | |
| | |
|
| Short-Term Investments — 0.4% | |
| | |
| | | | | | | | |
| Description | | Interest
(000’s omitted) | | | Value | |
Eaton Vance Cash Reserves Fund, LLC, 0.12%(8) | | $ | 3,356 | | | $ | 3,356,047 | |
| | |
| |
Total Short-Term Investments
(identified cost $3,356,047) | | | $ | 3,356,047 | |
| | |
| |
Total Investments — 99.5%
(identified cost $836,376,254) | | | $ | 962,351,385 | |
| | |
| |
Other Assets, Less Liabilities — 0.5% | | | $ | 5,299,817 | |
| | |
| |
Net Assets — 100.0% | | | $ | 967,651,202 | |
| | |
The percentage shown for each investment category in the Portfolio of Investments is based on net assets.
| | | | |
| ADR | | – | | American Depositary Receipt |
| PPTT | | – | | Preferred Pass-Through Trust |
| | (1) | Non-income producing security. |
| | (2) | Variable rate security. The stated interest rate represents the rate in effect at October 31, 2012. |
| | (3) | Security exempt from registration pursuant to Rule 144A under the Securities Act of 1933. These securities may be sold in certain transactions (normally to qualified institutional buyers) and remain exempt from registration. At October 31, 2012, the aggregate value of these securities is $56,718,010 or 5.9% of the Fund’s net assets. |
| | (5) | For fair value measurement disclosure purposes, security is categorized as Level 3 (see Note 12). |
| | (6) | Security converts to floating rate after the indicated fixed-rate coupon period. |
| | (7) | The maturity dates shown are the scheduled maturity date and final maturity date, respectively. The scheduled maturity date is earlier than the final maturity date due to the possibility of earlier repayment. |
| | (8) | Affiliated investment company available to Eaton Vance portfolios and funds which invests in high quality, U.S. dollar denominated money market instruments. The rate shown is the annualized seven-day yield as of October 31, 2012. |
| | | | |
| | 10 | | See Notes to Financial Statements. |
Eaton Vance
Tax-Managed Global Dividend Income Fund
October 31, 2012
Portfolio of Investments — continued
| | | | | | | | |
| Country Concentration of Portfolio | |
| | |
| | | | | | | | |
| Country | | Percentage of
Total Investments | | | Value | |
United States | | | 62.2 | % | | $ | 598,539,038 | |
United Kingdom | | | 7.5 | | | | 72,616,336 | |
France | | | 5.2 | | | | 49,935,711 | |
Ireland | | | 4.1 | | | | 39,730,250 | |
Australia | | | 3.0 | | | | 29,040,114 | |
Switzerland | | | 2.4 | | | | 22,750,785 | |
Germany | | | 1.8 | | | | 17,280,480 | |
Netherlands | | | 1.8 | | | | 16,849,275 | |
Belgium | | | 1.7 | | | | 16,726,214 | |
Italy | | | 1.6 | | | | 15,187,199 | |
Bermuda | | | 1.5 | | | | 14,919,187 | |
Spain | | | 1.5 | | | | 14,117,404 | |
Norway | | | 1.5 | | | | 13,999,660 | |
Cayman Islands | | | 1.2 | | | | 11,984,535 | |
Canada | | | 1.2 | | | | 11,229,400 | |
Japan | | | 0.9 | | | | 8,795,917 | |
Israel | | | 0.9 | | | | 8,649,880 | |
Iceland | | | 0.0 | | | | 0 | |
| | |
Total Investments | | | 100.0 | % | | $ | 962,351,385 | |
| | | | | | | | | |
| | | | |
| | 11 | | See Notes to Financial Statements. |
Eaton Vance
Tax-Managed Global Dividend Income Fund
October 31, 2012
Statement of Assets and Liabilities
| | | | |
| Assets | | October 31, 2012 | |
Unaffiliated investments, at value (identified cost, $833,020,207) | | $ | 958,995,338 | |
Affiliated investment, at value (identified cost, $3,356,047) | | | 3,356,047 | |
Foreign currency, at value (identified cost, $853,203) | | | 862,476 | |
Dividends and interest receivable | | | 2,875,711 | |
Interest receivable from affiliated investment | | | 446 | |
Receivable for investments sold | | | 5,715,457 | |
Receivable for Fund shares sold | | | 397,698 | |
Receivable for open forward foreign currency exchange contracts | | | 1,767 | |
Tax reclaims receivable | | | 4,054,017 | |
Total assets | | $ | 976,258,957 | |
|
| Liabilities | |
Payable for investments purchased | | $ | 5,112,500 | |
Payable for open forward foreign currency exchange contracts | | | 2,294 | |
Payable for Fund shares redeemed | | | 2,120,173 | |
Payable to affiliates: | | | | |
Investment adviser fee | | | 532,987 | |
Distribution and service fees | | | 442,125 | |
Administration fee | | | 125,377 | |
Trustees’ fees | | | 3,222 | |
Accrued expenses | | | 269,077 | |
Total liabilities | | $ | 8,607,755 | |
Net Assets | | $ | 967,651,202 | |
|
| Sources of Net Assets | |
Paid-in capital | | $ | 1,417,760,451 | |
Accumulated net realized loss | | | (578,066,019 | ) |
Accumulated undistributed net investment income | | | 1,800,290 | |
Net unrealized appreciation | | | 126,156,480 | |
Total | | $ | 967,651,202 | |
| |
| Class A Shares | | | | |
Net Assets | | $ | 490,142,379 | |
Shares Outstanding | | | 50,094,687 | |
Net Asset Value and Redemption Price Per Share | | | | |
(net assets ÷ shares of beneficial interest outstanding) | | $ | 9.78 | |
Maximum Offering Price Per Share | | | | |
(100 ÷ 94.25 of net asset value per share) | | $ | 10.38 | |
|
| Class B Shares | |
Net Assets | | $ | 51,491,918 | |
Shares Outstanding | | | 5,275,061 | |
Net Asset Value and Offering Price Per Share* | | | | |
(net assets ÷ shares of beneficial interest outstanding) | | $ | 9.76 | |
|
| Class C Shares | |
Net Assets | | $ | 338,460,659 | |
Shares Outstanding | | | 34,668,041 | |
Net Asset Value and Offering Price Per Share* | | | | |
(net assets ÷ shares of beneficial interest outstanding) | | $ | 9.76 | |
|
| Class I Shares | |
Net Assets | | $ | 87,556,246 | |
Shares Outstanding | | | 8,943,282 | |
Net Asset Value, Offering Price and Redemption Price Per Share | | | | |
(net assets ÷ shares of beneficial interest outstanding) | | $ | 9.79 | |
On sales of $50,000 or more, the offering price of Class A shares is reduced.
| * | Redemption price per share is equal to the net asset value less any applicable contingent deferred sales charge. |
| | | | |
| | 12 | | See Notes to Financial Statements. |
Eaton Vance
Tax-Managed Global Dividend Income Fund
October 31, 2012
Statement of Operations
| | | | |
| Investment Income | | Year Ended October 31, 2012 | |
Dividends (net of foreign taxes, $3,205,304) | | $ | 57,578,342 | |
Interest | | | 3,858,398 | |
Interest allocated from affiliated investment | | | 4,267 | |
Expenses allocated from affiliated investment | | | (583 | ) |
Total investment income | | $ | 61,440,424 | |
| |
| Expenses | | | | |
Investment adviser fee | | $ | 6,406,228 | |
Administration fee | | | 1,508,650 | |
Distribution and service fees | | | | |
Class A | | | 1,268,315 | |
Class B | | | 584,872 | |
Class C | | | 3,504,975 | |
Trustees’ fees and expenses | | | 40,070 | |
Custodian fee | | | 351,857 | |
Transfer and dividend disbursing agent fees | | | 723,144 | |
Legal and accounting services | | | 91,776 | |
Printing and postage | | | 129,765 | |
Registration fees | | | 62,307 | |
Miscellaneous | | | 58,086 | |
Total expenses | | $ | 14,730,045 | |
Deduct — | | | | |
Reduction of custodian fee | | $ | 89 | |
Total expense reductions | | $ | 89 | |
| |
Net expenses | | $ | 14,729,956 | |
| |
Net investment income | | $ | 46,710,468 | |
| |
| Realized and Unrealized Gain (Loss) | | | | |
Net realized gain (loss) — | | | | |
Investment transactions | | $ | 32,130,961 | |
Investment transactions allocated from affiliated investment | | | 118 | |
Foreign currency and forward foreign currency exchange contract transactions | | | (3,215,932 | ) |
Net realized gain | | $ | 28,915,147 | |
Change in unrealized appreciation (depreciation) — | | | | |
Investments | | $ | 22,714,103 | |
Foreign currency and forward foreign currency exchange contracts | | | (189,983 | ) |
Net change in unrealized appreciation (depreciation) | | $ | 22,524,120 | |
| |
Net realized and unrealized gain | | $ | 51,439,267 | |
| |
Net increase in net assets from operations | | $ | 98,149,735 | |
| | | | |
| | 13 | | See Notes to Financial Statements. |
Eaton Vance
Tax-Managed Global Dividend Income Fund
October 31, 2012
Statements of Changes in Net Assets
| | | | | | | | |
| | | Year Ended October 31, | |
| Increase (Decrease) in Net Assets | | 2012 | | | 2011 | |
From operations — | | | | | | | | |
Net investment income | | $ | 46,710,468 | | | $ | 62,514,507 | |
Net realized gain from investment, foreign currency and forward foreign currency exchange contract transactions | | | 28,915,147 | | | | 60,349,403 | |
Net change in unrealized appreciation (depreciation) from investments, foreign currency and forward foreign currency exchange contracts | | | 22,524,120 | | | | (103,565,757 | ) |
Net increase in net assets from operations | | $ | 98,149,735 | | | $ | 19,298,153 | |
Distributions to shareholders — | | | | | | | | |
From net investment income | | | | | | | | |
Class A | | $ | (25,677,467 | ) | | $ | (32,120,549 | ) |
Class B | | | (2,543,907 | ) | | | (3,672,459 | ) |
Class C | | | (15,130,160 | ) | | | (19,248,504 | ) |
Class I | | | (4,758,826 | ) | | | (4,114,452 | ) |
Total distributions to shareholders | | $ | (48,110,360 | ) | | $ | (59,155,964 | ) |
Transactions in shares of beneficial interest — | | | | | | | | |
Proceeds from sale of shares | | | | | | | | |
Class A | | $ | 73,670,694 | | | $ | 91,872,223 | |
Class B | | | 1,411,591 | | | | 5,809,065 | |
Class C | | | 25,910,034 | | | | 40,593,389 | |
Class I | | | 32,533,400 | | | | 54,412,844 | |
Net asset value of shares issued to shareholders in payment of distributions declared | | | | | | | | |
Class A | | | 21,720,856 | | | | 24,049,944 | |
Class B | | | 1,853,394 | | | | 2,380,154 | |
Class C | | | 11,128,544 | | | | 11,991,843 | |
Class I | | | 3,663,305 | | | | 2,877,443 | |
Cost of shares redeemed | | | | | | | | |
Class A | | | (186,013,191 | ) | | | (204,732,298 | ) |
Class B | | | (13,469,061 | ) | | | (17,438,200 | ) |
Class C | | | (87,315,837 | ) | | | (110,113,873 | ) |
Class I | | | (39,404,004 | ) | | | (24,060,417 | ) |
Net asset value of shares exchanged | | | | | | | | |
Class A | | | 8,932,922 | | | | 5,575,433 | |
Class B | | | (8,932,922 | ) | | | (5,575,433 | ) |
Net decrease in net assets from Fund share transactions | | $ | (154,310,275 | ) | | $ | (122,357,883 | ) |
| | |
Net decrease in net assets | | $ | (104,270,900 | ) | | $ | (162,215,694 | ) |
| | |
| Net Assets | | | | | | | | |
At beginning of year | | $ | 1,071,922,102 | | | $ | 1,234,137,796 | |
At end of year | | $ | 967,651,202 | | | $ | 1,071,922,102 | |
| | |
Accumulated undistributed net investment income included in net assets | | | | | | | | |
At end of year | | $ | 1,800,290 | | | $ | 2,981,381 | |
| | | | |
| | 14 | | See Notes to Financial Statements. |
Eaton Vance
Tax-Managed Global Dividend Income Fund
October 31, 2012
Financial Highlights
| | | | | | | | | | | | | | | | | | | | |
| | | Class A | |
| | | Year Ended October 31, | |
| | | 2012 | | | 2011 | | | 2010 | | | 2009 | | | 2008 | |
Net asset value — Beginning of year | | $ | 9.290 | | | $ | 9.660 | | | $ | 9.050 | | | $ | 8.830 | | | $ | 14.520 | |
| | | | | |
| Income (Loss) From Operations | | | | | | | | | | | | | | | | | | | | |
Net investment income(1) | | $ | 0.465 | (2) | | $ | 0.550 | | | $ | 0.494 | | | $ | 0.523 | | | $ | 0.862 | |
Net realized and unrealized gain (loss) | | | 0.503 | | | | (0.397 | ) | | | 0.644 | | | | 0.311 | | | | (5.751 | ) |
| | | | | |
Total income (loss) from operations | | $ | 0.968 | | | $ | 0.153 | | | $ | 1.138 | | | $ | 0.834 | | | $ | (4.889 | ) |
| | | | | |
| Less Distributions | | | | | | | | | | | | | | | | | | | | |
From net investment income | | $ | (0.478 | ) | | $ | (0.523 | ) | | $ | (0.528 | ) | | $ | (0.614 | ) | | $ | (0.801 | ) |
| | | | | |
Total distributions | | $ | (0.478 | ) | | $ | (0.523 | ) | | $ | (0.528 | ) | | $ | (0.614 | ) | | $ | (0.801 | ) |
| | | | | |
Net asset value — End of year | | $ | 9.780 | | | $ | 9.290 | | | $ | 9.660 | | | $ | 9.050 | | | $ | 8.830 | |
| | | | | |
Total Return(3) | | | 10.74 | % | | | 1.52 | % | | | 12.99 | % | | | 10.49 | % | | | (35.08 | )% |
| | | | | |
| Ratios/Supplemental Data | | | | | | | | | | | | | | | | | | | | |
Net assets, end of year (000’s omitted) | | $ | 490,142 | | | $ | 546,679 | | | $ | 648,656 | | | $ | 670,392 | | | $ | 673,782 | |
Ratios (as a percentage of average daily net assets): | | | | | | | | | | | | | | | | | | | | |
Expenses(4) | | | 1.18 | % | | | 1.17 | % | | | 1.19 | % | | | 1.21 | % | | | 1.15 | % |
Net investment income | | | 4.92 | %(2) | | | 5.65 | % | | | 5.34 | % | | | 6.38 | % | | | 7.00 | % |
Portfolio Turnover | | | 82 | % | | | 101 | % | | | 127 | % | | | 101 | % | | | 181 | % |
| (1) | Computed using average shares outstanding. |
| (2) | Net investment income per share reflects special dividends which amounted to $0.059 per share. Excluding special dividends, the ratio of net investment income to average daily net assets would have been 4.30%. |
| (3) | Returns are historical and are calculated by determining the percentage change in net asset value with all distributions reinvested and do not reflect the effect of sales charges. |
| (4) | Excludes the effect of custody fee credits, if any, of less than 0.005%. |
| | | | |
| | 15 | | See Notes to Financial Statements. |
Eaton Vance
Tax-Managed Global Dividend Income Fund
October 31, 2012
Financial Highlights — continued
| | | | | | | | | | | | | | | | | | | | |
| | | Class B | |
| | | Year Ended October 31, | |
| | | 2012 | | | 2011 | | | 2010 | | | 2009 | | | 2008 | |
Net asset value — Beginning of year | | $ | 9.270 | | | $ | 9.640 | | | $ | 9.030 | | | $ | 8.820 | | | $ | 14.490 | |
| | | | | |
| Income (Loss) From Operations | | | | | | | | | | | | | | | | | | | | |
Net investment income(1) | | $ | 0.393 | (2) | | $ | 0.479 | | | $ | 0.424 | | | $ | 0.463 | | | $ | 0.772 | |
Net realized and unrealized gain (loss) | | | 0.503 | | | | (0.399 | ) | | | 0.645 | | | | 0.300 | | | | (5.736 | ) |
| | | | | |
Total income (loss) from operations | | $ | 0.896 | | | $ | 0.080 | | | $ | 1.069 | | | $ | 0.763 | | | $ | (4.964 | ) |
| | | | | |
| Less Distributions | | | | | | | | | | | | | | | | | | | | |
From net investment income | | $ | (0.406 | ) | | $ | (0.450 | ) | | $ | (0.459 | ) | | $ | (0.553 | ) | | $ | (0.706 | ) |
| | | | | |
Total distributions | | $ | (0.406 | ) | | $ | (0.450 | ) | | $ | (0.459 | ) | | $ | (0.553 | ) | | $ | (0.706 | ) |
| | | | | |
Net asset value — End of year | | $ | 9.760 | | | $ | 9.270 | | | $ | 9.640 | | | $ | 9.030 | | | $ | 8.820 | |
| | | | | |
Total Return(3) | | | 9.93 | % | | | 0.75 | % | | | 12.18 | % | | | 9.57 | % | | | (35.51 | )% |
| | | | | |
| Ratios/Supplemental Data | | | | | | | | | | | | | | | | | | | | |
Net assets, end of year (000’s omitted) | | $ | 51,492 | | | $ | 67,749 | | | $ | 85,354 | | | $ | 89,245 | | | $ | 97,996 | |
Ratios (as a percentage of average daily net assets): | | | | | | | | | | | | | | | | | | | | |
Expenses(4) | | | 1.93 | % | | | 1.92 | % | | | 1.94 | % | | | 1.96 | % | | | 1.90 | % |
Net investment income | | | 4.18 | %(2) | | | 4.93 | % | | | 4.59 | % | | | 5.67 | % | | | 6.26 | % |
Portfolio Turnover | | | 82 | % | | | 101 | % | | | 127 | % | | | 101 | % | | | 181 | % |
| (1) | Computed using average shares outstanding. |
| (2) | Net investment income per share reflects special dividends which amounted to $0.059 per share. Excluding special dividends, the ratio of net investment income to average daily net assets would have been 3.55%. |
| (3) | Returns are historical and are calculated by determining the percentage change in net asset value with all distributions reinvested and do not reflect the effect of sales charges. |
| (4) | Excludes the effect of custody fee credits, if any, of less than 0.005%. |
| | | | |
| | 16 | | See Notes to Financial Statements. |
Eaton Vance
Tax-Managed Global Dividend Income Fund
October 31, 2012
Financial Highlights — continued
| | | | | | | | | | | | | | | | | | | | |
| | | Class C | |
| | | Year Ended October 31, | |
| | | 2012 | | | 2011 | | | 2010 | | | 2009 | | | 2008 | |
Net asset value — Beginning of year | | $ | 9.270 | | | $ | 9.640 | | | $ | 9.030 | | | $ | 8.820 | | | $ | 14.500 | |
| | | | | |
| Income (Loss) From Operations | | | | | | | | | | | | | | | | | | | | |
Net investment income(1) | | $ | 0.394 | (2) | | $ | 0.477 | | | $ | 0.423 | | | $ | 0.460 | | | $ | 0.769 | |
Net realized and unrealized gain (loss) | | | 0.503 | | | | (0.397 | ) | | | 0.646 | | | | 0.303 | | | | (5.742 | ) |
| | | | | |
Total income (loss) from operations | | $ | 0.897 | | | $ | 0.080 | | | $ | 1.069 | | | $ | 0.763 | | | $ | (4.973 | ) |
| | | | | |
| Less Distributions | | | | | | | | | | | | | | | | | | | | |
From net investment income | | $ | (0.407 | ) | | $ | (0.450 | ) | | $ | (0.459 | ) | | $ | (0.553 | ) | | $ | (0.707 | ) |
| | | | | |
Total distributions | | $ | (0.407 | ) | | $ | (0.450 | ) | | $ | (0.459 | ) | | $ | (0.553 | ) | | $ | (0.707 | ) |
| | | | | |
Net asset value — End of year | | $ | 9.760 | | | $ | 9.270 | | | $ | 9.640 | | | $ | 9.030 | | | $ | 8.820 | |
| | | | | |
Total Return(3) | | | 9.93 | % | | | 0.76 | % | | | 12.18 | % | | | 9.57 | % | | | (35.51 | )% |
| | | | | |
| Ratios/Supplemental Data | | | | | | | | | | | | | | | | | | | | |
Net assets, end of year (000’s omitted) | | $ | 338,461 | | | $ | 371,066 | | | $ | 442,969 | | | $ | 451,078 | | | $ | 458,907 | |
Ratios (as a percentage of average daily net assets): | | | | | | | | | | | | | | | | | | | | |
Expenses(4) | | | 1.93 | % | | | 1.92 | % | | | 1.94 | % | | | 1.96 | % | | | 1.90 | % |
Net investment income | | | 4.18 | %(2) | | | 4.92 | % | | | 4.58 | % | | | 5.63 | % | | | 6.25 | % |
Portfolio Turnover | | | 82 | % | | | 101 | % | | | 127 | % | | | 101 | % | | | 181 | % |
| (1) | Computed using average shares outstanding. |
| (2) | Net investment income per share reflects special dividends which amounted to $0.059 per share. Excluding special dividends, the ratio of net investment income to average daily net assets would have been 3.55%. |
| (3) | Returns are historical and are calculated by determining the percentage change in net asset value with all distributions reinvested and do not reflect the effect of sales charges. |
| (4) | Excludes the effect of custody fee credits, if any, of less than 0.005%. |
| | | | |
| | 17 | | See Notes to Financial Statements. |
Eaton Vance
Tax-Managed Global Dividend Income Fund
October 31, 2012
Financial Highlights — continued
| | | | | | | | | | | | | | | | | | | | |
| | | Class I | |
| | | Year Ended October 31, | |
| | | 2012 | | | 2011 | | | 2010 | | | 2009 | | | 2008 | |
Net asset value — Beginning of year | | $ | 9.300 | | | $ | 9.660 | | | $ | 9.050 | | | $ | 8.840 | | | $ | 14.530 | |
| | | | | |
| Income (Loss) From Operations | | | | | | | | | | | | | | | | | | | | |
Net investment income(1) | | $ | 0.493 | (2) | | $ | 0.573 | | | $ | 0.518 | | | $ | 0.479 | | | $ | 0.681 | |
Net realized and unrealized gain (loss) | | | 0.498 | | | | (0.385 | ) | | | 0.643 | | | | 0.365 | | | | (5.538 | ) |
| | | | | |
Total income (loss) from operations | | $ | 0.991 | | | $ | 0.188 | | | $ | 1.161 | | | $ | 0.844 | | | $ | (4.857 | ) |
| | | | | |
| Less Distributions | | | | | | | | | | | | | | | | | | | | |
From net investment income | | $ | (0.501 | ) | | $ | (0.548 | ) | | $ | (0.551 | ) | | $ | (0.634 | ) | | $ | (0.833 | ) |
| | | | | |
Total distributions | | $ | (0.501 | ) | | $ | (0.548 | ) | | $ | (0.551 | ) | | $ | (0.634 | ) | | $ | (0.833 | ) |
| | | | | |
Net asset value — End of year | | $ | 9.790 | | | $ | 9.300 | | | $ | 9.660 | | | $ | 9.050 | | | $ | 8.840 | |
| | | | | |
Total Return(3) | | | 11.01 | % | | | 1.88 | % | | | 13.27 | % | | | 10.63 | % | | | (34.84 | )% |
| | | | | |
| Ratios/Supplemental Data | | | | | | | | | | | | | | | | | | | | |
Net assets, end of year (000’s omitted) | | $ | 87,556 | | | $ | 86,428 | | | $ | 57,160 | | | $ | 20,639 | | | $ | 1,773 | |
Ratios (as a percentage of average daily net assets): | | | | | | | | | | | | | | | | | | | | |
Expenses(4) | | | 0.93 | % | | | 0.93 | % | | | 0.94 | % | | | 0.94 | % | | | 0.90 | % |
Net investment income | | | 5.21 | %(2) | | | 5.91 | % | | | 5.63 | % | | | 5.71 | % | | | 5.95 | % |
Portfolio Turnover | | | 82 | % | | | 101 | % | | | 127 | % | | | 101 | % | | | 181 | % |
| (1) | Computed using average shares outstanding. |
| (2) | Net investment income per share reflects special dividends which amounted to $0.059 per share. Excluding special dividends, the ratio of net investment income to average daily net assets would have been 4.58%. |
| (3) | Returns are historical and are calculated by determining the percentage change in net asset value with all distributions reinvested. |
| (4) | Excludes the effect of custody fee credits, if any, of less than 0.005%. |
| | | | |
| | 18 | | See Notes to Financial Statements. |
Eaton Vance
Tax-Managed Global Dividend Income Fund
October 31, 2012
Notes to Financial Statements
1 Significant Accounting Policies
Eaton Vance Tax-Managed Global Dividend Income Fund (the Fund) is a diversified series of Eaton Vance Mutual Funds Trust (the Trust). The Trust is a Massachusetts business trust registered under the Investment Company Act of 1940, as amended (the 1940 Act), as an open-end management investment company. The Fund’s investment objective is to achieve after-tax total return by investing primarily in a diversified portfolio of common and preferred stocks. The Fund offers four classes of shares. Class A shares are generally sold subject to a sales charge imposed at time of purchase. Class B and Class C shares are sold at net asset value and are generally subject to a contingent deferred sales charge (see Note 5). Class I shares are sold at net asset value and are not subject to a sales charge. Class B shares automatically convert to Class A shares eight years after their purchase as described in the Fund’s prospectus. Beginning on January 1, 2012, Class B shares are only available for purchase upon exchange from another Eaton Vance fund or through reinvestment of distributions. Each class represents a pro-rata interest in the Fund, but votes separately on class-specific matters and (as noted below) is subject to different expenses. Realized and unrealized gains and losses and net investment income and losses, other than class-specific expenses, are allocated daily to each class of shares based on the relative net assets of each class to the total net assets of the Fund. Each class of shares differs in its distribution plan and certain other class-specific expenses.
The following is a summary of significant accounting policies of the Fund. The policies are in conformity with accounting principles generally accepted in the United States of America.
A Investment Valuation — Equity securities (including common shares of closed-end investment companies) listed on a U.S. securities exchange generally are valued at the last sale or closing price on the day of valuation or, if no sales took place on such date, at the mean between the closing bid and asked prices therefore on the exchange where such securities are principally traded. Equity securities listed on the NASDAQ Global or Global Select Market generally are valued at the NASDAQ official closing price. Unlisted or listed securities for which closing sales prices or closing quotations are not available are valued at the mean between the latest available bid and asked prices or, in the case of preferred equity securities that are not listed or traded in the over-the-counter market, by a third party pricing service that will use various techniques that consider factors including, but not limited to, prices or yields of securities with similar characteristics, benchmark yields, broker/dealer quotes, quotes of underlying common stock, issuer spreads, as well as industry and economic events. The value of preferred equity securities that are valued by a pricing service on a bond basis will be adjusted by an income factor, to be determined by the investment adviser, to reflect the next anticipated regular dividend. Debt obligations (including short-term obligations with a remaining maturity of more than sixty days) are generally valued on the basis of valuations provided by third party pricing services, as derived from such services’ pricing models. Inputs to the models may include, but are not limited to, reported trades, executable bid and asked prices, broker/dealer quotations, prices or yields of securities with similar characteristics, benchmark curves or information pertaining to the issuer, as well as industry and economic events. The pricing services may use a matrix approach, which considers information regarding securities with similar characteristics to determine the valuation for a security. Short-term obligations purchased with a remaining maturity of sixty days or less are generally valued at amortized cost, which approximates market value. Foreign securities and currencies are valued in U.S. dollars, based on foreign currency exchange rate quotations supplied by a third party pricing service. The pricing service uses a proprietary model to determine the exchange rate. Inputs to the model include reported trades and implied bid/ask spreads. Forward foreign currency exchange contracts are generally valued at the mean of the average bid and average asked prices that are reported by currency dealers to a third party pricing service at the valuation time. Such third party pricing service valuations are supplied for specific settlement periods and the Fund’s forward foreign currency exchange contracts are valued at an interpolated rate between the closest preceding and subsequent settlement period reported by the third party pricing service. The daily valuation of exchange-traded foreign securities generally is determined as of the close of trading on the principal exchange on which such securities trade. Events occurring after the close of trading on foreign exchanges may result in adjustments to the valuation of foreign securities to more accurately reflect their fair value as of the close of regular trading on the New York Stock Exchange. When valuing foreign equity securities that meet certain criteria, the Fund’s Trustees have approved the use of a fair value service that values such securities to reflect market trading that occurs after the close of the applicable foreign markets of comparable securities or other instruments that have a strong correlation to the fair-valued securities.
Investments for which valuations or market quotations are not readily available or are deemed unreliable are valued at fair value using methods determined in good faith by or at the direction of the Trustees of the Fund in a manner that fairly reflects the security’s value, or the amount that the Fund might reasonably expect to receive for the security upon its current sale in the ordinary course. Each such determination is based on a consideration of relevant factors, which are likely to vary from one pricing context to another. These factors may include, but are not limited to, the type of security, the existence of any contractual restrictions on the security’s disposition, the price and extent of public trading in similar securities of the issuer or of comparable companies or entities, quotations or relevant information obtained from broker/dealers or other market participants, information obtained from the issuer, analysts, and/or the appropriate stock exchange (for exchange-traded securities), an analysis of the company’s or entity’s financial condition, and an evaluation of the forces that influence the issuer and the market(s) in which the security is purchased and sold.
The Fund may invest in Eaton Vance Cash Reserves Fund, LLC (Cash Reserves Fund), an affiliated investment company managed by Eaton Vance Management (EVM). Cash Reserves Fund generally values its investment securities utilizing the amortized cost valuation technique in accordance with Rule 2a-7 under the 1940 Act. This technique involves initially valuing a portfolio security at its cost and thereafter assuming a constant amortization to maturity of any discount or premium. If amortized cost is determined not to approximate fair value, Cash Reserves Fund may value its investment securities in the same manner as debt obligations described above.
B Investment Transactions — Investment transactions for financial statement purposes are accounted for on a trade date basis. Realized gains and losses on investments sold are determined on the basis of identified cost.
Eaton Vance
Tax-Managed Global Dividend Income Fund
October 31, 2012
Notes to Financial Statements — continued
C Income — Dividend income is recorded on the ex-dividend date for dividends received in cash and/or securities. However, if the ex-dividend date has passed, certain dividends from foreign securities are recorded as the Fund is informed of the ex-dividend date. Withholding taxes on foreign dividends and capital gains have been provided for in accordance with the Fund’s understanding of the applicable countries’ tax rules and rates. Interest income is recorded on the basis of interest accrued, adjusted for amortization of premium or accretion of discount.
D Federal Taxes — The Fund’s policy is to comply with the provisions of the Internal Revenue Code applicable to regulated investment companies and to distribute to shareholders each year substantially all of its net investment income, and all or substantially all of its net realized capital gains. Accordingly, no provision for federal income or excise tax is necessary.
At October 31, 2012, the Fund, for federal income tax purposes, had a capital loss carryforward of $569,059,242 which will reduce its taxable income arising from future net realized gains on investment transactions, if any, to the extent permitted by the Internal Revenue Code, and thus will reduce the amount of distributions to shareholders, which would otherwise be necessary to relieve the Fund of any liability for federal income or excise tax. Such capital loss carryforward will expire on October 31, 2016 ($286,925,838), October 31, 2017 ($258,617,823), and October 31, 2018 ($23,515,581). In addition, such capital loss carryforward cannot be utilized prior to the utilization of new capital losses, if any, created after October 31, 2012.
During the year ended October 31, 2012, a capital loss carryforward of $28,588,854 was utilized to offset net capital gains by the Fund.
As of October 31, 2012, the Fund had no uncertain tax positions that would require financial statement recognition, de-recognition, or disclosure. The Fund files a U.S. federal income tax return annually after its fiscal year-end, which is subject to examination by the Internal Revenue Service for a period of three years from the date of filing.
E Expenses — The majority of expenses of the Trust are directly identifiable to an individual fund. Expenses which are not readily identifiable to a specific fund are allocated taking into consideration, among other things, the nature and type of expense and the relative size of the funds.
F Expense Reduction — State Street Bank and Trust Company (SSBT) serves as custodian of the Fund. Pursuant to the custodian agreement, SSBT receives a fee reduced by credits, which are determined based on the average daily cash balance the Fund maintains with SSBT. All credit balances, if any, used to reduce the Fund’s custodian fees are reported as a reduction of expenses in the Statement of Operations.
G Foreign Currency Translation — Investment valuations, other assets, and liabilities initially expressed in foreign currencies are translated each business day into U.S. dollars based upon current exchange rates. Purchases and sales of foreign investment securities and income and expenses denominated in foreign currencies are translated into U.S. dollars based upon currency exchange rates in effect on the respective dates of such transactions. Recognized gains or losses on investment transactions attributable to changes in foreign currency exchange rates are recorded for financial statement purposes as net realized gains and losses on investments. That portion of unrealized gains and losses on investments that results from fluctuations in foreign currency exchange rates is not separately disclosed.
H Use of Estimates — The preparation of the financial statements in conformity with accounting principles generally accepted in the United States of America requires management to make estimates and assumptions that affect the reported amounts of assets and liabilities at the date of the financial statements and the reported amounts of income and expense during the reporting period. Actual results could differ from those estimates.
I Indemnifications — Under the Trust’s organizational documents, its officers and Trustees may be indemnified against certain liabilities and expenses arising out of the performance of their duties to the Fund. Under Massachusetts law, if certain conditions prevail, shareholders of a Massachusetts business trust (such as the Trust) could be deemed to have personal liability for the obligations of the Trust. However, the Trust’s Declaration of Trust contains an express disclaimer of liability on the part of Fund shareholders and the By-laws provide that the Trust shall assume the defense on behalf of any Fund shareholders. Moreover, the By-laws also provide for indemnification out of Fund property of any shareholder held personally liable solely by reason of being or having been a shareholder for all loss or expense arising from such liability. Additionally, in the normal course of business, the Fund enters into agreements with service providers that may contain indemnification clauses. The Fund’s maximum exposure under these arrangements is unknown as this would involve future claims that may be made against the Fund that have not yet occurred.
J Forward Foreign Currency Exchange Contracts — The Fund may enter into forward foreign currency exchange contracts for the purchase or sale of a specific foreign currency at a fixed price on a future date. The forward foreign currency exchange contracts are adjusted by the daily exchange rate of the underlying currency and any gains or losses are recorded as unrealized until such time as the contracts have been closed or offset by another contract with the same broker for the same settlement date and currency. Risks may arise upon entering these contracts from the potential inability of counterparties to meet the terms of their contracts and from movements in the value of a foreign currency relative to the U.S. dollar.
2 Distributions to Shareholders
It is the present policy of the Fund to make monthly distributions of all or substantially all of its net investment income and to distribute annually all or substantially all of its net realized capital gains (reduced by available capital loss carryforwards from prior years, if any). Distributions to shareholders are recorded on the ex-dividend date. Distributions are declared separately for each class of shares. Shareholders may reinvest income and capital gain distributions in additional shares of the same class of the Fund at the net asset value as of the ex-dividend date or, at the election of the shareholder, receive distributions in cash. The Fund distinguishes between distributions on a tax basis and a financial reporting basis. Accounting principles generally
Eaton Vance
Tax-Managed Global Dividend Income Fund
October 31, 2012
Notes to Financial Statements — continued
accepted in the United States of America require that only distributions in excess of tax basis earnings and profits be reported in the financial statements as a return of capital. Permanent differences between book and tax accounting relating to distributions are reclassified to paid-in capital. For tax purposes, distributions from short-term capital gains are considered to be from ordinary income.
The tax character of distributions declared for the years ended October 31, 2012 and October 31, 2011 was as follows:
| | | | | | | | |
| | | Year Ended October 31, | |
| | | 2012 | | | 2011 | |
| | |
Distributions declared from: | | | | | | | | |
Ordinary income | | $ | 48,110,360 | | | $ | 59,155,964 | |
During the year ended October 31, 2012, accumulated net realized loss was increased by $218,801 and accumulated undistributed net investment income was increased by $218,801 due to differences between book and tax accounting, primarily for accretion of market discount, investments in partnerships, distributions from real estate investment trusts (REITs) and foreign currency gain (loss). These reclassifications had no effect on the net assets or net asset value per share of the Fund.
As of October 31, 2012, the components of distributable earnings (accumulated losses) and unrealized appreciation (depreciation) on a tax basis were as follows:
| | | | |
Undistributed ordinary income | | $ | 1,415,130 | |
Capital loss carryforward | | $ | (569,059,242 | ) |
Net unrealized appreciation | | $ | 117,534,863 | |
The differences between components of distributable earnings (accumulated losses) on a tax basis and the amounts reflected in the Statement of Assets and Liabilities are primarily due to wash sales, distributions from REITs, foreign currency transactions, investments in partnerships and accretion of market discount.
3 Investment Adviser Fee and Other Transactions with Affiliates
The investment adviser fee is earned by EVM as compensation for management and investment advisory services rendered to the Fund. The fee is computed at an annual rate of 0.65% of the Fund’s average daily net assets up to $500 million, 0.625% from $500 million up to $1 billion, and is payable monthly. On net assets of $1 billion and over, the annual fee is reduced. The Fund invests its cash in Cash Reserves Fund. EVM does not currently receive a fee for advisory services provided to Cash Reserves Fund. For the year ended October 31, 2012, the Fund’s investment adviser fee amounted to $6,406,228 or 0.64% of the Fund’s average daily net assets. The administration fee is earned by EVM for administering the business affairs of the Fund and is computed at an annual rate of 0.15% of the Fund’s average daily net assets. For the year ended October 31, 2012, the administration fee amounted to $1,508,650. EVM serves as the sub-transfer agent of the Fund and receives from the transfer agent an aggregate fee based upon the actual expenses incurred by EVM in the performance of these services. For the year ended October 31, 2012, EVM earned $31,413 in sub-transfer agent fees. The Fund was informed that Eaton Vance Distributors, Inc. (EVD), an affiliate of EVM and the Fund’s principal underwriter, received $133,279 as its portion of the sales charge on sales of Class A shares for the year ended October 31, 2012. EVD also received distribution and service fees from Class A, Class B and Class C shares (see Note 4) and contingent deferred sales charges (see Note 5).
Trustees and officers of the Fund who are members of EVM’s organization receive remuneration for their services to the Fund out of the investment adviser fee. Trustees of the Fund who are not affiliated with EVM may elect to defer receipt of all or a percentage of their annual fees in accordance with the terms of the Trustees Deferred Compensation Plan. For the year ended October 31, 2012, no significant amounts have been deferred. Certain officers and Trustees of the Fund are officers of EVM.
4 Distribution Plans
The Fund has in effect a distribution plan for Class A shares (Class A Plan) pursuant to Rule 12b-1 under the 1940 Act. Pursuant to the Class A Plan, the Fund pays EVD a distribution and service fee of 0.25% per annum of its average daily net assets attributable to Class A shares for distribution services and facilities provided to the Fund by EVD, as well as for personal services and/or the maintenance of shareholder accounts. Distribution and service fees paid or accrued to EVD for the year ended October 31, 2012 amounted to $1,268,315 for Class A shares.
The Fund also has in effect distribution plans for Class B shares (Class B Plan) and Class C shares (Class C Plan) pursuant to Rule 12b-1 under the 1940 Act. Pursuant to the Class B and Class C Plans, the Fund pays EVD amounts equal to 0.75% per annum of its average daily net assets attributable to Class B and Class C shares for providing ongoing distribution services and facilities to the Fund. The Fund will automatically discontinue payments to EVD during any period in which there are no outstanding Uncovered Distribution Charges, which are equivalent to the sum of (i) 6.25% of the aggregate
Eaton Vance
Tax-Managed Global Dividend Income Fund
October 31, 2012
Notes to Financial Statements — continued
amount received by the Fund for Class B and Class C shares sold, plus (ii) interest calculated by applying the rate of 1% over the prevailing prime rate to the outstanding balance of Uncovered Distribution Charges of EVD of each respective class, reduced by the aggregate amount of contingent deferred sales charges (see Note 5) and amounts theretofore paid or payable to EVD by each respective class. For the year ended October 31, 2012, the Fund paid or accrued to EVD $438,654 and $2,628,731 for Class B and Class C shares, respectively, representing 0.75% of the average daily net assets of Class B and Class C shares. At October 31, 2012, the amounts of Uncovered Distribution Charges of EVD calculated under the Class B and Class C Plans were approximately $4,950,000 and $48,827,000, respectively.
Pursuant to the Class B and Class C Plans, the Fund also makes payments of service fees to EVD, financial intermediaries and other persons in amounts equal to 0.25% per annum of its average daily net assets attributable to that class. Service fees paid or accrued are for personal services and/or the maintenance of shareholder accounts. They are separate and distinct from the sales commissions and distribution fees payable to EVD and, as such, are not subject to automatic discontinuance when there are no outstanding Uncovered Distribution Charges of EVD. Service fees paid or accrued for the year ended October 31, 2012 amounted to $146,218 and $876,244 for Class B and Class C shares, respectively.
5 Contingent Deferred Sales Charges
A contingent deferred sales charge (CDSC) generally is imposed on redemptions of Class B shares made within six years of purchase and on redemptions of Class C shares made within one year of purchase. Class A shares may be subject to a 1% CDSC if redeemed within 18 months of purchase (depending on the circumstances of purchase). Generally, the CDSC is based upon the lower of the net asset value at date of redemption or date of purchase. No charge is levied on shares acquired by reinvestment of dividends or capital gain distributions. The CDSC for Class B shares is imposed at declining rates that begin at 5% in the case of redemptions in the first and second year after purchase, declining one percentage point each subsequent year. Class C shares are subject to a 1% CDSC if redeemed within one year of purchase. No CDSC is levied on shares which have been sold to EVM or its affiliates or to their respective employees or clients and may be waived under certain other limited conditions. CDSCs received on Class B and Class C redemptions are paid to EVD to reduce the amount of Uncovered Distribution Charges calculated under the Fund’s Class B and Class C Plans. CDSCs received on Class B and Class C redemptions when no Uncovered Distribution Charges exist are credited to the Fund. For the year ended October 31, 2012, the Fund was informed that EVD received approximately $12,000, $111,000 and $16,000 of CDSCs paid by Class A, Class B and Class C shareholders, respectively.
6 Purchases and Sales of Investments
Purchases and sales of investments, other than short-term obligations, aggregated $819,735,648 and $957,477,744, respectively, for the year ended October 31, 2012.
7 Shares of Beneficial Interest
The Fund’s Declaration of Trust permits the Trustees to issue an unlimited number of full and fractional shares of beneficial interest (without par value). Such shares may be issued in a number of different series (such as the Fund) and classes. Transactions in Fund shares were as follows:
| | | | | | | | |
| | | Year Ended October 31, | |
| Class A | | 2012 | | | 2011 | |
| | |
Sales | | | 7,801,439 | | | | 9,538,392 | |
Issued to shareholders electing to receive payments of distributions in Fund shares | | | 2,307,212 | | | | 2,494,882 | |
Redemptions | | | (19,809,158 | ) | | | (20,950,310 | ) |
Exchange from Class B shares | | | 954,828 | | | | 596,639 | |
| | |
Net decrease | | | (8,745,679 | ) | | | (8,320,397 | ) |
| | |
| | | | | | | | |
| | | Year Ended October 31, | |
| Class B | | 2012 | | | 2011 | |
| | |
Sales | | | 152,589 | | | | 596,753 | |
Issued to shareholders electing to receive payments of distributions in Fund shares | | | 197,813 | | | | 247,389 | |
Redemptions | | | (1,427,530 | ) | | | (1,794,881 | ) |
Exchange to Class A shares | | | (956,719 | ) | | | (597,865 | ) |
| | |
Net decrease | | | (2,033,847 | ) | | | (1,548,604 | ) |
Eaton Vance
Tax-Managed Global Dividend Income Fund
October 31, 2012
Notes to Financial Statements — continued
| | | | | | | | |
| | | Year Ended October 31, | |
| Class C | | 2012 | | | 2011 | |
| | |
Sales | | | 2,754,722 | | | | 4,174,026 | |
Issued to shareholders electing to receive payments of distributions in Fund shares | | | 1,185,370 | | | | 1,247,679 | |
Redemptions | | | (9,295,332 | ) | | | (11,357,748 | ) |
| | |
Net decrease | | | (5,355,240 | ) | | | (5,936,043 | ) |
| | |
| | | | | | | | |
| | | Year Ended October 31, | |
| Class I | | 2012 | | | 2011 | |
| | |
Sales | | | 3,462,101 | | | | 5,572,080 | |
Issued to shareholders electing to receive payments of distributions in Fund shares | | | 389,175 | | | | 299,383 | |
Redemptions | | | (4,205,327 | ) | | | (2,488,926 | ) |
| | |
Net increase (decrease) | | | (354,051 | ) | | | 3,382,537 | |
8 Federal Income Tax Basis of Investments
The cost and unrealized appreciation (depreciation) of investments of the Fund at October 31, 2012, as determined on a federal income tax basis, were as follows:
| | | | |
| |
Aggregate cost | | $ | 844,998,398 | |
| |
Gross unrealized appreciation | | $ | 143,143,330 | |
Gross unrealized depreciation | | | (25,790,343 | ) |
| |
Net unrealized appreciation | | $ | 117,352,987 | |
9 Financial Instruments
The Fund may trade in financial instruments with off-balance sheet risk in the normal course of its investing activities. These financial instruments may include forward foreign currency exchange contracts and may involve, to a varying degree, elements of risk in excess of the amounts recognized for financial statement purposes. The notional or contractual amounts of these instruments represent the investment the Fund has in particular classes of financial instruments and do not necessarily represent the amounts potentially subject to risk. The measurement of the risks associated with these instruments is meaningful only when all related and offsetting transactions are considered.
Eaton Vance
Tax-Managed Global Dividend Income Fund
October 31, 2012
Notes to Financial Statements ��� continued
A summary of obligations under these financial instruments at October 31, 2012 is as follows:
| | | | | | | | | | |
| Forward Foreign Currency Exchange Contracts | | | | | |
| | | | |
| | | | | | | | | | |
Sales | |
| Settlement Date | | Deliver | | In Exchange For | | Counterparty | | Net Unrealized
Appreciation
(Depreciation) | |
| | | | |
| 11/30/12 | | Euro
9,846,600 | | United States Dollar
12,764,620 | | Citibank NA | | $ | (1,157 | ) |
| 11/30/12 | | Euro
9,846,600 | | United States Dollar
12,767,545 | | Standard Chartered Bank | | | 1,767 | |
| 11/30/12 | | Euro
9,846,600 | | United States Dollar
12,764,640 | | State Street Bank and Trust Co. | | | (1,137 | ) |
| | | | |
| | | | | | | | | $ | (527 | ) |
At October 31, 2012, the Fund had sufficient cash and/or securities to cover commitments under these contracts.
The Fund is subject to foreign exchange risk in the normal course of pursuing its investment objective. Because the Fund holds foreign currency denominated investments, the value of these investments and related receivables and payables may change due to future changes in foreign currency exchange rates. To hedge against this risk, the Fund enters into forward foreign currency exchange contracts. The Fund also enters into such contracts to hedge the currency risk of investments it anticipates purchasing.
The Fund enters into forward foreign currency exchange contracts that may contain provisions whereby the counterparty may terminate the contract under certain conditions, including but not limited to a decline in the Fund’s net assets below a certain level over a certain period of time, which would trigger a payment by the Fund for those derivatives in a liability position. At October 31, 2012, the fair value of derivatives with credit-related contingent features in a net liability position was $2,294.
The non-exchange traded derivatives in which the Fund invests, including forward foreign currency exchange contracts, are subject to the risk that the counterparty to the contract fails to perform its obligations under the contract. At October 31, 2012, the maximum amount of loss the Fund would incur due to counterparty risk was $1,767, representing the fair value of such derivatives in an asset position, with the highest amount from any one counterparty being $1,767. To mitigate this risk, the Fund has entered into master netting agreements with substantially all its derivative counterparties, which allows it and a counterparty to aggregate amounts owed by each of them for derivative transactions under the agreement into a single net amount payable by either the Fund or the counterparty. Counterparties may be required to pledge collateral in the form of cash, U.S. Government securities or highly-rated bonds for the benefit of the Fund if the net amount due from the counterparty with respect to a derivative contract exceeds a certain threshold. The amount of collateral posted by the counterparties with respect to such contracts would also reduce the amount of any loss incurred.
The fair value of open derivative instruments (not considered to be hedging instruments for accounting disclosure purposes) and whose primary underlying risk exposure is foreign exchange risk at October 31, 2012 was as follows:
| | | | | | | | |
| | | Fair Value | |
| Derivative | | Asset Derivative | | | Liability Derivative | |
| | |
Forward foreign currency exchange contracts | | $ | 1,767 | (1) | | $ | (2,294 | )(2) |
| (1) | Statement of Assets and Liabilities location: Receivable for open forward foreign currency exchange contracts; Net unrealized appreciation. |
| (2) | Statement of Assets and Liabilities location: Payable for open forward foreign currency exchange contracts; Net unrealized appreciation. |
Eaton Vance
Tax-Managed Global Dividend Income Fund
October 31, 2012
Notes to Financial Statements — continued
The effect of derivative instruments (not considered to be hedging instruments for accounting disclosure purposes) on the Statement of Operations and whose primary underlying risk exposure is foreign exchange risk for the year ended October 31, 2012 was as follows:
| | | | | | | | |
| Derivative | | Realized Gain (Loss) on Derivatives Recognized in Income | | | Change in Unrealized Appreciation (Depreciation) on Derivatives Recognized in Income | |
| | |
Forward foreign currency exchange contracts | | $ | (2,949,672 | )(1) | | $ | (527 | )(2) |
| (1) | Statement of Operations location: Net realized gain (loss) – Foreign currency and forward foreign currency exchange contract transactions. |
| (2) | Statement of Operations location: Change in unrealized appreciation (depreciation) – Foreign currency and forward foreign currency exchange contracts. |
The average notional amount of forward foreign currency exchange contracts outstanding during the year ended October 31, 2012, which is indicative of the volume of this derivative type, was approximately $10,494,000.
10 Line of Credit
The Fund participates with other portfolios and funds managed by EVM and its affiliates in a $600 million unsecured line of credit agreement with a group of banks. Borrowings are made by the Fund solely to facilitate the handling of unusual and/or unanticipated short-term cash requirements. Interest is charged to the Fund based on its borrowings at an amount above either the Eurodollar rate or Federal Funds rate. In addition, a fee computed at an annual rate of 0.08% on the daily unused portion of the line of credit is allocated among the participating portfolios and funds at the end of each quarter. Because the line of credit is not available exclusively to the Fund, it may be unable to borrow some or all of its requested amounts at any particular time. The Fund did not have any significant borrowings or allocated fees during the year ended October 31, 2012.
11 Risks Associated with Foreign Investments
Investing in securities issued by companies whose principal business activities are outside the United States may involve significant risks not present in domestic investments. For example, there is generally less publicly available information about foreign companies, particularly those not subject to the disclosure and reporting requirements of the U.S. securities laws. Certain foreign issuers are generally not bound by uniform accounting, auditing, and financial reporting requirements and standards of practice comparable to those applicable to domestic issuers. Investments in foreign securities also involve the risk of possible adverse changes in investment or exchange control regulations, expropriation or confiscatory taxation, limitation on the removal of funds or other assets of the Fund, political or financial instability or diplomatic and other developments which could affect such investments. Foreign securities markets, while growing in volume and sophistication, are generally not as developed as those in the United States, and securities of some foreign issuers (particularly those located in developing countries) may be less liquid and more volatile than securities of comparable U.S. companies. In general, there is less overall governmental supervision and regulation of foreign securities markets, broker/dealers and issuers than in the United States.
12 Fair Value Measurements
Under generally accepted accounting principles for fair value measurements, a three-tier hierarchy to prioritize the assumptions, referred to as inputs, is used in valuation techniques to measure fair value. The three-tier hierarchy of inputs is summarized in the three broad levels listed below.
| Ÿ | | Level 1 – quoted prices in active markets for identical investments |
| Ÿ | | Level 2 – other significant observable inputs (including quoted prices for similar investments, interest rates, prepayment speeds, credit risk, etc.) |
| Ÿ | | Level 3 – significant unobservable inputs (including a fund’s own assumptions in determining the fair value of investments) |
In cases where the inputs used to measure fair value fall in different levels of the fair value hierarchy, the level disclosed is determined based on the lowest level input that is significant to the fair value measurement in its entirety. The inputs or methodology used for valuing securities are not necessarily an indication of the risk associated with investing in those securities.
Eaton Vance
Tax-Managed Global Dividend Income Fund
October 31, 2012
Notes to Financial Statements — continued
At October 31, 2012, the hierarchy of inputs used in valuing the Fund’s investments and open derivative instruments, which are carried at value, were as follows:
| | | | | | | | | | | | | | | | |
| Asset Description | | Level 1 | | | Level 2 | | | Level 3* | | | Total | |
| | | | |
Common Stocks | | | | | | | | | | | | | | | | |
Consumer Discretionary | | $ | 77,437,775 | | | $ | 18,308,480 | | | $ | — | | | $ | 95,746,255 | |
Consumer Staples | | | 15,887,785 | | | | 47,301,954 | | | | — | | | | 63,189,739 | |
Energy | | | 41,974,740 | | | | 44,019,950 | | | | — | | | | 85,994,690 | |
Financials | | | 83,284,963 | | | | 40,056,336 | | | | — | | | | 123,341,299 | |
Health Care | | | 49,433,975 | | | | 29,907,621 | | | | — | | | | 79,341,596 | |
Industrials | | | 59,409,340 | | | | 12,062,969 | | | | — | | | | 71,472,309 | |
Information Technology | | | 93,970,435 | | | | — | | | | — | | | | 93,970,435 | |
Materials | | | 35,682,520 | | | | 7,572,713 | | | | — | | | | 43,255,233 | |
Telecommunication Services | | | 9,962,500 | | | | 18,245,436 | | | | — | | | | 28,207,936 | |
Utilities | | | 11,105,350 | | | | 32,092,635 | | | | — | | | | 43,197,985 | |
| | | | |
Total Common Stocks | | $ | 478,149,383 | | | $ | 249,568,094 | ** | | $ | — | | | $ | 727,717,477 | |
| | | | |
Preferred Stocks | | | | | | | | | | | | | | | | |
Consumer Staples | | $ | — | | | $ | 1,216,516 | | | $ | — | | | $ | 1,216,516 | |
Financials | | | 68,464,697 | | | | 86,864,525 | | | | 0 | | | | 155,329,222 | |
Industrials | | | — | | | | 5,056,542 | | | | — | | | | 5,056,542 | |
Telecommunication Services | | | — | | | | 2,074,170 | | | | — | | | | 2,074,170 | |
Utilities | | | 2,632,084 | | | | 19,219,656 | | | | — | | | | 21,851,740 | |
| | | | |
Total Preferred Stocks | | $ | 71,096,781 | | | $ | 114,431,409 | ** | | $ | 0 | | | $ | 185,528,190 | |
| | | | |
Corporate Bonds & Notes | | $ | — | | | $ | 45,749,671 | | | $ | — | | | $ | 45,749,671 | |
Short-Term Investments | | | — | | | | 3,356,047 | | | | — | | | | 3,356,047 | |
| | | | |
Total Investments | | $ | 549,246,164 | | | $ | 413,105,221 | | | $ | 0 | | | $ | 962,351,385 | |
| | | | |
Forward Foreign Currency Exchange Contracts | | $ | — | | | $ | 1,767 | | | $ | — | | | $ | 1,767 | |
| | | | |
Total | | $ | 549,246,164 | | | $ | 413,106,988 | | | $ | 0 | | | $ | 962,353,152 | |
| | | | |
Liability Description | | | | | | | | | | | | | | | | |
Forward Foreign Currency Exchange Contracts | | $ | — | | | $ | (2,294 | ) | | $ | — | | | $ | (2,294 | ) |
| | | | |
Total | | $ | — | | | $ | (2,294 | ) | | $ | — | | | $ | (2,294 | ) |
| * | None of the unobservable inputs for Level 3 assets, individually or collectively, had a material impact on the Fund. |
| ** | Includes foreign equity securities whose values were adjusted to reflect market trading of comparable securities or other correlated instruments that occurred after the close of trading in their applicable foreign markets. |
Level 3 investments at the beginning and/or end of the year in relation to net assets were not significant and accordingly, a reconciliation of Level 3 assets for the year ended October 31, 2012 is not presented. At October 31, 2012, there were no investments transferred between Level 1 and Level 2 during the year then ended.
Eaton Vance
Tax-Managed Global Dividend Income Fund
October 31, 2012
Report of Independent Registered Public Accounting Firm
To the Trustees of Eaton Vance Mutual Funds Trust and Shareholders of Eaton Vance Tax-Managed Global Dividend Income Fund:
We have audited the accompanying statement of assets and liabilities of Eaton Vance Tax-Managed Global Dividend Income Fund (the “Fund”) (one of the funds constituting Eaton Vance Mutual Funds Trust), including the portfolio of investments, as of October 31, 2012, and the related statement of operations for the year then ended, the statements of changes in net assets for each of the two years in the period then ended, and the financial highlights for each of the five years in the period then ended. These financial statements and financial highlights are the responsibility of the Fund’s management. Our responsibility is to express an opinion on these financial statements and financial highlights based on our audits.
We conducted our audits in accordance with the standards of the Public Company Accounting Oversight Board (United States). Those standards require that we plan and perform the audit to obtain reasonable assurance about whether the financial statements and financial highlights are free of material misstatement. The Fund is not required to have, nor were we engaged to perform, an audit of its internal control over financial reporting. Our audits included consideration of internal control over financial reporting as a basis for designing audit procedures that are appropriate in the circumstances, but not for the purpose of expressing an opinion on the effectiveness of the Fund’s internal control over financial reporting. Accordingly, we express no such opinion. An audit also includes examining, on a test basis, evidence supporting the amounts and disclosures in the financial statements, assessing the accounting principles used and significant estimates made by management, as well as evaluating the overall financial statement presentation. Our procedures included confirmation of securities owned as of October 31, 2012, by correspondence with the custodian and brokers; where replies were not received from brokers, we performed other auditing procedures. We believe that our audits provide a reasonable basis for our opinion.
In our opinion, such financial statements and financial highlights referred to above present fairly, in all material respects, the financial position of Eaton Vance Tax-Managed Global Dividend Income Fund as of October 31, 2012, the results of its operations for the year then ended, the changes in its net assets for each of the two years in the period then ended, and the financial highlights for each of the five years in the period then ended, in conformity with accounting principles generally accepted in the United States of America.
DELOITTE & TOUCHE LLP
Boston, Massachusetts
December 17, 2012
Eaton Vance
Tax-Managed Global Dividend Income Fund
October 31, 2012
Federal Tax Information (Unaudited)
The Form 1099-DIV you receive in January 2013 will show the tax status of all distributions paid to your account in calendar year 2012. Shareholders are advised to consult their own tax adviser with respect to the tax consequences of their investment in the Fund. As required by the Internal Revenue Code and/or regulations, shareholders must be notified regarding the status of qualified dividend income for individuals and the dividends received deduction for corporations.
Qualified Dividend Income. The Fund designates approximately $58,457,948, or up to the maximum amount of such dividends allowable pursuant to the Internal Revenue Code, as qualified dividend income eligible for the reduced tax rate of 15%.
Dividends Received Deduction. Corporate shareholders are generally entitled to take the dividends received deduction on the portion of the Fund’s dividend distribution that qualifies under tax law. For the Fund’s fiscal 2012 ordinary income dividends, 43.08% qualifies for the corporate dividends received deduction.
Eaton Vance
Tax-Managed Global Dividend Income Fund
October 31, 2012
Management and Organization
Fund Management. The Trustees of Eaton Vance Mutual Funds Trust (the Trust) are responsible for the overall management and supervision of the Trust’s affairs. The Trustees and officers of the Trust are listed below. Except as indicated, each individual has held the office shown or other offices in the same company for the last five years. Trustees and officers of the Trust hold indefinite terms of office. The “Noninterested Trustees” consist of those Trustees who are not “interested persons” of the Trust, as that term is defined under the 1940 Act. The business address of each Trustee and officer is Two International Place, Boston, Massachusetts 02110. As used below, “EVC” refers to Eaton Vance Corp., “EV” refers to Eaton Vance, Inc., “EVM” refers to Eaton Vance Management, “BMR” refers to Boston Management and Research and “EVD” refers to Eaton Vance Distributors, Inc. EVC and EV are the corporate parent and trustee, respectively, of EVM and BMR. EVD is the Fund’s principal underwriter and a wholly-owned subsidiary of EVC. Each officer affiliated with Eaton Vance may hold a position with other Eaton Vance affiliates that is comparable to his or her position with EVM listed below. Each Trustee oversees 187 portfolios in the Eaton Vance Complex (including all master and feeder funds in a master feeder structure). Each officer serves as an officer of certain other Eaton Vance funds. Each Trustee and officer serves until his or her successor is elected.
| | | | | | |
| Name and Year of Birth | | Position(s) with the
Trust | | Length of
Service | | Principal Occupation(s) and Directorships During Past Five Years and Other Relevant Experience |
Interested Trustee |
| | | |
Thomas E. Faust Jr. 1958 | | Trustee | | Since 2007 | | Chairman, Chief Executive Officer and President of EVC, Director and President of EV, Chief Executive Officer and President of EVM and BMR, and Director of EVD. Trustee and/or officer of 187 registered investment companies. Mr. Faust is an interested person because of his positions with EVM, BMR, EVD, EVC and EV, which are affiliates of the Trust. Directorships in the Last Five Years.(1) Director of EVC and Hexavest Inc. |
| | | |
| | | | | | |
Noninterested Trustees |
| | | |
Scott E. Eston 1956 | | Trustee | | Since 2011 | | Private investor. Formerly held various positions at Grantham, Mayo, Van Otterloo and Co., L.L.C. (investment management firm) (1997-2009), including Chief Operating Officer (2002-2009), Chief Financial Officer (1997-2009) and Chairman of the Executive Committee (2002-2008); President and Principal Executive Officer, GMO Trust (open-end registered investment company) (2006-2009). Former Partner, Coopers and Lybrand L.L.P. (now PricewaterhouseCoopers) (public accounting firm) (1987-1997). Directorships in the Last Five Years. None. |
| | | |
Benjamin C. Esty 1963 | | Trustee | | Since 2005 | | Roy and Elizabeth Simmons Professor of Business Administration and Finance Unit Head, Harvard University Graduate School of Business Administration. Directorships in the Last Five Years.(1) None. |
| | | |
Allen R. Freedman 1940 | | Trustee | | Since 2007 | | Private Investor. Former Chairman (2002-2004) and a Director (1983-2004) of Systems & Computer Technology Corp. (provider of software to higher education). Formerly, a Director of Loring Ward International (fund distributor) (2005-2007). Former Chairman and a Director of Indus International, Inc. (provider of enterprise management software to the power generating industry) (2005-2007). Former Chief Executive Officer of Assurant, Inc. (insurance provider) (1979-2000). Directorships in the Last Five Years.(1) Director of Stonemor Partners, L.P. (owner and operator of cemeteries). Formerly, Director of Assurant, Inc. (insurance provider) (1979-2011). |
| | | |
William H. Park 1947 | | Trustee | | Since 2003 | | Consultant and private investor. Formerly, Chief Financial Officer, Aveon Group L.P. (investment management firm) (2010-2011). Formerly, Vice Chairman, Commercial Industrial Finance Corp. (specialty finance company) (2006-2010). Formerly, President and Chief Executive Officer, Prizm Capital Management, LLC (investment management firm) (2002-2005). Formerly, Executive Vice President and Chief Financial Officer, United Asset Management Corporation (investment management firm) (1982-2001). Formerly, Senior Manager, Price Waterhouse (now PricewaterhouseCoopers) (an independent registered public accounting firm) (1972-1981). Directorships in the Last Five Years.(1) None. |
| | | |
Ronald A. Pearlman 1940 | | Trustee | | Since 2003 | | Professor of Law, Georgetown University Law Center. Formerly, Deputy Assistant Secretary (Tax Policy) and Assistant Secretary (Tax Policy), U.S. Department of the Treasury (1983-1985). Formerly, Chief of Staff, Joint Committee on Taxation, U.S. Congress (1988-1990). Directorships in the Last Five Years.(1) None. |
Eaton Vance
Tax-Managed Global Dividend Income Fund
October 31, 2012
Management and Organization — continued
| | | | | | |
| Name and Year of Birth | | Position(s) with the
Trust | | Length of
Service | | Principal Occupation(s) and Directorships During Past Five Years and Other Relevant Experience |
Noninterested Trustees (continued) |
| | | |
Helen Frame Peters 1948 | | Trustee | | Since 2008 | | Professor of Finance, Carroll School of Management, Boston College. Formerly, Dean, Carroll School of Management, Boston College (2000-2002). Formerly, Chief Investment Officer, Fixed Income, Scudder Kemper Investments (investment management firm) (1998-1999). Formerly, Chief Investment Officer, Equity and Fixed Income, Colonial Management Associates (investment management firm) (1991-1998). Directorships in the Last Five Years.(1) Formerly, Director of BJ’s Wholesale Club, Inc. (wholesale club retailer) (2004-2011). Formerly, Trustee of SPDR Index Shares Funds and SPDR Series Trust (exchange traded funds) (2000-2009). Formerly, Director of Federal Home Loan Bank of Boston (a bank for banks) (2007-2009). |
| | | |
Lynn A. Stout 1957 | | Trustee | | Since 1998 | | Distinguished Professor of Corporate and Business Law, Jack G. Clarke Business Law Institute, Cornell University Law School. Formerly, the Paul Hastings Professor of Corporate and Securities Law (2006-2012) and Professor of Law (2001-2006), University of California at Los Angeles School of Law. Directorships in the Last Five Years.(1) None. |
| | | |
Harriett Tee Taggart 1948 | | Trustee | | Since 2011 | | Managing Director, Taggart Associates (a professional practice firm). Formerly, Partner and Senior Vice President, Wellington Management Company, LLP (investment management firm) (1983-2006). Directorships in the Last Five Years. Director of Albemarle Corporation (chemicals manufacturer) (since 2007) and The Hanover Group (specialty property and casualty insurance company) (since 2009). Formerly, Director of Lubrizol Corporation (specialty chemicals) (2007-2011). |
| | | |
Ralph F. Verni 1943 | | Chairman of the Board and Trustee | | Chairman of the Board since 2007 and Trustee since 2005 | | Consultant and private investor. Formerly, Chief Investment Officer (1982-1992), Chief Financial Officer (1988-1990) and Director (1982-1992), New England Life. Formerly, Chairperson, New England Mutual Funds (1982-1992). Formerly, President and Chief Executive Officer, State Street Management & Research (1992-2000). Formerly, Chairperson, State Street Research Mutual Funds (1992-2000). Formerly, Director, W.P. Carey, LLC (1998-2004) and First Pioneer Farm Credit Corp. (2002-2006). Directorships in the Last Five Years.(1) None. |
| | | |
| | | | | | |
Principal Officers who are not Trustees | | |
| Name and Year of Birth | | Position(s) with the Trust | | Length of Service | | Principal Occupation(s) During Past Five Years |
| | | |
Duncan W. Richardson 1957 | | President | | Since 2011 | | Director of EVC and Executive Vice President and Chief Equity Investment Officer of EVC, EVM and BMR. |
| | | |
Payson F. Swaffield 1956 | | Vice President | | Since 2011 | | Vice President and Chief Income Investment Officer of EVM and BMR. |
| | | |
Barbara E. Campbell 1957 | | Treasurer | | Since 2005 | | Vice President of EVM and BMR. |
| | | |
Maureen A. Gemma 1960 | | Vice President, Secretary and Chief Legal Officer | | Vice President since 2011, Secretary since 2007 and Chief Legal Officer since 2008 | | Vice President of EVM and BMR. |
| | | |
Paul M. O’Neil 1953 | | Chief Compliance Officer | | Since 2004 | | Vice President of EVM and BMR. |
| (1) | During their respective tenures, the Trustees (except Mr. Eston and Ms. Taggart) also served as trustees of one or more of the following Eaton Vance funds (which operated in the years noted): Eaton Vance Credit Opportunities Fund (launched in 2005 and terminated in 2010); Eaton Vance Insured Florida Plus Municipal Bond Fund (launched in 2002 and terminated in 2009); and Eaton Vance National Municipal Income Trust (launched in 1998 and terminated in 2009). |
The SAI for the Fund includes additional information about the Trustees and officers of the Fund and can be obtained without charge on Eaton Vance’s website at www.eatonvance.com or by calling 1-800-262-1122.
Eaton Vance Funds
IMPORTANT NOTICES
Privacy. The Eaton Vance organization is committed to ensuring your financial privacy. Each of the financial institutions identified below has in effect the following policy (“Privacy Policy”) with respect to nonpublic personal information about its customers:
| Ÿ | | Only such information received from you, through application forms or otherwise, and information about your Eaton Vance fund transactions will be collected. This may include information such as name, address, social security number, tax status, account balances and transactions. |
| Ÿ | | None of such information about you (or former customers) will be disclosed to anyone, except as permitted by law (which includes disclosure to employees necessary to service your account). In the normal course of servicing a customer’s account, Eaton Vance may share information with unaffiliated third parties that perform various required services such as transfer agents, custodians and broker-dealers. |
| Ÿ | | Policies and procedures (including physical, electronic and procedural safeguards) are in place that are designed to protect the confidentiality of such information. |
| Ÿ | | We reserve the right to change our Privacy Policy at any time upon proper notification to you. Customers may want to review our Privacy Policy periodically for changes by accessing the link on our homepage: www.eatonvance.com. |
Our pledge of privacy applies to the following entities within the Eaton Vance organization: the Eaton Vance Family of Funds, Eaton Vance Management, Eaton Vance Investment Counsel, Eaton Vance Distributors, Inc., Eaton Vance Trust Company, Eaton Vance Management’s Real Estate Investment Group and Boston Management and Research. In addition, our Privacy Policy applies only to those Eaton Vance customers who are individuals and who have a direct relationship with us. If a customer’s account (i.e., fund shares) is held in the name of a third-party financial advisor/broker-dealer, it is likely that only such advisor’s privacy policies apply to the customer. This notice supersedes all previously issued privacy disclosures. For more information about Eaton Vance’s Privacy Policy, please call 1-800-262-1122.
Delivery of Shareholder Documents. The Securities and Exchange Commission (SEC) permits funds to deliver only one copy of shareholder documents, including prospectuses, proxy statements and shareholder reports, to fund investors with multiple accounts at the same residential or post office box address. This practice is often called “householding” and it helps eliminate duplicate mailings to shareholders. Eaton Vance, or your financial advisor, may household the mailing of your documents indefinitely unless you instruct Eaton Vance, or your financial advisor, otherwise. If you would prefer that your Eaton Vance documents not be householded, please contact Eaton Vance at 1-800-262-1122, or contact your financial advisor. Your instructions that householding not apply to delivery of your Eaton Vance documents will be effective within 30 days of receipt by Eaton Vance or your financial advisor.
Portfolio Holdings. Each Eaton Vance Fund and its underlying Portfolio(s) (if applicable) will file a schedule of portfolio holdings on Form N-Q with the SEC for the first and third quarters of each fiscal year. The Form N-Q will be available on the Eaton Vance website at www.eatonvance.com, by calling Eaton Vance at 1-800-262-1122 or in the EDGAR database on the SEC’s website at www.sec.gov. Form N-Q may also be reviewed and copied at the SEC’s public reference room in Washington, D.C. (call 1-800-732-0330 for information on the operation of the public reference room).
Proxy Voting. From time to time, funds are required to vote proxies related to the securities held by the funds. The Eaton Vance Funds or their underlying Portfolios (if applicable) vote proxies according to a set of policies and procedures approved by the Funds’ and Portfolios’ Boards. You may obtain a description of these policies and procedures and information on how the Funds or Portfolios voted proxies relating to portfolio securities during the most recent 12-month period ended June 30, without charge, upon request, by calling 1-800-262-1122 and by accessing the SEC’s website at www.sec.gov.
This Page Intentionally Left Blank
Investment Adviser and Administrator
Eaton Vance Management
Two International Place
Boston, MA 02110
Principal Underwriter*
Eaton Vance Distributors, Inc.
Two International Place
Boston, MA 02110
(617) 482-8260
Custodian
State Street Bank and Trust Company
200 Clarendon Street
Boston, MA 02116
Transfer Agent
BNY Mellon Investment Servicing (US) Inc.
Attn: Eaton Vance Funds
P.O. Box 9653
Providence, RI 02940-9653
(800) 262-1122
Independent Registered Public Accounting Firm
Deloitte & Touche LLP
200 Berkeley Street
Boston, MA 02116-5022
Fund Offices
Two International Place
Boston, MA 02110
| * | FINRA BrokerCheck. Investors may check the background of their Investment Professional by contacting the Financial Industry Regulatory Authority (FINRA). FINRA BrokerCheck is a free tool to help investors check the professional background of current and former FINRA-registered securities firms and brokers. FINRA BrokerCheck is available by calling 1-800-289-9999 and at www.FINRA.org. The FINRA BrokerCheck brochure describing this program is available to investors at www.FINRA.org. |
1857-12/12 TMDISRC
| | |
Eaton Vance Tax-Managed International Equity Fund Annual Report October 31, 2012 | | 
|

Fund shares are not insured by the FDIC and are not deposits or other obligations of, or guaranteed by, any depository institution. Shares are subject to investment risks, including possible loss of principal invested.
This report must be preceded or accompanied by a current summary prospectus or prospectus. Before investing, investors should consider carefully the investment objective, risks, and charges and expenses of a mutual fund. This and other important information is contained in the summary prospectus and prospectus, which can be obtained from a financial advisor. Prospective investors should read the prospectus carefully before investing. For further information, please call 1-800-262-1122.
Annual Report October 31, 2012
Eaton Vance
Tax-Managed International Equity Fund
Table of Contents
| | | | |
Management’s Discussion of Fund Performance | | | 2 | |
| |
Performance | | | 3 | |
| |
Fund Profile | | | 4 | |
| |
Endnotes and Additional Disclosures | | | 5 | |
| |
Fund Expenses | | | 6 | |
| |
Financial Statements | | | 7 | |
| |
Report of Independent Registered Public Accounting Firm | | | 18 and 35 | |
| |
Federal Tax Information | | | 19 | |
| |
Special Meeting of Shareholders Notice | | | 36 | |
| |
Management and Organization | | | 37 | |
| |
Important Notices | | | 40 | |
Eaton Vance
Tax-Managed International Equity Fund
October 31, 2012
Management’s Discussion of Fund Performance1
Economic and Market Conditions
As the 12-month period began, investors appeared to worry about intensifying debt problems in Europe, high U.S. unemployment and a Congressional deadlock that left businesses perplexed about the direction of tax and regulatory policy. The MSCI World Index,2 a broad measure of global equity market performance, was relatively flat in November 2011.
Beginning in mid-December 2011, however, an equity rally took hold and continued into early April 2012. U.S. stocks were generally fueled by stronger economic growth and falling unemployment. European stocks continued to underperform U.S. issues, but nonetheless moved higher, aided by the Long Term Refinancing Operation announced by the European Central Bank (ECB) and what the markets perceived as a successful restructuring of Greek debt. Then in May 2012, the third annual mid-year economic slowdown arrived. As U.S. stock prices decreased, stock prices overseas fell even harder. Contributing factors included renewed concerns over Europe and slowing growth in China.
But despite a slowdown in consumer spending, weakening employment data and downward revisions of growth expectations, global equities moved upward intermittently from June through mid-October 2012. Hunting for yield in a low interest-rate environment, investors were driven to stocks that offered better yields than bonds. Ongoing action by the ECB also helped the market, particularly the Outright Monetary Transactions program to support sovereign debt.
Additional factors led U.S. stocks to generally outperform their non-U.S. counterparts. First, investors anticipated that worsening economic news would prompt the U.S. Federal Reserve to initiate another round of quantitative easing to stimulate the economy — which it did in September 2012. Finally, in an increasingly global marketplace, a case could be made that the U.S. market was relatively attractive versus many other world markets for much of the period. Amid ongoing European turmoil and a slowdown in Chinese growth, the U.S. market was one of the few places investors could find an economy that was growing (albeit slowly); a liquid, transparent and generally well regulated market; and an opportunity to find companies with large cash reserves and solid profit growth.
In the final weeks of the period, however, stocks gave back some of their gains as the market seemed to have come full circle; amid uncertainty about the upcoming U.S. elections,
investors once again worried about a Congressional deadlock on tax policy — an impasse that has left the United States rushing toward a fiscal cliff that could drag down the global economy.
Fund Performance
For the fiscal year ended October 31, 2012, Eaton Vance Tax-Managed International Equity Fund (the Fund) had a total return of 9.34% for Class A shares at net asset value (NAV). By comparison, the Fund’s benchmark, the MSCI EAFE Index (the Index), returned 4.61% during the same period.
At the country level, contributors to the Fund’s performance relative to the Index were the Fund’s underweight position in Japan, which underperformed the Index, and its overweight position in Singapore, which outperformed the Index. At the sector level, notable Fund performance contributors versus the Index included the Fund’s overweight position in consumer staples, which outperformed the Index, and its underweight position in materials, which underperformed the Index.
In terms of detractors from the Fund’s relative performance versus the Index, an overweight position in Israel, which underperformed the Index, was a source of weakness. The Fund’s exposure to China and Brazil, neither of which is included in the Index, also detracted from relative performance versus the Index. At the sector level, the Fund’s exposure to the energy sector, which underperformed the Index, hurt relative Fund performance versus the Index.
Continued European debt woes, along with uncertainty regarding U.S. tax and spending policies, continue to concern investors. Will policymakers and banks finally be able to resolve the European fiscal crisis? Will the Fed’s latest round of quantitative easing help prevent a slowdown in U.S. growth? Time will tell.
The Fund adjusts its country, sector and individual stock weightings in an effort to seek broad exposure and diversification.7 We believe Parametric’s broadly diversified and disciplined investment process offers a compelling means to potentially take advantage of volatile markets without relying on forecasts of economic and political trends.
See Endnotes and Additional Disclosures in this report.
Past performance is no guarantee of future results. Returns are historical and are calculated by determining the percentage change in net asset value (NAV) or offering price (as applicable) with all distributions reinvested. Investment return and principal value will fluctuate so that shares, when redeemed, may be worth more or less than their original cost. Performance less than one year is cumulative. Performance is for the stated time period only; due to market volatility, the Fund’s current performance may be lower or higher than quoted. Returns are before taxes unless otherwise noted. For performance as of the most recent month end, please refer to www.eatonvance.com.
Eaton Vance
Tax-Managed International Equity Fund
October 31, 2012
Performance2,3
Portfolio Managers David Stein, Ph.D and Thomas Seto, each of Parametric Portfolio Associates LLC
| | | | | | | | | | | | | | | | | | | | |
| % Average Annual Total Returns | | Inception Date | | | One Year | | | Five Years | | | Ten Years | | | Since
Inception | |
Class A at NAV | | | 04/22/1998 | | | | 9.34 | % | | | –9.32 | % | | | 5.76 | % | | | — | |
Class A with 5.75% Maximum Sales Charge | | | — | | | | 3.05 | | | | –10.39 | | | | 5.12 | | | | — | |
Class B at NAV | | | 04/22/1998 | | | | 8.50 | | | | –9.99 | | | | 4.98 | | | | — | |
Class B with 5% Maximum Sales Charge | | | — | | | | 3.50 | | | | –10.34 | | | | 4.98 | | | | — | |
Class C at NAV | | | 04/22/1998 | | | | 8.44 | | | | –10.01 | | | | 4.98 | | | | — | |
Class C with 1% Maximum Sales Charge | | | — | | | | 7.44 | | | | –10.01 | | | | 4.98 | | | | — | |
Class I at NAV | | | 09/02/2008 | | | | 9.46 | | | | — | | | | — | | | | –5.28 | % |
MSCI EAFE Index | | | — | | | | 4.61 | % | | | –5.81 | % | | | 7.72 | % | | | — | |
| | | | | |
| | | | | | | | | | | | | | | | | | | | |
| % After-Tax Returns with Maximum Sales Charge | | Inception Date | | | One Year | | | Five Years | | | Ten Years | | | Since
Inception | |
Class A After Taxes on Distributions | | | 04/22/1998 | | | | 3.32 | % | | | –10.28 | % | | | 5.25 | % | | | — | |
Class A After Taxes on Distributions and Sales of Fund Shares | | | — | | | | 2.73 | | | | –8.21 | | | | 4.78 | | | | — | |
Class B After Taxes on Distributions | | | 04/22/1998 | | | | 3.60 | | | | –10.22 | | | | 5.11 | | | | — | |
Class B After Taxes on Distributions and Sales of Fund Shares | | | — | | | | 2.54 | | | | –8.28 | | | | 4.55 | | | | — | |
Class C After Taxes on Distributions | | | 04/22/1998 | | | | 7.58 | | | | –9.90 | | | | 5.12 | | | | — | |
Class C After Taxes on Distributions and Sales of Fund Shares | | | — | | | | 5.21 | | | | –8.00 | | | | 4.58 | | | | — | |
Class I After Taxes on Distributions | | | 09/02/2008 | | | | 9.82 | | | | — | | | | — | | | | –5.15 | % |
Class I After Taxes on Distributions and Sales of Fund Shares | | | — | | | | 7.13 | | | | — | | | | — | | | | –4.06 | |
| | | | | |
| | | | | | | | | | | | | | | | | | | | |
| % Total Annual Operating Expense Ratios4 | | | | | Class A | | | Class B | | | Class C | | | Class I | |
| | | | | | | 1.56 | % | | | 2.31 | % | | | 2.31 | % | | | 1.31 | % |
Performance of $10,000
This graph shows the change in value of a hypothetical investment of $10,000 in Class A of the Fund for the period indicated. For comparison, the same investment is shown in the indicated index.
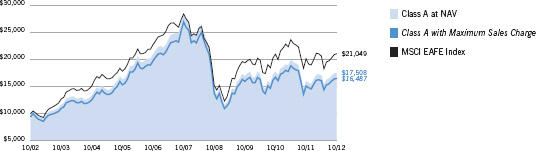
| | | | | | | | |
| Performance of Investment | | Amount Invested | | Period Beginning | | At NAV | | With Maximum
Sales Charge |
Class B | | $10,000 | | 10/31/2002 | | $16,258 | | N.A. |
Class C | | $10,000 | | 10/31/2002 | | $16,262 | | N.A. |
Class I | | $250,000 | | 09/02/2008 | | $199,473 | | N.A. |
See Endnotes and Additional Disclosures in this report.
Past performance is no guarantee of future results. Returns are historical and are calculated by determining the percentage change in net asset value (NAV) or offering price (as applicable) with all distributions reinvested. Investment return and principal value will fluctuate so that shares, when redeemed, may be worth more or less than their original cost. Performance less than one year is cumulative. Performance is for the stated time period only; due to market volatility, the Fund’s current performance may be lower or higher than quoted. Returns are before taxes unless otherwise noted. For performance as of the most recent month end, please refer to www.eatonvance.com.
Eaton Vance
Tax-Managed International Equity Fund
October 31, 2012
Fund Profile5
Sector Allocation (% of net assets)6
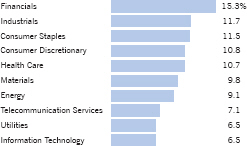
Geographic Allocation (% of net assets)6
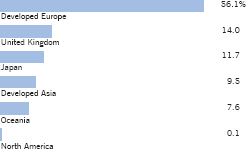
Top 10 Holdings (% of net assets)6
| | | | | | |
Royal Dutch Shell PLC, Class A | | | 2.4 | % | | |
Nestle SA | | | 1.8 | | | |
SAP AG | | | 1.7 | | | |
ENI SpA | | | 1.6 | | | |
Anheuser-Busch InBev NV | | | 1.4 | | | |
Novo Nordisk A/S, Class B | | | 1.3 | | | |
L’Oreal SA | | | 1.1 | | | |
DBS Group Holdings, Ltd. | | | 1.1 | | | |
ASML Holding NV | | | 1.1 | | | |
AstraZeneca PLC | | | 1.0 | | | |
| | | | | | | |
Total | | | 14.5 | % | | |
| | | | | | | |
See Endnotes and Additional Disclosures in this report.
Eaton Vance
Tax-Managed International Equity Fund
October 31, 2012
Endnotes and Additional Disclosures
| 1 | The views expressed in this report are those of the portfolio manager(s) and are current only through the date stated at the top of this page. These views are subject to change at any time based upon market or other conditions, and Eaton Vance and the Fund(s) disclaim any responsibility to update such views. These views may not be relied upon as investment advice and, because investment decisions are based on many factors, may not be relied upon as an indication of trading intent on behalf of any Eaton Vance fund. This commentary may contain statements that are not historical facts, referred to as “forward looking statements”. The Fund’s actual future results may differ significantly from those stated in any forward looking statement, depending on factors such as changes in securities or financial markets or general economic conditions, the volume of sales and purchases of Fund shares, the continuation of investment advisory, administrative and service contracts, and other risks discussed from time to time in the Fund’s filings with the Securities and Exchange Commission. |
| 2 | MSCI World Index is an unmanaged index of equity securities in the developed markets. MSCI EAFE Index is an unmanaged index of equities in the developed markets, excluding the U.S. and Canada. MSCI indices are net of foreign withholding taxes. Source: MSCI. MSCI data may not be reproduced or used for any other purpose. MSCI provides no warranties, has not prepared or approved this report, and has no liability hereunder. Unless otherwise stated, index returns do not reflect the effect of any applicable sales charges, commissions, expenses, taxes or leverage, as applicable. It is not possible to invest directly in an index. |
| 3 | Total Returns at NAV do not include applicable sales charges. If sales charges were deducted, the returns would be lower. Total Returns shown with maximum sales charge reflect the stated maximum sales charge. Unless otherwise stated, performance does not reflect the deduction of taxes on Fund distributions or redemptions of Fund shares. After-tax returns are calculated using certain assumptions, including using the highest historical individual federal income tax rates and do not reflect the impact of state/local taxes. Actual after-tax returns depend on a shareholder’s tax situation and the actual characterization of distributions and may differ from those shown. After-tax returns are not relevant to shareholders who hold shares in tax-deferred accounts or shares held by nontaxable entities. Return After Taxes on Distributions may be the same as Return Before Taxes for the same period because no taxable distributions were made during that period. Return After Taxes on Distributions and Sale of Fund Shares may be greater than or equal to Return After Taxes on Distributions for the same period because of losses realized on the sale of Fund shares. The Fund’s after-tax returns also may reflect foreign tax credits passed by the Fund to its shareholders. |
| 4 | Source: Fund prospectus. |
| 5 | Fund invests in an affiliated investment company (Portfolio) with the same objective(s) and policies as the Fund. References to investments are to the Portfolio’s holdings. |
| 6 | Excludes cash and cash equivalents. |
| 7 | Diversification cannot guarantee a profit or eliminate the risk of a loss. |
Fund profile subject to change due to active management.
Important Notice to Shareholders
Tax code provisions applicable to tax-favored dividends are effective for distributions paid on or before December 31, 2012. Thereafter, dividends will be taxable as ordinary income unless further legislative action is taken.
Eaton Vance
Tax-Managed International Equity Fund
October 31, 2012
Fund Expenses
Example: As a Fund shareholder, you incur two types of costs: (1) transaction costs, including sales charges (loads) on purchases and redemption fees (if applicable); and (2) ongoing costs, including management fees; distribution and/or service fees; and other Fund expenses. This Example is intended to help you understand your ongoing costs (in dollars) of Fund investing and to compare these costs with the ongoing costs of investing in other mutual funds. The Example is based on an investment of $1,000 invested at the beginning of the period and held for the entire period (May 1, 2012 – October 31, 2012).
Actual Expenses: The first section of the table below provides information about actual account values and actual expenses. You may use the information in this section, together with the amount you invested, to estimate the expenses that you paid over the period. Simply divide your account value by $1,000 (for example, an $8,600 account value divided by $1,000 = 8.6), then multiply the result by the number in the first section under the heading entitled “Expenses Paid During Period” to estimate the expenses you paid on your account during this period.
Hypothetical Example for Comparison Purposes: The second section of the table below provides information about hypothetical account values and hypothetical expenses based on the actual Fund expense ratio and an assumed rate of return of 5% per year (before expenses), which is not the actual Fund return. The hypothetical account values and expenses may not be used to estimate the actual ending account balance or expenses you paid for the period. You may use this information to compare the ongoing costs of investing in your Fund and other funds. To do so, compare this 5% hypothetical example with the 5% hypothetical examples that appear in the shareholder reports of the other funds.
Please note that the expenses shown in the table are meant to highlight your ongoing costs only and do not reflect any transactional costs, such as sales charges (loads) or redemption fees (if applicable). Therefore, the second section of the table is useful in comparing ongoing costs only, and will not help you determine the relative total costs of owning different funds. In addition, if these transactional costs were included, your costs would be higher.
| | | | | | | | | | | | | | | | |
| | | Beginning
Account Value
(5/1/12) | | | Ending
Account Value
(10/31/12) | | | Expenses Paid
During Period*
(5/1/12 – 10/31/12) | | | Annualized
Expense
Ratio | |
| | | | |
| | | | | | | | | | | | | | | | |
Actual | |
Class A | | $ | 1,000.00 | | | $ | 1,026.70 | | | $ | 9.22 | | | | 1.81 | % |
Class B | | $ | 1,000.00 | | | $ | 1,022.60 | | | $ | 12.96 | | | | 2.55 | % |
Class C | | $ | 1,000.00 | | | $ | 1,021.70 | | | $ | 13.01 | | | | 2.56 | % |
Class I | | $ | 1,000.00 | | | $ | 1,026.70 | | | $ | 7.95 | | | | 1.56 | % |
| | | | | | | | | | | | | | | | | |
| | | | |
| | | | | | | | | | | | | | | | |
Hypothetical | | | | | | | | | | | | | | | | |
(5% return per year before expenses) | | | | | | | | | | | | | | | | |
Class A | | $ | 1,000.00 | | | $ | 1,016.00 | | | $ | 9.17 | | | | 1.81 | % |
Class B | | $ | 1,000.00 | | | $ | 1,012.30 | | | $ | 12.90 | | | | 2.55 | % |
Class C | | $ | 1,000.00 | | | $ | 1,012.30 | | | $ | 12.95 | | | | 2.56 | % |
Class I | | $ | 1,000.00 | | | $ | 1,017.30 | | | $ | 7.91 | | | | 1.56 | % |
| * | Expenses are equal to the Fund’s annualized expense ratio for the indicated Class, multiplied by the average account value over the period, multiplied by 184/366 (to reflect the one-half year period). The Example assumes that the $1,000 was invested at the net asset value per share determined at the close of business on April 30, 2012. The Example reflects the expenses of both the Fund and the Portfolio. |
Eaton Vance
Tax-Managed International Equity Fund
October 31, 2012
Statement of Assets and Liabilities
| | | | |
| Assets | | October 31, 2012 | |
Investment in Tax-Managed International Equity Portfolio, at value (identified cost, $42,346,922) | | $ | 43,857,833 | |
Receivable for Fund shares sold | | | 9,990 | |
Miscellaneous receivable | | | 111,045 | |
Total assets | | $ | 43,978,868 | |
| |
| Liabilities | | | | |
Payable for Fund shares redeemed | | $ | 215,219 | |
Payable to affiliates: | | | | |
Distribution and service fees | | | 17,337 | |
Trustees’ fees | | | 42 | |
Accrued expenses | | | 52,872 | |
Total liabilities | | $ | 285,470 | |
Net Assets | | $ | 43,693,398 | |
| |
| Sources of Net Assets | | | | |
Paid-in capital | | $ | 94,417,168 | |
Accumulated net realized loss from Portfolio | | | (53,029,122 | ) |
Accumulated undistributed net investment income | | | 794,441 | |
Net unrealized appreciation from Portfolio | | | 1,510,911 | |
Total | | $ | 43,693,398 | |
| |
| Class A Shares | | | | |
Net Assets | | $ | 28,997,925 | |
Shares Outstanding | | | 3,425,491 | |
Net Asset Value and Redemption Price Per Share | | | | |
(net assets ÷ shares of beneficial interest outstanding) | | $ | 8.47 | |
Maximum Offering Price Per Share | | | | |
(100 ÷ 94.25 of net asset value per share) | | $ | 8.99 | |
| |
| Class B Shares | | | | |
Net Assets | | $ | 1,288,066 | |
Shares Outstanding | | | 157,939 | |
Net Asset Value and Offering Price Per Share* | | | | |
(net assets ÷ shares of beneficial interest outstanding) | | $ | 8.16 | |
| |
| Class C Shares | | | | |
Net Assets | | $ | 11,488,304 | |
Shares Outstanding | | | 1,433,439 | |
Net Asset Value and Offering Price Per Share* | | | | |
(net assets ÷ shares of beneficial interest outstanding) | | $ | 8.01 | |
| |
| Class I Shares | | | | |
Net Assets | | $ | 1,919,103 | |
Shares Outstanding | | | 226,776 | |
Net Asset Value, Offering Price and Redemption Price Per Share | | | | |
(net assets ÷ shares of beneficial interest outstanding) | | $ | 8.46 | |
| On | sales of $50,000 or more, the offering price of Class A shares is reduced. |
| * | Redemption price per share is equal to the net asset value less any applicable contingent deferred sales charge. |
| | | | |
| | 7 | | See Notes to Financial Statements. |
Eaton Vance
Tax-Managed International Equity Fund
October 31, 2012
Statement of Operations
| | | | |
| Investment Income | | Year Ended
October 31, 2012 | |
Dividends allocated from Portfolio (net of foreign taxes, $166,412) | | $ | 1,722,739 | |
Interest allocated from Portfolio | | | 1,019 | |
Miscellaneous income | | | 54,052 | |
Expenses allocated from Portfolio | | | (489,770 | ) |
Total investment income | | $ | 1,288,040 | |
| |
| Expenses | | | | |
Distribution and service fees | | | | |
Class A | | $ | 78,066 | |
Class B | | | 15,664 | |
Class C | | | 128,207 | |
Trustees’ fees and expenses | | | 500 | |
Custodian fee | | | 16,692 | |
Transfer and dividend disbursing agent fees | | | 98,705 | |
Legal and accounting services | | | 28,627 | |
Printing and postage | | | 62,971 | |
Registration fees | | | 51,106 | |
Miscellaneous | | | 13,027 | |
Total expenses | | $ | 493,565 | |
| |
Net investment income | | $ | 794,475 | |
| |
| Realized and Unrealized Gain (Loss) from Portfolio | | | | |
Net realized gain (loss) — | | | | |
Investment transactions | | $ | 683,116 | |
Foreign currency transactions | | | (30,933 | ) |
Net realized gain | | $ | 652,183 | |
Change in unrealized appreciation (depreciation) — | | | | |
Investments | | $ | 2,438,815 | |
Foreign currency | | | (21,857 | ) |
Net change in unrealized appreciation (depreciation) | | $ | 2,416,958 | |
| |
Net realized and unrealized gain | | $ | 3,069,141 | |
| |
Net increase in net assets from operations | | $ | 3,863,616 | |
| | | | |
| | 8 | | See Notes to Financial Statements. |
Eaton Vance
Tax-Managed International Equity Fund
October 31, 2012
Statements of Changes in Net Assets
| | | | | | | | |
| | | Year Ended October 31, | |
| Increase (Decrease) in Net Assets | | 2012 | | | 2011 | |
From operations — | | | | | | | | |
Net investment income | | $ | 794,475 | | | $ | 590,675 | |
Net realized gain (loss) from investment and foreign currency transactions | | | 652,183 | | | | (2,375,863 | ) |
Net change in unrealized appreciation (depreciation) from investments and foreign currency | | | 2,416,958 | | | | (4,129,021 | ) |
Net increase (decrease) in net assets from operations | | $ | 3,863,616 | | | $ | (5,914,209 | ) |
Distributions to shareholders — | | | | | | | | |
From net investment income | | | | | | | | |
Class A | | $ | (491,956 | ) | | $ | (930,902 | ) |
Class B | | | (9,103 | ) | | | (27,883 | ) |
Class C | | | (92,300 | ) | | | (201,093 | ) |
Class I | | | (35,627 | ) | | | (10,987 | ) |
Total distributions to shareholders | | $ | (628,986 | ) | | $ | (1,170,865 | ) |
Transactions in shares of beneficial interest — | | | | | | | | |
Proceeds from sale of shares | | | | | | | | |
Class A | | $ | 1,631,116 | | | $ | 6,153,293 | |
Class B | | | 8,566 | | | | 98,247 | |
Class C | | | 764,122 | | | | 955,608 | |
Class I | | | 967,221 | | | | 2,508,016 | |
Net asset value of shares issued to shareholders in payment of distributions declared | | | | | | | | |
Class A | | | 451,687 | | | | 793,055 | |
Class B | | | 8,111 | | | | 24,457 | |
Class C | | | 79,533 | | | | 165,091 | |
Class I | | | 29,822 | | | | 3,767 | |
Cost of shares redeemed | | | | | | | | |
Class A | | | (11,982,861 | ) | | | (40,265,619 | ) |
Class B | | | (446,894 | ) | | | (570,640 | ) |
Class C | | | (4,260,595 | ) | | | (5,669,562 | ) |
Class I | | | (1,237,666 | ) | | | (692,191 | ) |
Net asset value of shares exchanged | | | | | | | | |
Class A | | | 407,344 | | | | 586,653 | |
Class B | | | (407,344 | ) | | | (586,653 | ) |
Redemption fees | | | — | | | | 970 | |
Net decrease in net assets from Fund share transactions | | $ | (13,987,838 | ) | | $ | (36,495,508 | ) |
| | |
Net decrease in net assets | | $ | (10,753,208 | ) | | $ | (43,580,582 | ) |
| | |
| Net Assets | | | | | | | | |
At beginning of year | | $ | 54,446,606 | | | $ | 98,027,188 | |
At end of year | | $ | 43,693,398 | | | $ | 54,446,606 | |
| | |
Accumulated undistributed net investment income
included in net assets | | | | | | | | |
At end of year | | $ | 794,441 | | | $ | 506,793 | |
| | | | |
| | 9 | | See Notes to Financial Statements. |
Eaton Vance
Tax-Managed International Equity Fund
October 31, 2012
Financial Highlights
| | | | | | | | | | | | | | | | | | | | |
| | | Class A | |
| | | Year Ended October 31, | |
| | | 2012 | | | 2011 | | | 2010 | | | 2009 | | | 2008 | |
Net asset value — Beginning of year | | $ | 7.870 | | | $ | 8.870 | | | $ | 8.600 | | | $ | 7.530 | | | $ | 14.970 | |
| | | | | |
| Income (Loss) From Operations | | | | | | | | | | | | | | | | | | | | |
Net investment income(1) | | $ | 0.150 | | | $ | 0.091 | | | $ | 0.080 | | | $ | 0.121 | | | $ | 0.205 | |
Net realized and unrealized gain (loss) | | | 0.567 | | | | (0.936 | ) | | | 0.340 | | | | 1.078 | | | | (7.470 | ) |
| | | | | |
Total income (loss) from operations | | $ | 0.717 | | | $ | (0.845 | ) | | $ | 0.420 | | | $ | 1.199 | | | $ | (7.265 | ) |
| | | | | |
| Less Distributions | | | | | | | | | | | | | | | | | | | | |
From net investment income | | $ | (0.117 | ) | | $ | (0.155 | ) | | $ | (0.151 | ) | | $ | (0.129 | ) | | $ | (0.176 | ) |
| | | | | |
Total distributions | | $ | (0.117 | ) | | $ | (0.155 | ) | | $ | (0.151 | ) | | $ | (0.129 | ) | | $ | (0.176 | ) |
| | | | | |
Redemption fees(1) | | $ | — | | | $ | 0.000 | (2) | | $ | 0.001 | | | $ | 0.000 | (2) | | $ | 0.001 | |
| | | | | |
Net asset value — End of year | | $ | 8.470 | | | $ | 7.870 | | | $ | 8.870 | | | $ | 8.600 | | | $ | 7.530 | |
| | | | | |
Total Return(3) | | | 9.34 | % | | | (9.74 | )% | | | 4.89 | % | | | 16.22 | % | | | (49.06 | )% |
| | | | | |
| Ratios/Supplemental Data | | | | | | | | | | | | | | | | | | | | |
Net assets, end of year (000’s omitted) | | $ | 28,998 | | | $ | 36,350 | | | $ | 73,731 | | | $ | 76,284 | | | $ | 92,173 | |
Ratios (as a percentage of average daily net assets): | | | | | | | | | | | | | | | | | | | | |
Expenses(4)(5) | | | 1.86 | % | | | 1.77 | % | | | 1.68 | % | | | 1.73 | %(6) | | | 1.54 | % |
Net investment income | | | 1.89 | % | | | 1.02 | % | | | 0.95 | % | | | 1.67 | % | | | 1.67 | % |
Portfolio Turnover of the Portfolio | | | 117 | % | | | 41 | % | | | 72 | % | | | 57 | % | | | 34 | % |
| (1) | Computed using average shares outstanding. |
| (2) | Amount is less than $0.0005. |
| (3) | Returns are historical and are calculated by determining the percentage change in net asset value with all distributions reinvested and do not reflect the effect of sales charges. |
| (4) | Includes the Fund’s share of the Portfolio’s allocated expenses. |
| (5) | Excludes the effect of custody fee credits, if any, of less than 0.005%. |
| (6) | The investment adviser of the Portfolio waived a portion of its investment adviser fee (equal to less than 0.005% of average daily net assets for the year ended October 31, 2009). All of the waiver was borne by the sub-adviser of the Portfolio. |
| | | | |
| | 10 | | See Notes to Financial Statements. |
Eaton Vance
Tax-Managed International Equity Fund
October 31, 2012
Financial Highlights — continued
| | | | | | | | | | | | | | | | | | | | |
| | | Class B | |
| | | Year Ended October 31, | |
| | | 2012 | | | 2011 | | | 2010 | | | 2009 | | | 2008 | |
Net asset value — Beginning of year | | $ | 7.560 | | | $ | 8.510 | | | $ | 8.250 | | | $ | 7.140 | | | $ | 14.200 | |
| | | | | |
| Income (Loss) From Operations | | | | | | | | | | | | | | | | | | | | |
Net investment income(1) | | $ | 0.083 | | | $ | 0.024 | | | $ | 0.017 | | | $ | 0.066 | | | $ | 0.098 | |
Net realized and unrealized gain (loss) | | | 0.554 | | | | (0.898 | ) | | | 0.315 | | | | 1.044 | | | | (7.094 | ) |
| | | | | |
Total income (loss) from operations | | $ | 0.637 | | | $ | (0.874 | ) | | $ | 0.332 | | | $ | 1.110 | | | $ | (6.996 | ) |
| | | | | |
| Less Distributions | | | | | | | | | | | | | | | | | | | | |
From net investment income | | $ | (0.037 | ) | | $ | (0.076 | ) | | $ | (0.073 | ) | | $ | — | | | $ | (0.065 | ) |
| | | | | |
Total distributions | | $ | (0.037 | ) | | $ | (0.076 | ) | | $ | (0.073 | ) | | $ | — | | | $ | (0.065 | ) |
| | | | | |
Redemption fees(1) | | $ | — | | | $ | 0.000 | (2) | | $ | 0.001 | | | $ | 0.000 | (2) | | $ | 0.001 | |
| | | | | |
Net asset value — End of year | | $ | 8.160 | | | $ | 7.560 | | | $ | 8.510 | | | $ | 8.250 | | | $ | 7.140 | |
| | | | | |
Total Return(3) | | | 8.50 | % | | | (10.39 | )% | | | 4.15 | % | | | 15.41 | % | | | (49.47 | )% |
| | | | | |
| Ratios/Supplemental Data | | | | | | | | | | | | | | | | | | | | |
Net assets, end of year (000’s omitted) | | $ | 1,288 | | | $ | 2,019 | | | $ | 3,319 | | | $ | 5,775 | | | $ | 9,717 | |
Ratios (as a percentage of average daily net assets): | | | | | | | | | | | | | | | | | | | | |
Expenses(4)(5) | | | 2.60 | % | | | 2.53 | % | | | 2.43 | % | | | 2.49 | %(6) | | | 2.29 | % |
Net investment income | | | 1.08 | % | | | 0.29 | % | | | 0.21 | % | | | 0.95 | % | | | 0.82 | % |
Portfolio Turnover of the Portfolio | | | 117 | % | | | 41 | % | | | 72 | % | | | 57 | % | | | 34 | % |
| (1) | Computed using average shares outstanding. |
| (2) | Amount is less than $0.0005. |
| (3) | Returns are historical and are calculated by determining the percentage change in net asset value with all distributions reinvested and do not reflect the effect of sales charges. |
| (4) | Includes the Fund’s share of the Portfolio’s allocated expenses. |
| (5) | Excludes the effect of custody fee credits, if any, of less than 0.005%. |
| (6) | The investment adviser of the Portfolio waived a portion of its investment adviser fee (equal to less than 0.005% of average daily net assets for the year ended October 31, 2009). All of the waiver was borne by the sub-adviser of the Portfolio. |
| | | | |
| | 11 | | See Notes to Financial Statements. |
Eaton Vance
Tax-Managed International Equity Fund
October 31, 2012
Financial Highlights — continued
| | | | | | | | | | | | | | | | | | | | |
| | | Class C | |
| | | Year Ended October 31, | |
| | | 2012 | | | 2011 | | | 2010 | | | 2009 | | | 2008 | |
Net asset value — Beginning of year | | $ | 7.440 | | | $ | 8.390 | | | $ | 8.150 | | | $ | 7.100 | | | $ | 14.150 | |
| | | | | |
| Income (Loss) From Operations | | | | | | | | | | | | | | | | | | | | |
Net investment income(1) | | $ | 0.087 | | | $ | 0.025 | | | $ | 0.017 | | | $ | 0.063 | | | $ | 0.105 | |
Net realized and unrealized gain (loss) | | | 0.534 | | | | (0.886 | ) | | | 0.314 | | | | 1.024 | | | | (7.060 | ) |
| | | | | |
Total income (loss) from operations | | $ | 0.621 | | | $ | (0.861 | ) | | $ | 0.331 | | | $ | 1.087 | | | $ | (6.955 | ) |
| | | | | |
| Less Distributions | | | | | | | | | | | | | | | | | | | | |
From net investment income | | $ | (0.051 | ) | | $ | (0.089 | ) | | $ | (0.092 | ) | | $ | (0.037 | ) | | $ | (0.096 | ) |
| | | | | |
Total distributions | | $ | (0.051 | ) | | $ | (0.089 | ) | | $ | (0.092 | ) | | $ | (0.037 | ) | | $ | (0.096 | ) |
| | | | | |
Redemption fees(1) | | $ | — | | | $ | 0.000 | (2) | | $ | 0.001 | | | $ | 0.000 | (2) | | $ | 0.001 | |
| | | | | |
Net asset value — End of year | | $ | 8.010 | | | $ | 7.440 | | | $ | 8.390 | | | $ | 8.150 | | | $ | 7.100 | |
| | | | | |
Total Return(3) | | | 8.44 | % | | | (10.40 | )% | | | 4.07 | % | | | 15.40 | % | | | (49.46 | )% |
| | | | | |
| Ratios/Supplemental Data | | | | | | | | | | | | | | | | | | | | |
Net assets, end of year (000’s omitted) | | $ | 11,488 | | | $ | 14,022 | | | $ | 20,359 | | | $ | 25,599 | | | $ | 29,444 | |
Ratios (as a percentage of average daily net assets): | | | | | | | | | | | | | | | | | | | | |
Expenses(4)(5) | | | 2.61 | % | | | 2.53 | % | | | 2.43 | % | | | 2.48 | %(6) | | | 2.29 | % |
Net investment income | | | 1.16 | % | | | 0.29 | % | | | 0.21 | % | | | 0.91 | % | | | 0.90 | % |
Portfolio Turnover of the Portfolio | | | 117 | % | | | 41 | % | | | 72 | % | | | 57 | % | | | 34 | % |
| (1) | Computed using average shares outstanding. |
| (2) | Amount is less than $0.0005. |
| (3) | Returns are historical and are calculated by determining the percentage change in net asset value with all distributions reinvested and do not reflect the effect of sales charges. |
| (4) | Includes the Fund’s share of the Portfolio’s allocated expenses. |
| (5) | Excludes the effect of custody fee credits, if any, of less than 0.005%. |
| (6) | The investment adviser of the Portfolio waived a portion of its investment adviser fee (equal to less than 0.005% of average daily net assets for the year ended October 31, 2009). All of the waiver was borne by the sub-adviser of the Portfolio. |
| | | | |
| | 12 | | See Notes to Financial Statements. |
Eaton Vance
Tax-Managed International Equity Fund
October 31, 2012
Financial Highlights — continued
| | | | | | | | | | | | | | | | | | | | |
| | | Class I | |
| | | Year Ended October 31, | | | Period Ended
October 31, 2008(1) | |
| | | 2012 | | | 2011 | | | 2010 | | | 2009 | | |
Net asset value — Beginning of period | | $ | 7.880 | | | $ | 8.870 | | | $ | 8.600 | | | $ | 7.530 | | | $ | 11.490 | |
| | | | | |
| Income (Loss) From Operations | | | | | | | | | | | | | | | | | | | | |
Net investment income(2) | | $ | 0.172 | | | $ | 0.115 | | | $ | 0.077 | | | $ | 0.157 | | | $ | 0.003 | |
Net realized and unrealized gain (loss) | | | 0.552 | | | | (0.920 | ) | | | 0.363 | | | | 1.072 | | | | (3.963 | ) |
| | | | | |
Total income (loss) from operations | | $ | 0.724 | | | $ | (0.805 | ) | | $ | 0.440 | | | $ | 1.229 | | | $ | (3.960 | ) |
| | | | | |
| Less Distributions | | | | | | | | | | | | | | | | | | | | |
From net investment income | | $ | (0.144 | ) | | $ | (0.185 | ) | | $ | (0.171 | ) | | $ | (0.159 | ) | | $ | — | |
| | | | | |
Total distributions | | $ | (0.144 | ) | | $ | (0.185 | ) | | $ | (0.171 | ) | | $ | (0.159 | ) | | $ | — | |
| | | | | |
Redemption fees(2) | | $ | — | | | $ | 0.000 | (3) | | $ | 0.001 | | | $ | 0.000 | (3) | | $ | 0.000 | (3) |
| | | | | |
Net asset value — End of period | | $ | 8.460 | | | $ | 7.880 | | | $ | 8.870 | | | $ | 8.600 | | | $ | 7.530 | |
| | | | | |
Total Return(4) | | | 9.46 | % | | | (9.33 | )% | | | 5.13 | % | | | 16.69 | % | | | (34.46 | )%(5) |
| | | | | |
| Ratios/Supplemental Data | | | | | | | | | | | | | | | | | | | | |
Net assets, end of period (000’s omitted) | | $ | 1,919 | | | $ | 2,055 | | | $ | 618 | | | $ | 1,253 | | | $ | 101 | |
Ratios (as a percentage of average daily net assets): | | | | | | | | | | | | | | | | | | | | |
Expenses(6)(7) | | | 1.61 | % | | | 1.52 | % | | | 1.43 | % | | | 1.48 | %(9) | | | 1.23 | %(8) |
Net investment income | | | 2.16 | % | | | 1.33 | % | | | 0.94 | % | | | 2.11 | % | | | 0.25 | %(8) |
Portfolio Turnover of the Portfolio | | | 117 | % | | | 41 | % | | | 72 | % | | | 57 | % | | | 34 | %(10) |
| | (1) | For the period from the start of business, September 2, 2008, to October 31, 2008. |
| | (2) | Computed using average shares outstanding. |
| | (3) | Amount is less than $0.0005. |
| | (4) | Returns are historical and are calculated by determining the percentage change in net asset value with all distributions reinvested. |
| | (6) | Includes the Fund’s share of the Portfolio’s allocated expenses. |
| | (7) | Excludes the effect of custody fee credits, if any, of less than 0.005%. |
| | (9) | The investment adviser of the Portfolio waived a portion of its investment adviser fee (equal to less than 0.005% of average daily net assets for the year ended October 31, 2009). All of the waiver was borne by the sub-adviser of the Portfolio. |
| (10) | For the Portfolio’s year ended October 31, 2008. |
| | | | |
| | 13 | | See Notes to Financial Statements. |
Eaton Vance
Tax-Managed International Equity Fund
October 31, 2012
Notes to Financial Statements
1 Significant Accounting Policies
Eaton Vance Tax-Managed International Equity Fund (the Fund) is a diversified series of Eaton Vance Mutual Funds Trust (the Trust). The Trust is a Massachusetts business trust registered under the Investment Company Act of 1940, as amended (the 1940 Act), as an open-end management investment company. The Fund offers four classes of shares. Class A shares are generally sold subject to a sales charge imposed at time of purchase. Class B and Class C shares are sold at net asset value and are generally subject to a contingent deferred sales charge (see Note 5). Class I shares are sold at net asset value and are not subject to a sales charge. Class B shares automatically convert to Class A shares eight years after their purchase as described in the Fund’s prospectus. Beginning January 1, 2012, Class B shares are only available for purchase upon exchange from another Eaton Vance fund or through reinvestment of distributions. Each class represents a pro-rata interest in the Fund, but votes separately on class-specific matters and (as noted below) is subject to different expenses. Realized and unrealized gains and losses and net investment income and losses, other than class-specific expenses, are allocated daily to each class of shares based on the relative net assets of each class to the total net assets of the Fund. Each class of shares differs in its distribution plan and certain other class-specific expenses. The Fund invests all of its investable assets in interests in Tax-Managed International Equity Portfolio (the Portfolio), a Massachusetts business trust, having the same investment objective and policies as the Fund. The value of the Fund’s investment in the Portfolio reflects the Fund’s proportionate interest in the net assets of the Portfolio (42.5% at October 31, 2012). The performance of the Fund is directly affected by the performance of the Portfolio. The financial statements of the Portfolio, including the portfolio of investments, are included elsewhere in this report and should be read in conjunction with the Fund’s financial statements.
The following is a summary of significant accounting policies of the Fund. The policies are in conformity with accounting principles generally accepted in the United States of America.
A Investment Valuation — Valuation of securities by the Portfolio is discussed in Note 1A of the Portfolio’s Notes to Financial Statements, which are included elsewhere in this report.
B Income — The Fund’s net investment income or loss consists of the Fund’s pro-rata share of the net investment income or loss of the Portfolio and other income, less all actual and accrued expenses of the Fund.
C Federal Taxes — The Fund’s policy is to comply with the provisions of the Internal Revenue Code applicable to regulated investment companies and to distribute to shareholders each year substantially all of its net investment income, and all or substantially all of its net realized capital gains. Accordingly, no provision for federal income or excise tax is necessary. At October 31, 2012, the Fund, for federal income tax purposes, had a capital loss carryforward of $51,153,850 which will reduce its taxable income arising from future net realized gains on investment transactions, if any, to the extent permitted by the Internal Revenue Code, and thus will reduce the amount of distributions to shareholders, which would otherwise be necessary to relieve the Fund of any liability for federal income or excise tax. The capital loss carryforward will expire on October 31, 2016 ($11,851,312), October 31, 2017 ($36,830,557) and October 31, 2019 ($2,471,981). In addition, such capital loss carryforward cannot be utilized prior to the utilization of new capital losses, if any, created after October 31, 2012.
During the year ended October 31, 2012, a capital loss carryforward of $718,288 was utilized to offset net realized gains by the Fund.
As of October 31, 2012, the Fund had no uncertain tax positions that would require financial statement recognition, de-recognition, or disclosure. The Fund files a U.S. federal income tax return annually after its fiscal year-end, which is subject to examination by the Internal Revenue Service for a period of three years from the date of filing.
D Expenses — The majority of expenses of the Trust are directly identifiable to an individual fund. Expenses which are not readily identifiable to a specific fund are allocated taking into consideration, among other things, the nature and type of expense and the relative size of the funds.
E Expense Reduction — State Street Bank and Trust Company (SSBT) serves as custodian of the Fund. Pursuant to the custodian agreement, SSBT receives a fee reduced by credits, which are determined based on the average daily cash balance the Fund maintains with SSBT. All credit balances, if any, used to reduce the Fund’s custodian fees are reported as a reduction of expenses in the Statement of Operations.
F Use of Estimates — The preparation of the financial statements in conformity with accounting principles generally accepted in the United States of America requires management to make estimates and assumptions that affect the reported amounts of assets and liabilities at the date of the financial statements and the reported amounts of income and expense during the reporting period. Actual results could differ from those estimates.
G Indemnifications — Under the Trust’s organizational documents, its officers and Trustees may be indemnified against certain liabilities and expenses arising out of the performance of their duties to the Fund. Under Massachusetts law, if certain conditions prevail, shareholders of a Massachusetts business trust (such as the Trust) could be deemed to have personal liability for the obligations of the Trust. However, the Trust’s Declaration of Trust contains an express disclaimer of liability on the part of Fund shareholders and the By-laws provide that the Trust shall assume the defense on behalf of any Fund shareholders. Moreover, the By-laws also provide for indemnification out of Fund property of any shareholder held personally liable solely by reason of being or having been a shareholder for all loss or expense arising from such liability. Additionally, in the normal course of business, the Fund enters into agreements with service providers that may contain indemnification clauses. The Fund’s maximum exposure under these arrangements is unknown as this would involve future claims that may be made against the Fund that have not yet occurred.
H Redemption Fees — Prior to January 1, 2011 and upon the redemption or exchange of shares by Class A and Class I shareholders within 90 days of the settlement of purchase, a fee of 1% of the current net asset value of these shares was assessed and retained by the Fund for the benefit of the
Eaton Vance
Tax-Managed International Equity Fund
October 31, 2012
Notes to Financial Statements — continued
remaining shareholders. The redemption fee was accounted for as an addition to paid-in capital. Effective January 1, 2011, Class A and Class I shares are no longer subject to a redemption fee.
I Other — Investment transactions are accounted for on a trade date basis. Dividends to shareholders are recorded on the ex-dividend date.
2 Distributions to Shareholders
It is the present policy of the Fund to make at least one distribution annually (normally in December) of all or substantially all of its net investment income and to distribute annually all or substantially all of its net realized capital gains (reduced by available capital loss carryforwards from prior years, if any). Distributions are declared separately for each class of shares. Shareholders may reinvest income and capital gain distributions in additional shares of the same class of the Fund at the net asset value as of the ex-dividend date or, at the election of the shareholder, receive distributions in cash. The Fund distinguishes between distributions on a tax basis and a financial reporting basis. Accounting principles generally accepted in the United States of America require that only distributions in excess of tax basis earnings and profits be reported in the financial statements as a return of capital. Permanent differences between book and tax accounting relating to distributions are reclassified to paid-in capital. For tax purposes, distributions from short-term capital gains are considered to be from ordinary income.
The tax character of distributions declared for the years ended October 31, 2012 and October 31, 2011 was as follows:
| | | | | | | | |
| | | Year Ended October 31, | |
| | | 2012 | | | 2011 | |
| | |
Distributions declared from: | | | | | | | | |
Ordinary income | | $ | 628,986 | | | $ | 1,170,865 | |
During the year ended October 31, 2012, accumulated net realized loss was increased by $122,159 and accumulated undistributed net investment income was increased by $122,159 due to differences between book and tax accounting, primarily for foreign currency gain (loss) and investments in passive foreign investment companies (PFICs). These reclassifications had no effect on the net assets or net asset value per share of the Fund.
As of October 31, 2012, the components of distributable earnings (accumulated losses) and unrealized appreciation (depreciation) on a tax basis were as follows:
| | | | |
Undistributed ordinary income | | $ | 937,853 | |
Capital loss carryforward | | $ | (51,153,850 | ) |
Net unrealized depreciation | | $ | (507,773 | ) |
The differences between components of distributable earnings (accumulated losses) on a tax basis and the amounts reflected in the Statement of Assets and Liabilities are primarily due to wash sales, partnership allocations and investments in PFICs.
3 Transactions with Affiliates
Eaton Vance Management (EVM) serves as the administrator to the Fund, but receives no compensation. The Portfolio has engaged Boston Management and Research (BMR), a subsidiary of EVM, to render investment advisory services. See Note 2 of the Portfolio’s Notes to Financial Statements which are included elsewhere in this report. EVM serves as the sub-transfer agent of the Fund and receives from the transfer agent an aggregate fee based upon the actual expenses incurred by EVM in the performance of these services. For the year ended October 31, 2012, EVM earned $8,917 in sub-transfer agent fees. The Fund was informed that Eaton Vance Distributors, Inc. (EVD), an affiliate of EVM and the Fund’s principal underwriter, received $1,454 as its portion of the sales charge on sales of Class A shares for the year ended October 31, 2012. EVD also received distribution and service fees from Class A, Class B and Class C shares (see Note 4) and contingent deferred sales charges (see Note 5).
Trustees and officers of the Fund who are members of EVM’s or BMR’s organizations receive remuneration for their services to the Fund out of the investment adviser fee. Certain officers and Trustees of the Fund and the Portfolio are officers of the above organizations.
4 Distribution Plans
The Fund has in effect a distribution plan for Class A shares (Class A Plan) pursuant to Rule 12b-1 under the 1940 Act. Pursuant to the Class A Plan, the Fund pays EVD a distribution and service fee of 0.25% per annum of its average daily net assets attributable to Class A shares for distribution services and facilities provided to the Fund by EVD, as well as for personal services and/or the maintenance of shareholder accounts. Distribution and service fees paid or accrued to EVD for the year ended October 31, 2012 amounted to $78,066 for Class A shares. The Fund also has in effect distribution plans for Class B shares (Class B Plan) and Class C shares (Class C Plan) pursuant to Rule 12b-1 under the 1940 Act. Pursuant to the Class B and Class C Plans,
Eaton Vance
Tax-Managed International Equity Fund
October 31, 2012
Notes to Financial Statements — continued
the Fund pays EVD amounts equal to 0.75% per annum of its average daily net assets attributable to Class B and Class C shares for providing ongoing distribution services and facilities to the Fund. The Fund will automatically discontinue payments to EVD during any period in which there are no outstanding Uncovered Distribution Charges, which are equivalent to the sum of (i) 5% and 6.25% of the aggregate amount received by the Fund for Class B and Class C shares sold, respectively, plus (ii) interest calculated by applying the rate of 1% over the prevailing prime rate to the outstanding balance of Uncovered Distribution Charges of EVD of each respective class, reduced by the aggregate amount of contingent deferred sales charges (see Note 5) and amounts theretofore paid or payable to EVD by each respective class. For the year ended October 31, 2012, the Fund paid or accrued to EVD $11,748 and $96,155 for Class B and Class C shares, respectively, representing 0.75% of the average daily net assets of Class B and Class C shares. At October 31, 2012, the amounts of Uncovered Distribution Charges of EVD calculated under the Class B and Class C Plans were approximately $4,560,000 and $11,108,000, respectively.
Pursuant to the Class B and Class C Plans, the Fund also makes payments of service fees to EVD, financial intermediaries and other persons in amounts equal to 0.25% per annum of its average daily net assets attributable to that class. Service fees paid or accrued are for personal services and/or the maintenance of shareholder accounts. They are separate and distinct from the sales commissions and distribution fees payable to EVD and, as such, are not subject to automatic discontinuance when there are no outstanding Uncovered Distribution Charges of EVD. Service fees paid or accrued for the year ended October 31, 2012 amounted to $3,916 and $32,052 for Class B and Class C shares, respectively.
5 Contingent Deferred Sales Charges
A contingent deferred sales charge (CDSC) generally is imposed on redemptions of Class B shares made within six years of purchase and on redemptions of Class C shares made within one year of purchase. Class A shares may be subject to a 1% CDSC if redeemed within 18 months of purchase (depending on the circumstances of purchase). Generally, the CDSC is based upon the lower of the net asset value at date of redemption or date of purchase. No charge is levied on shares acquired by reinvestment of dividends or capital gain distributions. The CDSC for Class B shares is imposed at declining rates that begin at 5% in the case of redemptions in the first and second year after purchase, declining one percentage point each subsequent year. Class C shares are subject to a 1% CDSC if redeemed within one year of purchase. No CDSC is levied on shares which have been sold to EVM or its affiliates or to their respective employees or clients and may be waived under certain other limited conditions. CDSCs received on Class B and Class C redemptions are paid to EVD to reduce the amount of Uncovered Distribution Charges calculated under the Fund’s Class B and Class C Plans. CDSCs received on Class B and Class C redemptions when no Uncovered Distribution Charges exist are credited to the Fund. For the year ended October 31, 2012, the Fund was informed that EVD received approximately $200, $3,000 and $200 of CDSCs paid by Class A, Class B and Class C shareholders, respectively.
6 Investment Transactions
For the year ended October 31, 2012, increases and decreases in the Fund’s investment in the Portfolio aggregated $971,073 and $16,168,834, respectively.
7 Shares of Beneficial Interest
The Fund’s Declaration of Trust permits the Trustees to issue an unlimited number of full and fractional shares of beneficial interest (without par value). Such shares may be issued in a number of different series (such as the Fund) and classes. Transactions in Fund shares were as follows:
| | | | | | | | |
| | | Year Ended October 31, | |
| Class A | | 2012 | | | 2011 | |
| | |
Sales | | | 201,838 | | | | 681,623 | |
Issued to shareholders electing to receive payments of distributions in Fund shares | | | 61,287 | | | | 88,116 | |
Redemptions | | | (1,508,791 | ) | | | (4,534,211 | ) |
Exchange from Class B shares | | | 51,663 | | | | 67,548 | |
| | |
Net decrease | | | (1,194,003 | ) | | | (3,696,924 | ) |
| | |
| | | | | | | | |
Eaton Vance
Tax-Managed International Equity Fund
October 31, 2012
Notes to Financial Statements — continued
| | | | | | | | |
| | | Year Ended October 31, | |
| Class B | | 2012 | | | 2011 | |
| | |
Sales | | | 1,168 | | | | 11,289 | |
Issued to shareholders electing to receive payments of distributions in Fund shares | | | 1,134 | | | | 2,814 | |
Redemptions | | | (58,033 | ) | | | (66,977 | ) |
Exchange to Class A shares | | | (53,498 | ) | | | (70,197 | ) |
| | |
Net decrease | | | (109,229 | ) | | | (123,071 | ) |
| | |
| | | | | | | | |
| | | Year Ended October 31, | |
| Class C | | 2012 | | | 2011 | |
| | |
Sales | | | 99,619 | | | | 111,126 | |
Issued to shareholders electing to receive payments of distributions in Fund shares | | | 11,329 | | | | 19,286 | |
Redemptions | | | (561,580 | ) | | | (672,865 | ) |
| | |
Net decrease | | | (450,632 | ) | | | (542,453 | ) |
| | |
| | | | | | | | |
| | | Year Ended October 31, | |
| Class I | | 2012 | | | 2011 | |
| | |
Sales | | | 120,894 | | | | 268,181 | |
Issued to shareholders electing to receive payments of distributions in Fund shares | | | 4,058 | | | | 419 | |
Redemptions | | | (159,158 | ) | | | (77,266 | ) |
| | |
Net increase (decrease) | | | (34,206 | ) | | | 191,334 | |
For the year ended October 31, 2011, the Fund received $970 in redemption fees.
8. Subsequent Event
Effective December 1, 2012, EVM and Parametric have agreed to reimburse the Fund’s expenses to the extent that total annual operating expenses (relating to ordinary operating expenses only) exceed 1.50%, 2.25%, 2.25% and 1.25% of the Fund’s average daily net assets for Class A, Class B, Class C and Class I, respectively. This agreement may be changed or terminated after February 28, 2014.
Eaton Vance
Tax-Managed International Equity Fund
October 31, 2012
Report of Independent Registered Public Accounting Firm
To the Trustees of Eaton Vance Mutual Funds Trust and the Shareholders of Eaton Vance Tax-Managed International Equity Fund:
We have audited the accompanying statement of assets and liabilities of Eaton Vance Tax-Managed International Equity Fund (the “Fund”) (one of the funds constituting Eaton Vance Mutual Funds Trust) as of October 31, 2012, and the related statement of operations for the year then ended, the statements of changes in net assets for each of the two years in the period then ended, and the financial highlights for each of the five years in the period then ended. These financial statements and financial highlights are the responsibility of the Fund’s management. Our responsibility is to express an opinion on these financial statements and financial highlights based on our audits.
We conducted our audits in accordance with the standards of the Public Company Accounting Oversight Board (United States). Those standards require that we plan and perform the audit to obtain reasonable assurance about whether the financial statements and financial highlights are free of material misstatement. The Fund is not required to have, nor were we engaged to perform, an audit of its internal control over financial reporting. Our audits included consideration of internal control over financial reporting as a basis for designing audit procedures that are appropriate in the circumstances, but not for the purpose of expressing an opinion on the effectiveness of the Fund’s internal control over financial reporting. Accordingly, we express no such opinion. An audit also includes examining, on a test basis, evidence supporting the amounts and disclosures in the financial statements, assessing the accounting principles used and significant estimates made by management, as well as evaluating the overall financial statement presentation. We believe that our audits provide a reasonable basis for our opinion.
In our opinion, such financial statements and financial highlights referred to above present fairly, in all material respects, the financial position of Eaton Vance Tax-Managed International Equity Fund as of October 31, 2012, the results of its operations for the year then ended, the changes in its net assets for each of the two years in the period then ended, and the financial highlights for each of the five years in the period then ended, in conformity with accounting principles generally accepted in the United States of America.
DELOITTE & TOUCHE LLP
Boston, Massachusetts
December 18, 2012
Eaton Vance
Tax-Managed International Equity Fund
October 31, 2012
Federal Tax Information (Unaudited)
The Form 1099-DIV you receive in January 2013 will show the tax status of all distributions paid to your account in calendar year 2012. Shareholders are advised to consult their own tax adviser with respect to the tax consequences of their investment in the Fund. As required by the Internal Revenue Code and/or regulations, shareholders must be notified regarding the status of qualified dividend income for individuals and the foreign tax credit.
Qualified Dividend Income. The Fund designates $1,661,171 or up to the maximum amount of such dividends allowable pursuant to the Internal Revenue Code, as qualified dividend income eligible for the reduced tax rate of 15%.
Foreign Tax Credit. The Fund paid foreign taxes of $162,556 and recognized foreign source income of $1,888,872.
Tax-Managed International Equity Portfolio
October 31, 2012
Portfolio of Investments
| | | | | | | | |
| Common Stocks — 99.0% | |
| | |
| | | | | | | | |
| Security | | Shares | | | Value | |
| | | | | | | | |
|
Aerospace & Defense — 2.3% | |
BAE Systems PLC | | | 119,985 | | | $ | 605,594 | |
Elbit Systems, Ltd. | | | 4,016 | | | | 141,289 | |
European Aeronautic Defence and Space Co. NV | | | 12,580 | | | | 447,721 | |
Rolls-Royce Holdings PLC | | | 59,307 | | | | 819,586 | |
Rolls-Royce Holdings PLC, PFC Shares(1) | | | 4,507,332 | | | | 7,274 | |
Safran SA | | | 4,673 | | | | 186,143 | |
Singapore Technologies Engineering, Ltd. | | | 52,000 | | | | 149,660 | |
| | | | | | | | | |
| | | | | | $ | 2,357,267 | |
| | | | | | | | | |
|
Air Freight & Logistics — 0.3% | |
Deutsche Post AG | | | 13,649 | | | $ | 270,604 | |
Yamato Holdings Co., Ltd. | | | 3,200 | | | | 48,748 | |
| | | | | | | | | |
| | | | | | $ | 319,352 | |
| | | | | | | | | |
| | |
Airlines — 0.7% | | | | | | | | |
Cathay Pacific Airways, Ltd. | | | 89,000 | | | $ | 161,196 | |
Deutsche Lufthansa AG | | | 9,221 | | | | 141,073 | |
International Consolidated Airlines Group SA(1) | | | 17,117 | | | | 45,058 | |
Singapore Airlines, Ltd. | | | 47,000 | | | | 407,329 | |
| | | | | | | | | |
| | | | | | $ | 754,656 | |
| | | | | | | | | |
| | |
Auto Components — 1.3% | | | | | | | | |
Bridgestone Corp. | | | 2,300 | | | $ | 53,726 | |
Compagnie Generale des Etablissements Michelin, Class B | | | 3,717 | | | | 320,423 | |
Continental AG | | | 1,095 | | | | 110,212 | |
NGK Spark Plug Co., Ltd. | | | 9,000 | | | | 100,787 | |
Nokian Renkaat Oyj | | | 7,801 | | | | 324,886 | |
Pirelli & C. SpA | | | 30,451 | | | | 353,738 | |
Sumitomo Rubber Industries, Ltd. | | | 7,200 | | | | 84,882 | |
| | | | | | | | | |
| | | | | | $ | 1,348,654 | |
| | | | | | | | | |
| | |
Automobiles — 1.8% | | | | | | | | |
Bayerische Motoren Werke AG | | | 8,312 | | | $ | 664,511 | |
Daihatsu Motor Co., Ltd. | | | 20,000 | | | | 350,026 | |
Daimler AG | | | 6,322 | | | | 296,153 | |
Honda Motor Co., Ltd. | | | 7,000 | | | | 210,442 | |
Porsche Automobil Holding SE, PFC Shares | | | 819 | | | | 54,590 | |
Volkswagen AG, PFC Shares | | | 1,508 | | | | 313,099 | |
| | | | | | | | | |
| | | | | | $ | 1,888,821 | |
| | | | | | | | | |
| | | | | | | | |
| Security | | Shares | | | Value | |
| | | | | | | | |
| | |
Beverages — 2.5% | | | | | | | | |
Anheuser-Busch InBev NV | | | 16,899 | | | $ | 1,413,282 | |
Carlsberg A/S, Class B | | | 712 | | | | 61,459 | |
Coca-Cola Amatil, Ltd. | | | 14,713 | | | | 205,272 | |
Coca-Cola Hellenic Bottling Co. SA | | | 8,092 | | | | 173,307 | |
Diageo PLC | | | 4,632 | | | | 132,422 | |
Heineken Holding NV | | | 3,202 | | | | 162,686 | |
Heineken NV | | | 7,054 | | | | 435,322 | |
| | | | | | | | | |
| | | | | | $ | 2,583,750 | |
| | | | | | | | | |
| | |
Biotechnology — 0.7% | | | | | | | | |
Actelion, Ltd.(1) | | | 5,582 | | | $ | 269,429 | |
CSL, Ltd. | | | 5,507 | | | | 271,609 | |
Grifols SA(1) | | | 6,311 | | | | 219,186 | |
| | | | | | | | | |
| | | | | | $ | 760,224 | |
| | | | | | | | | |
| | |
Building Products — 0.0%(2) | | | | | | | | |
Geberit AG | | | 236 | | | $ | 48,745 | |
| | | | | | | | | |
| | | | | | $ | 48,745 | |
| | | | | | | | | |
| | |
Chemicals — 4.6% | | | | | | | | |
Air Liquide SA | | | 8,048 | | | $ | 950,082 | |
Air Water, Inc. | | | 4,000 | | | | 50,121 | |
Akzo Nobel NV | | | 10,515 | | | | 572,311 | |
Croda International PLC | | | 1,406 | | | | 50,060 | |
Givaudan SA(1) | | | 157 | | | | 157,045 | |
Israel Chemicals, Ltd. | | | 16,489 | | | | 206,288 | |
Israel Corp., Ltd. | | | 213 | | | | 144,749 | |
Kansai Paint Co., Ltd. | | | 18,000 | | | | 193,900 | |
Koninklijke DSM NV | | | 6,935 | | | | 356,625 | |
Linde AG | | | 3,838 | | | | 645,868 | |
Novozymes A/S, Class B | | | 20,149 | | | | 556,696 | |
Orica, Ltd. | | | 15,853 | | | | 412,951 | |
Solvay SA | | | 2,611 | | | | 314,370 | |
Yara International ASA | | | 1,858 | | | | 87,565 | |
| | | | | | | | | |
| | | | | | $ | 4,698,631 | |
| | | | | | | | | |
| | |
Commercial Banks — 10.7% | | | | | | | | |
Aozora Bank, Ltd. | | | 34,000 | | | $ | 95,881 | |
Australia and New Zealand Banking Group, Ltd. | | | 10,697 | | | | 282,200 | |
Bank Hapoalim B.M.(1) | | | 62,876 | | | | 247,360 | |
Bank Leumi Le-Israel B.M.(1) | | | 89,574 | | | | 288,720 | |
Bank of East Asia, Ltd. | | | 62,800 | | | | 231,596 | |
Bank of Kyoto, Ltd. (The) | | | 17,000 | | | | 146,119 | |
Bank of Yokohama, Ltd. (The) | | | 63,000 | | | | 289,929 | |
| | | | |
| | 20 | | See Notes to Financial Statements. |
Tax-Managed International Equity Portfolio
October 31, 2012
Portfolio of Investments — continued
| | | | | | | | |
| Security | | Shares | | | Value | |
| | | | | | | | |
| | |
Commercial Banks (continued) | | | | | | | | |
Bankia SA(1) | | | 12,698 | | | $ | 19,166 | |
BOC Hong Kong (Holdings), Ltd. | | | 144,000 | | | | 442,438 | |
CaixaBank SA | | | 50,803 | | | | 192,941 | |
Chiba Bank, Ltd. (The) | | | 34,000 | | | | 198,600 | |
Chugoku Bank, Ltd. (The) | | | 19,000 | | | | 261,487 | |
Commonwealth Bank of Australia | | | 14,132 | | | | 846,302 | |
Danske Bank A/S(1) | | | 3,080 | | | | 48,183 | |
DBS Group Holdings, Ltd. | | | 98,300 | | | | 1,116,337 | |
Gunma Bank, Ltd. (The) | | | 39,000 | | | | 188,152 | |
Hachijuni Bank, Ltd. (The) | | | 30,000 | | | | 154,974 | |
Hang Seng Bank, Ltd. | | | 54,700 | | | | 839,073 | |
Hiroshima Bank, Ltd. (The) | | | 36,000 | | | | 128,058 | |
Israel Discount Bank, Ltd., Series A(1) | | | 36,415 | | | | 51,369 | |
Iyo Bank, Ltd. (The) | | | 18,000 | | | | 139,172 | |
Joyo Bank, Ltd. (The) | | | 12,000 | | | | 58,074 | |
Mizrahi Tefahot Bank, Ltd.(1) | | | 15,499 | | | | 140,739 | |
Mizuho Financial Group, Inc. | | | 92,200 | | | | 144,263 | |
National Australia Bank, Ltd. | | | 10,650 | | | | 284,618 | |
Nishi-Nippon City Bank, Ltd. (The) | | | 47,000 | | | | 107,170 | |
Nordea Bank AB | | | 74,611 | | | | 678,188 | |
Oversea-Chinese Banking Corp., Ltd. | | | 108,000 | | | | 802,695 | |
Raiffeisen International Bank-Holding AG | | | 11,757 | | | | 470,935 | |
Seven Bank, Ltd. | | | 23,200 | | | | 66,329 | |
Shizuoka Bank, Ltd. (The) | | | 37,000 | | | | 378,435 | |
Skandinaviska Enskilda Banken AB, Class A | | | 37,554 | | | | 311,615 | |
Suruga Bank, Ltd. | | | 14,000 | | | | 168,126 | |
Swedbank AB, Class A | | | 11,599 | | | | 215,446 | |
United Overseas Bank, Ltd. | | | 33,000 | | | | 492,121 | |
Westpac Banking Corp. | | | 15,292 | | | | 404,289 | |
Wing Hang Bank, Ltd. | | | 10,500 | | | | 111,215 | |
| | | | | | | | | |
| | | | | | $ | 11,042,315 | |
| | | | | | | | | |
| | |
Commercial Services & Supplies — 0.5% | | | | | | | | |
Serco Group PLC | | | 28,822 | | | $ | 263,827 | |
Societe BIC SA | | | 2,060 | | | | 251,368 | |
| | | | | | | | | |
| | | | | | $ | 515,195 | |
| | | | | | | | | |
| | |
Communications Equipment — 0.4% | | | | | | | | |
Alcatel-Lucent(1) | | | 265,623 | | | $ | 271,595 | |
Nokia Oyj | | | 26,551 | | | | 71,382 | |
Telefonaktiebolaget LM Ericsson, Class B | | | 11,670 | | | | 103,385 | |
| | | | | | | | | |
| | | | | | $ | 446,362 | |
| | | | | | | | | |
| | | | | | | | |
| Security | | Shares | | | Value | |
| | | | | | | | |
| | |
Computers & Peripherals — 0.1% | | | | | | | | |
Gemalto NV | | | 562 | | | $ | 50,760 | |
| | | | | | | | | |
| | | | | | $ | 50,760 | |
| | | | | | | | | |
| | |
Construction & Engineering — 0.8% | | | | | | | | |
ACS Actividades de Construccion y Servicios SA | | | 5,068 | | | $ | 108,306 | |
Ferrovial SA | | | 28,385 | | | | 401,656 | |
Fomento de Construcciones y Contratas SA | | | 1,918 | | | | 25,128 | |
Skanska AB | | | 17,255 | | | | 270,301 | |
| | | | | | | | | |
| | | | | | $ | 805,391 | |
| | | | | | | | | |
| | |
Construction Materials — 0.6% | | | | | | | | |
CRH PLC | | | 17,461 | | | $ | 325,014 | |
Fletcher Building, Ltd. | | | 30,881 | | | | 178,614 | |
Imerys SA | | | 879 | | | | 49,450 | |
James Hardie Industries SE CDI | | | 5,348 | | | | 51,157 | |
| | | | | | | | | |
| | | | | | $ | 604,235 | |
| | | | | | | | | |
| | |
Containers & Packaging — 1.0% | | | | | | | | |
Amcor, Ltd. | | | 86,114 | | | $ | 705,472 | |
Rexam PLC | | | 47,083 | | | | 339,967 | |
| | | | | | | | | |
| | | | | | $ | 1,045,439 | |
| | | | | | | | | |
| | |
Diversified Consumer Services — 0.1% | | | | | | | | |
Benesse Holdings, Inc. | | | 1,100 | | | $ | 52,985 | |
| | | | | | | | | |
| | | | | | $ | 52,985 | |
| | | | | | | | | |
| | |
Diversified Financial Services — 0.9% | | | | | | | | |
Groupe Bruxelles Lambert SA | | | 7,642 | | | $ | 564,969 | |
Investor AB, Class B | | | 10,797 | | | | 238,335 | |
Pohjola Bank PLC, Class A | | | 8,056 | | | | 109,896 | |
| | | | | | | | | |
| | | | | | $ | 913,200 | |
| | | | | | | | | |
|
Diversified Telecommunication Services — 5.2% | |
Belgacom SA | | | 11,898 | | | $ | 347,851 | |
Bezeq Israeli Telecommunication Corp., Ltd. | | | 79,936 | | | | 97,385 | |
Chorus, Ltd. | | | 19,838 | | | | 55,108 | |
Deutsche Telekom AG | | | 13,301 | | | | 151,744 | |
Elisa Oyj | | | 13,791 | | | | 295,940 | |
France Telecom SA | | | 3,863 | | | | 43,179 | |
Iliad SA | | | 316 | | | | 48,693 | |
Koninklijke KPN NV | | | 71,881 | | | | 453,112 | |
Portugal Telecom SGPS SA | | | 20,164 | | | | 101,401 | |
Singapore Telecommunications, Ltd. | | | 244,000 | | | | 642,699 | |
Swisscom AG | | | 1,156 | | | | 481,198 | |
| | | | |
| | 21 | | See Notes to Financial Statements. |
Tax-Managed International Equity Portfolio
October 31, 2012
Portfolio of Investments — continued
| | | | | | | | |
| Security | | Shares | | | Value | |
| | | | | | | | |
|
Diversified Telecommunication Services (continued) | |
TDC A/S | | | 14,081 | | | $ | 97,085 | |
Telecom Corporation of New Zealand, Ltd. | | | 83,532 | | | | 165,132 | |
Telecom Italia SpA | | | 46,235 | | | | 42,657 | |
Telecom Italia SpA, PFC Shares | | | 124,288 | | | | 99,526 | |
Telefonica SA | | | 43,216 | | | | 570,399 | |
Telekom Austria AG | | | 1,187 | | | | 7,478 | |
Telenor ASA | | | 42,114 | | | | 828,303 | |
TeliaSonera AB | | | 89,068 | | | | 585,553 | |
Telstra Corp., Ltd. | | | 56,147 | | | | 241,292 | |
| | | | | | | | | |
| | | | | | $ | 5,355,735 | |
| | | | | | | | | |
| | |
Electric Utilities — 2.9% | | | | | | | | |
Cheung Kong Infrastructure Holdings, Ltd. | | | 50,000 | | | $ | 293,265 | |
CLP Holdings, Ltd. | | | 47,000 | | | | 400,458 | |
Contact Energy, Ltd.(1) | | | 23,324 | | | | 106,209 | |
EDF SA | | | 2,363 | | | | 50,004 | |
EDP-Energias de Portugal SA | | | 87,007 | | | | 236,496 | |
Enel SpA | | | 33,088 | | | | 124,601 | |
Fortum Oyj | | | 6,801 | | | | 125,873 | |
Iberdrola SA | | | 26,296 | | | | 136,186 | |
Power Assets Holdings, Ltd. | | | 76,000 | | | | 645,813 | |
Red Electrica Corp. SA | | | 5,529 | | | | 259,419 | |
SSE PLC | | | 2,331 | | | | 54,520 | |
Terna Rete Elettrica Nazionale SpA | | | 113,704 | | | | 427,502 | |
Verbund AG | | | 5,638 | | | | 131,465 | |
| | | | | | | | | |
| | | | | | $ | 2,991,811 | |
| | | | | | | | | |
|
Electronic Equipment, Instruments & Components — 1.1% | |
Hamamatsu Photonics K.K. | | | 9,200 | | | $ | 318,967 | |
Hirose Electric Co., Ltd. | | | 500 | | | | 53,518 | |
Hoya Corp. | | | 2,400 | | | | 48,606 | |
Keyence Corp. | | | 2,500 | | | | 663,722 | |
Yokogawa Electric Corp. | | | 5,100 | | | | 58,054 | |
| | | | | | | | | |
| | | | | | $ | 1,142,867 | |
| | | | | | | | | |
| | |
Energy Equipment & Services — 1.2% | | | | | | | | |
Aker Solutions ASA | | | 14,269 | | | $ | 281,191 | |
Saipem SpA | | | 8,756 | | | | 394,537 | |
Seadrill, Ltd. | | | 7,973 | | | | 323,068 | |
Subsea 7 SA | | | 10,099 | | | | 221,391 | |
Tenaris SA | | | 3,381 | | | | 63,375 | |
| | | | | | | | | |
| | | | | | $ | 1,283,562 | |
| | | | | | | | | |
| | | | | | | | |
| Security | | Shares | | | Value | |
| | | | | | | | |
| | |
Food & Staples Retailing — 3.2% | | | | | | | | |
Carrefour SA | | | 7,633 | | | $ | 184,342 | |
Colruyt SA | | | 7,459 | | | | 341,012 | |
Delhaize Group SA | | | 299 | | | | 11,448 | |
Distribuidora Internacional de Alimentacion SA | | | 10,918 | | | | 66,143 | |
Jeronimo Martins SGPS SA | | | 15,466 | | | | 270,748 | |
Kesko Oyj, Class B | | | 2,175 | | | | 68,013 | |
Koninklijke Ahold NV | | | 48,448 | | | | 616,963 | |
Lawson, Inc. | | | 1,700 | | | | 124,933 | |
Tesco PLC | | | 91,836 | | | | 475,199 | |
Wesfarmers, Ltd. | | | 3,101 | | | | 111,789 | |
Wesfarmers, Ltd., PPS | | | 2,530 | | | | 94,808 | |
WM Morrison Supermarkets PLC | | | 137,276 | | | | 594,371 | |
Woolworths, Ltd. | | | 11,077 | | | | 337,869 | |
| | | | | | | | | |
| | | | | | $ | 3,297,638 | |
| | | | | | | | | |
| | |
Food Products — 3.2% | | | | | | | | |
Associated British Foods PLC | | | 5,547 | | | $ | 124,134 | |
Kerry Group PLC, Class A | | | 13,533 | | | | 707,523 | |
Nestle SA | | | 29,445 | | | | 1,869,409 | |
Parmalat SpA | | | 4,696 | | | | 10,643 | |
Unilever PLC | | | 15,225 | | | | 567,940 | |
Yakult Honsha Co., Ltd. | | | 1,500 | | | | 69,881 | |
| | | | | | | | | |
| | | | | | $ | 3,349,530 | |
| | | | | | | | | |
| | |
Gas Utilities — 1.9% | | | | | | | | |
APA Group | | | 9,919 | | | $ | 53,092 | |
Enagas | | | 17,193 | | | | 342,013 | |
Hong Kong & China Gas Co., Ltd. | | | 246,400 | | | | 655,685 | |
Snam Rete Gas SpA | | | 117,981 | | | | 522,815 | |
Toho Gas Co., Ltd. | | | 33,000 | | | | 200,009 | |
Tokyo Gas Co., Ltd. | | | 30,000 | | | | 158,968 | |
| | | | | | | | | |
| | | | | | $ | 1,932,582 | |
| | | | | | | | | |
| | |
Health Care Equipment & Supplies — 1.4% | | | | | | | | |
Coloplast A/S | | | 3,072 | | | $ | 673,831 | |
Essilor International SA | | | 3,907 | | | | 352,308 | |
Sonova Holding AG(1) | | | 2,191 | | | | 220,626 | |
Sysmex Corp. | | | 1,700 | | | | 79,935 | |
William Demant Holding A/S(1) | | | 1,810 | | | | 155,666 | |
| | | | | | | | | |
| | | | | | $ | 1,482,366 | |
| | | | | | | | | |
| | |
Health Care Providers & Services — 0.3% | | | | | | | | |
Fresenius Medical Care AG & Co. KGaA | | | 705 | | | $ | 49,536 | |
Miraca Holdings, Inc. | | | 1,300 | | | | 54,900 | |
| | | | |
| | 22 | | See Notes to Financial Statements. |
Tax-Managed International Equity Portfolio
October 31, 2012
Portfolio of Investments — continued
| | | | | | | | |
| Security | | Shares | | | Value | |
| | | | | | | | |
| | |
Health Care Providers & Services (continued) | | | | | | | | |
Suzuken Co., Ltd. | | | 5,000 | | | $ | 157,834 | |
| | | | | | | | | |
| | | | | | $ | 262,270 | |
| | | | | | | | | |
| | |
Hotels, Restaurants & Leisure — 1.6% | | | | | | | | |
Autogrill SpA | | | 7,979 | | | $ | 81,675 | |
Compass Group PLC | | | 23,593 | | | | 259,240 | |
Crown, Ltd. | | | 5,308 | | | | 53,499 | |
McDonald’s Holdings Co. (Japan), Ltd. | | | 7,500 | | | | 208,397 | |
OPAP SA | | | 23,076 | | | | 147,494 | |
Oriental Land Co., Ltd. | | | 3,400 | | | | 463,777 | |
Sky City Entertainment Group, Ltd. | | | 17,644 | | | | 56,275 | |
Sodexo | | | 1,273 | | | | 98,066 | |
Tabcorp Holdings, Ltd. | | | 17,246 | | | | 50,788 | |
Tatts Group, Ltd. | | | 20,688 | | | | 60,085 | |
Whitbread PLC | | | 5,656 | | | | 214,945 | |
| | | | | | | | | |
| | | | | | $ | 1,694,241 | |
| | | | | | | | | |
| | |
Household Durables — 0.2% | | | | | | | | |
Rinnai Corp. | | | 3,100 | | | $ | 211,731 | |
| | | | | | | | | |
| | | | | | $ | 211,731 | |
| | | | | | | | | |
| | |
Household Products — 1.1% | | | | | | | | |
Henkel AG & Co. KGaA | | | 8,281 | | | $ | 536,185 | |
Svenska Cellulosa AB, Class B | | | 9,463 | | | | 184,492 | |
Unicharm Corp. | | | 7,000 | | | | 378,735 | |
| | | | | | | | | |
| | | | | | $ | 1,099,412 | |
| | | | | | | | | |
|
Independent Power Producers & Energy Traders — 0.1% | |
Electric Power Development Co., Ltd. | | | 1,800 | | | $ | 46,105 | |
Enel Green Power SpA | | | 30,966 | | | | 52,743 | |
| | | | | | | | | |
| | | | | | $ | 98,848 | |
| | | | | | | | | |
| | |
Industrial Conglomerates — 1.2% | | | | | | | | |
Delek Group, Ltd. | | | 342 | | | $ | 65,033 | |
Fraser and Neave, Ltd. | | | 8,000 | | | | 59,937 | |
Hopewell Holdings, Ltd. | | | 51,500 | | | | 185,797 | |
Orkla ASA | | | 52,718 | | | | 417,612 | |
Siemens AG | | | 5,077 | | | | 511,553 | |
| | | | | | | | | |
| | | | | | $ | 1,239,932 | |
| | | | | | | | | |
| | |
Insurance — 1.8% | | | | | | | | |
Baloise Holding AG | | | 1,801 | | | $ | 150,322 | |
Gjensidige Forsikring ASA | | | 6,519 | | | | 95,191 | |
Hannover Rueckversicherung AG | | | 2,449 | | | | 172,540 | |
| | | | | | | | |
| Security | | Shares | | | Value | |
| | | | | | | | |
| | |
Insurance (continued) | | | | | | | | |
Resolution, Ltd. | | | 13,759 | | | $ | 48,509 | |
Sampo Oyj | | | 12,347 | | | | 387,123 | |
Swiss Reinsurance Co., Ltd. | | | 7,258 | | | | 502,235 | |
Tryg A/S | | | 2,912 | | | | 190,134 | |
Vienna Insurance Group | | | 1,893 | | | | 81,340 | |
Zurich Insurance Group AG(1) | | | 830 | | | | 204,611 | |
| | | | | | | | | |
| | | | | | $ | 1,832,005 | |
| | | | | | | | | |
| | |
Internet & Catalog Retail — 0.4% | | | | | | | | |
Rakuten, Inc. | | | 42,600 | | | $ | 382,940 | |
| | | | | | | | | |
| | | | | | $ | 382,940 | |
| | | | | | | | | |
| | |
Internet Software & Services — 0.3% | | | | | | | | |
United Internet AG | | | 11,282 | | | $ | 225,774 | |
Yahoo! Japan Corp. | | | 167 | | | | 57,473 | |
| | | | | | | | | |
| | | | | | $ | 283,247 | |
| | | | | | | | | |
| | |
IT Services — 0.5% | | | | | | | | |
Amadeus IT Holding SA, Class A | | | 10,684 | | | $ | 264,668 | |
Computershare, Ltd. | | | 6,596 | | | | 59,401 | |
Indra Sistemas SA | | | 7,412 | | | | 84,808 | |
ITOCHU Techno-Solutions Corp. | | | 2,500 | | | | 129,340 | |
| | | | | | | | | |
| | | | | | $ | 538,217 | |
| | | | | | | | | |
| | |
Leisure Equipment & Products — 0.1% | | | | | | | | |
Sankyo Co., Ltd. | | | 2,800 | | | $ | 126,858 | |
| | | | | | | | | |
| | | | | | $ | 126,858 | |
| | | | | | | | | |
| | |
Life Sciences Tools & Services — 0.2% | | | | | | | | |
QIAGEN NV(1) | | | 13,623 | | | $ | 237,327 | |
| | | | | | | | | |
| | | | | | $ | 237,327 | |
| | | | | | | | | |
| | |
Machinery — 2.0% | | | | | | | | |
Atlas Copco AB, Class B | | | 4,247 | | | $ | 93,129 | |
Kone Oyj, Class B | | | 11,111 | | | | 796,760 | |
Scania AB, Class B | | | 5,767 | | | | 110,038 | |
Schindler Holding AG | | | 2,426 | | | | 314,267 | |
Schindler Holding AG PC | | | 414 | | | | 54,638 | |
Sulzer AG | | | 795 | | | | 115,280 | |
Wartsila Oyj | | | 8,800 | | | | 356,378 | |
Zardoya Otis SA | | | 16,076 | | | | 198,843 | |
| | | | | | | | | |
| | | | | | $ | 2,039,333 | |
| | | | | | | | | |
| | | | |
| | 23 | | See Notes to Financial Statements. |
Tax-Managed International Equity Portfolio
October 31, 2012
Portfolio of Investments — continued
| | | | | | | | |
| Security | | Shares | | | Value | |
| | | | | | | | |
| | |
Marine — 0.4% | | | | | | | | |
A.P. Moller - Maersk A/S, Class A | | | 22 | | | $ | 145,768 | |
A.P. Moller - Maersk A/S, Class B | | | 37 | | | | 258,247 | |
| | | | | | | | | |
| | | | | | $ | 404,015 | |
| | | | | | | | | |
| | |
Media — 0.9% | | | | | | | | |
Eutelsat Communications SA | | | 6,017 | | | $ | 192,670 | |
Reed Elsevier NV | | | 12,954 | | | | 173,888 | |
Reed Elsevier PLC | | | 16,194 | | | | 158,625 | |
SES SA | | | 2,705 | | | | 74,875 | |
Singapore Press Holdings, Ltd. | | | 99,000 | | | | 327,341 | |
| | | | | | | | | |
| | | | | | $ | 927,399 | |
| | | | | | | | | |
| | |
Metals & Mining — 3.3% | | | | | | | | |
Acerinox SA | | | 12,749 | | | $ | 133,077 | |
BHP Billiton PLC | | | 19,135 | | | | 613,300 | |
BHP Billiton, Ltd. | | | 14,762 | | | | 522,655 | |
Boliden AB | | | 32,182 | | | | 563,947 | |
Newcrest Mining, Ltd. | | | 1,826 | | | | 50,361 | |
Norsk Hydro ASA | | | 118,504 | | | | 533,508 | |
OZ Minerals, Ltd. | | | 1,693 | | | | 14,365 | |
Randgold Resources, Ltd. | | | 2,636 | | | | 315,101 | |
Rio Tinto, Ltd. | | | 6,172 | | | | 363,874 | |
Umicore SA | | | 5,226 | | | | 268,555 | |
Voestalpine AG | | | 2,321 | | | | 73,084 | |
| | | | | | | | | |
| | | | | | $ | 3,451,827 | |
| | | | | | | | | |
| | |
Multi-Utilities — 1.5% | | | | | | | | |
AGL Energy, Ltd. | | | 19,720 | | | $ | 297,393 | |
Centrica PLC | | | 149,088 | | | | 780,523 | |
E.ON AG | | | 3,381 | | | | 76,969 | |
GDF Suez | | | 14,024 | | | | 321,883 | |
National Grid PLC | | | 9,583 | | | | 109,290 | |
| | | | | | | | | |
| | | | | | $ | 1,586,058 | |
| | | | | | | | | |
| | |
Multiline Retail — 1.0% | | | | | | | | |
Harvey Norman Holdings, Ltd. | | | 44,634 | | | $ | 88,165 | |
Isetan Mitsukoshi Holdings, Ltd. | | | 5,100 | | | | 49,922 | |
Marks & Spencer Group PLC | | | 23,568 | | | | 150,001 | |
Next PLC | | | 9,933 | | | | 572,600 | |
PPR SA | | | 657 | | | | 115,821 | |
Takashimaya Co., Ltd. | | | 2,000 | | | | 13,155 | |
| | | | | | | | | |
| | | | | | $ | 989,664 | |
| | | | | | | | | |
| | | | | | | | |
| Security | | Shares | | | Value | |
| | | | | | | | |
| | |
Office Electronics — 0.1% | | | | | | | | |
Canon, Inc. | | | 2,000 | | | $ | 64,999 | |
Neopost SA | | | 618 | | | | 33,882 | |
| | | | | | | | | |
| | | | | | $ | 98,881 | |
| | | | | | | | | |
| | |
Oil, Gas & Consumable Fuels — 7.9% | | | | | | | | |
BP PLC | | | 115,420 | | | $ | 824,283 | |
ENI SpA | | | 72,015 | | | | 1,657,131 | |
Galp Energia SGPS SA, Class B | | | 7,743 | | | | 123,949 | |
JX Holdings, Inc. | | | 8,800 | | | | 46,869 | |
Lundin Petroleum AB(1) | | | 2,108 | | | | 50,579 | |
OMV AG | | | 15,532 | | | | 568,398 | |
Origin Energy, Ltd. | | | 24,729 | | | | 291,088 | |
Repsol SA | | | 16,922 | | | | 339,130 | |
Royal Dutch Shell PLC, Class A | | | 72,627 | | | | 2,492,029 | |
Statoil ASA | | | 31,115 | | | | 766,330 | |
TonenGeneral Sekiyu K.K. | | | 29,000 | | | | 263,178 | |
Total SA | | | 2,178 | | | | 109,706 | |
Tullow Oil PLC | | | 19,185 | | | | 435,859 | |
Woodside Petroleum, Ltd. | | | 4,035 | | | | 143,873 | |
| | | | | | | | | |
| | | | | | $ | 8,112,402 | |
| | | | | | | | | |
| | |
Paper & Forest Products — 0.3% | | | | | | | | |
Holmen AB, Class B | | | 3,672 | | | $ | 108,212 | |
Stora Enso Oyj | | | 18,840 | | | | 119,174 | |
UPM-Kymmene Oyj | | | 4,555 | | | | 48,906 | |
| | | | | | | | | |
| | | | | | $ | 276,292 | |
| | | | | | | | | |
| | |
Personal Products — 1.5% | | | | | | | | |
Beiersdorf AG | | | 4,742 | | | $ | 344,979 | |
L’Oreal SA | | | 9,042 | | | | 1,152,380 | |
| | | | | | | | | |
| | | | | | $ | 1,497,359 | |
| | | | | | | | | |
| | |
Pharmaceuticals — 8.1% | | | | | | | | |
AstraZeneca PLC | | | 21,712 | | | $ | 1,006,889 | |
Chugai Pharmaceutical Co., Ltd. | | | 13,200 | | | | 267,449 | |
Dainippon Sumitomo Pharma Co., Ltd. | | | 12,900 | | | | 148,373 | |
Elan Corp. PLC(1) | | | 15,731 | | | | 171,202 | |
GlaxoSmithKline PLC | | | 7,574 | | | | 169,714 | |
Johnson & Johnson | | | 994 | | | | 70,395 | |
Kyowa Hakko Kirin Co., Ltd. | | | 17,000 | | | | 180,952 | |
Mitsubishi Tanabe Pharma Corp. | | | 9,700 | | | | 139,822 | |
Novartis AG | | | 14,467 | | | | 872,368 | |
Novo Nordisk A/S, Class B | | | 8,373 | | | | 1,342,321 | |
Ono Pharmaceutical Co., Ltd. | | | 5,300 | | | | 320,009 | |
| | | | |
| | 24 | | See Notes to Financial Statements. |
Tax-Managed International Equity Portfolio
October 31, 2012
Portfolio of Investments — continued
| | | | | | | | |
| Security | | Shares | | | Value | |
| | | | | | | | |
| | |
Pharmaceuticals (continued) | | | | | | | | |
Orion Oyj, Class B | | | 8,426 | | | $ | 208,489 | |
Roche Holding AG ADR | | | 2 | | | | 96 | |
Roche Holding AG PC | | | 5,163 | | | | 994,523 | |
Sanofi | | | 4,986 | | | | 437,908 | |
Santen Pharmaceutical Co., Ltd. | | | 5,800 | | | | 254,072 | |
Shire PLC | | | 15,848 | | | | 445,639 | |
Taisho Pharmaceutical Holdings Co., Ltd. | | | 600 | | | | 48,456 | |
Takeda Pharmaceutical Co., Ltd. | | | 1,100 | | | | 51,129 | |
Teva Pharmaceutical Industries, Ltd. ADR | | | 18,026 | | | | 728,611 | |
Tsumura & Co. | | | 4,700 | | | | 150,299 | |
UCB SA | | | 5,498 | | | | 321,125 | |
| | | | | | | | | |
| | | | | | $ | 8,329,841 | |
| | | | | | | | | |
| | |
Professional Services — 0.4% | | | | | | | | |
Adecco SA(1) | | | 5,678 | | | $ | 275,340 | |
Experian PLC | | | 7,587 | | | | 131,262 | |
SGS SA | | | 7 | | | | 14,840 | |
| | | | | | | | | |
| | | | | | $ | 421,442 | |
| | | | | | | | | |
| | |
Real Estate Investment Trusts (REITs) — 1.4% | | | | | | | | |
Ascendas Real Estate Investment Trust | | | 144,000 | | | $ | 277,840 | |
Centro Retail Australia | | | 22,983 | | | | 51,242 | |
CFS Retail Property Trust | | | 29,212 | | | | 59,189 | |
GPT Group | | | 32,529 | | | | 120,125 | |
Japan Prime Realty Investment Corp. | | | 3 | | | | 9,041 | |
Japan Real Estate Investment Corp. | | | 12 | | | | 120,160 | |
Link REIT (The) | | | 147,500 | | | | 732,029 | |
Unibail-Rodamco SE | | | 268 | | | | 60,363 | |
Westfield Retail Trust | | | 16,133 | | | | 51,804 | |
| | | | | | | | | |
| | | | | | $ | 1,481,793 | |
| | | | | | | | | |
| | |
Real Estate Management & Development — 0.5% | | | | | | | | |
Hang Lung Group, Ltd. | | | 16,000 | | | $ | 94,261 | |
Immofinanz AG(1) | | | 58,394 | | | | 225,726 | |
UOL Group, Ltd. | | | 51,000 | | | | 235,978 | |
| | | | | | | | | |
| | | | | | $ | 555,965 | |
| | | | | | | | | |
| | |
Road & Rail — 1.6% | | | | | | | | |
ComfortDelGro Corp., Ltd. | | | 45,000 | | | $ | 62,229 | |
DSV A/S | | | 13,873 | | | | 312,061 | |
Keikyu Corp. | | | 8,000 | | | | 75,345 | |
Keio Corp. | | | 39,000 | | | | 295,982 | |
Kintetsu Corp. | | | 24,000 | | | | 94,055 | |
MTR Corp., Ltd. | | | 87,500 | | | | 340,181 | |
| | | | | | | | |
| Security | | Shares | | | Value | |
| | | | | | | | |
| | |
Road & Rail (continued) | | | | | | | | |
Odakyu Electric Railway Co., Ltd. | | | 44,000 | | | $ | 466,874 | |
| | | | | | | | | |
| | | | | | $ | 1,646,727 | |
| | | | | | | | | |
| | |
Semiconductors & Semiconductor Equipment — 1.2% | | | | | | | | |
ASML Holding NV | | | 20,168 | | | $ | 1,108,680 | |
Mellanox Technologies, Ltd.(1) | | | 2,363 | | | | 178,330 | |
| | | | | | | | | |
| | | | | | $ | 1,287,010 | |
| | | | | | | | | |
| | |
Software — 2.8% | | | | | | | | |
Dassault Systemes SA | | | 3,888 | | | $ | 410,200 | |
NICE Systems, Ltd.(1) | | | 6,534 | | | | 218,253 | |
Oracle Corp. Japan | | | 2,800 | | | | 124,520 | |
Sage Group PLC (The) | | | 79,778 | | | | 400,687 | |
SAP AG | | | 23,374 | | | | 1,704,502 | |
| | | | | | | | | |
| | | | | | $ | 2,858,162 | |
| | | | | | | | | |
| | |
Specialty Retail — 1.8% | | | | | | | | |
ABC-Mart, Inc. | | | 2,400 | | | $ | 105,256 | |
Hennes & Mauritz AB, Class B | | | 15,772 | | | | 534,773 | |
Industria de Diseno Textil SA | | | 7,085 | | | | 904,698 | |
Kingfisher PLC | | | 22,184 | | | | 103,866 | |
Nitori Co., Ltd. | | | 500 | | | | 40,831 | |
USS Co., Ltd. | | | 1,940 | | | | 203,976 | |
| | | | | | | | | |
| | | | | | $ | 1,893,400 | |
| | | | | | | | | |
| | |
Textiles, Apparel & Luxury Goods — 1.6% | | | | | | | | |
Adidas AG | | | 2,652 | | | $ | 226,048 | |
Burberry Group PLC | | | 2,271 | | | | 42,849 | |
Luxottica Group SpA | | | 7,662 | | | | 292,443 | |
LVMH Moet Hennessy Louis Vuitton SA | | | 5,113 | | | | 831,276 | |
Swatch Group, Ltd. (The), Bearer Shares | | | 638 | | | | 264,085 | |
| | | | | | | | | |
| | | | | | $ | 1,656,701 | |
| | | | | | | | | |
| | |
Trading Companies & Distributors — 0.1% | | | | | | | | |
Bunzl PLC | | | 5,796 | | | $ | 96,007 | |
| | | | | | | | | |
| | | | | | $ | 96,007 | |
| | | | | | | | | |
| | |
Transportation Infrastructure — 1.4% | | | | | | | | |
Abertis Infraestructuras SA | | | 14,497 | | | $ | 218,960 | |
Atlantia SpA | | | 11,265 | | | | 186,323 | |
Auckland International Airport, Ltd. | | | 100,898 | | | | 222,566 | |
Fraport AG | | | 937 | | | | 54,987 | |
Kamigumi Co., Ltd. | | | 19,000 | | | | 153,235 | |
Koninklijke Vopak NV | | | 1,903 | | | | 132,487 | |
| | | | |
| | 25 | | See Notes to Financial Statements. |
Tax-Managed International Equity Portfolio
October 31, 2012
Portfolio of Investments — continued
| | | | | | | | |
| Security | | Shares | | | Value | |
| | | | | | | | |
| | |
Transportation Infrastructure (continued) | | | | | | | | |
Mitsubishi Logistics Corp. | | | 4,000 | | | $ | 51,587 | |
Sydney Airport | | | 15,321 | | | | 53,888 | |
Transurban Group | | | 63,537 | | | | 401,018 | |
| | | | | | | | | |
| | | | | | $ | 1,475,051 | |
| | | | | | | | | |
| | |
Water Utilities — 0.1% | | | | | | | | |
Severn Trent PLC | | | 1,894 | | | $ | 49,121 | |
United Utilities Group PLC | | | 4,978 | | | | 54,426 | |
| | | | | | | | | |
| | | | | | $ | 103,547 | |
| | | | | | | | | |
| | |
Wireless Telecommunication Services — 1.9% | | | | | | | | |
Millicom International Cellular SA SDR | | | 2,339 | | | $ | 201,936 | |
Mobistar SA | | | 428 | | | | 11,318 | |
NTT DoCoMo, Inc. | | | 477 | | | | 691,185 | |
StarHub, Ltd. | | | 17,000 | | | | 51,146 | |
Tele2 AB, Class B | | | 17,620 | | | | 294,128 | |
Vodafone Group PLC | | | 256,506 | | | | 696,576 | |
| | | | | | | | | |
| | | | | | $ | 1,946,289 | |
| | | | | | | | | |
| |
Total Common Stocks
(identified cost $97,936,669) | | | $ | 102,214,266 | |
| | | | | | | | | |
|
| Short-Term Investments — 0.3% | |
| | |
| | | | | | | | |
| Description | | Interest
(000’s omitted) | | | Value | |
Eaton Vance Cash Reserves Fund, LLC, 0.12%(3) | | $ | 308 | | | $ | 308,319 | |
| | | | | | | | | |
| |
Total Short-Term Investments
(identified cost $308,319) | | | $ | 308,319 | |
| | | | | | | | | |
| |
Total Investments — 99.3%
(identified cost $98,244,988) | | | $ | 102,522,585 | |
| | | | | | | | | |
| |
Other Assets, Less Liabilities — 0.7% | | | $ | 768,652 | |
| | | | | | | | | |
| |
Net Assets — 100.0% | | | $ | 103,291,237 | |
| | | | | | | | | |
The percentage shown for each investment category in the Portfolio of Investments is based on net assets.
| | | | |
| ADR | | – | | American Depositary Receipt |
| CDI | | – | | CHESS Depositary Interest |
| PC | | – | | Participation Certificate |
| PFC Shares | | – | | Preference Shares |
| PPS | | – | | Partially Protected Shares |
| SDR | | – | | Swedish Depositary Receipt |
| (1) | Non-income producing security. |
| (2) | Amount is less than 0.05%. |
| (3) | Affiliated investment company available to Eaton Vance portfolios and funds which invests in high quality, U.S. dollar denominated money market instruments. The rate shown is the annualized seven-day yield as of October 31, 2012. |
| | | | | | | | |
| Country Concentration of Portfolio | | | | | | | | |
| | |
| | | | | | | | |
| Country | | Percentage
of Net Assets | | | Value | |
United Kingdom | | | 14.0 | % | | $ | 14,427,626 | |
Japan | | | 11.7 | | | | 12,095,800 | |
Australia | | | 6.8 | | | | 7,035,533 | |
Switzerland | | | 6.6 | | | | 6,809,057 | |
Germany | | | 6.3 | | | | 6,550,927 | |
France | | | 6.3 | | | | 6,546,617 | |
Hong Kong | | | 5.0 | | | | 5,133,007 | |
Netherlands | | | 4.6 | | | | 4,747,882 | |
Singapore | | | 4.5 | | | | 4,625,312 | |
Sweden | | | 4.4 | | | | 4,544,057 | |
Spain | | | 4.4 | | | | 4,529,785 | |
Italy | | | 4.2 | | | | 4,309,709 | |
Denmark | | | 3.7 | | | | 3,841,451 | |
Belgium | | | 3.5 | | | | 3,593,930 | |
Norway | | | 3.2 | | | | 3,332,768 | |
Finland | | | 2.8 | | | | 2,912,820 | |
Israel | | | 2.4 | | | | 2,508,126 | |
Austria | | | 1.5 | | | | 1,558,426 | |
Ireland | | | 1.2 | | | | 1,203,739 | |
New Zealand | | | 0.8 | | | | 783,904 | |
Portugal | | | 0.7 | | | | 732,594 | |
United States | | | 0.4 | | | | 378,714 | |
Greece | | | 0.3 | | | | 320,801 | |
| | | | | | | | | |
Total Investments | | | 99.3 | % | | $ | 102,522,585 | |
| | | | | | | | | |
| | | | |
| | 26 | | See Notes to Financial Statements. |
Tax-Managed International Equity Portfolio
October 31, 2012
Statement of Assets and Liabilities
| | | | |
| Assets | | October 31, 2012 | |
Unaffiliated investments, at value (identified cost, $97,936,669) | | $ | 102,214,266 | |
Affiliated investment, at value (identified cost, $308,319) | | | 308,319 | |
Foreign currency, at value (identified cost, $46,174) | | | 46,174 | |
Dividends receivable | | | 194,137 | |
Interest receivable from affiliated investment | | | 30 | |
Tax reclaims receivable | | | 647,872 | |
Total assets | | $ | 103,410,798 | |
| |
| Liabilities | | | | |
Payable for investments purchased | | $ | 7,274 | |
Payable to affiliates: | | | | |
Investment adviser fee | | | 65,936 | |
Trustees’ fees | | | 371 | |
Accrued expenses | | | 45,980 | |
Total liabilities | | $ | 119,561 | |
Net Assets applicable to investors’ interest in Portfolio | | $ | 103,291,237 | |
| |
| Sources of Net Assets | | | | |
Investors’ capital | | $ | 98,961,133 | |
Net unrealized appreciation | | | 4,330,104 | |
Total | | $ | 103,291,237 | |
| | | | |
| | 27 | | See Notes to Financial Statements. |
Tax-Managed International Equity Portfolio
October 31, 2012
Statement of Operations
| | | | |
| Investment Income | | Year Ended October 31, 2012 | |
Dividends (net of foreign taxes, $357,768) | | $ | 3,738,227 | |
Interest allocated from affiliated investment | | | 2,139 | |
Expenses allocated from affiliated investment | | | (327 | ) |
Total investment income | | $ | 3,740,039 | |
| |
| Expenses | | | | |
Investment adviser fee | | $ | 904,479 | |
Trustees’ fees and expenses | | | 4,474 | |
Custodian fee | | | 106,659 | |
Legal and accounting services | | | 37,239 | |
Miscellaneous | | | 7,237 | |
Total expenses | | $ | 1,060,088 | |
Deduct — | | | | |
Reduction of custodian fee | | $ | 4 | |
Total expense reductions | | $ | 4 | |
| |
Net expenses | | $ | 1,060,084 | |
| |
Net investment income | | $ | 2,679,955 | |
|
| Realized and Unrealized Gain (Loss) | |
Net realized gain (loss) — | | | | |
Investment transactions | | $ | 2,659,427 | |
Investment transactions allocated from affiliated investment | | | 70 | |
Foreign currency transactions | | | (66,798 | ) |
Net realized gain | | $ | 2,592,699 | |
Change in unrealized appreciation (depreciation) — | | | | |
Investments | | $ | 4,600,910 | |
Foreign currency | | | (43,400 | ) |
Net change in unrealized appreciation (depreciation) | | $ | 4,557,510 | |
| |
Net realized and unrealized gain | | $ | 7,150,209 | |
| |
Net increase in net assets from operations | | $ | 9,830,164 | |
| | | | |
| | 28 | | See Notes to Financial Statements. |
Tax-Managed International Equity Portfolio
October 31, 2012
Statements of Changes in Net Assets
| | | | | | | | |
| | | Year Ended October 31, | |
| Increase (Decrease) in Net Assets | | 2012 | | | 2011 | |
From operations — | | | | | | | | |
Net investment income | | $ | 2,679,955 | | | $ | 2,377,997 | |
Net realized gain (loss) from investment and foreign currency transactions | | | 2,592,699 | | | | (3,716,677 | ) |
Net change in unrealized appreciation (depreciation) from investments and foreign currency | | | 4,557,510 | | | | (7,860,293 | ) |
Net increase (decrease) in net assets from operations | | $ | 9,830,164 | | | $ | (9,198,973 | ) |
Capital transactions — | | | | | | | | |
Contributions | | $ | 1,889,335 | | | $ | 3,039,751 | |
Withdrawals | | | (17,282,938 | ) | | | (59,624,574 | ) |
Net decrease in net assets from capital transactions | | $ | (15,393,603 | ) | | $ | (56,584,823 | ) |
| | |
Net decrease in net assets | | $ | (5,563,439 | ) | | $ | (65,783,796 | ) |
|
| Net Assets | |
At beginning of year | | $ | 108,854,676 | | | $ | 174,638,472 | |
At end of year | | $ | 103,291,237 | | | $ | 108,854,676 | |
| | | | |
| | 29 | | See Notes to Financial Statements. |
Tax-Managed International Equity Portfolio
October 31, 2012
Supplementary Data
| | | | | | | | | | | | | | | | | | | | |
| | | Year Ended October 31, | |
| Ratios/Supplemental Data | | 2012 | | | 2011 | | | 2010 | | | 2009 | | | 2008 | |
Ratios (as a percentage of average daily net assets): | | | | | | | | | | | | | | | | | | | | |
Expenses(1) | | | 1.03 | % | | | 1.13 | % | | | 1.13 | % | | | 1.12 | %(2) | | | 1.09 | % |
Net investment income | | | 2.60 | % | | | 1.67 | % | | | 1.30 | % | | | 2.30 | % | | | 2.08 | % |
Portfolio Turnover | | | 117 | % | | | 41 | % | | | 72 | % | | | 57 | % | | | 34 | % |
| | | | | |
Total Return | | | 10.24 | % | | | (9.16 | )% | | | 5.48 | % | | | 16.92 | % | | | (48.82 | )% |
| | | | | |
Net assets, end of year (000’s omitted) | | $ | 103,291 | | | $ | 108,855 | | | $ | 174,638 | | | $ | 193,608 | | | $ | 226,980 | |
| (1) | Excludes the effect of custody fee credits, if any, of less than 0.005%. |
| (2) | The investment adviser waived a portion of its investment adviser fee (equal to less than 0.005% of average daily net assets for the year ended October 31, 2009). All of the waiver was borne by the sub-adviser. |
| | | | |
| | 30 | | See Notes to Financial Statements. |
Tax-Managed International Equity Portfolio
October 31, 2012
Notes to Financial Statements
1 Significant Accounting Policies
Tax-Managed International Equity Portfolio (the Portfolio) is a Massachusetts business trust registered under the Investment Company Act of 1940, as amended (the 1940 Act), as a diversified, open-end management investment company. The Portfolio’s investment objective is to achieve long-term after-tax returns by investing in a diversified portfolio of foreign equity securities. The Declaration of Trust permits the Trustees to issue interests in the Portfolio. At October 31, 2012, Eaton Vance Tax-Managed International Equity Fund and Eaton Vance Tax-Managed Equity Asset Allocation Fund held an interest of 42.5% and 57.5%, respectively, in the Portfolio.
The following is a summary of significant accounting policies of the Portfolio. The policies are in conformity with accounting principles generally accepted in the United States of America.
A Investment Valuation — Equity securities (including common shares of closed-end investment companies) listed on a U.S. securities exchange generally are valued at the last sale or closing price on the day of valuation or, if no sales took place on such date, at the mean between the closing bid and asked prices therefore on the exchange where such securities are principally traded. Equity securities listed on the NASDAQ Global or Global Select Market generally are valued at the NASDAQ official closing price. Unlisted or listed securities for which closing sales prices or closing quotations are not available are valued at the mean between the latest available bid and asked prices or, in the case of preferred equity securities that are not listed or traded in the over-the-counter market, by a third party pricing service that will use various techniques that consider factors including, but not limited to, prices or yields of securities with similar characteristics, benchmark yields, broker/dealer quotes, quotes of underlying common stock, issuer spreads, as well as industry and economic events. Short-term obligations purchased with a remaining maturity of sixty days or less are generally valued at amortized cost, which approximates market value. The daily valuation of exchange-traded foreign securities generally is determined as of the close of trading on the principal exchange on which such securities trade. Events occurring after the close of trading on foreign exchanges may result in adjustments to the valuation of foreign securities to more accurately reflect their fair value as of the close of regular trading on the New York Stock Exchange. When valuing foreign equity securities that meet certain criteria, the Portfolio’s Trustees have approved the use of a fair value service that values such securities to reflect market trading that occurs after the close of the applicable foreign markets of comparable securities or other instruments that have a strong correlation to the fair-valued securities. Foreign securities and currencies are valued in U.S. dollars, based on foreign currency exchange rate quotations supplied by a third party pricing service. The pricing service uses a proprietary model to determine the exchange rate. Inputs to the model include reported trades and implied bid/ask spreads. Investments for which valuations or market quotations are not readily available or are deemed unreliable are valued at fair value using methods determined in good faith by or at the direction of the Trustees of the Portfolio in a manner that fairly reflects the security’s value, or the amount that the Portfolio might reasonably expect to receive for the security upon its current sale in the ordinary course. Each such determination is based on a consideration of relevant factors, which are likely to vary from one pricing context to another. These factors may include, but are not limited to, the type of security, the existence of any contractual restrictions on the security’s disposition, the price and extent of public trading in similar securities of the issuer or of comparable companies or entities, quotations or relevant information obtained from broker/dealers or other market participants, information obtained from the issuer, analysts, and/or the appropriate stock exchange (for exchange-traded securities), an analysis of the company’s or entity’s financial condition, and an evaluation of the forces that influence the issuer and the market(s) in which the security is purchased and sold.
The Portfolio may invest in Eaton Vance Cash Reserves Fund, LLC (Cash Reserves Fund), an affiliated investment company managed by Eaton Vance Management (EVM). Cash Reserves Fund generally values its investment securities utilizing the amortized cost valuation technique in accordance with Rule 2a-7 under the 1940 Act. This technique involves initially valuing a portfolio security at its cost and thereafter assuming a constant amortization to maturity of any discount or premium. If amortized cost is determined not to approximate fair value, Cash Reserves Fund may value its investment securities based on available market quotations provided by a third party pricing service.
B Investment Transactions — Investment transactions for financial statement purposes are accounted for on a trade date basis. Realized gains and losses on investments sold are determined on the basis of identified cost.
C Income — Dividend income is recorded on the ex-dividend date for dividends received in cash and/or securities. However, if the ex-dividend date has passed, certain dividends from foreign securities are recorded as the Portfolio is informed of the ex-dividend date. Withholding taxes on foreign dividends and capital gains have been provided for in accordance with the Portfolio’s understanding of the applicable countries’ tax rules and rates. Interest income is recorded on the basis of interest accrued, adjusted for amortization of premium or accretion of discount.
D Federal Taxes — The Portfolio has elected to be treated as a partnership for federal tax purposes. No provision is made by the Portfolio for federal or state taxes on any taxable income of the Portfolio because each investor in the Portfolio is ultimately responsible for the payment of any taxes on its share of taxable income. Since at least one of the Portfolio’s investors is a regulated investment company that invests all or substantially all of its assets in the Portfolio, the Portfolio normally must satisfy the applicable source of income and diversification requirements (under the Internal Revenue Code) in order for its investors to satisfy them. The Portfolio will allocate, at least annually among its investors, each investor’s distributive share of the Portfolio’s net investment income, net realized capital gains and any other items of income, gain, loss, deduction or credit.
As of October 31, 2012, the Portfolio had no uncertain tax positions that would require financial statement recognition, de-recognition, or disclosure. The Portfolio files a U.S. federal income tax return annually after its fiscal year-end, which is subject to examination by the Internal Revenue Service for a period of three years from the date of filing.
Tax-Managed International Equity Portfolio
October 31, 2012
Notes to Financial Statements — continued
E Expense Reduction — State Street Bank and Trust Company (SSBT) serves as custodian of the Portfolio. Pursuant to the custodian agreement, SSBT receives a fee reduced by credits, which are determined based on the average daily cash balance the Portfolio maintains with SSBT. All credit balances, if any, used to reduce the Portfolio’s custodian fees are reported as a reduction of expenses in the Statement of Operations.
F Foreign Currency Translation — Investment valuations, other assets, and liabilities initially expressed in foreign currencies are translated each business day into U.S. dollars based upon current exchange rates. Purchases and sales of foreign investment securities and income and expenses denominated in foreign currencies are translated into U.S. dollars based upon currency exchange rates in effect on the respective dates of such transactions. Recognized gains or losses on investment transactions attributable to changes in foreign currency exchange rates are recorded for financial statement purposes as net realized gains and losses on investments. That portion of unrealized gains and losses on investments that results from fluctuations in foreign currency exchange rates is not separately disclosed.
G Use of Estimates — The preparation of the financial statements in conformity with accounting principles generally accepted in the United States of America requires management to make estimates and assumptions that affect the reported amounts of assets and liabilities at the date of the financial statements and the reported amounts of income and expense during the reporting period. Actual results could differ from those estimates.
H Indemnifications — Under the Portfolio’s organizational documents, its officers and Trustees may be indemnified against certain liabilities and expenses arising out of the performance of their duties to the Portfolio. Under Massachusetts law, if certain conditions prevail, interestholders in the Portfolio could be deemed to have personal liability for the obligations of the Portfolio. However, the Portfolio’s Declaration of Trust contains an express disclaimer of liability on the part of Portfolio interestholders and the By-laws provide that the Portfolio shall assume the defense on behalf of any Portfolio interestholder. Moreover, the By-laws also provide for indemnification out of Portfolio property of any interestholder held personally liable solely by reason of being or having been an interestholder for all loss or expense arising from such liability. Additionally, in the normal course of business, the Portfolio enters into agreements with service providers that may contain indemnification clauses. The Portfolio’s maximum exposure under these arrangements is unknown as this would involve future claims that may be made against the Portfolio that have not yet occurred.
2 Investment Adviser Fee and Other Transactions with Affiliates
The investment adviser fee is earned by Boston Management and Research (BMR), a subsidiary of EVM, as compensation for investment advisory services rendered to the Portfolio. Prior to May 1, 2012, the fee was computed at an annual rate of 1.00% of the Portfolio’s average daily net assets up to $500 million and at reduced rates on average daily net assets of $500 million or more. Effective May 1, 2012, BMR contractually agreed to reduce the advisory fee payable to an annual rate of 0.75% of the Portfolio’s average daily net assets up to $500 million and at reduced rates on average daily net assets of $500 million or more. This fee reduction cannot be terminated or reduced without the approval of a majority vote of the Trustees of the Portfolio who are not interested persons of BMR or the Portfolio and by the vote of a majority of the holders of interests in the Portfolio. Pursuant to an interim sub-advisory agreement effective May 1, 2012, and a sub-advisory agreement effective August 17, 2012, BMR pays Parametric Portfolio Associates LLC (Parametric), a majority-owned subsidiary of Eaton Vance Corp., a portion of its adviser fee for sub-advisory services provided to the Portfolio. Prior to May 1, 2012, BMR paid Eagle Global Advisors, L.L.C a portion of its adviser fee for sub-advisory services provided to the Portfolio. The Portfolio invests its cash in Cash Reserves Fund. EVM does not currently receive a fee for advisory services provided to Cash Reserves Fund. For the year ended October 31, 2012, the Portfolio’s investment adviser fee amounted to $904,479 or 0.88% of the Portfolio’s average daily net assets.
Trustees and officers of the Portfolio who are members of EVM’s or BMR’s organizations receive remuneration for their services to the Portfolio out of the investment adviser fee. Trustees of the Portfolio who are not affiliated with the investment adviser may elect to defer receipt of all or a percentage of their annual fees in accordance with the terms of the Trustees Deferred Compensation Plan. For the year ended October 31, 2012, no significant amounts have been deferred. Certain officers and Trustees of the Portfolio are officers of the above organizations.
3 Purchases and Sales of Investments
Purchases and sales of investments, other than short-term obligations, aggregated $116,394,357 and $119,889,457, respectively, for the year ended October 31, 2012.
Tax-Managed International Equity Portfolio
October 31, 2012
Notes to Financial Statements — continued
4 Federal Income Tax Basis of Investments
The cost and unrealized appreciation (depreciation) of investments of the Portfolio at October 31, 2012, as determined on a federal income tax basis, were as follows:
| | | | |
| |
Aggregate cost | | $ | 98,691,305 | |
| |
Gross unrealized appreciation | | $ | 6,622,306 | |
Gross unrealized depreciation | | | (2,791,026 | ) |
| |
Net unrealized appreciation | | $ | 3,831,280 | |
The net unrealized appreciation on foreign currency at October 31, 2012 on a federal income tax basis was $52,507.
5 Line of Credit
The Portfolio participates with other portfolios and funds managed by EVM and its affiliates in a $600 million unsecured line of credit agreement with a group of banks. Borrowings are made by the Portfolio solely to facilitate the handling of unusual and/or unanticipated short-term cash requirements. Interest is charged to the Portfolio based on its borrowings at an amount above either the Eurodollar rate or Federal Funds rate. In addition, a fee computed at an annual rate of 0.08% on the daily unused portion of the line of credit is allocated among the participating portfolios and funds at the end of each quarter. Because the line of credit is not available exclusively to the Portfolio, it may be unable to borrow some or all of its requested amounts at any particular time. The Portfolio did not have any significant borrowings or allocated fees during the year ended October 31, 2012.
6 Risks Associated with Foreign Investments
Investing in securities issued by companies whose principal business activities are outside the United States may involve significant risks not present in domestic investments. For example, there is generally less publicly available information about foreign companies, particularly those not subject to the disclosure and reporting requirements of the U.S. securities laws. Certain foreign issuers are generally not bound by uniform accounting, auditing, and financial reporting requirements and standards of practice comparable to those applicable to domestic issuers. Investments in foreign securities also involve the risk of possible adverse changes in investment or exchange control regulations, expropriation or confiscatory taxation, limitation on the removal of funds or other assets of the Portfolio, political or financial instability or diplomatic and other developments which could affect such investments. Foreign securities markets, while growing in volume and sophistication, are generally not as developed as those in the United States, and securities of some foreign issuers (particularly those located in developing countries) may be less liquid and more volatile than securities of comparable U.S. companies. In general, there is less overall governmental supervision and regulation of foreign securities markets, broker/dealers and issuers than in the United States.
7 Fair Value Measurements
Under generally accepted accounting principles for fair value measurements, a three-tier hierarchy to prioritize the assumptions, referred to as inputs, is used in valuation techniques to measure fair value. The three-tier hierarchy of inputs is summarized in the three broad levels listed below.
| Ÿ | | Level 1 – quoted prices in active markets for identical investments |
| Ÿ | | Level 2 – other significant observable inputs (including quoted prices for similar investments, interest rates, prepayment speeds, credit risk, etc.) |
| Ÿ | | Level 3 – significant unobservable inputs (including a fund’s own assumptions in determining the fair value of investments) |
In cases where the inputs used to measure fair value fall in different levels of the fair value hierarchy, the level disclosed is determined based on the lowest level input that is significant to the fair value measurement in its entirety. The inputs or methodology used for valuing securities are not necessarily an indication of the risk associated with investing in those securities.
Tax-Managed International Equity Portfolio
October 31, 2012
Notes to Financial Statements — continued
At October 31, 2012, the hierarchy of inputs used in valuing the Portfolio’s investments, which are carried at value, were as follows:
| | | | | | | | | | | | | | | | |
| Asset Description | | Level 1 | | | Level 2 | | | Level 3 | | | Total | |
| | | | |
Common Stocks | | | | | | | | | | | | | | | | |
Consumer Discretionary | | $ | — | | | $ | 11,173,394 | | | $ | — | | | $ | 11,173,394 | |
Consumer Staples | | | — | | | | 11,827,689 | | | | — | | | | 11,827,689 | |
Energy | | | — | | | | 9,395,964 | | | | — | | | | 9,395,964 | |
Financials | | | — | | | | 15,825,278 | | | | — | | | | 15,825,278 | |
Health Care | | | 799,102 | | | | 10,272,926 | | | | — | | | | 11,072,028 | |
Industrials | | | 7,274 | | | | 12,115,839 | | | | — | | | | 12,123,113 | |
Information Technology | | | — | | | | 6,705,506 | | | | — | | | | 6,705,506 | |
Materials | | | — | | | | 10,076,424 | | | | — | | | | 10,076,424 | |
Telecommunication Services | | | — | | | | 7,302,024 | | | | — | | | | 7,302,024 | |
Utilities | | | — | | | | 6,712,846 | | | | — | | | | 6,712,846 | |
| | | | |
Total Common Stocks | | $ | 806,376 | | | $ | 101,407,890 | * | | $ | — | | | $ | 102,214,266 | |
| | | | |
Short-Term Investments | | $ | — | | | $ | 308,319 | | | $ | — | | | $ | 308,319 | |
| | | | |
Total Investments | | $ | 806,376 | | | $ | 101,716,209 | | | $ | — | | | $ | 102,522,585 | |
| * | Includes foreign equity securities whose values were adjusted to reflect market trading of comparable securities or other correlated instruments that occurred after the close of trading in their applicable foreign markets. |
The Portfolio held no investments or other financial instruments as of October 31, 2011 whose fair value was determined using Level 3 inputs. At October 31, 2012, there were no investments transferred between Level 1 and Level 2 during the year then ended.
Tax-Managed International Equity Portfolio
October 31, 2012
Report of Independent Registered Public Accounting Firm
To the Trustees and Investors of Tax-Managed International Equity Portfolio:
We have audited the accompanying statement of assets and liabilities of Tax-Managed International Equity Portfolio (the “Portfolio”), including the portfolio of investments, as of October 31, 2012, and the related statement of operations for the year then ended, the statements of changes in net assets for each of the two years in the period then ended, and the supplementary data for each of the five years in the period then ended. These financial statements and supplementary data are the responsibility of the Portfolio’s management. Our responsibility is to express an opinion on these financial statements and supplementary data based on our audits.
We conducted our audits in accordance with the standards of the Public Company Accounting Oversight Board (United States). Those standards require that we plan and perform the audit to obtain reasonable assurance about whether the financial statements and supplementary data are free of material misstatement. The Portfolio is not required to have, nor were we engaged to perform, an audit of its internal control over financial reporting. Our audits included consideration of internal control over financial reporting as a basis for designing audit procedures that are appropriate in the circumstances, but not for the purpose of expressing an opinion on the effectiveness of the Portfolio’s internal control over financial reporting. Accordingly, we express no such opinion. An audit also includes examining on a test basis, evidence supporting the amounts and disclosures in the financial statements, assessing the accounting principles used and significant estimates made by management, as well as evaluating the overall financial statement presentation. Our procedures included confirmation of securities owned as of October 31, 2012, by correspondence with the custodian and brokers; where replies were not received from brokers, we performed other auditing procedures. We believe that our audits provide a reasonable basis for our opinion.
In our opinion, such financial statements and supplementary data referred to above present fairly, in all material respects, the financial position of Tax-Managed International Equity Portfolio as of October 31, 2012, the results of its operations for the year then ended, the changes in its net assets for each of the two years in the period then ended, and the supplementary data for each of the five years in the period then ended, in conformity with accounting principles generally accepted in the United States of America.
DELOITTE & TOUCHE LLP
Boston, Massachusetts
December 18, 2012
Eaton Vance
Tax-Managed International Equity Fund
October 31, 2012
Special Meeting of Shareholders (Unaudited)
Eaton Vance Tax-Managed International Equity Fund
The Fund held a Special Meeting of Shareholders on August 17, 2012 to approve a new Sub-Advisory Agreement for Tax-Managed International Equity Portfolio (the “Portfolio”), the registered investment company in which Eaton Vance Tax-Managed International Equity Fund invests, between Boston Management and Research (“BMR”) and Parametric Portfolio Associates LLC (“Parametric”), and to authorize BMR to select investment sub-advisers and enter into sub-advisory agreements for the Portfolio without obtaining shareholder approval to the extent permitted by applicable law. The results of the vote were as follows:
| | | | | | | | | | | | |
| | | Number of Shares | |
| | | For | | | Against/Withheld | | | Abstain | |
Proposal 1. To approve a new Sub-Advisory Agreement for the Portfolio between BMR and Parametric. | | | 2,849,914.618 | | | | 77,126.320 | | | | 150,975.364 | |
Proposal 2. To authorize BMR to select investment sub-advisers and enter into sub-advisory agreements for the Portfolio without obtaining shareholder approval to the extent permitted by applicable law. | | | 2,748,271.183 | | | | 173,047.285 | | | | 156,697.834 | |
|
| Tax-Managed International Equity Portfolio | |
| | | |
| | | | | | | | | | | | |
| The Portfolio held a Special Meeting of Interestholders on August 17, 2012 to approve a new Sub-Advisory Agreement for the Portfolio between BMR and Parametric, and to authorize BMR to select investment sub-advisers and enter into sub-advisory agreements for the Portfolio without obtaining shareholder approval to the extent permitted by applicable law. The results of the vote were as follows: | |
| | | Interest in the Portfolio | |
| | | For | | | Against/Withheld | | | Abstain | |
Proposal 1. To approve a new Sub-Advisory Agreement for the Portfolio between BMR and Parametric. | | | 92.589% | | | | 2.506% | | | | 4.905 | % |
Proposal 2. To authorize BMR to select investment sub-advisers and enter into sub-advisory agreements for the Portfolio without obtaining shareholder approval to the extent permitted by applicable law. | | | 89.287% | | | | 5.622% | | | | 5.091 | % |
Eaton Vance
Tax-Managed International Equity Fund
October 31, 2012
Management and Organization
Fund Management. The Trustees of Eaton Vance Mutual Funds Trust (the Trust) and Tax-Managed International Equity Portfolio (the Portfolio) are responsible for the overall management and supervision of the Trust’s and Portfolio’s affairs. The Trustees and officers of the Trust and the Portfolio are listed below. Except as indicated, each individual has held the office shown or other offices in the same company for the last five years. Trustees and officers of the Trust and the Portfolio hold indefinite terms of office. The “Noninterested Trustees” consist of those Trustees who are not “interested persons” of the Trust and the Portfolio, as that term is defined under the 1940 Act. The business address of each Trustee and officer is Two International Place, Boston, Massachusetts 02110. As used below, “EVC” refers to Eaton Vance Corp., “EV” refers to Eaton Vance, Inc., “EVM” refers to Eaton Vance Management, “BMR” refers to Boston Management and Research and “EVD” refers to Eaton Vance Distributors, Inc. EVC and EV are the corporate parent and trustee, respectively, of EVM and BMR. EVD is the Fund’s principal underwriter, the Portfolio’s placement agent and a wholly-owned subsidiary of EVC. Each officer affiliated with Eaton Vance may hold a position with other Eaton Vance affiliates that is comparable to his or her position with EVM listed below. Each Trustee oversees 187 portfolios in the Eaton Vance Complex (including all master and feeder funds in a master feeder structure). Each officer serves as an officer of certain other Eaton Vance funds. Each Trustee and officer serves until his or her successor is elected.
| | | | | | |
| Name and Year of Birth | | Position(s) with the Trust and the Portfolio | | Length of
Service | | Principal Occupation(s) and Directorships During Past Five Years and Other Relevant Experience |
Interested Trustee | | | | | | |
| | | |
Thomas E. Faust Jr. 1958 | | Trustee | | Since 2007 | | Chairman, Chief Executive Officer and President of EVC, Director and President of EV, Chief Executive Officer and President of EVM and BMR, and Director of EVD. Trustee and/or officer of 187 registered investment companies. Mr. Faust is an interested person because of his positions with EVM, BMR, EVD, EVC and EV, which are affiliates of the Trust and the Portfolio. Directorships in the Last Five Years.(1) Director of EVC and Hexavest Inc. |
| | | |
| | | | | | |
Noninterested Trustees | | | | | | |
| | | |
Scott E. Eston 1956 | | Trustee | | Since 2011 | | Private investor. Formerly held various positions at Grantham, Mayo, Van Otterloo and Co., L.L.C. (investment management firm) (1997-2009), including Chief Operating Officer (2002-2009), Chief Financial Officer (1997-2009) and Chairman of the Executive Committee (2002-2008); President and Principal Executive Officer, GMO Trust (open-end registered investment company) (2006-2009). Former Partner, Coopers and Lybrand L.L.P. (now PricewaterhouseCoopers) (public accounting firm) (1987-1997). Directorships in the Last Five Years. None. |
| | | |
Benjamin C. Esty 1963 | | Trustee | | Since 2005 | | Roy and Elizabeth Simmons Professor of Business Administration and Finance Unit Head, Harvard University Graduate School of Business Administration. Directorships in the Last Five Years.(1) None. |
| | | |
Allen R. Freedman 1940 | | Trustee | | Since 2007 | | Private Investor. Former Chairman (2002-2004) and a Director (1983-2004) of Systems & Computer Technology Corp. (provider of software to higher education). Formerly, a Director of Loring Ward International (fund distributor) (2005-2007). Former Chairman and a Director of Indus International, Inc. (provider of enterprise management software to the power generating industry) (2005-2007). Former Chief Executive Officer of Assurant, Inc. (insurance provider) (1979-2000). Directorships in the Last Five Years.(1) Director of Stonemor Partners, L.P. (owner and operator of cemeteries). Formerly, Director of Assurant, Inc. (insurance provider) (1979-2011). |
| | | |
William H. Park 1947 | | Trustee | | Since 2003 | | Consultant and private investor. Formerly, Chief Financial Officer, Aveon Group L.P. (investment management firm) (2010-2011). Formerly, Vice Chairman, Commercial Industrial Finance Corp. (specialty finance company) (2006-2010). Formerly, President and Chief Executive Officer, Prizm Capital Management, LLC (investment management firm) (2002-2005). Formerly, Executive Vice President and Chief Financial Officer, United Asset Management Corporation (investment management firm) (1982-2001). Formerly, Senior Manager, Price Waterhouse (now PricewaterhouseCoopers) (an independent registered public accounting firm) (1972-1981). Directorships in the Last Five Years.(1) None. |
| | | |
Ronald A. Pearlman 1940 | | Trustee | | Since 2003 | | Professor of Law, Georgetown University Law Center. Formerly, Deputy Assistant Secretary (Tax Policy) and Assistant Secretary (Tax Policy), U.S. Department of the Treasury (1983-1985). Formerly, Chief of Staff, Joint Committee on Taxation, U.S. Congress (1988-1990). Directorships in the Last Five Years.(1) None. |
Eaton Vance
Tax-Managed International Equity Fund
October 31, 2012
Management and Organization — continued
| | | | | | |
| Name and Year of Birth | | Position(s) with the Trust and the Portfolio | | Length of
Service | | Principal Occupation(s) and Directorships During Past Five Years and Other Relevant Experience |
Noninterested Trustees (continued) |
| | | |
Helen Frame Peters 1948 | | Trustee | | Since 2008 | | Professor of Finance, Carroll School of Management, Boston College. Formerly, Dean, Carroll School of Management, Boston College (2000-2002). Formerly, Chief Investment Officer, Fixed Income, Scudder Kemper Investments (investment management firm) (1998-1999). Formerly, Chief Investment Officer, Equity and Fixed Income, Colonial Management Associates (investment management firm) (1991-1998). Directorships in the Last Five Years.(1) Formerly, Director of BJ’s Wholesale Club, Inc. (wholesale club retailer) (2004-2011). Formerly, Trustee of SPDR Index Shares Funds and SPDR Series Trust (exchange traded funds) (2000-2009). Formerly, Director of Federal Home Loan Bank of Boston (a bank for banks) (2007-2009). |
| | | |
Lynn A. Stout 1957 | | Trustee | | Since 1998 | | Distinguished Professor of Corporate and Business Law, Jack G. Clarke Business Law Institute, Cornell University Law School. Formerly, the Paul Hastings Professor of Corporate and Securities Law (2006-2012) and Professor of Law (2001-2006), University of California at Los Angeles School of Law. Directorships in the Last Five Years.(1) None. |
| | | |
Harriett Tee Taggart 1948 | | Trustee | | Since 2011 | | Managing Director, Taggart Associates (a professional practice firm). Formerly, Partner and Senior Vice President, Wellington Management Company, LLP (investment management firm) (1983-2006). Directorships in the Last Five Years. Director of Albemarle Corporation (chemicals manufacturer) (since 2007) and The Hanover Group (specialty property and casualty insurance company) (since 2009). Formerly, Director of Lubrizol Corporation (specialty chemicals) (2007-2011). |
| | | |
Ralph F. Verni 1943 | | Chairman of the Board and Trustee | | Chairman of the Board since 2007 and Trustee since 2005 | | Consultant and private investor. Formerly, Chief Investment Officer (1982-1992), Chief Financial Officer (1988-1990) and Director (1982-1992), New England Life. Formerly, Chairperson, New England Mutual Funds (1982-1992). Formerly, President and Chief Executive Officer, State Street Management & Research (1992-2000). Formerly, Chairperson, State Street Research Mutual Funds (1992-2000). Formerly, Director, W.P. Carey, LLC (1998-2004) and First Pioneer Farm Credit Corp. (2002-2006). Directorships in the Last Five Years.(1) None. |
| | | |
| | | | | | |
Principal Officers who are not Trustees | | |
| Name and Year of Birth | | Position(s) with the
Trust and the
Portfolio | | Length of Service | | Principal Occupation(s) During Past Five Years |
| | | |
Duncan W. Richardson 1957 | | President | | Of the Trust since 2011 and of the Portfolio since 2002 | | Director of EVC and Executive Vice President and Chief Equity Investment Officer of EVC, EVM and BMR. |
| | | |
Payson F. Swaffield 1956 | | Vice President of the Trust | | Since 2011 | | Vice President and Chief Income Investment Officer of EVM and BMR. |
| | | |
Barbara E. Campbell 1957 | | Treasurer | | Of the Trust since 2005 and of the Portfolio since 2008 | | Vice President of EVM and BMR. |
| | | |
Maureen A. Gemma 1960 | | Vice President, Secretary and Chief Legal Officer | | Vice President since 2011, Secretary since 2007 and Chief Legal Officer since 2008 | | Vice President of EVM and BMR. |
Eaton Vance
Tax-Managed International Equity Fund
October 31, 2012
Management and Organization — continued
| | | | | | |
| Name and Year of Birth | | Position(s) with the Trust and the Portfolio | | Length of Service | | Principal Occupation(s) During Past Five Years |
Principal Officers who are not Trustees (continued) |
| | | |
Paul M. O’Neil 1953 | | Chief Compliance Officer | | Since 2004 | | Vice President of EVM and BMR. |
| (1) | During their respective tenures, the Trustees (except Mr. Eston and Ms. Taggart) also served as trustees of one or more of the following Eaton Vance funds (which operated in the years noted): Eaton Vance Credit Opportunities Fund (launched in 2005 and terminated in 2010); Eaton Vance Insured Florida Plus Municipal Bond Fund (launched in 2002 and terminated in 2009); and Eaton Vance National Municipal Income Trust (launched in 1998 and terminated in 2009). |
The SAI for the Fund includes additional information about the Trustees and officers of the Fund and the Portfolio and can be obtained without charge on Eaton Vance’s website at www.eatonvance.com or by calling 1-800-262-1122.
Eaton Vance Funds
IMPORTANT NOTICES
Privacy. The Eaton Vance organization is committed to ensuring your financial privacy. Each of the financial institutions identified below has in effect the following policy (“Privacy Policy”) with respect to nonpublic personal information about its customers:
| Ÿ | | Only such information received from you, through application forms or otherwise, and information about your Eaton Vance fund transactions will be collected. This may include information such as name, address, social security number, tax status, account balances and transactions. |
| Ÿ | | None of such information about you (or former customers) will be disclosed to anyone, except as permitted by law (which includes disclosure to employees necessary to service your account). In the normal course of servicing a customer’s account, Eaton Vance may share information with unaffiliated third parties that perform various required services such as transfer agents, custodians and broker-dealers. |
| Ÿ | | Policies and procedures (including physical, electronic and procedural safeguards) are in place that are designed to protect the confidentiality of such information. |
| Ÿ | | We reserve the right to change our Privacy Policy at any time upon proper notification to you. Customers may want to review our Privacy Policy periodically for changes by accessing the link on our homepage: www.eatonvance.com. |
Our pledge of privacy applies to the following entities within the Eaton Vance organization: the Eaton Vance Family of Funds, Eaton Vance Management, Eaton Vance Investment Counsel, Eaton Vance Distributors, Inc., Eaton Vance Trust Company, Eaton Vance Management’s Real Estate Investment Group and Boston Management and Research. In addition, our Privacy Policy applies only to those Eaton Vance customers who are individuals and who have a direct relationship with us. If a customer’s account (i.e., fund shares) is held in the name of a third-party financial advisor/broker-dealer, it is likely that only such advisor’s privacy policies apply to the customer. This notice supersedes all previously issued privacy disclosures. For more information about Eaton Vance’s Privacy Policy, please call 1-800-262-1122.
Delivery of Shareholder Documents. The Securities and Exchange Commission (SEC) permits funds to deliver only one copy of shareholder documents, including prospectuses, proxy statements and shareholder reports, to fund investors with multiple accounts at the same residential or post office box address. This practice is often called “householding” and it helps eliminate duplicate mailings to shareholders. Eaton Vance, or your financial advisor, may household the mailing of your documents indefinitely unless you instruct Eaton Vance, or your financial advisor, otherwise. If you would prefer that your Eaton Vance documents not be householded, please contact Eaton Vance at 1-800-262-1122, or contact your financial advisor. Your instructions that householding not apply to delivery of your Eaton Vance documents will be effective within 30 days of receipt by Eaton Vance or your financial advisor.
Portfolio Holdings. Each Eaton Vance Fund and its underlying Portfolio(s) (if applicable) will file a schedule of portfolio holdings on Form N-Q with the SEC for the first and third quarters of each fiscal year. The Form N-Q will be available on the Eaton Vance website at www.eatonvance.com, by calling Eaton Vance at 1-800-262-1122 or in the EDGAR database on the SEC’s website at www.sec.gov. Form N-Q may also be reviewed and copied at the SEC’s public reference room in Washington, D.C. (call 1-800-732-0330 for information on the operation of the public reference room).
Proxy Voting. From time to time, funds are required to vote proxies related to the securities held by the funds. The Eaton Vance Funds or their underlying Portfolios (if applicable) vote proxies according to a set of policies and procedures approved by the Funds’ and Portfolios’ Boards. You may obtain a description of these policies and procedures and information on how the Funds or Portfolios voted proxies relating to portfolio securities during the most recent 12-month period ended June 30, without charge, upon request, by calling 1-800-262-1122 and by accessing the SEC’s website at www.sec.gov.
Investment Adviser of Tax-Managed International Equity Portfolio
Boston Management and Research
Two International Place
Boston, MA 02110
Sub-Adviser of Tax-Managed International Equity Portfolio
Parametric Portfolio Associates LLC
1918 Eighth Avenue, Suite 3100
Seattle, WA 98101
Administrator of Eaton Vance Tax-Managed International Equity Fund
Eaton Vance Management
Two International Place
Boston, MA 02110
Principal Underwriter*
Eaton Vance Distributors, Inc.
Two International Place
Boston, MA 02110
(617) 482-8260
Custodian
State Street Bank and Trust Company
200 Clarendon Street
Boston, MA 02116
Transfer Agent
BNY Mellon Investment Servicing (US) Inc.
Attn: Eaton Vance Funds
P.O. Box 9653
Providence, RI 02940-9653
(800) 262-1122
Independent Registered Public Accounting Firm
Deloitte & Touche LLP
200 Berkeley Street
Boston, MA 02116-5022
Fund Offices
Two International Place
Boston, MA 02110
| * | FINRA BrokerCheck. Investors may check the background of their Investment Professional by contacting the Financial Industry Regulatory Authority (FINRA). FINRA BrokerCheck is a free tool to help investors check the professional background of current and former FINRA-registered securities firms and brokers. FINRA BrokerCheck is available by calling 1-800-289-9999 and at www.FINRA.org. The FINRA BrokerCheck brochure describing this program is available to investors at www.FINRA.org. |
038-12/12 IGSRC
| | |
Eaton Vance Tax-Managed Multi-Cap Growth Fund Annual Report October 31, 2012 | | 
|

Fund shares are not insured by the FDIC and are not deposits or other obligations of, or guaranteed by, any depository institution. Shares are subject to investment risks, including possible loss of principal invested.
This report must be preceded or accompanied by a current summary prospectus or prospectus. Before investing, investors should consider carefully the investment objective, risks, and charges and expenses of a mutual fund. This and other important information is contained in the summary prospectus and prospectus, which can be obtained from a financial advisor. Prospective investors should read the prospectus carefully before investing. For further information, please call 1-800-262-1122.
Annual Report October 31, 2012
Eaton Vance
Tax-Managed Multi-Cap Growth Fund
Table of Contents
| | | | |
Management’s Discussion of Fund Performance | | | 2 | |
| |
Performance | | | 3 | |
| |
Fund Profile | | | 4 | |
| |
Endnotes and Additional Disclosures | | | 5 | |
| |
Fund Expenses | | | 6 | |
| |
Financial Statements | | | 7 | |
| |
Report of Independent Registered Public Accounting Firm | | | 16 and 30 | |
| |
Federal Tax Information | | | 17 | |
| |
Management and Organization | | | 31 | |
| |
Important Notices | | | 34 | |
Eaton Vance
Tax-Managed Multi-Cap Growth Fund
October 31, 2012
Management’s Discussion of Fund Performance1
Economic and Market Conditions
As the period began, investors appeared to worry about intensifying debt problems in Europe, high U.S. unemployment and a Congressional deadlock that left businesses perplexed about the direction of tax and regulatory policy. The S&P 500 Index2 was relatively flat in November 2011.
Beginning in mid-December 2011, however, an equity rally took hold and continued into early April 2012, fueled by stronger economic growth in the fourth quarter, falling unemployment, the Long-Term Refinancing Operation announced by the European Central Bank, and what the markets perceived as a successful restructuring of Greek debt. Then in May 2012, the third annual mid-year economic slowdown arrived, instigated by renewed concerns in Europe, slowing growth in China and political uncertainty in the United States with the upcoming presidential election.
But despite a slowdown in consumer spending, weakening employment data and downward revisions of growth expectations, global equities moved upward intermittently from June through mid-October 2012. Several factors appeared to be driving a market rally that defied U.S. economic data. First, investors anticipated that worsening economic news would prompt the U.S. Federal Reserve to initiate another round of quantitative easing to stimulate the economy — which it did in mid-September 2012. Second, investors were hunting for yield in a historically low interest-rate environment, and many were driven to stocks that offered higher yields than bonds.
Finally, in an increasingly global marketplace, a case could be made that the U.S. market was relatively attractive versus many other world markets for much of the period. Europe’s ongoing debt crisis led investors to move money out of European stocks and bonds. With emerging markets in Asia largely leveraged to the Chinese economy, the slowdown in Chinese growth made markets throughout Asia appear less attractive. Amid this global economic turmoil, the U.S. market was one of the few places investors could find an economy that was growing (albeit slowly); a liquid, transparent and generally well-regulated market; and an opportunity to find companies with large cash reserves and solid profit growth.
In the final weeks of the period, however, U.S. stocks gave back some of their gains as the market seemed to have come full circle; amid uncertainty about the upcoming elections, investors once again worried about a Congressional deadlock on tax policy — an impasse that has left the economy rushing headlong toward a self-imposed fiscal cliff.
Fund Performance
For the fiscal year ended October 31, 2012, Eaton Vance Tax-Managed Multi-Cap Growth Fund (the Fund) had a total return of 9.11% for Class A shares at net asset value (NAV).
By comparison, the Fund’s primary benchmark, the Russell 3000 Growth Index (the Index), returned 12.76% for the period.
The Fund underperformed the Index due primarily to stock selection. Sector allocation overall was a modest positive offset. The environment of economic uncertainty and market volatility during the period challenged the Fund’s focus on long-term growth opportunities. In general, investors favored large-cap, dividend-paying stocks rather than the mid-cap growth stocks to which the Fund had greater exposure. Nevertheless, the Fund achieved positive absolute returns in seven of the eight economic sectors in which it was invested. The Index recorded positive returns in all 10 of its sectors.
The biggest detractor from the Fund’s relative performance versus the Index was the health care sector. A major software provider in the health care technology industry was one of the Fund’s worst performing individual stocks after a new product was delayed. Stock selection was also a drag on the Fund’s results versus the Index in the energy sector. The Fund’s holdings in a mid-sized independent oil and gas exploration and production company hurt the Fund’s relative performance versus the Index when it reported disappointing financial results. An underweight in the underperforming oil, gas & consumable fuels industry partially offset stock selection in the energy sector. The financials sector also hurt the Fund’s relative results versus the Index due to stock selection. The Fund’s real estate investment trust (REIT) holdings were notable underperformers due to both stock selection and an underweight position.
On the positive side, stock selection in the consumer discretionary sector made the biggest contribution to the Fund’s performance versus the Index. In the hotels, restaurants & leisure industry a leading international fast food chain was one of the Fund’s best performing stocks during the period. A major online travel agency specializing in European hotel bookings was another holding contributing to Fund performance. The Fund’s holdings in the information technology sector also outperformed, thanks to stock selection as well as stock allocation. The stock contributing the most to Fund performance for the 12-month period was a major supplier of semiconductors to the mobile phone and tablet market. In the internet software and services industry, a leading provider of cloud computing services to businesses was another contributor. Stock selection in the consumer staples sector, led by the beverages industry, also boosted the Fund’s relative performance versus the Index.
See Endnotes and Additional Disclosures in this report.
Past performance is no guarantee of future results. Returns are historical and are calculated by determining the percentage change in net asset value (NAV) or offering price (as applicable) with all distributions reinvested. Investment return and principal value will fluctuate so that shares, when redeemed, may be worth more or less than their original cost. Performance less than one year is cumulative. Performance is for the stated time period only; due to market volatility, the Fund’s current performance may be lower or higher than quoted.. Returns are before taxes unless otherwise noted. For performance as of the most recent month end, please refer to www.eatonvance.com.
Eaton Vance
Tax-Managed Multi-Cap Growth Fund
October 31, 2012
Performance2,3
Portfolio Managers Kwang Kim, Gerald Moore, CFA and G. R. Nelson
| | | | | | | | | | | | | | | | |
| % Average Annual Total Returns | | Inception Date | | | One Year | | | Five Years | | | Ten Years | |
Class A at NAV | | | 06/30/2000 | | | | 9.11 | % | | | –2.25 | % | | | 8.68 | % |
Class A with 5.75% Maximum Sales Charge | | | — | | | | 2.81 | | | | –3.41 | | | | 8.04 | |
Class B at NAV | | | 07/10/2000 | | | | 8.30 | | | | –3.00 | | | | 7.85 | |
Class B with 5% Maximum Sales Charge | | | — | | | | 3.30 | | | | –3.34 | | | | 7.85 | |
Class C at NAV | | | 07/10/2000 | | | | 8.38 | | | | –2.98 | | | | 7.87 | |
Class C with 1% Maximum Sales Charge | | | — | | | | 7.38 | | | | –2.98 | | | | 7.87 | |
Russell 3000 Growth Index | | | — | | | | 12.76 | % | | | 1.90 | % | | | 7.32 | % |
S&P 500 Index | | | — | | | | 15.21 | | | | 0.36 | | | | 6.90 | |
| | | | |
| | | | | | | | | | | | | | | | |
| % After-Tax Returns with Maximum Sales Charge | | Inception Date | | | One Year | | | Five Years | | | Ten Years | |
Class A After Taxes on Distributions | | | 06/30/2000 | | | | 2.81 | % | | | –3.95 | % | | | 7.68 | % |
Class A After Taxes on Distributions and Sale of Fund Shares | | | — | | | | 1.83 | | | | –2.97 | | | | 7.06 | |
Class B After Taxes on Distributions | | | 07/10/2000 | | | | 3.30 | | | | –3.88 | | | | 7.49 | |
Class B After Taxes on Distributions and Sale of Fund Shares | | | — | | | | 2.14 | | | | –2.89 | | | | 6.90 | |
Class C After Taxes on Distributions | | | 07/10/2000 | | | | 7.38 | | | | –3.52 | | | | 7.50 | |
Class C After Taxes on Distributions and Sale of Fund Shares | | | — | | | | 4.79 | | | | –2.60 | | | | 6.91 | |
| | | | |
| | | | | | | | | | | | | | | | |
| % Total Annual Operating Expense Ratios4 | | | | | Class A | | | Class B | | | Class C | |
| | | | | | | 1.48 | % | | | 2.23 | % | | | 2.23 | % |
Performance of $10,000
This graph shows the change in value of a hypothetical investment of $10,000 in Class A of the Fund for the period indicated. For comparison, the same investment is shown in the indicated index.
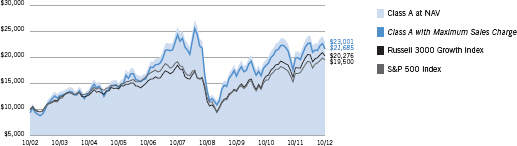
| | | | | | | | | | |
| Performance of Investment | | Amount
Invested | | Period Beginning | | At NAV | | With Maximum
Sales Charge |
Class B | | $ 10,000 | | 10/31/2002 | | $21,313 | | N.A. |
Class C | | $ 10,000 | | 10/31/2002 | | $21,338 | | N.A. |
See Endnotes and Additional Disclosures in this report.
Past performance is no guarantee of future results. Returns are historical and are calculated by determining the percentage change in net asset value (NAV) or offering price (as applicable) with all distributions reinvested. Investment return and prin-cipal value will fluctuate so that shares, when redeemed, may be worth more or less than their original cost. Performance less than one year is cumulative. Performance is for the stated time period only; due to market volatility, the Fund’s current performance may be lower or higher than quoted. Returns are before taxes unless otherwise noted. For performance as of the most recent month end, please refer to www.eatonvance.com.
Eaton Vance
Tax-Managed Multi-Cap Growth Fund
October 31, 2012
Fund Profile5
Top 10 Holdings (% of net assets)6
| | | | | | |
Apple, Inc. | | | 6.9 | % | | |
Google, Inc., Class A | | | 3.0 | | | |
Cirrus Logic, Inc. | | | 2.4 | | | |
Yum! Brands, Inc. | | | 2.2 | | | |
Tractor Supply Co. | | | 1.9 | | | |
Intuitive Surgical, Inc. | | | 1.8 | | | |
W.W. Grainger, Inc. | | | 1.8 | | | |
Rackspace Hosting, Inc. | | | 1.6 | | | |
EOG Resources, Inc. | | | 1.6 | | | |
QUALCOMM, Inc. | | | 1.6 | | | |
Total | | | 24.8 | % | | |
See Endnotes and Additional Disclosures in this report.
Eaton Vance
Tax-Managed Multi-Cap Growth Fund
October 31, 2012
Endnotes and Additional Disclosures
| 1 | The views expressed in this report are those of the portfolio manager(s) and are current only through the date stated at the top of this page. These views are subject to change at any time based upon market or other conditions, and Eaton Vance and the Fund(s) disclaim any responsibility to update such views. These views may not be relied upon as investment advice and, because investment decisions are based on many factors, may not be relied upon as an indication of trading intent on behalf of any Eaton Vance fund. This commentary may contain statements that are not historical facts, referred to as “forward looking statements”. The Fund’s actual future results may differ significantly from those stated in any forward looking statement, depending on factors such as changes in securities or financial markets or general economic conditions, the volume of sales and purchases of Fund shares, the continuation of investment advisory, administrative and service contracts, and other risks discussed from time to time in the Fund’s filings with the Securities and Exchange Commission. |
| 2 | S&P 500 Index is an unmanaged index of large-cap stocks commonly used as a measure of U.S. stock market performance. Russell 3000 Growth Index is an unmanaged index of the broad growth segment of the U.S. equity universe. Unless otherwise stated, index returns do not reflect the effect of any applicable sales charges, commissions, expenses, taxes or leverage, as applicable. It is not possible to invest directly in an index. |
| 3 | Total Returns at NAV do not include applicable sales charges. If sales charges were deducted, the returns would be lower. Total Returns shown with maximum sales charge reflect the stated maximum sales charge. Unless otherwise stated, performance does not reflect the deduction of taxes on Fund distributions or redemptions of Fund shares. After-tax returns are calculated using certain assumptions, including using the highest historical individual federal income tax rates and do not reflect the impact of state/local taxes. Actual after-tax returns depend on a shareholder’s tax situation and the actual characterization of distributions and may differ from those shown. After-tax returns are not relevant to shareholders who hold shares in tax-deferred accounts or shares held by nontaxable entities. Return After Taxes on Distributions may be the same as Return Before Taxes for the same period because no taxable distributions were made during that period. Return After Taxes on Distributions and Sale of Fund Shares may be greater than or equal to Return After Taxes on Distributions for the same period because of losses realized on the sale of Fund shares. The Fund’s after-tax returns also may reflect foreign tax credits passed by the Fund to its shareholders. |
| 4 | Source: Fund prospectus. |
| 5 | Fund invests in an affiliated investment company (Portfolio) with the same objective(s) and policies as the Fund. References to investments are to the Portfolio’s holdings. |
| 6 | Depictions do not reflect the Fund’s option positions. Excludes cash and cash equivalents. |
| | Fund profile subject to change due to active management. |
Important Notice to Shareholders
Tax code provisions applicable to tax-favored dividends are effective for distributions paid on or before December 31, 2012. Thereafter, dividends will be taxable as ordinary income unless further legislative action is taken.
Eaton Vance
Tax-Managed Multi-Cap Growth Fund
October 31, 2012
Fund Expenses
Example: As a Fund shareholder, you incur two types of costs: (1) transaction costs, including sales charges (loads) on purchases and redemption fees (if applicable); and (2) ongoing costs, including management fees; distribution and/or service fees; and other Fund expenses. This Example is intended to help you understand your ongoing costs (in dollars) of Fund investing and to compare these costs with the ongoing costs of investing in other mutual funds. The Example is based on an investment of $1,000 invested at the beginning of the period and held for the entire period (May 1, 2012 – October 31, 2012).
Actual Expenses: The first section of the table below provides information about actual account values and actual expenses. You may use the information in this section, together with the amount you invested, to estimate the expenses that you paid over the period. Simply divide your account value by $1,000 (for example, an $8,600 account value divided by $1,000 = 8.6), then multiply the result by the number in the first section under the heading entitled “Expenses Paid During Period” to estimate the expenses you paid on your account during this period.
Hypothetical Example for Comparison Purposes: The second section of the table below provides information about hypothetical account values and hypothetical expenses based on the actual Fund expense ratio and an assumed rate of return of 5% per year (before expenses), which is not the actual Fund return. The hypothetical account values and expenses may not be used to estimate the actual ending account balance or expenses you paid for the period. You may use this information to compare the ongoing costs of investing in your Fund and other funds. To do so, compare this 5% hypothetical example with the 5% hypothetical examples that appear in the shareholder reports of the other funds.
Please note that the expenses shown in the table are meant to highlight your ongoing costs only and do not reflect any transactional costs, such as sales charges (loads) or redemption fees (if applicable). Therefore, the second section of the table is useful in comparing ongoing costs only, and will not help you determine the relative total costs of owning different funds. In addition, if these transactional costs were included, your costs would be higher.
| | | | | | | | | | | | | | | | |
| | | Beginning
Account Value
(5/1/12) | | | Ending
Account Value
(10/31/12) | | | Expenses Paid
During Period*
(5/1/12 – 10/31/12) | | | Annualized
Expense
Ratio | |
| | | | |
| | | | | | | | | | | | | | | | |
Actual | | | | | | | | | | | | | | | | |
Class A | | $ | 1,000.00 | | | $ | 953.40 | | | $ | 7.22 | | | | 1.47 | % |
Class B | | $ | 1,000.00 | | | $ | 950.00 | | | $ | 10.93 | | | | 2.23 | % |
Class C | | $ | 1,000.00 | | | $ | 950.00 | | | $ | 10.88 | | | | 2.22 | % |
| | | | | | | | | | | | | | | | | |
| | | | |
| | | | | | | | | | | | | | | | |
Hypothetical | | | | | | | | | | | | | |
(5% return per year before expenses) | | | | | | | | | | | | | |
Class A | | $ | 1,000.00 | | | $ | 1,017.70 | | | $ | 7.46 | | | | 1.47 | % |
Class B | | $ | 1,000.00 | | | $ | 1,013.90 | | | $ | 11.29 | | | | 2.23 | % |
Class C | | $ | 1,000.00 | | | $ | 1,014.00 | | | $ | 11.24 | | | | 2.22 | % |
| * | Expenses are equal to the Fund’s annualized expense ratio for the indicated Class, multiplied by the average account value over the period, multiplied by 184/366 (to reflect the one-half year period). The Example assumes that the $1,000 was invested at the net asset value per share determined at the close of business on April 30, 2012. The Example reflects the expenses of both the Fund and the Portfolio. |
Eaton Vance
Tax-Managed Multi-Cap Growth Fund
October 31, 2012
Statement of Assets and Liabilities
| | | | |
| Assets | | October 31, 2012 | |
Investment in Tax-Managed Multi-Cap Growth Portfolio, at value (identified cost, $46,803,610) | | $ | 54,608,837 | |
Receivable for Fund shares sold | | | 4,268 | |
Total assets | | $ | 54,613,105 | |
|
| Liabilities | |
Payable for Fund shares redeemed | | $ | 74,241 | |
Payable to affiliates: | | | | |
Distribution and service fees | | | 23,644 | |
Administration fee | | | 7,166 | |
Trustees’ fees | | | 42 | |
Accrued expenses | | | 46,587 | |
Total liabilities | | $ | 151,680 | |
Net Assets | | $ | 54,461,425 | |
|
| Sources of Net Assets | |
Paid-in capital | | $ | 63,338,112 | |
Accumulated net realized loss from Portfolio | | | (16,146,377 | ) |
Accumulated net investment loss | | | (535,537 | ) |
Net unrealized appreciation from Portfolio | | | 7,805,227 | |
Total | | $ | 54,461,425 | |
| |
| Class A Shares | | | | |
Net Assets | | $ | 36,579,062 | |
Shares Outstanding | | | 2,631,786 | |
Net Asset Value and Redemption Price Per Share | | | | |
(net assets ÷ shares of beneficial interest outstanding) | | $ | 13.90 | |
Maximum Offering Price Per Share | | | | |
(100 ÷ 94.25 of net asset value per share) | | $ | 14.75 | |
|
| Class B Shares | |
Net Assets | | $ | 2,333,785 | |
Shares Outstanding | | | 186,266 | |
Net Asset Value and Offering Price Per Share* | | | | |
(net assets ÷ shares of beneficial interest outstanding) | | $ | 12.53 | |
|
| Class C Shares | |
Net Assets | | $ | 15,548,578 | |
Shares Outstanding | | | 1,239,253 | |
Net Asset Value and Offering Price Per Share* | | | | |
(net assets ÷ shares of beneficial interest outstanding) | | $ | 12.55 | |
On sales of $50,000 or more, the offering price of Class A shares is reduced.
| * | Redemption price per share is equal to the net asset value less any applicable contingent deferred sales charge. |
| | | | |
| | 7 | | See Notes to Financial Statements. |
Eaton Vance
Tax-Managed Multi-Cap Growth Fund
October 31, 2012
Statement of Operations
| | | | |
| Investment Income | | Year Ended
October 31, 2012 | |
Dividends allocated from Portfolio (net of foreign taxes, $8,729) | | $ | 400,880 | |
Interest allocated from Portfolio | | | 1,143 | |
Expenses allocated from Portfolio | | | (449,538 | ) |
Total investment loss from Portfolio | | $ | (47,515 | ) |
|
| Expenses | |
Administration fee | | $ | 86,966 | |
Distribution and service fees | | | | |
Class A | | | 97,298 | |
Class B | | | 28,671 | |
Class C | | | 161,983 | |
Trustees’ fees and expenses | | | 500 | |
Custodian fee | | | 18,083 | |
Transfer and dividend disbursing agent fees | | | 72,063 | |
Legal and accounting services | | | 23,831 | |
Printing and postage | | | 20,640 | |
Registration fees | | | 44,437 | |
Miscellaneous | | | 10,877 | |
Total expenses | | $ | 565,349 | |
| |
Net investment loss | | $ | (612,864 | ) |
|
| Realized and Unrealized Gain (Loss) from Portfolio | |
Net realized gain (loss) — | | | | |
Investment transactions | | $ | 3,926,834 | |
Written options | | | 295,380 | |
Foreign currency transactions | | | 101 | |
Net realized gain | | $ | 4,222,315 | |
Change in unrealized appreciation (depreciation) — | | | | |
Investments | | $ | 1,389,588 | |
Written options | | | 2,999 | |
Foreign currency | | | 76 | |
Net change in unrealized appreciation (depreciation) | | $ | 1,392,663 | |
| |
Net realized and unrealized gain | | $ | 5,614,978 | |
| |
Net increase in net assets from operations | | $ | 5,002,114 | |
| | | | |
| | 8 | | See Notes to Financial Statements. |
Eaton Vance
Tax-Managed Multi-Cap Growth Fund
October 31, 2012
Statements of Changes in Net Assets
| | | | | | | | |
| | | Year Ended October 31, | |
| Increase (Decrease) in Net Assets | | 2012 | | | 2011 | |
From operations — | | | | | | | | |
Net investment loss | | $ | (612,864 | ) | | $ | (592,334 | ) |
Net realized gain from investment transactions, written options and foreign currency transactions | | | 4,222,315 | | | | 9,478,835 | |
Net change in unrealized appreciation (depreciation) from investments, written options and foreign currency | | | 1,392,663 | | | | (3,635,361 | ) |
Net increase in net assets from operations | | $ | 5,002,114 | | | $ | 5,251,140 | |
Transactions in shares of beneficial interest — | | | | | | | | |
Proceeds from sale of shares | | | | | | | | |
Class A | | $ | 2,020,588 | | | $ | 3,377,834 | |
Class B | | | 102,899 | | | | 518,559 | |
Class C | | | 1,176,661 | | | | 2,107,027 | |
Cost of shares redeemed | | | | | | | | |
Class A | | | (8,153,222 | ) | | | (13,053,462 | ) |
Class B | | | (671,706 | ) | | | (1,392,175 | ) |
Class C | | | (3,007,494 | ) | | | (5,569,571 | ) |
Net asset value of shares exchanged | | | | | | | | |
Class A | | | 670,273 | | | | 1,101,309 | |
Class B | | | (670,273 | ) | | | (1,101,309 | ) |
Net decrease in net assets from Fund share transactions | | $ | (8,532,274 | ) | | $ | (14,011,788 | ) |
| | |
Net decrease in net assets | | $ | (3,530,160 | ) | | $ | (8,760,648 | ) |
|
| Net Assets | |
At beginning of year | | $ | 57,991,585 | | | $ | 66,752,233 | |
At end of year | | $ | 54,461,425 | | | $ | 57,991,585 | |
|
| Accumulated net investment loss included in net assets | |
At end of year | | $ | (535,537 | ) | | $ | — | |
| | | | |
| | 9 | | See Notes to Financial Statements. |
Eaton Vance
Tax-Managed Multi-Cap Growth Fund
October 31, 2012
Financial Highlights
| | | | | | | | | | | | | | | | | | | | |
| | | Class A | |
| | | Year Ended October 31, | |
| | | 2012 | | | 2011 | | | 2010 | | | 2009 | | | 2008 | |
Net asset value — Beginning of year | | $ | 12.740 | | | $ | 11.810 | | | $ | 10.500 | | | $ | 8.730 | | | $ | 17.990 | |
| | | | | |
| Income (Loss) From Operations | | | | | | | | | | | | | | | | | | | | |
Net investment loss(1) | | $ | (0.111 | ) | | $ | (0.084 | )(2) | | $ | (0.081 | )(3) | | $ | (0.036 | ) | | $ | (0.010 | ) |
Net realized and unrealized gain (loss) | | | 1.271 | | | | 1.014 | | | | 1.391 | | | | 1.806 | | | | (6.853 | ) |
| | | | | |
Total income (loss) from operations | | $ | 1.160 | | | $ | 0.930 | | | $ | 1.310 | | | $ | 1.770 | | | $ | (6.863 | ) |
| | | | | |
| Less Distributions | | | | | | | | | | | | | | | | | | | | |
From net investment income | | $ | — | | | $ | — | | | $ | — | | | $ | — | | | $ | (0.197 | ) |
From net realized gain | | | — | | | | — | | | | — | | | | — | | | | (2.200 | ) |
| | | | | |
Total distributions | | $ | — | | | $ | — | | | $ | — | | | $ | — | | | $ | (2.397 | ) |
| | | | | |
Net asset value — End of year | | $ | 13.900 | | | $ | 12.740 | | | $ | 11.810 | | | $ | 10.500 | | | $ | 8.730 | |
| | | | | |
Total Return(4) | | | 9.11 | % | | | 7.78 | % | | | 12.57 | % | | | 20.27 | % | | | (43.97 | )% |
| | | | | |
| Ratios/Supplemental Data | | | | | | | | | | | | | | | | | | | | |
Net assets, end of year (000’s omitted) | | $ | 36,579 | | | $ | 38,582 | | | $ | 43,627 | | | $ | 45,868 | | | $ | 56,537 | |
Ratios (as a percentage of average daily net assets): | | | | | | | | | | | | | | | | | | | | |
Expenses(5)(6) | | | 1.50 | % | | | 1.48 | % | | | 1.47 | % | | | 1.57 | % | | | 1.38 | % |
Net investment loss | | | (0.81 | )% | | | (0.65 | )%(2) | | | (0.70 | )%(3) | | | (0.41 | )% | | | (0.07 | )% |
Portfolio Turnover of the Portfolio | | | 83 | % | | | 139 | % | | | 200 | % | | | 205 | % | | | 283 | % |
| (1) | Computed using average shares outstanding. |
| (2) | Net investment loss per share reflects special dividends allocated from the Portfolio which amounted to $0.027 per share. Excluding special dividends, the ratio of net investment loss to average daily net assets would have been (0.85)%. |
| (3) | Net investment loss per share reflects special dividends allocated from the Portfolio which amounted to $0.011 per share. Excluding special dividends, the ratio of net investment loss to average daily net assets would have been (0.81)%. |
| (4) | Returns are historical and are calculated by determining the percentage change in net asset value with all distributions reinvested and do not reflect the effect of sales charges. |
| (5) | Excludes the effect of custody fee credits, if any, of less than 0.005%. |
| (6) | Includes the Fund’s share of the Portfolio’s allocated expenses. |
| | | | |
| | 10 | | See Notes to Financial Statements. |
Eaton Vance
Tax-Managed Multi-Cap Growth Fund
October 31, 2012
Financial Highlights — continued
| | | | | | | | | | | | | | | | | | | | |
| | | Class B | |
| | | Year Ended October 31, | |
| | | 2012 | | | 2011 | | | 2010 | | | 2009 | | | 2008 | |
Net asset value — Beginning of year | | $ | 11.570 | | | $ | 10.810 | | | $ | 9.680 | | | $ | 8.120 | | | $ | 16.880 | |
| | | | | |
| Income (Loss) From Operations | | | | | | | | | | | | | | | | | | | | |
Net investment loss(1) | | $ | (0.189 | ) | | $ | (0.164 | )(2) | | $ | (0.151 | )(3) | | $ | (0.089 | ) | | $ | (0.111 | ) |
Net realized and unrealized gain (loss) | | | 1.149 | | | | 0.924 | | | | 1.281 | | | | 1.649 | | | | (6.375 | ) |
| | | | | |
Total income (loss) from operations | | $ | 0.960 | | | $ | 0.760 | | | $ | 1.130 | | | $ | 1.560 | | | $ | (6.486 | ) |
| | | | | |
| Less Distributions | | | | | | | | | | | | | | | | | | | | |
From net investment income | | $ | — | | | $ | — | | | $ | — | | | $ | — | | | $ | (0.074 | ) |
From net realized gain | | | — | | | | — | | | | — | | | | — | | | | (2.200 | ) |
| | | | | |
Total distributions | | $ | — | | | $ | — | | | $ | — | | | $ | — | | | $ | (2.274 | ) |
| | | | | |
Net asset value — End of year | | $ | 12.530 | | | $ | 11.570 | | | $ | 10.810 | | | $ | 9.680 | | | $ | 8.120 | |
| | | | | |
Total Return(4) | | | 8.30 | % | | | 7.03 | % | | | 11.67 | % | | | 19.21 | % | | | (44.36 | )% |
| | | | | |
| Ratios/Supplemental Data | | | | | | | | | | | | | | | | | | | | |
Net assets, end of year (000’s omitted) | | $ | 2,334 | | | $ | 3,340 | | | $ | 4,940 | | | $ | 7,300 | | | $ | 10,119 | |
Ratios (as a percentage of average daily net assets): | | | | | | | | | | | | | | | | | | | | |
Expenses(5)(6) | | | 2.26 | % | | | 2.23 | % | | | 2.22 | % | | | 2.33 | % | | | 2.13 | % |
Net investment loss | | | (1.54 | )% | | | (1.38 | )%(2) | | | (1.43 | )%(3) | | | (1.11 | )% | | | (0.84 | )% |
Portfolio Turnover of the Portfolio | | | 83 | % | | | 139 | % | | | 200 | % | | | 205 | % | | | 283 | % |
| (1) | Computed using average shares outstanding. |
| (2) | Net investment loss per share reflects special dividends allocated from the Portfolio which amounted to $0.026 per share. Excluding special dividends, the ratio of net investment loss to average daily net assets would have been (1.60)%. |
| (3) | Net investment loss per share reflects special dividends allocated from the Portfolio which amounted to $0.010 per share. Excluding special dividends, the ratio of net investment loss to average daily net assets would have been (1.54)%. |
| (4) | Returns are historical and are calculated by determining the percentage change in net asset value with all distributions reinvested and do not reflect the effect of sales charges. |
| (5) | Excludes the effect of custody fee credits, if any, of less than 0.005%. |
| (6) | Includes the Fund’s share of the Portfolio’s allocated expenses. |
| | | | |
| | 11 | | See Notes to Financial Statements. |
Eaton Vance
Tax-Managed Multi-Cap Growth Fund
October 31, 2012
Financial Highlights — continued
| | | | | | | | | | | | | | | | | | | | |
| | | Class C | |
| | | Year Ended October 31, | |
| | | 2012 | | | 2011 | | | 2010 | | | 2009 | | | 2008 | |
Net asset value — Beginning of year | | $ | 11.580 | | | $ | 10.830 | | | $ | 9.690 | | | $ | 8.130 | | | $ | 16.910 | |
| | | | | |
| Income (Loss) From Operations | | | | | | | | | | | | | | | | | | | | |
Net investment loss(1) | | $ | (0.194 | ) | | $ | (0.166 | )(2) | | $ | (0.153 | )(3) | | $ | (0.100 | ) | | $ | (0.109 | ) |
Net realized and unrealized gain (loss) | | | 1.164 | | | | 0.916 | | | | 1.293 | | | | 1.660 | | | | (6.379 | ) |
| | | | | |
Total income (loss) from operations | | $ | 0.970 | | | $ | 0.750 | | | $ | 1.140 | | | $ | 1.560 | | | $ | (6.488 | ) |
| | | | | |
| Less Distributions | | | | | | | | | | | | | | | | | | | | |
From net investment income | | $ | — | | | $ | — | | | $ | — | | | $ | — | | | $ | (0.092 | ) |
From net realized gain | | | — | | | | — | | | | — | | | | — | | | | (2.200 | ) |
| | | | | |
Total distributions | | $ | — | | | $ | — | | | $ | — | | | $ | — | | | $ | (2.292 | ) |
| | | | | |
Net asset value — End of year | | $ | 12.550 | | | $ | 11.580 | | | $ | 10.830 | | | $ | 9.690 | | | $ | 8.130 | |
| | | | | |
Total Return(4) | | | 8.38 | % | | | 6.93 | % | | | 11.76 | % | | | 19.19 | % | | | (44.33 | )% |
| | | | | |
| Ratios/Supplemental Data | | | | | | | | | | | | | | | | | | | | |
Net assets, end of year (000’s omitted) | | $ | 15,549 | | | $ | 16,069 | | | $ | 18,185 | | | $ | 20,220 | | | $ | 18,483 | |
Ratios (as a percentage of average daily net assets): | | | | | | | | | | | | | | | | | | | | |
Expenses(5)(6) | | | 2.25 | % | | | 2.23 | % | | | 2.22 | % | | | 2.32 | % | | | 2.13 | % |
Net investment loss | | | (1.57 | )% | | | (1.39 | )%(2) | | | (1.45 | )%(3) | | | (1.21 | )% | | | (0.83 | )% |
Portfolio Turnover of the Portfolio | | | 83 | % | | | 139 | % | | | 200 | % | | | 205 | % | | | 283 | % |
| (1) | Computed using average shares outstanding. |
| (2) | Net investment loss per share reflects special dividends allocated from the Portfolio which amounted to $0.025 per share. Excluding special dividends, the ratio of net investment loss to average daily net assets would have been (1.60)%. |
| (3) | Net investment loss per share reflects special dividends allocated from the Portfolio which amounted to $0.010 per share. Excluding special dividends, the ratio of net investment loss to average daily net assets would have been (1.56)%. |
| (4) | Returns are historical and are calculated by determining the percentage change in net asset value with all distributions reinvested and do not reflect the effect of sales charges. |
| (5) | Excludes the effect of custody fee credits, if any, of less than 0.005%. |
| (6) | Includes the Fund’s share of the Portfolio’s allocated expenses. |
| | | | |
| | 12 | | See Notes to Financial Statements. |
Eaton Vance
Tax-Managed Multi-Cap Growth Fund
October 31, 2012
Notes to Financial Statements
1 Significant Accounting Policies
Eaton Vance Tax-Managed Multi-Cap Growth Fund (the Fund) is a diversified series of Eaton Vance Mutual Funds Trust (the Trust). The Trust is a Massachusetts business trust registered under the Investment Company Act of 1940, as amended (the 1940 Act), as an open-end management investment company. The Fund offers three classes of shares. Class A shares are generally sold subject to a sales charge imposed at time of purchase. Class B and Class C shares are sold at net asset value and are generally subject to a contingent deferred sales charge (see Note 5). Class B shares automatically convert to Class A shares eight years after their purchase as described in the Fund’s prospectus. Beginning January 1, 2012, Class B shares are only available for purchase upon exchange from another Eaton Vance fund or through reinvestment of distributions. Each class represents a pro-rata interest in the Fund, but votes separately on class-specific matters and (as noted below) is subject to different expenses. Realized and unrealized gains and losses and net investment income and losses, other than class-specific expenses, are allocated daily to each class of shares based on the relative net assets of each class to the total net assets of the Fund. Each class of shares differs in its distribution plan and certain other class-specific expenses. The Fund invests all of its investable assets in interests in Tax-Managed Multi-Cap Growth Portfolio (the Portfolio), a Massachusetts business trust, having the same investment objective and policies as the Fund. The value of the Fund’s investment in the Portfolio reflects the Fund’s proportionate interest in the net assets of the Portfolio (58.0% at October 31, 2012). The performance of the Fund is directly affected by the performance of the Portfolio. The financial statements of the Portfolio, including the portfolio of investments, are included elsewhere in this report and should be read in conjunction with the Fund’s financial statements.
The following is a summary of significant accounting policies of the Fund. The policies are in conformity with accounting principles generally accepted in the United States of America.
A Investment Valuation — Valuation of securities by the Portfolio is discussed in Note 1A of the Portfolio’s Notes to Financial Statements, which are included elsewhere in this report.
B Income — The Fund’s net investment income or loss consists of the Fund’s pro-rata share of the net investment income or loss of the Portfolio, less all actual and accrued expenses of the Fund.
C Federal Taxes — The Fund’s policy is to comply with the provisions of the Internal Revenue Code applicable to regulated investment companies and to distribute to shareholders each year substantially all of its net investment income, and all or substantially all of its net realized capital gains. Accordingly, no provision for federal income or excise tax is necessary.
At October 31, 2012, the Fund, for federal income tax purposes, had a capital loss carryforward of $14,947,648 which will reduce its taxable income arising from future net realized gains on investment transactions, if any, to the extent permitted by the Internal Revenue Code, and thus will reduce the amount of distributions to shareholders, which would otherwise be necessary to relieve the Fund of any liability for federal income or excise tax. The capital loss carryforward will expire on October 31, 2016 ($1,195,698) and October 31, 2017 ($13,751,950). In addition, such capital loss carryforward cannot be utilized prior to the utilization of new capital losses, if any, created after October 31, 2012.
During the year ended October 31, 2012, a capital loss carryforward of $4,122,670 was utilized to offset net realized gains by the Fund.
Additionally, at October 31, 2012, the Fund had a net investment loss of $535,537 incurred after December 31, 2011. This net investment loss is treated as arising on the first day of the Fund’s taxable year ending October 31, 2013.
As of October 31, 2012, the Fund had no uncertain tax positions that would require financial statement recognition, de-recognition, or disclosure. The Fund files a U.S. federal income tax return annually after its fiscal year-end, which is subject to examination by the Internal Revenue Service for a period of three years from the date of filing.
D Expenses — The majority of expenses of the Trust are directly identifiable to an individual fund. Expenses which are not readily identifiable to a specific fund are allocated taking into consideration, among other things, the nature and type of expense and the relative size of the funds.
E Expense Reduction — State Street Bank and Trust Company (SSBT) serves as custodian of the Fund. Pursuant to the custodian agreement, SSBT receives a fee reduced by credits, which are determined based on the average daily cash balance the Fund maintains with SSBT. All credit balances, if any, used to reduce the Fund’s custodian fees are reported as a reduction of expenses in the Statement of Operations.
F Use of Estimates — The preparation of the financial statements in conformity with accounting principles generally accepted in the United States of America requires management to make estimates and assumptions that affect the reported amounts of assets and liabilities at the date of the financial statements and the reported amounts of income and expense during the reporting period. Actual results could differ from those estimates.
G Indemnifications — Under the Trust’s organizational documents, its officers and Trustees may be indemnified against certain liabilities and expenses arising out of the performance of their duties to the Fund. Under Massachusetts law, if certain conditions prevail, shareholders of a Massachusetts business trust (such as the Trust) could be deemed to have personal liability for the obligations of the Trust. However, the Trust’s Declaration of Trust contains an express disclaimer of liability on the part of Fund shareholders and the By-laws provide that the Trust shall assume the defense on behalf of any Fund shareholders. Moreover, the By-laws also provide for indemnification out of Fund property of any shareholder held personally liable solely by reason of being or having been a shareholder for all loss or expense arising from such liability. Additionally, in the normal course of business, the Fund enters into
Eaton Vance
Tax-Managed Multi-Cap Growth Fund
October 31, 2012
Notes to Financial Statements — continued
agreements with service providers that may contain indemnification clauses. The Fund’s maximum exposure under these arrangements is unknown as this would involve future claims that may be made against the Fund that have not yet occurred.
H Other — Investment transactions are accounted for on a trade date basis. Dividends to shareholders are recorded on the ex-dividend date.
2 Distributions to Shareholders
It is the present policy of the Fund to make at least one distribution annually (normally in December) of all or substantially all of its net investment income and to distribute annually all or substantially all of its net realized capital gains (reduced by available capital loss carryforwards from prior years, if any). Distributions are declared separately for each class of shares. Shareholders may reinvest income and capital gain distributions in additional shares of the same class of the Fund at the net asset value as of the ex-dividend date or, at the election of the shareholder, receive distributions in cash. The Fund distinguishes between distributions on a tax basis and a financial reporting basis. Accounting principles generally accepted in the United States of America require that only distributions in excess of tax basis earnings and profits be reported in the financial statements as a return of capital. Permanent differences between book and tax accounting relating to distributions are reclassified to paid-in capital. For tax purposes, distributions from short-term capital gains are considered to be from ordinary income.
During the year ended October 31, 2012, accumulated net realized loss was increased by $1,921, accumulated net investment loss was decreased by $77,327 and paid-in capital was decreased by $75,406 due to differences between book and tax accounting, primarily for net operating losses, distributions from real estate investment trusts and foreign currency gain (loss). These reclassifications had no effect on the net assets or net asset value per share of the Fund.
As of October 31, 2012, the components of distributable earnings (accumulated losses) and unrealized appreciation (depreciation) on a tax basis were as follows:
| | | | |
Capital loss carryforward | | $ | (14,947,648 | ) |
Late year ordinary losses | | $ | (535,537 | ) |
Net unrealized appreciation | | $ | 6,606,498 | |
The differences between components of distributable earnings (accumulated losses) on a tax basis and the amounts reflected in the Statement of Assets and Liabilities are primarily due to wash sales and partnership allocations.
3 Transactions with Affiliates
The administration fee is earned by Eaton Vance Management (EVM) as compensation for administrative services rendered to the Fund. The fee is computed at an annual rate of 0.15% of the Fund’s average daily net assets. For the year ended October 31, 2012, the administration fee amounted to $86,966. The Portfolio has engaged Boston Management and Research (BMR), a subsidiary of EVM, to render investment advisory services. See Note 2 of the Portfolio’s Notes to Financial Statements which are included elsewhere in this report. EVM serves as the sub-transfer agent of the Fund and receives from the transfer agent an aggregate fee based upon the actual expenses incurred by EVM in the performance of these services. For the year ended October 31, 2012, EVM earned $6,600 in sub-transfer agent fees. The Fund was informed that Eaton Vance Distributors, Inc. (EVD), an affiliate of EVM and the Fund’s principal underwriter, received $4,228 as its portion of the sales charge on sales of Class A shares for the year ended October 31, 2012. EVD also received distribution and service fees from Class A, Class B and Class C shares (see Note 4) and contingent deferred sales charges (see Note 5).
Trustees and officers of the Fund who are members of EVM’s or BMR’s organizations receive remuneration for their services to the Fund out of the investment adviser fee. Certain officers and Trustees of the Fund and the Portfolio are officers of the above organizations.
4 Distribution Plans
The Fund has in effect a distribution plan for Class A shares (Class A Plan) pursuant to Rule 12b-1 under the 1940 Act. Pursuant to the Class A Plan, the Fund pays EVD a distribution and service fee of 0.25% per annum of its average daily net assets attributable to Class A shares for distribution services and facilities provided to the Fund by EVD, as well as for personal services and/or the maintenance of shareholder accounts. Distribution and service fees paid or accrued to EVD for the year ended October 31, 2012 amounted to $97,298 for Class A shares.
The Fund also has in effect distribution plans for Class B shares (Class B Plan) and Class C shares (Class C Plan) pursuant to Rule 12b-1 under the 1940 Act. Pursuant to the Class B and Class C Plans, the Fund pays EVD amounts equal to 0.75% per annum of its average daily net assets attributable to Class B and Class C shares for providing ongoing distribution services and facilities to the Fund. The Fund will automatically discontinue payments to EVD during any period in which there are no outstanding Uncovered Distribution Charges, which are equivalent to the sum of (i) 6.25% of the aggregate amount received by the Fund for Class B and Class C shares sold, plus (ii) interest calculated by applying the rate of 1% over the prevailing prime rate to the outstanding balance of Uncovered Distribution Charges of EVD of each respective class, reduced by the aggregate amount of contingent deferred sales charges (see Note 5) and amounts theretofore paid or
Eaton Vance
Tax-Managed Multi-Cap Growth Fund
October 31, 2012
Notes to Financial Statements — continued
payable to EVD by each respective class. For the year ended October 31, 2012, the Fund paid or accrued to EVD $21,503 and $121,487 for Class B and Class C shares, respectively, representing 0.75% of the average daily net assets of Class B and Class C shares. At October 31, 2012, the amounts of Uncovered Distribution Charges of EVD calculated under the Class B and Class C Plans were approximately $549,000 and $1,579,000, respectively.
Pursuant to the Class B and Class C Plans, the Fund also makes payments of service fees to EVD, financial intermediaries and other persons in amounts equal to 0.25% per annum of its average daily net assets attributable to that class. Service fees paid or accrued are for personal services and/or the maintenance of shareholder accounts. They are separate and distinct from the sales commissions and distribution fees payable to EVD and, as such, are not subject to automatic discontinuance when there are no outstanding Uncovered Distribution Charges of EVD. Service fees paid or accrued for the year ended October 31, 2012 amounted to $7,168 and $40,496 for Class B and Class C shares, respectively.
5 Contingent Deferred Sales Charges
A contingent deferred sales charge (CDSC) generally is imposed on redemptions of Class B shares made within six years of purchase and on redemptions of Class C shares made within one year of purchase. Class A shares may be subject to a 1% CDSC if redeemed within 18 months of purchase (depending on the circumstances of purchase). Generally, the CDSC is based upon the lower of the net asset value at date of redemption or date of purchase. No charge is levied on shares acquired by reinvestment of dividends or capital gain distributions. The CDSC for Class B shares is imposed at declining rates that begin at 5% in the case of redemptions in the first and second year after purchase, declining one percentage point each subsequent year. Class C shares are subject to a 1% CDSC if redeemed within one year of purchase. No CDSC is levied on shares which have been sold to EVM or its affiliates or to their respective employees or clients and may be waived under certain other limited conditions. CDSCs received on Class B and Class C redemptions are paid to EVD to reduce the amount of Uncovered Distribution Charges calculated under the Fund’s Class B and Class C Plans. CDSCs received on Class B and Class C redemptions when no Uncovered Distribution Charges exist are credited to the Fund. For the year ended October 31, 2012, the Fund was informed that EVD received less than $100 and approximately $7,000 of CDSCs paid by Class A and Class B shareholders, respectively, and no CDSCs paid by Class C shareholders.
6 Investment Transactions
For the year ended October 31, 2012, increases and decreases in the Fund’s investment in the Portfolio aggregated $1,254,712 and $10,457,395, respectively.
7 Shares of Beneficial Interest
The Fund’s Declaration of Trust permits the Trustees to issue an unlimited number of full and fractional shares of beneficial interest (without par value). Such shares may be issued in a number of different series (such as the Fund) and classes. Transactions in Fund shares were as follows:
| | | | | | | | |
| | | Year Ended October 31, | |
| Class A | | 2012 | | | 2011 | |
| | |
Sales | | | 148,166 | | | | 255,880 | |
Redemptions | | | (596,305 | ) | | | (1,004,675 | ) |
Exchange from Class B shares | | | 50,684 | | | | 85,202 | |
| | |
Net decrease | | | (397,455 | ) | | | (663,593 | ) |
| | |
| | | | | | | | |
| | | Year Ended October 31, | |
| Class B | | 2012 | | | 2011 | |
| | |
Sales | | | 8,229 | | | | 42,818 | |
Redemptions | | | (54,759 | ) | | | (117,516 | ) |
Exchange to Class A shares | | | (55,929 | ) | | | (93,447 | ) |
| | |
Net decrease | | | (102,459 | ) | | | (168,145 | ) |
| | |
| | | | | | | | |
| | | Year Ended October 31, | |
| Class C | | 2012 | | | 2011 | |
| | |
Sales | | | 97,005 | | | | 177,526 | |
Redemptions | | | (244,931 | ) | | | (470,103 | ) |
| | |
Net decrease | | | (147,926 | ) | | | (292,577 | ) |
Eaton Vance
Tax-Managed Multi-Cap Growth Fund
October 31, 2012
Report of Independent Registered Public Accounting Firm
To the Trustees of Eaton Vance Mutual Funds Trust and Shareholders of Eaton Vance Tax-Managed Multi-Cap Growth Fund:
We have audited the accompanying statement of assets and liabilities of Eaton Vance Tax-Managed Multi-Cap Growth Fund (the “Fund”) (one of the funds constituting Eaton Vance Mutual Funds Trust) as of October 31, 2012, and the related statement of operations for the year then ended, the statements of changes in net assets for each of the two years in the period then ended, and the financial highlights for each of the five years in the period then ended. These financial statements and financial highlights are the responsibility of the Fund’s management. Our responsibility is to express an opinion on these financial statements and financial highlights based on our audits.
We conducted our audits in accordance with the standards of the Public Company Accounting Oversight Board (United States). Those standards require that we plan and perform the audit to obtain reasonable assurance about whether the financial statements and financial highlights are free of material misstatement. The Fund is not required to have, nor were we engaged to perform, an audit of its internal control over financial reporting. Our audits included consideration of internal control over financial reporting as a basis for designing audit procedures that are appropriate in the circumstances, but not for the purpose of expressing an opinion on the effectiveness of the Fund’s internal control over financial reporting. Accordingly, we express no such opinion. An audit also includes examining, on a test basis, evidence supporting the amounts and disclosures in the financial statements, assessing the accounting principles used and significant estimates made by management, as well as evaluating the overall financial statement presentation. We believe that our audits provide a reasonable basis for our opinion.
In our opinion, such financial statements and financial highlights referred to above present fairly, in all material respects, the financial position of Eaton Vance Tax-Managed Multi-Cap Growth Fund as of October 31, 2012, the results of its operations for the year then ended, the changes in its net assets for each of the two years in the period then ended, and the financial highlights for each of the five years in the period then ended, in conformity with accounting principles generally accepted in the United States of America.
DELOITTE & TOUCHE LLP
Boston, Massachusetts
December 19, 2012
Eaton Vance
Tax-Managed Multi-Cap Growth Fund
October 31, 2012
Federal Tax Information (Unaudited)
Shareholders are advised to consult their own tax adviser with respect to the tax consequences of their investment in the Fund.
Tax-Managed Multi-Cap Growth Portfolio
October 31, 2012
Portfolio of Investments
| | | | | | | | |
| Common Stocks — 96.5%(1) | |
| | |
| | | | | | | | |
| Security | | Shares | | | Value | |
| | | | | | | | |
|
Aerospace & Defense — 1.5% | |
Precision Castparts Corp. | | | 8,200 | | | $ | 1,419,174 | |
| | |
| | | | | | $ | 1,419,174 | |
| | |
|
Beverages — 2.5% | |
Anheuser-Busch InBev NV ADR | | | 15,200 | | | $ | 1,273,760 | |
Beam, Inc. | | | 19,800 | | | | 1,100,088 | |
| | |
| | | | | | $ | 2,373,848 | |
| | |
|
Biotechnology — 3.9% | |
Biogen Idec, Inc.(2) | | | 7,500 | | | $ | 1,036,650 | |
Celgene Corp.(2) | | | 10,600 | | | | 777,192 | |
Gilead Sciences, Inc.(2) | | | 17,900 | | | | 1,202,164 | |
Vertex Pharmaceuticals, Inc.(2) | | | 13,500 | | | | 651,240 | |
| | |
| | | | | | $ | 3,667,246 | |
| | |
|
Building Products — 0.7% | |
Fortune Brands Home & Security, Inc.(2) | | | 23,000 | | | $ | 654,120 | |
| | |
| | | | | | $ | 654,120 | |
| | |
|
Capital Markets — 0.9% | |
T. Rowe Price Group, Inc. | | | 13,300 | | | $ | 863,702 | |
| | |
| | | | | | $ | 863,702 | |
| | |
|
Chemicals — 4.8% | |
Celanese Corp., Series A | | | 24,000 | | | $ | 911,760 | |
Cytec Industries, Inc. | | | 15,900 | | | | 1,094,238 | |
Monsanto Co. | | | 17,400 | | | | 1,497,618 | |
Praxair, Inc. | | | 9,900 | | | | 1,051,479 | |
| | |
| | | | | | $ | 4,555,095 | |
| | |
|
Commercial Banks — 3.7% | |
Capital Bank Financial Corp., Class A(2) | | | 30,000 | | | $ | 525,900 | |
First Republic Bank | | | 28,600 | | | | 982,410 | |
Toronto-Dominion Bank (The) | | | 12,900 | | | | 1,049,286 | |
Wells Fargo & Co. | | | 26,600 | | | | 896,154 | |
| | |
| | | | | | $ | 3,453,750 | |
| | |
|
Commercial Services & Supplies — 1.1% | |
Waste Connections, Inc. | | | 31,850 | | | $ | 1,045,636 | |
| | |
| | | | | | $ | 1,045,636 | |
| | |
| | | | | | | | |
| Security | | Shares | | | Value | |
| | | | | | | | |
|
Communications Equipment — 2.2% | |
Palo Alto Networks, Inc.(2) | | | 10,000 | | | $ | 549,800 | |
QUALCOMM, Inc. | | | 25,600 | | | | 1,499,520 | |
| | |
| | | | | | $ | 2,049,320 | |
| | |
|
Computers & Peripherals — 8.5% | |
Apple, Inc. | | | 11,000 | | | $ | 6,546,100 | |
EMC Corp.(2) | | | 59,800 | | | | 1,460,316 | |
| | |
| | | | | | $ | 8,006,416 | |
| | |
|
Distributors — 1.1% | |
LKQ Corp.(2) | | | 50,800 | | | $ | 1,061,212 | |
| | |
| | | | | | $ | 1,061,212 | |
| | |
|
Electronic Equipment, Instruments & Components — 1.0% | |
InvenSense, Inc.(2) | | | 86,500 | | | $ | 968,800 | |
| | |
| | | | | | $ | 968,800 | |
| | |
|
Energy Equipment & Services — 2.2% | |
National Oilwell Varco, Inc. | | | 16,000 | | | $ | 1,179,200 | |
Rowan Cos., Inc.(2) | | | 29,000 | | | | 919,590 | |
| | |
| | | | | | $ | 2,098,790 | |
| | |
|
Food Products — 3.7% | |
Annie’s, Inc.(2) | | | 15,367 | | | $ | 606,997 | |
Hershey Co. (The) | | | 15,800 | | | | 1,087,830 | |
Mondelez International, Inc., Class A | | | 48,300 | | | | 1,281,882 | |
WhiteWave Foods Co. (The), Class A(2) | | | 31,484 | | | | 518,541 | |
| | |
| | | | | | $ | 3,495,250 | |
| | |
|
Health Care Equipment & Supplies — 3.8% | |
Align Technology, Inc.(2) | | | 20,100 | | | $ | 534,258 | |
Analogic Corp. | | | 7,700 | | | | 567,182 | |
Intuitive Surgical, Inc.(2) | | | 3,200 | | | | 1,735,104 | |
Stryker Corp. | | | 13,400 | | | | 704,840 | |
| | |
| | | | | | $ | 3,541,384 | |
| | |
|
Health Care Providers & Services — 2.5% | |
Brookdale Senior Living, Inc.(2) | | | 20,100 | | | $ | 471,546 | |
Catamaran Corp.(2) | | | 15,638 | | | | 737,488 | |
MEDNAX, Inc.(2) | | | 16,200 | | | | 1,117,476 | |
| | |
| | | | | | $ | 2,326,510 | |
| | |
| | | | |
| | 18 | | See Notes to Financial Statements. |
Tax-Managed Multi-Cap Growth Portfolio
October 31, 2012
Portfolio of Investments — continued
| | | | | | | | |
| Security | | Shares | | | Value | |
| | | | | | | | |
|
Hotels, Restaurants & Leisure — 3.0% | |
Las Vegas Sands Corp. | | | 16,000 | | | $ | 743,040 | |
Yum! Brands, Inc. | | | 29,700 | | | | 2,082,267 | |
| | |
| | | | | | $ | 2,825,307 | |
| | |
|
Household Durables — 0.4% | |
Tempur-Pedic International, Inc.(2) | | | 14,700 | | | $ | 388,668 | |
| | |
| | | | | | $ | 388,668 | |
| | |
|
Household Products — 0.8% | |
Colgate-Palmolive Co. | | | 7,100 | | | $ | 745,216 | |
| | |
| | | | | | $ | 745,216 | |
| | |
|
Industrial Conglomerates — 1.0% | |
Danaher Corp. | | | 17,600 | | | $ | 910,448 | |
| | |
| | | | | | $ | 910,448 | |
| | |
|
Internet & Catalog Retail — 2.9% | |
Amazon.com, Inc.(2) | | | 5,100 | | | $ | 1,187,382 | |
priceline.com, Inc.(2) | | | 1,800 | | | | 1,032,786 | |
Shutterfly, Inc.(2) | | | 16,900 | | | | 511,394 | |
| | |
| | | | | | $ | 2,731,562 | |
| | |
|
Internet Software & Services — 7.7% | |
Equinix, Inc.(2) | | | 4,000 | | | $ | 721,640 | |
Google, Inc., Class A(2) | | | 4,100 | | | | 2,787,057 | |
LinkedIn Corp., Class A(2) | | | 9,300 | | | | 994,449 | |
MercadoLibre, Inc. | | | 9,800 | | | | 822,906 | |
Rackspace Hosting, Inc.(2) | | | 24,007 | | | | 1,529,006 | |
VeriSign, Inc.(2) | | | 10,100 | | | | 374,407 | |
| | |
| | | | | | $ | 7,229,465 | |
| | |
|
IT Services — 3.5% | |
Accenture PLC, Class A | | | 16,700 | | | $ | 1,125,747 | |
Teradata Corp.(2) | | | 10,100 | | | | 689,931 | |
Visa, Inc., Class A | | | 10,800 | | | | 1,498,608 | |
| | |
| | | | | | $ | 3,314,286 | |
| | |
|
Leisure Equipment & Products — 0.9% | |
Polaris Industries, Inc. | | | 9,800 | | | $ | 828,100 | |
| | |
| | | | | | $ | 828,100 | |
| | |
|
Machinery — 2.0% | |
Colfax Corp.(2) | | | 20,700 | | | $ | 711,873 | |
| | | | | | | | |
| Security | | Shares | | | Value | |
| | | | | | | | |
|
Machinery (continued) | |
Eaton Corp. | | | 11,800 | | | $ | 557,196 | |
Stanley Black & Decker, Inc. | | | 9,400 | | | | 651,420 | |
| | |
| | | | | | $ | 1,920,489 | |
| | |
|
Metals & Mining — 0.9% | |
Freeport-McMoRan Copper & Gold, Inc. | | | 20,600 | | | $ | 800,928 | |
| | |
| | | | | | $ | 800,928 | |
| | |
|
Multiline Retail — 1.3% | |
Dollar General Corp.(2) | | | 25,805 | | | $ | 1,254,639 | |
| | |
| | | | | | $ | 1,254,639 | |
| | |
|
Oil, Gas & Consumable Fuels — 3.9% | |
Concho Resources, Inc.(2) | | | 12,900 | | | $ | 1,110,948 | |
EOG Resources, Inc. | | | 13,100 | | | | 1,526,019 | |
Range Resources Corp. | | | 16,100 | | | | 1,052,296 | |
| | |
| | | | | | $ | 3,689,263 | |
| | |
|
Pharmaceuticals — 2.4% | |
Allergan, Inc. | | | 13,700 | | | $ | 1,231,904 | |
Perrigo Co. | | | 9,200 | | | | 1,058,092 | |
| | |
| | | | | | $ | 2,289,996 | |
| | |
|
Real Estate Investment Trusts (REITs) — 1.0% | |
Public Storage, Inc. | | | 6,400 | | | $ | 887,232 | |
| | |
| | | | | | $ | 887,232 | |
| | |
|
Road & Rail — 2.4% | |
J.B. Hunt Transport Services, Inc. | | | 16,400 | | | $ | 962,680 | |
Kansas City Southern | | | 15,832 | | | | 1,273,843 | |
| | |
| | | | | | $ | 2,236,523 | |
| | |
|
Semiconductors & Semiconductor Equipment — 4.0% | |
Cirrus Logic, Inc.(2) | | | 54,500 | | | $ | 2,221,420 | |
Cypress Semiconductor Corp.(2) | | | 48,800 | | | | 483,608 | |
Mellanox Technologies, Ltd.(2) | | | 8,300 | | | | 638,851 | |
Monolithic Power Systems, Inc.(2) | | | 23,000 | | | | 446,890 | |
| | |
| | | | | | $ | 3,790,769 | |
| | |
|
Software — 2.1% | |
Infoblox, Inc.(2) | | | 55,543 | | | $ | 922,569 | |
Splunk, Inc.(2) | | | 9,304 | | | | 260,977 | |
| | | | |
| | 19 | | See Notes to Financial Statements. |
Tax-Managed Multi-Cap Growth Portfolio
October 31, 2012
Portfolio of Investments — continued
| | | | | | | | |
| Security | | Shares | | | Value | |
| | | | | | | | |
|
Software (continued) | |
VMware, Inc., Class A(2) | | | 9,100 | | | $ | 771,407 | |
| | |
| | | | | | $ | 1,954,953 | |
| | |
|
Specialty Retail — 6.7% | |
Home Depot, Inc. (The) | | | 16,400 | | | $ | 1,006,632 | |
Ross Stores, Inc. | | | 20,200 | | | | 1,231,190 | |
Sally Beauty Holdings, Inc.(2) | | | 25,500 | | | | 614,040 | |
Tractor Supply Co. | | | 18,700 | | | | 1,799,688 | |
Ulta Salon, Cosmetics & Fragrance, Inc. | | | 5,100 | | | | 470,322 | |
Urban Outfitters, Inc.(2) | | | 20,700 | | | | 740,232 | |
Williams-Sonoma, Inc. | | | 10,500 | | | | 485,415 | |
| | |
| | | | | | $ | 6,347,519 | |
| | |
| | |
Textiles, Apparel & Luxury Goods — 1.1% | | | | | | | | |
lululemon athletica, inc.(2) | | | 8,000 | | | $ | 552,080 | |
Wolverine World Wide, Inc. | | | 12,000 | | | | 502,440 | |
| | |
| | | | | | $ | 1,054,520 | |
| | |
|
Thrifts & Mortgage Finance — 0.7% | |
ViewPoint Financial Group, Inc. | | | 33,100 | | | $ | 688,480 | |
| | |
| | | | | | $ | 688,480 | |
| | |
|
Tobacco — 1.1% | |
Philip Morris International, Inc. | | | 11,300 | | | $ | 1,000,728 | |
| | |
| | | | | | $ | 1,000,728 | |
| | |
|
Trading Companies & Distributors — 2.6% | |
United Rentals, Inc.(2) | | | 17,500 | | | $ | 711,550 | |
W.W. Grainger, Inc. | | | 8,400 | | | | 1,691,844 | |
| | |
| | | | | | $ | 2,403,394 | |
| | |
| |
Total Common Stocks
(identified cost $77,142,257) | | | $ | 90,872,738 | |
| | |
|
| Short-Term Investments — 3.3% | |
| | |
| | | | | | | | |
| Description | | Interest
(000’s omitted) | | | Value | |
Eaton Vance Cash Reserves Fund, LLC, 0.12%(3) | | $ | 3,134 | | | $ | 3,133,920 | |
| | |
| |
Total Short-Term Investments
(identified cost $3,133,920) | | | $ | 3,133,920 | |
| | |
| |
Total Investments — 99.8%
(identified cost $80,276,177) | | | $ | 94,006,658 | |
| | |
| | | | | | | | | | | | | | | | |
| Covered Call Options Written — (0.0)%(4) | |
| | | | |
| | | | | | | | | | | | | | | | |
| Security | | Number of
Contracts | | | Strike
Price | | | Expiration
Date | | | Value | |
| | | | | | | | | | | | | | | | |
Allergan, Inc. | | | 14 | | | $ | 97.50 | | | | 11/17/12 | | | $ | (105 | ) |
Apple, Inc. | | | 6 | | | | 700.00 | | | | 11/17/12 | | | | (141 | ) |
Biogen Idec, Inc. | | | 8 | | | | 165.00 | | | | 11/17/12 | | | | (60 | ) |
Catamaran Corp. | | | 16 | | | | 57.50 | | | | 11/17/12 | | | | (400 | ) |
Colgate-Palmolive Co. | | | 7 | | | | 110.00 | | | | 11/17/12 | | | | (39 | ) |
EMC Corp. | | | 41 | | | | 27.00 | | | | 11/17/12 | | | | (144 | ) |
Gilead Sciences, Inc. | | | 18 | | | | 75.00 | | | | 11/17/12 | | | | (252 | ) |
Las Vegas Sands Corp. | | | 16 | | | | 47.00 | | | | 11/17/12 | | | | (1,960 | ) |
LinkedIn Corp., Class A | | | 9 | | | | 125.00 | | | | 11/17/12 | | | | (990 | ) |
Rackspace Hosting, Inc. | | | 24 | | | | 75.00 | | | | 11/17/12 | | | | (360 | ) |
Range Resources Corp. | | | 16 | | | | 75.00 | | | | 11/17/12 | | | | (120 | ) |
Tempur-Pedic International, Inc. | | | 15 | | | | 34.00 | | | | 11/17/12 | | | | (37 | ) |
United Rentals, Inc. | | | 15 | | | | 40.00 | | | | 11/17/12 | | | | (2,700 | ) |
Yum! Brands, Inc. | | | 30 | | | | 72.50 | | | | 11/17/12 | | | | (1,155 | ) |
| | |
| |
Total Covered Call Options Written
(premiums received $28,504) | | | $ | (8,463 | ) |
| | |
| |
Other Assets, Less Liabilities — 0.2% | | | $ | 219,296 | |
| | |
| |
Net Assets — 100.0% | | | $ | 94,217,491 | |
| | |
The percentage shown for each investment category in the Portfolio of Investments is based on net assets.
| | | | |
| ADR | | – | | American Depositary Receipt |
| (1) | All or a portion of each applicable common stock for which a written call option is outstanding at October 31, 2012 has been pledged as collateral for such written option. |
| (2) | Non-income producing security. |
| (3) | Affiliated investment company available to Eaton Vance portfolios and funds which invests in high quality, U.S. dollar denominated money market instruments. The rate shown is the annualized seven-day yield as of October 31, 2012. |
| (4) | Amount is less than 0.05%. |
| | | | |
| | 20 | | See Notes to Financial Statements. |
Tax-Managed Multi-Cap Growth Portfolio
October 31, 2012
Statement of Assets and Liabilities
| | | | |
| Assets | | October 31, 2012 | |
Unaffiliated investments, at value (identified cost, $77,142,257) | | $ | 90,872,738 | |
Affiliated investment, at value (identified cost, $3,133,920) | | | 3,133,920 | |
Cash | | | 8,433 | |
Dividends receivable | | | 45,336 | |
Interest receivable from affiliated investment | | | 279 | |
Receivable for investments sold | | | 251,947 | |
Tax reclaims receivable | | | 10,202 | |
Total assets | | $ | 94,322,855 | |
|
| Liabilities | |
Written options outstanding, at value (premiums received, $28,504) | | $ | 8,463 | |
Payable to affiliates: | | | | |
Investment adviser fee | | | 53,553 | |
Trustees’ fees | | | 366 | |
Accrued expenses | | | 42,982 | |
Total liabilities | | $ | 105,364 | |
Net Assets applicable to investors’ interest in Portfolio | | $ | 94,217,491 | |
|
| Sources of Net Assets | |
Investors’ capital | | $ | 80,466,969 | |
Net unrealized appreciation | | | 13,750,522 | |
Total | | $ | 94,217,491 | |
| | | | |
| | 21 | | See Notes to Financial Statements. |
Tax-Managed Multi-Cap Growth Portfolio
October 31, 2012
Statement of Operations
| | | | |
| Investment Income | | Year Ended
October 31, 2012 | |
Dividends (net of foreign taxes, $15,107) | | $ | 700,167 | |
Interest allocated from affiliated investment | | | 1,990 | |
Expenses allocated from affiliated investment | | | (272 | ) |
Total investment income | | $ | 701,885 | |
|
| Expenses | |
Investment adviser fee | | $ | 657,989 | |
Trustees’ fees and expenses | | | 4,460 | |
Custodian fee | | | 76,143 | |
Legal and accounting services | | | 38,600 | |
Miscellaneous | | | 5,797 | |
Total expenses | | $ | 782,989 | |
Deduct — | | | | |
Reduction of custodian fee | | $ | 11 | |
Total expense reductions | | $ | 11 | |
| |
Net expenses | | $ | 782,978 | |
| |
Net investment loss | | $ | (81,093 | ) |
|
| Realized and Unrealized Gain (Loss) | |
Net realized gain (loss) — | | | | |
Investment transactions | | $ | 7,217,106 | |
Investment transactions allocated from affiliated investment | | | 41 | |
Written options | | | 516,090 | |
Foreign currency transactions | | | 162 | |
Net realized gain | | $ | 7,733,399 | |
Change in unrealized appreciation (depreciation) — | | | | |
Investments | | $ | 2,230,257 | |
Written options | | | 2,890 | |
Foreign currency | | | 134 | |
Net change in unrealized appreciation (depreciation) | | $ | 2,233,281 | |
| |
Net realized and unrealized gain | | $ | 9,966,680 | |
| |
Net increase in net assets from operations | | $ | 9,885,587 | |
| | | | |
| | 22 | | See Notes to Financial Statements. |
Tax-Managed Multi-Cap Growth Portfolio
October 31, 2012
Statements of Changes in Net Assets
| | | | | | | | |
| | | Year Ended October 31, | |
| Increase (Decrease) in Net Assets | | 2012 | | | 2011 | |
From operations — | | | | | | | | |
Net investment income (loss) | | $ | (81,093 | ) | | $ | 97,242 | |
Net realized gain from investment transactions, written options and foreign currency transactions | | | 7,733,399 | | | | 17,592,485 | |
Net change in unrealized appreciation (depreciation) from investments, written options and foreign currency | | | 2,233,281 | | | | (6,865,877 | ) |
Net increase in net assets from operations | | $ | 9,885,587 | | | $ | 10,823,850 | |
Capital transactions — | | | | | | | | |
Contributions | | $ | 1,254,712 | | | $ | 23,827,543 | |
Withdrawals | | | (20,743,689 | ) | | | (51,290,189 | ) |
Net decrease in net assets from capital transactions | | $ | (19,488,977 | ) | | $ | (27,462,646 | ) |
| | |
Net decrease in net assets | | $ | (9,603,390 | ) | | $ | (16,638,796 | ) |
|
| Net Assets | |
At beginning of year | | $ | 103,820,881 | | | $ | 120,459,677 | |
At end of year | | $ | 94,217,491 | | | $ | 103,820,881 | |
| | | | |
| | 23 | | See Notes to Financial Statements. |
Tax-Managed Multi-Cap Growth Portfolio
October 31, 2012
Supplementary Data
| | | | | | | | | | | | | | | | | | | | |
| | | Year Ended October 31, | |
| Ratios/Supplemental Data | | 2012 | | | 2011 | | | 2010 | | | 2009 | | | 2008 | |
Ratios (as a percentage of average daily net assets): | | | | | | | | | | | | | | | | | | | | |
Expenses(1) | | | 0.77 | % | | | 0.75 | % | | | 0.76 | % | | | 0.76 | % | | | 0.76 | % |
Net investment income (loss) | | | (0.08 | )% | | | 0.08 | %(2) | | | 0.00 | %(3)(4) | | | 0.39 | % | | | 0.54 | % |
Portfolio Turnover | | | 83 | % | | | 139 | % | | | 200 | % | | | 205 | % | | | 283 | % |
| | | | | |
Total Return | | | 9.90 | % | | | 8.57 | % | | | 13.37 | % | | | 21.24 | % | | | (43.60 | )% |
| | | | | |
Net assets, end of year (000’s omitted) | | $ | 94,217 | | | $ | 103,821 | | | $ | 120,460 | | | $ | 127,116 | | | $ | 140,510 | |
| (1) | Excludes the effect of custody fee credits, if any, of less than 0.005%. |
| (2) | Includes special dividends equal to 0.21% of average daily net assets. |
| (3) | Includes special dividends equal to 0.10% of average daily net assets. |
| (4) | Amount is less than 0.005%. |
| | | | |
| | 24 | | See Notes to Financial Statements. |
Tax-Managed Multi-Cap Growth Portfolio
October 31, 2012
Notes to Financial Statements
1 Significant Accounting Policies
Tax-Managed Multi-Cap Growth Portfolio (the Portfolio) is a Massachusetts business trust registered under the Investment Company Act of 1940, as amended (the 1940 Act), as a diversified, open-end management investment company. The Portfolio’s investment objective is to achieve long-term, after-tax returns. The Declaration of Trust permits the Trustees to issue interests in the Portfolio. At October 31, 2012, Eaton Vance Tax-Managed Multi-Cap Growth Fund and Eaton Vance Tax-Managed Equity Asset Allocation Fund held an interest of 58.0% and 42.0%, respectively, in the Portfolio.
The following is a summary of significant accounting policies of the Portfolio. The policies are in conformity with accounting principles generally accepted in the United States of America.
A Investment Valuation — Equity securities (including common shares of closed-end investment companies) listed on a U.S. securities exchange generally are valued at the last sale or closing price on the day of valuation or, if no sales took place on such date, at the mean between the closing bid and asked prices therefore on the exchange where such securities are principally traded. Equity securities listed on the NASDAQ Global or Global Select Market generally are valued at the NASDAQ official closing price. Unlisted or listed securities for which closing sales prices or closing quotations are not available are valued at the mean between the latest available bid and asked prices or, in the case of preferred equity securities that are not listed or traded in the over-the-counter market, by a third party pricing service that will use various techniques that consider factors including, but not limited to, prices or yields of securities with similar characteristics, benchmark yields, broker/dealer quotes, quotes of underlying common stock, issuer spreads, as well as industry and economic events. Exchange-traded options are valued at the mean between the bid and asked prices at valuation time as reported by the Options Price Reporting Authority for U.S. listed options or by the relevant exchange or board of trade for non-U.S. listed options. Over-the-counter options are valued by a third party pricing service using techniques that consider factors including the value of the underlying instrument, the volatility of the underlying instrument and the period of time until option expiration. Short-term obligations purchased with a remaining maturity of sixty days or less are generally valued at amortized cost, which approximates market value. Foreign securities and currencies are valued in U.S. dollars, based on foreign currency exchange rate quotations supplied by a third party pricing service. The pricing service uses a proprietary model to determine the exchange rate. Inputs to the model include reported trades and implied bid/ask spreads. The daily valuation of exchange-traded foreign securities generally is determined as of the close of trading on the principal exchange on which such securities trade. Events occurring after the close of trading on foreign exchanges may result in adjustments to the valuation of foreign securities to more accurately reflect their fair value as of the close of regular trading on the New York Stock Exchange. When valuing foreign equity securities that meet certain criteria, the Portfolio’s Trustees have approved the use of a fair value service that values such securities to reflect market trading that occurs after the close of the applicable foreign markets of comparable securities or other instruments that have a strong correlation to the fair-valued securities. Investments for which valuations or market quotations are not readily available or are deemed unreliable are valued at fair value using methods determined in good faith by or at the direction of the Trustees of the Portfolio in a manner that fairly reflects the security’s value, or the amount that the Portfolio might reasonably expect to receive for the security upon its current sale in the ordinary course. Each such determination is based on a consideration of relevant factors, which are likely to vary from one pricing context to another. These factors may include, but are not limited to, the type of security, the existence of any contractual restrictions on the security’s disposition, the price and extent of public trading in similar securities of the issuer or of comparable companies or entities, quotations or relevant information obtained from broker/dealers or other market participants, information obtained from the issuer, analysts, and/or the appropriate stock exchange (for exchange-traded securities), an analysis of the company’s or entity’s financial condition, and an evaluation of the forces that influence the issuer and the market(s) in which the security is purchased and sold.
The Portfolio may invest in Eaton Vance Cash Reserves Fund, LLC (Cash Reserves Fund), an affiliated investment company managed by Eaton Vance Management (EVM). Cash Reserves Fund generally values its investment securities utilizing the amortized cost valuation technique in accordance with Rule 2a-7 under the 1940 Act. This technique involves initially valuing a portfolio security at its cost and thereafter assuming a constant amortization to maturity of any discount or premium. If amortized cost is determined not to approximate fair value, Cash Reserves Fund may value its investment securities based on available market quotations provided by a third party pricing service.
B Investment Transactions — Investment transactions for financial statement purposes are accounted for on a trade date basis. Realized gains and losses on investments sold are determined on the basis of identified cost.
C Income — Dividend income is recorded on the ex-dividend date for dividends received in cash and/or securities. However, if the ex-dividend date has passed, certain dividends from foreign securities are recorded as the Portfolio is informed of the ex-dividend date. Withholding taxes on foreign dividends and capital gains have been provided for in accordance with the Portfolio’s understanding of the applicable countries’ tax rules and rates. Interest income is recorded on the basis of interest accrued, adjusted for amortization of premium or accretion of discount.
D Federal Taxes — The Portfolio has elected to be treated as a partnership for federal tax purposes. No provision is made by the Portfolio for federal or state taxes on any taxable income of the Portfolio because each investor in the Portfolio is ultimately responsible for the payment of any taxes on its share of taxable income. Since at least one of the Portfolio’s investors is a regulated investment company that invests all or substantially all of its assets in the Portfolio, the Portfolio normally must satisfy the applicable source of income and diversification requirements (under the Internal Revenue Code) in order for its investors to satisfy them. The Portfolio will allocate, at least annually among its investors, each investor’s distributive share of the Portfolio’s net investment income, net realized capital gains and any other items of income, gain, loss, deduction or credit.
Tax-Managed Multi-Cap Growth Portfolio
October 31, 2012
Notes to Financial Statements — continued
As of October 31, 2012, the Portfolio had no uncertain tax positions that would require financial statement recognition, de-recognition, or disclosure. The Portfolio files a U.S. federal income tax return annually after its fiscal year-end, which is subject to examination by the Internal Revenue Service for a period of three years from the date of filing.
E Expense Reduction — State Street Bank and Trust Company (SSBT) serves as custodian of the Portfolio. Pursuant to the custodian agreement, SSBT receives a fee reduced by credits, which are determined based on the average daily cash balance the Portfolio maintains with SSBT. All credit balances, if any, used to reduce the Portfolio’s custodian fees are reported as a reduction of expenses in the Statement of Operations.
F Foreign Currency Translation — Investment valuations, other assets, and liabilities initially expressed in foreign currencies are translated each business day into U.S. dollars based upon current exchange rates. Purchases and sales of foreign investment securities and income and expenses denominated in foreign currencies are translated into U.S. dollars based upon currency exchange rates in effect on the respective dates of such transactions. Recognized gains or losses on investment transactions attributable to changes in foreign currency exchange rates are recorded for financial statement purposes as net realized gains and losses on investments. That portion of unrealized gains and losses on investments that results from fluctuations in foreign currency exchange rates is not separately disclosed.
G Use of Estimates — The preparation of the financial statements in conformity with accounting principles generally accepted in the United States of America requires management to make estimates and assumptions that affect the reported amounts of assets and liabilities at the date of the financial statements and the reported amounts of income and expense during the reporting period. Actual results could differ from those estimates.
H Indemnifications — Under the Portfolio’s organizational documents, its officers and Trustees may be indemnified against certain liabilities and expenses arising out of the performance of their duties to the Portfolio. Under Massachusetts law, if certain conditions prevail, interestholders in the Portfolio could be deemed to have personal liability for the obligations of the Portfolio. However, the Portfolio’s Declaration of Trust contains an express disclaimer of liability on the part of Portfolio interestholders and the By-laws provide that the Portfolio shall assume the defense on behalf of any Portfolio interestholder. Moreover, the By-laws also provide for indemnification out of Portfolio property of any interestholder held personally liable solely by reason of being or having been an interestholder for all loss or expense arising from such liability. Additionally, in the normal course of business, the Portfolio enters into agreements with service providers that may contain indemnification clauses. The Portfolio’s maximum exposure under these arrangements is unknown as this would involve future claims that may be made against the Portfolio that have not yet occurred.
I Written Options — Upon the writing of a call or a put option, the premium received by the Portfolio is included in the Statement of Assets and Liabilities as a liability. The amount of the liability is subsequently marked-to-market to reflect the current market value of the option written, in accordance with the Portfolio’s policies on investment valuations discussed above. Premiums received from writing options which expire are treated as realized gains. Premiums received from writing options which are exercised or are closed are added to or offset against the proceeds or amount paid on the transaction to determine the realized gain or loss. When an index option is exercised, the Portfolio is required to deliver an amount of cash determined by the excess of the strike price of the option over the value of the index (in the case of a put) or the excess of the value of the index over the strike price of the option (in the case of a call) at contract termination. If a put option on a security is exercised, the premium reduces the cost basis of the securities purchased by the Portfolio. The Portfolio, as a writer of an option, may have no control over whether the underlying securities or other assets may be sold (call) or purchased (put) and, as a result, bears the market risk of an unfavorable change in the price of the securities or other assets underlying the written option. The Portfolio may also bear the risk of not being able to enter into a closing transaction if a liquid secondary market does not exist.
J Purchased Options — Upon the purchase of a call or put option, the premium paid by the Portfolio is included in the Statement of Assets and Liabilities as an investment. The amount of the investment is subsequently marked-to-market to reflect the current market value of the option purchased, in accordance with the Portfolio’s policies on investment valuations discussed above. As the purchaser of an index option, the Portfolio has the right to receive a cash payment equal to any depreciation in the value of the index below the strike price of the option (in the case of a put) or equal to any appreciation in the value of the index over the strike price of the option (in the case of a call) as of the valuation date of the option. If an option which the Portfolio had purchased expires on the stipulated expiration date, the Portfolio will realize a loss in the amount of the cost of the option. If the Portfolio enters into a closing sale transaction, the Portfolio will realize a gain or loss, depending on whether the sales proceeds from the closing sale transaction are greater or less than the cost of the option. If the Portfolio exercises a put option on a security, it will realize a gain or loss from the sale of the underlying security, and the proceeds from such sale will be decreased by the premium originally paid. If the Portfolio exercises a call option on a security, the cost of the security which the Portfolio purchases upon exercise will be increased by the premium originally paid. The risk associated with purchasing options is limited to the premium originally paid.
2 Investment Adviser Fee and Other Transactions with Affiliates
The investment adviser fee is earned by Boston Management and Research (BMR), a subsidiary of EVM, as compensation for investment advisory services rendered to the Portfolio. The fee is computed at an annual rate of 0.65% of the Portfolio’s average daily net assets up to $500 million, and is payable monthly. On net assets of $500 million and over, the annual fee is reduced. The Portfolio invests its cash in Cash Reserves Fund. EVM does not currently receive a fee for advisory services provided to Cash Reserves Fund. For the year ended October 31, 2012, the Portfolio’s investment adviser fee amounted to $657,989 or 0.65% of the Portfolio’s average daily net assets.
Tax-Managed Multi-Cap Growth Portfolio
October 31, 2012
Notes to Financial Statements — continued
Trustees and officers of the Portfolio who are members of EVM’s or BMR’s organizations receive remuneration for their services to the Portfolio out of the investment adviser fee. Trustees of the Portfolio who are not affiliated with the investment adviser may elect to defer receipt of all or a percentage of their annual fees in accordance with the terms of the Trustees Deferred Compensation Plan. For the year ended October 31, 2012, no significant amounts have been deferred. Certain officers and Trustees of the Portfolio are officers of the above organizations.
3 Purchases and Sales of Investments
Purchases and sales of investments, other than short-term obligations, aggregated $82,227,958 and $103,308,016, respectively, for the year ended October 31, 2012.
4 Federal Income Tax Basis of Investments
The cost and unrealized appreciation (depreciation) of investments of the Portfolio at October 31, 2012, as determined on a federal income tax basis, were as follows:
| | | | |
| |
Aggregate cost | | $ | 80,303,940 | |
| |
Gross unrealized appreciation | | $ | 15,271,921 | |
Gross unrealized depreciation | | | (1,569,203 | ) |
| |
Net unrealized appreciation | | $ | 13,702,718 | |
5 Financial Instruments
The Portfolio may trade in financial instruments with off-balance sheet risk in the normal course of its investing activities. These financial instruments may include written options and may involve, to a varying degree, elements of risk in excess of the amounts recognized for financial statement purposes. The notional or contractual amounts of these instruments represent the investment the Portfolio has in particular classes of financial instruments and do not necessarily represent the amounts potentially subject to risk. The measurement of the risks associated with these instruments is meaningful only when all related and offsetting transactions are considered. A summary of written call options at October 31, 2012 is included in the Portfolio of Investments.
Written options activity for the year ended October 31, 2012 was as follows:
| | | | | | | | |
| | | Number of
Contracts | | | Premiums
Received | |
Outstanding, beginning of year | | | 1,640 | | | $ | 138,382 | |
Options written | | | 7,398 | | | | 621,220 | |
Options terminated in closing purchase transactions | | | (422 | ) | | | (33,351 | ) |
Options exercised | | | (2,315 | ) | | | (202,094 | ) |
Options expired | | | (6,066 | ) | | | (495,653 | ) |
| | |
Outstanding, end of year | | | 235 | | | $ | 28,504 | |
At October 31, 2012, the Portfolio had sufficient cash and/or securities to cover commitments under these contracts.
The Portfolio is subject to equity price risk in the normal course of pursuing its investment objective. The Portfolio enters into option transactions or a combination of option transactions on individual securities that it holds to generate premium income and/or to seek to reduce the Portfolio’s exposure to a decline in the stock price. The Portfolio is not subject to counterparty credit risk with respect to its written options as the Portfolio, not the counterparty, is obligated to perform under such derivatives.
Tax-Managed Multi-Cap Growth Portfolio
October 31, 2012
Notes to Financial Statements — continued
The fair value of open derivative instruments (not considered to be hedging instruments for accounting disclosure purposes) and whose primary underlying risk exposure is equity price risk at October 31, 2012 was as follows:
| | | | | | | | |
| | | Fair Value | |
| Derivative | | Asset Derivative | | | Liability Derivative | |
| | |
Written options | | $ | — | | | $ | (8,463 | )(1) |
| (1) | Statement of Assets and Liabilities location: Written options outstanding, at value. |
The effect of derivative instruments (not considered to be hedging instruments for accounting disclosure purposes) on the Statement of Operations and whose primary underlying risk exposure is equity price risk for the year ended October 31, 2012 was as follows:
| | | | | | | | |
| Derivative | | Realized Gain (Loss)
on Derivatives Recognized
in Income | | | Change in Unrealized
Appreciation (Depreciation) on
Derivatives Recognized in Income | |
Purchased options | | $ | (42,786 | )(1) | | $ | — | (2) |
Written options | | | 516,090 | (1) | | | 2,890 | (2) |
| (1) | Statement of Operations location: Net realized gain (loss) – Investment transactions and Written options, respectively. |
| (2) | Statement of Operations location: Change in unrealized appreciation (depreciation) – Investments and Written options, respectively. |
6 Line of Credit
The Portfolio participates with other portfolios and funds managed by EVM and its affiliates in a $600 million unsecured line of credit agreement with a group of banks. Borrowings are made by the Portfolio solely to facilitate the handling of unusual and/or unanticipated short-term cash requirements. Interest is charged to the Portfolio based on its borrowings at an amount above either the Eurodollar rate or Federal Funds rate. In addition, a fee computed at an annual rate of 0.08% on the daily unused portion of the line of credit is allocated among the participating portfolios and funds at the end of each quarter. Because the line of credit is not available exclusively to the Portfolio, it may be unable to borrow some or all of its requested amounts at any particular time. The Portfolio did not have any significant borrowings or allocated fees during the year ended October 31, 2012.
7 Fair Value Measurements
Under generally accepted accounting principles for fair value measurements, a three-tier hierarchy to prioritize the assumptions, referred to as inputs, is used in valuation techniques to measure fair value. The three-tier hierarchy of inputs is summarized in the three broad levels listed below.
| Ÿ | | Level 1 – quoted prices in active markets for identical investments |
| Ÿ | | Level 2 – other significant observable inputs (including quoted prices for similar investments, interest rates, prepayment speeds, credit risk, etc.) |
| Ÿ | | Level 3 – significant unobservable inputs (including a fund’s own assumptions in determining the fair value of investments) |
In cases where the inputs used to measure fair value fall in different levels of the fair value hierarchy, the level disclosed is determined based on the lowest level input that is significant to the fair value measurement in its entirety. The inputs or methodology used for valuing securities are not necessarily an indication of the risk associated with investing in those securities.
Tax-Managed Multi-Cap Growth Portfolio
October 31, 2012
Notes to Financial Statements — continued
At October 31, 2012, the hierarchy of inputs used in valuing the Portfolio’s investments and open derivative instruments, which are carried at value, were as follows:
| | | | | | | | | | | | | | | | |
| Asset Description | | Level 1 | | | Level 2 | | | Level 3 | | | Total | |
| | | | |
Common Stocks | | $ | 90,872,738 | * | | $ | — | | | $ | — | | | $ | 90,872,738 | |
Short-Term Investments | | | — | | | | 3,133,920 | | | | — | | | | 3,133,920 | |
| | | | |
Total Investments | | $ | 90,872,738 | | | $ | 3,133,920 | | | $ | — | | | $ | 94,006,658 | |
| | | | |
Liability Description | | | | | | | | | | | | | | | | |
| | | | |
Covered Call Options Written | | $ | (8,463 | ) | | $ | — | | | $ | — | | | $ | (8,463 | ) |
| | | | |
Total | | $ | (8,463 | ) | | $ | — | | | $ | — | | | $ | (8,463 | ) |
| * | The level classification by major category of investments is the same as the category presentation in the Portfolio of Investments. |
The Portfolio held no investments or other financial instruments as of October 31, 2011 whose fair value was determined using Level 3 inputs. At October 31, 2012, there were no investments transferred between Level 1 and Level 2 during the year then ended.
Tax-Managed Multi-Cap Growth Portfolio
October 31, 2012
Report of Independent Registered Public Accounting Firm
To the Trustees and Investors of Tax-Managed Multi-Cap Growth Portfolio:
We have audited the accompanying statement of assets and liabilities of Tax-Managed Multi-Cap Growth Portfolio (the “Portfolio”), including the portfolio of investments, as of October 31, 2012, and the related statement of operations for the year then ended, the statements of changes in net assets for each of the two years in the period then ended, and the supplementary data for each of the five years in the period then ended. These financial statements and supplementary data are the responsibility of the Portfolio’s management. Our responsibility is to express an opinion on these financial statements and supplementary data based on our audits.
We conducted our audits in accordance with standards of the Public Company Accounting Oversight Board (United States). Those standards require that we plan and perform the audit to obtain reasonable assurance about whether the financial statements and supplementary data are free of material misstatement. The Portfolio is not required to have, nor were we engaged to perform, an audit of its internal control over financial reporting. Our audits included consideration of internal control over financial reporting as a basis for designing audit procedures that are appropriate in the circumstances, but not for the purpose of expressing an opinion on the effectiveness of the Portfolio’s internal control over financial reporting. Accordingly, we express no such opinion. An audit also includes examining, on a test basis, evidence supporting the amounts and disclosures in the financial statements, assessing the accounting principles used and significant estimates made by management, as well as evaluating the overall financial statement presentation. Our procedures included confirmation of securities owned as of October 31, 2012, by correspondence with the custodian. We believe that our audits provide a reasonable basis for our opinion.
In our opinion, such financial statements and supplementary data referred to above present fairly, in all material respects, the financial position of Tax- Managed Multi-Cap Growth Portfolio as of October 31, 2012, the results of its operations for the year then ended, the changes in its net assets for each of the two years in the period then ended, and the supplementary data for each of the five years in the period then ended, in conformity with accounting principles generally accepted in the United States of America.
DELOITTE & TOUCHE LLP
Boston, Massachusetts
December 19, 2012
Eaton Vance
Tax-Managed Multi-Cap Growth Fund
October 31, 2012
Management and Organization
Fund Management. The Trustees of Eaton Vance Mutual Funds Trust (the Trust) and Tax-Managed Multi-Cap Growth Portfolio (the Portfolio) are responsible for the overall management and supervision of the Trust’s and Portfolio’s affairs. The Trustees and officers of the Trust and the Portfolio are listed below. Except as indicated, each individual has held the office shown or other offices in the same company for the last five years. Trustees and officers of the Trust and the Portfolio hold indefinite terms of office. The “Noninterested Trustees” consist of those Trustees who are not “interested persons” of the Trust and the Portfolio, as that term is defined under the 1940 Act. The business address of each Trustee and officer is Two International Place, Boston, Massachusetts 02110. As used below, “EVC” refers to Eaton Vance Corp., “EV” refers to Eaton Vance, Inc., “EVM” refers to Eaton Vance Management, “BMR” refers to Boston Management and Research and “EVD” refers to Eaton Vance Distributors, Inc. EVC and EV are the corporate parent and trustee, respectively, of EVM and BMR. EVD is the Fund’s principal underwriter, the Portfolio’s placement agent and a wholly-owned subsidiary of EVC. Each officer affiliated with Eaton Vance may hold a position with other Eaton Vance affiliates that is comparable to his or her position with EVM listed below. Each Trustee oversees 187 portfolios in the Eaton Vance Complex (including all master and feeder funds in a master feeder structure). Each officer serves as an officer of certain other Eaton Vance funds. Each Trustee and officer serves until his or her successor is elected.
| | | | | | |
| Name and Year of Birth | | Position(s)
with the
Trust and the
Portfolio | | Length of
Service | | Principal Occupation(s) and Directorships During Past Five Years and Other Relevant Experience |
Interested Trustee |
| | | |
Thomas E. Faust Jr. 1958 | | Trustee | | Since 2007 | | Chairman, Chief Executive Officer and President of EVC, Director and President of EV, Chief Executive Officer and President of EVM and BMR, and Director of EVD. Trustee and/or officer of 187 registered investment companies. Mr. Faust is an interested person because of his positions with EVM, BMR, EVD, EVC and EV, which are affiliates of the Trust and the Portfolio. Directorships in the Last Five Years.(1) Director of EVC and Hexavest Inc. |
| | | |
| | | | | | |
Noninterested Trustees |
| | | |
Scott E. Eston 1956 | | Trustee | | Since 2011 | | Private investor. Formerly held various positions at Grantham, Mayo, Van Otterloo and Co., L.L.C. (investment management firm) (1997-2009), including Chief Operating Officer (2002-2009), Chief Financial Officer (1997-2009) and Chairman of the Executive Committee (2002-2008); President and Principal Executive Officer, GMO Trust (open-end registered investment company) (2006-2009). Former Partner, Coopers and Lybrand L.L.P. (now PricewaterhouseCoopers) (public accounting firm) (1987-1997). Directorships in the Last Five Years. None. |
| | | |
Benjamin C. Esty 1963 | | Trustee | | Since 2005 | | Roy and Elizabeth Simmons Professor of Business Administration and Finance Unit Head, Harvard University Graduate School of Business Administration. Directorships in the Last Five Years.(1) None. |
| | | |
Allen R. Freedman 1940 | | Trustee | | Since 2007 | | Private Investor. Former Chairman (2002-2004) and a Director (1983-2004) of Systems & Computer Technology Corp. (provider of software to higher education). Formerly, a Director of Loring Ward International (fund distributor) (2005-2007). Former Chairman and a Director of Indus International, Inc. (provider of enterprise management software to the power generating industry) (2005-2007). Former Chief Executive Officer of Assurant, Inc. (insurance provider) (1979-2000). Directorships in the Last Five Years.(1) Director of Stonemor Partners, L.P. (owner and operator of cemeteries). Formerly, Director of Assurant, Inc. (insurance provider) (1979-2011). |
| | | |
William H. Park 1947 | | Trustee | | Since 2003 | | Consultant and private investor. Formerly, Chief Financial Officer, Aveon Group L.P. (investment management firm) (2010-2011). Formerly, Vice Chairman, Commercial Industrial Finance Corp. (specialty finance company) (2006-2010). Formerly, President and Chief Executive Officer, Prizm Capital Management, LLC (investment management firm) (2002-2005). Formerly, Executive Vice President and Chief Financial Officer, United Asset Management Corporation (investment management firm) (1982-2001). Formerly, Senior Manager, Price Waterhouse (now PricewaterhouseCoopers) (an independent registered public accounting firm) (1972-1981). Directorships in the Last Five Years.(1) None. |
| | | |
Ronald A. Pearlman 1940 | | Trustee | | Since 2003 | | Professor of Law, Georgetown University Law Center. Formerly, Deputy Assistant Secretary (Tax Policy) and Assistant Secretary (Tax Policy), U.S. Department of the Treasury (1983-1985). Formerly, Chief of Staff, Joint Committee on Taxation, U.S. Congress (1988-1990). Directorships in the Last Five Years.(1) None. |
Eaton Vance
Tax-Managed Multi-Cap Growth Fund
October 31, 2012
Management and Organization — continued
| | | | | | |
| Name and Year of Birth | | Position(s)
with the
Trust and the
Portfolio | | Length of
Service | | Principal Occupation(s) and Directorships During Past Five Years and Other Relevant Experience |
Noninterested Trustees (continued) |
| | | |
Helen Frame Peters 1948 | | Trustee | | Since 2008 | | Professor of Finance, Carroll School of Management, Boston College. Formerly, Dean, Carroll School of Management, Boston College (2000-2002). Formerly, Chief Investment Officer, Fixed Income, Scudder Kemper Investments (investment management firm) (1998-1999). Formerly, Chief Investment Officer, Equity and Fixed Income, Colonial Management Associates (investment management firm) (1991-1998). Directorships in the Last Five Years.(1) Formerly, Director of BJ’s Wholesale Club, Inc. (wholesale club retailer) (2004-2011). Formerly, Trustee of SPDR Index Shares Funds and SPDR Series Trust (exchange traded funds) (2000-2009). Formerly, Director of Federal Home Loan Bank of Boston (a bank for banks) (2007-2009). |
| | | |
Lynn A. Stout 1957 | | Trustee | | Of the Trust since 1998 and of the Portfolio since 2000 | | Distinguished Professor of Corporate and Business Law, Jack G. Clarke Business Law Institute, Cornell University Law School. Formerly, the Paul Hastings Professor of Corporate and Securities Law (2006-2012) and Professor of Law (2001-2006), University of California at Los Angeles School of Law. Directorships in the Last Five Years.(1) None. |
| | | |
Harriett Tee Taggart 1948 | | Trustee | | Since 2011 | | Managing Director, Taggart Associates (a professional practice firm). Formerly, Partner and Senior Vice President, Wellington Management Company, LLP (investment management firm) (1983-2006). Directorships in the Last Five Years. Director of Albemarle Corporation (chemicals manufacturer) (since 2007) and The Hanover Group (specialty property and casualty insurance company) (since 2009). Formerly, Director of Lubrizol Corporation (specialty chemicals) (2007-2011). |
| | | |
Ralph F. Verni 1943 | | Chairman of the Board and Trustee | | Chairman of the Board since 2007 and Trustee since 2005 | | Consultant and private investor. Formerly, Chief Investment Officer (1982-1992), Chief Financial Officer (1988-1990) and Director (1982-1992), New England Life. Formerly, Chairperson, New England Mutual Funds (1982-1992). Formerly, President and Chief Executive Officer, State Street Management & Research (1992-2000). Formerly, Chairperson, State Street Research Mutual Funds (1992-2000). Formerly, Director, W.P. Carey, LLC (1998-2004) and First Pioneer Farm Credit Corp. (2002-2006). Directorships in the Last Five Years.(1) None. |
| | | |
| | | | | | |
Principal Officers who are not Trustees |
Name and Year of Birth | | Position(s)
with the
Trust and the
Portfolio | | Length of Service | | Principal Occupation(s) During Past Five Years |
Duncan W. Richardson 1957 | | President | | Of the Trust since 2011 and of the Portfolio since 2002 | | Director of EVC and Executive Vice President and Chief Equity Investment Officer of EVC, EVM and BMR. |
| | | |
Payson F. Swaffield 1956 | | Vice President of the Trust | | Since 2011 | | Vice President and Chief Income Investment Officer of EVM and BMR. |
| | | |
Barbara E. Campbell 1957 | | Treasurer | | Of the Trust since 2005 and of the Portfolio since 2008 | | Vice President of EVM and BMR. |
Eaton Vance
Tax-Managed Multi-Cap Growth Fund
October 31, 2012
Management and Organization — continued
| | | | | | |
| Name and Year of Birth | | Position(s)
with the
Trust and the
Portfolio | | Length of
Service | | Principal Occupation(s) During Past Five Years |
Principal Officers who are not Trustees (continued) |
| | | |
Maureen A. Gemma 1960 | | Vice President, Secretary and Chief Legal Officer | | Vice President since 2011, Secretary since 2007 and Chief Legal Officer since 2008 | | Vice President of EVM and BMR. |
| | | |
Paul M. O’Neil 1953 | | Chief Compliance Officer | | Since 2004 | | Vice President of EVM and BMR. |
| (1) | During their respective tenures, the Trustees (except Mr. Eston and Ms. Taggart) also served as trustees of one or more of the following Eaton Vance funds (which operated in the years noted): Eaton Vance Credit Opportunities Fund (launched in 2005 and terminated in 2010); Eaton Vance Insured Florida Plus Municipal Bond Fund (launched in 2002 and terminated in 2009); and Eaton Vance National Municipal Income Trust (launched in 1998 and terminated in 2009). |
The SAI for the Fund includes additional information about the Trustees and officers of the Fund and the Portfolio and can be obtained without charge on Eaton Vance’s website at www.eatonvance.com or by calling 1-800-262-1122.
Eaton Vance Funds
IMPORTANT NOTICES
Privacy. The Eaton Vance organization is committed to ensuring your financial privacy. Each of the financial institutions identified below has in effect the following policy (“Privacy Policy”) with respect to nonpublic personal information about its customers:
| Ÿ | | Only such information received from you, through application forms or otherwise, and information about your Eaton Vance fund transactions will be collected. This may include information such as name, address, social security number, tax status, account balances and transactions. |
| Ÿ | | None of such information about you (or former customers) will be disclosed to anyone, except as permitted by law (which includes disclosure to employees necessary to service your account). In the normal course of servicing a customer’s account, Eaton Vance may share information with unaffiliated third parties that perform various required services such as transfer agents, custodians and broker-dealers. |
| Ÿ | | Policies and procedures (including physical, electronic and procedural safeguards) are in place that are designed to protect the confidentiality of such information. |
| Ÿ | | We reserve the right to change our Privacy Policy at any time upon proper notification to you. Customers may want to review our Privacy Policy periodically for changes by accessing the link on our homepage: www.eatonvance.com. |
Our pledge of privacy applies to the following entities within the Eaton Vance organization: the Eaton Vance Family of Funds, Eaton Vance Management, Eaton Vance Investment Counsel, Eaton Vance Distributors, Inc., Eaton Vance Trust Company, Eaton Vance Management’s Real Estate Investment Group and Boston Management and Research. In addition, our Privacy Policy applies only to those Eaton Vance customers who are individuals and who have a direct relationship with us. If a customer’s account (i.e., fund shares) is held in the name of a third-party financial advisor/broker-dealer, it is likely that only such advisor’s privacy policies apply to the customer. This notice supersedes all previously issued privacy disclosures. For more information about Eaton Vance’s Privacy Policy, please call 1-800-262-1122.
Delivery of Shareholder Documents. The Securities and Exchange Commission (SEC) permits funds to deliver only one copy of shareholder documents, including prospectuses, proxy statements and shareholder reports, to fund investors with multiple accounts at the same residential or post office box address. This practice is often called “householding” and it helps eliminate duplicate mailings to shareholders. Eaton Vance, or your financial advisor, may household the mailing of your documents indefinitely unless you instruct Eaton Vance, or your financial advisor, otherwise. If you would prefer that your Eaton Vance documents not be householded, please contact Eaton Vance at 1-800-262-1122, or contact your financial advisor. Your instructions that householding not apply to delivery of your Eaton Vance documents will be effective within 30 days of receipt by Eaton Vance or your financial advisor.
Portfolio Holdings. Each Eaton Vance Fund and its underlying Portfolio(s) (if applicable) will file a schedule of portfolio holdings on Form N-Q with the SEC for the first and third quarters of each fiscal year. The Form N-Q will be available on the Eaton Vance website at www.eatonvance.com, by calling Eaton Vance at 1-800-262-1122 or in the EDGAR database on the SEC’s website at www.sec.gov. Form N-Q may also be reviewed and copied at the SEC’s public reference room in Washington, D.C. (call 1-800-732-0330 for information on the operation of the public reference room).
Proxy Voting. From time to time, funds are required to vote proxies related to the securities held by the funds. The Eaton Vance Funds or their underlying Portfolios (if applicable) vote proxies according to a set of policies and procedures approved by the Funds’ and Portfolios’ Boards. You may obtain a description of these policies and procedures and information on how the Funds or Portfolios voted proxies relating to portfolio securities during the most recent 12-month period ended June 30, without charge, upon request, by calling 1-800-262-1122 and by accessing the SEC’s website at www.sec.gov.
This Page Intentionally Left Blank
This Page Intentionally Left Blank
Investment Adviser of Tax-Managed Multi-Cap Growth Portfolio
Boston Management and Research
Two International Place
Boston, MA 02110
Administrator of Eaton Vance Tax-Managed Multi-Cap Growth Fund
Eaton Vance Management
Two International Place
Boston, MA 02110
Principal Underwriter*
Eaton Vance Distributors, Inc.
Two International Place
Boston, MA 02110
(617) 482-8260
Custodian
State Street Bank and Trust Company
200 Clarendon Street
Boston, MA 02116
Transfer Agent
BNY Mellon Investment Servicing (US) Inc.
Attn: Eaton Vance Funds
P.O. Box 9653
Providence, RI 02940-9653
(800) 262-1122
Independent Registered Public Accounting Firm
Deloitte & Touche LLP
200 Berkley Street
Boston, MA 02116-5022
Fund Offices
Two International Place
Boston, MA 02110
| * | FINRA BrokerCheck. Investors may check the background of their Investment Professional by contacting the Financial Industry Regulatory Authority (FINRA). FINRA BrokerCheck is a free tool to help investors check the professional background of current and former FINRA-registered securities firms and brokers. FINRA BrokerCheck is available by calling 1-800-289-9999 and at www.FINRA.org. The FINRA BrokerCheck brochure describing this program is available to investors at www.FINRA.org. |
| | |
Eaton Vance Tax-Managed Small-Cap Fund Annual Report October 31, 2012 | | 
|

Fund shares are not insured by the FDIC and are not deposits or other obligations of, or guaranteed by, any depository institution. Shares are subject to investment risks, including possible loss of principal invested.
This report must be preceded or accompanied by a current summary prospectus or prospectus. Before investing, investors should consider carefully the investment objective, risks, and charges and expenses of a mutual fund. This and other important information is contained in the summary prospectus and prospectus, which can be obtained from a financial advisor. Prospective investors should read the prospectus carefully before investing. For further information, please call 1-800-262-1122.
Annual Report October 31, 2012
Eaton Vance
Tax-Managed Small-Cap Fund
Table of Contents
| | | | |
Management’s Discussion of Fund Performance | | | 2 | |
| |
Performance | | | 3 | |
| |
Fund Profile | | | 4 | |
| |
Endnotes and Additional Disclosures | | | 5 | |
| |
Fund Expenses | | | 6 | |
| |
Financial Statements | | | 7 | |
| |
Report of Independent Registered Public Accounting Firm | | | 18 and 29 | |
| |
Federal Tax Information | | | 19 | |
| |
Management and Organization | | | 30 | |
| |
Important Notices | | | 33 | |
Eaton Vance
Tax-Managed Small-Cap Fund
October 31, 2012
Management’s Discussion of Fund Performance1
Economic and Market Conditions
As the period began, investors appeared to worry about intensifying debt problems in Europe, high U.S. unemployment and a Congressional deadlock that left businesses perplexed about the direction of tax and regulatory policy. The S&P 500 Index2 was relatively flat in November 2011.
Beginning in mid-December 2011, however, an equity rally took hold and continued into early April 2012, fueled by stronger economic growth in the fourth quarter, falling unemployment, the Long-Term Refinancing Operation announced by the European Central Bank, and what the markets perceived as a successful restructuring of Greek debt. Then in May 2012, the third annual mid-year economic slowdown arrived, instigated by renewed concerns in Europe, slowing growth in China and political uncertainty in the United States with the upcoming presidential election.
But despite a slowdown in consumer spending, weakening employment data and downward revisions of growth expectations, global equities moved upward intermittently from June through mid-October 2012. Several factors appeared to be driving a market rally that defied U.S. economic data. First, investors anticipated that worsening economic news would prompt the U.S. Federal Reserve to initiate another round of quantitative easing to stimulate the economy — which it did in mid-September 2012. Second, investors were hunting for yield in a historically low interest-rate environment, and many were driven to stocks that offered higher yields than bonds.
Finally, in an increasingly global marketplace, a case could be made that the U.S. market was relatively attractive versus many other world markets for much of the period. Europe’s ongoing debt crisis led investors to move money out of European stocks and bonds. With emerging markets in Asia largely leveraged to the Chinese economy, the slowdown in Chinese growth made markets throughout Asia appear less attractive. Amid this global economic turmoil, the U.S. market was one of the few places investors could find an economy that was growing (albeit slowly); a liquid, transparent and generally well-regulated market; and an opportunity to find companies with large cash reserves and solid profit growth.
In the final weeks of the period, however, U.S. stocks gave back some of their gains as the market seemed to have come full circle; amid uncertainty about the upcoming elections, investors once again worried about a Congressional deadlock on tax policy — an impasse that has left the economy rushing headlong toward a self-imposed fiscal cliff.
Fund Performance
For the fiscal year ended October 31, 2012, Eaton Vance Tax-Managed Small-Cap Fund (the Fund) had a total return
of 10.30% for Class A shares at net asset value (NAV). By comparison, the Fund’s benchmark, the Russell 2000 Index (the Index), returned 12.08% for the period.
The Fund underperformed the Index largely due to sector and industry allocation. Stock selection made a positive contribution to overall results versus the Index, partially offsetting the allocation decisions. While the broad stock market recorded solid gains for the 12-month period, the nature of the rally favored low-quality stocks. For the period, the Fund achieved positive absolute returns in six of the nine economic sectors in which it was invested. The Index recorded positive returns in nine of its 10 sectors.
The Fund’s worst-performing sector was materials, where stock selection was the primary detractor from relative performance versus the Index. In the metals and mining industry, the Fund’s holding in a leading supplier of rare earth metals suffered when slowing global growth and growing competition from China negatively impacted company results. The Fund’s overweight in the underperforming energy sector also detracted from relative performance versus the Index, with an overweight in the oil, gas & consumable fuels industry accounting for much of the underperformance relative to the Index. The Fund’s holdings in the industrials sector hurt relative results versus the Index due largely to stock selection, particularly in the aerospace & defense and professional services industries. In the latter, a leading financial consulting firm was a detractor from Fund performance versus the Index when merger and acquisition activity lagged expectations.
On the positive side, the Fund’s holdings in the financials sector outperformed the overall Index thanks to stock selection. In the capital markets industry, a leading mortgage servicing company was one of the largest contributors to Fund performance. The company had benefited from large banks exiting the mortgage servicing business in the wake of the financial crisis. The Fund’s holdings in the consumer discretionary sector also contributed to relative performance versus the Index due primarily to stock selection. The Fund’s holdings in the specialty retail industry made a notable contribution to performance versus the Index, while an overweight in the outperforming distributors industry also helped. In the information technology sector, stock selection overcame an overweight position to boost the Fund’s relative performance versus the Index. Among individual stocks in the sector, a major supplier of semiconductors to the mobile phone and tablet market contributed to Fund performance. Also boosting performance for the 12-month period was the Fund’s avoidance of the underperforming telecommunication services sector.
See Endnotes and Additional Disclosures in this report.
Past performance is no guarantee of future results. Returns are historical and are calculated by determining the percentage change in net asset value (NAV) or offering price (as applicable) with all distributions reinvested. Investment return and principal value will fluctuate so that shares, when redeemed, may be worth more or less than their original cost. Performance less than one year is cumulative. Performance is for the stated time period only; due to market volatility, the Fund’s current performance may be lower or higher than quoted. Returns are before taxes unless otherwise noted. For performance as of the most recent month end, please refer to www.eatonvance.com.
Eaton Vance
Tax-Managed Small-Cap Fund
October 31, 2012
Performance2,3
Portfolio Manager Nancy B. Tooke, CFA
| | | | | | | | | | | | | | | | | | | | |
| % Average Annual Total Returns | | Inception Date | | | One Year | | | Five Years | | | Ten Years | | | Since
Inception | |
Class A at NAV | | | 09/25/1997 | | | | 10.30 | % | | | 0.95 | % | | | 8.30 | % | | | — | |
Class A with 5.75% Maximum Sales Charge | | | — | | | | 3.93 | | | | –0.23 | | | | 7.66 | | | | — | |
Class B at NAV | | | 09/29/1997 | | | | 9.57 | | | | 0.23 | | | | 7.50 | | | | — | |
Class B with 5% Maximum Sales Charge | | | — | | | | 4.57 | | | | –0.17 | | | | 7.50 | | | | — | |
Class C at NAV | | | 09/29/1997 | | | | 9.45 | | | | 0.20 | | | | 7.48 | | | | — | |
Class C with 1% Maximum Sales Charge | | | — | | | | 8.45 | | | | 0.20 | | | | 7.48 | | | | — | |
Class I at NAV | | | 10/01/2009 | | | | 10.64 | | | | — | | | | — | | | | 11.53 | % |
Russell 2000 Index | | | — | | | | 12.08 | % | | | 1.19 | % | | | 9.58 | % | | | — | |
| | | | | |
| | | | | | | | | | | | | | | | | | | | |
| % After-Tax Returns with Maximum Sales Charge | | Inception Date | | | One Year | | | Five Years | | | Ten Years | | | Since
Inception | |
Class A After Taxes on Distributions | | | 09/25/1997 | | | | 3.93 | % | | | –0.23 | % | | | 7.66 | % | | | — | |
Class A After Taxes on Distributions and Sale of Fund Shares | | | — | | | | 2.56 | | | | –0.20 | | | | 6.79 | | | | — | |
Class B After Taxes on Distributions | | | 09/29/1997 | | | | 4.57 | | | | –0.17 | | | | 7.50 | | | | — | |
Class B After Taxes on Distributions and Sale of Fund Shares | | | — | | | | 2.97 | | | | –0.15 | | | | 6.64 | | | | — | |
Class C After Taxes on Distributions | | | 09/29/1997 | | | | 8.45 | | | | 0.20 | | | | 7.48 | | | | — | |
Class C After Taxes on Distributions and Sale of Fund Shares | | | — | | | | 5.50 | | | | 0.17 | | | | 6.62 | | | | — | |
Class I After Taxes on Distributions | | | 10/01/2009 | | | | 10.64 | | | | — | | | | — | | | | 11.53 | % |
Class I After Taxes on Distributions and Sale of Fund Shares | | | — | | | | 6.91 | | | | — | | | | — | | | | 9.96 | |
| | | | | |
| | | | | | | | | | | | | | | | | | | | |
| % Total Annual Operating Expense Ratios4 | | | | | Class A | | | Class B | | | Class C | | | Class I | |
| | | | | | | 1.23 | % | | | 1.98 | % | | | 1.98 | % | | | 0.98 | % |
Performance of $10,000
This graph shows the change in value of a hypothetical investment of $10,000 in Class A of the Fund for the period indicated. For comparison, the same investment is shown in the indicated index.
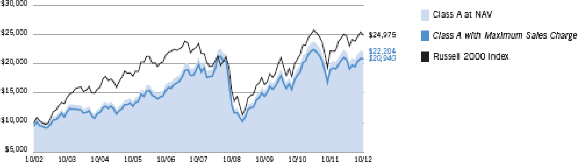
| | | | | | | | |
| Performance of Investment | | Amount Invested | | Period Beginning | | At NAV | | With Maximum
Sales Charge |
Class B | | $10,000 | | 10/31/2002 | | $20,628 | | N.A. |
Class C | | $10,000 | | 10/31/2002 | | $20,588 | | N.A. |
Class I | | $250,000 | | 10/01/2009 | | $350,175 | | N.A. |
See Endnotes and Additional Disclosures in this report.
Past performance is no guarantee of future results. Returns are historical and are calculated by determining the percentage change in net asset value (NAV) or offering price (as applicable) with all distributions reinvested. Investment return and principal value will fluctuate so that shares, when redeemed, may be worth more or less than their original cost. Performance less than one year is cumulative. Performance is for the stated time period only; due to market volatility, the Fund’s current performance may be lower or higher than quoted. Returns are before taxes unless otherwise noted. For performance as of the most recent month end, please refer to www.eatonvance.com.
Eaton Vance
Tax-Managed Small-Cap Fund
October 31, 2012
Fund Profile5
Sector Allocation (% of net assets) 6
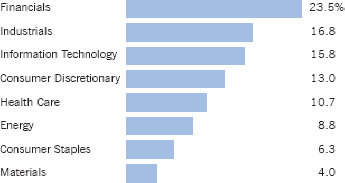
Top 10 Holdings (% of net assets)6
| | | | | | |
Walter Investment Management Corp. | | | 3.0 | % | | |
GNC Holdings, Inc., Class A | | | 2.9 | | | |
LKQ Corp. | | | 2.8 | | | |
Analogic Corp. | | | 2.6 | | | |
Valmont Industries, Inc. | | | 2.6 | | | |
Forestar Real Estate Group, Inc. | | | 2.6 | | | |
Church & Dwight Co., Inc. | | | 2.6 | | | |
Team, Inc. | | | 2.4 | | | |
PDC Energy, Inc. | | | 2.2 | | | |
Cirrus Logic, Inc. | | | 2.2 | | | |
Total | | | 25.9 | % | | |
See Endnotes and Additional Disclosures in this report.
Eaton Vance
Tax-Managed Small-Cap Fund
October 31, 2012
Endnotes and Additional Disclosures
| 1 | The views expressed in this report are those of the portfolio manager(s) and are current only through the date stated at the top of this page. These views are subject to change at any time based upon market or other conditions, and Eaton Vance and the Fund(s) disclaim any responsibility to update such views. These views may not be relied upon as investment advice and, because investment decisions are based on many factors, may not be relied upon as an indication of trading intent on behalf of any Eaton Vance fund. This commentary may contain statements that are not historical facts, referred to as “forward looking statements”. The Fund’s actual future results may differ significantly from those stated in any forward looking statement, depending on factors such as changes in securities or financial markets or general economic conditions, the volume of sales and purchases of Fund shares, the continuation of investment advisory, administrative and service contracts, and other risks discussed from time to time in the Fund’s filings with the Securities and Exchange Commission. |
| 2 | S&P 500 Index is an unmanaged index of large-cap stocks commonly used as a measure of U.S. stock market performance. Russell 2000 Index is an unmanaged index of 2,000 U.S. small-cap stocks. Unless otherwise stated, index returns do not reflect the effect of any applicable sales charges, commissions, expenses, taxes or leverage, as applicable. It is not possible to invest directly in an index. |
| 3 | Total Returns at NAV do not include applicable sales charges. If sales charges were deducted, the returns would be lower. Total Returns shown with maximum sales charge reflect the stated maximum sales charge. Unless otherwise stated, performance does not reflect the deduction of taxes on Fund distributions or redemptions of Fund shares. After-tax returns are calculated using certain assumptions, including using the highest historical individual federal income tax rates and do not reflect the impact of state/local taxes. Actual after-tax returns depend on a shareholder’s tax situation and the actual characterization of distributions and may differ from those shown. After-tax returns are not relevant to shareholders who hold shares in tax-deferred accounts or shares held by nontaxable entities. Return After Taxes on Distributions may be the same as Return Before Taxes for the same period because no taxable distributions were made during that period. Return After Taxes on Distributions and Sale of Fund Shares may be greater than or equal to Return After Taxes on Distributions for the same period because of losses realized on the sale of Fund shares. The Fund’s after-tax returns also may reflect foreign tax credits passed by the Fund to its shareholders. |
| 4 | Source: Fund prospectus. |
| 5 | Fund invests in an affiliated investment company (Portfolio) with the same objective(s) and policies as the Fund. References to investments are to the Portfolio’s holdings. |
| 6 | Excludes cash and cash equivalents. |
| | Fund profile subject to change due to active management. |
Important Notice to Shareholders
| | Tax code provisions applicable to tax-favored dividends are effective for distributions paid on or before December 31, 2012. Thereafter, dividends will be taxable as ordinary income unless further legislative action is taken. |
Eaton Vance
Tax-Managed Small-Cap Fund
October 31, 2012
Fund Expenses
Example: As a Fund shareholder, you incur two types of costs: (1) transaction costs, including sales charges (loads) on purchases and redemption fees (if applicable); and (2) ongoing costs, including management fees; distribution and/or service fees; and other Fund expenses. This Example is intended to help you understand your ongoing costs (in dollars) of Fund investing and to compare these costs with the ongoing costs of investing in other mutual funds. The Example is based on an investment of $1,000 invested at the beginning of the period and held for the entire period (May 1, 2012 – October 31, 2012).
Actual Expenses: The first section of the table below provides information about actual account values and actual expenses. You may use the information in this section, together with the amount you invested, to estimate the expenses that you paid over the period. Simply divide your account value by $1,000 (for example, an $8,600 account value divided by $1,000 = 8.6), then multiply the result by the number in the first section under the heading entitled “Expenses Paid During Period” to estimate the expenses you paid on your account during this period.
Hypothetical Example for Comparison Purposes: The second section of the table below provides information about hypothetical account values and hypothetical expenses based on the actual Fund expense ratio and an assumed rate of return of 5% per year (before expenses), which is not the actual Fund return. The hypothetical account values and expenses may not be used to estimate the actual ending account balance or expenses you paid for the period. You may use this information to compare the ongoing costs of investing in your Fund and other funds. To do so, compare this 5% hypothetical example with the 5% hypothetical examples that appear in the shareholder reports of the other funds.
Please note that the expenses shown in the table are meant to highlight your ongoing costs only and do not reflect any transactional costs, such as sales charges (loads) or redemption fees (if applicable). Therefore, the second section of the table is useful in comparing ongoing costs only, and will not help you determine the relative total costs of owning different funds. In addition, if these transactional costs were included, your costs would be higher.
| | | | | | | | | | | | | | | | |
| | | Beginning
Account Value
(5/1/12) | | | Ending
Account Value
(10/31/12) | | | Expenses Paid
During Period*
(5/1/12 – 10/31/12) | | | Annualized
Expense
Ratio | |
| | | | |
| | | | | | | | | | | | | | | | |
Actual | | | | | | | | | | | | | | | | |
Class A | | $ | 1,000.00 | | | $ | 1,009.50 | | | $ | 6.21 | | | | 1.23 | % |
Class B | | $ | 1,000.00 | | | $ | 1,006.00 | | | $ | 9.98 | | | | 1.98 | % |
Class C | | $ | 1,000.00 | | | $ | 1,005.30 | | | $ | 9.98 | | | | 1.98 | % |
Class I | | $ | 1,000.00 | | | $ | 1,010.70 | | | $ | 4.95 | | | | 0.98 | % |
| | | | | | | | | | | | | | | | | |
| | | | |
| | | | | | | | | | | | | | | | |
Hypothetical | | | | | | | | | | | | | | | | |
(5% return per year before expenses) | | | | | | | | | | | | | | | | |
Class A | | $ | 1,000.00 | | | $ | 1,019.00 | | | $ | 6.24 | | | | 1.23 | % |
Class B | | $ | 1,000.00 | | | $ | 1,015.20 | | | $ | 10.03 | | | | 1.98 | % |
Class C | | $ | 1,000.00 | | | $ | 1,015.20 | | | $ | 10.03 | | | | 1.98 | % |
Class I | | $ | 1,000.00 | | | $ | 1,020.20 | | | $ | 4.98 | | | | 0.98 | % |
| * | Expenses are equal to the Fund’s annualized expense ratio for the indicated Class, multiplied by the average account value over the period, multiplied by 184/366 (to reflect the one-half year period). The Example assumes that the $1,000 was invested at the net asset value per share determined at the close of business on April 30, 2012. The Example reflects the expenses of both the Fund and the Portfolio. |
Eaton Vance
Tax-Managed Small-Cap Fund
October 31, 2012
Statement of Assets and Liabilities
| | | | |
| Assets | | October 31, 2012 | |
Investment in Tax-Managed Small-Cap Portfolio, at value (identified cost, $88,156,967) | | $ | 98,483,527 | |
Receivable for Fund shares sold | | | 11,183 | |
Total assets | | $ | 98,494,710 | |
| |
| Liabilities | | | | |
Payable for Fund shares redeemed | | $ | 756,474 | |
Payable to affiliates: | | | | |
Distribution and service fees | | | 33,320 | |
Trustees’ fees | | | 42 | |
Accrued expenses | | | 71,590 | |
Total liabilities | | $ | 861,426 | |
Net Assets | | $ | 97,633,284 | |
| |
| Sources of Net Assets | | | | |
Paid-in capital | | $ | 105,247,650 | |
Accumulated net realized loss from Portfolio | | | (17,971,355 | ) |
Accumulated undistributed net investment income | | | 30,429 | |
Net unrealized appreciation from Portfolio | | | 10,326,560 | |
Total | | $ | 97,633,284 | |
| |
| Class A Shares | | | | |
Net Assets | | $ | 64,345,604 | |
Shares Outstanding | | | 3,801,734 | |
Net Asset Value and Redemption Price Per Share | | | | |
(net assets ÷ shares of beneficial interest outstanding) | | $ | 16.93 | |
Maximum Offering Price Per Share | | | | |
(100 ÷ 94.25 of net asset value per share) | | $ | 17.96 | |
| |
| Class B Shares | | | | |
Net Assets | | $ | 1,624,942 | |
Shares Outstanding | | | 107,479 | |
Net Asset Value and Offering Price Per Share* | | | | |
(net assets ÷ shares of beneficial interest outstanding) | | $ | 15.12 | |
| |
| Class C Shares | | | | |
Net Assets | | $ | 20,732,147 | |
Shares Outstanding | | | 1,376,973 | |
Net Asset Value and Offering Price Per Share* | | | | |
(net assets ÷ shares of beneficial interest outstanding) | | $ | 15.06 | |
| |
| Class I Shares | | | | |
Net Assets | | $ | 10,930,591 | |
Shares Outstanding | | | 640,529 | |
Net Asset Value, Offering Price and Redemption Price Per Share | | | | |
(net assets ÷ shares of beneficial interest outstanding) | | $ | 17.06 | |
| On | sales of $50,000 or more, the offering price of Class A shares is reduced. |
| * | Redemption price per share is equal to the net asset value less any applicable contingent deferred sales charge. |
| | | | |
| | 7 | | See Notes to Financial Statements. |
Eaton Vance
Tax-Managed Small-Cap Fund
October 31, 2012
Statement of Operations
| | | | |
| Investment Income | | Year Ended
October 31, 2012 | |
Dividends allocated from Portfolio (net of foreign taxes, $4,810) | | $ | 1,097,386 | |
Interest allocated from Portfolio | | | 3,766 | |
Expenses allocated from Portfolio | | | (843,700 | ) |
Total investment income from Portfolio | | $ | 257,452 | |
| |
| Expenses | | | | |
Distribution and service fees | | | | |
Class A | | $ | 203,247 | |
Class B | | | 20,926 | |
Class C | | | 216,407 | |
Trustees’ fees and expenses | | | 500 | |
Custodian fee | | | 24,496 | |
Transfer and dividend disbursing agent fees | | | 171,313 | |
Legal and accounting services | | | 27,973 | |
Printing and postage | | | 30,648 | |
Registration fees | | | 50,224 | |
Miscellaneous | | | 13,335 | |
Total expenses | | $ | 759,069 | |
| |
Net investment loss | | $ | (501,617 | ) |
| |
| Realized and Unrealized Gain (Loss) from Portfolio | | | | |
Net realized gain (loss) — | | | | |
Investment transactions | | $ | 8,205,994 | |
Foreign currency transactions | | | 281 | |
Net realized gain | | $ | 8,206,275 | |
Change in unrealized appreciation (depreciation) — | | | | |
Investments | | $ | 4,040,520 | |
Net change in unrealized appreciation (depreciation) | | $ | 4,040,520 | |
| |
Net realized and unrealized gain | | $ | 12,246,795 | |
| |
Net increase in net assets from operations | | $ | 11,745,178 | |
| | | | |
| | 8 | | See Notes to Financial Statements. |
Eaton Vance
Tax-Managed Small-Cap Fund
October 31, 2012
Statements of Changes in Net Assets
| | | | | | | | |
| | | Year Ended October 31, | |
| Increase (Decrease) in Net Assets | | 2012 | | | 2011 | |
From operations — | | | | | | | | |
Net investment loss | | $ | (501,617 | ) | | $ | (1,166,813 | ) |
Net realized gain from investment and foreign currency transactions | | | 8,206,275 | | | | 5,316,527 | |
Net change in unrealized appreciation (depreciation) from investments and foreign currency | | | 4,040,520 | | | | 2,878,899 | |
Net increase in net assets from operations | | $ | 11,745,178 | | | $ | 7,028,613 | |
Transactions in shares of beneficial interest — | | | | | | | | |
Proceeds from sale of shares | | | | | | | | |
Class A | | $ | 6,138,987 | | | $ | 8,051,155 | |
Class B | | | 79,460 | | | | 535,919 | |
Class C | | | 640,076 | | | | 2,123,156 | |
Class I | | | 2,297,128 | | | | 10,041,117 | |
Cost of shares redeemed | | | | | | | | |
Class A | | | (38,094,732 | ) | | | (25,418,968 | ) |
Class B | | | (540,952 | ) | | | (738,284 | ) |
Class C | | | (4,516,712 | ) | | | (6,809,532 | ) |
Class I | | | (4,251,996 | ) | | | (6,085,692 | ) |
Net asset value of shares exchanged | | | | | | | | |
Class A | | | 770,948 | | | | 1,273,694 | |
Class B | | | (770,948 | ) | | | (1,273,694 | ) |
Net decrease in net assets from Fund share transactions | | $ | (38,248,741 | ) | | $ | (18,301,129 | ) |
| | |
Net decrease in net assets | | $ | (26,503,563 | ) | | $ | (11,272,516 | ) |
| | |
| Net Assets | | | | | | | | |
At beginning of year | | $ | 124,136,847 | | | $ | 135,409,363 | |
At end of year | | $ | 97,633,284 | | | $ | 124,136,847 | |
| | |
Accumulated undistributed net investment income
included in net assets | | | | | | | | |
At end of year | | $ | 30,429 | | | $ | 28,118 | |
| | | | |
| | 9 | | See Notes to Financial Statements. |
Eaton Vance
Tax-Managed Small-Cap Fund
October 31, 2012
Financial Highlights
| | | | | | | | | | | | | | | | | | | | |
| | | Class A | |
| | | Year Ended October 31, | |
| | | 2012 | | | 2011 | | | 2010 | | | 2009 | | | 2008 | |
Net asset value — Beginning of year | | $ | 15.340 | | | $ | 14.640 | | | $ | 11.710 | | | $ | 10.540 | | | $ | 16.140 | |
| | | | | |
| Income (Loss) From Operations | | | | | | | | | | | | | | | | | | | | |
Net investment loss(1) | | $ | (0.048 | ) | | $ | (0.110 | ) | | $ | (0.113 | ) | | $ | (0.070 | )(2) | | $ | (0.120 | ) |
Net realized and unrealized gain (loss) | | | 1.638 | | | | 0.810 | | | | 3.043 | | | | 1.240 | | | | (5.480 | ) |
| | | | | |
Total income (loss) from operations | | $ | 1.590 | | | $ | 0.700 | | | $ | 2.930 | | | $ | 1.170 | | | $ | (5.600 | ) |
| | | | | |
Net asset value — End of year | | $ | 16.930 | | | $ | 15.340 | | | $ | 14.640 | | | $ | 11.710 | | | $ | 10.540 | |
| | | | | |
Total Return(3) | | | 10.30 | % | | | 4.78 | % | | | 25.02 | % | | | 11.10 | % | | | (34.70 | )% |
| | |
| Ratios/Supplemental Data | | | | | | | | |
Net assets, end of year (000’s omitted) | | $ | 64,346 | | | $ | 87,192 | | | $ | 97,524 | | | $ | 85,422 | | | $ | 80,868 | |
Ratios (as a percentage of average daily net assets): | | | | | | | | | | | | | | | | | | | | |
Expenses(4)(5) | | | 1.25 | % | | | 1.23 | % | | | 1.28 | % | | | 1.44 | % | | | 1.27 | % |
Net investment loss | | | (0.30 | )% | | | (0.67 | )% | | | (0.84 | )% | | | (0.70 | )%(2) | | | (0.80 | )% |
Portfolio Turnover of the Portfolio | | | 57 | % | | | 89 | % | | | 114 | % | | | 95 | % | | | 93 | % |
| (1) | Computed using average shares outstanding. |
| (2) | Net investment loss per share reflects special dividends allocated from the Portfolio which amounted to $0.008 per share. Excluding special dividends, the ratio of net investment loss to average daily net assets would have been (0.78)%. |
| (3) | Returns are historical and are calculated by determining the percentage change in net asset value with all distributions reinvested and do not reflect the effect of sales charges. |
| (4) | Includes the Fund’s share of the Portfolio’s allocated expenses. |
| (5) | Excludes the effect of custody fee credits, if any, of less than 0.005%. |
| | | | |
| | 10 | | See Notes to Financial Statements. |
Eaton Vance
Tax-Managed Small-Cap Fund
October 31, 2012
Financial Highlights — continued
| | | | | | | | | | | | | | | | | | | | |
| | | Class B | |
| | | Year Ended October 31, | |
| | | 2012 | | | 2011 | | | 2010 | | | 2009 | | | 2008 | |
Net asset value — Beginning of year | | $ | 13.800 | | | $ | 13.270 | | | $ | 10.700 | | | $ | 9.700 | | | $ | 14.950 | |
| | | | | |
| Income (Loss) From Operations | | | | | | | | | | | | | | | | | | | | |
Net investment loss(1) | | $ | (0.151 | ) | | $ | (0.209 | ) | | $ | (0.194 | ) | | $ | (0.123 | )(2) | | $ | (0.216 | ) |
Net realized and unrealized gain (loss) | | | 1.471 | | | | 0.739 | | | | 2.764 | | | | 1.123 | | | | (5.034 | ) |
| | | | | |
Total income (loss) from operations | | $ | 1.320 | | | $ | 0.530 | | | $ | 2.570 | | | $ | 1.000 | | | $ | (5.250 | ) |
| | | | | |
Net asset value — End of year | | $ | 15.120 | | | $ | 13.800 | | | $ | 13.270 | | | $ | 10.700 | | | $ | 9.700 | |
| | | | | |
Total Return(3) | | | 9.57 | % | | | 3.99 | % | | | 24.02 | % | | | 10.31 | % | | | (35.12 | )% |
| | |
| Ratios/Supplemental Data | | | | | | | | |
Net assets, end of year (000’s omitted) | | $ | 1,625 | | | $ | 2,660 | | | $ | 3,899 | | | $ | 5,805 | | | $ | 12,352 | |
Ratios (as a percentage of average daily net assets): | | | | | | | | | | | | | | | | | | | | |
Expenses(4)(5) | | | 2.00 | % | | | 1.98 | % | | | 2.03 | % | | | 2.20 | % | | | 2.02 | % |
Net investment loss | | | (1.04 | )% | | | (1.41 | )% | | | (1.59 | )% | | | (1.37 | )%(2) | | | (1.55 | )% |
Portfolio Turnover of the Portfolio | | | 57 | % | | | 89 | % | | | 114 | % | | | 95 | % | | | 93 | % |
| (1) | Computed using average shares outstanding. |
| (2) | Net investment loss per share reflects special dividends allocated from the Portfolio which amounted to $0.011 per share. Excluding special dividends, the ratio of net investment loss to average daily net assets would have been (1.50)%. |
| (3) | Returns are historical and are calculated by determining the percentage change in net asset value with all distributions reinvested and do not reflect the effect of sales charges. |
| (4) | Includes the Fund’s share of the Portfolio’s allocated expenses. |
| (5) | Excludes the effect of custody fee credits, if any, of less than 0.005%. |
| | | | |
| | 11 | | See Notes to Financial Statements. |
Eaton Vance
Tax-Managed Small-Cap Fund
October 31, 2012
Financial Highlights — continued
| | | | | | | | | | | | | | | | | | | | |
| | | Class C | |
| | | Year Ended October 31, | |
| | | 2012 | | | 2011 | | | 2010 | | | 2009 | | | 2008 | |
Net asset value — Beginning of year | | $ | 13.750 | | | $ | 13.220 | | | $ | 10.660 | | | $ | 9.660 | | | $ | 14.900 | |
| | | | | |
| Income (Loss) From Operations | | | | | | | | | | | | | | | | | | | | |
Net investment loss(1) | | $ | (0.154 | ) | | $ | (0.209 | ) | | $ | (0.194 | ) | | $ | (0.132 | )(2) | | $ | (0.215 | ) |
Net realized and unrealized gain (loss) | | | 1.464 | | | | 0.739 | | | | 2.754 | | | | 1.132 | | | | (5.025 | ) |
| | | | | |
Total income (loss) from operations | | $ | 1.310 | | | $ | 0.530 | | | $ | 2.560 | | | $ | 1.000 | | | $ | (5.240 | ) |
| | | | | |
Net asset value — End of year | | $ | 15.060 | | | $ | 13.750 | | | $ | 13.220 | | | $ | 10.660 | | | $ | 9.660 | |
| | | | | |
Total Return(3) | | | 9.45 | % | | | 4.01 | % | | | 24.02 | % | | | 10.35 | % | | | (35.17 | )% |
| | |
| Ratios/Supplemental Data | | | | | | | | |
Net assets, end of year (000’s omitted) | | $ | 20,732 | | | $ | 22,593 | | | $ | 26,016 | | | $ | 22,931 | | | $ | 23,037 | |
Ratios (as a percentage of average daily net assets): | | | | | | | | | | | | | | | | | | | | |
Expenses(4)(5) | | | 2.00 | % | | | 1.98 | % | | | 2.03 | % | | | 2.19 | % | | | 2.02 | % |
Net investment loss | | | (1.06 | )% | | | (1.42 | )% | | | (1.59 | )% | | | (1.44 | )%(2) | | | (1.55 | )% |
Portfolio Turnover of the Portfolio | | | 57 | % | | | 89 | % | | | 114 | % | | | 95 | % | | | 93 | % |
| (1) | Computed using average shares outstanding. |
| (2) | Net investment loss per share reflects special dividends allocated from the Portfolio which amounted to $0.008 per share. Excluding special dividends, the ratio of net investment loss to average daily net assets would have been (1.52)%. |
| (3) | Returns are historical and are calculated by determining the percentage change in net asset value with all distributions reinvested and do not reflect the effect of sales charges. |
| (4) | Includes the Fund’s share of the Portfolio’s allocated expenses. |
| (5) | Excludes the effect of custody fee credits, if any, of less than 0.005%. |
| | | | |
| | 12 | | See Notes to Financial Statements. |
Eaton Vance
Tax-Managed Small-Cap Fund
October 31, 2012
Financial Highlights — continued
| | | | | | | | | | | | | | | | |
| | | Class I | |
| | | Year Ended October 31, | | | Period Ended October 31, 2009(1) | |
| | | 2012 | | | 2011 | | | 2010 | | |
Net asset value — Beginning of period | | $ | 15.420 | | | $ | 14.680 | | | $ | 11.710 | | | $ | 12.180 | |
| | | | |
| Income (Loss) From Operations | | | | | | | | | | | | | | | | |
Net investment loss(2) | | $ | (0.013 | ) | | $ | (0.068 | ) | | $ | (0.081 | ) | | $ | (0.008 | ) |
Net realized and unrealized gain (loss) | | | 1.653 | | | | 0.808 | | | | 3.051 | | | | (0.462 | ) |
| | | | |
Total income (loss) from operations | | $ | 1.640 | | | $ | 0.740 | | | $ | 2.970 | | | $ | (0.470 | ) |
| | | | |
Net asset value — End of period | | $ | 17.060 | | | $ | 15.420 | | | $ | 14.680 | | | $ | 11.710 | |
| | | | |
Total Return(3) | | | 10.64 | % | | | 5.04 | % | | | 25.36 | % | | | (3.86 | )%(4) |
| | | | |
| Ratios/Supplemental Data | | | | | | | | | | | | | | | | |
Net assets, end of period (000’s omitted) | | $ | 10,931 | | | $ | 11,692 | | | $ | 7,971 | | | $ | 1,923 | |
Ratios (as a percentage of average daily net assets): | | | | | | | | | | | | | | | | |
Expenses(5)(6) | | | 1.00 | % | | | 0.98 | % | | | 1.03 | % | | | 1.19 | %(7) |
Net investment loss | | | (0.08 | )% | | | (0.41 | )% | | | (0.59 | )% | | | (0.79 | )%(7) |
Portfolio Turnover of the Portfolio | | | 57 | % | | | 89 | % | | | 114 | % | | | 95 | %(8) |
| (1) | For the period from the commencement of operations, October 1, 2009, to October 31, 2009. |
| (2) | Computed using average shares outstanding. |
| (3) | Returns are historical and are calculated by determining the percentage change in net asset value with all distributions reinvested. |
| (5) | Includes the Fund’s share of the Portfolio’s allocated expenses. |
| (6) | Excludes the effect of custody fee credits, if any, of less than 0.005%. |
| (8) | For the Portfolio’s year ended October 31, 2009. |
| | | | |
| | 13 | | See Notes to Financial Statements. |
Eaton Vance
Tax-Managed Small-Cap Fund
October 31, 2012
Notes to Financial Statements
1 Significant Accounting Policies
Eaton Vance Tax-Managed Small-Cap Fund (the Fund) is a diversified series of Eaton Vance Mutual Funds Trust (the Trust). The Trust is a Massachusetts business trust registered under the Investment Company Act of 1940, as amended (the 1940 Act), as an open-end management investment company. The Fund offers four classes of shares. Class A shares are generally sold subject to a sales charge imposed at time of purchase. Class B and Class C shares are sold at net asset value and are generally subject to a contingent deferred sales charge (see Note 5). Class I shares are sold at net asset value and are not subject to a sales charge. Class B shares automatically convert to Class A shares eight years after their purchase as described in the Fund’s prospectus. Beginning January 1, 2012, Class B shares are only available for purchase upon exchange from another Eaton Vance fund or through reinvestment of distributions. Each class represents a pro-rata interest in the Fund, but votes separately on class-specific matters and (as noted below) is subject to different expenses. Realized and unrealized gains and losses and net investment income and losses, other than class-specific expenses, are allocated daily to each class of shares based on the relative net assets of each class to the total net assets of the Fund. Each class of shares differs in its distribution plan and certain other class-specific expenses. The Fund invests all of its investable assets in interests in Tax-Managed Small-Cap Portfolio (the Portfolio), a Massachusetts business trust, having the same investment objective and policies as the Fund. The value of the Fund’s investment in the Portfolio reflects the Fund’s proportionate interest in the net assets of the Portfolio (72.5% at October 31, 2012). The performance of the Fund is directly affected by the performance of the Portfolio. The financial statements of the Portfolio, including the portfolio of investments, are included elsewhere in this report and should be read in conjunction with the Fund’s financial statements.
The following is a summary of significant accounting policies of the Fund. The policies are in conformity with accounting principles generally accepted in the United States of America.
A Investment Valuation — Valuation of securities by the Portfolio is discussed in Note 1A of the Portfolio’s Notes to Financial Statements, which are included elsewhere in this report.
B Income — The Fund’s net investment income or loss consists of the Fund’s pro-rata share of the net investment income or loss of the Portfolio, less all actual and accrued expenses of the Fund.
C Federal Taxes — The Fund’s policy is to comply with the provisions of the Internal Revenue Code applicable to regulated investment companies and to distribute to shareholders each year substantially all of its net investment income, and all or substantially all of its net realized capital gains. Accordingly, no provision for federal income or excise tax is necessary.
At October 31, 2012, the Fund, for federal income tax purposes, had a capital loss carryforward of $20,601,526 which will reduce its taxable income arising from future net realized gains on investment transactions, if any, to the extent permitted by the Internal Revenue Code, and thus will reduce the amount of distributions to shareholders, which would otherwise be necessary to relieve the Fund of any liability for federal income or excise tax. The capital loss carryforward will expire on October 31, 2017. In addition, such capital loss carryforward cannot be utilized prior to the utilization of new capital losses, if any, created after October 31, 2012.
During the year ended October 31, 2012, a capital loss carryforward of $8,143,094 was utilized to offset net realized gains by the Fund.
As of October 31, 2012, the Fund had no uncertain tax positions that would require financial statement recognition, de-recognition, or disclosure. The Fund files a U.S. federal income tax return annually after its fiscal year-end, which is subject to examination by the Internal Revenue Service for a period of three years from the date of filing.
D Expenses — The majority of expenses of the Trust are directly identifiable to an individual fund. Expenses which are not readily identifiable to a specific fund are allocated taking into consideration, among other things, the nature and type of expense and the relative size of the funds.
E Expense Reduction — State Street Bank and Trust Company (SSBT) serves as custodian of the Fund. Pursuant to the custodian agreement, SSBT receives a fee reduced by credits, which are determined based on the average daily cash balance the Fund maintains with SSBT. All credit balances, if any, used to reduce the Fund’s custodian fees are reported as a reduction of expenses in the Statement of Operations.
F Use of Estimates — The preparation of the financial statements in conformity with accounting principles generally accepted in the United States of America requires management to make estimates and assumptions that affect the reported amounts of assets and liabilities at the date of the financial statements and the reported amounts of income and expense during the reporting period. Actual results could differ from those estimates.
G Indemnifications — Under the Trust’s organizational documents, its officers and Trustees may be indemnified against certain liabilities and expenses arising out of the performance of their duties to the Fund. Under Massachusetts law, if certain conditions prevail, shareholders of a Massachusetts business trust (such as the Trust) could be deemed to have personal liability for the obligations of the Trust. However, the Trust’s Declaration of Trust contains an express disclaimer of liability on the part of Fund shareholders and the By-laws provide that the Trust shall assume the defense on behalf of any Fund shareholders. Moreover, the By-laws also provide for indemnification out of Fund property of any shareholder held personally liable solely by reason of being or having been a shareholder for all loss or expense arising from such liability. Additionally, in the normal course of business, the Fund enters into agreements with service providers that may contain indemnification clauses. The Fund’s maximum exposure under these arrangements is unknown as this would involve future claims that may be made against the Fund that have not yet occurred.
Eaton Vance
Tax-Managed Small-Cap Fund
October 31, 2012
Notes to Financial Statements — continued
H Other — Investment transactions are accounted for on a trade date basis. Dividends to shareholders are recorded on the ex-dividend date.
2 Distributions to Shareholders
It is the present policy of the Fund to make at least one distribution annually (normally in December) of all or substantially all of its net investment income and to distribute annually all or substantially all of its net realized capital gains (reduced by available capital loss carryforwards from prior years, if any). Distributions are declared separately for each class of shares. Shareholders may reinvest income and capital gain distributions in additional shares of the same class of the Fund at the net asset value as of the ex-dividend date or, at the election of the shareholder, receive distributions in cash. The Fund distinguishes between distributions on a tax basis and a financial reporting basis. Accounting principles generally accepted in the United States of America require that only distributions in excess of tax basis earnings and profits be reported in the financial statements as a return of capital. Permanent differences between book and tax accounting relating to distributions are reclassified to paid-in capital. For tax purposes, distributions from short-term capital gains are considered to be from ordinary income.
During the year ended October 31, 2012, accumulated net realized loss was decreased by $52,975, accumulated net investment loss was decreased by $503,928 and paid-in capital was decreased by $556,903 due to differences between book and tax accounting, primarily for net operating losses, distributions from real estate investment trusts (REITs), investments in partnerships and foreign currency gain (loss). These reclassifications had no effect on the net assets or net asset value per share of the Fund.
As of October 31, 2012, the components of distributable earnings (accumulated losses) and unrealized appreciation (depreciation) on a tax basis were as follows:
| | | | |
Capital loss carryforward | | $ | (20,601,526 | ) |
Net unrealized appreciation | | $ | 12,987,160 | |
The differences between components of distributable earnings (accumulated losses) on a tax basis and the amounts reflected in the Statement of Assets and Liabilities are primarily due to wash sales, partnership allocations, distributions from REITs and investments in partnerships.
3 Transactions with Affiliates
Eaton Vance Management (EVM) serves as the administrator to the Fund, but receives no compensation. The Portfolio has engaged Boston Management and Research (BMR), a subsidiary of EVM, to render investment advisory services. See Note 2 of the Portfolio’s Notes to Financial Statements which are included elsewhere in this report.
EVM serves as the sub-transfer agent of the Fund and receives from the transfer agent an aggregate fee based upon the actual expenses incurred by EVM in the performance of these services. For the year ended October 31, 2012, EVM earned $14,641 in sub-transfer agent fees. The Fund was informed that Eaton Vance Distributors, Inc. (EVD), an affiliate of EVM and the Fund’s principal underwriter, received $2,080 as its portion of the sales charge on sales of Class A shares for the year ended October 31, 2012. EVD also received distribution and service fees from Class A, Class B and Class C shares (see Note 4) and contingent deferred sales charges (see Note 5).
Trustees and officers of the Fund who are members of EVM’s or BMR’s organizations receive remuneration for their services to the Fund out of the investment adviser fee. Certain officers and Trustees of the Fund and the Portfolio are officers of the above organizations.
4 Distribution Plans
The Fund has in effect a distribution plan for Class A shares (Class A Plan) pursuant to Rule 12b-1 under the 1940 Act. Pursuant to the Class A Plan, the Fund pays EVD a distribution and service fee of 0.25% per annum of its average daily net assets attributable to Class A shares for distribution services and facilities provided to the Fund by EVD, as well as for personal services and/or the maintenance of shareholder accounts. Distribution and service fees paid or accrued to EVD for the year ended October 31, 2012 amounted to $203,247 for Class A shares.
The Fund also has in effect distribution plans for Class B shares (Class B Plan) and Class C shares (Class C Plan) pursuant to Rule 12b-1 under the 1940 Act. Pursuant to the Class B and Class C Plans, the Fund pays EVD amounts equal to 0.75% per annum of its average daily net assets attributable to Class B and Class C shares for providing ongoing distribution services and facilities to the Fund. The Fund will automatically discontinue payments to EVD during any period in which there are no outstanding Uncovered Distribution Charges, which are equivalent to the sum of (i) 6.25% of the aggregate amount received by the Fund for Class B and Class C shares sold, plus (ii) interest calculated by applying the rate of 1% over the prevailing prime rate to the outstanding balance of Uncovered Distribution Charges of EVD of each respective class, reduced by the aggregate amount of contingent deferred sales charges (see Note 5) and amounts theretofore paid or payable to EVD by each respective class. For the year ended October 31, 2012, the Fund paid or accrued to EVD $15,694 and $162,305 for Class B and Class C shares, respectively, representing 0.75% of the average daily net assets of Class B and
Eaton Vance
Tax-Managed Small-Cap Fund
October 31, 2012
Notes to Financial Statements — continued
Class C shares. At October 31, 2012, the amounts of Uncovered Distribution Charges of EVD calculated under the Class B and Class C Plans were approximately $7,806,000 and $12,849,000, respectively.
Pursuant to the Class B and Class C Plans, the Fund also makes payments of service fees to EVD, financial intermediaries and other persons in amounts equal to 0.25% per annum of its average daily net assets attributable to that class. Service fees paid or accrued are for personal services and/or the maintenance of shareholder accounts. They are separate and distinct from the sales commissions and distribution fees payable to EVD and, as such, are not subject to automatic discontinuance when there are no outstanding Uncovered Distribution Charges of EVD. Service fees paid or accrued for the year ended October 31, 2012 amounted to $5,232 and $54,102 for Class B and Class C shares, respectively.
5 Contingent Deferred Sales Charges
A contingent deferred sales charge (CDSC) generally is imposed on redemptions of Class B shares made within six years of purchase and on redemptions of Class C shares made within one year of purchase. Class A shares may be subject to a 1% CDSC if redeemed within 18 months of purchase (depending on the circumstances of purchase). Generally, the CDSC is based upon the lower of the net asset value at date of redemption or date of purchase. No charge is levied on shares acquired by reinvestment of dividends or capital gain distributions. The CDSC for Class B shares is imposed at declining rates that begin at 5% in the case of redemptions in the first and second year after purchase, declining one percentage point each subsequent year. Class C shares are subject to a 1% CDSC if redeemed within one year of purchase. No CDSC is levied on shares which have been sold to EVM or its affiliates or to their respective employees or clients and may be waived under certain other limited conditions. CDSCs received on Class B and Class C redemptions are paid to EVD to reduce the amount of Uncovered Distribution Charges calculated under the Fund’s Class B and Class C Plans. CDSCs received on Class B and Class C redemptions when no Uncovered Distribution Charges exist are credited to the Fund. For the year ended October 31, 2012, the Fund was informed that EVD received approximately $200, $4,000 and $2,000 of CDSCs paid by Class A, Class B and Class C shareholders, respectively.
6 Investment Transactions
For the year ended October 31, 2012, increases and decreases in the Fund’s investment in the Portfolio aggregated $3,258,074 and $41,569,712, respectively.
7 Shares of Beneficial Interest
The Fund’s Declaration of Trust permits the Trustees to issue an unlimited number of full and fractional shares of beneficial interest (without par value). Such shares may be issued in a number of different series (such as the Fund) and classes. Transactions in Fund shares were as follows:
| | | | | | | | |
| | | Year Ended October 31, | |
| Class A | | 2012 | | | 2011 | |
| | |
Sales | | | 391,171 | | | | 492,436 | |
Redemptions | | | (2,322,861 | ) | | | (1,548,234 | ) |
Exchange from Class B shares | | | 47,903 | | | | 77,946 | |
| | |
Net decrease | | | (1,883,787 | ) | | | (977,852 | ) |
| | |
| | | | | | | | |
| | | Year Ended October 31, | |
| Class B | | 2012 | | | 2011 | |
| | |
Sales | | | 5,305 | | | | 35,954 | |
Redemptions | | | (37,199 | ) | | | (50,667 | ) |
Exchange to Class A shares | | | (53,389 | ) | | | (86,311 | ) |
| | |
Net decrease | | | (85,283 | ) | | | (101,024 | ) |
| | |
| | | | | | | | |
Eaton Vance
Tax-Managed Small-Cap Fund
October 31, 2012
Notes to Financial Statements — continued
| | | | | | | | |
| | | Year Ended October 31, | |
| Class C | | 2012 | | | 2011 | |
| | |
Sales | | | 44,321 | | | | 141,036 | |
Redemptions | | | (311,080 | ) | | | (465,707 | ) |
| | |
Net decrease | | | (266,759 | ) | | | (324,671 | ) |
| | |
| | | | | | | | |
| | | Year Ended October 31, | |
| Class I | | 2012 | | | 2011 | |
| | |
Sales | | | 139,030 | | | | 608,329 | |
Redemptions | | | (256,532 | ) | | | (393,252 | ) |
| | |
Net increase (decrease) | | | (117,502 | ) | | | 215,077 | |
Eaton Vance
Tax-Managed Small-Cap Fund
October 31, 2012
Report of Independent Registered Public Accounting Firm
To the Trustees of Eaton Vance Mutual Funds Trust and Shareholders of Eaton Vance Tax-Managed Small-Cap Fund:
We have audited the accompanying statement of assets and liabilities of Eaton Vance Tax-Managed Small-Cap Fund (the “Fund”) (one of the funds constituting Eaton Vance Mutual Funds Trust) as of October 31, 2012, and the related statement of operations for the year then ended, the statements of changes in net assets for each of the two years in the period then ended, and the financial highlights for each of the five years in the period then ended. These financial statements and financial highlights are the responsibility of the Fund’s management. Our responsibility is to express an opinion on these financial statements and financial highlights based on our audits.
We conducted our audits in accordance with the standards of the Public Company Accounting Oversight Board (United States). Those standards require that we plan and perform the audit to obtain reasonable assurance about whether the financial statements and financial highlights are free of material misstatement. The Fund is not required to have, nor were we engaged to perform, an audit of its internal control over financial reporting. Our audits included consideration of internal control over financial reporting as a basis for designing audit procedures that are appropriate in the circumstances, but not for the purpose of expressing an opinion on the effectiveness of the Fund’s internal control over financial reporting. Accordingly, we express no such opinion. An audit also includes examining, on a test basis, evidence supporting the amounts and disclosures in the financial statements, assessing the accounting principles used and significant estimates made by management, as well as evaluating the overall financial statement presentation. We believe that our audits provide a reasonable basis for our opinion.
In our opinion, such financial statements and financial highlights referred to above present fairly, in all material respects, the financial position of Eaton Vance Tax-Managed Small-Cap Fund as of October 31, 2012, the results of its operations for the year then ended, the changes in its net assets for each of the two years in the period then ended, and the financial highlights for each of the five years in the period then ended, in conformity with accounting principles generally accepted in the United States of America.
DELOITTE & TOUCHE LLP
Boston, Massachusetts
December 17, 2012
Eaton Vance
Tax-Managed Small-Cap Fund
October 31, 2012
Federal Tax Information (Unaudited)
Shareholders are advised to consult their own tax adviser with respect to the tax consequences of their investment in the Fund.
Tax-Managed Small-Cap Portfolio
October 31, 2012
Portfolio of Investments
| | | | | | | | |
| Common Stocks — 98.9% | |
| | |
| | | | | | | | |
| Security | | Shares | | | Value | |
| | | | | | | | |
| | |
Aerospace & Defense — 1.6% | | | | | | | | |
Aerovironment, Inc.(1) | | | 95,740 | | | $ | 2,105,323 | |
| | | | | | | | | |
| | | | | | $ | 2,105,323 | |
| | | | | | | | | |
| | |
Auto Components — 1.5% | | | | | | | | |
Dana Holding Corp. | | | 159,860 | | | $ | 2,103,758 | |
| | | | | | | | | |
| | | | | | $ | 2,103,758 | |
| | | | | | | | | |
| | |
Building Products — 1.9% | | | | | | | | |
Armstrong World Industries, Inc. | | | 48,650 | | | $ | 2,520,070 | |
| | | | | | | | | |
| | | | | | $ | 2,520,070 | |
| | | | | | | | | |
| | |
Capital Markets — 6.4% | | | | | | | | |
HFF, Inc., Class A(1) | | | 158,300 | | | $ | 2,205,119 | |
Lazard, Ltd., Class A | | | 81,980 | | | | 2,415,131 | |
Walter Investment Management Corp.(1) | | | 83,501 | | | | 4,035,603 | |
| | | | | | | | | |
| | | | | | $ | 8,655,853 | |
| | | | | | | | | |
| | |
Chemicals — 4.0% | | | | | | | | |
Balchem Corp. | | | 80,260 | | | $ | 2,795,456 | |
Cytec Industries, Inc. | | | 37,940 | | | | 2,611,031 | |
| | | | | | | | | |
| | | | | | $ | 5,406,487 | |
| | | | | | | | | |
| | |
Commercial Banks — 3.3% | | | | | | | | |
Signature Bank(1) | | | 34,560 | | | $ | 2,462,054 | |
Texas Capital Bancshares, Inc.(1) | | | 42,180 | | | | 2,002,285 | |
| | | | | | | | | |
| | | | | | $ | 4,464,339 | |
| | | | | | | | | |
| | |
Commercial Services & Supplies — 3.0% | | | | | | | | |
Clean Harbors, Inc.(1) | | | 13,600 | | | $ | 793,560 | |
Team, Inc.(1) | | | 98,364 | | | | 3,224,372 | |
| | | | | | | | | |
| | | | | | $ | 4,017,932 | |
| | | | | | | | | |
| | |
Construction & Engineering — 2.1% | | | | | | | | |
MYR Group, Inc.(1) | | | 134,940 | | | $ | 2,858,029 | |
| | | | | | | | | |
| | | | | | $ | 2,858,029 | |
| | | | | | | | | |
| | |
Distributors — 2.8% | | | | | | | | |
LKQ Corp.(1) | | | 180,680 | | | $ | 3,774,405 | |
| | | | | | | | | |
| | | | | | $ | 3,774,405 | |
| | | | | | | | | |
| | | | | | | | |
| Security | | Shares | | | Value | |
| | | | | | | | |
|
Electronic Equipment, Instruments & Components — 6.9% | |
FEI Co. | | | 51,540 | | | $ | 2,837,277 | |
FLIR Systems, Inc. | | | 137,190 | | | | 2,665,602 | |
InvenSense, Inc.(1) | | | 161,220 | | | | 1,805,664 | |
National Instruments Corp. | | | 86,615 | | | | 2,040,649 | |
| | | | | | | | | |
| | | | | | $ | 9,349,192 | |
| | | | | | | | | |
| | |
Energy Equipment & Services — 1.6% | | | | | | | | |
Hornbeck Offshore Services, Inc.(1) | | | 62,360 | | | $ | 2,160,150 | |
| | | | | | | | | |
| | | | | | $ | 2,160,150 | |
| | | | | | | | | |
| | |
Food Products — 3.7% | | | | | | | | |
Flowers Foods, Inc. | | | 108,880 | | | $ | 2,143,847 | |
Ingredion, Inc. | | | 43,020 | | | | 2,644,009 | |
WhiteWave Foods Co. (The), Class A(1) | | | 16,243 | | | | 267,523 | |
| | | | | | | | | |
| | | | | | $ | 5,055,379 | |
| | | | | | | | | |
| | |
Health Care Equipment & Supplies — 4.8% | | | | | | | | |
Analogic Corp. | | | 48,810 | | | $ | 3,595,344 | |
Integra LifeSciences Holdings Corp.(1) | | | 32,352 | | | | 1,237,464 | |
Orthofix International NV(1) | | | 44,130 | | | | 1,750,196 | |
| | | | | | | | | |
| | | | | | $ | 6,583,004 | |
| | | | | | | | | |
| | |
Health Care Providers & Services — 4.3% | | | | | | | | |
ExamWorks Group, Inc.(1) | | | 185,030 | | | $ | 2,594,121 | |
MEDNAX, Inc.(1) | | | 36,990 | | | | 2,551,570 | |
Team Health Holdings, Inc.(1) | | | 26,270 | | | | 699,045 | |
| | | | | | | | | |
| | | | | | $ | 5,844,736 | |
| | | | | | | | | |
| | |
Household Products — 2.6% | | | | | | | | |
Church & Dwight Co., Inc. | | | 70,060 | | | $ | 3,556,246 | |
| | | | | | | | | |
| | | | | | $ | 3,556,246 | |
| | | | | | | | | |
| | |
Insurance — 3.8% | | | | | | | | |
Allied World Assurance Co. Holdings, Ltd. | | | 36,460 | | | $ | 2,927,738 | |
HCC Insurance Holdings, Inc. | | | 64,220 | | | | 2,288,801 | |
| | | | | | | | | |
| | | | | | $ | 5,216,539 | |
| | | | | | | | | |
| | |
IT Services — 3.2% | | | | | | | | |
Euronet Worldwide, Inc.(1) | | | 120,180 | | | $ | 2,438,452 | |
Global Cash Access Holdings, Inc.(1) | | | 269,900 | | | | 1,902,795 | |
| | | | | | | | | |
| | | | | | $ | 4,341,247 | |
| | | | | | | | | |
| | | | |
| | 20 | | See Notes to Financial Statements. |
Tax-Managed Small-Cap Portfolio
October 31, 2012
Portfolio of Investments — continued
| | | | | | | | |
| Security | | Shares | | | Value | |
| | | | | | | | |
| | |
Life Sciences Tools & Services — 1.5% | | | | | | | | |
Bruker Corp.(1) | | | 169,340 | | | $ | 2,047,321 | |
| | | | | | | | | |
| | | | | | $ | 2,047,321 | |
| | | | | | | | | |
| | |
Machinery — 6.6% | | | | | | | | |
Colfax Corp.(1) | | | 69,340 | | | $ | 2,384,602 | |
RBC Bearings, Inc.(1) | | | 60,336 | | | | 2,996,286 | |
Valmont Industries, Inc. | | | 26,360 | | | | 3,561,236 | |
| | | | | | | | | |
| | | | | | $ | 8,942,124 | |
| | | | | | | | | |
| | |
Marine — 1.7% | | | | | | | | |
Kirby Corp.(1) | | | 40,290 | | | $ | 2,315,869 | |
| | | | | | | | | |
| | | | | | $ | 2,315,869 | |
| | | | | | | | | |
| | |
Multiline Retail — 2.1% | | | | | | | | |
Fred’s, Inc., Class A | | | 213,220 | | | $ | 2,889,131 | |
| | | | | | | | | |
| | | | | | $ | 2,889,131 | |
| | | | | | | | | |
| | |
Oil, Gas & Consumable Fuels — 7.2% | | | | | | | | |
Goodrich Petroleum Corp.(1) | | | 150,440 | | | $ | 1,854,925 | |
Kodiak Oil & Gas Corp.(1) | | | 301,200 | | | | 2,783,088 | |
PDC Energy, Inc.(1) | | | 100,690 | | | | 3,047,886 | |
WPX Energy, Inc.(1) | | | 127,440 | | | | 2,158,834 | |
| | | | | | | | | |
| | | | | | $ | 9,844,733 | |
| | | | | | | | | |
| | |
Real Estate Investment Trusts (REITs) — 6.5% | | | | | | | | |
American Campus Communities, Inc. | | | 52,410 | | | $ | 2,374,697 | |
Mid-America Apartment Communities, Inc. | | | 32,360 | | | | 2,094,015 | |
PS Business Parks, Inc. | | | 39,521 | | | | 2,534,482 | |
Sovran Self Storage, Inc. | | | 32,660 | | | | 1,887,748 | |
| | | | | | | | | |
| | | | | | $ | 8,890,942 | |
| | | | | | | | | |
| | |
Real Estate Management & Development — 2.6% | | | | | | | | |
Forestar Real Estate Group, Inc.(1) | | | 222,171 | | | $ | 3,556,958 | |
| | | | | | | | | |
| | | | | | $ | 3,556,958 | |
| | | | | | | | | |
|
Semiconductors & Semiconductor Equipment — 3.8% | |
Cirrus Logic, Inc.(1) | | | 74,370 | | | $ | 3,031,321 | |
Cypress Semiconductor Corp.(1) | | | 208,620 | | | | 2,067,424 | |
| | | | | | | | | |
| | | | | | $ | 5,098,745 | |
| | | | | | | | | |
| | |
Software — 2.0% | | | | | | | | |
Mentor Graphics Corp.(1) | | | 172,050 | | | $ | 2,670,216 | |
| | | | | | | | | |
| | | | | | $ | 2,670,216 | |
| | | | | | | | | |
| | | | | | | | |
| Security | | Shares | | | Value | |
| | |
Specialty Retail — 6.6% | | | | | | | | |
GNC Holdings, Inc., Class A | | | 102,540 | | | $ | 3,965,222 | |
Group 1 Automotive, Inc. | | | 35,460 | | | | 2,198,874 | |
Select Comfort Corp.(1) | | | 99,030 | | | | 2,756,005 | |
| | | | | | | | | |
| | | | | | $ | 8,920,101 | |
| | | | | | | | | |
| | |
Thrifts & Mortgage Finance — 0.8% | | | | | | | | |
ViewPoint Financial Group, Inc. | | | 53,780 | | | $ | 1,118,624 | |
| | | | | | | | | |
| | | | | | $ | 1,118,624 | |
| | | | | | | | | |
| | |
Total Common Stocks
(identified cost $112,828,284) | | | | | | $ | 134,307,453 | |
| | | | | | | | | |
|
| Special Warrants — 0.0% | |
| | |
| | | | | | | | |
| Security | | Shares | | | Value | |
| | |
Metals & Mining — 0.0% | | | | | | | | |
Western Exploration and Development, Ltd.(1)(2)(3) | | | 600,000 | | | $ | 0 | |
| | | | | | | | | |
| | |
Total Special Warrants
(identified cost $480,000) | | | | | | $ | 0 | |
| | | | | | | | | |
|
| Short-Term Investments — 2.7% | |
| | |
| | | | | | | | |
| Description | | Interest
(000’s omitted) | | | Value | |
Eaton Vance Cash Reserves Fund, LLC, 0.12%(4) | | $ | 3,636 | | | $ | 3,635,604 | |
| | | | | | | | | |
| | |
Total Short-Term Investments
(identified cost $3,635,604) | | | | | | $ | 3,635,604 | |
| | | | | | | | | |
| | |
Total Investments — 101.6%
(identified cost $116,943,888) | | | | | | $ | 137,943,057 | |
| | | | | | | | | |
| | |
Other Assets, Less Liabilities — (1.6)% | | | | | | $ | (2,147,550 | ) |
| | | | | | | | | |
| | |
Net Assets — 100.0% | | | | | | $ | 135,795,507 | |
| | | | | | | | | |
The percentage shown for each investment category in the Portfolio of Investments is based on net assets.
| (1) | Non-income producing security. |
| (2) | Restricted security (see Note 5). |
| (3) | For fair value measurement disclosure purposes, security is categorized as Level 3 (see Note 7). |
| (4) | Affiliated investment company available to Eaton Vance portfolios and funds which invests in high quality, U.S. dollar denominated money market instruments. The rate shown is the annualized seven-day yield as of October 31, 2012. |
| | | | |
| | 21 | | See Notes to Financial Statements. |
Tax-Managed Small-Cap Portfolio
October 31, 2012
Statement of Assets and Liabilities
| | | | |
| Assets | | October 31, 2012 | |
Unaffiliated investments, at value (identified cost, $113,308,284) | | $ | 134,307,453 | |
Affiliated investment, at value (identified cost, $3,635,604) | | | 3,635,604 | |
Interest receivable from affiliated investment | | | 364 | |
Total assets | | $ | 137,943,421 | |
|
| Liabilities | |
Payable for investments purchased | | $ | 2,012,215 | |
Payable to affiliates: | | | | |
Investment adviser fee | | | 73,028 | |
Trustees’ fees | | | 542 | |
Accrued expenses | | | 62,129 | |
Total liabilities | | $ | 2,147,914 | |
Net Assets applicable to investors’ interest in Portfolio | | $ | 135,795,507 | |
|
| Sources of Net Assets | |
Investors’ capital | | $ | 114,796,338 | |
Net unrealized appreciation | | | 20,999,169 | |
Total | | $ | 135,795,507 | |
| | | | |
| | 22 | | See Notes to Financial Statements. |
Tax-Managed Small-Cap Portfolio
October 31, 2012
Statement of Operations
| | | | |
| Investment Income | | Year Ended
October 31, 2012 | |
Dividends (net of foreign taxes, $6,382) | | $ | 1,463,214 | |
Interest allocated from affiliated investment | | | 5,047 | |
Expenses allocated from affiliated investment | | | (705 | ) |
Total investment income | | $ | 1,467,556 | |
|
| Expenses | |
Investment adviser fee | | $ | 971,111 | |
Trustees’ fees and expenses | | | 6,772 | |
Custodian fee | | | 89,196 | |
Legal and accounting services | | | 55,351 | |
Miscellaneous | | | 6,979 | |
Total expenses | | $ | 1,129,409 | |
Deduct — | | | | |
Reduction of custodian fee | | $ | 7 | |
Total expense reductions | | $ | 7 | |
| |
Net expenses | | $ | 1,129,402 | |
| |
Net investment income | | $ | 338,154 | |
|
| Realized and Unrealized Gain (Loss) | |
Net realized gain (loss) — | | | | |
Investment transactions | | $ | 10,292,944 | |
Investment transactions allocated from affiliated investment | | | 108 | |
Foreign currency transactions | | | 367 | |
Net realized gain | | $ | 10,293,419 | |
Change in unrealized appreciation (depreciation) — | | | | |
Investments | | $ | 5,952,299 | |
Net change in unrealized appreciation (depreciation) | | $ | 5,952,299 | |
| |
Net realized and unrealized gain | | $ | 16,245,718 | |
| |
Net increase in net assets from operations | | $ | 16,583,872 | |
| | | | |
| | 23 | | See Notes to Financial Statements. |
Tax-Managed Small-Cap Portfolio
October 31, 2012
Statements of Changes in Net Assets
| | | | | | | | |
| | | Year Ended October 31, | |
| Increase (Decrease) in Net Assets | | 2012 | | | 2011 | |
From operations — | | | | | | | | |
Net investment income (loss) | | $ | 338,154 | | | $ | (283,408 | ) |
Net realized gain from investment and foreign currency transactions | | | 10,293,419 | | | | 6,152,449 | |
Net change in unrealized appreciation (depreciation) from investments and foreign currency | | | 5,952,299 | | | | 3,147,988 | |
Net increase in net assets from operations | | $ | 16,583,872 | | | $ | 9,017,029 | |
Capital transactions — | | | | | | | | |
Contributions | | $ | 3,261,344 | | | $ | 26,265,991 | |
Withdrawals | | | (49,844,231 | ) | | | (41,453,573 | ) |
Net decrease in net assets from capital transactions | | $ | (46,582,887 | ) | | $ | (15,187,582 | ) |
| | |
Net decrease in net assets | | $ | (29,999,015 | ) | | $ | (6,170,553 | ) |
|
| Net Assets | |
At beginning of year | | $ | 165,794,522 | | | $ | 171,965,075 | |
At end of year | | $ | 135,795,507 | | | $ | 165,794,522 | |
| | | | |
| | 24 | | See Notes to Financial Statements. |
Tax-Managed Small-Cap Portfolio
October 31, 2012
Supplementary Data
| | | | | | | | | | | | | | | | | | | | |
| | | Year Ended October 31, | |
| Ratios/Supplemental Data | | 2012 | | | 2011 | | | 2010 | | | 2009 | | | 2008 | |
Ratios (as a percentage of average daily net assets): | | | | | | | | | | | | | | | | | | | | |
Expenses(1) | | | 0.73 | % | | | 0.72 | % | | | 0.74 | % | | | 0.75 | % | | | 0.74 | % |
Net investment income (loss) | | | 0.22 | % | | | (0.15 | )% | | | (0.30 | )% | | | (0.00 | )%(2)(3) | | | (0.27 | )% |
Portfolio Turnover | | | 57 | % | | | 89 | % | | | 114 | % | | | 95 | % | | | 93 | % |
| | | | | |
Total Return | | | 10.87 | % | | | 5.31 | % | | | 25.69 | % | | | 11.86 | % | | | (34.33 | )% |
| | | | | |
Net assets, end of year (000’s omitted) | | $ | 135,796 | | | $ | 165,795 | | | $ | 171,965 | | | $ | 163,056 | | | $ | 157,143 | |
| (1) | Excludes the effect of custody fee credits, if any, of less than 0.005%. |
| (2) | Excluding special dividends, the ratio of net investment loss to average daily net assets would have been (0.09)%. |
| (3) | Amount is less than 0.005%. |
| | | | |
| | 25 | | See Notes to Financial Statements. |
Tax-Managed Small-Cap Portfolio
October 31, 2012
Notes to Financial Statements
1 Significant Accounting Policies
Tax-Managed Small-Cap Portfolio (the Portfolio) is a Massachusetts business trust registered under the Investment Company Act of 1940, as amended (the 1940 Act), as a diversified, open-end management investment company. The Portfolio’s investment objective is to achieve long-term, after-tax returns by investing in a diversified portfolio of publicly traded equity securities of small-cap companies. The Declaration of Trust permits the Trustees to issue interests in the Portfolio. At October 31, 2012, Eaton Vance Tax-Managed Small-Cap Fund and Eaton Vance Tax-Managed Equity Asset Allocation Fund held an interest of 72.5% and 27.5%, respectively, in the Portfolio.
The following is a summary of significant accounting policies of the Portfolio. The policies are in conformity with accounting principles generally accepted in the United States of America.
A Investment Valuation — Equity securities (including common shares of closed-end investment companies) listed on a U.S. securities exchange generally are valued at the last sale or closing price on the day of valuation or, if no sales took place on such date, at the mean between the closing bid and asked prices therefore on the exchange where such securities are principally traded. Equity securities listed on the NASDAQ Global or Global Select Market generally are valued at the NASDAQ official closing price. Unlisted or listed securities for which closing sales prices or closing quotations are not available are valued at the mean between the latest available bid and asked prices or, in the case of preferred equity securities that are not listed or traded in the over-the-counter market, by a third party pricing service that will use various techniques that consider factors including, but not limited to, prices or yields of securities with similar characteristics, benchmark yields, broker/dealer quotes, quotes of underlying common stock, issuer spreads, as well as industry and economic events. Short-term obligations purchased with a remaining maturity of sixty days or less are generally valued at amortized cost, which approximates market value. Foreign securities and currencies are valued in U.S. dollars, based on foreign currency exchange rate quotations supplied by a third party pricing service. The pricing service uses a proprietary model to determine the exchange rate. Inputs to the model include reported trades and implied bid/ask spreads. The daily valuation of exchange-traded foreign securities generally is determined as of the close of trading on the principal exchange on which such securities trade. Events occurring after the close of trading on foreign exchanges may result in adjustments to the valuation of foreign securities to more accurately reflect their fair value as of the close of regular trading on the New York Stock Exchange. When valuing foreign equity securities that meet certain criteria, the Portfolio’s Trustees have approved the use of a fair value service that values such securities to reflect market trading that occurs after the close of the applicable foreign markets of comparable securities or other instruments that have a strong correlation to the fair-valued securities. Investments for which valuations or market quotations are not readily available or are deemed unreliable are valued at fair value using methods determined in good faith by or at the direction of the Trustees of the Portfolio in a manner that fairly reflects the security’s value, or the amount that the Portfolio might reasonably expect to receive for the security upon its current sale in the ordinary course. Each such determination is based on a consideration of relevant factors, which are likely to vary from one pricing context to another. These factors may include, but are not limited to, the type of security, the existence of any contractual restrictions on the security’s disposition, the price and extent of public trading in similar securities of the issuer or of comparable companies or entities, quotations or relevant information obtained from broker/dealers or other market participants, information obtained from the issuer, analysts, and/or the appropriate stock exchange (for exchange-traded securities), an analysis of the company’s or entity’s financial condition, and an evaluation of the forces that influence the issuer and the market(s) in which the security is purchased and sold.
The Portfolio may invest in Eaton Vance Cash Reserves Fund, LLC (Cash Reserves Fund), an affiliated investment company managed by Eaton Vance Management (EVM). Cash Reserves Fund generally values its investment securities utilizing the amortized cost valuation technique in accordance with Rule 2a-7 under the 1940 Act. This technique involves initially valuing a portfolio security at its cost and thereafter assuming a constant amortization to maturity of any discount or premium. If amortized cost is determined not to approximate fair value, Cash Reserves Fund may value its investment securities based on available market quotations provided by a third party pricing service.
B Investment Transactions — Investment transactions for financial statement purposes are accounted for on a trade date basis. Realized gains and losses on investments sold are determined on the basis of identified cost.
C Income — Dividend income is recorded on the ex-dividend date for dividends received in cash and/or securities. However, if the ex-dividend date has passed, certain dividends from foreign securities are recorded as the Portfolio is informed of the ex-dividend date. Withholding taxes on foreign dividends and capital gains have been provided for in accordance with the Portfolio’s understanding of the applicable countries’ tax rules and rates. Interest income is recorded on the basis of interest accrued, adjusted for amortization of premium or accretion of discount.
D Federal Taxes — The Portfolio has elected to be treated as a partnership for federal tax purposes. No provision is made by the Portfolio for federal or state taxes on any taxable income of the Portfolio because each investor in the Portfolio is ultimately responsible for the payment of any taxes on its share of taxable income. Since at least one of the Portfolio’s investors is a regulated investment company that invests all or substantially all of its assets in the Portfolio, the Portfolio normally must satisfy the applicable source of income and diversification requirements (under the Internal Revenue Code) in order for its investors to satisfy them. The Portfolio will allocate, at least annually among its investors, each investor’s distributive share of the Portfolio’s net investment income, net realized capital gains and any other items of income, gain, loss, deduction or credit.
As of October 31, 2012, the Portfolio had no uncertain tax positions that would require financial statement recognition, de-recognition, or disclosure. The Portfolio files a U.S. federal income tax return annually after its fiscal year-end, which is subject to examination by the Internal Revenue Service for a period of three years from the date of filing.
Tax-Managed Small-Cap Portfolio
October 31, 2012
Notes to Financial Statements — continued
E Expense Reduction — State Street Bank and Trust Company (SSBT) serves as custodian of the Portfolio. Pursuant to the custodian agreement, SSBT receives a fee reduced by credits, which are determined based on the average daily cash balance the Portfolio maintains with SSBT. All credit balances, if any, used to reduce the Portfolio’s custodian fees are reported as a reduction of expenses in the Statement of Operations.
F Foreign Currency Translation — Investment valuations, other assets, and liabilities initially expressed in foreign currencies are translated each business day into U.S. dollars based upon current exchange rates. Purchases and sales of foreign investment securities and income and expenses denominated in foreign currencies are translated into U.S. dollars based upon currency exchange rates in effect on the respective dates of such transactions. Recognized gains or losses on investment transactions attributable to changes in foreign currency exchange rates are recorded for financial statement purposes as net realized gains and losses on investments. That portion of unrealized gains and losses on investments that results from fluctuations in foreign currency exchange rates is not separately disclosed.
G Use of Estimates — The preparation of the financial statements in conformity with accounting principles generally accepted in the United States of America requires management to make estimates and assumptions that affect the reported amounts of assets and liabilities at the date of the financial statements and the reported amounts of income and expense during the reporting period. Actual results could differ from those estimates.
H Indemnifications — Under the Portfolio’s organizational documents, its officers and Trustees may be indemnified against certain liabilities and expenses arising out of the performance of their duties to the Portfolio. Under Massachusetts law, if certain conditions prevail, interestholders in the Portfolio could be deemed to have personal liability for the obligations of the Portfolio. However, the Portfolio’s Declaration of Trust contains an express disclaimer of liability on the part of Portfolio interestholders and the By-laws provide that the Portfolio shall assume the defense on behalf of any Portfolio interestholder. Moreover, the By-laws also provide for indemnification out of Portfolio property of any interestholder held personally liable solely by reason of being or having been an interestholder for all loss or expense arising from such liability. Additionally, in the normal course of business, the Portfolio enters into agreements with service providers that may contain indemnification clauses. The Portfolio’s maximum exposure under these arrangements is unknown as this would involve future claims that may be made against the Portfolio that have not yet occurred.
2 Investment Adviser Fee and Other Transactions with Affiliates
The investment adviser fee is earned by Boston Management and Research (BMR), a subsidiary of EVM, as compensation for investment advisory services rendered to the Portfolio. The fee is computed at an annual rate of 0.625% of the Portfolio’s average daily net assets up to $500 million and is payable monthly. On net assets of $500 million and over, the annual fee is reduced. The Portfolio invests its cash in Cash Reserves Fund. EVM does not currently receive a fee for advisory services provided to Cash Reserves Fund. For the year ended October 31, 2012, the Portfolio’s investment adviser fee amounted to $971,111 or 0.625% of the Portfolio’s average daily net assets.
Trustees and officers of the Portfolio who are members of EVM’s or BMR’s organizations receive remuneration for their services to the Portfolio out of the investment adviser fee. Trustees of the Portfolio who are not affiliated with the investment adviser may elect to defer receipt of all or a percentage of their annual fees in accordance with the terms of the Trustees Deferred Compensation Plan. For the year ended October 31, 2012, no significant amounts have been deferred. Certain officers and Trustees of the Portfolio are officers of the above organizations.
3 Purchases and Sales of Investments
Purchases and sales of investments, other than short-term obligations, aggregated $85,299,786 and $123,045,453, respectively, for the year ended October 31, 2012.
4 Federal Income Tax Basis of Investments
The cost and unrealized appreciation (depreciation) of investments of the Portfolio at October 31, 2012, as determined on a federal income tax basis, were as follows:
| | | | |
| |
Aggregate cost | | $ | 116,876,736 | |
| |
Gross unrealized appreciation | | $ | 25,979,706 | |
Gross unrealized depreciation | | | (4,913,385 | ) |
| |
Net unrealized appreciation | | $ | 21,066,321 | |
Tax-Managed Small-Cap Portfolio
October 31, 2012
Notes to Financial Statements — continued
5 Restricted Securities
At October 31, 2012, the Portfolio owned the following security (representing 0.0% of net assets) which was restricted as to public resale and not registered under the Securities Act of 1933 (excluding Rule 144A securities). The Portfolio has various registration rights (exercisable under a variety of circumstances) with respect to this security. The value of this security is determined based on valuations provided by brokers when available, or if not available, it is valued at fair value using methods determined in good faith by or at the direction of the Trustees.
| | | | | | | | | | | | | | | | |
| Description | | Date of Acquisition | | | Shares | | | Cost | | | Value | |
| | | | |
Special Warrants | | | | | | | | | | | | | | | | |
Western Exploration and Development, Ltd. | | | 12/21/98 | | | | 600,000 | | | $ | 480,000 | | | $ | 0 | |
| | | | |
Total Special Warrants | | | | | | | | | | $ | 480,000 | | | $ | 0 | |
| | | | |
Total Restricted Securities | | | | | | | | | | | | | | $ | 0 | |
6 Line of Credit
The Portfolio participates with other portfolios and funds managed by EVM and its affiliates in a $600 million unsecured line of credit agreement with a group of banks. Borrowings are made by the Portfolio solely to facilitate the handling of unusual and/or unanticipated short-term cash requirements. Interest is charged to the Portfolio based on its borrowings at an amount above either the Eurodollar rate or Federal Funds rate. In addition, a fee computed at an annual rate of 0.08% on the daily unused portion of the line of credit is allocated among the participating portfolios and funds at the end of each quarter. Because the line of credit is not available exclusively to the Portfolio, it may be unable to borrow some or all of its requested amounts at any particular time. The Portfolio did not have any significant borrowings or allocated fees during the year ended October 31, 2012.
7 Fair Value Measurements
Under generally accepted accounting principles for fair value measurements, a three-tier hierarchy to prioritize the assumptions, referred to as inputs, is used in valuation techniques to measure fair value. The three-tier hierarchy of inputs is summarized in the three broad levels listed below.
| Ÿ | | Level 1 – quoted prices in active markets for identical investments |
| Ÿ | | Level 2 – other significant observable inputs (including quoted prices for similar investments, interest rates, prepayment speeds, credit risk, etc.) |
| Ÿ | | Level 3 – significant unobservable inputs (including a fund’s own assumptions in determining the fair value of investments) |
In cases where the inputs used to measure fair value fall in different levels of the fair value hierarchy, the level disclosed is determined based on the lowest level input that is significant to the fair value measurement in its entirety. The inputs or methodology used for valuing securities are not necessarily an indication of the risk associated with investing in those securities.
At October 31, 2012, the hierarchy of inputs used in valuing the Portfolio’s investments, which are carried at value, were as follows:
| | | | | | | | | | | | | | | | |
| Asset Description | | Level 1 | | | Level 2 | | | Level 3** | | | Total | |
| | | | |
Common Stocks | | $ | 134,307,453 | * | | $ | — | | | $ | — | | | $ | 134,307,453 | |
Special Warrants | | | — | | | | — | | | | 0 | * | | | 0 | |
Short-Term Investments | | | — | | | | 3,635,604 | | | | — | | | | 3,635,604 | |
| | | | |
Total Investments | | $ | 134,307,453 | | | $ | 3,635,604 | | | $ | 0 | | | $ | 137,943,057 | |
| * | The level classification by major category of investments is the same as the category presentation in the Portfolio of Investments. |
| ** | None of the unobservable inputs for Level 3 assets, individually or collectively, had a material impact on the Portfolio. |
Level 3 investments at the beginning and/or end of the year in relation to net assets were not significant and accordingly, a reconciliation of Level 3 assets for the year ended October 31, 2012 is not presented. At October 31, 2012, there were no investments transferred between Level 1 and Level 2 during the year then ended.
Tax-Managed Small-Cap Portfolio
October 31, 2012
Report of Independent Registered Public Accounting Firm
To the Trustees and Investors of Tax-Managed Small-Cap Portfolio:
We have audited the accompanying statement of assets and liabilities of Tax-Managed Small-Cap Portfolio (the “Portfolio”), including the portfolio of investments, as of October 31, 2012, and the related statement of operations for the year then ended, the statements of changes in net assets for each of the two years in the period then ended, and the supplementary data for each of the five years in the period then ended. These financial statements and supplementary data are the responsibility of the Portfolio’s management. Our responsibility is to express an opinion on these financial statements and supplementary data based on our audits.
We conducted our audits in accordance with the standards of the Public Company Accounting Oversight Board (United States). Those standards require that we plan and perform the audit to obtain reasonable assurance about whether the financial statements and supplementary data are free of material misstatement. The Portfolio is not required to have, nor were we engaged to perform, an audit of its internal control over financial reporting. Our audits included consideration of internal control over financial reporting as a basis for designing audit procedures that are appropriate in the circumstances, but not for the purpose of expressing an opinion on the effectiveness of the Portfolio’s internal control over financial reporting. Accordingly, we express no such opinion. An audit also includes examining, on a test basis, evidence supporting the amounts and disclosures in the financial statements, assessing the accounting principles used and significant estimates made by management, as well as evaluating the overall financial statement presentation. Our procedures included confirmation of securities owned as of October 31, 2012, by correspondence with the custodian and brokers; where replies were not received from brokers, we performed other auditing procedures. We believe that our audits provide a reasonable basis for our opinion.
In our opinion, such financial statements and supplementary data referred to above present fairly, in all material respects, the financial position of Tax-Managed Small-Cap Portfolio as of October 31, 2012, the results of its operations for the year then ended, the changes in its net assets for each of the two years in the period then ended, and the supplementary data for each of the five years in the period then ended, in conformity with accounting principles generally accepted in the United States of America.
DELOITTE & TOUCHE LLP
Boston, Massachusetts
December 17, 2012
Eaton Vance
Tax-Managed Small-Cap Fund
October 31, 2012
Management and Organization
Fund Management. The Trustees of Eaton Vance Mutual Funds Trust (the Trust) and Tax-Managed Small-Cap Portfolio (the Portfolio) are responsible for the overall management and supervision of the Trust’s and Portfolio’s affairs. The Trustees and officers of the Trust and the Portfolio are listed below. Except as indicated, each individual has held the office shown or other offices in the same company for the last five years. Trustees and officers of the Trust and the Portfolio hold indefinite terms of office. The “Noninterested Trustees” consist of those Trustees who are not “interested persons” of the Trust and the Portfolio, as that term is defined under the 1940 Act. The business address of each Trustee and officer is Two International Place, Boston, Massachusetts 02110. As used below, “EVC” refers to Eaton Vance Corp., “EV” refers to Eaton Vance, Inc., “EVM” refers to Eaton Vance Management, “BMR” refers to Boston Management and Research and “EVD” refers to Eaton Vance Distributors, Inc. EVC and EV are the corporate parent and trustee, respectively, of EVM and BMR. EVD is the Fund’s principal underwriter, the Portfolio’s placement agent and a wholly-owned subsidiary of EVC. Each officer affiliated with Eaton Vance may hold a position with other Eaton Vance affiliates that is comparable to his or her position with EVM listed below. Each Trustee oversees 187 portfolios in the Eaton Vance Complex (including all master and feeder funds in a master feeder structure). Each officer serves as an officer of certain other Eaton Vance funds. Each Trustee and officer serves until his or her successor is elected.
| | | | | | |
| Name and Year of Birth | | Position(s) with the Trust and the
Portfolio | | Length of Service | | Principal Occupation(s) and Directorships During Past Five Years and Other Relevant Experience |
Interested Trustee |
| | | |
Thomas E. Faust Jr. 1958 | | Trustee | | Since 2007 | | Chairman, Chief Executive Officer and President of EVC, Director and President of EV, Chief Executive Officer and President of EVM and BMR, and Director of EVD. Trustee and/or officer of 187 registered investment companies. Mr. Faust is an interested person because of his positions with EVM, BMR, EVD, EVC and EV, which are affiliates of the Trust and the Portfolio. Directorships in the Last Five Years.(1) Director of EVC and Hexavest Inc. |
| | | |
| | | | | | |
Noninterested Trustees |
| | | |
Scott E. Eston 1956 | | Trustee | | Since 2011 | | Private investor. Formerly held various positions at Grantham, Mayo, Van Otterloo and Co., L.L.C. (investment management firm) (1997-2009), including Chief Operating Officer (2002-2009), Chief Financial Officer (1997-2009) and Chairman of the Executive Committee (2002-2008); President and Principal Executive Officer, GMO Trust (open-end registered investment company) (2006-2009). Former Partner, Coopers and Lybrand L.L.P. (now PricewaterhouseCoopers) (public accounting firm) (1987-1997). Directorships in the Last Five Years. None. |
| | | |
Benjamin C. Esty 1963 | | Trustee | | Since 2005 | | Roy and Elizabeth Simmons Professor of Business Administration and Finance Unit Head, Harvard University Graduate School of Business Administration. Directorships in the Last Five Years.(1) None. |
| | | |
Allen R. Freedman 1940 | | Trustee | | Since 2007 | | Private Investor. Former Chairman (2002-2004) and a Director (1983-2004) of Systems & Computer Technology Corp. (provider of software to higher education). Formerly, a Director of Loring Ward International (fund distributor) (2005-2007). Former Chairman and a Director of Indus International, Inc. (provider of enterprise management software to the power generating industry) (2005-2007). Former Chief Executive Officer of Assurant, Inc. (insurance provider) (1979-2000). Directorships in the Last Five Years.(1) Director of Stonemor Partners, L.P. (owner and operator of cemeteries). Formerly, Director of Assurant, Inc. (insurance provider) (1979-2011). |
| | | |
William H. Park 1947 | | Trustee | | Since 2003 | | Consultant and private investor. Formerly, Chief Financial Officer, Aveon Group L.P. (investment management firm) (2010-2011). Formerly, Vice Chairman, Commercial Industrial Finance Corp. (specialty finance company) (2006-2010). Formerly, President and Chief Executive Officer, Prizm Capital Management, LLC (investment management firm) (2002-2005). Formerly, Executive Vice President and Chief Financial Officer, United Asset Management Corporation (investment management firm) (1982-2001). Formerly, Senior Manager, Price Waterhouse (now PricewaterhouseCoopers) (an independent registered public accounting firm) (1972-1981). Directorships in the Last Five Years.(1) None. |
Eaton Vance
Tax-Managed Small-Cap Fund
October 31, 2012
Management and Organization — continued
| | | | | | |
| Name and Year of Birth | | Position(s) with the Trust and the
Portfolio | | Length of Service | | Principal Occupation(s) and Directorships During Past Five Years and Other Relevant Experience |
Noninterested Trustees (continued) |
| | | |
Ronald A. Pearlman 1940 | | Trustee | | Since 2003 | | Professor of Law, Georgetown University Law Center. Formerly, Deputy Assistant Secretary (Tax Policy) and Assistant Secretary (Tax Policy), U.S. Department of the Treasury (1983-1985). Formerly, Chief of Staff, Joint Committee on Taxation, U.S. Congress (1988-1990). Directorships in the Last Five Years.(1) None. |
| | | |
Helen Frame Peters 1948 | | Trustee | | Since 2008 | | Professor of Finance, Carroll School of Management, Boston College. Formerly, Dean, Carroll School of Management, Boston College (2000-2002). Formerly, Chief Investment Officer, Fixed Income, Scudder Kemper Investments (investment management firm) (1998-1999). Formerly, Chief Investment Officer, Equity and Fixed Income, Colonial Management Associates (investment management firm) (1991-1998). Directorships in the Last Five Years.(1) Formerly, Director of BJ’s Wholesale Club, Inc. (wholesale club retailer) (2004-2011). Formerly, Trustee of SPDR Index Shares Funds and SPDR Series Trust (exchange traded funds) (2000-2009). Formerly, Director of Federal Home Loan Bank of Boston (a bank for banks) (2007-2009). |
| | | |
Lynn A. Stout 1957 | | Trustee | | Since 1998 | | Distinguished Professor of Corporate and Business Law, Jack G. Clarke Business Law Institute, Cornell University Law School. Formerly, the Paul Hastings Professor of Corporate and Securities Law (2006-2012) and Professor of Law (2001-2006), University of California at Los Angeles School of Law. Directorships in the Last Five Years.(1) None. |
| | | |
Harriett Tee Taggart 1948 | | Trustee | | Since 2011 | | Managing Director, Taggart Associates (a professional practice firm). Formerly, Partner and Senior Vice President, Wellington Management Company, LLP (investment management firm) (1983-2006). Directorships in the Last Five Years. Director of Albemarle Corporation (chemicals manufacturer) (since 2007) and The Hanover Group (specialty property and casualty insurance company) (since 2009). Formerly, Director of Lubrizol Corporation (specialty chemicals) (2007-2011). |
| | | |
Ralph F. Verni 1943 | | Chairman of the Board and Trustee | | Chairman of the Board since 2007 and Trustee since 2005 | | Consultant and private investor. Formerly, Chief Investment Officer (1982-1992), Chief Financial Officer (1988-1990) and Director (1982-1992), New England Life. Formerly, Chairperson, New England Mutual Funds (1982-1992). Formerly, President and Chief Executive Officer, State Street Management & Research (1992-2000). Formerly, Chairperson, State Street Research Mutual Funds (1992-2000). Formerly, Director, W.P. Carey, LLC (1998-2004) and First Pioneer Farm Credit Corp. (2002-2006). Directorships in the Last Five Years.(1) None. |
| | | |
| | | | | | |
Principal Officers who are not Trustees |
| Name and Year of Birth | | Position(s) with the Trust and the Portfolio | | Length of Service | | Principal Occupation(s) During Past Five Years |
Duncan W. Richardson 1957 | | President of the Trust and Vice President of the Portfolio | | Since 2011 | | Director of EVC and Executive Vice President and Chief Equity Investment Officer of EVC, EVM and BMR. |
| | | |
Nancy B. Tooke 1946 | | President of the Portfolio | | Since 2011 | | Vice President of EVM and BMR. |
| | | |
Payson F. Swaffield 1956 | | Vice President of the Trust | | Since 2011 | | Vice President and Chief Income Investment Officer of EVM and BMR. |
| | | |
Barbara E. Campbell 1957 | | Treasurer | | Of the Trust since 2005 and of the Portfolio since 2008 | | Vice President of EVM and BMR. |
Eaton Vance
Tax-Managed Small-Cap Fund
October 31, 2012
Management and Organization — continued
| | | | | | |
| Name and Year of Birth | | Position(s) with the Trust and the Portfolio | | Length of Service | | Principal Occupation(s) During Past Five Years |
Principal Officers who are not Trustees (continued) |
| | | |
Maureen A. Gemma 1960 | | Vice President, Secretary and Chief Legal Officer | | Vice President since 2011, Secretary since 2007 and Chief Legal Officer since 2008 | | Vice President of EVM and BMR. |
| | | |
Paul M. O’Neil 1953 | | Chief Compliance Officer | | Since 2004 | | Vice President of EVM and BMR. |
| (1) | During their respective tenures, the Trustees (except Mr. Eston and Ms. Taggart) also served as trustees of one or more of the following Eaton Vance funds (which operated in the years noted): Eaton Vance Credit Opportunities Fund (launched in 2005 and terminated in 2010); Eaton Vance Insured Florida Plus Municipal Bond Fund (launched in 2002 and terminated in 2009); and Eaton Vance National Municipal Income Trust (launched in 1998 and terminated in 2009). |
The SAI for the Fund includes additional information about the Trustees and officers of the Fund and the Portfolio and can be obtained without charge on Eaton Vance’s website at www.eatonvance.com or by calling 1-800-262-1122.
Eaton Vance Funds
IMPORTANT NOTICES
Privacy. The Eaton Vance organization is committed to ensuring your financial privacy. Each of the financial institutions identified below has in effect the following policy (“Privacy Policy”) with respect to nonpublic personal information about its customers:
| Ÿ | | Only such information received from you, through application forms or otherwise, and information about your Eaton Vance fund transactions will be collected. This may include information such as name, address, social security number, tax status, account balances and transactions. |
| Ÿ | | None of such information about you (or former customers) will be disclosed to anyone, except as permitted by law (which includes disclosure to employees necessary to service your account). In the normal course of servicing a customer’s account, Eaton Vance may share information with unaffiliated third parties that perform various required services such as transfer agents, custodians and broker-dealers. |
| Ÿ | | Policies and procedures (including physical, electronic and procedural safeguards) are in place that are designed to protect the confidentiality of such information. |
| Ÿ | | We reserve the right to change our Privacy Policy at any time upon proper notification to you. Customers may want to review our Privacy Policy periodically for changes by accessing the link on our homepage: www.eatonvance.com. |
Our pledge of privacy applies to the following entities within the Eaton Vance organization: the Eaton Vance Family of Funds, Eaton Vance Management, Eaton Vance Investment Counsel, Eaton Vance Distributors, Inc., Eaton Vance Trust Company, Eaton Vance Management’s Real Estate Investment Group and Boston Management and Research. In addition, our Privacy Policy applies only to those Eaton Vance customers who are individuals and who have a direct relationship with us. If a customer’s account (i.e., fund shares) is held in the name of a third-party financial advisor/broker-dealer, it is likely that only such advisor’s privacy policies apply to the customer. This notice supersedes all previously issued privacy disclosures. For more information about Eaton Vance’s Privacy Policy, please call 1-800-262-1122.
Delivery of Shareholder Documents. The Securities and Exchange Commission (SEC) permits funds to deliver only one copy of shareholder documents, including prospectuses, proxy statements and shareholder reports, to fund investors with multiple accounts at the same residential or post office box address. This practice is often called “householding” and it helps eliminate duplicate mailings to shareholders. Eaton Vance, or your financial advisor, may household the mailing of your documents indefinitely unless you instruct Eaton Vance, or your financial advisor, otherwise. If you would prefer that your Eaton Vance documents not be householded, please contact Eaton Vance at 1-800-262-1122, or contact your financial advisor. Your instructions that householding not apply to delivery of your Eaton Vance documents will be effective within 30 days of receipt by Eaton Vance or your financial advisor.
Portfolio Holdings. Each Eaton Vance Fund and its underlying Portfolio(s) (if applicable) will file a schedule of portfolio holdings on Form N-Q with the SEC for the first and third quarters of each fiscal year. The Form N-Q will be available on the Eaton Vance website at www.eatonvance.com, by calling Eaton Vance at 1-800-262-1122 or in the EDGAR database on the SEC’s website at www.sec.gov. Form N-Q may also be reviewed and copied at the SEC’s public reference room in Washington, D.C. (call 1-800-732-0330 for information on the operation of the public reference room).
Proxy Voting. From time to time, funds are required to vote proxies related to the securities held by the funds. The Eaton Vance Funds or their underlying Portfolios (if applicable) vote proxies according to a set of policies and procedures approved by the Funds’ and Portfolios’ Boards. You may obtain a description of these policies and procedures and information on how the Funds or Portfolios voted proxies relating to portfolio securities during the most recent 12-month period ended June 30, without charge, upon request, by calling 1-800-262-1122 and by accessing the SEC’s website at www.sec.gov.
This Page Intentionally Left Blank
This Page Intentionally Left Blank
This Page Intentionally Left Blank
Investment Adviser of Tax-Managed Small-Cap Portfolio
Boston Management and Research
Two International Place
Boston, MA 02110
Administrator of Eaton Vance Tax-Managed Small-Cap Fund
Eaton Vance Management
Two International Place
Boston, MA 02110
Principal Underwriter*
Eaton Vance Distributors, Inc.
Two International Place
Boston, MA 02110
(617) 482-8260
Custodian
State Street Bank and Trust Company
200 Clarendon Street
Boston, MA 02116
Transfer Agent
BNY Mellon Investment Servicing (US) Inc.
Attn: Eaton Vance Funds
P.O. Box 9653
Providence, RI 02940-9653
(800) 262-1122
Independent Registered Public Accounting Firm
Deloitte & Touche LLP
200 Berkeley Street
Boston, MA 02116-5022
Fund Offices
Two International Place
Boston, MA 02110
| * | FINRA BrokerCheck. Investors may check the background of their Investment Professional by contacting the Financial Industry Regulatory Authority (FINRA). FINRA BrokerCheck is a free tool to help investors check the professional background of current and former FINRA-registered securities firms and brokers. FINRA BrokerCheck is available by calling 1-800-289-9999 and at www.FINRA.org. The FINRA BrokerCheck brochure describing this program is available to investors at www.FINRA.org. |
| | |
Eaton Vance Tax-Managed Small-Cap Value Fund Annual Report October 31, 2012 | | 
|

Fund shares are not insured by the FDIC and are not deposits or other obligations of, or guaranteed by, any depository institution. Shares are subject to investment risks, including possible loss of principal invested.
This report must be preceded or accompanied by a current summary prospectus or prospectus. Before investing, investors should consider carefully the investment objective, risks, and charges and expenses of a mutual fund. This and other important information is contained in the summary prospectus and prospectus, which can be obtained from a financial advisor. Prospective investors should read the prospectus carefully before investing. For further information, please call 1-800-262-1122.
Annual Report October 31, 2012
Eaton Vance
Tax-Managed Small-Cap Value Fund
Table of Contents
| | | | |
Management’s Discussion of Fund Performance | | | 2 | |
| |
Performance | | | 3 | |
| |
Fund Profile | | | 4 | |
| |
Endnotes and Additional Disclosures | | | 5 | |
| |
Fund Expenses | | | 6 | |
| |
Financial Statements | | | 7 | |
| |
Report of Independent Registered Public Accounting Firm | | | 18 and 29 | |
| |
Federal Tax Information | | | 19 | |
| |
Management and Organization | | | 30 | |
| |
Important Notices | | | 33 | |
Eaton Vance
Tax-Managed Small-Cap Value Fund
October 31, 2012
Management’s Discussion of Fund Performance1
Economic and Market Conditions
As the period began, investors appeared to worry about intensifying debt problems in Europe, high U.S. unemployment and a Congressional deadlock that left businesses perplexed about the direction of tax and regulatory policy. The S&P 500 Index2 was relatively flat in November 2011.
Beginning in mid-December 2011, however, an equity rally took hold and continued into early April 2012, fueled by stronger economic growth in the fourth quarter, falling unemployment, the Long-Term Refinancing Operation announced by the European Central Bank, and what the markets perceived as a successful restructuring of Greek debt. Then in May 2012, the third annual mid-year economic slowdown arrived, instigated by renewed concerns in Europe, slowing growth in China and political uncertainty in the United States with the upcoming presidential election.
But despite a slowdown in consumer spending, weakening employment data and downward revisions of growth expectations, global equities moved upward intermittently from June through mid-October 2012. Several factors appeared to be driving a market rally that defied U.S. economic data. First, investors anticipated that worsening economic news would prompt the U.S. Federal Reserve to initiate another round of quantitative easing to stimulate the economy — which it did in mid-September 2012. Second, investors were hunting for yield in a historically low interest-rate environment, and many were driven to stocks that offered higher yields than bonds.
Finally, in an increasingly global marketplace, a case could be made that the U.S. market was relatively attractive versus many other world markets for much of the period. Europe’s ongoing debt crisis led investors to move money out of European stocks and bonds. With emerging markets in Asia largely leveraged to the Chinese economy, the slowdown in Chinese growth made markets throughout Asia appear less attractive. Amid this global economic turmoil, the U.S. market was one of the few places investors could find an economy that was growing (albeit slowly); a liquid, transparent and generally well-regulated market; and an opportunity to find companies with large cash reserves and solid profit growth.
In the final weeks of the period, however, U.S. stocks gave back some of their gains as the market seemed to have come full circle; amid uncertainty about the upcoming elections, investors once again worried about a Congressional deadlock on tax policy — an impasse that has left the economy rushing headlong toward a self-imposed fiscal cliff.
Fund Performance
For the fiscal year ended October 31, 2012, Eaton Vance Tax-Managed Small-Cap Value Fund (the Fund) had a total return of 7.51% for Class A shares at net asset value (NAV). By comparison, the Fund’s benchmark, the Russell 2000 Value Index (the Index), returned 14.47% for the period.
The Fund underperformed the Index due to stock selection as well as sector and industry allocation. While the broad stock market recorded solid gains for the 12-month period, the nature of the rally favored low-quality stocks. The Fund achieved positive absolute returns in seven of the nine economic sectors in which it was invested. The Index recorded positive returns in eight of its 10 sectors.
An underweight position as well as stock selection hurt the Fund’s relative results in financials, which was the top-performing sector in the Index. In the materials sector, the Fund’s position in a major supplier of carbon for water filtration detracted from Fund performance after the company fell short of expectations. The energy sector also negatively impacted the Fund’s relative performance versus the Index due to both a sector overweight and stock selection. Energy was the weakest-performing Index sector for the 12-month period. The Fund’s holding in an oil exploration and production company detracted from Fund performance, as slowing global economic growth negatively impacted the company’s shares.
Conversely, stock selection as well as an underweight in information technology contributed to the Fund’s relative performance versus the Index. A large information technology outsourcing company with government exposure was one of the Fund’s holdings contributing to performance for the period. The company’s stock price rose partly on expectations that it would gain new business from the implementation of health care reform. The Fund’s holdings in the consumer discretionary sector also outperformed the Index for the period thanks to stock selection. The Fund’s holdings in the textiles, apparel and luxury goods industry contributed positively to results versus the Index, led by a leading manufacturer of children’s clothing. The utilities sector was also a contributor to the Fund’s relative performance versus the Index, as stock selection overcame an overweight position. Within utilities, the Fund avoided industries most impacted by price competition from falling natural gas prices.
See Endnotes and Additional Disclosures in this report.
Past performance is no guarantee of future results. Returns are historical and are calculated by determining the percentage change in net asset value (NAV) or offering price (as applicable) with all distributions reinvested. Investment return and principal value will fluctuate so that shares, when redeemed, may be worth more or less than their original cost. Performance less than one year is cumulative. Performance is for the stated time period only; due to market volatility, the Fund’s current performance may be lower or higher than quoted. Returns are before taxes unless otherwise noted. For performance as of the most recent month end, please refer to www.eatonvance.com.
Eaton Vance
Tax-Managed Small-Cap Value Fund
October 31, 2012
Performance2,3
Portfolio Managers Gregory R. Greene, CFA, J. Bradley Ohlmuller, CFA and Robert J. Milmore, CFA
| | | | | | | | | | | | | | | | | | | | |
| % Average Annual Total Returns | | Inception Date | | | One Year | | | Five Years | | | Ten Years | | | Since
Inception | |
Class A at NAV | | | 03/04/2002 | | | | 7.51 | % | | | 2.75 | % | | | 8.98 | % | | | — | |
Class A with 5.75% Maximum Sales Charge | | | — | | | | 1.34 | | | | 1.54 | | | | 8.34 | | | | — | |
Class B at NAV | | | 03/04/2002 | | | | 6.67 | | | | 1.99 | | | | 8.17 | | | | — | |
Class B with 5% Maximum Sales Charge | | | — | | | | 1.67 | | | | 1.65 | | | | 8.17 | | | | — | |
Class C at NAV | | | 03/04/2002 | | | | 6.67 | | | | 1.97 | | | | 8.18 | | | | — | |
Class C with 1% Maximum Sales Charge | | | — | | | | 5.67 | | | | 1.97 | | | | 8.18 | | | | — | |
Class I at NAV | | | 10/01/2009 | | | | 7.75 | | | | — | | | | — | | | | 10.47 | % |
Russell 2000 Value Index | | | — | | | | 14.47 | % | | | 0.87 | % | | | 9.37 | % | | | — | |
| | | | | |
| | | | | | | | | | | | | | | | | | | | |
| % After-Tax Returns with Maximum Sales Charge | | Inception Date | | | One Year | | | Five Years | | | Ten Years | | | Since
Inception | |
Class A After Taxes on Distributions | | | 03/04/2002 | | | | 0.80 | % | | | 1.00 | % | | | 7.84 | % | | | — | |
Class A After Taxes on Distributions and Sale of Fund Shares | | | — | | | | 1.53 | | | | 1.27 | | | | 7.33 | | | | — | |
Class B After Taxes on Distributions | | | 03/04/2002 | | | | 1.06 | | | | 1.07 | | | | 7.66 | | | | — | |
Class B After Taxes on Distributions and Sale of Fund Shares | | | — | | | | 1.85 | | | | 1.37 | | | | 7.19 | | | | — | |
Class C After Taxes on Distributions | | | 03/04/2002 | | | | 5.05 | | | | 1.40 | | | | 7.66 | | | | — | |
Class C After Taxes on Distributions and Sale of Fund Shares | | | — | | | | 4.44 | | | | 1.65 | | | | 7.20 | | | | — | |
Class I After Taxes on Distributions | | | 10/01/2009 | | | | 7.18 | | | | — | | | | — | | | | 10.03 | % |
Class I After Taxes on Distributions and Sale of Fund Shares | | | — | | | | 5.73 | | | | — | | | | — | | | | 8.99 | |
| | | | | |
| | | | | | | | | | | | | | | | | | | | |
| % Total Annual Operating Expense Ratios4 | | | | | Class A | | | Class B | | | Class C | | | Class I | |
Gross | | | | | | | 2.05 | % | | | 2.80 | % | | | 2.80 | % | | | 1.80 | % |
Net | | | | | | | 1.45 | | | | 2.20 | | | | 2.20 | | | | 1.20 | |
Performance of $10,000
This graph shows the change in value of a hypothetical investment of $10,000 in Class A of the Fund for the period indicated. For comparison, the same investment is shown in the indicated index.
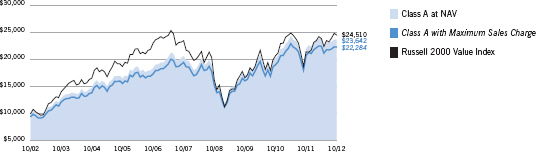
| | | | | | | | |
| Performance of Investment | | Amount Invested | | Period Beginning | | At NAV | | With Maximum Sales Charge |
Class B | | $10,000 | | 10/31/2002 | | $21,955 | | N.A. |
Class C | | $10,000 | | 10/31/2002 | | $21,963 | | N.A. |
Class I | | $250,000 | | 10/01/2009 | | $339,975 | | N.A. |
See Endnotes and Additional Disclosures in this report.
Past performance is no guarantee of future results. Returns are historical and are calculated by determining the percentage change in net asset value (NAV) or offering price (as applicable) with all distributions reinvested. Investment return and principal value will fluctuate so that shares, when redeemed, may be worth more or less than their original cost. Performance less than one year is cumulative. Performance is for the stated time period only; due to market volatility, the Fund’s current performance may be lower or higher than quoted. Returns are before taxes unless otherwise noted. For performance as of the most recent month end, please refer to www.eatonvance.com.
Eaton Vance
Tax-Managed Small-Cap Value Fund
October 31, 2012
Fund Profile5
Sector Allocation (% of net assets)6
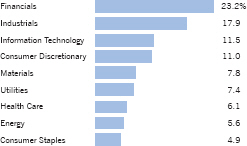
Top 10 Holdings (% of net assets)6
| | | | | | |
A.O. Smith Corp. | | | 4.3 | % | | |
Cleco Corp. | | | 4.2 | | | |
JDA Software Group, Inc. | | | 3.2 | | | |
Portland General Electric Co. | | | 3.1 | | | |
MAXIMUS, Inc. | | | 3.1 | | | |
National Penn Bancshares, Inc. | | | 2.9 | | | |
Lancaster Colony Corp. | | | 2.9 | | | |
NETGEAR, Inc. | | | 2.8 | | | |
AptarGroup, Inc. | | | 2.8 | | | |
Umpqua Holdings Corp. | | | 2.6 | | | |
Total | | | 31.9 | % | | |
See Endnotes and Additional Disclosures in this report.
Eaton Vance
Tax-Managed Small-Cap Value Fund
October 31, 2012
Endnotes and Additional Disclosures
| 1 | The views expressed in this report are those of the portfolio manager(s) and are current only through the date stated at the top of this page. These views are subject to change at any time based upon market or other conditions, and Eaton Vance and the Fund(s) disclaim any responsibility to update such views. These views may not be relied upon as investment advice and, because investment decisions are based on many factors, may not be relied upon as an indication of trading intent on behalf of any Eaton Vance fund. This commentary may contain statements that are not historical facts, referred to as “forward looking statements”. The Fund’s actual future results may differ significantly from those stated in any forward looking statement, depending on factors such as changes in securities or financial markets or general economic conditions, the volume of sales and purchases of Fund shares, the continuation of investment advisory, administrative and service contracts, and other risks discussed from time to time in the Fund’s filings with the Securities and Exchange Commission. |
| 2 | S&P 500 Index is an unmanaged index of large-cap stocks commonly used as a measure of U.S. stock market performance. Russell 2000 Value Index is an unmanaged index of U.S. small-cap value stocks. Unless otherwise stated, index returns do not reflect the effect of any applicable sales charges, commissions, expenses, taxes or leverage, as applicable. It is not possible to invest directly in an index. |
| 3 | Total Returns at NAV do not include applicable sales charges. If sales charges were deducted, the returns would be lower. Total Returns shown with maximum sales charge reflect the stated maximum sales charge. Unless otherwise stated, performance does not reflect the deduction of taxes on Fund distributions or redemptions of Fund shares. After-tax returns are calculated using certain assumptions, including using the highest historical individual federal income tax rates and do not reflect the impact of state/local taxes. Actual after-tax returns depend on a shareholder’s tax situation and the actual characterization of distributions and may differ from those shown. After-tax returns are not relevant to shareholders who hold shares in tax-deferred accounts or shares held by nontaxable entities. Return After Taxes on Distributions may be the same as Return Before Taxes for the same period because no taxable distributions were made during that period. Return After Taxes on Distributions and Sale of Fund Shares may be greater than or equal to Return After Taxes on Distributions for the same period because of losses realized on the sale of Fund shares. The Fund’s after-tax returns also may reflect foreign tax credits passed by the Fund to its shareholders. |
| 4 | Source: Fund prospectus. Net expense ratio reflects a contractual expense reimbursement that continues through 2/28/13. Without the reimbursement, performance would have been lower. |
| 5 | Fund invests in an affiliated investment company (Portfolio) with the same objective(s) and policies as the Fund. References to investments are to the Portfolio’s holdings. |
| 6 | Excludes cash and cash equivalents. |
| | Fund profile subject to change due to active management. |
Important Notice to Shareholders
| | Tax code provisions applicable to tax-favored dividends are effective for distributions paid on or before December 31, 2012. Thereafter, dividends will be taxable as ordinary income unless further legislative action is taken. |
Eaton Vance
Tax-Managed Small-Cap Value Fund
October 31, 2012
Fund Expenses
Example: As a Fund shareholder, you incur two types of costs: (1) transaction costs, including sales charges (loads) on purchases and redemption fees (if applicable); and (2) ongoing costs, including management fees; distribution and/or service fees; and other Fund expenses. This Example is intended to help you understand your ongoing costs (in dollars) of Fund investing and to compare these costs with the ongoing costs of investing in other mutual funds. The Example is based on an investment of $1,000 invested at the beginning of the period and held for the entire period (May 1, 2012 – October 31, 2012).
Actual Expenses: The first section of the table below provides information about actual account values and actual expenses. You may use the information in this section, together with the amount you invested, to estimate the expenses that you paid over the period. Simply divide your account value by $1,000 (for example, an $8,600 account value divided by $1,000 = 8.6), then multiply the result by the number in the first section under the heading entitled “Expenses Paid During Period” to estimate the expenses you paid on your account during this period.
Hypothetical Example for Comparison Purposes: The second section of the table below provides information about hypothetical account values and hypothetical expenses based on the actual Fund expense ratio and an assumed rate of return of 5% per year (before expenses), which is not the actual Fund return. The hypothetical account values and expenses may not be used to estimate the actual ending account balance or expenses you paid for the period. You may use this information to compare the ongoing costs of investing in your Fund and other funds. To do so, compare this 5% hypothetical example with the 5% hypothetical examples that appear in the shareholder reports of the other funds.
Please note that the expenses shown in the table are meant to highlight your ongoing costs only and do not reflect any transactional costs, such as sales charges (loads) or redemption fees (if applicable). Therefore, the second section of the table is useful in comparing ongoing costs only, and will not help you determine the relative total costs of owning different funds. In addition, if these transactional costs were included, your costs would be higher.
| | | | | | | | | | | | | | | | |
| | | Beginning
Account Value
(5/1/12) | | | Ending
Account Value
(10/31/12) | | | Expenses Paid
During Period*
(5/1/12 – 10/31/12) | | | Annualized
Expense
Ratio | |
| | | | |
| | | | | | | | | | | | | | | | |
Actual | | | | | | | | | | | | | |
Class A | | $ | 1,000.00 | | | $ | 992.90 | | | $ | 7.26 | ** | | | 1.45 | % |
Class B | | $ | 1,000.00 | | | $ | 989.40 | | | $ | 11.00 | ** | | | 2.20 | % |
Class C | | $ | 1,000.00 | | | $ | 988.70 | | | $ | 11.00 | ** | | | 2.20 | % |
Class I | | $ | 1,000.00 | | | $ | 993.60 | | | $ | 6.01 | ** | | | 1.20 | % |
| | | | | | | | | | | | | | | | | |
| | | | |
| | | | | | | | | | | | | | | | |
Hypothetical | | | | | | �� | | | | | | | |
(5% return per year before expenses) | | | | | | | | | | | | | |
Class A | | $ | 1,000.00 | | | $ | 1,017.80 | | | $ | 7.35 | ** | | | 1.45 | % |
Class B | | $ | 1,000.00 | | | $ | 1,014.10 | | | $ | 11.14 | ** | | | 2.20 | % |
Class C | | $ | 1,000.00 | | | $ | 1,014.10 | | | $ | 11.14 | ** | | | 2.20 | % |
Class I | | $ | 1,000.00 | | | $ | 1,019.10 | | | $ | 6.09 | ** | | | 1.20 | % |
| * | Expenses are equal to the Fund’s annualized expense ratio for the indicated Class, multiplied by the average account value over the period, multiplied by 184/366 (to reflect the one-half year period). The Example assumes that the $1,000 was invested at the net asset value per share determined at the close of business on April 30, 2012. The Example reflects the expenses of both the Fund and the Portfolio. |
| ** | Absent an allocation of certain expenses to affiliates, expenses would be higher. |
Eaton Vance
Tax-Managed Small-Cap Value Fund
October 31, 2012
Statement of Assets and Liabilities
| | | | |
| Assets | | October 31, 2012 | |
Investment in Tax-Managed Small-Cap Value Portfolio, at value (identified cost, $27,508,307) | | $ | 36,712,090 | |
Receivable for Fund shares sold | | | 4,914 | |
Receivable from affiliate | | | 7,291 | |
Total assets | | $ | 36,724,295 | |
|
| Liabilities | |
Payable for Fund shares redeemed | | $ | 42,020 | |
Payable to affiliates: | | | | |
Distribution and service fees | | | 11,868 | |
Administration fee | | | 4,667 | |
Trustees’ fees | | | 42 | |
Accrued expenses | | | 37,930 | |
Total liabilities | | $ | 96,527 | |
Net Assets | | $ | 36,627,768 | |
|
| Sources of Net Assets | |
Paid-in capital | | $ | 25,205,332 | |
Accumulated net realized gain from Portfolio | | | 2,326,571 | |
Accumulated net investment loss | | | (107,918 | ) |
Net unrealized appreciation from Portfolio | | | 9,203,783 | |
Total | | $ | 36,627,768 | |
|
| Class A Shares | |
Net Assets | | $ | 22,824,383 | |
Shares Outstanding | | | 1,489,961 | |
Net Asset Value and Redemption Price Per Share | | | | |
(net assets ÷ shares of beneficial interest outstanding) | | $ | 15.32 | |
Maximum Offering Price Per Share | | | | |
(100 ÷ 94.25 of net asset value per share) | | $ | 16.25 | |
|
| Class B Shares | |
Net Assets | | $ | 1,286,079 | |
Shares Outstanding | | | 92,346 | |
Net Asset Value and Offering Price Per Share* | | | | |
(net assets ÷ shares of beneficial interest outstanding) | | $ | 13.93 | |
|
| Class C Shares | |
Net Assets | | $ | 6,944,303 | |
Shares Outstanding | | | 498,017 | |
Net Asset Value and Offering Price Per Share* | | | | |
(net assets ÷ shares of beneficial interest outstanding) | | $ | 13.94 | |
|
| Class I Shares | |
Net Assets | | $ | 5,573,003 | |
Shares Outstanding | | | 360,831 | |
Net Asset Value, Offering Price and Redemption Price Per Share | | | | |
(net assets ÷ shares of beneficial interest outstanding) | | $ | 15.44 | |
On sales of $50,000 or more, the offering price of Class A shares is reduced.
| * | Redemption price per share is equal to the net asset value less any applicable contingent deferred sales charge. |
| | | | |
| | 7 | | See Notes to Financial Statements. |
Eaton Vance
Tax-Managed Small-Cap Value Fund
October 31, 2012
Statement of Operations
| | | | |
| Investment Income | | Year Ended
October 31, 2012 | |
Dividends allocated from Portfolio (net of foreign taxes, $218) | | $ | 478,264 | |
Interest allocated from Portfolio | | | 94 | |
Expenses allocated from Portfolio | | | (413,527 | ) |
Total investment income from Portfolio | | $ | 64,831 | |
|
| Expenses | |
Administration fee | | $ | 54,723 | |
Distribution and service fees | | | | |
Class A | | | 58,455 | |
Class B | | | 16,187 | |
Class C | | | 73,377 | |
Trustees’ fees and expenses | | | 500 | |
Custodian fee | | | 15,402 | |
Transfer and dividend disbursing agent fees | | | 48,709 | |
Legal and accounting services | | | 20,171 | |
Printing and postage | | | 19,818 | |
Registration fees | | | 52,077 | |
Miscellaneous | | | 13,046 | |
Total expenses | | $ | 372,465 | |
Deduct — | | | | |
Allocation of expenses to affiliates | | $ | 200,130 | |
Total expense reductions | | $ | 200,130 | |
| |
Net expenses | | $ | 172,335 | |
| |
Net investment loss | | $ | (107,504 | ) |
|
| Realized and Unrealized Gain (Loss) from Portfolio | |
Net realized gain (loss) — | | | | |
Investment transactions | | $ | 2,411,020 | |
Net realized gain | | $ | 2,411,020 | |
Change in unrealized appreciation (depreciation) — | | | | |
Investments | | $ | 225,635 | |
Net change in unrealized appreciation (depreciation) | | $ | 225,635 | |
| |
Net realized and unrealized gain | | $ | 2,636,655 | |
| |
Net increase in net assets from operations | | $ | 2,529,151 | |
| | | | |
| | 8 | | See Notes to Financial Statements. |
Eaton Vance
Tax-Managed Small-Cap Value Fund
October 31, 2012
Statements of Changes in Net Assets
| | | | | | | | |
| | | Year Ended October 31, | |
| Increase (Decrease) in Net Assets | | 2012 | | | 2011 | |
From operations — | | | | | | | | |
Net investment loss | | $ | (107,504 | ) | | $ | (128,312 | ) |
Net realized gain from investment transactions | | | 2,411,020 | | | | 1,395,930 | |
Net change in unrealized appreciation (depreciation) from investments | | | 225,635 | | | | 2,048,851 | |
Net increase in net assets from operations | | $ | 2,529,151 | | | $ | 3,316,469 | |
Distributions to shareholders — | | | | | | | | |
From net realized gain | | | | | | | | |
Class A | | $ | (858,606 | ) | | $ | (1,295,895 | ) |
Class B | | | (70,065 | ) | | | (110,140 | ) |
Class C | | | (286,480 | ) | | | (392,953 | ) |
Class I | | | (128,499 | ) | | | (74,671 | ) |
Total distributions to shareholders | | $ | (1,343,650 | ) | | $ | (1,873,659 | ) |
Transactions in shares of beneficial interest — | | | | | | | | |
Proceeds from sale of shares | | | | | | | | |
Class A | | $ | 3,343,223 | | | $ | 6,322,372 | |
Class B | | | 357,858 | | | | 525,474 | |
Class C | | | 769,219 | | | | 1,551,167 | |
Class I | | | 2,945,220 | | | | 2,903,262 | |
Net asset value of shares issued to shareholders in payment of distributions declared | | | | | | | | |
Class A | | | 799,592 | | | | 1,138,551 | |
Class B | | | 45,498 | | | | 87,432 | |
Class C | | | 225,917 | | | | 309,152 | |
Class I | | | 96,195 | | | | 4,226 | |
Cost of shares redeemed | | | | | | | | |
Class A | | | (6,711,068 | ) | | | (10,360,470 | ) |
Class B | | | (464,785 | ) | | | (500,694 | ) |
Class C | | | (1,593,437 | ) | | | (1,978,212 | ) |
Class I | | | (963,098 | ) | | | (1,127,669 | ) |
Net asset value of shares exchanged | | | | | | | | |
Class A | | | 466,139 | | | | 485,346 | |
Class B | | | (466,139 | ) | | | (485,346 | ) |
Net decrease in net assets from Fund share transactions | | $ | (1,149,666 | ) | | $ | (1,125,409 | ) |
| | |
Net increase in net assets | | $ | 35,835 | | | $ | 317,401 | |
|
| Net Assets | |
At beginning of year | | $ | 36,591,933 | | | $ | 36,274,532 | |
At end of year | | $ | 36,627,768 | | | $ | 36,591,933 | |
|
Accumulated net investment loss
included in net assets | |
At end of year | | $ | (107,918 | ) | | $ | — | |
| | | | |
| | 9 | | See Notes to Financial Statements. |
Eaton Vance
Tax-Managed Small-Cap Value Fund
October 31, 2012
Financial Highlights
| | | | | | | | | | | | | | | | | | | | |
| | | Class A | |
| | | Year Ended October 31, | |
| | | 2012 | | | 2011 | | | 2010 | | | 2009 | | | 2008 | |
Net asset value — Beginning of year | | $ | 14.770 | | | $ | 14.210 | | | $ | 12.000 | | | $ | 11.400 | | | $ | 16.050 | |
| | | | | |
| Income (Loss) From Operations | | | | | | | | | | | | | | | | | | | | |
Net investment income (loss)(1) | | $ | (0.021 | ) | | $ | (0.023 | )(2) | | $ | (0.043 | ) | | $ | 0.022 | | | $ | (0.003 | ) |
Net realized and unrealized gain (loss) | | | 1.100 | | | | 1.298 | | | | 2.253 | | | | 0.578 | | | | (3.146 | ) |
| | | | | |
Total income (loss) from operations | | $ | 1.079 | | | $ | 1.275 | | | $ | 2.210 | | | $ | 0.600 | | | $ | (3.149 | ) |
| | | | | |
| Less Distributions | | | | | | | | | | | | | | | | | | | | |
From net realized gain | | $ | (0.529 | ) | | $ | (0.715 | ) | | $ | — | | | $ | — | | | $ | (1.501 | ) |
| | | | | |
Total distributions | | $ | (0.529 | ) | | $ | (0.715 | ) | | $ | — | | | $ | — | | | $ | (1.501 | ) |
| | | | | |
Net asset value — End of year | | $ | 15.320 | | | $ | 14.770 | | | $ | 14.210 | | | $ | 12.000 | | | $ | 11.400 | |
| | | | | |
Total Return(3) | | | 7.51 | % | | | 8.94 | % | | | 18.42 | % | | | 5.36 | % | | | (21.61 | )% |
| | | | | |
| Ratios/Supplemental Data | | | | | | | | | | | | | | | | | | | | |
Net assets, end of year (000’s omitted) | | $ | 22,824 | | | $ | 24,119 | | | $ | 25,448 | | | $ | 21,727 | | | $ | 17,628 | |
Ratios (as a percentage of average daily net assets): | | | | | | | | | | | | | | | | | | | | |
Expenses(4)(5)(6) | | | 1.45 | % | | | 1.59 | % | | | 1.65 | % | | | 1.65 | % | | | 1.65 | % |
Net investment income (loss) | | | (0.14 | )% | | | (0.15 | )%(2) | | | (0.32 | )% | | | 0.21 | % | | | (0.02 | )% |
Portfolio Turnover of the Portfolio | | | 55 | % | | | 66 | % | | | 51 | % | | | 66 | % | | | 103 | % |
| (1) | Computed using average shares outstanding. |
| (2) | Net investment loss per share includes special dividends allocated from the Portfolio which amounted to $0.024 per share. Excluding special dividends, the ratio of net investment loss to average daily net assets would have been (0.31)%. |
| (3) | Returns are historical and are calculated by determining the percentage change in net asset value with all distributions reinvested and do not reflect the effect of sales charges. |
| (4) | Includes the Fund’s share of the Portfolio’s allocated expenses. |
| (5) | The administrator subsidized certain operating expenses (equal to 0.55%, 0.46%, 0.37%, 0.55% and 0.32% of average daily net assets for the years ended October 31, 2012, 2011, 2010, 2009 and 2008, respectively). Prior to March 19, 2012, a portion of the subsidy was borne by the sub-adviser of the Portfolio. Absent this subsidy, total return would have been lower. |
| (6) | Excludes the effect of custody fee credits, if any, of less than 0.005%. |
| | | | |
| | 10 | | See Notes to Financial Statements. |
Eaton Vance
Tax-Managed Small-Cap Value Fund
October 31, 2012
Financial Highlights — continued
| | | | | | | | | | | | | | | | | | | | |
| | | Class B | |
| | | Year Ended October 31, | |
| | | 2012 | | | 2011 | | | 2010 | | | 2009 | | | 2008 | |
Net asset value — Beginning of year | | $ | 13.580 | | | $ | 13.210 | | | $ | 11.240 | | | $ | 10.750 | | | $ | 15.330 | |
| | | | | |
| Income (Loss) From Operations | | | | | | | | | | | | | | | | | | | | |
Net investment loss(1) | | $ | (0.121 | ) | | $ | (0.124 | )(2) | | $ | (0.132 | ) | | $ | (0.049 | ) | | $ | (0.102 | ) |
Net realized and unrealized gain (loss) | | | 1.000 | | | | 1.209 | | | | 2.102 | | | | 0.539 | | | | (2.977 | ) |
| | | | | |
Total income (loss) from operations | | $ | 0.879 | | | $ | 1.085 | | | $ | 1.970 | | | $ | 0.490 | | | $ | (3.079 | ) |
| | | | | |
| Less Distributions | | | | | | | | | | | | | | | | | | | | |
From net realized gain | | $ | (0.529 | ) | | $ | (0.715 | ) | | $ | — | | | $ | — | | | $ | (1.501 | ) |
| | | | | |
Total distributions | | $ | (0.529 | ) | | $ | (0.715 | ) | | $ | — | | | $ | — | | | $ | (1.501 | ) |
| | | | | |
Net asset value — End of year | | $ | 13.930 | | | $ | 13.580 | | | $ | 13.210 | | | $ | 11.240 | | | $ | 10.750 | |
| | | | | |
Total Return(3) | | | 6.67 | % | | | 8.14 | % | | | 17.53 | % | | | 4.56 | % | | | (22.15 | )% |
| | | | | |
| Ratios/Supplemental Data | | | | | | | | | | | | | | | | | | | | |
Net assets, end of year (000’s omitted) | | $ | 1,286 | | | $ | 1,768 | | | $ | 2,071 | | | $ | 2,638 | | | $ | 3,538 | |
Ratios (as a percentage of average daily net assets): | | | | | | | | | | | | | | | | | | | | |
Expenses(4)(5)(6) | | | 2.20 | % | | | 2.35 | % | | | 2.40 | % | | | 2.40 | % | | | 2.40 | % |
Net investment loss | | | (0.88 | )% | | | (0.90 | )%(2) | | | (1.06 | )% | | | (0.51 | )% | | | (0.79 | )% |
Portfolio Turnover of the Portfolio | | | 55 | % | | | 66 | % | | | 51 | % | | | 66 | % | | | 103 | % |
| (1) | Computed using average shares outstanding. |
| (2) | Net investment loss per share includes special dividends allocated from the Portfolio which amounted to $0.022 per share. Excluding special dividends, the ratio of net investment loss to average daily net assets would have been (1.06)%. |
| (3) | Returns are historical and are calculated by determining the percentage change in net asset value with all distributions reinvested and do not reflect the effect of sales charges. |
| (4) | Includes the Fund’s share of the Portfolio’s allocated expenses. |
| (5) | The administrator subsidized certain operating expenses (equal to 0.55%, 0.46%, 0.37%, 0.55% and 0.32% of average daily net assets for the years ended October 31, 2012, 2011, 2010, 2009 and 2008, respectively). Prior to March 19, 2012, a portion of the subsidy was borne by the sub-adviser of the Portfolio. Absent this subsidy, total return would have been lower. |
| (6) | Excludes the effect of custody fee credits, if any, of less than 0.005%. |
| | | | |
| | 11 | | See Notes to Financial Statements. |
Eaton Vance
Tax-Managed Small-Cap Value Fund
October 31, 2012
Financial Highlights — continued
| | | | | | | | | | | | | | | | | | | | |
| | | Class C | |
| | | Year Ended October 31, | |
| | | 2012 | | | 2011 | | | 2010 | | | 2009 | | | 2008 | |
Net asset value — Beginning of year | | $ | 13.590 | | | $ | 13.220 | | | $ | 11.250 | | | $ | 10.760 | | | $ | 15.350 | |
| | | | | |
| Income (Loss) From Operations | | | | | | | | | | | | | | | | | | | | |
Net investment loss(1) | | $ | (0.122 | ) | | $ | (0.123 | )(2) | | $ | (0.133 | ) | | $ | (0.053 | ) | | $ | (0.100 | ) |
Net realized and unrealized gain (loss) | | | 1.001 | | | | 1.208 | | | | 2.103 | | | | 0.543 | | | | (2.989 | ) |
| | | | | |
Total income (loss) from operations | | $ | 0.879 | | | $ | 1.085 | | | $ | 1.970 | | | $ | 0.490 | | | $ | (3.089 | ) |
| | | | | |
| Less Distributions | | | | | | | | | | | | | | | | | | | | |
From net realized gain | | $ | (0.529 | ) | | $ | (0.715 | ) | | $ | — | | | $ | — | | | $ | (1.501 | ) |
| | | | | |
Total distributions | | $ | (0.529 | ) | | $ | (0.715 | ) | | $ | — | | | $ | — | | | $ | (1.501 | ) |
| | | | | |
Net asset value — End of year | | $ | 13.940 | | | $ | 13.590 | | | $ | 13.220 | | | $ | 11.250 | | | $ | 10.760 | |
| | | | | |
Total Return(3) | | | 6.67 | % | | | 8.14 | % | | | 17.51 | % | | | 4.55 | % | | | (22.19 | )% |
| | | | | |
| Ratios/Supplemental Data | | | | | | | | | | | | | | | | | | | | |
Net assets, end of year (000’s omitted) | | $ | 6,944 | | | $ | 7,351 | | | $ | 7,312 | | | $ | 6,317 | | | $ | 5,336 | |
Ratios (as a percentage of average daily net assets): | | | | | | | | | | | | | | | | | | | | |
Expenses(4)(5)(6) | | | 2.20 | % | | | 2.34 | % | | | 2.40 | % | | | 2.40 | % | | | 2.40 | % |
Net investment loss | | | (0.89 | )% | | | (0.90 | )%(2) | | | (1.06 | )% | | | (0.54 | )% | | | (0.78 | )% |
Portfolio Turnover of the Portfolio | | | 55 | % | | | 66 | % | | | 51 | % | | | 66 | % | | | 103 | % |
| (1) | Computed using average shares outstanding. |
| (2) | Net investment loss per share includes special dividends allocated from the Portfolio which amounted to $0.021 per share. Excluding special dividends, the ratio of net investment loss to average daily net assets would have been (1.05)%. |
| (3) | Returns are historical and are calculated by determining the percentage change in net asset value with all distributions reinvested and do not reflect the effect of sales charges. |
| (4) | Includes the Fund’s share of the Portfolio’s allocated expenses. |
| (5) | The administrator subsidized certain operating expenses (equal to 0.55%, 0.46%, 0.37%, 0.55% and 0.32% of average daily net assets for the years ended October 31, 2012, 2011, 2010, 2009 and 2008, respectively). Prior to March 19, 2012, a portion of the subsidy was borne by the sub-adviser of the Portfolio. Absent this subsidy, total return would have been lower. |
| (6) | Excludes the effect of custody fee credits, if any, of less than 0.005%. |
| | | | |
| | 12 | | See Notes to Financial Statements. |
Eaton Vance
Tax-Managed Small-Cap Value Fund
October 31, 2012
Financial Highlights — continued
| | | | | | | | | | | | | | | | |
| | | Class I | |
| | | Year Ended October 31, | | | Period Ended October 31, 2009(1) | |
| | | 2012 | | | 2011 | | | 2010 | | |
Net asset value — Beginning of period | | $ | 14.850 | | | $ | 14.250 | | | $ | 12.000 | | | $ | 12.330 | |
| | | | |
| Income (Loss) From Operations | | | | | | | | | | | | | | | | |
Net investment income (loss)(2) | | $ | 0.014 | | | $ | 0.008 | (3) | | $ | (0.011 | ) | | $ | (0.001 | ) |
Net realized and unrealized gain (loss) | | | 1.105 | | | | 1.307 | | | | 2.261 | | | | (0.329 | ) |
| | | | |
Total income (loss) from operations | | $ | 1.119 | | | $ | 1.315 | | | $ | 2.250 | | | $ | (0.330 | ) |
| | | | |
| Less Distributions | | | | | | | | | | | | | | | | |
From net realized gain | | $ | (0.529 | ) | | $ | (0.715 | ) | | $ | — | | | $ | — | |
| | | | |
Total distributions | | $ | (0.529 | ) | | $ | (0.715 | ) | | $ | — | | | $ | — | |
| | | | |
Net asset value — End of period | | $ | 15.440 | | | $ | 14.850 | | | $ | 14.250 | | | $ | 12.000 | |
| | | | |
Total Return(4) | | | 7.75 | % | | | 9.20 | % | | | 18.75 | % | | | (2.68 | )%(5) |
| | | | |
| Ratios/Supplemental Data | | | | | | | | | | | | | | | | |
Net assets, end of period (000’s omitted) | | $ | 5,573 | | | $ | 3,354 | | | $ | 1,444 | | | $ | 897 | |
Ratios (as a percentage of average daily net assets): | | | | | | | | | | | | | | | | |
Expenses(6)(7)(8) | | | 1.20 | % | | | 1.34 | % | | | 1.40 | % | | | 1.40 | %(9) |
Net investment income (loss) | | | 0.10 | % | | | 0.05 | %(3) | | | (0.08 | )% | | | (0.07 | )%(9) |
Portfolio Turnover of the Portfolio | | | 55 | % | | | 66 | % | | | 51 | % | | | 66 | %(5)(10) |
| (1) | For the period from the commencement of operations, October 1, 2009, to October 31, 2009. |
| (2) | Computed using average shares outstanding. |
| (3) | Net investment income per share includes special dividends allocated from the Portfolio which amounted to $0.022 per share. Excluding special dividends, the ratio of net investment income (loss) to average daily net assets would have been (0.09)%. |
| (4) | Returns are historical and are calculated by determining the percentage change in net asset value with all distributions reinvested. |
| (6) | Includes the Fund’s share of the Portfolio’s allocated expenses. |
| (7) | The administrator subsidized certain operating expenses (equal to 0.55%, 0.46%, 0.37% and 0.58% of average daily net assets for the years ended October 31, 2012, 2011 and 2010 and the period ended October 31, 2009, respectively). Prior to March 19, 2012, a portion of the subsidy was borne by the sub-adviser of the Portfolio. Absent this subsidy, total return would have been lower. |
| (8) | Excludes the effect of custody fee credits, if any, of less than 0.005%. |
| (10) | For the Portfolio’s year ended October 31, 2009. |
| | | | |
| | 13 | | See Notes to Financial Statements. |
Eaton Vance
Tax-Managed Small-Cap Value Fund
October 31, 2012
Notes to Financial Statements
1 Significant Accounting Policies
Eaton Vance Tax-Managed Small-Cap Value Fund (the Fund) is a diversified series of Eaton Vance Mutual Funds Trust (the Trust). The Trust is a Massachusetts business trust registered under the Investment Company Act of 1940, as amended (the 1940 Act), as an open-end management investment company. The Fund offers four classes of shares. Class A shares are generally sold subject to a sales charge imposed at time of purchase. Class B and Class C shares are sold at net asset value and are generally subject to a contingent deferred sales charge (see Note 5). Class I shares are sold at net asset value and are not subject to a sales charge. Class B shares automatically convert to Class A shares eight years after their purchase as described in the Fund’s prospectus. Beginning on January 1, 2012, Class B shares are only available for purchase upon exchange from another Eaton Vance fund or through reinvestment of distributions. Each class represents a pro-rata interest in the Fund, but votes separately on class-specific matters and (as noted below) is subject to different expenses. Realized and unrealized gains and losses and net investment income and losses, other than class-specific expenses, are allocated daily to each class of shares based on the relative net assets of each class to the total net assets of the Fund. Each class of shares differs in its distribution plan and certain other class-specific expenses. The Fund invests all of its investable assets in interests in Tax-Managed Small-Cap Value Portfolio (the Portfolio), a Massachusetts business trust, having the same investment objective and policies as the Fund. The value of the Fund’s investment in the Portfolio reflects the Fund’s proportionate interest in the net assets of the Portfolio (52.4% at October 31, 2012). The performance of the Fund is directly affected by the performance of the Portfolio. The financial statements of the Portfolio, including the portfolio of investments, are included elsewhere in this report and should be read in conjunction with the Fund’s financial statements.
The following is a summary of significant accounting policies of the Fund. The policies are in conformity with accounting principles generally accepted in the United States of America.
A Investment Valuation — Valuation of securities by the Portfolio is discussed in Note 1A of the Portfolio’s Notes to Financial Statements, which are included elsewhere in this report.
B Income — The Fund’s net investment income or loss consists of the Fund’s pro-rata share of the net investment income or loss of the Portfolio, less all actual and accrued expenses of the Fund.
C Federal Taxes — The Fund’s policy is to comply with the provisions of the Internal Revenue Code applicable to regulated investment companies and to distribute to shareholders each year substantially all of its net investment income, and all or substantially all of its net realized capital gains. Accordingly, no provision for federal income or excise tax is necessary.
At October 31, 2012, the Fund had a net investment loss of $107,918 incurred after December 31, 2011. This net loss is treated as arising on the first day of the Fund’s taxable year ending October 31, 2013.
As of October 31, 2012, the Fund had no uncertain tax positions that would require financial statement recognition, de-recognition, or disclosure. The Fund files a U.S. federal income tax return annually after its fiscal year-end, which is subject to examination by the Internal Revenue Service for a period of three years from the date of filing.
D Expenses — The majority of expenses of the Trust are directly identifiable to an individual fund. Expenses which are not readily identifiable to a specific fund are allocated taking into consideration, among other things, the nature and type of expense and the relative size of the funds.
E Expense Reduction — State Street Bank and Trust Company (SSBT) serves as custodian of the Fund. Pursuant to the custodian agreement, SSBT receives a fee reduced by credits, which are determined based on the average daily cash balance the Fund maintains with SSBT. All credit balances, if any, used to reduce the Fund’s custodian fees are reported as a reduction of expenses in the Statement of Operations.
F Use of Estimates — The preparation of the financial statements in conformity with accounting principles generally accepted in the United States of America requires management to make estimates and assumptions that affect the reported amounts of assets and liabilities at the date of the financial statements and the reported amounts of income and expense during the reporting period. Actual results could differ from those estimates.
G Indemnifications — Under the Trust’s organizational documents, its officers and Trustees may be indemnified against certain liabilities and expenses arising out of the performance of their duties to the Fund. Under Massachusetts law, if certain conditions prevail, shareholders of a Massachusetts business trust (such as the Trust) could be deemed to have personal liability for the obligations of the Trust. However, the Trust’s Declaration of Trust contains an express disclaimer of liability on the part of Fund shareholders and the By-laws provide that the Trust shall assume the defense on behalf of any Fund shareholders. Moreover, the By-laws also provide for indemnification out of Fund property of any shareholder held personally liable solely by reason of being or having been a shareholder for all loss or expense arising from such liability. Additionally, in the normal course of business, the Fund enters into agreements with service providers that may contain indemnification clauses. The Fund’s maximum exposure under these arrangements is unknown as this would involve future claims that may be made against the Fund that have not yet occurred.
H Other — Investment transactions are accounted for on a trade date basis. Dividends to shareholders are recorded on the ex-dividend date.
Eaton Vance
Tax-Managed Small-Cap Value Fund
October 31, 2012
Notes to Financial Statements — continued
2 Distributions to Shareholders
It is the present policy of the Fund to make at least one distribution annually (normally in December) of all or substantially all of its net investment income and to distribute annually all or substantially all of its net realized capital gains. Distributions are declared separately for each class of shares. Shareholders may reinvest income and capital gain distributions in additional shares of the same class of the Fund at the net asset value as of the ex-dividend date or, at the election of the shareholder, receive distributions in cash. The Fund distinguishes between distributions on a tax basis and a financial reporting basis. Accounting principles generally accepted in the United States of America require that only distributions in excess of tax basis earnings and profits be reported in the financial statements as a return of capital. Permanent differences between book and tax accounting relating to distributions are reclassified to paid-in capital. For tax purposes, distributions from short-term capital gains are considered to be from ordinary income.
The tax character of distributions declared for the years ended October 31, 2012 and October 31, 2011 was as follows:
| | | | | | | | |
| | | Year Ended October 31, | |
| | | 2012 | | | 2011 | |
| | |
Distributions declared from: | | | | | | | | |
Long-term capital gains | | $ | 1,343,650 | | | $ | 1,873,659 | |
During the year ended October 31, 2012, accumulated net investment loss was increased by $414 and accumulated net realized gain was increased by $414 due to differences between book and tax accounting, primarily for foreign currency gain (loss). These reclassifications had no effect on the net assets or net asset value per share of the Fund.
As of October 31, 2012, the components of distributable earnings (accumulated losses) and unrealized appreciation (depreciation) on a tax basis were as follows:
| | | | |
Undistributed long-term capital gains | | $ | 2,454,238 | |
Late year ordinary losses | | $ | (107,918 | ) |
Net unrealized appreciation | | $ | 9,076,116 | |
The differences between components of distributable earnings (accumulated losses) on a tax basis and the amounts reflected in the Statement of Assets and Liabilities are primarily due to wash sales and partnership allocations.
3 Transactions with Affiliates
The administration fee is earned by Eaton Vance Management (EVM) as compensation for administrative services rendered to the Fund. The fee is computed at an annual rate of 0.15% of the Fund’s average daily net assets. For the year ended October 31, 2012, the administration fee amounted to $54,723. EVM (and the sub-adviser of the Portfolio, Fox Asset Management LLC (Fox), prior to the termination of the sub-advisory agreement effective March 19, 2012) has agreed to reimburse the Fund’s expenses to the extent that total annual operating expenses (related to ordinary operating expenses only) exceed 1.45%, 2.20%, 2.20% and 1.20% of the Fund’s average daily net assets for Class A, Class B, Class C and Class I, respectively. This agreement may be changed or terminated after February 28, 2013. Pursuant to this agreement, EVM and Fox were allocated $200,130 in total of the Fund’s operating expenses for the year ended October 31, 2012. The Portfolio has engaged Boston Management and Research (BMR), a subsidiary of EVM, to render investment advisory services. See Note 2 of the Portfolio’s Notes to Financial Statements which are included elsewhere in this report.
EVM serves as the sub-transfer agent of the Fund and receives from the transfer agent an aggregate fee based upon the actual expenses incurred by EVM in the performance of these services. For the year ended October 31, 2012, EVM earned $2,804 in sub-transfer agent fees. The Fund was informed that Eaton Vance Distributors, Inc. (EVD), an affiliate of EVM and the Fund’s principal underwriter, received $3,252 as its portion of the sales charge on sales of Class A shares for the year ended October 31, 2012. EVD also received distribution and service fees from Class A, Class B and Class C shares (see Note 4) and contingent deferred sales charges (see Note 5).
Trustees and officers of the Fund and Portfolio who are members of EVM’s or BMR’s organizations receive remuneration for their services to the Fund out of the investment adviser fee. Certain officers and Trustees of the Fund and the Portfolio are officers of the above organizations.
Eaton Vance
Tax-Managed Small-Cap Value Fund
October 31, 2012
Notes to Financial Statements — continued
4 Distribution Plans
The Fund has in effect a distribution plan for Class A shares (Class A Plan) pursuant to Rule 12b-1 under the 1940 Act. Pursuant to the Class A Plan, the Fund pays EVD a distribution and service fee of 0.25% per annum of its average daily net assets attributable to Class A shares for distribution services and facilities provided to the Fund by EVD, as well as for personal services and/or the maintenance of shareholder accounts. Distribution and service fees paid or accrued to EVD for the year ended October 31, 2012 amounted to $58,455 for Class A shares.
The Fund also has in effect distribution plans for Class B shares (Class B Plan) and Class C shares (Class C Plan) pursuant to Rule 12b-1 under the 1940 Act. Pursuant to the Class B and Class C Plans, the Fund pays EVD amounts equal to 0.75% per annum of its average daily net assets attributable to Class B and Class C shares for providing ongoing distribution services and facilities to the Fund. The Fund will automatically discontinue payments to EVD during any period in which there are no outstanding Uncovered Distribution Charges, which are equivalent to the sum of (i) 6.25% of the aggregate amount received by the Fund for Class B and Class C shares sold, plus (ii) interest calculated by applying the rate of 1% over the prevailing prime rate to the outstanding balance of Uncovered Distribution Charges of EVD of each respective class, reduced by the aggregate amount of contingent deferred sales charges (see Note 5) and amounts theretofore paid or payable to EVD by each respective class. For the year ended October 31, 2012, the Fund paid or accrued to EVD $12,140 and $55,033 for Class B and Class C shares, respectively, representing 0.75% of the average daily net assets of Class B and Class C shares. At October 31, 2012, the amounts of Uncovered Distribution Charges of EVD calculated under the Class B and Class C Plans were approximately $68,000 and $638,000, respectively.
Pursuant to the Class B and Class C Plans, the Fund also makes payments of service fees to EVD, financial intermediaries and other persons in amounts equal to 0.25% per annum of its average daily net assets attributable to that class. Service fees paid or accrued are for personal services and/or the maintenance of shareholder accounts. They are separate and distinct from the sales commissions and distribution fees payable to EVD and, as such, are not subject to automatic discontinuance when there are no outstanding Uncovered Distribution Charges of EVD. Service fees paid or accrued for the year ended October 31, 2012 amounted to $4,047 and $18,344 for Class B and Class C shares, respectively.
5 Contingent Deferred Sales Charges
A contingent deferred sales charge (CDSC) generally is imposed on redemptions of Class B shares made within six years of purchase and on redemptions of Class C shares made within one year of purchase. Class A shares may be subject to a 1% CDSC if redeemed within 18 months of purchase (depending on the circumstances of purchase). Generally, the CDSC is based upon the lower of the net asset value at date of redemption or date of purchase. No charge is levied on shares acquired by reinvestment of dividends or capital gain distributions. The CDSC for Class B shares is imposed at declining rates that begin at 5% in the case of redemptions in the first and second year after purchase, declining one percentage point each subsequent year. Class C shares are subject to a 1% CDSC if redeemed within one year of purchase. No CDSC is levied on shares which have been sold to EVM or its affiliates or to their respective employees or clients and may be waived under certain other limited conditions. CDSCs received on Class B and Class C redemptions are paid to EVD to reduce the amount of Uncovered Distribution Charges calculated under the Fund’s Class B and Class C Plans. CDSCs received on Class B and Class C redemptions when no Uncovered Distribution Charges exist are credited to the Fund. For the year ended October 31, 2012, the Fund was informed that EVD received approximately $20, $500 and $300 of CDSCs paid by Class A, Class B and Class C shareholders, respectively.
6 Investment Transactions
For the year ended October 31, 2012, increases and decreases in the Fund’s investment in the Portfolio aggregated $6,095,551 and $7,401,466, respectively.
7 Shares of Beneficial Interest
The Fund’s Declaration of Trust permits the Trustees to issue an unlimited number of full and fractional shares of beneficial interest (without par value). Such shares may be issued in a number of different series (such as the Fund) and classes. Transactions in Fund shares were as follows:
| | | | | | | | |
| | | Year Ended October 31, | |
| Class A | | 2012 | | | 2011 | |
| | |
Sales | | | 218,859 | | | | 423,467 | |
Issued to shareholders electing to receive payments of distributions in Fund shares | | | 55,220 | | | | 76,515 | |
Redemptions | | | (447,881 | ) | | | (690,343 | ) |
Exchange from Class B shares | | | 30,965 | | | | 32,662 | |
| | |
Net decrease | | | (142,837 | ) | | | (157,699 | ) |
Eaton Vance
Tax-Managed Small-Cap Value Fund
October 31, 2012
Notes to Financial Statements — continued
| | | | | | | | |
| | | Year Ended October 31, | |
| Class B | | 2012 | | | 2011 | |
| | |
Sales | | | 26,736 | | | | 38,421 | |
Issued to shareholders electing to receive payments of distributions in Fund shares | | | 3,433 | | | | 6,349 | |
Redemptions | | | (34,134 | ) | | | (35,965 | ) |
Exchange to Class A shares | | | (33,913 | ) | | | (35,396 | ) |
| | |
Net decrease | | | (37,878 | ) | | | (26,591 | ) |
| | |
| | | | | | | | |
| | | Year Ended October 31, | |
| Class C | | 2012 | | | 2011 | |
| | |
Sales | | | 55,790 | | | | 111,470 | |
Issued to shareholders electing to receive payments of distributions in Fund shares | | | 17,025 | | | | 22,435 | |
Redemptions | | | (115,640 | ) | | | (145,996 | ) |
| | |
Net decrease | | | (42,825 | ) | | | (12,091 | ) |
| | |
| | | | | | | | |
| | | Year Ended October 31, | |
| Class I | | 2012 | | | 2011 | |
| | |
Sales | | | 192,760 | | | | 203,245 | |
Issued to shareholders electing to receive payments of distributions in Fund shares | | | 6,602 | | | | 283 | |
Redemptions | | | (64,388 | ) | | | (78,984 | ) |
| | |
Net increase | | | 134,974 | | | | 124,544 | |
Eaton Vance
Tax-Managed Small-Cap Value Fund
October 31, 2012
Report of Independent Registered Public Accounting Firm
To the Trustees of Eaton Vance Mutual Funds Trust and Shareholders of Eaton Vance Tax-Managed Small-Cap Value Fund:
We have audited the accompanying statement of assets and liabilities of Eaton Vance Tax-Managed Small-Cap Value Fund (the “Fund”) (one of the funds constituting Eaton Vance Mutual Funds Trust) as of October 31, 2012, and the related statement of operations for the year then ended, the statements of changes in net assets for each of the two years in the period then ended, and the financial highlights for each of the five years in the period then ended. These financial statements and financial highlights are the responsibility of the Fund’s management. Our responsibility is to express an opinion on these financial statements and financial highlights based on our audits.
We conducted our audits in accordance with the standards of the Public Company Accounting Oversight Board (United States). Those standards require that we plan and perform the audit to obtain reasonable assurance about whether the financial statements and financial highlights are free of material misstatement. The Fund is not required to have, nor were we engaged to perform, an audit of its internal control over financial reporting. Our audits included consideration of internal control over financial reporting as a basis for designing audit procedures that are appropriate in the circumstances, but not for the purpose of expressing an opinion on the effectiveness of the Fund’s internal control over financial reporting. Accordingly, we express no such opinion. An audit also includes examining, on a test basis, evidence supporting the amounts and disclosures in the financial statements, assessing the accounting principles used and significant estimates made by management, as well as evaluating the overall financial statement presentation. We believe that our audits provide a reasonable basis for our opinion.
In our opinion, such financial statements and financial highlights referred to above present fairly, in all material respects, the financial position of Eaton Vance Tax-Managed Small-Cap Value Fund as of October 31, 2012, the results of its operations for the year then ended, the changes in its net assets for each of the two years in the period then ended, and the financial highlights for each of the five years in the period then ended, in conformity with accounting principles generally accepted in the United States of America.
DELOITTE & TOUCHE LLP
Boston, Massachusetts
December 17, 2012
Eaton Vance
Tax-Managed Small-Cap Value Fund
October 31, 2012
Federal Tax Information (Unaudited)
The Form 1099-DIV you receive in January 2013 will show the tax status of all distributions paid to your account in calendar year 2012. Shareholders are advised to consult their own tax adviser with respect to the tax consequences of their investment in the Fund. As required by the Internal Revenue Code and/or regulations, shareholders must be notified regarding capital gain dividends.
Capital Gains Dividends. The Fund hereby designates as a capital gain dividend with respect to the taxable year ended October 31, 2012, $4,854,728 or, if subsequently determined to be different, the net capital gain of such year.
Tax-Managed Small-Cap Value Portfolio
October 31, 2012
Portfolio of Investments
| | | | | | | | |
| Common Stocks — 95.4% | | | | | | | | |
| | |
| | | | | | | | |
| Security | | Shares | | | Value | |
| | | | | | | | |
|
Auto Components — 1.0% | |
Dana Holding Corp. | | | 53,354 | | | $ | 702,139 | |
| | | | | | | | | |
| | | | | | $ | 702,139 | |
| | | | | | | | | |
|
Building Products — 4.3% | |
A.O. Smith Corp. | | | 49,350 | | | $ | 2,998,999 | |
| | | | | | | | | |
| | | | | | $ | 2,998,999 | |
| | | | | | | | | |
|
Capital Markets — 1.6% | |
Stifel Financial Corp.(1) | | | 34,763 | | | $ | 1,101,987 | |
| | | | | | | | | |
| | | | | | $ | 1,101,987 | |
| | | | | | | | | |
|
Chemicals — 5.0% | |
Calgon Carbon Corp.(1) | | | 51,196 | | | $ | 634,318 | |
Innophos Holdings, Inc. | | | 31,154 | | | | 1,484,488 | |
RPM International, Inc. | | | 52,000 | | | | 1,386,320 | |
| | | | | | | | | |
| | | | | | $ | 3,505,126 | |
| | | | | | | | | |
|
Commercial Banks — 12.8% | |
First Midwest Bancorp, Inc. | | | 54,514 | | | $ | 674,338 | |
MB Financial, Inc. | | | 76,841 | | | | 1,556,799 | |
National Penn Bancshares, Inc. | | | 230,500 | | | | 2,058,365 | |
Prosperity Bancshares, Inc. | | | 38,800 | | | | 1,624,168 | |
Trustmark Corp. | | | 51,624 | | | | 1,211,615 | |
Umpqua Holdings Corp. | | | 153,200 | | | | 1,852,188 | |
| | | | | | | | | |
| | | | | | $ | 8,977,473 | |
| | | | | | | | | |
|
Communications Equipment — 2.8% | |
NETGEAR, Inc.(1) | | | 56,200 | | | $ | 1,995,662 | |
| | | | | | | | | |
| | | | | | $ | 1,995,662 | |
| | | | | | | | | |
|
Construction & Engineering — 2.9% | |
EMCOR Group, Inc. | | | 31,051 | | | $ | 998,600 | |
MasTec, Inc.(1) | | | 45,992 | | | | 1,037,580 | |
| | | | | | | | | |
| | | | | | $ | 2,036,180 | |
| | | | | | | | | |
|
Containers & Packaging — 2.8% | |
AptarGroup, Inc. | | | 37,800 | | | $ | 1,938,384 | |
| | | | | | | | | |
| | | | | | $ | 1,938,384 | |
| | | | | | | | | |
| | | | | | | | |
| Security | | Shares | | | Value | |
| | | | | | | | |
|
Electric Utilities — 7.3% | |
Cleco Corp. | | | 69,200 | | | $ | 2,985,980 | |
Portland General Electric Co. | | | 79,200 | | | | 2,170,080 | |
| | | | | | | | | |
| | | | | | $ | 5,156,060 | |
| | | | | | | | | |
|
Electrical Equipment — 0.5% | |
General Cable Corp.(1) | | | 13,422 | | | $ | 382,930 | |
| | | | | | | | | |
| | | | | | $ | 382,930 | |
| | | | | | | | | |
|
Electronic Equipment, Instruments & Components — 0.5% | |
Itron, Inc.(1) | | | 7,935 | | | $ | 325,811 | |
| | | | | | | | | |
| | | | | | $ | 325,811 | |
| | | | | | | | | |
|
Energy Equipment & Services — 2.7% | |
Hornbeck Offshore Services, Inc.(1) | | | 38,004 | | | $ | 1,316,458 | |
Oil States International, Inc.(1) | | | 7,698 | | | | 562,724 | |
| | | | | | | | | |
| | | | | | $ | 1,879,182 | |
| | | | | | | | | |
|
Food Products — 4.9% | |
Darling International, Inc.(1) | | | 44,462 | | | $ | 734,957 | |
J & J Snack Foods Corp. | | | 12,336 | | | | 706,483 | |
Lancaster Colony Corp. | | | 27,900 | | | | 2,030,562 | |
| | | | | | | | | |
| | | | | | $ | 3,472,002 | |
| | | | | | | | | |
|
Health Care Equipment & Supplies — 4.1% | |
Teleflex, Inc. | | | 17,200 | | | $ | 1,168,740 | |
West Pharmaceutical Services, Inc. | | | 32,100 | | | | 1,729,227 | |
| | | | | | | | | |
| | | | | | $ | 2,897,967 | |
| | | | | | | | | |
|
Health Care Providers & Services — 2.0% | |
Magellan Health Services, Inc.(1) | | | 28,126 | | | $ | 1,410,519 | |
| | | | | | | | | |
| | | | | | $ | 1,410,519 | |
| | | | | | | | | |
|
Insurance — 7.9% | |
Aspen Insurance Holdings, Ltd. | | | 47,300 | | | $ | 1,530,155 | |
National Financial Partners Corp.(1) | | | 22,542 | | | | 413,646 | |
ProAssurance Corp. | | | 13,855 | | | | 1,238,637 | |
Protective Life Corp. | | | 49,989 | | | | 1,364,700 | |
Tower Group, Inc. | | | 53,633 | | | | 966,466 | |
| | | | | | | | | |
| | | | | | $ | 5,513,604 | |
| | | | | | | | | |
| | | | |
| | 20 | | See Notes to Financial Statements. |
Tax-Managed Small-Cap Value Portfolio
October 31, 2012
Portfolio of Investments — continued
| | | | | | | | |
| Security | | Shares | | | Value | |
| | | | | | | | |
| | |
IT Services — 3.1% | | | | | | | | |
MAXIMUS, Inc. | | | 39,000 | | | $ | 2,152,020 | |
| | | | | | | | | |
| | | | | | $ | 2,152,020 | |
| | | | | | | | | |
|
Machinery — 4.3% | |
Barnes Group, Inc. | | | 77,400 | | | $ | 1,770,912 | |
Crane Co. | | | 22,180 | | | | 931,116 | |
EnPro Industries, Inc.(1) | | | 8,949 | | | | 327,176 | |
| | | | | | | | | |
| | | | | | $ | 3,029,204 | |
| | | | | | | | | |
|
Media — 1.7% | |
Madison Square Garden Co. (The)(1) | | | 28,700 | | | $ | 1,181,292 | |
| | | | | | | | | |
| | | | | | $ | 1,181,292 | |
| | | | | | | | | |
|
Oil, Gas & Consumable Fuels — 2.9% | |
Stone Energy Corp.(1) | | | 43,822 | | | $ | 1,033,761 | |
VAALCO Energy, Inc.(1) | | | 122,682 | | | | 1,002,312 | |
| | | | | | | | | |
| | | | | | $ | 2,036,073 | |
| | | | | | | | | |
|
Professional Services — 1.2% | |
Towers Watson & Co., Class A | | | 15,515 | | | $ | 833,311 | |
| | | | | | | | | |
| | | | | | $ | 833,311 | |
| | | | | | | | | |
|
Road & Rail — 4.7% | |
Genesee & Wyoming, Inc., Class A(1) | | | 23,723 | | | $ | 1,719,206 | |
Old Dominion Freight Line, Inc.(1) | | | 46,896 | | | | 1,572,892 | |
| | | | | | | | | |
| | | | | | $ | 3,292,098 | |
| | | | | | | | | |
|
Semiconductors & Semiconductor Equipment — 0.9% | |
OmniVision Technologies, Inc.(1) | | | 44,254 | | | $ | 632,832 | |
| | | | | | | | | |
| | | | | | $ | 632,832 | |
| | | | | | | | | |
|
Software — 4.2% | |
Ebix, Inc. | | | 30,953 | | | $ | 674,466 | |
JDA Software Group, Inc.(1) | | | 58,900 | | | | 2,246,446 | |
| | | | | | | | | |
| | | | | | $ | 2,920,912 | |
| | | | | | | | | |
|
Specialty Retail — 4.8% | |
Aeropostale, Inc.(1) | | | 66,406 | | | $ | 793,552 | |
Children’s Place Retail Stores, Inc. (The)(1) | | | 26,084 | | | | 1,524,088 | |
Finish Line, Inc. (The), Class A | | | 50,500 | | | | 1,050,652 | |
| | | | | | | | | |
| | | | | | $ | 3,368,292 | |
| | | | | | | | | |
| | | | | | | | |
| Security | | Shares | | | Value | |
| | | | | | | | |
|
Textiles, Apparel & Luxury Goods — 3.5% | |
Hanesbrands, Inc.(1) | | | 43,000 | | | $ | 1,439,210 | |
Iconix Brand Group, Inc.(1) | | | 53,945 | | | | 998,522 | |
| | | | | | | | | |
| | | | | | $ | 2,437,732 | |
| | | | | | | | | |
|
Thrifts & Mortgage Finance — 1.0% | |
Washington Federal, Inc. | | | 40,300 | | | $ | 676,234 | |
| | | | | | | | | |
| | | | | | $ | 676,234 | |
| | | | | | | | | |
| | |
Total Common Stocks
(identified cost $48,374,516) | | | | | | $ | 66,854,025 | |
| | | | | | | | | |
| | |
| Short-Term Investments — 4.7% | | | | | | | | |
| | |
| | | | | | | | |
| Description | | Principal
Amount
(000’s omitted) | | | Value | |
State Street Bank and Trust Euro Time Deposit,
0.01%, 11/1/12 | | $ | 3,254 | | | $ | 3,254,174 | |
| | | | | | | | | |
| | |
Total Short-Term Investments
(identified cost $3,254,174) | | | | | | $ | 3,254,174 | |
| | | | | | | | | |
| | |
Total Investments — 100.1%
(identified cost $51,628,690) | | | | | | $ | 70,108,199 | |
| | | | | | | | | |
| | |
Other Assets, Less Liabilities — (0.1)% | | | | | | $ | (54,865 | ) |
| | | | | | | | | |
| | |
Net Assets — 100.0% | | | | | | $ | 70,053,334 | |
| | | | | | | | | |
The percentage shown for each investment category in the Portfolio of Investments is based on net assets.
| (1) | Non-income producing security. |
| | | | |
| | 21 | | See Notes to Financial Statements. |
Tax-Managed Small-Cap Value Portfolio
October 31, 2012
Statement of Assets and Liabilities
| | | | |
| Assets | | October 31, 2012 | |
Investments, at value (identified cost, $51,628,690) | | $ | 70,108,199 | |
Dividends and interest receivable | | | 39,020 | |
Total assets | | $ | 70,147,219 | |
| |
| Liabilities | | | | |
Payable to affiliates: | | | | |
Investment adviser fee | | $ | 59,269 | |
Trustees’ fees | | | 268 | |
Accrued expenses | | | 34,348 | |
Total liabilities | | $ | 93,885 | |
Net Assets applicable to investors’ interest in Portfolio | | $ | 70,053,334 | |
| |
| Sources of Net Assets | | | | |
Investors’ capital | | $ | 51,573,825 | |
Net unrealized appreciation | | | 18,479,509 | |
Total | | $ | 70,053,334 | |
| | | | |
| | 22 | | See Notes to Financial Statements. |
Tax-Managed Small-Cap Value Portfolio
October 31, 2012
Statement of Operations
| | | | |
| Investment Income | | Year Ended
October 31, 2012 | |
Dividends (net of foreign taxes, $429) | | $ | 943,406 | |
Interest | | | 184 | |
Total investment income | | $ | 943,590 | |
| |
| Expenses | | | | |
Investment adviser fee | | $ | 718,910 | |
Trustees’ fees and expenses | | | 3,363 | |
Custodian fee | | | 55,098 | |
Legal and accounting services | | | 31,993 | |
Miscellaneous | | | 4,917 | |
Total expenses | | $ | 814,281 | |
Deduct — | | | | |
Reduction of custodian fee | | $ | 1 | |
Total expense reductions | | $ | 1 | |
| |
Net expenses | | $ | 814,280 | |
| |
Net investment income | | $ | 129,310 | |
| |
| Realized and Unrealized Gain (Loss) | | | | |
Net realized gain (loss) — | | | | |
Investment transactions | | $ | 4,981,323 | |
Net realized gain | | $ | 4,981,323 | |
Change in unrealized appreciation (depreciation) — | | | | |
Investments | | $ | 216,959 | |
Net change in unrealized appreciation (depreciation) | | $ | 216,959 | |
| |
Net realized and unrealized gain | | $ | 5,198,282 | |
| |
Net increase in net assets from operations | | $ | 5,327,592 | |
| | | | |
| | 23 | | See Notes to Financial Statements. |
Tax-Managed Small-Cap Value Portfolio
October 31, 2012
Statements of Changes in Net Assets
| | | | | | | | |
| | | Year Ended October 31, | |
| Increase (Decrease) in Net Assets | | 2012 | | | 2011 | |
From operations — | | | | | | | | |
Net investment income | | $ | 129,310 | | | $ | 254,980 | |
Net realized gain from investment transactions | | | 4,981,323 | | | | 2,534,917 | |
Net change in unrealized appreciation (depreciation) from investments | | | 216,959 | | | | 3,896,518 | |
Net increase in net assets from operations | | $ | 5,327,592 | | | $ | 6,686,415 | |
Capital transactions — | | | | | | | | |
Contributions | | $ | 6,097,420 | | | $ | 12,264,195 | |
Withdrawals | | | (15,044,707 | ) | | | (17,744,784 | ) |
Net decrease in net assets from capital transactions | | $ | (8,947,287 | ) | | $ | (5,480,589 | ) |
| | |
Net increase (decrease) in net assets | | $ | (3,619,695 | ) | | $ | 1,205,826 | |
|
| Net Assets | |
At beginning of year | | $ | 73,673,029 | | | $ | 72,467,203 | |
At end of year | | $ | 70,053,334 | | | $ | 73,673,029 | |
| | | | |
| | 24 | | See Notes to Financial Statements. |
Tax-Managed Small-Cap Value Portfolio
October 31, 2012
Supplementary Data
| | | | | | | | | | | | | | | | | | | | |
| | | Year Ended October 31, | |
| Ratios/Supplemental Data | | 2012 | | | 2011 | | | 2010 | | | 2009 | | | 2008 | |
Ratios (as a percentage of average daily net assets): | | | | | | | | | | | | | | | | | | | | |
Expenses(1) | | | 1.13 | % | | | 1.11 | % | | | 1.13 | % | | | 1.14 | % | | | 1.12 | % |
Net investment income | | | 0.18 | % | | | 0.33 | %(2) | | | 0.20 | % | | | 0.73 | % | | | 0.51 | % |
Portfolio Turnover | | | 55 | % | | | 66 | % | | | 51 | % | | | 66 | % | | | 103 | % |
| | | | | |
Total Return | | | 7.86 | % | | | 9.46 | % | | | 18.99 | % | | | 5.89 | % | | | (21.19 | )% |
| | | | | |
Net assets, end of year (000’s omitted) | | $ | 70,053 | | | $ | 73,673 | | | $ | 72,467 | | | $ | 67,629 | | | $ | 61,778 | |
| (1) | Excludes the effect of custody fee credits, if any, of less than 0.005%. |
| (2) | Includes special dividends equal to 0.16% of average daily net assets. |
| | | | |
| | 25 | | See Notes to Financial Statements. |
Tax-Managed Small-Cap Value Portfolio
October 31, 2012
Notes to Financial Statements
1 Significant Accounting Policies
Tax-Managed Small-Cap Value Portfolio (the Portfolio) is a Massachusetts business trust registered under the Investment Company Act of 1940, as amended (the 1940 Act), as a diversified, open-end management investment company. The Portfolio’s investment objective is to achieve long-term after-tax returns by investing in a diversified portfolio of value stocks of small-cap companies. The Declaration of Trust permits the Trustees to issue interests in the Portfolio. At October 31, 2012, Eaton Vance Tax-Managed Small-Cap Value Fund and Eaton Vance Tax-Managed Equity Asset Allocation Fund held an interest of 52.4% and 47.6%, respectively, in the Portfolio.
The following is a summary of significant accounting policies of the Portfolio. The policies are in conformity with accounting principles generally accepted in the United States of America.
A Investment Valuation — Equity securities (including common shares of closed-end investment companies) listed on a U.S. securities exchange generally are valued at the last sale or closing price on the day of valuation or, if no sales took place on such date, at the mean between the closing bid and asked prices therefore on the exchange where such securities are principally traded. Equity securities listed on the NASDAQ Global or Global Select Market generally are valued at the NASDAQ official closing price. Unlisted or listed securities for which closing sales prices or closing quotations are not available are valued at the mean between the latest available bid and asked prices or, in the case of preferred equity securities that are not listed or traded in the over-the-counter market, by a third party pricing service that will use various techniques that consider factors including, but not limited to, prices or yields of securities with similar characteristics, benchmark yields, broker/dealer quotes, quotes of underlying common stock, issuer spreads, as well as industry and economic events. Short-term obligations purchased with a remaining maturity of sixty days or less are generally valued at amortized cost, which approximates market value. Investments for which valuations or market quotations are not readily available or are deemed unreliable are valued at fair value using methods determined in good faith by or at the direction of the Trustees of the Portfolio in a manner that fairly reflects the security’s value, or the amount that the Portfolio might reasonably expect to receive for the security upon its current sale in the ordinary course. Each such determination is based on a consideration of relevant factors, which are likely to vary from one pricing context to another. These factors may include, but are not limited to, the type of security, the existence of any contractual restrictions on the security’s disposition, the price and extent of public trading in similar securities of the issuer or of comparable companies or entities, quotations or relevant information obtained from broker/dealers or other market participants, information obtained from the issuer, analysts, and/or the appropriate stock exchange (for exchange-traded securities), an analysis of the company’s or entity’s financial condition, and an evaluation of the forces that influence the issuer and the market(s) in which the security is purchased and sold.
B Investment Transactions — Investment transactions for financial statement purposes are accounted for on a trade date basis. Realized gains and losses on investments sold are determined on the basis of identified cost.
C Income — Dividend income is recorded on the ex-dividend date for dividends received in cash and/or securities. Interest income is recorded on the basis of interest accrued, adjusted for amortization of premium or accretion of discount.
D Federal Taxes — The Portfolio has elected to be treated as a partnership for federal tax purposes. No provision is made by the Portfolio for federal or state taxes on any taxable income of the Portfolio because each investor in the Portfolio is ultimately responsible for the payment of any taxes on its share of taxable income. Since at least one of the Portfolio’s investors is a regulated investment company that invests all or substantially all of its assets in the Portfolio, the Portfolio normally must satisfy the applicable source of income and diversification requirements (under the Internal Revenue Code) in order for its investors to satisfy them. The Portfolio will allocate, at least annually among its investors, each investor’s distributive share of the Portfolio’s net investment income, net realized capital gains and any other items of income, gain, loss, deduction or credit.
As of October 31, 2012, the Portfolio had no uncertain tax positions that would require financial statement recognition, de-recognition, or disclosure. The Portfolio files a U.S. federal income tax return annually after its fiscal year-end, which is subject to examination by the Internal Revenue Service for a period of three years from the date of filing.
E Expense Reduction — State Street Bank and Trust Company (SSBT) serves as custodian of the Portfolio. Pursuant to the custodian agreement, SSBT receives a fee reduced by credits, which are determined based on the average daily cash balance the Portfolio maintains with SSBT. All credit balances, if any, used to reduce the Portfolio’s custodian fees are reported as a reduction of expenses in the Statement of Operations.
F Use of Estimates — The preparation of the financial statements in conformity with accounting principles generally accepted in the United States of America requires management to make estimates and assumptions that affect the reported amounts of assets and liabilities at the date of the financial statements and the reported amounts of income and expense during the reporting period. Actual results could differ from those estimates.
G Indemnifications — Under the Portfolio’s organizational documents, its officers and Trustees may be indemnified against certain liabilities and expenses arising out of the performance of their duties to the Portfolio. Under Massachusetts law, if certain conditions prevail, interestholders in the Portfolio could be deemed to have personal liability for the obligations of the Portfolio. However, the Portfolio’s Declaration of Trust contains an express disclaimer of liability on the part of Portfolio interestholders and the By-laws provide that the Portfolio shall assume the defense on behalf of any Portfolio interestholder. Moreover, the By-laws also provide for indemnification out of Portfolio property of any interestholder held personally liable solely by reason of being or having been an interestholder for all loss or expense arising from such liability. Additionally, in the normal course of business, the Portfolio enters into agreements with service providers that may contain indemnification clauses. The Portfolio’s maximum exposure under these arrangements is unknown as this would involve future claims that may be made against the Portfolio that have not yet occurred.
Tax-Managed Small-Cap Value Portfolio
October 31, 2012
Notes to Financial Statements — continued
2 Investment Adviser Fee and Other Transactions with Affiliates
The investment adviser fee is earned by Boston Management and Research (BMR), a subsidiary of Eaton Vance Management (EVM), as compensation for management and investment advisory services rendered to the Portfolio. The fee is computed at an annual rate of 1.00% of the Portfolio’s average daily net assets up to $500 million, and is payable monthly. On net assets of $500 million and over, the annual fee is reduced. Prior to March 19, 2012, BMR delegated the investment management of the Portfolio to Fox Asset Management LLC (Fox), an affiliate of EVM, and paid Fox a portion of its advisory fee for sub-advisory services provided to the Portfolio. Effective March 19, 2012, the portfolio managers of the Portfolio became dual employees of BMR and Fox and the sub-advisory agreement was terminated. For the year ended October 31, 2012, the Portfolio’s investment adviser fee amounted to $718,910 or 1.00% of the Portfolio’s average daily net assets.
Trustees and officers of the Portfolio who are members of EVM’s or BMR’s organizations receive remuneration for their services to the Portfolio out of the investment adviser fee. Trustees of the Portfolio who are not affiliated with the investment adviser may elect to defer receipt of all or a percentage of their annual fees in accordance with the terms of the Trustees Deferred Compensation Plan. For the year ended October 31, 2012, no significant amounts have been deferred. Certain officers and Trustees of the Portfolio are officers of the above organizations.
3 Purchases and Sales of Investments
Purchases and sales of investments, other than short-term obligations, aggregated $38,281,880 and $47,643,118, respectively, for the year ended October 31, 2012.
4 Federal Income Tax Basis of Investments
The cost and unrealized appreciation (depreciation) of investments of the Portfolio at October 31, 2012, as determined on a federal income tax basis, were as follows:
| | | | |
| |
Aggregate cost | | $ | 51,789,057 | |
| |
Gross unrealized appreciation | | $ | 18,609,755 | |
Gross unrealized depreciation | | | (290,613 | ) |
| |
Net unrealized appreciation | | $ | 18,319,142 | |
5 Line of Credit
The Portfolio participates with other portfolios and funds managed by EVM and its affiliates in a $600 million unsecured line of credit agreement with a group of banks. Borrowings are made by the Portfolio solely to facilitate the handling of unusual and/or unanticipated short-term cash requirements. Interest is charged to the Portfolio based on its borrowings at an amount above either the Eurodollar rate or Federal Funds rate. In addition, a fee computed at an annual rate of 0.08% on the daily unused portion of the line of credit is allocated among the participating portfolios and funds at the end of each quarter. Because the line of credit is not available exclusively to the Portfolio, it may be unable to borrow some or all of its requested amounts at any particular time. The Portfolio did not have any significant borrowings or allocated fees during the year ended October 31, 2012.
6 Fair Value Measurements
Under generally accepted accounting principles for fair value measurements, a three-tier hierarchy to prioritize the assumptions, referred to as inputs, is used in valuation techniques to measure fair value. The three-tier hierarchy of inputs is summarized in the three broad levels listed below.
| Ÿ | | Level 1 – quoted prices in active markets for identical investments |
| Ÿ | | Level 2 – other significant observable inputs (including quoted prices for similar investments, interest rates, prepayment speeds, credit risk, etc.) |
| Ÿ | | Level 3 – significant unobservable inputs (including a fund’s own assumptions in determining the fair value of investments) |
In cases where the inputs used to measure fair value fall in different levels of the fair value hierarchy, the level disclosed is determined based on the lowest level input that is significant to the fair value measurement in its entirety. The inputs or methodology used for valuing securities are not necessarily an indication of the risk associated with investing in those securities.
Tax-Managed Small-Cap Value Portfolio
October 31, 2012
Notes to Financial Statements — continued
At October 31, 2012, the hierarchy of inputs used in valuing the Portfolio’s investments, which are carried at value, were as follows:
| | | | | | | | | | | | | | | | |
| Asset Description | | Level 1 | | | Level 2 | | | Level 3 | | | Total | |
| | | | |
Common Stocks | | $ | 66,854,025 | * | | $ | — | | | $ | — | | | $ | 66,854,025 | |
| | | | |
Short-Term Investments | | | — | | | | 3,254,174 | | | | — | | | | 3,254,174 | |
| | | | |
Total Investments | | $ | 66,854,025 | | | $ | 3,254,174 | | | $ | — | | | $ | 70,108,199 | |
| * | The level classification by major category of investments is the same as the category presentation in the Portfolio of Investments. |
The Portfolio held no investments or other financial instruments as of October 31, 2011 whose fair value was determined using Level 3 inputs. At October 31, 2012, there were no investments transferred between Level 1 and Level 2 during the year then ended.
Tax-Managed Small-Cap Value Portfolio
October 31, 2012
Report of Independent Registered Public Accounting Firm
To the Trustees and Investors of Tax-Managed Small-Cap Value Portfolio:
We have audited the accompanying statement of assets and liabilities of Tax-Managed Small-Cap Value Portfolio (the “Portfolio”), including the portfolio of investments, as of October 31, 2012, and the related statement of operations for the year then ended, the statements of changes in net assets for each of the two years in the period then ended, and the supplementary data for each of the five years in the period then ended. These financial statements and supplementary data are the responsibility of the Portfolio’s management. Our responsibility is to express an opinion on these financial statements and supplementary data based on our audits.
We conducted our audits in accordance with the standards of the Public Company Accounting Oversight Board (United States). Those standards require that we plan and perform the audit to obtain reasonable assurance about whether the financial statements and supplementary data are free of material misstatement. The Portfolio is not required to have, nor were we engaged to perform, an audit of its internal control over financial reporting. Our audits included consideration of internal control over financial reporting as a basis for designing audit procedures that are appropriate in the circumstances, but not for the purpose of expressing an opinion on the effectiveness of the Portfolio’s internal control over financial reporting. Accordingly, we express no such opinion. An audit also includes examining, on a test basis, evidence supporting the amounts and disclosures in the financial statements, assessing the accounting principles used and significant estimates made by management, as well as evaluating the overall financial statement presentation. Our procedures included confirmation of securities owned as of October 31, 2012, by correspondence with the custodian and brokers. We believe that our audits provide a reasonable basis for our opinion.
In our opinion, such financial statements and supplementary data referred to above present fairly, in all material respects, the financial position of Tax-Managed Small-Cap Value Portfolio as of October 31, 2012, the results of its operations for the year then ended, the changes in its net assets for each of the two years in the period then ended, and the supplementary data for each of the five years in the period then ended, in conformity with accounting principles generally accepted in the United States of America.
DELOITTE & TOUCHE LLP
Boston, Massachusetts
December 17, 2012
Eaton Vance
Tax-Managed Small-Cap Value Fund
October 31, 2012
Management and Organization
Fund Management. The Trustees of Eaton Vance Mutual Funds Trust (the Trust) and Tax-Managed Small-Cap Value Portfolio (the Portfolio) are responsible for the overall management and supervision of the Trust’s and Portfolio’s affairs. The Trustees and officers of the Trust and the Portfolio are listed below. Except as indicated, each individual has held the office shown or other offices in the same company for the last five years. Trustees and officers of the Trust and the Portfolio hold indefinite terms of office. The “Noninterested Trustees” consist of those Trustees who are not “interested persons” of the Trust and the Portfolio, as that term is defined under the 1940 Act. The business address of each Trustee and officer is Two International Place, Boston, Massachusetts 02110. As used below, “EVC” refers to Eaton Vance Corp., “EV” refers to Eaton Vance, Inc., “EVM” refers to Eaton Vance Management, “BMR” refers to Boston Management and Research and “EVD” refers to Eaton Vance Distributors, Inc. EVC and EV are the corporate parent and trustee, respectively, of EVM and BMR. EVD is the Fund’s principal underwriter, the Portfolio’s placement agent and a wholly-owned subsidiary of EVC. Each officer affiliated with Eaton Vance may hold a position with other Eaton Vance affiliates that is comparable to his or her position with EVM listed below. Each Trustee oversees 187 portfolios in the Eaton Vance Complex (including all master and feeder funds in a master feeder structure). Each officer serves as an officer of certain other Eaton Vance funds. Each Trustee and officer serves until his or her successor is elected.
| | | | | | |
| Name and Year of Birth | | Position(s) with the Trust and the Portfolio | | Length of
Service | | Principal Occupation(s) and Directorships During Past Five Years and Other Relevant Experience |
Interested Trustee |
| | | |
Thomas E. Faust Jr. 1958 | | Trustee | | Since 2007 | | Chairman, Chief Executive Officer and President of EVC, Director and President of EV, Chief Executive Officer and President of EVM and BMR, and Director of EVD. Trustee and/or officer of 187 registered investment companies. Mr. Faust is an interested person because of his positions with EVM, BMR, EVD, EVC and EV, which are affiliates of the Trust and the Portfolio.
Directorships in the Last Five Years.(1) Director of EVC and Hexavest Inc. |
| | | |
| | | | | | |
Noninterested Trustees |
| | | |
Scott E. Eston 1956 | | Trustee | | Since 2011 | | Private investor. Formerly held various positions at Grantham, Mayo, Van Otterloo and Co., L.L.C. (investment management firm) (1997-2009), including Chief Operating Officer (2002-2009), Chief Financial Officer (1997-2009) and Chairman of the Executive Committee (2002-2008); President and Principal Executive Officer, GMO Trust (open-end registered investment company) (2006-2009). Former Partner, Coopers and Lybrand L.L.P. (now PricewaterhouseCoopers) (public accounting firm) (1987-1997).
Directorships in the Last Five Years. None. |
| | | |
Benjamin C. Esty 1963 | | Trustee | | Since 2005 | | Roy and Elizabeth Simmons Professor of Business Administration and Finance Unit Head, Harvard University Graduate School of Business Administration.
Directorships in the Last Five Years.(1) None. |
| | | |
Allen R. Freedman 1940 | | Trustee | | Since 2007 | | Private Investor. Former Chairman (2002-2004) and a Director (1983-2004) of Systems & Computer Technology Corp. (provider of software to higher education). Formerly, a Director of Loring Ward International (fund distributor) (2005-2007). Former Chairman and a Director of Indus International, Inc. (provider of enterprise management software to the power generating industry) (2005-2007). Former Chief Executive Officer of Assurant, Inc. (insurance provider) (1979-2000).
Directorships in the Last Five Years.(1) Director of Stonemor Partners, L.P. (owner and operator of cemeteries). Formerly, Director of Assurant, Inc. (insurance provider) (1979-2011). |
| | | |
William H. Park 1947 | | Trustee | | Since 2003 | | Consultant and private investor. Formerly, Chief Financial Officer, Aveon Group L.P. (investment management firm) (2010-2011). Formerly, Vice Chairman, Commercial Industrial Finance Corp. (specialty finance company) (2006-2010). Formerly, President and Chief Executive Officer, Prizm Capital Management, LLC (investment management firm) (2002-2005). Formerly, Executive Vice President and Chief Financial Officer, United Asset Management Corporation (investment management firm) (1982-2001). Formerly, Senior Manager, Price Waterhouse (now PricewaterhouseCoopers) (an independent registered public accounting firm) (1972-1981). Directorships in the Last Five Years.(1) None. |
Eaton Vance
Tax-Managed Small-Cap Value Fund
October 31, 2012
Management and Organization — continued
| | | | | | |
| Name and Year of Birth | | Position(s) with the Trust and the Portfolio | | Length of
Service | | Principal Occupation(s) and Directorships During Past Five Years and Other Relevant Experience |
Noninterested Trustees (continued) |
| | | |
| Ronald A. Pearlman 1940 | | Trustee | | Since 2003 | | Professor of Law, Georgetown University Law Center. Formerly, Deputy Assistant Secretary (Tax Policy) and Assistant Secretary (Tax Policy), U.S. Department of the Treasury (1983-1985). Formerly, Chief of Staff, Joint Committee on Taxation, U.S. Congress (1988-1990). Directorships in the Last Five Years.(1) None. |
| | | |
Helen Frame Peters 1948 | | Trustee | | Since 2008 | | Professor of Finance, Carroll School of Management, Boston College. Formerly, Dean, Carroll School of Management, Boston College (2000-2002). Formerly, Chief Investment Officer, Fixed Income, Scudder Kemper Investments (investment management firm) (1998-1999). Formerly, Chief Investment Officer, Equity and Fixed Income, Colonial Management Associates (investment management firm) (1991-1998). Directorships in the Last Five Years.(1) Formerly, Director of BJ’s Wholesale Club, Inc. (wholesale club retailer) (2004-2011). Formerly, Trustee of SPDR Index Shares Funds and SPDR Series Trust (exchange traded funds) (2000-2009). Formerly, Director of Federal Home Loan Bank of Boston (a bank for banks) (2007-2009). |
| | | |
Lynn A. Stout 1957 | | Trustee | | Of the Trust since 1998 and of the Portfolio since 2001 | | Distinguished Professor of Corporate and Business Law, Jack G. Clarke Business Law Institute, Cornell University Law School. Formerly, the Paul Hastings Professor of Corporate and Securities Law (2006-2012) and Professor of Law (2001-2006), University of California at Los Angeles School of Law.
Directorships in the Last Five Years.(1) None. |
| | | |
Harriett Tee Taggart 1948 | | Trustee | | Since 2011 | | Managing Director, Taggart Associates (a professional practice firm). Formerly, Partner and Senior Vice President, Wellington Management Company, LLP (investment management firm) (1983-2006). Directorships in the Last Five Years. Director of Albemarle Corporation (chemicals manufacturer) (since 2007) and The Hanover Group (specialty property and casualty insurance company) (since 2009). Formerly, Director of Lubrizol Corporation (specialty chemicals) (2007-2011). |
| | | |
Ralph F. Verni 1943 | | Chairman of the Board and Trustee | | Chairman of the Board since 2007 and Trustee since 2005 | | Consultant and private investor. Formerly, Chief Investment Officer (1982-1992), Chief Financial Officer (1988-1990) and Director (1982-1992), New England Life. Formerly, Chairperson, New England Mutual Funds (1982-1992). Formerly, President and Chief Executive Officer, State Street Management & Research (1992-2000). Formerly, Chairperson, State Street Research Mutual Funds (1992-2000). Formerly, Director, W.P. Carey, LLC (1998-2004) and First Pioneer Farm Credit Corp. (2002-2006). Directorships in the Last Five Years.(1) None. |
| | | |
| | | | | | |
Principal Officers who are not Trustees |
| Name and Year of Birth | | Position(s) with the Trust and the Portfolio | | Length of
Service | | Principal Occupation(s) During Past Five Years |
Duncan W. Richardson 1957 | | President | | Of the Trust since 2011 and of the Portfolio since 2002 | | Director of EVC and Executive Vice President and Chief Equity Investment Officer of EVC, EVM and BMR. |
| | | |
Payson F. Swaffield 1956 | | Vice President of the Trust | | Since 2011 | | Vice President and Chief Income Investment Officer of EVM and BMR. |
| | | |
Barbara E. Campbell 1957 | | Treasurer | | Of the Trust since 2005 and of the Portfolio since 2008 | | Vice President of EVM and BMR. |
Eaton Vance
Tax-Managed Small-Cap Value Fund
October 31, 2012
Management and Organization — continued
| | | | | | |
| Name and Year of Birth | | Position(s) with the Trust and the Portfolio | | Length of
Service | | Principal Occupation(s) During Past Five Years |
Principal Officers who are not Trustees (continued) |
| | | |
Maureen A. Gemma 1960 | | Vice President, Secretary and Chief Legal Officer | | Vice President since 2011, Secretary since 2007 and Chief Legal Officer since 2008 | | Vice President of EVM and BMR. |
| | | |
Paul M. O’Neil 1953 | | Chief Compliance Officer | | Since 2004 | | Vice President of EVM and BMR. |
| (1) | During their respective tenures, the Trustees (except Mr. Eston and Ms. Taggart) also served as trustees of one or more of the following Eaton Vance funds (which operated in the years noted): Eaton Vance Credit Opportunities Fund (launched in 2005 and terminated in 2010); Eaton Vance Insured Florida Plus Municipal Bond Fund (launched in 2002 and terminated in 2009); and Eaton Vance National Municipal Income Trust (launched in 1998 and terminated in 2009). |
The SAI for the Fund includes additional information about the Trustees and officers of the Fund and the Portfolio and can be obtained without charge on Eaton Vance’s website at www.eatonvance.com or by calling 1-800-262-1122.
Eaton Vance Funds
IMPORTANT NOTICES
Privacy. The Eaton Vance organization is committed to ensuring your financial privacy. Each of the financial institutions identified below has in effect the following policy (“Privacy Policy”) with respect to nonpublic personal information about its customers:
| Ÿ | | Only such information received from you, through application forms or otherwise, and information about your Eaton Vance fund transactions will be collected. This may include information such as name, address, social security number, tax status, account balances and transactions. |
| Ÿ | | None of such information about you (or former customers) will be disclosed to anyone, except as permitted by law (which includes disclosure to employees necessary to service your account). In the normal course of servicing a customer’s account, Eaton Vance may share information with unaffiliated third parties that perform various required services such as transfer agents, custodians and broker-dealers. |
| Ÿ | | Policies and procedures (including physical, electronic and procedural safeguards) are in place that are designed to protect the confidentiality of such information. |
| Ÿ | | We reserve the right to change our Privacy Policy at any time upon proper notification to you. Customers may want to review our Privacy Policy periodically for changes by accessing the link on our homepage: www.eatonvance.com. |
Our pledge of privacy applies to the following entities within the Eaton Vance organization: the Eaton Vance Family of Funds, Eaton Vance Management, Eaton Vance Investment Counsel, Eaton Vance Distributors, Inc., Eaton Vance Trust Company, Eaton Vance Management’s Real Estate Investment Group and Boston Management and Research. In addition, our Privacy Policy applies only to those Eaton Vance customers who are individuals and who have a direct relationship with us. If a customer’s account (i.e., fund shares) is held in the name of a third-party financial advisor/broker-dealer, it is likely that only such advisor’s privacy policies apply to the customer. This notice supersedes all previously issued privacy disclosures. For more information about Eaton Vance’s Privacy Policy, please call 1-800-262-1122.
Delivery of Shareholder Documents. The Securities and Exchange Commission (SEC) permits funds to deliver only one copy of shareholder documents, including prospectuses, proxy statements and shareholder reports, to fund investors with multiple accounts at the same residential or post office box address. This practice is often called “householding” and it helps eliminate duplicate mailings to shareholders. Eaton Vance, or your financial advisor, may household the mailing of your documents indefinitely unless you instruct Eaton Vance, or your financial advisor, otherwise. If you would prefer that your Eaton Vance documents not be householded, please contact Eaton Vance at 1-800-262-1122, or contact your financial advisor. Your instructions that householding not apply to delivery of your Eaton Vance documents will be effective within 30 days of receipt by Eaton Vance or your financial advisor.
Portfolio Holdings. Each Eaton Vance Fund and its underlying Portfolio(s) (if applicable) will file a schedule of portfolio holdings on Form N-Q with the SEC for the first and third quarters of each fiscal year. The Form N-Q will be available on the Eaton Vance website at www.eatonvance.com, by calling Eaton Vance at 1-800-262-1122 or in the EDGAR database on the SEC’s website at www.sec.gov. Form N-Q may also be reviewed and copied at the SEC’s public reference room in Washington, D.C. (call 1-800-732-0330 for information on the operation of the public reference room).
Proxy Voting. From time to time, funds are required to vote proxies related to the securities held by the funds. The Eaton Vance Funds or their underlying Portfolios (if applicable) vote proxies according to a set of policies and procedures approved by the Funds’ and Portfolios’ Boards. You may obtain a description of these policies and procedures and information on how the Funds or Portfolios voted proxies relating to portfolio securities during the most recent 12-month period ended June 30, without charge, upon request, by calling 1-800-262-1122 and by accessing the SEC’s website at www.sec.gov.
This Page Intentionally Left Blank
This Page Intentionally Left Blank
This Page Intentionally Left Blank
Investment Adviser of Tax-Managed Small-Cap Value Portfolio
Boston Management and Research
Two International Place
Boston, MA 02110
Administrator of Eaton Vance Tax-Managed Small-Cap Value Fund
Eaton Vance Management
Two International Place
Boston, MA 02110
Principal Underwriter*
Eaton Vance Distributors, Inc.
Two International Place
Boston, MA 02110
(617) 482-8260
Custodian
State Street Bank and Trust Company
200 Clarendon Street
Boston, MA 02116
Transfer Agent
BNY Mellon Investment Servicing (US) Inc.
Attn: Eaton Vance Funds
P.O. Box 9653
Providence, RI 02940-9653
(800) 262-1122
Independent Registered Public Accounting Firm
Deloitte & Touche LLP
200 Berkeley Street
Boston, MA 02116-5022
Fund Offices
Two International Place
Boston, MA 02110
| * | FINRA BrokerCheck. Investors may check the background of their Investment Professional by contacting the Financial Industry Regulatory Authority (FINRA). FINRA BrokerCheck is a free tool to help investors check the professional background of current and former FINRA-registered securities firms and brokers. FINRA BrokerCheck is available by calling 1-800-289-9999 and at www.FINRA.org. The FINRA BrokerCheck brochure describing this program is available to investors at www.FINRA.org. |
1300-12/12 TMSCVSRC
| | |
Eaton Vance Tax-Managed Value Fund Annual Report October 31, 2012 | | 
|

Fund shares are not insured by the FDIC and are not deposits or other obligations of, or guaranteed by, any depository institution. Shares are subject to investment risks, including possible loss of principal invested.
This report must be preceded or accompanied by a current summary prospectus or prospectus. Before investing, investors should consider carefully the investment objective, risks, and charges and expenses of a mutual fund. This and other important information is contained in the summary prospectus and prospectus, which can be obtained from a financial advisor. Prospective investors should read the prospectus carefully before investing. For further information, please call 1-800-262-1122.
Annual Report October 31, 2012
Eaton Vance
Tax-Managed Value Fund
| | | | |
| Table of Contents | | | | |
| |
Management’s Discussion of Fund Performance | | | 2 | |
| |
Performance | | | 3 | |
| |
Fund Profile | | | 4 | |
| |
Endnotes and Additional Disclosures | | | 5 | |
| |
Fund Expenses | | | 6 | |
| |
Financial Statements | | | 7 | |
| |
Report of Independent Registered Public Accounting Firm | | | 17 and 30 | |
| |
Federal Tax Information | | | 18 | |
| |
Management and Organization | | | 31 | |
| |
Important Notices | | | 34 | |
Eaton Vance
Tax-Managed Value Fund
October 31, 2012
Management’s Discussion of Fund Performance1
Economic and Market Conditions
As the period began, investors appeared to worry about intensifying debt problems in Europe, high U.S. unemployment and a Congressional deadlock that left businesses perplexed about the direction of tax and regulatory policy. The S&P 500 Index2 was relatively flat in November 2011.
Beginning in mid-December 2011, however, an equity rally took hold and continued into early April 2012, fueled by stronger economic growth in the fourth quarter, falling unemployment, the Long-Term Refinancing Operation announced by the European Central Bank, and what the markets perceived as a successful restructuring of Greek debt. Then in May 2012, the third annual mid-year economic slowdown arrived, instigated by renewed concerns in Europe, slowing growth in China and political uncertainty in the United States with the upcoming presidential election.
But despite a slowdown in consumer spending, weakening employment data and downward revisions of growth expectations, global equities moved upward intermittently from June through mid-October 2012. Several factors appeared to be driving a market rally that defied U.S. economic data. First, investors anticipated that worsening economic news would prompt the U.S. Federal Reserve to initiate another round of quantitative easing to stimulate the economy — which it did in mid-September 2012. Second, investors were hunting for yield in a historically low interest-rate environment, and many were driven to stocks that offered higher yields than bonds.
Finally, in an increasingly global marketplace, a case could be made that the U.S. market was relatively attractive versus many other world markets for much of the period. Europe’s ongoing debt crisis led investors to move money out of European stocks and bonds. With emerging markets in Asia largely leveraged to the Chinese economy, the slowdown in Chinese growth made markets throughout Asia appear less attractive. Amid this global economic turmoil, the U.S. market was one of the few places investors could find an economy that was growing (albeit slowly); a liquid, transparent and generally well-regulated market; and an opportunity to find companies with large cash reserves and solid profit growth.
In the final weeks of the period, however, U.S. stocks gave back some of their gains as the market seemed to have come full circle; amid uncertainty about the upcoming elections, investors once again worried about a Congressional deadlock on tax policy — an impasse that has left the economy rushing headlong toward a self-imposed fiscal cliff.
Fund Performance
For the fiscal year ended October 31, 2012, Eaton Vance Tax-Managed Value Fund (the Fund) had a total return of 15.14% for Class A shares at net asset value (NAV). By comparison, the Fund’s benchmark, the Russell 1000 Value Index (the Index), returned 16.89% for the period. The Fund underperformed the benchmark primarily due to sector and industry allocation. Stock selection overall contributed to the Fund’s relative performance versus the Index, partially offsetting the loss generated from allocation decisions. Despite trailing the Index, the Fund achieved positive absolute returns in all 10 economic sectors in which it was invested. The Index recorded positive absolute returns in nine of those 10 sectors.
On a sector basis, the biggest detractor from relative Fund performance versus the Index was financials. Stock selection in the consumer finance industry was a notable drag on results versus the Index, along with stock selection and an underweight in diversified financial services. In consumer finance, the Fund’s lack of exposure to a major credit card company hurt results versus the Index, as the stock outperformed. In the energy sector, stock selection hurt the Fund’s relative results versus the Index. Among individual energy stocks, a major coal producer held in the Fund was a poor performer after coal prices fell due to price competition from plentiful natural gas supplies. The materials sector was also a drag on the Fund’s relative performance versus the Index. In particular, an overweight in the underperforming metals and mining industry detracted from Fund performance versus the Index, although stock selection partially offset the negative impact.
In terms of contributors to performance versus the Index, stock selection made information technology (IT) the Fund’s top-performing sector relative to the Index. The Fund benefited from management’s early recognition of the trend toward mobile communications and tablet computers, as this segment continued its rapid growth during the 12-month period. A major supplier of smart phones and tablet computers was one of the Fund’s holdings contributing the most to performance. In addition, the Fund’s avoidance of the communications equipment and semiconductors & semiconductor equipment industries, both underperformers, contributed to Fund performance versus the Index in the IT sector. The health care sector also boosted the Fund’s relative results versus the Index, particularly the Fund’s overweight in the biotechnology industry, which outperformed during the period. Two leading biopharmaceutical companies were among the contributors to Fund performance. In the utilities sector, stock selection contributed to the Fund’s relative performance versus the Index.
|
See Endnotes and Additional Disclosures in this report. Past performance is no guarantee of future results. Returns are historical and are calculated by determining the percentage change in net asset value (NAV) or offering price (as applicable) with all distributions reinvested. Investment return and principal value will fluctuate so that shares, when redeemed, may be worth more or less than their original cost. Performance less than one year is cumulative. Performance is for the stated time period only; due to market volatility, the Fund’s current performance may be lower or higher than quoted. Returns are before taxes unless otherwise noted. For performance as of the most recent month end, please refer to www.eatonvance.com. |
Eaton Vance
Tax-Managed Value Fund
October 31, 2012
Performance2,3
Portfolio Managers Michael R. Mach, CFA, Matthew F. Beaudry, CMFC, CIMA, John D. Crowley and Stephen J. Kaszynski, CFA
| | | | | | | | | | | | | | | | | | | | |
| % Average Annual Total Returns | | Inception Date | | | One Year | | | Five Years | | | Ten Years | | | Since Inception | |
Class A at NAV | | | 12/27/1999 | | | | 15.14 | % | | | –2.10 | % | | | 6.53 | % | | | — | |
Class A with 5.75% Maximum Sales Charge | | | — | | | | 8.54 | | | | –3.26 | | | | 5.89 | | | | — | |
Class C at NAV | | | 01/24/2000 | | | | 14.23 | | | | –2.85 | | | | 5.72 | | | | — | |
Class C with 1% Maximum Sales Charge | | | — | | | | 13.23 | | | | –2.85 | | | | 5.72 | | | | — | |
Class I at NAV | | | 11/30/2007 | | | | 15.41 | | | | — | | | | — | | | | –1.16 | % |
Russell 1000 Value Index | | | — | | | | 16.89 | % | | | –1.00 | % | | | 7.34 | % | | | — | |
| | | | | |
| % After-Tax Returns with Maximum Sales Charge | | Inception Date | | | One Year | | | Five Years | | | Ten Years | | | Since
Inception | |
Class A After Taxes on Distributions | | | 12/27/1999 | | | | 8.29 | % | | | –3.42 | % | | | 5.75 | % | | | — | |
Class A After Taxes on Distributions and Sale of Fund Shares | | | — | | | | 5.81 | | | | –2.76 | | | | 5.15 | | | | — | |
Class C After Taxes on Distributions | | | 01/24/2000 | | | | 13.11 | | | | –2.90 | | | | 5.68 | | | | — | |
Class C After Taxes on Distributions and Sale of Fund Shares | | | — | | | | 8.73 | | | | –2.41 | | | | 5.01 | | | | — | |
Class I After Taxes on Distributions | | | 11/30/2007 | | | | 15.10 | | | | — | | | | — | | | | –1.37 | % |
Class I After Taxes on Distributions and Sale of Fund Shares | | | — | | | | 10.35 | | | | — | | | | — | | | | –1.01 | |
| | | | | |
| % Total Annual Operating Expense Ratios4 | | | | | | | | Class A | | | Class C | | | Class I | |
| | | | | | | | | | | 1.17 | % | | | 1.92 | % | | | 0.92 | % |
Performance of $10,000
This graph shows the change in value of a hypothetical investment of $10,000 in Class A of the Fund for the period indicated. For comparison, the same investment is shown in the indicated index.
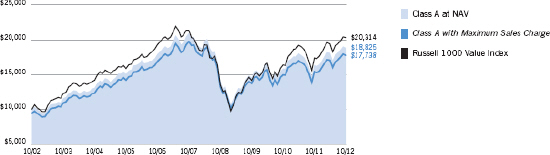
| | | | | | | | |
| Performance of Investment | | Amount Invested | | Period Beginning | | At NAV | | With Maximum Sales Charge |
Class C | | $10,000 | | 10/31/2002 | | $17,451 | | N.A. |
Class I | | $250,000 | | 11/30/2007 | | $236,000 | | N.A. |
See Endnotes and Additional Disclosures in this report.
Past performance is no guarantee of future results. Returns are historical and are calculated by determining the percentage change in net asset value (NAV) or offering price (as applicable) with all distributions reinvested. Investment return and principal value will fluctuate so that shares, when redeemed, may be worth more or less than their original cost. Performance less than one year is cumulative. Performance is for the stated time period only; due to market volatility, the Fund’s current performance may be lower or higher than quoted. Returns are before taxes unless otherwise noted. For performance as of the most recent month end, please refer to www.eatonvance.com.
Eaton Vance
Tax-Managed Value Fund
October 31, 2012
Fund Profile5
Sector Allocation (% of net assets)6
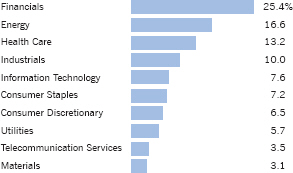
Top 10 Holdings (% of net assets)6
| | | | |
JPMorgan Chase & Co. | | | 3.0 | % |
Exxon Mobil Corp. | | | 3.0 | |
General Electric Co. | | | 3.0 | |
Wells Fargo & Co. | | | 3.0 | |
Merck & Co., Inc. | | | 3.0 | |
Pfizer, Inc. | | | 2.9 | |
Chevron Corp. | | | 2.9 | |
Apple, Inc. | | | 2.7 | |
Walt Disney Co. (The) | | | 2.4 | |
CVS Caremark Corp. | | | 2.4 | |
| | | | | |
Total | | | 28.3 | % |
| | | | | |
See Endnotes and Additional Disclosures in this report.
Eaton Vance
Tax-Managed Value Fund
October 31, 2012
Endnotes and Additional Disclosures
| 1 | The views expressed in this report are those of the portfolio manager(s) and are current only through the date stated at the top of this page. These views are subject to change at any time based upon market or other conditions, and Eaton Vance and the Fund(s) disclaim any responsibility to update such views. These views may not be relied upon as investment advice and, because investment decisions are based on many factors, may not be relied upon as an indication of trading intent on behalf of any Eaton Vance fund. This commentary may contain statements that are not historical facts, referred to as “forward looking statements”. The Fund’s actual future results may differ significantly from those stated in any forward looking statement, depending on factors such as changes in securities or financial markets or general economic conditions, the volume of sales and purchases of Fund shares, the continuation of investment advisory, administrative and service contracts, and other risks discussed from time to time in the Fund’s filings with the Securities and Exchange Commission. |
| 2 | S&P 500 Index is an unmanaged index of large-cap stocks commonly used as a measure of U.S. stock market performance. Russell 1000 Value Index is an unmanaged index of U.S. large-cap value stocks. Unless otherwise stated, index returns do not reflect the effect of any applicable sales charges, commissions, expenses, taxes or leverage, as applicable. It is not possible to invest directly in an index. |
| 3 | Total Returns at NAV do not include applicable sales charges. If sales charges were deducted, the returns would be lower. Total Returns shown with maximum sales charge reflect the stated maximum sales charge. Unless otherwise stated, performance does not reflect the deduction of taxes on Fund distributions or redemptions of Fund shares. After-tax returns are calculated using certain assumptions, including using the highest historical individual federal income tax rates and do not reflect the impact of state/local taxes. Actual after-tax returns depend on a shareholder’s tax situation and the actual characterization of distributions and may differ from those shown. After-tax returns are not relevant to shareholders who hold shares in tax-deferred accounts or shares held by nontaxable entities. Return After Taxes on Distributions may be the same as Return Before Taxes for the same period because no taxable distributions were made during that period. Return After Taxes on Distributions and Sale of Fund Shares may be greater than or equal to Return After Taxes on Distributions for the same period because of losses realized on the sale of Fund shares. The Fund’s after-tax returns also may reflect foreign tax credits passed by the Fund to its shareholders. |
| 4 | Source: Fund prospectus. |
| 5 | Fund invests in an affiliated investment company (Portfolio) with the same objective(s) and policies as the Fund. References to investments are to the Portfolio’s holdings. |
| 6 | Excludes cash and cash equivalents. |
| | Fund profile subject to change due to active management. |
Important Notice to Shareholders
Tax code provisions applicable to tax-favored dividends are effective for distributions paid on or before December 31, 2012. Thereafter, dividends will be taxable as ordinary income unless further legislative action is taken.
Eaton Vance
Tax-Managed Value Fund
October 31, 2012
Fund Expenses
Example: As a Fund shareholder, you incur two types of costs: (1) transaction costs, including sales charges (loads) on purchases and redemption fees (if applicable); and (2) ongoing costs, including management fees; distribution and/or service fees; and other Fund expenses. This Example is intended to help you understand your ongoing costs (in dollars) of Fund investing and to compare these costs with the ongoing costs of investing in other mutual funds. The Example is based on an investment of $1,000 invested at the beginning of the period and held for the entire period (May 1, 2012 – October 31, 2012).
Actual Expenses: The first section of the table below provides information about actual account values and actual expenses. You may use the information in this section, together with the amount you invested, to estimate the expenses that you paid over the period. Simply divide your account value by $1,000 (for example, an $8,600 account value divided by $1,000 = 8.6), then multiply the result by the number in the first section under the heading entitled “Expenses Paid During Period” to estimate the expenses you paid on your account during this period.
Hypothetical Example for Comparison Purposes: The second section of the table below provides information about hypothetical account values and hypothetical expenses based on the actual Fund expense ratio and an assumed rate of return of 5% per year (before expenses), which is not the actual Fund return. The hypothetical account values and expenses may not be used to estimate the actual ending account balance or expenses you paid for the period. You may use this information to compare the ongoing costs of investing in your Fund and other funds. To do so, compare this 5% hypothetical example with the 5% hypothetical examples that appear in the shareholder reports of the other funds.
Please note that the expenses shown in the table are meant to highlight your ongoing costs only and do not reflect any transactional costs, such as sales charges (loads) or redemption fees (if applicable). Therefore, the second section of the table is useful in comparing ongoing costs only, and will not help you determine the relative total costs of owning different funds. In addition, if these transactional costs were included, your costs would be higher.
| | | | | | | | | | | | | | | | |
| | | Beginning
Account Value
(5/1/12) | | | Ending
Account Value (10/31/12) | | | Expenses Paid
During Period*
(5/1/12 – 10/31/12) | | | Annualized
Expense
Ratio | |
| | | | |
| | | | | | | | | | | | | | | | |
Actual | |
Class A | | $ | 1,000.00 | | | $ | 1,040.00 | | | $ | 6.15 | | | | 1.20 | % |
Class C | | $ | 1,000.00 | | | $ | 1,035.40 | | | $ | 9.93 | | | | 1.94 | % |
Class I | | $ | 1,000.00 | | | $ | 1,041.20 | | | $ | 4.93 | | | | 0.96 | % |
| | | | | | | | | | | | | | | | | |
| | | | |
| | | | | | | | | | | | | | | | |
Hypothetical | | | | | | | | | | | | | | | | |
(5% return per year before expenses) | | | | | | | | | | | | | | | | |
Class A | | $ | 1,000.00 | | | $ | 1,019.10 | | | $ | 6.09 | | | | 1.20 | % |
Class C | | $ | 1,000.00 | | | $ | 1,015.40 | | | $ | 9.83 | | | | 1.94 | % |
Class I | | $ | 1,000.00 | | | $ | 1,020.30 | | | $ | 4.88 | | | | 0.96 | % |
| * | Expenses are equal to the Fund’s annualized expense ratio for the indicated Class, multiplied by the average account value over the period, multiplied by 184/366 (to reflect the one-half year period). The Example assumes that the $1,000 was invested at the net asset value per share determined at the close of business on April 30, 2012. The Example reflects the expenses of both the Fund and the Portfolio. |
Eaton Vance
Tax-Managed Value Fund
October 31, 2012
Statement of Assets and Liabilities
| | | | |
| Assets | | October 31, 2012 | |
Investment in Tax-Managed Value Portfolio, at value (identified cost, $475,999,294) | | $ | 752,485,155 | |
Receivable for Fund shares sold | | | 596,200 | |
Total assets | | $ | 753,081,355 | |
|
| Liabilities | |
Payable for Fund shares redeemed | | $ | 10,619,508 | |
Payable to affiliates: | | | | |
Distribution and service fees | | | 204,059 | |
Administration fee | | | 98,232 | |
Trustees’ fees | | | 42 | |
Accrued expenses | | | 212,851 | |
Total liabilities | | $ | 11,134,692 | |
Net Assets | | $ | 741,946,663 | |
|
| Sources of Net Assets | |
Paid-in capital | | $ | 457,594,042 | |
Accumulated net realized loss from Portfolio | | | (3,107,432 | ) |
Accumulated undistributed net investment income | | | 10,974,192 | |
Net unrealized appreciation from Portfolio | | | 276,485,861 | |
Total | | $ | 741,946,663 | |
|
| Class A Shares | |
Net Assets | | $ | 394,414,140 | |
Shares Outstanding | | | 21,371,459 | |
Net Asset Value and Redemption Price Per Share | | | | |
(net assets ÷ shares of beneficial interest outstanding) | | $ | 18.46 | |
Maximum Offering Price Per Share | | | | |
(100 ÷ 94.25 of net asset value per share) | | $ | 19.59 | |
|
| Class C Shares | |
Net Assets | | $ | 133,613,674 | |
Shares Outstanding | | | 7,492,105 | |
Net Asset Value and Offering Price Per Share** | | | | |
(net assets ÷ shares of beneficial interest outstanding) | | $ | 17.83 | |
|
| Class I Shares | |
Net Assets | | $ | 213,918,849 | |
Shares Outstanding | | | 11,594,120 | |
Net Asset Value, Offering Price and Redemption Price Per Share | | | | |
(net assets ÷ shares of beneficial interest outstanding) | | $ | 18.45 | |
On sales of $50,000 or more, the offering price of Class A shares is reduced.
| ** | Redemption price per share is equal to the net asset value less any applicable contingent deferred sales charge. |
| | | | |
| | 7 | | See Notes to Financial Statements. |
Eaton Vance
Tax-Managed Value Fund
October 31, 2012
Statement of Operations
| | | | |
| Investment Income | | Year Ended
October 31, 2012 | |
Dividends allocated from Portfolio (net of foreign taxes, $100,886) | | $ | 29,511,963 | |
Interest allocated from Portfolio | | | 18,279 | |
Securities lending income allocated from Portfolio, net | | | 57,287 | |
Expenses allocated from Portfolio | | | (7,484,151 | ) |
Total investment income from Portfolio | | $ | 22,103,378 | |
| |
| Expenses | | | | |
Administration fee | | $ | 1,678,178 | |
Distribution and service fees | | | | |
Class A | | | 1,430,611 | |
Class C | | | 1,363,104 | |
Trustees’ fees and expenses | | | 500 | |
Custodian fee | | | 37,435 | |
Transfer and dividend disbursing agent fees | | | 1,141,545 | |
Legal and accounting services | | | 34,337 | |
Printing and postage | | | 182,193 | |
Registration fees | | | 61,411 | |
Miscellaneous | | | 27,450 | |
Total expenses | | $ | 5,956,764 | |
| |
Net investment income | | $ | 16,146,614 | |
| |
| Realized and Unrealized Gain (Loss) from Portfolio | | | | |
Net realized gain (loss) — | | | | |
Investment transactions | | $ | 239,765,541 | (1) |
Foreign currency transactions | | | 57,471 | |
Net realized gain | | $ | 239,823,012 | |
Change in unrealized appreciation (depreciation) — | | | | |
Investments | | $ | (115,060,325 | ) |
Foreign currency | | | (129,456 | ) |
Net change in unrealized appreciation (depreciation) | | $ | (115,189,781 | ) |
| |
Net realized and unrealized gain | | $ | 124,633,231 | |
| |
Net increase in net assets from operations | | $ | 140,779,845 | |
| (1) | Includes $2,657,361 of net realized gains from redemptions in-kind. |
| | | | |
| | 8 | | See Notes to Financial Statements. |
Eaton Vance
Tax-Managed Value Fund
October 31, 2012
Statements of Changes in Net Assets
| | | | | | | | |
| | | Year Ended October 31, | |
| Increase (Decrease) in Net Assets | | 2012 | | | 2011 | |
From operations — | | | | | | | | |
Net investment income | | $ | 16,146,614 | | | $ | 20,988,471 | |
Net realized gain from investment and foreign currency transactions | | | 239,823,012 | (1) | | | 81,720,561 | |
Net change in unrealized appreciation (depreciation) from investments and foreign currency | | | (115,189,781 | ) | | | (48,215,718 | ) |
Net increase in net assets from operations | | $ | 140,779,845 | | | $ | 54,493,314 | |
Distributions to shareholders — | | | | | | | | |
From net investment income | | | | | | | | |
Class A | | $ | (10,019,454 | ) | | $ | (6,337,673 | ) |
Class B | | | — | | | | (167,178 | ) |
Class C | | | (951,362 | ) | | | (8,609 | ) |
Class I | | | (9,040,914 | ) | | | (9,155,770 | ) |
Total distributions to shareholders | | $ | (20,011,730 | ) | | $ | (15,669,230 | ) |
Transactions in shares of beneficial interest — | | | | | | | | |
Proceeds from sale of shares | | | | | | | | |
Class A | | $ | 64,479,822 | | | $ | 210,694,267 | |
Class B | | | — | | | | 378,795 | |
Class C | | | 2,745,894 | | | | 4,046,679 | |
Class I | | | 100,271,603 | | | | 272,228,474 | |
Net asset value of shares issued to shareholders in payment of distributions declared | | | | | | | | |
Class A | | | 7,390,668 | | | | 4,488,669 | |
Class B | | | — | | | | 129,973 | |
Class C | | | 730,848 | | | | 6,307 | |
Class I | | | 8,541,655 | | | | 7,488,904 | |
Cost of shares redeemed | | | | | | | | |
Class A | | | (448,012,976 | ) | | | (346,334,306 | ) |
Class B | | | — | | | | (4,046,008 | ) |
Class C | | | (26,663,286 | ) | | | (41,152,994 | ) |
Class I | | | (421,813,193 | ) | | | (640,774,950 | ) |
Net asset value of shares exchanged | | | | | | | | |
Class A | | | — | | | | 7,933,250 | |
Class B | | | — | | | | (7,933,250 | ) |
Net asset value of shares merged* | | | | | | | | |
Class A | | | — | | | | 20,114,247 | |
Class B | | | — | | | | (20,114,247 | ) |
Contingent deferred sales charges | | | | | | | | |
Class B | | | — | | | | 20,482 | |
Net decrease in net assets from Fund share transactions | | $ | (712,328,965 | ) | | $ | (532,825,708 | ) |
| | |
Net decrease in net assets | | $ | (591,560,850 | ) | | $ | (494,001,624 | ) |
|
| Net Assets | |
At beginning of year | | $ | 1,333,507,513 | | | $ | 1,827,509,137 | |
At end of year | | $ | 741,946,663 | | | $ | 1,333,507,513 | |
|
Accumulated undistributed net investment income included in net assets | |
At end of year | | $ | 10,974,192 | | | $ | 15,108,118 | |
| (1) | Includes $2,657,361 of net realized gains from redemptions in-kind. |
| * | At the close of business on June 24, 2011, Class B shares of the Fund merged into Class A shares. |
| | | | |
| | 9 | | See Notes to Financial Statements. |
Eaton Vance
Tax-Managed Value Fund
October 31, 2012
Financial Highlights
| | | | | | | | | | | | | | | | | | | | |
| | | Class A | |
| | | Year Ended October 31, | |
| | | 2012 | | | 2011 | | | 2010 | | | 2009 | | | 2008 | |
Net asset value — Beginning of year | | $ | 16.280 | | | $ | 15.910 | | | $ | 14.760 | | | $ | 14.400 | | | $ | 21.750 | |
| | | | | |
| Income (Loss) From Operations | | | | | | | | | | | | | | | | | | | | |
Net investment income(1) | | $ | 0.246 | | | $ | 0.193 | | | $ | 0.137 | | | $ | 0.192 | | | $ | 0.229 | |
Net realized and unrealized gain (loss) | | | 2.179 | | | | 0.306 | | | | 1.190 | | | | 0.356 | | | | (7.386 | ) |
| | | | | |
Total income (loss) from operations | | $ | 2.425 | | | $ | 0.499 | | | $ | 1.327 | | | $ | 0.548 | | | $ | (7.157 | ) |
| | | | | |
| Less Distributions | | | | | | | | | | | | | | | | | | | | |
From net investment income | | $ | (0.245 | ) | | $ | (0.129 | ) | | $ | (0.177 | ) | | $ | (0.188 | ) | | $ | (0.193 | ) |
| | | | | |
Total distributions | | $ | (0.245 | ) | | $ | (0.129 | ) | | $ | (0.177 | ) | | $ | (0.188 | ) | | $ | (0.193 | ) |
| | | | | |
Net asset value — End of year | | $ | 18.460 | | | $ | 16.280 | | | $ | 15.910 | | | $ | 14.760 | | | $ | 14.400 | |
| | | | | |
Total Return(2) | | | 15.14 | % | | | 3.11 | % | | | 9.00 | % | | | 4.01 | % | | | (33.19 | )% |
| | | | | |
| Ratios/Supplemental Data | | | | | | | | | | | | | | | | | | | | |
Net assets, end of year (000’s omitted) | | $ | 394,414 | | | $ | 702,929 | | | $ | 785,050 | | | $ | 745,816 | | | $ | 710,258 | |
Ratios (as a percentage of average daily net assets): | | | | | | | | | | | | | | | | | | | | |
Expenses(3)(4) | | | 1.20 | % | | | 1.17 | % | | | 1.16 | % | | | 1.19 | % | | | 1.16 | % |
Net investment income | | | 1.43 | % | | | 1.16 | % | | | 0.88 | % | | | 1.46 | % | | | 1.20 | % |
Portfolio Turnover of the Portfolio | | | 38 | % | | | 40 | % | | | 35 | % | | | 82 | % | | | 84 | % |
| (1) | Computed using average shares outstanding. |
| (2) | Returns are historical and are calculated by determining the percentage change in net asset value with all distributions reinvested and do not reflect the effect of sales charges. |
| (3) | Includes the Fund’s share of the Portfolio’s allocated expenses. |
| (4) | Excludes the effect of custody fee credits, if any, of less than 0.005%. |
| | | | |
| | 10 | | See Notes to Financial Statements. |
Eaton Vance
Tax-Managed Value Fund
October 31, 2012
Financial Highlights — continued
| | | | | | | | | | | | | | | | | | | | |
| | | Class C | |
| | | Year Ended October 31, | |
| | | 2012 | | | 2011 | | | 2010 | | | 2009 | | | 2008 | |
Net asset value — Beginning of year | | $ | 15.720 | | | $ | 15.370 | | | $ | 14.260 | | | $ | 13.870 | | | $ | 20.960 | |
| | | | | |
| Income (Loss) From Operations | | | | | | | | | | | | | | | | | | | | |
Net investment income(1) | | $ | 0.109 | | | $ | 0.067 | | | $ | 0.020 | | | $ | 0.099 | | | $ | 0.087 | |
Net realized and unrealized gain (loss) | | | 2.112 | | | | 0.284 | | | | 1.158 | | | | 0.337 | | | | (7.143 | ) |
| | | | | |
Total income (loss) from operations | | $ | 2.221 | | | $ | 0.351 | | | $ | 1.178 | | | $ | 0.436 | | | $ | (7.056 | ) |
| | | | | |
| Less Distributions | | | | | | | | | | | | | | | | | | | | |
From net investment income | | $ | (0.111 | ) | | $ | (0.001 | ) | | $ | (0.068 | ) | | $ | (0.046 | ) | | $ | (0.034 | ) |
| | | | | |
Total distributions | | $ | (0.111 | ) | | $ | (0.001 | ) | | $ | (0.068 | ) | | $ | (0.046 | ) | | $ | (0.034 | ) |
| | | | | |
Net asset value — End of year | | $ | 17.830 | | | $ | 15.720 | | | $ | 15.370 | | | $ | 14.260 | | | $ | 13.870 | |
| | | | | |
Total Return(2) | | | 14.23 | % | | | 2.28 | % | | | 8.27 | % | | | 3.19 | % | | | (33.72 | )% |
| | | | | |
| Ratios/Supplemental Data | | | | | | | | | | | | | | | | | | | | |
Net assets, end of year (000’s omitted) | | $ | 133,614 | | | $ | 139,686 | | | $ | 171,693 | | | $ | 186,734 | | | $ | 218,320 | |
Ratios (as a percentage of average daily net assets): | | | | | | | | | | | | | | | | | | | | |
Expenses(3)(4) | | | 1.95 | % | | | 1.92 | % | | | 1.91 | % | | | 1.94 | % | | | 1.91 | % |
Net investment income | | | 0.65 | % | | | 0.41 | % | | | 0.13 | % | | | 0.78 | % | | | 0.47 | % |
Portfolio Turnover of the Portfolio | | | 38 | % | | | 40 | % | | | 35 | % | | | 82 | % | | | 84 | % |
| (1) | Computed using average shares outstanding. |
| (2) | Returns are historical and are calculated by determining the percentage change in net asset value with all distributions reinvested and do not reflect the effect of sales charges. |
| (3) | Includes the Fund’s share of the Portfolio’s allocated expenses. |
| (4) | Excludes the effect of custody fee credits, if any, of less than 0.005%. |
| | | | |
| | 11 | | See Notes to Financial Statements. |
Eaton Vance
Tax-Managed Value Fund
October 31, 2012
Financial Highlights — continued
| | | | | | | | | | | | | | | | | | | | |
| | | Class I | |
| | | Year Ended October 31, | | | Period Ended October 31, 2008(1) | |
| | | 2012 | | | 2011 | | | 2010 | | | 2009 | | |
Net asset value — Beginning of period | | $ | 16.280 | | | $ | 15.910 | | | $ | 14.750 | | | $ | 14.410 | | | $ | 20.970 | |
| | | | | |
| Income (Loss) From Operations | | | | | | | | | | | | | | | | | | | | |
Net investment income(2) | | $ | 0.295 | | | $ | 0.234 | | | $ | 0.173 | | | $ | 0.205 | | | $ | 0.224 | |
Net realized and unrealized gain (loss) | | | 2.167 | | | | 0.305 | | | | 1.198 | | | | 0.366 | | | | (6.551 | ) |
| | | | | |
Total income (loss) from operations | | $ | 2.462 | | | $ | 0.539 | | | $ | 1.371 | | | $ | 0.571 | | | $ | (6.327 | ) |
| | | | | |
| Less Distributions | | | | | | | | | | | | | | | | | | | | |
From net investment income | | $ | (0.292 | ) | | $ | (0.169 | ) | | $ | (0.211 | ) | | $ | (0.231 | ) | | $ | (0.233 | ) |
| | | | | |
Total distributions | | $ | (0.292 | ) | | $ | (0.169 | ) | | $ | (0.211 | ) | | $ | (0.231 | ) | | $ | (0.233 | ) |
| | | | | |
Net asset value — End of period | | $ | 18.450 | | | $ | 16.280 | | | $ | 15.910 | | | $ | 14.750 | | | $ | 14.410 | |
| | | | | |
Total Return(3) | | | 15.41 | % | | | 3.36 | % | | | 9.31 | % | | | 4.22 | % | | | (30.53 | )%(4) |
| | | | | |
| Ratios/Supplemental Data | | | | | | | | | | | | | | | | | | | | |
Net assets, end of period (000’s omitted) | | $ | 213,919 | | | $ | 490,893 | | | $ | 840,923 | | | $ | 538,097 | | | $ | 174,464 | |
Ratios (as a percentage of average daily net assets): | | | | | | | | | | | | | | | | | | | | |
Expenses(5)(6) | | | 0.96 | % | | | 0.92 | % | | | 0.91 | % | | | 0.94 | % | | | 0.91 | %(7) |
Net investment income | | | 1.73 | % | | | 1.39 | % | | | 1.11 | % | | | 1.53 | % | | | 1.36 | %(7) |
Portfolio Turnover of the Portfolio | | | 38 | % | | | 40 | % | | | 35 | % | | | 82 | % | | | 84 | %(8) |
| (1) | For the period from the start of business, November 30, 2007, to October 31, 2008. |
| (2) | Computed using average shares outstanding. |
| (3) | Returns are historical and are calculated by determining the percentage change in net asset value with all distributions reinvested. |
| (5) | Includes the Fund’s share of the Portfolio’s allocated expenses. |
| (6) | Excludes the effect of custody fee credits, if any, of less than 0.005%. |
| (8) | For the Portfolio’s fiscal year ended October 31, 2008. |
| | | | |
| | 12 | | See Notes to Financial Statements. |
Eaton Vance
Tax-Managed Value Fund
October 31, 2012
Notes to Financial Statements
1 Significant Accounting Policies
Eaton Vance Tax-Managed Value Fund (the Fund) is a diversified series of Eaton Vance Mutual Funds Trust (the Trust). The Trust is a Massachusetts business trust registered under the Investment Company Act of 1940, as amended (the 1940 Act), as an open-end management investment company. The Fund offers three classes of shares. Class A shares are generally sold subject to a sales charge imposed at time of purchase. Class C shares are sold at net asset value and are generally subject to a contingent deferred sales charge (see Note 5). Class I shares are sold at net asset value and are not subject to a sales charge. Each class represents a pro-rata interest in the Fund, but votes separately on class-specific matters and (as noted below) is subject to different expenses. Realized and unrealized gains and losses and net investment income and losses, other than class-specific expenses, are allocated daily to each class of shares based on the relative net assets of each class to the total net assets of the Fund. Each class of shares differs in its distribution plan and certain other class-specific expenses. The Fund invests all of its investable assets in interests in Tax-Managed Value Portfolio (the Portfolio), a Massachusetts business trust, having the same investment objective and policies as the Fund. The value of the Fund’s investment in the Portfolio reflects the Fund’s proportionate interest in the net assets of the Portfolio (88.0% at October 31, 2012). The performance of the Fund is directly affected by the performance of the Portfolio. The financial statements of the Portfolio, including the portfolio of investments, are included elsewhere in this report and should be read in conjunction with the Fund’s financial statements.
The following is a summary of significant accounting policies of the Fund. The policies are in conformity with accounting principles generally accepted in the United States of America.
A Investment Valuation — Valuation of securities by the Portfolio is discussed in Note 1A of the Portfolio’s Notes to Financial Statements, which are included elsewhere in this report.
B Income — The Fund’s net investment income or loss consists of the Fund’s pro-rata share of the net investment income or loss of the Portfolio, less all actual and accrued expenses of the Fund.
C Federal Taxes — The Fund’s policy is to comply with the provisions of the Internal Revenue Code applicable to regulated investment companies and to distribute to shareholders each year substantially all of its net investment income, and all or substantially all of its net realized capital gains. Accordingly, no provision for federal income or excise tax is necessary.
At October 31, 2012, the Fund, for federal income tax purposes, had a capital loss carryforward of $135,193 which will reduce its taxable income arising from future net realized gains on investment transactions, if any, to the extent permitted by the Internal Revenue Code, and thus will reduce the amount of distributions to shareholders, which would otherwise be necessary to relieve the Fund of any liability for federal income or excise tax. The capital loss carryforward will expire on October 31, 2017. In addition, such capital loss carryforward cannot be utilized prior to the utilization of new capital losses, if any, created after October 31, 2012.
During the year ended October 31, 2012, a capital loss carryforward of $236,724,004 was utilized to offset net realized gains by the Fund.
As of October 31, 2012, the Fund had no uncertain tax positions that would require financial statement recognition, de-recognition, or disclosure. The Fund files a U.S. federal income tax return annually after its fiscal year-end, which is subject to examination by the Internal Revenue Service for a period of three years from the date of filing.
D Expenses — The majority of expenses of the Trust are directly identifiable to an individual fund. Expenses which are not readily identifiable to a specific fund are allocated taking into consideration, among other things, the nature and type of expense and the relative size of the funds.
E Expense Reduction — State Street Bank and Trust Company (SSBT) serves as custodian of the Fund. Pursuant to the custodian agreement, SSBT receives a fee reduced by credits, which are determined based on the average daily cash balance the Fund maintains with SSBT. All credit balances, if any, used to reduce the Fund’s custodian fees are reported as a reduction of expenses in the Statement of Operations.
F Use of Estimates — The preparation of the financial statements in conformity with accounting principles generally accepted in the United States of America requires management to make estimates and assumptions that affect the reported amounts of assets and liabilities at the date of the financial statements and the reported amounts of income and expense during the reporting period. Actual results could differ from those estimates.
G Indemnifications — Under the Trust’s organizational documents, its officers and Trustees may be indemnified against certain liabilities and expenses arising out of the performance of their duties to the Fund. Under Massachusetts law, if certain conditions prevail, shareholders of a Massachusetts business trust (such as the Trust) could be deemed to have personal liability for the obligations of the Trust. However, the Trust’s Declaration of Trust contains an express disclaimer of liability on the part of Fund shareholders and the By-laws provide that the Trust shall assume the defense on behalf of any Fund shareholders. Moreover, the By-laws also provide for indemnification out of Fund property of any shareholder held personally liable solely by reason of being or having been a shareholder for all loss or expense arising from such liability. Additionally, in the normal course of business, the Fund enters into agreements with service providers that may contain indemnification clauses. The Fund’s maximum exposure under these arrangements is unknown as this would involve future claims that may be made against the Fund that have not yet occurred.
H Other — Investment transactions are accounted for on a trade date basis. Dividends to shareholders are recorded on the ex-dividend date.
Eaton Vance
Tax-Managed Value Fund
October 31, 2012
Notes to Financial Statements — continued
2 Distributions to Shareholders
It is the present policy of the Fund to make at least one distribution annually (normally in December) of all or substantially all of its net investment income and to distribute annually all or substantially all of its net realized capital gains (reduced by available capital loss carryforwards from prior years, if any). Distributions are declared separately for each class of shares. Shareholders may reinvest income and capital gain distributions in additional shares of the same class of the Fund at the net asset value as of the ex-dividend date or, at the election of the shareholder, receive distributions in cash. The Fund distinguishes between distributions on a tax basis and a financial reporting basis. Accounting principles generally accepted in the United States of America require that only distributions in excess of tax basis earnings and profits be reported in the financial statements as a return of capital. Permanent differences between book and tax accounting relating to distributions are reclassified to paid-in capital. For tax purposes, distributions from short-term capital gains are considered to be from ordinary income.
The tax character of distributions declared for the years ended October 31, 2012 and October 31, 2011 was as follows:
| | | | | | | | |
| | | Year Ended October 31, | |
| | | 2012 | | | 2011 | |
| | |
Distributions declared from: | | | | | | | | |
Ordinary income | | $ | 20,011,730 | | | $ | 15,669,230 | |
During the year ended October 31, 2012, accumulated net realized loss was increased by $2,388,551, accumulated undistributed net investment income was decreased by $268,810 and paid-in capital was increased by $2,657,361 due to differences between book and tax accounting, primarily for distributions from real estate investment trusts (REITs), redemptions in-kind and foreign currency gain (loss). These reclassifications had no effect on the net assets or net asset value per share of the Fund.
As of October 31, 2012, the components of distributable earnings (accumulated losses) and unrealized appreciation (depreciation) on a tax basis were as follows:
| | | | |
Undistributed ordinary income | | $ | 10,973,658 | |
Capital loss carryforward | | $ | (135,193 | ) |
Net unrealized appreciation | | $ | 273,514,156 | |
The differences between components of distributable earnings (accumulated losses) on a tax basis and the amounts reflected in the Statement of Assets and Liabilities are primarily due to wash sales, partnership allocations, investments in partnerships and distributions from REITs.
3 Transactions with Affiliates
The administration fee is earned by Eaton Vance Management (EVM) as compensation for administrative services rendered to the Fund. The fee is computed at an annual rate of 0.15% of the Fund’s average daily net assets. For the year ended October 31, 2012, the administration fee amounted to $1,678,178. The Portfolio has engaged Boston Management and Research (BMR), a subsidiary of EVM, to render investment advisory services. See Note 2 of the Portfolio’s Notes to Financial Statements which are included elsewhere in this report.
EVM serves as the sub-transfer agent of the Fund and receives from the transfer agent an aggregate fee based upon the actual expenses incurred by EVM in the performance of these services. For the year ended October 31, 2012, EVM earned $39,982 in sub-transfer agent fees. The Fund was informed that Eaton Vance Distributors, Inc. (EVD), an affiliate of EVM and the Fund’s principal underwriter, received $18,504 as its portion of the sales charge on sales of Class A shares for the year ended October 31, 2012. EVD also received distribution and service fees from Class A and Class C shares (see Note 4) and contingent deferred sales charges (see Note 5).
Trustees and officers of the Fund who are members of EVM’s or BMR’s organizations receive remuneration for their services to the Fund out of the investment adviser fee. Certain officers and Trustees of the Fund and the Portfolio are officers of the above organizations.
4 Distribution Plans
The Fund has in effect a distribution plan for Class A shares (Class A Plan) pursuant to Rule 12b-1 under the 1940 Act. Pursuant to the Class A Plan, the Fund pays EVD a distribution and service fee of 0.25% per annum of its average daily net assets attributable to Class A shares for distribution services and facilities provided to the Fund by EVD, as well as for personal services and/or the maintenance of shareholder accounts. Distribution and service fees paid or accrued to EVD for the year ended October 31, 2012 amounted to $1,430,611 for Class A shares.
Eaton Vance
Tax-Managed Value Fund
October 31, 2012
Notes to Financial Statements — continued
The Fund also has in effect a distribution plan for Class C shares (Class C Plan) pursuant to Rule 12b-1 under the 1940 Act. Pursuant to the Class C Plan, the Fund pays EVD amounts equal to 0.75% per annum of its average daily net assets attributable to Class C shares for providing ongoing distribution services and facilities to the Fund. The Fund will automatically discontinue payments to EVD during any period in which there are no outstanding Uncovered Distribution Charges, which are equivalent to the sum of (i) 6.25% of the aggregate amount received by the Fund for Class C shares sold, plus (ii) interest calculated by applying the rate of 1% over the prevailing prime rate to the outstanding balance of Uncovered Distribution Charges of EVD of Class C, reduced by the aggregate amount of contingent deferred sales charges (see Note 5) and amounts theretofore paid or payable to EVD by Class C. For the year ended October 31, 2012, the Fund paid or accrued to EVD $1,022,328 for Class C shares, representing 0.75% of the average daily net assets of Class C shares. At October 31, 2012, the amount of Uncovered Distribution Charges of EVD calculated under the Class C Plan was approximately $23,543,000.
Pursuant to the Class C Plan, the Fund also makes payments of service fees to EVD, financial intermediaries and other persons in amounts equal to 0.25% per annum of its average daily net assets attributable to Class C. Service fees paid or accrued are for personal services and/or the maintenance of shareholder accounts. They are separate and distinct from the sales commissions and distribution fees payable to EVD and, as such, are not subject to automatic discontinuance when there are no outstanding Uncovered Distribution Charges of EVD. Service fees paid or accrued for the year ended October 31, 2012 amounted to $340,776 for Class C shares.
5 Contingent Deferred Sales Charges
A contingent deferred sales charge (CDSC) of 1% generally is imposed on redemptions of Class C shares made within one year of purchase. Class A shares may be subject to a 1% CDSC if redeemed within 18 months of purchase (depending on the circumstances of purchase). Generally, the CDSC is based upon the lower of the net asset value at date of redemption or date of purchase. No charge is levied on shares acquired by reinvestment of dividends or capital gain distributions. No CDSC is levied on shares which have been sold to EVM or its affiliates or to their respective employees or clients and may be waived under certain other limited conditions. CDSCs received on Class C redemptions are paid to EVD to reduce the amount of Uncovered Distribution Charges calculated under the Fund’s Class C Plan. CDSCs received on Class C redemptions when no Uncovered Distribution Charges exist are credited to the Fund. For the year ended October 31, 2012, the Fund was informed that EVD received approximately $2,000 and $3,000 of CDSCs paid by Class A and Class C shareholders, respectively.
6 Investment Transactions
For the year ended October 31, 2012, increases and decreases in the Fund’s investment in the Portfolio aggregated $23,807,592 and $754,821,023, respectively.
7 Shares of Beneficial Interest
The Fund’s Declaration of Trust permits the Trustees to issue an unlimited number of full and fractional shares of beneficial interest (without par value). Such shares may be issued in a number of different series (such as the Fund) and classes. Sales and redemptions of Class I shares include shares purchased and redeemed in connection with the ReFlow liquidity program, a program designed to provide an alternative liquidity source for mutual funds experiencing net redemptions of their shares. The Fund began participating in the ReFlow liquidity program on October 23, 2012. Transactions in Fund shares were as follows:
| | | | | | | | |
| | | Year Ended October 31, | |
| Class A | | 2012 | | | 2011 | |
| | |
Sales | | | 3,764,949 | | | | 12,838,222 | |
Issued to shareholders electing to receive payments of distributions in Fund shares | | | 464,238 | | | | 266,074 | |
Redemptions | | | (26,037,356 | ) | | | (20,933,144 | ) |
Exchange from Class B shares | | | — | | | | 468,212 | |
Merger from Class B shares | | | — | | | | 1,203,161 | |
| | |
Net decrease | | | (21,808,169 | ) | | | (6,157,475 | ) |
Eaton Vance
Tax-Managed Value Fund
October 31, 2012
Notes to Financial Statements — continued
| | | | | | | | |
| Class B | | | | | Year Ended
October 31, 2011(1) | |
| | |
Sales | | | | | | | 23,398 | |
Issued to shareholders electing to receive payments of distributions in Fund shares | | | | | | | 8,088 | |
Redemptions | | | | | | | (249,386 | ) |
Exchange to Class A shares | | | | | | | (491,800 | ) |
Merger to Class A shares | | | | | | | (1,263,212 | ) |
| | |
Net decrease | | | | | | | (1,972,912 | ) |
| | |
| | | | | | | | |
| | | Year Ended October 31, | |
| Class C | | 2012 | | | 2011 | |
| | |
Sales | | | 166,263 | | | | 249,167 | |
Issued to shareholders electing to receive payments of distributions in Fund shares | | | 47,212 | | | | 385 | |
Redemptions | | | (1,606,869 | ) | | | (2,537,836 | ) |
| | |
Net decrease | | | (1,393,394 | ) | | | (2,288,284 | ) |
| | |
| | | | | | | | |
| | | Year Ended October 31, | |
| Class I | | 2012 | | | 2011 | |
| | |
Sales | | | 5,908,547 | | | | 16,185,560 | |
Issued to shareholders electing to receive payments of distributions in Fund shares | | | 537,887 | | | | 444,709 | |
Redemptions | | | (25,005,372 | ) | | | (39,327,405 | ) |
| | |
Net decrease | | | (18,558,938 | ) | | | (22,697,136 | ) |
| (1) | The Fund previously offered Class B Shares. Such offering was discontinued during the year ended October 31, 2011. At the close of business on June 24, 2011, Class B shares of the Fund merged into Class A shares. |
Eaton Vance
Tax-Managed Value Fund
October 31, 2012
Report of Independent Registered Public Accounting Firm
To the Trustees of Eaton Vance Mutual Funds Trust and Shareholders of Eaton Vance Tax-Managed Value Fund:
We have audited the accompanying statement of assets and liabilities of Eaton Vance Tax-Managed Value Fund (the “Fund”) (one of the funds constituting Eaton Vance Mutual Funds Trust) as of October 31, 2012, and the related statement of operations for the year then ended, the statements of changes in net assets for each of the two years in the period then ended, and the financial highlights for each of the five years in the period then ended. These financial statements and financial highlights are the responsibility of the Fund’s management. Our responsibility is to express an opinion on these financial statements and financial highlights based on our audits.
We conducted our audits in accordance with the standards of the Public Company Accounting Oversight Board (United States). Those standards require that we plan and perform the audit to obtain reasonable assurance about whether the financial statements and financial highlights are free of material misstatement. The Fund is not required to have, nor were we engaged to perform, an audit of its internal control over financial reporting. Our audits included consideration of internal control over financial reporting as a basis for designing audit procedures that are appropriate in the circumstances, but not for the purpose of expressing an opinion on the effectiveness of the Fund’s internal control over financial reporting. Accordingly, we express no such opinion. An audit also includes examining, on a test basis, evidence supporting the amounts and disclosures in the financial statements, assessing the accounting principles used and significant estimates made by management, as well as evaluating the overall financial statement presentation. We believe that our audits provide a reasonable basis for our opinion.
In our opinion, such financial statements and financial highlights referred to above present fairly, in all material respects, the financial position of Eaton Vance Tax-Managed Value Fund as of October 31, 2012, the results of its operations for the year then ended, the changes in its net assets for each of the two years in the period then ended, and the financial highlights for each of the five years in the period then ended, in conformity with accounting principles generally accepted in the United States of America.
DELOITTE & TOUCHE LLP
Boston, Massachusetts
December 17, 2012
Eaton Vance
Tax-Managed Value Fund
October 31, 2012
Federal Tax Information (Unaudited)
The Form 1099-DIV you receive in January 2013 will show the tax status of all distributions paid to your account in calendar year 2012. Shareholders are advised to consult their own tax adviser with respect to the tax consequences of their investment in the Fund. As required by the Internal Revenue Code and/or regulations, shareholders must be notified regarding the status of qualified dividend income for individuals and the dividends received deduction for corporations.
Qualified Dividend Income. The Fund designates approximately $28,487,462, or up to the maximum amount of such dividends allowable pursuant to the Internal Revenue Code, as qualified dividend income eligible for the reduced tax rate of 15%.
Dividends Received Deduction. Corporate shareholders are generally entitled to take the dividends received deduction on the portion of the Fund’s dividend distribution that qualifies under tax law. For the Fund’s fiscal 2012 ordinary income dividends, 100% qualifies for the corporate dividends received deduction.
Tax-Managed Value Portfolio
October 31, 2012
Portfolio of Investments
| | | | | | | | |
| Common Stocks — 98.8% | |
| | |
| | | | | | | | |
| Security | | Shares | | | Value | |
| | | | | | | | |
| | |
Aerospace & Defense — 3.7% | | | | | | | | |
Boeing Co. (The) | | | 120,000 | | | $ | 8,452,800 | |
General Dynamics Corp. | | | 73,500 | | | | 5,003,880 | |
Honeywell International, Inc. | | | 145,000 | | | | 8,879,800 | |
United Technologies Corp. | | | 123,100 | | | | 9,621,496 | |
| | | | | | | | | |
| | | | | | $ | 31,957,976 | |
| | | | | | | | | |
|
Biotechnology — 1.8% | |
Celgene Corp.(1) | | | 78,192 | | | $ | 5,733,037 | |
Gilead Sciences, Inc.(1) | | | 150,000 | | | | 10,074,000 | |
| | | | | | | | | |
| | | | | | $ | 15,807,037 | |
| | | | | | | | | |
|
Capital Markets — 2.4% | |
Ameriprise Financial, Inc. | | | 90,000 | | | $ | 5,253,300 | |
Goldman Sachs Group, Inc. (The) | | | 72,400 | | | | 8,861,036 | |
State Street Corp. | | | 135,000 | | | | 6,016,950 | |
| | | | | | | | | |
| | | | | | $ | 20,131,286 | |
| | | | | | | | | |
|
Chemicals — 1.4% | |
Air Products and Chemicals, Inc. | | | 60,000 | | | $ | 4,651,800 | |
LyondellBasell Industries NV, Class A | | | 130,000 | | | | 6,940,700 | |
| | | | | | | | | |
| | | | | | $ | 11,592,500 | |
| | | | | | | | | |
|
Commercial Banks — 7.6% | |
Fifth Third Bancorp | | | 350,000 | | | $ | 5,085,500 | |
KeyCorp | | | 735,000 | | | | 6,188,700 | |
PNC Financial Services Group, Inc. | | | 193,900 | | | | 11,283,041 | |
Regions Financial Corp. | | | 1,125,000 | | | | 7,335,000 | |
U.S. Bancorp | | | 290,000 | | | | 9,630,900 | |
Wells Fargo & Co. | | | 755,000 | | | | 25,435,950 | |
| | | | | | | | | |
| | | | | | $ | 64,959,091 | |
| | | | | | | | | |
|
Commercial Services & Supplies — 0.5% | |
ADT Corp. (The)(1) | | | 45,000 | | | $ | 1,867,950 | |
Tyco International, Ltd. | | | 90,000 | | | | 2,418,300 | |
| | | | | | | | | |
| | | | | | $ | 4,286,250 | |
| | | | | | | | | |
|
Computers & Peripherals — 2.7% | |
Apple, Inc. | | | 39,500 | | | $ | 23,506,450 | |
| | | | | | | | | |
| | | | | | $ | 23,506,450 | |
| | | | | | | | | |
| | | | | | | | |
| Security | | Shares | | | Value | |
| | | | | | | | |
|
Consumer Finance — 2.3% | |
American Express Co. | | | 347,600 | | | $ | 19,455,172 | |
| | | | | | | | | |
| | | | | | $ | 19,455,172 | |
| | | | | | | | | |
|
Diversified Financial Services — 4.1% | |
Citigroup, Inc. | | | 250,000 | | | $ | 9,347,500 | |
JPMorgan Chase & Co. | | | 623,000 | | | | 25,966,640 | |
| | | | | | | | | |
| | | | | | $ | 35,314,140 | |
| | | | | | | | | |
|
Diversified Telecommunication Services — 2.1% | |
AT&T, Inc. | | | 350,000 | | | $ | 12,106,500 | |
CenturyLink, Inc. | | | 160,000 | | | | 6,140,800 | |
| | | | | | | | | |
| | | | | | $ | 18,247,300 | |
| | | | | | | | | |
|
Electric Utilities — 2.5% | |
American Electric Power Co., Inc. | | | 225,000 | | | $ | 9,999,000 | |
NextEra Energy, Inc. | | | 165,000 | | | | 11,559,900 | |
| | | | | | | | | |
| | | | | | $ | 21,558,900 | |
| | | | | | | | | |
|
Energy Equipment & Services — 2.1% | |
National Oilwell Varco, Inc. | | | 150,000 | | | $ | 11,055,000 | |
Schlumberger, Ltd. | | | 97,900 | | | | 6,806,987 | |
| | | | | | | | | |
| | | | | | $ | 17,861,987 | |
| | | | | | | | | |
|
Food & Staples Retailing — 2.4% | |
CVS Caremark Corp. | | | 440,000 | | | $ | 20,416,000 | |
| | | | | | | | | |
| | | | | | $ | 20,416,000 | |
| | | | | | | | | |
|
Food Products — 3.5% | |
Kraft Foods Group, Inc.(1) | | | 108,333 | | | $ | 4,926,985 | |
Mondelez International, Inc., Class A | | | 325,000 | | | | 8,625,500 | |
Nestle SA | | | 145,000 | | | | 9,205,785 | |
Unilever NV - NY Shares | | | 200,000 | | | | 7,338,000 | |
| | | | | | | | | |
| | | | | | $ | 30,096,270 | |
| | | | | | | | | |
|
Health Care Equipment & Supplies — 1.1% | |
Covidien PLC | | | 175,000 | | | $ | 9,616,250 | |
| | | | | | | | | |
| | | | | | $ | 9,616,250 | |
| | | | | | | | | |
|
Health Care Providers & Services — 2.0% | |
UnitedHealth Group, Inc. | | | 300,000 | | | $ | 16,800,000 | |
| | | | | | | | | |
| | | | | | $ | 16,800,000 | |
| | | | | | | | | |
| | | | |
| | 19 | | See Notes to Financial Statements. |
Tax-Managed Value Portfolio
October 31, 2012
Portfolio of Investments — continued
| | | | | | | | |
| Security | | Shares | | | Value | |
| | | | | | | | |
|
Industrial Conglomerates — 3.0% | |
General Electric Co. | | | 1,215,000 | | | $ | 25,587,900 | |
| | | | | | | | | |
| | | | | | $ | 25,587,900 | |
| | | | | | | | | |
|
Insurance — 5.7% | |
ACE, Ltd. | | | 110,000 | | | $ | 8,651,500 | |
MetLife, Inc. | | | 256,200 | | | | 9,092,538 | |
Prudential Financial, Inc. | | | 144,600 | | | | 8,249,430 | |
Travelers Companies, Inc. (The) | | | 195,000 | | | | 13,833,300 | |
XL Group PLC | | | 375,000 | | | | 9,277,500 | |
| | | | | | | | | |
| | | | | | $ | 49,104,268 | |
| | | | | | | | | |
|
Internet Software & Services — 0.8% | |
Google, Inc., Class A(1) | | | 10,000 | | | $ | 6,797,700 | |
| | | | | | | | | |
| | | | | | $ | 6,797,700 | |
| | | | | | | | | |
|
IT Services — 1.9% | |
International Business Machines Corp. | | | 85,000 | | | $ | 16,535,050 | |
| | | | | | | | | |
| | | | | | $ | 16,535,050 | |
| | | | | | | | | |
|
Life Sciences Tools & Services — 0.8% | |
Thermo Fisher Scientific, Inc. | | | 105,000 | | | $ | 6,411,300 | |
| | | | | | | | | |
| | | | | | $ | 6,411,300 | |
| | | | | | | | | |
|
Machinery — 1.0% | |
Eaton Corp.(2) | | | 175,000 | | | $ | 8,263,500 | |
| | | | | | | | | |
| | | | | | $ | 8,263,500 | |
| | | | | | | | | |
|
Media — 4.4% | |
Comcast Corp., Class A | | | 300,000 | | | $ | 11,253,000 | |
Time Warner, Inc. | | | 135,000 | | | | 5,865,750 | |
Walt Disney Co. (The) | | | 420,000 | | | | 20,609,400 | |
| | | | | | | | | |
| | | | | | $ | 37,728,150 | |
| | | | | | | | | |
|
Metals & Mining — 1.7% | |
BHP Billiton, Ltd. ADR(2) | | | 100,000 | | | $ | 7,074,000 | |
Freeport-McMoRan Copper & Gold, Inc. | | | 200,000 | | | | 7,776,000 | |
| | | | | | | | | |
| | | | | | $ | 14,850,000 | |
| | | | | | | | | |
|
Multi-Utilities — 3.1% | |
National Grid PLC | | | 890,000 | | | $ | 10,150,046 | |
PG&E Corp. | | | 25,000 | | | | 1,063,000 | |
Sempra Energy | | | 225,000 | | | | 15,693,750 | |
| | | | | | | | | |
| | | | | | $ | 26,906,796 | |
| | | | | | | | | |
| | | | | | | | |
| Security | | Shares | | | Value | |
| | | | | | | | |
|
Multiline Retail — 2.1% | |
Macy’s, Inc. | | | 200,000 | | | $ | 7,614,000 | |
Target Corp. | | | 160,000 | | | | 10,200,000 | |
| | | | | | | | | |
| | | | | | $ | 17,814,000 | |
| | | | | | | | | |
|
Oil, Gas & Consumable Fuels — 14.5% | |
Apache Corp. | | | 69,300 | | | $ | 5,734,575 | |
Chevron Corp. | | | 227,000 | | | | 25,017,670 | |
ConocoPhillips | | | 292,500 | | | | 16,921,125 | |
EOG Resources, Inc. | | | 50,000 | | | | 5,824,500 | |
Exxon Mobil Corp. | | | 283,000 | | | | 25,801,110 | |
Marathon Petroleum Corp. | | | 115,000 | | | | 6,316,950 | |
Occidental Petroleum Corp. | | | 250,000 | | | | 19,740,000 | |
Peabody Energy Corp. | | | 200,000 | | | | 5,580,000 | |
Phillips 66 | | | 275,000 | | | | 12,969,000 | |
| | | | | | | | | |
| | | | | | $ | 123,904,930 | |
| | | | | | | | | |
|
Pharmaceuticals — 7.5% | |
Johnson & Johnson | | | 190,000 | | | $ | 13,455,800 | |
Merck & Co., Inc. | | | 555,000 | | | | 25,324,650 | |
Pfizer, Inc. | | | 1,010,000 | | | | 25,118,700 | |
| | | | | | | | | |
| | | | | | $ | 63,899,150 | |
| | | | | | | | | |
|
Real Estate Investment Trusts (REITs) — 3.4% | |
AvalonBay Communities, Inc. | | | 70,000 | | | $ | 9,489,200 | |
Boston Properties, Inc. | | | 95,000 | | | | 10,098,500 | |
Simon Property Group, Inc. | | | 60,000 | | | | 9,132,600 | |
| | | | | | | | | |
| | | | | | $ | 28,720,300 | |
| | | | | | | | | |
|
Road & Rail — 1.8% | |
Union Pacific Corp. | | | 125,000 | | | $ | 15,378,750 | |
| | | | | | | | | |
| | | | | | $ | 15,378,750 | |
| | | | | | | | | |
|
Software — 2.2% | |
Microsoft Corp. | | | 465,100 | | | $ | 13,271,629 | |
Oracle Corp. | | | 170,000 | | | | 5,278,500 | |
| | | | | | | | | |
| | | | | | $ | 18,550,129 | |
| | | | | | | | | |
|
Tobacco — 1.3% | |
Philip Morris International, Inc. | | | 125,000 | | | $ | 11,070,000 | |
| | | | | | | | | |
| | | | | | $ | 11,070,000 | |
| | | | | | | | | |
| | | | |
| | 20 | | See Notes to Financial Statements. |
Tax-Managed Value Portfolio
October 31, 2012
Portfolio of Investments — continued
| | | | | | | | |
| Security | | Shares | | | Value | |
| | | | | | | | |
|
Wireless Telecommunication Services — 1.4% | |
Rogers Communications, Inc., Class B | | | 125,000 | | | $ | 5,490,000 | |
Vodafone Group PLC ADR | | | 225,000 | | | | 6,124,500 | |
| | | | | | | | | |
| | | | | | $ | 11,614,500 | |
| | | | | | | | | |
| |
Total Common Stocks
(identified cost $542,768,144) | | | $ | 844,743,032 | |
| | |
|
| Short-Term Investments — 2.0% | |
| | |
| | | | | | | | |
| Description | | Interest
(000’s omitted) | | | Value | |
| | | | | | | | |
Eaton Vance Cash Collateral Fund, LLC, 0.11%(3)(4) | | $ | 15,016 | | | $ | 15,016,250 | |
Eaton Vance Cash Reserves Fund, LLC, 0.12%(4) | | | 1,703 | | | | 1,702,780 | |
| | |
| |
Total Short-Term Investments
(identified cost $16,719,030) | | | $ | 16,719,030 | |
| | |
| |
Total Investments — 100.8%
(identified cost $559,487,174) | | | $ | 861,462,062 | |
| | |
| |
Other Assets, Less Liabilities — (0.8)% | | | $ | (6,466,930 | ) |
| | | | | | | | | |
| |
Net Assets — 100.0% | | | $ | 854,995,132 | |
| | | | | | | | | |
The percentage shown for each investment category in the Portfolio of Investments is based on net assets.
| | | | |
| ADR | | – | | American Depositary Receipt |
| (1) | Non-income producing security. |
| (2) | All or a portion of this security was on loan at October 31, 2012. |
| (3) | The amount invested in Eaton Vance Cash Collateral Fund, LLC represents cash collateral received for securities on loan at October 31, 2012. Other Assets, Less Liabilities includes an equal and offsetting liability of the Portfolio to repay collateral amounts upon the return of loaned securities. |
| (4) | Affiliated investment company available to Eaton Vance portfolios and funds which invests in high quality, U.S. dollar denominated money market instruments. The rate shown is the annualized seven-day yield as of October 31, 2012. |
| | | | |
| | 21 | | See Notes to Financial Statements. |
Tax-Managed Value Portfolio
October 31, 2012
Statement of Assets and Liabilities
| | | | |
| Assets | | October 31, 2012 | |
Unaffiliated investments, at value including $15,054,180 of securities on loan (identified cost, $542,768,144) | | $ | 844,743,032 | |
Affiliated investments, at value (identified cost, $16,719,030) | | | 16,719,030 | |
Dividends receivable | | | 869,014 | |
Interest receivable from affiliated investment | | | 438 | |
Receivable for investments sold | | | 7,252,943 | |
Securities lending income receivable | | | 2,126 | |
Tax reclaims receivable | | | 1,004,919 | |
Total assets | | $ | 870,591,502 | |
| |
| Liabilities | | | | |
Collateral for securities loaned | | $ | 15,016,250 | |
Payable to affiliates: | | | | |
Investment adviser fee | | | 476,981 | |
Trustees’ fees | | | 3,510 | |
Accrued expenses | | | 99,629 | |
Total liabilities | | $ | 15,596,370 | |
Net Assets applicable to investors’ interest in Portfolio | | $ | 854,995,132 | |
| |
| Sources of Net Assets | | | | |
Investors’ capital | | $ | 552,883,740 | |
Net unrealized appreciation | | | 302,111,392 | |
Total | | $ | 854,995,132 | |
| | | | |
| | 22 | | See Notes to Financial Statements. |
Tax-Managed Value Portfolio
October 31, 2012
Statement of Operations
| | | | |
| Investment Income | | Year Ended
October 31, 2012 | |
Dividends (net of foreign taxes, $110,227) | | $ | 32,286,032 | |
Securities lending income, net | | | 62,784 | |
Interest allocated from affiliated investment | | | 20,101 | |
Expenses allocated from affiliated investment | | | (2,903 | ) |
Total investment income | | $ | 32,366,014 | |
| |
| Expenses | | | | |
Investment adviser fee | | $ | 7,758,267 | |
Trustees’ fees and expenses | | | 49,365 | |
Custodian fee | | | 273,547 | |
Legal and accounting services | | | 88,754 | |
Miscellaneous | | | 30,031 | |
Total expenses | | $ | 8,199,964 | |
Deduct — | | | | |
Reduction of custodian fee | | $ | 14 | |
Total expense reductions | | $ | 14 | |
| |
Net expenses | | $ | 8,199,950 | |
| |
Net investment income | | $ | 24,166,064 | |
| |
| Realized and Unrealized Gain (Loss) | | | | |
Net realized gain (loss) — | | | | |
Investment transactions | | $ | 258,950,756 | (1) |
Investment transactions allocated from affiliated investments | | | 1,332 | |
Foreign currency transactions | | | 62,265 | |
Net realized gain | | $ | 259,014,353 | |
Change in unrealized appreciation (depreciation) — | | | | |
Investments | | $ | (121,030,186 | ) |
Foreign currency | | | (138,798 | ) |
Net change in unrealized appreciation (depreciation) | | $ | (121,168,984 | ) |
| |
Net realized and unrealized gain | | $ | 137,845,369 | |
| |
Net increase in net assets from operations | | $ | 162,011,433 | |
| (1) | Includes $2,904,269 of net realized gains from redemptions in-kind. |
| | | | |
| | 23 | | See Notes to Financial Statements. |
Tax-Managed Value Portfolio
October 31, 2012
Statements of Changes in Net Assets
| | | | | | | | |
| | | Year Ended October 31, | |
| Increase (Decrease) in Net Assets | | 2012 | | | 2011 | |
From operations — | | | | | | | | |
Net investment income | | $ | 24,166,064 | | | $ | 31,403,107 | |
Net realized gain from investment and foreign currency transactions | | | 259,014,353 | (1) | | | 88,943,934 | |
Net change in unrealized appreciation (depreciation) from investments and foreign currency | | | (121,168,984 | ) | | | (53,202,698 | ) |
Net increase in net assets from operations | | $ | 162,011,433 | | | $ | 67,144,343 | |
Capital transactions — | | | | | | | | |
Contributions | | $ | 23,807,592 | | | $ | 87,467,984 | |
Withdrawals | | | (778,668,429 | ) | | | (652,726,995 | ) |
Net decrease in net assets from capital transactions | | $ | (754,860,837 | ) | | $ | (565,259,011 | ) |
| | |
Net decrease in net assets | | $ | (592,849,404 | ) | | $ | (498,114,668 | ) |
| | |
| Net Assets | | | | | | | | |
At beginning of year | | $ | 1,447,844,536 | | | $ | 1,945,959,204 | |
At end of year | | $ | 854,995,132 | | | $ | 1,447,844,536 | |
| (1) | Includes $2,904,269 of net realized gains from redemptions in-kind. |
| | | | |
| | 24 | | See Notes to Financial Statements. |
Tax-Managed Value Portfolio
October 31, 2012
Supplementary Data
| | | | | | | | | | | | | | | | | | | | |
| | | Year Ended October 31, | |
| Ratios/Supplemental Data | | 2012 | | | 2011 | | | 2010 | | | 2009 | | | 2008 | |
Ratios (as a percentage of average daily net assets): | | | | | | | | | | | | | | | | | | | | |
Expenses(1) | | | 0.67 | % | | | 0.65 | % | | | 0.65 | % | | | 0.67 | % | | | 0.66 | % |
Net investment income | | | 1.96 | % | | | 1.67 | % | | | 1.38 | % | | | 1.96 | % | | | 1.71 | % |
Portfolio Turnover | | | 38 | % | | | 40 | % | | | 35 | % | | | 82 | % | | | 84 | % |
| | | | | |
Total Return | | | 15.74 | % | | | 3.64 | % | | | 9.55 | % | | | 4.55 | % | | | (32.85 | )% |
| | | | | |
Net assets, end of year (000’s omitted) | | $ | 854,995 | | | $ | 1,447,845 | | | $ | 1,945,959 | | | $ | 1,649,326 | | | $ | 1,357,280 | |
| (1) | Excludes the effect of custody fee credits, if any, of less than 0.005%. |
| | | | |
| | 25 | | See Notes to Financial Statements. |
Tax-Managed Value Portfolio
October 31, 2012
Notes to Financial Statements
1 Significant Accounting Policies
Tax-Managed Value Portfolio (the Portfolio) is a Massachusetts business trust registered under the Investment Company Act of 1940, as amended (the 1940 Act), as a diversified, open-end management investment company. The Portfolio’s investment objective is to achieve long-term, after-tax returns by investing in a diversified portfolio of value stocks. The Declaration of Trust permits the Trustees to issue interests in the Portfolio. At October 31, 2012, Eaton Vance Tax-Managed Value Fund and Eaton Vance Tax-Managed Equity Asset Allocation Fund held an interest of 88.0% and 12.0%, respectively, in the Portfolio.
The following is a summary of significant accounting policies of the Portfolio. The policies are in conformity with accounting principles generally accepted in the United States of America.
A Investment Valuation — Equity securities (including common shares of closed-end investment companies) listed on a U.S. securities exchange generally are valued at the last sale or closing price on the day of valuation or, if no sales took place on such date, at the mean between the closing bid and asked prices therefore on the exchange where such securities are principally traded. Equity securities listed on the NASDAQ Global or Global Select Market generally are valued at the NASDAQ official closing price. Unlisted or listed securities for which closing sales prices or closing quotations are not available are valued at the mean between the latest available bid and asked prices or, in the case of preferred equity securities that are not listed or traded in the over-the-counter market, by a third party pricing service that will use various techniques that consider factors including, but not limited to, prices or yields of securities with similar characteristics, benchmark yields, broker/dealer quotes, quotes of underlying common stock, issuer spreads, as well as industry and economic events. Short-term obligations purchased with a remaining maturity of sixty days or less are generally valued at amortized cost, which approximates market value. Foreign securities and currencies are valued in U.S. dollars, based on foreign currency exchange rate quotations supplied by a third party pricing service. The pricing service uses a proprietary model to determine the exchange rate. Inputs to the model include reported trades and implied bid/ask spreads. The daily valuation of exchange-traded foreign securities generally is determined as of the close of trading on the principal exchange on which such securities trade. Events occurring after the close of trading on foreign exchanges may result in adjustments to the valuation of foreign securities to more accurately reflect their fair value as of the close of regular trading on the New York Stock Exchange. When valuing foreign equity securities that meet certain criteria, the Portfolio’s Trustees have approved the use of a fair value service that values such securities to reflect market trading that occurs after the close of the applicable foreign markets of comparable securities or other instruments that have a strong correlation to the fair-valued securities. Investments for which valuations or market quotations are not readily available or are deemed unreliable are valued at fair value using methods determined in good faith by or at the direction of the Trustees of the Portfolio in a manner that fairly reflects the security’s value, or the amount that the Portfolio might reasonably expect to receive for the security upon its current sale in the ordinary course. Each such determination is based on a consideration of relevant factors, which are likely to vary from one pricing context to another. These factors may include, but are not limited to, the type of security, the existence of any contractual restrictions on the security’s disposition, the price and extent of public trading in similar securities of the issuer or of comparable companies or entities, quotations or relevant information obtained from broker/dealers or other market participants, information obtained from the issuer, analysts, and/or the appropriate stock exchange (for exchange-traded securities), an analysis of the company’s or entity’s financial condition, and an evaluation of the forces that influence the issuer and the market(s) in which the security is purchased and sold.
The Portfolio may invest in Eaton Vance Cash Reserves Fund, LLC (Cash Reserves Fund) and Eaton Vance Cash Collateral Fund, LLC (Cash Collateral Fund), affiliated investment companies managed by Eaton Vance Management (EVM). Cash Reserves Fund and Cash Collateral Fund generally value their investment securities utilizing the amortized cost valuation technique in accordance with Rule 2a-7 under the 1940 Act. This technique involves initially valuing a portfolio security at its cost and thereafter assuming a constant amortization to maturity of any discount or premium. If amortized cost is determined not to approximate fair value, Cash Reserves Fund and Cash Collateral Fund may value their investment securities based on available market quotations provided by a third party pricing service.
B Investment Transactions — Investment transactions for financial statement purposes are accounted for on a trade date basis. Realized gains and losses on investments sold are determined on the basis of identified cost.
C Income — Dividend income is recorded on the ex-dividend date for dividends received in cash and/or securities. However, if the ex-dividend date has passed, certain dividends from foreign securities are recorded as the Portfolio is informed of the ex-dividend date. Withholding taxes on foreign dividends and capital gains have been provided for in accordance with the Portfolio’s understanding of the applicable countries’ tax rules and rates. Interest income is recorded on the basis of interest accrued, adjusted for amortization of premium or accretion of discount.
D Federal Taxes — The Portfolio has elected to be treated as a partnership for federal tax purposes. No provision is made by the Portfolio for federal or state taxes on any taxable income of the Portfolio because each investor in the Portfolio is ultimately responsible for the payment of any taxes on its share of taxable income. Since at least one of the Portfolio’s investors is a regulated investment company that invests all or substantially all of its assets in the Portfolio, the Portfolio normally must satisfy the applicable source of income and diversification requirements (under the Internal Revenue Code) in order for its investors to satisfy them. The Portfolio will allocate, at least annually among its investors, each investor’s distributive share of the Portfolio’s net investment income, net realized capital gains and any other items of income, gain, loss, deduction or credit.
As of October 31, 2012, the Portfolio had no uncertain tax positions that would require financial statement recognition, de-recognition, or disclosure. The Portfolio files a U.S. federal income tax return annually after its fiscal year-end, which is subject to examination by the Internal Revenue Service for a period of three years from the date of filing.
Tax-Managed Value Portfolio
October 31, 2012
Notes to Financial Statements — continued
E Expense Reduction — State Street Bank and Trust Company (SSBT) serves as custodian of the Portfolio. Pursuant to the custodian agreement, SSBT receives a fee reduced by credits, which are determined based on the average daily cash balance the Portfolio maintains with SSBT. All credit balances, if any, used to reduce the Portfolio’s custodian fees are reported as a reduction of expenses in the Statement of Operations.
F Foreign Currency Translation — Investment valuations, other assets, and liabilities initially expressed in foreign currencies are translated each business day into U.S. dollars based upon current exchange rates. Purchases and sales of foreign investment securities and income and expenses denominated in foreign currencies are translated into U.S. dollars based upon currency exchange rates in effect on the respective dates of such transactions. Recognized gains or losses on investment transactions attributable to changes in foreign currency exchange rates are recorded for financial statement purposes as net realized gains and losses on investments. That portion of unrealized gains and losses on investments that results from fluctuations in foreign currency exchange rates is not separately disclosed.
G Use of Estimates — The preparation of the financial statements in conformity with accounting principles generally accepted in the United States of America requires management to make estimates and assumptions that affect the reported amounts of assets and liabilities at the date of the financial statements and the reported amounts of income and expense during the reporting period. Actual results could differ from those estimates.
H Indemnifications — Under the Portfolio’s organizational documents, its officers and Trustees may be indemnified against certain liabilities and expenses arising out of the performance of their duties to the Portfolio. Under Massachusetts law, if certain conditions prevail, interestholders in the Portfolio could be deemed to have personal liability for the obligations of the Portfolio. However, the Portfolio’s Declaration of Trust contains an express disclaimer of liability on the part of Portfolio interestholders and the By-laws provide that the Portfolio shall assume the defense on behalf of any Portfolio interestholder. Moreover, the By-laws also provide for indemnification out of Portfolio property of any interestholder held personally liable solely by reason of being or having been an interestholder for all loss or expense arising from such liability. Additionally, in the normal course of business, the Portfolio enters into agreements with service providers that may contain indemnification clauses. The Portfolio’s maximum exposure under these arrangements is unknown as this would involve future claims that may be made against the Portfolio that have not yet occurred.
2 Investment Adviser Fee and Other Transactions with Affiliates
The investment adviser fee is earned by Boston Management and Research (BMR), a subsidiary of EVM, as compensation for investment advisory services rendered to the Portfolio. Pursuant to the investment advisory agreement and subsequent fee reduction agreement between the Portfolio and BMR, the fee is computed at an annual rate of 0.65% of the Portfolio’s average daily net assets up to $500 million, 0.625% on net assets of $500 million but less than $1 billion, 0.60% on net assets of $1 billion but less than $2 billion, 0.575% on net assets of $2 billion but less than $5 billion and 0.555% on net assets of $5 billion and over, and is payable monthly. The fee reduction cannot be terminated without the consent of the Trustees and shareholders. The Portfolio invests its cash in Cash Reserves Fund. EVM does not currently receive a fee for advisory services provided to Cash Reserves Fund. For the year ended October 31, 2012, the Portfolio’s investment adviser fee amounted to $7,758,267 or 0.63% of the Portfolio’s average daily net assets.
Trustees and officers of the Portfolio who are members of EVM’s or BMR’s organizations receive remuneration for their services to the Portfolio out of the investment adviser fee. Trustees of the Portfolio who are not affiliated with the investment adviser may elect to defer receipt of all or a percentage of their annual fees in accordance with the terms of the Trustees Deferred Compensation Plan. For the year ended October 31, 2012, no significant amounts have been deferred. Certain officers and Trustees of the Portfolio are officers of the above organizations.
3 Purchases and Sales of Investments
Purchases and sales of investments, other than short-term obligations, aggregated $465,195,729 and $1,194,651,137, respectively, for the year ended October 31, 2012. Included in sales is $7,252,943 representing the value of securities delivered in payment of redemptions in-kind.
4 Federal Income Tax Basis of Investments
The cost and unrealized appreciation (depreciation) of investments of the Portfolio at October 31, 2012, as determined on a federal income tax basis, were as follows:
| | | | |
| |
Aggregate cost | | $ | 563,565,429 | |
| |
Gross unrealized appreciation | | $ | 297,896,633 | |
Gross unrealized depreciation | | | — | |
| |
Net unrealized appreciation | | $ | 297,896,633 | |
The net unrealized appreciation on foreign currency transactions at October 31, 2012 on a federal income tax basis was $136,504.
Tax-Managed Value Portfolio
October 31, 2012
Notes to Financial Statements — continued
5 Line of Credit
The Portfolio participates with other portfolios and funds managed by EVM and its affiliates in a $600 million unsecured line of credit agreement with a group of banks. Borrowings are made by the Portfolio solely to facilitate the handling of unusual and/or unanticipated short-term cash requirements. Interest is charged to the Portfolio based on its borrowings at an amount above either the Eurodollar rate or Federal Funds rate. In addition, a fee computed at an annual rate of 0.08% on the daily unused portion of the line of credit is allocated among the participating portfolios and funds at the end of each quarter. Because the line of credit is not available exclusively to the Portfolio, it may be unable to borrow some or all of its requested amounts at any particular time. The Portfolio did not have any significant borrowings or allocated fees during the year ended October 31, 2012.
6 Securities Lending Agreement
The Portfolio has established a securities lending agreement with SSBT as securities lending agent in which the Portfolio lends portfolio securities to qualified borrowers in exchange for collateral consisting of either cash or U.S. Government securities in an amount at least equal to the market value of the securities on loan. Cash collateral is invested in Cash Collateral Fund. The Portfolio earns interest on the amount invested in Cash Collateral Fund but it must pay (and at times receive from) the broker a loan rebate fee computed as a varying percentage of the collateral received. Income earned by the Portfolio from its investment in Cash Collateral Fund, prior to rebates and fees, for the year ended October 31, 2012 amounted to $12,399. At October 31, 2012, the value of the securities loaned and the value of the collateral received amounted to $15,054,180 and $15,016,250, respectively. In the event of counterparty default, the Portfolio is subject to potential loss if it is delayed or prevented from exercising its right to dispose of the collateral. The Portfolio bears risk in the event that invested collateral is not sufficient to meet its obligations due on loans.
7 Fair Value Measurements
Under generally accepted accounting principles for fair value measurements, a three-tier hierarchy to prioritize the assumptions, referred to as inputs, is used in valuation techniques to measure fair value. The three-tier hierarchy of inputs is summarized in the three broad levels listed below.
| Ÿ | | Level 1 – quoted prices in active markets for identical investments |
| Ÿ | | Level 2 – other significant observable inputs (including quoted prices for similar investments, interest rates, prepayment speeds, credit risk, etc.) |
| Ÿ | | Level 3 – significant unobservable inputs (including a fund’s own assumptions in determining the fair value of investments) |
In cases where the inputs used to measure fair value fall in different levels of the fair value hierarchy, the level disclosed is determined based on the lowest level input that is significant to the fair value measurement in its entirety. The inputs or methodology used for valuing securities are not necessarily an indication of the risk associated with investing in those securities.
Tax-Managed Value Portfolio
October 31, 2012
Notes to Financial Statements — continued
At October 31, 2012, the hierarchy of inputs used in valuing the Portfolio’s investments, which are carried at value, were as follows:
| | | | | | | | | | | | | | | | |
| Asset Description | | Level 1 | | | Level 2 | | | Level 3 | | | Total | |
| | | | |
Common Stocks | | | | | | | | | | | | | | | | |
Consumer Discretionary | | $ | 55,542,150 | | | $ | — | | | $ | — | | | $ | 55,542,150 | |
Consumer Staples | | | 52,376,485 | | | | 9,205,785 | | | | — | | | | 61,582,270 | |
Energy | | | 141,766,917 | | | | — | | | | — | | | | 141,766,917 | |
Financials | | | 217,684,257 | | | | — | | | | — | | | | 217,684,257 | |
Health Care | | | 112,533,737 | | | | — | | | | — | | | | 112,533,737 | |
Industrials | | | 85,474,376 | | | | — | | | | — | | | | 85,474,376 | |
Information Technology | | | 65,389,329 | | | | — | | | | — | | | | 65,389,329 | |
Materials | | | 26,442,500 | | | | — | | | | — | | | | 26,442,500 | |
Telecommunication Services | | | 29,861,800 | | | | — | | | | — | | | | 29,861,800 | |
Utilities | | | 38,315,650 | | | | 10,150,046 | | | | — | | | | 48,465,696 | |
| | | | |
Total Common Stocks | | $ | 825,387,201 | | | $ | 19,355,831 | * | | $ | — | | | $ | 844,743,032 | |
| | | | |
Short-Term Investments | | $ | — | | | $ | 16,719,030 | | | $ | — | | | $ | 16,719,030 | |
| | | | |
Total Investments | | $ | 825,387,201 | | | $ | 36,074,861 | | | $ | — | | | $ | 861,462,062 | |
| * | Includes foreign equity securities whose values were adjusted to reflect market trading of comparable securities or other correlated instruments that occurred after the close of trading in their applicable foreign markets. |
The Portfolio held no investments or other financial instruments as of October 31, 2011 whose fair value was determined using Level 3 inputs. At October 31, 2012, there were no investments transferred between Level 1 and Level 2 during the year then ended.
Tax-Managed Value Portfolio
October 31, 2012
Report of Independent Registered Public Accounting Firm
To the Trustees and Investors of Tax-Managed Value Portfolio:
We have audited the accompanying statement of assets and liabilities of Tax-Managed Value Portfolio (the “Portfolio”), including the portfolio of investments, as of October 31, 2012, and the related statement of operations for the year then ended, the statements of changes in net assets for each of the two years in the period then ended, and the supplementary data for each of the five years in the period then ended. These financial statements and supplementary data are the responsibility of the Portfolio’s management. Our responsibility is to express an opinion on these financial statements and supplementary data based on our audits.
We conducted our audits in accordance with the standards of the Public Company Accounting Oversight Board (United States). Those standards require that we plan and perform the audit to obtain reasonable assurance about whether the financial statements and supplementary data are free of material misstatement. The Portfolio is not required to have, nor were we engaged to perform, an audit of its internal control over financial reporting. Our audits included consideration of internal control over financial reporting as a basis for designing audit procedures that are appropriate in the circumstances, but not for the purpose of expressing an opinion on the effectiveness of the Portfolio’s internal control over financial reporting. Accordingly, we express no such opinion. An audit also includes examining, on a test basis, evidence supporting the amounts and disclosures in the financial statements, assessing the accounting principles used and significant estimates made by management, as well as evaluating the overall financial statement presentation. Our procedures included confirmation of securities owned as of October 31, 2012, by correspondence with the custodian. We believe that our audits provide a reasonable basis for our opinion.
In our opinion, such financial statements and supplementary data referred to above present fairly, in all material respects, the financial position of Tax-Managed Value Portfolio as of October 31, 2012, the results of its operations for the year then ended, the changes in its net assets for each of the two years in the period then ended, and the supplementary data for each of the five years in the period then ended, in conformity with accounting principles generally accepted in the United States of America.
DELOITTE & TOUCHE LLP
Boston, Massachusetts
December 17, 2012
Eaton Vance
Tax-Managed Value Fund
October 31, 2012
Management and Organization
Fund Management. The Trustees of Eaton Vance Mutual Funds Trust (the Trust) and Tax-Managed Value Portfolio (the Portfolio) are responsible for the overall management and supervision of the Trust’s and Portfolio’s affairs. The Trustees and officers of the Trust and the Portfolio are listed below. Except as indicated, each individual has held the office shown or other offices in the same company for the last five years. Trustees and officers of the Trust and the Portfolio hold indefinite terms of office. The “Noninterested Trustees” consist of those Trustees who are not “interested persons” of the Trust and the Portfolio, as that term is defined under the 1940 Act. The business address of each Trustee and officer is Two International Place, Boston, Massachusetts 02110. As used below, “EVC” refers to Eaton Vance Corp., “EV” refers to Eaton Vance, Inc., “EVM” refers to Eaton Vance Management, “BMR” refers to Boston Management and Research and “EVD” refers to Eaton Vance Distributors, Inc. EVC and EV are the corporate parent and trustee, respectively, of EVM and BMR. EVD is the Fund’s principal underwriter, the Portfolio’s placement agent and a wholly-owned subsidiary of EVC. Each officer affiliated with Eaton Vance may hold a position with other Eaton Vance affiliates that is comparable to his or her position with EVM listed below. Each Trustee oversees 187 portfolios in the Eaton Vance Complex (including all master and feeder funds in a master feeder structure). Each officer serves as an officer of certain other Eaton Vance funds. Each Trustee and officer serves until his or her successor is elected.
| | | | | | |
| Name and Year of Birth | | Position(s)
with the
Trust and the
Portfolio | | Length of
Service | | Principal Occupation(s) and Directorships
During Past Five Years and Other Relevant Experience |
Interested Trustee |
| | | |
Thomas E. Faust Jr. 1958 | | Trustee | | Since 2007 | | Chairman, Chief Executive Officer and President of EVC, Director and President of EV, Chief Executive Officer and President of EVM and BMR, and Director of EVD. Trustee and/or officer of 187 registered investment companies. Mr. Faust is an interested person because of his positions with EVM, BMR, EVD, EVC and EV, which are affiliates of the Trust and the Portfolio. Directorships in the Last Five Years.(1) Director of EVC and Hexavest Inc. |
| | | |
| | | | | | |
Noninterested Trustees |
| | | |
Scott E. Eston 1956 | | Trustee | | Since 2011 | | Private investor. Formerly held various positions at Grantham, Mayo, Van Otterloo and Co., L.L.C. (investment management firm) (1997-2009), including Chief Operating Officer (2002-2009), Chief Financial Officer (1997-2009) and Chairman of the Executive Committee (2002-2008); President and Principal Executive Officer, GMO Trust (open-end registered investment company) (2006-2009). Former Partner, Coopers and Lybrand L.L.P. (now PricewaterhouseCoopers) (public accounting firm) (1987-1997). Directorships in the Last Five Years. None. |
| | | |
Benjamin C. Esty 1963 | | Trustee | | Since 2005 | | Roy and Elizabeth Simmons Professor of Business Administration and Finance Unit Head, Harvard University Graduate School of Business Administration. Directorships in the Last Five Years.(1) None. |
| | | |
Allen R. Freedman 1940 | | Trustee | | Since 2007 | | Private Investor. Former Chairman (2002-2004) and a Director (1983-2004) of Systems & Computer Technology Corp. (provider of software to higher education). Formerly, a Director of Loring Ward International (fund distributor) (2005-2007). Former Chairman and a Director of Indus International, Inc. (provider of enterprise management software to the power generating industry) (2005-2007). Former Chief Executive Officer of Assurant, Inc. (insurance provider) (1979-2000). Directorships in the Last Five Years.(1) Director of Stonemor Partners, L.P. (owner and operator of cemeteries). Formerly, Director of Assurant, Inc. (insurance provider) (1979-2011). |
| | | |
William H. Park 1947 | | Trustee | | Since 2003 | | Consultant and private investor. Formerly, Chief Financial Officer, Aveon Group L.P. (investment management firm) (2010-2011). Formerly, Vice Chairman, Commercial Industrial Finance Corp. (specialty finance company) (2006-2010). Formerly, President and Chief Executive Officer, Prizm Capital Management, LLC (investment management firm) (2002-2005). Formerly, Executive Vice President and Chief Financial Officer, United Asset Management Corporation (investment management firm) (1982-2001). Formerly, Senior Manager, Price Waterhouse (now PricewaterhouseCoopers) (an independent registered public accounting firm) (1972-1981). Directorships in the Last Five Years.(1) None. |
Eaton Vance
Tax-Managed Value Fund
October 31, 2012
Management and Organization — continued
| | | | | | |
| Name and Year of Birth | | Position(s)
with the
Trust and the
Portfolio | | Length of
Service | | Principal Occupation(s) and Directorships
During Past Five Years and Other Relevant Experience |
Noninterested Trustees (continued) |
| | | |
Ronald A. Pearlman 1940 | | Trustee | | Since 2003 | | Professor of Law, Georgetown University Law Center. Formerly, Deputy Assistant Secretary (Tax Policy) and Assistant Secretary (Tax Policy), U.S. Department of the Treasury (1983-1985). Formerly, Chief of Staff, Joint Committee on Taxation, U.S. Congress (1988-1990). Directorships in the Last Five Years.(1) None. |
| | | |
Helen Frame Peters 1948 | | Trustee | | Since 2008 | | Professor of Finance, Carroll School of Management, Boston College. Formerly, Dean, Carroll School of Management, Boston College (2000-2002). Formerly, Chief Investment Officer, Fixed Income, Scudder Kemper Investments (investment management firm) (1998-1999). Formerly, Chief Investment Officer, Equity and Fixed Income, Colonial Management Associates (investment management firm) (1991-1998). Directorships in the Last Five Years.(1) Formerly, Director of BJ’s Wholesale Club, Inc. (wholesale club retailer) (2004-2011). Formerly, Trustee of SPDR Index Shares Funds and SPDR Series Trust (exchange traded funds) (2000-2009). Formerly, Director of Federal Home Loan Bank of Boston (a bank for banks) (2007-2009). |
| | | |
Lynn A. Stout 1957 | | Trustee | | Of the Trust since 1998 and of the Portfolio since 2001 | | Distinguished Professor of Corporate and Business Law, Jack G. Clarke Business Law Institute, Cornell University Law School. Formerly, the Paul Hastings Professor of Corporate and Securities Law (2006-2012) and Professor of Law (2001-2006), University of California at Los Angeles School of Law. Directorships in the Last Five Years.(1) None. |
| | | |
Harriett Tee Taggart 1948 | | Trustee | | Since 2011 | | Managing Director, Taggart Associates (a professional practice firm). Formerly, Partner and Senior Vice President, Wellington Management Company, LLP (investment management firm) (1983-2006). Directorships in the Last Five Years. Director of Albemarle Corporation (chemicals manufacturer) (since 2007) and The Hanover Group (specialty property and casualty insurance company) (since 2009). Formerly, Director of Lubrizol Corporation (specialty chemicals) (2007-2011). |
| | | |
Ralph F. Verni 1943 | | Chairman of the Board and Trustee | | Chairman of the Board since 2007 and Trustee since 2005 | | Consultant and private investor. Formerly, Chief Investment Officer (1982-1992), Chief Financial Officer (1988-1990) and Director (1982-1992), New England Life. Formerly, Chairperson, New England Mutual Funds (1982-1992). Formerly, President and Chief Executive Officer, State Street Management & Research (1992-2000). Formerly, Chairperson, State Street Research Mutual Funds (1992-2000). Formerly, Director, W.P. Carey, LLC (1998-2004) and First Pioneer Farm Credit Corp. (2002-2006). Directorships in the Last Five Years.(1) None. |
| | | |
| | | | | | |
Principal Officers who are not Trustees |
| Name and Year of Birth | | Position(s)
with the
Trust and the
Portfolio | | Length of Service | | Principal Occupation(s) During Past Five Years |
Duncan W. Richardson 1957 | | President of the Trust and Vice President of the Portfolio | | Since 2011 | | Director of EVC and Executive Vice President and Chief Equity Investment Officer of EVC, EVM and BMR. |
| | | |
Michael R. Mach 1947 | | President of the Portfolio | | Since 2011 | | Vice President of EVM and BMR. |
| | | |
Payson F. Swaffield 1956 | | Vice President of the Trust | | Since 2011 | | Vice President and Chief Income Investment Officer of EVM and BMR. |
| | | |
Barbara E. Campbell 1957 | | Treasurer | | Of the Trust since 2005 and of the Portfolio since 2008 | | Vice President of EVM and BMR. |
Eaton Vance
Tax-Managed Value Fund
October 31, 2012
Management and Organization — continued
| | | | | | |
| Name and Year of Birth | | Position(s)
with the
Trust and the
Portfolio | | Length of Service | | Principal Occupation(s) During Past Five Years |
Principal Officers who are not Trustees (continued) |
| | | |
Maureen A. Gemma 1960 | | Vice President, Secretary and Chief Legal Officer | | Vice President since 2011, Secretary since 2007 and Chief Legal Officer since 2008 | | Vice President of EVM and BMR. |
| | | |
Paul M. O’Neil 1953 | | Chief Compliance Officer | | Since 2004 | | Vice President of EVM and BMR. |
| (1) | During their respective tenures, the Trustees (except Mr. Eston and Ms. Taggart) also served as trustees of one or more of the following Eaton Vance funds (which operated in the years noted): Eaton Vance Credit Opportunities Fund (launched in 2005 and terminated in 2010); Eaton Vance Insured Florida Plus Municipal Bond Fund (launched in 2002 and terminated in 2009); and Eaton Vance National Municipal Income Trust (launched in 1998 and terminated in 2009). |
The SAI for the Fund includes additional information about the Trustees and officers of the Fund and the Portfolio and can be obtained without charge on Eaton Vance’s website at www.eatonvance.com or by calling 1-800-262-1122.
Eaton Vance Funds
IMPORTANT NOTICES
Privacy. The Eaton Vance organization is committed to ensuring your financial privacy. Each of the financial institutions identified below has in effect the following policy (“Privacy Policy”) with respect to nonpublic personal information about its customers:
| Ÿ | | Only such information received from you, through application forms or otherwise, and information about your Eaton Vance fund transactions will be collected. This may include information such as name, address, social security number, tax status, account balances and transactions. |
| Ÿ | | None of such information about you (or former customers) will be disclosed to anyone, except as permitted by law (which includes disclosure to employees necessary to service your account). In the normal course of servicing a customer’s account, Eaton Vance may share information with unaffiliated third parties that perform various required services such as transfer agents, custodians and broker-dealers. |
| Ÿ | | Policies and procedures (including physical, electronic and procedural safeguards) are in place that are designed to protect the confidentiality of such information. |
| Ÿ | | We reserve the right to change our Privacy Policy at any time upon proper notification to you. Customers may want to review our Privacy Policy periodically for changes by accessing the link on our homepage: www.eatonvance.com. |
Our pledge of privacy applies to the following entities within the Eaton Vance organization: the Eaton Vance Family of Funds, Eaton Vance Management, Eaton Vance Investment Counsel, Eaton Vance Distributors, Inc., Eaton Vance Trust Company, Eaton Vance Management’s Real Estate Investment Group and Boston Management and Research. In addition, our Privacy Policy applies only to those Eaton Vance customers who are individuals and who have a direct relationship with us. If a customer’s account (i.e., fund shares) is held in the name of a third-party financial advisor/broker-dealer, it is likely that only such advisor’s privacy policies apply to the customer. This notice supersedes all previously issued privacy disclosures. For more information about Eaton Vance’s Privacy Policy, please call 1-800-262-1122.
Delivery of Shareholder Documents. The Securities and Exchange Commission (SEC) permits funds to deliver only one copy of shareholder documents, including prospectuses, proxy statements and shareholder reports, to fund investors with multiple accounts at the same residential or post office box address. This practice is often called “householding” and it helps eliminate duplicate mailings to shareholders. Eaton Vance, or your financial advisor, may household the mailing of your documents indefinitely unless you instruct Eaton Vance, or your financial advisor, otherwise. If you would prefer that your Eaton Vance documents not be householded, please contact Eaton Vance at 1-800-262-1122, or contact your financial advisor. Your instructions that householding not apply to delivery of your Eaton Vance documents will be effective within 30 days of receipt by Eaton Vance or your financial advisor.
Portfolio Holdings. Each Eaton Vance Fund and its underlying Portfolio(s) (if applicable) will file a schedule of portfolio holdings on Form N-Q with the SEC for the first and third quarters of each fiscal year. The Form N-Q will be available on the Eaton Vance website at www.eatonvance.com, by calling Eaton Vance at 1-800-262-1122 or in the EDGAR database on the SEC’s website at www.sec.gov. Form N-Q may also be reviewed and copied at the SEC’s public reference room in Washington, D.C. (call 1-800-732-0330 for information on the operation of the public reference room).
Proxy Voting. From time to time, funds are required to vote proxies related to the securities held by the funds. The Eaton Vance Funds or their underlying Portfolios (if applicable) vote proxies according to a set of policies and procedures approved by the Funds’ and Portfolios’ Boards. You may obtain a description of these policies and procedures and information on how the Funds or Portfolios voted proxies relating to portfolio securities during the most recent 12-month period ended June 30, without charge, upon request, by calling 1-800-262-1122 and by accessing the SEC’s website at www.sec.gov.
This Page Intentionally Left Blank
This Page Intentionally Left Blank
Investment Adviser of Tax-Managed Value Portfolio
Boston Management and Research
Two International Place
Boston, MA 02110
Administrator of Eaton Vance Tax-Managed Value Fund
Eaton Vance Management
Two International Place
Boston, MA 02110
Principal Underwriter*
Eaton Vance Distributors, Inc.
Two International Place
Boston, MA 02110
(617) 482-8260
Custodian
State Street Bank and Trust Company
200 Clarendon Street
Boston, MA 02116
Transfer Agent
BNY Mellon Investment Servicing (US) Inc.
Attn: Eaton Vance Funds
P.O. Box 9653
Providence, RI 02940-9653
(800) 262-1122
Independent Registered Public Accounting Firm
Deloitte & Touche LLP
200 Berkeley Street
Boston, MA 02116-5022
Fund Offices
Two International Place
Boston, MA 02110
| * | FINRA BrokerCheck. Investors may check the background of their Investment Professional by contacting the Financial Industry Regulatory Authority (FINRA). FINRA BrokerCheck is a free tool to help investors check the professional background of current and former FINRA-registered securities firms and brokers. FINRA BrokerCheck is available by calling 1-800-289-9999 and at www.FINRA.org. The FINRA BrokerCheck brochure describing this program is available to investors at www.FINRA.org. |
501-12/12 TVSRC
| | |
Eaton Vance Floating-Rate Advantage Fund Annual Report October 31, 2012 | | 
|

Fund shares are not insured by the FDIC and are not deposits or other obligations of, or guaranteed by, any depository institution. Shares are subject to investment risks, including possible loss of principal invested.
This report must be preceded or accompanied by a current summary prospectus or prospectus. Before investing, investors should consider carefully the investment objective, risks, and charges and expenses of a mutual fund. This and other important information is contained in the summary prospectus and prospectus, which can be obtained from a financial advisor. Prospective investors should read the prospectus carefully before investing. For further information, please call 1-800-262-1122.
Annual Report October 31, 2012
Eaton Vance
Floating-Rate Advantage Fund
Table of Contents
| | | | |
Management’s Discussion of Fund Performance | | | 2 | |
| |
Performance | | | 3 | |
| |
Fund Profile | | | 4 | |
| |
Endnotes and Additional Disclosures | | | 5 | |
| |
Fund Expenses | | | 6 | |
| |
Financial Statements | | | 7 | |
| |
Report of Independent Registered Public Accounting Firm | | | 19 and 49 | |
| |
Federal Tax Information | | | 20 | |
| |
Management and Organization | | | 50 | |
| |
Important Notices | | | 53 | |
Eaton Vance
Floating-Rate Advantage Fund
October 31, 2012
Management’s Discussion of Fund Performance1
Economic and Market Conditions
The U.S. floating-rate loan market generated solid results for the 12-month period ended October 31, 2012, as measured by the 8.48% return of the S&P/LSTA Leveraged Loan Index,2 a broad barometer of the asset class. Returns of the Index reflected an increase in loan prices, plus investment income.
Throughout the past 12 months, the floating-rate market exhibited resilience amid low U.S. economic growth and uncertainty regarding U.S. fiscal policy. This resilience was due to favorable market technical and fundamental conditions. The net supply of floating-rate loans was moderate, as loan repayments by issuers helped offset new issue supply coming to market. At the same time, demand strengthened. Improved economic data and the U.S. Federal Reserve’s pledge to keep interest rates low appeared to have fueled investors’ appetite for higher-yielding alternatives to government bonds. Other investors turned to floating-rate loans for protection against potentially rising interest rates. In the institutional market, buying by pension funds, hedge funds, structured vehicles, and other institutional investors, such as value crossover strategies, also expanded as the period progressed. For the period overall, the modest growth in the overall supply of loans was easily absorbed due to widespread investor demand.
In terms of issuer fundamentals, improving corporate balance sheets and better-than-expected earnings growth also helped bolster loans. Furthermore, the default rate in the market remained well below longer-term averages, ending October 31, 2012 at 1.1% by principal amount on a last-12-months basis, according to S&P Leveraged Commentary & Data (LCD).
Fund Performance
For the fiscal year ended October 31, 2012, Eaton Vance Floating-Rate Advantage Fund’s (the Fund) Class A shares at net asset value (NAV) had a total return of 9.31%. By comparison, the Fund’s benchmark, the S&P/LSTA Leveraged Loan Index (the Index), gained 8.48% during the period.
Contributing to relative performance versus the Index was the Fund’s use of leverage5 because it amplified the Fund’s positive performance. The Index does not use leverage.
Underweight exposures to utilities and telecommunications helped bolster relative results versus the Index, as these segments lagged the broad loan market.
The Fund’s underweight to the lower-quality segment of the market detracted from performance relative to the Index. Specifically, the Fund’s holdings were biased toward higher-quality BB- and B-rated8 loans. At the same time, the Fund had an underweight to CCC-rated loans. For the year, BB-rated loans in the Index returned 6.60%, B-rated loans in the Index gained 10.12% and CCC-rated loans in the Index rose 9.93%. Within the BB- and B-rated space, the Fund had a more pronounced overweight to the higher-rated BB-ratings tier, providing a further drag on relative results versus the Index.
In terms of industry allocation, underweight exposure to publishing and financial intermediaries — which outperformed the broad market — and overweight exposure to the leisure goods/activities/movies segment — which underperformed the broad market — also were a drag on performance relative to the Index.
See Endnotes and Additional Disclosures in this report.
Past performance is no guarantee of future results. Returns are historical and are calculated by determining the percentage change in net asset value (NAV) or offering price (as applicable) with all distributions reinvested. Investment return and principal value will fluctuate so that shares, when redeemed, may be worth more or less than their original cost. Performance less than one year is cumulative. Performance is for the stated time period only; due to market volatility, the Fund’s current performance may be lower or higher than quoted. Returns are before taxes unless otherwise noted. For performance as of the most recent month end, please refer to www.eatonvance.com.
Eaton Vance
Floating-Rate Advantage Fund
October 31, 2012
Performance2,3
Portfolio Managers Scott H. Page, CFA and Craig P. Russ
| | | | | | | | | | | | | | | | | | | | |
| % Average Annual Total Returns | | Inception Date | | | One Year | | | Five Years | | | Ten Years | | | Since Inception | |
Advisers Class at NAV | | | 03/15/2008 | | | | 9.31 | % | | | — | | | | — | | | | 7.86 | % |
Class A at NAV | | | 03/17/2008 | | | | 9.31 | | | | — | | | | — | | | | 7.86 | |
Class A with 2.25% Maximum Sales Charge | | | — | | | | 6.81 | | | | — | | | | — | | | | 7.34 | |
Class B at NAV | | | 08/04/1989 | | | | 9.03 | | | | 5.13 | % | | | 5.26 | % | | | — | |
Class B with 3% Maximum Sales Charge | | | — | | | | 6.03 | | | | 5.13 | | | | 5.26 | | | | — | |
Class C at NAV | | | 03/15/2008 | | | | 8.80 | | | | — | | | | — | | | | 7.34 | |
Class C with 1% Maximum Sales Charge | | | — | | | | 7.80 | | | | — | | | | — | | | | 7.34 | |
Class I at NAV | | | 03/15/2008 | | | | 9.59 | | | | — | | | | — | | | | 8.13 | |
S&P/LSTA Leveraged Loan Index | | | 03/15/2008 | | | | 8.48 | % | | | — | | | | — | | | | 7.37 | % |
| | | | | |
| | | | | | | | | | | | | | | | | | | | |
| % Total Annual Operating Expense Ratios4 | | Advisers Class | | | Class A | | | Class B | | | Class C | | | Class I | |
Gross | | | 1.49 | % | | | 1.49 | % | | | 1.84 | % | | | 1.99 | % | | | 1.24 | % |
Net | | | 1.10 | | | | 1.10 | | | | 1.45 | | | | 1.60 | | | | 0.85 | |
| | | | | |
| | | | | | | | | | | | | | | | | | | | |
| % Total Leverage5 | | | | | | | | | | | | | | | |
Borrowings | | | | | | | | | | | | | | | | | | | 11.59 | % |
Performance of $250,000
This graph shows the change in value of a hypothetical investment of $250,000 in Class I of the Fund for the period indicated. For comparison, the same investment is shown in the indicated index.
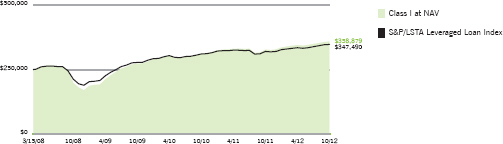
| | | | | | | | |
| Performance of Investment | | Amount Invested | | Period Beginning | | At NAV | | With Maximum Sales Charge |
Advisers Class | | $10,000 | | 03/15/2008 | | $14,195 | | N.A. |
Class A | | $10,000 | | 03/17/2008 | | $14,195 | | $13,876 |
Class B | | $10,000 | | 10/31/2002 | | $16,701 | | N.A. |
Class C | | $10,000 | | 03/15/2008 | | $13,881 | | N.A. |
See Endnotes and Additional Disclosures in this report.
Past performance is no guarantee of future results. Returns are historical and are calculated by determining the percentage change in net asset value (NAV) or offering price (as applicable) with all distributions reinvested. Investment return and principal value will fluctuate so that shares, when redeemed, may be worth more or less than their original cost. Performance less than one year is cumulative. Performance is for the stated time period only; due to market volatility, the Fund’s current performance may be lower or higher than quoted. Returns are before taxes unless otherwise noted. For performance as of the most recent month end, please refer to www.eatonvance.com
Eaton Vance
Floating-Rate Advantage Fund
October 31, 2012
Fund Profile6
Top 10 Holdings (% of total investments)7
| | | | |
| |
Intelsat Jackson Holdings Ltd. | | | 1.2 | % |
Alliance Boots Holdings Limited | | | 1.1 | |
Asurion LLC | | | 1.1 | |
Infor (US), Inc. | | | 1.1 | |
Hertz Corporation (The) | | | 1.0 | |
Rite Aid Corporation | | | 1.0 | |
SunGard Data Systems, Inc. | | | 0.9 | |
Ineos US Finance LLC | | | 0.9 | |
HCA, Inc. | | | 0.9 | |
NBTY, Inc. | | | 0.8 | |
| | | | | |
Total | | | 10.0 | % |
| | | | | |
Credit Quality (% of loan holdings)8
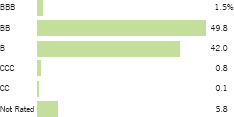
Top 10 Sectors (% of total investments)7
| | | | |
| |
Health Care | | | 13.0 | % |
Business Equipment and Services | | | 8.8 | |
Electronics/Electrical | | | 6.2 | |
Automotive | | | 4.5 | |
Food Service | | | 4.2 | |
Telecommunications | | | 4.1 | |
Chemicals and Plastics | | | 4.1 | |
Leisure Goods/Activities/Movies | | | 3.8 | |
Publishing | | | 3.7 | |
Insurance | | | 3.6 | |
| | | | | |
Total | | | 56.0 | % |
| | | | | |
See Endnotes and Additional Disclosures in this report.
Eaton Vance
Floating-Rate Advantage Fund
October 31, 2012
Endnotes and Additional Disclosures
| 1 | The views expressed in this report are those of the portfolio manager(s) and are current only through the date stated at the top of this page. These views are subject to change at any time based upon market or other conditions, and Eaton Vance and the Fund(s) disclaim any responsibility to update such views. These views may not be relied upon as investment advice and, because investment decisions are based on many factors, may not be relied upon as an indication of trading intent on behalf of any Eaton Vance fund. This commentary may contain statements that are not historical facts, referred to as “forward looking statements”. The Fund’s actual future results may differ significantly from those stated in any forward looking statement, depending on factors such as changes in securities or financial markets or general economic conditions, the volume of sales and purchases of Fund shares, the continuation of investment advisory, administrative and service contracts, and other risks discussed from time to time in the Fund’s filings with the Securities and Exchange Commission. |
| 2 | S&P/LSTA Leveraged Loan Index is an unmanaged index of the institutional leveraged loan market. Unless otherwise stated, index returns do not reflect the effect of any applicable sales charges, commissions, expenses, taxes or leverage, as applicable. It is not possible to invest directly in an index. |
| 3 | Total Returns at NAV do not include applicable sales charges. If sales charges were deducted, the returns would be lower. Total Returns shown with maximum sales charge reflect the stated maximum sales charge. Unless otherwise stated, performance does not reflect the deduction of taxes on Fund distributions or redemptions of Fund shares. Performance for periods prior to 3/15/08 reflects performance of Eaton Vance Prime Rate Reserves, the Fund’s predecessor. |
| 4 | Total Annual Fund Operating Expense ratio is as stated in the Fund’s most recent prospectus. Net expense ratio excludes interest expense on borrowings. |
| 5 | Total leverage is shown as a percentage of the Fund’s aggregate net assets plus borrowings outstanding. The Fund employs leverage through borrowings. Use of leverage creates an opportunity for income, but creates risks including greater volatility of NAV. The cost of borrowings rises and falls with changes in short-term interest rates. The Fund may be required to maintain prescribed asset coverage for its borrowings and may be required to reduce its borrowings if Fund asset values decline. |
| 6 | Fund invests in an affiliated investment company (Portfolio) with the same objective(s) and policies as the Fund. References to investments are to the Portfolio’s holdings. |
| 7 | Excludes cash and cash equivalents. |
| 8 | Ratings are based on Moody’s, S&P or Fitch, as applicable. Credit ratings are based largely on the rating agency’s investment analysis at the time of rating and the rating assigned to any particular security is not necessarily a reflection of the issuer’s current financial condition. The rating assigned to a security by a rating agency does not necessarily reflect its assessment of the volatility of a security’s market value or of the liquidity of an investment in the security. If securities are rated differently by the rating agencies, the higher rating is applied. Ratings of BBB or higher by Standard and Poor’s or Fitch (Baa or higher by Moody’s) are considered to be investment grade quality. |
| | Fund profile subject to change due to active management. |
Eaton Vance
Floating-Rate Advantage Fund
October 31, 2012
Fund Expenses
Example: As a Fund shareholder, you incur two types of costs: (1) transaction costs, including sales charges (loads) on purchases and redemption fees (if applicable); and (2) ongoing costs, including management fees; distribution and/or service fees; and other Fund expenses. This Example is intended to help you understand your ongoing costs (in dollars) of Fund investing and to compare these costs with the ongoing costs of investing in other mutual funds. The Example is based on an investment of $1,000 invested at the beginning of the period and held for the entire period (May 1, 2012 – October 31, 2012).
Actual Expenses: The first section of the table below provides information about actual account values and actual expenses. You may use the information in this section, together with the amount you invested, to estimate the expenses that you paid over the period. Simply divide your account value by $1,000 (for example, an $8,600 account value divided by $1,000 = 8.6), then multiply the result by the number in the first section under the heading entitled “Expenses Paid During Period” to estimate the expenses you paid on your account during this period.
Hypothetical Example for Comparison Purposes: The second section of the table below provides information about hypothetical account values and hypothetical expenses based on the actual Fund expense ratio and an assumed rate of return of 5% per year (before expenses), which is not the actual Fund return. The hypothetical account values and expenses may not be used to estimate the actual ending account balance or expenses you paid for the period. You may use this information to compare the ongoing costs of investing in your Fund and other funds. To do so, compare this 5% hypothetical example with the 5% hypothetical examples that appear in the shareholder reports of the other funds.
Please note that the expenses shown in the table are meant to highlight your ongoing costs only and do not reflect any transactional costs, such as sales charges (loads) or redemption fees (if applicable). Therefore, the second section of the table is useful in comparing ongoing costs only, and will not help you determine the relative total costs of owning different funds. In addition, if these transactional costs were included, your costs would be higher.
| | | | | | | | | | | | | | | | |
| | | Beginning
Account Value (5/1/12) | | | Ending
Account Value (10/31/12) | | | Expenses Paid
During Period* (5/1/12 – 10/31/12) | | | Annualized
Expense Ratio | |
| | | | |
| | | | | | | | | | | | | | | | |
Actual | |
Advisers Class | | $ | 1,000.00 | | | $ | 1,038.40 | | | $ | 6.87 | | | | 1.34 | % |
Class A | | $ | 1,000.00 | | | $ | 1,038.40 | | | $ | 6.81 | | | | 1.33 | % |
Class B | | $ | 1,000.00 | | | $ | 1,036.60 | | | $ | 8.65 | | | | 1.69 | % |
Class C | | $ | 1,000.00 | | | $ | 1,035.90 | | | $ | 9.37 | | | | 1.83 | % |
Class I | | $ | 1,000.00 | | | $ | 1,039.80 | | | $ | 5.54 | | | | 1.08 | % |
| | | | | | | | | | | | | | | | | |
| | | | |
| | | | | | | | | | | | | | | | |
Hypothetical | | | | | | | | | | | | | | | | |
(5% return per year before expenses) | | | | | | | | | | | | | | | | |
Advisers Class | | $ | 1,000.00 | | | $ | 1,018.40 | | | $ | 6.80 | | | | 1.34 | % |
Class A | | $ | 1,000.00 | | | $ | 1,018.50 | | | $ | 6.75 | | | | 1.33 | % |
Class B | | $ | 1,000.00 | | | $ | 1,016.60 | | | $ | 8.57 | | | | 1.69 | % |
Class C | | $ | 1,000.00 | | | $ | 1,015.90 | | | $ | 9.27 | | | | 1.83 | % |
Class I | | $ | 1,000.00 | | | $ | 1,019.70 | | | $ | 5.48 | | | | 1.08 | % |
| * | Expenses are equal to the Fund’s annualized expense ratio for the indicated Class, multiplied by the average account value over the period, multiplied by 184/366 (to reflect the one-half year period). The Example assumes that the $1,000 was invested at the net asset value per share determined at the close of business on April 30, 2012. The Example reflects the expenses of both the Fund and the Portfolio. |
Eaton Vance
Floating-Rate Advantage Fund
October 31, 2012
Statement of Assets and Liabilities
| | | | |
| Assets | | October 31, 2012 | |
Investment in Senior Debt Portfolio, at value (identified cost, $3,120,473,163) | | $ | 3,141,559,797 | |
Receivable for Fund shares sold | | | 19,769,815 | |
Total assets | | $ | 3,161,329,612 | |
| |
| Liabilities | | | | |
Payable for Fund shares redeemed | | $ | 5,977,443 | |
Distributions payable | | | 5,652,974 | |
Payable to affiliates: | | | | |
Distribution and service fees | | | 702,524 | |
Administration fee | | | 257,623 | |
Trustees’ fees | | | 42 | |
Accrued expenses | | | 578,897 | |
Total liabilities | | $ | 13,169,503 | |
Net Assets | | $ | 3,148,160,109 | |
| |
| Sources of Net Assets | | | | |
Paid-in capital | | $ | 3,340,266,864 | |
Accumulated net realized loss from Portfolio | | | (212,038,360 | ) |
Accumulated distributions in excess of net investment income | | | (1,155,029 | ) |
Net unrealized appreciation from Portfolio | | | 21,086,634 | |
Total | | $ | 3,148,160,109 | |
| |
| Advisers Class Shares | | | | |
Net Assets | | $ | 65,257,546 | |
Shares Outstanding | | | 5,899,657 | |
Net Asset Value, Offering Price and Redemption Price Per Share | | | | |
(net assets ÷ shares of beneficial interest outstanding) | | $ | 11.06 | |
| |
| Class A Shares | | | | |
Net Assets | | $ | 959,178,549 | |
Shares Outstanding | | | 86,688,001 | |
Net Asset Value and Redemption Price Per Share | | | | |
(net assets ÷ shares of beneficial interest outstanding) | | $ | 11.06 | |
Maximum Offering Price Per Share | | | | |
(100 ÷ 97.75 of net asset value per share) | | $ | 11.31 | |
| |
| Class B Shares | | | | |
Net Assets | | $ | 55,277,240 | |
Shares Outstanding | | | 4,985,047 | |
Net Asset Value and Offering Price Per Share* | | | | |
(net assets ÷ shares of beneficial interest outstanding) | | $ | 11.09 | |
| |
| Class C Shares | | | | |
Net Assets | | $ | 748,842,813 | |
Shares Outstanding | | | 67,805,449 | |
Net Asset Value and Offering Price Per Share* | | | | |
(net assets ÷ shares of beneficial interest outstanding) | | $ | 11.04 | |
| |
| Class I Shares | | | | |
Net Assets | | $ | 1,319,603,961 | |
Shares Outstanding | | | 119,265,734 | |
Net Asset Value, Offering Price and Redemption Price Per Share | | | | |
(net assets ÷ shares of beneficial interest outstanding) | | $ | 11.06 | |
| On | sales of $100,000 or more, the offering price of Class A shares is reduced. |
| * | Redemption price per share is equal to the net asset value less any applicable contingent deferred sales charge. |
| | | | |
| | 7 | | See Notes to Financial Statements. |
Eaton Vance
Floating-Rate Advantage Fund
October 31, 2012
Statement of Operations
| | | | |
| Investment Income | | Year Ended October 31, 2012 | |
Interest allocated from Portfolio | | $ | 142,165,949 | |
Dividends allocated from Portfolio | | | 2,774,040 | |
Expenses allocated from Portfolio | | | (20,627,856 | ) |
Total investment income from Portfolio | | $ | 124,312,133 | |
| |
| Expenses | | | | |
Administration fee | | $ | 2,167,496 | |
Distribution and service fees | | | | |
Advisers Class | | | 140,009 | |
Class A | | | 1,906,488 | |
Class B | | | 409,596 | |
Class C | | | 4,952,653 | |
Trustees’ fees and expenses | | | 500 | |
Custodian fee | | | 38,135 | |
Transfer and dividend disbursing agent fees | | | 1,725,998 | |
Legal and accounting services | | | 56,569 | |
Printing and postage | | | 271,464 | |
Registration fees | | | 146,715 | |
Miscellaneous | | | 21,823 | |
Total expenses | | $ | 11,837,446 | |
| |
Net investment income | | $ | 112,474,687 | |
| |
| Realized and Unrealized Gain (Loss) from Portfolio | | | | |
Net realized gain (loss) — | | | | |
Investment transactions | | $ | 5,758,802 | |
Swap contracts | | | (277,590 | ) |
Foreign currency and forward foreign currency exchange contract transactions | | | 7,169,589 | |
Net realized gain | | $ | 12,650,801 | |
Change in unrealized appreciation (depreciation) — | | | | |
Investments | | $ | 64,716,371 | |
Swap contracts | | | (251,871 | ) |
Foreign currency and forward foreign currency exchange contracts | | | (3,576,864 | ) |
Net change in unrealized appreciation (depreciation) | | $ | 60,887,636 | |
| |
Net realized and unrealized gain | | $ | 73,538,437 | |
| |
Net increase in net assets from operations | | $ | 186,013,124 | |
| | | | |
| | 8 | | See Notes to Financial Statements. |
Eaton Vance
Floating-Rate Advantage Fund
October 31, 2012
Statements of Changes in Net Assets
| | | | | | | | |
| | | Year Ended October 31, | |
| Increase (Decrease) in Net Assets | | 2012 | | | 2011 | |
From operations — | | | | | | | | |
Net investment income | | $ | 112,474,687 | | | $ | 77,577,876 | |
Net realized gain (loss) from investment transactions, swap contracts, foreign currency and forward foreign currency exchange contract transactions | | | 12,650,801 | | | | (9,337,723 | ) |
Net change in unrealized appreciation (depreciation) from investments, swap contracts, foreign currency and forward foreign currency exchange contracts | | | 60,887,636 | | | | (7,088,636 | ) |
Net increase in net assets from operations | | $ | 186,013,124 | | | $ | 61,151,517 | |
Distributions to shareholders — | | | | | | | | |
From net investment income | | | | | | | | |
Advisers Class | | $ | (2,943,542 | ) | | $ | (2,813,521 | ) |
Class A | | | (40,003,002 | ) | | | (33,936,089 | ) |
Class B | | | (3,327,747 | ) | | | (4,463,234 | ) |
Class C | | | (31,438,127 | ) | | | (28,501,210 | ) |
Class I | | | (34,476,653 | ) | | | (8,898,812 | ) |
Tax return of capital | | | | | | | | |
Advisers Class | | | — | | | | (156,008 | ) |
Class A | | | — | | | | (1,881,735 | ) |
Class B | | | — | | | | (247,484 | ) |
Class C | | | — | | | | (1,580,374 | ) |
Class I | | | — | | | | (493,434 | ) |
Total distributions to shareholders | | $ | (112,189,071 | ) | | $ | (82,971,901 | ) |
Transactions in shares of beneficial interest — | | | | | | | | |
Proceeds from sale of shares | | | | | | | | |
Advisers Class | | $ | 26,774,803 | | | $ | 46,929,101 | |
Class A | | | 325,046,238 | | | | 330,547,619 | |
Class B | | | 2,604,861 | | | | 11,985,939 | |
Class C | | | 162,277,993 | | | | 135,319,504 | |
Class I | | | 1,403,333,687 | | | | 271,293,844 | |
Net asset value of shares issued to shareholders in payment of distributions declared | | | | | | | | |
Advisers Class | | | 2,146,009 | | | | 2,149,861 | |
Class A | | | 31,653,808 | | | | 24,932,344 | |
Class B | | | 2,242,809 | | | | 2,861,184 | |
Class C | | | 25,526,730 | | | | 22,303,151 | |
Class I | | | 7,947,038 | | | | 4,659,962 | |
Cost of shares redeemed | | | | | | | | |
Advisers Class | | | (19,460,563 | ) | | | (35,194,696 | ) |
Class A | | | (152,177,434 | ) | | | (211,406,535 | ) |
Class B | | | (11,903,420 | ) | | | (20,252,915 | ) |
Class C | | | (93,162,413 | ) | | | (106,777,255 | ) |
Class I | | | (282,575,092 | ) | | | (158,777,472 | ) |
Net asset value of shares exchanged | | | | | | | | |
Class A | | | 24,688,811 | | | | 11,323,300 | |
Class B | | | (24,688,811 | ) | | | (11,323,300 | ) |
Redemption fees | | | — | | | | 2,375 | |
Net increase in net assets from Fund share transactions | | $ | 1,430,275,054 | | | $ | 320,576,011 | |
| | |
Net increase in net assets | | $ | 1,504,099,107 | | | $ | 298,755,627 | |
| | |
| Net Assets | | | | | | | | |
At beginning of year | | $ | 1,644,061,002 | | | $ | 1,345,305,375 | |
At end of year | | $ | 3,148,160,109 | | | $ | 1,644,061,002 | |
| | |
Accumulated distributions in excess of net investment income
included in net assets | | | | | | | | |
At end of year | | $ | (1,155,029 | ) | | $ | (2,023,263 | ) |
| | | | |
| | 9 | | See Notes to Financial Statements. |
Eaton Vance
Floating-Rate Advantage Fund
October 31, 2012
Financial Highlights
| | | | | | | | | | | | | | | | | | | | |
| | | Advisers Class | |
| | | Year Ended October 31, | | | Period Ended October 31, 2008(1) | |
| | | 2012 | | | 2011 | | | 2010 | | | 2009 | | |
Net asset value — Beginning of period | | $ | 10.660 | | | $ | 10.690 | | | $ | 9.910 | | | $ | 7.620 | | | $ | 10.000 | |
| | | | | |
| Income (Loss) From Operations | | | | | | | | | | | | | | | | | | | | |
Net investment income(2) | | $ | 0.572 | | | $ | 0.526 | | | $ | 0.487 | | | $ | 0.435 | | | $ | 0.395 | |
Net realized and unrealized gain (loss) | | | 0.396 | | | | 0.010 | (3) | | | 0.834 | | | | 2.289 | | | | (2.405 | ) |
| | | | | |
Total income (loss) from operations | | $ | 0.968 | | | $ | 0.536 | | | $ | 1.321 | | | $ | 2.724 | | | $ | (2.010 | ) |
| | | | | |
| Less Distributions | | | | | | | | | | | | | | | | | | | | |
From net investment income | | $ | (0.568 | ) | | $ | (0.536 | ) | | $ | (0.541 | ) | | $ | (0.434 | ) | | $ | (0.330 | ) |
From net realized gain | | | — | | | | — | | | | — | | | | — | | | | (0.040 | ) |
Tax return of capital | | | — | | | | (0.030 | ) | | | — | | | | — | | | | — | |
| | | | | |
Total distributions | | $ | (0.568 | ) | | $ | (0.566 | ) | | $ | (0.541 | ) | | $ | (0.434 | ) | | $ | (0.370 | ) |
| | | | | |
Redemption fees(2) | | $ | — | | | $ | 0.000 | (4) | | $ | 0.000 | (4) | | $ | 0.000 | (4) | | $ | — | |
| | | | | |
Net asset value — End of period | | $ | 11.060 | | | $ | 10.660 | | | $ | 10.690 | | | $ | 9.910 | | | $ | 7.620 | |
| | | | | |
Total Return(5) | | | 9.31 | % | | | 5.07 | % | | | 13.65 | % | | | 37.38 | % | | | (20.84 | )%(6) |
| | | | | |
| Ratios/Supplemental Data | | | | | | | | | | | | | | | | | | | | |
Net assets, end of period (000’s omitted) | | $ | 65,258 | | | $ | 53,729 | | | $ | 40,841 | | | $ | 34,173 | | | $ | 27,960 | |
Ratios (as a percentage of average daily net assets): | | | | | | | | | | | | | | | | | | | | |
Expenses excluding interest and fees(7)(8) | | | 1.08 | % | | | 1.10 | % | | | 1.18 | % | | | 1.29 | % | | | 1.17 | %(9) |
Interest and fee expense(7) | | | 0.34 | % | | | 0.39 | % | | | 0.56 | % | | | 1.32 | % | | | 0.96 | %(9) |
Total expenses(7) | | | 1.42 | % | | | 1.49 | % | | | 1.74 | % | | | 2.61 | % | | | 2.13 | %(9) |
Net investment income | | | 5.27 | % | | | 4.86 | % | | | 4.69 | % | | | 5.36 | % | | | 6.25 | %(9) |
Portfolio Turnover of the Portfolio | | | 37 | % | | | 59 | % | | | 37 | % | | | 32 | % | | | 7 | %(10) |
| (1) | Class commenced operations on March 15, 2008. |
| (2) | Computed using average shares outstanding. |
| (3) | The per share amount is not in accord with the net realized and unrealized loss for the period because of the timing of sales of Fund shares and the amount of the per share realized and unrealized gains and losses at such time. |
| (4) | Rounds to less than $0.001. |
| (5) | Returns are historical and are calculated by determining the percentage change in net asset value with all distributions reinvested. |
| (7) | Includes the Fund’s share of the Portfolio’s allocated expenses. |
| (8) | Excludes the effect of custody fee credits, if any, of less than 0.005%. |
| (10) | For the Portfolio’s year ended October 31, 2008. |
| | | | |
| | 10 | | See Notes to Financial Statements. |
Eaton Vance
Floating-Rate Advantage Fund
October 31, 2012
Financial Highlights — continued
| | | | | | | | | | | | | | | | | | | | |
| | | Class A | |
| | | Year Ended October 31, | | | Period Ended October 31, 2008(1) | |
| | | 2012 | | | 2011 | | | 2010 | | | 2009 | | |
Net asset value — Beginning of period | | $ | 10.660 | | | $ | 10.690 | | | $ | 9.910 | | | $ | 7.610 | | | $ | 10.000 | |
| | | | | |
| Income (Loss) From Operations | | | | | | | | | | | | | | | | | | | | |
Net investment income(2) | | $ | 0.571 | | | $ | 0.527 | | | $ | 0.488 | | | $ | 0.439 | | | $ | 0.388 | |
Net realized and unrealized gain (loss) | | | 0.397 | | | | 0.009 | (3) | | | 0.833 | | | | 2.294 | | | | (2.408 | ) |
| | | | | |
Total income (loss) from operations | | $ | 0.968 | | | $ | 0.536 | | | $ | 1.321 | | | $ | 2.733 | | | $ | (2.020 | ) |
| | | | | |
| Less Distributions | | | | | | | | | | | | | | | | | | | | |
From net investment income | | $ | (0.568 | ) | | $ | (0.536 | ) | | $ | (0.541 | ) | | $ | (0.433 | ) | | $ | (0.330 | ) |
Tax return of capital | | | — | | | | (0.030 | ) | | | — | | | | — | | | | (0.040 | ) |
| | | | | |
Total distributions | | $ | (0.568 | ) | | $ | (0.566 | ) | | $ | (0.541 | ) | | $ | (0.433 | ) | | $ | (0.370 | ) |
| | | | | |
Redemption fees(2) | | $ | — | | | $ | 0.000 | (4) | | $ | 0.000 | (4) | | $ | 0.000 | (4) | | $ | — | |
| | | | | |
Net asset value — End of period | | $ | 11.060 | | | $ | 10.660 | | | $ | 10.690 | | | $ | 9.910 | | | $ | 7.610 | |
| | | | | |
Total Return(5) | | | 9.31 | % | | | 5.07 | % | | | 13.64 | % | | | 37.56 | % | | | (20.94 | )%(6) |
| | | | | |
| Ratios/Supplemental Data | | | | | | | | | | | | | | | | | | | | |
Net assets, end of period (000’s omitted) | | $ | 959,179 | | | $ | 702,127 | | | $ | 556,631 | | | $ | 528,054 | | | $ | 444,144 | |
Ratios (as a percentage of average daily net assets): | | | | | | | | | | | | | | | | | | | | |
Expenses excluding interest and fees(7)(8) | | | 1.08 | % | | | 1.10 | % | | | 1.18 | % | | | 1.29 | % | | | 1.16 | %(9) |
Interest and fee expense(7) | | | 0.34 | % | | | 0.39 | % | | | 0.56 | % | | | 1.32 | % | | | 0.97 | %(9) |
Total expenses(7) | | | 1.42 | % | | | 1.49 | % | | | 1.74 | % | | | 2.61 | % | | | 2.13 | %(9) |
Net investment income | | | 5.26 | % | | | 4.88 | % | | | 4.71 | % | | | 5.42 | % | | | 6.23 | %(9) |
Portfolio Turnover of the Portfolio | | | 37 | % | | | 59 | % | | | 37 | % | | | 32 | % | | | 7 | %(10) |
| (1) | Class commenced operations on March 17, 2008. |
| (2) | Computed using average shares outstanding. |
| (3) | The per share amount is not in accord with the net realized and unrealized loss for the period because of the timing of sales of Fund shares and the amount of the per share realized and unrealized gains and losses at such time. |
| (4) | Rounds to less than $0.001. |
| (5) | Returns are historical and are calculated by determining the percentage change in net asset value with all distributions reinvested and do not reflect the effect of sales charges. |
| (7) | Includes the Fund’s share of the Portfolio’s allocated expenses. |
| (8) | Excludes the effect of custody fee credits, if any, of less than 0.005%. |
| (10) | For the Portfolio’s year ended October 31, 2008. |
| | | | |
| | 11 | | See Notes to Financial Statements. |
Eaton Vance
Floating-Rate Advantage Fund
October 31, 2012
Financial Highlights — continued
| | | | | | | | | | | | | | | | | | | | |
| | | Class B(1) | |
| | | Year Ended October 31, | |
| | | 2012 | | | 2011 | | | 2010 | | | 2009 | | | 2008 | |
Net asset value — Beginning of year | | $ | 10.680 | | | $ | 10.710 | | | $ | 9.930 | | | $ | 7.630 | | | $ | 11.180 | |
| | | | | |
| Income (Loss) From Operations | | | | | | | | | | | | | | | | | | | | |
Net investment income(2) | | $ | 0.532 | | | $ | 0.489 | | | $ | 0.452 | | | $ | 0.426 | | | $ | 0.662 | |
Net realized and unrealized gain (loss) | | | 0.410 | | | | 0.009 | (3) | | | 0.834 | | | | 2.279 | | | | (3.601 | ) |
| | | | | |
Total income (loss) from operations | | $ | 0.942 | | | $ | 0.498 | | | $ | 1.286 | | | $ | 2.705 | | | $ | (2.939 | ) |
| | | | | |
| Less Distributions | | | | | | | | | | | | | | | | | | | | |
From net investment income | | $ | (0.532 | ) | | $ | (0.500 | ) | | $ | (0.506 | ) | | $ | (0.405 | ) | | $ | (0.545 | ) |
Tax return of capital | | | — | | | | (0.028 | ) | | | — | | | | — | | | | (0.066 | ) |
| | | | | |
Total distributions | | $ | (0.532 | ) | | $ | (0.528 | ) | | $ | (0.506 | ) | | $ | (0.405 | ) | | $ | (0.611 | ) |
| | | | | |
Redemption fees(2) | | $ | — | | | $ | 0.000 | (4) | | $ | 0.000 | (4) | | $ | 0.000 | (4) | | $ | — | |
| | | | | |
Net asset value — End of year | | $ | 11.090 | | | $ | 10.680 | | | $ | 10.710 | | | $ | 9.930 | | | $ | 7.630 | |
| | | | | |
Total Return(5) | | | 9.03 | % | | | 4.70 | % | | | 13.23 | % | | | 36.99 | % | | | (27.45 | )% |
| | | | | |
| Ratios/Supplemental Data | | | | | | | | | | | | | | | | | | | | |
Net assets, end of year (000’s omitted) | | $ | 55,277 | | | $ | 84,483 | | | $ | 101,395 | | | $ | 121,236 | | | $ | 151,321 | |
Ratios (as a percentage of average daily net assets): | | | | | | | | | | | | | | | | | | | | |
Expenses excluding interest and fees(6)(7) | | | 1.45 | % | | | 1.45 | % | | | 1.53 | % | | | 1.64 | % | | | 1.51 | % |
Interest and fee expense(6) | | | 0.34 | % | | | 0.39 | % | | | 0.56 | % | | | 1.32 | % | | | 1.02 | % |
Total expenses(6) | | | 1.79 | % | | | 1.84 | % | | | 2.09 | % | | | 2.96 | % | | | 2.53 | % |
Net investment income | | | 4.90 | % | | | 4.52 | % | | | 4.36 | % | | | 5.34 | % | | | 6.37 | % |
Portfolio Turnover of the Portfolio | | | 37 | % | | | 59 | % | | | 37 | % | | | 32 | % | | | 7 | % |
| (1) | Information prior to the close of business on March 14, 2008 reflects the historical financial results of Eaton Vance Prime Rate Reserves prior to its reorganization. |
| (2) | Computed using average shares outstanding. |
| (3) | The per share amount is not in accord with the net realized and unrealized loss for the period because of the timing of sales of Fund shares and the amount of the per share realized and unrealized gains and losses at such time. |
| (4) | Rounds to less than $0.001. |
| (5) | Returns are historical and are calculated by determining the percentage change in net asset value with all distributions reinvested and do not reflect the effect of sales charges. |
| (6) | Includes the Fund’s share of the Portfolio’s allocated expenses. |
| (7) | Excludes the effect of custody fee credits, if any, of less than 0.005%. |
| | | | |
| | 12 | | See Notes to Financial Statements. |
Eaton Vance
Floating-Rate Advantage Fund
October 31, 2012
Financial Highlights — continued
| | | | | | | | | | | | | | | | | | | | |
| | | Class C | |
| | | Year Ended October 31, | | | Period Ended October 31, 2008(1) | �� |
| | | 2012 | | | 2011 | | | 2010 | | | 2009 | | |
Net asset value — Beginning of period | | $ | 10.640 | | | $ | 10.680 | | | $ | 9.900 | | | $ | 7.620 | | | $ | 10.000 | |
| | | | | |
| Income (Loss) From Operations | | | | | | | | | | | | | | | | | | | | |
Net investment income(2) | | $ | 0.516 | | | $ | 0.472 | | | $ | 0.435 | | | $ | 0.399 | | | $ | 0.362 | |
Net realized and unrealized gain (loss) | | | 0.399 | | | | 0.004 | (3) | | | 0.840 | | | | 2.280 | | | | (2.400 | ) |
| | | | | |
Total income (loss) from operations | | $ | 0.915 | | | $ | 0.476 | | | $ | 1.275 | | | $ | 2.679 | | | $ | (2.038 | ) |
| | | | | |
| Less Distributions | | | | | | | | | | | | | | | | | | | | |
From net investment income | | $ | (0.515 | ) | | $ | (0.489 | ) | | $ | (0.495 | ) | | $ | (0.399 | ) | | $ | (0.305 | ) |
Tax return of capital | | | — | | | | (0.027 | ) | | | — | | | | — | | | | (0.037 | ) |
| | | | | |
Total distributions | | $ | (0.515 | ) | | $ | (0.516 | ) | | $ | (0.495 | ) | | $ | (0.399 | ) | | $ | (0.342 | ) |
| | | | | |
Redemption fees(2) | | $ | — | | | $ | 0.000 | (4) | | $ | 0.000 | (4) | | $ | 0.000 | (4) | | $ | — | |
| | | | | |
Net asset value — End of period | | $ | 11.040 | | | $ | 10.640 | | | $ | 10.680 | | | $ | 9.900 | | | $ | 7.620 | |
| | | | | |
Total Return(5) | | | 8.80 | % | | | 4.50 | % | | | 13.16 | % | | | 36.67 | % | | | (21.06 | )%(6) |
| | | | | |
| Ratios/Supplemental Data | | | | | | | | | | | | | | | | | | | | |
Net assets, end of period (000’s omitted) | | $ | 748,843 | | | $ | 629,929 | | | $ | 583,683 | | | $ | 550,652 | | | $ | 484,551 | |
Ratios (as a percentage of average daily net assets): | | | | | | | | | | | | | | | | | | | | |
Expenses excluding interest and fees(7)(8) | | | 1.58 | % | | | 1.60 | % | | | 1.68 | % | | | 1.79 | % | | | 1.68 | %(9) |
Interest and fee expense(7) | | | 0.34 | % | | | 0.39 | % | | | 0.56 | % | | | 1.32 | % | | | 0.96 | %(9) |
Total expenses(7) | | | 1.92 | % | | | 1.99 | % | | | 2.24 | % | | | 3.11 | % | | | 2.64 | %(9) |
Net investment income | | | 4.76 | % | | | 4.37 | % | | | 4.21 | % | | | 4.95 | % | | | 5.74 | %(9) |
Portfolio Turnover of the Portfolio | | | 37 | % | | | 59 | % | | | 37 | % | | | 32 | % | | | 7 | %(10) |
| (1) | Class commenced operations on March 15, 2008. |
| (2) | Computed using average shares outstanding. |
| (3) | The per share amount is not in accord with the net realized and unrealized loss for the period because of the timing of sales of Fund shares and the amount of the per share realized and unrealized gains and losses at such time. |
| (4) | Rounds to less than $0.001. |
| (5) | Returns are historical and are calculated by determining the percentage change in net asset value with all distributions reinvested and do not reflect the effect of sales charges. |
| (7) | Includes the Fund’s share of the Portfolio’s allocated expenses. |
| (8) | Excludes the effect of custody fee credits, if any, of less than 0.005%. |
| (10) | For the Portfolio’s year ended October 31, 2008. |
| | | | |
| | 13 | | See Notes to Financial Statements. |
Eaton Vance
Floating-Rate Advantage Fund
October 31, 2012
Financial Highlights — continued
| | | | | | | | | | | | | | | | | | | | |
| | | Class I | |
| | | Year Ended October 31, | | | Period Ended
October 31, 2008(1) | |
| | | 2012 | | | 2011 | | | 2010 | | | 2009 | | |
Net asset value — Beginning of period | | $ | 10.660 | | | $ | 10.690 | | | $ | 9.910 | | | $ | 7.620 | | | $ | 10.000 | |
| | | | | |
| Income (Loss) From Operations | | | | | | | | | | | | | | | | | | | | |
Net investment income(2) | | $ | 0.605 | | | $ | 0.554 | | | $ | 0.513 | | | $ | 0.461 | | | $ | 0.412 | |
Net realized and unrealized gain (loss) | | | 0.391 | | | | 0.008 | (3) | | | 0.833 | | | | 2.282 | | | | (2.407 | ) |
| | | | | |
Total income (loss) from operations | | $ | 0.996 | | | $ | 0.562 | | | $ | 1.346 | | | $ | 2.743 | | | $ | (1.995 | ) |
| | | | | |
| Less Distributions | | | | | | | | | | | | | | | | | | | | |
From net investment income | | $ | (0.596 | ) | | $ | (0.561 | ) | | $ | (0.566 | ) | | $ | (0.453 | ) | | $ | (0.344 | ) |
Tax return of capital | | | — | | | | (0.031 | ) | | | — | | | | — | | | | (0.041 | ) |
| | | | | |
Total distributions | | $ | (0.596 | ) | | $ | (0.592 | ) | | $ | (0.566 | ) | | $ | (0.453 | ) | | $ | (0.385 | ) |
| | | | | |
Redemption fees(2) | | $ | — | | | $ | 0.000 | (4) | | $ | 0.000 | (4) | | $ | 0.000 | (4) | | $ | — | |
| | | | | |
Net asset value — End of period | | $ | 11.060 | | | $ | 10.660 | | | $ | 10.690 | | | $ | 9.910 | | | $ | 7.620 | |
| | | | | |
Total Return(5) | | | 9.59 | % | | | 5.33 | % | | | 13.91 | % | | | 37.70 | % | | | (20.71 | )%(6) |
| | | | | |
| Ratios/Supplemental Data | | | | | | | | | | | | | | | | | | | | |
Net assets, end of period (000’s omitted) | | $ | 1,319,604 | | | $ | 173,792 | | | $ | 62,755 | | | $ | 24,688 | | | $ | 13,515 | |
Ratios (as a percentage of average daily net assets): | | | | | | | | | | | | | | | | | | | | |
Expenses excluding interest and fees(7)(8) | | | 0.77 | % | | | 0.85 | % | | | 0.93 | % | | | 1.04 | % | | | 0.92 | %(9) |
Interest and fee expense(7) | | | 0.34 | % | | | 0.39 | % | | | 0.56 | % | | | 1.32 | % | | | 0.96 | %(9) |
Total expenses(7) | | | 1.11 | % | | | 1.24 | % | | | 1.49 | % | | | 2.36 | % | | | 1.88 | %(9) |
Net investment income | | | 5.54 | % | | | 5.12 | % | | | 4.94 | % | | | 5.65 | % | | | 6.51 | %(9) |
Portfolio Turnover of the Portfolio | | | 37 | % | | | 59 | % | | | 37 | % | | | 32 | % | | | 7 | %(10) |
| (1) | Class commenced operations on March 15, 2008. |
| (2) | Computed using average shares outstanding. |
| (3) | The per share amount is not in accord with the net realized and unrealized loss for the period because of the timing of sales of Fund shares and the amount of the per share realized and unrealized gains and losses at such time. |
| (4) | Rounds to less than $0.001. |
| (5) | Returns are historical and are calculated by determining the percentage change in net asset value with all distributions reinvested. |
| (7) | Includes the Fund’s share of the Portfolio’s allocated expenses. |
| (8) | Excludes the effect of custody fee credits, if any, of less than 0.005%. |
| (10) | For the Portfolio’s year ended October 31, 2008. |
| | | | |
| | 14 | | See Notes to Financial Statements. |
Eaton Vance
Floating-Rate Advantage Fund
October 31, 2012
Notes to Financial Statements
1 Significant Accounting Policies
Eaton Vance Floating-Rate Advantage Fund (the Fund) is a diversified series of Eaton Vance Mutual Funds Trust (the Trust). The Trust is a Massachusetts business trust registered under the Investment Company Act of 1940, as amended (the 1940 Act), as an open-end management investment company. The Fund offers five classes of shares. Class A shares are generally sold subject to a sales charge imposed at time of purchase. Class B and Class C shares are sold at net asset value and are generally subject to a contingent deferred sales charge (see Note 5). The Advisers Class and Class I shares are generally sold at net asset value and are not subject to a sales charge. Class B shares automatically convert to Class A shares eight years after their purchase as described in the Fund’s prospectus. Beginning January 1, 2012, Class B shares are only available for purchase upon exchange from another Eaton Vance fund or through reinvestment of distributions. Each class represents a pro-rata interest in the Fund, but votes separately on class-specific matters and (as noted below) is subject to different expenses. Realized and unrealized gains and losses are allocated daily to each class of shares based on the relative net assets of each class to the total net assets of the Fund. Net investment income, other than class-specific expenses, is allocated daily to each class of shares based upon the ratio of the value of each class’s paid shares to the total value of all paid shares. Each class of shares differs in its distribution plan and certain other class-specific expenses. The Fund invests all of its investable assets in interests in Senior Debt Portfolio (the Portfolio), a Massachusetts business trust, having the same investment objective and policies as the Fund. The value of the Fund’s investment in the Portfolio reflects the Fund’s proportionate interest in the net assets of the Portfolio (96.9% at October 31, 2012). The performance of the Fund is directly affected by the performance of the Portfolio. The financial statements of the Portfolio, including the portfolio of investments, are included elsewhere in this report and should be read in conjunction with the Fund’s financial statements.
The following is a summary of significant accounting policies of the Fund. The policies are in conformity with accounting principles generally accepted in the United States of America.
A Investment Valuation — Valuation of securities by the Portfolio is discussed in Note 1A of the Portfolio’s Notes to Financial Statements, which are included elsewhere in this report.
B Income — The Fund’s net investment income or loss consists of the Fund’s pro-rata share of the net investment income or loss of the Portfolio, less all actual and accrued expenses of the Fund.
C Federal Taxes — The Fund’s policy is to comply with the provisions of the Internal Revenue Code applicable to regulated investment companies and to distribute to shareholders each year substantially all of its net investment income, and all or substantially all of its net realized capital gains. Accordingly, no provision for federal income or excise tax is necessary.
At October 31, 2012, the Fund, for federal income tax purposes, had a capital loss carryforward of $214,956,373 which will reduce its taxable income arising from future net realized gains on investment transactions, if any, to the extent permitted by the Internal Revenue Code, and thus will reduce the amount of distributions to shareholders, which would otherwise be necessary to relieve the Fund of any liability for federal income or excise tax. Such capital loss carryforward will expire on October 31, 2015 ($10,899,103), October 31, 2016 ($124,652,882), October 31, 2017 ($50,458,629), October 31, 2018 ($28,308,325) and October 31, 2019 ($637,434). In addition, such capital loss carryforward cannot be utilized prior to the utilization of new capital losses, if any, created after October 31, 2012.
During the year ended October 31, 2012, a capital loss carryforward of $5,078,413 was utilized to offset net realized gains by the Fund.
As of October 31, 2012, the Fund had no uncertain tax positions that would require financial statement recognition, de-recognition, or disclosure. The Fund files a U.S. federal income tax return annually after its fiscal year-end, which is subject to examination by the Internal Revenue Service for a period of three years from the date of filing.
D Expenses — The majority of expenses of the Trust are directly identifiable to an individual fund. Expenses which are not readily identifiable to a specific fund are allocated taking into consideration, among other things, the nature and type of expense and the relative size of the funds.
E Expense Reduction — State Street Bank and Trust Company (SSBT) serves as custodian of the Fund. Pursuant to the custodian agreement, SSBT receives a fee reduced by credits, which are determined based on the average daily cash balance the Fund maintains with SSBT. All credit balances, if any, used to reduce the Fund’s custodian fees are reported as a reduction of expenses in the Statement of Operations.
F Use of Estimates — The preparation of the financial statements in conformity with accounting principles generally accepted in the United States of America requires management to make estimates and assumptions that affect the reported amounts of assets and liabilities at the date of the financial statements and the reported amounts of income and expense during the reporting period. Actual results could differ from those estimates.
G Indemnifications — Under the Trust’s organizational documents, its officers and Trustees may be indemnified against certain liabilities and expenses arising out of the performance of their duties to the Fund. Under Massachusetts law, if certain conditions prevail, shareholders of a Massachusetts business trust (such as the Trust) could be deemed to have personal liability for the obligations of the Trust. However, the Trust’s Declaration of Trust contains an express disclaimer of liability on the part of Fund shareholders and the By-laws provide that the Trust shall assume the defense on behalf of any Fund shareholders. Moreover, the By-laws also provide for indemnification out of Fund property of any shareholder held personally liable solely by reason of being or having been a shareholder for all loss or expense arising from such liability. Additionally, in the normal course of business, the Fund enters into
Eaton Vance
Floating-Rate Advantage Fund
October 31, 2012
Notes to Financial Statements — continued
agreements with service providers that may contain indemnification clauses. The Fund’s maximum exposure under these arrangements is unknown as this would involve future claims that may be made against the Fund that have not yet occurred.
H Redemption Fees — Upon the redemption or exchange of shares by Advisers Class, Class A and Class I shareholders within 90 days of the settlement of purchase, a fee of 1% of the current net asset value of these shares was assessed and retained by the Fund for the benefit of the remaining shareholders. The redemption fee was accounted for as an addition to paid-in capital. Effective January 1, 2011, Advisers Class, Class A and Class I shares are no longer subject to a redemption fee.
I Other — Investment transactions are accounted for on a trade date basis. Dividends to shareholders are recorded on the ex-dividend date.
2 Distributions to Shareholders
The Fund declares dividends daily to shareholders of record at the time of declaration. Distributions are generally paid monthly. Distributions of realized capital gains are made at least annually. Distributions are declared separately for each class of shares. Shareholders may reinvest income and capital gain distributions in additional shares of the same class of the Fund at the net asset value as of the reinvestment date or, at the election of the shareholder, receive distributions in cash. The Fund distinguishes between distributions on a tax basis and a financial reporting basis. Accounting principles generally accepted in the United States of America require that only distributions in excess of tax basis earnings and profits be reported in the financial statements as a return of capital. Permanent differences between book and tax accounting relating to distributions are reclassified to paid-in capital. For tax purposes, distributions from short-term capital gains are considered to be from ordinary income.
The tax character of distributions declared for the years ended October 31, 2012 and October 31, 2011 was as follows:
| | | | | | | | |
| | | Year Ended October 31, | |
| | | 2012 | | | 2011 | |
|
Distributions declared from: | |
Ordinary income | | $ | 112,189,071 | | | $ | 78,612,866 | |
Tax return of capital | | $ | — | | | $ | 4,359,035 | |
During the year ended October 31, 2012, accumulated net realized loss was increased by $7,566,010, accumulated distributions in excess of net investment income was decreased by $582,618 and paid-in capital was increased by $6,983,392 due to differences between book and tax accounting, primarily for swap contracts, mixed straddles, defaulted bond interest and foreign currency gain (loss). These reclassifications had no effect on the net assets or net asset value per share of the Fund.
As of October 31, 2012, the components of distributable earnings (accumulated losses) and unrealized appreciation (depreciation) on a tax basis were as follows:
| | | | |
Undistributed ordinary income | | $ | 4,497,945 | |
Capital loss carryforward | | $ | (214,956,373 | ) |
Net unrealized appreciation | | $ | 24,004,647 | |
Other temporary differences | | $ | (5,652,974 | ) |
The differences between components of distributable earnings (accumulated losses) on a tax basis and the amounts reflected in the Statement of Assets and Liabilities are primarily due to wash sales, partnership allocations and the timing of recognizing distributions to shareholders.
3 Transactions with Affiliates
The administration fee is earned by Eaton Vance Management (EVM) as compensation for administrative services rendered to the Fund. The fee is computed at an annual rate of 0.10% of the Fund’s average daily net assets. For the year ended October 31, 2012, the administration fee amounted to $2,167,496. The Portfolio has engaged Boston Management and Research (BMR), a subsidiary of EVM, to render investment advisory services. See Note 2 of the Portfolio’s Notes to Financial Statements which are included elsewhere in this report.
EVM serves as the sub-transfer agent of the Fund and receives from the transfer agent an aggregate fee based upon the actual expenses incurred by EVM in the performance of these services. For the year ended October 31, 2012, EVM earned $158,999 in sub-transfer agent fees. The Fund was informed that Eaton Vance Distributors, Inc. (EVD), an affiliate of EVM and the Fund’s principal underwriter, received $98,308 as its portion of the sales charge on
Eaton Vance
Floating-Rate Advantage Fund
October 31, 2012
Notes to Financial Statements — continued
sales of Class A shares for the year ended October 31, 2012. EVD also received distribution and service fees from Advisers Class, Class A, Class B and Class C shares (see Note 4) and contingent deferred sales charges (see Note 5).
Trustees and officers of the Fund who are members of EVM’s or BMR’s organizations receive remuneration for their services to the Fund out of the investment adviser fee. Certain officers and Trustees of the Fund and the Portfolio are officers of the above organizations.
4 Distribution Plans
The Fund has in effect a distribution plan for Advisers Class shares and Class A shares (Advisers/Class A Plan) pursuant to Rule 12b-1 under the 1940 Act. Pursuant to the Advisers/Class A Plan, the Fund pays EVD a distribution and service fee of 0.25% per annum of its average daily net assets attributable to Advisers Class and Class A shares for distribution services and facilities provided to the Fund by EVD, as well as for personal services and/or the maintenance of shareholder accounts. Distribution and service fees paid or accrued to EVD for the year ended October 31, 2012 amounted to $140,009 for Advisers Class shares and $1,906,488 for Class A shares.
The Fund also has in effect distribution plans for Class B shares (Class B Plan) and Class C shares (Class C Plan) pursuant to Rule 12b-1 under the 1940 Act. Pursuant to the Class B and Class C Plans, the Fund pays EVD amounts equal to 0.40% and 0.60% per annum of its average daily net assets attributable to Class B and Class C shares, respectively, for providing ongoing distribution services and facilities to the Fund. For the year ended October 31, 2012, the Fund paid or accrued to EVD $273,064 and $3,962,122 for Class B and Class C shares, respectively.
Pursuant to the Class B and Class C Plans, the Fund also makes payments of service fees to EVD, financial intermediaries and other persons in amounts equal to 0.20% and 0.15% per annum of its average daily net assets attributable to Class B and Class C shares, respectively. Although there is no present intention to do so, Class C shares could pay service fees of up to 0.25% annually upon Trustee approval. Service fees paid or accrued are for personal services and/or the maintenance of shareholder accounts. They are separate and distinct from the sales commissions and distribution fees payable to EVD. Service fees paid or accrued for the year ended October 31, 2012 amounted to $136,532 and $990,531 for Class B and Class C shares, respectively.
5 Contingent Deferred Sales Charges
A contingent deferred sales charge (CDSC) generally is imposed on redemptions of Class B shares made within four years of purchase and on redemptions of Class C shares made within one year of purchase. Class A shares may be subject to a 1% CDSC if redeemed within 18 months of purchase (depending on the circumstances of purchase). Generally, the CDSC is based upon the lower of the net asset value at date of redemption or date of purchase. No charge is levied on shares acquired by reinvestment of dividends or capital gain distributions. The CDSC for Class B shares is imposed at declining rates that begin at 3% in the case of redemptions in the first year of purchase, declining to 2.5% in the second year, 2.0% in the third year, 1.0% in the fourth year and 0.0% thereafter. Class C shares are subject to a 1% CDSC if redeemed within one year of purchase. No CDSC is levied on shares which have been sold to EVM or its affiliates or to their respective employees or clients and may be waived under certain other limited conditions. For the year ended October 31, 2012, the Fund was informed that EVD received approximately $100, $29,000 and $46,000 of CDSCs paid by Class A, Class B and Class C shareholders, respectively.
6 Investment Transactions
For the year ended October 31, 2012, increases and decreases in the Fund’s investment in the Portfolio aggregated $1,489,597,099 and $191,767,616, respectively.
7 Shares of Beneficial Interest
The Fund’s Declaration of Trust permits the Trustees to issue an unlimited number of full and fractional shares of beneficial interest (without par value). Such shares may be issued in a number of different series (such as the Fund) and classes. Transactions in Fund shares were as follows:
| | | | | | | | |
| | | Year Ended October 31, | |
| Advisers Class | | 2012 | | | 2011 | |
| | |
Sales | | | 2,461,777 | | | | 4,295,195 | |
Issued to shareholders electing to receive payments of distributions in Fund shares | | | 197,436 | | | | 198,903 | |
Redemptions | | | (1,800,758 | ) | | | (3,273,947 | ) |
| | |
Net increase | | | 858,455 | | | | 1,220,151 | |
Eaton Vance
Floating-Rate Advantage Fund
October 31, 2012
Notes to Financial Statements — continued
| | | | | | | | |
| | | Year Ended October 31, | |
| Class A | | 2012 | | | 2011 | |
| | |
Sales | | | 29,710,614 | | | | 30,258,632 | |
Issued to shareholders electing to receive payments of distributions in Fund shares | | | 2,910,716 | | | | 2,311,019 | |
Redemptions | | | (14,064,087 | ) | | | (19,831,355 | ) |
Exchange from Class B shares | | | 2,273,423 | | | | 1,051,208 | |
| | |
Net increase | | | 20,830,666 | | | | 13,789,504 | |
| | |
| | | | | | | | |
| | | Year Ended October 31, | |
| Class B | | 2012 | | | 2011 | |
| | |
Sales | | | 240,092 | | | | 1,098,623 | |
Issued to shareholders electing to receive payments of distributions in Fund shares | | | 206,347 | | | | 264,349 | |
Redemptions | | | (1,100,412 | ) | | | (1,872,774 | ) |
Exchange to Class A shares | | | (2,268,145 | ) | | | (1,048,266 | ) |
| | |
Net decrease | | | (2,922,118 | ) | | | (1,558,068 | ) |
| | |
| | | | | | | | |
| | | Year Ended October 31, | |
| Class C | | 2012 | | | 2011 | |
| | |
Sales | | | 14,884,086 | | | | 12,408,772 | |
Issued to shareholders electing to receive payments of distributions in Fund shares | | | 2,353,297 | | | | 2,069,786 | |
Redemptions | | | (8,618,302 | ) | | | (9,957,741 | ) |
| | |
Net increase | | | 8,619,081 | | | | 4,520,817 | |
| | |
| | | | | | | | |
| | | Year Ended October 31, | |
| Class I | | 2012 | | | 2011 | |
| | |
Sales | | | 128,216,381 | | | | 24,833,469 | |
Issued to shareholders electing to receive payments of distributions in Fund shares | | | 728,632 | | | | 431,541 | |
Redemptions | | | (25,979,282 | ) | | | (14,834,201 | ) |
| | |
Net increase | | | 102,965,731 | | | | 10,430,809 | |
For the years ended October 31, 2012 and October 31, 2011, the Fund received $0 and $2,375, respectively, in redemption fees.
Eaton Vance
Floating-Rate Advantage Fund
October 31, 2012
Report of Independent Registered Public Accounting Firm
To the Trustees of Eaton Vance Mutual Funds Trust and Shareholders of Eaton Vance Floating-Rate Advantage Fund:
We have audited the accompanying statement of assets and liabilities of Eaton Vance Floating-Rate Advantage Fund (the “Fund”) (one of the funds constituting Eaton Vance Mutual Funds Trust) as of October 31, 2012, and the related statement of operations for the year then ended, the statements of changes in net assets for each of the two years in the period then ended, and the financial highlights for each of the periods presented. These financial statements and financial highlights are the responsibility of the Fund’s management. Our responsibility is to express an opinion on these financial statements and financial highlights based on our audits.
We conducted our audits in accordance with the standards of the Public Company Accounting Oversight Board (United States). Those standards require that we plan and perform the audit to obtain reasonable assurance about whether the financial statements and financial highlights are free of material misstatement. The Fund is not required to have, nor were we engaged to perform, an audit of its internal control over financial reporting. Our audits included consideration of internal control over financial reporting as a basis for designing audit procedures that are appropriate in the circumstances, but not for the purpose of expressing an opinion on the effectiveness of the Fund’s internal control over financial reporting. Accordingly, we express no such opinion. An audit also includes examining, on a test basis, evidence supporting the amounts and disclosures in the financial statements, assessing the accounting principles used and significant estimates made by management, as well as evaluating the overall financial statement presentation. We believe that our audits provide a reasonable basis for our opinion.
In our opinion, such financial statements and financial highlights referred to above present fairly, in all material respects, the financial position of Eaton Vance Floating-Rate Advantage Fund as of October 31, 2012, the results of its operations for the year then ended, the changes in its net assets for each of the two years in the period then ended, and the financial highlights for each of the periods presented, in conformity with accounting principles generally accepted in the United States of America.
DELOITTE & TOUCHE LLP
Boston, Massachusetts
December 18, 2012
Eaton Vance
Floating-Rate Advantage Fund
October 31, 2012
Federal Tax Information (Unaudited)
The Form 1099-DIV you receive in January 2013 will show the tax status of all distributions paid to your account in calendar year 2012. Shareholders are advised to consult their own tax adviser with respect to the tax consequences of their investment in the Fund. As required by the Internal Revenue Code and/or regulations, shareholders must be notified regarding the status of qualified dividend income for individuals and the dividends received deduction for corporations.
Qualified Dividend Income. The Fund designates approximately $2,774,040, or up to the maximum amount of such dividends allowable pursuant to the Internal Revenue Code, as qualified dividend income eligible for the reduced tax rate of 15%.
Dividends Received Deduction. Corporate shareholders are generally entitled to take the dividends received deduction on the portion of the Fund’s dividend distribution that qualifies under tax law. For the Fund’s fiscal 2012 ordinary income dividends, 2.46% qualifies for the corporate dividends received deduction.
Senior Debt Portfolio
October 31, 2012
Portfolio of Investments
| | | | | | | | | | |
| Senior Floating-Rate Interests — 115.2%(1) | | | | | |
| | | |
| | | | | | | | | | |
| Borrower/Tranche Description | | | | Principal
Amount*
(000’s omitted) | | | Value | |
| | | | | | | | | | |
|
Aerospace and Defense — 2.3% | |
Booz Allen Hamilton Inc. | |
Term Loan, 4.50%, Maturing July 31, 2019 | | | | | 13,250 | | | $ | 13,347,997 | |
DAE Aviation Holdings, Inc. | |
Term Loan, 7.25%, Maturing July 31, 2014 | | | | | 7,267 | | | | 7,266,774 | |
Term Loan, 7.25%, Maturing July 31, 2014 | | | | | 8,713 | | | | 8,713,118 | |
Ducommun Incorporated | |
Term Loan, 5.50%, Maturing June 28, 2017 | | | | | 1,449 | | | | 1,470,782 | |
IAP Worldwide Services, Inc. | |
Term Loan, 9.25%, Maturing December 28, 2012(2) | | | | | 5,321 | | | | 4,323,139 | |
Sequa Corporation | |
Term Loan, 3.62%, Maturing December 3, 2014 | | | | | 14,381 | | | | 14,374,275 | |
TASC, Inc. | |
Term Loan, 4.50%, Maturing December 18, 2015 | | | | | 2,150 | | | | 2,154,261 | |
Transdigm, Inc. | |
Term Loan, 4.00%, Maturing February 14, 2017 | | | | | 3,309 | | | | 3,324,132 | |
Term Loan, 4.00%, Maturing February 14, 2017 | | | | | 16,206 | | | | 16,271,457 | |
Wesco Aircraft Hardware Corp. | |
Term Loan, 4.25%, Maturing April 7, 2017 | | | | | 1,015 | | | | 1,018,951 | |
Wyle Services Corporation | |
Term Loan, 5.00%, Maturing March 27, 2017 | | | | | 1,779 | | | | 1,789,708 | |
| | | | | | | | | | | |
| | | | | | | | $ | 74,054,594 | |
| | | | | | | | | | | |
|
Air Transport — 0.2% | |
Evergreen International Aviation, Inc. | |
Term Loan, 11.50%, Maturing June 30, 2015 | | | | | 2,396 | | | $ | 2,336,456 | |
Orbitz Worldwide Inc. | |
Term Loan, 3.21%, Maturing July 25, 2014 | | | | | 4,189 | | | | 4,096,759 | |
| | | | | | | | | | | |
| | | | | | | | $ | 6,433,215 | |
| | | | | | | | | | | |
|
Automotive — 5.5% | |
Allison Transmission, Inc. | |
Term Loan, 2.72%, Maturing August 7, 2014 | | | | | 4,173 | | | $ | 4,183,808 | |
Term Loan, 4.25%, Maturing August 23, 2019 | | | | | 22,410 | | | | 22,543,291 | |
Autoparts Holdings Limited | |
Term Loan, 6.50%, Maturing July 28, 2017 | | | | | 1,213 | | | | 1,208,202 | |
Chrysler Group LLC | |
Term Loan, 6.00%, Maturing May 24, 2017 | | | | | 29,393 | | | | 30,111,499 | |
Delphi Corporation | |
Term Loan, 3.50%, Maturing March 31, 2017 | | | | | 1,504 | | | | 1,511,458 | |
Federal-Mogul Corporation | |
Term Loan, 2.15%, Maturing December 29, 2014 | | | | | 13,500 | | | | 12,728,061 | |
Term Loan, 2.15%, Maturing December 28, 2015 | | | | | 7,794 | | | | 7,347,887 | |
| | | | | | | | | | |
| Borrower/Tranche Description | | | | Principal
Amount*
(000’s omitted) | | | Value | |
| | | | | | | | | | |
|
Automotive (continued) | |
Financiere Truck Investissement SAS | |
Term Loan, 2.35%, Maturing February 15, 2013 | | EUR | | | 634 | | | $ | 782,802 | |
Goodyear Tire & Rubber Company (The) | |
Term Loan - Second Lien, 4.75%, Maturing April 30, 2019 | | | | | 28,075 | | | | 28,390,844 | |
HHI Holdings LLC | |
Term Loan, 6.00%, Maturing October 3, 2018 | | | | | 10,200 | | | | 10,200,000 | |
Metaldyne Company LLC | |
Term Loan, 5.25%, Maturing May 18, 2017 | | | | | 11,234 | | | | 11,290,619 | |
Remy International, Inc. | |
Term Loan, 6.25%, Maturing December 16, 2016 | | | | | 2,398 | | | | 2,415,720 | |
SRAM, LLC | |
Term Loan, 4.78%, Maturing June 7, 2018 | | | | | 4,470 | | | | 4,514,670 | |
Term Loan - Second Lien, 8.50%, Maturing December 7, 2018 | | | | | 2,000 | | | | 2,040,000 | |
Tomkins LLC | |
Term Loan, 4.25%, Maturing September 29, 2016 | | | | | 16,770 | | | | 16,882,884 | |
TriMas Corporation | |
Term Loan, Maturing October 10, 2019(3) | | | | | 3,725 | | | | 3,734,313 | |
UCI International, Inc. | |
Term Loan, 5.50%, Maturing July 26, 2017 | | | | | 955 | | | | 965,024 | |
Veyance Technologies, Inc. | |
Term Loan, 2.47%, Maturing July 31, 2014 | | | | | 1,057 | | | | 1,049,188 | |
Term Loan, 2.47%, Maturing July 31, 2014 | | | | | 7,379 | | | | 7,325,049 | |
Term Loan, 5.50%, Maturing July 31, 2014 | | | | | 2,886 | | | | 2,896,321 | |
Term Loan - Second Lien, 5.96%, Maturing July 31, 2015 | | | | | 6,000 | | | | 5,820,000 | |
| | | | | | | | | | | |
| | | | | | | | $ | 177,941,640 | |
| | | | | | | | | | | |
|
Beverage and Tobacco — 0.0%(4) | |
Maine Beverage Company | |
Term Loan, 2.11%, Maturing March 31, 2013 | | | | | 107 | | | $ | 106,339 | |
| | | | | | | | | | | |
| | | | | | | | $ | 106,339 | |
| | | | | | | | | | | |
|
Building and Development — 1.3% | |
401 North Wabash Venture LLC | |
Term Loan, 6.75%, Maturing August 1, 2013 | | | | | 2,697 | | | $ | 2,698,408 | |
Armstrong World Industries, Inc. | |
Term Loan, 4.00%, Maturing March 9, 2018 | | | | | 4,692 | | | | 4,714,630 | |
Goodman Global Inc. | |
Term Loan, 5.75%, Maturing October 28, 2016 | | | | | 8,677 | | | | 8,714,154 | |
Preferred Proppants, LLC | | | | | | | | | | |
Term Loan, 7.50%, Maturing December 15, 2016 | | | | | 6,409 | | | | 6,080,621 | |
| | | | |
| | 21 | | See Notes to Financial Statements. |
Senior Debt Portfolio
October 31, 2012
Portfolio of Investments — continued
| | | | | | | | | | |
| Borrower/Tranche Description | | | | Principal
Amount*
(000’s omitted) | | | Value | |
| | | | | | | | | | |
|
Building and Development (continued) | |
RE/MAX International, Inc. | |
Term Loan, 5.50%, Maturing April 15, 2016 | | | | | 3,915 | | | $ | 3,944,702 | |
Realogy Corporation | |
Term Loan, 3.24%, Maturing October 10, 2013 | | | | | 150 | | | | 147,761 | |
Term Loan, 4.46%, Maturing October 10, 2016 | | | | | 362 | | | | 361,708 | |
Term Loan, 4.46%, Maturing October 10, 2016 | | | | | 4,637 | | | | 4,634,254 | |
Summit Materials Companies I, LLC | |
Term Loan, 6.00%, Maturing January 30, 2019 | | | | | 1,244 | | | | 1,256,317 | |
The Woodlands Land Development Company L.P. | |
Term Loan, 5.00%, Maturing March 7, 2014 | | | | | 4,815 | | | | 4,742,592 | |
Tishman Speyer U.S. Office, Inc. | |
Term Loan, 5.21%, Maturing January 8, 2014 | | | | | 4,925 | | | | 4,978,190 | |
| | | | | | | | | | | |
| | | | | | | | $ | 42,273,337 | |
| | | | | | | | | | | |
|
Business Equipment and Services — 10.7% | |
ACCO Brands Corporation | |
Term Loan, 4.25%, Maturing April 30, 2019 | | | | | 1,294 | | | $ | 1,307,243 | |
Acosta, Inc. | |
Term Loan, 5.00%, Maturing March 1, 2018 | | | | | 19,700 | | | | 19,823,513 | |
Advantage Sales & Marketing, Inc. | |
Term Loan, 5.25%, Maturing December 18, 2017 | | | | | 15,046 | | | | 15,079,377 | |
Affinion Group, Inc. | |
Term Loan, 5.00%, Maturing July 16, 2015 | | | | | 11,823 | | | | 11,164,909 | |
Allied Security Holdings, LLC | |
Term Loan, 5.25%, Maturing February 3, 2017 | | | | | 1,379 | | | | 1,382,448 | |
Altegrity, Inc. | |
Term Loan, 7.75%, Maturing February 20, 2015 | | | | | 1,510 | | | | 1,510,291 | |
Term Loan, 2.96%, Maturing February 21, 2015 | | | | | 1,390 | | | | 1,292,586 | |
BAR/BRI Review Courses, Inc. | |
Term Loan, 6.00%, Maturing June 16, 2017 | | | | | 4,475 | | | | 4,480,588 | |
Brand Energy & Infrastructure Services, Inc. | |
Term Loan, Maturing October 16, 2016(3) | | | | | 706 | | | | 706,452 | |
Term Loan, Maturing October 16, 2018(3) | | | | | 2,944 | | | | 2,933,738 | |
Brickman Group Holdings Inc. | |
Term Loan, 5.50%, Maturing October 14, 2016 | | | | | 13,540 | | | | 13,742,780 | |
Brock Holdings III, Inc. | |
Term Loan, 6.01%, Maturing March 16, 2017 | | | | | 2,867 | | | | 2,895,432 | |
Catalina Marketing Corporation | |
Term Loan, 2.96%, Maturing October 1, 2014 | | | | | 987 | | | | 984,644 | |
ClientLogic Corporation | |
Term Loan, 7.10%, Maturing January 30, 2017 | | | | | 3,293 | | | | 3,218,755 | |
Corporate Executive Board Company, The | |
Term Loan, 5.00%, Maturing July 2, 2019 | | | | | 2,050 | | | | 2,065,375 | |
| | | | | | | | | | |
| Borrower/Tranche Description | | | | Principal
Amount*
(000’s omitted) | | | Value | |
| | | �� | | | | | | | |
|
Business Equipment and Services (continued) | |
CPM Acquisition Corp. | |
Term Loan, 6.25%, Maturing August 29, 2017 | | | | | 1,975 | | | $ | 1,991,047 | |
DynCorp International LLC | |
Term Loan, 6.25%, Maturing July 7, 2016 | | | | | 1,929 | | | | 1,940,211 | |
Education Management LLC | |
Term Loan, 4.38%, Maturing June 1, 2016 | | | | | 4,973 | | | | 4,192,356 | |
Term Loan, 8.25%, Maturing March 29, 2018 | | | | | 10,045 | | | | 8,911,628 | |
EIG Investors Corp. | |
Term Loan, 7.75%, Maturing April 20, 2018 | | | | | 9,975 | | | | 10,031,109 | |
Term Loan - Second Lien, 11.00%, Maturing October 22, 2018 | | | | | 1,125 | | | | 1,136,250 | |
Expert Global Solutions, Inc. | |
Term Loan, 8.00%, Maturing April 3, 2018 | | | | | 9,154 | | | | 9,245,540 | |
Garda World Security Corp. | |
Term Loan, Maturing October 24, 2019(3) | | | | | 1,700 | | | | 1,714,875 | |
Genesys Telecom Holdings, U.S., Inc. | |
Term Loan, 6.75%, Maturing January 31, 2019 | | | | | 1,642 | | | | 1,667,402 | |
Genpact International, Inc. | |
Term Loan, 4.25%, Maturing August 30, 2019 | | | | | 6,350 | | | | 6,373,812 | |
Go Daddy Operating Company, LLC | |
Term Loan, 5.50%, Maturing December 17, 2018 | | | | | 9,685 | | | | 9,659,897 | |
IG Investment Holdings, LLC | |
Term Loan, Maturing October 31, 2019(3) | | | | | 3,600 | | | | 3,595,500 | |
IMS Health Incorporated | |
Term Loan, 4.50%, Maturing August 25, 2017 | | | | | 9,183 | | | | 9,249,745 | |
Infor (US), Inc. | |
Term Loan, 5.25%, Maturing April 5, 2018 | | | | | 41,607 | | | | 42,107,637 | |
KAR Auction Services, Inc. | |
Term Loan, 5.00%, Maturing May 19, 2017 | | | | | 11,653 | | | | 11,735,950 | |
Kronos Incorporated | |
Term Loan, Maturing October 25, 2019(3) | | | | | 7,250 | | | | 7,268,125 | |
Term Loan - Second Lien, Maturing April 24, 2020(3) | | | | | 4,175 | | | | 4,185,437 | |
Language Line, LLC | |
Term Loan, 6.25%, Maturing June 20, 2016 | | | | | 6,957 | | | | 6,917,725 | |
Meritas LLC | |
Term Loan, 7.50%, Maturing July 28, 2017 | | | | | 3,735 | | | | 3,734,626 | |
Mitchell International, Inc. | |
Term Loan - Second Lien, 5.63%, Maturing March 30, 2015 | | | | | 1,000 | | | | 987,500 | |
Monitronics International Inc. | |
Term Loan, 5.50%, Maturing March 16, 2018 | | | | | 2,264 | | | | 2,285,317 | |
Quintiles Transnational Corp. | |
Term Loan, 4.50%, Maturing June 8, 2018 | | | | | 2,250 | | | | 2,258,438 | |
Term Loan, 5.00%, Maturing June 8, 2018 | | | | | 25,644 | | | | 25,855,560 | |
| | | | |
| | 22 | | See Notes to Financial Statements. |
Senior Debt Portfolio
October 31, 2012
Portfolio of Investments — continued
| | | | | | | | | | |
| Borrower/Tranche Description | | | | Principal
Amount*
(000’s omitted) | | | Value | |
| | | | | | | | | | |
|
Business Equipment and Services (continued) | |
Sabre, Inc. | |
Term Loan, 2.21%, Maturing September 30, 2014 | | | | | 4,138 | | | $ | 4,131,011 | |
Sensus USA Inc. | |
Term Loan, 4.75%, Maturing May 9, 2017 | | | | | 1,921 | | | | 1,927,953 | |
Softlayer Technologies, Inc. | |
Term Loan, 7.25%, Maturing November 5, 2016 | | | | | 1,400 | | | | 1,408,813 | |
SunGard Data Systems, Inc. | |
Term Loan, 3.90%, Maturing February 26, 2016 | | | | | 24,078 | | | | 24,176,237 | |
Term Loan, 3.97%, Maturing February 28, 2017 | | | | | 10,961 | | | | 11,015,942 | |
SymphonyIRI Group, Inc. | |
Term Loan, 5.00%, Maturing December 1, 2017 | | | | | 913 | | | | 915,150 | |
Trans Union, LLC | |
Term Loan, 5.50%, Maturing February 12, 2018 | | | | | 12,806 | | | | 12,943,252 | |
Travelport LLC | |
Term Loan, 4.65%, Maturing August 21, 2015 | | EUR | | | 740 | | | | 913,924 | |
Term Loan, 4.86%, Maturing August 21, 2015 | | | | | 5,549 | | | | 5,313,702 | |
Term Loan, 4.86%, Maturing August 21, 2015 | | | | | 7,792 | | | | 7,461,909 | |
Term Loan, 4.86%, Maturing August 21, 2015 | | | | | 2,922 | | | | 2,798,704 | |
U.S. Security Holdings, Inc. | |
Term Loan, 6.00%, Maturing July 28, 2017 | | | | | 349 | | | | 351,749 | |
Term Loan, 6.00%, Maturing July 28, 2017 | | | | | 2,278 | | | | 2,297,731 | |
West Corporation | |
Term Loan, 5.50%, Maturing July 15, 2016 | | | | | 1,804 | | | | 1,825,162 | |
Term Loan, 5.50%, Maturing July 15, 2016 | | | | | 5,133 | | | | 5,192,730 | |
Term Loan, 5.75%, Maturing June 29, 2018 | | | | | 4,564 | | | | 4,620,607 | |
| | | | | | | | | | | |
| | | | | | | | $ | 346,928,394 | |
| | | | | | | | | | | |
|
Cable and Satellite Television — 3.6% | |
Atlantic Broadband Finance, LLC | |
Term Loan, 5.25%, Maturing April 4, 2019 | | | | | 6,509 | | | $ | 6,550,532 | |
Term Loan - Second Lien, 9.75%, Maturing October 4, 2019 | | | | | 2,000 | | | | 2,080,000 | |
BBHI Acquisition LLC | |
Term Loan, 4.50%, Maturing December 14, 2017 | | | | | 2,726 | | | | 2,740,070 | |
Bragg Communications Incorporated | |
Term Loan, 4.00%, Maturing February 28, 2018 | | | | | 1,045 | | | | 1,049,974 | |
Cequel Communications, LLC | |
Term Loan, 4.00%, Maturing February 14, 2019 | | | | | 25,472 | | | | 25,551,600 | |
Charter Communications Operating, LLC | |
Term Loan, 3.47%, Maturing September 6, 2016 | | | | | 2,661 | | | | 2,675,138 | |
Term Loan, 4.00%, Maturing May 15, 2019 | | | | | 10,970 | | | | 11,056,263 | |
Crown Media Holdings, Inc. | |
Term Loan, 5.75%, Maturing July 14, 2018 | | | | | 1,379 | | | | 1,385,748 | |
CSC Holdings, Inc. | |
Term Loan, 1.96%, Maturing March 29, 2016 | | | | | 7,025 | | | | 7,028,211 | |
| | | | | | | | | | |
| Borrower/Tranche Description | | | | Principal
Amount*
(000’s omitted) | | | Value | |
| | | | | | | | | | |
|
Cable and Satellite Television (continued) | |
Kabel Deutschland GMBH | |
Term Loan, 4.25%, Maturing February 1, 2019 | | | | | 3,998 | | | $ | 4,012,856 | |
Lavena Holdings 4 GmbH | |
Term Loan, 2.95%, Maturing March 6, 2015 | | EUR | | | 3,467 | | | | 4,224,513 | |
Term Loan, 3.32%, Maturing March 4, 2016 | | EUR | | | 3,467 | | | | 4,224,513 | |
MCC Iowa LLC | |
Term Loan, 1.93%, Maturing January 30, 2015 | | | | | 1,852 | | | | 1,840,578 | |
Mediacom Broadband LLC | |
Term Loan, 4.50%, Maturing October 23, 2017 | | | | | 3,299 | | | | 3,297,001 | |
Mediacom Illinois, LLC | |
Term Loan, 1.68%, Maturing January 30, 2015 | | | | | 5,680 | | | | 5,583,972 | |
Term Loan, 4.50%, Maturing October 23, 2017 | | | | | 2,862 | | | | 2,851,802 | |
UPC Broadband Holding B.V. | |
Term Loan, 3.87%, Maturing December 31, 2016 | | EUR | | | 7,221 | | | | 9,308,562 | |
UPC Financing Partnership | |
Term Loan, 3.71%, Maturing December 30, 2016 | | | | | 453 | | | | 450,854 | |
Term Loan, 3.71%, Maturing December 29, 2017 | | | | | 11,593 | | | | 11,575,393 | |
Term Loan, 4.75%, Maturing December 29, 2017 | | | | | 2,500 | | | | 2,518,750 | |
WaveDivision Holdings, LLC | |
Term Loan, 5.50%, Maturing August 9, 2019 | | | | | 1,275 | | | | 1,288,532 | |
YPSO Holding SA | |
Term Loan, Maturing June 6, 2016(3) | | EUR | | | 586 | | | | 720,503 | |
Term Loan, Maturing June 6, 2016(3) | | EUR | | | 732 | | | | 899,262 | |
Term Loan, Maturing June 6, 2016(3) | | EUR | | | 2,682 | | | | 3,296,348 | |
| | | | | | | | | | | |
| | | | | | | | $ | 116,210,975 | |
| | | | | | | | | | | |
|
Chemicals and Plastics — 4.5% | |
Ashland, Inc. | |
Term Loan, 3.75%, Maturing August 23, 2018 | | | | | 1,758 | | | $ | 1,772,117 | |
AZ Chem US Inc. | |
Term Loan, 7.25%, Maturing December 22, 2017 | | | | | 2,736 | | | | 2,796,474 | |
Chemtura Corporation | |
Term Loan, 5.50%, Maturing August 27, 2016 | | | | | 3,650 | | | | 3,700,187 | |
Emerald Performance Materials, LLC | |
Term Loan, 6.75%, Maturing May 18, 2018 | | | | | 5,536 | | | | 5,598,406 | |
General Chemical Corporation | |
Term Loan, 5.00%, Maturing October 6, 2015 | | | | | 1,162 | | | | 1,167,433 | |
Harko C.V. | |
Term Loan, 5.75%, Maturing August 2, 2017 | | | | | 1,510 | | | | 1,520,602 | |
Houghton International, Inc. | |
Term Loan, 6.75%, Maturing January 29, 2016 | | | | | 4,443 | | | | 4,481,737 | |
Huntsman International, LLC | |
Term Loan, 2.79%, Maturing April 19, 2017 | | | | | 3,467 | | | | 3,462,863 | |
Ineos US Finance LLC | |
Term Loan, 6.50%, Maturing May 4, 2018 | | | | | 34,563 | | | | 35,095,310 | |
| | | | |
| | 23 | | See Notes to Financial Statements. |
Senior Debt Portfolio
October 31, 2012
Portfolio of Investments — continued
| | | | | | | | | | |
| Borrower/Tranche Description | | | | Principal
Amount*
(000’s omitted) | | | Value | |
| | | | | | | | | | |
|
Chemicals and Plastics (continued) | |
Momentive Performance Materials GmbH | |
Term Loan, 3.61%, Maturing May 5, 2015 | | EUR | | | 2,798 | | | $ | 3,599,487 | |
Momentive Performance Materials Inc. | |
Term Loan, 3.75%, Maturing May 5, 2015 | | | | | 1,741 | | | | 1,739,073 | |
Momentive Performance Materials USA Inc. | |
Term Loan, 3.75%, Maturing May 5, 2015 | | | | | 5,796 | | | | 5,781,373 | |
Momentive Specialty Chemicals Inc. | |
Term Loan, 3.82%, Maturing May 5, 2015 | | EUR | | | 714 | | | | 893,148 | |
Term Loan, 4.00%, Maturing May 5, 2015 | | | | | 7,460 | | | | 7,441,248 | |
Term Loan, 4.13%, Maturing May 5, 2015 | | | | | 3,276 | | | | 3,267,949 | |
Term Loan, 4.13%, Maturing May 5, 2015 | | | | | 3,790 | | | | 3,676,300 | |
OEP Pearl Dutch Acquisition B.V. | |
Term Loan, 6.50%, Maturing March 30, 2018 | | | | | 265 | | | | 267,733 | |
Omnova Solutions Inc. | |
Term Loan, 5.50%, Maturing May 31, 2017 | | | | | 7,284 | | | | 7,347,290 | |
PolyOne Corp. | |
Term Loan, 5.00%, Maturing December 20, 2017 | | | | | 5,145 | | | | 5,191,522 | |
Schoeller Arca Systems Holding B.V. | |
Term Loan, 4.78%, Maturing November 16, 2015 | | EUR | | | 289 | | | | 262,252 | |
Term Loan, 4.78%, Maturing November 16, 2015 | | EUR | | | 824 | | | | 747,728 | |
Term Loan, 4.78%, Maturing November 16, 2015 | | EUR | | | 887 | | | | 804,629 | |
Sonneborn LLC | |
Term Loan, 6.50%, Maturing March 30, 2018 | | | | | 1,501 | | | | 1,517,157 | |
Styron S.A.R.L., LLC | |
Term Loan, 8.00%, Maturing August 2, 2017 | | | | | 6,284 | | | | 6,014,491 | |
Taminco Global Chemical Corporation | |
Term Loan, 5.25%, Maturing February 15, 2019 | | | | | 3,980 | | | | 4,026,435 | |
Tronox Pigments (Netherlands) B.V. | |
Term Loan, 4.25%, Maturing February 8, 2018 | | | | | 1,742 | | | | 1,756,839 | |
Term Loan, 4.25%, Maturing February 8, 2018 | | | | | 6,388 | | | | 6,437,750 | |
Univar Inc. | |
Term Loan, 5.00%, Maturing June 30, 2017 | | | | | 26,698 | | | | 26,482,557 | |
| | | | | | | | | | | |
| | | | | | | | $ | 146,850,090 | |
| | | | | | | | | | | |
|
Clothing / Textiles — 0.2% | |
Ascena Retail Group, Inc. | |
Term Loan, 4.75%, Maturing June 14, 2018 | | | | | 3,367 | | | $ | 3,389,708 | |
Warnaco Inc. | |
Term Loan, 3.75%, Maturing June 15, 2018 | | | | | 1,432 | | | | 1,424,716 | |
Wolverine Worldwide, Inc. | |
Term Loan, 5.25%, Maturing July 31, 2019 | | | | | 2,125 | | | | 2,150,234 | |
| | | | | | | | | | | |
| | | | | | | | $ | 6,964,658 | |
| | | | | | | | | | | |
| | | | | | | | | | |
| Borrower/Tranche Description | | | | Principal
Amount*
(000’s omitted) | | | Value | |
| | | | | | | | | | |
|
Conglomerates — 2.0% | |
Jason Incorporated | |
Term Loan, 8.25%, Maturing September 21, 2014 | | | | | 565 | | | $ | 566,216 | |
Term Loan, 7.75%, Maturing September 22, 2014 | | | | | 569 | | | | 570,739 | |
Term Loan, 8.25%, Maturing September 22, 2014 | | | | | 228 | | | | 228,084 | |
Rexnord Corporation | |
Term Loan, 4.50%, Maturing April 2, 2018 | | | | | 19,151 | | | | 19,306,158 | |
RGIS Services, LLC | |
Term Loan, 4.61%, Maturing October 18, 2016 | | | | | 4,971 | | | | 4,958,819 | |
Term Loan, 5.50%, Maturing October 18, 2017 | | | | | 6,397 | | | | 6,420,443 | |
Rocket Software, Inc. | |
Term Loan, 5.75%, Maturing February 8, 2018 | | | | | 3,831 | | | | 3,857,690 | |
Term Loan, 6.75%, Maturing February 8, 2018 | | | | | 1,000 | | | | 1,000,000 | |
Term Loan - Second Lien, 10.25%, Maturing February 8, 2019 | | | | | 1,000 | | | | 1,007,500 | |
Spectrum Brands, Inc. | |
Term Loan, 5.02%, Maturing June 17, 2016 | | | | | 3,647 | | | | 3,660,669 | |
Walter Energy, Inc. | |
Term Loan, 5.75%, Maturing April 2, 2018 | | | | | 22,260 | | | | 22,000,279 | |
| | | | | | | | | | | |
| | | | | | | | $ | 63,576,597 | |
| | | | | | | | | | | |
|
Containers and Glass Products — 1.7% | |
Berry Plastics Holding Corporation | |
Term Loan, 2.21%, Maturing April 3, 2015 | | | | | 17,579 | | | $ | 17,490,941 | |
BWAY Corporation | |
Term Loan, 5.25%, Maturing February 23, 2018 | | | | | 894 | | | | 895,559 | |
Term Loan, 5.25%, Maturing February 23, 2018 | | | | | 7,972 | | | | 7,990,096 | |
Hilex Poly Co. LLC | |
Term Loan, 11.25%, Maturing November 16, 2015 | | | | | 1,152 | | | | 1,175,022 | |
Pelican Products, Inc. | |
Term Loan, 7.00%, Maturing July 11, 2018 | | | | | 6,236 | | | | 6,283,022 | |
Reynolds Group Holdings Inc. | |
Term Loan, 4.75%, Maturing September 20, 2018 | | | | | 15,375 | | | | 15,460,485 | |
Sealed Air Corporation | |
Term Loan, 4.75%, Maturing October 3, 2018 | | | | | 733 | | | | 738,165 | |
TricorBraun, Inc. | |
Term Loan, 5.50%, Maturing May 3, 2018 | | | | | 6,559 | | | | 6,607,752 | |
| | | | | | | | | | | |
| | | | | | | | $ | 56,641,042 | |
| | | | | | | | | | | |
|
Cosmetics / Toiletries — 0.6% | |
Bausch & Lomb, Inc. | |
Term Loan, 5.25%, Maturing May 17, 2019 | | | | | 14,838 | | | $ | 15,023,285 | |
Huish Detergents, Inc. | |
Term Loan, 2.22%, Maturing April 25, 2014 | | | | | 1,853 | | | | 1,774,705 | |
| | | | |
| | 24 | | See Notes to Financial Statements. |
Senior Debt Portfolio
October 31, 2012
Portfolio of Investments — continued
| | | | | | | | | | |
| Borrower/Tranche Description | | | | Principal
Amount*
(000’s omitted) | | | Value | |
| | | | | | | | | | |
|
Cosmetics / Toiletries (continued) | |
Prestige Brands, Inc. | |
Term Loan, 5.28%, Maturing January 31, 2019 | | | | | 1,084 | | | $ | 1,097,933 | |
| | | | | | | | | | | |
| | | | | | | | $ | 17,895,923 | |
| | | | | | | | | | | |
| | | |
Drugs — 1.0% | | | | | | | | | | |
Aptalis Pharma, Inc. | |
Term Loan, 5.50%, Maturing February 10, 2017 | | | | | 2,488 | | | $ | 2,498,383 | |
Term Loan, 5.50%, Maturing February 10, 2017 | | | | | 5,885 | | | | 5,914,826 | |
Endo Pharmaceuticals Holdings, Inc. | |
Term Loan, 4.00%, Maturing June 18, 2018 | | | | | 608 | | | | 611,975 | |
Par Pharmaceutical Companies, Inc. | |
Term Loan, 5.00%, Maturing September 30, 2019 | | | | | 7,350 | | | | 7,346,722 | |
Warner Chilcott Company, LLC | |
Term Loan, 4.25%, Maturing March 15, 2018 | | | | | 3,034 | | | | 3,049,458 | |
Warner Chilcott Corporation | |
Term Loan, 4.25%, Maturing March 15, 2018 | | | | | 2,305 | | | | 2,316,094 | |
Term Loan, 4.25%, Maturing March 15, 2018 | | | | | 6,069 | | | | 6,098,916 | |
WC Luxco S.a.r.l. | |
Term Loan, 4.25%, Maturing March 15, 2018 | | | | | 4,172 | | | | 4,193,005 | |
| | | | | | | | | | | |
| | | | | | | | $ | 32,029,379 | |
| | | | | | | | | | | |
|
Ecological Services and Equipment — 0.5% | |
ADS Waste Holdings | |
Term Loan, 5.25%, Maturing September 11, 2019 | | | | | 14,075 | | | $ | 14,223,083 | |
Envirotest Systems Holding Corp. | |
Term Loan - Second Lien, 15.50%, Maturing March 31, 2017(5) | | | | | 46 | | | | 47,682 | |
Progressive Waste Solutions Ltd. | |
Term Loan, Maturing October 11, 2019(3) | | | | | 2,300 | | | | 2,321,563 | |
Safety Kleen (SK Holdings) | |
Term Loan, 5.00%, Maturing February 17, 2017 | | | | | 992 | | | | 990,841 | |
| | | | | | | | | | | |
| | | | | | | | $ | 17,583,169 | |
| | | | | | | | | | | |
|
Electronics / Electrical — 7.5% | |
Aeroflex Incorporated | |
Term Loan, 5.75%, Maturing May 9, 2018 | | | | | 12,561 | | | $ | 12,603,855 | |
Aspect Software, Inc. | |
Term Loan, 6.25%, Maturing May 6, 2016 | | | | | 10,209 | | | | 10,068,543 | |
Attachmate Corporation | |
Term Loan, 7.25%, Maturing November 22, 2017 | | | | | 16,019 | | | | 16,203,124 | |
Cinedigm Digital Funding I, LLC | |
Term Loan, 5.25%, Maturing April 29, 2016 | | | | | 1,005 | | | | 1,014,705 | |
CommScope, Inc. | |
Term Loan, 4.25%, Maturing January 12, 2018 | | | | | 13,386 | | | | 13,502,735 | |
| | | | | | | | | | |
| Borrower/Tranche Description | | | | Principal
Amount*
(000’s omitted) | | | Value | |
| | | | | | | | | | |
|
Electronics / Electrical (continued) | |
CompuCom Systems, Inc. | |
Term Loan, 6.50%, Maturing October 2, 2018 | | | | | 8,875 | | | $ | 8,891,641 | |
Dealer Computer Services, Inc. | |
Term Loan, 3.75%, Maturing April 20, 2018 | | | | | 3,334 | | | | 3,357,183 | |
DG FastChannel, Inc. | |
Term Loan, 5.75%, Maturing July 26, 2018 | | | | | 9,448 | | | | 9,117,112 | |
Eagle Parent, Inc. | |
Term Loan, 5.00%, Maturing May 16, 2018 | | | | | 8,426 | | | | 8,486,987 | |
Edwards (Cayman Islands II) Limited | |
Term Loan, 5.50%, Maturing May 31, 2016 | | | | | 3,894 | | | | 3,911,039 | |
Term Loan, 5.50%, Maturing May 31, 2016 | | | | | 4,292 | | | | 4,310,704 | |
Freescale Semiconductor, Inc. | |
Term Loan, 4.46%, Maturing December 1, 2016 | | | | | 10,834 | | | | 10,617,018 | |
Hyland Software, Inc. | |
Term Loan, Maturing October 29, 2019(3) | | | | | 1,550 | | | | 1,552,584 | |
InfoGroup Inc. | |
Term Loan, 5.75%, Maturing May 25, 2018 | | | | | 2,275 | | | | 2,036,335 | |
Magic Newco LLC | |
Term Loan, 7.25%, Maturing December 12, 2018 | | | | | 9,225 | | | | 9,265,359 | |
Microsemi Corporation | |
Term Loan, 4.00%, Maturing February 2, 2018 | | | | | 7,597 | | | | 7,659,046 | |
NeuStar, Inc. | |
Term Loan, 5.00%, Maturing November 8, 2018 | | | | | 2,574 | | | | 2,602,957 | |
Nxp B.V. | |
Term Loan, 4.50%, Maturing March 3, 2017 | | | | | 11,894 | | | | 12,082,696 | |
Term Loan, 5.50%, Maturing March 3, 2017 | | | | | 2,747 | | | | 2,810,209 | |
Term Loan, 5.25%, Maturing March 19, 2019 | | | | | 4,254 | | | | 4,320,973 | |
Open Solutions, Inc. | |
Term Loan, 2.44%, Maturing January 23, 2014 | | | | | 5,269 | | | | 5,095,902 | |
Rovi Solutions Corporation | |
Term Loan, 4.00%, Maturing March 29, 2019 | | | | | 9,154 | | | | 8,993,805 | |
SafeNet Inc. | |
Term Loan, 2.71%, Maturing April 12, 2014 | | | | | 2,717 | | | | 2,710,599 | |
Semtech Corporation | |
Term Loan, 4.25%, Maturing March 20, 2017 | | | | | 1,070 | | | | 1,078,984 | |
Sensata Technologies Finance Company, LLC | |
Term Loan, 4.00%, Maturing May 11, 2018 | | | | | 12,820 | | | | 12,883,786 | |
Serena Software, Inc. | |
Term Loan, 4.22%, Maturing March 10, 2016 | | | | | 10,397 | | | | 10,318,990 | |
Term Loan, 5.00%, Maturing March 10, 2016 | | | | | 900 | | | | 903,375 | |
Shield Finance Co. S.A.R.L. | |
Term Loan, 6.50%, Maturing May 10, 2019 | | | | | 4,090 | | | | 4,115,311 | |
SkillSoft Corporation | |
Term Loan, 5.00%, Maturing May 26, 2017 | | | | | 7,109 | | | | 7,189,319 | |
Sophia, L.P. | |
Term Loan, 6.25%, Maturing July 19, 2018 | | | | | 6,532 | | | | 6,632,468 | |
| | | | |
| | 25 | | See Notes to Financial Statements. |
Senior Debt Portfolio
October 31, 2012
Portfolio of Investments — continued
| | | | | | | | | | |
| Borrower/Tranche Description | | | | Principal
Amount*
(000’s omitted) | | | Value | |
| | | | | | | | | | |
|
Electronics / Electrical (continued) | |
Spansion LLC | |
Term Loan, 4.75%, Maturing February 9, 2015 | | | | | 1,020 | | | $ | 1,031,397 | |
SS&C Technologies Inc. | |
Term Loan, 5.00%, Maturing June 7, 2019 | | | | | 977 | | | | 987,692 | |
Term Loan, 5.00%, Maturing June 7, 2019 | | | | | 9,441 | | | | 9,562,442 | |
VeriFone Inc. | |
Term Loan, 4.25%, Maturing December 28, 2018 | | | | | 2,079 | | | | 2,080,609 | |
Vertafore, Inc. | |
Term Loan, 5.25%, Maturing July 29, 2016 | | | | | 10,530 | | | | 10,573,772 | |
Wall Street Systems, Inc. | |
Term Loan, Maturing October 24, 2019(3) | | | | | 6,350 | | | | 6,270,625 | |
Term Loan - Second Lien, Maturing April 24, 2020(3) | | | | | 3,250 | | | | 3,237,812 | |
Web.com Group, Inc. | |
Term Loan, 7.00%, Maturing October 27, 2017 | | | | | 5,481 | | | | 5,488,289 | |
| | | | | | | | | | | |
| | | | | | | | $ | 243,569,982 | |
| | | | | | | | | | | |
|
Equipment Leasing — 0.9% | |
BakerCorp International, Inc. | |
Term Loan, 5.00%, Maturing June 1, 2018 | | | | | 8,357 | | | $ | 8,400,873 | |
Delos Aircraft Inc. | |
Term Loan, 4.75%, Maturing April 12, 2016 | | | | | 4,450 | | | | 4,522,312 | |
Flying Fortress Inc. | |
Term Loan, 5.00%, Maturing June 30, 2017 | | | | | 17,400 | | | | 17,704,500 | |
| | | | | | | | | | | |
| | | | | | | | $ | 30,627,685 | |
| | | | | | | | | | | |
|
Financial Intermediaries — 3.8% | |
American Capital Holdings, Inc. | |
Term Loan, 5.50%, Maturing August 22, 2016 | | | | | 3,275 | | | $ | 3,299,563 | |
Asset Acceptance Capital Corp. | |
Term Loan, 8.75%, Maturing November 14, 2017 | | | | | 8,194 | | | | 8,275,983 | |
CB Richard Ellis Services, Inc. | |
Term Loan, 3.46%, Maturing March 5, 2018 | | | | | 1,752 | | | | 1,756,487 | |
Term Loan, 3.71%, Maturing September 4, 2019 | | | | | 890 | | | | 892,386 | |
Citco III Limited | |
Term Loan, 5.50%, Maturing June 29, 2018 | | | | | 11,707 | | | | 11,817,016 | |
First Data Corporation | |
Term Loan, 2.96%, Maturing September 24, 2014 | | | | | 190 | | | | 190,002 | |
Term Loan, 2.96%, Maturing September 24, 2014 | | | | | 311 | | | | 311,346 | |
Term Loan, 2.96%, Maturing September 24, 2014 | | | | | 554 | | | | 555,036 | |
Term Loan, 4.21%, Maturing March 23, 2018 | | | | | 4,755 | | | | 4,560,049 | |
Term Loan, 5.21%, Maturing September 24, 2018 | | | | | 5,025 | | | | 4,938,108 | |
Grosvenor Capital Management Holdings, LLP | |
Term Loan, 2.50%, Maturing December 5, 2013 | | | | | 1,252 | | | | 1,202,335 | |
Term Loan, 4.25%, Maturing December 5, 2016 | | | | | 1,294 | | | | 1,273,150 | |
| | | | | | | | | | |
| Borrower/Tranche Description | | | | Principal
Amount*
(000’s omitted) | | | Value | |
| | | | | | | | | | |
|
Financial Intermediaries (continued) | |
Hamilton Lane Advisors, LLC | |
Term Loan, 6.50%, Maturing February 23, 2018 | | | | | 4,826 | | | $ | 4,826,250 | |
Harbourvest Partners, LLC | |
Term Loan, 6.25%, Maturing December 16, 2016 | | | | | 2,086 | | | | 2,090,978 | |
iPayment, Inc. | |
Term Loan, 5.75%, Maturing May 8, 2017 | | | | | 4,065 | | | | 4,057,877 | |
LPL Holdings, Inc. | |
Term Loan, 2.71%, Maturing March 29, 2017 | | | | | 2,096 | | | | 2,072,667 | |
Term Loan, 4.00%, Maturing March 29, 2019 | | | | | 8,557 | | | | 8,605,133 | |
Mercury Payment Systems Canada, LLC | |
Term Loan, 5.50%, Maturing July 3, 2017 | | | | | 8,976 | | | | 9,065,697 | |
MIP Delaware, LLC | |
Term Loan, 5.50%, Maturing July 12, 2018 | | | | | 1,960 | | | | 1,979,341 | |
Nuveen Investments, Inc. | |
Term Loan, 5.85%, Maturing May 12, 2017 | | | | | 20,508 | | | | 20,533,458 | |
Term Loan, 5.84%, Maturing May 13, 2017 | | | | | 8,579 | | | | 8,600,861 | |
Term Loan, 7.25%, Maturing May 13, 2017 | | | | | 1,400 | | | | 1,405,600 | |
Oz Management LP | |
Term Loan, 1.71%, Maturing November 15, 2016 | | | | | 3,482 | | | | 3,117,773 | |
RJO Holdings Corp. | |
Term Loan, 6.22%, Maturing December 10, 2015(5) | | | | | 23 | | | | 18,533 | |
Term Loan, 6.97%, Maturing December 10, 2015(5) | | | | | 715 | | | | 550,980 | |
RPI Finance Trust | |
Term Loan, 3.50%, Maturing May 9, 2018 | | | | | 7,739 | | | | 7,774,895 | |
Term Loan, 4.00%, Maturing November 9, 2018 | | | | | 6,072 | | | | 6,114,948 | |
Springleaf Financial Funding Company | |
Term Loan, 5.50%, Maturing May 10, 2017 | | | | | 2,000 | | | | 1,975,000 | |
Vantiv, LLC | |
Term Loan, 3.75%, Maturing March 27, 2019 | | | | | 1,244 | | | | 1,247,637 | |
| | | | | | | | | | | |
| | | $ | 123,109,089 | |
| | | | | | | | | | | |
|
Food Products — 4.2% | |
AdvancePierre Foods, Inc. | |
Term Loan, 5.75%, Maturing July 10, 2017 | | | | | 8,250 | | | $ | 8,329,060 | |
American Seafoods Group LLC | |
Term Loan, 4.25%, Maturing March 16, 2018 | | | | | 1,579 | | | | 1,564,955 | |
Blue Buffalo Company, Ltd. | |
Term Loan, 6.50%, Maturing August 8, 2019 | | | | | 6,550 | | | | 6,599,125 | |
Clearwater Seafoods Limited Partnership | |
Term Loan, 6.75%, Maturing June 6, 2018 | | | | | 4,015 | | | | 4,029,993 | |
Del Monte Foods Company | |
Term Loan, 4.50%, Maturing March 8, 2018 | | | | | 26,284 | | | | 26,283,585 | |
Dole Food Company Inc. | |
Term Loan, 5.04%, Maturing July 6, 2018 | | | | | 2,834 | | | | 2,846,230 | |
| | | | |
| | 26 | | See Notes to Financial Statements. |
Senior Debt Portfolio
October 31, 2012
Portfolio of Investments — continued
| | | | | | | | | | |
| Borrower/Tranche Description | | | | Principal
Amount*
(000’s omitted) | | | Value | |
| | | | | | | | | | |
|
Food Products (continued) | |
Hearthside Food Solutions, LLC | |
Term Loan, 6.50%, Maturing June 5, 2018 | | | | | 4,464 | | | $ | 4,469,392 | |
High Liner Foods Incorporated | |
Term Loan, 7.00%, Maturing December 19, 2017 | | | | | 3,454 | | | | 3,473,078 | |
JBS USA Holdings Inc. | |
Term Loan, 4.25%, Maturing May 25, 2018 | | | | | 9,311 | | | | 9,311,354 | |
Michael Foods Group, Inc. | |
Term Loan, 4.25%, Maturing February 23, 2018 | | | | | 3,009 | | | | 3,025,771 | |
NBTY, Inc. | |
Term Loan, 4.25%, Maturing October 2, 2017 | | | | | 32,809 | | | | 33,020,651 | |
Pinnacle Foods Finance LLC | |
Term Loan, 4.75%, Maturing October 17, 2018 | | | | | 5,249 | | | | 5,281,429 | |
Term Loan, 4.75%, Maturing October 17, 2018 | | | | | 16,890 | | | | 16,960,569 | |
Solvest Ltd. | |
Term Loan, 5.02%, Maturing July 6, 2018 | | | | | 5,072 | | | | 5,093,261 | |
Windsor Quality Food Company Ltd. | |
Term Loan, 5.00%, Maturing February 16, 2017 | | | | | 4,974 | | | | 4,973,877 | |
| | | | | | | | | | | |
| | | $ | 135,262,330 | |
| | | | | | | | | | | |
| | | |
Food Service — 5.1% | | | | | | | | | | |
Aramark Corporation | |
Term Loan, 3.40%, Maturing July 26, 2016 | | | | | 441 | | | $ | 442,406 | |
Term Loan, 3.46%, Maturing July 26, 2016 | | | | | 918 | | | | 921,107 | |
Term Loan, 3.46%, Maturing July 26, 2016 | | | | | 21,466 | | | | 21,527,561 | |
Term Loan, 3.57%, Maturing July 26, 2016 | | | | | 5,581 | | | | 5,594,023 | |
Brasa Holdings, Inc. | |
Term Loan, 7.50%, Maturing July 19, 2019 | | | | | 1,775 | | | | 1,792,750 | |
Buffets, Inc. | |
Term Loan, 0.24%, Maturing April 22, 2015(5) | | | | | 295 | | | | 294,849 | |
Burger King Corporation | |
Term Loan, 3.75%, Maturing September 27, 2019 | | | | | 11,200 | | | | 11,259,506 | |
Centerplate, Inc. | |
Term Loan, 5.75%, Maturing October 15, 2018 | | | | | 2,575 | | | | 2,594,313 | |
DineEquity, Inc. | |
Term Loan, 4.25%, Maturing October 19, 2017 | | | | | 5,097 | | | | 5,140,007 | |
Dunkin’ Brands, Inc. | |
Term Loan, 4.00%, Maturing November 23, 2017 | | | | | 28,443 | | | | 28,572,857 | |
Landry’s, Inc. | |
Term Loan, 6.50%, Maturing April 24, 2018 | | | | | 6,144 | | | | 6,219,649 | |
NPC International, Inc. | |
Term Loan, 5.25%, Maturing December 28, 2018 | | | | | 1,766 | | | | 1,797,032 | |
OSI Restaurant Partners, LLC | |
Term Loan, 4.75%, Maturing October 24, 2019 | | | | | 17,155 | | | | 17,227,909 | |
| | | | | | | | | | |
| Borrower/Tranche Description | | | | Principal
Amount*
(000’s omitted) | | | Value | |
| | | | | | | | | | |
| | | |
Food Service (continued) | | | | | | | | | | |
P.F. Chang’s China Bistro Inc. | |
Term Loan, 6.25%, Maturing July 2, 2019 | | | | | 1,675 | | | $ | 1,696,636 | |
Sagittarius Restaurants, LLC | |
Term Loan, 7.51%, Maturing May 18, 2015 | | | | | 894 | | | | 895,984 | |
US Foods, Inc. | |
Term Loan, 2.71%, Maturing July 3, 2014 | | | | | 2,425 | | | | 2,401,981 | |
Term Loan, 5.75%, Maturing March 31, 2017 | | | | | 23,135 | | | | 22,845,391 | |
Weight Watchers International, Inc. | | | | | | | | | | |
Term Loan, 4.00%, Maturing March 15, 2019 | | | | | 13,159 | | | | 13,201,641 | |
Wendy’s International, Inc. | | | | | | | | | | |
Term Loan, 4.75%, Maturing May 15, 2019 | | | | | 20,475 | | | | 20,690,417 | |
| | | | | | | | | | | |
| | | $ | 165,116,019 | |
| | | | | | | | | | | |
|
Food / Drug Retailers — 3.6% | |
Alliance Boots Holdings Limited | | | | | | | | | | |
Term Loan, 3.08%, Maturing July 9, 2015 | | EUR | | | 1,749 | | | $ | 2,218,763 | |
Term Loan, 3.49%, Maturing July 9, 2015 | | GBP | | | 26,200 | | | | 40,989,454 | |
Fairway Group Acquisition Company | | | | | | | | | | |
Term Loan, 8.25%, Maturing August 17, 2018 | | | | | 2,000 | | | | 2,020,000 | |
General Nutrition Centers, Inc. | | | | | | | | | | |
Term Loan, 3.75%, Maturing March 2, 2018 | | | | | 21,656 | | | | 21,713,032 | |
Iceland Foods Group Limited | | | | | | | | | | |
Term Loan, 5.11%, Maturing April 12, 2019 | | EUR | | | 2,725 | | | | 3,573,950 | |
Pantry, Inc. (The) | | | | | | | | | | |
Term Loan, 5.75%, Maturing August 2, 2019 | | | | | 1,725 | | | | 1,738,657 | |
Rite Aid Corporation | | | | | | | | | | |
Term Loan, 1.97%, Maturing June 4, 2014 | | | | | 24,002 | | | | 23,834,134 | |
Term Loan, 4.50%, Maturing March 2, 2018 | | | | | 13,823 | | | | 13,796,845 | |
Sprouts Farmers Markets Holdings, LLC | | | | | | | | | | |
Term Loan, 6.00%, Maturing April 18, 2018 | | | | | 1,492 | | | | 1,507,348 | |
Term Loan, 6.00%, Maturing April 18, 2018 | | | | | 6,733 | | | | 6,800,381 | |
| | | | | | | | | | | |
| | | $ | 118,192,564 | |
| | | | | | | | | | | |
|
Forest Products — 0.1% | |
SIG Euro Holding AG & Co. KG | | | | | | | | | | |
Term Loan, 5.25%, Maturing September 28, 2018 | | EUR | | | 2,750 | | | $ | 3,573,322 | |
| | | | | | | | | | | |
| | | $ | 3,573,322 | |
| | | | | | | | | | | |
|
Health Care — 15.4% | |
Alere, Inc. | | | | | | | | | | |
Term Loan, 4.75%, Maturing June 30, 2017 | | | | | 1,244 | | | $ | 1,254,633 | |
Term Loan, 4.75%, Maturing June 30, 2017 | | | | | 1,514 | | | | 1,525,624 | |
Term Loan, 4.75%, Maturing June 30, 2017 | | | | | 15,805 | | | | 15,931,353 | |
| | | | |
| | 27 | | See Notes to Financial Statements. |
Senior Debt Portfolio
October 31, 2012
Portfolio of Investments — continued
| | | | | | | | | | |
| Borrower/Tranche Description | | | | Principal
Amount*
(000’s omitted) | | | Value | |
| | | | | | | | | | |
|
Health Care (continued) | |
Alkermes, Inc. | | | | | | | | | | |
Term Loan, 4.50%, Maturing September 18, 2019 | | | | | 5,000 | | | $ | 5,037,500 | |
Alliance Healthcare Services, Inc. | | | | | | | | | | |
Term Loan, 7.25%, Maturing June 1, 2016 | | | | | 10,255 | | | | 10,100,712 | |
Ardent Medical Services, Inc. | | | | | | | | | | |
Term Loan, 6.50%, Maturing September 15, 2015 | | | | | 4,561 | | | | 4,572,821 | |
AssuraMed. | | | | | | | | | | |
Term Loan, Maturing October 23, 2019(3) | | | | | 3,675 | | | | 3,696,436 | |
Aveta, Inc. | | | | | | | | | | |
Term Loan, 8.50%, Maturing April 4, 2017 | | | | | 4,259 | | | | 4,261,724 | |
Term Loan, 8.50%, Maturing April 4, 2017 | | | | | 4,259 | | | | 4,261,724 | |
Term Loan, Maturing October 9, 2017(3) | | | | | 3,126 | | | | 3,110,684 | |
Term Loan, Maturing October 26, 2017(3) | | | | | 2,274 | | | | 2,262,316 | |
Biomet Inc. | | | | | | | | | | |
Term Loan, 3.96%, Maturing July 25, 2017 | | | | | 17,178 | | | | 17,302,984 | |
BSN Medical Acquisition Holding GmbH | | | | | | | | | | |
Term Loan, 5.00%, Maturing August 28, 2019 | | | | | 4,714 | | | | 4,737,595 | |
Catalent Pharma Solutions Inc. | | | | | | | | | | |
Term Loan, 4.21%, Maturing September 15, 2016 | | | | | 8,028 | | | | 8,067,832 | |
Term Loan, 5.25%, Maturing September 15, 2017 | | | | | 3,130 | | | | 3,163,403 | |
Community Health Systems, Inc. | | | | | | | | | | |
Term Loan, 3.92%, Maturing January 25, 2017 | | | | | 24,185 | | | | 24,321,388 | |
Convatec Inc. | | | | | | | | | | |
Term Loan, 5.00%, Maturing December 22, 2016 | | | | | 3,551 | | | | 3,577,839 | |
CRC Health Corporation | | | | | | | | | | |
Term Loan, 4.86%, Maturing November 16, 2015 | | | | | 7,597 | | | | 7,397,762 | |
DaVita, Inc. | | | | | | | | | | |
Term Loan, 4.50%, Maturing October 20, 2016 | | | | | 6,526 | | | | 6,573,502 | |
Term Loan, Maturing September 2, 2019(3) | | | | | 19,100 | | | | 19,179,590 | |
DJO Finance LLC | | | | | | | | | | |
Term Loan, 5.21%, Maturing November 1, 2016 | | | | | 6,227 | | | | 6,249,979 | |
Term Loan, 6.25%, Maturing September 15, 2017 | | | | | 4,577 | | | | 4,604,462 | |
Drumm Investors LLC | | | | | | | | | | |
Term Loan, 5.00%, Maturing May 4, 2018 | | | | | 9,913 | | | | 9,571,975 | |
Emdeon, Inc. | | | | | | | | | | |
Term Loan, 5.00%, Maturing November 2, 2018 | | | | | 2,512 | | | | 2,541,818 | |
Emergency Medical Services Corporation | |
Term Loan, 5.25%, Maturing May 25, 2018 | | | | | 18,300 | | | | 18,488,071 | |
Fresenius US Finance I Inc. | | | | | | | | | | |
Term Loan, 3.50%, Maturing September 10, 2014 | | | | | 353 | | | | 354,193 | |
Term Loan, 3.50%, Maturing September 10, 2014 | | | | | 617 | | | | 619,608 | |
Grifols Inc. | | | | | | | | | | |
Term Loan, 4.50%, Maturing June 1, 2017 | | | | | 13,573 | | | | 13,735,682 | |
Hanger Orthopedic Group, Inc. | | | | | | | | | | |
Term Loan, 4.01%, Maturing December 1, 2016 | | | | | 3,399 | | | | 3,415,703 | |
| | | | | | | | | | |
| Borrower/Tranche Description | | | | Principal
Amount*
(000’s omitted) | | | Value | |
| | | | | | | | | | |
|
Health Care (continued) | |
HCA, Inc. | | | | | | | | | | |
Term Loan, 3.61%, Maturing March 31, 2017 | | | | | 20,311 | | | $ | 20,371,030 | |
Term Loan, 3.46%, Maturing May 1, 2018 | | | | | 13,788 | | | | 13,821,139 | |
Health Management Associates, Inc. | | | | | | | | | | |
Term Loan, 4.50%, Maturing November 16, 2018 | | | | | 18,306 | | | | 18,494,185 | |
Hologic Inc. | | | | | | | | | | |
Term Loan, 4.50%, Maturing August 1, 2019 | | | | | 7,357 | | | | 7,449,285 | |
Iasis Healthcare LLC | | | | | | | | | | |
Term Loan, 5.00%, Maturing May 3, 2018 | | | | | 16,989 | | | | 17,063,826 | |
inVentiv Health, Inc. | | | | | | | | | | |
Term Loan, 6.50%, Maturing August 4, 2016 | | | | | 12,660 | | | | 12,380,751 | |
Term Loan, 6.75%, Maturing May 15, 2018 | | | | | 9,299 | | | | 9,066,261 | |
Kindred Healthcare, Inc. | | | | | | | | | | |
Term Loan, 5.25%, Maturing June 1, 2018 | | | | | 6,486 | | | | 6,408,727 | |
Term Loan, 6.00%, Maturing June 1, 2018 | | | | | 3,300 | | | | 3,260,786 | |
Kinetic Concepts, Inc. | | | | | | | | | | |
Term Loan, 7.00%, Maturing May 4, 2018 | | | | | 27,642 | | | | 28,056,944 | |
LHP Hospital Group, Inc. | | | | | | | | | | |
Term Loan, 9.00%, Maturing July 3, 2018 | | | | | 2,195 | | | | 2,216,445 | |
MedAssets, Inc. | | | | | | | | | | |
Term Loan, 5.25%, Maturing November 16, 2016 | | | | | 3,467 | | | | 3,506,232 | |
Medpace, Inc. | | | | | | | | | | |
Term Loan, 6.50%, Maturing June 16, 2017 | | | | | 2,352 | | | | 2,269,610 | |
Multiplan, Inc. | | | | | | | | | | |
Term Loan, 4.75%, Maturing August 26, 2017 | | | | | 13,623 | | | | 13,702,631 | |
MX USA, Inc. | | | | | | | | | | |
Term Loan, 6.50%, Maturing April 28, 2017 | | | | | 4,677 | | | | 4,653,118 | |
One Call Medical, Inc. | | | | | | | | | | |
Term Loan, 7.00%, Maturing August 16, 2019 | | | | | 8,350 | | | | 8,391,750 | |
Onex Carestream Finance LP | | | | | | | | | | |
Term Loan, 5.00%, Maturing February 25, 2017 | | | | | 6,760 | | | | 6,701,084 | |
Pharmaceutical Product Development, Inc. | | | | | | | | | | |
Term Loan, 6.25%, Maturing December 5, 2018 | | | | | 20,131 | | | | 20,401,810 | |
Physiotherapy Associates Holdings, Inc. | | | | | | | | | | |
Term Loan, 6.01%, Maturing April 30, 2018 | | | | | 898 | | | | 899,994 | |
Radnet Management, Inc. | | | | | | | | | | |
Term Loan, 5.51%, Maturing September 30, 2018 | | | | | 8,875 | | | | 8,895,341 | |
Select Medical Corporation | | | | | | | | | | |
Term Loan, 5.50%, Maturing June 1, 2018 | | | | | 11,576 | | | | 11,677,428 | |
Sheridan Holdings, Inc. | | | | | | | | | | |
Term Loan, 6.00%, Maturing June 29, 2018 | | | | | 2,294 | | | | 2,315,759 | |
Sunrise Medical Holdings B.V. | | | | | | | | | | |
Term Loan, 7.25%, Maturing May 13, 2014 | | EUR | | | 909 | | | | 1,161,804 | |
TriZetto Group, Inc. (The) | | | | | | | | | | |
Term Loan, 4.75%, Maturing May 2, 2018 | | | | | 8,714 | | | | 8,690,661 | |
| | | | |
| | 28 | | See Notes to Financial Statements. |
Senior Debt Portfolio
October 31, 2012
Portfolio of Investments — continued
| | | | | | | | | | |
| Borrower/Tranche Description | | | | Principal
Amount*
(000’s omitted) | | | Value | |
| | | | | | | | | | |
|
Health Care (continued) | |
Truven Health Analytics Inc. | | | | | | | | | | |
Term Loan, 5.75%, Maturing June 1, 2019 | | | | | 7,075 | | | $ | 7,097,109 | |
Universal Health Services, Inc. | | | | | | | | | | |
Term Loan, 3.75%, Maturing November 15, 2016 | | | | | 1,521 | | | | 1,528,816 | |
Valeant Pharmaceuticals International, Inc. | | | | | | | | | | |
Term Loan, 4.25%, Maturing February 13, 2019 | | | | | 14,479 | | | | 14,558,760 | |
Term Loan, Maturing September 27, 2019(3) | | | | | 14,875 | | | | 14,956,812 | |
Vanguard Health Holding Company II, LLC | | | | | | | | | | |
Term Loan, 5.00%, Maturing January 29, 2016 | | | | | 4,704 | | | | 4,738,250 | |
VWR Funding, Inc. | | | | | | | | | | |
Term Loan, 2.61%, Maturing June 27, 2014 | | EUR | | | 1,234 | | | | 1,599,856 | |
Term Loan, 2.71%, Maturing June 30, 2014 | | | | | 9,678 | | | | 9,694,158 | |
Term Loan, 4.46%, Maturing April 3, 2017 | | | | | 875 | | | | 879,796 | |
Term Loan, 4.61%, Maturing April 3, 2017 | | EUR | | | 1,234 | | | | 1,599,106 | |
| | | | | | | | | | | |
| | | $ | 498,428,177 | |
| | | | | | | | | | | |
|
Home Furnishings — 0.5% | |
Hunter Fan Company | | | | | | | | | | |
Term Loan, 2.83%, Maturing April 16, 2014 | | | | | 968 | | | $ | 924,519 | |
Oreck Corporation | |
Term Loan - Second Lien, 3.88%, Maturing March 19, 2016(5) | | | | | 237 | | | | 214,456 | |
Serta Simmons Holdings, LLC | | | | | | | | | | |
Term Loan, 6.00%, Maturing October 1, 2019 | | | | | 12,800 | | | | 12,813,338 | |
Sofia III S.a.r.l. | | | | | | | | | | |
Term Loan, 2.61%, Maturing June 24, 2016 | | EUR | | | 2,243 | | | | 2,630,693 | |
| | | | | | | | | | | |
| | | $ | 16,583,006 | |
| | | | | | | | | | | |
|
Industrial Equipment — 2.4% | |
Colfax Corporation | | | | | | | | | | |
Term Loan, 4.50%, Maturing January 11, 2019 | | | | | 11,633 | | | $ | 11,762,605 | |
Excelitas Technologies Corp. | | | | | | | | | | |
Term Loan, 5.00%, Maturing November 23, 2016 | | | | | 5,945 | | | | 5,929,933 | |
Generac Power Systems, Inc. | | | | | | | | | | |
Term Loan, 6.25%, Maturing February 8, 2019 | | | | | 5,561 | | | | 5,693,138 | |
Grede LLC | | | | | | | | | | |
Term Loan, 7.00%, Maturing April 3, 2017 | | | | | 6,321 | | | | 6,336,802 | |
Husky Injection Molding Systems Ltd. | | | | | | | | | | |
Term Loan, 5.75%, Maturing June 29, 2018 | | | | | 13,227 | | | | 13,422,999 | |
Kinetek Acquisitions Corporation | | | | | | | | | | |
Term Loan, 4.50%, Maturing November 11, 2013 | | | | | 79 | | | | 78,394 | |
Term Loan, 4.50%, Maturing November 11, 2013 | | | | | 775 | | | | 772,938 | |
Kion Group GMBH | | | | | | | | | | |
Term Loan, 3.36%, Maturing December 23, 2014 | | EUR | | | 3,901 | | | | 4,967,955 | |
| | | | | | | | | | |
| Borrower/Tranche Description | | | | Principal
Amount*
(000’s omitted) | | | Value | |
| | | | | | | | | | |
|
Industrial Equipment (continued) | |
Term Loan, 3.46%, Maturing December 23, 2014 | | | | | 2,826 | | | $ | 2,776,711 | |
Term Loan, 3.96%, Maturing December 23, 2015 | | | | | 2,826 | | | | 2,776,711 | |
Term Loan, 3.86%, Maturing December 29, 2015 | | EUR | | | 3,701 | | | | 4,713,167 | |
Manitowoc Company, Inc. (The) | | | | | | | | | | |
Term Loan, 4.25%, Maturing November 13, 2017 | | | | | 1,462 | | | | 1,472,461 | |
Tank Holding Corp. | | | | | | | | | | |
Term Loan, 5.50%, Maturing July 9, 2019 | | | | | 5,776 | | | | 5,816,074 | |
Terex Corporation | | | | | | | | | | |
Term Loan, 4.50%, Maturing April 28, 2017 | | | | | 7,165 | | | | 7,224,265 | |
Unifrax Corporation | | | | | | | | | | |
Term Loan, 6.50%, Maturing November 28, 2018 | | | | | 2,487 | | | | 2,515,465 | |
| | | | | | | | | | | |
| | | $ | 76,259,618 | |
| | | | | | | | | | | |
|
Insurance — 4.4% | |
Alliant Holdings I, Inc. | | | | | | | | | | |
Term Loan, 0.50%, Maturing August 21, 2013(6) | | | | | 5,000 | | | $ | 4,675,000 | |
Term Loan, 3.36%, Maturing August 21, 2014 | | | | | 933 | | | | 932,129 | |
Term Loan, 6.75%, Maturing August 21, 2014 | | | | | 1,908 | | | | 1,926,848 | |
AmWINS Group, Inc. | | | | | | | | | | |
Term Loan, 5.75%, Maturing June 6, 2019 | | | | | 7,232 | | | | 7,258,995 | |
Term Loan - Second Lien, 9.25%, Maturing December 6, 2019 | | | | | 12,275 | | | | 12,328,703 | |
Applied Systems, Inc. | | | | | | | | | | |
Term Loan, 5.50%, Maturing December 8, 2016 | | | | | 2,214 | | | | 2,219,410 | |
Term Loan, 5.50%, Maturing December 8, 2016 | | | | | 2,961 | | | | 2,970,925 | |
Asurion LLC | | | | | | | | | | |
Term Loan, 5.50%, Maturing May 24, 2018 | | | | | 38,283 | | | | 38,603,116 | |
Term Loan - Second Lien, 9.00%, Maturing May 24, 2019 | | | | | 3,645 | | | | 3,776,274 | |
CCC Information Services, Inc. | | | | | | | | | | |
Term Loan, 5.75%, Maturing November 11, 2015 | | | | | 3,031 | | | | 3,047,638 | |
CNO Financial Group, Inc. | | | | | | | | | | |
Term Loan, 5.00%, Maturing September 20, 2018 | | | | | 24,475 | | | | 24,658,562 | |
Cunningham Lindsey Group, Inc. | | | | | | | | | | |
Term Loan, Maturing October 29, 2019(3) | | | | | 6,025 | | | | 6,036,297 | |
Term Loan - Second Lien, Maturing April 29, 2020(3) | | | | | 3,000 | | | | 3,045,000 | |
Hub International Limited | | | | | | | | | | |
Term Loan, 4.71%, Maturing June 13, 2017 | | | | | 16,007 | | | | 16,137,260 | |
Term Loan, 6.75%, Maturing December 13, 2017 | | | | | 1,310 | | | | 1,326,040 | |
Sedgwick CMS Holdings, Inc. | | | | | | | | | | |
Term Loan, 5.00%, Maturing December 30, 2016 | | | | | 2,487 | | | | 2,490,010 | |
USI Holdings Corporation | | | | | | | | | | |
Term Loan, 2.72%, Maturing May 5, 2014 | | | | | 10,054 | | | | 10,060,389 | |
| | | | | | | | | | | |
| | | $ | 141,492,596 | |
| | | | | | | | | | | |
| | | | |
| | 29 | | See Notes to Financial Statements. |
Senior Debt Portfolio
October 31, 2012
Portfolio of Investments — continued
| | | | | | | | | | |
| Borrower/Tranche Description | | | | Principal
Amount*
(000’s omitted) | | | Value | |
| | | | | | | | | | |
|
Leisure Goods / Activities / Movies — 4.2% | |
Alpha D2 Limited | | | | | | | | | | |
Term Loan, 6.00%, Maturing April 29, 2019 | | | | | 6,293 | | | $ | 6,356,309 | |
AMC Entertainment, Inc. | | | | | | | | | | |
Term Loan, 4.25%, Maturing December 15, 2016 | | | | | 4,844 | | | | 4,877,067 | |
Term Loan, 4.75%, Maturing February 22, 2018 | | | | | 4,570 | | | | 4,610,860 | |
AMC Networks Inc. | |
Term Loan, 4.00%, Maturing December 31, 2018 | | | | | 8,129 | | | | 8,195,311 | |
Bombardier Recreational Products, Inc. | | | | | | | | | | |
Term Loan, 4.46%, Maturing June 28, 2016 | | | | | 12,538 | | | | 12,620,016 | |
Bright Horizons Family Solutions, Inc. | | | | | | | | | | |
Term Loan, 5.25%, Maturing May 23, 2017 | | | | | 6,219 | | | | 6,234,297 | |
Cedar Fair, L.P. | | | | | | | | | | |
Term Loan, 4.00%, Maturing December 15, 2017 | | | | | 6,393 | | | | 6,445,365 | |
Cinemark USA, Inc. | | | | | | | | | | |
Term Loan, 3.47%, Maturing April 29, 2016 | | | | | 4,819 | | | | 4,857,417 | |
Clubcorp Club Operations, Inc. | | | | | | | | | | |
Term Loan, 6.00%, Maturing November 30, 2016 | | | | | 3,838 | | | | 3,868,933 | |
Dave & Buster’s, Inc. | | | | | | | | | | |
Term Loan, 5.50%, Maturing June 1, 2016 | | | | | 1,123 | | | | 1,128,641 | |
Fender Musical Instruments Corporation | | | | | | | | | | |
Term Loan, 2.47%, Maturing June 9, 2014 | | | | | 253 | | | | 252,784 | |
Term Loan, 2.47%, Maturing June 9, 2014 | | | | | 500 | | | | 500,267 | |
Kasima, LLC | | | | | | | | | | |
Term Loan, 4.12%, Maturing March 10, 2015 | | | | | 3,820 | | | | 3,834,551 | |
Term Loan, 5.00%, Maturing March 31, 2017 | | | | | 4,987 | | | | 5,005,308 | |
Live Nation Entertainment, Inc. | | | | | | | | | | |
Term Loan, 4.50%, Maturing November 7, 2016 | | | | | 10,553 | | | | 10,623,193 | |
Merlin Entertainment Group Luxembourg 2 S.a.r.l. | | | | | | | | | | |
Term Loan, 4.46%, Maturing July 21, 2017 | | | | | 4,224 | | | | 4,234,121 | |
Regal Cinemas, Inc. | | | | | | | | | | |
Term Loan, 3.24%, Maturing August 23, 2017 | | | | | 6,163 | | | | 6,190,229 | |
Revolution Studios Distribution Company, LLC | | | | | | | | | | |
Term Loan, 3.97%, Maturing December 21, 2014(5) | | | | | 2,661 | | | | 2,175,136 | |
Term Loan - Second Lien, 7.22%, Maturing June 21, 2015(5) | | | | | 2,825 | | | | 1,504,313 | |
SeaWorld Parks & Entertainment, Inc. | | | | | | | | | | |
Term Loan, 4.00%, Maturing August 17, 2017 | | | | | 18,447 | | | | 18,579,585 | |
Six Flags Theme Parks, Inc. | | | | | | | | | | |
Term Loan, 4.25%, Maturing December 20, 2018 | | | | | 7,075 | | | | 7,130,242 | |
Town Sports International Inc. | | | | | | | | | | |
Term Loan, 5.75%, Maturing May 11, 2018 | | | | | 5,960 | | | | 6,033,093 | |
Warner Music Group Corp. | | | | | | | | | | |
Term Loan, Maturing October 25, 2018(3) | | | | | 2,450 | | | | 2,462,250 | |
| | | | | | | | | | |
| Borrower/Tranche Description | | | | Principal
Amount*
(000’s omitted) | | | Value | |
| | | | | | | | | | |
|
Leisure Goods / Activities / Movies (continued) | |
Zuffa LLC | | | | | | | | | | |
Term Loan, 2.25%, Maturing June 19, 2015 | | | | | 2,896 | | | $ | 2,854,568 | |
Term Loan, 7.50%, Maturing June 19, 2015 | | | | | 5,970 | | | | 6,014,295 | |
| | | | | | | | | | | |
| | | $ | 136,588,151 | |
| | | | | | | | | | | |
|
Lodging and Casinos — 1.9% | |
Affinity Gaming, LLC | | | | | | | | | | |
Term Loan, 5.50%, Maturing November 9, 2017 | | | | | 2,587 | | | $ | 2,622,571 | |
Ameristar Casinos, Inc. | | | | | | | | | | |
Term Loan, 4.00%, Maturing April 16, 2018 | | | | | 5,799 | | | | 5,841,980 | |
Caesars Entertainment Operating Company | | | | | | | | | | |
Term Loan, 9.50%, Maturing October 31, 2016 | | | | | 1,471 | | | | 1,512,494 | |
Term Loan, 5.46%, Maturing January 26, 2018 | | | | | 16,362 | | | | 14,736,750 | |
Gala Group LTD | | | | | | | | | | |
Term Loan, 5.51%, Maturing May 30, 2018 | | GBP | | | 13,725 | | | | 20,830,859 | |
Isle of Capri Casinos, Inc. | | | | | | | | | | |
Term Loan, 4.75%, Maturing March 24, 2017 | | | | | 2,389 | | | | 2,412,511 | |
Las Vegas Sands LLC | | | | | | | | | | |
Term Loan, 2.72%, Maturing November 23, 2016 | | | | | 1,545 | | | | 1,545,073 | |
Term Loan, 2.72%, Maturing November 23, 2016 | | | | | 6,117 | | | | 6,116,848 | |
LodgeNet Entertainment Corporation | | | | | | | | | | |
Term Loan, 8.50%, Maturing April 4, 2014 | | | | | 867 | | | | 675,525 | |
Penn National Gaming, Inc. | | | | | | | | | | |
Term Loan, Maturing July 16, 2018(3) | | | | | 1,550 | | | | 1,559,204 | |
Pinnacle Entertainment, Inc. | | | | | | | | | | |
Term Loan, 4.00%, Maturing March 19, 2019 | | | | | 4,502 | | | | 4,530,515 | |
Tropicana Entertainment Inc. | | | | | | | | | | |
Term Loan, 7.50%, Maturing March 16, 2018 | | | | | 398 | | | | 401,234 | |
| | | | | | | | | | | |
| | | $ | 62,785,564 | |
| | | | | | | | | | | |
|
Nonferrous Metals / Minerals — 1.6% | |
Arch Coal Inc. | | | | | | | | | | |
Term Loan, 5.75%, Maturing May 16, 2018 | | | | | 15,486 | | | $ | 15,630,255 | |
Fairmount Minerals LTD | | | | | | | | | | |
Term Loan, 5.25%, Maturing March 15, 2017 | | | | | 13,500 | | | | 13,520,529 | |
Noranda Aluminum Acquisition Corporation | | | | | | | | | | |
Term Loan, 5.75%, Maturing February 24, 2019 | | | | | 4,652 | | | | 4,701,049 | |
Novelis, Inc. | | | | | | | | | | |
Term Loan, 4.00%, Maturing March 10, 2017 | | | | | 1,757 | | | | 1,759,074 | |
Term Loan, 4.00%, Maturing March 10, 2017 | | | | | 7,721 | | | | 7,729,172 | |
Oxbow Carbon and Mineral Holdings LLC | | | | | | | | | | |
Term Loan, 3.71%, Maturing May 8, 2016 | | | | | 3,198 | | | | 3,210,445 | |
| | | | |
| | 30 | | See Notes to Financial Statements. |
Senior Debt Portfolio
October 31, 2012
Portfolio of Investments — continued
| | | | | | | | | | |
| Borrower/Tranche Description | | | | Principal
Amount*
(000’s omitted) | | | Value | |
| | | | | | | | | | |
|
Nonferrous Metals / Minerals (continued) | |
United Distribution Group, Inc. | | | | | | | | | | |
Term Loan, 7.50%, Maturing October 9, 2018 | | | | | 5,150 | | | $ | 4,969,750 | |
Term Loan - Second Lien, 12.50%, Maturing April 12, 2019 | | | | | 1,250 | | | | 1,193,750 | |
| | | | | | | | | | | |
| | | | | | | | $ | 52,714,024 | |
| | | | | | | | | | | |
|
Oil and Gas — 3.9% | |
Buffalo Gulf Coast Terminals LLC | | | | | | | | | | |
Term Loan, 7.50%, Maturing October 31, 2017 | | | | | 6,485 | | | $ | 6,614,317 | |
Citgo Petroleum Corporation | | | | | | | | | | |
Term Loan, 8.00%, Maturing June 24, 2015 | | | | | 419 | | | | 422,197 | |
Term Loan, 9.00%, Maturing June 23, 2017 | | | | | 5,816 | | | | 5,928,813 | |
Crestwood Holdings LLC | | | | | | | | | | |
Term Loan, 9.75%, Maturing March 26, 2018 | | | | | 5,383 | | | | 5,463,472 | |
Energy Transfer Equity, L.P. | | | | | | | | | | |
Term Loan, 3.75%, Maturing March 24, 2017 | | | | | 19,100 | | | | 19,117,247 | |
Frac Tech International LLC | | | | | | | | | | |
Term Loan, 8.50%, Maturing May 6, 2016 | | | | | 9,405 | | | | 8,496,264 | |
Gibson Energy ULC | | | | | | | | | | |
Term Loan, 4.75%, Maturing June 15, 2018 | | | | | 8,482 | | | | 8,583,103 | |
MEG Energy Corp. | | | | | | | | | | |
Term Loan, 4.00%, Maturing March 16, 2018 | | | | | 3,168 | | | | 3,186,812 | |
Obsidian Natural Gas Trust | | | | | | | | | | |
Term Loan, 7.00%, Maturing November 2, 2015 | | | | | 12,031 | | | | 12,091,376 | |
Plains Exploration & Production | | | | | | | | | | |
Term Loan, Maturing September 13, 2019(3) | | | | | 13,600 | | | | 13,678,934 | |
Samson Investment Company | | | | | | | | | | |
Term Loan - Second Lien, 6.00%, Maturing September 25, 2018 | | | | | 3,525 | | | | 3,561,903 | |
Sheridan Production Partners I, LLC | | | | | | | | | | |
Term Loan, 5.00%, Maturing September 14, 2019 | | | | | 8,385 | | | | 8,398,324 | |
Term Loan, 5.00%, Maturing September 25, 2019 | | | | | 679 | | | | 679,733 | |
Term Loan, 5.00%, Maturing September 25, 2019 | | | | | 1,111 | | | | 1,112,846 | |
Tallgrass Energy Partners, LP | | | | | | | | | | |
Term Loan, Maturing October 25, 2018(3) | | | | | 15,450 | | | | 15,478,969 | |
Tervita Corporation | | | | | | | | | | |
Term Loan, 3.21%, Maturing November 14, 2014 | | | | | 63 | | | | 61,981 | |
Term Loan, 3.21%, Maturing November 14, 2014 | | | | | 10,889 | | | | 10,723,212 | |
Term Loan, 6.50%, Maturing November 14, 2014 | | | | | 1,414 | | | | 1,416,670 | |
| | | | | | | | | | | |
| | | | | | | | $ | 125,016,173 | |
| | | | | | | | | | | |
|
Publishing — 4.2% | |
Ascend Learning, Inc. | | | | | | | | | | |
Term Loan, 5.75%, Maturing May 23, 2017 | | | | | 10,024 | | | $ | 10,056,943 | |
| | | | | | | | | | |
| Borrower/Tranche Description | | | | Principal
Amount*
(000’s omitted) | | | Value | |
| | | | | | | | | | |
|
Publishing (continued) | |
Aster Zweite Beteiligungs GmbH | | | | | | | | | | |
Term Loan, 5.97%, Maturing December 31, 2014 | | | | | 2,251 | | | $ | 2,196,796 | |
Term Loan, 5.97%, Maturing December 31, 2014 | | | | | 3,440 | | | | 3,356,776 | |
Term Loan, 5.97%, Maturing December 31, 2014 | | | | | 3,518 | | | | 3,433,153 | |
Term Loan, 8.22%, Maturing June 30, 2016 | | | | | 1,292 | | | | 1,056,561 | |
Black Press US Partnership | | | | | | | | | | |
Term Loan, 2.42%, Maturing August 2, 2013 | | | | | 395 | | | | 387,162 | |
Term Loan, 2.42%, Maturing August 2, 2013 | | | | | 651 | | | | 637,679 | |
Cengage Learning Acquisitions, Inc. | | | | | | | | | | |
Term Loan, 2.47%, Maturing July 3, 2014 | | | | | 5,884 | | | | 5,626,498 | |
GateHouse Media Operating, Inc. | | | | | | | | | | |
Term Loan, 2.22%, Maturing August 28, 2014 | | | | | 2,026 | | | | 699,439 | |
Term Loan, 2.22%, Maturing August 28, 2014 | | | | | 4,753 | | | | 1,641,118 | |
Term Loan, 2.47%, Maturing August 28, 2014 | | | | | 4,151 | | | | 1,433,167 | |
Getty Images, Inc. | | | | | | | | | | |
Term Loan, 4.75%, Maturing September 13, 2019 | | | | | 25,600 | | | | 25,740,800 | |
Instant Web, Inc. | | | | | | | | | | |
Term Loan, 3.59%, Maturing August 7, 2014 | | | | | 401 | | | | 312,999 | |
Term Loan, 3.59%, Maturing August 7, 2014 | | | | | 3,849 | | | | 3,002,579 | |
Interactive Data Corporation | | | | | | | | | | |
Term Loan, 4.50%, Maturing February 12, 2018 | �� | | | | 11,927 | | | | 12,017,509 | |
Laureate Education, Inc. | | | | | | | | | | |
Term Loan, 3.32%, Maturing August 17, 2014 | | | | | 451 | | | | 450,987 | |
Term Loan, 3.32%, Maturing August 17, 2014 | | | | | 4,487 | | | | 4,486,969 | |
Term Loan, 5.25%, Maturing June 18, 2018 | | | | | 24,136 | | | | 24,075,811 | |
MediaNews Group | | | | | | | | | | |
Term Loan, 8.50%, Maturing March 19, 2014 | | | | | 491 | | | | 478,756 | |
Merrill Communications, LLC | | | | | | | | | | |
Term Loan, 9.75%, Maturing December 24, 2012 | | | | | 5,366 | | | | 5,352,618 | |
Nelson Education Ltd. | | | | | | | | | | |
Term Loan, 2.86%, Maturing July 3, 2014 | | | | | 1,433 | | | | 1,214,330 | |
Newspaper Holdings Inc. | | | | | | | | | | |
Term Loan, 1.88%, Maturing July 24, 2014 | | | | | 7,430 | | | | 6,895,608 | |
Nielsen Finance LLC | | | | | | | | | | |
Term Loan, 3.47%, Maturing May 2, 2016 | | | | | 12,979 | | | | 13,057,745 | |
Term Loan, 3.97%, Maturing May 2, 2016 | | | | | 3,108 | | | | 3,127,641 | |
Penton Media, Inc. | | | | | | | | | | |
Term Loan, 5.00%, Maturing August 1, 2014 | | | | | 1,747 | | | | 1,455,483 | |
Source Interlink Companies, Inc. | | | | | | | | | | |
Term Loan, 15.00%, Maturing March 18,
2014(2)(5) | | | | | 747 | | | | 318,827 | |
Term Loan - Second Lien, 10.75%, Maturing June 18, 2013 | | | | | 886 | | | | 779,849 | |
Springer Science+Business Media S.A. | | | | | | | | | | |
Term Loan, 4.11%, Maturing July 21, 2016 | | EUR | | | 3,000 | | | | 3,892,337 | |
| | | | |
| | 31 | | See Notes to Financial Statements. |
Senior Debt Portfolio
October 31, 2012
Portfolio of Investments — continued
| | | | | | | | | | |
| Borrower/Tranche Description | | | | Principal
Amount*
(000’s omitted) | | | Value | |
| | | | | | | | | | |
|
Publishing (continued) | |
Star Tribune Company (The) | | | | | | | | | | |
Term Loan, 8.00%, Maturing September 28, 2014 | | | | | 125 | | | $ | 119,076 | |
Term Loan, 8.00%, Maturing September 29, 2014 | | | | | 167 | | | | 158,768 | |
| | | | | | | | | | | |
| | | | | | | | $ | 137,463,984 | |
| | | | | | | | | | | |
|
Radio and Television — 3.2% | |
Clear Channel Communications, Inc. | | | | | | | | | | |
Term Loan, 3.86%, Maturing January 29, 2016 | | | | | 5,704 | | | $ | 4,739,160 | |
Cumulus Media Holdings Inc. | | | | | | | | | | |
Term Loan, 5.75%, Maturing September 17, 2018 | | | | | 25,670 | | | | 25,857,782 | |
Entercom Radio, LLC | | | | | | | | | | |
Term Loan, 6.25%, Maturing November 23, 2018 | | | | | 5,116 | | | | 5,151,612 | |
Foxco Acquisition Sub, LLC | | | | | | | | | | |
Term Loan, 5.50%, Maturing July 31, 2017 | | | | | 11,600 | | | | 11,774,000 | |
Gray Television, Inc. | | | | | | | | | | |
Term Loan, 3.59%, Maturing October 15, 2019(6) | | | | | 5,175 | | | | 5,207,344 | |
Hubbard Radio, LLC | | | | | | | | | | |
Term Loan, 5.25%, Maturing April 28, 2017 | | | | | 2,127 | | | | 2,143,250 | |
LIN Television Corp. | | | | | | | | | | |
Term Loan, 5.00%, Maturing December 21, 2018 | | | | | 1,538 | | | | 1,556,643 | |
Local TV Finance, LLC | | | | | | | | | | |
Term Loan, 4.22%, Maturing May 7, 2015 | | | | | 4,712 | | | | 4,735,583 | |
Mission Broadcasting, Inc. | | | | | | | | | | |
Term Loan, 5.00%, Maturing September 30, 2016 | | | | | 1,210 | | | | 1,213,415 | |
Nexstar Broadcasting, Inc. | | | | | | | | | | |
Term Loan, 5.00%, Maturing September 30, 2016 | | | | | 3,371 | | | | 3,379,105 | |
Radio One, Inc. | | | | | | | | | | |
Term Loan, 7.50%, Maturing March 31, 2016 | | | | | 3,922 | | | | 3,951,249 | |
Raycom TV Broadcasting, Inc. | | | | | | | | | | |
Term Loan, 4.25%, Maturing May 31, 2017 | | | | | 2,518 | | | | 2,505,534 | |
Sinclair Television Group Inc. | | | | | | | | | | |
Term Loan, 4.00%, Maturing October 28, 2016 | | | | | 1,916 | | | | 1,929,371 | |
Tyrol Acquisitions 2 SAS | | | | | | | | | | |
Term Loan, 4.11%, Maturing January 29, 2016 | | EUR | | | 1,010 | | | | 1,188,793 | |
Term Loan, 4.11%, Maturing January 29, 2016 | | EUR | | | 1,010 | | | | 1,188,793 | |
Univision Communications Inc. | | | | | | | | | | |
Term Loan, 2.21%, Maturing September 29, 2014 | | | | | 2,368 | | | | 2,364,507 | |
Term Loan, 4.46%, Maturing March 31, 2017 | | | | | 20,648 | | | | 20,260,639 | |
Weather Channel | | | | | | | | | | |
Term Loan, 4.25%, Maturing February 13, 2017 | | | | | 5,035 | | | | 5,077,092 | |
| | | | | | | | | | | |
| | | | | | | | $ | 104,223,872 | |
| | | | | | | | | | | |
|
Retailers (Except Food and Drug) — 4.2% | |
99 Cents Only Stores | | | | | | | | | | |
Term Loan, 5.25%, Maturing January 11, 2019 | | | | | 12,755 | | | $ | 12,924,097 | |
| | | | | | | | | | |
| Borrower/Tranche Description | | | | Principal
Amount*
(000’s omitted) | | | Value | |
| | | | | | | | | | |
|
Retailers (Except Food and Drug) (continued) | |
David’s Bridal, Inc. | | | | | | | | | | |
Term Loan, 5.00%, Maturing October 11, 2019 | | | | | 2,825 | | | $ | 2,824,119 | |
Evergreen Acqco 1 LP | | | | | | | | | | |
Term Loan, 5.00%, Maturing July 9, 2019 | | | | | 2,643 | | | | 2,655,490 | |
FTD, Inc. | | | | | | | | | | |
Term Loan, 4.75%, Maturing June 11, 2018 | | | | | 4,412 | | | | 4,439,449 | |
Harbor Freight Tools USA, Inc. | | | | | | | | | | |
Term Loan, 5.50%, Maturing November 14, 2017 | | | | | 3,117 | | | | 3,152,256 | |
J Crew Group, Inc. | | | | | | | | | | |
Term Loan, 4.75%, Maturing March 7, 2018 | | | | | 15,765 | | | | 15,799,976 | |
Jo-Ann Stores, Inc. | | | | | | | | | | |
Term Loan, 4.75%, Maturing March 16, 2018 | | | | | 13,011 | | | | 13,032,615 | |
Michaels Stores, Inc. | | | | | | | | | | |
Term Loan, 4.91%, Maturing July 29, 2016 | | | | | 5,798 | | | | 5,859,322 | |
Term Loan, 4.91%, Maturing July 29, 2016 | | | | | 9,421 | | | | 9,521,337 | |
National Vision, Inc. | | | | | | | | | | |
Term Loan, 7.00%, Maturing August 2, 2018 | | | | | 3,142 | | | | 3,189,257 | |
Neiman Marcus Group, Inc. (The) | | | | | | | | | | |
Term Loan, 4.75%, Maturing May 16, 2018 | | | | | 17,775 | | | | 17,849,744 | |
Ollie’s Bargain Outlet, Inc. | | | | | | | | | | |
Term Loan, 6.25%, Maturing September 27, 2019 | | | | | 4,075 | | | | 4,090,281 | |
Pep Boys-Manny, Moe & Jack (The) | | | | | | | | | | |
Term Loan, 5.00%, Maturing October 17, 2018 | | | | | 2,000 | | | | 2,016,666 | |
Petco Animal Supplies, Inc. | | | | | | | | | | |
Term Loan, 4.50%, Maturing November 24, 2017 | | | | | 9,291 | | | | 9,350,322 | |
Pilot Travel Centers LLC | | | | | | | | | | |
Term Loan, 3.75%, Maturing March 30, 2018 | | | | | 3,133 | | | | 3,152,895 | |
Term Loan, 4.25%, Maturing August 7, 2019 | | | | | 1,050 | | | | 1,058,860 | |
ServiceMaster Company | | | | | | | | | | |
Term Loan, 4.46%, Maturing January 31, 2017 | | | | | 10,780 | | | | 10,841,948 | |
Visant Holding Corp. | | | | | | | | | | |
Term Loan, 5.25%, Maturing December 22, 2016 | | | | | 3,414 | | | | 3,298,470 | |
Vivarte SA | | | | | | | | | | |
Term Loan, 2.42%, Maturing March 9, 2015 | | EUR | | | 2,640 | | | | 2,755,996 | |
Term Loan, 2.92%, Maturing March 8, 2016 | | EUR | | | 2,640 | | | | 2,755,996 | |
Term Loan - Second Lien, 3.92%, Maturing September 8, 2016 | | EUR | | | 22 | | | | 20,693 | |
Term Loan - Second Lien, 3.92%, Maturing September 8, 2016 | | EUR | | | 154 | | | | 144,854 | |
Term Loan - Second Lien, 3.92%, Maturing September 8, 2016 | | EUR | | | 1,582 | | | | 1,489,927 | |
Wilton Brands LLC | | | | | | | | | | |
Term Loan, 7.50%, Maturing August 30, 2018 | | | | | 2,575 | | | | 2,602,359 | |
| | | | | | | | | | | |
| | | $ | 134,826,929 | |
| | | | | | | | | | | |
| | | | |
| | 32 | | See Notes to Financial Statements. |
Senior Debt Portfolio
October 31, 2012
Portfolio of Investments — continued
| | | | | | | | | | |
| Borrower/Tranche Description | | | | Principal
Amount*
(000’s omitted) | | | Value | |
| | | | | | | | | | |
|
Steel — 1.7% | |
Essar Steel Algoma, Inc. | | | | | | | | | | |
Term Loan, 8.75%, Maturing September 19, 2014 | | | | | 10,025 | | | $ | 10,150,312 | |
FMG America Finance, Inc. | | | | | | | | | | |
Term Loan, 5.25%, Maturing October 18, 2017 | | | | | 25,075 | | | | 25,012,312 | |
JMC Steel Group, Inc. | | | | | | | | | | |
Term Loan, 4.75%, Maturing April 3, 2017 | | | | | 4,742 | | | | 4,801,070 | |
Patriot Coal Corporation | | | | | | | | | | |
Term Loan, 9.25%, Maturing October 4, 2013 | | | | | 3,250 | | | | 3,274,375 | |
SunCoke Energy, Inc. | | | | | | | | | | |
Term Loan, 4.00%, Maturing July 26, 2018 | | | | | 5,687 | | | | 5,714,933 | |
Waupaca Foundry, Inc. | | | | | | | | | | |
Term Loan, 8.50%, Maturing June 29, 2017 | | | | | 2,543 | | | | 2,574,598 | |
WireCo WorldGroup, Inc. | | | | | | | | | | |
Term Loan, 6.00%, Maturing February 15, 2017 | | | | | 2,525 | | | | 2,556,563 | |
| | | | | | | | | | | |
| | | $ | 54,084,163 | |
| | | | | | | | | | | |
|
Surface Transport — 1.4% | |
Hertz Corporation, (The) | | | | | | | | | | |
Term Loan, 3.75%, Maturing March 9, 2018 | | | | | 7,100 | | | $ | 7,073,375 | |
Term Loan, 3.75%, Maturing March 9, 2018 | | | | | 16,450 | | | | 16,432,250 | |
Term Loan, Maturing March 11, 2018(3) | | | | | 15,825 | | | | 15,795,328 | |
Swift Transportation Co. Inc. | | | | | | | | | | |
Term Loan, 5.00%, Maturing December 21, 2017 | | | | | 4,794 | | | | 4,832,810 | |
| | | | | | | | | | | |
| | | $ | 44,133,763 | |
| | | | | | | | | | | |
|
Telecommunications — 5.0% | |
Alaska Communications Systems Holdings, Inc. | | | | | | | | | | |
Term Loan, 5.50%, Maturing October 21, 2016 | | | | | 3,955 | | | $ | 3,672,800 | |
Cellular South, Inc. | | | | | | | | | | |
Term Loan, 4.50%, Maturing July 27, 2017 | | | | | 2,469 | | | | 2,474,922 | |
Cricket Communications, Inc. | | | | | | | | | | |
Term Loan, 4.75%, Maturing October 10, 2019 | | | | | 7,100 | | | | 7,144,375 | |
Crown Castle International Corporation | | | | | | | | | | |
Term Loan, 4.00%, Maturing January 31, 2019 | | | | | 8,381 | | | | 8,438,972 | |
Intelsat Jackson Holdings Ltd. | | | | | | | | | | |
Term Loan, 4.50%, Maturing April 2, 2018 | | | | | 47,240 | | | | 47,657,306 | |
IPC Systems, Inc. | | | | | | | | | | |
Term Loan, 2.85%, Maturing May 31, 2014 | | GBP | | | 166 | | | | 262,505 | |
Macquarie UK Broadcast Limited | | | | | | | | | | |
Term Loan, 3.00%, Maturing December 1, 2014 | | GBP | | | 2,508 | | | | 3,831,729 | |
MetroPCS Wireless, Inc. | | | | | | | | | | |
Term Loan, 4.00%, Maturing March 16, 2018 | | | | | 29,755 | | | | 29,872,725 | |
Midcontinent Communications | | | | | | | | | | |
Term Loan, 4.00%, Maturing December 30, 2016 | | | | | 1,939 | | | | 1,938,656 | |
| | | | | | | | | | |
| Borrower/Tranche Description | | | | Principal
Amount*
(000’s omitted) | | | Value | |
| | | | | | | | | | |
|
Telecommunications (continued) | |
NTELOS Inc. | |
Term Loan, 4.00%, Maturing August 7, 2015 | | | | | 6,991 | | | $ | 7,020,019 | |
Oberthur Technologies Holding SAS | | | | | | | | | | |
Term Loan, 6.25%, Maturing March 30, 2019 | | | | | 1,525 | | | | 1,520,234 | |
SBA Finance | | | | | | | | | | |
Term Loan, 3.75%, Maturing June 29, 2018 | | | | | 2,716 | | | | 2,724,111 | |
Term Loan, 3.75%, Maturing September 27, 2019 | | | | | 1,775 | | | | 1,786,094 | |
Syniverse Holdings, Inc. | | | | | | | | | | |
Term Loan, 5.00%, Maturing April 23, 2019 | | | | | 12,444 | | | | 12,521,586 | |
Telesat LLC | | | | | | | | | | |
Term Loan, 4.25%, Maturing March 28, 2019 | | | | | 26,708 | | | | 26,861,634 | |
Windstream Corporation | | | | | | | | | | |
Term Loan, 4.00%, Maturing August 8, 2019 | | | | | 3,666 | | | | 3,693,306 | |
| | | | | | | | | | | |
| | | $ | 161,420,974 | |
| | | | | | | | | | | |
|
Utilities — 1.9% | |
AES Corporation | | | | | | | | | | |
Term Loan, 4.25%, Maturing June 1, 2018 | | | | | 6,375 | | | $ | 6,423,222 | |
Calpine Corporation | | | | | | | | | | |
Term Loan, 4.50%, Maturing April 2, 2018 | | | | | 4,233 | | | | 4,251,651 | |
Term Loan, 4.50%, Maturing April 2, 2018 | | | | | 11,516 | | | | 11,560,749 | |
Term Loan, 4.50%, Maturing September 27, 2019 | | | | | 3,600 | | | | 3,611,700 | |
Covanta Energy Corporation | | | | | | | | | | |
Term Loan, 4.00%, Maturing March 28, 2019 | | | | | 1,070 | | | | 1,073,636 | |
Dynegy Midwest Generation LLC | | | | | | | | | | |
Term Loan, 9.25%, Maturing August 4, 2016 | | | | | 1,485 | | | | 1,544,400 | |
Dynegy Power, LLC | | | | | | | | | | |
Term Loan, 9.25%, Maturing August 4, 2016 | | | | | 2,747 | | | | 2,876,887 | |
Invenergy LLC | | | | | | | | | | |
Term Loan, 9.00%, Maturing November 21, 2017 | | | | | 1,909 | | | | 1,923,485 | |
LSP Madison Funding, LLC | | | | | | | | | | |
Term Loan, 5.50%, Maturing June 28, 2019 | | | | | 4,489 | | | | 4,533,637 | |
NRG Energy, Inc. | | | | | | | | | | |
Term Loan, 4.00%, Maturing July 2, 2018 | | | | | 8,965 | | | | 9,029,171 | |
Texas Competitive Electric Holdings Company, LLC | | | | | | | | | | |
Term Loan, 4.75%, Maturing October 10, 2017 | | | | | 24,173 | | | | 15,712,734 | |
| | | | | | | | | | | |
| | | $ | 62,541,272 | |
| | | | | | | | | | | |
| |
Total Senior Floating-Rate Interests
(identified cost $3,722,793,375) | | | $ | 3,733,502,609 | |
| | | | | | | | | | | |
| | | | |
| | 33 | | See Notes to Financial Statements. |
Senior Debt Portfolio
October 31, 2012
Portfolio of Investments — continued
| | | | | | | | | | |
| Corporate Bonds & Notes — 3.0% | | | | | |
| | | |
| | | | | | | | | | |
| Security | | Principal
Amount*
(000’s omitted) | | | Value | |
| | | | | | | | | | |
|
Building and Development — 0.0%(4) | |
Calcipar SA, Sr. Notes | | | | | | | | | | |
6.875%, 5/1/18(7) | | | | | 1,000 | | | $ | 1,007,500 | |
| | | | | | | | | | | |
| | | $ | 1,007,500 | |
| | | | | | | | | | | |
|
Chemicals and Plastics — 0.4% | |
Hexion US Finance Corp., Sr. Notes | | | | | | | | | | |
6.625%, 4/15/20 | | | | | 2,000 | | | $ | 2,005,000 | |
Ineos Finance PLC, Sr. Notes | | | | | | | | | | |
7.25%, 2/15/19(7) | | EUR | | | 3,000 | | | | 3,975,938 | |
7.50%, 5/1/20(7) | | | | | 2,375 | | | | 2,416,563 | |
8.375%, 2/15/19(7) | | | | | 3,800 | | | | 4,004,250 | |
Polymer Group, Inc., Sr. Notes | | | | | | | | | | |
7.75%, 2/1/19(7) | | | | | 2,500 | | | | 2,687,500 | |
| | | | | | | | | | | |
| | | $ | 15,089,251 | |
| | | | | | | | | | | |
|
Containers and Glass Products — 0.7% | |
Reynolds Group Holdings, Inc., Sr. Notes | | | | | | | | | | |
5.75%, 10/15/20(7) | | | | | 15,875 | | | $ | 16,073,437 | |
Smurfit Kappa Acquisitions, Sr. Notes | | | | | | | | | | |
4.875%, 9/15/18(7) | | | | | 1,850 | | | | 1,856,938 | |
3.795%, 10/15/20(7) | | EUR | | | 3,000 | | | | 3,893,309 | |
| | | | | | | | | | | |
| | | $ | 21,823,684 | |
| | | | | | | | | | | |
|
Ecological Services and Equipment — 0.0%(4) | |
Environmental Systems Product Holdings, Inc., Jr. Notes | | | | | | | | | | |
18.00%, 3/31/15(2)(5)(7) | | | | | 92 | | | $ | 78,037 | |
| | | | | | | | | | | |
| | | $ | 78,037 | |
| | | | | | | | | | | |
| | | |
Equipment Leasing — 0.1% | | | | | | | | | | |
International Lease Finance Corp., Sr. Notes | | | | | | | | | | |
6.75%, 9/1/16(7) | | | | | 750 | | | $ | 851,250 | |
7.125%, 9/1/18(7) | | | | | 750 | | | | 885,000 | |
| | | | | | | | | | | |
| | | $ | 1,736,250 | |
| | | | | | | | | | | |
| | | |
Financial Intermediaries — 0.1% | | | | | | | | | | |
First Data Corp., Sr. Notes | | | | | | | | | | |
7.375%, 6/15/19(7) | | | | | 2,500 | | | $ | 2,600,000 | |
6.75%, 11/1/20(7) | | | | | 2,575 | | | | 2,587,875 | |
| | | | | | | | | | | |
| | | $ | 5,187,875 | |
| | | | | | | | | | | |
| | | | | | | | | | |
| Security | | Principal
Amount*
(000’s omitted) | | | Value | |
| | | | | | | | | | |
| | | |
Health Care — 0.4% | | | | | | | | | | |
Community Health Systems, Inc., Sr. Notes | | | | | | | | | | |
5.125%, 8/15/18 | | | | | 8,225 | | | $ | 8,554,000 | |
HCA, Inc., Sr. Notes | | | | | | | | | | |
4.75%, 5/1/23 | | | | | 4,650 | | | | 4,661,625 | |
| | | | | | | | | | | |
| | | $ | 13,215,625 | |
| | | | | | | | | | | |
| | | |
Home Furnishings — 0.1% | | | | | | | | | | |
Libbey Glass, Inc., Sr. Notes | | | | | | | | | | |
6.875%, 5/15/20(7) | | | | | 2,250 | | | $ | 2,407,500 | |
| | | | | | | | | | | |
| | | $ | 2,407,500 | |
| | | | | | | | | | | |
| | | |
Insurance — 0.1% | | | | | | | | | | |
CNO Financial Group, Inc., Sr. Notes | | | | | | | | | | |
6.375%, 10/1/20(7) | | | | | 2,000 | | | $ | 2,080,000 | |
| | | | | | | | | | | |
| | | $ | 2,080,000 | |
| | | | | | | | | | | |
|
Leisure Goods / Activities / Movies — 0.2% | |
NAI Entertainment Holdings, LLC, Sr. Notes | | | | | | | | | | |
8.25%, 12/15/17(7) | | | | | 2,250 | | | $ | 2,514,375 | |
National CineMedia, LLC, Sr. Notes | | | | | | | | | | |
6.00%, 4/15/22(7) | | | | | 4,200 | | | | 4,452,000 | |
| | | | | | | | | | | |
| | | $ | 6,966,375 | |
| | | | | | | | | | | |
| | | |
Lodging and Casinos — 0.2% | | | | | | | | | | |
Caesars Entertainment Operating Co., Inc., Sr. Notes | | | | | | | | | | |
8.50%, 2/15/20(7) | | | | | 5,550 | | | $ | 5,466,750 | |
| | | | | | | | | | | |
| | | $ | 5,466,750 | |
| | | | | | | | | | | |
| | | |
Radio and Television — 0.1% | | | | | | | | | | |
Clear Channel Communications, Inc., Sr. Notes | | | | | | | | | | |
9.00%, 12/15/19(7) | | | | | 1,709 | | | $ | 1,546,645 | |
Univision Communications, Inc., Sr. Notes | | | | | | | | | | |
6.75%, 9/15/22(7) | | | | | 3,400 | | | | 3,417,000 | |
| | | | | | | | | | | |
| | | $ | 4,963,645 | |
| | | | | | | | | | | |
| | | |
Telecommunications — 0.1% | | | | | | | | | | |
Hughes Satellite Systems Corp., Sr. Notes | | | | | | | | | | |
6.50%, 6/15/19 | | | | | 2,000 | | | $ | 2,150,000 | |
| | | | | | | | | | | |
| | | $ | 2,150,000 | |
| | | | | | | | | | | |
| | | | |
| | 34 | | See Notes to Financial Statements. |
Senior Debt Portfolio
October 31, 2012
Portfolio of Investments — continued
| | | | | | | | | | |
| Security | | Principal
Amount*
(000’s omitted) | | | Value | |
| | | | | | | | | | |
| | | |
Utilities — 0.5% | | | | | | | | | | |
Calpine Corp., Sr. Notes | | | | | | | | | | |
7.50%, 2/15/21(7) | | | | | 8,123 | | | $ | 8,874,377 | |
7.875%, 1/15/23(7) | | | | | 7,087 | | | | 7,866,570 | |
| | | | | | | | | | | |
| | | $ | 16,740,947 | |
| | | | | | | | | | | |
| | | |
Total Corporate Bonds & Notes
(identified cost $95,298,707) | | | | | | | | $ | 98,913,439 | |
| | | | | | | | | | | |
|
| Common Stocks — 0.7% | |
| | | |
| | | | | | | | | | |
| Security | | | | Shares | | | Value | |
|
Automotive — 0.0%(4) | |
Dayco Products, LLC(5)(8)(9) | | | | | 48,926 | | | $ | 1,247,613 | |
| | | | | | | | | | | |
| | | $ | 1,247,613 | |
| | | | | | | | | | | |
| | | |
Building and Development — 0.0%(4) | | | | | | | | | | |
United Subcontractors, Inc.(5)(8)(9) | | | | | 1,646 | | | $ | 68,612 | |
| | | | | | | | | | | |
| | | $ | 68,612 | |
| | | | | | | | | | | |
| | | |
Ecological Services and Equipment — 0.0%(4) | | | | | | | | | | |
Environmental Systems Products Holdings,
Inc.(5)(9)(10) | | | | | 1,242 | | | $ | 89,710 | |
| | | | | | | | | | | |
| | | $ | 89,710 | |
| | | | | | | | | | | |
| | | |
Financial Intermediaries — 0.0%(4) | | | | | | | | | | |
RTS Investor Corp.(5)(8)(9) | | | | | 250 | | | $ | 23,863 | |
| | | | | | | | | | | |
| | | $ | 23,863 | |
| | | | | | | | | | | |
| | | |
Food Service — 0.0%(4) | | | | | | | | | | |
Buffets Restaurants Holdings, Inc.(5)(8)(9) | | | | | 105,043 | | | $ | 950,639 | |
| | | | | | | | | | | |
| | | $ | 950,639 | |
| | | | | | | | | | | |
| | | |
Home Furnishings — 0.0%(4) | | | | | | | | | | |
Oreck Corp.(5)(8)(9) | | | | | 4,230 | | | $ | 73,560 | |
Sanitec Europe Oy B Units(5)(8)(9) | | | | | 157,491 | | | | 990,039 | |
Sanitec Europe Oy E Units(5)(8)(9) | | | | | 154,721 | | | | 0 | |
| | | | | | | | | | | |
| | | $ | 1,063,599 | |
| | | | | | | | | | | |
| | | |
Investment Services — 0.0% | | | | | | | | | | |
Safelite Realty Corp.(5)(9) | | | | | 20,048 | | | $ | 0 | |
| | | | | | | | | | | |
| | | $ | 0 | |
| | | | | | | | | | | |
| | | | | | | | | | |
| Security | | | | Shares | | | Value | |
| | | | | | | | | | |
|
Leisure Goods / Activities / Movies — 0.2% | |
Metro-Goldwyn-Mayer Holdings, Inc.(8)(9) | | | | | 158,338 | | | $ | 5,042,084 | |
| | | | | | | | | | | |
| | | $ | 5,042,084 | |
| | | | | | | | | | | |
| | | |
Lodging and Casinos — 0.1% | | | | | | | | | | |
Affinity Gaming, LLC(8)(9) | | | | | 167,709 | | | $ | 1,900,693 | |
Tropicana Entertainment, Inc.(5)(8)(9) | | | | | 40,751 | | | | 570,514 | |
| | | | | | | | | | | |
| | | $ | 2,471,207 | |
| | | | | | | | | | | |
| | | |
Publishing — 0.3% | | | | | | | | | | |
Ion Media Networks, Inc.(5)(8)(9) | | | | | 13,247 | | | $ | 8,425,092 | |
MediaNews Group, Inc.(5)(8)(9) | | | | | 66,239 | | | | 1,389,692 | |
Source Interlink Companies, Inc.(5)(8)(9) | | | | | 2,290 | | | | 0 | |
| | | | | | | | | | | |
| | | $ | 9,814,784 | |
| | | | | | | | | | | |
| | | |
Radio and Television — 0.1% | | | | | | | | | | |
New Young Broadcasting Holding Co., Inc.(5)(8)(9) | | | | | 505 | | | $ | 1,818,000 | |
| | | | | | | | | | | |
| | | $ | 1,818,000 | |
| | | | | | | | | | | |
| | | |
Total Common Stocks (identified cost $13,549,393) | | | | | | | | $ | 22,590,111 | |
| | | | | | | | | | | |
| | | |
| Preferred Stocks — 0.0%(4) | | | | | | | | | | |
| | | |
| | | | | | | | | | |
| Security | | | | Shares | | | Value | |
|
Ecological Services and Equipment — 0.0%(4) | |
Environmental Systems Products Holdings, Inc., Series A(5)(9)(10) | | | | | 284 | | | $ | 17,892 | |
| | | | | | | | | | | |
| | | |
Total Preferred Stocks
(identified cost $4,970) | | | | | | | | $ | 17,892 | |
| | | | | | | | | | | |
| | | |
| Warrants — 0.0%(4) | | | | | | | | | | |
| | | |
| | | | | | | | | | |
| Security | | | | Shares | | | Value | |
| | | |
Radio and Television — 0.0%(4) | | | | | | | | | | |
New Young Broadcasting Holding Co., Inc., Expires 12/24/24(5)(8)(9) | | | | | 5 | | | $ | 18,000 | |
| | | | | | | | | | | |
| | | |
Total Warrants
(identified cost $8,593) | | | | | | | | $ | 18,000 | |
| | | | | | | | | | | |
| | | | |
| | 35 | | See Notes to Financial Statements. |
Senior Debt Portfolio
October 31, 2012
Portfolio of Investments — continued
| | | | | | | | | | |
| Short-Term Investments — 2.9% | |
| | | |
| | | | | | | | | | |
| Description | | | | Interest
(000’s omitted) | | | Value | |
| | | | | | | | | | |
Eaton Vance Cash Reserves Fund, LLC, 0.12%(11) | | | | $ | 93,586 | | | $ | 93,586,107 | |
| | | | | | | | | | | |
| | | |
Total Short-Term Investments
(identified cost $93,586,107) | | | | | | | | $ | 93,586,107 | |
| | | | | | | | | | | |
| | | |
Total Investments — 121.8%
(identified cost $3,925,241,145) | | | | | | | | $ | 3,948,628,158 | |
| | | | | | | | | | | |
| |
Less Unfunded Loan Commitments — (0.2)% | | | $ | (6,258,784 | ) |
| | | | | | | | | | | |
| | | |
Net Investments — 121.6%
(identified cost $3,918,982,361) | | | | | | | | $ | 3,942,369,374 | |
| | | | | | | | | | | |
| |
Other Assets, Less Liabilities — (21.6)% | | | $ | (700,588,004 | ) |
| | | | | | | | | | | |
| | | |
Net Assets — 100.0% | | | | | | | | $ | 3,241,781,370 | |
| | | | | | | | | | | |
The percentage shown for each investment category in the Portfolio of Investments is based on net assets.
| | | | |
| EUR | | – | | Euro |
| GBP | | – | | British Pound Sterling |
| | * | In U.S. dollars unless otherwise indicated. |
| | (1) | Senior floating-rate interests (Senior Loans) often require prepayments from excess cash flows or permit the borrowers to repay at their election. The degree to which borrowers repay, whether as a contractual requirement or at their election, cannot be predicted with accuracy. As a result, the actual remaining maturity may be substantially less than the stated maturities shown. However, Senior Loans will have an expected average life of approximately two to four years. The stated interest rate represents the weighted average interest rate of all contracts within the senior loan facility and includes commitment fees on unfunded loan commitments, if any. Senior Loans typically have rates of interest which are redetermined either daily, monthly, quarterly or semi-annually by reference to a base lending rate, plus a premium. These base lending rates are primarily the London Interbank Offered Rate (“LIBOR”) and secondarily, the prime rate offered by one or more major United States banks (the “Prime Rate”) and the certificate of deposit (“CD”) rate or other base lending rates used by commercial lenders. |
| | (2) | Represents a payment-in-kind security which may pay all or a portion of interest in additional par. |
| | (3) | This Senior Loan will settle after October 31, 2012, at which time the interest rate will be determined. |
| | (4) | Amount is less than 0.05%. |
| | (5) | For fair value measurement disclosure purposes, security is categorized as Level 3 (see Note 10). |
| | (6) | Unfunded or partially unfunded loan commitments. See Note 1G for description. |
| | (7) | Security exempt from registration pursuant to Rule 144A under the Securities Act of 1933. These securities may be sold in certain transactions (normally to qualified institutional buyers) and remain exempt from registration. At October 31, 2012, the aggregate value of these securities is $81,542,814 or 2.5% of the Portfolio’s net assets. |
| | (8) | Security was acquired in connection with a restructuring of a Senior Loan and may be subject to restrictions on resale. |
| | (9) | Non-income producing security. |
| (10) | Restricted security (see Note 5). |
| (11) | Affiliated investment company available to Eaton Vance portfolios and funds which invests in high quality, U.S. dollar denominated money market instruments. The rate shown is the annualized seven-day yield as of October 31, 2012. |
| | | | |
| | 36 | | See Notes to Financial Statements. |
Senior Debt Portfolio
October 31, 2012
Statement of Assets and Liabilities
| | | | |
| Assets | | October 31, 2012 | |
Unaffiliated investments, at value (identified cost, $3,825,396,254) | | $ | 3,848,783,267 | |
Affiliated investments, at value (identified cost, $93,586,107) | | | 93,586,107 | |
Cash | | | 15,568,994 | |
Restricted cash* | | | 3,980,586 | |
Foreign currency, at value (identified cost, $26,443,134) | | | 26,469,317 | |
Interest receivable | | | 12,560,567 | |
Interest receivable from affiliated investment | | | 5,634 | |
Receivable for investments sold | | | 11,199,483 | |
Receivable for open forward foreign currency exchange contracts | | | 30,296 | |
Prepaid expenses | | | 127,591 | |
Other assets | | | 9,802 | |
Total assets | | $ | 4,012,321,644 | |
| |
| Liabilities | | | | |
Notes payable | | $ | 425,000,000 | |
Payable for investments purchased | | | 341,401,109 | |
Payable for open forward foreign currency exchange contracts | | | 1,312,949 | |
Payable for open swap contracts | | | 950,947 | |
Payable to affiliates: | | | | |
Investment adviser fee | | | 1,303,220 | |
Trustees’ fees | | | 5,667 | |
Accrued expenses | | | 566,382 | |
Total liabilities | | $ | 770,540,274 | |
Net Assets applicable to investors’ interest in Portfolio | | $ | 3,241,781,370 | |
| |
| Sources of Net Assets | | | | |
Investors’ capital | | $ | 3,220,609,345 | |
Net unrealized appreciation | | | 21,172,025 | |
Total | | $ | 3,241,781,370 | |
| * | Represents restricted cash on deposit at the custodian as collateral for open financial contracts. |
| | | | |
| | 37 | | See Notes to Financial Statements. |
Senior Debt Portfolio
October 31, 2012
Statement of Operations
| | | | |
| Investment Income | | Year Ended
October 31, 2012 | |
Interest | | $ | 142,354,787 | |
Dividends | | | 2,774,040 | |
Interest allocated from affiliated investment | | | 57,064 | |
Expenses allocated from affiliated investment | | | (7,433 | ) |
Total investment income | | $ | 145,178,458 | |
| |
| Expenses | | | | |
Investment adviser fee | | $ | 12,140,518 | |
Trustees’ fees and expenses | | | 69,458 | |
Custodian fee | | | 686,116 | |
Legal and accounting services | | | 265,641 | |
Interest expense and fees | | | 7,329,346 | |
Miscellaneous | | | 159,744 | |
Total expenses | | $ | 20,650,823 | |
Deduct — | | | | |
Reduction of custodian fee | | $ | 38 | |
Total expense reductions | | $ | 38 | |
| |
Net expenses | | $ | 20,650,785 | |
| |
Net investment income | | $ | 124,527,673 | |
| |
| Realized and Unrealized Gain (Loss) | | | | |
Net realized gain (loss) — | | | | |
Investment transactions | | $ | 5,818,996 | |
Investment transactions allocated from affiliated investment | | | 574 | |
Swap contracts | | | (277,922 | ) |
Foreign currency and forward foreign currency exchange contract transactions | | | 7,129,281 | |
Net realized gain | | $ | 12,670,929 | |
Change in unrealized appreciation (depreciation) — | | | | |
Investments | | $ | 64,674,364 | |
Swap contracts | | | (251,873 | ) |
Foreign currency and forward foreign currency exchange contracts | | | (3,549,117 | ) |
Net change in unrealized appreciation (depreciation) | | $ | 60,873,374 | |
| |
Net realized and unrealized gain | | $ | 73,544,303 | |
| |
Net increase in net assets from operations | | $ | 198,071,976 | |
| | | | |
| | 38 | | See Notes to Financial Statements. |
Senior Debt Portfolio
October 31, 2012
Statements of Changes in Net Assets
| | | | | | | | |
| | | Year Ended October 31, | |
| Increase (Decrease) in Net Assets | | 2012 | | | 2011 | |
From operations — | | | | | | | | |
Net investment income | | $ | 124,527,673 | | | $ | 88,020,298 | |
Net realized gain (loss) from investment transactions, swap contracts, foreign currency and forward foreign currency exchange contract transactions | | | 12,670,929 | | | | (9,337,724 | ) |
Net change in unrealized appreciation (depreciation) from investments, swap contracts, foreign currency and forward foreign currency exchange contracts | | | 60,873,374 | | | | (7,088,636 | ) |
Net increase in net assets from operations | | $ | 198,071,976 | | | $ | 71,593,938 | |
Capital transactions — | | | | | | | | |
Contributions | | $ | 1,589,597,098 | | | $ | 494,343,350 | |
Withdrawals | | | (191,767,616 | ) | | | (267,752,684 | ) |
Net increase in net assets from capital transactions | | $ | 1,397,829,482 | | | $ | 226,590,666 | |
| | |
Net increase in net assets | | $ | 1,595,901,458 | | | $ | 298,184,604 | |
| | |
| Net Assets | | | | | | | | |
At beginning of year | | $ | 1,645,879,912 | | | $ | 1,347,695,308 | |
At end of year | | $ | 3,241,781,370 | | | $ | 1,645,879,912 | |
| | | | |
| | 39 | | See Notes to Financial Statements. |
Senior Debt Portfolio
October 31, 2012
Statement of Cash Flows
| | | | |
| Cash Flows From Operating Activities | | Year Ended October 31, 2012 | |
Net increase in net assets from operations | | $ | 198,071,976 | |
Adjustments to reconcile net increase in net assets from operations to net cash used in operating activities: | | | | |
Investments purchased | | | (2,370,473,953 | ) |
Investments sold and principal repayments | | | 1,002,711,363 | |
Increase in short-term investments, net | | | (32,815,112 | ) |
Net amortization/accretion of premium (discount) | | | (10,144,504 | ) |
Increase in restricted cash | | | (2,330,586 | ) |
Increase in dividends and interest receivable | | | (4,506,580 | ) |
Increase in interest receivable from affiliated investment | | | (3,247 | ) |
Decrease in receivable for open forward foreign currency exchange contracts | | | 2,652,733 | |
Increase in prepaid expenses | | | (43,684 | ) |
Decrease in other assets | | | 23,096 | |
Increase in payable for open forward foreign currency exchange contracts | | | 278,378 | |
Increase in payable for open swap contracts | | | 251,873 | |
Increase in payable to affiliate for investment adviser fee | | | 458,799 | |
Increase in payable to affiliate for Trustees’ fees | | | 1,459 | |
Decrease in accrued expenses | | | (341,221 | ) |
Decrease in unfunded loan commitments | | | (8,791,690 | ) |
Net change in unrealized (appreciation) depreciation from investments | | | (64,674,364 | ) |
Net realized gain from investments | | | (5,818,996 | ) |
Net cash used in operating activities | | $ | (1,295,494,260 | ) |
| |
| Cash Flows From Financing Activities | | | | |
Proceeds from capital contributions | | $ | 1,589,597,098 | |
Payments for capital withdrawals | | | (191,767,616 | ) |
Proceeds from notes payable | | | 680,000,000 | |
Repayments of notes payable | | | (745,000,000 | ) |
Net cash provided by financing activities | | $ | 1,332,829,482 | |
| |
Net increase in cash* | | $ | 37,335,222 | |
| |
Cash at beginning of year(1) | | $ | 4,703,089 | |
| |
Cash at end of year(1) | | $ | 42,038,311 | |
| |
| Supplemental disclosure of cash flow information: | | | | |
Cash paid for interest and fees on borrowings | | $ | 7,579,326 | |
| (1) | Balance includes foreign currency, at value. |
| * | Includes net change in unrealized appreciation (depreciation) on foreign currency of $48,907. |
| | | | |
| | 40 | | See Notes to Financial Statements. |
Senior Debt Portfolio
October 31, 2012
Supplementary Data
| | | | | | | | | | | | | | | | | | | | |
| | | Year Ended October 31, | |
| Ratios/Supplemental Data | | 2012 | | | 2011 | | | 2010 | | | 2009 | | | 2008 | |
Ratios (as a percentage of average daily net assets): | | | | | | | | | | | | | | | | | | | | |
Expenses before custodian fee reduction excluding interest and fees(1) | | | 0.61 | % | | | 0.65 | % | | | 0.72 | % | | | 0.76 | % | | | 0.66 | % |
Interest and fee expense | | | 0.34 | % | | | 0.39 | % | | | 0.56 | % | | | 1.31 | % | | | 0.98 | % |
Total expenses | | | 0.95 | % | | | 1.04 | % | | | 1.28 | % | | | 2.07 | % | | | 1.64 | % |
Net investment income | | | 5.73 | % | | | 5.31 | % | | | 5.15 | % | | | 5.97 | % | | | 7.01 | % |
Portfolio Turnover | | | 37 | % | | | 59 | % | | | 37 | % | | | 32 | % | | | 7 | % |
| | | | | |
Total Return | | | 9.94 | % | | | 5.54 | % | | | 14.14 | % | | | 38.19 | % | | | (26.81 | )% |
| | | | | |
Net assets, end of year (000’s omitted) | | $ | 3,241,781 | | | $ | 1,645,880 | | | $ | 1,347,695 | | | $ | 1,263,528 | | | $ | 1,119,305 | |
| (1) | Excludes the effect of custody fee credits, if any, of less than 0.005%. |
| | | | |
| | 41 | | See Notes to Financial Statements. |
Senior Debt Portfolio
October 31, 2012
Notes to Financial Statements
1 Significant Accounting Policies
Senior Debt Portfolio (the Portfolio) is a Massachusetts business trust registered under the Investment Company Act of 1940, as amended (the 1940 Act), as an open-end management investment company. The Portfolio’s investment objective is to provide a high level of current income. The Declaration of Trust permits the Trustees to issue interests in the Portfolio. At October 31, 2012, Eaton Vance Floating-Rate Advantage Fund and Eaton Vance Strategic Income Fund held an interest of 96.9% and 3.1%, respectively, in the Portfolio.
The following is a summary of significant accounting policies of the Portfolio. The policies are in conformity with accounting principles generally accepted in the United States of America.
A Investment Valuation — Interests in senior floating-rate loans (Senior Loans) for which reliable market quotations are readily available are valued generally at the average mean of bid and ask quotations obtained from a third party pricing service. Other Senior Loans are valued at fair value by the investment adviser under procedures approved by the Trustees. In fair valuing a Senior Loan, the investment adviser utilizes one or more of the valuation techniques described in (i) through (iii) below to assess the likelihood that the borrower will make a full repayment of the loan underlying such Senior Loan relative to yields on other Senior Loans issued by companies of comparable credit quality. If the investment adviser believes that there is a reasonable likelihood of full repayment, the investment adviser will determine fair value using a matrix pricing approach that considers the yield on the Senior Loan. If the investment adviser believes there is not a reasonable likelihood of full repayment, the investment adviser will determine fair value using analyses that include, but are not limited to: (i) a comparison of the value of the borrower’s outstanding equity and debt to that of comparable public companies; (ii) a discounted cash flow analysis; or (iii) when the investment adviser believes it is likely that a borrower will be liquidated or sold, an analysis of the terms of such liquidation or sale. In certain cases, the investment adviser will use a combination of analytical methods to determine fair value, such as when only a portion of a borrower’s assets are likely to be sold. In conducting its assessment and analyses for purposes of determining fair value of a Senior Loan, the investment adviser will use its discretion and judgment in considering and appraising relevant factors. Fair value determinations are made by the portfolio managers of the Portfolio based on information available to such managers. The portfolio managers of other funds managed by the investment adviser that invest in Senior Loans may not possess the same information about a Senior Loan borrower as the portfolio managers of the Portfolio. At times, the fair value of a Senior Loan determined by the portfolio managers of other funds managed by the investment adviser that invest in Senior Loans may vary from the fair value of the same Senior Loan determined by the portfolio managers of the Portfolio. The fair value of each Senior Loan is periodically reviewed and approved by the investment adviser’s Valuation Committee and by the Trustees based upon procedures approved by the Trustees. Junior Loans (i.e., subordinated loans and second lien loans) are valued in the same manner as Senior Loans.
Debt obligations (including short-term obligations with a remaining maturity of more than sixty days) are generally valued on the basis of valuations provided by third party pricing services, as derived from such services’ pricing models. Inputs to the models may include, but are not limited to, reported trades, executable bid and asked prices, broker/dealer quotations, prices or yields of securities with similar characteristics, benchmark curves or information pertaining to the issuer, as well as industry and economic events. The pricing services may use a matrix approach, which considers information regarding securities with similar characteristics to determine the valuation for a security. Short-term obligations purchased with a remaining maturity of sixty days or less are generally valued at amortized cost, which approximates market value.
Equity securities (including common shares of closed-end investment companies) listed on a U.S. securities exchange generally are valued at the last sale or closing price on the day of valuation or, if no sales took place on such date, at the mean between the closing bid and asked prices therefore on the exchange where such securities are principally traded. Equity securities listed on the NASDAQ Global or Global Select Market generally are valued at the NASDAQ official closing price. Unlisted or listed securities for which closing sales prices or closing quotations are not available are valued at the mean between the latest available bid and asked prices or, in the case of preferred equity securities that are not listed or traded in the over-the-counter market, by a third party pricing service that will use various techniques that consider factors including, but not limited to, prices or yields of securities with similar characteristics, benchmark yields, broker/dealer quotes, quotes of underlying common stock, issuer spreads, as well as industry and economic events. Forward foreign currency exchange contracts are generally valued at the mean of the average bid and average asked prices that are reported by currency dealers to a third party pricing service at the valuation time. Such third party pricing service valuations are supplied for specific settlement periods and the Portfolio’s forward foreign currency exchange contracts are valued at an interpolated rate between the closest preceding and subsequent settlement period reported by the third party pricing service. Interest rate swaps are normally valued using valuations provided by a third party pricing service. Such pricing service valuations are based on the present value of fixed and projected floating rate cash flows over the term of the swap contract. Future cash flows are discounted to their present value using swap quotations provided by electronic data services or by broker/dealers. Foreign securities and currencies are valued in U.S. dollars, based on foreign currency exchange rate quotations supplied by a third party pricing service. The pricing service uses a proprietary model to determine the exchange rate. Inputs to the model include reported trades and implied bid/ask spreads. Investments for which valuations or market quotations are not readily available or are deemed unreliable are valued at fair value using methods determined in good faith by or at the direction of the Trustees of the Portfolio in a manner that fairly reflects the security’s value, or the amount that the Portfolio might reasonably expect to receive for the security upon its current sale in the ordinary course. Each such determination is based on a consideration of relevant factors, which are likely to vary from one pricing context to another. These factors may include, but are not limited to, the type of security, the existence of any contractual restrictions on the security’s disposition, the price and extent of public trading in similar securities of the issuer or of comparable companies or entities, quotations or relevant information obtained from broker/dealers or other market participants, information obtained from the issuer, analysts, and/or the appropriate stock exchange (for exchange-traded securities), an analysis of the company’s or entity’s financial condition, and an evaluation of the forces that influence the issuer and the market(s) in which the security is purchased and sold.
Senior Debt Portfolio
October 31, 2012
Notes to Financial Statements — continued
The Portfolio may invest in Eaton Vance Cash Reserves Fund, LLC (Cash Reserves Fund), an affiliated investment company managed by Eaton Vance Management (EVM). Cash Reserves Fund generally values its investment securities utilizing the amortized cost valuation technique in accordance with Rule 2a-7 under the 1940 Act. This technique involves initially valuing a portfolio security at its cost and thereafter assuming a constant amortization to maturity of any discount or premium. If amortized cost is determined not to approximate fair value, Cash Reserves Fund may value its investment securities in the same manner as debt obligations described above.
B Investment Transactions — Investment transactions for financial statement purposes are accounted for on a trade date basis. Realized gains and losses on investments sold are determined on the basis of identified cost.
C Income — Interest income is recorded on the basis of interest accrued, adjusted for amortization of premium or accretion of discount. Fees associated with loan amendments are recognized immediately. Dividend income is recorded on the ex-dividend date for dividends received in cash and/or securities.
D Federal Taxes — The Portfolio has elected to be treated as a partnership for federal tax purposes. No provision is made by the Portfolio for federal or state taxes on any taxable income of the Portfolio because each investor in the Portfolio is ultimately responsible for the payment of any taxes on its share of taxable income. Since at least one of the Portfolio’s investors is a regulated investment company that invests all or substantially all of its assets in the Portfolio, the Portfolio normally must satisfy the applicable source of income and diversification requirements (under the Internal Revenue Code) in order for its investors to satisfy them. The Portfolio will allocate, at least annually among its investors, each investor’s distributive share of the Portfolio’s net investment income, net realized capital gains and any other items of income, gain, loss, deduction or credit.
As of October 31, 2012, the Portfolio had no uncertain tax positions that would require financial statement recognition, de-recognition, or disclosure. The Portfolio files a U.S. federal income tax return annually after its fiscal year-end, which is subject to examination by the Internal Revenue Service for a period of three years from the date of filing.
E Expense Reduction — State Street Bank and Trust Company (SSBT) serves as custodian of the Portfolio. Pursuant to the custodian agreement, SSBT receives a fee reduced by credits, which are determined based on the average daily cash balance the Portfolio maintains with SSBT. All credit balances, if any, used to reduce the Portfolio’s custodian fees are reported as a reduction of expenses in the Statement of Operations.
F Foreign Currency Translation — Investment valuations, other assets, and liabilities initially expressed in foreign currencies are translated each business day into U.S. dollars based upon current exchange rates. Purchases and sales of foreign investment securities and income and expenses denominated in foreign currencies are translated into U.S. dollars based upon currency exchange rates in effect on the respective dates of such transactions. Recognized gains or losses on investment transactions attributable to changes in foreign currency exchange rates are recorded for financial statement purposes as net realized gains and losses on investments. That portion of unrealized gains and losses on investments that results from fluctuations in foreign currency exchange rates is not separately disclosed.
G Unfunded Loan Commitments — The Portfolio may enter into certain credit agreements all or a portion of which may be unfunded. The Portfolio is obligated to fund these commitments at the borrower’s discretion. These commitments are disclosed in the accompanying Portfolio of Investments. At October 31, 2012, the Portfolio had sufficient cash and/or securities to cover these commitments.
H Use of Estimates — The preparation of the financial statements in conformity with accounting principles generally accepted in the United States of America requires management to make estimates and assumptions that affect the reported amounts of assets and liabilities at the date of the financial statements and the reported amounts of income and expense during the reporting period. Actual results could differ from those estimates.
I Indemnifications — Under the Portfolio’s organizational documents, its officers and Trustees may be indemnified against certain liabilities and expenses arising out of the performance of their duties to the Portfolio. Under Massachusetts law, if certain conditions prevail, interestholders in the Portfolio could be deemed to have personal liability for the obligations of the Portfolio. However, the Portfolio’s Declaration of Trust contains an express disclaimer of liability on the part of Portfolio interestholders and the By-laws provide that the Portfolio shall assume the defense on behalf of any Portfolio interestholder. Moreover, the By-laws also provide for indemnification out of Portfolio property of any interestholder held personally liable solely by reason of being or having been an interestholder for all loss or expense arising from such liability. Additionally, in the normal course of business, the Portfolio enters into agreements with service providers that may contain indemnification clauses. The Portfolio’s maximum exposure under these arrangements is unknown as this would involve future claims that may be made against the Portfolio that have not yet occurred.
J Forward Foreign Currency Exchange Contracts — The Portfolio may enter into forward foreign currency exchange contracts for the purchase or sale of a specific foreign currency at a fixed price on a future date. The forward foreign currency exchange contracts are adjusted by the daily exchange rate of the underlying currency and any gains or losses are recorded as unrealized until such time as the contracts have been closed or offset by another contract with the same broker for the same settlement date and currency. Risks may arise upon entering these contracts from the potential inability of counterparties to meet the terms of their contracts and from movements in the value of a foreign currency relative to the U.S. dollar.
K Interest Rate Swaps — Pursuant to interest rate swap agreements, the Portfolio either makes floating-rate payments based on a benchmark interest rate in exchange for fixed-rate payments or the Portfolio makes fixed-rate payments in exchange for payments on a floating benchmark interest rate. Payments received or made are recorded as realized gains or losses. During the term of the outstanding swap agreement, changes in the underlying value of the swap
Senior Debt Portfolio
October 31, 2012
Notes to Financial Statements��— continued
are recorded as unrealized gains or losses. The value of the swap is determined by changes in the relationship between two rates of interest. The Portfolio is exposed to credit loss in the event of non-performance by the swap counterparty. Risk may also arise from movements in interest rates.
L Statement of Cash Flows — The cash amount shown in the Statement of Cash Flows of the Portfolio is the amount included in the Portfolio’s Statement of Assets and Liabilities and represents the cash on hand at its custodian and does not include any short-term investments.
2 Investment Adviser Fee and Other Transactions with Affiliates
The investment adviser fee is earned by Boston Management and Research (BMR), a subsidiary of EVM, as compensation for investment advisory services rendered to the Portfolio. Pursuant to the investment advisory agreement and subsequent fee reduction agreement between the Portfolio and BMR, the fee is computed at an annual rate of 0.50% of the Portfolio’s average daily gross assets up to and including $1 billion, 0.45% over $1 billion up to and including $2 billion, and at reduced rates on daily gross assets over $2 billion, and is payable monthly. The fee reduction cannot be terminated without the consent of the Trustees and shareholders. The Portfolio invests its cash in Cash Reserves Fund. EVM does not currently receive a fee for advisory services provided to Cash Reserves Fund. For the year ended October 31, 2012, the Portfolio’s investment adviser fee totaled $12,140,518 or 0.56% of the Portfolio’s average daily net assets.
Trustees and officers of the Portfolio who are members of EVM’s or BMR’s organizations receive remuneration for their services to the Portfolio out of the investment adviser fee. Trustees of the Portfolio who are not affiliated with the investment adviser may elect to defer receipt of all or a percentage of their annual fees in accordance with the terms of the Trustees Deferred Compensation Plan. For the year ended October 31, 2012, no significant amounts have been deferred. Certain officers and Trustees of the Portfolio are officers of the above organizations.
3 Purchases and Sales of Investments
Purchases and sales of investments, other than short-term obligations and including maturities, paydowns and principal repayments on Senior Loans, aggregated $2,661,988,443 and $986,428,813, respectively, for the year ended October 31, 2012.
4 Federal Income Tax Basis of Investments
The cost and unrealized appreciation (depreciation) of investments of the Portfolio at October 31, 2012, as determined on a federal income tax basis, were as follows:
| | | | |
| |
Aggregate cost | | $ | 3,919,230,235 | |
| |
Gross unrealized appreciation | | $ | 51,504,591 | |
Gross unrealized depreciation | | | (28,365,452 | ) |
| |
Net unrealized appreciation | | $ | 23,139,139 | |
The net unrealized depreciation on swap contracts and foreign currency transactions at October 31, 2012 on a federal income tax basis was $2,214,988.
5 Restricted Securities
At October 31, 2012, the Portfolio owned the following securities (representing less than 0.1% of net assets) which were restricted as to public resale and not registered under the Securities Act of 1933 (excluding Rule 144A securities). The Portfolio has various registration rights (exercisable under a variety of circumstances) with respect to these securities. The value of these securities is determined based on valuations provided by brokers when available, or if not available, they are valued at fair value using methods determined in good faith by or at the direction of the Trustees.
Senior Debt Portfolio
October 31, 2012
Notes to Financial Statements — continued
| | | | | | | | | | | | | | | | |
| Description | | Date of Acquisition | | | Shares | | | Cost | | | Value | |
| | | | |
Common Stocks | | | | | | | | | | | | | | | | |
Environmental Systems Products Holdings, Inc | | | 10/24/00 | | | | 1,242 | | | $ | 0 | | | $ | 89,710 | |
Safelite Realty Corp. | | | 9/29/00-11/10/00 | | | | 20,048 | | | | 0 | | | | 0 | |
| | | | |
Total Common Stocks | | | | | | | | | | $ | 0 | | | $ | 89,710 | |
| | | | |
Preferred Stocks | | | | | | | | | | | | | | | | |
Environmental Systems Products Holdings, Inc., Series A | | | 10/25/07 | | | | 284 | | | $ | 4,970 | | | $ | 17,892 | |
| | | | |
Total Restricted Securities | | | | | | | | | | $ | 4,970 | | | $ | 107,602 | |
6 Financial Instruments
The Portfolio may trade in financial instruments with off-balance sheet risk in the normal course of its investing activities. These financial instruments may include forward foreign currency exchange contracts and swap contracts and may involve, to a varying degree, elements of risk in excess of the amounts recognized for financial statement purposes. The notional or contractual amounts of these instruments represent the investment the Portfolio has in particular classes of financial instruments and do not necessarily represent the amounts potentially subject to risk. The measurement of the risks associated with these instruments is meaningful only when all related and offsetting transactions are considered.
A summary of obligations under these financial instruments at October 31, 2012 is as follows:
| | | | | | | | | | |
| Forward Foreign Currency Exchange Contracts | | | | | |
| | | | |
| | | | | | | | | | |
Sales | |
| Settlement Date | | Deliver | | In Exchange For | | Counterparty | | Net Unrealized Appreciation
(Depreciation) | |
| | | | |
| 11/30/12 | | British Pound Sterling
13,699,983 | | United States Dollar
21,679,264 | | JPMorgan Chase Bank | | $ | (426,968 | ) |
| 11/30/12 | | Euro
11,419,719 | | United States Dollar
14,324,610 | | Citibank NA | | | (480,662 | ) |
| 12/31/12 | | British Pound Sterling
7,557,756 | | United States Dollar
12,202,866 | | Goldman Sachs International | | | 8,746 | |
| 12/31/12 | | British Pound Sterling
4,303,125 | | United States Dollar
6,947,361 | | State Street Bank and Trust Co. | | | 4,450 | |
| 12/31/12 | | Euro
30,227,320 | | United States Dollar
38,902,863 | | HSBC Bank USA | | | (300,381 | ) |
| 1/31/13 | | British Pound Sterling 17,396,444 | | United States Dollar
27,960,435 | | HSBC Bank USA | | | (104,938 | ) |
| 1/31/13 | | Euro
19,702,884 | | United States Dollar
25,578,087 | | Deutsche Bank | | | 17,100 | |
| | | | |
| | | | | | | | | $ | (1,282,653 | ) |
Senior Debt Portfolio
October 31, 2012
Notes to Financial Statements — continued
| | | | | | | | | | | | | | | | | | |
| Interest Rate Swaps | |
| Counterparty | | Notional Amount (000’s omitted) | | Portfolio Pays/Receives
Floating Rate | | Floating Rate Index | | Annual Fixed Rate | | | Termination Date | | | Net Unrealized Depreciation | |
| | | | | | |
| Citibank NA | | $15,000 | | Receives | | 3-month USD-LIBOR-BBA | | | 0.98 | % | | | 6/24/14 | | | $ | (238,492 | ) |
| Citibank NA | | 15,000 | | Receives | | 3-month USD-LIBOR-BBA | | | 1.81 | | | | 6/24/16 | | | | (712,455 | ) |
| | | | | | |
| | | | | | | | | | | | | | | | | $ | (950,947 | ) |
At October 31, 2012, the Portfolio had sufficient cash and/or securities to cover commitments under these contracts.
In the normal course of pursuing its investment objectives and its use of derivatives, the Portfolio is subject to the following risks:
Foreign Exchange Risk: Because the Portfolio holds foreign currency denominated investments, the value of these investments and related receivables and payables may change due to future changes in foreign currency exchange rates. To hedge against this risk, the Portfolio enters into forward foreign currency exchange contracts. The Portfolio also enters into such contracts to hedge the currency risk of investments it anticipates purchasing.
Interest Rate Risk: Because the Portfolio holds fixed-rate bonds, the value of these bonds may decrease if interest rates rise. To hedge against this risk, the Portfolio enters into interest rate swap contracts.
The Portfolio enters into swap contracts and forward foreign currency exchange contracts that may contain provisions whereby the counterparty may terminate the contract under certain conditions, including but not limited to a decline in the Portfolio’s net assets below a certain level over a certain period of time, which would trigger a payment by the Portfolio for those derivatives in a liability position. At October 31, 2012, the fair value of derivatives with credit-related contingent features in a net liability position was $2,263,896. The aggregate fair value of assets pledged as collateral by the Portfolio for such liability was $3,980,586 at October 31, 2012.
The non-exchange traded derivatives in which the Portfolio invests, including swap contracts and forward foreign currency exchange contracts, are subject to the risk that the counterparty to the contract fails to perform its obligations under the contract. At October 31, 2012, the maximum amount of loss the Portfolio would incur due to counterparty risk was $30,296, representing the fair value of such derivatives in an asset position, with the highest amount from any one counterparty being $17,100. To mitigate this risk, the Portfolio has entered into master netting agreements with substantially all its derivative counterparties, which allows it and a counterparty to aggregate amounts owed by each of them for derivative transactions under the agreement into a single net amount payable by either the Portfolio or the counterparty. Counterparties may be required to pledge collateral in the form of cash, U.S. Government securities or highly-rated bonds for the benefit of the Portfolio if the net amount due from the counterparty with respect to a derivative contract exceeds a certain threshold. The amount of collateral posted by the counterparties with respect to such contracts would also reduce the amount of any loss incurred.
The fair value of open derivative instruments (not considered to be hedging instruments for accounting disclosure purposes) by risk exposure at October 31, 2012 was as follows:
| | | | | | | | | | |
| | | | | Fair Value | |
| Risk | | Derivative | | Asset Derivative | | | Liability Derivative | |
| | | |
Foreign Exchange | | Forward foreign currency exchange contracts | | $ | 30,296 | (1) | | $ | (1,312,949 | )(2) |
| | | |
| | | | | $ | 30,296 | | | $ | (1,312,949 | ) |
| | | |
Interest rate | | Interest rate swaps | | $ | — | | | $ | (950,947 | )(3) |
| | | |
| | | | | $ | — | | | $ | (950,947 | ) |
| (1) | Statement of Assets and Liabilities location: Receivable for open forward foreign currency exchange contracts; Net unrealized appreciation. |
| (2) | Statement of Assets and Liabilities location: Payable for open forward foreign currency exchange contracts and Net unrealized appreciation. |
| (3) | Statement of Assets and Liabilities location: Payable for open swap contracts; Net unrealized appreciation. |
Senior Debt Portfolio
October 31, 2012
Notes to Financial Statements — continued
The effect of derivative instruments (not considered to be hedging instruments for accounting disclosure purposes) on the Statement of Operations by risk exposure for the year ended October 31, 2012 was as follows:
| | | | | | | | | | |
| Risk | | Derivative | | Realized Gain (Loss) on Derivatives Recognized in Income | | | Change in Unrealized Appreciation (Depreciation) on Derivatives Recognized in Income | |
| | | |
Foreign Exchange | | Forward foreign currency exchange contracts | | $ | 7,882,421 | (1) | | $ | (2,931,111 | )(2) |
Interest Rate | | Interest rate swaps | | | (277,922 | )(3) | | | (251,873 | )(4) |
| | | |
Total | | | | $ | 7,604,499 | | | $ | (3,182,984 | ) |
| (1) | Statement of Operations location: Net realized gain (loss) – Foreign currency and forward foreign currency exchange contract transactions. |
| (2) | Statement of Operations location: Change in unrealized appreciation (depreciation) – Foreign currency and forward foreign currency exchange contracts. |
| (3) | Statement of Operations location: Net realized gain (loss) – Swap contracts. |
| (4) | Statement of Operations location: Change in unrealized appreciation (depreciation) – Swap contracts. |
The average notional amounts of forward foreign currency exchange contracts and swap contracts outstanding during the year ended October 31, 2012, which are indicative of the volume of these derivative types, were approximately $109,442,000 and $30,000,000, respectively.
7 Revolving Credit Agreement
The Portfolio has entered into a Revolving Credit Agreement, as amended (the Agreement) with conduit lenders and a bank that allows it to borrow up to $840 million ($640 million prior to June 18, 2012) and to invest the borrowings in accordance with its investment practices. Borrowings under the Agreement are secured by the assets of the Portfolio. Interest is charged at a rate above the conduits’ commercial paper issuance rate and is payable monthly. Under the terms of the Agreement, the Portfolio also pays a program fee of 0.65% (0.60% prior to February 16, 2012) per annum on its outstanding borrowings to administer the facility and a commitment fee of 0.35% (0.45% prior to February 16, 2012) per annum if outstanding loan amount is greater than 50% of total facility size; 0.45% if outstanding loan amount is less than or equal to 50% of total facility size. Program and commitment fees for the year ended October 31, 2012 totaled $5,685,604 and are included in interest expense in the Statement of Operations. In connection with the structuring of the Agreement, the Portfolio was obligated to pay a fee of $1 million in quarterly installments of $50,000 through February 2012, of which no balance remains outstanding at October 31, 2012. At October 31, 2012, the Portfolio had borrowings outstanding under the Agreement of $425,000,000 at an interest rate of 0.27%. The carrying amount of the borrowings at October 31, 2012 approximated its fair value. If measured at fair value, borrowings under the Agreement would have been considered as Level 2 in the fair value hierarchy (see Note 10) at October 31, 2012. For the year ended October 31, 2012, the average borrowings under the Agreement and the average annual interest rate were $489,870,765 and 0.32%, respectively.
8 Risks Associated with Foreign Investments
Investing in securities issued by companies whose principal business activities are outside the United States may involve significant risks not present in domestic investments. For example, there is generally less publicly available information about foreign companies, particularly those not subject to the disclosure and reporting requirements of the U.S. securities laws. Certain foreign issuers are generally not bound by uniform accounting, auditing, and financial reporting requirements and standards of practice comparable to those applicable to domestic issuers. Investments in foreign securities also involve the risk of possible adverse changes in investment or exchange control regulations, expropriation or confiscatory taxation, limitation on the removal of funds or other assets of the Portfolio, political or financial instability or diplomatic and other developments which could affect such investments. Foreign securities markets, while growing in volume and sophistication, are generally not as developed as those in the United States, and securities of some foreign issuers (particularly those located in developing countries) may be less liquid and more volatile than securities of comparable U.S. companies. In general, there is less overall governmental supervision and regulation of foreign securities markets, broker/dealers and issuers than in the United States.
9 Credit Risk
The Portfolio invests primarily in below investment grade floating-rate loans and floating-rate debt obligations, which are considered speculative because of the credit risk of their issuers. Changes in economic conditions or other circumstances are more likely to reduce the capacity of issuers of these securities to make principal and interest payments. Such companies are more likely to default on their payments of interest and principal owed than issuers of investment grade bonds. An economic downturn generally leads to a higher non-payment rate, and a loan or other debt obligation may lose significant value before a default occurs. Lower rated investments also may be subject to greater price volatility than higher rated investments. Moreover, the specific collateral used to secure a loan may decline in value or become illiquid, which would adversely affect the loan’s value.
Senior Debt Portfolio
October 31, 2012
Notes to Financial Statements — continued
10 Fair Value Measurements
Under generally accepted accounting principles for fair value measurements, a three-tier hierarchy to prioritize the assumptions, referred to as inputs, is used in valuation techniques to measure fair value. The three-tier hierarchy of inputs is summarized in the three broad levels listed below.
| Ÿ | | Level 1 – quoted prices in active markets for identical investments |
| Ÿ | | Level 2 – other significant observable inputs (including quoted prices for similar investments, interest rates, prepayment speeds, credit risk, etc.) |
| Ÿ | | Level 3 – significant unobservable inputs (including a fund’s own assumptions in determining the fair value of investments) |
In cases where the inputs used to measure fair value fall in different levels of the fair value hierarchy, the level disclosed is determined based on the lowest level input that is significant to the fair value measurement in its entirety. The inputs or methodology used for valuing securities are not necessarily an indication of the risk associated with investing in those securities.
At October 31, 2012, the hierarchy of inputs used in valuing the Portfolio’s investments and open derivative instruments, which are carried at value, were as follows:
| | | | | | | | | | | | | | | | |
| Asset Description | | Level 1 | | | Level 2 | | | Level 3* | | | Total | |
| | | | |
Senior Floating-Rate Interests (Less Unfunded Loan Commitments) | | $ | — | | | $ | 3,722,119,049 | | | $ | 5,124,776 | | | $ | 3,727,243,825 | |
Corporate Bonds & Notes | | | — | | | | 98,835,402 | | | | 78,037 | | | | 98,913,439 | |
Common Stocks | | | — | | | | 6,942,777 | | | | 15,647,334 | | | | 22,590,111 | |
Preferred Stocks | | | — | | | | — | | | | 17,892 | | | | 17,892 | |
Warrants | | | — | | | | — | | | | 18,000 | | | | 18,000 | |
Short-Term Investments | | | — | | | | 93,586,107 | | | | — | | | | 93,586,107 | |
| | | | |
Total Investments | | $ | — | | | $ | 3,921,483,335 | | | $ | 20,886,039 | | | $ | 3,942,369,374 | |
Forward Foreign Currency Exchange Contracts | | $ | — | | | $ | 30,296 | | | $ | — | | | $ | 30,296 | |
| | | | |
Total | | $ | — | | | $ | 3,921,513,631 | | | $ | 20,886,039 | | | $ | 3,942,399,670 | |
| | | | |
Liability Description | | | | | | | | | | | | | | | | |
| | | | |
Forward Foreign Currency Exchange Contracts | | $ | — | | | $ | (1,312,949 | ) | | $ | — | | | $ | (1,312,949 | ) |
Interest Rate Swaps | | | — | | | | (950,947 | ) | | | — | | | | (950,947 | ) |
| | | | |
Total | | $ | — | | | $ | (2,263,896 | ) | | $ | — | | | $ | (2,263,896 | ) |
| * | None of the unobservable inputs for Level 3 assets, individually or collectively, had a material impact on the Fund. |
Level 3 investments at the beginning and/or end of the period in relation to net assets were not significant and accordingly, a reconciliation of Level 3 assets for the year ended October 31, 2012 is not presented. At October 31, 2012, there were no investments transferred between Level 1 and Level 2 during the year then ended.
Senior Debt Portfolio
October 31, 2012
Report of Independent Registered Public Accounting Firm
To the Trustees and Investors of Senior Debt Portfolio:
We have audited the accompanying statement of assets and liabilities of Senior Debt Portfolio (the “Portfolio”), including the portfolio of investments, as of October 31, 2012, and the related statements of operations and cash flows for the year then ended, the statements of changes in net assets for each of the two years in the period then ended, and the supplementary data for each of the five years in the period then ended. These financial statements and supplementary data are the responsibility of the Portfolio’s management. Our responsibility is to express an opinion on these financial statements and supplementary data based on our audits.
We conducted our audits in accordance with the standards of the Public Company Accounting Oversight Board (United States). Those standards require that we plan and perform the audit to obtain reasonable assurance about whether the financial statements and supplementary data are free of material misstatement. The Portfolio is not required to have, nor were we engaged to perform, an audit of its internal control over financial reporting. Our audits included consideration of internal control over financial reporting as a basis for designing audit procedures that are appropriate in the circumstances, but not for the purpose of expressing an opinion on the effectiveness of the Portfolio’s internal control over financial reporting. Accordingly, we express no such opinion. An audit also includes examining, on a test basis, evidence supporting the amounts and disclosures in the financial statements, assessing the accounting principles used and significant estimates made by management, as well as evaluating the overall financial statement presentation. Our procedures included confirmation of securities and senior loans owned as of October 31, 2012, by correspondence with the custodian, brokers, and selling or agent banks; where replies were not received from brokers and selling or agent banks, we performed other auditing procedures. We believe that our audits provide a reasonable basis for our opinion.
In our opinion, such financial statements and supplementary data referred to above present fairly, in all material respects, the financial position of Senior Debt Portfolio as of October 31, 2012, the results of its operations and its cash flows for the year then ended, the changes in its net assets for each of the two years in the period then ended, and the supplementary data for each of the five years in the period then ended, in conformity with accounting principles generally accepted in the United States of America.
DELOITTE & TOUCHE LLP
Boston, Massachusetts
December 18, 2012
Eaton Vance
Floating-Rate Advantage Fund
October 31, 2012
Management and Organization
Fund Management. The Trustees of Eaton Vance Mutual Funds Trust (the Trust) and Senior Debt Portfolio (the Portfolio) are responsible for the overall management and supervision of the Trust’s and Portfolio’s affairs. The Trustees and officers of the Trust and the Portfolio are listed below. Except as indicated, each individual has held the office shown or other offices in the same company for the last five years. Trustees and officers of the Trust and the Portfolio hold indefinite terms of office. The “Noninterested Trustees” consist of those Trustees who are not “interested persons” of the Trust and the Portfolio, as that term is defined under the 1940 Act. The business address of each Trustee and officer is Two International Place, Boston, Massachusetts 02110. As used below, “EVC” refers to Eaton Vance Corp., “EV” refers to Eaton Vance, Inc., “EVM” refers to Eaton Vance Management, “BMR” refers to Boston Management and Research and “EVD” refers to Eaton Vance Distributors, Inc. EVC and EV are the corporate parent and trustee, respectively, of EVM and BMR. EVD is the Fund’s principal underwriter, the Portfolio’s placement agent and a wholly-owned subsidiary of EVC. Each officer affiliated with Eaton Vance may hold a position with other Eaton Vance affiliates that is comparable to his or her position with EVM listed below. Each Trustee oversees 187 portfolios in the Eaton Vance Complex (including all master and feeder funds in a master feeder structure). Each officer serves as an officer of certain other Eaton Vance funds. Each Trustee and officer serves until his or her successor is elected.
| | | | | | |
| Name and Year of Birth | | Position(s) with the
Trust and the Portfolio | | Length of Service | | Principal Occupation(s) and Directorships During Past Five Years and Other Relevant Experience |
Interested Trustee |
| | | |
Thomas E. Faust Jr. 1958 | | Trustee | | Since 2007 | | Chairman, Chief Executive Officer and President of EVC, Director and President of EV, Chief Executive Officer and President of EVM and BMR, and Director of EVD. Trustee and/or officer of 187 registered investment companies. Mr. Faust is an interested person because of his positions with EVM, BMR, EVD, EVC and EV, which are affiliates of the Trust and the Portfolio. Directorships in the Last Five Years.(1) Director of EVC and Hexavest Inc. |
| | | |
| | | | | | |
Noninterested Trustees |
| | | |
Scott E. Eston 1956 | | Trustee | | Since 2011 | | Private investor. Formerly held various positions at Grantham, Mayo, Van Otterloo and Co., L.L.C. (investment management firm) (1997-2009), including Chief Operating Officer (2002-2009), Chief Financial Officer (1997-2009) and Chairman of the Executive Committee (2002-2008); President and Principal Executive Officer, GMO Trust (open-end registered investment company) (2006-2009). Former Partner, Coopers and Lybrand L.L.P. (now PricewaterhouseCoopers) (public accounting firm) (1987-1997). Directorships in the Last Five Years. None. |
| | | |
Benjamin C. Esty 1963 | | Trustee | | Since 2005 | | Roy and Elizabeth Simmons Professor of Business Administration and Finance Unit Head, Harvard University Graduate School of Business Administration. Directorships in the Last Five Years.(1) None. |
| | | |
Allen R. Freedman 1940 | | Trustee | | Since 2007 | | Private Investor. Former Chairman (2002-2004) and a Director (1983-2004) of Systems & Computer Technology Corp. (provider of software to higher education). Formerly, a Director of Loring Ward International (fund distributor) (2005-2007). Former Chairman and a Director of Indus International, Inc. (provider of enterprise management software to the power generating industry) (2005-2007). Former Chief Executive Officer of Assurant, Inc. (insurance provider) (1979-2000). Directorships in the Last Five Years.(1) Director of Stonemor Partners, L.P. (owner and operator of cemeteries). Formerly, Director of Assurant, Inc. (insurance provider) (1979-2011). |
| | | |
William H. Park 1947 | | Trustee | | Since 2003 | | Consultant and private investor. Formerly, Chief Financial Officer, Aveon Group L.P. (investment management firm) (2010-2011). Formerly, Vice Chairman, Commercial Industrial Finance Corp. (specialty finance company) (2006-2010). Formerly, President and Chief Executive Officer, Prizm Capital Management, LLC (investment management firm) (2002-2005). Formerly, Executive Vice President and Chief Financial Officer, United Asset Management Corporation (investment management firm) (1982-2001). Formerly, Senior Manager, Price Waterhouse (now PricewaterhouseCoopers) (an independent registered public accounting firm) (1972-1981). Directorships in the Last Five Years.(1) None. |
Eaton Vance
Floating-Rate Advantage Fund
October 31, 2012
Management and Organization — continued
| | | | | | |
| Name and Year of Birth | | Position(s) with the
Trust and the Portfolio | | Length of Service | | Principal Occupation(s) and Directorships During Past Five Years and Other Relevant Experience |
Noninterested Trustees (continued) |
| | | |
Ronald A. Pearlman 1940 | | Trustee | | Since 2003 | | Professor of Law, Georgetown University Law Center. Formerly, Deputy Assistant Secretary (Tax Policy) and Assistant Secretary (Tax Policy), U.S. Department of the Treasury (1983-1985). Formerly, Chief of Staff, Joint Committee on Taxation, U.S. Congress (1988-1990). Directorships in the Last Five Years.(1) None. |
| | | |
Helen Frame Peters 1948 | | Trustee | | Since 2008 | | Professor of Finance, Carroll School of Management, Boston College. Formerly, Dean, Carroll School of Management, Boston College (2000-2002). Formerly, Chief Investment Officer, Fixed Income, Scudder Kemper Investments (investment management firm) (1998-1999). Formerly, Chief Investment Officer, Equity and Fixed Income, Colonial Management Associates (investment management firm) (1991-1998). Directorships in the Last Five Years.(1) Formerly, Director of BJ’s Wholesale Club, Inc. (wholesale club retailer) (2004-2011). Formerly, Trustee of SPDR Index Shares Funds and SPDR Series Trust (exchange traded funds) (2000-2009). Formerly, Director of Federal Home Loan Bank of Boston (a bank for banks) (2007-2009). |
| | | |
Lynn A. Stout 1957 | | Trustee | | Since 1998 | | Distinguished Professor of Corporate and Business Law, Jack G. Clarke Business Law Institute, Cornell University Law School. Formerly, the Paul Hastings Professor of Corporate and Securities Law (2006-2012) and Professor of Law (2001-2006), University of California at Los Angeles School of Law. Directorships in the Last Five Years.(1) None. |
| | | |
Harriett Tee Taggart 1948 | | Trustee | | Since 2011 | | Managing Director, Taggart Associates (a professional practice firm). Formerly, Partner and Senior Vice President, Wellington Management Company, LLP (investment management firm) (1983-2006). Directorships in the Last Five Years. Director of Albemarle Corporation (chemicals manufacturer) (since 2007) and The Hanover Group (specialty property and casualty insurance company) (since 2009). Formerly, Director of Lubrizol Corporation (specialty chemicals) (2007-2011). |
| | | |
Ralph F. Verni 1943 | | Chairman of the Board and Trustee | | Chairman of the Board since 2007 and Trustee since 2005 | | Consultant and private investor. Formerly, Chief Investment Officer (1982-1992), Chief Financial Officer (1988-1990) and Director (1982-1992), New England Life. Formerly, Chairperson, New England Mutual Funds (1982-1992). Formerly, President and Chief Executive Officer, State Street Management & Research (1992-2000). Formerly, Chairperson, State Street Research Mutual Funds (1992-2000). Formerly, Director, W.P. Carey, LLC (1998-2004) and First Pioneer Farm Credit Corp. (2002-2006). Directorships in the Last Five Years.(1) None. |
| | | |
| | | | | | |
Principal Officers who are not Trustees |
| Name and Year of Birth | | Position(s) with the Trust and the Portfolio | | Length of Service | | Principal Occupation(s) During Past Five Years |
Duncan W. Richardson 1957 | | President of the Trust | | Since 2011 | | Director of EVC and Executive Vice President and Chief Equity Investment Officer of EVC, EVM and BMR. |
| | | |
Scott H. Page 1959 | | President of the Portfolio | | Since 2002 | | Vice President of EVM and BMR. |
| | | |
Payson F. Swaffield 1956 | | Vice President | | Since 2011 | | Vice President and Chief Income Investment Officer of EVM and BMR. |
| | | |
Barbara E. Campbell 1957 | | Treasurer | | Of the Trust since 2005 and of the Portfolio since 2008 | | Vice President of EVM and BMR. |
Eaton Vance
Floating-Rate Advantage Fund
October 31, 2012
Management and Organization — continued
| | | | | | |
| Name and Year of Birth | | Position(s) with the Trust and the Portfolio | | Length of Service | | Principal Occupation(s) During Past Five Years |
Principal Officers who are not Trustees (continued) |
| | | |
Maureen A. Gemma 1960 | | Vice President, Secretary and Chief Legal Officer | | Vice President since 2011, Secretary since 2007 and Chief Legal Officer since 2008 | | Vice President of EVM and BMR. |
| | | |
Paul M. O’Neil 1953 | | Chief Compliance Officer | | Since 2004 | | Vice President of EVM and BMR. |
| (1) | During their respective tenures, the Trustees (except Mr. Eston and Ms. Taggart) also served as trustees of one or more of the following Eaton Vance funds (which operated in the years noted): Eaton Vance Credit Opportunities Fund (launched in 2005 and terminated in 2010); Eaton Vance Insured Florida Plus Municipal Bond Fund (launched in 2002 and terminated in 2009); and Eaton Vance National Municipal Income Trust (launched in 1998 and terminated in 2009). |
The SAI for the Fund includes additional information about the Trustees and officers of the Fund and the Portfolio and can be obtained without charge on Eaton Vance’s website at www.eatonvance.com or by calling 1-800-262-1122.
Eaton Vance Funds
IMPORTANT NOTICES
Privacy. The Eaton Vance organization is committed to ensuring your financial privacy. Each of the financial institutions identified below has in effect the following policy (“Privacy Policy”) with respect to nonpublic personal information about its customers:
| Ÿ | | Only such information received from you, through application forms or otherwise, and information about your Eaton Vance fund transactions will be collected. This may include information such as name, address, social security number, tax status, account balances and transactions. |
| Ÿ | | None of such information about you (or former customers) will be disclosed to anyone, except as permitted by law (which includes disclosure to employees necessary to service your account). In the normal course of servicing a customer’s account, Eaton Vance may share information with unaffiliated third parties that perform various required services such as transfer agents, custodians and broker-dealers. |
| Ÿ | | Policies and procedures (including physical, electronic and procedural safeguards) are in place that are designed to protect the confidentiality of such information. |
| Ÿ | | We reserve the right to change our Privacy Policy at any time upon proper notification to you. Customers may want to review our Privacy Policy periodically for changes by accessing the link on our homepage: www.eatonvance.com. |
Our pledge of privacy applies to the following entities within the Eaton Vance organization: the Eaton Vance Family of Funds, Eaton Vance Management, Eaton Vance Investment Counsel, Eaton Vance Distributors, Inc., Eaton Vance Trust Company, Eaton Vance Management’s Real Estate Investment Group and Boston Management and Research. In addition, our Privacy Policy applies only to those Eaton Vance customers who are individuals and who have a direct relationship with us. If a customer’s account (i.e., fund shares) is held in the name of a third-party financial advisor/broker-dealer, it is likely that only such advisor’s privacy policies apply to the customer. This notice supersedes all previously issued privacy disclosures. For more information about Eaton Vance’s Privacy Policy, please call 1-800-262-1122.
Delivery of Shareholder Documents. The Securities and Exchange Commission (SEC) permits funds to deliver only one copy of shareholder documents, including prospectuses, proxy statements and shareholder reports, to fund investors with multiple accounts at the same residential or post office box address. This practice is often called “householding” and it helps eliminate duplicate mailings to shareholders. Eaton Vance, or your financial advisor, may household the mailing of your documents indefinitely unless you instruct Eaton Vance, or your financial advisor, otherwise. If you would prefer that your Eaton Vance documents not be householded, please contact Eaton Vance at 1-800-262-1122, or contact your financial advisor. Your instructions that householding not apply to delivery of your Eaton Vance documents will be effective within 30 days of receipt by Eaton Vance or your financial advisor.
Portfolio Holdings. Each Eaton Vance Fund and its underlying Portfolio(s) (if applicable) will file a schedule of portfolio holdings on Form N-Q with the SEC for the first and third quarters of each fiscal year. The Form N-Q will be available on the Eaton Vance website at www.eatonvance.com, by calling Eaton Vance at 1-800-262-1122 or in the EDGAR database on the SEC’s website at www.sec.gov. Form N-Q may also be reviewed and copied at the SEC’s public reference room in Washington, D.C. (call 1-800-732-0330 for information on the operation of the public reference room).
Proxy Voting. From time to time, funds are required to vote proxies related to the securities held by the funds. The Eaton Vance Funds or their underlying Portfolios (if applicable) vote proxies according to a set of policies and procedures approved by the Funds’ and Portfolios’ Boards. You may obtain a description of these policies and procedures and information on how the Funds or Portfolios voted proxies relating to portfolio securities during the most recent 12-month period ended June 30, without charge, upon request, by calling 1-800-262-1122 and by accessing the SEC’s website at www.sec.gov.
This Page Intentionally Left Blank
This Page Intentionally Left Blank
This Page Intentionally Left Blank
Investment Adviser of Senior Debt Portfolio
Boston Management and Research
Two International Place
Boston, MA 02110
Administrator of Eaton Vance Floating-Rate Advantage Fund
Eaton Vance Management
Two International Place
Boston, MA 02110
Principal Underwriter*
Eaton Vance Distributors, Inc.
Two International Place
Boston, MA 02110
(617) 482-8260
Custodian
State Street Bank and Trust Company
200 Clarendon Street
Boston, MA 02116
Transfer Agent
BNY Mellon Investment Servicing (US) Inc.
Attn: Eaton Vance Funds
P.O. Box 9653
Providence, RI 02940-9653
(800) 262-1122
Independent Registered Public Accounting Firm
Deloitte & Touche LLP
200 Berkeley Street
Boston, MA 02116-5022
Fund Offices
Two International Place
Boston, MA 02110
| * | FINRA BrokerCheck. Investors may check the background of their Investment Professional by contacting the Financial Industry Regulatory Authority (FINRA). FINRA BrokerCheck is a free tool to help investors check the professional background of current and former FINRA-registered securities firms and brokers. FINRA BrokerCheck is available by calling 1-800-289-9999 and at www.FINRA.org. The FINRA BrokerCheck brochure describing this program is available to investors at www.FINRA.org. |
| | |
Eaton Vance Multi-Strategy
All Market Fund Annual Report October 31, 2012 | | 
|

Fund shares are not insured by the FDIC and are not deposits or other obligations of, or guaranteed by, any depository institution. Shares are subject to investment risks, including possible loss of principal invested.
This report must be preceded or accompanied by a current summary prospectus or prospectus. Before investing, investors should consider carefully the investment objective, risks, and charges and expenses of a mutual fund. This and other important information is contained in the summary prospectus and prospectus, which can be obtained from a financial advisor. Prospective investors should read the prospectus carefully before investing. For further information, please call 1-800-262-1122.
Annual Report October 31, 2012
Eaton Vance
Multi-Strategy All Market Fund
| | | | |
| Table of Contents | | | |
| |
Management’s Discussion of Fund Performance | | | 2 | |
| |
Performance | | | 3 | |
| |
Fund Profile | | | 4 | |
| |
Endnotes and Additional Disclosures | | | 5 | |
| |
Fund Expenses | | | 6 | |
| |
Financial Statements | | | 7 | |
| |
Report of Independent Registered Public Accounting Firm | | | 20 | |
| |
Federal Tax Information | | | 21 | |
| |
Management and Organization | | | 22 | |
| |
Important Notices | | | 24 | |
Eaton Vance
Multi-Strategy All Market Fund
October 31, 2012
Management’s Discussion of Fund Performance1
Economic and Market Conditions
During the 12 months ended October 31, 2012, financial markets worldwide climbed, despite a less-than-ideal global economic backdrop. In the United States, the economy grew at a disappointing annual pace of 2.7% or less, and unemployment remained stubbornly high—dropping below 8% in September 2012 for the first time in more than three years. A pickup in the U.S. housing market and improved consumer sentiment, however, offered some encouragement. By contrast, economies in the U.K., European Union and many emerging markets weakened, pressured by the sovereign debt crisis in Europe and signs of slowing growth in China.
Financial markets responded positively, as central banks in the United States and Europe undertook stimulus measures aimed at averting further economic deterioration. Last fall, the U.S. Federal Reserve (the Fed) initiated “Operation Twist,” a program aimed at lowering borrowing costs for consumers and businesses, while the European Central Bank (ECB) put in place a long-term refinancing operation giving struggling eurozone banks access to very low interest-rate, three-year loans. By the New Year, the U.S. economy was showing signs of improvement and the fiscal situation in Europe was starting to stabilize, buoying the financial markets. However, investors grew risk-averse in the second quarter, as U.S. economic momentum faded and the sovereign debt crisis in Europe deepened. In the summer, markets benefited, as investors correctly anticipated more monetary stimulus measures in the United States and additional efforts in Europe to address the sovereign debt crisis. The ECB subsequently pledged to do whatever was necessary to save the euro and outlined an aggressive government bond repurchase program to help fiscally strapped eurozone countries. In the United States, the Fed announced a third round of U.S. quantitative easing — involving the open-ended purchase of agency mortgage-backed securities — along with plans to keep short-term interest rates near zero through mid-2015. Markets retreated late in the period amid mounting worries over the U.S. presidential election and looming fiscal cliff.
Low interest rates and central bank intervention helped the S&P 500 Index2 close the period with a 15.21% gain, while the MSCI World Index was up 9.45%. Fixed-income markets also moved solidly higher, with the Barclays Capital U.S. Aggregate Index climbing 5.25%. Longer-term bonds and higher-risk assets did especially well. For the year, the BofA Merrill Lynch U.S. High Yield Index returned 13.18%, compared to 3.53% for the Barclays Capital U.S. Government Bond Index.
Fund Performance
For the fiscal year ended October 31, 2012, Eaton Vance Multi-Strategy All Market Fund’s (the Fund) Class A shares
had a total return of 5.44% at net asset value (NAV), outperforming the 5.25% gain of its primary benchmark, the Barclays Capital U.S. Aggregate Index (the Index). Nearly all of the Fund’s underlying Portfolios contributed positively to performance.
The Fund’s biggest contributions to performance versus the Index came from the Floating Rate Portfolio, whose focus is floating-rate loans, and the Boston Income Portfolio, which invests in high-yield bonds. At period-end, nearly half of the Fund’s assets were in these two Portfolios, which gained as investors flocked to the higher-yields of securities issued by below-investment-grade companies. In addition, prices on floating-rate and high-yield issues appreciated, as credit spreads—the difference between the yields on lower- and higher-quality bonds—tightened. Both sectors also benefited from investors’ growing appetite for risk in the wake of central bank initiatives.
Foreign exposure further aided results versus the Index, led by an allocation to the Global Macro Absolute Return Advantage Portfolio, which focuses on long and short positions in sovereign debt and currencies around the world. The Portfolio gained in part due to foreign currencies appreciating against the U.S. dollar. To a lesser extent, the Fund’s stake in the option absolute return strategy within the MSAM Completion Portfolio contributed to performance versus the Index. The strategy, which involves a series of put and call option spread combinations on the S&P 500 Index, performed well during a period of relatively low market volatility.
Conservative positioning within the Fund’s targeted volatility range detracted from performance versus the Index, despite the strong performance of credit markets relative to equities. During the year, the Fund reduced weightings in both the option absolute return strategy within the MSAM Completion Portfolio and in the Boston Income Portfolio, while adding to the lower-risk, market-neutral Parametric Structured Absolute Return Portfolio as well as to the Floating Rate Portfolio. Last spring, the Fund eliminated a small stake in the diversified currency income strategy. The timing worked well, as the Fund was out of the strategy—which was invested more heavily in emerging-market than developed-market currencies—before the market downturn in May 2012 caused investors to flee emerging markets. Adding modestly to government bonds and establishing a small position in gold had little impact on performance. The Fund lost ground by owning S&P 500 Index put options within the MSAM Completion Portfolio, purchased to reduce overall portfolio risk. The cost of owning the contracts detracted from performance versus the Index, as stocks rallied.
|
| See Endnotes and Additional Disclosures in this report. |
|
Past performance is no guarantee of future results. Returns are historical and are calculated by determining the percentage
change in net asset value (NAV) or offering price (as applicable) with all distributions reinvested. Investment return and
principal value will fluctuate so that shares, when redeemed, may be worth more or less than their original cost. Performance
less than one year is cumulative. Performance is for the stated time period only; due to market volatility, the Fund’s current
performance may be lower or higher than quoted. Returns are before taxes unless otherwise noted. For performance as of the
most recent month end, please refer to www.eatonvance.com. |
Eaton Vance
Multi-Strategy All Market Fund
October 31, 2012
Performance2,3
Portfolio Managers Jeffrey A. Rawlins, CFA, Dan R. Strelow, CFA, Justin H. Bourgette, CFA and Thomas A. Shively
| | | | | | | | | | | | |
| % Cumulative Total Returns | | Inception Date | | | One Year | | | Since Inception | |
Class A at NAV | | | 10/31/2011 | | | | 5.44 | % | | | 5.44 | % |
Class A with 4.75% Maximum Sales Charge | | | — | | | | 0.42 | | | | 0.42 | |
Class C at NAV | | | 10/31/2011 | | | | 4.46 | | | | 4.46 | |
Class C with 1% Maximum Sales Charge | | | — | | | | 3.46 | | | | 3.46 | |
Class I at NAV | | | 10/31/2011 | | | | 5.61 | | | | 5.61 | |
Barclays Capital U.S. Aggregate Index | | | 10/31/2011 | | | | 5.25 | % | | | 5.25 | % |
MSCI All Country World Index | | | 10/31/2011 | | | | 8.55 | | | | 8.55 | |
| | | |
| | | | | | | | | | | | |
| % Total Annual Operating Expense Ratios4 | | Class A | | | Class C | | | Class I | |
| | | 1.35 | % | | | 2.10 | % | | | 1.10 | % |
Performance of $10,000
This graph shows the change in value of a hypothetical investment of $10,000 in Class A of the Fund for the period indicated. For comparison, the same investment is shown in the indicated index.
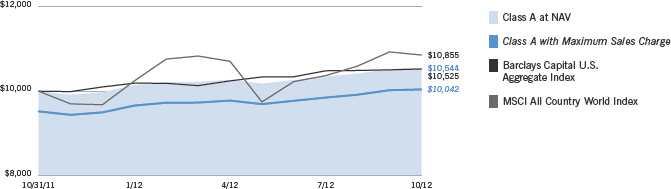
| | | | | | | | |
| Performance of Investment | | Amount Invested | | Period Beginning | | At NAV | | With Maximum Sales Charge |
Class C | | $10,000 | | 10/31/2011 | | $10,446 | | $10,346 |
Class I | | $250,000 | | 10/31/2011 | | $264,025 | | N.A. |
See Endnotes and Additional Disclosures in this report.
Past performance is no guarantee of future results. Returns are historical and are calculated by determining the percentage change in net asset value (NAV) or offering price (as applicable) with all distributions reinvested. Investment return and principal value will fluctuate so that shares, when redeemed, may be worth more or less than their original cost. Performance less than one year is cumulative. Performance is for the stated time period only; due to market volatility, the Fund’s current performance may be lower or higher than quoted. Returns are before taxes unless otherwise noted. For performance as of the most recent month end, please refer to www.eatonvance.com.
Eaton Vance
Multi-Strategy All Market Fund
October 31, 2012
Fund Profile5
| | |
| Portfolio Allocation (% of net assets) |
|
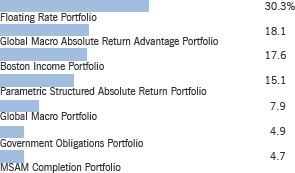
|
International Income Portfolio amount is less than 0.05% of portfolio allocation.
See Endnotes and Additional Disclosures in this report.
| | | | |
| Fund Weightings (% of net assets)6 | | | |
| |
Absolute Return Strategies | | | 46.1 | % |
Global Macro Portfolio | | | 7.9 | |
Global Macro Absolute Return Advantage Portfolio | | | 18.1 | |
Parametric Structured Absolute Return Portfolio | | | 15.1 | |
Option Absolute Return Strategy* | | | 5.0 | |
| |
Income Strategies | | | 52.8 | % |
Government Obligations Portfolio | | | 4.9 | |
Floating Rate Portfolio | | | 30.3 | |
Boston Income Portfolio | | | 17.6 | |
| |
Other | | | 1.1 | % |
Equity Options* | | | -0.0 | |
Gold** | | | 1.1 | |
| |
Cash & Cash Equivalents* | | | 4.8 | % |
| *Held | in MSAM Completion Portfolio. Amount is less than 0.05%. |
| **Gold | held in a wholly-owned subsidiary of the Fund. |
Eaton Vance
Multi-Strategy All Market Fund
October 31, 2012
Endnotes and Additional Disclosures
| 1 | The views expressed in this report are those of the portfolio manager(s) and are current only through the date stated at the top of this page. These views are subject to change at any time based upon market or other conditions, and Eaton Vance and the Fund(s) disclaim any responsibility to update such views. These views may not be relied upon as investment advice and, because investment decisions are based on many factors, may not be relied upon as an indication of trading intent on behalf of any Eaton Vance fund. This commentary may contain statements that are not historical facts, referred to as “forward looking statements”. The Fund’s actual future results may differ significantly from those stated in any forward looking statement, depending on factors such as changes in securities or financial markets or general economic conditions, the volume of sales and purchases of Fund shares, the continuation of investment advisory, administrative and service contracts, and other risks discussed from time to time in the Fund’s filings with the Securities and Exchange Commission. |
| 2 | S&P 500 Index is an unmanaged index of large-cap stocks commonly used as a measure of U.S. stock market performance. MSCI World Index is an unmanaged index of equity securities in the developed markets. MSCI indices are net of foreign withholding taxes. MSCI All Country World Index is an unmanaged free float-adjusted market-capitalization-weighted index designed to measure the equity market performance of developed and emerging markets. MSCI indices are net of foreign withholding taxes. Source: MSCI. MSCI data may not be reproduced or used for any other purpose. MSCI provides no warranties, has not prepared or approved this report, and has no liability hereunder. Barclays Capital U.S. Aggregate Index is an unmanaged index of domestic investment-grade bonds, including corporate, government and mortgage-backed securities. BofA Merrill Lynch U.S. High Yield Index is an unmanaged index of below-investment grade U.S. corporate bonds. BofA Merrill Lynch® indices not for redistribution or other uses; provided “as is”, without warranties, and with no liability. Eaton Vance has prepared this report, BofAML does not endorse it, or guarantee, review, or endorse Eaton Vance’s products. Barclays Capital U.S. Government Bond Index is a broad-based index of all public debt obligations of the U.S. government and its agencies that have an average maturity of roughly nine years. Unless otherwise stated, index returns do not reflect the effect of any applicable sales charges, commissions, expenses, taxes or leverage, as applicable. It is not possible to invest directly in an index. |
| 3 | Cumulative Total Returns at NAV do not include applicable sales charges. If sales charges were deducted, the returns would be lower. Cumulative Total Returns shown with maximum sales charge reflect the stated maximum sales charge. Unless otherwise stated, performance does not reflect the deduction of taxes on Fund distributions or redemptions of Fund shares. |
| 4 | Source: Fund prospectus |
| 5 | Fund primarily invests in one or more affiliated investment companies (Portfolios) and may also invest directly. Unless otherwise noted, references to investments are to the aggregate holdings of the Fund and the Portfolios. |
| 6 | Economic value is shown for derivatives holdings and, thus, total will not add to 100%. |
| | Fund profile subject to change due to active management. |
Eaton Vance
Multi-Strategy All Market Fund
October 31, 2012
Fund Expenses
Example: As a Fund shareholder, you incur two types of costs: (1) transaction costs, including sales charges (loads) on purchases and redemption fees (if applicable); and (2) ongoing costs, including management fees; distribution and/or service fees; and other Fund expenses. This Example is intended to help you understand your ongoing costs (in dollars) of Fund investing and to compare these costs with the ongoing costs of investing in other mutual funds. The Example is based on an investment of $1,000 invested at the beginning of the period and held for the entire period (May 1, 2012 – October 31, 2012).
Actual Expenses: The first section of the table below provides information about actual account values and actual expenses. You may use the information in this section, together with the amount you invested, to estimate the expenses that you paid over the period. Simply divide your account value by $1,000 (for example, an $8,600 account value divided by $1,000 = 8.6), then multiply the result by the number in the first section under the heading entitled “Expenses Paid During Period” to estimate the expenses you paid on your account during this period.
Hypothetical Example for Comparison Purposes: The second section of the table below provides information about hypothetical account values and hypothetical expenses based on the actual Fund expense ratio and an assumed rate of return of 5% per year (before expenses), which is not the actual Fund return. The hypothetical account values and expenses may not be used to estimate the actual ending account balance or expenses you paid for the period. You may use this information to compare the ongoing costs of investing in your Fund and other funds. To do so, compare this 5% hypothetical example with the 5% hypothetical examples that appear in the shareholder reports of the other funds.
Please note that the expenses shown in the table are meant to highlight your ongoing costs only and do not reflect any transactional costs, such as sales charges (loads) or redemption fees (if applicable). Therefore, the second section of the table is useful in comparing ongoing costs only, and will not help you determine the relative total costs of owning different funds. In addition, if these transactional costs were included, your costs would be higher.
| | | | | | | | | | | | | | | | |
| | | Beginning
Account Value
(5/1/12) | | | Ending
Account Value
(10/31/12) | | | Expenses Paid
During Period*
(5/1/12 – 10/31/12) | | | Annualized
Expense
Ratio | |
| | | | |
| | | | | | | | | | | | | | | | |
Actual | | | | | | | | | | | | | | | | |
Class A | | $ | 1,000.00 | | | $ | 1,026.90 | | | $ | 7.49 | ** | | | 1.47 | % |
Class C | | $ | 1,000.00 | | | $ | 1,021.00 | | | $ | 11.33 | ** | | | 2.23 | % |
Class I | | $ | 1,000.00 | | | $ | 1,027.40 | | | $ | 6.22 | ** | | | 1.22 | % |
| | | | | | | | | | | | | | | | | |
| | | | |
| | | | | | | | | | | | | | | | |
Hypothetical | | | | | | | | | | | | | | | | |
(5% return per year before expenses) | | | | | | | | | | | | | | | | |
Class A | | $ | 1,000.00 | | | $ | 1,017.70 | | | $ | 7.46 | ** | | | 1.47 | % |
Class C | | $ | 1,000.00 | | | $ | 1,013.90 | | | $ | 11.29 | ** | | | 2.23 | % |
Class I | | $ | 1,000.00 | | | $ | 1,019.00 | | | $ | 6.19 | ** | | | 1.22 | % |
| * | Expenses are equal to the Fund’s annualized expense ratio for the indicated Class, multiplied by the average account value over the period, multiplied by 184/366 (to reflect the one-half year period). The Example assumes that the $1,000 was invested at the net asset value per share determined at the close of business on April 30, 2012. The Example reflects the expenses of both the Fund and the Portfolios. |
| ** | Absent an allocation of certain expenses to affiliates, expenses would be higher. |
Eaton Vance
Multi-Strategy All Market Fund
October 31, 2012
Consolidated Portfolio of Investments
| | | | | | | | | | |
| Investments in Affiliated Portfolios | | | | Value | | | % of Net
Assets | |
| | | | | | | | | | |
Boston Income Portfolio
(identified cost, $14,310,724) | | | | $ | 14,786,587 | | | | 17.6 | % |
Floating Rate Portfolio
(identified cost, $25,216,206) | | | | | 25,422,437 | | | | 30.3 | |
Global Macro Absolute Return Advantage Portfolio
(identified cost, $15,404,028) | | | | | 15,208,468 | | | | 18.1 | |
Global Macro Portfolio
(identified cost, $6,768,551) | | | | | 6,684,625 | | | | 7.9 | |
Government Obligations Portfolio
(identified cost, $4,090,985) | | | | | 4,115,745 | | | | 4.9 | |
International Income Portfolio
(identified cost, $522) | | | | | 1 | | | | 0.0 | (1) |
MSAM Completion Portfolio
(identified cost, $3,920,717) | | | | | 3,924,517 | | | | 4.7 | |
Parametric Structured Absolute Return Portfolio
(identified cost, $12,303,879) | | | | | 12,698,281 | | | | 15.1 | |
| | | | | | | | | | | |
| | |
Total Investments in Affiliated Portfolios
(identified cost $82,015,612) | | $ | 82,840,661 | | | | 98.6 | % |
| | | | | | | | | | | |
|
| Exchange-Traded Funds | |
| | | |
| | | | | | | | | | |
| Description | | Shares | | Value | | | % of Net
Assets | |
SPDR Gold Trust(2) | | 5,400 | | $ | 901,044 | | | | 1.1 | % |
| | | | | | | | | | | |
| | |
Total Exchange-Traded Funds
(identified cost $812,781) | | $ | 901,044 | | | | 1.1 | % |
| | | | | | | | | | | |
| | |
Total Investments
(identified cost $82,828,393) | | $ | 83,741,705 | | | | 99.7 | % |
| | | | | | | | | | | |
| | |
Other Assets, Less Liabilities | | $ | 275,193 | | | | 0.3 | % |
| | | | | | | | | | | |
| | |
Net Assets | | $ | 84,016,898 | | | | 100.0 | % |
| | | | | | | | | | | |
| (1) | Amount is less than 0.05%. |
| (2) | Non-income producing security. |
| | | | |
| | 7 | | See Notes to Consolidated Financial Statements. |
Eaton Vance
Multi-Strategy All Market Fund
October 31, 2012
Consolidated Statement of Assets and Liabilities
| | | | |
| Assets | | October 31, 2012 | |
Affiliated investments, at value (identified cost, $82,015,612) | | $ | 82,840,661 | |
Unaffiliated investments, at value (identified cost, $812,781) | | | 901,044 | |
Cash | | | 177,720 | |
Receivable for Fund shares sold | | | 422,636 | |
Receivable from affiliate | | | 53,246 | |
Total assets | | $ | 84,395,307 | |
|
| Liabilities | |
Payable for Fund shares redeemed | | $ | 284,430 | |
Distributions payable | | | 20 | |
Payable to affiliates: | | | | |
Investment adviser fee | | | 561 | |
Distribution and service fees | | | 17,611 | |
Trustees’ fees | | | 42 | |
Accrued expenses | | | 75,745 | |
Total liabilities | | $ | 378,409 | |
Net Assets | | $ | 84,016,898 | |
| |
| Sources of Net Assets | | | | |
Paid-in capital | | $ | 83,124,659 | |
Accumulated net realized loss | | | (244,345 | ) |
Accumulated undistributed net investment income | | | 223,272 | |
Net unrealized appreciation | | | 913,312 | |
Total | | $ | 84,016,898 | |
| |
| Class A Shares | | | | |
Net Assets | | $ | 82,415,455 | |
Shares Outstanding | | | 8,099,257 | |
Net Asset Value and Redemption Price Per Share | | | | |
(net assets ÷ shares of beneficial interest outstanding) | | $ | 10.18 | |
Maximum Offering Price Per Share | | | | |
(100 ÷ 95.25 of net asset value per share) | | $ | 10.69 | |
|
| Class C Shares | |
Net Assets | | $ | 14,724 | |
Shares Outstanding | | | 1,448 | |
Net Asset Value and Offering Price Per Share* | | | | |
(net assets ÷ shares of beneficial interest outstanding) | | $ | 10.17 | |
|
| Class I Shares | |
Net Assets | | $ | 1,586,719 | |
Shares Outstanding | | | 156,034 | |
Net Asset Value, Offering Price and Redemption Price Per Share | | | | |
(net assets ÷ shares of beneficial interest outstanding) | | $ | 10.17 | |
On sales of $50,000 or more, the offering price of Class A shares is reduced.
| * | Redemption price per share is equal to the net asset value less any applicable contingent deferred sales charge. |
| | | | |
| | 8 | | See Notes to Consolidated Financial Statements. |
Eaton Vance
Multi-Strategy All Market Fund
October 31, 2012
Consolidated Statement of Operations
| | | | |
| Investment Income | | Year Ended October 31, 2012 | |
Interest and other income allocated from affiliated Portfolios (net of foreign taxes, $3,011) | | $ | 2,535,194 | |
Dividends allocated from affiliated Portfolios (net of foreign taxes, $13,687) | | | 176,793 | |
Expenses allocated from affiliated Portfolios | | | (623,825 | ) |
Total investment income | | $ | 2,088,162 | |
|
| Expenses | |
Investment adviser and administration fee | | $ | 2,933 | |
Distribution and service fees | | | | |
Class A | | | 129,569 | |
Class C | | | 120 | |
Trustees’ fees and expenses | | | 542 | |
Custodian fee | | | 32,325 | |
Transfer and dividend disbursing agent fees | | | 33,861 | |
Legal and accounting services | | | 64,031 | |
Printing and postage | | | 22,705 | |
Registration fees | | | 90,251 | |
Miscellaneous | | | 10,051 | |
Total expenses | | $ | 386,388 | |
Deduct — | | | | |
Allocation of expenses to affiliate | | $ | 197,398 | |
Reduction of custodian fee | | | 54 | |
Total expense reductions | | $ | 197,452 | |
| |
Net expenses | | $ | 188,936 | |
| |
Net investment income | | $ | 1,899,226 | |
|
| Realized and Unrealized Gain (Loss) | |
Net realized gain (loss) — | | | | |
Investment transactions from affiliated Fund | | $ | 3,384 | |
Net realized gain (loss) allocated from affiliated Portfolios — | | | | |
Investment transactions (including a gain of $119 from precious metals) | | | (574,979 | ) |
Written options | | | 391,647 | |
Securities sold short | | | 27,637 | |
Futures contracts | | | (309,831 | ) |
Swap contracts | | | (134,163 | ) |
Forward commodity contracts | | | (16,305 | ) |
Foreign currency and forward foreign currency exchange contract transactions | | | 605,654 | |
Net realized loss | | $ | (6,956 | ) |
Change in unrealized appreciation (depreciation) — | | | | |
Unaffiliated investments | | $ | 88,263 | |
Change in unrealized appreciation (depreciation) allocated from affiliated Portfolios — | | | | |
Investments (including net decrease of $28,503 from precious metals) | | | 1,316,437 | |
Written options | | | 87,419 | |
Securities sold short | | | (146,298 | ) |
Futures contracts | | | 51,180 | |
Swap contracts | | | (262,900 | ) |
Forward commodity contracts | | | 13,922 | |
Foreign currency and forward foreign currency exchange contracts | | | (234,711 | ) |
Net change in unrealized appreciation (depreciation) | | $ | 913,312 | |
| |
Net realized and unrealized gain | | $ | 906,356 | |
| |
Net increase in net assets from operations | | $ | 2,805,582 | |
| | | | |
| | 9 | | See Notes to Consolidated Financial Statements. |
Eaton Vance
Multi-Strategy All Market Fund
October 31, 2012
Consolidated Statements of Changes in Net Assets
| | | | | | | | |
| Increase (Decrease) in Net Assets | | Year Ended
October 31, 2012 | | | Period Ended
October 31, 2011(1) | |
From operations — | | | | | | | | |
Net investment income | | $ | 1,899,226 | | | $ | — | |
Net realized loss from investment transactions, written options, securities sold short, futures contracts, swap contracts, forward commodity contracts, and foreign currency and forward foreign currency exchange contract transactions | | | (6,956 | ) | | | — | |
Net change in unrealized appreciation (depreciation) from investments, written options, securities sold short, futures contracts, swap contracts, forward commodity contracts, foreign currency and forward foreign currency exchange contracts | | | 913,312 | | | | — | |
Net increase in net assets from operations | | $ | 2,805,582 | | | $ | — | |
Distributions to shareholders — | | | | | | | | |
From net investment income | | | | | | | | |
Class A | | $ | (1,259,138 | ) | | $ | — | |
Class C | | | (222 | ) | | | — | |
Class I | | | (178,726 | ) | | | — | |
From net realized gain | | | | | | | | |
Class A | | | (555,553 | ) | | | — | |
Class C | | | (99 | ) | | | — | |
Class I | | | (9,160 | ) | | | — | |
Total distributions to shareholders | | $ | (2,002,898 | ) | | $ | — | |
Transactions in shares of beneficial interest — | | | | | | | | |
Proceeds from sale of shares | | | | | | | | |
Class A | | $ | 107,983,784 | | | $ | 10,000 | |
Class C | | | 4,455 | | | | 10,000 | |
Class I | | | 1,626,332 | | | | 9,980,000 | |
Net asset value of shares issued to shareholders in payment of distributions declared | | | | | | | | |
Class A | | | 1,812,687 | | | | — | |
Class C | | | 51 | | | | — | |
Class I | | | 26,805 | | | | — | |
Cost of shares redeemed | | | | | | | | |
Class A | | | (28,117,343 | ) | | | — | |
Class C | | | (19 | ) | | | — | |
Class I | | | (10,122,538 | ) | | | — | |
Net increase in net assets from Fund share transactions | | $ | 73,214,214 | | | $ | 10,000,000 | |
| | |
Net increase in net assets | | $ | 74,016,898 | | | $ | 10,000,000 | |
|
| Net Assets | |
At beginning of period | | $ | 10,000,000 | | | $ | — | |
At end of period | | $ | 84,016,898 | | | $ | 10,000,000 | |
|
Accumulated undistributed net investment income
included in net assets | |
At end of period | | $ | 223,272 | | | $ | — | |
| (1) | The Fund commenced operations on October 31, 2011. |
| | | | |
| | 10 | | See Notes to Consolidated Financial Statements. |
Eaton Vance
Multi-Strategy All Market Fund
October 31, 2012
Consolidated Financial Highlights
| | | | |
| | | Class A | |
| | | Year Ended
October 31, 2012 | |
Net asset value — Beginning of year | | $ | 10.000 | |
|
| Income (Loss) From Operations | |
Net investment income(1) | | $ | 0.335 | |
Net realized and unrealized gain | | | 0.199 | |
| |
Total income from operations | | $ | 0.534 | |
|
| Less Distributions | |
From net investment income | | $ | (0.286 | ) |
From net realized gain | | | (0.068 | ) |
| |
Total distributions | | $ | (0.354 | ) |
| |
Net asset value — End of year | | $ | 10.180 | |
| |
Total Return(2) | | | 5.44 | % |
|
| Ratios/Supplemental Data | |
Net assets, end of year (000’s omitted) | | $ | 82,415 | |
Ratios (as a percentage of average daily net assets): | | | | |
Expenses(3)(4)(5) | | | 1.46 | % |
Net investment income | | | 3.32 | % |
Portfolio Turnover of the Fund(6) | | | 65 | % |
Portfolio Turnover of Boston Income Portfolio | | | 64 | % |
Portfolio Turnover of Floating Rate Portfolio | | | 42 | % |
Portfolio Turnover of Global Macro Absolute Return Advantage Portfolio | | | 91 | % |
Portfolio Turnover of Global Macro Portfolio | | | 39 | % |
Portfolio Turnover of Government Obligations Portfolio | | | 26 | % |
Portfolio Turnover of International Income Portfolio | | | 37 | % |
Portfolio Turnover of MSAM Completion Portfolio | | | 0 | % |
Portfolio Turnover of Parametric Structured Absolute Return Portfolio | | | 22 | % |
Class A commenced operations on October 31, 2011. Financial Highlights for the period ended October 31, 2011 are not presented as there was no investment activity, distributions or change in net asset value per share in the period.
| (1) | Computed using average shares outstanding. |
| (2) | Returns are historical and are calculated by determining the percentage change in net asset value with all distributions reinvested and do not reflect the effect of sales charges. |
| (3) | Includes the Fund’s share of the Portfolios’ allocated expenses. |
| (4) | Excludes the effect of custody fee credits, if any, of less than 0.005%. |
| (5) | The investment adviser and administrator subsidized certain operating expenses (equal to 0.34% of average daily net assets for the year ended October 31, 2012). Absent this subsidy, total return would have been lower. |
| (6) | Percentage includes both the Fund’s contributions to and withdrawals from the Portfolios and purchases and sales of securities held directly by the Fund, if any. |
| | | | |
| | 11 | | See Notes to Consolidated Financial Statements. |
Eaton Vance
Multi-Strategy All Market Fund
October 31, 2012
Consolidated Financial Highlights — continued
| | | | |
| | | Class C | |
| | | Year Ended
October 31, 2012 | |
Net asset value — Beginning of year | | $ | 10.000 | |
|
| Income (Loss) From Operations | |
Net investment income(1) | | $ | 0.247 | |
Net realized and unrealized gain | | | 0.192 | |
| |
Total income from operations | | $ | 0.439 | |
|
| Less Distributions | |
From net investment income | | $ | (0.201 | ) |
From net realized gain | | | (0.068 | ) |
| |
Total distributions | | $ | (0.269 | ) |
| |
Net asset value — End of year | | $ | 10.170 | |
| |
Total Return(2) | | | 4.46 | % |
|
| Ratios/Supplemental Data | |
Net assets, end of year (000’s omitted) | | $ | 15 | |
Ratios (as a percentage of average daily net assets): | | | | |
Expenses(3)(4)(5) | | | 2.17 | % |
Net investment income | | | 2.46 | % |
Portfolio Turnover of the Fund(6) | | | 65 | % |
Portfolio Turnover of Boston Income Portfolio | | | 64 | % |
Portfolio Turnover of Floating Rate Portfolio | | | 42 | % |
Portfolio Turnover of Global Macro Absolute Return Advantage Portfolio | | | 91 | % |
Portfolio Turnover of Global Macro Portfolio | | | 39 | % |
Portfolio Turnover of Government Obligations Portfolio | | | 26 | % |
Portfolio Turnover of International Income Portfolio | | | 37 | % |
Portfolio Turnover of MSAM Completion Portfolio | | | 0 | % |
Portfolio Turnover of Parametric Structured Absolute Return Portfolio | | | 22 | % |
Class C commenced operations on October 31, 2011. Financial Highlights for the period ended October 31, 2011 are not presented as there was no investment activity, distributions or change in net asset value per share in the period.
| (1) | Computed using average shares outstanding. |
| (2) | Returns are historical and are calculated by determining the percentage change in net asset value with all distributions reinvested and do not reflect the effect of sales charges. |
| (3) | Includes the Fund’s share of the Portfolios’ allocated expenses. |
| (4) | Excludes the effect of custody fee credits, if any, of less than 0.005%. |
| (5) | The investment adviser and administrator subsidized certain operating expenses (equal to 0.38% of average daily net assets for the year ended October 31, 2012). Absent this subsidy, total return would have been lower. |
| (6) | Percentage includes both the Fund’s contributions to and withdrawals from the Portfolios and purchases and sales of securities held directly by the Fund, if any. |
| | | | |
| | 12 | | See Notes to Consolidated Financial Statements. |
Eaton Vance
Multi-Strategy All Market Fund
October 31, 2012
Consolidated Financial Highlights — continued
| | | | |
| | | Class I | |
| | | Year Ended
October 31, 2012 | |
Net asset value — Beginning of year | | $ | 10.000 | |
|
| Income (Loss) From Operations | |
Net investment income(1) | | $ | 0.355 | |
Net realized and unrealized gain | | | 0.195 | |
| |
Total income from operations | | $ | 0.550 | |
|
| Less Distributions | |
From net investment income | | $ | (0.312 | ) |
From net realized gain | | | (0.068 | ) |
| |
Total distributions | | $ | (0.380 | ) |
| |
Net asset value — End of year | | $ | 10.170 | |
| |
Total Return(2) | | | 5.61 | % |
|
| Ratios/Supplemental Data | |
Net assets, end of year (000’s omitted) | | $ | 1,587 | |
Ratios (as a percentage of average daily net assets): | | | | |
Expenses(3)(4)(5) | | | 1.10 | % |
Net investment income | | | 3.54 | % |
Portfolio Turnover of the Fund(6) | | | 65 | % |
Portfolio Turnover of Boston Income Portfolio | | | 64 | % |
Portfolio Turnover of Floating Rate Portfolio | | | 42 | % |
Portfolio Turnover of Global Macro Absolute Return Advantage Portfolio | | | 91 | % |
Portfolio Turnover of Global Macro Portfolio | | | 39 | % |
Portfolio Turnover of Government Obligations Portfolio | | | 26 | % |
Portfolio Turnover of International Income Portfolio | | | 37 | % |
Portfolio Turnover of MSAM Completion Portfolio | | | 0 | % |
Portfolio Turnover of Parametric Structured Absolute Return Portfolio | | | 22 | % |
Class I commenced operations on October 31, 2011. Financial Highlights for the period ended October 31, 2011 are not presented as there was no investment activity, distributions or change in net asset value per share in the period.
| (1) | Computed using average shares outstanding. |
| (2) | Returns are historical and are calculated by determining the percentage change in net asset value with all distributions reinvested. |
| (3) | Includes the Fund’s share of the Portfolios’ allocated expenses. |
| (4) | Excludes the effect of custody fee credits, if any, of less than 0.005%. |
| (5) | The investment adviser and administrator subsidized certain operating expenses (equal to 0.43% of average daily net assets for the year ended October 31, 2012). Absent this subsidy, total return would have been lower. |
| (6) | Percentage includes both the Fund’s contributions to and withdrawals from the Portfolios and purchases and sales of securities held directly by the Fund, if any. |
| | | | |
| | 13 | | See Notes to Consolidated Financial Statements. |
Eaton Vance
Multi-Strategy All Market Fund
October 31, 2012
Consolidated Notes to Financial Statements
1 Significant Accounting Policies
Eaton Vance Multi-Strategy All Market Fund (the Fund) is a non-diversified series of Eaton Vance Mutual Funds Trust (the Trust). The Trust is a Massachusetts business trust registered under the Investment Company Act of 1940, as amended (the 1940 Act), as an open-end management investment company. The Fund commenced operations on October 31, 2011. The Fund offers three classes of shares. Class A shares are generally sold subject to a sales charge imposed at time of purchase. Class C shares are sold at net asset value and are generally subject to a contingent deferred sales charge (see Note 5). Class I shares are sold at net asset value and are not subject to a sales charge. Each class represents a pro-rata interest in the Fund, but votes separately on class-specific matters and (as noted below) is subject to different expenses. Realized and unrealized gains and losses are allocated daily to each class of shares based on the relative net assets of each class to the total net assets of the Fund. Net investment income, other than class-specific expenses, is allocated daily to each class of shares based upon the ratio of the value of each class’s paid shares to the total value of all paid shares. Each class of shares differs in its distribution plan and certain other class-specific expenses. The Fund’s investment objective is total return. The Fund currently pursues its objective by investing substantially all of its investable assets in interests in the following eight portfolios managed by Eaton Vance Management (EVM) or its affiliates: Boston Income Portfolio, Floating Rate Portfolio, Global Macro Absolute Return Advantage Portfolio, Global Macro Portfolio, Government Obligations Portfolio, International Income Portfolio, MSAM Completion Portfolio and Parametric Structured Absolute Return Portfolio (the Portfolios), which are Massachusetts business trusts. The value of the Fund’s investments in the Portfolios reflects the Fund’s proportionate interest in the net assets of Boston Income Portfolio, Floating Rate Portfolio, Global Macro Absolute Return Advantage Portfolio, Global Macro Portfolio, Government Obligations Portfolio, International Income Portfolio, MSAM Completion Portfolio and Parametric Structured Absolute Return Portfolio (0.3%, 0.3%, 1.3%, 0.1%, 0.3%, less than 0.05%, 99.9% and 4.8%, respectively, at October 31, 2012). The performance of the Fund is directly affected by the performance of the Portfolios. A copy of each Portfolio’s financial statements is available on the EDGAR Database on the Securities and Exchange Commission’s website (www.sec.gov), at the Commission’s public reference room in Washington, DC or upon request from the Fund’s principal underwriter, Eaton Vance Distributors, Inc. (EVD), by calling 1-800-262-1122.
The Fund seeks to gain exposure to the commodity markets, in whole or in part, through investments in Eaton Vance AM Commodity Subsidiary, Ltd. (the Subsidiary), a wholly-owned subsidiary of the Fund organized under the laws of the Cayman Islands with the same objective and investment policies and restrictions as the Fund. The Fund may invest up to 25% of its total assets in the Subsidiary. The net assets of the Subsidiary at October 31, 2012 were $1,056,631 or 1.3% of the Fund’s consolidated net assets. The accompanying Consolidated Financial Statements include the accounts of the Subsidiary. Intercompany balances and transactions have been eliminated in consolidation.
The following is a summary of significant accounting policies of the Fund. The policies are in conformity with accounting principles generally accepted in the United States of America.
A Investment Valuation — The valuation policies common to the Portfolios are as follows:
Debt obligations (including short-term obligations with a remaining maturity of more than sixty days and excluding most seasoned, fixed-rate 30-year mortgage-backed securities as noted below) are generally valued on the basis of valuations provided by third party pricing services, as derived from such services’ pricing models. Inputs to the models may include, but are not limited to, reported trades, executable bid and asked prices, broker/dealer quotations, prices or yields of securities with similar characteristics, benchmark curves or information pertaining to the issuer, as well as industry and economic events. The pricing services may use a matrix approach, which considers information regarding securities with similar characteristics to determine the valuation for a security. Short-term obligations purchased with a remaining maturity of sixty days or less (excluding those that are non-U.S. dollar denominated, which typically are valued by a pricing service or dealer quotes) are generally valued at amortized cost, which approximates market value. Equity securities (including common shares of closed-end investment companies) listed on a U.S. securities exchange generally are valued at the last sale or closing price on the day of valuation or, if no sales took place on such date, at the mean between the closing bid and asked prices therefore on the exchange where such securities are principally traded. Equity securities listed on the NASDAQ Global or Global Select Market generally are valued at the NASDAQ official closing price. Unlisted or listed securities for which closing sales prices or closing quotations are not available are valued at the mean between the latest available bid and asked prices or, in the case of preferred equity securities that are not listed or traded in the over-the-counter market, by a third party pricing service that will use various techniques that consider factors including, but not limited to, prices or yields of securities with similar characteristics, benchmark yields, broker/dealer quotes, quotes of underlying common stock, issuer spreads, as well as industry and economic events. The daily valuation of exchange-traded foreign securities generally is determined as of the close of trading on the principal exchange on which such securities trade. Events occurring after the close of trading on foreign exchanges may result in adjustments to the valuation of foreign securities to more accurately reflect their fair value as of the close of regular trading on the New York Stock Exchange. When valuing foreign equity securities that meet certain criteria, the Portfolios’ Trustees have approved the use of a fair value service that values such securities to reflect market trading that occurs after the close of the applicable foreign markets of comparable securities or other instruments that have a strong correlation to the fair-valued securities. Precious metals are valued at the New York composite mean quotation reported by Bloomberg at the valuation time. Exchange-traded options (other than FLexible EXchange traded options) are valued at the mean between the bid and asked prices at valuation time as reported by the Options Price Reporting Authority for U.S. listed options or by the relevant exchange or board of trade for non-U.S. listed options. Over-the-counter options (including options on securities, indices and foreign currencies) and FLexible EXchange traded options traded at the Chicago Board Options Exchange are valued by a third party pricing service using techniques that consider factors including the value of the underlying instrument, the volatility of the underlying instrument and the period of time until option expiration. Financial and commodities futures contracts are valued at the closing settlement price established by the board of trade or exchange on which they are traded. Forward foreign currency exchange contracts are generally valued at the mean of the average bid and average asked prices that are reported by currency dealers to a third party pricing service at the valuation time. Such third party pricing service valuations are supplied for specific
Eaton Vance
Multi-Strategy All Market Fund
October 31, 2012
Consolidated Notes to Financial Statements — continued
settlement periods and the Portfolios’ forward foreign currency exchange contracts are valued at an interpolated rate between the closest preceding and subsequent settlement period reported by the third party pricing service. Forward commodity contracts are generally valued based on the price of the underlying futures or forward contract provided by the exchange on which the underlying instruments are traded or if unavailable, based on forward rates provided by broker/dealers. Interest rate swaps, cross-currency swaps and options on interest rate swaps (“swaptions”) are normally valued using valuations provided by a third party pricing service. Such pricing service valuations are based on the present value of fixed and projected floating rate cash flows over the term of the swap contract. Future cash flows are discounted to their present value using swap rates provided by electronic data services or by broker/dealers. Alternatively, swaptions may be valued at the valuation provided by the counterparty, so determined using the same techniques as those employed by the pricing service. Credit default swaps are normally valued using valuations provided by a third party pricing service. The pricing services employ electronic data processing techniques to determine the present value based on credit spread quotations obtained from broker/dealers and expected default recovery rates determined by the pricing service using proprietary models. Foreign securities and currencies are valued in U.S. dollars, based on foreign currency exchange rate quotations supplied by a third party pricing service. The pricing service uses a proprietary model to determine the exchange rate. Inputs to the model include reported trades and implied bid/ask spreads. Investments for which valuations or market quotations are not readily available or are deemed unreliable are valued at fair value using methods determined in good faith by or at the direction of the Trustees of the Portfolios in a manner that fairly reflects the security’s value, or the amount that the Portfolios might reasonably expect to receive for the security upon its current sale in the ordinary course. Each such determination is based on a consideration of relevant factors, which are likely to vary from one pricing context to another. These factors may include, but are not limited to, the type of security, the existence of any contractual restrictions on the security’s disposition, the price and extent of public trading in similar securities of the issuer or of comparable companies or entities, quotations or relevant information obtained from broker/dealers or other market participants, information obtained from the issuer, analysts, and/or the appropriate stock exchange (for exchange-traded securities), an analysis of the company’s or entity’s financial condition, and an evaluation of the forces that influence the issuer and the market(s) in which the security is purchased and sold.
Additional valuation policies for Global Macro Absolute Return Advantage Portfolio, Global Macro Portfolio, Government Obligations Portfolio and International Income Portfolio are as follows: Most seasoned, fixed-rate 30-year mortgage-backed securities are valued through the use of the investment adviser’s matrix pricing system, which takes into account bond prices, yield differentials, anticipated prepayments and interest rates provided by dealers.
Additional valuation policies for Boston Income Portfolio and Floating Rate Portfolio are as follows: Interests in senior floating-rate loans (Senior Loans) for which reliable market quotations are readily available are valued generally at the average mean of bid and ask quotations obtained from a third party pricing service. Other Senior Loans are valued at fair value by the investment adviser under procedures approved by the Trustees. In fair valuing a Senior Loan, the investment adviser utilizes one or more of the valuation techniques described in (i) through (iii) below to assess the likelihood that the borrower will make a full repayment of the loan underlying such Senior Loan relative to yields on other Senior Loans issued by companies of comparable credit quality. If the investment adviser believes that there is a reasonable likelihood of full repayment, the investment adviser will determine fair value using a matrix pricing approach that considers the yield on the Senior Loan. If the investment adviser believes there is not a reasonable likelihood of full repayment, the investment adviser will determine fair value using analyses that include, but are not limited to: (i) a comparison of the value of the borrower’s outstanding equity and debt to that of comparable public companies; (ii) a discounted cash flow analysis; or (iii) when the investment adviser believes it is likely that a borrower will be liquidated or sold, an analysis of the terms of such liquidation or sale. In certain cases, the investment adviser will use a combination of analytical methods to determine fair value, such as when only a portion of a borrower’s assets are likely to be sold. In conducting its assessment and analyses for purposes of determining fair value of a Senior Loan, the investment adviser will use its discretion and judgment in considering and appraising relevant factors. Fair value determinations are made by the portfolio managers of the Portfolios based on information available to such managers. The portfolio managers of other funds managed by the investment adviser that invest in Senior Loans may not possess the same information about a Senior Loan borrower as the portfolio managers of the Portfolios. At times, the fair value of a Senior Loan determined by the portfolio managers of other portfolios managed by the investment adviser that invest in Senior Loans may vary from the fair value of the same Senior Loan determined by the portfolio managers of the Portfolios. The fair value of each Senior Loan is periodically reviewed and approved by the investment adviser’s Valuation Committee and by the Trustees based upon procedures approved by the Trustees. Junior Loans (i.e., subordinated loans and second lien loans) are valued in the same manner as Senior Loans.
The Portfolios may invest in Eaton Vance Cash Reserves Fund, LLC (Cash Reserves Fund), an affiliated investment company managed by EVM. Cash Reserves Fund generally values its investment securities utilizing the amortized cost valuation technique in accordance with Rule 2a-7 under the 1940 Act. This technique involves initially valuing a portfolio security at its cost and thereafter assuming a constant amortization to maturity of any discount or premium. If amortized cost is determined not to approximate fair value, Cash Reserves Fund may value its investment securities in the same manner as debt obligations described above.
In addition to investing in the Portfolios, the Fund may invest directly in securities. The valuation policies of the Fund are consistent with the valuation policies of the Portfolios.
B Income — The Fund’s net investment income or loss includes the Fund’s pro-rata share of the net investment income or loss of the Portfolios, less all actual and accrued expenses of the Fund. Interest income on direct investments in securities is recorded on the basis of interest accrued, adjusted for amortization of premium or accretion of discount.
Eaton Vance
Multi-Strategy All Market Fund
October 31, 2012
Consolidated Notes to Financial Statements — continued
C Federal Taxes — The Fund’s policy is to comply with the provisions of the Internal Revenue Code applicable to regulated investment companies and to distribute to shareholders each year substantially all of its net investment income, and all or substantially all of its net realized capital gains. Accordingly, no provision for federal income or excise tax is necessary.
As of October 31, 2012, the Fund had no uncertain tax positions that would require financial statement recognition, de-recognition, or disclosure. The Fund files a U.S. federal income tax return annually after its fiscal year-end, which is subject to examination by the Internal Revenue Service for a period of three years from the date of filing.
D Expenses — The majority of expenses of the Trust are directly identifiable to an individual fund. Expenses which are not readily identifiable to a specific fund are allocated taking into consideration, among other things, the nature and type of expense and the relative size of the funds.
E Expense Reduction — State Street Bank and Trust Company (SSBT) serves as custodian of the Fund. Pursuant to the custodian agreement, SSBT receives a fee reduced by credits, which are determined based on the average daily cash balance the Fund maintains with SSBT. All credit balances, if any, used to reduce the Fund’s custodian fees are reported as a reduction of expenses in the Consolidated Statement of Operations.
F Use of Estimates — The preparation of the consolidated financial statements in conformity with accounting principles generally accepted in the United States of America requires management to make estimates and assumptions that affect the reported amounts of assets and liabilities at the date of the consolidated financial statements and the reported amounts of income and expense during the reporting period. Actual results could differ from those estimates.
G Indemnifications — Under the Trust’s organizational documents, its officers and Trustees may be indemnified against certain liabilities and expenses arising out of the performance of their duties to the Fund. Under Massachusetts law, if certain conditions prevail, shareholders of a Massachusetts business trust (such as the Trust) could be deemed to have personal liability for the obligations of the Trust. However, the Trust’s Declaration of Trust contains an express disclaimer of liability on the part of Fund shareholders and the By-laws provide that the Trust shall assume the defense on behalf of any Fund shareholders. Moreover, the By-laws also provide for indemnification out of Fund property of any shareholder held personally liable solely by reason of being or having been a shareholder for all loss or expense arising from such liability. Additionally, in the normal course of business, the Fund enters into agreements with service providers that may contain indemnification clauses. The Fund’s maximum exposure under these arrangements is unknown as this would involve future claims that may be made against the Fund that have not yet occurred.
H Other — Investment transactions are accounted for on a trade date basis. Dividends to shareholders are recorded on the ex-dividend date. Realized gains and losses on investments sold are determined on the basis of identified cost.
2 Distributions to Shareholders
The Fund declares dividends daily to shareholders of record at the time of declaration. Distributions are generally paid monthly. Distributions of realized capital gains are made at least annually. Distributions are declared separately for each class of shares. Shareholders may reinvest income and capital gain distributions in additional shares of the same class of the Fund at the net asset value as of the reinvestment date or, at the election of the shareholder, receive distributions in cash. The Fund distinguishes between distributions on a tax basis and a financial reporting basis. Accounting principles generally accepted in the United States of America require that only distributions in excess of tax basis earnings and profits be reported in the consolidated financial statements as a return of capital. Permanent differences between book and tax accounting relating to distributions are reclassified to paid-in capital. For tax purposes, distributions from short-term capital gains are considered to be from ordinary income.
The tax character of distributions declared for the year ended October 31, 2012 was as follows:
| | | | |
| | | Year Ended
October 31, 2012 | |
| |
Distributions declared from: | | | | |
Ordinary income | | $ | 1,662,148 | |
Long-term capital gains | | $ | 340,750 | |
During the year ended October 31, 2012, accumulated net realized loss was decreased by $327,423, accumulated undistributed net investment income was decreased by $237,868 and paid-in capital was decreased by $89,555 due to differences between book and tax accounting, primarily for foreign currency gain (loss), swap contracts, paydown gain (loss), futures contracts, option contracts, premium amortization, tax accounting for straddle transactions, a Portfolio’s investment in a subsidiary, investment in passive foreign investment companies (PFICs), investment in partnerships, defaulted bond interest, and non-deductible expenses. These reclassifications had no effect on the net assets or net asset value per share of the Fund.
Eaton Vance
Multi-Strategy All Market Fund
October 31, 2012
Consolidated Notes to Financial Statements — continued
As of October 31, 2012, the components of distributable earnings (accumulated losses) and unrealized appreciation (depreciation) on a tax basis were as follows:
| | | | |
Undistributed long-term capital gains | | $ | 72,624 | |
Net unrealized appreciation | | $ | 819,635 | |
Other temporary differences | | $ | (20 | ) |
The differences between components of distributable earnings (accumulated losses) on a tax basis and the amounts reflected in the Consolidated Statement of Assets and Liabilities are primarily due to tax accounting for straddle transactions, wash sales, futures contracts, swap contracts, foreign currency transactions, premium amortization, partnership allocations, defaulted bond interest, option contracts, investment in PFICs and the timing of recognizing distributions to shareholders.
3 Investment Adviser and Administration Fee and Other Transactions with Affiliates
The investment adviser and administration fee is earned by EVM, as compensation for investment advisory and administrative services rendered to the Fund and the Subsidiary. The fee is computed at an annual rate of 0.615% of the Fund’s consolidated average daily net assets that are not invested in other investment companies for which EVM or its affiliates serve as investment adviser or administrator (“Investable Assets”) up to $500 million and is payable monthly. On Investable Assets of $500 million or more, the annual fee is reduced. To the extent the Fund’s assets are invested in other investment companies managed by EVM or its affiliates, the Fund is allocated its share of such investment companies’ investment adviser fee. For the year ended October 31, 2012, the Fund’s allocated portion of the investment adviser fee paid by the Portfolios totaled $406,899 and the investment adviser and administration fee paid by the Fund on Investable Assets amounted to $2,933. For the year ended October 31, 2012, the Fund’s investment adviser and administration fee, including the investment adviser fee allocated from the Portfolios, was 0.72% of the Fund’s average daily net assets.
EVM has agreed to reimburse the Fund’s expenses to the extent that total annual operating expenses (relating to ordinary operating expenses only and including management fees and other expenses associated with the Fund’s investment in an affiliated investment fund) exceed 1.35%, 2.10%, and 1.10% of the Fund’s average daily net assets for Class A, Class C and Class I, respectively. This agreement may be changed or terminated after February 28, 2013. Pursuant to this agreement, EVM was allocated $197,398 of the Fund’s operating expenses for the year ended October 31, 2012.
EVM serves as the sub-transfer agent of the Fund and receives from the transfer agent an aggregate fee based upon the actual expenses incurred by EVM in the performance of these services. For the year ended October 31, 2012, EVM earned $757 in sub-transfer agent fees. The Fund was informed that EVD, an affiliate of EVM, received $660 as its portion of the sales charge on sales of Class A shares for the year ended October 31, 2012. EVD also received distribution and service fees from Class A and Class C shares (see Note 6).
Trustees and officers of the Fund and the Portfolios who are members of EVM’s or BMR’s organizations receive remuneration for their services to the Fund out of the investment adviser fee. Certain officers and Trustees of the Fund and the Portfolios are officers of the above organizations.
4 Purchases and Sales of Investments
Purchases and sales of investments, other than short-term obligations aggregated $5,556,431 and $4,747,034, respectively, for the year ended October 31, 2012.
5 Federal Income Tax Basis of Investments
The cost and unrealized appreciation (depreciation) of investments of the Fund, including the Subsidiary, at October 31, 2012, as determined on a federal income tax basis, were as follows:
| | | | |
| |
Aggregate cost | | $ | 812,781 | |
| |
Gross unrealized appreciation | | $ | 88,263 | |
Gross unrealized depreciation | | | — | |
| |
Net unrealized appreciation | | $ | 88,263 | |
6 Distribution Plans
The Fund has in effect a distribution plan for Class A shares (Class A Plan) pursuant to Rule 12b-1 under the 1940 Act. Pursuant to the Class A Plan, the Fund pays EVD a distribution and service fee of 0.25% per annum of its average daily net assets attributable to Class A shares for distribution services and facilities provided to the Fund by EVD, as well as for personal services and/or the maintenance of shareholder accounts. Distribution and service fees paid or accrued to EVD for the year ended October 31, 2012 amounted to $129,569 for Class A shares.
Eaton Vance
Multi-Strategy All Market Fund
October 31, 2012
Consolidated Notes to Financial Statements — continued
The Fund also has in effect a distribution plan for Class C shares (Class C Plan) pursuant to Rule 12b-1 under the 1940 Act. Pursuant to the Class C Plan, the Fund pays EVD amounts equal to 0.75% per annum of its average daily net assets attributable to Class C shares for providing ongoing distribution services and facilities to the Fund. For the year ended October 31, 2012, the Fund paid or accrued to EVD $90 for Class C shares.
Pursuant to the Class C Plan, the Fund also makes payments of service fees to EVD, financial intermediaries and other persons in amounts equal to 0.25% per annum of its average daily net assets attributable to Class C shares. Service fees paid or accrued are for personal services and/or the maintenance of shareholder accounts. They are separate and distinct from the sales commissions and distribution fees payable to EVD. Service fees paid or accrued for the year ended October 31, 2012 amounted to $30 for Class C shares.
7 Contingent Deferred Sales Charges
A contingent deferred sales charge (CDSC) of 1% generally is imposed on redemptions of Class C shares made within one year of purchase. Class A shares may be subject to a 1% CDSC if redeemed within 18 months of purchase (depending on the circumstances of purchase). Generally, the CDSC is based upon the lower of the net asset value at date of redemption or date of purchase. No charge is levied on shares acquired by reinvestment of dividends or capital gain distributions. No CDSC is levied on shares which have been sold to EVM or its affiliates or to their respective employees or clients and may be waived under certain other limited conditions. For the year ended October 31, 2012, the Fund was informed that EVD received no CDSCs paid by Class A and Class C shareholders.
8 Investment Transactions
For the year ended October 31, 2012, increases and decreases in the Fund’s investments in the Portfolios were as follows:
| | | | | | | | |
| Portfolio | | Contributions | | | Withdrawals | |
| | |
Boston Income Portfolio | | $ | 24,672,390 | | | $ | 11,258,129 | |
Floating Rate Portfolio | | | 28,267,123 | | | | 3,721,848 | |
Global Macro Absolute Return Advantage Portfolio | | | 18,060,195 | | | | 3,241,223 | |
Global Macro Portfolio | | | 8,016,770 | | | | 1,438,991 | |
Government Obligations Portfolio | | | 4,910,082 | | | | 875,660 | |
International Income Portfolio | | | 583,925 | | | | 587,585 | |
MSAM Completion Portfolio | | | 14,708,478 | | | | 10,775,147 | |
Parametric Structured Absolute Return Portfolio | | | 13,617,407 | | | | 1,000,000 | |
9 Shares of Beneficial Interest
The Fund’s Declaration of Trust permits the Trustees to issue an unlimited number of full and fractional shares of beneficial interest (without par value). Such shares may be issued in a number of different series (such as the Fund) and classes. Transactions in Fund shares were as follows:
| | | | | | | | |
| Class A | | Year Ended
October 31, 2012 | | | Period Ended October 31,
2011(1) | |
| | |
Sales | | | 10,702,295 | | | | 1,000 | |
Issued to shareholders electing to receive payments of distributions in Fund shares | | | 179,745 | | | | — | |
Redemptions | | | (2,783,783 | ) | | | — | |
| | |
Net increase | | | 8,098,257 | | | | 1,000 | |
| | |
| | | | | | | | |
| Class C | | Year Ended
October 31, 2012 | | | Period Ended
October 31,
2011(1) | |
| | |
Sales | | | 445 | | | | 1,000 | |
Issued to shareholders electing to receive payments of distributions in Fund shares | | | 5 | | | | — | |
Redemptions | | | (2 | ) | | | — | |
| | |
Net increase | | | 448 | | | | 1,000 | |
| | |
| | | | | | | | |
Eaton Vance
Multi-Strategy All Market Fund
October 31, 2012
Consolidated Notes to Financial Statements — continued
| | | | | | | | |
| Class I | | Year Ended
October 31, 2012 | | | Period Ended October 31,
2011(1) | |
| | |
Sales | | | 161,134 | | | | 998,000 | |
Issued to shareholders electing to receive payments of distributions in Fund shares | | | 2,657 | | | | — | |
Redemptions | | | (1,005,757 | ) | | | — | |
| | |
Net increase (decrease) | | | (841,966 | ) | | | 998,000 | |
| (1) | The Fund commenced operations on October 31, 2011. |
At October 31, 2012, accounts advised by EVM owned 65.1% of the value of the outstanding shares of the Fund.
10 Affiliated Investment Funds
Transactions with affiliated investment funds for the year ended October 31, 2012 were as follows:
| | | | | | | | | | | | | | | | | | | | | | | | |
| Fund | | Value, beginning
of period | | | Cost of
purchases | | | Proceeds
from sales | | | Investment
income | | | Realized
gain (loss) | | | Value, end of period | |
| | | | | | |
Parametric Option Absolute Return Strategy Fund, Class I | | $ | — | | | $ | 4,743,650 | | | $ | 4,747,034 | | | $ | — | | | $ | 3,384 | | | $ | — | |
11 Fair Value Measurements
Under generally accepted accounting principles for fair value measurements, a three-tier hierarchy to prioritize the assumptions, referred to as inputs, is used in valuation techniques to measure fair value. The three-tier hierarchy of inputs is summarized in the three broad levels listed below.
| Ÿ | | Level 1 – quoted prices in active markets for identical investments |
| Ÿ | | Level 2 – other significant observable inputs (including quoted prices for similar investments, interest rates, prepayment speeds, credit risk, etc.) |
| Ÿ | | Level 3 – significant unobservable inputs (including a fund’s own assumptions in determining the fair value of investments) |
In cases where the inputs used to measure fair value fall in different levels of the fair value hierarchy, the level disclosed is determined based on the lowest level input that is significant to the fair value measurement in its entirety. The inputs or methodology used for valuing securities are not necessarily an indication of the risk associated with investing in those securities.
At October 31, 2012, the Fund’s investment and investments in the Portfolios were valued based on Level 1 inputs. The Fund held no investments as of October 31, 2011, the date it commenced operations.
Eaton Vance
Multi-Strategy All Market Fund
October 31, 2012
Report of Independent Registered Public Accounting Firm
To the Trustees of Eaton Vance Mutual Funds Trust and Shareholders of Eaton Vance Multi-Strategy All Market Fund:
We have audited the accompanying consolidated statement of assets and liabilities of Eaton Vance Multi-Strategy All Market Fund and subsidiary (the “Fund”) (one of the funds constituting Eaton Vance Mutual Funds Trust), including the consolidated portfolio of investments as of October 31, 2012, and the related consolidated statement of operations and the consolidated financial highlights for the year then ended and the consolidated statements of changes in net assets for the year then ended and for the period of the start of business commencing on and ending on October 31, 2011. These consolidated financial statements and consolidated financial highlights are the responsibility of the Fund’s management. Our responsibility is to express an opinion on these consolidated financial statements and consolidated financial highlights based on our audits.
We conducted our audits in accordance with the standards of the Public Company Accounting Oversight Board (United States). Those standards require that we plan and perform the audit to obtain reasonable assurance about whether the consolidated financial statements and consolidated financial highlights are free of material misstatement. The Fund is not required to have, nor were we engaged to perform, an audit of its internal control over financial reporting. Our audits included consideration of internal control over financial reporting as a basis for designing audit procedures that are appropriate in the circumstances, but not for the purpose of expressing an opinion on the effectiveness of the Fund’s internal control over financial reporting. Accordingly, we express no such opinion. An audit also includes examining, on a test basis, evidence supporting the amounts and disclosures in the financial statements, assessing the accounting principles used and significant estimates made by management, as well as evaluating the overall financial statement presentation. Our audit procedures include confirmation of securities owned as of October 31, 2012, by correspondence with the custodian. We believe that our audits provide a reasonable basis for our opinion.
In our opinion, such consolidated financial statements and consolidated financial highlights referred to above present fairly, in all material respects, the financial position of Eaton Vance Multi-Strategy All Market Fund and subsidiary as of October 31, 2012, and the results of their operations and financial highlights for the year then ended and the changes in their net assets for the year then ended and for the period of the start of business commencing on and ending on October 31, 2011, in conformity with accounting principles generally accepted in the United States of America.
DELOITTE & TOUCHE LLP
Boston, Massachusetts
December 27, 2012
Eaton Vance
Multi-Strategy All Market Fund
October 31, 2012
Federal Tax Information (Unaudited)
The Form 1099-DIV you receive in January 2013 will show the tax status of all distributions paid to your account in calendar year 2012. Shareholders are advised to consult their own tax adviser with respect to the tax consequences of their investment in the Fund. As required by the Internal Revenue Code and/or regulations, shareholders must be notified regarding capital gains dividends.
Capital Gains Dividends. The Fund hereby designates as a capital gain dividend with respect to the taxable year ended October 31, 2012, $754,124 or, if subsequently determined to be different, the net capital gain of such year.
Eaton Vance
Multi-Strategy All Market Fund
October 31, 2012
Management and Organization
Fund Management. The Trustees of Eaton Vance Mutual Funds Trust (the Trust) are responsible for the overall management and supervision of the Trust’s affairs. The Trustees and officers of the Trust are listed below. Except as indicated, each individual has held the office shown or other offices in the same company for the last five years. Trustees and officers of the Trust hold indefinite terms of office. The “Noninterested Trustees” consist of those Trustees who are not “interested persons” of the Trust, as that term is defined under the 1940 Act. The business address of each Trustee and officer is Two International Place, Boston, Massachusetts 02110. As used below, “EVC” refers to Eaton Vance Corp., “EV” refers to Eaton Vance, Inc., “EVM” refers to Eaton Vance Management, “BMR” refers to Boston Management and Research and “EVD” refers to Eaton Vance Distributors, Inc. EVC and EV are the corporate parent and trustee, respectively, of EVM and BMR. EVD is the Fund’s principal underwriter and a wholly-owned subsidiary of EVC. Each officer affiliated with Eaton Vance may hold a position with other Eaton Vance affiliates that is comparable to his or her position with EVM listed below. Each Trustee oversees 187 portfolios in the Eaton Vance Complex (including all master and feeder funds in a master feeder structure). Each officer serves as an officer of certain other Eaton Vance funds. Each Trustee and officer serves until his or her successor is elected.
| | | | | | |
| Name and Year of Birth | | Position(s)
with the
Trust | | Length of
Service | | Principal Occupation(s) and Directorships
During Past Five Years and Other Relevant Experience |
Interested Trustee | | | | | | |
| | | |
Thomas E. Faust Jr. 1958 | | Trustee | | Since 2007 | | Chairman, Chief Executive Officer and President of EVC, Director and President of EV, Chief Executive Officer and President of EVM and BMR, and Director of EVD. Trustee and/or officer of 187 registered investment companies. Mr. Faust is an interested person because of his positions with EVM, BMR, EVD, EVC and EV, which are affiliates of the Trust. Directorships in the Last Five Years.(1) Director of EVC and Hexavest Inc. |
| | | |
| | | | | | |
Noninterested Trustees | | | | | | |
| | | |
Scott E. Eston 1956 | | Trustee | | Since 2011 | | Private investor. Formerly held various positions at Grantham, Mayo, Van Otterloo and Co., L.L.C. (investment management firm) (1997-2009), including Chief Operating Officer (2002-2009), Chief Financial Officer (1997-2009) and Chairman of the Executive Committee (2002-2008); President and Principal Executive Officer, GMO Trust (open-end registered investment company) (2006-2009). Former Partner, Coopers and Lybrand L.L.P. (now PricewaterhouseCoopers) (public accounting firm) (1987-1997). Directorships in the Last Five Years. None. |
| | | |
Benjamin C. Esty 1963 | | Trustee | | Since 2005 | | Roy and Elizabeth Simmons Professor of Business Administration and Finance Unit Head, Harvard University Graduate School of Business Administration. Directorships in the Last Five Years.(1) None. |
| | | |
Allen R. Freedman 1940 | | Trustee | | Since 2007 | | Private Investor. Former Chairman (2002-2004) and a Director (1983-2004) of Systems & Computer Technology Corp. (provider of software to higher education). Formerly, a Director of Loring Ward International (fund distributor) (2005-2007). Former Chairman and a Director of Indus International, Inc. (provider of enterprise management software to the power generating industry) (2005-2007). Former Chief Executive Officer of Assurant, Inc. (insurance provider) (1979-2000). Directorships in the Last Five Years.(1) Director of Stonemor Partners, L.P. (owner and operator of cemeteries). Formerly, Director of Assurant, Inc. (insurance provider) (1979-2011). |
| | | |
William H. Park 1947 | | Trustee | | Since 2003 | | Consultant and private investor. Formerly, Chief Financial Officer, Aveon Group L.P. (investment management firm) (2010-2011). Formerly, Vice Chairman, Commercial Industrial Finance Corp. (specialty finance company) (2006-2010). Formerly, President and Chief Executive Officer, Prizm Capital Management, LLC (investment management firm) (2002-2005). Formerly, Executive Vice President and Chief Financial Officer, United Asset Management Corporation (investment management firm) (1982-2001). Formerly, Senior Manager, Price Waterhouse (now PricewaterhouseCoopers) (an independent registered public accounting firm) (1972-1981). Directorships in the Last Five Years.(1) None. |
| | | |
Ronald A. Pearlman 1940 | | Trustee | | Since 2003 | | Professor of Law, Georgetown University Law Center. Formerly, Deputy Assistant Secretary (Tax Policy) and Assistant Secretary (Tax Policy), U.S. Department of the Treasury (1983-1985). Formerly, Chief of Staff, Joint Committee on Taxation, U.S. Congress (1988-1990). Directorships in the Last Five Years.(1) None. |
Eaton Vance
Multi-Strategy All Market Fund
October 31, 2012
Management and Organization — continued
| | | | | | |
| Name and Year of Birth | | Position(s)
with the
Trust | | Length of
Service | | Principal Occupation(s) and Directorships
During Past Five Years and Other Relevant Experience |
Noninterested Trustees (continued) |
| | | |
Helen Frame Peters 1948 | | Trustee | | Since 2008 | | Professor of Finance, Carroll School of Management, Boston College. Formerly, Dean, Carroll School of Management, Boston College (2000-2002). Formerly, Chief Investment Officer, Fixed Income, Scudder Kemper Investments (investment management firm) (1998-1999). Formerly, Chief Investment Officer, Equity and Fixed Income, Colonial Management Associates (investment management firm) (1991-1998). Directorships in the Last Five Years.(1) Formerly, Director of BJ’s Wholesale Club, Inc. (wholesale club retailer) (2004-2011). Formerly, Trustee of SPDR Index Shares Funds and SPDR Series Trust (exchange traded funds) (2000-2009). Formerly, Director of Federal Home Loan Bank of Boston (a bank for banks) (2007-2009). |
| | | |
Lynn A. Stout 1957 | | Trustee | | Since 1998 | | Distinguished Professor of Corporate and Business Law, Jack G. Clarke Business Law Institute, Cornell University Law School. Formerly, the Paul Hastings Professor of Corporate and Securities Law (2006-2012) and Professor of Law (2001-2006), University of California at Los Angeles School of Law. Directorships in the Last Five Years.(1) None. |
| | | |
Harriett Tee Taggart 1948 | | Trustee | | Since 2011 | | Managing Director, Taggart Associates (a professional practice firm). Formerly, Partner and Senior Vice President, Wellington Management Company, LLP (investment management firm) (1983-2006). Directorships in the Last Five Years. Director of Albemarle Corporation (chemicals manufacturer) (since 2007) and The Hanover Group (specialty property and casualty insurance company) (since 2009). Formerly, Director of Lubrizol Corporation (specialty chemicals) (2007-2011). |
| | | |
Ralph F. Verni 1943 | | Chairman of the Board and Trustee | | Chairman of the Board since 2007 and Trustee since 2005 | | Consultant and private investor. Formerly, Chief Investment Officer (1982-1992), Chief Financial Officer (1988-1990) and Director (1982-1992), New England Life. Formerly, Chairperson, New England Mutual Funds (1982-1992). Formerly, President and Chief Executive Officer, State Street Management & Research (1992-2000). Formerly, Chairperson, State Street Research Mutual Funds (1992-2000). Formerly, Director, W.P. Carey, LLC (1998-2004) and First Pioneer Farm Credit Corp. (2002-2006). Directorships in the Last Five Years.(1) None. |
| | | |
| | | | | | |
Principal Officers who are not Trustees | | |
| Name and Year of Birth | | Position(s)
with the
Trust | | Length of Service | | Principal Occupation(s) During Past Five Years |
| | | |
Duncan W. Richardson 1957 | | President | | Since 2011 | | Director of EVC and Executive Vice President and Chief Equity Investment Officer of EVC, EVM and BMR. |
| | | |
Payson F. Swaffield 1956 | | Vice President | | Since 2011 | | Vice President and Chief Income Investment Officer of EVM and BMR. |
| | | |
Barbara E. Campbell 1957 | | Treasurer | | Since 2005 | | Vice President of EVM and BMR. |
| | | |
Maureen A. Gemma 1960 | | Vice President, Secretary and Chief Legal Officer | | Vice President since 2011, Secretary since 2007 and Chief Legal Officer since 2008 | | Vice President of EVM and BMR. |
| | | |
Paul M. O’Neil 1953 | | Chief Compliance Officer | | Since 2004 | | Vice President of EVM and BMR. |
| (1) | During their respective tenures, the Trustees (except Mr. Eston and Ms. Taggart) also served as trustees of one or more of the following Eaton Vance funds (which operated in the years noted): Eaton Vance Credit Opportunities Fund (launched in 2005 and terminated in 2010); Eaton Vance Insured Florida Plus Municipal Bond Fund (launched in 2002 and terminated in 2009); and Eaton Vance National Municipal Income Trust (launched in 1998 and terminated in 2009). |
The SAI for the Fund includes additional information about the Trustees and officers of the Fund and can be obtained without charge on Eaton Vance’s website at www.eatonvance.com or by calling 1-800-262-1122.
Eaton Vance Funds
IMPORTANT NOTICES
Privacy. The Eaton Vance organization is committed to ensuring your financial privacy. Each of the financial institutions identified below has in effect the following policy (“Privacy Policy”) with respect to nonpublic personal information about its customers:
| Ÿ | | Only such information received from you, through application forms or otherwise, and information about your Eaton Vance fund transactions will be collected. This may include information such as name, address, social security number, tax status, account balances and transactions. |
| Ÿ | | None of such information about you (or former customers) will be disclosed to anyone, except as permitted by law (which includes disclosure to employees necessary to service your account). In the normal course of servicing a customer’s account, Eaton Vance may share information with unaffiliated third parties that perform various required services such as transfer agents, custodians and broker-dealers. |
| Ÿ | | Policies and procedures (including physical, electronic and procedural safeguards) are in place that are designed to protect the confidentiality of such information. |
| Ÿ | | We reserve the right to change our Privacy Policy at any time upon proper notification to you. Customers may want to review our Privacy Policy periodically for changes by accessing the link on our homepage: www.eatonvance.com. |
Our pledge of privacy applies to the following entities within the Eaton Vance organization: the Eaton Vance Family of Funds, Eaton Vance Management, Eaton Vance Investment Counsel, Eaton Vance Distributors, Inc., Eaton Vance Trust Company, Eaton Vance Management’s Real Estate Investment Group and Boston Management and Research. In addition, our Privacy Policy applies only to those Eaton Vance customers who are individuals and who have a direct relationship with us. If a customer’s account (i.e., fund shares) is held in the name of a third-party financial advisor/broker-dealer, it is likely that only such advisor’s privacy policies apply to the customer. This notice supersedes all previously issued privacy disclosures. For more information about Eaton Vance’s Privacy Policy, please call 1-800-262-1122.
Delivery of Shareholder Documents. The Securities and Exchange Commission (SEC) permits funds to deliver only one copy of shareholder documents, including prospectuses, proxy statements and shareholder reports, to fund investors with multiple accounts at the same residential or post office box address. This practice is often called “householding” and it helps eliminate duplicate mailings to shareholders. Eaton Vance, or your financial advisor, may household the mailing of your documents indefinitely unless you instruct Eaton Vance, or your financial advisor, otherwise. If you would prefer that your Eaton Vance documents not be householded, please contact Eaton Vance at 1-800-262-1122, or contact your financial advisor. Your instructions that householding not apply to delivery of your Eaton Vance documents will be effective within 30 days of receipt by Eaton Vance or your financial advisor.
Portfolio Holdings. Each Eaton Vance Fund and its underlying Portfolio(s) (if applicable) will file a schedule of portfolio holdings on Form N-Q with the SEC for the first and third quarters of each fiscal year. The Form N-Q will be available on the Eaton Vance website at www.eatonvance.com, by calling Eaton Vance at 1-800-262-1122 or in the EDGAR database on the SEC’s website at www.sec.gov. Form N-Q may also be reviewed and copied at the SEC’s public reference room in Washington, D.C. (call 1-800-732-0330 for information on the operation of the public reference room).
Proxy Voting. From time to time, funds are required to vote proxies related to the securities held by the funds. The Eaton Vance Funds or their underlying Portfolios (if applicable) vote proxies according to a set of policies and procedures approved by the Funds’ and Portfolios’ Boards. You may obtain a description of these policies and procedures and information on how the Funds or Portfolios voted proxies relating to portfolio securities during the most recent 12-month period ended June 30, without charge, upon request, by calling 1-800-262-1122 and by accessing the SEC’s website at www.sec.gov.
Investment Adviser and Administrator
Eaton Vance Management
Two International Place
Boston, MA 02110
Principal Underwriter*
Eaton Vance Distributors, Inc.
Two International Place
Boston, MA 02110
(617) 482-8260
Custodian
State Street Bank and Trust Company
200 Clarendon Street
Boston, MA 02116
Transfer Agent
BNY Mellon Investment Servicing (US) Inc.
Attn: Eaton Vance Funds
P.O. Box 9653
Providence, RI 02940-9653
(800) 262-1122
Independent Registered Public Accounting Firm
Deloitte & Touche LLP
200 Berkeley Street
Boston, MA 02116-5022
Fund Offices
Two International Place
Boston, MA 02110
| * | FINRA BrokerCheck. Investors may check the background of their Investment Professional by contacting the Financial Industry Regulatory Authority (FINRA). FINRA BrokerCheck is a free tool to help investors check the professional background of current and former FINRA-registered securities firms and brokers. FINRA BrokerCheck is available by calling 1-800-289-9999 and at www.FINRA.org. The FINRA BrokerCheck brochure describing this program is available to investors at www.FINRA.org. |
| | |
Eaton Vance Parametric Structured Absolute Return Fund Annual Report October 31, 2012 | | 
|

Fund shares are not insured by the FDIC and are not deposits or other obligations of, or guaranteed by, any depository institution. Shares are subject to investment risks, including possible loss of principal invested.
This report must be preceded or accompanied by a current summary prospectus or prospectus. Before investing, investors should consider carefully the investment objective, risks, and charges and expenses of a mutual fund. This and other important information is contained in the summary prospectus and prospectus, which can be obtained from a financial advisor. Prospective investors should read the prospectus carefully before investing. For further information, please call 1-800-262-1122.
Annual Report October 31, 2012
Eaton Vance
Parametric Structured Absolute Return Fund
Table of Contents
| | | | |
Management’s Discussion of Fund Performance | | | 2 | |
| |
Performance | | | 3 | |
| |
Fund Profile | | | 4 | |
| |
Endnotes and Additional Disclosures | | | 5 | |
| |
Fund Expenses | | | 6 | |
| |
Financial Statements | | | 7 | |
| |
Report of Independent Registered Public Accounting Firm | | | 15 and 55 | |
| |
Federal Tax Information | | | 16 | |
| |
Management and Organization | | | 56 | |
| |
Important Notices | | | 59 | |
Eaton Vance
Parametric Structured Absolute Return Fund
October 31, 2012
Management’s Discussion of Fund Performance1
Economic and Market Conditions
As the 12-month period began, investors appeared to worry about intensifying debt problems in Europe, high U.S. unemployment and a Congressional deadlock that left businesses perplexed about the direction of tax and regulatory policy. The MSCI World Index,2 a broad measure of global equity market performance, was relatively flat in November 2011.
Beginning in mid-December 2011, however, an equity rally took hold and continued into early April 2012. U.S. stocks were generally fueled by stronger economic growth and falling unemployment. European stocks continued to underperform U.S. issues, but nonetheless moved higher, aided by the Long-Term Refinancing Operation announced by the European Central Bank (ECB) and what the markets perceived as a successful restructuring of Greek debt. Then in May 2012, the third annual mid-year economic slowdown arrived. As U.S. stock prices decreased, stock prices overseas fell even harder. Contributing factors included renewed concerns over Europe and slowing growth in China.
But despite a slowdown in consumer spending, weakening employment data and downward revisions of growth expectations, global equities moved upward intermittently from June through mid-October 2012. Hunting for yield in a low interest-rate environment, investors were driven to stocks that offered higher yields than bonds. Ongoing action by the ECB also helped the market, particularly the Outright Monetary Transactions program to support sovereign debt.
Additional factors led U.S. stocks to generally outperform their non-U.S. counterparts. First, investors anticipated that worsening economic news would prompt the U.S. Federal Reserve to initiate another round of quantitative easing to stimulate the economy — which it did in September 2012. Finally, in an increasingly global marketplace, a case could be made that the U.S. market was relatively attractive versus many other world markets for much of the period. Amid ongoing European turmoil and a slowdown in Chinese growth, the U.S. market was one of the few places investors could find an economy that was growing (albeit slowly); a liquid, transparent and generally well-regulated market; and an opportunity to find companies with large cash reserves and solid profit growth.
In the final weeks of the period, however, stocks gave back some of their gains as the market seemed to have come full circle; amid uncertainty about the upcoming U.S. elections, investors once again worried about a Congressional deadlock on tax policy — an impasse that has left the United States rushing toward a fiscal cliff that could drag down the U.S. and global economies.
During the 12-month period, foreign currency values relative to the U.S. dollar demonstrated great disparity, depending on geographical region and perceived economic strength. Developed currencies tied to Europe’s economic crisis generally fell, while currencies associated with the more fiscally stable
dollar bloc countries (Australian, New Zealand and Canadian Dollar) generally experienced mild appreciation. Meanwhile, the commodities market, as measured by the Dow Jones-UBS Commodity Index Total Return, fell. While the grains sector rallied strongly, those gains were more than offset by large declines in the softs sector (e.g., coffee, cotton and sugar) and by the continuing collapse in the value of natural gas.
Fund Performance
For the fiscal year ended October 31, 2012, Parametric Structured Absolute Return Fund (the Fund) had a total return of 1.40% for Class A shares at net asset value (NAV). By comparison, the Fund’s benchmark, the BofA Merrill Lynch 3-Month U.S. Treasury Bill Index (the Index), returned 0.08% during the period.
The Fund consisted of five substrategies representing regional equities, currencies and commodities. Each substrategy targeted a complete hedge against primary market exposure or beta neutrality on a stand-alone basis with the most relevant liquid benchmark. Beta is a measure of the volatility of a security or portfolio in relation to the market as a whole. In order of contribution to the Fund’s performance versus the Index during the period, the five substrategies were:
1) Structured U.S. equities hedged with the S&P 500 Index; 2) Structured Emerging Markets Core equities hedged with MSCI Emerging Markets Index; 3) Structured International equities hedged with MSCI EAFE Index; 4) Structured Commodities hedged with the Dow Jones-UBS Commodity Index Total Return; and 5) Structured Developed Currencies hedged with the U.S. Dollar Index. All five substrategies contributed positively to Fund performance versus the Index.
The Structured U.S. equities substrategy benefited from a structural low-volatility focus and particularly selection within the energy sector, while underweights to mega-cap stocks and to the financials sector detracted from Fund performance versus the Index.
The Structured Emerging Markets Core equities substrategy benefited from a structural underweight to Brazil, while a structural underweight to China was the largest detractor from Fund performance versus the Index.
The Structured International equities substrategy benefited from both a large underweight to Japan and low-volatility-focused security selection within that country. Overweights to Spain and Italy were among the largest detractors from Fund performance versus the Index.
The Structured Commodities substrategy benefited from an underweight to natural gas and an overweight to gasoline, while an underweight to soybeans was the largest detractor from Fund performance versus the Index.
The Structured Developed Currencies substrategy benefited primarily from the euro’s loss of value, while detractors from Fund performance versus the Index were generally modest, led by the appreciation of the Israeli shekel — both relative to other developed currencies.
|
See Endnotes and Additional Disclosures in this report. Past performance is no guarantee of future results. Returns are historical and are calculated by determining the percentage change in net asset value (NAV) or offering price (as applicable) with all distributions reinvested. Investment return and principal value will fluctuate so that shares, when redeemed, may be worth more or less than their original cost. Performance less than one year is cumulative. Performance is for the stated time period only; due to market volatility, the Fund’s current performance may be lower or higher than quoted. Returns are before taxes unless otherwise noted. For performance as of the most recent month end, please refer to www.eatonvance.com. |
Eaton Vance
Parametric Structured Absolute Return Fund
October 31, 2012
Performance2,3
Portfolio Managers David Stein, Ph.D and Thomas Seto, each of Parametric Portfolio Associates LLC
| | | | | | | | | | | | |
| % Cumulative Total Returns | | Inception Date | | | One Year | | | Since
Inception | |
Class A at NAV | | | 12/09/2011 | | | | — | | | | 1.40 | % |
Class A with 4.75% Maximum Sales Charge | | | — | | | | — | | | | –3.43 | |
Class I at NAV | | | 10/31/2011 | | | | 1.60 | % | | | 1.60 | |
BofA Merrill Lynch 3-Month U.S. Treasury Bill Index | | | 10/31/2011 | | | | 0.08 | % | | | 0.08 | % |
| | | |
| | | | | | | | | | | | |
| % Total Annual Operating Expense Ratios4 | | | | | Class A | | | Class I | |
Gross | | | | | | | 1.70 | % | | | 1.45 | % |
Net | | | | | | | 1.55 | | | | 1.30 | |
Performance of $250,000
This graph shows the change in value of a hypothetical investment of $250,000 in Class I of the Fund for the period indicated. For comparison, the same investment is shown in the indicated index.
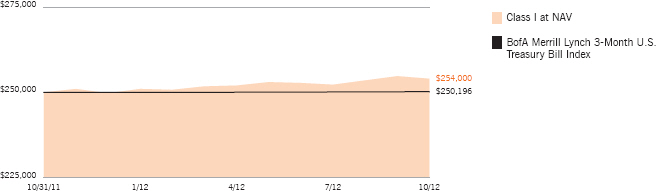
| | | | | | | | |
| Performance of Investment | | Amount Invested | | Period Beginning | | At NAV | | With Maximum
Sales Charge |
Class A | | $10,000 | | 12/09/2011 | | $10,140 | | $9,657 |
See Endnotes and Additional Disclosures in this report.
Past performance is no guarantee of future results. Returns are historical and are calculated by determining the percentage change in net asset value (NAV) or offering price (as applicable) with all distributions reinvested. Investment return and principal value will fluctuate so that shares, when redeemed, may be worth more or less than their original cost. Performance less than one year is cumulative. Performance is for the stated time period only; due to market volatility, the Fund’s current performance may be lower or higher than quoted. Returns are before taxes unless otherwise noted. For performance as of the most recent month end, please refer to www.eatonvance.com.
Eaton Vance
Parametric Structured Absolute Return Fund
October 31, 2012
Fund Profile5
See Endnotes and Additional Disclosures in this report.
Eaton Vance
Parametric Structured Absolute Return Fund
October 31, 2012
Endnotes and Additional Disclosures
| 1 | The views expressed in this report are those of the portfolio manager(s) and are current only through the date stated at the top of this page. These views are subject to change at any time based upon market or other conditions, and Eaton Vance and the Fund(s) disclaim any responsibility to update such views. These views may not be relied upon as investment advice and, because investment decisions are based on many factors, may not be relied upon as an indication of trading intent on behalf of any Eaton Vance fund. This commentary may contain statements that are not historical facts, referred to as “forward looking statements”. The Fund’s actual future results may differ significantly from those stated in any forward looking statement, depending on factors such as changes in securities or financial markets or general economic conditions, the volume of sales and purchases of Fund shares, the continuation of investment advisory, administrative and service contracts, and other risks discussed from time to time in the Fund’s filings with the Securities and Exchange Commission. |
| 2 | MSCI World Index is an unmanaged index of equity securities in the developed markets. MSCI Emerging Markets Index is an unmanaged index of emerging markets common stocks. MSCI EAFE Index is an unmanaged index of equities in the developed markets, excluding the U.S. and Canada. MSCI indices are net of foreign withholding taxes. Source: MSCI. MSCI data may not be reproduced or used for any other purpose. MSCI provides no warranties, has not prepared or approved this report, and has no liability hereunder. Dow Jones-UBS Commodity Index Total Return is composed of futures contracts on physical commodities traded on U.S. exchanges. BofA Merrill Lynch 3-Month U.S. Treasury Bill Index is an unmanaged index of U.S. Treasury securities maturing in 90 days. BofA Merrill Lynch® indices not for redistribution or other uses; provided “as is”, without warranties, and with no liability. Eaton Vance has prepared this report, BofAML does not endorse it, or guarantee, review, or endorse Eaton Vance’s products. S&P 500 Index is an unmanaged index of large- cap stocks commonly used as a measure of U.S. stock market performance. U.S. Dollar Index is a measure of the value of the United States dollar relative to a basket of other developed-market currencies. Unless otherwise stated, index returns do not reflect the effect of any applicable sales charges, commissions, expenses, taxes or leverage, as applicable. It is not possible to invest directly in an index. |
| 3 | Cumulative Total Returns at NAV do not include applicable sales charges. If sales charges were deducted, the returns would be lower. Cumulative Total Returns shown with maximum sales charge reflect the stated maximum sales charge. Unless otherwise stated, performance does not reflect the deduction of taxes on Fund distributions or redemptions of Fund shares. |
| 4 | Source: Fund prospectus. Net expense ratio reflects a contractual expense reimbursement that continues through 2/28/13. Without the reimbursement, performance would have been lower. |
| 5 | Fund primarily invests in an affiliated investment company (Portfolio) with the same objective(s) and policies as the Fund and may also invest directly. References to investments are to the Portfolio’s holdings. |
| 6 | Market Neutral reflects both long and short positions for each strategy. |
| 7 | Other net assets represents other assets less liabilities and includes investment types, if any, each less than 1% of net assets. See Statement of Assets and Liabilities for details. |
| | Fund profile subject to change due to active management. |
Eaton Vance
Parametric Structured Absolute Return Fund
October 31, 2012
Fund Expenses
Example: As a Fund shareholder, you incur two types of costs: (1) transaction costs, including sales charges (loads) on purchases and redemption fees (if applicable); and (2) ongoing costs, including management fees; distribution and/or service fees; and other Fund expenses. This Example is intended to help you understand your ongoing costs (in dollars) of Fund investing and to compare these costs with the ongoing costs of investing in other mutual funds. The Example is based on an investment of $1,000 invested at the beginning of the period and held for the entire period (May 1, 2012 – October 31, 2012).
Actual Expenses: The first section of the table below provides information about actual account values and actual expenses. You may use the information in this section, together with the amount you invested, to estimate the expenses that you paid over the period. Simply divide your account value by $1,000 (for example, an $8,600 account value divided by $1,000 = 8.6), then multiply the result by the number in the first section under the heading entitled “Expenses Paid During Period” to estimate the expenses you paid on your account during this period.
Hypothetical Example for Comparison Purposes: The second section of the table below provides information about hypothetical account values and hypothetical expenses based on the actual Fund expense ratio and an assumed rate of return of 5% per year (before expenses), which is not the actual Fund return. The hypothetical account values and expenses may not be used to estimate the actual ending account balance or expenses you paid for the period. You may use this information to compare the ongoing costs of investing in your Fund and other funds. To do so, compare this 5% hypothetical example with the 5% hypothetical examples that appear in the shareholder reports of the other funds.
Please note that the expenses shown in the table are meant to highlight your ongoing costs only and do not reflect any transactional costs, such as sales charges (loads) or redemption fees (if applicable). Therefore, the second section of the table is useful in comparing ongoing costs only, and will not help you determine the relative total costs of owning different funds. In addition, if these transactional costs were included, your costs would be higher.
| | | | | | | | | | | | | | | | |
| | | Beginning
Account Value
(5/1/12) | | | Ending
Account Value
(10/31/12) | | | Expenses Paid
During Period*
(5/1/12 – 10/31/12) | | | Annualized
Expense
Ratio | |
| | | | |
| | | | | | | | | | | | | | | | |
Actual | | | | | | | | | | | | | |
Class A | | $ | 1,000.00 | | | $ | 1,007.00 | | | $ | 7.82 | ** | | | 1.55 | % |
Class I | | $ | 1,000.00 | | | $ | 1,007.90 | | | $ | 6.56 | ** | | | 1.30 | % |
| | | | | | | | | | | | | | | | | |
| | | | |
| | | | | | | | | | | | | | | | |
Hypothetical | | | | | | | | | | | | | |
(5% return per year before expenses) | | | | | | | | | | | | | |
Class A | | $ | 1,000.00 | | | $ | 1,017.30 | | | $ | 7.86 | ** | | | 1.55 | % |
Class I | | $ | 1,000.00 | | | $ | 1,018.60 | | | $ | 6.60 | ** | | | 1.30 | % |
| * | Expenses are equal to the Fund’s annualized expense ratio for the indicated Class, multiplied by the average account value over the period, multiplied by 184/366 (to reflect the one-half year period). The Example assumes that the $1,000 was invested at the net asset value per share determined at the close of business on April 30, 2012. The Example reflects the expenses of both the Fund and the Portfolio. |
| ** | Absent an allocation of certain expenses to affiliates, the expenses would be higher. |
Eaton Vance
Parametric Structured Absolute Return Fund
October 31, 2012
Statement of Assets and Liabilities
| | | | |
| Assets | | October 31, 2012 | |
Investment in Parametric Structured Absolute Return Portfolio, at value (identified cost, $59,958,843) | | $ | 61,381,823 | |
Receivable for Fund shares sold | | | 157,894 | |
Receivable from affiliates | | | 47,727 | |
Total assets | | $ | 61,587,444 | |
|
| Liabilities | |
Payable for Fund shares redeemed | | $ | 210,881 | |
Payable to affiliates: | | | | |
Distribution and service fees | | | 8,307 | |
Trustees’ fees | | | 42 | |
Accrued expenses | | | 41,349 | |
Total liabilities | | $ | 260,579 | |
Net Assets | | $ | 61,326,865 | |
|
| Sources of Net Assets | |
Paid-in capital | | $ | 61,059,546 | |
Accumulated net realized loss from Portfolio | | | (1,456,250 | ) |
Accumulated undistributed net investment income | | | 300,589 | |
Net unrealized appreciation from Portfolio | | | 1,422,980 | |
Total | | $ | 61,326,865 | |
| |
| Class A Shares | | | | |
Net Assets | | $ | 45,443,842 | |
Shares Outstanding | | | 4,482,955 | |
Net Asset Value and Redemption Price Per Share | | | | |
(net assets ÷ shares of beneficial interest outstanding) | | $ | 10.14 | |
Maximum Offering Price Per Share | | | | |
(100 ÷ 95.25 of net asset value per share) | | $ | 10.65 | |
|
| Class I Shares | |
Net Assets | | $ | 15,883,023 | |
Shares Outstanding | | | 1,563,176 | |
Net Asset Value, Offering Price and Redemption Price Per Share | | | | |
(net assets ÷ shares of beneficial interest outstanding) | | $ | 10.16 | |
On sales of $50,000 or more, the offering price of Class A shares is reduced.
| | | | |
| | 7 | | See Notes to Financial Statements. |
Eaton Vance
Parametric Structured Absolute Return Fund
October 31, 2012
Statement of Operations
| | | | |
| Investment Income | | Year Ended
October 31, 2012 | |
Dividends allocated from Portfolio (net of foreign taxes, $26,031) | | $ | 335,993 | |
Interest allocated from Portfolio | | | 10,455 | |
Expenses allocated from Portfolio | | | (254,612 | ) |
Total investment income from Portfolio | | $ | 91,836 | |
| |
| Expenses | | | | |
Distribution and service fees | | | | |
Class A | | $ | 28,098 | |
Trustees’ fees and expenses | | | 542 | |
Custodian fee | | | 16,081 | |
Transfer and dividend disbursing agent fees | | | 23,376 | |
Legal and accounting services | | | 27,524 | |
Printing and postage | | | 25,068 | |
Registration fees | | | 70,427 | |
Miscellaneous | | | 8,952 | |
Total expenses | | $ | 200,068 | |
Deduct — | | | | |
Allocation of expenses to affiliates | | $ | 160,311 | |
Total expense reductions | | $ | 160,311 | |
| |
Net expenses | | $ | 39,757 | |
| |
Net investment income | | $ | 52,079 | |
| |
| Realized and Unrealized Gain (Loss) from Portfolio | | | | |
Net realized gain (loss) — | | | | |
Investment transactions | | $ | 307,964 | |
Financial futures contracts | | | (1,395,212 | ) |
Swap contracts | | | (281,628 | ) |
Foreign currency and forward foreign currency exchange contract transactions | | | 161,136 | |
Net realized loss | | $ | (1,207,740 | ) |
Change in unrealized appreciation (depreciation) — | | | | |
Investments (net of increase in accrued foreign capital gains taxes of $62) | | $ | 897,801 | |
Financial futures contracts | | | 763,243 | |
Swap contracts | | | (253,615 | ) |
Foreign currency and forward foreign currency exchange contracts | | | 15,551 | |
Net change in unrealized appreciation (depreciation) | | $ | 1,422,980 | |
| |
Net realized and unrealized gain | | $ | 215,240 | |
| |
Net increase in net assets from operations | | $ | 267,319 | |
| | | | |
| | 8 | | See Notes to Financial Statements. |
Eaton Vance
Parametric Structured Absolute Return Fund
October 31, 2012
Statements of Changes in Net Assets
| | | | | | | | |
| Increase (Decrease) in Net Assets | | Year Ended
October 31, 2012 | | | Period Ended
October 31, 2011(1) | |
From operations — | | | | | | | | |
Net investment income | | $ | 52,079 | | | $ | — | |
Net realized loss from investment transactions, financial futures contracts, swap contracts and foreign currency and forward foreign currency exchange contract transactions | | | (1,207,740 | ) | | | — | |
Net change in unrealized appreciation (depreciation) from investments, financial futures contracts, swap contracts, foreign currency and forward foreign currency exchange contracts | | | 1,422,980 | | | | — | |
Net increase in net assets from operations | | $ | 267,319 | | | $ | — | |
Transactions in shares of beneficial interest — | | | | | | | | |
Proceeds from sale of shares | | | | | | | | |
Class A | | $ | 50,716,001 | | | $ | — | |
Class I | | | 15,284,436 | | | | 1,000,000 | |
Cost of shares redeemed | | | | | | | | |
Class A | | | (5,374,626 | ) | | | — | |
Class I | | | (566,265 | ) | | | — | |
Net increase in net assets from Fund share transactions | | $ | 60,059,546 | | | $ | 1,000,000 | |
| | |
Net increase in net assets | | $ | 60,326,865 | | | $ | 1,000,000 | |
|
| Net Assets | |
At beginning of period | | $ | 1,000,000 | | | $ | — | |
At end of period | | $ | 61,326,865 | | | $ | 1,000,000 | |
|
Accumulated undistributed net investment income included in net assets | |
At end of period | | $ | 300,589 | | | $ | — | |
| (1) | The Fund commenced operations on October 31, 2011. |
| | | | |
| | 9 | | See Notes to Financial Statements. |
Eaton Vance
Parametric Structured Absolute Return Fund
October 31, 2012
Financial Highlights
| | | | |
| | | Class A | |
| | | Period Ended October 31, 2012(1) | |
Net asset value — Beginning of period | | $ | 10.000 | |
| |
| Income (Loss) From Operations | | | | |
Net investment loss(2) | | $ | (0.003 | ) |
Net realized and unrealized gain | | | 0.143 | |
| |
Total income from operations | | $ | 0.140 | |
| |
Net asset value — End of period | | $ | 10.140 | |
| |
Total Return(3) | | | 1.40 | %(4) |
| |
| Ratios/Supplemental Data | | | | |
Net assets, end of period (000’s omitted) | | $ | 45,444 | |
Ratios (as a percentage of average daily net assets): | | | | |
Expenses(5)(6) | | | 1.55 | %(7)(8) |
Net investment loss | | | (0.03 | )%(8) |
Portfolio Turnover of the Portfolio | | | 22 | %(9) |
| (1) | For the period from commencement of operations, December 9, 2011, to October 31, 2012. |
| (2) | Computed using average shares outstanding. |
| (3) | Returns are historical and are calculated by determining the percentage change in net asset value with all distributions reinvested and do not reflect the effect of sales charges. |
| (5) | Includes the Fund’s share of the Portfolio’s allocated expenses. |
| (6) | Excludes the effect of custody fee credits, if any, of less than 0.005%. |
| (7) | The investment adviser of the Portfolio subsidized certain operating expenses and the investment adviser and administrator of the Fund subsidized certain operating expenses (equal to 0.84% of average daily net assets for the period ended October 31, 2012). A portion of the subsidy was borne by the sub-adviser. Absent this subsidy, total return would have been lower. |
| (9) | For the Portfolio’s year ended October 31, 2012. |
| | | | |
| | 10 | | See Notes to Financial Statements. |
Eaton Vance
Parametric Structured Absolute Return Fund
October 31, 2012
Financial Highlights — continued
| | | | |
| | | Class I | |
| | | Year Ended
October 31, 2012 | |
Net asset value — Beginning of year | | $ | 10.000 | |
| |
| Income (Loss) From Operations | | | | |
Net investment income(1) | | $ | 0.062 | |
Net realized and unrealized gain | | | 0.098 | |
| |
Total income from operations | | $ | 0.160 | |
| |
Net asset value — End of year | | $ | 10.160 | |
| |
Total Return(2) | | | 1.60 | % |
| |
| Ratios/Supplemental Data | | | | |
Net assets, end of year (000’s omitted) | | $ | 15,883 | |
Ratios (as a percentage of average daily net assets): | | | | |
Expenses(3)(4) | | | 1.30 | %(5) |
Net investment income | | | 0.62 | % |
Portfolio Turnover of the Portfolio | | | 22 | % |
The Fund commenced operations on October 31, 2011. Financial Highlights for the period ended October 31, 2011 are not presented as there was no investment activity, distributions or change in net asset value per share in the period.
| (1) | Computed using average shares outstanding. |
| (2) | Returns are historical and are calculated by determining the percentage change in net asset value with all distributions reinvested. |
| (3) | Includes the Fund’s share of the Portfolio’s allocated expenses. |
| (4) | Excludes the effect of custody fee credits, if any, of less than 0.005%. |
| (5) | The investment adviser of the Portfolio subsidized certain operating expenses and the investment adviser and administrator of the Fund subsidized certain operating expenses (equal to 0.84% of average daily net assets for the year ended October 31, 2012). A portion of the subsidy was borne by the sub-adviser. Absent this subsidy, total return would have been lower. |
| | | | |
| | 11 | | See Notes to Financial Statements. |
Eaton Vance
Parametric Structured Absolute Return Fund
October 31, 2012
Notes to Financial Statements
1 Significant Accounting Policies
Eaton Vance Parametric Structured Absolute Return Fund (the Fund) is a non-diversified series of Eaton Vance Mutual Funds Trust (the Trust). The Trust is a Massachusetts business trust registered under the Investment Company Act of 1940, as amended (the 1940 Act), as an open-end management investment company. The Fund commenced operations on October 31, 2011. The Fund offers two classes of shares. Class A shares are generally sold subject to a sales charge imposed at time of purchase. Class I shares are sold at net asset value and are not subject to a sales charge. Each class represents a pro-rata interest in the Fund, but votes separately on class-specific matters and (as noted below) is subject to different expenses. Realized and unrealized gains and losses and net investment income and losses, other than class-specific expenses, are allocated daily to each class of shares based on the relative net assets of each class to the total net assets of the Fund. Each class of shares differs in its distribution plan and certain other class-specific expenses. The Fund invests all of its investable assets in interests in Parametric Structured Absolute Return Portfolio (the Portfolio), a Massachusetts business trust, having the same investment objective and policies as the Fund. The value of the Fund’s investment in the Portfolio reflects the Fund’s proportionate interest in the net assets of the Portfolio (23.3% at October 31, 2012). The performance of the Fund is directly affected by the performance of the Portfolio. The consolidated financial statements of the Portfolio, including the consolidated portfolio of investments, are included elsewhere in this report and should be read in conjunction with the Fund’s financial statements.
The following is a summary of significant accounting policies of the Fund. The policies are in conformity with accounting principles generally accepted in the United States of America.
A Investment Valuation — Valuation of securities by the Portfolio is discussed in Note 1A of the Portfolio’s Notes to Consolidated Financial Statements, which are included elsewhere in this report.
B Income — The Fund’s net investment income or loss consists of the Fund’s pro-rata share of the net investment income or loss of the Portfolio, less all actual and accrued expenses of the Fund.
C Federal Taxes — The Fund’s policy is to comply with the provisions of the Internal Revenue Code applicable to regulated investment companies and to distribute to shareholders each year substantially all of its net investment income, and all or substantially all of its net realized capital gains. Accordingly, no provision for federal income or excise tax is necessary.
At October 31, 2012, the Fund, for federal income tax purposes, had current year deferred capital losses of $668,417 which will reduce its taxable income arising from future net realized gains on investment transactions, if any, to the extent permitted by the Internal Revenue Code, and thus will reduce the amount of distributions to shareholders, which would otherwise be necessary to relieve the Fund of any liability for federal income or excise tax. The current year deferred capital losses are treated as arising on the first day of the Fund’s next taxable year.
In addition to the requirements of the Internal Revenue Code, the Fund may also be required to recognize its pro-rata share of the capital gains taxes incurred by the Portfolio. In doing so, the daily net asset value would reflect the Fund’s pro-rata share of the estimated reserve for such taxes incurred by the Portfolio.
As of October 31, 2012, the Fund had no uncertain tax positions that would require financial statement recognition, de-recognition, or disclosure. The Fund files a U.S. federal income tax return annually after its fiscal year-end, which is subject to examination by the Internal Revenue Service for a period of three years from the date of filing.
D Expenses — The majority of expenses of the Trust are directly identifiable to an individual fund. Expenses which are not readily identifiable to a specific fund are allocated taking into consideration, among other things, the nature and type of expense and the relative size of the funds.
E Expense Reduction — State Street Bank and Trust Company (SSBT) serves as custodian of the Fund. Pursuant to the custodian agreement, SSBT receives a fee reduced by credits, which are determined based on the average daily cash balance the Fund maintains with SSBT. All credit balances, if any, used to reduce the Fund’s custodian fees are reported as a reduction of expenses in the Statement of Operations.
F Use of Estimates — The preparation of the financial statements in conformity with accounting principles generally accepted in the United States of America requires management to make estimates and assumptions that affect the reported amounts of assets and liabilities at the date of the financial statements and the reported amounts of income and expense during the reporting period. Actual results could differ from those estimates.
G Indemnifications — Under the Trust’s organizational documents, its officers and Trustees may be indemnified against certain liabilities and expenses arising out of the performance of their duties to the Fund. Under Massachusetts law, if certain conditions prevail, shareholders of a Massachusetts business trust (such as the Trust) could be deemed to have personal liability for the obligations of the Trust. However, the Trust’s Declaration of Trust contains an express disclaimer of liability on the part of Fund shareholders and the By-laws provide that the Trust shall assume the defense on behalf of any Fund shareholders. Moreover, the By-laws also provide for indemnification out of Fund property of any shareholder held personally liable solely by reason of being or having been a shareholder for all loss or expense arising from such liability. Additionally, in the normal course of business, the Fund enters into agreements with service providers that may contain indemnification clauses. The Fund’s maximum exposure under these arrangements is unknown as this would involve future claims that may be made against the Fund that have not yet occurred.
H Other — Investment transactions are accounted for on a trade date basis. Dividends to shareholders are recorded on the ex-dividend date.
Eaton Vance
Parametric Structured Absolute Return Fund
October 31, 2012
Notes to Financial Statements — continued
2 Distributions to Shareholders
It is the present policy of the Fund to make at least one distribution annually (normally in December) of all or substantially all of its net investment income and to distribute annually all or substantially all of its net realized capital gains. Distributions are declared separately for each class of shares. Shareholders may reinvest income and capital gain distributions in additional shares of the same class of the Fund at the net asset value as of the ex-dividend date or, at the election of the shareholder, receive distributions in cash. The Fund distinguishes between distributions on a tax basis and a financial reporting basis. Accounting principles generally accepted in the United States of America require that only distributions in excess of tax basis earnings and profits be reported in the financial statements as a return of capital. Permanent differences between book and tax accounting relating to distributions are reclassified to paid-in capital. For tax purposes, distributions from short-term capital gains are considered to be from ordinary income.
During the year ended October 31, 2012, accumulated net realized loss was increased by $248,510 and accumulated undistributed net investment income was increased by $248,510 due to differences between book and tax accounting, primarily for swap contracts, investment in the Subsidiary, investments in passive foreign investment companies (PFICs) and foreign currency gain (loss). These reclassifications had no effect on the net assets or net asset value per share of the Fund.
As of October 31, 2012, the components of distributable earnings (accumulated losses) and unrealized appreciation (depreciation) on a tax basis were as follows:
| | | | |
Undistributed ordinary income | | $ | 308,441 | |
Deferred capital losses | | $ | (668,417 | ) |
Net unrealized appreciation | | $ | 627,295 | |
The differences between components of distributable earnings (accumulated losses) on a tax basis and the amounts reflected in the Statement of Assets and Liabilities are primarily due to wash sales, partnership allocations, futures contracts, foreign currency transactions and investments in PFICs.
3 Investment Adviser and Administration Fee and Other Transactions with Affiliates
The investment adviser and administration fee is earned by Eaton Vance Management (EVM) as compensation for investment advisory and administrative services rendered to the Fund. The fee is computed at an annual rate of 1.00% of the Fund’s average daily net assets that are not invested in other investment companies for which EVM or its affiliates serve as investment adviser or administrator (“Investable Assets”) up to $500 million, and is payable monthly. On Investable Assets of $500 million and over, the annual fee is reduced. Pursuant to a sub-advisory agreement, EVM pays Parametric Portfolio Associates LLC (Parametric), a majority-owned subsidiary of Eaton Vance Corp., a portion of its adviser and administration fee for sub-advisory services provided to the Fund. For the year ended October 31, 2012, the Fund incurred no adviser and administration fee on Investable Assets. To the extent the Fund’s assets are invested in the Portfolio, the Fund is allocated its share of the Portfolio’s adviser fee. The Portfolio has engaged Boston Management and Research (BMR), a subsidiary of EVM, to render investment advisory services. See Note 2 of the Portfolio’s Notes to Consolidated Financial Statements which are included elsewhere in this report.
EVM and Parametric have agreed to reimburse the Fund’s expenses to the extent that total annual operating expenses (relating to ordinary expenses only) exceed 1.55% and 1.30% of the Fund’s average daily net assets for Class A and Class I, respectively. This agreement may be changed or terminated after February 28, 2013. Pursuant to this agreement, EVM and Parametric were allocated $160,311 in total of the Fund’s operating expenses for the year ended October 31, 2012.
EVM serves as the sub-transfer agent of the Fund and receives from the transfer agent an aggregate fee based upon the actual expenses incurred by EVM in the performance of these services. For the year ended October 31, 2012, EVM earned $1,128 in sub-transfer agent fees. Eaton Vance Distributors, Inc. (EVD), an affiliate of EVM and the Fund’s principal underwriter, received distribution and service fees from Class A shares (see Note 4).
Trustees and officers of the Fund who are members of EVM’s or BMR’s organizations receive remuneration for their services to the Fund out of the investment adviser and administration fee. Certain officers and Trustees of the Fund and the Portfolio are officers of the above organizations.
4 Distribution Plan
The Fund has in effect a distribution plan for Class A shares (Class A Plan) pursuant to Rule 12b-1 under the 1940 Act. Pursuant to the Class A Plan, the Fund pays EVD a distribution and service fee of 0.25% per annum of its average daily net assets attributable to Class A shares for distribution services and facilities provided to the Fund by EVD, as well as for personal services and/or the maintenance of shareholder accounts. Distribution and service fees paid or accrued to EVD for the year ended October 31, 2012 amounted to $28,098 for Class A shares.
Eaton Vance
Parametric Structured Absolute Return Fund
October 31, 2012
Notes to Financial Statements — continued
5 Contingent Deferred Sales Charges
Class A shares may be subject to a 1% contingent deferred sales charge (CDSC) if redeemed within 18 months of purchase (depending on the circumstances of purchase). Generally, the CDSC is based upon the lower of the net asset value at date of redemption or date of purchase. No charge is levied on shares acquired by reinvestment of dividends or capital gain distributions. No CDSC is levied on shares which have been sold to EVM or its affiliates or to their respective employees or clients and may be waived under certain other limited conditions. For the year ended October 31, 2012, the Fund was informed that EVD received no CDSCs paid by Class A shareholders.
6 Investment Transactions
For the year ended October 31, 2012, increases and decreases in the Fund’s investment in the Portfolio aggregated $63,855,794 and $2,781,047, respectively.
7 Shares of Beneficial Interest
The Fund’s Declaration of Trust permits the Trustees to issue an unlimited number of full and fractional shares of beneficial interest (without par value). Such shares may be issued in a number of different series (such as the Fund) and classes. Transactions in Fund shares were as follows:
| | | | |
| Class A | | Period Ended
October 31, 2012(1) | |
| |
Sales | | | 5,014,015 | |
Redemptions | | | (531,060 | ) |
| |
Net increase | | | 4,482,955 | |
| | | | | | | | |
| Class I | | Year Ended
October 31, 2012 | | | Period Ended
October 31, 2011(2) | |
| | |
Sales | | | 1,519,088 | | | | 100,000 | |
Redemptions | | | (55,912 | ) | | | — | |
| | |
Net increase | | | 1,463,176 | | | | 100,000 | |
| (1) | Class A commenced operations on December 9, 2011. |
| (2) | Class I commenced operations on October 31, 2011. |
At October 31, 2012, an EVM retirement plan, accounts advised by EVM and pooled income funds (established and maintained by a public charity) managed by EVM owned in the aggregate approximately 77% of the value of the outstanding shares of the Fund.
Eaton Vance
Parametric Structured Absolute Return Fund
October 31, 2012
Report of Independent Registered Public Accounting Firm
To the Trustees of Eaton Vance Mutual Funds Trust and Shareholders of Eaton Vance Parametric Structured Absolute Return Fund:
We have audited the accompanying statement of assets and liabilities of Eaton Vance Parametric Structured Absolute Return Fund (the “Fund”) (one of the funds constituting Eaton Vance Mutual Funds Trust) as of October 31, 2012, and the related statement of operations and financial highlights for the year then ended, and the statements of changes in net assets for the year then ended and for the period of the start of business commencing on and ending on October 31, 2011. These financial statements and financial highlights are the responsibility of the Fund’s management. Our responsibility is to express an opinion on these financial statements and financial highlights based on our audits.
We conducted our audits in accordance with the standards of the Public Company Accounting Oversight Board (United States). Those standards require that we plan and perform the audit to obtain reasonable assurance about whether the financial statements are free of material misstatement. The Fund is not required to have, nor were we engaged to perform, an audit of its internal control over financial reporting. Our audits included consideration of internal control over financial reporting as a basis for designing audit procedures that are appropriate in the circumstances, but not for the purpose of expressing an opinion on the effectiveness of the Fund’s internal control over financial reporting. Accordingly, we express no such opinion. An audit also includes examining, on a test basis, evidence supporting the amounts and disclosures in the financial statements, assessing the accounting principles used and significant estimates made by management, as well as evaluating the overall financial statement presentation. We believe that our audits provide a reasonable basis for our opinion.
In our opinion, such financial statements referred to above present fairly, in all material respects, the financial position of Eaton Vance Parametric Structured Absolute Return Fund as of October 31, 2012, and the related statement of operations and financial highlights for the year then ended, and the statements of changes in net assets for the year then ended and for the period of the start of business commencing on and ending on October 31, 2011, in conformity with accounting principles generally accepted in the United States of America.
DELOITTE & TOUCHE LLP
Boston, Massachusetts
December 21, 2012
Eaton Vance
Parametric Structured Absolute Return Fund
October 31, 2012
Federal Tax Information (Unaudited)
The Form 1099-DIV you receive in January 2013 will show the tax status of all distributions paid to your account in calendar year 2012. Shareholders are advised to consult their own tax adviser with respect to the tax consequences of their investment in the Fund. As required by the Internal Revenue Code and/or regulations, shareholders must be notified regarding the status of qualified dividend income for individuals.
Qualified Dividend Income. The Fund designates approximately $307,266, or up to the maximum amount of such dividends allowable pursuant to the Internal Revenue Code, as qualified dividend income eligible for the reduced tax rate of 15%.
Parametric Structured Absolute Return Portfolio
October 31, 2012
Consolidated Portfolio of Investments
| | | | | | | | |
| Common Stocks — 57.4% | | | | | | | | |
| | |
| | | | | | | | |
| Security | | Shares | | | Value | |
| | | | | | | | |
| | |
Australia — 1.3% | | | | | | | | |
AGL Energy, Ltd. | | | 9,948 | | | $ | 150,024 | |
Amcor, Ltd. | | | 42,414 | | | | 347,468 | |
APA Group | | | 5,836 | | | | 31,237 | |
Australia and New Zealand Banking Group, Ltd. | | | 7,126 | | | | 187,993 | |
BHP Billiton, Ltd. | | | 7,559 | | | | 267,629 | |
Centro Retail Australia | | | 13,790 | | | | 30,746 | |
CFS Retail Property Trust Group | | | 14,691 | | | | 29,767 | |
Coca-Cola Amatil, Ltd. | | | 7,496 | | | | 104,582 | |
Commonwealth Bank of Australia | | | 6,130 | | | | 367,098 | |
Computershare, Ltd. | | | 3,083 | | | | 27,764 | |
Crown, Ltd. | | | 3,077 | | | | 31,013 | |
CSL, Ltd. | | | 3,282 | | | | 161,870 | |
GPT Group | | | 19,590 | | | | 72,343 | |
Harvey Norman Holdings, Ltd. | | | 17,218 | | | | 34,011 | |
James Hardie Industries SE CDI | | | 3,210 | | | | 30,706 | |
Metcash, Ltd. | | | 5,337 | | | | 20,273 | |
National Australia Bank, Ltd. | | | 6,574 | | | | 175,688 | |
Newcrest Mining, Ltd. | | | 566 | | | | 15,610 | |
Orica, Ltd. | | | 8,030 | | | | 209,172 | |
Origin Energy, Ltd. | | | 13,116 | | | | 154,390 | |
OZ Minerals, Ltd. | | | 4,155 | | | | 35,255 | |
Rio Tinto, Ltd. | | | 3,175 | | | | 187,184 | |
Sydney Airport | | | 9,194 | | | | 32,338 | |
Tabcorp Holdings, Ltd. | | | 6,320 | | | | 18,612 | |
Tatts Group, Ltd. | | | 6,146 | | | | 17,850 | |
Telstra Corp., Ltd. | | | 28,826 | | | | 123,880 | |
Transurban Group | | | 31,140 | | | | 196,542 | |
Wesfarmers, Ltd. | | | 728 | | | | 26,244 | |
Westfield Group | | | 2,794 | | | | 30,885 | |
Westfield Retail Trust | | | 9,680 | | | | 31,083 | |
Westpac Banking Corp. | | | 6,498 | | | | 171,794 | |
Woodside Petroleum, Ltd. | | | 1,713 | | | | 61,079 | |
Woolworths, Ltd. | | | 5,596 | | | | 170,688 | |
| | | | | | | | | |
| | | | | | $ | 3,552,818 | |
| | | | | | | | | |
| | |
Austria — 0.3% | | | | | | | | |
Andritz AG | | | 496 | | | $ | 29,888 | |
Immofinanz AG(1) | | | 19,776 | | | | 76,445 | |
OMV AG | | | 6,899 | | | | 252,471 | |
Raiffeisen Bank International AG | | | 6,252 | | | | 250,429 | |
Telekom Austria AG | | | 3,434 | | | | 21,634 | |
Verbund AG | | | 3,498 | | | | 81,565 | |
Vienna Insurance Group | | | 448 | | | | 19,250 | |
| | | | | | | | | |
| | | | | | $ | 731,682 | |
| | | | | | | | | |
| | | | | | | | |
| Security | | Shares | | | Value | |
| | | | | | | | |
| | |
Belgium — 0.7% | | | | | | | | |
Anheuser-Busch InBev NV | | | 8,589 | | | $ | 718,307 | |
Belgacom SA | | | 6,195 | | | | 181,118 | |
Colruyt SA | | | 3,740 | | | | 170,986 | |
Delhaize Group SA | | | 682 | | | | 26,112 | |
Groupe Bruxelles Lambert SA | | | 3,417 | | | | 252,617 | |
Mobistar SA | | | 842 | | | | 22,265 | |
Solvay SA | | | 1,339 | | | | 161,218 | |
UCB SA | | | 2,896 | | | | 169,148 | |
Umicore SA | | | 2,839 | | | | 145,892 | |
| | | | | | | | | |
| | | | | | $ | 1,847,663 | |
| | | | | | | | | |
| | |
Brazil — 1.4% | | | | | | | | |
AES Tiete SA, PFC Shares | | | 3,300 | | | $ | 37,484 | |
All America Latina Logistica SA (Units) | | | 11,200 | | | | 50,953 | |
Banco do Brasil SA | | | 13,000 | | | | 138,702 | |
Banco Santander Brasil SA ADR | | | 16,000 | | | | 108,800 | |
BM&F Bovespa SA | | | 22,200 | | | | 142,094 | |
BR Malls Participacoes SA | | | 7,900 | | | | 103,853 | |
Bradespar SA, PFC Shares | | | 2,500 | | | | 36,927 | |
CCX Carvao da Colombia SA(1) | | | 1,500 | | | | 1,625 | |
Centrais Eletricas Brasileiras SA, Class B, PFC Shares | | | 5,400 | | | | 42,938 | |
Cia de Companhia de Concessoes Rodoviarias (CCR) | | | 12,900 | | | | 113,436 | |
Cia de Saneamento Basico do Estado de Sao Paulo ADR | | | 700 | | | | 58,807 | |
Cia de Saneamento de Minas Gerais SA ADR | | | 7,200 | | | | 86,328 | |
Cia de Saneamento de Minas Gerais-Copasa MG | | | 1,500 | | | | 35,405 | |
Cia Energetica de Sao Paulo, PFC Shares | | | 4,800 | | | | 43,130 | |
Cia Hering | | | 4,100 | | | | 94,191 | |
Cia Paranaense de Energia ADR | | | 2,500 | | | | 36,900 | |
Cia Siderurgica Nacional SA ADR | | | 7,900 | | | | 42,976 | |
Cielo SA | | | 4,020 | | | | 99,458 | |
CPFL Energia SA ADR | | | 2,100 | | | | 48,909 | |
Diagnosticos da America SA | | | 11,900 | | | | 79,097 | |
Embraer SA ADR | | | 2,000 | | | | 55,820 | |
Estacio Participacoes SA | | | 4,600 | | | | 87,649 | |
Gerdau SA ADR | | | 6,800 | | | | 59,772 | |
Iochpe-Maxion SA | | | 2,500 | | | | 30,649 | |
Itau Unibanco Holding SA ADR, PFC Shares | | | 17,900 | | | | 260,982 | |
Light SA | | | 2,200 | | | | 23,667 | |
Lojas Americanas SA, PFC Shares | | | 11,865 | | | | 99,311 | |
Lojas Renner SA | | | 3,500 | | | | 129,588 | |
Marcopolo SA, PFC Shares | | | 5,700 | | | | 33,425 | |
MPX Energia SA(1) | | | 4,500 | | | | 23,773 | |
Natura Cosmeticos SA | | | 4,000 | | | | 106,644 | |
OGX Petroleo e Gas Participacoes SA(1) | | | 13,100 | | | | 30,379 | |
Oi SA ADR | | | 18,499 | | | | 73,996 | |
PDG Realty SA Empreendimentos e Participacoes | | | 56,300 | | | | 94,801 | |
| | | | |
| | 17 | | See Notes to Consolidated Financial Statements. |
Parametric Structured Absolute Return Portfolio
October 31, 2012
Consolidated Portfolio of Investments — continued
| | | | | | | | |
| Security | | Shares | | | Value | |
| | | | | | | | |
| | |
Brazil (continued) | | | | | | | | |
Petroleo Brasileiro SA ADR | | | 20,100 | | | $ | 426,321 | |
Raia Drogasil SA | | | 7,800 | | | | 85,832 | |
Randon Participacoes SA, PFC Shares | | | 3,400 | | | | 17,979 | |
Tim Participacoes SA ADR | | | 2,900 | | | | 50,402 | |
Totvs SA | | | 2,000 | | | | 40,669 | |
Tractebel Energia SA | | | 2,900 | | | | 49,974 | |
Ultrapar Participacoes SA | | | 2,900 | | | | 60,826 | |
Vale SA ADR | | | 18,500 | | | | 338,920 | |
Weg SA | | | 3,600 | | | | 41,352 | |
| | | | | | | | | |
| | | | | | $ | 3,624,744 | |
| | | | | | | | | |
| | |
Chile — 0.7% | | | | | | | | |
Administradora de Fondos de Pensiones Provida SA | | | 5,100 | | | $ | 36,166 | |
Aguas Andinas SA, Series A | | | 57,700 | | | | 38,722 | |
Antarchile SA, Series A | | | 3,000 | | | | 47,044 | |
Banco de Chile | | | 671,209 | | | | 100,148 | |
Banco de Credito e Inversiones | | | 1,213 | | | | 78,152 | |
Banco Santander Chile SA ADR | | | 4,156 | | | | 113,002 | |
Cap SA | | | 1,500 | | | | 51,710 | |
Cencosud SA | | | 18,600 | | | | 101,514 | |
Cia Cervecerias Unidas SA | | | 2,400 | | | | 34,916 | |
Cia Cervecerias Unidas SA ADR | | | 200 | | | | 14,186 | |
Cia General de Electricidad SA | | | 6,200 | | | | 31,957 | |
Colbun SA(1) | | | 111,100 | | | | 30,997 | |
Corpbanca SA | | | 3,255,600 | | | | 42,594 | |
Embotelladora Andina SA, Class B, PFC Shares | | | 4,800 | | | | 30,327 | |
Empresa Nacional de Electricidad SA | | | 52,100 | | | | 83,865 | |
Empresa Nacional de Electricidad SA ADR | | | 400 | | | | 19,148 | |
Empresas CMPC SA | | | 24,300 | | | | 93,180 | |
Empresas Copec SA | | | 8,500 | | | | 121,931 | |
Enersis SA | | | 212,300 | | | | 72,671 | |
Enersis SA ADR | | | 1,100 | | | | 18,634 | |
ENTEL SA | | | 2,300 | | | | 46,846 | |
Latam Airlines Group SA | | | 3,700 | | | | 90,779 | |
Latam Airlines Group SA ADR | | | 1,300 | | | | 32,227 | |
Parque Arauco SA | | | 19,300 | | | | 44,083 | |
Ripley Corp. SA | | | 17,800 | | | | 16,796 | |
S.A.C.I. Falabella SA | | | 17,100 | | | | 175,389 | |
Salfacorp SA | | | 14,400 | | | | 33,999 | |
Sigdo Koppers SA | | | 16,400 | | | | 39,368 | |
Sociedad Quimica y Minera de Chile SA, Series B ADR | | | 1,700 | | | | 98,345 | |
Sonda SA | | | 18,800 | | | | 57,594 | |
Vina Concha y Toro SA | | | 16,500 | | | | 33,367 | |
| | | | | | | | | |
| | | | | | $ | 1,829,657 | |
| | | | | | | | | |
| | | | | | | | |
| Security | | Shares | | | Value | |
| | | | | | | | |
| | |
China — 2.1% | | | | | | | | |
AAC Technologies Holdings, Inc. | | | 18,000 | | | $ | 64,436 | |
Agricultural Bank of China, Ltd., Class H | | | 268,000 | | | | 115,127 | |
Air China, Ltd., Class H | | | 80,000 | | | | 56,525 | |
Anhui Conch Cement Co., Ltd., Class H | | | 37,500 | | | | 128,804 | |
Baidu, Inc. ADR(1) | | | 2,500 | | | | 266,550 | |
Bank of Communications, Ltd., Class H | | | 146,000 | | | | 104,094 | |
Beijing Enterprises Holdings, Ltd. | | | 8,000 | | | | 51,670 | |
Brilliance China Automotive Holdings, Ltd.(1) | | | 48,000 | | | | 59,310 | |
BYD Co., Ltd., Class H(1) | | | 8,000 | | | | 15,701 | |
China CITIC Bank Corp., Ltd., Class H | | | 181,000 | | | | 91,966 | |
China Coal Energy Co., Class H | | | 145,000 | | | | 143,475 | |
China Communications Construction Co., Ltd., Class H | | | 72,000 | | | | 67,389 | |
China Construction Bank Corp., Class H | | | 530,000 | | | | 398,003 | |
China Eastern Airlines Corp., Ltd., Class H(1) | | | 132,000 | | | | 45,853 | |
China Life Insurance Co., Ltd., Class H | | | 66,000 | | | | 194,074 | |
China Longyuan Power Group Corp., Class H | | | 86,000 | | | | 55,891 | |
China Mengniu Dairy Co., Ltd. | | | 18,000 | | | | 54,435 | |
China Merchants Bank Co., Ltd., Class H | | | 52,500 | | | | 97,546 | |
China Merchants Holdings (International) Co., Ltd. | | | 16,000 | | | | 52,780 | |
China Minsheng Banking Corp, Ltd., Class H | | | 116,500 | | | | 105,660 | |
China Mobile, Ltd. | | | 55,500 | | | | 615,233 | |
China National Building Material Co., Ltd., Class H | | | 122,000 | | | | 154,410 | |
China Overseas Land & Investment, Ltd. | | | 42,000 | | | | 109,900 | |
China Pacific Insurance (Group) Co., Ltd., Class H | | | 32,400 | | | | 101,227 | |
China Resources Enterprise, Ltd. | | | 16,000 | | | | 52,148 | |
China Resources Power Holdings Co., Ltd. | | | 38,000 | | | | 81,645 | |
China Telecom Corp., Ltd., Class H | | | 174,000 | | | | 102,724 | |
China Yurun Food Group, Ltd.(1) | | | 47,000 | | | | 34,287 | |
Citic Pacific, Ltd. | | | 30,000 | | | | 38,099 | |
Ctrip.com International, Ltd. ADR(1) | | | 3,800 | | | | 76,038 | |
Digital China Holdings, Ltd. | | | 32,000 | | | | 53,559 | |
Dongfeng Motor Group Co., Ltd., Class H | | | 40,000 | | | | 49,472 | |
Focus Media Holding, Ltd. ADR | | | 2,000 | | | | 47,160 | |
Guangdong Investment, Ltd. | | | 52,000 | | | | 42,514 | |
Guangzhou Automobile Group Co., Ltd., Class H | | | 60,000 | | | | 41,085 | |
Home Inns & Hotels Management, Inc. ADR(1) | | | 1,100 | | | | 32,395 | |
Inner Mongolia Eerduosi Cashmere Products Co., Ltd., Class B | | | 110,200 | | | | 96,687 | |
Inner Mongolia Yitai Coal Co., Ltd., Class B | | | 21,200 | | | | 115,094 | |
Jiangxi Copper Co., Ltd., Class H | | | 55,000 | | | | 141,314 | |
Kunlun Energy Co., Ltd. | | | 86,000 | | | | 159,193 | |
Lenovo Group, Ltd. | | | 78,000 | | | | 62,553 | |
Lianhua Supermarket Holdings Ltd., Class H | | | 21,000 | | | | 16,949 | |
Mindray Medical International, Ltd. ADR | | | 800 | | | | 27,208 | |
NetEase.com, Inc. ADR(1) | | | 1,100 | | | | 59,400 | |
New Oriental Education & Technology Group, Inc. ADR | | | 7,100 | | | | 119,706 | |
NVC Lighting Holdings, Ltd. | | | 63,000 | | | | 16,605 | |
| | | | |
| | 18 | | See Notes to Consolidated Financial Statements. |
Parametric Structured Absolute Return Portfolio
October 31, 2012
Consolidated Portfolio of Investments — continued
| | | | | | | | |
| Security | | Shares | | | Value | |
| | | | | | | | |
| | |
China (continued) | | | | | | | | |
Parkson Retail Group, Ltd. | | | 41,000 | | | $ | 34,571 | |
PICC Property & Casualty Co., Ltd., Class H | | | 80,000 | | | | 105,908 | |
Ports Design, Ltd. | | | 39,000 | | | | 27,702 | |
Shandong Weigao Group Medical Polymer Co., Ltd., Class H | | | 24,000 | | | | 32,367 | |
SINA Corp.(1) | | | 1,300 | | | | 71,019 | |
Sino Biopharmaceutical, Ltd. | | | 96,000 | | | | 38,326 | |
Sinopharm Group Co., Ltd., Class H | | | 9,600 | | | | 32,232 | |
Sinotrans Shipping, Ltd. | | | 74,000 | | | | 18,185 | |
Sohu.com, Inc.(1) | | | 1,600 | | | | 60,768 | |
Sound Global, Ltd. | | | 68,000 | | | | 28,014 | |
Suntech Power Holdings Co., Ltd. ADR(1) | | | 74,500 | | | | 60,345 | |
Tingyi (Cayman Islands) Holding Corp. | | | 22,000 | | | | 65,319 | |
Tsingtao Brewery Co., Ltd., Class H | | | 8,000 | | | | 43,156 | |
Want Want China Holdings, Ltd. | | | 61,000 | | | | 83,047 | |
Weichai Power Co., Ltd., Class H | | | 15,200 | | | | 53,586 | |
WuXi PharmaTech (Cayman), Inc. ADR(1) | | | 1,900 | | | | 26,961 | |
Yangzijiang Shipbuilding Holdings, Ltd. | | | 61,000 | | | | 44,985 | |
Yanzhou Coal Mining Co., Ltd., Class H | | | 86,000 | | | | 128,194 | |
Zhongsheng Group Holdings, Ltd. | | | 17,000 | | | | 21,832 | |
ZTE Corp., Class H | | | 37,400 | | | | 52,440 | |
| | | | | | | | | |
| | | $ | 5,644,851 | |
| | | | | | | | | |
| | |
Colombia — 0.4% | | | | | | | | |
Almacenes Exito SA | | | 6,100 | | | $ | 116,288 | |
Banco de Bogota | | | 1,300 | | | | 38,679 | |
Bancolombia SA ADR, PFC Shares | | | 2,100 | | | | 134,442 | |
Cia Colombiana de Inversiones SA | | | 14,300 | | | | 42,546 | |
Ecopetrol SA | | | 55,100 | | | | 163,937 | |
Empresa de Energia de Bogota SA | | | 29,900 | | | | 21,383 | |
Grupo Aval Acciones y Valores SA | | | 56,100 | | | | 39,814 | |
Grupo Aval Acciones y Valores SA, PFC Shares | | | 61,500 | | | | 43,479 | |
Grupo de Inversiones Suramericana | | | 3,600 | | | | 70,280 | |
Grupo Nutresa SA | | | 7,200 | | | | 96,301 | |
Grupo Odinsa SA | | | 3,356 | | | | 17,570 | |
Interconexion Electrica SA | | | 12,300 | | | | 66,611 | |
Inversiones Argos SA | | | 4,700 | | | | 53,728 | |
Inversiones Argos SA, PFC Shares | | | 2,500 | | | | 27,842 | |
ISAGEN SA ESP | | | 31,400 | | | | 44,055 | |
| | | | | | | | | |
| | | | | | $ | 976,955 | |
| | | | | | | | | |
| | |
Czech Republic — 0.3% | | | | | | | | |
CEZ AS | | | 12,000 | | | $ | 443,452 | |
Komercni Banka AS | | | 1,110 | | | | 227,140 | |
New World Resources PLC, Class A | | | 15,550 | | | | 66,709 | |
Pegas Nonwovens SA | | | 3,630 | | | | 83,421 | |
Unipetrol AS(1) | | | 8,100 | | | | 70,306 | |
| | | | | | | | | |
| | | | | | $ | 891,028 | |
| | | | | | | | | |
| | | | | | | | |
| Security | | Shares | | | Value | |
| | | | | | | | |
| | |
Denmark — 0.8% | | | | | | | | |
A.P. Moller – Maersk A/S, Class A | | | 17 | | | $ | 112,639 | |
A.P. Moller – Maersk A/S, Class B | | | 20 | | | | 139,593 | |
Carlsberg A/S, Class B | | | 150 | | | | 12,948 | |
Coloplast A/S | | | 1,437 | | | | 315,200 | |
Danske Bank A/S(1) | | | 2,209 | | | | 34,557 | |
DSV A/S | | | 6,961 | | | | 156,581 | |
Novo Nordisk A/S, Class B | | | 4,709 | | | | 754,925 | |
Novozymes A/S, Class B | | | 9,565 | | | | 264,271 | |
TDC A/S | | | 6,980 | | | | 48,125 | |
Tryg A/S | | | 1,451 | | | | 94,741 | |
William Demant Holding A/S(1) | | | 978 | | | | 84,112 | |
| | | | | | | | | |
| | | | | | $ | 2,017,692 | |
| | | | | | | | | |
| | |
Egypt — 0.4% | | | | | | | | |
Alexandria Mineral Oils Co. | | | 3,300 | | | $ | 42,106 | |
Amer Group Holding(1) | | | 188,800 | | | | 22,262 | |
Commercial International Bank | | | 26,300 | | | | 163,330 | |
Eastern Tobacco | | | 2,550 | | | | 38,827 | |
Egypt Kuwaiti Holding Co. | | | 35,600 | | | | 44,895 | |
Egyptian Financial Group-Hermes Holding SAE(1) | | | 25,300 | | | | 48,293 | |
Egyptian International Pharmaceutical Industrial Co. | | | 6,300 | | | | 40,447 | |
El Sewedy Cables Holding Co. | | | 2,000 | | | | 8,709 | |
Ezz Steel | | | 23,000 | | | | 38,422 | |
Juhayna Food Industries | | | 47,300 | | | | 51,115 | |
Orascom Construction Industries (OCI) | | | 4,000 | | | | 168,197 | |
Orascom Telecom Holding SAE(1) | | | 190,500 | | | | 112,140 | |
Orascom Telecom Media and Technology Holding SAE | | | 173,500 | | | | 17,035 | |
Sidi Kerir Petrochemicals Co. | | | 16,100 | | | | 35,105 | |
Talaat Moustafa Group(1) | | | 57,300 | | | | 44,781 | |
Telecom Egypt | | | 24,800 | | | | 56,039 | |
| | | | | | | | | |
| | | | | | $ | 931,703 | |
| | | | | | | | | |
| | |
Finland — 0.6% | | | | | | | | |
Elisa Oyj | | | 6,836 | | | $ | 146,693 | |
Fortum Oyj | | | 5,542 | | | | 102,571 | |
Kesko Oyj, Class B | | | 860 | | | | 26,893 | |
Kone Oyj, Class B | | | 5,420 | | | | 388,663 | |
Nokia Oyj | | | 17,747 | | | | 47,713 | |
Nokian Renkaat Oyj | | | 3,771 | | | | 157,050 | |
Orion Oyj, Class B | | | 5,086 | | | | 125,846 | |
Pohjola Bank PLC, Class A | | | 3,625 | | | | 49,450 | |
Sampo Oyj | | | 6,020 | | | | 188,748 | |
Stora Enso Oyj | | | 7,820 | | | | 49,466 | |
UPM-Kymmene Oyj | | | 1,212 | | | | 13,013 | |
Wartsila Oyj | | | 4,418 | | | | 178,918 | |
| | | | | | | | | |
| | | $ | 1,475,024 | |
| | | | | | | | | |
| | | | |
| | 19 | | See Notes to Consolidated Financial Statements. |
Parametric Structured Absolute Return Portfolio
October 31, 2012
Consolidated Portfolio of Investments — continued
| | | | | | | | |
| Security | | Shares | | | Value | |
| | | | | | | | |
| | |
France — 1.3% | | | | | | | | |
Air Liquide SA | | | 3,948 | | | $ | 466,069 | |
Alcatel-Lucent(1) | | | 131,667 | | | | 134,627 | |
Carrefour SA | | | 2,148 | | | | 51,876 | |
Compagnie Generale des Etablissements Michelin, Class B | | | 1,920 | | | | 165,513 | |
Dassault Systemes SA | | | 1,901 | | | | 200,563 | |
Essilor International SA | | | 1,948 | | | | 175,658 | |
Eutelsat Communications SA | | | 3,857 | | | | 123,504 | |
France Telecom SA | | | 3,371 | | | | 37,679 | |
GDF Suez | | | 6,952 | | | | 159,565 | |
Iliad SA | | | 189 | | | | 29,124 | |
Imerys SA | | | 706 | | | | 39,718 | |
L’Oreal SA | | | 4,264 | | | | 543,436 | |
LVMH Moet Hennessy Louis Vuitton SA | | | 2,699 | | | | 438,806 | |
Natixis | | | 8,696 | | | | 28,541 | |
PPR SA | | | 148 | | | | 26,091 | |
Safran SA | | | 2,605 | | | | 103,767 | |
Sanofi | | | 2,359 | | | | 207,185 | |
SES SA | | | 2,365 | | | | 65,463 | |
Societe BIC SA | | | 1,002 | | | | 122,268 | |
Sodexo | | | 875 | | | | 67,406 | |
Suez Environnement Co. SA | | | 2,287 | | | | 24,278 | |
Thales SA | | | 520 | | | | 18,305 | |
Total SA | | | 1,640 | | | | 82,607 | |
Unibail-Rodamco SE | | | 90 | | | | 20,271 | |
| | | | | | | | | |
| | | $ | 3,332,320 | |
| | | | | | | | | |
| | |
Germany — 1.3% | | | | | | | | |
Adidas AG | | | 1,161 | | | $ | 98,960 | |
Bayerische Motoren Werke AG | | | 2,599 | | | | 207,779 | |
Bayerische Motoren Werke AG, PFC Shares | | | 1,948 | | | | 107,916 | |
Beiersdorf AG | | | 2,859 | | | | 207,991 | |
Brenntag AG | | | 228 | | | | 28,769 | |
Continental AG | | | 775 | | | | 78,004 | |
Daimler AG | | | 3,264 | | | | 152,902 | |
Deutsche Lufthansa AG | | | 1,799 | | | | 27,523 | |
Deutsche Post AG | | | 6,942 | | | | 137,632 | |
Deutsche Telekom AG | | | 7,347 | | | | 83,818 | |
E.ON AG | | | 1,092 | | | | 24,859 | |
Fraport AG | | | 277 | | | | 16,255 | |
Fresenius Medical Care AG & Co. KGaA | | | 261 | | | | 18,339 | |
Hannover Rueckversicherung AG | | | 560 | | | | 39,454 | |
Henkel AG & Co. KGaA | | | 1,706 | | | | 110,462 | |
Henkel AG & Co. KGaA, PFC Shares | | | 2,203 | | | | 176,147 | |
Linde AG | | | 2,164 | | | | 364,163 | |
Porsche Automobil Holding SE, PFC Shares | | | 486 | | | | 32,394 | |
SAP AG | | | 11,713 | | | | 854,147 | |
| | | | | | | | |
| Security | | Shares | | | Value | |
| | | | | | | | |
| | |
Germany (continued) | | | | | | | | |
Siemens AG | | | 2,409 | | | $ | 242,728 | |
United Internet AG | | | 5,941 | | | | 118,891 | |
Volkswagen AG | | | 97 | | | | 18,969 | |
Volkswagen AG, PFC Shares | | | 846 | | | | 175,651 | |
| | | | | | | | | |
| | | | | | $ | 3,323,753 | |
| | | | | | | | | |
| | |
Greece — 0.1% | | | | | | | | |
Coca-Cola Hellenic Bottling Co. SA(1) | | | 3,475 | | | $ | 74,424 | |
OPAP SA | | | 14,989 | | | | 95,805 | |
| | | | | | | | | |
| | | | | | $ | 170,229 | |
| | | | | | | | | |
| | |
Hong Kong — 1.0% | | | | | | | | |
Bank of East Asia, Ltd. | | | 32,200 | | | $ | 118,748 | |
BOC Hong Kong (Holdings), Ltd. | | | 71,500 | | | | 219,683 | |
Cathay Pacific Airways, Ltd. | | | 53,000 | | | | 95,993 | |
Cheung Kong Infrastructure Holdings, Ltd. | | | 25,000 | | | | 146,633 | |
CLP Holdings, Ltd. | | | 24,000 | | | | 204,489 | |
Hang Lung Group, Ltd. | | | 5,000 | | | | 29,457 | |
Hang Seng Bank, Ltd. | | | 27,000 | | | | 414,167 | |
Hong Kong & China Gas Co., Ltd. | | | 117,800 | | | | 313,473 | |
Hopewell Holdings, Ltd. | | | 23,500 | | | | 84,781 | |
Link REIT (The) | | | 84,500 | | | | 419,366 | |
MTR Corp., Ltd. | | | 40,500 | | | | 157,455 | |
Power Assets Holdings, Ltd. | | | 38,500 | | | | 327,155 | |
Wing Hang Bank, Ltd. | | | 6,500 | | | | 68,847 | |
| | | | | | | | | |
| | | | | | $ | 2,600,247 | |
| | | | | | | | | |
| | |
Hungary — 0.3% | | | | | | | | |
EGIS Pharmaceuticals PLC | | | 340 | | | $ | 27,362 | |
FHB Mortgage Bank Rt.(1) | | | 3,500 | | | | 7,621 | |
Magyar Telekom Rt. | | | 66,340 | | | | 123,106 | |
MOL Hungarian Oil & Gas Rt. | | | 3,020 | | | | 262,707 | |
OTP Bank Rt. | | | 13,220 | | | | 251,939 | |
Richter Gedeon Rt. | | | 1,250 | | | | 232,729 | |
| | | | | | | | | |
| | | | | | $ | 905,464 | |
| | | | | | | | | |
| | |
India — 0.1% | | | | | | | | |
Dr. Reddy’s Laboratories, Ltd. ADR | | | 1,500 | | | $ | 48,810 | |
Infosys, Ltd. ADR | | | 6,800 | | | | 295,256 | |
| | | | | | | | | |
| | | | | | $ | 344,066 | |
| | | | | | | | | |
| | |
Indonesia — 0.7% | | | | | | | | |
Adaro Energy Tbk PT | | | 287,500 | | | $ | 40,773 | |
AKR Corporindo Tbk PT | | | 76,500 | | | | 35,244 | |
| | | | |
| | 20 | | See Notes to Consolidated Financial Statements. |
Parametric Structured Absolute Return Portfolio
October 31, 2012
Consolidated Portfolio of Investments — continued
| | | | | | | | |
| Security | | Shares | | | Value | |
| | | | | | | | |
| | |
Indonesia (continued) | | | | | | | | |
Bank Central Asia Tbk PT | | | 146,000 | | | $ | 124,255 | |
Bank Mandiri Tbk PT | | | 128,000 | | | | 109,348 | |
Bank Negara Indonesia Persero Tbk PT | | | 133,000 | | | | 53,069 | |
Bank Pembangunan Daerah Jawa Barat Dan Banten Tbk PT | | | 358,000 | | | | 40,782 | |
Bank Rakyat Indonesia Tbk PT | | | 145,500 | | | | 111,498 | |
Bumi Resources Tbk PT | | | 560,000 | | | | 38,225 | |
Energi Mega Persada Tbk PT(1) | | | 1,737,000 | | | | 16,339 | |
Gudang Garam Tbk PT | | | 19,500 | | | | 99,437 | |
Indo Tambangraya Megah Tbk PT | | | 11,000 | | | | 46,321 | |
Indocement Tunggal Prakarsa Tbk PT | | | 41,000 | | | | 91,004 | |
Indofood Sukses Makmur Tbk PT | | | 153,500 | | | | 90,824 | |
Jasa Marga Tbk PT | | | 52,500 | | | | 31,616 | |
Kalbe Farma Tbk PT | | | 645,000 | | | | 64,980 | |
Lippo Karawaci Tbk PT | | | 274,500 | | | | 26,490 | |
Media Nusantara Citra Tbk PT | | | 120,000 | | | | 35,192 | |
Perusahaan Gas Negara Tbk PT | | | 206,500 | | | | 99,596 | |
Perusahaan Perkebunan London Sumatra Indonesia Tbk PT | | | 204,500 | | | | 49,276 | |
Semen Gresik (Persero) Tbk PT | | | 64,000 | | | | 98,946 | |
Surya Semesta Internusa Tbk PT | | | 462,500 | | | | 56,557 | |
Tambang Batubara Bukit Asam Tbk PT | | | 30,500 | | | | 50,583 | |
Telekomunikasi Indonesia Tbk PT | | | 202,000 | | | | 205,163 | |
Unilever Indonesia Tbk PT | | | 41,500 | | | | 112,242 | |
United Tractors Tbk PT | | | 37,000 | | | | 80,789 | |
XL Axiata Tbk PT | | | 76,000 | | | | 54,065 | |
| | | | | | | | | |
| | | | | | $ | 1,862,614 | |
| | | | | | | | | |
| | |
Ireland — 0.4% | | | | | | | | |
Accenture PLC, Class A | | | 4,815 | | | $ | 324,579 | |
CRH PLC | | | 8,775 | | | | 163,335 | |
Elan Corp. PLC(1) | | | 9,358 | | | | 101,844 | |
Kerry Group PLC, Class A | | | 7,880 | | | | 411,977 | |
| | | | | | | | | |
| | | | | | $ | 1,001,735 | |
| | | | | | | | | |
| | |
Israel — 0.5% | | | | | | | | |
Bank Hapoalim B.M.(1) | | | 33,193 | | | $ | 130,584 | |
Bank Leumi Le-Israel B.M.(1) | | | 37,387 | | | | 120,508 | |
Bezeq Israeli Telecommunication Corp., Ltd. | | | 32,974 | | | | 40,172 | |
Delek Group, Ltd. | | | 104 | | | | 19,776 | |
Elbit Systems, Ltd. | | | 1,930 | | | | 67,900 | |
Israel Chemicals, Ltd. | | | 6,130 | | | | 76,690 | |
Israel Corp., Ltd. | | | 132 | | | | 89,703 | |
Mellanox Technologies, Ltd. (1) | | | 1,757 | | | | 132,596 | |
Mizrahi Tefahot Bank, Ltd.(1) | | | 7,531 | | | | 68,385 | |
NICE Systems, Ltd.(1) | | | 3,684 | | | | 123,056 | |
Teva Pharmaceutical Industries, Ltd. ADR | | | 9,839 | | | | 397,693 | |
| | | | | | | | | |
| | | | | | $ | 1,267,063 | |
| | | | | | | | | |
| | | | | | | | |
| Security | | Shares | | | Value | |
| | | | | | | | |
| | |
Italy — 0.8% | | | | | | | | |
Atlantia SpA | | | 3,644 | | | $ | 60,272 | |
Autogrill SpA | | | 5,154 | | | | 52,758 | |
Enel Green Power SpA | | | 7,388 | | | | 12,583 | |
Enel SpA | | | 5,639 | | | | 21,235 | |
ENI SpA | | | 37,291 | | | | 858,100 | |
Luxottica Group SpA | | | 4,080 | | | | 155,725 | |
Pirelli & C. SpA | | | 15,972 | | | | 185,541 | |
Saipem SpA | | | 4,323 | | | | 194,790 | |
Snam Rete Gas SpA | | | 64,096 | | | | 284,032 | |
Telecom Italia SpA | | | 13,750 | | | | 12,686 | |
Telecom Italia SpA, PFC Shares | | | 67,529 | | | | 54,075 | |
Tenaris SA | | | 2,360 | | | | 44,237 | |
Terna Rete Elettrica Nazionale SpA | | | 55,693 | | | | 209,394 | |
| | | | | | | | | |
| | | | | | $ | 2,145,428 | |
| | | | | | | | | |
|
Japan — 2.3% | |
ABC-Mart, Inc. | | | 1,500 | | | $ | 65,785 | |
Air Water, Inc. | | | 3,000 | | | | 37,591 | |
All Nippon Airways Co., Ltd. | | | 10,000 | | | | 21,179 | |
Aozora Bank, Ltd. | | | 8,000 | | | | 22,560 | |
Bank of Kyoto, Ltd. (The) | | | 12,000 | | | | 103,143 | |
Bank of Yokohama, Ltd. (The) | | | 32,000 | | | | 147,265 | |
Benesse Holdings, Inc. | | | 500 | | | | 24,084 | |
Bridgestone Corp. | | | 1,300 | | | | 30,367 | |
Canon, Inc. | | | 700 | | | | 22,750 | |
Chiba Bank, Ltd. (The) | | | 15,000 | | | | 87,617 | |
Chugai Pharmaceutical Co., Ltd. | | | 5,700 | | | | 115,489 | |
Chugoku Bank, Ltd. (The) | | | 12,000 | | | | 165,150 | |
Daihatsu Motor Co., Ltd. | | | 9,000 | | | | 157,512 | |
Dainippon Sumitomo Pharma Co., Ltd. | | | 6,400 | | | | 73,611 | |
Electric Power Development Co., Ltd. | | | 600 | | | | 15,368 | |
Gunma Bank, Ltd. (The) | | | 21,000 | | | | 101,313 | |
Hachijuni Bank, Ltd. (The) | | | 18,000 | | | | 92,984 | |
Hamamatsu Photonics K.K. | | | 4,600 | | | | 159,484 | |
Hirose Electric Co., Ltd. | | | 300 | | | | 32,111 | |
Hiroshima Bank, Ltd. (The) | | | 23,000 | | | | 81,815 | |
Honda Motor Co., Ltd. | | | 2,300 | | | | 69,145 | |
Hoya Corp. | | | 1,500 | | | | 30,379 | |
Isetan Mitsukoshi Holdings, Ltd. | | | 2,500 | | | | 24,471 | |
ITOCHU Techno-Solutions Corp. | | | 1,000 | | | | 51,736 | |
Iyo Bank, Ltd. (The) | | | 8,000 | | | | 61,854 | |
Japan Prime Realty Investment Corp. | | | 7 | | | | 21,097 | |
Japan Real Estate Investment Corp. | | | 3 | | | | 30,040 | |
Joyo Bank, Ltd. (The) | | | 3,000 | | | | 14,519 | |
JX Holdings, Inc. | | | 6,700 | | | | 35,685 | |
Kamigumi Co., Ltd. | | | 9,000 | | | | 72,585 | |
| | | | |
| | 21 | | See Notes to Consolidated Financial Statements. |
Parametric Structured Absolute Return Portfolio
October 31, 2012
Consolidated Portfolio of Investments — continued
| | | | | | | | |
| Security | | Shares | | | Value | |
| | | | | | | | |
|
Japan (continued) | |
Kansai Paint Co., Ltd. | | | 8,000 | | | $ | 86,178 | |
Keikyu Corp. | | | 3,000 | | | | 28,254 | |
Keio Corp. | | | 21,000 | | | | 159,375 | |
Keyence Corp. | | | 1,300 | | | | 345,135 | |
Kintetsu Corp. | | | 15,000 | | | | 58,785 | |
Kyowa Hakko Kirin Co., Ltd. | | | 9,000 | | | | 95,798 | |
Lawson, Inc. | | | 700 | | | | 51,443 | |
McDonald’s Holdings Co. (Japan), Ltd. | | | 4,000 | | | | 111,145 | |
Miraca Holdings, Inc. | | | 500 | | | | 21,116 | |
Mitsubishi Logistics Corp. | | | 4,000 | | | | 51,586 | |
Mitsubishi Motors Corp.(1) | | | 35,000 | | | | 30,169 | |
Mitsubishi Tanabe Pharma Corp. | | | 3,900 | | | | 56,217 | |
Mizuho Financial Group, Inc. | | | 16,500 | | | | 25,817 | |
NGK Spark Plug Co., Ltd. | | | 6,000 | | | | 67,191 | |
Nidec Corp. | | | 400 | | | | 28,466 | |
Nippon Telegraph & Telephone Corp. | | | 300 | | | | 13,718 | |
Nishi-Nippon City Bank, Ltd. (The) | | | 26,000 | | | | 59,286 | |
Nitori Co., Ltd. | | | 400 | | | | 32,665 | |
NTT DoCoMo, Inc. | | | 219 | | | | 317,337 | |
Odakyu Electric Railway Co., Ltd. | | | 19,000 | | | | 201,605 | |
Ono Pharmaceutical Co., Ltd. | | | 2,600 | | | | 156,986 | |
Oracle Corp. Japan | | | 1,600 | | | | 71,154 | |
Oriental Land Co., Ltd. | | | 1,400 | | | | 190,967 | |
Osaka Gas Co., Ltd. | | | 7,000 | | | | 28,851 | |
Rakuten, Inc. | | | 20,929 | | | | 188,135 | |
Rinnai Corp. | | | 1,000 | | | | 68,300 | |
Sankyo Co., Ltd. | | | 1,100 | | | | 49,837 | |
Santen Pharmaceutical Co., Ltd. | | | 3,100 | | | | 135,797 | |
Seven Bank, Ltd. | | | 8,300 | | | | 23,730 | |
Shizuoka Bank, Ltd. (The) | | | 22,000 | | | | 225,016 | |
Sumitomo Metal Mining Co., Ltd. | | | 3,000 | | | | 39,509 | |
Sumitomo Rubber Industries, Ltd. | | | 2,500 | | | | 29,473 | |
Suruga Bank, Ltd. | | | 7,000 | | | | 84,063 | |
Suzuken Co., Ltd. | | | 2,200 | | | | 69,447 | |
Sysmex Corp. | | | 600 | | | | 28,212 | |
Taisho Pharmaceutical Holdings Co., Ltd. | | | 200 | | | | 16,152 | |
Takashimaya Co., Ltd. | | | 3,000 | | | | 19,732 | |
Takeda Pharmaceutical Co., Ltd. | | | 1,400 | | | | 65,073 | |
Toho Gas Co., Ltd. | | | 18,000 | | | | 109,096 | |
Tokyo Gas Co., Ltd. | | | 16,000 | | | | 84,783 | |
TonenGeneral Sekiyu K.K. | | | 15,000 | | | | 136,127 | |
Tsumura & Co. | | | 800 | | | | 25,583 | |
Unicharm Corp. | | | 3,900 | | | | 211,009 | |
USS Co., Ltd. | | | 910 | | | | 95,679 | |
Yahoo! Japan Corp. | | | 61 | | | | 20,993 | |
Yakult Honsha Co., Ltd. | | | 600 | | | | 27,952 | |
| | | | | | | | |
| Security | | Shares | | | Value | |
| | | | | | | | |
|
Japan (continued) | |
Yamaguchi Financial Group, Inc. | | | 3,000 | | | $ | 24,856 | |
Yamato Holdings Co., Ltd. | | | 1,900 | | | | 28,944 | |
Yokogawa Electric Corp. | | | 1,400 | | | | 15,937 | |
| | | | | | | | | |
| | | $ | 6,081,368 | |
| | | | | | | | | |
| | |
Kuwait — 0.3% | | | | | | | | |
Al Ahli Bank of Kuwait KSC | | | 10,500 | | | $ | 22,964 | |
Boubyan Bank KSC(1) | | | 15,000 | | | | 33,572 | |
Boubyan Petrochemicals Co. | | | 35,000 | | | | 69,729 | |
Burgan Bank SAK | | | 15,000 | | | | 27,164 | |
Commercial Bank of Kuwait SAK(1) | | | 20,000 | | | | 47,473 | |
Gulf Bank(1) | | | 35,750 | | | | 52,015 | |
Gulf Cable and Electrical Industries Co. | | | 10,000 | | | | 38,402 | |
Kuwait Finance House KSC | | | 25,800 | | | | 68,703 | |
Kuwait Foods Co. (Americana) | | | 2,500 | | | | 14,288 | |
Kuwait Pipes Industries & Oil Services Co.(1) | | | 60,000 | | | | 23,422 | |
Mabanee Co. SAKC | | | 15,000 | | | | 61,028 | |
Mobile Telecommunications Co. | | | 65,700 | | | | 172,629 | |
National Bank of Kuwait SAK | | | 45,750 | | | | 155,720 | |
National Industries Group Holding(1) | | | 57,700 | | | | 42,205 | |
Sultan Center Food Products Co.(1) | | | 74,929 | | | | 27,537 | |
| | | | | | | | | |
| | | $ | 856,851 | |
| | | | | | | | | |
| | |
Malaysia — 0.7% | | | | | | | | |
Airasia Bhd | | | 23,600 | | | $ | 23,424 | |
AMMB Holdings Bhd | | | 19,900 | | | | 41,609 | |
Axiata Group Bhd | | | 43,300 | | | | 92,675 | |
Batu Kawan Bhd | | | 8,600 | | | | 50,690 | |
Boustead Holdings Bhd | | | 12,050 | | | | 19,798 | |
British American Tobacco Malaysia Bhd | | | 2,300 | | | | 47,664 | |
Dialog Group Bhd | | | 58,400 | | | | 45,915 | |
Digi.com Bhd | | | 33,100 | | | | 57,591 | |
Gamuda Bhd | | | 40,100 | | | | 47,420 | |
Genting Bhd | | | 28,200 | | | | 81,716 | |
Hong Leong Bank Bhd | | | 14,300 | | | | 68,848 | |
IJM Corp. Bhd | | | 22,200 | | | | 36,436 | |
IOI Corp. Bhd | | | 49,900 | | | | 82,724 | |
Kuala Lumpur Kepong Bhd | | | 9,400 | | | | 66,004 | |
Lafarge Malayan Cement Bhd | | | 13,500 | | | | 43,202 | |
Malayan Banking Bhd | | | 38,300 | | | | 113,301 | |
Malaysian Resources Corp. Bhd | | | 41,600 | | | | 23,933 | |
Maxis Bhd | | | 25,400 | | | | 57,996 | |
Multi-Purpose Holdings Bhd | | | 23,600 | | | | 28,078 | |
Parkson Holdings Bhd | | | 30,000 | | | | 47,677 | |
Petronas Chemicals Group Bhd | | | 55,900 | | | | 119,066 | |
| | | | |
| | 22 | | See Notes to Consolidated Financial Statements. |
Parametric Structured Absolute Return Portfolio
October 31, 2012
Consolidated Portfolio of Investments — continued
| | | | | | | | |
| Security | | Shares | | | Value | |
| | | | | | | | |
| | |
Malaysia (continued) | | | | | | | | |
Petronas Dagangan Bhd | | | 8,800 | | | $ | 63,688 | |
PPB Group Bhd | | | 12,300 | | | | 54,285 | |
Public Bank Bhd | | | 13,900 | | | | 72,443 | |
Resorts World Bhd | | | 59,800 | | | | 70,361 | |
RHB Capital Bhd | | | 21,100 | | | | 51,859 | |
Sapurakencana Petroleum Bhd(1) | | | 56,897 | | | | 46,748 | |
Sime Darby Bhd | | | 61,600 | | | | 197,600 | |
Telekom Malaysia Bhd | | | 29,400 | | | | 57,639 | |
Tenaga Nasional Bhd | | | 33,300 | | | | 75,761 | |
| | | | | | | | | |
| | | $ | 1,886,151 | |
| | | | | | | | | |
| | |
Mexico — 1.4% | | | | | | | | |
Alfa SAB de CV, Series A | | | 95,800 | | | $ | 176,031 | |
America Movil SAB de CV ADR, Series L | | | 32,000 | | | | 809,280 | |
Bolsa Mexicana de Valores SAB de CV | | | 26,300 | | | | 58,248 | |
Cemex SAB de CV ADR(1) | | | 23,004 | | | | 207,956 | |
Coca Cola Femsa SAB de CV ADR | | | 500 | | | | 63,955 | |
Compartamos SAB de CV | | | 39,900 | | | | 53,783 | |
Corporacion GEO SAB de CV, Series B(1) | | | 4,400 | | | | 5,282 | |
Embotelladoras Arca SAB de CV | | | 9,900 | | | | 71,827 | |
Empresas ICA SAB de CV(1) | | | 20,700 | | | | 44,739 | |
Fomento Economico Mexicano SA de CV ADR | | | 2,400 | | | | 217,464 | |
Genomma Lab Internacional SA de CV(1) | | | 9,700 | | | | 19,409 | |
Grupo Aeroportuario del Pacifico SAB de CV ADR | | | 600 | | | | 28,572 | |
Grupo Aeroportuario del Sureste SAB de CV, Class B | | | 3,800 | | | | 36,720 | |
Grupo Bimbo SA de CV, Series A | | | 36,500 | | | | 84,936 | |
Grupo Carso SA de CV, Series A1 | | | 13,600 | | | | 49,232 | |
Grupo Elektra SA de CV | | | 1,000 | | | | 41,378 | |
Grupo Financiero Banorte SAB de CV, Class O | | | 56,800 | | | | 315,797 | |
Grupo Financiero Inbursa SAB de CV, Class O | | | 95,500 | | | | 253,811 | |
Grupo Mexico SAB de CV, Series B | | | 65,343 | | | | 209,593 | |
Grupo Modelo SA de CV, Series C | | | 8,400 | | | | 74,031 | |
Grupo Televisa SA ADR | | | 5,000 | | | | 113,000 | |
Impulsora del Desarrollo y el Empleo en America Latina SA de CV, Series B1(1) | | | 6,400 | | | | 11,007 | |
Industrias CH SAB de CV, Series B(1) | | | 5,100 | | | | 29,597 | |
Industrias Penoles SA de CV | | | 2,700 | | | | 135,062 | |
Inmuebles Carso SAB de CV(1) | | | 8,000 | | | | 6,214 | |
Kimberly-Clark de Mexico SAB de CV, Class A | | | 25,000 | | | | 60,600 | |
Mexichem SAB de CV | | | 15,232 | | | | 75,497 | |
Minera Frisco SAB de CV(1) | | | 12,200 | | | | 48,263 | |
Promotora y Operadora de Infraestructura SAB de CV(1) | | | 10,300 | | | | 53,490 | |
TV Azteca SAB de CV, Series CPO | | | 39,000 | | | | 24,513 | |
Wal-Mart de Mexico SAB de CV, Series V | | | 67,500 | | | | 198,623 | |
| | | | | | | | | |
| | | $ | 3,577,910 | |
| | | | | | | | | |
| | | | | | | | |
| Security | | Shares | | | Value | |
| | | | | | | | |
| | |
Morocco — 0.4% | | | | | | | | |
Afriquia Gaz | | | 110 | | | $ | 20,861 | |
Alliances Developpement Immobilier SA | | | 489 | | | | 32,891 | |
Attijariwafa Bank | | | 5,100 | | | | 192,094 | |
Banque Centrale Populaire | | | 4,000 | | | | 92,191 | |
Banque Marocaine du Commerce Exterieur (BMCE) | | | 3,100 | | | | 64,292 | |
Cie Miniere de Touissit | | | 110 | | | | 19,263 | |
Ciments du Maroc | | | 400 | | | | 36,451 | |
Cosumar Compagnie Sucriere Marocaine et de Raffinage | | | 100 | | | | 18,479 | |
Delta Holding SA | | | 1,800 | | | | 7,789 | |
Douja Promotion Groupe Addoha SA | | | 11,600 | | | | 83,870 | |
Lafarge Ciments | | | 400 | | | | 62,683 | |
Managem | | | 400 | | | | 73,703 | |
Maroc Telecom | | | 21,800 | | | | 274,349 | |
| | | | | | | | | |
| | | | | | $ | 978,916 | |
| | | | | | | | | |
| | |
Netherlands — 1.0% | | | | | | | | |
Akzo Nobel NV | | | 4,706 | | | $ | 256,139 | |
ASML Holding NV | | | 11,461 | | | | 630,037 | |
European Aeronautic Defence and Space Co. NV | | | 7,168 | | | | 255,109 | |
Gemalto NV | | | 337 | | | | 30,438 | |
Heineken Holding NV | | | 1,465 | | | | 74,433 | |
Heineken NV | | | 4,009 | | | | 247,406 | |
Koninklijke Ahold NV | | | 24,653 | | | | 313,945 | |
Koninklijke DSM NV | | | 3,945 | | | | 202,867 | |
Koninklijke KPN NV | | | 37,806 | | | | 238,316 | |
Koninklijke Vopak NV | | | 1,100 | | | | 76,582 | |
QIAGEN NV(1) | | | 6,848 | | | | 119,299 | |
Reed Elsevier NV | | | 4,414 | | | | 59,251 | |
Unilever NV | | | 5,995 | | | | 220,344 | |
| | | | | | | | | |
| | | | | | $ | 2,724,166 | |
| | | | | | | | | |
| | |
New Zealand — 0.1% | | | | | | | | |
Auckland International Airport, Ltd. | | | 57,862 | | | $ | 127,635 | |
Chorus, Ltd. | | | 8,812 | | | | 24,479 | |
Contact Energy, Ltd.(1) | | | 13,196 | | | | 60,090 | |
Fletcher Building, Ltd. | | | 15,850 | | | | 91,675 | |
Sky City Entertainment Group, Ltd. | | | 9,328 | | | | 29,751 | |
Telecom Corporation of New Zealand, Ltd. | | | 32,008 | | | | 63,276 | |
| | | | | | | | | |
| | | | | | $ | 396,906 | |
| | | | | | | | | |
| | |
Norway — 0.6% | | | | | | | | |
Aker Solutions ASA | | | 4,895 | | | $ | 96,463 | |
Gjensidige Forsikring ASA | | | 2,549 | | | | 37,221 | |
Norsk Hydro ASA | | | 52,769 | | | | 237,567 | |
Orkla ASA | | | 27,033 | | | | 214,145 | |
| | | | |
| | 23 | | See Notes to Consolidated Financial Statements. |
Parametric Structured Absolute Return Portfolio
October 31, 2012
Consolidated Portfolio of Investments — continued
| | | | | | | | |
| Security | | Shares | | | Value | |
| | | | | | | | |
| | |
Norway (continued) | | | | | | | | |
Seadrill, Ltd. | | | 4,836 | | | $ | 195,956 | |
Statoil ASA | | | 15,791 | | | | 388,916 | |
Telenor ASA | | | 23,108 | | | | 454,491 | |
Yara International ASA | | | 889 | | | | 41,897 | |
| | | | | | | | | |
| | | | | | $ | 1,666,656 | |
| | | | | | | | | |
| | |
Peru — 0.4% | | | | | | | | |
Alicorp SA | | | 38,300 | | | $ | 108,626 | |
Cia de Minas Buenaventura SA ADR | | | 4,600 | | | | 164,496 | |
Credicorp, Ltd. ADR | | | 1,640 | | | | 212,118 | |
Ferreyros SA | | | 28,063 | | | | 23,282 | |
Grana y Montero SA | | | 23,300 | | | | 80,829 | |
Intergroup Financial Services Corp. | | | 500 | | | | 16,000 | |
Luz del Sur SAA | | | 6,300 | | | | 20,129 | |
Minsur SA | | | 20,900 | | | | 18,952 | |
Sociedad Minera Cerro Verde SAA(1) | | | 600 | | | | 24,780 | |
Southern Copper Corp. | | | 4,852 | | | | 184,861 | |
Union Andina de Cementos SAA | | | 17,000 | | | | 20,270 | |
Volcan Cia Minera SA, Class B | | | 66,141 | | | | 64,571 | |
| | | | | | | | | |
| | | | | | $ | 938,914 | |
| | | | | | | | | |
| | |
Philippines — 0.4% | | | | | | | | |
Aboitiz Equity Ventures, Inc. | | | 41,200 | | | $ | 48,214 | |
Aboitiz Power Corp. | | | 30,200 | | | | 24,257 | |
Alliance Global Group, Inc. | | | 94,000 | | | | 33,898 | |
Ayala Corp. | | | 4,000 | | | | 42,938 | |
Ayala Land, Inc. | | | 106,900 | | | | 61,100 | |
Ayala Land, Inc., PFC Shares(2) | | | 65,600 | | | | 159 | |
Bank of the Philippine Islands | | | 34,400 | | | | 67,557 | |
DMCI Holdings, Inc. | | | 24,700 | | | | 32,346 | |
International Container Terminal Services, Inc. | | | 23,200 | | | | 39,938 | |
JG Summit Holding, Inc. | | | 50,500 | | | | 40,413 | |
Jollibee Foods Corp. | | | 12,900 | | | | 33,100 | |
Manila Electric Co. | | | 3,700 | | | | 25,061 | |
Metro Pacific Investments Corp. | | | 263,000 | | | | 26,390 | |
Philex Mining Corp. | | | 137,100 | | | | 49,855 | |
Philex Petroleum Corp.(1) | | | 29,500 | | | | 18,239 | |
Philippine Long Distance Telephone Co. | | | 1,520 | | | | 97,552 | |
Puregold Price Club, Inc. | | | 42,100 | | | | 30,565 | |
Robinsons Land Corp. | | | 89,500 | | | | 41,270 | |
San Miguel Corp. | | | 9,500 | | | | 25,133 | |
Semirara Mining Corp. | | | 5,500 | | | | 29,225 | |
SM Investments Corp. | | | 5,000 | | | | 97,389 | |
SM Prime Holdings, Inc. | | | 89,500 | | | | 31,456 | |
Universal Robina Corp. | | | 21,000 | | | | 36,622 | |
| | | | | | | | | |
| | | | | | $ | 932,677 | |
| | | | | | | | | |
| | | | | | | | |
| Security | | Shares | | | Value | |
| | | | | | | | |
| | |
Poland — 0.7% | | | | | | | | |
Agora SA | | | 14,100 | | | $ | 37,529 | |
AmRest Holdings SE(1) | | | 1,400 | | | | 34,535 | |
Asseco Poland SA | | | 5,810 | | | | 72,799 | |
Bank Pekao SA | | | 2,800 | | | | 134,501 | |
Boryszew SA(1) | | | 93,680 | | | | 15,551 | |
BRE Bank SA(1) | | | 470 | | | | 44,412 | |
Budimex SA | | | 710 | | | | 12,057 | |
Cyfrowy Polsat SA(1) | | | 17,244 | | | | 78,240 | |
Emperia Holding SA | | | 1,350 | | | | 22,841 | |
Enea SA | | | 4,500 | | | | 21,743 | |
Eurocash SA | | | 6,240 | | | | 76,565 | |
ING Bank Slaski SA(1) | | | 1,400 | | | | 38,203 | |
Jastrzebska Spolka Weglowa SA | | | 1,200 | | | | 32,702 | |
KGHM Polska Miedz SA | | | 3,213 | | | | 161,919 | |
Lubelski Wegiel Bogdanka SA | | | 1,040 | | | | 39,159 | |
Netia SA(1) | | | 13,000 | | | | 23,662 | |
NG2 SA | | | 2,690 | | | | 49,471 | |
Polimex-Mostostal SA(1) | | | 32,200 | | | | 5,673 | |
Polish Oil & Gas(1) | | | 44,800 | | | | 55,499 | |
Polska Grupa Energetyczna SA | | | 25,610 | | | | 138,959 | |
Polski Koncern Naftowy Orlen SA(1) | | | 7,480 | | | | 102,518 | |
Powszechna Kasa Oszczednosci Bank Polski SA | | | 18,250 | | | | 204,007 | |
Powszechny Zaklad Ubezpieczen SA | | | 1,417 | | | | 165,756 | |
Tauron Polska Energia SA | | | 47,400 | | | | 65,556 | |
Telekomunikacja Polska SA | | | 23,350 | | | | 88,546 | |
TVN SA | | | 24,240 | | | | 53,138 | |
Zaklady Azotowe Pulawy SA | | | 120 | | | | 4,491 | |
| | | | | | | | | |
| | | | | | $ | 1,780,032 | |
| | | | | | | | | |
| | |
Portugal — 0.1% | | | | | | | | |
EDP-Energias de Portugal SA | | | 46,501 | | | $ | 126,395 | |
Galp Energia SGPS SA, Class B | | | 2,862 | | | | 45,815 | |
Jeronimo Martins SGPS SA | | | 7,997 | | | | 139,996 | |
Portugal Telecom SGPS SA | | | 7,749 | | | | 38,968 | |
| | | | | | | | | |
| | | | | | $ | 351,174 | |
| | | | | | | | | |
| | |
Qatar — 0.4% | | | | | | | | |
Aamal Co. QSC(1) | | | 6,300 | | | $ | 27,062 | |
Commercial Bank of Qatar | | | 1,900 | | | | 37,500 | |
Doha Bank, Ltd. | | | 2,600 | | | | 39,004 | |
Gulf International Services QSC | | | 3,900 | | | | 32,205 | |
Industries Qatar | | | 4,350 | | | | 181,460 | |
Masraf Al Rayan | | | 11,950 | | | | 86,667 | |
Qatar Electricity & Water Co. | | | 1,400 | | | | 51,164 | |
Qatar Gas Transport Co., Ltd. (NAKILAT) | | | 13,000 | | | | 55,308 | |
| | | | |
| | 24 | | See Notes to Consolidated Financial Statements. |
Parametric Structured Absolute Return Portfolio
October 31, 2012
Consolidated Portfolio of Investments — continued
| | | | | | | | |
| Security | | Shares | | | Value | |
| | | | | | | | |
| | |
Qatar (continued) | | | | | | | | |
Qatar Islamic Bank | | | 2,500 | | | $ | 52,649 | |
Qatar National Bank | | | 5,448 | | | | 200,227 | |
Qatar National Cement Co. | | | 600 | | | | 16,808 | |
Qatar National Navigation | | | 1,500 | | | | 26,496 | |
Qatar Telecom QSC | | | 4,394 | | | | 127,373 | |
| | | | | | | | | |
| | | | | | $ | 933,923 | |
| | | | | | | | | |
| | |
Russia — 1.3% | | | | | | | | |
CTC Media, Inc. | | | 3,900 | | | $ | 32,721 | |
E.ON Russia JSC | | | 607,000 | | | | 49,702 | |
Etalon Group, Ltd. GDR(1)(3) | | | 4,600 | | | | 26,588 | |
Federal Grid Co. Unified Energy System JSC(1) | | | 7,226,300 | | | | 47,123 | |
Federal Hydrogenerating Co. JSC ADR | | | 28,000 | | | | 66,537 | |
KamAZ(1) | | | 13,000 | | | | 15,880 | |
LUKOIL OAO ADR | | | 5,700 | | | | 345,923 | |
Magnit OJSC | | | 1,570 | | | | 223,277 | |
Mail.ru Group, Ltd. GDR(3) | | | 1,800 | | | | 60,100 | |
Mechel ADR | | | 11,100 | | | | 70,485 | |
MMC Norilsk Nickel GDR | | | 9,100 | | | | 139,872 | |
Mobile TeleSystems OJSC | | | 28,800 | | | | 211,958 | |
Novolipetsk Steel GDR(3) | | | 2,500 | | | | 47,292 | |
OAO Gazprom ADR | | | 62,400 | | | | 573,143 | |
OAO Inter Rao Ues(1) | | | 41,577,400 | | | | 33,553 | |
Pharmstandard OJSC GDR(1)(3) | | | 2,600 | | | | 38,220 | |
PIK Group GDR(1)(3) | | | 9,700 | | | | 20,952 | |
Rosneft Oil Co. GDR(1)(3) | | | 15,300 | | | | 113,387 | |
Rostelecom | | | 30,700 | | | | 120,984 | |
Sberbank of Russia ADR | | | 46,500 | | | | 549,883 | |
Severstal OAO GDR(3) | | | 4,600 | | | | 55,829 | |
Surgutneftegas OJSC ADR | | | 13,600 | | | | 119,012 | |
Surgutneftegas OJSC ADR, PFC Shares | | | 130,200 | | | | 80,568 | |
Tatneft ADR | | | 3,000 | | | | 116,292 | |
Uralkali OJSC GDR(3) | | | 3,400 | | | | 133,661 | |
VimpelCom, Ltd. ADR | | | 5,800 | | | | 63,916 | |
VTB Bank OJSC GDR(3) | | | 30,500 | | | | 105,287 | |
X5 Retail Group NV GDR(1)(3) | | | 2,900 | | | | 54,955 | |
Yandex NV, Class A(1) | | | 1,300 | | | | 30,264 | |
| | | | | | | | | |
| | | | | | $ | 3,547,364 | |
| | | | | | | | | |
| | |
Singapore — 0.9% | | | | | | | | |
Ascendas Real Estate Investment Trust | | | 74,000 | | | $ | 142,779 | |
CapitaMall Trust | | | 18,000 | | | | 30,971 | |
ComfortDelGro Corp., Ltd. | | | 14,000 | | | | 19,360 | |
DBS Group Holdings, Ltd. | | | 54,000 | | | | 613,247 | |
| | | | | | | | |
| Security | | Shares | | | Value | |
| | | | | | | | |
| | |
Singapore (continued) | | | | | | | | |
Fraser and Neave, Ltd. | | | 1,000 | | | $ | 7,492 | |
Oversea-Chinese Banking Corp., Ltd. | | | 53,000 | | | | 393,915 | |
Singapore Airlines, Ltd. | | | 23,000 | | | | 199,331 | |
Singapore Press Holdings, Ltd. | | | 50,000 | | | | 165,324 | |
Singapore Technologies Engineering, Ltd. | | | 30,000 | | | | 86,342 | |
Singapore Telecommunications, Ltd. | | | 114,000 | | | | 300,278 | |
StarHub, Ltd. | | | 11,000 | | | | 33,095 | |
United Overseas Bank, Ltd. | | | 18,000 | | | | 268,430 | |
UOL Group, Ltd. | | | 25,000 | | | | 115,675 | |
| | | | | | | | | |
| | | | | | $ | 2,376,239 | |
| | | | | | | | | |
| | |
South Africa — 1.4% | | | | | | | | |
ABSA Group, Ltd. | | | 4,500 | | | $ | 72,148 | |
Adcock Ingram Holdings, Ltd. | | | 5,800 | | | | 38,764 | |
AECI, Ltd. | | | 2,500 | | | | 21,241 | |
African Bank Investments, Ltd. | | | 12,000 | | | | 40,604 | |
African Rainbow Minerals, Ltd. | | | 1,000 | | | | 20,968 | |
Anglo Platinum, Ltd. | | | 800 | | | | 37,192 | |
AngloGold Ashanti, Ltd. | | | 4,300 | | | | 145,277 | |
Aquarius Platinum, Ltd. | | | 15,400 | | | | 9,340 | |
Aveng, Ltd. | | | 14,200 | | | | 50,825 | |
AVI, Ltd. | | | 7,900 | | | | 52,091 | |
Barloworld, Ltd. | | | 7,500 | | | | 60,777 | |
Bidvest Group, Ltd. | | | 7,500 | | | | 179,017 | |
Capital Property Fund | | | 19,700 | | | | 22,657 | |
Clicks Group, Ltd. | | | 6,800 | | | | 46,913 | |
Discovery Holdings, Ltd. | | | 7,500 | | | | 47,985 | |
FirstRand, Ltd. | | | 26,600 | | | | 88,408 | |
Harmony Gold Mining Co., Ltd. | | | 5,600 | | | | 45,880 | |
Impala Platinum Holdings, Ltd. | | | 6,286 | | | | 113,333 | |
Imperial Holdings, Ltd. | | | 3,400 | | | | 77,278 | |
Kumba Iron Ore, Ltd. | | | 1,000 | | | | 62,545 | |
Kumba Resources, Ltd. | | | 2,200 | | | | 43,992 | |
Liberty Holdings, Ltd. | | | 2,300 | | | | 26,669 | |
Massmart Holdings, Ltd. | | | 2,200 | | | | 44,255 | |
Mediclinic International, Ltd. | | | 9,600 | | | | 52,137 | |
MMI Holdings, Ltd. | | | 18,700 | | | | 45,121 | |
Mondi, Ltd. | | | 3,100 | | | | 33,550 | |
Mr. Price Group, Ltd. | | | 4,200 | | | | 64,942 | |
MTN Group, Ltd. | | | 37,800 | | | | 683,025 | |
Murray & Roberts Holdings, Ltd.(1) | | | 11,600 | | | | 30,157 | |
Nampak, Ltd. | | | 9,600 | | | | 32,015 | |
Nedbank Group, Ltd. | | | 2,200 | | | | 45,364 | |
Netcare, Ltd. | | | 26,000 | | | | 53,964 | |
Remgro, Ltd. | | | 6,000 | | | | 102,786 | |
Reunert, Ltd. | | | 5,500 | | | | 48,436 | |
| | | | |
| | 25 | | See Notes to Consolidated Financial Statements. |
Parametric Structured Absolute Return Portfolio
October 31, 2012
Consolidated Portfolio of Investments — continued
| | | | | | | | |
| Security | | Shares | | | Value | |
| | | | | | | | |
| | |
South Africa (continued) | | | | | | | | |
RMB Holdings, Ltd. | | | 12,000 | | | $ | 52,720 | |
Sanlam, Ltd. | | | 22,500 | | | | 100,549 | |
Sasol, Ltd. | | | 5,400 | | | | 230,040 | |
Shoprite Holdings, Ltd. | | | 5,100 | | | | 104,881 | |
Spar Group, Ltd. | | | 3,300 | | | | 46,256 | |
Standard Bank Group, Ltd. | | | 13,900 | | | | 171,640 | |
Steinhoff International Holdings, Ltd.(1) | | | 24,600 | | | | 82,767 | |
Sun International, Ltd. | | | 4,200 | | | | 46,721 | |
Telkom South Africa, Ltd.(1) | | | 7,300 | | | | 15,400 | |
Tiger Brands, Ltd. | | | 2,600 | | | | 82,667 | |
Truworths International, Ltd. | | | 7,200 | | | | 78,405 | |
Vodacom Group (Pty), Ltd. | | | 8,900 | | | | 112,116 | |
Wilson Bayly Holmes-Ovcon, Ltd. | | | 3,100 | | | | 50,797 | |
Woolworths Holdings, Ltd. | | | 10,500 | | | | 79,275 | |
| | | | | | | | | |
| | | | | | $ | 3,793,890 | |
| | | | | | | | | |
| | |
South Korea — 1.4% | | | | | | | | |
Asiana Airlines, Inc.(1) | | | 3,000 | | | $ | 17,310 | |
BS Financial Group, Inc. | | | 5,220 | | | | 59,084 | |
Celltrion, Inc. | | | 2,625 | | | | 64,651 | |
Cheil Industries, Inc. | | | 670 | | | | 57,356 | |
Cheil Worldwide, Inc. | | | 2,670 | | | | 51,427 | |
CJ Corp. | | | 300 | | | | 29,260 | |
Dongbu Insurance Co., Ltd. | | | 1,430 | | | | 64,799 | |
Hankook Tire Co., Ltd.(1) | | | 1,560 | | | | 65,799 | |
Hankook Tire Worldwide Co., Ltd. | | | 3,569 | | | | 46,065 | |
Hite-Jinro Co., Ltd. | | | 2,800 | | | | 82,764 | |
Honam Petrochemical Corp. | | | 270 | | | | 55,175 | |
Hynix Semiconductor, Inc.(1) | | | 2,810 | | | | 63,969 | |
Hyundai Glovis Co., Ltd. | | | 290 | | | | 60,308 | |
Hyundai Heavy Industries Co., Ltd. | | | 280 | | | | 58,677 | |
Hyundai Marine & Fire Insurance Co., Ltd. | | | 1,900 | | | | 61,320 | |
Hyundai Merchant Marine Co., Ltd.(1) | | | 1,080 | | | | 25,988 | |
Hyundai Motor Co. | | | 1,000 | | | | 205,519 | |
Hyundai Steel Co. | | | 700 | | | | 50,296 | |
Industrial Bank of Korea | | | 4,750 | | | | 52,217 | |
Kangwon Land, Inc. | | | 2,740 | | | | 63,772 | |
Korea Electric Power Corp.(1) | | | 3,470 | | | | 90,005 | |
Korea Express Co., Ltd.(1) | | | 100 | | | | 10,406 | |
Korea Zinc Co., Ltd. | | | 170 | | | | 69,639 | |
Korean Air Lines Co., Ltd.(1) | | | 660 | | | | 29,593 | |
Korean Reinsurance Co. | | | 4,578 | | | | 44,862 | |
KT&G Corp. | | | 1,080 | | | | 82,184 | |
LG Chem, Ltd. | | | 460 | | | | 129,039 | |
LG Corp. | | | 870 | | | | 53,058 | |
LG Display Co., Ltd.(1) | | | 1,210 | | | | 35,910 | |
LG Electronics, Inc. | | | 1,050 | | | | 73,050 | |
| | | | | | | | |
| Security | | Shares | | | Value | |
| | | | | | | | |
| | |
South Korea (continued) | | | | | | | | |
LG Hausys, Ltd. | | | 540 | | | $ | 38,801 | |
LIG Insurance Co., Ltd. | | | 2,290 | | | | 58,241 | |
NHN Corp. | | | 330 | | | | 76,332 | |
POSCO | | | 760 | | | | 238,909 | |
S-Oil Corp. | | | 590 | | | | 53,950 | |
Samsung C&T Corp. | | | 990 | | | | 53,774 | |
Samsung Electro-Mechanics Co., Ltd. | | | 350 | | | | 29,933 | |
Samsung Electronics Co., Ltd. | | | 565 | | | | 678,021 | |
Samsung Engineering Co., Ltd. | | | 370 | | | | 48,297 | |
Samsung Fine Chemicals Co., Ltd. | | | 470 | | | | 29,977 | |
Samsung Fire & Marine Insurance Co., Ltd. | | | 550 | | | | 120,068 | |
Samsung Heavy Industries Co., Ltd. | | | 1,900 | | | | 57,985 | |
Samsung Life Insurance Co., Ltd. | | | 1,380 | | | | 118,849 | |
Samsung Securities Co., Ltd. | | | 1,500 | | | | 67,104 | |
SK Broadband Co., Ltd.(1) | | | 7,780 | | | | 28,453 | |
SK Chemicals Co., Ltd. | | | 510 | | | | 31,434 | |
SK Telecom Co., Ltd. ADR | | | 4,600 | | | | 71,898 | |
TONGYANG Securities, Inc. | | | 9,480 | | | | 33,403 | |
Woori Finance Holdings Co., Ltd. | | | 6,060 | | | | 57,207 | |
| | | | | | | | | |
| | | | | | $ | 3,746,138 | |
| | | | | | | | | |
| | |
Spain — 0.9% | | | | | | | | |
Abertis Infraestructuras SA | | | 7,619 | | | $ | 115,076 | |
Acerinox SA | | | 5,359 | | | | 55,938 | |
ACS Actividades de Construccion y Servicios SA | | | 1,151 | | | | 24,598 | |
Amadeus IT Holding SA, Class A | | | 5,522 | | | | 136,793 | |
CaixaBank SA | | | 23,817 | | | | 90,453 | |
Distribuidora Internacional de Alimentacion SA | | | 4,948 | | | | 29,976 | |
Enagas | | | 8,349 | | | | 166,083 | |
Ferrovial SA | | | 16,609 | | | | 235,022 | |
Grifols SA(1) | | | 4,111 | | | | 142,778 | |
Iberdrola SA | | | 8,261 | | | | 42,783 | |
Indra Sistemas SA | | | 4,503 | | | | 51,523 | |
Industria de Diseno Textil SA | | | 3,421 | | | | 436,835 | |
International Consolidated Airlines Group SA(1) | | | 13,289 | | | | 34,982 | |
Red Electrica Corp. SA | | | 3,289 | | | | 154,319 | |
Repsol SA | | | 7,962 | | | | 159,565 | |
Telefonica SA | | | 21,422 | | | | 282,744 | |
Zardoya Otis SA | | | 8,452 | | | | 104,542 | |
| | | | | | | | | |
| | | | | | $ | 2,264,010 | |
| | | | | | | | | |
| | |
Sweden — 0.8% | | | | | | | | |
Atlas Copco AB, Class A | | | 1,107 | | | $ | 27,223 | |
Boliden AB | | | 14,597 | | | | 255,793 | |
Hennes & Mauritz AB, Class B | | | 7,766 | | | | 263,318 | |
| | | | |
| | 26 | | See Notes to Consolidated Financial Statements. |
Parametric Structured Absolute Return Portfolio
October 31, 2012
Consolidated Portfolio of Investments — continued
| | | | | | | | |
| Security | | Shares | | | Value | |
| | | | | | | | |
| | |
Sweden (continued) | | | | | | | | |
Holmen AB, Class B | | | 3,062 | | | $ | 90,235 | |
Investor AB, Class B | | | 6,033 | | | | 133,174 | |
Lundin Petroleum AB(1) | | | 1,265 | | | | 30,352 | |
Millicom International Cellular SA SDR | | | 1,492 | | | | 128,811 | |
Nordea Bank AB | | | 34,418 | | | | 312,848 | |
Scania AB, Class B | | | 2,369 | | | | 45,202 | |
Skandinaviska Enskilda Banken AB, Class A | | | 15,422 | | | | 127,968 | |
Skanska AB, Class B | | | 8,481 | | | | 132,855 | |
Svenska Cellulosa AB, Class B | | | 3,080 | | | | 60,048 | |
Swedbank AB, Class A | | | 7,841 | | | | 145,643 | |
Tele2 AB, Class B | | | 8,723 | | | | 145,612 | |
Telefonaktiebolaget LM Ericsson, Class B | | | 5,785 | | | | 51,250 | |
TeliaSonera AB | | | 40,021 | | | | 263,107 | |
| | | | | | | | | |
| | | | | | $ | 2,213,439 | |
| | | | | | | | | |
| | |
Switzerland — 1.3% | | | | | | | | |
Actelion, Ltd.(1) | | | 2,628 | | | $ | 126,847 | |
Adecco SA | | | 2,368 | | | | 114,830 | |
Baloise Holding AG | | | 532 | | | | 44,404 | |
Geberit AG | | | 193 | | | | 39,863 | |
Givaudan SA(1) | | | 88 | | | | 88,025 | |
Nestle SA | | | 15,544 | | | | 986,860 | |
Novartis AG | | | 7,290 | | | | 439,591 | |
Roche Holding AG PC | | | 2,322 | | | | 447,276 | |
Schindler Holding AG | | | 1,178 | | | | 152,599 | |
Schindler Holding AG PC | | | 196 | | | | 25,868 | |
Sonova Holding AG(1) | | | 1,282 | | | | 129,093 | |
Sulzer AG | | | 328 | | | | 47,562 | |
Swatch Group, Ltd. (The), Bearer Shares | | | 365 | | | | 151,083 | |
Swiss Reinsurance Co., Ltd. | | | 4,317 | | | | 298,725 | |
Swisscom AG | | | 528 | | | | 219,786 | |
Tyco International, Ltd. | | | 2,444 | | | | 65,670 | |
Zurich Insurance Group AG(1) | | | 482 | | | | 118,823 | |
| | | | | | | | | |
| | | | | | $ | 3,496,905 | |
| | | | | | | | | |
| | |
Taiwan — 1.3% | | | | | | | | |
Acer, Inc.(1) | | | 73,000 | | | $ | 56,352 | |
Advanced Semiconductor Engineering, Inc. | | | 112,931 | | | | 85,221 | |
Ambassador Hotel | | | 22,000 | | | | 22,682 | |
Asia Cement Corp. | | | 30,900 | | | | 38,483 | |
Asia Optical Co., Inc.(1) | | | 27,000 | | | | 24,577 | |
Asustek Computer, Inc. | | | 9,000 | | | | 96,286 | |
AU Optronics Corp.(1) | | | 197,000 | | | | 74,578 | |
Catcher Technology Co., Ltd. | | | 15,000 | | | | 65,105 | |
Cathay Financial Holding Co., Ltd. | | | 89,600 | | | | 89,840 | |
| | | | | | | | |
| Security | | Shares | | | Value | |
| | | | | | | | |
| | |
Taiwan (continued) | | | | | | | | |
Chang Hwa Commercial Bank | | | 74,520 | | | $ | 37,563 | |
Cheng Shin Rubber Industry Co., Ltd. | | | 25,100 | | | | 63,165 | |
Chimei Innolux Corp.(1) | | | 195,795 | | | | 72,921 | |
China Airlines, Ltd.(1) | | | 68,178 | | | | 26,584 | |
China Development Financial Holding Corp.(1) | | | 132,000 | | | | 29,460 | |
Chinatrust Financial Holding Co., Ltd. | | | 105,479 | | | | 58,061 | |
Chong Hong Construction Co., Ltd. | | | 11,110 | | | | 25,404 | |
Chunghwa Telecom Co., Ltd. | | | 55,000 | | | | 172,089 | |
Compal Electronics, Inc. | | | 104,000 | | | | 65,418 | |
Delta Electronics, Inc. | | | 27,000 | | | | 92,100 | |
EVA Airways Corp.(1) | | | 81,000 | | | | 46,953 | |
Far Eastern Department Stores, Ltd. | | | 30,680 | | | | 28,838 | |
Far Eastern International Bank | | | 17,907 | | | | 6,587 | |
Far Eastern New Century Corp. | | | 74,740 | | | | 77,270 | |
Far EasTone Telecommunications Co., Ltd. | | | 31,000 | | | | 71,559 | |
First Financial Holding Co., Ltd. | | | 81,280 | | | | 46,113 | |
Formosa Chemicals & Fibre Corp. | | | 40,000 | | | | 94,658 | |
Formosa Petrochemical Corp. | | | 17,000 | | | | 49,415 | |
Formosa Plastics Corp. | | | 47,000 | | | | 127,940 | |
Formosan Rubber Group, Inc. | | | 29,000 | | | | 19,604 | |
Foxconn International Holdings, Ltd.(1) | | | 190,000 | | | | 65,675 | |
Foxconn Technology Co., Ltd. | | | 18,900 | | | | 65,539 | |
Fubon Financial Holding Co., Ltd. | | | 70,496 | | | | 72,225 | |
Giant Manufacturing Co., Ltd. | | | 6,000 | | | | 30,991 | |
Goldsun Development & Construction Co., Ltd. | | | 63,000 | | | | 22,190 | |
Hotai Motor Co., Ltd. | | | 6,000 | | | | 42,673 | |
Hua Nan Financial Holdings Co., Ltd. | | | 45,177 | | | | 23,714 | |
Kerry TJ Logistics Co., Ltd. | | | 7,000 | | | | 11,155 | |
Mega Financial Holding Co., Ltd. | | | 89,900 | | | | 65,303 | |
Nan Ya Plastics Corp. | | | 61,000 | | | | 107,436 | |
Pou Chen Corp. | | | 50,000 | | | | 50,547 | |
President Chain Store Corp. | | | 10,000 | | | | 49,422 | |
Quanta Computer, Inc. | | | 50,000 | | | | 114,114 | |
Radiant Opto-Electronics Corp. | | | 16,300 | | | | 67,700 | |
Radium Life Tech Co., Ltd. | | | 32,309 | | | | 20,088 | |
Ruentex Industries, Ltd. | | | 19,000 | | | | 42,804 | |
Sanyang Industrial Co., Ltd.(1) | | | 29,000 | | | | 18,439 | |
Shin Kong Synthetic Fibers Corp. | | | 71,000 | | | | 21,770 | |
Siliconware Precision Industries Co., Ltd. | | | 71,000 | | | | 68,993 | |
Sincere Navigation | | | 24,000 | | | | 20,114 | |
Solar Applied Materials Technology Corp. | | | 7,699 | | | | 8,580 | |
Standard Foods Corp. | | | 10,480 | | | | 26,830 | |
Synnex Technology International Corp. | | | 33,000 | | | | 69,755 | |
Taishin Financial Holdings Co., Ltd. | | | 58,835 | | | | 21,017 | |
Taiwan Cement Corp. | | | 43,000 | | | | 55,060 | |
Taiwan Cooperative Financial Holding Co., Ltd. | | | 73,692 | | | | 38,308 | |
| | | | |
| | 27 | | See Notes to Consolidated Financial Statements. |
Parametric Structured Absolute Return Portfolio
October 31, 2012
Consolidated Portfolio of Investments — continued
| | | | | | | | |
| Security | | Shares | | | Value | |
| | | | | | | | |
| | |
Taiwan (continued) | | | | | | | | |
Taiwan Fertilizer Co., Ltd. | | | 11,000 | | | $ | 26,179 | |
Tong Yang Industry Co., Ltd. | | | 5,200 | | | | 4,191 | |
TPK Holding Co., Ltd. | | | 5,887 | | | | 73,840 | |
TTY Biopharm Co., Ltd. | | | 7,480 | | | | 23,347 | |
Uni-President Enterprises Corp. | | | 61,170 | | | | 107,990 | |
United Microelectronics Corp. | | | 222,000 | | | | 82,316 | |
Waterland Financial Holdings | | | 65,520 | | | | 19,816 | |
Wei Chuan Food Corp. | | | 21,000 | | | | 22,337 | |
Wistron Corp. | | | 68,100 | | | | 65,328 | |
Yageo Corp.(1) | | | 120,000 | | | | 34,711 | |
Yieh Phui Enterprise | | | 63,240 | | | | 17,613 | |
Yuanta Financial Holding Co., Ltd. | | | 96,000 | | | | 43,322 | |
Yuen Foong Yu Paper Manufacturing Co., Ltd. | | | 49,000 | | | | 19,946 | |
Yulon Motor Co., Ltd. | | | 22,000 | | | | 38,318 | |
| | | | | | | | | |
| | | | | | $ | 3,544,522 | |
| | | | | | | | | |
| | |
Thailand — 0.7% | | | | | | | | |
Advanced Info Service PCL(4) | | | 26,500 | | | $ | 170,246 | |
Airports of Thailand PCL(4) | | | 17,900 | | | | 47,790 | |
Bangkok Bank PCL(4) | | | 8,600 | | | | 50,548 | |
Bangkok Dusit Medical Services PCL(4) | | | 15,700 | | | | 54,336 | |
Bank of Ayudhya PCL(4) | | | 53,400 | | | | 51,550 | |
Banpu PCL(4) | | | 2,300 | | | | 29,322 | |
BEC World PCL(4) | | | 15,500 | | | | 29,711 | |
Berli Jucker PCL(4) | | | 18,000 | | | | 37,627 | |
Big C Supercenter PCL(4) | | | 4,000 | | | | 24,397 | |
BTS Group Holdings PCL | | | 102,400 | | | | 19,340 | |
Bumrungrad Hospital PCL(4) | | | 3,800 | | | | 9,370 | |
Central Pattana PCL(4) | | | 21,300 | | | | 49,086 | |
Charoen Pokphand Foods PCL(4) | | | 52,900 | | | | 60,671 | |
CP ALL PCL(4) | | | 73,500 | | | | 95,035 | |
Delta Electronics (Thailand) PCL(4) | | | 29,900 | | | | 28,449 | |
Dynasty Ceramic PCL(4) | | | 2,900 | | | | 4,484 | |
Electricity Generating PCL(4) | | | 7,500 | | | | 32,005 | |
Esso Thailand PCL(4) | | | 18,000 | | | | 6,312 | |
Glow Energy PCL(4) | | | 13,700 | | | | 31,878 | |
Hana Microelectronics PCL(4) | | | 37,700 | | | | 26,992 | |
Home Product Center PCL(4) | | | 15,960 | | | | 5,926 | |
IRPC PCL(4) | | | 142,000 | | | | 19,828 | |
Kasikornbank PCL(4) | | | 16,600 | | | | 96,526 | |
Krung Thai Bank PCL(4) | | | 72,950 | | | | 42,884 | |
Land & Houses PCL(4) | | | 82,300 | | | | 23,004 | |
Minor International PCL(4) | | | 44,000 | | | | 26,197 | |
PTT Exploration & Production PCL(4) | | | 15,900 | | | | 85,782 | |
PTT Global Chemical PCL(4) | | | 24,500 | | | | 48,526 | |
PTT PCL(4) | | | 12,700 | | | | 131,305 | |
| | | | | | | | |
| Security | | Shares | | | Value | |
| | | | | | | | |
| | |
Thailand (continued) | | | | | | | | |
Ratchaburi Electricity Generating Holding PCL(4) | | | 9,000 | | | $ | 15,853 | |
Robinson Department Store PCL(4) | | | 3,700 | | | | 7,308 | |
Shin Corp. PCL(4) | | | 15,000 | | | | 30,621 | |
Siam Cement PCL(4) | | | 4,100 | | | | 55,407 | |
Siam City Cement PCL(4) | | | 1,600 | | | | 22,174 | |
Siam Commercial Bank PCL(4) | | | 21,300 | | | | 111,352 | |
Siam Makro PCL(4) | | | 1,900 | | | | 28,420 | |
Sino Thai Engineering & Construction PCL(4) | | | 35,300 | | | | 24,586 | |
Thai Beverage PCL | | | 169,000 | | | | 60,135 | |
Thai Oil PCL(4) | | | 17,500 | | | | 37,912 | |
Thai Union Frozen Products PCL(4) | | | 11,160 | | | | 26,156 | |
Thanachart Capital PCL(4) | | | 19,800 | | | | 23,795 | |
TMB Bank PCL(4) | | | 355,700 | | | | 21,246 | |
Total Access Communication PCL(4) | | | 13,600 | | | | 36,524 | |
TPI Polene PCL(4) | | | 11,900 | | | | 5,455 | |
True Corp. PCL(1) | | | 206,200 | | | | 34,203 | |
| | | | | | | | | |
| | | | | | $ | 1,880,274 | |
| | | | | | | | | |
| | |
Turkey — 0.7% | | | | | | | | |
Akbank TAS | | | 33,800 | | | $ | 163,084 | |
Akenerji Elektrik Uretim AS(1) | | | 17,000 | | | | 19,826 | |
Aksa Akrilik Kimya Sanayii AS | | | 1,200 | | | | 3,152 | |
Anadolu Efes Biracilik ve Malt Sanayii AS | | | 4,000 | | | | 60,081 | |
Arcelik AS | | | 7,400 | | | | 48,908 | |
BIM Birlesik Magazalar AS | | | 2,200 | | | | 102,200 | |
Cimsa Cimento Sanayi ve Ticaret AS | | | 4,600 | | | | 21,750 | |
Coca-Cola Icecek AS | | | 1,500 | | | | 29,146 | |
Dogan Sirketler Grubu Holding AS(1) | | | 10,000 | | | | 4,350 | |
Eczacibasi Ilac Sanayi ve Ticaret AS | | | 2,500 | | | | 2,650 | |
Enka Insaat ve Sanayi AS | | | 24,976 | | | | 66,330 | |
Eregli Demir ve Celik Fabrikalari TAS | | | 56,200 | | | | 66,778 | |
Ford Otomotiv Sanayi AS | | | 2,100 | | | | 21,541 | |
Haci Omer Sabanci Holding AS | | | 17,200 | | | | 90,829 | |
Ihlas Holding AS(1) | | | 44,800 | | | | 32,734 | |
Is Gayrimenkul Yatirim Ortakligi AS | | | 23,800 | | | | 19,250 | |
Kardemir Karabuk Demir Celik Sanayi ve Ticaret AS, Class D | | | 38,500 | | | | 28,343 | |
KOC Holding AS | | | 23,520 | | | | 110,501 | |
Koza Altin Isletmeleri AS | | | 1,900 | | | | 41,399 | |
Koza Anadolu Metal Madencilik Isletmeleri AS(1) | | | 9,300 | | | | 23,612 | |
Petkim Petrokimya Holding AS | | | 15,600 | | | | 17,844 | |
Tekfen Holding AS | | | 6,700 | | | | 24,244 | |
Tofas Turk Otomobil Fabrikasi AS | | | 4,800 | | | | 26,797 | |
Trakya Cam Sanayii AS(1) | | | 2,530 | | | | 3,096 | |
Tupras-Turkiye Petrol Rafinerileri AS | | | 4,500 | | | | 110,061 | |
Turk Hava Yollari Anonim Ortakligi (THY) AS(1) | | | 23,500 | | | | 54,433 | |
Turk Sise ve Cam Fabrikalari AS | | | 21,446 | | | | 31,353 | |
| | | | |
| | 28 | | See Notes to Consolidated Financial Statements. |
Parametric Structured Absolute Return Portfolio
October 31, 2012
Consolidated Portfolio of Investments — continued
| | | | | | | | |
| Security | | Shares | | | Value | |
| | | | | | | | |
| | |
Turkey (continued) | | | | | | | | |
Turk Telekomunikasyon AS | | | 18,100 | | | $ | 70,749 | |
Turkcell Iletisim Hizmetleri AS(1) | | | 25,900 | | | | 158,238 | |
Turkiye Garanti Bankasi AS | | | 39,700 | | | | 189,685 | |
Turkiye Halk Bankasi AS | | | 5,800 | | | | 51,171 | |
Turkiye Is Bankasi | | | 24,300 | | | | 82,742 | |
Turkiye Sinai Kalkinma Bankasi AS | | | 25,025 | | | | 28,770 | |
Turkiye Vakiflar Bankasi TAO | | | 19,300 | | | | 45,461 | |
Ulker Gida Sanayi ve Ticaret AS | | | 5,300 | | | | 24,045 | |
Yapi ve Kredi Bankasi AS(1) | | | 16,600 | | | | 42,639 | |
Yazicilar Holding AS | | | 3,200 | | | | 25,607 | |
| | | | | | | | | |
| | | | | | $ | 1,943,399 | |
| | | | | | | | | |
| | |
United Arab Emirates — 0.4% | | | | | | | | |
Abu Dhabi Commercial Bank (PJSC) | | | 132,000 | | | $ | 118,402 | |
Abu Dhabi National Hotels | | | 13,000 | | | | 6,428 | |
Air Arabia (PJSC) | | | 286,700 | | | | 53,314 | |
Aldar Properties (PJSC) | | | 119,000 | | | | 43,458 | |
DP World, Ltd. | | | 18,000 | | | | 212,912 | |
Dubai Financial Market(1) | | | 107,700 | | | | 29,594 | |
Dubai Islamic Bank (PJSC) | | | 26,000 | | | | 14,277 | |
Emaar Properties (PJSC) | | | 164,700 | | | | 161,204 | |
First Gulf Bank (PJSC) | | | 25,200 | | | | 71,270 | |
National Bank of Abu Dhabi (PJSC) | | | 53,835 | | | | 145,082 | |
Ras Al Khaimah Ceramics(1) | | | 82,200 | | | | 26,661 | |
Union National Bank | | | 61,500 | | | | 51,728 | |
| | | | | | | | | |
| | | | | | $ | 934,330 | |
| | | | | | | | | |
| | |
United Kingdom — 2.7% | | | | | | | | |
Associated British Foods PLC | | | 4,094 | | | $ | 91,618 | |
AstraZeneca PLC | | | 10,627 | | | | 492,825 | |
BAE Systems PLC | | | 57,966 | | | | 292,569 | |
BHP Billiton PLC | | | 9,231 | | | | 295,865 | |
BP PLC | | | 56,900 | | | | 406,357 | |
Bunzl PLC | | | 1,911 | | | | 31,655 | |
Burberry Group PLC | | | 8,212 | | | | 154,944 | |
Centrica PLC | | | 79,298 | | | | 415,150 | |
Compass Group PLC | | | 12,242 | | | | 134,515 | |
Croda International PLC | | | 816 | | | | 29,053 | |
Diageo PLC | | | 3,575 | | | | 102,204 | |
Experian PLC | | | 3,566 | | | | 61,695 | |
GlaxoSmithKline PLC | | | 4,970 | | | | 111,365 | |
Globaltrans Investment PLC GDR(3) | | | 2,700 | | | | 49,990 | |
Imperial Tobacco Group PLC | | | 1,027 | | | | 38,841 | |
Kingfisher PLC | | | 5,668 | | | | 26,538 | |
Marks & Spencer Group PLC | | | 10,988 | | | | 69,934 | |
| | | | | | | | |
| Security | | Shares | | | Value | |
| | | | | | | | |
| | |
United Kingdom (continued) | | | | | | | | |
National Grid PLC | | | 1,714 | | | $ | 19,547 | |
Next PLC | | | 4,932 | | | | 284,311 | |
Randgold Resources, Ltd. | | | 1,330 | | | | 158,985 | |
Reckitt Benckiser Group PLC | | | 334 | | | | 20,235 | |
Reed Elsevier PLC | | | 2,870 | | | | 28,113 | |
Rexam PLC | | | 23,339 | | | | 168,521 | |
Rolls-Royce Holdings PLC | | | 32,731 | | | | 452,322 | |
Rolls-Royce Holdings PLC, PFC Shares(1) | | | 2,487,556 | | | | 4,014 | |
Royal Dutch Shell PLC, Class A | | | 17,627 | | | | 604,830 | |
Royal Dutch Shell PLC, Class B | | | 19,325 | | | | 683,572 | |
Sage Group PLC (The) | | | 36,503 | | | | 183,337 | |
Serco Group PLC | | | 14,171 | | | | 129,716 | |
Severn Trent PLC | | | 1,097 | | | | 28,451 | |
Shire PLC | | | 7,492 | | | | 210,672 | |
SSE PLC | | | 1,270 | | | | 29,704 | |
Subsea 7 SA | | | 4,061 | | | | 89,025 | |
Tesco PLC | | | 51,741 | | | | 267,730 | |
Tullow Oil PLC | | | 10,062 | | | | 228,596 | |
Unilever PLC | | | 603 | | | | 22,494 | |
United Utilities Group PLC | | | 1,376 | | | | 15,044 | |
Vodafone Group PLC | | | 130,295 | | | | 353,833 | |
Whitbread PLC | | | 2,865 | | | | 108,879 | |
WM Morrison Supermarkets PLC | | | 68,010 | | | | 294,466 | |
| | | | | | | | | |
| | | | | | $ | 7,191,515 | |
| | | | | | | | | |
| | |
United States — 19.3% | | | | | | | | |
3M Co. | | | 4,029 | | | $ | 352,940 | |
A.O. Smith Corp. | | | 271 | | | | 16,469 | |
Abaxis, Inc.(1) | | | 1,922 | | | | 70,691 | |
Abbott Laboratories | | | 5,546 | | | | 363,374 | |
Acadia Realty Trust | | | 2,351 | | | | 60,374 | |
Acorda Therapeutics, Inc.(1) | | | 2,871 | | | | 68,760 | |
Acuity Brands, Inc. | | | 418 | | | | 27,045 | |
Advance Auto Parts, Inc. | | | 215 | | | | 15,252 | |
Advanced Energy Industries, Inc.(1) | | | 178 | | | | 2,102 | |
Advisory Board Co. (The)(1) | | | 845 | | | | 40,138 | |
Affymax, Inc.(1) | | | 2,189 | | | | 49,887 | |
AGL Resources, Inc. | | | 1,729 | | | | 70,595 | |
Air Products and Chemicals, Inc. | | | 1,065 | | | | 82,569 | |
Airgas, Inc. | | | 769 | | | | 68,418 | |
Akamai Technologies, Inc.(1) | | | 501 | | | | 19,033 | |
Alaska Air Group, Inc.(1) | | | 1,448 | | | | 55,372 | |
Alere, Inc.(1) | | | 1,686 | | | | 32,371 | |
Alexion Pharmaceuticals, Inc.(1) | | | 1,229 | | | | 111,077 | |
Allegiant Travel Co.(1) | | | 636 | | | | 46,263 | |
Allergan, Inc. | | | 1,480 | | | | 133,082 | |
| | | | |
| | 29 | | See Notes to Consolidated Financial Statements. |
Parametric Structured Absolute Return Portfolio
October 31, 2012
Consolidated Portfolio of Investments — continued
| | | | | | | | |
| Security | | Shares | | | Value | |
| | | | | | | | |
| | |
United States (continued) | | | | | | | | |
ALLETE, Inc. | | | 1,557 | | | $ | 64,802 | |
Alliant Energy Corp. | | | 254 | | | | 11,354 | |
Allied Nevada Gold Corp.(1) | | | 1,142 | | | | 42,163 | |
Allied World Assurance Co. Holdings, Ltd. | | | 261 | | | | 20,958 | |
Altera Corp. | | | 2,732 | | | | 83,271 | |
Altria Group, Inc. | | | 13,358 | | | | 424,784 | |
Amazon.com, Inc.(1) | | | 1,448 | | | | 337,123 | |
Amdocs, Ltd. | | | 1,060 | | | | 35,054 | |
American Express Co. | | | 2,133 | | | | 119,384 | |
American Greetings Corp. | | | 1,423 | | | | 24,433 | |
American States Water Co. | | | 747 | | | | 32,883 | |
American Tower Corp. | | | 2,498 | | | | 188,074 | |
American Water Works Co., Inc. | | | 2,751 | | | | 101,072 | |
Amerigroup Corp.(1) | | | 588 | | | | 53,708 | |
AmerisourceBergen Corp. | | | 1,704 | | | | 67,206 | |
Amgen, Inc. | | | 2,715 | | | | 234,970 | |
Amsurg Corp.(1) | | | 2,208 | | | | 62,972 | |
Analog Devices, Inc. | | | 4,022 | | | | 157,300 | |
Analogic Corp. | | | 311 | | | | 22,908 | |
Anworth Mortgage Asset Corp. | | | 9,836 | | | | 60,393 | |
AOL, Inc.(1) | | | 2,076 | | | | 71,269 | |
Aon PLC | | | 5,340 | | | | 288,093 | |
Apple, Inc.(1) | | | 1,214 | | | | 722,451 | |
Applied Industrial Technologies, Inc. | | | 1,936 | | | | 78,582 | |
Applied Materials, Inc. | | | 10,835 | | | | 114,851 | |
Applied Micro Circuits Corp.(1) | | | 443 | | | | 2,569 | |
AptarGroup, Inc. | | | 278 | | | | 14,256 | |
Aqua America, Inc. | | | 2,857 | | | | 72,539 | |
Arbitron, Inc. | | | 2,655 | | | | 96,536 | |
Arch Capital Group, Ltd.(1) | | | 2,260 | | | | 99,779 | |
Argo Group International Holdings, Ltd. | | | 1,765 | | | | 60,716 | |
Arthur J. Gallagher & Co. | | | 1,506 | | | | 53,373 | |
Ascena Retail Group, Inc.(1) | | | 684 | | | | 13,543 | |
Ascent Capital Group, Inc., Series A(1) | | | 880 | | | | 52,316 | |
Associated Banc-Corp. | | | 2,471 | | | | 31,851 | |
Astoria Financial Corp. | | | 1,769 | | | | 17,743 | |
AT&T, Inc. | | | 20,733 | | | | 717,154 | |
Atlantic Power Corp. | | | 10,651 | | | | 159,978 | |
ATMI, Inc.(1) | | | 1,089 | | | | 21,508 | |
Atmos Energy Corp. | | | 625 | | | | 22,481 | |
Automatic Data Processing, Inc. | | | 5,575 | | | | 322,179 | |
AutoNation, Inc.(1) | | | 435 | | | | 19,314 | |
AutoZone, Inc.(1) | | | 257 | | | | 96,375 | |
Auxilium Pharmaceuticals, Inc.(1) | | | 2,802 | | | | 57,385 | |
Avago Technologies, Ltd. | | | 1,933 | | | | 63,847 | |
Avid Technology, Inc.(1) | | | 2,833 | | | | 16,630 | |
| | | | | | | | |
| Security | | Shares | | | Value | |
| | | | | | | | |
| | |
United States (continued) | | | | | | | | |
Avista Corp. | | | 2,940 | | | $ | 74,735 | |
Axis Capital Holdings, Ltd. | | | 1,105 | | | | 40,023 | |
AZZ, Inc. | | | 1,018 | | | | 40,150 | |
Badger Meter, Inc. | | | 95 | | | | 4,070 | |
Balchem Corp. | | | 310 | | | | 10,797 | |
Banco Latinoamericano de Comercio Exterior SA, Class E | | | 936 | | | | 21,060 | |
Bank of Hawaii Corp. | | | 1,027 | | | | 45,352 | |
Bank of New York Mellon Corp. (The) | | | 3,363 | | | | 83,100 | |
Bank of the Ozarks, Inc. | | | 480 | | | | 15,715 | |
BankUnited, Inc. | | | 892 | | | | 21,149 | |
Banner Corp. | | | 95 | | | | 2,754 | |
BB&T Corp. | | | 3,474 | | | | 100,572 | |
BBCN Bancorp, Inc. | | | 8,227 | | | | 98,148 | |
Berkshire Hathaway, Inc., Class B(1) | | | 4,321 | | | | 373,118 | |
Bio Reference Labs, Inc.(1) | | | 808 | | | | 22,430 | |
Biogen Idec, Inc.(1) | | | 653 | | | | 90,258 | |
BioMarin Pharmaceutical, Inc.(1) | | | 519 | | | | 19,224 | |
BJ’s Restaurants, Inc.(1) | | | 404 | | | | 13,352 | |
Black Hills Corp. | | | 1,679 | | | | 60,058 | |
Blackbaud, Inc. | | | 2,611 | | | | 62,063 | |
Bob Evans Farms, Inc. | | | 1,846 | | | | 70,277 | |
Boston Private Financial Holdings, Inc. | | | 2,240 | | | | 20,653 | |
Briggs & Stratton Corp. | | | 114 | | | | 2,252 | |
Bristol-Myers Squibb Co. | | | 8,350 | | | | 277,637 | |
Bristow Group, Inc. | | | 1,838 | | | | 91,753 | |
Brookline Bancorp, Inc. | | | 365 | | | | 3,095 | |
Brooks Automation, Inc. | | | 1,961 | | | | 14,158 | |
Brown and Brown, Inc. | | | 1,635 | | | | 41,774 | |
Buffalo Wild Wings, Inc.(1) | | | 272 | | | | 20,658 | |
Bunge, Ltd. | | | 1,570 | | | | 111,517 | |
C.H. Robinson Worldwide, Inc. | | | 2,614 | | | | 157,703 | |
CACI International, Inc.(1) | | | 279 | | | | 14,070 | |
California Water Service Group | | | 1,648 | | | | 30,356 | |
Campbell Soup Co. | | | 4,538 | | | | 160,055 | |
Capitol Federal Financial, Inc. | | | 4,335 | | | | 51,630 | |
Carnival Corp. | | | 2,309 | | | | 87,465 | |
Cash America International, Inc. | | | 371 | | | | 14,502 | |
Caterpillar, Inc. | | | 600 | | | | 50,886 | |
Cathay General Bancorp | | | 119 | | | | 2,105 | |
Cato Corp. (The) | | | 716 | | | | 20,320 | |
Cavium, Inc.(1) | | | 570 | | | | 18,913 | |
Celgene Corp.(1) | | | 2,991 | | | | 219,300 | |
CenturyLink, Inc. | | | 9,031 | | | | 346,610 | |
Cerner Corp.(1) | | | 1,940 | | | | 147,809 | |
CH Energy Group, Inc. | | | 444 | | | | 28,873 | |
Charles River Laboratories(1) | | | 1,062 | | | | 39,634 | |
| | | | |
| | 30 | | See Notes to Consolidated Financial Statements. |
Parametric Structured Absolute Return Portfolio
October 31, 2012
Consolidated Portfolio of Investments — continued
| | | | | | | | |
| Security | | Shares | | | Value | |
| | | | | | | | |
| | |
United States (continued) | | | | | | | | |
Cheesecake Factory, Inc. (The) | | | 534 | | | $ | 17,654 | |
Chemed Corp. | | | 1,048 | | | | 70,478 | |
Chemical Financial Corp. | | | 534 | | | | 12,560 | |
Chesapeake Lodging Trust | | | 3,061 | | | | 57,700 | |
Chevron Corp. | | | 5,754 | | | | 634,148 | |
Children’s Place Retail Stores, Inc. (The)(1) | | | 61 | | | | 3,564 | |
Chipotle Mexican Grill, Inc.(1) | | | 395 | | | | 100,539 | |
CIRCOR International, Inc. | | | 48 | | | | 1,656 | |
Cirrus Logic, Inc.(1) | | | 932 | | | | 37,988 | |
City Holding Co. | | | 521 | | | | 18,298 | |
City National Corp. | | | 1,034 | | | | 52,837 | |
Clean Energy Fuels Corp.(1) | | | 1,714 | | | | 19,625 | |
Clean Harbors, Inc.(1) | | | 1,813 | | | | 105,789 | |
Clorox Co. (The) | | | 1,193 | | | | 86,254 | |
Coca-Cola Co. (The) | | | 12,379 | | | | 460,251 | |
Cogent Communications Group, Inc. | | | 1,139 | | | | 24,728 | |
Cognizant Technology Solutions Corp., Class A(1) | | | 2,868 | | | | 191,152 | |
Colgate-Palmolive Co. | | | 833 | | | | 87,432 | |
Colony Financial, Inc. | | | 5,004 | | | | 100,130 | |
Columbia Banking System, Inc. | | | 563 | | | | 9,971 | |
Comcast Corp., Class A | | | 1,636 | | | | 61,366 | |
Comerica, Inc. | | | 2,539 | | | | 75,688 | |
Comfort Systems USA, Inc. | | | 269 | | | | 2,932 | |
Commerce Bancshares, Inc. | | | 135 | | | | 5,141 | |
Commercial Metals Co. | | | 134 | | | | 1,844 | |
comScore, Inc.(1) | | | 719 | | | | 10,188 | |
Concho Resources, Inc.(1) | | | 45 | | | | 3,875 | |
CONMED Corp. | | | 3,682 | | | | 101,844 | |
ConocoPhillips | | | 5,628 | | | | 325,580 | |
Consolidated Edison, Inc. | | | 4,839 | | | | 292,179 | |
Cooper Industries PLC | | | 1,919 | | | | 143,810 | |
Copa Holdings SA, Class A | | | 659 | | | | 61,168 | |
Corporate Executive Board Co. (The) | | | 80 | | | | 3,597 | |
Costar Group, Inc.(1) | | | 320 | | | | 26,528 | |
Costco Wholesale Corp. | | | 4,626 | | | | 455,337 | |
Covanta Holding Corp. | | | 3,410 | | | | 61,994 | |
Cracker Barrel Old Country Store, Inc. | | | 1,244 | | | | 79,181 | |
Credit Acceptance Corp.(1) | | | 192 | | | | 15,677 | |
Cree, Inc.(1) | | | 606 | | | | 18,380 | |
CreXus Investment Corp. | | | 5,405 | | | | 60,806 | |
Cullen/Frost Bankers, Inc. | | | 777 | | | | 42,968 | |
Cummins, Inc. | | | 780 | | | | 72,992 | |
CVB Financial Corp. | | | 7,964 | | | | 86,170 | |
CVR Energy, Inc.(2) | | | 122 | | | | 0 | |
CVS Caremark Corp. | | | 5,108 | | | | 237,011 | |
Danaher Corp. | | | 1,617 | | | | 83,647 | |
| | | | | | | | |
| Security | | Shares | | | Value | |
| | | | | | | | |
| | |
United States (continued) | | | | | | | | |
Darden Restaurants, Inc. | | | 2,469 | | | $ | 129,919 | |
DaVita, Inc.(1) | | | 546 | | | | 61,436 | |
Delta Air Lines, Inc.(1) | | | 2,450 | | | | 23,594 | |
Deluxe Corp. | | | 758 | | | | 23,885 | |
Devon Energy Corp. | | | 1,518 | | | | 88,363 | |
Dexcom, Inc.(1) | | | 3,460 | | | | 45,326 | |
Dime Community Bancshares, Inc. | | | 239 | | | | 3,466 | |
Discovery Communications, Inc., Class A(1) | | | 1,976 | | | | 116,624 | |
Dollar Tree, Inc.(1) | | | 318 | | | | 12,679 | |
Dominion Resources, Inc. | | | 2,526 | | | | 133,322 | |
Donaldson Co., Inc. | | | 148 | | | | 4,776 | |
DSW, Inc., Class A | | | 62 | | | | 3,881 | |
DTE Energy Co. | | | 1,213 | | | | 75,327 | |
Duke Energy Corp. | | | 5,552 | | | | 364,711 | |
E.I. du Pont de Nemours & Co. | | | 3,091 | | | | 137,611 | |
Earthlink, Inc. | | | 3,876 | | | | 24,574 | |
eBay, Inc.(1) | | | 3,719 | | | | 179,591 | |
Ecolab, Inc. | | | 3,073 | | | | 213,881 | |
Edwards Lifesciences Corp.(1) | | | 785 | | | | 68,162 | |
El Paso Electric Co. | | | 3,562 | | | | 121,072 | |
Electronics for Imaging, Inc.(1) | | | 5,006 | | | | 86,904 | |
Eli Lilly & Co. | | | 5,543 | | | | 269,556 | |
EMC Corp.(1) | | | 5,696 | | | | 139,096 | |
EMCOR Group, Inc. | | | 999 | | | | 32,128 | |
Emergent Biosolutions, Inc.(1) | | | 156 | | | | 2,073 | |
Emerson Electric Co. | | | 5,206 | | | | 252,127 | |
Endurance Specialty Holdings, Ltd. | | | 1,489 | | | | 60,379 | |
Ennis, Inc. | | | 1,146 | | | | 17,534 | |
EnPro Industries, Inc.(1) | | | 539 | | | | 19,706 | |
Ensign Group, Inc. (The) | | | 73 | | | | 2,129 | |
Enstar Group, Ltd.(1) | | | 607 | | | | 60,700 | |
Enzon Pharmaceuticals, Inc.(1) | | | 394 | | | | 2,589 | |
Equifax, Inc. | | | 1,187 | | | | 59,397 | |
Erie Indemnity Co. | | | 207 | | | | 12,880 | |
ESCO Technologies, Inc. | | | 2,149 | | | | 80,459 | |
Everest Re Group, Ltd. | | | 692 | | | | 76,847 | |
Exelon Corp. | | | 1,921 | | | | 68,733 | |
Expeditors International of Washington, Inc. | | | 1,284 | | | | 47,007 | |
Exponent, Inc.(1) | | | 386 | | | | 21,222 | |
Express Scripts Holding Co.(1) | | | 1,186 | | | | 72,986 | |
Exxon Mobil Corp. | | | 9,110 | | | | 830,559 | |
EZCorp, Inc.(1) | | | 560 | | | | 11,010 | |
FactSet Research Systems, Inc. | | | 766 | | | | 69,361 | |
Family Dollar Stores, Inc. | | | 1,027 | | | | 67,741 | |
Fastenal Co. | | | 688 | | | | 30,754 | |
FedEx Corp. | | | 2,715 | | | | 249,753 | |
| | | | |
| | 31 | | See Notes to Consolidated Financial Statements. |
Parametric Structured Absolute Return Portfolio
October 31, 2012
Consolidated Portfolio of Investments — continued
| | | | | | | | |
| Security | | Shares | | | Value | |
| | | | | | | | |
| | |
United States (continued) | | | | | | | | |
Fidelity National Information Services, Inc. | | | 2,258 | | | $ | 74,220 | |
First Cash Financial Services, Inc.(1) | | | 448 | | | | 20,008 | |
First Citizens BancShares, Inc. | | | 21 | | | | 3,544 | |
First Commonwealth Financial Corp. | | | 2,296 | | | | 15,039 | |
First Financial Bankshares, Inc. | | | 3,302 | | | | 119,631 | |
First Horizon National Corp. | | | 4,074 | | | | 37,929 | |
First Midwest Bancorp, Inc. | | | 1,278 | | | | 15,809 | |
First Niagara Financial Group, Inc. | | | 8,625 | | | | 71,415 | |
Fiserv, Inc.(1) | | | 1,110 | | | | 83,183 | |
Flushing Financial Corp. | | | 237 | | | | 3,685 | |
Foot Locker, Inc. | | | 669 | | | | 22,412 | |
Formfactor, Inc.(1) | | | 278 | | | | 1,268 | |
Forrester Research, Inc. | | | 85 | | | | 2,460 | |
Forward Air Corp. | | | 2,416 | | | | 80,622 | |
Franklin Electric Co., Inc. | | | 1,014 | | | | 58,751 | |
Fred’s, Inc., Class A | | | 136 | | | | 1,843 | |
Fresh Del Monte Produce, Inc. | | | 545 | | | | 13,718 | |
Frontier Communications Corp. | | | 17,145 | | | | 80,924 | |
FTI Consulting, Inc.(1) | | | 578 | | | | 15,005 | |
Gartner, Inc.(1) | | | 2,164 | | | | 100,431 | |
General Mills, Inc. | | | 3,945 | | | | 158,116 | |
Genesco, Inc.(1) | | | 287 | | | | 16,445 | |
Gilead Sciences, Inc.(1) | | | 1,040 | | | | 69,846 | |
Global Payments, Inc. | | | 916 | | | | 39,159 | |
Global Power Equipment Group, Inc. | | | 486 | | | | 8,213 | |
Google, Inc., Class A(1) | | | 810 | | | | 550,614 | |
Gorman-Rupp Co. (The) | | | 396 | | | | 10,692 | |
Government Properties Income Trust | | | 2,609 | | | | 57,894 | |
Granite Construction, Inc. | | | 1,060 | | | | 32,023 | |
Greatbatch, Inc.(1) | | | 748 | | | | 16,441 | |
Greenlight Capital Re, Ltd.(1) | | | 2,332 | | | | 59,583 | |
Gulfmark Offshore, Inc.(1) | | | 628 | | | | 20,297 | |
H.J. Heinz Co. | | | 1,049 | | | | 60,328 | |
Halliburton Co. | | | 1,149 | | | | 37,101 | |
Hancock Holding Co. | | | 96 | | | | 3,033 | |
Hanger Orthopedic Group, Inc.(1) | | | 2,264 | | | | 57,392 | |
Harsco Corp. | | | 72 | | | | 1,439 | |
Hawaiian Electric Industries Co. | | | 635 | | | | 16,434 | |
Haynes International, Inc. | | | 345 | | | | 17,485 | |
Healthcare Services Group, Inc. | | | 2,476 | | | | 59,176 | |
HeartWare International, Inc.(1) | | | 378 | | | | 31,744 | |
HEICO Corp. | | | 2,531 | | | | 97,773 | |
Herbalife, Ltd. | | | 344 | | | | 17,664 | |
Hershey Co. (The) | | | 849 | | | | 58,454 | |
Hillenbrand, Inc. | | | 4,098 | | | | 83,886 | |
Hittite Microwave Corp.(1) | | | 1,054 | | | | 59,699 | |
| | | | | | | | |
| Security | | Shares | | | Value | |
| | | | | | | | |
| | |
United States (continued) | | | | | | | | |
HollyFrontier Corp. | | | 5,601 | | | $ | 216,367 | |
Hologic, Inc.(1) | | | 891 | | | | 18,372 | |
Home BancShares, Inc. | | | 131 | | | | 4,538 | |
Home Depot, Inc. (The) | | | 5,550 | | | | 340,659 | |
Home Federal Bancorp Inc. | | | 165 | | | | 1,884 | |
Howard Hughes Corp. (The)(1) | | | 581 | | | | 40,670 | |
Hubbell, Inc., Class B | | | 819 | | | | 68,567 | |
Huron Consulting Group, Inc.(1) | | | 508 | | | | 14,656 | |
Hyatt Hotels Corp.(1) | | | 535 | | | | 19,528 | |
IAC/InterActiveCorp | | | 1,224 | | | | 59,180 | |
IBERIABANK Corp. | | | 578 | | | | 28,779 | |
ICF International, Inc.(1) | | | 619 | | | | 11,359 | |
ICG Group, Inc.(1) | | | 1,883 | | | | 19,734 | |
ICU Medical, Inc.(1) | | | 542 | | | | 32,157 | |
IDACORP, Inc. | | | 1,875 | | | | 83,850 | |
IDEX Corp. | | | 526 | | | | 22,371 | |
IHS, Inc.(1) | | | 719 | | | | 60,676 | |
Illinois Tool Works, Inc. | | | 3,377 | | | | 207,111 | |
Independent Bank Corp. | | | 64 | | | | 1,889 | |
Insperity, Inc. | | | 424 | | | | 11,071 | |
Integrys Energy Group, Inc. | | | 1,243 | | | | 67,172 | |
Intel Corp. | | | 23,188 | | | | 501,440 | |
International Business Machines Corp. | | | 3,810 | | | | 741,159 | |
International Rectifier Corp.(1) | | | 819 | | | | 12,686 | |
Intersil Corp. | | | 9,699 | | | | 68,378 | |
Investors Bancorp, Inc. | | | 1,430 | | | | 25,726 | |
IPC The Hospitalist Co., Inc.(1) | | | 70 | | | | 2,414 | |
Isis Pharmaceuticals, Inc.(1) | | | 2,198 | | | | 19,013 | |
ITC Holdings Corp. | | | 89 | | | | 7,086 | |
J & J Snack Foods Corp. | | | 1,452 | | | | 83,156 | |
J.B. Hunt Transport Services, Inc. | | | 68 | | | | 3,992 | |
j2 Global, Inc. | | | 3,293 | | | | 98,922 | |
Jack Henry & Associates, Inc. | | | 616 | | | | 23,408 | |
Jack in the Box, Inc.(1) | | | 3,531 | | | | 91,841 | |
JetBlue Airways Corp.(1) | | | 6,734 | | | | 35,623 | |
John Wiley & Sons, Inc., Class A | | | 776 | | | | 33,663 | |
Johnson & Johnson | | | 6,946 | | | | 491,916 | |
Jones Lang LaSalle, Inc. | | | 750 | | | | 58,305 | |
Jos. A. Bank Clothiers, Inc.(1) | | | 699 | | | | 32,706 | |
Kaiser Aluminum Corp. | | | 534 | | | | 32,350 | |
Kellogg Co. | | | 2,117 | | | | 110,761 | |
Kennametal, Inc. | | | 372 | | | | 13,176 | |
KeyCorp | | | 5,730 | | | | 48,247 | |
Kimberly-Clark Corp. | | | 678 | | | | 56,579 | |
Kinder Morgan, Inc. | | | 7,985 | | | | 277,159 | |
Kirby Corp.(1) | | | 273 | | | | 15,692 | |
| | | | |
| | 32 | | See Notes to Consolidated Financial Statements. |
Parametric Structured Absolute Return Portfolio
October 31, 2012
Consolidated Portfolio of Investments — continued
| | | | | | | | |
| Security | | Shares | | | Value | |
| | | | | | | | |
| | |
United States (continued) | | | | | | | | |
Knight Transportation, Inc. | | | 1,032 | | | $ | 15,604 | |
Kohl’s Corp. | | | 3,487 | | | | 185,787 | |
Kraft Foods Group, Inc.(1) | | | 2,014 | | | | 91,597 | |
L.B. Foster Co., Class A | | | 65 | | | | 2,146 | |
Laboratory Corp. of America Holdings(1) | | | 1,125 | | | | 95,321 | |
Laclede Group, Inc. (The) | | | 85 | | | | 3,539 | |
Lam Research Corp.(1) | | | 953 | | | | 33,736 | |
Landstar System, Inc. | | | 65 | | | | 3,292 | |
Layne Christensen Co.(1) | | | 4,051 | | | | 90,297 | |
Lennox International, Inc. | | | 972 | | | | 48,649 | |
Lindsay Corp. | | | 1,473 | | | | 112,493 | |
Lions Gate Entertainment Corp.(1) | | | 6,528 | | | | 108,887 | |
Live Nation, Inc.(1) | | | 312 | | | | 2,855 | |
LivePerson, Inc.(1) | | | 524 | | | | 8,222 | |
Loews Corp. | | | 2,581 | | | | 109,125 | |
LogMeIn, Inc.(1) | | | 288 | | | | 7,108 | |
Lowe’s Companies, Inc. | | | 4,032 | | | | 130,556 | |
LSI Corp.(1) | | | 2,402 | | | | 16,454 | |
LTC Properties, Inc. | | | 1,803 | | | | 59,517 | |
Luminex Corp.(1) | | | 903 | | | | 14,520 | |
M&T Bank Corp. | | | 3,079 | | | | 320,524 | |
Madison Square Garden Co. (The)(1) | | | 1,273 | | | | 52,397 | |
Manhattan Associates, Inc.(1) | | | 1,011 | | | | 60,660 | |
Marathon Oil Corp. | | | 2,619 | | | | 78,727 | |
Marathon Petroleum Corp. | | | 6,766 | | | | 371,656 | |
Marsh & McLennan Cos., Inc. | | | 7,940 | | | | 270,198 | |
Martin Marietta Materials, Inc. | | | 722 | | | | 59,428 | |
MasterCard, Inc., Class A | | | 717 | | | | 330,487 | |
Matson, Inc. | | | 40 | | | | 850 | |
Maxim Integrated Products, Inc. | | | 362 | | | | 9,964 | |
MAXIMUS, Inc. | | | 806 | | | | 44,475 | |
McCormick & Co., Inc. | | | 1,706 | | | | 105,124 | |
McDonald’s Corp. | | | 6,822 | | | | 592,150 | |
McGraw-Hill Cos., Inc. (The) | | | 2,828 | | | | 156,332 | |
McKesson Corp. | | | 1,807 | | | | 168,611 | |
MDC Holdings, Inc. | | | 765 | | | | 29,254 | |
Medicines Co. (The)(1) | | | 888 | | | | 19,465 | |
Men’s Wearhouse, Inc. (The) | | | 473 | | | | 15,510 | |
Merck & Co., Inc. | | | 9,284 | | | | 423,629 | |
Meredith Corp. | | | 1,343 | | | | 44,950 | |
MGE Energy, Inc. | | | 1,364 | | | | 71,801 | |
Micrel, Inc. | | | 1,588 | | | | 15,388 | |
Microchip Technology, Inc. | | | 2,817 | | | | 88,313 | |
Microsoft Corp. | | | 15,627 | | | | 445,916 | |
Minerals Technologies, Inc. | | | 466 | | | | 33,394 | |
Mondelez International, Inc., Class A | | | 8,252 | | | | 219,008 | |
| | | | | | | | |
| Security | | Shares | | | Value | |
| | | | | | | | |
| | |
United States (continued) | | | | | | | | |
Monsanto Co. | | | 2,549 | | | $ | 219,392 | |
Morningstar, Inc. | | | 230 | | | | 14,485 | |
MSCI, Inc., Class A(1) | | | 554 | | | | 14,925 | |
Mueller Industries, Inc. | | | 843 | | | | 36,923 | |
Murphy Oil Corp. | | | 1,445 | | | | 86,700 | |
MWI Veterinary Supply, Inc.(1) | | | 182 | | | | 19,114 | |
MYR Group, Inc.(1) | | | 151 | | | | 3,198 | |
National Fuel Gas Co. | | | 69 | | | | 3,636 | |
National Health Investors, Inc. | | | 1,125 | | | | 60,086 | |
National Healthcare Corp. | | | 397 | | | | 18,905 | |
National Oilwell Varco, Inc. | | | 1,213 | | | | 89,398 | |
Nektar Therapeutics(1) | | | 3,830 | | | | 34,470 | |
Neogen Corp.(1) | | | 1,438 | | | | 61,532 | |
Neustar, Inc., Class A(1) | | | 1,008 | | | | 36,883 | |
New Jersey Resources Corp. | | | 845 | | | | 37,569 | |
New York Community Bancorp, Inc. | | | 12,950 | | | | 179,487 | |
Newmont Mining Corp. | | | 9,702 | | | | 529,244 | |
NextEra Energy, Inc. | | | 2,168 | | | | 151,890 | |
NIC, Inc. | | | 4,561 | | | | 65,222 | |
NIKE, Inc., Class B | | | 650 | | | | 59,397 | |
Nordic American Tankers, Ltd. | | | 221 | | | | 1,856 | |
Nordstrom, Inc. | | | 704 | | | | 39,966 | |
Northeast Utilities | | | 1,364 | | | | 53,605 | |
Northern Trust Corp. | | | 2,242 | | | | 107,123 | |
NorthStar Realty Finance Corp. | | | 9,360 | | | | 61,495 | |
Northwest Bancshares, Inc. | | | 1,264 | | | | 15,042 | |
Northwest Natural Gas Co. | | | 439 | | | | 20,427 | |
NorthWestern Corp. | | | 3,393 | | | | 121,503 | |
NPS Pharmaceuticals, Inc.(1) | | | 322 | | | | 2,975 | |
NVR, Inc.(1) | | | 181 | | | | 163,577 | |
O’Reilly Automotive, Inc.(1) | | | 1,077 | | | | 92,277 | |
Occidental Petroleum Corp. | | | 1,056 | | | | 83,382 | |
OGE Energy Corp. | | | 1,366 | | | | 78,654 | |
Omnicare, Inc. | | | 523 | | | | 18,059 | |
Omnicell, Inc.(1) | | | 750 | | | | 10,935 | |
Omnicom Group, Inc. | | | 1,471 | | | | 70,476 | |
Oneok, Inc. | | | 2,995 | | | | 141,663 | |
OpenTable, Inc.(1) | | | 392 | | | | 18,412 | |
Optimer Pharmaceuticals, Inc.(1) | | | 224 | | | | 2,137 | |
Oracle Corp. | | | 5,099 | | | | 158,324 | |
OraSure Technologies, Inc.(1) | | | 2,027 | | | | 18,365 | |
Oritani Financial Corp. | | | 251 | | | | 3,835 | |
PacWest Bancorp | | | 170 | | | | 3,825 | |
Pall Corp. | | | 947 | | | | 59,623 | |
Panera Bread Co., Class A(1) | | | 557 | | | | 93,932 | |
Papa John’s International, Inc.(1) | | | 88 | | | | 4,692 | |
| | | | |
| | 33 | | See Notes to Consolidated Financial Statements. |
Parametric Structured Absolute Return Portfolio
October 31, 2012
Consolidated Portfolio of Investments — continued
| | | | | | | | |
| Security | | Shares | | | Value | |
| | | | | | | | |
| | |
United States (continued) | | | | | | | | |
Park National Corp. | | | 28 | | | $ | 1,863 | |
Parker Hannifin Corp. | | | 637 | | | | 50,106 | |
PartnerRe, Ltd. | | | 1,012 | | | | 81,972 | |
Paychex, Inc. | | | 3,735 | | | | 121,126 | |
Penn National Gaming, Inc.(1) | | | 436 | | | | 17,627 | |
PennyMac Mortgage Investment Trust | | | 1,550 | | | | 39,432 | |
People’s United Financial, Inc. | | | 15,905 | | | | 191,337 | |
PepsiCo, Inc. | | | 7,132 | | | | 493,820 | |
Perrigo Co. | | | 595 | | | | 68,431 | |
Pfizer, Inc. | | | 14,478 | | | | 360,068 | |
PG&E Corp. | | | 1,670 | | | | 71,008 | |
Philip Morris International, Inc. | | | 7,726 | | | | 684,215 | |
Phillips 66 | | | 1,807 | | | | 85,218 | |
Piedmont Natural Gas Co., Inc. | | | 1,147 | | | | 36,555 | |
Pinnacle Financial Partners, Inc.(1) | | | 706 | | | | 13,802 | |
Platinum Underwriters Holdings, Ltd. | | | 1,923 | | | | 85,381 | |
PNC Financial Services Group, Inc. | | | 1,865 | | | | 108,524 | |
PNM Resources, Inc. | | | 251 | | | | 5,562 | |
Portland General Electric Co. | | | 180 | | | | 4,932 | |
Power Integrations, Inc. | | | 543 | | | | 16,062 | |
PPG Industries, Inc. | | | 786 | | | | 92,025 | |
Praxair, Inc. | | | 3,379 | | | | 358,884 | |
Prestige Brands Holdings, Inc.(1) | | | 5,759 | | | | 100,149 | |
priceline.com, Inc.(1) | | | 548 | | | | 314,426 | |
Pricesmart, Inc. | | | 293 | | | | 24,316 | |
Procter & Gamble Co. | | | 6,358 | | | | 440,228 | |
Provident Financial Services, Inc. | | | 968 | | | | 14,520 | |
QUALCOMM, Inc. | | | 2,132 | | | | 124,882 | |
Quanex Building Products Corp. | | | 1,483 | | | | 29,319 | |
Quanta Services, Inc.(1) | | | 1,816 | | | | 47,089 | |
Rackspace Hosting, Inc.(1) | | | 363 | | | | 23,119 | |
Ralph Lauren Corp. | | | 500 | | | | 76,845 | |
RBC Bearings, Inc.(1) | | | 1,715 | | | | 85,167 | |
Red Robin Gourmet Burgers, Inc.(1) | | | 583 | | | | 19,472 | |
Regal-Beloit Corp. | | | 1,222 | | | | 79,650 | |
Regeneron Pharmaceuticals, Inc.(1) | | | 232 | | | | 33,014 | |
Regis Corp. | | | 3,562 | | | | 59,343 | |
RenaissanceRe Holdings, Ltd. | | | 605 | | | | 49,223 | |
Renasant Corp. | | | 115 | | | | 2,117 | |
Republic Services, Inc. | | | 4,420 | | | | 125,307 | |
Retail Opportunity Investments Corp. | | | 2,403 | | | | 30,422 | |
Reynolds American, Inc. | | | 5,944 | | | | 247,508 | |
RLI Corp. | | | 877 | | | | 59,794 | |
Rockwell Automation, Inc. | | | 283 | | | | 20,110 | |
Ross Stores, Inc. | | | 632 | | | | 38,520 | |
Royal Gold, Inc. | | | 1,114 | | | | 98,121 | |
| | | | | | | | |
| Security | | Shares | | | Value | |
| | | | | | | | |
| | |
United States (continued) | | | | | | | | |
RR Donnelley & Sons Co. | | | 3,058 | | | $ | 30,641 | |
RTI International Metals, Inc.(1) | | | 124 | | | | 2,826 | |
Ryman Hospitality Properties(1) | | | 570 | | | | 22,236 | |
S&T Bancorp, Inc. | | | 987 | | | | 17,342 | |
salesforce.com, inc.(1) | | | 521 | | | | 76,056 | |
Salix Pharmaceuticals, Ltd.(1) | | | 49 | | | | 1,913 | |
Sandy Spring Bancorp, Inc. | | | 98 | | | | 1,874 | |
SBA Communications Corp., Class A(1) | | | 993 | | | | 66,164 | |
Scansource, Inc. Com(1) | | | 2,169 | | | | 63,443 | |
SCBT Financial Corp. | | | 56 | | | | 2,222 | |
Schlumberger, Ltd. | | | 3,647 | | | | 253,576 | |
Scholastic Corp. | | | 469 | | | | 15,472 | |
SEACOR Holdings, Inc.(1) | | | 1,250 | | | | 109,637 | |
Seattle Genetics, Inc.(1) | | | 1,072 | | | | 26,972 | |
Selective Insurance Group, Inc. | | | 3,029 | | | | 56,006 | |
SemGroup Corp.(1) | | | 520 | | | | 20,093 | |
Sempra Energy | | | 2,702 | | | | 188,464 | |
Semtech Corp.(1) | | | 1,185 | | | | 29,589 | |
Sequenom, Inc.(1) | | | 4,068 | | | | 12,651 | |
Sherwin-Williams Co. (The) | | | 1,898 | | | | 270,617 | |
Sigma-Aldrich Corp. | | | 459 | | | | 32,194 | |
Signature Bank(1) | | | 2,142 | | | | 152,596 | |
Silicon Laboratories, Inc.(1) | | | 602 | | | | 24,333 | |
Simmons First National Corp., Class A | | | 64 | | | | 1,593 | |
South Jersey Industries, Inc. | | | 2,512 | | | | 127,082 | |
Southern Co. (The) | | | 7,349 | | | | 344,227 | |
Southwest Airlines Co. | | | 14,855 | | | | 131,021 | |
Southwest Gas Corp. | | | 640 | | | | 27,821 | |
Southwestern Energy Co.(1) | | | 1,662 | | | | 57,671 | |
Spectra Energy Corp. | | | 11,579 | | | | 334,286 | |
St. Jude Medical, Inc. | | | 1,397 | | | | 53,449 | |
Stage Stores, Inc. | | | 106 | | | | 2,597 | |
Standex International Corp. | | | 316 | | | | 14,612 | |
Stanley Black & Decker, Inc. | | | 1,456 | | | | 100,901 | |
Starbucks Corp. | | | 4,435 | | | | 203,566 | |
Stericycle, Inc.(1) | | | 1,795 | | | | 170,094 | |
Stryker Corp. | | | 1,122 | | | | 59,017 | |
SVB Financial Group(1) | | | 62 | | | | 3,509 | |
Sysco Corp. | | | 3,381 | | | | 105,048 | |
Targa Resources Corp. | | | 1,170 | | | | 59,588 | |
Target Corp. | | | 2,875 | | | | 183,281 | |
Techne Corp. | | | 1,218 | | | | 82,044 | |
Teekay Corp. | | | 1,030 | | | | 31,528 | |
Tejon Ranch Co.(1) | | | 64 | | | | 1,916 | |
Telephone & Data Systems, Inc. | | | 3,483 | | | | 86,622 | |
Teradata Corp.(1) | | | 1,269 | | | | 86,685 | |
| | | | |
| | 34 | | See Notes to Consolidated Financial Statements. |
Parametric Structured Absolute Return Portfolio
October 31, 2012
Consolidated Portfolio of Investments — continued
| | | | | | | | |
| Security | | Shares | | | Value | |
| | | | | | | | |
| | |
United States (continued) | | | | | | | | |
Tesoro Corp. | | | 2,403 | | | $ | 90,617 | |
Tetra Tech, Inc.(1) | | | 1,285 | | | | 33,333 | |
Texas Capital Bancshares, Inc.(1) | | | 504 | | | | 23,925 | |
Texas Industries, Inc.(1) | | | 575 | | | | 24,800 | |
Texas Instruments, Inc. | | | 7,641 | | | | 214,636 | |
Texas Roadhouse, Inc. | | | 1,171 | | | | 19,064 | |
TFS Financial Corp.(1) | | | 2,168 | | | | 19,404 | |
Thomson Reuters Corp. | | | 4,401 | | | | 124,372 | |
Time Warner, Inc. | | | 4,463 | | | | 193,917 | |
TJX Companies, Inc. (The) | | | 6,817 | | | | 283,792 | |
Toro Co. (The) | | | 482 | | | | 20,350 | |
Towers Watson & Co., Class A | | | 885 | | | | 47,533 | |
Tredegar Corp. | | | 1,164 | | | | 19,753 | |
Trex Co., Inc.(1) | | | 90 | | | | 3,145 | |
Trustco Bank Corp. | | | 2,143 | | | | 11,958 | |
Trustmark Corp. | | | 5,461 | | | | 128,170 | |
TW Telecom, Inc.(1) | | | 2,447 | | | | 62,325 | |
Tyler Technologies, Inc.(1) | | | 1,390 | | | | 66,456 | |
U.S. Bancorp | | | 6,533 | | | | 216,961 | |
UGI Corp. | | | 1,894 | | | | 61,157 | |
UIL Holdings Corp. | | | 310 | | | | 11,213 | |
Ultra Petroleum Corp.(1) | | | 985 | | | | 22,468 | |
Umpqua Holdings Corp. | | | 2,564 | | | | 30,999 | |
Union Pacific Corp. | | | 1,496 | | | | 184,053 | |
United Bankshares, Inc. | | | 3,988 | | | | 95,034 | |
United Financial Bancorp, Inc. | | | 103 | | | | 1,583 | |
United Parcel Service, Inc., Class B | | | 5,983 | | | | 438,255 | |
United Technologies Corp. | | | 2,915 | | | | 227,836 | |
United Therapeutics Corp.(1) | | | 358 | | | | 16,350 | |
UnitedHealth Group, Inc. | | | 2,569 | | | | 143,864 | |
Universal Corp., VA | | | 663 | | | | 32,858 | |
URS Corp. | | | 1,580 | | | | 52,898 | |
Valero Energy Corp. | | | 8,861 | | | | 257,855 | |
Valmont Industries, Inc. | | | 389 | | | | 52,554 | |
Valspar Corp. | | | 409 | | | | 22,916 | |
Vectren Corp. | | | 104 | | | | 3,075 | |
VeriSign, Inc.(1) | | | 2,079 | | | | 77,069 | |
Verisk Analytics, Inc., Class A(1) | | | 126 | | | | 6,426 | |
Verizon Communications, Inc. | | | 15,115 | | | | 674,734 | |
Viacom, Inc., Class B | | | 2,332 | | | | 119,562 | |
Visa, Inc., Class A | | | 3,349 | | | | 464,707 | |
Vistaprint NV(1) | | | 466 | | | | 14,199 | |
Vitamin Shoppe, Inc.(1) | | | 274 | | | | 15,684 | |
Volterra Semiconductor Corp.(1) | | | 459 | | | | 8,340 | |
W.W. Grainger, Inc. | | | 978 | | | | 196,979 | |
Wal-Mart Stores, Inc. | | | 9,838 | | | | 738,047 | |
| | | | | | | | |
| Security | | Shares | | | Value | |
| | | | | | | | |
| | |
United States (continued) | | | | | | | | |
Walgreen Co. | | | 1,930 | | | $ | 67,994 | |
Walt Disney Co. (The) | | | 1,306 | | | | 64,085 | |
Washington Federal, Inc. | | | 2,109 | | | | 35,389 | |
Washington Post Co., Class B | | | 309 | | | | 103,055 | |
Waste Connections, Inc. | | | 3,629 | | | | 119,140 | |
Waste Management, Inc. | | | 8,126 | | | | 266,045 | |
Watsco, Inc. | | | 560 | | | | 38,276 | |
Watson Pharmaceuticals, Inc.(1) | | | 2,113 | | | | 181,612 | |
Watts Water Technologies, Inc. | | | 53 | | | | 2,132 | |
Webster Financial Corp. | | | 146 | | | | 3,212 | |
Wells Fargo & Co. | | | 4,961 | | | | 167,136 | |
Wendy’s Co. (The) | | | 3,955 | | | | 16,888 | |
Wesbanco, Inc. | | | 84 | | | | 1,848 | |
Westamerica Bancorporation | | | 65 | | | | 2,868 | |
Western Alliance Bancorp(1) | | | 1,256 | | | | 12,887 | |
Western Refining, Inc. | | | 1,219 | | | | 30,317 | |
Western Union Co. | | | 1,860 | | | | 23,622 | |
WGL Holdings, Inc. | | | 936 | | | | 37,225 | |
White Mountains Insurance Group, Ltd. | | | 31 | | | | 15,894 | |
Williams Cos., Inc. | | | 1,447 | | | | 50,631 | |
Windstream Corp. | | | 1,997 | | | | 19,051 | |
Wisconsin Energy Corp. | | | 1,552 | | | | 59,705 | |
World Fuel Services Corp. | | | 1,435 | | | | 49,795 | |
WPX Energy, Inc.(1) | | | 758 | | | | 12,841 | |
Wright Medical Group, Inc.(1) | | | 4,020 | | | | 81,686 | |
Xilinx, Inc. | | | 3,164 | | | | 103,653 | |
Yahoo! Inc.(1) | | | 3,584 | | | | 60,247 | |
Yum! Brands, Inc. | | | 5,429 | | | | 380,627 | |
Zions Bancorporation | | | 2,563 | | | | 55,028 | |
| | | | | | | | | |
| | | | | | $ | 50,787,711 | |
| | | | | | | | | |
| | |
Total Common Stocks
(identified cost $144,878,920) | | | | | | $ | 151,302,116 | |
| | | | | | | | | |
| | | | | | | | | | | | |
|
| Equity-Linked Securities(5) — 1.3% | |
| | | |
| | | | | | | | | | | | |
| Security | | Maturity
Date | | | Shares | | | Value | |
| | | | | | | | | | | | |
| | | |
India(6) — 1.3% | | | | | | | | | | | | |
ABB Ltd. | | | 11/2/16 | | | | 1,900 | | | $ | 26,049 | |
Adani Enterprises Ltd. | | | 11/2/16 | | | | 7,600 | | | | 30,400 | |
Adani Ports and Special Economic Zone | | | 11/2/16 | | | | 14,900 | | | | 35,239 | |
Adani Power Ltd. | | | 11/2/16 | | | | 11,200 | | | | 10,024 | |
Apollo Hospitals Enterprises Ltd. | | | 11/2/16 | | | | 1,900 | | | | 27,541 | |
Asian Paints Ltd. | | | 8/17/16 | | | | 800 | | | | 57,552 | |
Axis Bank Ltd. | | | 10/8/14 | | | | 4,400 | | | | 96,712 | |
| | | | |
| | 35 | | See Notes to Consolidated Financial Statements. |
Parametric Structured Absolute Return Portfolio
October 31, 2012
Consolidated Portfolio of Investments — continued
| | | | | | | | | | | | |
| Security | | Maturity
Date | | | Shares | | | Value | |
| | | | | | | | | | | | |
| | | |
India (continued) | | | | | | | | | | | | |
Bajaj Auto Ltd. | | | 7/29/16 | | | | 700 | | | $ | 23,629 | |
Bank of Baroda | | | 9/29/14 | | | | 2,700 | | | | 36,410 | |
Bharat Forge Ltd. | | | 11/2/16 | | | | 4,200 | | | | 21,189 | |
Bharat Heavy Electricals Ltd. | | | 9/29/14 | | | | 13,100 | | | | 54,758 | |
Bharti Airtel Ltd. | | | 9/29/14 | | | | 26,800 | | | | 134,402 | |
Cairn India Ltd. | | | 9/29/14 | | | | 10,500 | | | | 65,625 | |
Cipla Ltd. | | | 9/29/14 | | | | 3,000 | | | | 20,250 | |
Coal India Ltd. | | | 11/2/16 | | | | 12,000 | | | | 77,220 | |
Colgate-Palmolive (India) Ltd. | | | 10/1/14 | | | | 1,300 | | | | 31,057 | |
Divi’s Laboratories Ltd. | | | 11/2/16 | | | | 1,200 | | | | 26,736 | |
DLF Ltd. | | | 11/2/16 | | | | 15,800 | | | | 59,566 | |
Essar Oil Ltd. | | | 11/2/16 | | | | 28,700 | | | | 33,436 | |
Exide Industries Ltd. | | | 11/2/16 | | | | 8,400 | | | | 22,092 | |
Federal Bank Ltd. | | | 7/29/16 | | | | 5,000 | | | | 45,025 | |
GAIL India Ltd. | | | 4/6/16 | | | | 8,100 | | | | 52,528 | |
GlaxoSmithKline Pharmaceuticals Ltd. | | | 11/3/16 | | | | 500 | | | | 18,628 | |
Glenmark Pharmaceuticals Ltd. | | | 11/2/16 | | | | 4,500 | | | | 35,820 | |
Grasim Industries Ltd. | | | 9/29/14 | | | | 300 | | | | 18,470 | |
Gujarat State Petronet Ltd. | | | 11/2/16 | | | | 16,300 | | | | 22,902 | |
Hero Motocorp Ltd. | | | 10/8/14 | | | | 1,300 | | | | 45,415 | |
Hindalco Industries Ltd. | | | 6/30/16 | | | | 19,100 | | | | 41,351 | |
Hindustan Petroleum Corp., Ltd. | | | 10/13/14 | | | | 4,800 | | | | 26,640 | |
Hindustan Unilever Ltd. | | | 10/1/14 | | | | 9,900 | | | | 100,584 | |
Hindustan Zinc Ltd. | | | 10/13/14 | | | | 11,300 | | | | 28,137 | |
IDBI Bank Ltd. | | | 11/2/16 | | | | 28,400 | | | | 48,990 | |
Idea Cellular Ltd. | | | 11/2/16 | | | | 24,600 | | | | 39,114 | |
IFCI Ltd. | | | 10/13/14 | | | | 94,100 | | | | 48,461 | |
Indiabulls Financial Services Ltd. | | | 11/2/16 | | | | 9,200 | | | | 42,734 | |
Indian Oil Corp., Ltd. | | | 4/26/16 | | | | 10,700 | | | | 51,788 | |
IndusInd Bank Ltd. | | | 12/15/14 | | | | 10,600 | | | | 71,709 | |
Infrastructure Development Finance Company Ltd. | | | 10/8/14 | | | | 22,400 | | | | 67,536 | |
ITC Ltd. | | | 9/29/14 | | | | 21,300 | | | | 111,825 | |
Jaiprakash Associates Ltd. | | | 10/13/14 | | | | 17,200 | | | | 27,950 | |
Jindal Steel and Power Ltd. JSPL | | | 9/29/14 | | | | 6,800 | | | | 49,062 | |
Kotak Mahindra Bank Ltd. | | | 10/13/14 | | | | 4,600 | | | | 51,612 | |
Larsen & Toubro Ltd. | | | 11/4/14 | | | | 2,200 | | | | 66,506 | |
Lupin Ltd. | | | 11/2/16 | | | | 2,000 | | | | 21,050 | |
Mahindra & Mahindra Ltd. | | | 10/15/14 | | | | 3,700 | | | | 60,809 | |
Maruti Suzuki India Ltd. | | | 9/29/14 | | | | 800 | | | | 21,376 | |
National Hydroelectric Power Corp., Ltd. | | | 11/2/16 | | | | 57,100 | | | | 22,840 | |
Nestle India, Ltd. | | | 9/8/15 | | | | 400 | | | | 34,936 | |
NMDC Ltd. | | | 11/2/16 | | | | 14,500 | | | | 47,560 | |
NTPC Ltd. | | | 4/26/16 | | | | 28,500 | | | | 87,637 | |
Oil and Natural Gas Corp., Ltd. | | | 4/26/16 | | | | 27,700 | | | | 138,084 | |
Oil India Ltd. | | | 11/2/16 | | | | 5,450 | | | | 48,941 | |
| | | | | | | | | | | | |
| Security | | Maturity
Date | | | Shares | | | Value | |
| | | | | | | | | | | | |
| | | |
India (continued) | | | | | | | | | | | | |
Power Finance Co. | | | 7/27/15 | | | | 16,100 | | | $ | 55,464 | |
Power Grid Corp. of India Ltd. | | | 11/16/15 | | | | 29,800 | | | | 63,176 | |
Ranbaxy Laboratories Ltd. | | | 11/2/16 | | | | 2,000 | | | | 19,560 | |
Reliance Communications Ltd. | | | 4/26/16 | | | | 10,200 | | | | 10,251 | |
Reliance Infrastructure Ltd. | | | 4/26/16 | | | | 3,900 | | | | 34,028 | |
Reliance Power Ltd. | | | 11/2/16 | | | | 9,700 | | | | 16,684 | |
Shriram Transport Finance Co. | | | 9/24/14 | | | | 4,800 | | | | 55,752 | |
Siemens Ltd. | | | 11/2/16 | | | | 3,200 | | | | 40,848 | |
Sun Pharmaceutical Industries Ltd. | | | 4/26/16 | | | | 4,300 | | | | 55,448 | |
Tata Chemicals Ltd. | | | 6/30/16 | | | | 5,500 | | | | 32,340 | |
Tata Consultancy Services Ltd. | | | 10/13/14 | | | | 7,000 | | | | 171,115 | |
Tata Power Co., Ltd. | | | 4/26/16 | | | | 25,400 | | | | 50,038 | |
Tata Steel Ltd. | | | 10/13/14 | | | | 5,500 | | | | 40,067 | |
Torrent Power Ltd. | | | 11/2/16 | | | | 800 | | | | 2,284 | |
Union Bank of India Ltd. | | | 7/29/16 | | | | 14,000 | | | | 50,890 | |
United Breweries Ltd. | | | 11/2/16 | | | | 2,200 | | | | 31,537 | |
Wipro Ltd. | | | 10/13/14 | | | | 8,200 | | | | 53,423 | |
Yes Bank Ltd. | | | 11/2/16 | | | | 5,900 | | | | 45,135 | |
| | | | | | | | | | | | | |
| | | $ | 3,313,947 | |
| | | | | | | | | | | | | |
| | | |
Kuwait(7) — 0.0%(8) | | | | | | | | | | | | |
Al Safwa Group Holding Co. KSC | | | 11/15/13 | | | | 160,000 | | | $ | 5,888 | |
Kuwait Finance House KSC | | | 1/14/14 | | | | 5,000 | | | | 13,418 | |
Kuwait Foods Co. (Americana) | | | 11/15/13 | | | | 2,500 | | | | 19,549 | |
Kuwait Pipes Industries & Oil Services Co. | | | 5/16/14 | | | | 20,000 | | | | 7,680 | |
National Mobile Telecommunications Co. KSC | | | 1/7/14 | | | | 2,500 | | | | 14,306 | |
| | | | | | | | | | | | | |
| | | $ | 60,841 | |
| | | | | | | | | | | | | |
| |
Total Equity-Linked Securities
(identified cost $3,404,879) | | | $ | 3,374,788 | |
| | |
| | | | | | |
|
| Rights(1) — 0.0%(8) | |
| | |
| | | | | | |
| Security | | Shares | | Value | |
| | | | | | |
Polimex-Mostostal SA, Exp. 12/31/12 | | 32,200 | | $ | 149 | |
| | | | | | | |
| | |
Total Rights
(identified cost $0) | | | | $ | 149 | |
| | | | | | | |
| | | | |
| | 36 | | See Notes to Consolidated Financial Statements. |
Parametric Structured Absolute Return Portfolio
October 31, 2012
Consolidated Portfolio of Investments — continued
| | | | | | | | |
| Short-Term Investments — 47.4% | |
|
| U.S. Treasury Obligations — 24.6% | |
| | |
| | | | | | | | |
| Security | | Principal
Amount
(000’s omitted) | | | Value | |
U.S. Treasury Bill, 0.00%, 1/31/13 | | $ | 12,500 | | | $ | 12,496,525 | |
U.S. Treasury Bill, 0.00%, 5/2/13 | | | 12,500 | | | | 12,490,488 | |
U.S. Treasury Bill, 0.00%, 2/7/13(9) | | | 20,000 | | | | 19,994,020 | |
U.S. Treasury Bill, 0.00%, 10/17/13 | | | 20,000 | | | | 19,967,000 | |
| | | | | | | | | |
| | |
Total U.S. Treasury Obligations
(identified cost $64,945,017) | | | | | | $ | 64,948,033 | |
| | | | | | | | | |
| | |
| Other — 22.8% | | | | | | | | |
| | |
| | | | | | | | |
| Description | | Interest
(000’s omitted) | | | Value | |
Eaton Vance Cash Reserves Fund, LLC, 0.12%(10) | | $ | 60,066 | | | $ | 60,066,122 | |
| | | | | | | | | |
| | |
Total Other
(identified cost $60,066,122) | | | | | | $ | 60,066,122 | |
| | | | | | | | | |
| | |
Total Short-Term Investments
(identified cost $125,011,139) | | | | | | $ | 125,014,155 | |
| | | | | | | | | |
| | |
Total Investments — 106.1%
(identified cost $273,294,938) | | | | | | $ | 279,691,208 | |
| | | | | | | | | |
| | |
Other Assets, Less Liabilities — (6.1)% | | | | | | $ | (15,985,729 | ) |
| | | | | | | | | |
| | |
Net Assets — 100.0% | | | | | | $ | 263,705,479 | |
| | | | | | | | | |
The percentage shown for each investment category in the Consolidated Portfolio of Investments is based on net assets.
| | | | |
| ADR | | – | | American Depositary Receipt |
| CDI | | – | | CHESS Depositary Interest |
| GDR | | – | | Global Depositary Receipt |
| PC | | – | | Participation Certificate |
| PCL | | – | | Public Company Ltd. |
| PFC Shares | | – | | Preference Shares |
| SDR | | – | | Swedish Depositary Receipt |
| | (1) | Non-income producing security. |
| | (2) | For fair value measurement disclosure purposes, security is categorized as Level 3 (see Note 8). |
| | (3) | Security exempt from registration under Regulation S of the Securities Act of 1933, which exempts from registration securities offered and sold outside the United States. Security may not be offered or sold in the United States except pursuant to an exemption from, or in a transaction not subject to, the registration requirements of the Securities Act of 1933. |
| | (4) | Indicates a foreign registered security. Shares issued to foreign investors in markets that have foreign ownership limits. |
| | (5) | Security exempt from registration pursuant to Rule 144A under the Securities Act of 1933. These securities may be sold in certain transactions (normally to qualified institutional buyers) and remain exempt from registration. At October 31, 2012, the aggregate value of these securities is $3,374,788 or 1.3% of the Portfolio’s net assets. |
| | (6) | Security whose performance, including redemption at maturity, is linked to the price of the underlying equity security. The investment is subject to credit risk of the issuing financial institution (JPMorgan Chase) in addition to the market risk of the underlying security. |
| | (7) | Security whose performance, including redemption at maturity, is linked to the price of the underlying equity security. The investment is subject to credit risk of the issuing financial institution (Citigroup Global Markets Holdings Inc.) in addition to the market risk of the underlying security. |
| | (8) | Amount is less than 0.05%. |
| | (9) | Security (or a portion thereof) has been pledged to cover collateral requirements on open financial contracts. |
| (10) | Affiliated investment company available to Eaton Vance portfolios and funds which invests in high quality, U.S. dollar denominated money market instruments. The rate shown is the annualized seven-day yield as of October 31, 2012. |
| | | | | | | | |
| Currency Concentration of Portfolio | |
| | |
| | | | | | | | |
| Currency | | Percentage
of Net Assets | | | Value | |
United States Dollar | | | 71.9 | % | | $ | 189,416,451 | |
Euro | | | 7.3 | | | | 19,042,605 | |
Hong Kong Dollar | | | 2.7 | | | | 7,178,443 | |
British Pound Sterling | | | 2.7 | | | | 7,061,840 | |
Japanese Yen | | | 2.3 | | | | 6,081,368 | |
South African Rand | | | 1.4 | | | | 3,784,550 | |
South Korean Won | | | 1.4 | | | | 3,674,240 | |
Australian Dollar | | | 1.3 | | | | 3,552,818 | |
New Taiwan Dollar | | | 1.3 | | | | 3,478,847 | |
Swiss Franc | | | 1.3 | | | | 3,431,235 | |
Other currency, less than 1% each | | | 12.5 | | | | 32,988,811 | |
| | |
Total Investments | | | 106.1 | % | | $ | 279,691,208 | |
| | |
| | | | | | | | |
| Sector Classification of Portfolio | |
| | |
| | | | | | | | |
| Sector | | Percentage
of Net Assets | | | Value | |
Financials | | | 11.4 | % | | $ | 29,972,233 | |
Industrials | | | 6.5 | | | | 17,198,625 | |
Consumer Staples | | | 6.2 | | | | 16,293,173 | |
Consumer Discretionary | | | 5.9 | | | | 15,421,541 | |
Information Technology | | | 5.8 | | | | 15,342,856 | |
Energy | | | 5.3 | | | | 13,910,639 | |
Materials | | | 5.2 | | | | 13,675,644 | |
Health Care | | | 4.6 | | | | 12,208,080 | |
Telecommunication Services | | | 4.2 | | | | 11,125,452 | |
Utilities | | | 3.6 | | | | 9,528,810 | |
Short-Term Investments | | | 47.4 | | | | 125,014,155 | |
| | |
Total Investments | | | 106.1 | % | | $ | 279,691,208 | |
| | |
| | | | |
| | 37 | | See Notes to Consolidated Financial Statements. |
Parametric Structured Absolute Return Portfolio
October 31, 2012
Consolidated Statement of Assets and Liabilities
| | | | |
| Assets | | October 31, 2012 | |
Unaffiliated investments, at value (identified cost, $213,228,816) | | $ | 219,625,086 | |
Affiliated investment, at value (identified cost, $60,066,122) | | | 60,066,122 | |
Cash | | | 6,304,176 | |
Restricted cash* | | | 5,173,550 | |
Foreign currency, at value (identified cost, $215,191) | | | 215,195 | |
Dividends receivable | | | 171,510 | |
Interest receivable from affiliated investment | | | 7,094 | |
Receivable for variation margin on open financial futures contracts | | | 344,141 | |
Receivable for open forward foreign currency exchange contracts | | | 147,139 | |
Receivable for open swap contracts | | | 1,523,159 | |
Tax reclaims receivable | | | 37,548 | |
Receivable from affiliates | | | 4,000 | |
Total assets | | $ | 293,618,720 | |
|
| Liabilities | |
Payable for investments purchased | | $ | 25,013,510 | |
Payable for open forward foreign currency exchange contracts | | | 262,100 | |
Payable for open swap contracts | | | 1,750,117 | |
Payable for closed swap contracts | | | 2,569,418 | |
Payable to affiliates: | | | | |
Investment adviser fee | | | 194,682 | |
Trustees’ fees | | | 672 | |
Accrued foreign capital gains taxes | | | 1,212 | |
Accrued expenses | | | 121,530 | |
Total liabilities | | $ | 29,913,241 | |
Net Assets applicable to investors’ interest in Portfolio | | $ | 263,705,479 | |
|
| Sources of Net Assets | |
Investors’ capital | | $ | 254,981,556 | |
Net unrealized appreciation | | | 8,723,923 | |
Total | | $ | 263,705,479 | |
| * | Represents restricted cash on deposit at the broker as collateral for open financial contracts. |
| | | | |
| | 38 | | See Notes to Consolidated Financial Statements. |
Parametric Structured Absolute Return Portfolio
October 31, 2012
Consolidated Statement of Operations
| | | | |
| Investment Income | | Year Ended
October 31, 2012 | |
Dividends (net of foreign taxes, $206,843) | | $ | 2,568,642 | |
Interest | | | 22,131 | |
Interest allocated from affiliated investment | | | 46,304 | |
Expenses allocated from affiliated investment | | | (5,955 | ) |
Total investment income | | $ | 2,631,122 | |
| |
| Expenses | | | | |
Investment adviser fee | | $ | 1,409,961 | |
Trustees’ fees and expenses | | | 5,830 | |
Custodian fee | | | 337,888 | |
Legal and accounting services | | | 119,240 | |
Stock dividend tax | | | 3,758 | |
Miscellaneous | | | 19,733 | |
Total expenses | | $ | 1,896,410 | |
Deduct — | | | | |
Allocation of expenses to affiliates | | $ | 65,577 | |
Reduction of custodian fee | | | 27 | |
Total expense reductions | | $ | 65,604 | |
| |
Net expenses | | $ | 1,830,806 | |
| |
Net investment income | | $ | 800,316 | |
| |
| Realized and Unrealized Gain (Loss) | | | | |
Net realized gain (loss) — | | | | |
Investment transactions | | $ | (1,718 | ) |
Investment transactions allocated from affiliated investment | | | 541 | |
Financial futures contracts | | | (6,360,115 | ) |
Swap contracts | | | (1,780,752 | ) |
Foreign currency and forward foreign currency exchange contract transactions | | | 397,780 | |
Net realized loss | | $ | (7,744,264 | ) |
Change in unrealized appreciation (depreciation) — | | | | |
Investments (net of increase in accrued foreign capital gains taxes of $1,212) | | $ | 6,395,058 | |
Financial futures contracts | | | 2,671,089 | |
Swap contracts | | | (226,958 | ) |
Foreign currency and forward foreign currency exchange contracts | | | (115,266 | ) |
Net change in unrealized appreciation (depreciation) | | $ | 8,723,923 | |
| |
Net realized and unrealized gain | | $ | 979,659 | |
| |
Net increase in net assets from operations | | $ | 1,779,975 | |
| | | | |
| | 39 | | See Notes to Consolidated Financial Statements. |
Parametric Structured Absolute Return Portfolio
October 31, 2012
Consolidated Statement of Changes in Net Assets
| | | | |
| Increase (Decrease) in Net Assets | | Year Ended
October 31, 2012 | |
From operations — | | | | |
Net investment income | | $ | 800,316 | |
Net realized loss from investment transactions, financial futures contracts, swap contracts and foreign currency and forward foreign currency exchange contract transactions | | | (7,744,264 | ) |
Net change in unrealized appreciation (depreciation) from investments, financial futures contracts, swap contracts, foreign currency and forward foreign currency exchange contracts | | | 8,723,923 | |
Net increase in net assets from operations | | $ | 1,779,975 | |
Capital transactions — | | | | |
Contributions | | $ | 286,927,481 | |
Withdrawals | | | (25,001,977 | ) |
Net increase in net assets from capital transactions | | $ | 261,925,504 | |
Net increase in net assets | | $ | 263,705,479 | |
| |
| Net Assets | | | | |
At beginning of year | | $ | — | |
At end of year | | $ | 263,705,479 | |
| | | | |
| | 40 | | See Notes to Consolidated Financial Statements. |
Parametric Structured Absolute Return Portfolio
October 31, 2012
Consolidated Supplementary Data
| | | | |
| Ratios/Supplemental Data | | Year Ended
October 31, 2012 | |
Ratios (as a percentage of average daily net assets): | | | | |
Expenses(1) | | | 1.30 | %(2) |
Net investment income | | | 0.56 | % |
Portfolio Turnover | | | 22 | % |
| |
Total Return | | | 1.60 | % |
| |
Net assets, end of year (000’s omitted) | | $ | 263,705 | |
| (1) | Excludes the effect of custody fee credits, if any, of less than 0.005%. |
| (2) | The investment adviser subsidized certain operating expenses (equal to 0.05% of average daily net assets for the year ended October 31, 2012). A portion of the subsidy was borne by the sub-adviser. Absent this subsidy, total return would be lower. |
| | | | |
| | 41 | | See Notes to Consolidated Financial Statements. |
Parametric Structured Absolute Return Portfolio
October 31, 2012
Notes to Consolidated Financial Statements
1 Significant Accounting Policies
Parametric Structured Absolute Return Portfolio (the Portfolio) is a Massachusetts business trust registered under the Investment Company Act of 1940, as amended (the 1940 Act), as a non-diversified, open-end management investment company. The Portfolio commenced operations on November 1, 2011. The Portfolio’s investment objective is total return. The Declaration of Trust permits the Trustees to issue interests in the Portfolio. At October 31, 2012, Eaton Vance Multi-Strategy Absolute Return Fund, Eaton Vance Multi-Strategy All Market Fund and Eaton Vance Parametric Structured Absolute Return Fund held an interest of 67.7%, 4.8% and 23.3%, respectively, in the Portfolio.
The Portfolio seeks to gain exposure to the commodity markets, in whole or in part, through investments in PSAR Commodity Subsidiary, Ltd. (the Subsidiary), a wholly-owned subsidiary of the Portfolio organized under the laws of the Cayman Islands with the same objective and investment policies and restrictions as the Portfolio. The Portfolio may invest up to 25% of its total assets in the Subsidiary. The net assets of the Subsidiary at October 31, 2012 were $12,537,014 or 4.8% of the Portfolio’s consolidated net assets. The accompanying consolidated financial statements include the accounts of the Subsidiary. Intercompany balances and transactions have been eliminated in consolidation.
The following is a summary of significant accounting policies of the Portfolio. The policies are in conformity with accounting principles generally accepted in the United States of America.
A Investment Valuation — Equity securities (including common shares of closed-end investment companies) listed on a U.S. securities exchange generally are valued at the last sale or closing price on the day of valuation or, if no sales took place on such date, at the mean between the closing bid and asked prices therefore on the exchange where such securities are principally traded. Equity securities listed on the NASDAQ Global or Global Select Market generally are valued at the NASDAQ official closing price. Unlisted or listed securities for which closing sales prices or closing quotations are not available are valued at the mean between the latest available bid and asked prices or, in the case of preferred equity securities that are not listed or traded in the over-the-counter market, by a third party pricing service that will use various techniques that consider factors including, but not limited to, prices or yields of securities with similar characteristics, benchmark yields, broker/dealer quotes, quotes of underlying common stock, issuer spreads, as well as industry and economic events. Debt obligations (including short-term obligations with a remaining maturity of more than sixty days) are generally valued on the basis of valuations provided by third party pricing services, as derived from such services’ pricing models. Inputs to the models may include, but are not limited to, reported trades, executable bid and asked prices, broker/dealer quotations, prices or yields of securities with similar characteristics, benchmark curves or information pertaining to the issuer, as well as industry and economic events. The pricing services may use a matrix approach, which considers information regarding securities with similar characteristics to determine the valuation for a security. Short-term obligations purchased with a remaining maturity of sixty days or less are generally valued at amortized cost, which approximates market value. Foreign securities and currencies are valued in U.S. dollars, based on foreign currency exchange rate quotations supplied by a third party pricing service. The pricing service uses a proprietary model to determine the exchange rate. Inputs to the model include reported trades and implied bid/ask spreads. The daily valuation of exchange-traded foreign securities generally is determined as of the close of trading on the principal exchange on which such securities trade. Events occurring after the close of trading on foreign exchanges may result in adjustments to the valuation of foreign securities to more accurately reflect their fair value as of the close of regular trading on the New York Stock Exchange. When valuing foreign equity securities that meet certain criteria, the Portfolio’s Trustees have approved the use of a fair value service that values such securities to reflect market trading that occurs after the close of the applicable foreign markets of comparable securities or other instruments that have a strong correlation to the fair-valued securities. Financial futures contracts are valued at the closing settlement price established by the board of trade or exchange on which they are traded. Forward foreign currency exchange contracts are generally valued at the mean of the average bid and average asked prices that are reported by currency dealers to a third party pricing service at the valuation time. Such third party pricing service valuations are supplied for specific settlement periods and the Portfolio’s forward foreign currency exchange contracts are valued at an interpolated rate between the closest preceding and subsequent settlement period reported by the third party pricing service. Total return swaps are valued by obtaining the value of the underlying index or instrument and reference interest rate from a third party pricing service. Investments for which valuations or market quotations are not readily available or are deemed unreliable are valued at fair value using methods determined in good faith by or at the direction of the Trustees of the Portfolio in a manner that fairly reflects the security’s value, or the amount that the Portfolio might reasonably expect to receive for the security upon its current sale in the ordinary course. Each such determination is based on a consideration of relevant factors, which are likely to vary from one pricing context to another. These factors may include, but are not limited to, the type of security, the existence of any contractual restrictions on the security’s disposition, the price and extent of public trading in similar securities of the issuer or of comparable companies or entities, quotations or relevant information obtained from broker/dealers or other market participants, information obtained from the issuer, analysts, and/or the appropriate stock exchange (for exchange-traded securities), an analysis of the company’s or entity’s financial condition, and an evaluation of the forces that influence the issuer and the market(s) in which the security is purchased and sold.
The Portfolio may invest in Eaton Vance Cash Reserves Fund, LLC (Cash Reserves Fund), an affiliated investment company managed by Eaton Vance Management (EVM). Cash Reserves Fund generally values its investment securities utilizing the amortized cost valuation technique in accordance with Rule 2a-7 under the 1940 Act. This technique involves initially valuing a portfolio security at its cost and thereafter assuming a constant amortization to maturity of any discount or premium. If amortized cost is determined not to approximate fair value, Cash Reserves Fund may value its investment securities in the same manner as debt obligations described above.
B Investment Transactions — Investment transactions for financial statement purposes are accounted for on a trade date basis. Realized gains and losses on investments sold are determined on the basis of identified cost.
Parametric Structured Absolute Return Portfolio
October 31, 2012
Notes to Consolidated Financial Statements — continued
C Income — Dividend income is recorded on the ex-dividend date for dividends received in cash and/or securities. However, if the ex-dividend date has passed, certain dividends from foreign securities are recorded as the Portfolio is informed of the ex-dividend date. Withholding taxes on foreign dividends and capital gains have been provided for in accordance with the Portfolio’s understanding of the applicable countries’ tax rules and rates. Interest income is recorded on the basis of interest accrued, adjusted for amortization of premium or accretion of discount.
D Federal Taxes — The Portfolio has elected to be treated as a partnership for federal tax purposes. No provision is made by the Portfolio for federal or state taxes on any taxable income of the Portfolio because each investor in the Portfolio is ultimately responsible for the payment of any taxes on its share of taxable income. Since at least one of the Portfolio’s investors is a regulated investment company that invests all or substantially all of its assets in the Portfolio, the Portfolio normally must satisfy the applicable source of income and diversification requirements (under the Internal Revenue Code) in order for its investors to satisfy them. The Portfolio will allocate, at least annually among its investors, each investor’s distributive share of the Portfolio’s net investment income, net realized capital gains and any other items of income, gain, loss, deduction or credit.
In addition to the requirements of the Internal Revenue Code, the Portfolio may also be subject to local taxes on the recognition of capital gains in certain countries. In determining the daily net asset value, the Portfolio estimates the accrual for such taxes, if any, based on the unrealized appreciation on certain portfolio securities and the related tax rates. Taxes attributable to unrealized appreciation are included in the change in unrealized appreciation (depreciation) on investments. Capital gains taxes on securities sold are included in net realized gain (loss) on investments.
Prior to December 1, 2011, the Portfolio was subject to a two percent transaction tax on foreign currency inflows for new investments in Brazil. For the year ended October 31, 2012, such tax amounted to $6,556 and is included in net realized gain (loss) on foreign currency and forward foreign currency exchange contract transactions.
The Subsidiary is treated as a controlled foreign corporation under the Internal Revenue Code and is not expected to be subject to U.S. federal income tax. The Portfolio is treated as a U.S. shareholder of the Subsidiary. As a result, the Portfolio is required to include in gross income for U.S. federal tax purposes all of the Subsidiary’s income, whether or not such income is distributed by the Subsidiary. If a net loss is realized by the Subsidiary, such loss is not generally available to offset the income earned by the Portfolio.
As of October 31, 2012, the Portfolio had no uncertain tax positions that would require financial statement recognition, de-recognition, or disclosure. The Portfolio files a U.S. federal income tax return annually after its fiscal year-end, which is subject to examination by the Internal Revenue Service for a period of three years from the date of filing.
E Expense Reduction — State Street Bank and Trust Company (SSBT) serves as custodian of the Portfolio. Pursuant to the custodian agreement, SSBT receives a fee reduced by credits, which are determined based on the average daily cash balance the Portfolio maintains with SSBT. All credit balances, if any, used to reduce the Portfolio’s custodian fees are reported as a reduction of expenses in the Consolidated Statement of Operations.
F Foreign Currency Translation — Investment valuations, other assets, and liabilities initially expressed in foreign currencies are translated each business day into U.S. dollars based upon current exchange rates. Purchases and sales of foreign investment securities and income and expenses denominated in foreign currencies are translated into U.S. dollars based upon currency exchange rates in effect on the respective dates of such transactions. Recognized gains or losses on investment transactions attributable to changes in foreign currency exchange rates are recorded for financial statement purposes as net realized gains and losses on investments. That portion of unrealized gains and losses on investments that results from fluctuations in foreign currency exchange rates is not separately disclosed.
G Use of Estimates — The preparation of the consolidated financial statements in conformity with accounting principles generally accepted in the United States of America requires management to make estimates and assumptions that affect the reported amounts of assets and liabilities at the date of the consolidated financial statements and the reported amounts of income and expense during the reporting period. Actual results could differ from those estimates.
H Indemnifications — Under the Portfolio’s organizational documents, its officers and Trustees may be indemnified against certain liabilities and expenses arising out of the performance of their duties to the Portfolio. Under Massachusetts law, if certain conditions prevail, interestholders in the Portfolio could be deemed to have personal liability for the obligations of the Portfolio. However, the Portfolio’s Declaration of Trust contains an express disclaimer of liability on the part of Portfolio interestholders and the By-laws provide that the Portfolio shall assume the defense on behalf of any Portfolio interestholder. Moreover, the By-laws also provide for indemnification out of Portfolio property of any interestholder held personally liable solely by reason of being or having been an interestholder for all loss or expense arising from such liability. Additionally, in the normal course of business, the Portfolio enters into agreements with service providers that may contain indemnification clauses. The Portfolio’s maximum exposure under these arrangements is unknown as this would involve future claims that may be made against the Portfolio that have not yet occurred.
I Financial Futures Contracts — Upon entering into a financial futures contract, the Portfolio is required to deposit with the broker, either in cash or securities, an amount equal to a certain percentage of the purchase price (initial margin). Subsequent payments, known as variation margin, are made or received by the Portfolio each business day, depending on the daily fluctuations in the value of the underlying security or index, and are recorded as unrealized gains or losses by the Portfolio. Gains (losses) are realized upon the expiration or closing of the financial futures contracts. Should market conditions change unexpectedly, the Portfolio may not achieve the anticipated benefits of the financial futures contracts and may realize a loss. Futures
Parametric Structured Absolute Return Portfolio
October 31, 2012
Notes to Consolidated Financial Statements — continued
contracts have minimal counterparty risk as they are exchange traded and the clearinghouse for the exchange is substituted as the counterparty, guaranteeing counterparty performance.
J Forward Foreign Currency Exchange Contracts — The Portfolio may enter into forward foreign currency exchange contracts for the purchase or sale of a specific foreign currency at a fixed price on a future date. The forward foreign currency exchange contracts are adjusted by the daily exchange rate of the underlying currency and any gains or losses are recorded as unrealized until such time as the contracts have been closed or offset by another contract with the same broker for the same settlement date and currency. Risks may arise upon entering these contracts from the potential inability of counterparties to meet the terms of their contracts and from movements in the value of a foreign currency relative to the U.S. dollar.
K Total Return Swaps — In a total return swap, the buyer receives a periodic return equal to the total return of a specified security, securities or index for a specified period of time. In return, the buyer pays the counterparty a fixed or variable stream of payments, typically based upon short-term interest rates, possibly plus or minus an agreed upon spread. During the term of the outstanding swap agreement, changes in the underlying value of the swap are recorded as unrealized gains and losses. Periodic payments received or made are recorded as realized gains or losses. The Portfolio is exposed to credit loss in the event of nonperformance by the swap counterparty. Risk may also arise from the unanticipated movements in value of interest rates, securities, or the index.
2 Investment Adviser Fee and Other Transactions with Affiliates
The investment adviser fee is earned by Boston Management and Research (BMR), a subsidiary of EVM, as compensation for investment advisory services rendered to the Portfolio and the Subsidiary. Pursuant to the investment advisory agreement between the Portfolio and BMR and the investment advisory agreement between the Subsidiary and BMR, the Portfolio and Subsidiary each pay BMR a fee at an annual rate of 1.00% of its respective average daily net assets up to $500 million and is payable monthly. On net assets of $500 million and over, the annual fee is reduced. In determining the investment adviser fee for the Portfolio and Subsidiary, the applicable advisory fee rate is based on the average daily net assets of the Portfolio (inclusive of its interest in the Subsidiary). Such fee rate is then assessed separately on the Portfolio’s average daily net assets (exclusive of its interest in the Subsidiary) and the Subsidiary’s average daily net assets to determine the amount of the investment adviser fee. Pursuant to sub-advisory agreements, BMR pays Parametric Portfolio Associates LLC (Parametric), a majority-owned subsidiary of Eaton Vance Corp., a portion of its adviser fee for sub-advisory services provided to the Portfolio and the Subsidiary. The Portfolio invests its cash in Cash Reserves Fund. EVM does not currently receive a fee for advisory services provided to Cash Reserves Fund. For the year ended October 31, 2012, the Portfolio’s investment adviser fee amounted to $1,409,961 or 1.00% of the Portfolio’s consolidated average daily net assets. Pursuant to a voluntary expense reimbursement, BMR and Parametric were allocated $65,577 in total of the Portfolio’s operating expenses for the year ended October 31, 2012.
Trustees and officers of the Portfolio who are members of EVM’s or BMR’s organizations receive remuneration for their services to the Portfolio out of the investment adviser fee. Trustees of the Portfolio who are not affiliated with the investment adviser may elect to defer receipt of all or a percentage of their annual fees in accordance with the terms of the Trustees Deferred Compensation Plan. For the year ended October 31, 2012, no significant amounts have been deferred. Certain officers and Trustees of the Portfolio are officers of the above organizations.
3 Purchases and Sales of Investments
Purchases and sales of investments, other than short-term obligations, aggregated $166,599,214 and $18,313,591, respectively, for the year ended October 31, 2012.
4 Federal Income Tax Basis of Investments
The cost and unrealized appreciation (depreciation) of investments of the Portfolio at October 31, 2012, as determined on a federal income tax basis, were as follows:
| | | | |
| |
Aggregate cost | | $ | 273,649,186 | |
| |
Gross unrealized appreciation | | $ | 10,357,775 | |
Gross unrealized depreciation | | | (4,315,753 | ) |
| |
Net unrealized appreciation | | $ | 6,042,022 | |
The net unrealized depreciation on swap contracts, foreign currency and forward foreign currency exchange contracts at October 31, 2012 on a federal income tax basis was $222,279.
Parametric Structured Absolute Return Portfolio
October 31, 2012
Notes to Consolidated Financial Statements — continued
5 Financial Instruments
The Portfolio may trade in financial instruments with off-balance sheet risk in the normal course of its investing activities. These financial instruments may include forward foreign currency exchange contracts, financial futures contracts and swap contracts and may involve, to a varying degree, elements of risk in excess of the amounts recognized for financial statement purposes. The notional or contractual amounts of these instruments represent the investment the Portfolio has in particular classes of financial instruments and do not necessarily represent the amounts potentially subject to risk. The measurement of the risks associated with these instruments is meaningful only when all related and offsetting transactions are considered.
A summary of obligations under these financial instruments at October 31, 2012 is as follows:
| | | | | | | | | | |
| Forward Foreign Currency Exchange Contracts | | | | | |
| | | | |
| | | | | | | | | | |
Purchases | |
| Settlement Date | | In Exchange For | | Deliver | | Counterparty | | Net Unrealized
Appreciation
(Depreciation) | |
| | | | |
| 11/23/12 | | Australian Dollar 3,680,530 | | United States Dollar 3,756,349 | | State Street Bank and Trust Co. | | $ | 57,886 | |
| 11/23/12 | | Australian Dollar
470,549 | | United States Dollar 484,520 | | State Street Bank and Trust Co. | | | 3,123 | |
| 11/23/12 | | Australian Dollar
490,768 | | United States Dollar 509,074 | | State Street Bank and Trust Co. | | | (477 | ) |
| 11/23/12 | | British Pound Sterling 2,346,773 | | United States Dollar 3,773,517 | | State Street Bank and Trust Co. | | | 13,316 | |
| 11/23/12 | | British Pound Sterling 329,254 | | United States Dollar 527,827 | | State Street Bank and Trust Co. | | | 3,468 | |
| 11/23/12 | | British Pound Sterling 312,178 | | United States Dollar 503,665 | | State Street Bank and Trust Co. | | | 76 | |
| 11/23/12 | | Canadian Dollar
524,931 | | United States Dollar 527,760 | | State Street Bank and Trust Co. | | | (2,403 | ) |
| 11/23/12 | | Canadian Dollar
539,546 | | United States Dollar 549,419 | | State Street Bank and Trust Co. | | | (9,436 | ) |
| 11/23/12 | | Canadian Dollar 3,687,929 | | United States Dollar 3,764,268 | | State Street Bank and Trust Co. | | | (73,350 | ) |
| 11/23/12 | | Euro
2,911,304 | | United States Dollar 3,775,554 | | State Street Bank and Trust Co. | | | (1,378 | ) |
| 11/23/12 | | Euro
397,586 | | United States Dollar 519,697 | | State Street Bank and Trust Co. | | | (4,271 | ) |
| 11/23/12 | | Euro
361,777 | | United States Dollar 474,159 | | State Street Bank and Trust Co. | | | (5,157 | ) |
| 11/23/12 | | Israeli Shekel
1,825,798 | | United States Dollar 478,521 | | State Street Bank and Trust Co. | | | (8,823 | ) |
| 11/23/12 | | Israeli Shekel
1,959,849 | | United States Dollar 513,445 | | State Street Bank and Trust Co. | | | (9,261 | ) |
| 11/23/12 | | Israeli Shekel
14,529,521 | | United States Dollar 3,787,231 | | State Street Bank and Trust Co. | | | (49,418 | ) |
| 11/23/12 | | New Zealand Dollar 4,615,448 | | United States Dollar 3,772,206 | | State Street Bank and Trust Co. | | | 18,472 | |
| 11/23/12 | | New Zealand Dollar 610,162 | | United States Dollar 497,721 | | State Street Bank and Trust Co. | | | 3,406 | |
| 11/23/12 | | New Zealand Dollar 646,071 | | United States Dollar 530,269 | | State Street Bank and Trust Co. | | | 350 | |
| 11/23/12 | | Norwegian Krone 21,527,179 | | United States Dollar 3,767,840 | | State Street Bank and Trust Co. | | | 5,159 | |
Parametric Structured Absolute Return Portfolio
October 31, 2012
Notes to Consolidated Financial Statements — continued
| | | | | | | | | | |
| Forward Foreign Currency Exchange Contracts (continued) | | | | | |
| | | | |
| | | | | | | | | | |
Purchases | |
| Settlement Date | | In Exchange For | | Deliver | | Counterparty | | Net Unrealized
Appreciation
(Depreciation) | |
| | | | |
| 11/23/12 | | Norwegian Krone 2,869,953 | | United States Dollar 505,647 | | State Street Bank and Trust Co. | | $ | (2,640 | ) |
| 11/23/12 | | Norwegian Krone 2,709,870 | | United States Dollar 481,549 | | State Street Bank and Trust Co. | | | (6,599 | ) |
| 11/23/12 | | Singapore Dollar 4,626,588 | | United States Dollar 3,786,481 | | State Street Bank and Trust Co. | | | 6,341 | |
| 11/23/12 | | Singapore Dollar
615,573 | | United States Dollar 503,837 | | State Street Bank and Trust Co. | | | 803 | |
| 11/23/12 | | Singapore Dollar
597,276 | | United States Dollar 490,588 | | State Street Bank and Trust Co. | | | (948 | ) |
| 11/23/12 | | Swedish Krona 25,261,584 | | United States Dollar 3,775,480 | | State Street Bank and Trust Co. | | | 30,704 | |
| 11/23/12 | | Swedish Krona
3,215,115 | | United States Dollar 487,693 | | State Street Bank and Trust Co. | | | (3,269 | ) |
| 11/23/12 | | Swedish Krona
3,036,819 | | United States Dollar 463,262 | | State Street Bank and Trust Co. | | | (5,702 | ) |
| 11/23/12 | | Swiss Franc
3,518,066 | | United States Dollar 3,774,830 | | State Street Bank and Trust Co. | | | 3,938 | |
| 11/23/12 | | Swiss Franc
479,514 | | United States Dollar 518,002 | | State Street Bank and Trust Co. | | | (2,954 | ) |
| 11/23/12 | | Swiss Franc
440,180 | | United States Dollar 477,377 | | State Street Bank and Trust Co. | | | (4,578 | ) |
| 11/26/12 | | Japanese Yen
41,032,471 | | United States Dollar 513,998 | | State Street Bank and Trust Co. | | | 97 | |
| 11/26/12 | | Japanese Yen
42,885,735 | | United States Dollar 541,213 | | State Street Bank and Trust Co. | | | (3,898 | ) |
| 11/26/12 | | Japanese Yen 295,082,183 | | United States Dollar 3,764,620 | | State Street Bank and Trust Co. | | | (67,538 | ) |
| | | | |
| | | | | | | | | $ | (114,961 | ) |
| | | | | | | | | | | | | | | | |
| Futures Contracts | |
Expiration
Month/Year | | Contracts | | Position | | Aggregate Cost | | | Value | | | Net
Unrealized
Appreciation | |
| | | | | |
| 12/12 | | 325
E-mini MSCI EAFE Index | | Short | | $ | (25,208,778 | ) | | $ | (24,674,001 | ) | | $ | 534,777 | |
| 12/12 | | 494
E-mini MSCI Emerging Markets Index | | Short | | | (24,896,880 | ) | | | (24,453,000 | ) | | | 443,880 | |
| 12/12 | | 564
E-mini S&P 500 Index | | Short | | | (40,936,950 | ) | | | (39,671,760 | ) | | | 1,265,190 | |
| 12/12 | | 664
United States Dollar Index | | Long | | | 52,684,126 | | | | 53,111,368 | | | | 427,242 | |
| | | | | |
| | | | | | | | | | | | | | | $ | 2,671,089 | |
Parametric Structured Absolute Return Portfolio
October 31, 2012
Notes to Consolidated Financial Statements — continued
| | | | | | | | | | | | | | | | | | | | |
| Total Return Swaps | | | | | | | | | | | | | |
| Counterparty | | Notional
Amount | | Portfolio
Pays/Receives
Return on
Reference
Index | | Reference Index | | Portfolio
Pays/Receives
Rate | | | Rate | | Expiration
Date | | | Net Unrealized
Appreciation
(Depreciation) | |
| | | | | | | |
| Bank of America | | $22,504,681 | | Pays | | Total Return on MSCI Daily Net Emerging Markets USD Index | | | Receives | | | 3-Month
USD-LIBOR-
BBA+0.07% | | | 10/31/13 | | | $ | 238 | |
| Bank of America | | 24,750,153 | | Pays | | Total Return on MSCI Daily Net EAFE USD Index | | | Receives | | | 3-Month
USD-LIBOR-
BBA-0.32% | | | 10/31/13 | | | | (5 | ) |
| Merrill Lynch International | | 37,885,968 | | Pays | | Excess Return on Dow Jones - UBS Commodity Index | | | Pays | | | 0.15% | | | 12/12/12 | | | | 1,044,107 | |
| Merrill Lynch International | | 11,772,899 | | Pays | | Excess Return on Dow Jones - UBS Commodity Index | | | Pays | | | 0.15 | | | 12/12/12 | | | | 391,420 | |
| Merrill Lynch International | | 3,127,841 | | Receives | | Excess Return on S&P GSCI 1 Month Forward Aluminum Index | | | Pays | | | 0.23 | | | 12/12/12 | | | | (139,460 | ) |
| Merrill Lynch International | | 980,392 | | Receives | | Excess Return on S&P GSCI 1 Month Forward Aluminum Index | | | Pays | | | 0.23 | | | 12/12/12 | | | | (56,481 | ) |
| Merrill Lynch International | | 781,960 | | Receives | | Excess Return on S&P GSCI 1 Month Forward Brent Crude Index | | | Pays | | | 0.23 | | | 12/12/12 | | | | (37,002 | ) |
| Merrill Lynch International | | 245,098 | | Receives | | Excess Return on S&P GSCI 1 Month Forward Brent Crude Index | | | Pays | | | 0.23 | | | 12/12/12 | | | | (9,826 | ) |
| Merrill Lynch International | | 3,127,841 | | Receives | | Excess Return on S&P GSCI 1 Month Forward Copper Index | | | Pays | | | 0.23 | | | 12/12/12 | | | | (176,238 | ) |
| Merrill Lynch International | | 980,392 | | Receives | | Excess Return on S&P GSCI 1 Month Forward Copper Index | | | Pays | | | 0.23 | | | 12/12/12 | | | | (55,206 | ) |
| Merrill Lynch International | | 781,960 | | Receives | | Excess Return on S&P GSCI 1 Month Forward Crude Oil Index | | | Pays | | | 0.23 | | | 12/12/12 | | | | (53,417 | ) |
| Merrill Lynch International | | 245,098 | | Receives | | Excess Return on S&P GSCI 1 Month Forward Crude Oil Index | | | Pays | | | 0.23 | | | 12/12/12 | | | | (16,594 | ) |
Parametric Structured Absolute Return Portfolio
October 31, 2012
Notes to Consolidated Financial Statements — continued
| | | | | | | | | | | | | | | | | | | | | | |
| Total Return Swaps (continued) | | | | | | | | | | | | | |
| Counterparty | | Notional
Amount | | | Portfolio
Pays/Receives
Return on
Reference
Index | | Reference Index | | Portfolio
Pays/Receives
Rate | | Rate | | | Expiration
Date | | | Net Unrealized
Appreciation
(Depreciation) | |
| | | | | | | | | | | | | | | | | | | | | | |
| Merrill Lynch International | | $ | 3,127,841 | | | Receives | | Excess Return on S&P GSCI 1 Month Forward GasOil Index | | Pays | | | 0.23 | % | | | 12/12/12 | | | $ | (102,849 | ) |
| Merrill Lynch International | | | 980,392 | | | Receives | | Excess Return on S&P GSCI 1 Month Forward GasOil Index | | Pays | | | 0.23 | | | | 12/12/12 | | | | (29,061 | ) |
| Merrill Lynch International | | | 3,127,841 | | | Receives | | Excess Return on S&P GSCI 1 Month Forward Gold Index | | Pays | | | 0.23 | | | | 12/12/12 | | | | (60,701 | ) |
| Merrill Lynch International | | | 980,392 | | | Receives | | Excess Return on S&P GSCI 1 Month Forward Gold Index | | Pays | | | 0.23 | | | | 12/12/12 | | | | (14,451 | ) |
| Merrill Lynch International | | | 1,563,920 | | | Receives | | Excess Return on S&P GSCI 1 Month Forward Lead Index | | Pays | | | 0.23 | | | | 12/12/12 | | | | (70,740 | ) |
| Merrill Lynch International | | | 490,196 | | | Receives | | Excess Return on S&P GSCI 1 Month Forward Lead Index | | Pays | | | 0.23 | | | | 12/12/12 | | | | (21,517 | ) |
| Merrill Lynch International | | | 1,563,920 | | | Receives | | Excess Return on S&P GSCI 1 Month Forward Nickel Index | | Pays | | | 0.23 | | | | 12/12/12 | | | | (90,357 | ) |
| Merrill Lynch International | | | 490,196 | | | Receives | | Excess Return on S&P GSCI 1 Month Forward Nickel Index | | Pays | | | 0.23 | | | | 12/12/12 | | | | (32,052 | ) |
| Merrill Lynch International | | | 1,563,920 | | | Receives | | Excess Return on S&P GSCI 1 Month Forward Silver Index | | Pays | | | 0.23 | | | | 12/12/12 | | | | (43,337 | ) |
| Merrill Lynch International | | | 490,196 | | | Receives | | Excess Return on S&P GSCI 1 Month Forward Silver Index | | Pays | | | 0.23 | | | | 12/12/12 | | | | (8,302 | ) |
| Merrill Lynch International | | | 3,127,841 | | | Receives | | Excess Return on S&P GSCI 1 Month Forward Unleaded Gasoline Index | | Pays | | | 0.23 | | | | 12/12/12 | | | | (175,910 | ) |
| Merrill Lynch International | | | 980,392 | | | Receives | | Excess Return on S&P GSCI 1 Month Forward Unleaded Gasoline Index | | Pays | | | 0.23 | | | | 12/12/12 | | | | (42,817 | ) |
Parametric Structured Absolute Return Portfolio
October 31, 2012
Notes to Consolidated Financial Statements — continued
| | | | | | | | | | | | | | | | | | | | | | |
| Total Return Swaps (continued) | | | | | | | | | | | | | |
| Counterparty | | Notional
Amount | | | Portfolio
Pays/Receives
Return on
Reference
Index | | Reference Index | | Portfolio
Pays/Receives
Rate | | Rate | | | Expiration
Date | | | Net Unrealized
Appreciation
(Depreciation) | |
| | | | | | | | | | | | | | | | | | | | | | |
| Merrill Lynch International | | $ | 1,563,920 | | | Receives | | Excess Return on S&P GSCI 1 Month Forward Zinc Index | | Pays | | | 0.23 | % | | | 12/12/12 | | | $ | (46,551 | ) |
| Merrill Lynch International | | | 490,196 | | | Receives | | Excess Return on S&P GSCI 1 Month Forward Zinc Index | | Pays | | | 0.23 | | | | 12/12/12 | | | | (14,526 | ) |
| Merrill Lynch International | | | 245,098 | | | Receives | | Excess Return on S&P GSCI Platinum Index | | Pays | | | 0.23 | | | | 12/12/12 | | | | (9,967 | ) |
| Merrill Lynch International | | | 781,960 | | | Receives | | Excess Return on S&P GSCI Platinum Index | | Pays | | | 0.23 | | | | 12/12/12 | | | | (43,840 | ) |
| Merrill Lynch International | | | 781,960 | | | Receives | | Excess Return on S&P GSCI 1 Month Forward Cocoa Index | | Pays | | | 0.28 | | | | 12/12/12 | | | | 563 | |
| Merrill Lynch International | | | 245,098 | | | Receives | | Excess Return on S&P GSCI 1 Month Forward Cocoa Index | | Pays | | | 0.28 | | | | 12/12/12 | | | | (4,732 | ) |
| Merrill Lynch International | | | 781,960 | | | Receives | | Excess Return on S&P GSCI 1 Month Forward Coffee Index | | Pays | | | 0.28 | | | | 12/12/12 | | | | (31,414 | ) |
| Merrill Lynch International | | | 245,098 | | | Receives | | Excess Return on S&P GSCI 1 Month Forward Coffee Index | | Pays | | | 0.28 | | | | 12/12/12 | | | | (5,882 | ) |
| Merrill Lynch International | | | 1,563,920 | | | Receives | | Excess Return on S&P GSCI 1 Month Forward Corn Index | | Pays | | | 0.28 | | | | 12/12/12 | | | | 25,548 | |
| Merrill Lynch International | | | 490,196 | | | Receives | | Excess Return on S&P GSCI 1 Month Forward Corn Index | | Pays | | | 0.28 | | | | 12/12/12 | | | | (1,505 | ) |
| Merrill Lynch International | | | 781,960 | | | Receives | | Excess Return on S&P GSCI 1 Month Forward Cotton Index | | Pays | | | 0.28 | | | | 12/12/12 | | | | (45,970 | ) |
| Merrill Lynch International | | | 245,098 | | | Receives | | Excess Return on S&P GSCI 1 Month Forward Cotton Index | | Pays | | | 0.28 | | | | 12/12/12 | | | | (13,153 | ) |
| Merrill Lynch International | | | 781,960 | | | Receives | | Excess Return on S&P GSCI 1 Month Forward Lean Hogs Index | | Pays | | | 0.28 | | | | 12/12/12 | | | | (4,690 | ) |
Parametric Structured Absolute Return Portfolio
October 31, 2012
Notes to Consolidated Financial Statements — continued
| | | | | | | | | | | | | | | | | | | | | | |
| Total Return Swaps (continued) | | | | | | | | | | | | | |
| Counterparty | | Notional
Amount | | | Portfolio
Pays/Receives
Return on
Reference
Index | | Reference Index | | Portfolio
Pays/Receives
Rate | | Rate | | | Expiration
Date | | | Net Unrealized
Appreciation
(Depreciation) | |
| | | | | | | | | | | | | | | | | | | | | | |
| Merrill Lynch International | | $ | 245,098 | | | Receives | | Excess Return on S&P GSCI 1 Month Forward Lean Hogs Index | | Pays | | | 0.28 | % | | | 12/12/12 | | | $ | (2,468 | ) |
| Merrill Lynch International | | | 1,563,920 | | | Receives | | Excess Return on S&P GSCI 1 Month Forward Live Cattle Index | | Pays | | | 0.28 | | | | 12/12/12 | | | | (15,083 | ) |
| Merrill Lynch International | | | 490,196 | | | Receives | | Excess Return on S&P GSCI 1 Month Forward Live Cattle Index | | Pays | | | 0.28 | | | | 12/12/12 | | | | (5,832 | ) |
| Merrill Lynch International | | | 1,563,920 | | | Receives | | Excess Return on S&P GSCI 1 Month Forward Soybeans Index | | Pays | | | 0.28 | | | | 12/12/12 | | | | 41,817 | |
| Merrill Lynch International | | | 490,196 | | | Receives | | Excess Return on S&P GSCI 1 Month Forward Soybeans Index | | Pays | | | 0.28 | | | | 12/12/12 | | | | 741 | |
| Merrill Lynch International | | | 1,563,920 | | | Receives | | Excess Return on S&P GSCI 1 Month Forward Sugar Index | | Pays | | | 0.28 | | | | 12/12/12 | | | | (50,726 | ) |
| Merrill Lynch International | | | 490,196 | | | Receives | | Excess Return on S&P GSCI 1 Month Forward Sugar Index | | Pays | | | 0.28 | | | | 12/12/12 | | | | (8,225 | ) |
| Merrill Lynch International | | | 1,563,920 | | | Receives | | Excess Return on S&P GSCI 1 Month Forward Wheat Index | | Pays | | | 0.28 | | | | 12/12/12 | | | | 18,725 | |
| Merrill Lynch International | | | 490,196 | | | Receives | | Excess Return on S&P GSCI 1 Month Forward Wheat Index | | Pays | | | 0.28 | | | | 12/12/12 | | | | (886 | ) |
| Merrill Lynch International | | | 490,196 | | | Receives | | Excess Return on Dow Jones - UBS 3 Month Forward Soybean Oil Subindex | | Pays | | | 0.33 | | | | 12/12/12 | | | | (20,439 | ) |
| Merrill Lynch International | | | 1,563,920 | | | Receives | | Excess Return on Dow Jones - UBS 3 Month Forward Soybean Oil Subindex | | Pays | | | 0.33 | | | | 12/12/12 | | | | (29,130 | ) |
Parametric Structured Absolute Return Portfolio
October 31, 2012
Notes to Consolidated Financial Statements — continued
| | | | | | | | | | | | | | | | | | | | | | |
| Total Return Swaps (continued) | | | | | | | | | | | | | |
| Counterparty | | Notional
Amount | | | Portfolio
Pays/Receives
Return on
Reference
Index | | Reference Index | | Portfolio
Pays/Receives
Rate | | Rate | | | Expiration
Date | | | Net Unrealized
Appreciation
(Depreciation) | |
| | | | | | | | | | | | | | | | | | | | | | |
| Merrill Lynch International | | $ | 3,127,841 | | | Receives | | Excess Return on S&P GSCI Enhanced Natural Gas Official Close Index | | Pays | | | 0.38 | % | | | 12/12/12 | | | $ | (108,009 | ) |
| Merrill Lynch International | | | 980,392 | | | Receives | | Excess Return on S&P GSCI Enhanced Natural Gas Official Close Index | | Pays | | | 0.38 | | | | 12/12/12 | | | | (50,766 | ) |
| | | | | | | |
| | | | | | | | | | | | | | | | | | | | | $ | (226,958 | ) |
At October 31, 2012, the Portfolio had sufficient cash and/or securities to cover commitments under these contracts.
In the normal course of pursuing its investment objective, the Portfolio is subject to the following risks:
Commodity Risk: Commodity risk is the risk that the value of a commodity or commodity index will fluctuate based on increases or decreases in the commodities market and factors specific to a particular industry or commodity. The Portfolio invests in commodities-linked derivative investments, including total return swaps based on a commodity index that provide exposure to the investment returns of the commodities market, without investing directly in physical commodities.
Equity Price Risk: The Portfolio enters into total return swap agreements on equity indices to enhance return, to hedge against fluctuations in securities prices or as substitution for the purchase or sale of securities. The Portfolio also enters into equity index futures contracts to enhance return or hedge volatility as an overall asset/risk instrument.
Foreign Exchange Risk: The Portfolio enters into forward foreign currency exchange contracts and currency futures contracts to enhance return, to hedge against fluctuations in currency exchange rates and/or as a substitute for the purchase or sale of securities or currencies.
The Portfolio enters into swap contracts and forward foreign currency exchange contracts that may contain provisions whereby the counterparty may terminate the contract under certain conditions, including but not limited to a decline in the Portfolio’s net assets below a certain level over a certain period of time, which would trigger a payment by the Portfolio for those derivatives in a liability position. At October 31, 2012, the fair value of derivatives with credit-related contingent features in a net liability position was $2,012,217. The aggregate fair value of assets pledged as collateral by the Portfolio for such liability was $4,318,708 at October 31, 2012.
The non-exchange traded derivatives in which the Portfolio invests, including swap contracts and forward foreign currency exchange contracts, are subject to the risk that the counterparty to the contract fails to perform its obligations under the contract. At October 31, 2012, the maximum amount of loss the Portfolio would incur due to counterparty risk was $1,670,298, with the highest amount from any one counterparty being $1,522,921. To mitigate this risk, the Portfolio (and Subsidiary) has entered into master netting agreements with substantially all of its derivative counterparties, which allows it and a counterparty to aggregate amounts owed by each of them for derivative transactions under the agreement into a single net amount payable by either the Portfolio (and Subsidiary) or the counterparty. At October 31, 2012, the maximum amount of loss the Portfolio would incur due to counterparty risk would be reduced by approximately $1,670,000, due to master netting agreements. Counterparties may be required to pledge collateral in the form of cash, U.S. Government securities or highly-rated bonds for the benefit of the Portfolio if the net amount due from the counterparty with respect to a derivative contract exceeds a certain threshold. The amount of collateral posted by the counterparties with respect to such contracts would also reduce the amount of any loss incurred. Because the Subsidiary is not registered under the 1940 Act, it may not be able to negotiate terms with its counterparties that are equivalent to those a registered portfolio may negotiate. As a result, the Subsidiary may have greater exposure to those counterparties than a registered portfolio.
Parametric Structured Absolute Return Portfolio
October 31, 2012
Notes to Consolidated Financial Statements — continued
The fair value of open derivative instruments (not considered to be hedging instruments for accounting disclosure purposes) by risk exposure at October 31, 2012 was as follows:
| | | | | | | | | | | | |
| | | Fair Value | |
| Consolidated Statement of Assets and Liabilities Caption | | Equity Price | | | Foreign
Exchange | | | Commodity | |
| | | |
Net unrealized appreciation* | | $ | 2,243,847 | | | $ | 427,242 | | | $ | — | |
Receivable for open forward foreign currency exchange contracts | | | — | | | | 147,139 | | | | — | |
Receivable for open swap contracts | | | 238 | | | | — | | | | 1,522,921 | |
| | | |
Total Asset Derivatives | | $ | 2,244,085 | | | $ | 574,381 | | | $ | 1,522,921 | |
| | | |
Payable for open forward foreign currency exchange contracts | | $ | — | | | $ | (262,100 | ) | | $ | — | |
Payable for open swap contracts | | | (5 | ) | | | — | | | | (1,750,112 | ) |
| | | |
Total Liability Derivatives | | $ | (5 | ) | | $ | (262,100 | ) | | $ | (1,750,112 | ) |
| | | |
| | | | | | | | | | | | |
* Amount represents cumulative unrealized appreciation or (depreciation) on futures contracts in the Futures Contracts table above. Only the current day’s variation margin on open futures contracts is reported within the Consolidated Statement of Assets and Liabilities as Receivable or Payable for variation margin, as applicable. | |
| | | |
| | | | | | | | | | | | |
| The effect of derivative instruments (not considered to be hedging instruments for accounting disclosure purposes) on the Consolidated Statement of Operations by risk exposure for the year ended October 31, 2012 was as follows: | |
| | | |
| | | | | | | | | | | | |
| Consolidated Statement of Operations Caption | | Equity Price | | | Foreign
Exchange | | | Commodity | |
| | | |
Net realized gain (loss) — | | | | | | | | | | | | |
Financial futures contracts | | $ | (5,968,610 | ) | | $ | (391,505 | ) | | $ | — | |
Swap contracts | | | (2,095,946 | ) | | | — | | | | 315,194 | |
Foreign currency and forward foreign currency exchange contract transactions | | | — | | | | 404,705 | | | | — | |
| | | |
Total | | $ | (8,064,556 | ) | | $ | 13,200 | | | $ | 315,194 | |
| | | |
Change in unrealized appreciation (depreciation) — | | | | | | | | | | | | |
Financial futures contracts | | $ | 2,243,847 | | | $ | 427,242 | | | $ | — | |
Swap contracts | | | 233 | | | | — | | | | (227,191 | ) |
Foreign currency and forward foreign currency exchange contracts | | | — | | | | (114,961 | ) | | | — | |
| | | |
Total | | $ | 2,244,080 | | | $ | 312,281 | | | $ | (227,191 | ) |
The average notional amounts of futures contracts, forward foreign currency exchange contracts and swap contracts outstanding during the year ended October 31, 2012, which are indicative of the volume of these derivative types, were approximately $67,591,000, $27,713,000 and $88,306,000, respectively.
6 Line of Credit
The Portfolio participates with other portfolios and funds managed by EVM and its affiliates in a $600 million unsecured line of credit agreement with a group of banks. Borrowings are made by the Portfolio solely to facilitate the handling of unusual and/or unanticipated short-term cash requirements. Interest is charged to the Portfolio based on its borrowings at an amount above either the Eurodollar rate or Federal Funds rate. In addition, a fee computed at an annual rate of 0.08% on the daily unused portion of the line of credit is allocated among the participating portfolios and funds at the end of each quarter. Because the line of credit is not available exclusively to the Portfolio, it may be unable to borrow some or all of its requested amounts at any particular time. The Portfolio did not have any significant borrowings or allocated fees during the year ended October 31, 2012.
Parametric Structured Absolute Return Portfolio
October 31, 2012
Notes to Consolidated Financial Statements — continued
7 Risks Associated with Foreign Investments
Investing in securities issued by companies whose principal business activities are outside the United States may involve significant risks not present in domestic investments. For example, there is generally less publicly available information about foreign companies, particularly those not subject to the disclosure and reporting requirements of the U.S. securities laws. Certain foreign issuers are generally not bound by uniform accounting, auditing, and financial reporting requirements and standards of practice comparable to those applicable to domestic issuers. Investments in foreign securities also involve the risk of possible adverse changes in investment or exchange control regulations, expropriation or confiscatory taxation, limitation on the removal of funds or other assets of the Portfolio, political or financial instability or diplomatic and other developments which could affect such investments. Foreign securities markets, while growing in volume and sophistication, are generally not as developed as those in the United States, and securities of some foreign issuers (particularly those located in developing countries) may be less liquid and more volatile than securities of comparable U.S. companies. In general, there is less overall governmental supervision and regulation of foreign securities markets, broker/dealers and issuers than in the United States.
8 Fair Value Measurements
Under generally accepted accounting principles for fair value measurements, a three-tier hierarchy to prioritize the assumptions, referred to as inputs, is used in valuation techniques to measure fair value. The three-tier hierarchy of inputs is summarized in the three broad levels listed below.
| Ÿ | | Level 1 – quoted prices in active markets for identical investments |
| Ÿ | | Level 2 – other significant observable inputs (including quoted prices for similar investments, interest rates, prepayment speeds, credit risk, etc.) |
| Ÿ | | Level 3 – significant unobservable inputs (including a fund’s own assumptions in determining the fair value of investments) |
In cases where the inputs used to measure fair value fall in different levels of the fair value hierarchy, the level disclosed is determined based on the lowest level input that is significant to the fair value measurement in its entirety. The inputs or methodology used for valuing securities are not necessarily an indication of the risk associated with investing in those securities.
At October 31, 2012, the hierarchy of inputs used in valuing the Portfolio’s investments and open derivative instruments, which are carried at value, were as follows:
| | | | | | | | | | | | | | | | |
| Asset Description | | Level 1 | | | Level 2 | | | Level 3* | | | Total | |
| | | | | | | | | | | | | | | | |
| | | | |
Common Stocks | | | | | | | | | | | | | | | | |
Asia/Pacific | | $ | 1,329,313 | | | $ | 33,519,399 | | | $ | 159 | | | $ | 34,848,871 | |
Developed Europe | | | 423,863 | | | | 35,529,528 | | | | — | | | | 35,953,391 | |
Emerging Europe | | | 705,219 | | | | 8,362,068 | | | | — | | | | 9,067,287 | |
Latin America | | | 10,948,180 | | | | — | | | | — | | | | 10,948,180 | |
Middle East/Africa | | | 420,657 | | | | 9,276,019 | | | | — | | | | 9,696,676 | |
North America | | | 50,787,711 | | | | — | | | | 0 | | | | 50,787,711 | |
| | | | |
Total Common Stocks | | $ | 64,614,943 | | | $ | 86,687,014 | ** | | $ | 159 | | | $ | 151,302,116 | |
| | | | |
Equity-Linked Securities | | $ | — | | | $ | 3,374,788 | | | $ | — | | | $ | 3,374,788 | |
Rights | | | 149 | | | | — | | | | — | | | | 149 | |
Short-Term Investments — | | | | | | | | | | | | | | | | |
U.S. Treasury Obligations | | | — | | | | 64,948,033 | | | | — | | | | 64,948,033 | |
Other | | | — | | | | 60,066,122 | | | | — | | | | 60,066,122 | |
| | | | |
Total Investments | | $ | 64,615,092 | | | $ | 215,075,957 | | | $ | 159 | | | $ | 279,691,208 | |
| | | | |
Forward Foreign Currency Exchange Contracts | | $ | — | | | $ | 147,139 | | | $ | — | | | $ | 147,139 | |
Futures Contracts | | | 2,671,089 | | | | — | | | | — | | | | 2,671,089 | |
Swap Contracts | | | — | | | | 1,523,159 | | | | — | | | | 1,523,159 | |
| | | | |
Total | | $ | 67,286,181 | | | $ | 216,746,255 | | | $ | 159 | | | $ | 284,032,595 | |
Parametric Structured Absolute Return Portfolio
October 31, 2012
Notes to Consolidated Financial Statements — continued
| | | | | | | | | | | | | | | | |
| Liability Description | | Level 1 | | | Level 2 | | | Level 3* | | | Total | |
| | | | | | | | | | | | | | | | |
| | | | |
Forward Foreign Currency Exchange Contracts | | $ | — | | | $ | (262,100 | ) | | $ | — | | | $ | (262,100 | ) |
Swap Contracts | | | — | | | | (1,750,117 | ) | | | — | | | | (1,750,117 | ) |
| | | | |
Total | | $ | — | | | $ | (2,012,217 | ) | | $ | — | | | $ | (2,012,217 | ) |
| * | None of the unobservable inputs for Level 3 assets, individually or collectively, had a material impact on the Portfolio. |
| ** | Includes foreign equity securities whose values were adjusted to reflect market trading of comparable securities or other correlated instruments that occurred after the close of trading in their applicable foreign markets. |
Level 3 investments at the beginning and/or end of the period in relation to net assets were not significant and accordingly, a reconciliation of Level 3 assets for the year ended October 31, 2012 is not presented.
Parametric Structured Absolute Return Portfolio
October 31, 2012
Report of Independent Registered Public Accounting Firm
To the Trustees and Investors of Parametric Structured Absolute Return Portfolio:
We have audited the accompanying consolidated statement of assets and liabilities of Parametric Structured Absolute Return Portfolio and subsidiary (the “Portfolio”), including the consolidated portfolio of investments, as of October 31, 2012, and the related consolidated statement of operations, the consolidated statement of changes in net assets, and the consolidated supplementary data for the year then ended. These consolidated financial statements and consolidated supplementary data are the responsibility of the Portfolio’s management. Our responsibility is to express an opinion on these consolidated financial statements and consolidated supplementary data based on our audit.
We conducted our audit in accordance with the standards of the Public Company Accounting Oversight Board (United States). Those standards require that we plan and perform the audit to obtain reasonable assurance about whether the consolidated financial statements and consolidated supplementary data are free of material misstatement. The Portfolio is not required to have, nor were we engaged to perform, an audit of its internal control over financial reporting. Our audit included consideration of internal control over financial reporting as a basis for designing audit procedures that are appropriate in the circumstances, but not for the purpose of expressing an opinion on the effectiveness of the Portfolio’s internal control over financial reporting. Accordingly, we express no such opinion. An audit also includes examining, on a test basis, evidence supporting the amounts and disclosures in the financial statements, assessing the accounting principles used and significant estimates made by management, as well as evaluating the overall financial statement presentation. Our procedures included confirmation of securities owned as of October 31, 2012, by correspondence with the custodian and brokers; where replies were not received from brokers, we performed other auditing procedures. We believe that our audit provides a reasonable basis for our opinion.
In our opinion, such consolidated financial statements and consolidated supplementary data referred to above present fairly, in all material respects, the financial position of Parametric Structured Absolute Return Portfolio and subsidiary as of October 31, 2012, the results of their operations, the changes in their net assets, and the supplementary data for the year then ended, in conformity with accounting principles generally accepted in the United States of America.
DELOITTE & TOUCHE LLP
Boston, Massachusetts
December 21, 2012
Eaton Vance
Parametric Structured Absolute Return Fund
October 31, 2012
Management and Organization
Fund Management. The Trustees of Eaton Vance Mutual Funds Trust (the Trust) and Parametric Structured Absolute Return Portfolio (the Portfolio) are responsible for the overall management and supervision of the Trust’s and Portfolio’s affairs. The Trustees and officers of the Trust and the Portfolio are listed below. Except as indicated, each individual has held the office shown or other offices in the same company for the last five years. Trustees and officers of the Trust and the Portfolio hold indefinite terms of office. The “Noninterested Trustees” consist of those Trustees who are not “interested persons” of the Trust and the Portfolio, as that term is defined under the 1940 Act. The business address of each Trustee and officer is Two International Place, Boston, Massachusetts 02110. As used below, “EVC” refers to Eaton Vance Corp., “EV” refers to Eaton Vance, Inc., “EVM” refers to Eaton Vance Management, “BMR” refers to Boston Management and Research and “EVD” refers to Eaton Vance Distributors, Inc. EVC and EV are the corporate parent and trustee, respectively, of EVM and BMR. EVD is the Fund’s principal underwriter, the Portfolio’s placement agent and a wholly-owned subsidiary of EVC. Each officer affiliated with Eaton Vance may hold a position with other Eaton Vance affiliates that is comparable to his or her position with EVM listed below. Each Trustee oversees 187 portfolios in the Eaton Vance Complex (including all master and feeder funds in a master feeder structure). Each officer serves as an officer of certain other Eaton Vance funds. Each Trustee and officer serves until his or her successor is elected.
| | | | | | |
| Name and Year of Birth | | Position(s) with the Trust
and the
Portfolio | | Length of
Service | | Principal Occupation(s) and Directorships During Past Five Years and Other Relevant Experience |
Interested Trustee |
| | | |
Thomas E. Faust Jr. 1958 | | Trustee | | Of the Trust since 2007 and of the Portfolio since 2011 | | Chairman, Chief Executive Officer and President of EVC, Director and President of EV, Chief Executive Officer and President of EVM and BMR, and Director of EVD. Trustee and/or officer of 187 registered investment companies. Mr. Faust is an interested person because of his positions with EVM, BMR, EVD, EVC and EV, which are affiliates of the Trust and the Portfolio. Directorships in the Last Five Years.(1) Director of EVC and Hexavest Inc. |
| | | |
| | | | | | |
Noninterested Trustees |
| | | |
Scott E. Eston 1956 | | Trustee | | Since 2011 | | Private investor. Formerly held various positions at Grantham, Mayo, Van Otterloo and Co., L.L.C. (investment management firm) (1997-2009), including Chief Operating Officer (2002-2009), Chief Financial Officer (1997-2009) and Chairman of the Executive Committee (2002-2008); President and Principal Executive Officer, GMO Trust (open-end registered investment company) (2006-2009). Former Partner, Coopers and Lybrand L.L.P. (now PricewaterhouseCoopers) (public accounting firm) (1987-1997). Directorships in the Last Five Years. None. |
| | | |
Benjamin C. Esty 1963 | | Trustee | | Of the Trust since 2005 and of the Portfolio since 2011 | | Roy and Elizabeth Simmons Professor of Business Administration and Finance Unit Head, Harvard University Graduate School of Business Administration. Directorships in the Last Five Years.(1) None. |
| | | |
Allen R. Freedman 1940 | | Trustee | | Of the Trust since 2007 and of the Portfolio since 2011 | | Private Investor. Former Chairman (2002-2004) and a Director (1983-2004) of Systems & Computer Technology Corp. (provider of software to higher education). Formerly, a Director of Loring Ward International (fund distributor) (2005-2007). Former Chairman and a Director of Indus International, Inc. (provider of enterprise management software to the power generating industry) (2005-2007). Former Chief Executive Officer of Assurant, Inc. (insurance provider) (1979-2000). Directorships in the Last Five Years.(1) Director of Stonemor Partners, L.P. (owner and operator of cemeteries). Formerly, Director of Assurant, Inc. (insurance provider) (1979-2011). |
| | | |
William H. Park 1947 | | Trustee | | Of the Trust since 2003 and of the Portfolio since 2011 | | Consultant and private investor. Formerly, Chief Financial Officer, Aveon Group L.P. (investment management firm) (2010-2011). Formerly, Vice Chairman, Commercial Industrial Finance Corp. (specialty finance company) (2006-2010). Formerly, President and Chief Executive Officer, Prizm Capital Management, LLC (investment management firm) (2002-2005). Formerly, Executive Vice President and Chief Financial Officer, United Asset Management Corporation (investment management firm) (1982-2001). Formerly, Senior Manager, Price Waterhouse (now PricewaterhouseCoopers) (an independent registered public accounting firm) (1972-1981). Directorships in the Last Five Years.(1) None. |
Eaton Vance
Parametric Structured Absolute Return Fund
October 31, 2012
Management and Organization — continued
| | | | | | |
| Name and Year of Birth | | Position(s) with the Trust
and the
Portfolio | | Length of
Service | | Principal Occupation(s) and Directorships During Past Five Years and Other Relevant Experience |
Noninterested Trustees (continued) |
| | | |
Ronald A. Pearlman 1940 | | Trustee | | Of the Trust since 2003 and of the Portfolio since 2011 | | Professor of Law, Georgetown University Law Center. Formerly, Deputy Assistant Secretary (Tax Policy) and Assistant Secretary (Tax Policy), U.S. Department of the Treasury (1983-1985). Formerly, Chief of Staff, Joint Committee on Taxation, U.S. Congress (1988-1990). Directorships in the Last Five Years.(1) None. |
| | | |
Helen Frame Peters 1948 | | Trustee | | Of the Trust since 2008 and of the Portfolio since 2011 | | Professor of Finance, Carroll School of Management, Boston College. Formerly, Dean, Carroll School of Management, Boston College (2000-2002). Formerly, Chief Investment Officer, Fixed Income, Scudder Kemper Investments (investment management firm) (1998-1999). Formerly, Chief Investment Officer, Equity and Fixed Income, Colonial Management Associates (investment management firm) (1991-1998). Directorships in the Last Five Years.(1) Formerly, Director of BJ’s Wholesale Club, Inc. (wholesale club retailer) (2004-2011). Formerly, Trustee of SPDR Index Shares Funds and SPDR Series Trust (exchange traded funds) (2000-2009). Formerly, Director of Federal Home Loan Bank of Boston (a bank for banks) (2007-2009). |
| | | |
Lynn A. Stout 1957 | | Trustee | | Of the Trust since 1998 and of the Portfolio since 2011 | | Distinguished Professor of Corporate and Business Law, Jack G. Clarke Business Law Institute, Cornell University Law School. Formerly, the Paul Hastings Professor of Corporate and Securities Law (2006-2012) and Professor of Law (2001-2006), University of California at Los Angeles School of Law. Directorships in the Last Five Years.(1) None. |
| | | |
Harriett Tee Taggart 1948 | | Trustee | | Since 2011 | | Managing Director, Taggart Associates (a professional practice firm). Formerly, Partner and Senior Vice President, Wellington Management Company, LLP (investment management firm) (1983-2006). Directorships in the Last Five Years. Director of Albemarle Corporation (chemicals manufacturer) (since 2007) and The Hanover Group (specialty property and casualty insurance company) (since 2009). Formerly, Director of Lubrizol Corporation (specialty chemicals) (2007-2011). |
| | | |
Ralph F. Verni 1943 | | Chairman of the Board and Trustee | | Chairman of the Board since 2007, Trustee of the Trust since 2005 and of the Portfolio since 2011 | | Consultant and private investor. Formerly, Chief Investment Officer (1982-1992), Chief Financial Officer (1988-1990) and Director (1982-1992), New England Life. Formerly, Chairperson, New England Mutual Funds (1982-1992). Formerly, President and Chief Executive Officer, State Street Management & Research (1992-2000). Formerly, Chairperson, State Street Research Mutual Funds (1992-2000). Formerly, Director, W.P. Carey, LLC (1998-2004) and First Pioneer Farm Credit Corp. (2002-2006). Directorships in the Last Five Years.(1) None. |
Principal Officers who are not Trustees |
| Name and Year of Birth | | Position(s)
with the Trust
and the Portfolio | | Length of Service | | Principal Occupation(s) During Past Five Years |
Duncan W. Richardson 1957 | | President | | Since 2011 | | Director of EVC and Executive Vice President and Chief Equity Investment Officer of EVC, EVM and BMR. |
| | | |
Payson F. Swaffield 1956 | | Vice President of the Trust | | Since 2011 | | Vice President and Chief Income Investment Officer of EVM and BMR. |
| | | |
Barbara E. Campbell 1957 | | Treasurer | | Of the Trust since 2005 and of the Portfolio since 2011 | | Vice President of EVM and BMR. |
Eaton Vance
Parametric Structured Absolute Return Fund
October 31, 2012
Management and Organization — continued
| | | | | | |
| Name and Year of Birth | | Position(s) with the Trust
and the
Portfolio | | Length of
Service | | Principal Occupation(s) During Past Five Years |
Principal Officers who are not Trustees (continued) |
| | | |
Maureen A. Gemma 1960 | | Vice President, Secretary and Chief Legal Officer | | Vice President since 2011; Secretary of the Trust since 2007 and of the Portfolio since 2011; and Chief Legal Officer of the Trust since 2008 and of the Portfolio since 2011 | | Vice President of EVM and BMR. |
| | | |
Paul M. O’Neil 1953 | | Chief Compliance Officer | | Of the Trust since 2004 and of the Portfolio since 2011 | | Vice President of EVM and BMR. |
| (1) | During their respective tenures, the Trustees (except Mr. Eston and Ms. Taggart) also served as trustees of one or more of the following Eaton Vance funds (which operated in the years noted): Eaton Vance Credit Opportunities Fund (launched in 2005 and terminated in 2010); Eaton Vance Insured Florida Plus Municipal Bond Fund (launched in 2002 and terminated in 2009); and Eaton Vance National Municipal Income Trust (launched in 1998 and terminated in 2009). |
The SAI for the Fund includes additional information about the Trustees and officers of the Fund and the Portfolio and can be obtained without charge on Eaton Vance’s website at www.eatonvance.com or by calling 1-800-262-1122.
Eaton Vance Funds
IMPORTANT NOTICES
Privacy. The Eaton Vance organization is committed to ensuring your financial privacy. Each of the financial institutions identified below has in effect the following policy (“Privacy Policy”) with respect to nonpublic personal information about its customers:
| Ÿ | | Only such information received from you, through application forms or otherwise, and information about your Eaton Vance fund transactions will be collected. This may include information such as name, address, social security number, tax status, account balances and transactions. |
| Ÿ | | None of such information about you (or former customers) will be disclosed to anyone, except as permitted by law (which includes disclosure to employees necessary to service your account). In the normal course of servicing a customer’s account, Eaton Vance may share information with unaffiliated third parties that perform various required services such as transfer agents, custodians and broker-dealers. |
| Ÿ | | Policies and procedures (including physical, electronic and procedural safeguards) are in place that are designed to protect the confidentiality of such information. |
| Ÿ | | We reserve the right to change our Privacy Policy at any time upon proper notification to you. Customers may want to review our Privacy Policy periodically for changes by accessing the link on our homepage: www.eatonvance.com. |
Our pledge of privacy applies to the following entities within the Eaton Vance organization: the Eaton Vance Family of Funds, Eaton Vance Management, Eaton Vance Investment Counsel, Eaton Vance Distributors, Inc., Eaton Vance Trust Company, Eaton Vance Management’s Real Estate Investment Group and Boston Management and Research. In addition, our Privacy Policy applies only to those Eaton Vance customers who are individuals and who have a direct relationship with us. If a customer’s account (i.e., fund shares) is held in the name of a third-party financial advisor/broker-dealer, it is likely that only such advisor’s privacy policies apply to the customer. This notice supersedes all previously issued privacy disclosures. For more information about Eaton Vance’s Privacy Policy, please call 1-800-262-1122.
Delivery of Shareholder Documents. The Securities and Exchange Commission (SEC) permits funds to deliver only one copy of shareholder documents, including prospectuses, proxy statements and shareholder reports, to fund investors with multiple accounts at the same residential or post office box address. This practice is often called “householding” and it helps eliminate duplicate mailings to shareholders. Eaton Vance, or your financial advisor, may household the mailing of your documents indefinitely unless you instruct Eaton Vance, or your financial advisor, otherwise. If you would prefer that your Eaton Vance documents not be householded, please contact Eaton Vance at 1-800-262-1122, or contact your financial advisor. Your instructions that householding not apply to delivery of your Eaton Vance documents will be effective within 30 days of receipt by Eaton Vance or your financial advisor.
Portfolio Holdings. Each Eaton Vance Fund and its underlying Portfolio(s) (if applicable) will file a schedule of portfolio holdings on Form N-Q with the SEC for the first and third quarters of each fiscal year. The Form N-Q will be available on the Eaton Vance website at www.eatonvance.com, by calling Eaton Vance at 1-800-262-1122 or in the EDGAR database on the SEC’s website at www.sec.gov. Form N-Q may also be reviewed and copied at the SEC’s public reference room in Washington, D.C. (call 1-800-732-0330 for information on the operation of the public reference room).
Proxy Voting. From time to time, funds are required to vote proxies related to the securities held by the funds. The Eaton Vance Funds or their underlying Portfolios (if applicable) vote proxies according to a set of policies and procedures approved by the Funds’ and Portfolios’ Boards. You may obtain a description of these policies and procedures and information on how the Funds or Portfolios voted proxies relating to portfolio securities during the most recent 12-month period ended June 30, without charge, upon request, by calling 1-800-262-1122 and by accessing the SEC’s website at www.sec.gov.
This Page Intentionally Left Blank
Investment Adviser of Parametric Structured Absolute Return Portfolio
Boston Management and Research
Two International Place
Boston, MA 02110
Sub-Adviser of Parametric Structured Absolute Return Portfolio and Eaton Vance Parametric Structured Absolute Return Fund
Parametric Portfolio Associates LLC
1918 Eighth Avenue, Suite 3100
Seattle, WA 98101
Investment Adviser and Administrator of Eaton Vance Parametric Structured Absolute Return Fund
Eaton Vance Management
Two International Place
Boston, MA 02110
Principal Underwriter*
Eaton Vance Distributors, Inc.
Two International Place
Boston, MA 02110
(617) 482-8260
Custodian
State Street Bank and Trust Company
200 Clarendon Street
Boston, MA 02116
Transfer Agent
BNY Mellon Investment Servicing (US) Inc.
Attn: Eaton Vance Funds
P.O. Box 9653
Providence, RI 02940-9653
(800) 262-1122
Independent Registered Public Accounting Firm
Deloitte & Touche LLP
200 Berkeley Street
Boston, MA 02116-5022
Fund Offices
Two International Place
Boston, MA 02110
| * | FINRA BrokerCheck. Investors may check the background of their Investment Professional by contacting the Financial Industry Regulatory Authority (FINRA). FINRA BrokerCheck is a free tool to help investors check the professional background of current and former FINRA-registered securities firms and brokers. FINRA BrokerCheck is available by calling 1-800-289-9999 and at www.FINRA.org. The FINRA BrokerCheck brochure describing this program is available to investors at www.FINRA.org. |
Item 2. Code of Ethics
Not required in this filing.
Item 3. Audit Committee Financial Expert
The registrant’s Board has designated William H. Park, an independent trustee, as its audit committee financial expert. Mr. Park is a certified public accountant who is a consultant and private investor. Previously, he served as the Chief Financial Officer of Aveon Group, L.P. (an investment management firm), as the Vice Chairman of Commercial Industrial Finance Corp. (specialty finance company), as President and Chief Executive Officer of Prizm Capital Management, LLC (investment management firm), as Executive Vice President and Chief Financial Officer of United Asset Management Corporation (an institutional investment management firm) and as a Senior Manager at Price Waterhouse (now PricewaterhouseCoopers) (an independent registered public accounting firm).
Item 4. Principal Accountant Fees and Services
(a)-(d)
Eaton Vance Diversified Currency Income Fund, Eaton Vance Emerging Markets Local Income Fund, Eaton Vance Floating-Rate & High Income Fund, Eaton Vance Floating-Rate Advantage Fund, Eaton Vance Floating-Rate Fund, Eaton Vance Global Dividend Income Fund, Eaton Vance Global Macro Absolute Return Advantage Fund, Eaton Vance Global Macro Absolute Return Fund, Eaton Vance Government Obligations Fund, Eaton Vance High Income Opportunities Fund, Eaton Vance Low Duration Government Income Fund (formerly, Eaton Vance Low Duration Fund), Eaton Vance Multi-Strategy Absolute Return Fund, Eaton Vance Multi-Strategy All Market Fund, Eaton Vance Parametric Structured Absolute Return Fund, Eaton Vance Tax- Managed Multi-Cap Growth Fund, Eaton Vance Tax-Managed Equity Asset Allocation Fund, Eaton Vance Tax-Managed Global Dividend Income Fund, Eaton Vance Tax-Managed International Equity Fund, Eaton Vance Tax-Managed Small-Cap Fund, Eaton Vance Tax-Managed Small-Cap Value Fund, Eaton Vance Tax-Managed Value Fund, and Eaton Vance U.S. Government Money Market Fund, (the “Fund(s)”) are series of Eaton Vance Mutual Funds Trust (the “Trust”), a Massachusetts business trust, which, including the Funds, contains a total of 34 series (the “Series”). The Trust is registered under the Investment Company Act of 1940 as an open-end management investment company. This Form N-CSR relates to the Funds’ annual reports.
The following table presents the aggregate fees billed to the fund for the fund’s fiscal years ended October 31, 2011 and October 31, 2012 by the fund’s principal accountant, Deloitte & Touche LLP (“D&T”), for professional services rendered for the audit of the fund’s annual financial statements and fees billed for other services rendered by D&T during such periods.
| | | | | | | | |
Eaton Vance Diversified Currency Income Fund Fiscal Years Ended | | 10/31/11 | | | 10/31/12 | |
Audit Fees | | $ | 10,960 | | | $ | 11,820 | |
Audit-Related Fees(1) | | $ | 0 | | | $ | 0 | |
Tax Fees(2) | | $ | 9,140 | | | $ | 9,390 | |
All Other Fees(3) | | $ | 300 | | | $ | 310 | |
| | | | | | | | |
Total | | $ | 20,400 | | | $ | 21,520 | |
| | | | | | | | |
| | | | | | | | |
Eaton Vance Emerging Markets Local Income Fund Fiscal Years Ended | | 10/31/11 | | | 10/31/12 | |
Audit Fees | | $ | 10,960 | | | $ | 11,820 | |
Audit-Related Fees(1) | | $ | 0 | | | $ | 0 | |
Tax Fees(2) | | $ | 9,265 | | | $ | 9,515 | |
All Other Fees(3) | | $ | 1,200 | | | $ | 1,240 | |
| | | | | | | | |
Total | | $ | 21,425 | | | $ | 22,575 | |
| | | | | | | | |
| | | | | | | | |
Eaton Vance Floating-Rate Fund Fiscal Years Ended | | 10/31/11 | | | 10/31/12 | |
Audit Fees | | $ | 13,685 | | | $ | 14,590 | |
Audit-Related Fees(1) | | $ | 0 | | | $ | 0 | |
Tax Fees(2) | | $ | 7,840 | | | $ | 8,040 | |
All Other Fees(3) | | $ | 1,200 | | | $ | 1,240 | |
| | | | | | | | |
Total | | $ | 22,725 | | | $ | 23,870 | |
| | | | | | | | |
| | | | | | | | |
Eaton Vance Floating-Rate Advantage Fund Period Ended | | 10/31/11 | | | 10/31/12 | |
Audit Fees | | $ | 16,700 | | | $ | 17,680 | |
Audit-Related Fees(1) | | $ | 0 | | | $ | 0 | |
Tax Fees(2) | | $ | 21,210 | | | $ | 21,810 | |
All Other Fees(3) | | $ | 1,200 | | | $ | 1,240 | |
| | | | | | | | |
Total | | $ | 39,110 | | | $ | 40,730 | |
| | | | | | | | |
| | | | | | | | |
Eaton Vance Floating-Rate & High Income Fund Fiscal Years Ended | | 10/31/11 | | | 10/31/12 | |
Audit Fees | | $ | 18,735 | | | $ | 19,580 | |
Audit-Related Fees(1) | | $ | 0 | | | $ | 0 | |
Tax Fees(2) | | $ | 8,340 | | | $ | 8,540 | |
All Other Fees(3) | | $ | 300 | | | $ | 310 | |
| | | | | | | | |
Total | | $ | 27,375 | | | $ | 28,430 | |
| | | | | | | | |
| | | | | | | | |
Eaton Vance Global Dividend Income Fund Fiscal Years Ended | | 10/31/11 | | | 10/31/12 | |
Audit Fees | | $ | 12,765 | | | $ | 32,960 | |
Audit-Related Fees(1) | | $ | 0 | | | $ | 0 | |
Tax Fees(2) | | $ | 8,660 | | | $ | 11,690 | |
All Other Fees(3) | | $ | 1,200 | | | $ | 930 | |
| | | | | | | | |
Total | | $ | 22,625 | | | $ | 45,580 | |
| | | | | | | | |
| | | | | | | | |
Eaton Vance Global Macro Absolute Return Advantage Fund Fiscal Years Ended | | 10/31/11 | | | 10/31/12 | |
Audit Fees | | $ | 26,550 | | | $ | 27,740 | |
Audit-Related Fees(1) | | $ | 0 | | | $ | 0 | |
Tax Fees(2) | | $ | 8,000 | | | $ | 10,250 | |
All Other Fees(3) | | $ | 3,200 | | | $ | 1,240 | |
| | | | | | | | |
Total | | $ | 37,750 | | | $ | 39,230 | |
| | | | | | | | |
| | | | | | | | |
Eaton Vance Global Macro Absolute Return Fund Fiscal Years Ended | | 10/31/11 | | | 10/31/12 | |
Audit Fees | | $ | 18,800 | | | $ | 19,820 | |
Audit-Related Fees(1) | | $ | 0 | | | $ | 0 | |
Tax Fees(2) | | $ | 10,835 | | | $ | 11,085 | |
All Other Fees(3) | | $ | 1,200 | | | $ | 1,240 | |
| | | | | | | | |
Total | | $ | 30,835 | | | $ | 32,145 | |
| | | | | | | | |
| | | | | | | | |
Eaton Vance Government Obligations Fund Fiscal Years Ended | | 10/31/11 | | | 10/31/12 | |
Audit Fees | | $ | 26,080 | | | $ | 27,260 | |
Audit-Related Fees(1) | | $ | 0 | | | $ | 0 | |
Tax Fees(2) | | $ | 12,260 | | | $ | 12,610 | |
All Other Fees(3) | | $ | 300 | | | $ | 310 | |
| | | | | | | | |
Total | | $ | 38,640 | | | $ | 40,180 | |
| | | | | | | | |
| | | | | | | | |
Eaton Vance High Income Opportunities Fund Fiscal Years Ended | | 10/31/11 | | | 10/31/12 | |
Audit Fees | | $ | 13,935 | | | $ | 14,850 | |
Audit-Related Fees(1) | | $ | 0 | | | $ | 0 | |
Tax Fees(2) | | $ | 8,100 | | | $ | 8,300 | |
All Other Fees(3) | | $ | 300 | | | $ | 310 | |
| | | | | | | | |
Total | | $ | 22,335 | | | $ | 23,460 | |
| | | | | | | | |
| | | | | | | | |
Eaton Vance Low Duration Government Income Fund (formerly, Eaton Vance Low Duration Fund) Fiscal Years Ended | | 10/31/11 | | | 10/31/12 | |
Audit Fees | | $ | 26,080 | | | $ | 27,080 | |
Audit-Related Fees(1) | | $ | 0 | | | $ | 0 | |
Tax Fees(2) | | $ | 13,550 | | | $ | 13,900 | |
All Other Fees(3) | | $ | 300 | | | $ | 310 | |
| | | | | | | | |
Total | | $ | 39,930 | | | $ | 41,290 | |
| | | | | | | | |
| | |
Eaton Vance Multi-Strategy Absolute Return Fund Fiscal Years Ended | | 10/31/11 | | | 10/31/12 | |
Audit Fees | | $ | 18,800 | | | $ | 19,640 | |
Audit-Related Fees(1) | | $ | 0 | | | $ | 0 | |
Tax Fees(2) | | $ | 22,940 | | | $ | 16,890 | |
All Other Fees(3) | | $ | 300 | | | $ | 7,010 | |
| | | | | | | | |
Total | | $ | 42,040 | | | $ | 43,540 | |
| | | | | | | | |
| | |
Eaton Vance Multi-Strategy All Market Fund* Fiscal Years Ended | | 10/31/11 | | | 10/31/12 | |
Audit Fees | | $ | 5,000 | | | $ | 30,030 | |
Audit-Related Fees(1) | | $ | 0 | | | $ | 0 | |
Tax Fees(2) | | $ | 0 | | | $ | 3,750 | |
All Other Fees(3) | | $ | 0 | | | $ | 7,010 | |
| | | | | | | | |
Total | | $ | 5,000 | | | $ | 40,790 | |
| | | | | | | | |
| | |
| * Fund commenced operations on 10/31/2011 | | | | | | | | |
| | |
Eaton Vance Parametric Structured Absolute Return Fund * Fiscal Years Ended | | 10/31/11 | | | 10/31/12 | |
Audit Fees | | $ | 5,000 | | | $ | 12,030 | |
Audit-Related Fees(1) | | $ | 0 | | | $ | 0 | |
Tax Fees(2) | | $ | 0 | | | $ | 3,750 | |
All Other Fees(3) | | $ | 0 | | | $ | 1,240 | |
| | | | | | | | |
Total | | $ | 5,000 | | | $ | 17,020 | |
| | | | | | | | |
| | |
| * Fund commenced operations on 10/31/2011 | | | | | | | | |
| | | | | | | | |
Eaton Vance Tax-Managed Multi-Cap Growth Fund Fiscal Years Ended | | 10/31/11 | | | 10/31/12 | |
Audit Fees | | $ | 12,625 | | | $ | 13,340 | |
Audit-Related Fees(1) | | $ | 0 | | | $ | 0 | |
Tax Fees(2) | | $ | 7,090 | | | $ | 7,240 | |
All Other Fees(3) | | $ | 1,200 | | | $ | 1,240 | |
| | | | | | | | |
Total | | $ | 20,915 | | | $ | 21,820 | |
| | | | | | | | |
| | |
Eaton Vance Tax-Managed Equity Asset Allocation Fund Fiscal Years Ended | | 10/31/11 | | | 10/31/12 | |
Audit Fees | | $ | 51,290 | | | $ | 52,810 | |
Audit-Related Fees(1) | | $ | 0 | | | $ | 0 | |
Tax Fees(2) | | $ | 18,880 | | | $ | 19,430 | |
All Other Fees(3) | | $ | 300 | | | $ | 310 | |
| | | | | | | | |
Total | | $ | 70,470 | | | $ | 72,550 | |
| | | | | | | | |
| | |
Eaton Vance Tax-Managed Global Dividend Income Fund Fiscal Years Ended | | 10/31/11 | | | 10/31/12 | |
Audit Fees | | $ | 50,770 | | | $ | 52,940 | |
Audit-Related Fees(1) | | $ | 0 | | | $ | 0 | |
Tax Fees(2) | | $ | 10,410 | | | $ | 10,660 | |
All Other Fees(3) | | $ | 1,200 | | | $ | 1,240 | |
| | | | | | | | |
Total | | $ | 62,380 | | | $ | 64,840 | |
| | | | | | | | |
| | |
Eaton Vance Tax-Managed International Equity Fund Fiscal Years Ended | | 10/31/11 | | | 10/31/12 | |
Audit Fees | | $ | 12,625 | | | $ | 13,420 | |
Audit-Related Fees(1) | | $ | 0 | | | $ | 0 | |
Tax Fees(2) | | $ | 6,960 | | | $ | 7,110 | |
All Other Fees(3) | | $ | 1,200 | | | $ | 1,240 | |
| | | | | | | | |
Total | | $ | 20,785 | | | $ | 21,770 | |
| | | | | | | | |
| | |
Eaton Vance Tax-Managed Small-Cap Fund Fiscal Years Ended | | 10/31/11 | | | 10/31/12 | |
Audit Fees | | $ | 17,075 | | | $ | 17,890 | |
Audit-Related Fees(1) | | $ | 0 | | | $ | 0 | |
Tax Fees(2) | | $ | 7,080 | | | $ | 7,230 | |
All Other Fees(3) | | $ | 1,200 | | | $ | 310 | |
| | | | | | | | |
Total | | $ | 25,355 | | | $ | 25,430 | |
| | | | | | | | |
| | | | | | | | |
Eaton Vance Tax-Managed Small-Cap Value Fund Fiscal Years Ended | | 10/31/11 | | | 10/31/12 | |
Audit Fees | | $ | 10,315 | | | $ | 10,980 | |
Audit-Related Fees(1) | | $ | 0 | | | $ | 0 | |
Tax Fees(2) | | $ | 6,840 | | | $ | 6,990 | |
All Other Fees(3) | | $ | 300 | | | $ | 310 | |
| | | | | | | | |
Total | | $ | 17,455 | | | $ | 18,280 | |
| | | | | | | | |
| | |
Eaton Vance Tax-Managed Value Fund Fiscal Years Ended | | 10/31/11 | | | 10/31/12 | |
Audit Fees | | $ | 14,945 | | | $ | 15,710 | |
Audit-Related Fees(1) | | $ | 0 | | | $ | 0 | |
Tax Fees(2) | | $ | 7,080 | | | $ | 7,230 | |
All Other Fees(3) | | $ | 1,200 | | | $ | 1,240 | |
| | | | | | | | |
Total | | $ | 23,225 | | | $ | 24,180 | |
| | | | | | | | |
| | |
Eaton Vance U.S. Government Money Market Fund Fiscal Years Ended | | 10/31/11 | | | 10/31/12 | |
Audit Fees | | $ | 15,660 | | | $ | 16,840 | |
Audit-Related Fees(1) | | $ | 0 | | | $ | 0 | |
Tax Fees(2) | | $ | 6,070 | | | $ | 6,220 | |
All Other Fees(3) | | $ | 300 | | | $ | 310 | |
| | | | | | | | |
Total | | $ | 22,030 | | | $ | 23,370 | |
| | | | | | | | |
| (1) | Audit-related fees consist of the aggregate fees billed for assurance and related services that are reasonably related to the performance of the audit of financial statements and are not reported under the category of audit fees. |
| (2) | Tax fees consist of the aggregate fees billed for professional services rendered by the principal accountant relating to tax compliance, tax advice, and tax planning and specifically include fees for tax return preparation. |
| (3) | All other fees consist of the aggregate fees billed for products and services provided by the principal accountant other than audit, audit-related, and tax services. |
The various Series comprising the Trust have differing fiscal year ends (January 31, September 30, October 31, November 30 or December 31). The following table presents the aggregate audit, audit-related, tax, and other fees billed to all of the Series in the Trust by D&T for the last two fiscal years of each Series.
| | | | | | | | | | | | | | | | | | | | | | | | | | | | | | | | |
Fiscal Years Ended* | | 12/31/10 | | | 1/31/11** | | | 9/30/11 | | | 10/31/11 | | | 12/31/11 | | | 1/31/12 | | | 9/30/12 | | | 10/31/12 | |
Audit Fees | | $ | 527,835 | | | $ | 90,920 | | | $ | 21,550 | | | $ | 522,885 | | | $ | 522,885 | | | $ | 31,865 | | | $ | 522,885 | | | $ | 524,630 | |
Audit-Related Fees(1) | | $ | 0 | | | $ | 0 | | | $ | 0 | | | $ | 0 | | | $ | 0 | | | $ | 0 | | | $ | 0 | | | $ | 0 | |
Tax Fees(2) | | $ | 258,500 | | | $ | 27,000 | | | $ | 11,500 | | | $ | 250,180 | | | $ | 250,180 | | | $ | 15,580 | | | $ | 250,180 | | | $ | 243,860 | |
All Other Fees(3) | | $ | 28,500 | | | $ | 4,900 | | | $ | 500 | | | $ | 22,300 | | | $ | 22,300 | | | $ | 600 | | | $ | 22,300 | | | $ | 38,080 | |
| | | | | | | | | | | | | | | | | | | | | | | | | | | | | | | | |
Total | | $ | 814,835 | | | $ | 122,820 | | | $ | 33,550 | | | $ | 795,365 | | | $ | 795,365 | | | $ | 48,045 | | | $ | 795,365 | | | $ | 806,570 | |
| | | | | | | | | | | | | | | | | | | | | | | | | | | | | | | | |
| * | Information is not presented for fiscal years ended 11/30/10 or 11/30/11, as no Series in the Trust with such fiscal year ends were in operation during those periods. |
| ** | Series commenced operations on April 1, 2010. |
| (1) | Audit-related fees consist of the aggregate fees billed for assurance and related services that are reasonably related to the performance of the audit of financial statements and are not reported under the category of audit fees. |
| (2) | Tax fees consist of the aggregate fees billed for professional services rendered by the principal accountant relating to tax compliance, tax advice, and tax planning and specifically include fees for tax return preparation. |
| (3) | All other fees consist of the aggregate fees billed for products and services provided by the principal accountant other than audit, audit-related, and tax services. |
(e)(1) The registrant’s audit committee has adopted policies and procedures relating to the pre-approval of services provided by the registrant’s principal accountant (the “Pre-Approval Policies”). The Pre-Approval Policies establish a framework intended to assist the audit committee in the proper discharge of its pre-approval responsibilities. As a general matter, the Pre-Approval Policies (i) specify certain types of audit, audit-related, tax, and other services determined to be pre-approved by the audit committee; and (ii) delineate specific procedures governing the mechanics of the pre-approval process, including the approval and monitoring of audit and non-audit service fees. Unless a service is specifically pre-approved under the Pre-Approval Policies, it must be separately pre-approved by the audit committee.
The Pre-Approval Policies and the types of audit and non-audit services pre-approved therein must be reviewed and ratified by the registrant’s audit committee at least annually. The registrant’s audit committee maintains full responsibility for the appointment, compensation, and oversight of the work of the registrant’s principal accountant.
(e)(2) No services described in paragraphs (b)-(d) above were approved by the registrant’s audit committee pursuant to the “de minimis exception” set forth in Rule 2-01(c)(7)(i)(C) of Regulation S-X.
(f) Not applicable.
(g) The following table presents (i) the aggregate non-audit fees (i.e., fees for audit-related, tax, and other services) billed for services rendered to all of the Series in the Trust by D&T for the last two fiscal years of each Series; and (ii) the aggregate non-audit fees (i.e., fees for audit-related, tax, and other services) billed to the Eaton Vance organization by D&T for the last two fiscal years of each Series.
| | | | | | | | | | | | | | | | | | | | | | | | | | | | | | | | |
Fiscal Years Ended* | | 12/31/10 | | | 1/31/11** | | | 9/30/11 | | | 10/31/11 | | | 12/31/11 | | | 1/31/12 | | | 9/30/12 | | | 10/31/12 | |
Registrant(1) | | $ | 31,900 | | | $ | 12,000 | | | $ | 16,180 | | | $ | 272,480 | | | $ | 53,070 | | | $ | 27,520 | | | $ | 29,360 | | | $ | 281,940 | |
Eaton Vance(2) | | $ | 250,973 | | | $ | 205,107 | | | $ | 226,431 | | | $ | 266,431 | | | $ | 334,561 | | | $ | 414,561 | | | $ | 606,619 | | | $ | 566,619 | |
| * | Information is not presented for fiscal years ended 11/30/10 or 11/30/11, as no Series in the Trust with such fiscal year ends were in operation during those periods. |
| ** | Series commenced operations on April 1, 2010. |
| (1) | Includes all of the Series of the Trust. During the fiscal years reported above, certain of the Funds were “feeder” funds in a “master-feeder” fund structure or funds of funds. |
| (2) | Various subsidiaries of Eaton Vance Corp. act in either an investment advisory and/or service provider capacity with respect to the Series and/or their respective “master” funds (if applicable). |
(h) The registrant’s audit committee has considered whether the provision by the registrant’s principal accountant of non-audit services to the registrant’s investment adviser and any entity controlling, controlled by, or under common control with the adviser that provides ongoing services to the registrant that were not pre-approved pursuant to Rule 2-01(c)(7)(ii) of Regulation S-X is compatible with maintaining the principal accountant’s independence.
Item 5. Audit Committee of Listed Registrants
Not required in this filing.
Item 6. Schedule of Investments
Please see schedule of investments contained in the Report to Stockholders included under Item 1 of this Form N-CSR.
Item 7. Disclosure of Proxy Voting Policies and Procedures for Closed-End Management Investment Companies
Not applicable.
Item 8. Portfolio Managers of Closed-End Management Investment Companies
Not applicable.
Item 9. Purchases of Equity Securities by Closed-End Management Investment Company and Affiliated Purchasers
Not applicable.
Item 10. Submission of Matters to a Vote of Security Holders
No Material Changes.
Item 11. Controls and Procedures
(a) It is the conclusion of the registrant’s principal executive officer and principal financial officer that the effectiveness of the registrant’s current disclosure controls and procedures (such disclosure controls and procedures having been evaluated within 90 days of the date of this filing) provide reasonable assurance that the information required to be disclosed by the registrant has been recorded, processed, summarized and reported within the time period specified in the Commission’s rules and forms and that the information required to be disclosed by the registrant has been accumulated and communicated to the registrant’s principal executive officer and principal financial officer in order to allow timely decisions regarding required disclosure.
(b) There have been no changes in the registrant’s internal controls over financial reporting during the second fiscal quarter of the period covered by this report that has materially affected, or is reasonably likely to materially affect, the registrant’s internal control over financial reporting.
Item 12. Exhibits
| | |
| (a)(1) | | Registrant’s Code of Ethics – Not applicable (please see Item 2). |
| |
| (a)(2)(i) | | Treasurer’s Section 302 certification. |
| |
| (a)(2)(ii) | | President’s Section 302 certification. |
| |
| (b) | | Combined Section 906 certification. |
Signatures
Pursuant to the requirements of the Securities Exchange Act of 1934 and the Investment Company Act of 1940, the registrant has duly caused this report to be signed on its behalf by the undersigned, thereunto duly authorized.
| | |
| Eaton Vance Mutual Funds Trust |
| |
| By: | | /s/ Duncan W. Richardson |
| | Duncan W. Richardson President |
Date: December 18, 2012
Pursuant to the requirements of the Securities Exchange Act of 1934 and the Investment Company Act of 1940, this report has been signed below by the following persons on behalf of the registrant and in the capacities and on the dates indicated.
| | |
| |
| By: | | /s/ Barbara E. Campbell |
| | Barbara E. Campbell Treasurer |
Date: December 18, 2012
| | |
| |
| By: | | /s/ Duncan W. Richardson |
| | Duncan W. Richardson President |
Date: December 18, 2012