UNITED STATES
SECURITIES AND EXCHANGE COMMISSION
Washington, D.C. 20549
Form N-CSR
CERTIFIED SHAREHOLDER REPORT OF REGISTERED
MANAGEMENT INVESTMENT COMPANIES
Investment Company Act File Number: 811-04015
Eaton Vance Mutual Funds Trust
(Exact Name of Registrant as Specified in Charter)
Two International Place, Boston, Massachusetts 02110
(Address of Principal Executive Offices)
Maureen A. Gemma
Two International Place, Boston, Massachusetts 02110
(Name and Address of Agent for Services)
(617) 482-8260
(Registrant’s Telephone Number)
January 31
Date of Fiscal Year End
January 31, 2018
Date of Reporting Period
Item 1. Reports to Stockholders

Parametric Emerging Markets Fund
Annual Report
January 31, 2018

Commodity Futures Trading Commission Registration. Effective December 31, 2012, the Commodity Futures Trading Commission (“CFTC”) adopted certain regulatory changes that subject registered investment companies and advisers to regulation by the CFTC if a fund invests more than a prescribed level of its assets in certain CFTC-regulated instruments (including futures, certain options and swap agreements) or markets itself as providing investment exposure to such instruments. The Fund has claimed an exclusion from the definition of the term “commodity pool operator” under the Commodity Exchange Act. Accordingly, neither the Fund nor the adviser with respect to the operation of the Fund is subject to CFTC regulation. Because of its management of other strategies, the Fund’s adviser is registered with the CFTC as a commodity pool operator and a commodity trading advisor.
Fund shares are not insured by the FDIC and are not deposits or other obligations of, or guaranteed by, any depository institution. Shares are subject to investment risks, including possible loss of principal invested.
This report must be preceded or accompanied by a current summary prospectus or prospectus. Before investing, investors should consider carefully the investment objective, risks, and charges and expenses of a mutual fund. This and other important information is contained in the summary prospectus and prospectus, which can be obtained from a financial advisor. Prospective investors should read the prospectus carefully before investing. For further information, please call 1-800-260-0761.
Annual Report January 31, 2018
Parametric Emerging Markets Fund
Table of Contents
| | | | |
Management’s Discussion of Fund Performance | | | 2 | |
| |
Performance | | | 3 | |
| |
Fund Profile | | | 4 | |
| |
Endnotes and Additional Disclosures | | | 5 | |
| |
Fund Expenses | | | 6 | |
| |
Financial Statements | | | 7 | |
| |
Report of Independent Registered Public Accounting Firm | | | 42 | |
| |
Federal Tax Information | | | 43 | |
| |
Management and Organization | | | 44 | |
| |
Important Notices | | | 47 | |
Parametric Emerging Markets Fund
January 31, 2018
Management’s Discussion of Fund Performance1
Economic and Market Conditions
For the 12-month period ended January 31, 2018, emerging market equities staged a sharp rally, with the MSCI Emerging Markets Index (the Index)2 posting positive returns in 11 of the 12 months. Investors were initially drawn to the asset class based on its attractive valuation versus U.S. equities, as well as signs that the Trump trade policy was not as draconian as feared. Moreover, the rally drew strength from the growing consensus that global growth was back on track, and should allow for a prolonged period of expansion in emerging market economies.
Although the emerging markets rally was broad-based for the year, many weaker performers from the first six months experienced a rebound during the back half of the period, while the initial leaders showed mixed results.
At the country level, China rose over 60% on data showing continued strength across its economy. Greece, which rallied after the International Monetary Fund announced it would not ask for any further fiscal reform, rose over 55%. Poland advanced over 50%, as equity markets rallied in response to the economic expansion across the Eurozone. The tech-heavy markets of South Korea and Taiwan were among the top-performers during the first half of the period, but trailed during the latter half due to a pullback in information technology stocks and news that Apple cut its forecast for iPhone X shipments. Taiwan is home to a number of major component providers to the iPhone. Qatar and Pakistan were the only constituents to decline for the year.
Frontier markets (as measured by the MSCI Frontier Markets Index) generally delivered moderately lower returns than emerging markets (as measured by the Index). Country returns in the frontier markets were predominantly positive.
Fund Performance
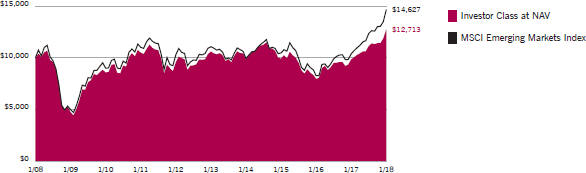
For the 12-month period ended January 31, 2018, Parametric Emerging Markets Fund (the Fund) had a total return of 29.33% for Investor Class shares at net asset value (NAV), underperforming the Fund’s benchmark, the MSCI Emerging Markets Index (the Index), which had a total return of 41.01% for the same period.
An underweight to China was the top detractor from relative performance, as Chinese markets continued to rally on strong economic growth. The inclusion of Pakistan also
weighed on relative results, as stocks fell due to political corruption scandals which led to the resignation of its prime minister. Lastly, an overweight to Mexico detracted from Fund performance versus the Index. Mexican stocks fell due to increasing signs that the North American Free Trade Agreement may be modified or canceled and a corruption scandal in the ruling political party.
The largest contributor to relative Fund performance was an underweight to Taiwan. Many of the suppliers for Apple’s smart phones are based in Taiwan, and suffered due to the lukewarm reception to the latest iPhone models. The sector diversification6 process within South Korea also contributed to relative results, particularly due to a resulting overweight to health care, which rose on increasing signs of success by South Korean generic drug-makers. The inclusion of non-index country Vietnam also benefited relative performance. Vietnam rallied on the back of a pronounced privatization effort by the country’s government, which led to the listing of a number of large, established companies.
See Endnotes and Additional Disclosures in this report.
Past performance is no guarantee of future results. Returns are historical and are calculated by determining the percentage change in net asset value (NAV) or offering price (as applicable) with all distributions reinvested. Investment return and principal value will fluctuate so that shares, when redeemed, may be worth more or less than their original cost. Performance less than or equal to one year is cumulative. Performance is for the stated time period only; due to market volatility, the Fund’s current performance may be lower or higher than quoted. Returns are before taxes unless otherwise noted. For performance as of the most recent month-end, please refer to eatonvance.com.
Parametric Emerging Markets Fund
January 31, 2018
Performance2,3
Portfolio Managers Thomas Seto and Timothy W. Atwill, Ph.D., CFA, each of Parametric Portfolio Associates LLC
| | | | | | | | | | | | | | | | | | | | |
| % Average Annual Total Returns | | Class
Inception Date | | | Performance
Inception Date | | | One Year | | | Five Years | | | Ten Years | |
Investor Class at NAV | | | 06/30/2006 | | | | 06/30/2006 | | | | 29.33 | % | | | 3.72 | % | | | 2.43 | % |
Class C at NAV | | | 06/30/2006 | | | | 06/30/2006 | | | | 28.32 | | | | 2.96 | | | | 1.67 | |
Class C with 1% Maximum Sales Charge | | | — | | | | — | | | | 27.32 | | | | 2.96 | | | | 1.67 | |
Institutional Class at NAV | | | 06/30/2006 | | | | 06/30/2006 | | | | 29.56 | | | | 3.97 | | | | 2.68 | |
Class R6 at NAV | | | 07/01/2014 | | | | 06/30/2006 | | | | 29.69 | | | | 4.02 | | | | 2.71 | |
MSCI Emerging Markets Index | | | — | | | | — | | | | 41.01 | % | | | 5.74 | % | | | 3.87 | % |
| | | | | |
| | | | | | | | | | | | | | | | | | | | |
| % Total Annual Operating Expense Ratios4 | | | | | Investor
Class | | | Class C | | | Institutional
Class | | | Class R6 | |
| | | | | | | 1.38 | % | | | 2.13 | % | | | 1.13 | % | | | 1.08 | % |
Growth of $10,000
This graph shows the change in value of a hypothetical investment of $10,000 in Investor Class of the Fund for the period indicated. For comparison, the same investment is shown in the indicated index.
| | | | | | | | | | | | | | | | |
| Growth of Investment3 | | Amount Invested | | | Period Beginning | | | At NAV | | | With Maximum Sales Charge | |
Class C | | $ | 10,000 | | | | 01/31/2008 | | | $ | 11,803 | | | | N.A. | |
Institutional Class | | $ | 50,000 | | | | 01/31/2008 | | | $ | 65,167 | | | | N.A. | |
Class R6 | | $ | 1,000,000 | | | | 01/31/2008 | | | $ | 1,306,681 | | | | N.A. | |
See Endnotes and Additional Disclosures in this report.
Past performance is no guarantee of future results. Returns are historical and are calculated by determining the percentage change in net asset value (NAV) or offering price (as applicable) with all distributions reinvested. Investment return and principal value will fluctuate so that shares, when redeemed, may be worth more or less than their original cost. Performance less than or equal to one year is cumulative. Performance is for the stated time period only; due to market volatility, the Fund’s current performance may be lower or higher than quoted. Returns are before taxes unless otherwise noted. For performance as of the most recent month-end, please refer to eatonvance.com.
Parametric Emerging Markets Fund
January 31, 2018
Fund Profile
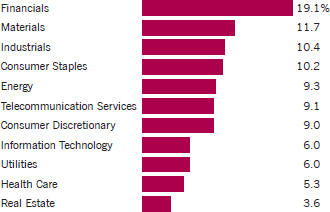
Sector Allocation (% of net assets)5
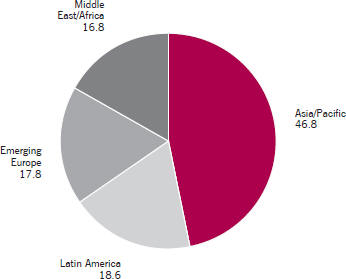
Geographic Allocation (% of common stocks)
Top 10 Holdings (% of net assets)5
| | | | |
Sberbank of Russia PJSC | | | 0.9 | % |
| |
America Movil SAB de CV, Series L | | | 0.8 | |
| |
China Mobile, Ltd. | | | 0.7 | |
| |
MTN Group, Ltd. | | | 0.6 | |
| |
Naspers, Ltd., Class N | | | 0.6 | |
| |
Credicorp, Ltd. | | | 0.6 | |
| |
Cielo SA | | | 0.5 | |
| |
Petroleo Brasileiro SA, PFC Shares | | | 0.5 | |
| |
Gazprom PJSC ADR | | | 0.5 | |
| |
Tencent Holdings, Ltd. | | | 0.4 | |
| |
Total | | | 6.1 | % |
See Endnotes and Additional Disclosures in this report.
Parametric Emerging Markets Fund
January 31, 2018
Endnotes and Additional Disclosures
| 1 | The views expressed in this report are those of the portfolio manager(s) and are current only through the date stated at the top of this page. These views are subject to change at any time based upon market or other conditions, and Eaton Vance and the Fund(s) disclaim any responsibility to update such views. These views may not be relied upon as investment advice and, because investment decisions are based on many factors, may not be relied upon as an indication of trading intent on behalf of any Eaton Vance fund. This commentary may contain statements that are not historical facts, referred to as “forward looking statements”. The Fund’s actual future results may differ significantly from those stated in any forward looking statement, depending on factors such as changes in securities or financial markets or general economic conditions, the volume of sales and purchases of Fund shares, the continuation of investment advisory, administrative and service contracts, and other risks discussed from time to time in the Fund’s filings with the Securities and Exchange Commission. |
| 2 | MSCI Frontier Markets Index is an unmanaged index that measures the performance of stock markets with less-developed economies and financial markets than emerging markets, and that typically have more restrictions on foreign stock ownership. MSCI Emerging Markets Index is an unmanaged index of emerging markets common stocks. MSCI indexes are net of foreign withholding taxes. Source: MSCI. MSCI data may not be reproduced or used for any other purpose. MSCI provides no warranties, has not prepared or approved this report, and has no liability hereunder. Unless otherwise stated, index returns do not reflect the effect of any applicable sales charges, commissions, expenses, taxes or leverage, as applicable. It is not possible to invest directly in an index. |
| 3 | Total Returns at NAV do not include applicable sales charges. If sales charges were deducted, the returns would be lower. Total Returns shown with maximum sales charge reflect the stated maximum sales charge. Investor Class, Institutional Class and Class R6 shares are offered without a sales charge. Unless otherwise stated, performance does not reflect the deduction of taxes on Fund distributions or redemptions of Fund shares. |
| | Performance prior to the inception date of a class may be linked to the performance of an older class of the Fund. This linked performance is adjusted for any applicable sales charge, but is not adjusted for class expense differences. If adjusted for such differences, the performance would be different. The performance of Class R6 is linked to Institutional Class. Performance since inception for an index, if presented, is the performance since the Fund’s or oldest share class’ inception, as applicable. Performance presented in the Financial Highlights included in the financial statements is not linked. |
| 4 | Source: Fund prospectus. The expense ratios for the current reporting period can be found in the Financial Highlights section of this report. |
| 5 | Excludes cash and cash equivalents. |
| 6 | Diversification cannot ensure a profit or eliminate the risk of loss. |
| | Fund profile subject to change due to active management. |
Parametric Emerging Markets Fund
January 31, 2018
Fund Expenses
Example: As a Fund shareholder, you incur two types of costs: (1) transaction costs, including sales charges (loads) on purchases and redemption fees (if applicable); and (2) ongoing costs, including management fees; distribution and/or service fees; and other Fund expenses. This Example is intended to help you understand your ongoing costs (in dollars) of Fund investing and to compare these costs with the ongoing costs of investing in other mutual funds. The Example is based on an investment of $1,000 invested at the beginning of the period and held for the entire period (August 1, 2017 – January 31, 2018).
Actual Expenses: The first section of the table below provides information about actual account values and actual expenses. You may use the information in this section, together with the amount you invested, to estimate the expenses that you paid over the period. Simply divide your account value by $1,000 (for example, an $8,600 account value divided by $1,000 = 8.6), then multiply the result by the number in the first section under the heading entitled “Expenses Paid During Period” to estimate the expenses you paid on your account during this period.
Hypothetical Example for Comparison Purposes: The second section of the table below provides information about hypothetical account values and hypothetical expenses based on the actual Fund expense ratio and an assumed rate of return of 5% per year (before expenses), which is not the actual Fund return. The hypothetical account values and expenses may not be used to estimate the actual ending account balance or expenses you paid for the period. You may use this information to compare the ongoing costs of investing in your Fund and other funds. To do so, compare this 5% hypothetical example with the 5% hypothetical examples that appear in the shareholder reports of the other funds.
Please note that the expenses shown in the table are meant to highlight your ongoing costs only and do not reflect any transactional costs, such as sales charges (loads) or redemption fees (if applicable). Therefore, the second section of the table is useful in comparing ongoing costs only, and will not help you determine the relative total costs of owning different funds. In addition, if these transactional costs were included, your costs would be higher.
| | | | | | | | | | | | | | | | |
| | | Beginning
Account Value
(8/1/17) | | | Ending
Account Value
(1/31/18) | | | Expenses Paid
During Period*
(8/1/17 – 1/31/18) | | | Annualized
Expense
Ratio | |
| | | | |
| | | | | | | | | | | | | | | | |
Actual | | | | | | | | | | | | | |
Investor Class | | $ | 1,000.00 | | | $ | 1,142.90 | | | $ | 7.40 | | | | 1.37 | % |
Class C | | $ | 1,000.00 | | | $ | 1,138.80 | | | $ | 11.43 | | | | 2.12 | % |
Institutional Class | | $ | 1,000.00 | | | $ | 1,144.10 | | | $ | 6.05 | | | | 1.12 | % |
Class R6 | | $ | 1,000.00 | | | $ | 1,145.20 | | | $ | 5.84 | | | | 1.08 | % |
| | | | | | | | | | | | | | | | | |
| | | | |
| | | | | | | | | | | | | | | | |
Hypothetical | | | | | | | | | | | | | |
(5% return per year before expenses) | | | | | | | | | | | | | |
Investor Class | | $ | 1,000.00 | | | $ | 1,018.30 | | | $ | 6.97 | | | | 1.37 | % |
Class C | | $ | 1,000.00 | | | $ | 1,014.50 | | | $ | 10.76 | | | | 2.12 | % |
Institutional Class | | $ | 1,000.00 | | | $ | 1,019.60 | | | $ | 5.70 | | | | 1.12 | % |
Class R6 | | $ | 1,000.00 | | | $ | 1,019.80 | | | $ | 5.50 | | | | 1.08 | % |
| * | Expenses are equal to the Fund’s annualized expense ratio for the indicated Class, multiplied by the average account value over the period, multiplied by 184/365 (to reflect the one-half year period). The Example assumes that the $1,000 was invested at the net asset value per share determined at the close of business on July 31, 2017. |
Parametric Emerging Markets Fund
January 31, 2018
Portfolio of Investments
| | | | | | | | |
| Common Stocks — 99.0% | |
| | |
| | | | | | | | |
| Security | | Shares | | | Value | |
| | | | | | | | |
| | |
| Argentina — 0.7% | | | | | | |
Adecoagro SA(1) | | | 162,806 | | | $ | 1,577,590 | |
Arcos Dorados Holdings, Inc., Class A(1) | | | 330,114 | | | | 3,383,668 | |
Banco Macro SA, Class B ADR | | | 6,487 | | | | 704,099 | |
BBVA Banco Frances SA ADR | | | 25,288 | | | | 639,534 | |
Cresud SA ADR | | | 42,441 | | | | 919,696 | |
Grupo Financiero Galicia SA, Class B ADR | | | 30,387 | | | | 2,121,013 | |
IRSA Inversiones y Representaciones SA ADR | | | 35,110 | | | | 1,008,359 | |
MercadoLibre, Inc. | | | 13,622 | | | | 5,273,076 | |
Pampa Energia SA ADR(1) | | | 50,499 | | | | 3,560,179 | |
Transportadora de Gas del Sur SA ADR(1) | | | 20,764 | | | | 475,496 | |
YPF SA ADR | | | 121,524 | | | | 2,934,805 | |
| | |
| | | | | | $ | 22,597,515 | |
| | |
|
| Bahrain — 0.7% | |
Ahli United Bank BSC | | | 14,236,325 | | | $ | 10,035,220 | |
Al Salam Bank-Bahrain BSC | | | 11,920,388 | | | | 3,889,124 | |
GFH Financial Group BSC | | | 11,076,329 | | | | 4,407,667 | |
Ithmaar Holding BSC(1) | | | 14,771,027 | | | | 2,782,809 | |
| | | | | | | | | |
| | | | | | $ | 21,114,820 | |
| | | | | | | | | |
| | |
| Bangladesh — 0.7% | | | | | | |
ACI, Ltd. | | | 60,159 | | | $ | 309,155 | |
Aftab Automobiles, Ltd. | | | 349,827 | | | | 253,525 | |
Bangladesh Export Import Co., Ltd. | | | 3,834,762 | | | | 1,204,127 | |
Bangladesh Submarine Cable Co., Ltd. | | | 192,647 | | | | 222,136 | |
Beximco Pharmaceuticals, Ltd. | | | 457,495 | | | | 587,684 | |
BSRM Steels, Ltd. | | | 1,068,413 | | | | 945,056 | |
City Bank, Ltd. (The) | | | 1,250,881 | | | | 636,244 | |
CVO Petrochemical Refinery, Ltd.(1) | | | 90,270 | | | | 223,502 | |
Grameenphone, Ltd. | | | 551,510 | | | | 3,307,107 | |
Heidelberger Cement Bangladesh, Ltd. | | | 146,500 | | | | 723,232 | |
Islami Bank Bangladesh, Ltd. | | | 1,269,074 | | | | 520,860 | |
Jamuna Oil Co., Ltd. | | | 180,599 | | | | 421,276 | |
Khulna Power Co., Ltd. | | | 757,470 | | | | 515,315 | |
LankaBangla Finance, Ltd. | | | 771,506 | | | | 381,905 | |
Meghna Petroleum, Ltd. | | | 174,079 | | | | 399,953 | |
National Bank, Ltd.(1) | | | 3,910,869 | | | | 607,358 | |
Olympic Industries, Ltd. | | | 607,819 | | | | 2,052,139 | |
Orion Pharma, Ltd. | | | 258,206 | | | | 147,102 | |
Padma Oil Co., Ltd. | | | 195,600 | | | | 556,384 | |
People’s Leasing and Financial Services, Ltd.(1) | | | 1,467,409 | | | | 232,733 | |
Pubali Bank, Ltd. | | | 2,029,094 | | | | 696,514 | |
Renata, Ltd. | | | 27,547 | | | | 408,602 | |
Singer Bangladesh, Ltd. | | | 142,500 | | | | 324,660 | |
| | | | | | | | |
| Security | | Shares | | | Value | |
| | | | | | | | |
| | |
| Bangladesh (continued) | | | | | | |
Social Islami Bank, Ltd. | | | 1,610,176 | | | $ | 428,378 | |
Southeast Bank, Ltd. | | | 1,630,632 | | | | 396,025 | |
Square Pharmaceuticals, Ltd. | | | 465,938 | | | | 1,829,136 | |
Summit Power, Ltd. | | | 1,655,358 | | | | 720,623 | |
Titas Gas Transmission & Distribution Co., Ltd. | | | 1,020,740 | | | | 526,726 | |
Unique Hotel & Resorts, Ltd. | | | 1,020,672 | | | | 667,691 | |
United Airways Bangladesh, Ltd.(1) | | | 6,170,401 | | | | 377,837 | |
United Commercial Bank, Ltd. | | | 1,220,971 | | | | 318,474 | |
| | | | | | | | | |
| | | | | | $ | 20,941,459 | |
| | | | | | | | | |
| | |
| Botswana — 0.4% | | | | | | |
Barclays Bank of Botswana, Ltd. | | | 1,539,465 | | | $ | 975,075 | |
Botswana Insurance Holdings, Ltd. | | | 859,111 | | | | 1,659,097 | |
First National Bank of Botswana, Ltd. | | | 7,940,100 | | | | 1,872,701 | |
Letshego Holdings, Ltd. | | | 17,758,614 | | | | 3,477,675 | |
Sechaba Breweries Holdings, Ltd. | | | 1,220,550 | | | | 2,457,967 | |
Standard Chartered Bank Botswana, Ltd. | | | 531,120 | | | | 275,671 | |
| | | | | | | | | |
| | | | | | $ | 10,718,186 | |
| | | | | | | | | |
| | |
| Brazil — 6.1% | | | | | | |
AES Tiete Energia SA | | | 98,400 | | | $ | 385,446 | |
AMBEV SA | | | 1,387,850 | | | | 9,561,616 | |
B2W Cia Digital(1) | | | 144,970 | | | | 966,922 | |
B3 SA - Brasil Bolsa Balcao | | | 340,200 | | | | 2,784,814 | |
Banco Bradesco SA, PFC Shares | | | 408,839 | | | | 5,229,187 | |
Banco do Brasil SA | | | 172,498 | | | | 2,148,374 | |
Banco do Estado do Rio Grande do Sul, PFC Shares | | | 93,300 | | | | 489,049 | |
BB Seguridade Participacoes SA | | | 142,700 | | | | 1,393,408 | |
BR Malls Participacoes SA | | | 146,211 | | | | 589,708 | |
Bradespar SA, PFC Shares | | | 121,000 | | | | 1,188,352 | |
Braskem SA, PFC Shares | | | 57,460 | | | | 891,117 | |
BRF SA(1) | | | 288,140 | | | | 3,197,034 | |
CCR SA | | | 634,000 | | | | 3,118,261 | |
Centrais Eletricas Brasileiras SA, PFC Shares | | | 291,500 | | | | 2,167,494 | |
Cia Brasileira de Distribuicao, PFC Shares | | | 63,069 | | | | 1,490,614 | |
Cia de Saneamento Basico do Estado de Sao Paulo | | | 195,260 | | | | 2,229,617 | |
Cia de Saneamento de Minas Gerais-COPASA | | | 34,800 | | | | 492,618 | |
Cia de Transmissao de Energia Eletrica Paulista, PFC Shares | | | 31,790 | | | | 671,022 | |
Cia Energetica de Minas Gerais SA, PFC Shares | | | 540,555 | | | | 1,272,493 | |
Cia Energetica de Sao Paulo, Class B, PFC Shares | | | 156,300 | | | | 755,499 | |
Cia Hering | | | 68,200 | | | | 478,427 | |
Cia Paranaense de Energia, PFC Shares | | | 85,800 | | | | 660,062 | |
Cia Siderurgica Nacional SA(1) | | | 205,600 | | | | 709,210 | |
Cielo SA | | | 1,955,606 | | | | 16,499,275 | |
Construtora Tenda SA(1) | | | 55,284 | | | | 387,821 | |
| | | | |
| | 7 | | See Notes to Financial Statements. |
Parametric Emerging Markets Fund
January 31, 2018
Portfolio of Investments — continued
| | | | | | | | |
| Security | | Shares | | | Value | |
| | | | | | | | |
| | |
| Brazil (continued) | | | | | | |
Cosan SA Industria e Comercio | | | 82,300 | | | $ | 1,127,298 | |
CPFL Energia SA | | | 338,972 | | | | 2,282,156 | |
Cyrela Brazil Realty SA Empreendimentos e Participacoes | | | 235,500 | | | | 1,107,279 | |
Duratex SA | | | 162,858 | | | | 521,391 | |
EcoRodovias Infraestrutura e Logistica SA | | | 166,400 | | | | 594,883 | |
EDP-Energias do Brasil SA | | | 186,700 | | | | 803,408 | |
Eletropaulo Metropolitana Eletricidade de Sao Paulo SA | | | 117,480 | | | | 519,921 | |
Embraer SA | | | 194,900 | | | | 1,224,701 | |
Embraer SA ADR | | | 77,548 | | | | 1,958,087 | |
Engie Brasil Energia SA | | | 126,500 | | | | 1,426,996 | |
Equatorial Energia SA | | | 90,400 | | | | 1,986,190 | |
Estacio Participacoes SA | | | 124,600 | | | | 1,370,756 | |
Even Construtora e Incorporadora SA(1) | | | 341,400 | | | | 669,727 | |
Ez Tec Empreendimentos e Participacoes SA | | | 111,998 | | | | 783,213 | |
Fibria Celulose SA | | | 69,257 | | | | 1,192,977 | |
Fleury SA | | | 304,200 | | | | 2,864,407 | |
Gafisa SA | | | 55,284 | | | | 298,457 | |
Gerdau SA, PFC Shares | | | 290,100 | | | | 1,311,186 | |
Gol Linhas Aereas Inteligentes SA, PFC Shares | | | 97,000 | | | | 551,372 | |
Hypermarcas SA | | | 177,000 | | | | 2,018,889 | |
Iochpe Maxion SA | | �� | 61,000 | | | | 455,681 | |
Itau Unibanco Holding SA, PFC Shares | | | 344,780 | | | | 5,655,431 | |
Itausa-Investimentos Itau SA, PFC Shares | | | 745,987 | | | | 3,102,425 | |
JBS SA | | | 406,725 | | | | 1,282,984 | |
Klabin SA, PFC Shares | | | 983,700 | | | | 997,285 | |
Kroton Educacional SA | | | 652,836 | | | | 3,329,750 | |
Light SA(1) | | | 80,000 | | | | 416,824 | |
Localiza Rent a Car SA | | | 317,352 | | | | 2,567,902 | |
Lojas Americanas SA, PFC Shares | | | 342,800 | | | | 1,818,368 | |
Lojas Renner SA | | | 328,270 | | | | 3,900,911 | |
Marcopolo SA, PFC Shares | | | 585,600 | | | | 768,301 | |
Marfrig Global Foods SA(1) | | | 287,155 | | | | 613,787 | |
Metalurgica Gerdau SA, PFC Shares | | | 260,300 | | | | 562,104 | |
MRV Engenharia e Participacoes SA | | | 205,500 | | | | 977,189 | |
Multiplus SA | | | 60,200 | | | | 665,110 | |
Natura Cosmeticos SA | | | 120,900 | | | | 1,325,119 | |
Odontoprev SA | | | 688,600 | | | | 3,594,293 | |
Petroleo Brasileiro SA, PFC Shares | | | 2,564,500 | | | | 15,857,078 | |
Prumo Logistica SA(1) | | | 159,600 | | | | 562,557 | |
Qualicorp SA | | | 485,600 | | | | 4,662,431 | |
Randon SA Implementos e Participacoes,
PFC Shares | | | 303,500 | | | | 814,477 | |
Rumo SA(1) | | | 185,919 | | | | 832,726 | |
Smiles Fidelidade SA | | | 22,500 | | | | 580,155 | |
Suzano Papel e Celulose SA | | | 223,625 | | | | 1,450,123 | |
| | | | | | | | |
| Security | | Shares | | | Value | |
| | | | | | | | |
| | |
| Brazil (continued) | | | | | | |
Telefonica Brasil SA, PFC Shares | | | 720,100 | | | $ | 12,171,182 | |
TIM Participacoes SA | | | 1,498,150 | | | | 6,348,093 | |
Totvs SA | | | 306,690 | | | | 3,128,507 | |
Transmissora Alianca de Energia Electrica SA | | | 91,000 | | | | 575,534 | |
Ultrapar Participacoes SA | | | 201,384 | | | | 5,154,065 | |
Usinas Siderurgicas de Minas Gerais SA, Class A, PFC Shares | | | 181,750 | | | | 676,571 | |
Vale SA | | | 931,247 | | | | 12,115,564 | |
Valid Solucoes SA | | | 100,870 | | | | 645,872 | |
Via Varejo SA | | | 49,500 | | | | 421,356 | |
Weg SA | | | 631,040 | | | | 4,694,177 | |
| | | | | | | | | |
| | | | | | $ | 187,094,666 | |
| | | | | | | | | |
| | |
| Bulgaria — 0.1% | | | | | | |
CB First Investment Bank AD(1) | | | 235,000 | | | $ | 868,779 | |
Chimimport AD | | | 329,922 | | | | 510,963 | |
MonBat AD | | | 60,235 | | | | 409,206 | |
Petrol AD(1)(2) | | | 102,500 | | | | 0 | |
Sopharma AD | | | 354,600 | | | | 957,959 | |
| | | | | | | | | |
| | | | | | $ | 2,746,907 | |
| | | | | | | | | |
| | |
| Chile — 3.0% | | | | | | |
AES Gener SA | | | 1,904,140 | | | $ | 611,234 | |
Aguas Andinas SA, Series A | | | 1,752,898 | | | | 1,180,559 | |
AntarChile SA | | | 88,715 | | | | 1,738,156 | |
Banco de Chile | | | 16,532,601 | | | | 2,824,499 | |
Banco de Chile ADR | | | 4,198 | | | | 426,307 | |
Banco de Credito e Inversiones | | | 35,999 | | | | 2,764,882 | |
Banco Santander Chile | | | 43,930,759 | | | | 3,710,755 | |
Banmedica SA | | | 173,981 | | | | 605,642 | |
Cap SA | | | 79,412 | | | | 1,028,168 | |
Cencosud SA | | | 1,566,681 | | | | 4,880,691 | |
Cia Cervecerias Unidas SA | | | 207,308 | | | | 2,969,398 | |
Cia Sud Americana de Vapores SA(1) | | | 14,510,741 | | | | 755,830 | |
Colbun SA | | | 4,152,944 | | | | 1,032,673 | |
Embotelladora Andina SA, Class B, PFC Shares | | | 393,044 | | | | 1,916,940 | |
Empresa Nacional de Telecomunicaciones SA | | | 270,924 | | | | 3,236,724 | |
Empresas CMPC SA | | | 1,264,282 | | | | 4,972,986 | |
Empresas COPEC SA | | | 702,613 | | | | 12,155,253 | |
Enel Americas SA | | | 17,888,503 | | | | 4,184,063 | |
Enel Chile SA | | | 12,287,847 | | | | 1,549,154 | |
Enel Generacion Chile SA | | | 2,105,520 | | | | 2,014,430 | |
Engie Energia Chile SA | | | 328,455 | | | | 729,997 | |
Forus SA | | | 132,100 | | | | 602,638 | |
Inversiones Aguas Metropolitanas SA | | | 218,715 | | | | 431,748 | |
| | | | |
| | 8 | | See Notes to Financial Statements. |
Parametric Emerging Markets Fund
January 31, 2018
Portfolio of Investments — continued
| | | | | | | | |
| Security | | Shares | | | Value | |
| | | | | | | | |
| | |
| Chile (continued) | | | | | | |
Inversiones La Construccion SA | | | 34,520 | | | $ | 716,363 | |
Itau CorpBanca | | | 133,731,904 | | | | 1,357,662 | |
Latam Airlines Group SA | | | 412,844 | | | | 7,142,914 | |
Parque Arauco SA | | | 541,699 | | | | 1,783,708 | |
Quinenco SA | | | 339,935 | | | | 1,109,189 | |
Ripley Corp. SA | | | 721,671 | | | | 855,954 | |
S.A.C.I. Falabella | | | 967,866 | | | | 10,163,051 | |
Sigdo Koppers SA | | | 440,196 | | | | 929,565 | |
Sociedad Matriz SAAM SA | | | 6,242,812 | | | | 688,663 | |
Sociedad Quimica y Minera de Chile SA,
Series B, PFC Shares | | | 92,659 | | | | 5,191,443 | |
Sonda SA | | | 1,014,743 | | | | 2,105,807 | |
Vina Concha y Toro SA | | | 864,834 | | | | 1,922,395 | |
| | | | | | | | | |
| | | | | | $ | 90,289,441 | |
| | | | | | | | | |
| | |
| China — 12.3% | | | | | | |
3SBio, Inc.(1)(3) | | | 1,558,500 | | | $ | 3,180,673 | |
AECC Aviation Power Co., Ltd. | | | 40,221 | | | | 159,530 | |
Agile Group Holdings, Ltd. | | | 1,096,000 | | | | 1,963,622 | |
Agricultural Bank of China, Ltd., Class H | | | 2,350,000 | | | | 1,437,819 | |
Aier Eye Hospital Group Co., Ltd., Class A | | | 66,500 | | | | 370,785 | |
Air China, Ltd., Class H | | | 1,646,000 | | | | 2,399,595 | |
Aisino Corp. | | | 70,100 | | | | 229,225 | |
Alibaba Group Holding, Ltd. ADR(1) | | | 15,200 | | | | 3,105,208 | |
Aluminum Corp. of China, Ltd., Class H(1) | | | 4,984,000 | | | | 3,370,626 | |
Angang Steel Co., Ltd., Class H | | | 1,994,000 | | | | 2,165,570 | |
Anhui Conch Cement Co., Ltd., Class H | | | 923,000 | | | | 5,064,346 | |
ANTA Sports Products, Ltd. | | | 513,000 | | | | 2,461,420 | |
AVIC Aircraft Co., Ltd., Class A | | | 125,600 | | | | 313,484 | |
Baidu, Inc. ADR(1) | | | 15,800 | | | | 3,901,336 | |
Bank of Beijing Co., Ltd. | | | 182,760 | | | | 218,038 | |
Bank of China, Ltd., Class H | | | 4,859,000 | | | | 2,912,164 | |
Bank of Communications, Ltd., Class H | | | 2,468,900 | | | | 2,132,103 | |
Bank of Nanjing Co., Ltd. | | | 169,400 | | | | 274,635 | |
Bank of Ningbo Co., Ltd., Class A | | | 115,300 | | | | 367,312 | |
Beijing Capital Co., Ltd. | | | 186,400 | | | | 153,099 | |
Beijing Capital International Airport Co., Ltd., Class H | | | 918,000 | | | | 1,393,800 | |
Beijing Enterprises Holdings, Ltd. | | | 171,500 | | | | 1,052,434 | |
Beijing Enterprises Water Group, Ltd. | | | 3,236,000 | | | | 2,324,109 | |
Beijing Orient Landscape & Environment Co., Ltd., Class A | | | 79,000 | | | | 231,019 | |
Beijing Originwater Technology Co., Ltd., Class A | | | 127,500 | | | | 328,824 | |
Beijing Sanju Environmental Protection and New Material Co., Ltd., Class A | | | 75,700 | | | | 463,702 | |
Beijing Tongrentang Co., Ltd. | | | 42,800 | | | | 230,652 | |
Beijing Water Business Doctor Co., Ltd., Class A | | | 101,700 | | | | 304,767 | |
| | | | | | | | |
| Security | | Shares | | | Value | |
| | | | | | | | |
| | |
| China (continued) | | | | | | |
Beijing Xinwei Technology Group Co., Ltd.(2) | | | 80,600 | | | $ | 0 | |
Beiqi Foton Motor Co., Ltd. | | | 407,100 | | | | 176,561 | |
BOE Technology Group Co., Ltd., Class A | | | 514,900 | | | | 497,636 | |
Brilliance China Automotive Holdings, Ltd. | | | 1,086,000 | | | | 2,761,085 | |
BYD Co., Ltd., Class H | | | 401,200 | | | | 3,774,834 | |
Cangzhou Mingzhu Plastic Co., Ltd., Class A | | | 104,020 | | | | 173,438 | |
CGN Power Co., Ltd., Class H(3) | | | 6,666,000 | | | | 1,882,799 | |
Changchun High & New Technology Industries, Inc., Class A | | | 10,400 | | | | 285,441 | |
Changjiang Securities Co., Ltd., Class A | | | 213,800 | | | | 271,757 | |
Chengdu Xingrong Environment Co., Ltd., Class A | | | 243,600 | | | | 205,190 | |
China Agri-Industries Holdings, Ltd. | | | 2,074,000 | | | | 962,931 | |
China Biologic Products Holdings, Inc.(1) | | | 32,700 | | | | 2,646,411 | |
China Bluechemical, Ltd., Class H | | | 1,270,000 | | | | 456,862 | |
China Cinda Asset Management Co., Ltd., Class H | | | 1,495,000 | | | | 631,514 | |
China CITIC Bank Corp., Ltd., Class H | | | 840,000 | | | | 689,631 | |
China Coal Energy Co., Ltd., Class H | | | 2,329,000 | | | | 1,201,846 | |
China Communications Construction Co., Ltd., Class H | | | 1,612,000 | | | | 1,919,387 | |
China Communications Services Corp., Ltd., Class H | | | 1,642,000 | | | | 1,040,167 | |
China Construction Bank Corp., Class H | | | 5,100,630 | | | | 5,855,888 | |
China Dongxiang Group Co., Ltd. | | | 4,257,000 | | | | 865,197 | |
China Everbright Bank Co., Ltd. | | | 341,400 | | | | 253,441 | |
China Everbright International, Ltd. | | | 880,000 | | | | 1,340,154 | |
China Everbright, Ltd. | | | 408,000 | | | | 1,003,823 | |
China Evergrande Group(1) | | | 774,000 | | | | 2,548,859 | |
China Fortune Land Development Co., Ltd. | | | 52,329 | | | | 373,986 | |
China Gas Holdings, Ltd. | | | 1,294,000 | | | | 3,777,680 | |
China Gezhouba Group Co., Ltd. | | | 152,700 | | | | 230,672 | |
China Huishan Dairy Holdings Co., Ltd.(1)(2) | | | 1,800,000 | | | | 0 | |
China International Marine Containers Co., Ltd. | | | 482,672 | | | | 993,435 | |
China International Travel Service Corp., Ltd. | | | 37,600 | | | | 304,770 | |
China Jinmao Holdings Group, Ltd. | | | 478,000 | | | | 311,156 | |
China Life Insurance Co., Ltd., Class H | | | 584,000 | | | | 1,966,444 | |
China Longyuan Power Group Corp., Ltd., Class H | | | 2,157,000 | | | | 1,574,436 | |
China Mengniu Dairy Co., Ltd. | | | 1,436,000 | | | | 4,681,261 | |
China Merchants Bank Co., Ltd., Class H | | | 497,524 | | | | 2,429,074 | |
China Merchants Port Holdings Co., Ltd. | | | 318,035 | | | | 838,577 | |
China Merchants Securities Co., Ltd. | | | 77,000 | | | | 234,693 | |
China Merchants Shekou Industrial Zone Holdings Co., Ltd., Class A | | | 188,374 | | | | 770,197 | |
China Minsheng Banking Corp., Ltd., Class H | | | 1,350,240 | | | | 1,540,156 | |
China Mobile, Ltd. | | | 1,959,500 | | | | 20,634,304 | |
China Molybdenum Co., Ltd., Class H | | | 4,203,000 | | | | 3,224,777 | |
China National Building Material Co., Ltd., Class H | | | 1,138,000 | | | | 1,207,416 | |
China National Nuclear Power Co., Ltd. | | | 210,800 | | | | 254,164 | |
China Northern Rare Earth Group High-Tech Co., Ltd. | | | 117,100 | | | | 249,879 | |
| | | | |
| | 9 | | See Notes to Financial Statements. |
Parametric Emerging Markets Fund
January 31, 2018
Portfolio of Investments — continued
| | | | | | | | |
| Security | | Shares | | | Value | |
| | | | | | | | |
| | |
| China (continued) | | | | | | |
China Oilfield Services, Ltd., Class H | | | 1,294,000 | | | $ | 1,540,043 | |
China Overseas Land & Investment, Ltd. | | | 936,160 | | | | 3,620,384 | |
China Pacific Insurance (Group) Co., Ltd., Class H | | | 196,400 | | | | 992,763 | |
China Petroleum & Chemical Corp., Class H | | | 10,960,300 | | | | 9,474,255 | |
China Power International Development, Ltd. | | | 1,381,000 | | | | 376,836 | |
China Railway Construction Corp., Ltd., Class H | | | 1,393,500 | | | | 1,691,990 | |
China Railway Group, Ltd., Class H | | | 2,179,000 | | | | 1,668,893 | |
China Resources Beer Holdings Co., Ltd. | | | 964,000 | | | | 3,640,355 | |
China Resources Gas Group, Ltd. | | | 548,000 | | | | 1,804,528 | |
China Resources Land, Ltd. | | | 768,000 | | | | 3,056,596 | |
China Resources Phoenix Healthcare Holdings Co., Ltd. | | | 355,000 | | | | 513,204 | |
China Resources Power Holdings Co., Ltd. | | | 1,019,600 | | | | 1,879,996 | |
China Shenhua Energy Co., Ltd., Class H | | | 1,500,500 | | | | 4,662,432 | |
China Shineway Pharmaceutical Group, Ltd. | | | 381,000 | | | | 468,968 | |
China Shipbuilding Industry Co., Ltd.(1) | | | 185,800 | | | | 183,409 | |
China Southern Airlines Co., Ltd., Class H | | | 2,200,000 | | | | 2,865,532 | |
China Sports Industry Group Co., Ltd. | | | 69,000 | | | | 133,029 | |
China State Construction Engineering Corp., Ltd. | | | 215,100 | | | | 345,981 | |
China Taiping Insurance Holdings Co., Ltd. | | | 254,800 | | | | 1,096,898 | |
China Telecom Corp., Ltd., Class H | | | 4,948,000 | | | | 2,450,602 | |
China Travel International Investment Hong Kong, Ltd. | | | 4,692,000 | | | | 1,728,920 | |
China Unicom (Hong Kong), Ltd.(1) | | | 2,090,372 | | | | 3,133,487 | |
China United Network Communications, Ltd., Class A(1) | | | 711,800 | | | | 790,676 | |
China Vanke Co., Ltd., Class H | | | 742,520 | | | | 3,616,761 | |
China Yangtze Power Co., Ltd. | | | 225,100 | | | | 568,858 | |
China Yurun Food Group, Ltd.(1) | | | 1,776,000 | | | | 262,939 | |
Chongqing Changan Automobile Co., Ltd., Class A | | | 98,800 | | | | 201,614 | |
CIFI Holdings Group Co., Ltd. | | | 772,000 | | | | 663,224 | |
CITIC Guoan Information Industry Co., Ltd., Class A | | | 138,800 | | | | 187,539 | |
CITIC, Ltd. | | | 1,152,000 | | | | 1,813,041 | |
CNOOC, Ltd. | | | 4,530,000 | | | | 7,120,534 | |
COFCO Tunhe Sugar Co., Ltd. | | | 118,100 | | | | 150,740 | |
COSCO SHIPPING Development Co., Ltd.,
Class H(1) | | | 4,252,000 | | | | 945,555 | |
COSCO SHIPPING Energy Transportation Co., Ltd., Class H | | | 1,702,000 | | | | 978,197 | |
COSCO SHIPPING Holdings Co., Ltd., Class H(1) | | | 2,694,975 | | | | 1,591,138 | |
COSCO SHIPPING Ports, Ltd. | | | 1,250,000 | | | | 1,306,221 | |
Country Garden Holdings Co., Ltd. | | | 1,353,631 | | | | 2,907,584 | |
CSPC Pharmaceutical Group, Ltd. | | | 3,068,000 | | | | 6,796,438 | |
Ctrip.com International, Ltd. ADR(1) | | | 75,854 | | | | 3,548,450 | |
Daqin Railway Co., Ltd. | | | 191,900 | | | | 293,891 | |
Datang International Power Generation Co., Ltd., Class H(1) | | | 4,476,000 | | | | 1,474,662 | |
Deluxe Family Co., Ltd. | | | 146,700 | | | | 141,415 | |
Dong-E-E-Jiao Co., Ltd., Class A | | | 41,400 | | | | 432,152 | |
| | | | | | | | |
| Security | | Shares | | | Value | |
| | | | | | | | |
| | |
| China (continued) | | | | | | |
Dongfeng Motor Group Co., Ltd., Class H | | | 1,966,000 | | | $ | 2,560,201 | |
Dr Peng Telecom & Media Group Co., Ltd. | | | 104,900 | | | | 274,855 | |
East Money Information Co., Ltd., Class A | | | 94,800 | | | | 230,360 | |
Financial Street Holdings Co., Ltd., Class A | | | 242,398 | | | | 453,414 | |
Focus Media Information Technology Co., Ltd., Class A | | | 163,620 | | | | 371,879 | |
Fullshare Holdings, Ltd. | | | 4,362,500 | | | | 2,052,729 | |
GD Power Development Co., Ltd. | | | 528,500 | | | | 261,974 | |
Gemdale Corp. | | | 169,600 | | | | 421,801 | |
GoerTek, Inc., Class A | | | 63,700 | | | | 141,776 | |
Golden Eagle Retail Group, Ltd. | | | 739,000 | | | | 936,848 | |
Great Wall Motor Co., Ltd., Class H | | | 1,771,500 | | | | 2,152,762 | |
Gree Electric Appliances, Inc. of Zhuhai, Class A | | | 73,500 | | | | 653,391 | |
Guangdong Baolihua New Energy Stock Co., Ltd., Class A | | | 255,400 | | | | 329,376 | |
Guangdong Golden Dragon Development, Inc., Class A | | | 82,300 | | | | 212,209 | |
Guangdong Investment, Ltd. | | | 1,842,000 | | | | 2,738,616 | |
Guangdong Wens Foodstuffs Group Co., Ltd., Class A | | | 150,300 | | | | 593,835 | |
Guanghui Energy Co., Ltd. | | | 355,600 | | | | 284,237 | |
Guangzhou Automobile Group Co., Ltd., Class H | | | 1,258,013 | | | | 2,835,450 | |
Guangzhou Baiyunshan Pharmaceutical Holdings Co., Ltd., Class H | | | 320,000 | | | | 935,680 | |
Guangzhou R&F Properties Co., Ltd., Class H | | | 522,400 | | | | 1,462,054 | |
Guosen Securities Co., Ltd., Class A | | | 117,628 | | | | 219,301 | |
Guoyuan Securities Co., Ltd., Class A | | | 113,850 | | | | 197,348 | |
Haier Electronics Group Co., Ltd. | | | 161,000 | | | | 549,619 | |
Han’s Laser Technology Industry Group Co., Ltd., Class A | | | 42,100 | | | | 329,125 | |
Hangzhou Hikvision Digital Technology Co., Ltd., Class A | | | 70,700 | | | | 447,490 | |
Harbin Pharmaceutical Group Co., Ltd.(2) | | | 150,900 | | | | 111,486 | |
Henan Shuanghui Investment & Development Co., Ltd., Class A | | | 61,400 | | | | 272,127 | |
Hengan International Group Co., Ltd. | | | 407,000 | | | | 3,899,372 | |
Hengtong Optic-electric Co., Ltd. | | | 69,200 | | | | 396,424 | |
Hesteel Co., Ltd., Class A | | | 506,400 | | | | 324,222 | |
Huadian Power International Corp., Ltd., Class H | | | 1,100,000 | | | | 417,620 | |
Huadong Medicine Co., Ltd., Class A | | | 31,474 | | | | 282,449 | |
Huaneng Power International, Inc., Class H | | | 5,166,000 | | | | 3,322,920 | |
Huaneng Renewables Corp., Ltd., Class H | | | 1,716,000 | | | | 593,083 | |
Huatai Securities Co., Ltd. | | | 73,700 | | | | 229,251 | |
Huaxia Bank Co., Ltd. | | | 146,972 | | | | 229,730 | |
Huayu Automotive Systems Co., Ltd. | | | 82,008 | | | | 345,364 | |
Hubei Energy Group Co., Ltd., Class A | | | 277,714 | | | | 206,578 | |
Humanwell Healthcare Group Co., Ltd. | | | 69,600 | | | | 178,121 | |
Hundsun Technologies, Inc. | | | 28,100 | | | | 230,062 | |
Iflytek Co., Ltd., Class A | | | 46,500 | | | | 406,439 | |
| | | | |
| | 10 | | See Notes to Financial Statements. |
Parametric Emerging Markets Fund
January 31, 2018
Portfolio of Investments — continued
| | | | | | | | |
| Security | | Shares | | | Value | |
| | | | | | | | |
| | |
| China (continued) | | | | | | |
iKang Healthcare Group, Inc. ADR(1) | | | 36,000 | | | $ | 579,960 | |
Industrial & Commercial Bank of China, Ltd., Class H | | | 5,073,000 | | | | 4,778,602 | |
Industrial Bank Co., Ltd. | | | 163,702 | | | | 485,960 | |
Inner Mongolia BaoTou Steel Union Co., Ltd.(1) | | | 707,000 | | | | 278,558 | |
Inner Mongolia Yili Industrial Group Co., Ltd. | | | 92,700 | | | | 501,985 | |
JD.com, Inc. ADR(1) | | | 33,900 | | | | 1,668,897 | |
Jiangsu Changjiang Electronics Technology Co., Ltd. | | | 76,300 | | | | 229,191 | |
Jiangsu Expressway Co., Ltd., Class H | | | 878,000 | | | | 1,350,466 | |
Jiangsu Hengrui Medicine Co., Ltd. | | | 44,640 | | | | 537,838 | |
Jiangsu Yanghe Brewery Joint-Stock Co., Ltd., Class A | | | 20,000 | | | | 413,039 | |
Jiangxi Copper Co., Ltd., Class H | | | 1,510,000 | | | | 2,551,058 | |
Jiangxi Ganfeng Lithium Co., Ltd., Class A | | | 34,100 | | | | 314,549 | |
Jilin Aodong Pharmaceutical Group Co., Ltd., Class A | | | 60,400 | | | | 217,200 | |
Jinke Properties Group Co., Ltd., Class A | | | 265,299 | | | | 217,471 | |
Jinyu Bio-Technology Co., Ltd. | | | 33,740 | | | | 162,046 | |
Jizhong Energy Resources Co., Ltd., Class A | | | 231,400 | | | | 217,614 | |
Kaidi Ecological and Environmental Technology Co., Ltd., Class A(1)(2) | | | 297,600 | | | | 188,838 | |
Kangde Xin Composite Material Group Co., Ltd., Class A | | | 76,700 | | | | 243,710 | |
Kangmei Pharmaceutical Co., Ltd. | | | 93,100 | | | | 307,849 | |
Kingboard Chemical Holdings, Ltd. | | | 256,100 | | | | 1,401,309 | |
Kingfa Sci & Tech Co., Ltd. | | | 171,338 | | | | 177,080 | |
Kunlun Energy Co., Ltd. | | | 958,000 | | | | 950,300 | |
Kweichow Moutai Co., Ltd. | | | 8,200 | | | | 996,697 | |
KWG Property Holding, Ltd. | | | 476,000 | | | | 802,123 | |
Lee & Man Paper Manufacturing, Ltd. | | | 1,220,000 | | | | 1,432,746 | |
Lenovo Group, Ltd. | | | 2,934,000 | | | | 1,688,967 | |
Lepu Medical Technology Beijing Co., Ltd., Class A | | | 69,200 | | | | 287,224 | |
Li Ning Co., Ltd.(1) | | | 774,208 | | | | 622,701 | |
Liaoning Cheng Da Co., Ltd.(1) | | | 72,100 | | | | 202,170 | |
Longfor Properties Co., Ltd. | | | 316,500 | | | | 1,032,864 | |
LONGi Green Energy Technology Co., Ltd. | | | 33,100 | | | | 202,596 | |
Luxshare Precision Industry Co., Ltd., Class A | | | 115,300 | | | | 398,403 | |
Luye Pharma Group, Ltd. | | | 496,500 | | | | 442,566 | |
Luzhou Laojiao Co., Ltd., Class A | | | 27,300 | | | | 283,539 | |
Maanshan Iron & Steel Co., Ltd., Class H(1) | | | 2,294,000 | | | | 1,229,508 | |
Meinian Onehealth Healthcare Holdings Co., Ltd., Class A | | | 96,200 | | | | 355,976 | |
Midea Group Co., Ltd., Class A | | | 60,900 | | | | 578,598 | |
NARI Technology Co., Ltd. | | | 85,600 | | | | 230,489 | |
NetEase, Inc. ADR | | | 6,200 | | | | 1,984,992 | |
Neusoft Corp. | | | 74,400 | | | | 157,223 | |
New Oriental Education & Technology Group, Inc. ADR | | | 32,200 | | | | 2,965,298 | |
Nine Dragons Paper Holdings, Ltd. | | | 879,000 | | | | 1,363,746 | |
O-film Tech Co., Ltd., Class A | | | 65,800 | | | | 186,649 | |
Oceanwide Holdings Co., Ltd., Class A(2) | | | 204,000 | | | | 256,816 | |
| | | | | | | | |
| Security | | Shares | | | Value | |
| | | | | | | | |
| | |
| China (continued) | | | | | | |
Offshore Oil Engineering Co., Ltd. | | | 217,300 | | | $ | 241,766 | |
Oriental Energy Co., Ltd., Class A | | | 132,900 | | | | 264,878 | |
PetroChina Co., Ltd., Class H | | | 7,560,000 | | | | 5,966,402 | |
PICC Property & Casualty Co., Ltd., Class H | | | 352,000 | | | | 728,209 | |
Ping An Bank Co., Ltd., Class A | | | 429,188 | | | | 958,333 | |
Ping An Insurance (Group) Co. of China, Ltd., Class H | | | 435,000 | | | | 5,123,423 | |
Pingdingshan Tianan Coal Mining Co., Ltd.(1) | | | 262,600 | | | | 283,105 | |
Poly Property Group Co., Ltd.(1) | | | 2,484,000 | | | | 1,372,727 | |
Poly Real Estate Group Co., Ltd., Class A | | | 271,600 | | | | 743,143 | |
Power Construction Corp. of China, Ltd. | | | 187,000 | | | | 217,883 | |
Qingdao Haier Co., Ltd. | | | 133,100 | | | | 448,456 | |
RiseSun Real Estate Development Co., Ltd., Class A | | | 249,300 | | | | 545,569 | |
SAIC Motor Corp., Ltd. | | | 82,400 | | | | 450,879 | |
Sanan Optoelectronics Co., Ltd. | | | 84,900 | | | | 313,237 | |
Sany Heavy Industry Co., Ltd. | | | 122,300 | | | | 178,713 | |
SDIC Power Holdings Co., Ltd. | | | 200,900 | | | | 229,611 | |
Semiconductor Manufacturing International Corp.(1) | | | 787,700 | | | | 1,133,609 | |
Shandong Gold Mining Co., Ltd. | | | 42,500 | | | | 215,069 | |
Shandong Nanshan Aluminum Co., Ltd. | | | 409,500 | | | | 230,151 | |
Shandong Weigao Group Medical Polymer Co., Ltd., Class H | | | 2,148,000 | | | | 1,591,079 | |
Shanghai Dazhong Public Utilities Group Co., Ltd. | | | 220,900 | | | | 159,021 | |
Shanghai Electric Group Co., Ltd., Class H(1) | | | 2,414,000 | | | | 980,309 | |
Shanghai Industrial Holdings, Ltd. | | | 304,000 | | | | 888,118 | |
Shanghai Jahwa United Co., Ltd. | | | 52,000 | | | | 281,910 | |
Shanghai Oriental Pearl Group Co., Ltd. | | | 58,400 | | | | 156,961 | |
Shanghai Pudong Development Bank Co., Ltd. | | | 244,400 | | | | 511,304 | |
Shanghai Zhangjiang High-Tech Park Development Co., Ltd. | | | 75,395 | | | | 169,861 | |
Shanxi Lu’an Environmental Energy Development Co., Ltd. | | | 152,200 | | | | 310,862 | |
Shanxi Xishan Coal & Electricity Power Co., Ltd., Class A | | | 152,700 | | | | 257,798 | |
Shenergy Co., Ltd. | | | 114,100 | | | | 109,318 | |
Shenwan Hongyuan Group Co., Ltd., Class A | | | 389,701 | | | | 331,362 | |
Shenzhen Inovance Technology Co., Ltd., Class A | | | 56,300 | | | | 250,922 | |
Shenzhen Investment, Ltd. | | | 674,000 | | | | 300,467 | |
Shenzhen Overseas Chinese Town Co., Ltd., Class A | | | 176,600 | | | | 290,675 | |
Shenzhen Zhongjin Lingnan Nonfemet Co., Ltd., Class A | | | 114,200 | | | | 217,510 | |
Shimao Property Holdings, Ltd. | | | 763,500 | | | | 2,265,594 | |
Siasun Robot & Automation Co., Ltd., Class A(1) | | | 114,800 | | | | 365,369 | |
Sichuan Changhong Electric Co., Ltd. | | | 307,800 | | | | 163,412 | |
Sichuan Chuantou Energy Co., Ltd. | | | 152,000 | | | | 235,201 | |
Sihuan Pharmaceutical Holdings Group, Ltd. | | | 3,161,000 | | | | 1,213,653 | |
SINA Corp.(1) | | | 11,900 | | | | 1,395,275 | |
Sino Biopharmaceutical, Ltd. | | | 3,764,000 | | | | 6,904,518 | |
| | | | |
| | 11 | | See Notes to Financial Statements. |
Parametric Emerging Markets Fund
January 31, 2018
Portfolio of Investments — continued
| | | | | | | | |
| Security | | Shares | | | Value | |
| | | | | | | | |
| | |
| China (continued) | | | | | | |
Sino-Ocean Group Holding, Ltd. | | | 2,570,500 | | | $ | 2,122,154 | |
Sinopec Shanghai Petrochemical Co., Ltd., Class H | | | 4,947,000 | | | | 3,020,493 | |
Sinopharm Group Co., Ltd., Class H | | | 1,100,800 | | | | 4,851,126 | |
Sohu.com, Inc.(1) | | | 10,300 | | | | 396,653 | |
Sun Art Retail Group, Ltd. | | | 1,476,000 | | | | 1,998,889 | |
Sunac China Holdings, Ltd. | | | 406,000 | | | | 1,937,717 | |
Suning Commerce Group Co., Ltd., Class A | | | 144,800 | | | | 303,098 | |
Tasly Pharmaceutical Group Co., Ltd. | | | 33,400 | | | | 190,315 | |
TBEA Co., Ltd. | | | 93,537 | | | | 145,758 | |
TCL Corp., Class A | | | 373,200 | | | | 211,834 | |
Tencent Holdings, Ltd. | | | 231,202 | | | | 13,661,133 | |
Tianqi Lithium Corp., Class A | | | 44,850 | | | | 373,044 | |
Tingyi (Cayman Islands) Holding Corp. | | | 1,720,000 | | | | 3,577,203 | |
Tonghua Dongbao Pharmaceutical Co., Ltd. | | | 71,640 | | | | 259,616 | |
Tongling Nonferrous Metals Group Co., Ltd.,
Class A(1) | | | 776,200 | | | | 358,621 | |
Tsinghua Tongfang Co., Ltd. | | | 100,600 | | | | 157,632 | |
Tsingtao Brewery Co., Ltd., Class H | | | 324,000 | | | | 1,803,987 | |
Tus-Sound Environmental Resources Co., Ltd., Class A | | | 46,900 | | | | 226,010 | |
Wanhua Chemical Group Co., Ltd.(2) | | | 35,865 | | | | 216,232 | |
Want Want China Holdings, Ltd. | | | 4,460,000 | | | | 3,930,648 | |
Weibo Corp. ADR(1) | | | 2,290 | | | | 296,715 | |
Weichai Power Co., Ltd., Class H | | | 887,600 | | | | 1,107,209 | |
West China Cement, Ltd.(1) | | | 4,450,000 | | | | 764,348 | |
Western Mining Co., Ltd. | | | 169,300 | | | | 224,859 | |
Western Securities Co., Ltd., Class A | | | 104,100 | | | | 206,951 | |
WH Group, Ltd.(3) | | | 3,559,000 | | | | 4,400,358 | |
Wintime Energy Co., Ltd.(2) | | | 327,670 | | | | 140,001 | |
Wuliangye Yibin Co., Ltd., Class A | | | 47,900 | | | | 642,243 | |
Xinhu Zhongbao Co., Ltd.(1) | | | 301,800 | | | | 266,680 | |
Yang Quan Coal Industry Group Co., Ltd.(1) | | | 189,300 | | | | 248,450 | |
Yango Group Co., Ltd., Class A | | | 206,192 | | | | 325,337 | |
Yangzijiang Shipbuilding Holdings, Ltd. | | | 1,535,000 | | | | 1,866,898 | |
Yanzhou Coal Mining Co., Ltd., Class H | | | 1,098,000 | | | | 1,909,697 | |
Yonghui Superstores Co., Ltd. | | | 233,400 | | | | 426,605 | |
Youngor Group Co., Ltd. | | | 132,440 | | | | 191,838 | |
Yuan Longping High-tech Agriculture Co., Ltd., Class A | | | 65,900 | | | | 263,804 | |
Yuexiu Property Co., Ltd. | | | 1,590,000 | | | | 340,909 | |
Yunnan Baiyao Group Co., Ltd., Class A | | | 21,200 | | | | 340,471 | |
Yunnan Chihong Zinc & Germanium Co., Ltd.(1) | | | 160,600 | | | | 185,813 | |
Zhaojin Mining Industry Co., Ltd., Class H | | | 1,440,000 | | | | 1,226,459 | |
Zhejiang China Commodities City Group Co., Ltd. | | | 167,200 | | | | 158,272 | |
Zhejiang Dahua Technology Co., Ltd., Class A | | | 69,550 | | | | 290,548 | |
Zhejiang Expressway Co., Ltd., Class H | | | 1,034,000 | | | | 1,221,109 | |
Zhejiang Huahai Pharmaceutical Co., Ltd. | | | 31,250 | | | | 130,462 | |
Zhejiang Longsheng Group Co., Ltd. | | | 148,343 | | | | 294,049 | |
| | | | | | | | |
| Security | | Shares | | | Value | |
| | | | | | | | |
| | |
| China (continued) | | | | | | |
Zhejiang Wanfeng Auto Wheel Co., Ltd., Class A | | | 84,800 | | | $ | 205,786 | |
Zhejiang Zheneng Electric Power Co., Ltd. | | | 246,600 | | | | 227,609 | |
Zhengzhou Yutong Bus Co., Ltd. | | | 66,400 | | | | 231,197 | |
Zhongjin Gold Corp., Ltd. | | | 115,900 | | | | 180,704 | |
Zhongtian Financial Group Co., Ltd., Class A(2) | | | 210,000 | | | | 122,671 | |
Zhuzhou CRRC Times Electric Co., Ltd., Class H | | | 89,500 | | | | 495,070 | |
Zijin Mining Group Co., Ltd., Class H | | | 8,448,000 | | | | 4,259,089 | |
ZTE Corp., Class H(1) | | | 456,103 | | | | 1,655,091 | |
| | | | | | | | | |
| | | | | | $ | 374,824,672 | |
| | | | | | | | | |
| | |
| Colombia — 1.5% | | | | | | |
Almacenes Exito SA | | | 465,190 | | | $ | 2,930,801 | |
Avianca Holdings SA, PFC Shares | | | 551,298 | | | | 554,601 | |
Banco Davivienda SA, PFC Shares | | | 81,361 | | | | 913,951 | |
Banco de Bogota SA | | | 77,039 | | | | 1,810,610 | |
Bancolombia SA | | | 114,355 | | | | 1,310,370 | |
Bancolombia SA ADR, PFC Shares | | | 84,300 | | | | 3,873,585 | |
Celsia SA ESP | | | 740,070 | | | | 1,220,414 | |
Cementos Argos SA | | | 529,343 | | | | 2,107,677 | |
Cementos Argos SA, PFC Shares | | | 253,603 | | | | 850,706 | |
Cemex Latam Holdings SA(1) | | | 173,596 | | | | 667,960 | |
Corporacion Financiera Colombiana SA | | | 74,770 | | | | 708,182 | |
Ecopetrol SA | | | 10,092,955 | | | | 9,459,939 | |
Empresa de Telecommunicaciones de Bogota SA(1) | | | 1,844,218 | | | | 307,370 | |
Grupo Argos SA | | | 395,281 | | | | 2,874,776 | |
Grupo Argos SA, PFC Shares | | | 108,995 | | | | 695,910 | |
Grupo Aval Acciones y Valores SA, PFC Shares | | | 2,976,771 | | | | 1,337,347 | |
Grupo de Inversiones Suramericana SA | | | 169,621 | | | | 2,397,888 | |
Grupo de Inversiones Suramericana SA,
PFC Shares | | | 48,367 | | | | 651,712 | |
Grupo Energia Bogota SA ESP | | | 2,931,523 | | | | 2,096,900 | |
Grupo Nutresa SA | | | 582,655 | | | | 5,551,451 | |
Interconexion Electrica SA | | | 823,887 | | | | 4,151,376 | |
| | | | | | | | | |
| | | | | | $ | 46,473,526 | |
| | | | | | | | | |
| | |
| Croatia — 0.7% | | | | | | |
AD Plastik DD | | | 19,187 | | | $ | 593,426 | |
Adris Grupa DD, PFC Shares | | | 47,518 | | | | 3,426,781 | |
Atlantic Grupa DD | | | 1,465 | | | | 239,019 | |
Atlantska Plovidba DD(1) | | | 12,175 | | | | 1,329,422 | |
Ericsson Nikola Tesla DD | | | 7,395 | | | | 1,501,729 | |
Hrvatski Telekom DD | | | 185,995 | | | | 5,157,481 | |
INA Industrija Nafte DD | | | 900 | | | | 458,161 | |
Koncar-Elektroindustrija DD | | | 8,576 | | | | 1,005,795 | |
Kras DD | | | 4,381 | | | | 331,827 | |
Ledo DD(1) | | | 978 | | | | 65,242 | |
| | | | |
| | 12 | | See Notes to Financial Statements. |
Parametric Emerging Markets Fund
January 31, 2018
Portfolio of Investments — continued
| | | | | | | | |
| Security | | Shares | | | Value | |
| | | | | | | | |
| | |
| Croatia (continued) | | | | | | |
Podravka Prehrambena Industrija DD | | | 19,726 | | | $ | 888,537 | |
Valamar Riviera DD | | | 754,570 | | | | 5,430,610 | |
Zagrebacka Banka DD | | | 178,504 | | | | 1,725,368 | |
| | | | | | | | | |
| | | | | | $ | 22,153,398 | |
| | | | | | | | | |
| | |
| Czech Republic — 0.7% | | | | | | |
CEZ AS | | | 310,200 | | | $ | 7,945,088 | |
Komercni Banka AS | | | 170,428 | | | | 7,826,801 | |
Philip Morris CR AS | | | 3,278 | | | | 2,724,408 | |
Unipetrol AS | | | 209,352 | | | | 3,766,058 | |
| | | | | | | | | |
| | | | | | $ | 22,262,355 | |
| | | | | | | | | |
| | |
| Egypt — 0.8% | | | | | | |
Alexandria Mineral Oils Co. | | | 1,176,841 | | | $ | 641,076 | |
Arab Cotton Ginning | | | 491,303 | | | | 163,063 | |
Commercial International Bank Egypt SAE | | | 1,060,819 | | | | 4,684,406 | |
Eastern Tobacco | | | 160,359 | | | | 4,216,321 | |
Egypt Kuwait Holding Co. SAE | | | 923,523 | | | | 906,265 | |
Egyptian Financial Group-Hermes Holding Co. | | | 393,508 | | | | 455,150 | |
ElSewedy Electric Co. | | | 269,621 | | | | 2,370,899 | |
Ezz Steel(1) | | | 576,315 | | | | 731,696 | |
Global Telecom Holding SAE(1) | | | 5,309,804 | | | | 2,049,549 | |
Juhayna Food Industries | | | 1,123,468 | | | | 692,220 | |
Maridive & Oil Services SAE(1) | | | 789,875 | | | | 355,246 | |
Orascom Telecom Media and Technology Holding SAE | | | 7,289,225 | | | | 292,567 | |
Oriental Weavers Co. | | | 936,875 | | | | 848,746 | |
Palm Hills Developments SAE(1) | | | 3,564,918 | | | | 767,160 | |
Pioneers Holding(1) | | | 373,831 | | | | 184,050 | |
Sidi Kerir Petrochemicals Co. | | | 803,688 | | | | 1,168,767 | |
Six of October Development & Investment Co.(1) | | | 382,178 | | | | 405,375 | |
Talaat Moustafa Group | | | 2,277,606 | | | | 1,225,240 | |
Telecom Egypt | | | 806,834 | | | | 607,983 | |
| | | | | | | | | |
| | | | | | $ | 22,765,779 | |
| | | | | | | | | |
| | |
| Estonia — 0.4% | | | | | | |
AS Merko Ehitus | | | 78,018 | | | $ | 869,973 | |
AS Tallink Grupp | | | 3,623,652 | | | | 5,558,549 | |
AS Tallinna Kaubamaja Grupp | | | 192,740 | | | | 2,350,618 | |
AS Tallinna Vesi | | | 116,590 | | | | 1,580,934 | |
Nordecon AS | | | 145,374 | | | | 225,348 | |
Olympic Entertainment Group AS | | | 831,290 | | | | 1,914,023 | |
| | | | | | | | | |
| | | | | | $ | 12,499,445 | |
| | | | | | | | | |
| | |
| Ghana — 0.2% | | | | | | |
CAL Bank, Ltd.(1) | | | 1,805,732 | | | $ | 460,701 | |
Ghana Commercial Bank, Ltd. | | | 1,626,918 | | | | 2,667,430 | |
| | | | | | | | |
| Security | | Shares | | | Value | |
| | | | | | | | |
| | |
| Ghana (continued) | | | | | | |
Produce Buying Co., Ltd.(1) | | | 488,128 | | | $ | 5,419 | |
Standard Chartered Bank of Ghana, Ltd. | | | 209,400 | | | | 1,441,326 | |
| | | | | | | | | |
| | | | | | $ | 4,574,876 | |
| | | | | | | | | |
| | |
| Greece — 1.5% | | | | | | |
Aegean Airlines SA | | | 78,939 | | | $ | 898,655 | |
Aegean Marine Petroleum Network, Inc. | | | 66,025 | | | | 307,016 | |
Alpha Bank AE(1) | | | 994,698 | | | | 2,420,208 | |
Athens Water Supply & Sewage Co. SA | | | 104,694 | | | | 888,107 | |
Costamare, Inc. | | | 108,419 | | | | 706,892 | |
Diana Shipping, Inc.(1) | | | 182,990 | | | | 695,362 | |
Ellaktor SA(1) | | | 333,206 | | | | 776,236 | |
Eurobank Ergasias SA(1) | | | 668,793 | | | | 745,526 | |
FF Group(1) | | | 46,335 | | | | 1,110,979 | |
GasLog, Ltd. | | | 70,301 | | | | 1,420,080 | |
GEK Terna Holding Real Estate Construction SA(1) | | | 180,050 | | | | 1,207,195 | |
Grivalia Properties REIC AE | | | 14,830 | | | | 171,327 | |
Hellenic Exchanges - Athens Stock Exchange SA | | | 230,984 | | | | 1,647,953 | |
Hellenic Petroleum SA | | | 127,570 | | | | 1,392,691 | |
Hellenic Telecommunications Organization SA | | | 491,580 | | | | 7,708,678 | |
Holding Co. ADMIE IPTO SA(1) | | | 402,146 | | | | 1,050,007 | |
JUMBO SA | | | 135,382 | | | | 2,674,332 | |
Motor Oil (Hellas) Corinth Refineries SA | | | 119,734 | | | | 2,992,477 | |
Mytilineos Holdings SA(1) | | | 189,130 | | | | 2,371,326 | |
National Bank of Greece SA(1) | | | 9,050,198 | | | | 3,826,815 | |
Navios Maritime Holdings, Inc.(1) | | | 293,886 | | | | 358,541 | |
OPAP SA | | | 249,882 | | | | 3,348,434 | |
Public Power Corp. SA(1) | | | 404,501 | | | | 1,597,164 | |
StealthGas, Inc.(1) | | | 37,397 | | | | 162,677 | |
Terna Energy SA | | | 112,955 | | | | 691,791 | |
Titan Cement Co. SA | | | 156,592 | | | | 4,805,777 | |
Tsakos Energy Navigation, Ltd. | | | 106,400 | | | | 388,360 | |
| | | | | | | | | |
| | | | | | $ | 46,364,606 | |
| | | | | | | | | |
| | |
| Hungary — 0.7% | | | | | | |
Magyar Telekom Telecommunications PLC | | | 1,023,950 | | | $ | 1,913,062 | |
MOL Hungarian Oil & Gas PLC | | | 561,932 | | | | 6,863,587 | |
OTP Bank PLC | | | 156,074 | | | | 7,231,553 | |
Richter Gedeon Nyrt. | | | 251,599 | | | | 6,458,548 | |
| | | | | | | | | |
| | | | | | $ | 22,466,750 | |
| | | | | | | | | |
| | |
| India — 5.9% | | | | | | |
ABB India, Ltd. | | | 19,900 | | | $ | 517,358 | |
ACC, Ltd. | | | 45,970 | | | | 1,238,925 | |
Adani Enterprises, Ltd. | | | 180,900 | | | | 602,549 | |
| | | | |
| | 13 | | See Notes to Financial Statements. |
Parametric Emerging Markets Fund
January 31, 2018
Portfolio of Investments — continued
| | | | | | | | |
| Security | | Shares | | | Value | |
| | | | | | | | |
| | |
| India (continued) | | | | | | |
Adani Ports and Special Economic Zone, Ltd. | | | 658,048 | | | $ | 4,415,476 | |
Adani Power, Ltd.(1) | | | 556,250 | | | | 318,633 | |
Adani Transmission, Ltd.(1) | | | 299,124 | | | | 977,419 | |
Aditya Birla Capital, Ltd.(1) | | | 94,280 | | | | 252,471 | |
Aditya Birla Fashion and Retail, Ltd.(1) | | | 92,050 | | | | 236,827 | |
Ambuja Cements, Ltd. | | | 342,920 | | | | 1,415,036 | |
Asian Paints, Ltd. | | | 102,017 | | | | 1,814,896 | |
Axis Bank, Ltd. | | | 189,668 | | | | 1,767,666 | |
Bajaj Auto, Ltd. | | | 33,912 | | | | 1,773,342 | |
Bank of Baroda | | | 175,282 | | | | 430,105 | |
Bank of India(1) | | | 109,562 | | | | 269,345 | |
Bharat Forge, Ltd. | | | 127,300 | | | | 1,438,699 | |
Bharat Heavy Electricals, Ltd. | | | 648,450 | | | | 1,015,878 | |
Bharat Petroleum Corp., Ltd. | | | 192,772 | | | | 1,483,870 | |
Bharti Airtel, Ltd. | | | 1,387,736 | | | | 9,585,155 | |
Biocon, Ltd. | | | 181,800 | | | | 1,754,697 | |
Canara Bank | | | 67,631 | | | | 360,937 | |
CG Power and Industrial Solutions, Ltd.(1) | | | 213,600 | | | | 304,089 | |
Cipla, Ltd. | | | 237,210 | | | | 2,212,063 | |
Coal India, Ltd. | | | 290,700 | | | | 1,372,001 | |
Colgate-Palmolive (India), Ltd. | | | 77,000 | | | | 1,354,645 | |
Container Corp. of India, Ltd. | | | 67,800 | | | | 1,480,962 | |
Crompton Greaves Consumer Electricals, Ltd. | | | 213,600 | | | | 833,145 | |
Cummins India, Ltd. | | | 49,900 | | | | 704,930 | |
Dabur India, Ltd. | | | 465,900 | | | | 2,608,355 | |
Divi’s Laboratories, Ltd. | | | 93,600 | | | | 1,534,693 | |
DLF, Ltd. | | | 88,900 | | | | 348,860 | |
Dr. Reddy’s Laboratories, Ltd. | | | 48,300 | | | | 1,691,111 | |
GAIL (India), Ltd. | | | 278,022 | | | | 2,091,619 | |
GlaxoSmithKline Pharmaceuticals, Ltd. | | | 8,680 | | | | 333,914 | |
Glenmark Pharmaceuticals, Ltd. | | | 125,460 | | | | 1,194,112 | |
GMR Infrastructure, Ltd.(1) | | | 1,721,400 | | | | 585,781 | |
Grasim Industries, Ltd. | | | 67,343 | | | | 1,226,968 | |
Gujarat State Petronet, Ltd. | | | 265,747 | | | | 846,319 | |
HCL Technologies, Ltd. | | | 156,435 | | | | 2,419,443 | |
HDFC Bank, Ltd. | | | 100,584 | | | | 3,277,880 | |
Hero MotoCorp, Ltd. | | | 31,601 | | | | 1,832,589 | |
Hindalco Industries, Ltd. | | | 229,710 | | | | 922,521 | |
Hindustan Petroleum Corp., Ltd. | | | 190,488 | | | | 1,183,570 | |
Hindustan Unilever, Ltd. | | | 273,143 | | | | 5,861,117 | |
Hindustan Zinc, Ltd. | | | 148,400 | | | | 721,972 | |
Housing Development Finance Corp., Ltd. | | | 129,630 | | | | 3,982,219 | |
ICICI Bank, Ltd. | | | 282,999 | | | | 1,566,513 | |
IDBI Bank, Ltd.(1) | | | 367,000 | | | | 347,881 | |
Idea Cellular, Ltd.(1) | | | 1,816,900 | | | | 2,639,138 | |
IDFC Bank, Ltd. | | | 260,034 | | | | 231,409 | |
| | | | | | | | |
| Security | | Shares | | | Value | |
| | | | | | | | |
| | |
| India (continued) | | | | | | |
IDFC, Ltd. | | | 260,034 | | | $ | 229,093 | |
IFCI, Ltd.(1) | | | 673,372 | | | | 300,205 | |
Indiabulls Housing Finance, Ltd. | | | 40,115 | | | | 873,020 | |
Indiabulls Real Estate, Ltd.(1) | | | 91,200 | | | | 306,183 | |
Indian Hotels Co., Ltd. (The) | | | 197,136 | | | | 427,775 | |
Indian Oil Corp., Ltd. | | | 212,700 | | | | 1,392,593 | |
Infosys, Ltd. | | | 483,819 | | | | 8,723,823 | |
ITC, Ltd. | | | 978,546 | | | | 4,169,879 | |
Jindal Steel & Power, Ltd.(1) | | | 268,800 | | | | 1,118,912 | |
JSW Steel, Ltd. | | | 442,738 | | | | 2,035,599 | |
Kotak Mahindra Bank, Ltd. | | | 85,911 | | | | 1,495,671 | |
Larsen & Toubro, Ltd. | | | 256,557 | | | | 5,739,034 | |
LIC Housing Finance, Ltd. | | | 49,663 | | | | 416,987 | |
Lupin, Ltd. | | | 80,300 | | | | 1,117,217 | |
Mahindra & Mahindra, Ltd. | | | 121,720 | | | | 1,462,904 | |
Maruti Suzuki India, Ltd. | | | 27,850 | | | | 4,153,886 | |
Nestle India, Ltd. | | | 11,930 | | | | 1,397,683 | |
NMDC, Ltd. | | | 86,003 | | | | 189,185 | |
NTPC, Ltd. | | | 1,745,919 | | | | 4,672,448 | |
Oil & Natural Gas Corp., Ltd. | | | 694,501 | | | | 2,217,639 | |
Oracle Financial Services Software, Ltd. | | | 13,345 | | | | 876,214 | |
Piramal Enterprises, Ltd. | | | 76,807 | | | | 3,303,293 | |
Power Grid Corporation of India, Ltd. | | | 1,307,767 | | | | 3,987,613 | |
Reliance Capital, Ltd. | | | 36,735 | | | | 280,549 | |
Reliance Communications, Ltd.(1) | | | 1,412,060 | | | | 653,111 | |
Reliance Industries, Ltd. | | | 657,396 | | | | 9,926,440 | |
Reliance Infrastructure, Ltd. | | | 133,300 | | | | 1,037,240 | |
Reliance Power, Ltd.(1) | | | 1,400,250 | | | | 1,002,446 | |
Siemens, Ltd. | | | 47,180 | | | | 958,750 | |
State Bank of India | | | 248,606 | | | | 1,226,435 | |
Steel Authority of India, Ltd.(1) | | | 513,200 | | | | 717,112 | |
Sun Pharmaceutical Industries, Ltd. | | | 498,368 | | | | 4,535,649 | |
Sun TV Network, Ltd. | | | 55,449 | | | | 888,204 | |
Suzlon Energy, Ltd.(1) | | | 2,099,450 | | | | 484,184 | |
Tata Communications, Ltd. | | | 127,400 | | | | 1,227,883 | |
Tata Consultancy Services, Ltd. | | | 119,737 | | | | 5,847,642 | |
Tata Global Beverages, Ltd. | | | 74,700 | | | | 341,135 | |
Tata Motors, Ltd.(1) | | | 208,855 | | | | 1,307,513 | |
Tata Power Co., Ltd. (The) | | | 1,346,918 | | | | 1,881,557 | |
Tata Steel, Ltd. | | | 102,296 | | | | 1,135,102 | |
Tech Mahindra, Ltd. | | | 160,844 | | | | 1,545,943 | |
Titan Co., Ltd. | | | 138,900 | | | | 1,894,922 | |
UltraTech Cement, Ltd. | | | 30,328 | | | | 2,084,022 | |
Unitech, Ltd.(1) | | | 2,836,900 | | | | 375,744 | |
United Spirits, Ltd.(1) | | | 29,285 | | | | 1,502,849 | |
UPL, Ltd. | | | 105,956 | | | | 1,249,981 | |
| | | | |
| | 14 | | See Notes to Financial Statements. |
Parametric Emerging Markets Fund
January 31, 2018
Portfolio of Investments — continued
| | | | | | | | |
| Security | | Shares | | | Value | |
| | | | | | | | |
| | |
| India (continued) | | | | | | |
Vedanta, Ltd. | | | 476,489 | | | $ | 2,545,052 | |
Voltas, Ltd. | | | 214,800 | | | | 2,037,726 | |
Wipro, Ltd. | | | 279,904 | | | | 1,340,073 | |
Yes Bank, Ltd. | | | 224,815 | | | | 1,250,500 | |
Zee Entertainment Enterprises, Ltd. | | | 142,399 | | | | 1,333,425 | |
| | | | | | | | | |
| | | | | | $ | 178,597,148 | |
| | | | | | | | | |
| | |
| Indonesia — 3.0% | | | | | | |
Adaro Energy Tbk PT | | | 20,118,500 | | | $ | 3,680,500 | |
AKR Corporindo Tbk PT | | | 4,864,500 | | | | 2,258,790 | |
Aneka Tambang Persero Tbk PT(1) | | | 10,251,500 | | | | 699,939 | |
Astra Argo Lestari Tbk PT | | | 775,000 | | | | 752,238 | |
Astra International Tbk PT | | | 13,196,100 | | | | 8,369,096 | |
Bank Central Asia Tbk PT | | | 1,999,700 | | | | 3,395,051 | |
Bank Danamon Indonesia Tbk PT | | | 1,913,203 | | | | 1,021,001 | |
Bank Mandiri Persero Tbk PT | | | 3,765,100 | | | | 2,288,891 | |
Bank Negara Indonesia Persero Tbk PT | | | 1,726,700 | | | | 1,212,458 | |
Bank Pan Indonesia Tbk PT(1) | | | 4,945,000 | | | | 542,566 | |
Bank Pembangunan Daerah Jawa Barat Dan Banten Tbk PT | | | 1,068,100 | | | | 184,243 | |
Bank Rakyat Indonesia Persero Tbk PT | | | 12,098,500 | | | | 3,345,830 | |
Bank Tabungan Negara Tbk PT | | | 2,513,500 | | | | 686,863 | |
Berlian Laju Tanker Tbk PT(1)(2) | | | 7,544,500 | | | | 0 | |
Bukit Asam Persero Tbk PT | | | 6,717,500 | | | | 1,705,640 | |
Bumi Serpong Damai Tbk PT | | | 3,215,100 | | | | 436,965 | |
Charoen Pokphand Indonesia Tbk PT | | | 5,565,200 | | | | 1,433,825 | |
Gudang Garam Tbk PT | | | 295,000 | | | | 1,786,691 | |
Hanson International Tbk PT(1) | | | 23,744,500 | | | | 196,668 | |
Indo Tambangraya Megah Tbk PT | | | 652,700 | | | | 1,475,826 | |
Indocement Tunggal Prakarsa Tbk PT | | | 2,435,200 | | | | 3,964,214 | |
Indofood Sukses Makmur Tbk PT | | | 3,485,500 | | | | 2,016,746 | |
Indosat Tbk PT | | | 1,634,500 | | | | 674,627 | |
Jasa Marga (Persero) Tbk PT | | | 3,198,000 | | | | 1,360,625 | |
Kalbe Farma Tbk PT | | | 61,346,500 | | | | 7,615,553 | |
Lippo Karawaci Tbk PT | | | 6,134,800 | | | | 252,073 | |
Matahari Department Store Tbk PT | | | 686,300 | | | | 570,252 | |
Matahari Putra Prima Tbk PT(1) | | | 7,240,000 | | | | 261,544 | |
Medco Energi Internasional Tbk PT(1) | | | 17,990,000 | | | | 1,665,691 | |
Media Nusantara Citra Tbk PT | | | 3,201,000 | | | | 364,158 | |
Mitra Keluarga Karyasehat Tbk PT | | | 3,345,900 | | | | 477,015 | |
MNC Investama Tbk PT(1) | | | 49,042,500 | | | | 443,409 | |
Perusahaan Gas Negara Persero Tbk PT | | | 31,781,800 | | | | 6,192,047 | |
Perusahaan Perkebunan London Sumatra Indonesia Tbk PT | | | 7,185,000 | | | | 702,983 | |
PP Persero Tbk PT | | | 8,311,089 | | | | 1,941,926 | |
Semen Indonesia Persero Tbk PT | | | 5,479,200 | | | | 4,552,784 | |
| | | | | | | | |
| Security | | Shares | | | Value | |
| | | | | | | | |
| | |
| Indonesia (continued) | | | | | | |
Sigmagold Inti Perkasa Tbk PT(1)(2) | | | 17,097,000 | | | $ | 44,695 | |
Siloam International Hospitals Tbk PT(1) | | | 2,296,600 | | | | 1,510,532 | |
Sugih Energy Tbk PT(1)(2) | | | 49,382,700 | | | | 73,769 | |
Surya Semesta Internusa Tbk PT | | | 14,275,000 | | | | 623,843 | |
Telekomunikasi Indonesia Persero Tbk PT | | | 25,815,800 | | | | 7,693,069 | |
Tower Bersama Infrastructure Tbk PT | | | 2,272,900 | | | | 1,041,961 | |
Unilever Indonesia Tbk PT | | | 746,500 | | | | 3,031,842 | |
United Tractors Tbk PT | | | 1,701,383 | | | | 4,933,559 | |
Vale Indonesia Tbk PT(1) | | | 5,222,500 | | | | 1,456,574 | |
Waskita Karya Persero Tbk PT | | | 4,712,800 | | | | 996,915 | |
Wijaya Karya Beton Tbk PT | | | 3,158,200 | | | | 141,520 | |
Wijaya Karya Persero Tbk PT | | | 6,522,800 | | | | 1,012,252 | |
XL Axiata Tbk PT(1) | | | 2,604,900 | | | | 581,445 | |
| | | | | | | | | |
| | | | | | $ | 91,670,704 | |
| | | | | | | | | |
| | |
| Jordan — 0.7% | | | | | | |
Al-Eqbal Investment Co. PLC | | | 70,342 | | | $ | 3,680,444 | |
Alia The Royal Jordanian Airlines PLC(1) | | | 249,829 | | | | 183,087 | |
Arab Bank PLC | | | 903,834 | | | | 7,411,285 | |
Arab Potash Co. PLC | | | 77,671 | | | | 1,817,988 | |
Bank of Jordan | | | 276,495 | | | | 1,204,010 | |
Cairo Amman Bank | | | 313,506 | | | | 676,297 | |
Capital Bank of Jordan | | | 406,376 | | | | 456,776 | |
Jordan Ahli Bank | | | 453,459 | | | | 779,628 | |
Jordan Islamic Bank | | | 227,486 | | | | 1,205,451 | |
Jordan Petroleum Refinery | | | 450,709 | | | | 1,732,103 | |
Jordan Telecommunications Co. | | | 120,379 | | | | 366,415 | |
Jordanian Electric Power Co. | | | 395,572 | | | | 979,955 | |
Union Investment Corp. PLC(1) | | | 99,181 | | | | 165,343 | |
| | | | | | | | | |
| | | | | | $ | 20,658,782 | |
| | | | | | | | | |
| | |
| Kazakhstan — 0.7% | | | | | | |
Halyk Savings Bank of Kazakhstan JSC GDR(1)(4) | | | 447,782 | | | $ | 5,795,808 | |
KAZ Minerals PLC(1) | | | 550,742 | | | | 6,408,985 | |
KazMunaiGas Exploration Production GDR(4) | | | 496,151 | | | | 6,819,715 | |
Kcell JSC GDR(4) | | | 414,605 | | | | 2,157,526 | |
Nostrum Oil & Gas PLC(1) | | | 75,523 | | | | 333,862 | |
| | | | | | | | | |
| | | | | | $ | 21,515,896 | |
| | | | | | | | | |
| | |
| Kenya — 0.7% | | | | | | |
ARM Cement, Ltd.(1) | | | 1,653,600 | | | $ | 203,853 | |
Bamburi Cement Co., Ltd. | | | 564,900 | | | | 976,123 | |
Barclays Bank of Kenya, Ltd. | | | 9,494,460 | | | | 1,001,906 | |
British American Tobacco Kenya, Ltd. | | | 52,000 | | | | 395,946 | |
Co-operative Bank of Kenya, Ltd. (The) | | | 7,647,436 | | | | 1,261,955 | |
| | | | |
| | 15 | | See Notes to Financial Statements. |
Parametric Emerging Markets Fund
January 31, 2018
Portfolio of Investments — continued
| | | | | | | | |
| Security | | Shares | | | Value | |
| | | | | | | | |
|
| Kenya (continued) | |
East African Breweries, Ltd. | | | 1,752,080 | | | $ | 4,329,678 | |
Equity Group Holdings, Ltd. | | | 6,707,500 | | | | 2,815,574 | |
KCB Group, Ltd. | | | 5,819,120 | | | | 2,597,819 | |
KenolKobil, Ltd. | | | 5,013,500 | | | | 726,080 | |
Kenya Power & Lighting, Ltd. | | | 7,482,654 | | | | 658,787 | |
Nation Media Group PLC | | | 518,384 | | | | 521,380 | |
Safaricom, Ltd. | | | 21,152,872 | | | | 6,141,295 | |
Standard Chartered Bank Kenya, Ltd. | | | 219,542 | | | | 431,545 | |
| | | | | | | | | |
| | | | | | $ | 22,061,941 | |
| | | | | | | | | |
| | |
| Kuwait — 1.4% | | | | | | |
Agility Public Warehousing Co. KSC | | | 1,676,506 | | | $ | 4,826,558 | |
Ahli United Bank | | | 352,908 | | | | 410,214 | |
Al Ahli Bank of Kuwait KSCP | | | 587,702 | | | | 595,763 | |
Al-Mazaya Holding Co. | | | 882,500 | | | | 332,941 | |
ALAFCO Aviation Lease and Finance Co. KSCP | | | 830,284 | | | | 1,040,328 | |
Boubyan Bank KSCP | | | 471,971 | | | | 724,443 | |
Boubyan Petrochemicals Co. | | | 1,754,743 | | | | 4,164,600 | |
Burgan Bank SAK | | | 562,380 | | | | 595,308 | |
Combined Group Contracting Co. KSC | | | 149,084 | | | | 229,135 | |
Commercial Bank of Kuwait KSCP | | | 472,404 | | | | 631,270 | |
Commercial Real Estate Co. KSCC | | | 2,296,205 | | | | 704,141 | |
Gulf Bank | | | 1,247,063 | | | | 1,031,631 | |
Gulf Cable & Electrical Industries Co. KSCP | | | 308,785 | | | | 446,378 | |
Gulf National Holding Co.(1)(2) | | | 595,711 | | | | 0 | |
Jazeera Airways Co. KSC | | | 299,261 | | | | 649,477 | |
Kuwait Cement Co. | | | 533,870 | | | | 853,027 | |
Kuwait Finance House KSCP | | | 2,071,196 | | | | 4,041,082 | |
Kuwait International Bank | | | 556,951 | | | | 417,991 | |
Kuwait Portland Cement Co. KSC | | | 200,012 | | | | 679,014 | |
Kuwait Projects Co. Holdings KSC | | | 476,189 | | | | 477,414 | |
Kuwait Real Estate Co. KSC(1) | | | 2,762,965 | | | | 540,781 | |
Mabanee Co. SAKC | | | 588,595 | | | | 1,437,490 | |
Mezzan Holding Co. KSCC | | | 138,999 | | | | 360,923 | |
Mobile Telecommunications Co. | | | 4,568,989 | | | | 7,196,360 | |
National Bank of Kuwait SAK | | | 2,190,745 | | | | 5,408,175 | |
National Industries Group Holding SAK(1) | | | 2,272,316 | | | | 1,226,831 | |
National Investment Co. | | | 581,744 | | | | 193,796 | |
National Real Estate Co. KPSC(1) | | | 862,155 | | | | 352,579 | |
Qurain Petrochemical Industries Co. KSC | | | 1,814,306 | | | | 2,049,400 | |
Sultan Center Food Products Co.(1)(2) | | | 3,421,833 | | | | 0 | |
Warba Bank KSCP(1) | | | 338,872 | | | | 253,509 | |
| | | | | | | | | |
| | | | | | $ | 41,870,559 | |
| | | | | | | | | |
| | |
| Latvia — 0.0%(5) | | | | | | |
Grindeks | | | 42,000 | | | $ | 400,109 | |
| | | | | | | | | |
| | | | | | $ | 400,109 | |
| | | | | | | | | |
| | | | | | | | |
| Security | | Shares | | | Value | |
| | | | | | | | |
| | |
| Lebanon — 0.1% | | | | | | |
Solidere GDR(1)(4) | | | 316,363 | | | $ | 2,739,704 | |
| | | | | | | | | |
| | | | | | $ | 2,739,704 | |
| | | | | | | | | |
| | |
| Lithuania — 0.1% | | | | | | |
Apranga PVA | | | 427,588 | | | $ | 1,389,734 | |
Energijos Skirstymo Operatorius AB | | | 128,934 | | | | 137,665 | |
Klaipedos Nafta AB | | | 1,345,900 | | | | 871,065 | |
Pieno Zvaigzdes | | | 104,200 | | | | 161,681 | |
Rokiskio Suris | | | 122,500 | | | | 420,847 | |
Siauliu Bankas | | | 1,919,893 | | | | 1,472,242 | |
| | | | | | | | | |
| | | | | | $ | 4,453,234 | |
| | | | | | | | | |
| | |
| Malaysia — 3.1% | | | | | | |
Aeon Co. (M) Bhd | | | 661,200 | | | $ | 277,119 | |
Airasia Bhd | | | 1,228,200 | | | | 1,304,120 | |
Alliance Bank Malaysia Bhd | | | 560,300 | | | | 621,980 | |
AMMB Holdings Bhd | | | 316,900 | | | | 391,768 | |
Astro Malaysia Holdings Bhd | | | 979,300 | | | | 652,663 | |
Axiata Group Bhd | | | 2,706,750 | | | | 3,941,820 | |
Berjaya Corp. Bhd(1) | | | 2,090,591 | | | | 182,337 | |
Berjaya Sports Toto Bhd | | | 830,250 | | | | 481,305 | |
Boustead Holdings Bhd | | | 834,694 | | | | 614,245 | |
British American Tobacco Malaysia Bhd | | | 109,700 | | | | 961,559 | |
Bumi Armada Bhd(1) | | | 3,133,350 | | | | 676,282 | |
Bursa Malaysia Bhd | | | 185,500 | | | | 518,441 | |
CIMB Group Holdings Bhd | | | 892,200 | | | | 1,657,488 | |
Dialog Group Bhd | | | 3,532,614 | | | | 2,316,558 | |
Digi.com Bhd | | | 1,873,500 | | | | 2,377,635 | |
Felda Global Ventures Holdings Bhd | | | 1,358,400 | | | | 699,633 | |
Gamuda Bhd | | | 965,900 | | | | 1,267,724 | |
Genting Bhd | | | 1,448,500 | | | | 3,575,199 | |
Genting Malaysia Bhd | | | 2,155,600 | | | | 3,045,223 | |
Genting Plantations Bhd | | | 261,700 | | | | 672,339 | |
Hartalega Holdings Bhd | | | 118,600 | | | | 359,697 | |
Hong Leong Bank Bhd | | | 116,000 | | | | 552,874 | |
Hong Leong Financial Group Bhd | | | 132,500 | | | | 630,319 | |
IHH Healthcare Bhd | | | 3,748,400 | | | | 5,782,003 | |
IJM Corp. Bhd | | | 1,567,680 | | | | 1,241,820 | |
IOI Corp. Bhd | | | 1,767,718 | | | | 2,124,407 | |
IOI Properties Group Bhd | | | 1,044,058 | | | | 532,885 | |
KLCCP Stapled Group | | | 399,100 | | | | 793,192 | |
KNM Group Bhd(1) | | | 5,003,150 | | | | 319,326 | |
Kuala Lumpur Kepong Bhd | | | 293,900 | | | | 1,901,812 | |
Lafarge Malaysia Bhd(1) | | | 942,950 | | | | 1,346,947 | |
Magnum Bhd | | | 940,340 | | | | 446,178 | |
Malayan Banking Bhd | | | 1,117,087 | | | | 2,893,501 | |
| | | | |
| | 16 | | See Notes to Financial Statements. |
Parametric Emerging Markets Fund
January 31, 2018
Portfolio of Investments — continued
| | | | | | | | |
| Security | | Shares | | | Value | |
| | | | | | | | |
| | |
| Malaysia (continued) | | | | | | |
Malaysia Airports Holdings Bhd | | | 342,800 | | | $ | 795,377 | |
Malaysian Resources Corp. Bhd | | | 761,400 | | | | 233,530 | |
Maxis Bhd | | | 1,252,500 | | | | 1,952,203 | |
MISC Bhd | | | 482,400 | | | | 931,923 | |
MMC Corp. Bhd | | | 1,217,800 | | | | 623,353 | |
My EG Services Bhd | | | 727,950 | | | | 466,396 | |
Nestle Malaysia Bhd | | | 12,300 | | | | 357,326 | |
Petronas Chemicals Group Bhd | | | 2,706,400 | | | | 5,641,355 | |
Petronas Dagangan Bhd | | | 507,500 | | | | 3,197,117 | |
Petronas Gas Bhd | | | 378,800 | | | | 1,736,632 | |
PPB Group Bhd | | | 404,100 | | | | 1,805,759 | |
Press Metal Aluminium Holdings Bhd | | | 2,435,220 | | | | 3,611,269 | |
Public Bank Bhd | | | 461,120 | | | | 2,599,173 | |
RHB Bank Bhd | | | 553,000 | | | | 771,489 | |
Sapura Energy Bhd | | | 5,340,168 | | | | 1,027,899 | |
Silverlake Axis, Ltd. | | | 703,200 | | | | 305,867 | |
Sime Darby Bhd | | | 1,193,039 | | | | 935,264 | |
Sime Darby Plantation Bhd(1) | | | 1,193,039 | | | | 1,683,462 | |
Sime Darby Property Bhd(1) | | | 1,193,039 | | | | 483,613 | |
Sunway Bhd | | | 717,840 | | | | 324,911 | |
Supermax Corp. Bhd | | | 1,732,700 | | | | 971,849 | |
Telekom Malaysia Bhd | | | 1,249,900 | | | | 1,971,623 | |
Tenaga Nasional Bhd | | | 1,751,225 | | | | 7,082,038 | |
Top Glove Corp. Bhd | | | 1,427,800 | | | | 3,387,386 | |
UEM Sunrise Bhd(1) | | | 1,683,050 | | | | 486,492 | |
UMW Holdings Bhd(1) | | | 448,400 | | | | 781,849 | |
Unisem (M) Bhd | | | 2,784,300 | | | | 2,153,223 | |
WCT Holdings Bhd(1) | | | 734,737 | | | | 293,943 | |
YTL Corp. Bhd | | | 2,920,734 | | | | 1,145,589 | |
YTL Power International Bhd | | | 1,920,860 | | | | 615,661 | |
| | | | | | | | | |
| | | | | | $ | 93,533,970 | |
| | | | | | | | | |
| | |
| Mauritius — 0.7% | | | | | | |
Alteo, Ltd. | | | 852,532 | | | $ | 787,699 | |
Attitude Property, Ltd. | | | 700,989 | | | | 276,987 | |
CIEL, Ltd. | | | 1,801,109 | | | | 411,071 | |
CIM Financial Services, Ltd. | | | 2,982,000 | | | | 952,293 | |
LUX Island Resorts, Ltd. | | | 987,060 | | | | 2,083,540 | |
MCB Group, Ltd. | | | 1,159,989 | | | | 9,851,011 | |
Phoenix Beverages, Ltd. | | | 24,345 | | | | 421,167 | |
Rogers & Co., Ltd. | | | 2,004,091 | | | | 2,060,866 | |
SBM Holdings, Ltd. | | | 11,724,679 | | | | 2,822,898 | |
Sun, Ltd., Class A(1) | | | 516,880 | | | | 777,310 | |
Terra Mauricia, Ltd. | | | 594,238 | | | | 538,509 | |
United Basalt Products, Ltd. | | | 334,219 | | | | 1,290,970 | |
| | | | | | | | | |
| | | | | | $ | 22,274,321 | |
| | | | | | | | | |
| | | | | | | | |
| Security | | Shares | | | Value | |
| | | | | | | | |
| | |
| Mexico — 5.3% | | | | | | |
Alfa SAB de CV, Series A | | | 5,242,472 | | | $ | 6,560,220 | |
Alsea SAB de CV | | | 694,800 | | | | 2,273,473 | |
America Movil SAB de CV, Series L | | | 25,844,950 | | | | 24,203,929 | |
America Movil SAB de CV, Series L ADR | | | 225,701 | | | | 4,220,609 | |
Arca Continental SAB de CV | | | 403,380 | | | | 2,935,229 | |
Bolsa Mexicana de Valores SAB de CV | | | 1,323,775 | | | | 2,537,767 | |
Cemex SAB de CV ADR(1) | | | 238,073 | | | | 1,973,625 | |
Cemex SAB de CV, Series CPO(1) | | | 7,728,239 | | | | 6,431,981 | |
Coca-Cola Femsa SAB de CV, Series L | | | 319,500 | | | | 2,445,722 | |
El Puerto de Liverpool SAB de CV | | | 163,780 | | | | 1,214,287 | |
Fibra Uno Administracion SA de CV | | | 2,054,090 | | | | 3,234,805 | |
Fomento Economico Mexicano SAB de CV ADR | | | 1,400 | | | | 136,556 | |
Fomento Economico Mexicano SAB de CV,
Series UBD | | | 1,189,956 | | | | 11,617,124 | |
Genomma Lab Internacional SAB de CV(1) | | | 2,778,500 | | | | 3,042,477 | |
Gentera SAB de CV | | | 2,133,200 | | | | 1,935,860 | |
Grupo Aeroportuario del Pacifico SAB de CV,
Class B | | | 370,587 | | | | 3,884,127 | |
Grupo Aeroportuario del Sureste SAB de CV,
Class B | | | 206,415 | | | | 4,014,899 | |
Grupo Bimbo SAB de CV, Series A | | | 1,376,145 | | | | 3,355,378 | |
Grupo Carso SAB de CV, Series A1 | | | 934,900 | | | | 3,517,727 | |
Grupo Elektra SAB de CV | | | 76,153 | | | | 2,780,203 | |
Grupo Financiero Banorte SAB de CV, Class O | | | 1,803,600 | | | | 11,551,258 | |
Grupo Financiero Inbursa SAB de CV, Class O | | | 3,836,400 | | | | 6,787,790 | |
Grupo Mexico SAB de CV, Series B | | | 2,709,379 | | | | 9,567,095 | |
Grupo Sanborns SAB de CV | | | 226,889 | | | | 252,346 | |
Grupo Simec SA de CV, Series B(1) | | | 133,800 | | | | 461,894 | |
Grupo Televisa SAB ADR | | | 431,500 | | | | 8,932,050 | |
Grupo Televisa SAB, Series CPO | | | 1,550,600 | | | | 6,419,264 | |
Impulsora del Desarrollo y el Empleo en America Latina SA de CV, Series B1(1) | | | 958,200 | | | | 1,801,926 | |
Industrias CH SAB de CV, Series B(1) | | | 225,500 | | | | 1,010,596 | |
Industrias Penoles SAB de CV | | | 126,965 | | | | 2,942,228 | |
Infraestructura Energetica Nova SAB de CV | | | 180,000 | | | | 938,117 | |
Kimberly-Clark de Mexico SAB de CV, Class A | | | 1,219,500 | | | | 2,284,791 | |
Mexichem SAB de CV | | | 1,049,899 | | | | 2,977,913 | |
Minera Frisco SAB de CV(1) | | | 714,800 | | | | 472,392 | |
Organizacion Soriana SAB de CV, Class B(1) | | | 120,000 | | | | 262,350 | |
Promotora y Operadora de Infraestructura
SAB de CV | | | 345,845 | | | | 3,540,815 | |
Telesites SAB de CV(1) | | | 1,386,268 | | | | 1,042,769 | |
Ternium SA ADR | | | 26,100 | | | | 890,271 | |
TV Azteca SAB de CV, Series CPO | | | 1,240,300 | | | | 223,913 | |
Wal-Mart de Mexico SAB de CV, Series V | | | 3,152,980 | | | | 7,887,638 | |
| | | | | | | | | |
| | | | | | $ | 162,563,414 | |
| | | | | | | | | |
| | |
| Morocco — 0.7% | | | | | | |
Attijariwafa Bank | | | 64,075 | | | $ | 3,501,871 | |
Banque Centrale Populaire | | | 71,323 | | | | 2,299,760 | |
BMCE Bank | | | 63,923 | | | | 1,571,780 | |
| | | | |
| | 17 | | See Notes to Financial Statements. |
Parametric Emerging Markets Fund
January 31, 2018
Portfolio of Investments — continued
| | | | | | | | |
| Security | | Shares | | | Value | |
| | | | | | | | |
| | |
| Morocco (continued) | | | | | | |
Cosumar | | | 84,250 | | | $ | 2,793,359 | |
Douja Promotion Groupe Addoha SA | | | 160,235 | | | | 586,236 | |
Label Vie | | | 3,100 | | | | 582,166 | |
LafargeHolcim Maroc SA | | | 17,330 | | | | 3,854,187 | |
Lesieur Cristal | | | 46,700 | | | | 916,750 | |
Managem SA | | | 2,236 | | | | 446,331 | |
Maroc Telecom | | | 271,350 | | | | 4,376,666 | |
Samir(1)(2) | | | 15,717 | | | | 0 | |
Taqa Morocco | | | 13,828 | | | | 1,565,944 | |
| | | | | | | | | |
| | | | | | $ | 22,495,050 | |
| | | | | | | | | |
| | |
| Nigeria — 0.8% | | | | | | |
Access Bank PLC | | | 26,850,917 | | | $ | 964,882 | |
Afriland Properties PLC(1)(2) | | | 1,286,159 | | | | 0 | |
Dangote Cement PLC | | | 3,798,144 | | | | 2,820,820 | |
Dangote Sugar Refinery PLC | | | 5,586,250 | | | | 322,294 | |
Ecobank Transnational, Inc. | | | 14,145,874 | | | | 782,224 | |
FBN Holdings PLC | | | 40,511,481 | | | | 1,564,195 | |
Fidelity Bank PLC | | | 22,430,824 | | | | 227,570 | |
Flour Mills of Nigeria PLC | | | 2,057,956 | | | | 194,297 | |
Forte Oil PLC(1) | | | 1,622,126 | | | | 221,277 | |
Guaranty Trust Bank PLC | | | 28,645,830 | | | | 3,903,059 | |
Guiness Nigeria PLC | | | 1,391,550 | | | | 457,903 | |
Lafarge Africa PLC | | | 7,206,875 | | | | 1,076,375 | |
Lekoil, Ltd.(1) | | | 1,547,494 | | | | 403,379 | |
Nestle Nigeria PLC | | | 413,429 | | | | 1,641,288 | |
Nigerian Breweries PLC | | | 4,747,707 | | | | 1,898,141 | |
Oando PLC(1) | | | 13,321,788 | | | | 220,604 | |
SEPLAT Petroleum Development Co. PLC(1)(3) | | | 825,805 | | | | 1,479,891 | |
Stanbic IBTC Holdings PLC | | | 1,977,675 | | | | 250,871 | |
Transnational Corp. of Nigeria PLC(1) | | | 44,100,342 | | | | 287,761 | |
UAC of Nigeria PLC | | | 4,651,935 | | | | 221,459 | |
Unilever Nigeria PLC | | | 2,740,833 | | | | 337,841 | |
United Bank for Africa PLC | | | 29,618,308 | | | | 1,043,961 | |
Zenith Bank PLC | | | 28,473,030 | | | | 2,447,226 | |
| | | | | | | | | |
| | | | | | $ | 22,767,318 | |
| | | | | | | | | |
| | |
| Oman — 0.6% | | | | | | |
Al Anwar Ceramic Tiles Co. | | | 1,033,027 | | | $ | 356,657 | |
Bank Dhofar SAOG | | | 2,090,131 | | | | 1,169,409 | |
Bank Muscat SAOG | | | 2,646,084 | | | | 2,848,272 | |
Bank Sohar SAOG | | | 2,706,490 | | | | 1,103,946 | |
Dhofar International Development & Investment Holding SAOG | | | 339,824 | | | | 276,362 | |
HSBC Bank Oman SAOG | | | 915,535 | | | | 261,902 | |
National Bank of Oman SAOG | | | 1,631,544 | | | | 919,619 | |
| | | | | | | | |
| Security | | Shares | | | Value | |
| | | | | | | | |
| | |
| Oman (continued) | | | | | | |
Oman Cables Industry SAOG | | | 127,600 | | | $ | 373,288 | |
Oman Cement Co. SAOG | | | 951,260 | | | | 968,400 | |
Oman Flour Mills Co. SAOG | | | 90,796 | | | | 205,951 | |
Oman Telecommunications Co. SAOG | | | 936,551 | | | | 2,726,222 | |
Ominvest | | | 1,442,590 | | | | 1,558,421 | |
Ooredoo | | | 731,509 | | | | 960,027 | |
Phoenix Power Co. SAOC | | | 2,829,100 | | | | 956,162 | |
Raysut Cement Co. SAOG | | | 634,342 | | | | 1,292,158 | |
Renaissance Services SAOG(1) | | | 1,523,972 | | | | 1,382,072 | |
Sembcorp Salalah Power & Water Co. | | | 1,120,000 | | | | 634,362 | |
| | | | | | | | | |
| | | | | | $ | 17,993,230 | |
| | | | | | | | | |
| | |
| Pakistan — 1.1% | | | | | | |
Adamjee Insurance Co., Ltd. | | | 1,115,744 | | | $ | 580,522 | |
Bank Alfalah, Ltd.(1) | | | 2,236,538 | | | | 972,370 | |
Cherat Cement Co., Ltd. | | | 231,500 | | | | 288,204 | |
D.G. Khan Cement Co., Ltd. | | | 322,232 | | | | 466,018 | |
Engro Corp., Ltd. | | | 487,387 | | | | 1,330,377 | |
Engro Fertilizers, Ltd. | | | 610,528 | | | | 385,078 | |
Engro Foods, Ltd. | | | 512,800 | | | | 429,380 | |
Fatima Fertilizer Co., Ltd. | | | 680,500 | | | | 200,323 | |
Fauji Cement Co., Ltd. | | | 1,580,000 | | | | 417,674 | |
Fauji Fertilizer Bin Qasim, Ltd. | | | 1,026,000 | | | | 352,441 | |
Fauji Fertilizer Co., Ltd. | | | 1,398,110 | | | | 1,143,395 | |
Habib Bank, Ltd. | | | 1,125,817 | | | | 1,976,943 | |
Hub Power Co., Ltd. | | | 3,388,900 | | | | 3,053,320 | |
K-Electric, Ltd.(1) | | | 11,230,000 | | | | 674,061 | |
Kot Addu Power Co., Ltd. | | | 1,364,400 | | | | 717,971 | |
Lucky Cement, Ltd. | | | 303,500 | | | | 1,688,730 | |
Maple Leaf Cement Factory, Ltd. | | | 624,937 | | | | 463,306 | |
Mari Petroleum Co., Ltd. | | | 43,100 | | | | 610,507 | |
MCB Bank, Ltd. | | | 1,209,730 | | | | 2,478,413 | |
Millat Tractors, Ltd. | | | 97,690 | | | | 1,163,052 | |
National Bank of Pakistan | | | 672,540 | | | | 297,557 | |
Nishat Mills, Ltd. | | | 2,394,071 | | | | 3,679,292 | |
Oil & Gas Development Co., Ltd. | | | 1,122,391 | | | | 1,669,779 | |
Pak Elektron, Ltd. | | | 892,000 | | | | 489,480 | |
Pak Suzuki Motor Co., Ltd. | | | 106,700 | | | | 499,077 | |
Pakistan Oilfields, Ltd. | | | 188,600 | | | | 959,337 | |
Pakistan Petroleum, Ltd. | | | 837,777 | | | | 1,560,196 | |
Pakistan State Oil Co., Ltd. | | | 503,274 | | | | 1,437,912 | |
Pakistan Telecommunication Co., Ltd. | | | 1,949,200 | | | | 245,600 | |
Searle Co., Ltd. (The) | | | 686,633 | | | | 2,339,801 | |
SUI Southern Gas Co., Ltd.(1) | | | 1,500,051 | | | | 482,283 | |
TRG Pakistan(1) | | | 1,992,000 | | | | 638,911 | |
United Bank, Ltd. | | | 556,245 | | | | 975,380 | |
| | | | | | | | | |
| | | | | | $ | 34,666,690 | |
| | | | | | | | | |
| | | | |
| | 18 | | See Notes to Financial Statements. |
Parametric Emerging Markets Fund
January 31, 2018
Portfolio of Investments — continued
| | | | | | | | |
| Security | | Shares | | | Value | |
| | | | | | | | |
| | |
| Panama — 0.3% | | | | | | |
Copa Holdings SA, Class A | | | 59,767 | | | $ | 8,267,569 | |
| | | | | | | | | |
| | | | | | $ | 8,267,569 | |
| | | | | | | | | |
| | |
| Peru — 1.5% | | | | | | |
Alicorp SAA | | | 1,532,318 | | | $ | 5,317,372 | |
BBVA Banco Continental SA | | | 325,899 | | | | 441,828 | |
Cementos Pacasmayo SAA | | | 192,689 | | | | 500,296 | |
Cia de Minas Buenaventura SA ADR | | | 281,597 | | | | 4,345,042 | |
Cia Minera Milpo SA | | | 396,999 | | | | 685,120 | |
Credicorp, Ltd. | | | 75,400 | | | | 17,464,902 | |
Ferreycorp SAA | | | 3,127,077 | | | | 2,518,386 | |
Grana y Montero SAA(1) | | | 1,115,664 | | | | 641,784 | |
Intercorp Financial Services, Inc. | | | 38,439 | | | | 1,549,092 | |
Southern Copper Corp. | | | 188,576 | | | | 9,155,365 | |
Volcan Cia Minera SAA, Class B | | | 3,886,275 | | | | 1,655,534 | |
| | | | | | | | | |
| | | | | | $ | 44,274,721 | |
| | | | | | | | | |
| | |
| Philippines — 2.8% | | | | | | |
Aboitiz Equity Ventures, Inc. | | | 1,554,400 | | | $ | 2,324,635 | |
Aboitiz Power Corp. | | | 3,330,700 | | | | 2,665,567 | |
Alliance Global Group, Inc.(1) | | | 2,794,300 | | | | 835,463 | |
Ayala Corp. | | | 155,315 | | | | 3,179,512 | |
Ayala Land, Inc. | | | 3,898,800 | | | | 3,363,498 | |
Ayala Land, Inc., PFC Shares(2) | | | 3,951,800 | | | | 0 | |
Bank of the Philippine Islands | | | 1,036,855 | | | | 2,407,784 | |
BDO Unibank, Inc. | | | 1,091,944 | | | | 3,253,975 | |
Bloomberry Resorts Corp.(1) | | | 12,417,700 | | | | 2,971,028 | |
Cosco Capital, Inc. | | | 3,726,300 | | | | 522,785 | |
D&L Industries, Inc. | | | 4,814,000 | | | | 1,142,252 | |
DMCI Holdings, Inc. | | | 2,571,600 | | | | 721,853 | |
Emperador, Inc. | | | 4,313,300 | | | | 686,207 | |
Energy Development Corp. | | | 14,106,300 | | | | 1,560,789 | |
Filinvest Land, Inc. | | | 9,303,000 | | | | 338,715 | |
First Gen Corp. | | | 2,377,522 | | | | 740,189 | |
First Philippine Holdings Corp. | | | 587,500 | | | | 707,813 | |
Globe Telecom, Inc. | | | 45,740 | | | | 1,693,734 | |
GT Capital Holdings, Inc. | | | 55,025 | | | | 1,443,510 | |
International Container Terminal Services, Inc. | | | 579,270 | | | | 1,279,814 | |
JG Summit Holdings, Inc. | | | 1,959,520 | | | | 2,924,698 | |
Jollibee Foods Corp. | | | 1,030,250 | | | | 5,714,006 | |
Lopez Holdings Corp. | | | 4,600,000 | | | | 493,243 | |
LT Group, Inc. | | | 1,873,000 | | | | 819,625 | |
Manila Electric Co. | | | 495,030 | | | | 3,268,077 | |
Manila Water Co. | | | 1,633,000 | | | | 899,826 | |
Megaworld Corp. | | | 12,596,000 | | | | 1,215,519 | |
| | | | | | | | |
| Security | | Shares | | | Value | |
| | | | | | | | |
| | |
| Philippines (continued) | | | | | | |
Melco Resorts and Entertainment (Philippines)
Corp.(1) | | | 3,711,400 | | | $ | 615,284 | |
Metro Pacific Investments Corp. | | | 7,682,400 | | | | 967,368 | |
Metropolitan Bank & Trust Co. | | | 967,766 | | | | 1,875,898 | |
Nickel Asia Corp. | | | 5,281,800 | | | | 677,949 | |
Petron Corp. | | | 4,267,400 | | | | 798,913 | |
Philex Mining Corp. | | | 6,094,825 | | | | 796,490 | |
PLDT, Inc. | | | 191,945 | | | | 5,858,675 | |
Puregold Price Club, Inc. | | | 2,240,100 | | | | 2,327,957 | |
Robinsons Land Corp. | | | 1,187,900 | | | | 483,034 | |
Robinsons Retail Holdings, Inc. | | | 1,269,250 | | | | 2,343,082 | |
San Miguel Corp. | | | 375,000 | | | | 1,052,971 | |
Security Bank Corp. | | | 243,300 | | | | 1,165,862 | |
Semirara Mining & Power Corp. | | | 3,622,920 | | | | 2,677,482 | |
SM Investments Corp. | | | 301,103 | | | | 6,001,806 | |
SM Prime Holdings, Inc. | | | 7,232,399 | | | | 5,201,180 | |
SSI Group, Inc.(1) | | | 2,061,000 | | | | 122,948 | |
Travellers International Hotel Group, Inc. | | | 3,521,900 | | | | 272,116 | |
Universal Robina Corp. | | | 1,693,830 | | | | 5,326,208 | |
Vista Land & Lifescapes, Inc. | | | 3,675,000 | | | | 499,917 | |
| | | | | | | | | |
| | | | | | $ | 86,239,257 | |
| | | | | | | | | |
| | |
| Poland — 3.0% | | | | | | |
Alior Bank SA(1) | | | 65,097 | | | $ | 1,661,992 | |
AmRest Holdings SE(1) | | | 12,198 | | | | 1,511,134 | |
Asseco Poland SA | | | 480,583 | | | | 6,674,886 | |
Bank Handlowy w Warszawie SA | | | 39,181 | | | | 991,576 | |
Bank Millennium SA(1) | | | 687,285 | | | | 1,967,563 | |
Bank Pekao SA | | | 102,868 | | | | 4,175,571 | |
Bank Zachodni WBK SA | | | 19,800 | | | | 2,483,579 | |
Boryszew SA(1) | | | 122,670 | | | | 353,590 | |
Budimex SA | | | 33,545 | | | | 2,064,653 | |
CCC SA | | | 38,814 | | | | 3,347,882 | |
Ciech SA(1) | | | 42,262 | | | | 777,719 | |
Cyfrowy Polsat SA | | | 342,382 | | | | 2,461,434 | |
Enea SA | | | 392,460 | | | | 1,289,424 | |
Energa SA | | | 367,797 | | | | 1,319,374 | |
Eurocash SA | | | 317,200 | | | | 2,556,426 | |
Getin Noble Bank SA(1) | | | 774,062 | | | | 423,768 | |
Grupa Azoty SA | | | 74,494 | | | | 1,577,902 | |
Grupa Lotos SA | | | 74,062 | | | | 1,312,377 | |
ING Bank Slaski SA(1) | | | 35,724 | | | | 2,350,865 | |
Jastrzebska Spolka Weglowa SA(1) | | | 80,467 | | | | 2,335,224 | |
KGHM Polska Miedz SA | | | 151,583 | | | | 4,974,818 | |
LPP SA | | | 2,021 | | | | 5,870,491 | |
Lubelski Wegiel Bogdanka SA | | | 12,326 | | | | 248,769 | |
| | | | |
| | 19 | | See Notes to Financial Statements. |
Parametric Emerging Markets Fund
January 31, 2018
Portfolio of Investments — continued
| | | | | | | | |
| Security | | Shares | | | Value | |
| | | | | | | | |
| | |
| Poland (continued) | | | | | | |
mBank SA(1) | | | 11,330 | | | $ | 1,724,113 | |
Netia SA | | | 841,829 | | | | 1,329,871 | |
Orange Polska SA(1) | | | 1,362,301 | | | | 2,497,405 | |
PGE SA(1) | | | 1,443,963 | | | | 5,128,533 | |
PKP Cargo SA(1) | | | 51,483 | | | | 930,230 | |
Polski Koncern Naftowy ORLEN SA | | | 227,752 | | | | 7,387,083 | |
Polskie Gornictwo Naftowe i Gazownictwo SA | | | 1,282,036 | | | | 2,514,353 | |
Powszechna Kasa Oszczednosci Bank Polski SA(1) | | | 630,169 | | | | 8,591,304 | |
Powszechny Zaklad Ubezpieczen SA | | | 439,397 | | | | 6,006,060 | |
Tauron Polska Energia SA(1) | | | 1,898,392 | | | | 1,719,395 | |
| | | | | | | | | |
| | | | | | $ | 90,559,364 | |
| | | | | | | | | |
| | |
| Qatar — 1.5% | | | | | | |
Aamal Co. QSC | | | 230,040 | | | $ | 532,385 | |
Al Meera Consumer Goods Co. | | | 12,300 | | | | 515,577 | |
Barwa Real Estate Co. | | | 233,067 | | | | 2,414,684 | |
Commercial Bank PQSC (The)(1) | | | 164,180 | | | | 1,259,343 | |
Doha Bank QPSC | | | 125,995 | | | | 1,134,507 | |
Gulf International Services QSC | | | 124,213 | | | | 649,073 | |
Industries Qatar | | | 166,300 | | | | 4,984,181 | |
Masraf Al Rayan QSC | | | 362,394 | | | | 4,013,583 | |
Medicare Group | | | 18,044 | | | | 378,958 | |
Ooredoo QPSC | | | 181,500 | | | | 4,741,955 | |
Qatar Electricity & Water Co. QSC | | | 65,558 | | | | 3,473,730 | |
Qatar Gas Transport Co., Ltd. | | | 489,281 | | | | 2,509,135 | |
Qatar Insurance Co. | | | 90,126 | | | | 1,257,882 | |
Qatar International Islamic Bank | | | 45,943 | | | | 766,869 | |
Qatar Islamic Bank | | | 54,850 | | | | 1,472,156 | |
Qatar National Bank QPSC | | | 227,713 | | | | 8,429,243 | |
Qatar National Cement Co. QSC | | | 38,265 | | | | 690,993 | |
Qatar Navigation QSC | | | 61,021 | | | | 1,073,894 | |
Qatari Investors Group | | | 99,029 | | | | 913,225 | |
United Development Co. QSC | | | 366,035 | | | | 1,698,024 | |
Vodafone Qatar QSC(1) | | | 726,000 | | | | 1,402,921 | |
| | | | | | | | | |
| | | | | | $ | 44,312,318 | |
| | | | | | | | | |
| | |
| Romania — 0.8% | | | | | | |
Banca Transilvania SA | | | 9,671,448 | | | $ | 6,201,236 | |
BRD-Groupe Societe Generale SA | | | 677,012 | | | | 2,440,892 | |
OMV Petrom SA | | | 45,352,995 | | | | 3,712,870 | |
Societatea Energetica Electrica SA | | | 622,400 | | | | 1,987,407 | |
Societatea Nationala de Gaze Naturale
ROMGAZ SA | | | 326,225 | | | | 2,979,680 | |
Societatea Nationala Nuclearelectrica SA | | | 794,100 | | | | 1,701,486 | |
Transelectrica SA | | | 369,345 | | | | 2,618,891 | |
Transgaz SA Medias | | | 13,144 | | | | 1,494,340 | |
| | | | | | | | | |
| | | | | | $ | 23,136,802 | |
| | | | | | | | | |
| | | | | | | | |
| Security | | Shares | | | Value | |
| | | | | | | | |
| | |
| Russia — 5.8% | | | | | | |
Aeroflot PJSC | | | 1,148,056 | | | $ | 2,734,067 | |
Alrosa PJSC | | | 650,100 | | | | 942,517 | |
Evraz PLC | | | 247,452 | | | | 1,306,099 | |
Federal Grid Co. Unified Energy System PJSC | | | 447,935,440 | | | | 1,397,472 | |
Gazprom PJSC ADR | | | 2,944,095 | | | | 14,822,806 | |
Globaltrans Investment PLC GDR(4) | | | 240,858 | | | | 2,586,830 | |
Inter RAO UES PJSC | | | 53,435,070 | | | | 3,593,772 | |
Lenta, Ltd. GDR(1)(4) | | | 168,201 | | | | 1,179,217 | |
LSR Group PJSC GDR(4) | | | 186,400 | | | | 561,228 | |
Lukoil PJSC ADR(6) | | | 23,800 | | | | 1,567,230 | |
Lukoil PJSC ADR(6) | | | 203,582 | | | | 13,451,572 | |
Luxoft Holding, Inc.(1) | | | 19,800 | | | | 1,139,490 | |
Magnit PJSC | | | 62,447 | | | | 5,927,315 | |
Magnit PJSC GDR(4) | | | 83,194 | | | | 1,867,138 | |
Magnitogorsk Iron & Steel Works PJSC | | | 721,700 | | | | 588,289 | |
Magnitogorsk Iron & Steel Works PJSC GDR(4) | | | 46,201 | | | | 484,213 | |
Mail.ru Group, Ltd. GDR(1)(4) | | | 171,209 | | | | 5,621,787 | |
Mechel PJSC ADR(1) | | | 152,000 | | | | 767,600 | |
MegaFon PJSC GDR(4)(6) | | | 42,781 | | | | 414,976 | |
MegaFon PJSC GDR(4)(6) | | | 120,383 | | | | 1,167,067 | |
MMC Norilsk Nickel PJSC ADR(6) | | | 32,723 | | | | 674,421 | |
MMC Norilsk Nickel PJSC ADR(6) | | | 519,111 | | | | 10,677,170 | |
Mobile TeleSystems PJSC | | | 1,645,167 | | | | 8,975,486 | |
Moscow Exchange MICEX-RTS PJSC | | | 1,046,040 | | | | 2,140,678 | |
Mosenergo PJSC | | | 8,811,603 | | | | 428,816 | |
Novatek PJSC GDR(4) | | | 39,308 | | | | 5,238,168 | |
Novolipetsk Steel PJSC GDR | | | 91,890 | | | | 2,408,421 | |
PhosAgro PJSC GDR(4)(6) | | | 12,600 | | | | 199,710 | |
PhosAgro PJSC GDR(4)(6) | | | 28,064 | | | | 446,999 | |
Polymetal International PLC | | | 261,058 | | | | 3,064,474 | |
QIWI PLC ADR | | | 66,466 | | | | 1,109,318 | |
Rosneft Oil Co. PJSC GDR(4)(6) | | | 3,905 | | | | 23,906 | |
Rosneft Oil Co. PJSC GDR(4)(6) | | | 613,543 | | | | 3,761,650 | |
Rosseti PJSC | | | 48,171,437 | | | | 778,548 | |
Rostelecom PJSC | | | 1,388,417 | | | | 1,640,258 | |
RusHydro PJSC | | | 205,845,080 | | | | 2,670,045 | |
Sberbank of Russia PJSC | | | 5,608,648 | | | | 26,362,864 | |
Severstal PJSC GDR(4) | | | 161,550 | | | | 2,653,245 | |
Sistema PJSC FC | | | 6,286,178 | | | | 1,359,205 | |
Sollers PJSC(1) | | | 24,262 | | | | 271,127 | |
Surgutneftegas OJSC ADR(6) | | | 45,600 | | | | 231,192 | |
Surgutneftegas OJSC ADR(6) | | | 527,704 | | | | 2,688,291 | |
Surgutneftegas OJSC, PFC Shares | | | 5,198,000 | | | | 2,765,448 | |
Tatneft PJSC ADR(6) | | | 6,500 | | | | 392,015 | |
Tatneft PJSC ADR(6) | | | 124,300 | | | | 7,538,960 | |
TMK PJSC GDR(4) | | | 64,757 | | | | 388,725 | |
| | | | |
| | 20 | | See Notes to Financial Statements. |
Parametric Emerging Markets Fund
January 31, 2018
Portfolio of Investments — continued
| | | | | | | | |
| Security | | Shares | | | Value | |
| | | | | | | | |
| | |
| Russia (continued) | | | | | | |
Transneft PJSC, PFC Shares | | | 945 | | | $ | 3,026,273 | |
Unipro PJSC | | | 8,737,000 | | | | 393,288 | |
VEON, Ltd. ADR | | | 426,584 | | | | 1,621,019 | |
VTB Bank PJSC | | | 2,908,170,000 | | | | 2,531,484 | |
X5 Retail Group NV GDR(1)(4) | | | 182,744 | | | | 7,015,871 | |
Yandex NV, Class A(1) | | | 315,600 | | | | 12,223,188 | |
| | | | | | | | | |
| | | | | | $ | 177,820,948 | |
| | | | | | | | | |
| | |
| Slovenia — 0.7% | | | | | | |
Cinkarna Celje DD | | | 6,272 | | | $ | 1,672,091 | |
Gorenje DD | | | 87,586 | | | | 527,987 | |
KRKA DD | | | 92,373 | | | | 6,711,420 | |
Luka Koper | | | 70,229 | | | | 2,872,770 | |
Petrol | | | 7,936 | | | | 3,467,757 | |
Pozavarovalnica Sava DD | | | 80,683 | | | | 1,660,480 | |
Telekom Slovenije DD | | | 25,746 | | | | 2,780,674 | |
Zavarovalnica Triglav DD | | | 71,375 | | | | 2,799,231 | |
| | | | | | | | | |
| | | | | | $ | 22,492,410 | |
| | | | | | | | | |
| | |
| South Africa — 6.1% | | | | | | |
AECI, Ltd. | | | 73,130 | | | $ | 636,381 | |
African Rainbow Minerals, Ltd. | | | 94,900 | | | | 1,020,597 | |
Anglo American Platinum, Ltd.(1) | | | 58,680 | | | | 1,763,791 | |
AngloGold Ashanti, Ltd. | | | 218,130 | | | | 2,432,163 | |
Aspen Pharmacare Holdings, Ltd. | | | 392,807 | | | | 8,976,005 | |
Astral Foods, Ltd. | | | 18,500 | | | | 370,234 | |
Aveng, Ltd.(1) | | | 939,990 | | | | 153,099 | |
AVI, Ltd. | | | 281,000 | | | | 2,551,773 | |
Barclays Africa Group, Ltd. | | | 126,562 | | | | 1,923,376 | |
Barloworld, Ltd. | | | 662,120 | | | | 9,421,794 | |
Bid Corp., Ltd. | | | 187,327 | | | | 4,202,137 | |
Bidvest Group, Ltd. (The) | | | 605,796 | | | | 12,755,737 | |
Capitec Bank Holdings, Ltd. | | | 12,100 | | | | 817,049 | |
Clicks Group, Ltd. | | | 167,700 | | | | 2,413,483 | |
DataTec, Ltd. | | | 160,600 | | | | 418,505 | |
Discovery, Ltd. | | | 96,631 | | | | 1,372,632 | |
Exxaro Resources, Ltd. | | | 118,010 | | | | 1,422,865 | |
FirstRand, Ltd. | | | 843,545 | | | | 4,731,784 | |
Foschini Group, Ltd. (The) | | | 63,545 | | | | 1,039,844 | |
Gold Fields, Ltd. | | | 509,300 | | | | 2,205,694 | |
Grindrod, Ltd.(1) | | | 340,300 | | | | 376,659 | |
Growthpoint Properties, Ltd. | | | 1,042,876 | | | | 2,449,494 | |
Harmony Gold Mining Co., Ltd. | | | 374,410 | | | | 643,074 | |
Hyprop Investments, Ltd. | | | 92,800 | | | | 905,843 | |
Impala Platinum Holdings, Ltd.(1) | | | 533,748 | | | | 1,639,452 | |
| | | | | | | | |
| Security | | Shares | | | Value | |
| | | | | | | | |
| | |
| South Africa (continued) | | | | | | |
Imperial Holdings, Ltd. | | | 78,001 | | | $ | 1,870,409 | |
Investec, Ltd. | | | 62,594 | | | | 491,934 | |
JSE, Ltd. | | | 92,200 | | | | 1,462,488 | |
Kumba Iron Ore, Ltd. | | | 23,160 | | | | 700,484 | |
Liberty Holdings, Ltd. | | | 107,168 | | | | 1,188,010 | |
Life Healthcare Group Holdings, Ltd. | | | 1,510,419 | | | | 3,464,404 | |
Massmart Holdings, Ltd. | | | 149,614 | | | | 1,759,494 | |
Mediclinic International PLC | | | 253,849 | | | | 2,144,052 | |
MMI Holdings, Ltd. | | | 578,450 | | | | 1,105,148 | |
Mondi, Ltd. | | | 49,630 | | | | 1,327,507 | |
Mr Price Group, Ltd. | | | 91,080 | | | | 2,197,687 | |
MTN Group, Ltd. | | | 1,674,895 | | | | 18,546,438 | |
Murray & Roberts Holdings, Ltd. | | | 915,850 | | | | 930,691 | |
Nampak, Ltd.(1) | | | 465,438 | | | | 598,902 | |
Naspers, Ltd., Class N | | | 62,747 | | | | 17,870,052 | |
Nedbank Group, Ltd. | | | 44,331 | | | | 989,132 | |
Netcare, Ltd. | | | 1,305,994 | | | | 2,862,400 | |
Northam Platinum, Ltd.(1) | | | 207,738 | | | | 909,140 | |
Pick’n Pay Stores, Ltd. | | | 371,278 | | | | 2,128,986 | |
PPC, Ltd.(1) | | | 468,427 | | | | 321,083 | |
Rand Merchant Investment Holdings, Ltd. | | | 322,134 | | | | 1,204,697 | |
Redefine Properties, Ltd. | | | 2,311,150 | | | | 2,114,448 | |
Remgro, Ltd. | | | 103,310 | | | | 2,059,815 | |
Reunert, Ltd. | | | 407,260 | | | | 2,570,451 | |
RMB Holdings, Ltd. | | | 163,033 | | | | 1,084,910 | |
Sanlam, Ltd. | | | 427,873 | | | | 3,185,390 | |
Sappi, Ltd. | | | 345,500 | | | | 2,484,025 | |
Sasol, Ltd. | | | 269,000 | | | | 9,666,560 | |
Shoprite Holdings, Ltd. | | | 224,300 | | | | 4,668,992 | |
Sibanye Gold, Ltd. | | | 513,672 | | | | 605,528 | |
SPAR Group, Ltd. (The) | | | 147,000 | | | | 2,540,745 | |
Standard Bank Group, Ltd. | | | 298,646 | | | | 5,054,818 | |
Steinhoff International Holdings NV | | | 787,883 | | | | 443,703 | |
Telkom SA SOC, Ltd. | | | 309,050 | | | | 1,343,410 | |
Tiger Brands, Ltd. | | | 122,350 | | | | 4,757,379 | |
Tongaat Hulett, Ltd. | | | 99,910 | | | | 968,591 | |
Truworths International, Ltd. | | | 300,800 | | | | 2,480,575 | |
Vodacom Group, Ltd. | | | 528,700 | | | | 7,305,218 | |
Wilson Bayly Holmes-Ovcon, Ltd. | | | 106,200 | | | | 1,421,770 | |
Woolworths Holdings, Ltd. | | | 287,328 | | | | 1,556,926 | |
| | | | | | | | | |
| | | | | | $ | 187,029,857 | |
| | | | | | | | | |
| | |
| South Korea — 5.8% | | | | | | |
AMOREPACIFIC Corp. | | | 12,580 | | | $ | 3,524,560 | |
AMOREPACIFIC Group | | | 6,000 | | | | 796,717 | |
Asiana Airlines, Inc.(1) | | | 92,200 | | | | 466,413 | |
| | | | |
| | 21 | | See Notes to Financial Statements. |
Parametric Emerging Markets Fund
January 31, 2018
Portfolio of Investments — continued
| | | | | | | | |
| Security | | Shares | | | Value | |
| | | | | | | | |
| | |
| South Korea (continued) | | | | | | |
BNK Financial Group, Inc. | | | 68,935 | | | $ | 683,615 | |
Celltrion, Inc.(1) | | | 24,338 | | | | 7,169,064 | |
Cheil Worldwide, Inc. | | | 31,519 | | | | 627,057 | |
CJ CheilJedang Corp. | | | 4,652 | | | | 1,561,725 | |
CJ Corp. | | | 3,500 | | | | 602,993 | |
CJ Logistics Corp.(1) | | | 2,049 | | | | 277,947 | |
CJ O Shopping Co., Ltd.(1) | | | 3,130 | | | | 659,918 | |
Coway Co., Ltd. | | | 14,240 | | | | 1,268,643 | |
Daelim Industrial Co., Ltd. | | | 8,650 | | | | 657,321 | |
Daesang Corp. | | | 8,000 | | | | 200,410 | |
Daewoo Engineering & Construction Co., Ltd.(1) | | | 65,741 | | | | 381,404 | |
Daewoo Industrial Development Co., Ltd.(1) | | | 3,657 | | | | 5,274 | |
Daewoong Pharmaceutical Co., Ltd. | | | 5,630 | | | | 955,285 | |
DB Insurance Co., Ltd. | | | 9,940 | | | | 673,301 | |
DGB Financial Group Co., Ltd. | | | 34,537 | | | | 400,789 | |
Dong-A Pharmaceutical Co., Ltd. | | | 2,407 | | | | 333,991 | |
Dong-A ST Co., Ltd. | | | 4,078 | | | | 454,199 | |
Dongkuk Steel Mill Co., Ltd. | | | 50,333 | | | | 572,148 | |
Doosan Corp. | | | 3,701 | | | | 411,213 | |
Doosan Heavy Industries & Construction Co., Ltd. | | | 23,400 | | | | 372,486 | |
Doosan Infracore Co., Ltd.(1) | | | 34,600 | | | | 357,330 | |
E-MART, Inc. | | | 10,328 | | | | 2,806,267 | |
GS Engineering & Construction Corp.(1) | | | 19,935 | | | | 618,643 | |
GS Holdings Corp. | | | 36,220 | | | | 2,353,540 | |
Hana Financial Group, Inc. | | | 46,600 | | | | 2,270,814 | |
Hanjin Kal Corp.(1) | | | 19,283 | | | | 418,271 | |
Hankook Tire Co., Ltd. | | | 21,623 | | | | 1,082,961 | |
Hanmi Pharmaceutical Co., Ltd.(1) | | | 3,953 | | | | 2,208,046 | |
Hanmi Science Co., Ltd.(1) | | | 9,058 | | | | 890,145 | |
Hansol Holdings Co., Ltd.(1) | | | 37,566 | | | | 173,452 | |
Hansol Paper Co., Ltd. | | | 22,933 | | | | 332,767 | |
Hanwha Chemical Corp.(1) | | | 35,850 | | | | 1,181,249 | |
Hanwha Corp. | | | 11,790 | | | | 519,409 | |
Hanwha Techwin Co., Ltd.(1) | | | 9,095 | | | | 286,604 | |
Hite-Jinro Co., Ltd. | | | 20,121 | | | | 433,551 | |
Hyosung Corp. | | | 8,368 | | | | 1,057,563 | |
Hyundai Construction Equipment Co., Ltd.(1) | | | 1,100 | | | | 209,898 | |
Hyundai Department Store Co., Ltd. | | | 7,615 | | | | 741,497 | |
Hyundai Development Co.- Engineering & Construction | | | 15,700 | | | | 649,572 | |
Hyundai Engineering & Construction Co., Ltd. | | | 15,844 | | | | 636,016 | |
Hyundai Glovis Co., Ltd. | | | 4,770 | | | | 624,030 | |
Hyundai Heavy Industries Co., Ltd.(1) | | | 6,601 | | | | 857,488 | |
Hyundai Marine & Fire Insurance Co., Ltd. | | | 10,256 | | | | 444,856 | |
Hyundai Mipo Dockyard Co., Ltd.(1) | | | 5,275 | | | | 549,183 | |
Hyundai Mobis Co., Ltd. | | | 14,074 | | | | 3,263,362 | |
| | | | | | | | |
| Security | | Shares | | | Value | |
| | | | | | | | |
| | |
| South Korea (continued) | | | | | | |
Hyundai Motor Co. | | | 30,410 | | | $ | 4,618,586 | |
Hyundai Robotics Co., Ltd.(1) | | | 867 | | | | 369,794 | |
Hyundai Steel Co. | | | 26,879 | | | | 1,432,092 | |
Hyundai Wia Corp. | | | 5,400 | | | | 312,957 | |
Industrial Bank of Korea(1) | | | 37,480 | | | | 584,005 | |
Kakao Corp. | | | 5,600 | | | | 734,393 | |
Kangwon Land, Inc. | | | 30,266 | | | | 918,988 | |
KB Financial Group, Inc. | | | 75,301 | | | | 4,735,526 | |
KCC Corp. | | | 1,345 | | | | 529,993 | |
Kia Motors Corp. | | | 53,420 | | | | 1,732,090 | |
Korea Electric Power Corp.(1) | | | 165,795 | | | | 5,546,147 | |
Korea Gas Corp.(1) | | | 29,048 | | | | 1,342,209 | |
Korea Investment Holdings Co., Ltd. | | | 6,990 | | | | 571,727 | |
Korea Zinc Co., Ltd. | | | 3,675 | | | | 1,772,483 | |
Korean Air Lines Co., Ltd. | | | 10,010 | | | | 361,167 | |
Korean Reinsurance Co. | | | 29,387 | | | | 335,736 | |
KT Corp. | | | 69,653 | | | | 1,928,024 | |
KT Corp. ADR(1) | | | 16,800 | | | | 251,160 | |
KT&G Corp. | | | 36,763 | | | | 3,666,312 | |
Kumho Petrochemical Co., Ltd. | | | 4,400 | | | | 424,193 | |
LG Chem, Ltd. | | | 10,733 | | | | 4,341,175 | |
LG Corp. | | | 29,710 | | | | 2,477,838 | |
LG Display Co., Ltd. | | | 19,325 | | | | 580,474 | |
LG Electronics, Inc. | | | 25,843 | | | | 2,479,009 | |
LG Hausys, Ltd. | | | 2,858 | | | | 244,898 | |
LG Household & Health Care, Ltd. | | | 3,104 | | | | 3,418,401 | |
LG International Corp. | | | 20,600 | | | | 577,686 | |
LG Uplus Corp. | | | 158,829 | | | | 2,126,019 | |
Lotte Chemical Corp. | | | 4,379 | | | | 1,721,475 | |
Lotte Corp. | | | 5,796 | | | | 378,750 | |
LOTTE Fine Chemical Co., Ltd. | | | 9,050 | | | | 650,743 | |
Lotte Shopping Co., Ltd. | | | 4,523 | | | | 1,021,060 | |
LS Corp. | | | 7,030 | | | | 519,912 | |
LS Industrial Systems Co., Ltd. | | | 9,200 | | | | 593,974 | |
Medy-Tox, Inc. | | | 3,894 | | | | 2,220,901 | |
Mirae Asset Daewoo Co., Ltd. | | | 76,889 | | | | 809,444 | |
Naver Corp. | | | 1,979 | | | | 1,685,731 | |
NCsoft Corp. | | | 1,263 | | | | 522,444 | |
NH Investment & Securities Co., Ltd. | | | 42,208 | | | | 663,621 | |
NHN Entertainment Corp.(1) | | | 4,718 | | | | 365,431 | |
Nong Shim Co., Ltd. | | | 3,700 | | | | 1,121,140 | |
OCI Co., Ltd. | | | 4,137 | | | | 654,312 | |
Orion Corp./Republic of Korea(1) | | | 10,527 | | | | 1,153,229 | |
POSCO | | | 18,272 | | | | 6,517,364 | |
Posco Daewoo Corp. | | | 21,675 | | | | 489,042 | |
S-Oil Corp. | | | 30,612 | | | | 3,526,038 | |
| | | | |
| | 22 | | See Notes to Financial Statements. |
Parametric Emerging Markets Fund
January 31, 2018
Portfolio of Investments — continued
| | | | | | | | |
| Security | | Shares | | | Value | |
| | | | | | | | |
| | |
| South Korea (continued) | | | | | | |
S1 Corp. | | | 6,966 | | | $ | 648,310 | |
Samsung Biologics Co., Ltd.(1)(3) | | | 7,181 | | | | 2,930,496 | |
Samsung C&T Corp. | | | 17,126 | | | | 2,276,832 | |
Samsung Card Co., Ltd. | | | 8,160 | | | | 297,536 | |
Samsung Electro-Mechanics Co., Ltd. | | | 5,701 | | | | 567,198 | |
Samsung Electronics Co., Ltd. | | | 5,760 | | | | 13,463,009 | |
Samsung Fire & Marine Insurance Co., Ltd. | | | 6,479 | | | | 1,752,223 | |
Samsung Heavy Industries Co., Ltd.(1) | | | 67,350 | | | | 578,523 | |
Samsung Life Insurance Co., Ltd. | | | 14,110 | | | | 1,704,217 | |
Samsung SDI Co., Ltd. | | | 3,725 | | | | 686,650 | |
Samsung Securities Co., Ltd. | | | 16,440 | | | | 670,166 | |
Shinhan Financial Group Co., Ltd.(1) | | | 74,551 | | | | 3,701,155 | |
Shinsegae, Inc. | | | 3,084 | | | | 990,618 | |
SK Chemicals Co., Ltd.(1) | | | 5,375 | | | | 578,850 | |
SK Discovery Co., Ltd. | | | 5,006 | | | | 238,568 | |
SK Holdings Co., Ltd. | | | 6,584 | | | | 1,962,830 | |
SK Hynix, Inc. | | | 37,255 | | | | 2,557,360 | |
SK Innovation Co., Ltd. | | | 40,091 | | | | 7,677,134 | |
SK Networks Co., Ltd. | | | 64,010 | | | | 389,542 | |
SK Telecom Co., Ltd. | | | 25,582 | | | | 6,352,583 | |
ViroMed Co., Ltd.(1) | | | 9,440 | | | | 2,339,811 | |
Woori Bank | | | 61,986 | | | | 977,290 | |
Yuanta Securities Korea Co., Ltd.(1) | | | 78,565 | | | | 366,161 | |
Yuhan Corp. | | | 6,867 | | | | 1,496,115 | |
Zyle Daewoo Motor Sales Corp.(1) | | | 5,113 | | | | 6,464 | |
| | | | | | | | | |
| | | | | | $ | 176,260,321 | |
| | | | | | | | | |
| | |
| Sri Lanka — 0.7% | | | | | | |
Access Engineering PLC | | | 3,199,414 | | | $ | 480,504 | |
Aitken Spence PLC | | | 1,072,547 | | | | 369,092 | |
Ceylon Tobacco Co. PLC | | | 140,993 | | | | 969,368 | |
Chevron Lubricants Lanka PLC | | | 1,821,700 | | | | 1,361,598 | |
Commercial Bank of Ceylon PLC | | | 2,081,782 | | | | 1,880,417 | |
DFCC Bank PLC | | | 293,137 | | | | 227,649 | |
Dialog Axiata PLC | | | 17,294,868 | | | | 1,543,683 | |
Hatton National Bank PLC | | | 1,527,082 | | | | 2,464,011 | |
Hemas Holdings PLC | | | 500,000 | | | | 392,653 | |
John Keells Holdings PLC | | | 3,927,989 | | | | 4,217,611 | |
Lanka IOC PLC | | | 1,479,571 | | | | 311,989 | |
Melstacorp PLC | | | 6,738,108 | | | | 2,674,365 | |
National Development Bank PLC | | | 773,114 | | | | 678,314 | |
Nations Trust Bank PLC | | | 376,548 | | | | 194,655 | |
Sampath Bank PLC | | | 898,108 | | | | 1,859,329 | |
Teejay Lanka PLC | | | 1,705,074 | | | | 398,529 | |
| | | | | | | | | |
| | | | | | $ | 20,023,767 | |
| | | | | | | | | |
| | | | | | | | |
| Security | | Shares | | | Value | |
| | | | | | | | |
| | |
| Taiwan — 6.0% | | | | | | |
AcBel Polytech, Inc. | | | 429,000 | | | $ | 334,855 | |
Acer, Inc. | | | 593,519 | | | | 562,115 | |
Advanced Semiconductor Engineering, Inc. | | | 525,123 | | | | 745,166 | |
AirTAC International Group | | | 106,714 | | | | 1,693,193 | |
AmTRAN Technology Co., Ltd. | | | 650,067 | | | | 389,336 | |
Asia Cement Corp. | | | 1,507,356 | | | | 1,552,085 | |
Asia Optical Co., Inc. | | | 198,907 | | | | 803,390 | |
Asustek Computer, Inc. | | | 63,325 | | | | 609,969 | |
AU Optronics Corp. | | | 1,011,837 | | | | 481,263 | |
Capital Securities Corp. | | | 711,928 | | | | 290,655 | |
Catcher Technology Co., Ltd. | | | 71,183 | | | | 814,296 | |
Cathay Financial Holding Co., Ltd. | | | 1,631,533 | | | | 3,051,099 | |
Center Laboratories, Inc.(1) | | | 523,551 | | | | 876,564 | |
Chailease Holding Co., Ltd. | | | 425,224 | | | | 1,429,164 | |
Chang Hwa Commercial Bank, Ltd. | | | 2,067,476 | | | | 1,212,233 | |
Cheng Shin Rubber Industry Co., Ltd. | | | 1,362,672 | | | | 2,375,337 | |
Chicony Electronics Co., Ltd. | | | 277,666 | | | | 730,964 | |
China Airlines, Ltd.(1) | | | 2,591,887 | | | | 1,073,383 | |
China Development Financial Holding Corp. | | | 3,842,050 | | | | 1,409,304 | |
China Life Insurance Co., Ltd. | | | 473,009 | | | | 486,511 | |
China Motor Corp. | | | 881,315 | | | | 805,441 | |
China Petrochemical Development Corp.(1) | | | 2,633,564 | | | | 1,377,443 | |
China Steel Corp. | | | 3,894,734 | | | | 3,328,989 | |
Chipbond Technology Corp. | | | 189,000 | | | | 436,112 | |
Chong Hong Construction Co., Ltd. | | | 184,999 | | | | 557,149 | |
Chunghwa Telecom Co., Ltd. | | | 2,646,746 | | | | 9,843,291 | |
Clevo Co. | | | 394,155 | | | | 382,401 | |
Compal Electronics, Inc. | | | 572,345 | | | | 426,075 | |
Coretronic Corp. | | | 389,702 | | | | 511,500 | |
CTBC Financial Holding Co., Ltd. | | | 3,424,275 | | | | 2,502,175 | |
Delta Electronics, Inc. | | | 190,151 | | | | 958,425 | |
Dynapack International Technology Corp. | | | 183,374 | | | | 290,907 | |
E Ink Holdings, Inc. | | | 278,000 | | | | 505,368 | |
E.Sun Financial Holding Co., Ltd. | | | 2,368,000 | | | | 1,558,344 | |
Eclat Textile Co., Ltd. | | | 142,159 | | | | 1,427,610 | |
Elan Microelectronics Corp. | | | 183,300 | | | | 290,471 | |
Epistar Corp.(1) | | | 125,472 | | | | 221,192 | |
EVA Airways Corp. | | | 1,789,366 | | | | 947,238 | |
Evergreen International Storage & Transport Corp. | | | 868,000 | | | | 415,202 | |
Evergreen Marine Corp.(1) | | | 2,373,754 | | | | 1,400,951 | |
Everlight Electronics Co., Ltd. | | | 142,291 | | | | 223,503 | |
Far Eastern Department Stores, Ltd. | | | 1,427,995 | | | | 766,315 | |
Far Eastern New Century Corp. | | | 2,912,695 | | | | 2,599,145 | |
Far EasTone Telecommunications Co., Ltd. | | | 1,332,084 | | | | 3,475,326 | |
Faraday Technology Corp. | | | 244,128 | | | | 683,303 | |
Feng Hsin Steel Co., Ltd. | | | 183,260 | | | | 376,623 | |
| | | | |
| | 23 | | See Notes to Financial Statements. |
Parametric Emerging Markets Fund
January 31, 2018
Portfolio of Investments — continued
| | | | | | | | |
| Security | | Shares | | | Value | |
| | | | | | | | |
| | |
| Taiwan (continued) | | | | | | |
FIH Mobile, Ltd. | | | 1,391,000 | | | $ | 414,805 | |
First Financial Holding Co., Ltd. | | | 2,580,587 | | | | 1,783,070 | |
Formosa Chemicals & Fibre Corp. | | | 1,314,399 | | | | 4,903,950 | |
Formosa International Hotels Corp. | | | 118,084 | | | | 627,803 | |
Formosa Petrochemical Corp. | | | 1,005,320 | | | | 4,269,618 | |
Formosa Plastics Corp. | | | 1,240,896 | | | | 4,403,160 | |
Formosa Taffeta Co., Ltd. | | | 842,000 | | | | 936,937 | |
Formosan Rubber Group, Inc. | | | 350,730 | | | | 190,654 | |
Foxconn Technology Co., Ltd. | | | 109,087 | | | | 311,301 | |
Fubon Financial Holding Co., Ltd. | | | 1,423,596 | | | | 2,644,608 | |
Giant Manufacturing Co., Ltd. | | | 262,208 | | | | 1,471,197 | |
Goldsun Building Materials Co., Ltd.(1) | | | 1,672,928 | | | | 551,166 | |
Great Wall Enterprise Co., Ltd. | | | 930,888 | | | | 1,085,283 | |
Highwealth Construction Corp. | | | 441,669 | | | | 693,825 | |
Hiwin Technologies Corp. | | | 240,040 | | | | 3,103,843 | |
Hon Hai Precision Industry Co., Ltd. | | | 1,268,434 | | | | 3,998,874 | |
Hota Industrial Manufacturing Co., Ltd. | | | 128,360 | | | | 538,210 | |
Hotai Motor Co., Ltd. | | | 240,000 | | | | 3,122,142 | |
HTC Corp.(1) | | | 185,535 | | | | 451,384 | |
Hu Lane Associate, Inc. | | | 181,000 | | | | 942,429 | |
Hua Nan Financial Holdings Co., Ltd. | | | 2,259,080 | | | | 1,348,073 | |
Innolux Corp. | | | 1,213,762 | | | | 571,636 | |
Inventec Corp. | | | 324,966 | | | | 265,228 | |
Kenda Rubber Industrial Co., Ltd. | | | 238,367 | | | | 302,519 | |
Kinpo Electronics, Inc. | | | 2,159,000 | | | | 796,522 | |
Kinsus Interconnect Technology Corp. | | | 182,000 | | | | 314,604 | |
Largan Precision Co., Ltd. | | | 9,795 | | | | 1,342,485 | |
Lite-On Technology Corp. | | | 240,941 | | | | 354,083 | |
MediaTek, Inc. | | | 151,462 | | | | 1,549,788 | |
Mega Financial Holding Co., Ltd. | | | 2,108,730 | | | | 1,829,154 | |
Merida Industry Co., Ltd. | | | 233,657 | | | | 1,101,778 | |
Nan Kang Rubber Tire Co., Ltd. | | | 1,153,253 | | | | 1,071,325 | |
Nan Ya Plastics Corp. | | | 1,447,214 | | | | 3,973,316 | |
Neo Solar Power Corp.(1) | | | 685,542 | | | | 326,636 | |
Novatek Microelectronics Corp., Ltd. | | | 138,942 | | | | 583,317 | |
Pegatron Corp. | | | 223,028 | | | | 603,407 | |
Phison Electronics Corp. | | | 17,363 | | | | 176,916 | |
Pou Chen Corp. | | | 1,957,819 | | | | 2,631,700 | |
Powertech Technology, Inc. | | | 111,865 | | | | 363,334 | |
President Chain Store Corp. | | | 619,664 | | | | 6,131,734 | |
Quanta Computer, Inc. | | | 317,508 | | | | 691,018 | |
Radiant Opto-Electronics Corp. | | | 141,264 | | | | 358,575 | |
Radium Life Tech Co., Ltd.(1) | | | 633,422 | | | | 264,135 | |
Realtek Semiconductor Corp. | | | 74,002 | | | | 295,039 | |
Ruentex Development Co., Ltd.(1) | | | 524,767 | | | | 602,251 | |
Ruentex Industries, Ltd. | | | 701,060 | | | | 1,238,783 | |
| | | | | | | | |
| Security | | Shares | | | Value | |
| | | | | | | | |
| | |
| Taiwan (continued) | | | | | | |
Sanyang Motor Co., Ltd. | | | 1,819,866 | | | $ | 1,314,561 | |
ScinoPharm Taiwan, Ltd. | | | 255,343 | | | | 305,384 | |
Shin Kong Financial Holding Co., Ltd. | | | 1,899,606 | | | | 696,942 | |
Shin Kong Synthetic Fibers Corp. | | | 1,321,483 | | | | 441,180 | |
Siliconware Precision Industries Co., Ltd. | | | 343,243 | | | | 593,093 | |
Simplo Technology Co., Ltd. | | | 30,533 | | | | 194,857 | |
Sino-American Silicon Products, Inc. | | | 138,233 | | | | 480,925 | |
SinoPac Financial Holdings Co., Ltd. | | | 3,810,446 | | | | 1,312,944 | |
St. Shine Optical Co., Ltd. | | | 22,000 | | | | 703,227 | |
Synnex Technology International Corp. | | | 380,358 | | | | 537,823 | |
Tainan Spinning Co., Ltd. | | | 941,822 | | | | 445,168 | |
Taishin Financial Holding Co., Ltd. | | | 2,729,766 | | | | 1,375,216 | |
Taiwan Business Bank | | | 2,337,898 | | | | 692,994 | |
Taiwan Cement Corp. | | | 1,686,830 | | | | 2,178,495 | |
Taiwan Cooperative Financial Holding Co., Ltd. | | | 2,528,288 | | | | 1,504,721 | |
Taiwan Fertilizer Co., Ltd. | | | 615,000 | | | | 842,958 | |
Taiwan Glass Industry Corp.(1) | | | 542,564 | | | | 361,102 | |
Taiwan Mobile Co., Ltd. | | | 1,302,296 | | | | 4,980,642 | |
Taiwan Semiconductor Manufacturing Co., Ltd. | | | 1,329,465 | | | | 11,618,597 | |
Taiwan Tea Corp. | | | 395,711 | | | | 207,569 | |
Tatung Co., Ltd.(1) | | | 2,377,785 | | | | 1,949,869 | |
Teco Electric & Machinery Co., Ltd. | | | 2,247,000 | | | | 2,163,766 | |
Tong Yang Industry Co., Ltd. | | | 758,608 | | | | 1,396,113 | |
TPK Holding Co., Ltd.(1) | | | 155,148 | | | | 551,808 | |
Tripod Technology Corp. | | | 187,535 | | | | 604,456 | |
TSRC Corp. | | | 693,063 | | | | 852,681 | |
TTY Biopharm Co., Ltd. | | | 534,330 | | | | 1,909,153 | |
Tung Ho Steel Enterprise Corp. | | | 991,060 | | | | 886,873 | |
U-Ming Marine Transport Corp. | | | 186,000 | | | | 246,775 | |
Uni-President Enterprises Corp. | | | 4,204,831 | | | | 10,093,642 | |
Unimicron Technology Corp. | | | 667,000 | | | | 486,053 | |
United Microelectronics Corp. | | | 1,215,090 | | | | 593,022 | |
Walsin Lihwa Corp. | | | 2,539,000 | | | | 1,457,700 | |
Wan Hai Lines, Ltd. | | | 518,962 | | | | 331,168 | |
Waterland Financial Holdings | | | 1,164,977 | | | | 398,842 | |
Wei Chuan Food Corp.(1) | | | 623,000 | | | | 502,181 | |
Wistron Corp. | | | 281,230 | | | | 235,979 | |
WPG Holdings Co., Ltd. | | | 247,489 | | | | 337,387 | |
Xxentria Technology Materials Corp. | | | 234,700 | | | | 514,875 | |
Yageo Corp. | | | 22,352 | | | | 295,400 | |
Yang Ming Marine Transport(1) | | | 1,153,621 | | | | 458,573 | |
YFY, Inc.(1) | | | 899,120 | | | | 419,236 | |
Yieh Phui Enterprise Co., Ltd. | | | 1,879,319 | | | | 744,547 | |
Yuanta Financial Holding Co., Ltd. | | | 2,872,629 | | | | 1,377,847 | |
Yulon Motor Co., Ltd. | | | 1,112,950 | | | | 907,397 | |
| | | | | | | | | |
| | | | | | $ | 183,266,737 | |
| | | | | | | | | |
| | | | |
| | 24 | | See Notes to Financial Statements. |
Parametric Emerging Markets Fund
January 31, 2018
Portfolio of Investments — continued
| | | | | | | | |
| Security | | Shares | | | Value | |
| | | | | | | | |
| | |
| Thailand — 3.0% | | | | | | |
Advanced Info Service PCL(7) | | | 839,600 | | | $ | 5,158,271 | |
Airports of Thailand PCL(7) | | | 1,801,600 | | | | 4,022,079 | |
AP Thailand PCL(7) | | | 2,428,300 | | | | 685,812 | |
Bangkok Bank PCL(7) | | | 126,300 | | | | 833,805 | |
Bangkok Dusit Medical Services PCL(7) | | | 5,099,200 | | | | 3,519,777 | |
Bangkok Land PCL(7) | | | 13,071,100 | | | | 722,396 | |
Banpu PCL(7) | | | 1,627,000 | | | | 1,184,024 | |
BEC World PCL(7) | | | 1,752,100 | | | | 654,219 | |
Berli Jucker PCL(7) | | | 591,200 | | | | 1,084,038 | |
BTS Group Holdings PCL(7) | | | 4,097,700 | | | | 1,050,460 | |
Bumrungrad Hospital PCL(7) | | | 777,200 | | | | 4,854,516 | |
Central Pattana PCL(7) | | | 537,000 | | | | 1,423,040 | |
Central Plaza Hotel PCL(7) | | | 268,400 | | | | 443,703 | |
CH. Karnchang PCL(7) | | | 442,520 | | | | 377,761 | |
Charoen Pokphand Foods PCL(7) | | | 1,456,900 | | | | 1,096,850 | |
CP ALL PCL(7) | | | 1,488,700 | | | | 3,790,607 | |
Delta Electronics (Thailand) PCL(7) | | | 1,422,300 | | | | 3,492,351 | |
Electricity Generating PCL(7) | | | 381,600 | | | | 2,652,684 | |
Glow Energy PCL(7) | | | 877,300 | | | | 2,384,764 | |
Hana Microelectronics PCL(7) | | | 1,730,900 | | | | 2,348,220 | |
Home Product Center PCL(7) | | | 3,521,555 | | | | 1,597,849 | |
Indorama Ventures PCL(7) | | | 1,087,200 | | | | 1,942,316 | |
IRPC PCL(7) | | | 3,717,200 | | | | 871,538 | |
Italian-Thai Development PCL(7) | | | 4,208,006 | | | | 531,966 | |
Jasmine International PCL(7) | | | 662,900 | | | | 163,993 | |
Kasikornbank PCL(7) | | | 300,200 | | | | 2,202,316 | |
KCE Electronics PCL(7) | | | 281,300 | | | | 668,394 | |
Khon Kaen Sugar Industry PCL(7) | | | 2,728,780 | | | | 381,708 | |
Kiatnakin Bank PCL(7) | | | 103,100 | | | | 268,924 | |
Krung Thai Bank PCL(7) | | | 1,231,400 | | | | 785,420 | |
L.P.N. Development PCL(7) | | | 1,255,000 | | | | 475,362 | |
Land & Houses PCL(7) | | | 2,593,500 | | | | 961,336 | |
Minor International PCL(7) | | | 2,603,577 | | | | 3,654,432 | |
Pruksa Holding PCL(7) | | | 518,200 | | | | 400,768 | |
PTT Exploration & Production PCL(7) | | | 647,498 | | | | 2,458,678 | |
PTT Global Chemical PCL(7) | | | 921,300 | | | | 2,829,073 | |
PTT PCL(7) | | | 267,000 | | | | 4,192,063 | |
Quality House PCL(7) | | | 8,192,646 | | | | 837,439 | |
Ratchaburi Electricity Generating Holding PCL(7) | | | 676,000 | | | | 1,181,914 | |
Robinson PCL(7) | | | 644,300 | | | | 1,477,015 | |
Samart Corp. PCL(7) | | | 2,188,100 | | | | 782,143 | |
Siam Cement PCL(7) | | | 171,600 | | | | 2,693,834 | |
Siam City Cement PCL(7) | | | 109,083 | | | | 936,979 | |
Siam Commercial Bank PCL(7) | | | 482,500 | | | | 2,422,597 | |
Siam Global House PCL (The)(7) | | | 1,116,150 | | | | 606,108 | |
Sino-Thai Engineering & Construction PCL(7) | | | 452,157 | | | | 356,102 | |
| | | | | | | | |
| Security | | Shares | | | Value | |
| | | | | | | | |
| | |
| Thailand (continued) | | | | | | |
Superblock PCL(1)(7) | | | 11,910,000 | | | $ | 444,192 | |
Thai Airways International PCL(1)(7) | | | 794,000 | | | | 418,245 | |
Thai Beverage PCL(7) | | | 3,524,300 | | | | 2,470,855 | |
Thai Oil PCL(7) | | | 330,500 | | | | 1,081,100 | |
Thai Union Group PCL(7) | | | 950,700 | | | | 628,217 | |
Thanachart Capital PCL(7) | | | 363,800 | | | | 684,727 | |
Thoresen Thai Agencies PCL(7) | | | 2,584,565 | | | | 726,042 | |
TMB Bank PCL(7) | | | 11,654,600 | | | | 1,078,137 | |
Total Access Communication PCL(1)(7) | | | 1,130,500 | | | | 1,774,874 | |
TPI Polene PCL(7) | | | 7,161,500 | | | | 489,872 | |
True Corp. PCL(1)(7) | | | 8,870,490 | | | | 1,909,576 | |
TTW PCL(7) | | | 3,598,200 | | | | 1,517,975 | |
| | | | | | | | | |
| | | | | | $ | 90,683,456 | |
| | | | | | | | | |
| | |
| Turkey — 2.9% | | | | | | |
AG Anadolu Grubu Holding AS | | | 109,884 | | | $ | 869,691 | |
Akbank Turk AS | | | 887,877 | | | | 2,573,450 | |
Akcansa Cimento AS | | | 126,800 | | | | 384,596 | |
Aksa Akrilik Kimya Sanayii AS | | | 251,413 | | | | 1,000,160 | |
Aksa Enerji Uretim AS(1) | | | 600,923 | | | | 798,389 | |
Albaraka Turk Katilim Bankasi AS | | | 522,467 | | | | 222,103 | |
Anadolu Efes Biracilik ve Malt Sanayii AS | | | 257,058 | | | | 1,905,474 | |
Arcelik AS | | | 516,256 | | | | 2,615,727 | |
Aygaz AS | | | 279,132 | | | | 1,182,464 | |
Besiktas Futbol Yatirimlari Sanayi ve Ticaret AS(1) | | | 372,500 | | | | 399,315 | |
BIM Birlesik Magazalar AS | | | 271,885 | | | | 5,419,705 | |
Brisa Bridgestone Sabanci Sanayi ve Ticaret AS(1) | | | 121,177 | | | | 254,919 | |
Cimsa Cimento Sanayi ve Ticaret AS | | | 141,400 | | | | 525,740 | |
Coca-Cola Icecek AS | | | 102,495 | | | | 980,442 | |
Dogan Sirketler Grubu Holding AS(1) | | | 1,732,915 | | | | 391,820 | |
Dogus Otomotiv Servis ve Ticaret AS(1) | | | 111,778 | | | | 263,772 | |
EIS Eczacibasi Ilac ve Sinai ve Finansal Yatirimlar Sanayi ve Ticaret AS | | | 440,700 | | | | 552,878 | |
Emlak Konut Gayrimenkul Yatirim Ortakligi AS(1) | | | 9,265,567 | | | | 6,527,430 | |
Enka Insaat ve Sanayi AS | | | 1,229,887 | | | | 1,847,404 | |
Eregli Demir ve Celik Fabrikalari TAS | | | 2,495,893 | | | | 6,598,981 | |
Ford Otomotiv Sanayi AS | | | 157,461 | | | | 2,513,680 | |
Gubre Fabrikalari TAS(1) | | | 239,300 | | | | 286,116 | |
Haci Omer Sabanci Holding AS | | | 498,524 | | | | 1,518,543 | |
Is Gayrimenkul Yatirim Ortakligi AS | | | 1,603,447 | | | | 617,742 | |
Kardemir Karabuk Demir Celik Sanayi ve Ticaret AS, Class D(1) | | | 2,316,004 | | | | 2,079,565 | |
KOC Holding AS | | | 746,532 | | | | 3,632,533 | |
Koza Altin Isletmeleri AS(1) | | | 77,300 | | | | 783,444 | |
Migros Ticaret AS(1) | | | 75,000 | | | | 523,240 | |
Net Holding AS(1) | | | 325,363 | | | | 212,123 | |
| | | | |
| | 25 | | See Notes to Financial Statements. |
Parametric Emerging Markets Fund
January 31, 2018
Portfolio of Investments — continued
| | | | | | | | |
| Security | | Shares | | | Value | |
| | | | | | | | |
| | |
| Turkey (continued) | | | | | | |
Pegasus Hava Tasimaciligi AS(1) | | | 36,600 | | | $ | 347,446 | |
Petkim Petrokimya Holding AS | | | 1,035,782 | | | | 2,187,583 | |
TAV Havalimanlari Holding AS | | | 101,888 | | | | 599,593 | |
Tekfen Holding AS | | | 209,373 | | | | 901,974 | |
Tofas Turk Otomobil Fabrikasi AS | | | 266,109 | | | | 2,253,744 | |
Trakya Cam Sanayii AS | | | 330,359 | | | | 424,534 | |
Tupras-Turkiye Petrol Rafinerileri AS | | | 353,994 | | | | 10,858,397 | |
Turk Hava Yollari AO(1) | | | 578,119 | | | | 2,532,859 | |
Turk Sise ve Cam Fabrikalari AS | | | 769,408 | | | | 1,021,286 | |
Turk Telekomunikasyon AS(1) | | | 1,467,995 | | | | 2,469,495 | |
Turkcell Iletisim Hizmetleri AS | | | 2,156,473 | | | | 8,948,998 | |
Turkiye Garanti Bankasi AS | | | 882,172 | | | | 2,877,728 | |
Turkiye Halk Bankasi AS | | | 267,144 | | | | 719,066 | |
Turkiye Is Bankasi AS, Class C | | | 563,039 | | | | 1,203,077 | |
Turkiye Sinai Kalkinma Bankasi AS | | | 879,989 | | | | 379,081 | |
Turkiye Vakiflar Bankasi TAO, Class D | | | 458,258 | | | | 915,033 | |
Ulker Biskuvi Sanayi AS | | | 269,059 | | | | 1,699,002 | |
Vestel Elektronik Sanayi ve Ticaret AS(1) | | | 242,175 | | | | 658,574 | |
Yapi ve Kredi Bankasi AS(1) | | | 313,444 | | | | 387,870 | |
| | | | | | | | | |
| | | | | | $ | 88,866,786 | |
| | | | | | | | | |
| | |
| United Arab Emirates — 1.4% | | | | | | |
Abu Dhabi Commercial Bank PJSC | | | 1,558,421 | | | $ | 3,076,721 | |
Abu Dhabi National Hotels | | | 232,683 | | | | 170,822 | |
Agthia Group PJSC | | | 1,013,903 | | | | 1,215,170 | |
Air Arabia PJSC | | | 6,129,835 | | | | 2,167,324 | |
Ajman Bank PJSC(1) | | | 825,022 | | | | 251,273 | |
Al Waha Capital PJSC | | | 1,587,889 | | | | 894,975 | |
Aldar Properties PJSC | | | 4,132,498 | | | | 2,577,357 | |
Arabtec Holding PJSC(1) | | | 1,673,286 | | | | 1,187,636 | |
Dana Gas PJSC(1) | | | 5,241,906 | | | | 1,071,992 | |
DP World, Ltd. | | | 336,282 | | | | 8,901,633 | |
Dubai Financial Market PJSC(1) | | | 1,928,561 | | | | 586,907 | |
Dubai Investments PJSC | | | 1,856,227 | | | | 1,219,603 | |
Dubai Islamic Bank PJSC | | | 982,741 | | | | 1,630,348 | |
DXB Entertainments PJSC(1) | | | 4,892,600 | | | | 853,493 | |
Emaar Properties PJSC | | | 2,668,666 | | | | 4,775,959 | |
Emirates Telecommunications Group Co. PJSC | | | 577,000 | | | | 2,796,119 | |
First Abu Dhabi Bank PJSC | | | 2,038,161 | | | | 6,209,082 | |
National Central Cooling Co. (Tabreed) | | | 828,054 | | | | 405,495 | |
RAK Properties PJSC | | | 2,150,800 | | | | 449,672 | |
Ras Al Khaimah Ceramics | | | 351,660 | | | | 266,630 | |
Union National Bank PJSC | | | 1,310,400 | | | | 1,424,016 | |
| | | | | | | | | |
| | | | | | $ | 42,132,227 | |
| | | | | | | | | |
| | | | | | | | |
| Security | | Shares | | | Value | |
| | | | | | | | |
| | |
| Vietnam — 1.3% | | | | | | |
Bank for Foreign Trade of Vietnam JSC | | | 1,188,355 | | | $ | 3,485,708 | |
Bao Viet Holdings | | | 307,150 | | | | 1,108,369 | |
Development Investment Construction Corp. | | | 322,120 | | | | 322,879 | |
FLC Faros Construction JSC(1) | | | 110,000 | | | | 845,293 | |
FPT Corp. | | | 163,350 | | | | 453,400 | |
HAGL JSC(1) | | | 1,155,511 | | | | 418,854 | |
Hoa Phat Group JSC(1) | | | 2,676,477 | | | | 7,342,090 | |
KIDO Group Corp. | | | 633,520 | | | | 1,242,006 | |
Kinh Bac City Development Share Holding Corp.(1) | | | 328,860 | | | | 203,632 | |
Masan Group Corp. | | | 408,780 | | | | 1,648,980 | |
PetroVietnam Drilling & Well Services JSC(1) | | | 813,305 | | | | 982,971 | |
PetroVietnam Fertilizer & Chemical JSC | | | 880,500 | | | | 946,380 | |
PetroVietnam Gas JSC | | | 276,000 | | | | 1,512,379 | |
PetroVietnam Technical Services Corp. | | | 1,236,400 | | | | 1,498,473 | |
Pha Lai Thermal Power JSC | | | 483,390 | | | | 435,324 | |
Phu Nhuan Jewelry JSC | | | 235,560 | | | | 1,547,883 | |
Refrigeration Electrical Engineering Corp. | | | 186,753 | | | | 350,563 | |
Saigon Securities, Inc. | | | 198,000 | | | | 297,187 | |
Tan Tao Investment & Industry JSC(1) | | | 1,554,838 | | | | 231,855 | |
Vietjet Aviation JSC | | | 120,000 | | | | 1,019,849 | |
Vietnam Dairy Products JSC | | | 390,228 | | | | 3,495,658 | |
Vietnam Joint Stock Commercial Bank for Industry and Trade | | | 1,255,523 | | | | 1,503,208 | |
Vingroup JSC(1) | | | 1,902,229 | | | | 7,165,358 | |
| | | | | | | | | |
| | | | | | $ | 38,058,299 | |
| | | | | | | | | |
| | |
Total Common Stocks
(identified cost $2,312,370,479) | | | | | | $ | 3,013,575,310 | |
| | | | | | | | | | | | |
|
| Equity-Linked Securities(3)(8) — 0.7% | |
| | | |
| | | | | | | | | | | | |
| Security | | Maturity
Date | | | Shares | | | Value | |
| | | | | | | | | | | | |
| |
| Saudi Arabia — 0.7% | | | | |
Abdullah Al Othaim Markets | | | 7/20/20 | | | | 26,995 | | | $ | 893,271 | |
Al Abdullatif Industrial Investment Co. | | | 4/30/18 | | | | 64,200 | | | | 231,101 | |
Al Rajhi Bank | | | 1/19/21 | | | | 111,080 | | | | 2,203,622 | |
Al Tayyar | | | 3/5/18 | | | | 70,167 | | | | 538,367 | |
Alinma Bank | | | 1/19/21 | | | | 109,712 | | | | 606,428 | |
Almarai Co. | | | 7/20/20 | | | | 98,998 | | | | 1,403,000 | |
Arab National Bank | | | 3/13/20 | | | | 70,000 | | | | 520,751 | |
Bank Albilad | | | 3/5/18 | | | | 68,212 | | | | 418,511 | |
Banque Saudi Fransi | | | 3/24/20 | | | | 71,335 | | | | 570,149 | |
Dar Al Arkan Real Estate Development | | | 7/20/18 | | | | 185,500 | | | | 497,094 | |
Etihad Etisalat Co. | | | 11/9/20 | | | | 134,038 | | | | 552,183 | |
Fawaz Abdulaziz Alhokair Co. | | | 2/28/20 | | | | 43,595 | | | | 360,642 | |
| | | | |
| | 26 | | See Notes to Financial Statements. |
Parametric Emerging Markets Fund
January 31, 2018
Portfolio of Investments — continued
| | | | | | | | | | | | |
| Security | | Maturity
Date | | | Shares | | | Value | |
| | | | | | | | | | | | |
| |
| Saudi Arabia (continued) | | | | |
Jarir Marketing Co. | | | 1/19/21 | | | | 20,525 | | | $ | 906,847 | |
Mobile Telecommunications Co. | | | 4/30/18 | | | | 123,207 | | | | 237,032 | |
National Industrialization Co. | | | 8/26/19 | | | | 62,181 | | | | 283,023 | |
Rabigh Refining and Petrochemicals Co. | | | 7/20/20 | | | | 92,400 | | | | 495,463 | |
Riyad Bank | | | 11/9/20 | | | | 161,200 | | | | 592,732 | |
Sahara Petrochemical Co. | | | 9/14/18 | | | | 43,292 | | | | 193,121 | |
Samba Financial Group | | | 5/6/20 | | | | 130,582 | | | | 892,228 | |
Saudi Airlines Catering Co. | | | 5/28/18 | | | | 5,500 | | | | 116,662 | |
Saudi Arabian Amiantit Co. | | | 4/30/18 | | | | 106,500 | | | | 230,871 | |
Saudi Arabian Fertilizer Co. | | | 7/20/20 | | | | 21,858 | | | | 408,853 | |
Saudi Arabian Mining Co. | | | 4/30/18 | | | | 44,255 | | | | 664,942 | |
Saudi Basic Industries Corp. | | | 1/19/21 | | | | 62,380 | | | | 1,791,385 | |
Saudi British Bank | | | 3/24/20 | | | | 58,524 | | | | 464,247 | |
Saudi Cable Co.(1)(2) | | | 7/20/18 | | | | 52,056 | | | | 0 | |
Saudi Cement Co. | | | 7/20/18 | | | | 14,570 | | | | 189,586 | |
Saudi Chemical Co. | | | 4/23/18 | | | | 25,900 | | | | 229,107 | |
Saudi Electricity Co. | | | 1/19/21 | | | | 268,400 | | | | 1,487,862 | |
Saudi Industrial Investment Group | | | 12/12/19 | | | | 59,263 | | | | 353,332 | |
Saudi International Petrochemical | | | 1/19/21 | | | | 40,200 | | | | 201,088 | |
Saudi Kayan Petrochemical Co. | | | 1/19/21 | | | | 123,009 | | | | 412,947 | |
Saudi Telecom Co. | | | 4/23/18 | | | | 98,200 | | | | 1,928,471 | |
Savola AB | | | 1/24/20 | | | | 88,024 | | | | 925,929 | |
Yanbu National Petrochemicals Co. | | | 7/20/20 | | | | 25,838 | | | | 455,051 | |
| | | | | | | | | | | | | |
| |
Total Equity-Linked Securities
(identified cost $23,818,493) | | | $ | 22,255,898 | |
|
| Rights(1) — 0.0%(5) | |
| | | |
| | | | | | | | | | | | |
| Security | | | | | Shares | | | Value | |
Agile Group Holdings, Ltd., Exp. 2/1/18 | | | | 21,920 | | | $ | 0 | |
Celsia SA ESP, Exp. 2/16/18 | | | | | | | 330,043 | | | | 26,166 | |
Flour Mills of Nigeria PLC, Exp. 2/21/18 | | | | | | | 1,157,600 | | | | 12,536 | |
Hyundai Heavy Industries Co., Ltd., Exp. 3/9/18 | | | | | | | 1,166 | | | | 36,033 | |
Mirae Asset Daewoo Co., Ltd., Exp. 2/22/18 | | | | | | | 15,220 | | | | 0 | |
Nations Trust Bank PLC, Exp. 1/29/18 | | | | | | | 65,486 | | | | 0 | |
Piramal Enterprises, Ltd., Exp. 2/26/18 | | | | | | | 3,339 | | | | 18,637 | |
Robinsons Land Corp., Exp. 2/8/18 | | | | | | | 319,182 | | | | 16,799 | |
Tata Steel, Ltd., Exp. 2/28/18 | | | | | | | 16,367 | | | | 50,592 | |
Tata Steel, Ltd. (partially paid shares), Exp. 2/28/18 | | | | | | | 8,184 | | | | 21,182 | |
| | | | | | | | | | | | | |
| |
Total Rights
(identified cost $0) | | | $ | 181,945 | |
| | | | | | | | |
| Short-Term Investments — 0.3% | |
| | |
| | | | | | | | |
| Description | | Principal
Amount
(000’s omitted) | | | Value | |
| | | | | | | | |
State Street Bank and Trust Eurodollar Time Deposit, 0.20%, 2/1/18 | | $ | 7,070 | | | $ | 7,070,394 | |
| | | | | | | | | |
| | |
Total Short-Term Investments
(identified cost $7,070,394) | | | | | | $ | 7,070,394 | |
| | |
Total Investments — 100.0%
(identified cost $2,343,259,366) | | | | | | $ | 3,043,083,547 | |
| | |
Other Assets, Less Liabilities — 0.0%(5) | | | | | | $ | 173,424 | |
| | |
Net Assets — 100.0% | | | | | | $ | 3,043,256,971 | |
The percentage shown for each investment category in the Portfolio of Investments is based on net assets.
| (1) | Non-income producing security. |
| (2) | For fair value measurement disclosure purposes, security is categorized as Level 3 (see Note 10). |
| (3) | Security exempt from registration pursuant to Rule 144A under the Securities Act of 1933, as amended. These securities may be sold in certain transactions in reliance on an exemption from registration (normally to qualified institutional buyers). At January 31, 2018, the aggregate value of these securities is $36,130,115 or 1.2% of the Fund’s net assets. |
| (4) | Security exempt from registration under Regulation S of the Securities Act of 1933, which exempts from registration securities offered and sold outside the United States. Security may not be offered or sold in the United States except pursuant to an exemption from, or in a transaction not subject to, the registration requirements of the Securities Act of 1933. At January 31, 2018, the aggregate value of these securities is $51,123,483 or 1.7% of the Fund’s net assets. |
| (5) | Amount is less than 0.05%. |
| (6) | Securities are traded on separate exchanges for the same entity. |
| (7) | Indicates a foreign registered security. Shares issued to foreign investors in markets that have foreign ownership limits. |
| (8) | Security whose performance, including redemption at maturity, is linked to the price of the underlying equity security. The investment is subject to credit risk of the issuing financial institution (HSBC Bank plc) in addition to the market risk of the underlying security. |
| | | | |
| | 27 | | See Notes to Financial Statements. |
Parametric Emerging Markets Fund
January 31, 2018
Portfolio of Investments — continued
| | | | | | | | |
| Currency Concentration of Portfolio | |
| | |
| | | | | | | | |
| Currency | | Percentage
of Net Assets | | | Value | |
Hong Kong Dollar | | | 10.0 | % | | $ | 305,384,462 | |
United States Dollar | | | 9.0 | | | | 274,495,470 | |
South African Rand | | | 6.1 | | | | 186,586,154 | |
Brazilian Real | | | 6.1 | | | | 185,136,579 | |
New Taiwan Dollar | | | 6.0 | | | | 182,851,932 | |
Indian Rupee | | | 5.9 | | | | 178,687,559 | |
South Korean Won | | | 5.8 | | | | 176,045,194 | |
Mexican Peso | | | 4.8 | | | | 146,410,303 | |
Malaysian Ringgit | | | 3.1 | | | | 93,228,103 | |
Indonesian Rupiah | | | 3.0 | | | | 91,670,704 | |
Polish Zloty | | | 3.0 | | | | 90,559,364 | |
Chilean Peso | | | 3.0 | | | | 89,863,134 | |
New Turkish Lira | | | 2.9 | | | | 88,866,786 | |
Thai Baht | | | 2.9 | | | | 88,212,601 | |
Philippine Peso | | | 2.8 | | | | 86,256,056 | |
Euro | | | 2.7 | | | | 82,614,579 | |
Russian Ruble | | | 2.2 | | | | 68,526,952 | |
Kuwaiti Dinar | | | 1.8 | | | | 54,688,588 | |
Chinese Yuan Renminbi | | | 1.5 | | | | 45,498,922 | |
Qatari Riyal | | | 1.5 | | | | 44,312,318 | |
Colombian Peso | | | 1.4 | | | | 42,626,107 | |
United Arab Emirates Dirham | | | 1.4 | | | | 41,527,385 | |
Vietnamese Dong | | | 1.3 | | | | 38,058,299 | |
Pakistani Rupee | | | 1.1 | | | | 34,666,690 | |
Other currency, less than 1% each | | | 10.7 | | | | 326,309,306 | |
| | |
Total Investments | | | 100.0 | % | | $ | 3,043,083,547 | |
| | |
| | | | | | | | |
| Sector Classification of Portfolio | |
| | |
| | | | | | | | |
| Sector | | Percentage
of Net Assets | | | Value | |
Financials | | | 19.1 | % | | $ | 580,471,106 | |
Materials | | | 11.7 | | | | 355,923,432 | |
Industrials | | | 10.4 | | | | 318,649,540 | |
Consumer Staples | | | 10.2 | | | | 310,212,311 | |
Energy | | | 9.3 | | | | 284,391,981 | |
Telecommunication Services | | | 9.1 | | | | 278,188,980 | |
Consumer Discretionary | | | 9.0 | | | | 272,597,268 | |
Information Technology | | | 6.0 | | | | 182,612,990 | |
Utilities | | | 6.0 | | | | 182,531,866 | |
Health Care | | | 5.3 | | | | 160,224,773 | |
Real Estate | | | 3.6 | | | | 110,208,906 | |
Short-Term Investments | | | 0.3 | | | | 7,070,394 | |
| | |
Total Investments | | | 100.0 | % | | $ | 3,043,083,547 | |
| | |
Abbreviations:
| | | | |
| ADR | | – | | American Depositary Receipt |
| GDR | | – | | Global Depositary Receipt |
| PCL | | – | | Public Company Ltd. |
| PFC Shares | | – | | Preference Shares |
| | | | |
| | 28 | | See Notes to Financial Statements. |
Parametric Emerging Markets Fund
January 31, 2018
Statement of Assets and Liabilities
| | | | |
| Assets | | January 31, 2018 | |
Unaffiliated investments, at value (identified cost, $2,343,259,366) | | $ | 3,043,083,547 | |
Cash | | | 1,078,625 | |
Foreign currency, at value (identified cost, $7,016,397) | | | 7,085,320 | |
Dividends and interest receivable | | | 2,393,331 | |
Receivable for investments sold | | | 474,355 | |
Receivable for Fund shares sold | | | 4,848,273 | |
Tax reclaims receivable | | | 102,637 | |
Total assets | | $ | 3,059,066,088 | |
| |
| Liabilities | | | | |
Payable for investments purchased | | $ | 2,914,874 | |
Payable for Fund shares redeemed | | | 7,412,703 | |
Payable to affiliates: | | | | |
Investment adviser fee | | | 2,012,994 | |
Administration fee | | | 383,489 | |
Distribution and service fees | | | 94,088 | |
Accrued foreign capital gains taxes | | | 874,475 | |
Accrued expenses | | | 2,116,494 | |
Total liabilities | | $ | 15,809,117 | |
Net Assets | | $ | 3,043,256,971 | |
| |
| Sources of Net Assets | | | | |
Paid-in capital | | $ | 2,723,444,359 | |
Accumulated distributions in excess of net investment income | | | (23,728,662 | ) |
Accumulated net realized loss | | | (355,460,981 | ) |
Net unrealized appreciation | | | 699,002,255 | |
Total | | $ | 3,043,256,971 | |
| |
| Investor Class Shares | | | | |
Net Assets | | $ | 400,813,502 | |
Shares Outstanding | | | 23,788,869 | |
Net Asset Value, Offering Price and Redemption Price Per Share | | | | |
(net assets ÷ shares of beneficial interest outstanding) | | $ | 16.85 | |
| |
| Class C Shares | | | | |
Net Assets | | $ | 10,151,563 | |
Shares Outstanding | | | 613,947 | |
Net Asset Value and Offering Price Per Share* | | | | |
(net assets ÷ shares of beneficial interest outstanding) | | $ | 16.53 | |
| |
| Institutional Class Shares | | | | |
Net Assets | | $ | 2,030,663,169 | |
Shares Outstanding | | | 120,057,270 | |
Net Asset Value, Offering Price and Redemption Price Per Share | | | | |
(net assets ÷ shares of beneficial interest outstanding) | | $ | 16.91 | |
| |
| Class R6 Shares | | | | |
Net Assets | | $ | 601,628,737 | |
Shares Outstanding | | | 35,568,081 | |
Net Asset Value, Offering Price and Redemption Price Per Share | | | | |
(net assets ÷ shares of beneficial interest outstanding) | | $ | 16.91 | |
| * | Redemption price per share is equal to the net asset value less any applicable contingent deferred sales charge. |
| | | | |
| | 29 | | See Notes to Financial Statements. |
Parametric Emerging Markets Fund
January 31, 2018
Statement of Operations
| | | | |
| Investment Income | | Year Ended
January 31, 2018 | |
Dividends (net of foreign taxes, $9,090,082) | | $ | 82,404,516 | |
Interest | | | 6,218 | |
Total investment income | | $ | 82,410,734 | |
|
| Expenses | |
Investment adviser fee | | $ | 23,329,963 | |
Administration fee | | | 4,440,993 | |
Distribution and service fees | | | | |
Investor Class | | | 1,175,499 | |
Class C | | | 94,847 | |
Trustees’ fees and expenses | | | 101,500 | |
Custodian fee | | | 3,204,565 | |
Transfer and dividend disbursing agent fees | | | 1,210,876 | |
Legal and accounting services | | | 147,991 | |
Printing and postage | | | 180,801 | |
Registration fees | | | 112,858 | |
Miscellaneous | | | 190,871 | |
Total expenses | | $ | 34,190,764 | |
| |
Net investment income | | $ | 48,219,970 | |
| |
| Realized and Unrealized Gain (Loss) | | | | |
Net realized gain (loss) — | | | | |
Investment transactions (net of foreign capital gains taxes of $411,696) | | $ | 15,133,544 | |
Foreign currency transactions | | | (246,731 | ) |
Net realized gain | | $ | 14,886,813 | |
Change in unrealized appreciation (depreciation) — | | | | |
Investments (including net decrease in accrued foreign capital gains taxes of $633,877) | | $ | 704,718,116 | |
Foreign currency | | | 53,990 | |
Net change in unrealized appreciation (depreciation) | | $ | 704,772,106 | |
| |
Net realized and unrealized gain | | $ | 719,658,919 | |
| |
Net increase in net assets from operations | | $ | 767,878,889 | |
| | | | |
| | 30 | | See Notes to Financial Statements. |
Parametric Emerging Markets Fund
January 31, 2018
Statements of Changes in Net Assets
| | | | | | | | |
| | | Year Ended January 31, | |
| Increase (Decrease) in Net Assets | | 2018 | | | 2017 | |
From operations — | | | | | | | | |
Net investment income | | $ | 48,219,970 | | | $ | 52,149,638 | |
Net realized gain (loss) | | | 14,886,813 | | | | (255,209,262 | ) |
Net change in unrealized appreciation (depreciation) | | | 704,772,106 | | | | 856,577,084 | |
Net increase in net assets from operations | | $ | 767,878,889 | | | $ | 653,517,460 | |
Distributions to shareholders — | | | | | | | | |
From net investment income | | | | | | | | |
Investor Class | | $ | (10,183,156 | ) | | $ | (8,417,254 | ) |
Class C | | | (168,458 | ) | | | (115,100 | ) |
Institutional Class | | | (49,803,465 | ) | | | (35,968,674 | ) |
Class R6 | | | (16,110,983 | ) | | | (11,003,612 | ) |
Total distributions to shareholders | | $ | (76,266,062 | ) | | $ | (55,504,640 | ) |
Transactions in shares of beneficial interest — | | | | | | | | |
Proceeds from sale of shares | | | | | | | | |
Investor Class | | $ | 55,520,901 | | | $ | 76,598,630 | |
Class C | | | 885,164 | | | | 294,195 | |
Institutional Class | | | 420,440,001 | | | | 774,512,603 | |
Class R6 | | | 80,751,262 | | | | 108,524,243 | |
Net asset value of shares issued to shareholders in payment of distributions declared | | | | | | | | |
Investor Class | | | 9,992,931 | | | | 8,258,320 | |
Class C | | | 158,118 | | | | 103,527 | |
Institutional Class | | | 36,505,344 | | | | 27,838,794 | |
Class R6 | | | 15,633,121 | | | | 10,270,177 | |
Cost of shares redeemed | | | | | | | | |
Investor Class | | | (292,705,286 | ) | | | (196,693,620 | ) |
Class C | | | (2,294,846 | ) | | | (2,628,575 | ) |
Institutional Class | | | (756,611,346 | ) | | | (1,096,484,364 | ) |
Class R6 | | | (171,183,425 | ) | | | (249,220,033 | ) |
Net decrease in net assets from Fund share transactions | | $ | (602,908,061 | ) | | $ | (538,626,103 | ) |
| | |
Net increase in net assets | | $ | 88,704,766 | | | $ | 59,386,717 | |
| | |
| Net Assets | | | | | | | | |
At beginning of year | | $ | 2,954,552,205 | | | $ | 2,895,165,488 | |
At end of year | | $ | 3,043,256,971 | | | $ | 2,954,552,205 | |
| | |
Accumulated undistributed (distributions in excess of) net investment income
included in net assets | | | | | | | | |
At end of year | | $ | (23,728,662 | ) | | $ | 12,757,519 | |
| | | | |
| | 31 | | See Notes to Financial Statements. |
Parametric Emerging Markets Fund
January 31, 2018
Financial Highlights
| | | | | | | | | | | | | | | | | | | | |
| | | Investor Class | |
| | | Year Ended January 31, | |
| | | 2018 | | | 2017 | | | 2016 | | | 2015 | | | 2014 | |
Net asset value — Beginning of year | | $ | 13.340 | | | $ | 10.990 | | | $ | 13.850 | | | $ | 14.070 | | | $ | 15.260 | |
| | | | | |
| Income (Loss) From Operations | | | | | | | | | | | | | | | | | | | | |
Net investment income(1) | | $ | 0.223 | | | $ | 0.179 | | | $ | 0.185 | | | $ | 0.204 | | | $ | 0.201 | |
Net realized and unrealized gain (loss) | | | 3.650 | | | | 2.364 | | | | (2.851 | ) | | | (0.166 | ) | | | (1.204 | ) |
| | | | | |
Total income (loss) from operations | | $ | 3.873 | | | $ | 2.543 | | | $ | (2.666 | ) | | $ | 0.038 | | | $ | (1.003 | ) |
| | | | | |
| Less Distributions | | | | | | | | | | | | | | | | | | | | |
From net investment income | | $ | (0.363 | ) | | $ | (0.193 | ) | | $ | (0.016 | ) | | $ | (0.180 | ) | | $ | (0.187 | ) |
From net realized gain | | | — | | | | — | | | | (0.178 | ) | | | (0.078 | ) | | | — | |
| | | | | |
Total distributions | | $ | (0.363 | ) | | $ | (0.193 | ) | | $ | (0.194 | ) | | $ | (0.258 | ) | | $ | (0.187 | ) |
| | | | | |
Net asset value — End of year | | $ | 16.850 | | | $ | 13.340 | | | $ | 10.990 | | | $ | 13.850 | | | $ | 14.070 | |
| | | | | |
Total Return(2) | | | 29.33 | % | | | 23.32 | % | | | (19.59 | )% | | | 0.25 | % | | | (6.62 | )% |
| |
| Ratios/Supplemental Data | | | | | |
Net assets, end of year (000’s omitted) | | $ | 400,814 | | | $ | 520,939 | | | $ | 527,198 | | | $ | 599,094 | | | $ | 755,768 | |
Ratios (as a percentage of average daily net assets): | | | | | | | | | | | | | | | | | | | | |
Expenses(3) | | | 1.37 | % | | | 1.38 | % | | | 1.37 | % | | | 1.36 | % | | | 1.38 | % |
Net investment income | | | 1.52 | % | | | 1.44 | % | | | 1.43 | % | | | 1.34 | % | | | 1.36 | % |
Portfolio Turnover | | | 3 | % | | | 6 | % | | | 8 | % | | | 9 | % | | | 7 | % |
| (1) | Computed using average shares outstanding. |
| (2) | Returns are historical and are calculated by determining the percentage change in net asset value with all distributions reinvested and do not reflect the effect of sales charges, if applicable, which were eliminated effective March 1, 2013. |
| (3) | Excludes the effect of custody fee credits, if any, of less than 0.005%. Effective September 1, 2015, custody fee credits, which were earned on cash deposit balances, were discontinued by the custodian. |
| | | | |
| | 32 | | See Notes to Financial Statements. |
Parametric Emerging Markets Fund
January 31, 2018
Financial Highlights — continued
| | | | | | | | | | | | | | | | | | | | |
| | | Class C | |
| | | Year Ended January 31, | |
| | | 2018 | | | 2017 | | | 2016 | | | 2015 | | | 2014 | |
Net asset value — Beginning of year | | $ | 13.120 | | | $ | 10.840 | | | $ | 13.760 | | | $ | 13.960 | | | $ | 15.130 | |
| | | | | |
| Income (Loss) From Operations | | | | | | | | | | | | | | | | | | | | |
Net investment income(1) | | $ | 0.096 | | | $ | 0.083 | | | $ | 0.096 | | | $ | 0.094 | | | $ | 0.091 | |
Net realized and unrealized gain (loss) | | | 3.580 | | | | 2.340 | | | | (2.834 | ) | | | (0.163 | ) | | | (1.188 | ) |
| | | | | |
Total income (loss) from operations | | $ | 3.676 | | | $ | 2.423 | | | $ | (2.738 | ) | | $ | (0.069 | ) | | $ | (1.097 | ) |
| | | | | |
| Less Distributions | | | | | | | | | | | | | | | | | | | | |
From net investment income | | $ | (0.266 | ) | | $ | (0.143 | ) | | $ | (0.004 | ) | | $ | (0.053 | ) | | $ | (0.073 | ) |
From net realized gain | | | — | | | | — | | | | (0.178 | ) | | | (0.078 | ) | | | — | |
| | | | | |
Total distributions | | $ | (0.266 | ) | | $ | (0.143 | ) | | $ | (0.182 | ) | | $ | (0.131 | ) | | $ | (0.073 | ) |
| | | | | |
Net asset value — End of year | | $ | 16.530 | | | $ | 13.120 | | | $ | 10.840 | | | $ | 13.760 | | | $ | 13.960 | |
| | | | | |
Total Return(2) | | | 28.32 | % | | | 22.50 | % | | | (20.23 | )% | | | (0.51 | )% | | | (7.27 | )% |
| |
| Ratios/Supplemental Data | | | | | |
Net assets, end of year (000’s omitted) | | $ | 10,152 | | | $ | 9,209 | | | $ | 9,573 | | | $ | 15,996 | | | $ | 19,779 | |
Ratios (as a percentage of average daily net assets): | | | | | | | | | | | | | | | | | | | | |
Expenses(3) | | | 2.12 | % | | | 2.13 | % | | | 2.12 | % | | | 2.11 | % | | | 2.13 | % |
Net investment income | | | 0.66 | % | | | 0.68 | % | | | 0.74 | % | | | 0.63 | % | | | 0.63 | % |
Portfolio Turnover | | | 3 | % | | | 6 | % | | | 8 | % | | | 9 | % | | | 7 | % |
| (1) | Computed using average shares outstanding. |
| (2) | Returns are historical and are calculated by determining the percentage change in net asset value with all distributions reinvested and do not reflect the effect of sales charges. |
| (3) | Excludes the effect of custody fee credits, if any, of less than 0.005%. Effective September 1, 2015, custody fee credits, which were earned on cash deposit balances, were discontinued by the custodian. |
| | | | |
| | 33 | | See Notes to Financial Statements. |
Parametric Emerging Markets Fund
January 31, 2018
Financial Highlights — continued
| | | | | | | | | | | | | | | | | | | | |
| | | Institutional Class | |
| | | Year Ended January 31, | |
| | | 2018 | | | 2017 | | | 2016 | | | 2015 | | | 2014 | |
Net asset value — Beginning of year | | $ | 13.400 | | | $ | 11.040 | | | $ | 13.890 | | | $ | 14.110 | | | $ | 15.310 | |
| | | | | |
| Income (Loss) From Operations | | | | | | | | | | | | | | | | | | | | |
Net investment income(1) | | $ | 0.245 | | | $ | 0.212 | | | $ | 0.233 | | | $ | 0.243 | | | $ | 0.224 | |
Net realized and unrealized gain (loss) | | | 3.673 | | | | 2.375 | | | | (2.880 | ) | | | (0.162 | ) | | | (1.197 | ) |
| | | | | |
Total income (loss) from operations | | $ | 3.918 | | | $ | 2.587 | | | $ | (2.647 | ) | | $ | 0.081 | | | $ | (0.973 | ) |
| | | | | |
| Less Distributions | | | | | | | | | | | | | | | | | | | | |
From net investment income | | $ | (0.408 | ) | | $ | (0.227 | ) | | $ | (0.025 | ) | | $ | (0.223 | ) | | $ | (0.227 | ) |
From net realized gain | | | — | | | | — | | | | (0.178 | ) | | | (0.078 | ) | | | — | |
| | | | | |
Total distributions | | $ | (0.408 | ) | | $ | (0.227 | ) | | $ | (0.203 | ) | | $ | (0.301 | ) | | $ | (0.227 | ) |
| | | | | |
Net asset value — End of year | | $ | 16.910 | | | $ | 13.400 | | | $ | 11.040 | | | $ | 13.890 | | | $ | 14.110 | |
| | | | | |
Total Return(2) | | | 29.56 | % | | | 23.64 | % | | | (19.40 | )% | | | 0.55 | % | | | (6.42 | )% |
| |
| Ratios/Supplemental Data | | | | | |
Net assets, end of year (000’s omitted) | | $ | 2,030,663 | | | $ | 1,884,610 | | | $ | 1,803,056 | | | $ | 3,227,614 | | | $ | 3,392,890 | |
Ratios (as a percentage of average daily net assets): | | | | | | | | | | | | | | | | | | | | |
Expenses(3) | | | 1.12 | % | | | 1.13 | % | | | 1.12 | % | | | 1.11 | % | | | 1.13 | % |
Net investment income | | | 1.65 | % | | | 1.68 | % | | | 1.77 | % | | | 1.59 | % | | | 1.52 | % |
Portfolio Turnover | | | 3 | % | | | 6 | % | | | 8 | % | | | 9 | % | | | 7 | % |
| (1) | Computed using average shares outstanding. |
| (2) | Returns are historical and are calculated by determining the percentage change in net asset value with all distributions reinvested. |
| (3) | Excludes the effect of custody fee credits, if any, of less than 0.005%. Effective September 1, 2015, custody fee credits, which were earned on cash deposit balances, were discontinued by the custodian. |
| | | | |
| | 34 | | See Notes to Financial Statements. |
Parametric Emerging Markets Fund
January 31, 2018
Financial Highlights — continued
| | | | | | | | | | | | | | | | |
| | | Class R6 | |
| | | Year Ended January 31, | | | Period Ended
January 31, 2015(1) | |
| | | 2018 | | | 2017 | | | 2016 | | |
Net asset value — Beginning of period | | $ | 13.400 | | | $ | 11.040 | | | $ | 13.890 | | | $ | 16.010 | |
| | | | |
| Income (Loss) From Operations | | | | | | | | | | | | | | | | |
Net investment income(2) | | $ | 0.249 | | | $ | 0.225 | | | $ | 0.223 | | | $ | 0.027 | |
Net realized and unrealized gain (loss) | | | 3.676 | | | | 2.370 | | | | (2.861 | ) | | | (1.842 | ) |
| | | | |
Total income (loss) from operations | | $ | 3.925 | | | $ | 2.595 | | | $ | (2.638 | ) | | $ | (1.815 | ) |
| | | | |
| Less Distributions | | | | | | | | | | | | | | | | |
From net investment income | | $ | (0.415 | ) | | $ | (0.235 | ) | | $ | (0.034 | ) | | $ | (0.227 | ) |
From net realized gain | | | — | | | | — | | | | (0.178 | ) | | | (0.078 | ) |
| | | | |
Total distributions | | $ | (0.415 | ) | | $ | (0.235 | ) | | $ | (0.212 | ) | | $ | (0.305 | ) |
| | | | |
Net asset value — End of period | | $ | 16.910 | | | $ | 13.400 | | | $ | 11.040 | | | $ | 13.890 | |
| | | | |
Total Return(3) | | | 29.69 | % | | | 23.71 | % | | | (19.34 | )% | | | (11.36 | )%(4) |
|
| Ratios/Supplemental Data | |
Net assets, end of period (000’s omitted) | | $ | 601,629 | | | $ | 539,794 | | | $ | 555,338 | | | $ | 593,622 | |
Ratios (as a percentage of average daily net assets): | | | | | | | | | | | | | | | | |
Expenses(5) | | | 1.07 | % | | | 1.08 | % | | | 1.07 | % | | | 1.07 | %(6) |
Net investment income | | | 1.67 | % | | | 1.79 | % | | | 1.72 | % | | | 0.31 | %(6) |
Portfolio Turnover | | | 3 | % | | | 6 | % | | | 8 | % | | | 9 | %(7) |
| (1) | For the period from the commencement of operations, July 1, 2014, to January 31, 2015. |
| (2) | Computed using average shares outstanding. |
| (3) | Returns are historical and are calculated by determining the percentage change in net asset value with all distributions reinvested. |
| (5) | Excludes the effect of custody fee credits, if any, of less than 0.005%. Effective September 1, 2015, custody fee credits, which were earned on cash deposit balances, were discontinued by the custodian. |
| (7) | For the Fund’s year ended January 31, 2015. |
| | | | |
| | 35 | | See Notes to Financial Statements. |
Parametric Emerging Markets Fund
January 31, 2018
Notes to Financial Statements
1 Significant Accounting Policies
Parametric Emerging Markets Fund (the Fund) is a diversified series of Eaton Vance Mutual Funds Trust (the Trust). The Trust is a Massachusetts business trust registered under the Investment Company Act of 1940, as amended (the 1940 Act), as an open-end management investment company. The Fund’s investment objective is to seek long-term capital appreciation. The Fund offers four classes of shares. Investor Class, Institutional Class and Class R6 shares are sold at net asset value and are not subject to a sales charge. Class C shares are sold at net asset value and are generally subject to a contingent deferred sales charge (see Note 5). Effective March 1, 2013, Class C shares of the Fund are no longer available for purchase, except by existing shareholders (including shares acquired through the reinvestment of dividends and distributions) or employer sponsored retirement plans. Each class represents a pro-rata interest in the Fund, but votes separately on class-specific matters and (as noted below) is subject to different expenses. Realized and unrealized gains and losses and net investment income and losses, other than class-specific expenses, are allocated daily to each class of shares based on the relative net assets of each class to the total net assets of the Fund. Sub-accounting, recordkeeping and similar administrative fees payable to financial intermediaries, which are a component of transfer and dividend disbursing agent fees on the Statement of Operations, are not allocated to Class R6 shares. Each class of shares differs in its distribution plan and certain other class-specific expenses.
The following is a summary of significant accounting policies of the Fund. The policies are in conformity with accounting principles generally accepted in the United States of America (U.S. GAAP). The Fund is an investment company and follows accounting and reporting guidance in the Financial Accounting Standards Board (FASB) Accounting Standards Codification Topic 946.
A Investment Valuation — The following methodologies are used to determine the market value or fair value of investments.
Equity Securities. Equity securities listed on a U.S. securities exchange generally are valued at the last sale or closing price on the day of valuation or, if no sales took place on such date, at the mean between the closing bid and asked prices therefore on the exchange where such securities are principally traded. Equity securities listed on the NASDAQ Global or Global Select Market generally are valued at the NASDAQ official closing price. Unlisted or listed securities for which closing sales prices or closing quotations are not available are valued at the mean between the latest available bid and asked prices. Equity-linked securities are generally valued based on the value of the underlying equity security or instrument.
Debt Obligations. Debt obligations are generally valued on the basis of valuations provided by third party pricing services, as derived from such services’ pricing models. Inputs to the models may include, but are not limited to, reported trades, executable bid and asked prices, broker/dealer quotations, prices or yields of securities with similar characteristics, interest rates, anticipated prepayments, benchmark curves or information pertaining to the issuer, as well as industry and economic events. The pricing services may use a matrix approach, which considers information regarding securities with similar characteristics to determine the valuation for a security. Short-term obligations purchased with a remaining maturity of sixty days or less for which a valuation from a third party pricing service is not readily available may be valued at amortized cost, which approximates fair value.
Foreign Securities and Currencies. Foreign securities and currencies are valued in U.S. dollars, based on foreign currency exchange rate quotations supplied by a third party pricing service. The pricing service uses a proprietary model to determine the exchange rate. Inputs to the model include reported trades and implied bid/ask spreads. The daily valuation of exchange-traded foreign securities generally is determined as of the close of trading on the principal exchange on which such securities trade. Events occurring after the close of trading on foreign exchanges may result in adjustments to the valuation of foreign securities to more accurately reflect their fair value as of the close of regular trading on the New York Stock Exchange. When valuing foreign equity securities that meet certain criteria, the Fund’s Trustees have approved the use of a fair value service that values such securities to reflect market trading that occurs after the close of the applicable foreign markets of comparable securities or other instruments that have a strong correlation to the fair-valued securities.
Fair Valuation. Investments for which valuations or market quotations are not readily available or are deemed unreliable are valued at fair value using methods determined in good faith by or at the direction of the Trustees of the Fund in a manner that fairly reflects the security’s value, or the amount that the Fund might reasonably expect to receive for the security upon its current sale in the ordinary course. Each such determination is based on a consideration of relevant factors, which are likely to vary from one pricing context to another. These factors may include, but are not limited to, the type of security, the existence of any contractual restrictions on the security’s disposition, the price and extent of public trading in similar securities of the issuer or of comparable companies or entities, quotations or relevant information obtained from broker/dealers or other market participants, information obtained from the issuer, analysts, and/or the appropriate stock exchange (for exchange-traded securities), an analysis of the company’s or entity’s financial condition, and an evaluation of the forces that influence the issuer and the market(s) in which the security is purchased and sold.
B Investment Transactions — Investment transactions for financial statement purposes are accounted for on a trade date basis. Realized gains and losses on investments sold are determined on the basis of identified cost.
C Income — Dividend income is recorded on the ex-dividend date for dividends received in cash and/or securities. However, if the ex-dividend date has passed, certain dividends from foreign securities are recorded as the Fund is informed of the ex-dividend date. Withholding taxes on foreign dividends and capital gains have been provided for in accordance with the Fund’s understanding of the applicable countries’ tax rules and rates. Interest income is recorded on the basis of interest accrued, adjusted for amortization of premium or accretion of discount.
D Federal and Other Taxes — The Fund’s policy is to comply with the provisions of the Internal Revenue Code applicable to regulated investment companies and to distribute to shareholders each year substantially all of its net investment income, and all or substantially all of its net realized capital gains. Accordingly, no provision for federal income or excise tax is necessary.
Parametric Emerging Markets Fund
January 31, 2018
Notes to Financial Statements — continued
In addition to the requirements of the Internal Revenue Code, the Fund may also be subject to local taxes on the recognition of capital gains in certain countries. In determining the daily net asset value, the Fund estimates the accrual for such taxes, if any, based on the unrealized appreciation on certain portfolio securities and the related tax rates. Taxes attributable to unrealized appreciation are included in the change in unrealized appreciation (depreciation) on investments. Capital gains taxes on securities sold are included in net realized gain (loss) on investments.
As of January 31, 2018, the Fund had no uncertain tax positions that would require financial statement recognition, de-recognition, or disclosure. The Fund files a U.S. federal income tax return annually after its fiscal year-end, which is subject to examination by the Internal Revenue Service for a period of three years from the date of filing.
E Expenses — The majority of expenses of the Trust are directly identifiable to an individual fund. Expenses which are not readily identifiable to a specific fund are allocated taking into consideration, among other things, the nature and type of expense and the relative size of the funds.
F Foreign Currency Translation — Investment valuations, other assets, and liabilities initially expressed in foreign currencies are translated each business day into U.S. dollars based upon current exchange rates. Purchases and sales of foreign investment securities and income and expenses denominated in foreign currencies are translated into U.S. dollars based upon currency exchange rates in effect on the respective dates of such transactions. Recognized gains or losses on investment transactions attributable to changes in foreign currency exchange rates are recorded for financial statement purposes as net realized gains and losses on investments. That portion of unrealized gains and losses on investments that results from fluctuations in foreign currency exchange rates is not separately disclosed.
G Equity-Linked Securities — Equity-linked securities are primarily used as an alternative means to more efficiently and effectively access the securities markets of emerging market countries and may also be known as participation notes, equity swaps, and zero strike calls and warrants. Equity-linked securities are privately issued securities whose investment results are designed to correspond generally to the performance of a specified stock index or “basket” of stocks, or a single stock. The Fund deposits an amount of cash with its custodian (or broker, if legally permitted) in an amount near or equal to the selling price of the underlying security in exchange for an equity-linked security. Upon sale, the Fund receives cash from the broker or custodian equal to the current value of the underlying security, less transactional costs. Aside from market risk of the underlying security, there is the risk that the issuer of an equity-linked security may default on its obligation under the security. In addition, the Fund may be unable to close out such a transaction with the other party or obtain an offsetting position with any other party, at any time prior to the end of the term of the underlying agreement. Income received on equity-linked securities is recorded as dividend income.
H Use of Estimates — The preparation of the financial statements in conformity with U.S. GAAP requires management to make estimates and assumptions that affect the reported amounts of assets and liabilities at the date of the financial statements and the reported amounts of income and expense during the reporting period. Actual results could differ from those estimates.
I Indemnifications — Under the Trust’s organizational documents, its officers and Trustees may be indemnified against certain liabilities and expenses arising out of the performance of their duties to the Fund. Under Massachusetts law, if certain conditions prevail, shareholders of a Massachusetts business trust (such as the Trust) could be deemed to have personal liability for the obligations of the Trust. However, the Trust’s Declaration of Trust contains an express disclaimer of liability on the part of Fund shareholders and the By-laws provide that the Trust shall assume the defense on behalf of any Fund shareholders. Moreover, the By-laws also provide for indemnification out of Fund property of any shareholder held personally liable solely by reason of being or having been a shareholder for all loss or expense arising from such liability. Additionally, in the normal course of business, the Fund enters into agreements with service providers that may contain indemnification clauses. The Fund’s maximum exposure under these arrangements is unknown as this would involve future claims that may be made against the Fund that have not yet occurred.
2 Distributions to Shareholders and Income Tax Information
It is the present policy of the Fund to make at least one distribution annually (normally in December) of all or substantially all of its net investment income and to distribute annually all or substantially all of its net realized capital gains. Distributions to shareholders are recorded on the ex-dividend date. Distributions are declared separately for each class of shares. Shareholders may reinvest income and capital gain distributions in additional shares of the same class of the Fund at the net asset value as of the ex-dividend date or, at the election of the shareholder, receive distributions in cash. Distributions to shareholders are determined in accordance with income tax regulations, which may differ from U.S. GAAP. As required by U.S. GAAP, only distributions in excess of tax basis earnings and profits are reported in the financial statements as a return of capital. Permanent differences between book and tax accounting relating to distributions are reclassified to paid-in capital. For tax purposes, distributions from short-term capital gains are considered to be from ordinary income.
The tax character of distributions declared for the years ended January 31, 2018 and January 31, 2017 was as follows:
| | | | | | | | |
| | | Year Ended January 31, | |
| | | 2018 | | | 2017 | |
| | |
Distributions declared from: | | | | | | | | |
Ordinary income | | $ | 76,266,062 | | | $ | 55,504,640 | |
Parametric Emerging Markets Fund
January 31, 2018
Notes to Financial Statements — continued
During the year ended January 31, 2018, accumulated net realized loss was increased by $2,249,787, accumulated distributions in excess of net investment income was increased by $8,440,089 and paid-in capital was increased by $10,689,876 due to the Fund’s use of equalization accounting and differences between book and tax accounting, primarily for foreign currency gain (loss), foreign capital gains taxes and investments in passive foreign investment companies (PFICs). Tax equalization accounting allows the Fund to treat as a distribution that portion of redemption proceeds representing a redeeming shareholder’s portion of undistributed taxable income and net capital gains. These reclassifications had no effect on the net assets or net asset value per share of the Fund.
As of January 31, 2018, the components of distributable earnings (accumulated losses) on a tax basis were as follows:
| | | | |
Undistributed ordinary income | | $ | 1,298,242 | |
Deferred capital losses | | $ | (349,111,888 | ) |
Net unrealized appreciation | | $ | 667,626,258 | |
The differences between components of distributable earnings (accumulated losses) on a tax basis and the amounts reflected in the Statement of Assets and Liabilities are primarily due to wash sales and investments in PFICs.
At January 31, 2018, the Fund, for federal income tax purposes, had deferred capital losses of $349,111,888 which would reduce its taxable income arising from future net realized gains on investment transactions, if any, to the extent permitted by the Internal Revenue Code, and thus would reduce the amount of distributions to shareholders, which would otherwise be necessary to relieve the Fund of any liability for federal income or excise tax. The deferred capital losses are treated as arising on the first day of the Fund’s next taxable year and retain the same short-term or long-term character as when originally deferred. Of the deferred capital losses at January 31, 2018, $349,111,888 are long-term.
The cost and unrealized appreciation (depreciation) of investments of the Fund at January 31, 2018, as determined on a federal income tax basis, were as follows:
| | | | |
| |
Aggregate cost | | $ | 2,374,635,363 | |
| |
Gross unrealized appreciation | | $ | 993,570,987 | |
Gross unrealized depreciation | | | (325,122,803 | ) |
| |
Net unrealized appreciation | | $ | 668,448,184 | |
3 Investment Adviser Fee and Other Transactions with Affiliates
The investment adviser fee is earned by Eaton Vance Management (EVM) as compensation for management and investment advisory services rendered to the Fund. Pursuant to the investment advisory agreement and subsequent fee reduction agreement between the Fund and EVM, the fee is computed at an annual rate of 0.85% of the Fund’s average daily net assets up to $500 million, 0.80% on net assets of $500 million but less than $1 billion, 0.775% on net assets of $1 billion but less than $2.5 billion, 0.75% on net assets of $2.5 billion but less than $5 billion, 0.73% on net assets of $5 billion but less than $7.5 billion and 0.71% on net assets of $7.5 billion and over, and is payable monthly. The fee reduction cannot be terminated or reduced without the approval of a majority vote of the Trustees of the Fund who are not interested persons of EVM or the Fund and by the vote of a majority of shareholders. For the year ended January 31, 2018, the investment adviser fee amounted to $23,329,963 or 0.79% of the Fund’s average daily net assets. Pursuant to a sub-advisory agreement, EVM has delegated the investment management of the Fund to Parametric Portfolio Associates LLC (Parametric), a majority-owned subsidiary of Eaton Vance Corp. EVM pays Parametric a portion of its investment adviser fee for sub-advisory services provided to the Fund. The administration fee is earned by EVM for administering the business affairs of the Fund and is computed at an annual rate of 0.15% of the Fund’s average daily net assets. For the year ended January 31, 2018, the administration fee amounted to $4,440,993.
EVM provides sub-transfer agency and related services to the Fund pursuant to a Sub-Transfer Agency Support Services Agreement. For the year ended January 31, 2018, EVM earned $49,084 from the Fund pursuant to such agreement, which is included in transfer and dividend disbursing agent fees on the Statement of Operations. Eaton Vance Distributors, Inc. (EVD), an affiliate of EVM and the Fund’s principal underwriter, received distribution and service fees from Investor Class and Class C shares (see Note 4) and contingent deferred sales charges (see Note 5).
Trustees and officers of the Fund who are members of EVM’s organization receive remuneration for their services to the Fund out of the investment adviser fee. Trustees of the Fund who are not affiliated with EVM may elect to defer receipt of all or a percentage of their annual fees in accordance with the terms of the Trustees Deferred Compensation Plan. For the year ended January 31, 2018, no significant amounts have been deferred. Certain officers and Trustees of the Fund are officers of EVM.
Parametric Emerging Markets Fund
January 31, 2018
Notes to Financial Statements — continued
4 Distribution Plans
The Fund has in effect a distribution plan for Investor Class shares (Investor Class Plan) pursuant to Rule 12b-1 under the 1940 Act. Pursuant to the Investor Class Plan, the Fund pays EVD a distribution and service fee of 0.25% per annum of its average daily net assets attributable to Investor Class shares for distribution services and facilities provided to the Fund by EVD, as well as for personal services and/or the maintenance of shareholder accounts. Distribution and service fees paid or accrued to EVD for the year ended January 31, 2018 amounted to $1,175,499 for Investor Class shares.
The Fund also has in effect a distribution plan for Class C shares (Class C Plan) pursuant to Rule 12b-1 under the 1940 Act. Pursuant to the Class C Plan, the Fund pays EVD amounts equal to 0.75% per annum of its average daily net assets attributable to Class C shares for providing ongoing distribution services and facilities to the Fund. For the year ended January 31, 2018, the Fund paid or accrued to EVD $71,135 for Class C shares.
Pursuant to the Class C Plan, the Fund also makes payments of service fees to EVD, financial intermediaries and other persons in amounts equal to 0.25% per annum of its average daily net assets attributable to that class. Service fees paid or accrued are for personal services and/or the maintenance of shareholder accounts. They are separate and distinct from the sales commissions and distribution fees payable to EVD. Service fees paid or accrued for the year ended January 31, 2018 amounted to $23,712 for Class C shares.
Distribution and service fees are subject to the limitations contained in the Financial Industry Regulatory Authority Rule 2341(d).
5 Contingent Deferred Sales Charges
A contingent deferred sales charge (CDSC) of 1% generally is imposed on redemptions of Class C shares made within one year of purchase. Generally, the CDSC is based upon the lower of the net asset value at date of redemption or date of purchase. No charge is levied on shares acquired by reinvestment of dividends or capital gain distributions. For the year ended January 31, 2018, the Fund was informed that EVD received approximately $100 of CDSCs paid by Class C shareholders.
6 Purchases and Sales of Investments
Purchases and sales of investments, other than short-term obligations, aggregated $97,776,647 and $717,467,933, respectively, for the year ended January 31, 2018.
7 Shares of Beneficial Interest
The Fund’s Declaration of Trust permits the Trustees to issue an unlimited number of full and fractional shares of beneficial interest (without par value). Such shares may be issued in a number of different series (such as the Fund) and classes. Transactions in Fund shares were as follows:
| | | | | | | | |
| | | Year Ended January 31, | |
| Investor Class | | 2018 | | | 2017 | |
| | |
Sales | | | 3,766,534 | | | | 6,129,611 | |
Issued to shareholders electing to receive payments of distributions in Fund shares | | | 654,358 | | | | 681,959 | |
Redemptions | | | (19,672,231 | ) | | | (15,731,257 | ) |
| | |
Net decrease | | | (15,251,339 | ) | | | (8,919,687 | ) |
| | |
| | | | | | | | |
| | | Year Ended January 31, | |
| Class C | | 2018 | | | 2017 | |
| | |
Sales | | | 58,977 | | | | 23,292 | |
Issued to shareholders electing to receive payments of distributions in Fund shares | | | 10,606 | | | | 8,751 | |
Redemptions | | | (157,753 | ) | | | (212,691 | ) |
| | |
Net decrease | | | (88,170 | ) | | | (180,648 | ) |
| | |
| | | | | | | | |
Parametric Emerging Markets Fund
January 31, 2018
Notes to Financial Statements — continued
| | | | | | | | |
| | | Year Ended January 31, | |
| Institutional Class | | 2018 | | | 2017 | |
| | |
Sales | | | 28,311,462 | | | | 61,768,701 | |
Issued to shareholders electing to receive payments of distributions in Fund shares | | | 2,369,982 | | | | 2,281,417 | |
Redemptions | | | (51,281,512 | ) | | | (86,735,012 | ) |
| | |
Net decrease | | | (20,600,068 | ) | | | (22,684,894 | ) |
| | |
| | | | | | | | |
| | | Year Ended January 31, | |
| Class R6 | | 2018 | | | 2017 | |
| | |
Sales | | | 5,554,714 | | | | 8,646,801 | |
Issued to shareholders electing to receive payments of distributions in Fund shares | | | 1,015,051 | | | | 839,911 | |
Redemptions | | | (11,291,637 | ) | | | (19,506,411 | ) |
| | |
Net decrease | | | (4,721,872 | ) | | | (10,019,699 | ) |
At January 31, 2018, one shareholder owned 10.8% of the value of the outstanding shares of the Fund.
8 Line of Credit
The Fund participates with other portfolios and funds managed by EVM and its affiliates in a $625 million unsecured line of credit agreement with a group of banks, which is in effect through October 30, 2018. Borrowings are made by the Fund solely to facilitate the handling of unusual and/or unanticipated short-term cash requirements. Interest is charged to the Fund based on its borrowings at an amount above either the Eurodollar rate or Federal Funds rate. In addition, a fee computed at an annual rate of 0.15% on the daily unused portion of the line of credit is allocated among the participating portfolios and funds at the end of each quarter. Because the line of credit is not available exclusively to the Fund, it may be unable to borrow some or all of its requested amounts at any particular time. The Fund did not have any significant borrowings or allocated fees during the year ended January 31, 2018.
9 Risks Associated with Foreign Investments
Investing in securities issued by companies whose principal business activities are outside the United States may involve significant risks not present in domestic investments. For example, there is generally less publicly available information about foreign companies, particularly those not subject to the disclosure and reporting requirements of the U.S. securities laws. Certain foreign issuers are generally not bound by uniform accounting, auditing, and financial reporting requirements and standards of practice comparable to those applicable to domestic issuers. Investments in foreign securities also involve the risk of possible adverse changes in investment or exchange control regulations, expropriation or confiscatory taxation, limitation on the removal of funds or other assets of the Fund, political or financial instability or diplomatic and other developments which could affect such investments. Foreign securities markets, while growing in volume and sophistication, are generally not as developed as those in the United States, and securities of some foreign issuers (particularly those located in developing countries) may be less liquid and more volatile than securities of comparable U.S. companies. In general, there is less overall governmental supervision and regulation of foreign securities markets, broker/dealers and issuers than in the United States. The foregoing risks of foreign investing can be more significant in less developed countries characterized as emerging market countries.
10 Fair Value Measurements
Under generally accepted accounting principles for fair value measurements, a three-tier hierarchy to prioritize the assumptions, referred to as inputs, is used in valuation techniques to measure fair value. The three-tier hierarchy of inputs is summarized in the three broad levels listed below.
| • | | Level 1 – quoted prices in active markets for identical investments |
| • | | Level 2 – other significant observable inputs (including quoted prices for similar investments, interest rates, prepayment speeds, credit risk, etc.) |
| • | | Level 3 – significant unobservable inputs (including a fund’s own assumptions in determining the fair value of investments) |
In cases where the inputs used to measure fair value fall in different levels of the fair value hierarchy, the level disclosed is determined based on the lowest level input that is significant to the fair value measurement in its entirety. The inputs or methodology used for valuing securities are not necessarily an indication of the risk associated with investing in those securities.
Parametric Emerging Markets Fund
January 31, 2018
Notes to Financial Statements — continued
At January 31, 2018, the hierarchy of inputs used in valuing the Fund’s investments, which are carried at value, were as follows:
| | | | | | | | | | | | | | | | |
| Asset Description | | Level 1 | | | Level 2 | | | Level 3* | | | Total | |
| | | | |
Common Stocks | | | | | | | | | | | | | | | | |
Asia/Pacific | | $ | 26,517,867 | | | $ | 1,382,610,001 | | | $ | 1,154,508 | | | $ | 1,410,282,376 | |
Emerging Europe | | | 24,402,993 | | | | 511,820,121 | | | | 0 | | | | 536,223,114 | |
Latin America | | | 561,560,852 | | | | — | | | | — | | | | 561,560,852 | |
Middle East/Africa | | | 2,739,057 | | | | 502,769,911 | | | | 0 | | | | 505,508,968 | |
| | | | |
Total Common Stocks | | $ | 615,220,769 | | | $ | 2,397,200,033 | ** | | $ | 1,154,508 | | | $ | 3,013,575,310 | |
| | | | |
Equity-Linked Securities — Saudi Arabia | | $ | — | | | $ | 22,255,898 | | | $ | 0 | | | $ | 22,255,898 | |
Rights | | | 26,166 | | | | 155,779 | | | | — | | | | 181,945 | |
Short-Term Investments | | | — | | | | 7,070,394 | | | | — | | | | 7,070,394 | |
| | | | |
Total Investments | | $ | 615,246,935 | | | $ | 2,426,682,104 | | | $ | 1,154,508 | | | $ | 3,043,083,547 | |
| * | None of the unobservable inputs for Level 3 assets, individually or collectively, had a material impact on the Fund. |
| ** | Includes foreign equity securities whose values were adjusted to reflect market trading of comparable securities or other correlated instruments that occurred after the close of trading in their applicable foreign markets. |
Level 3 investments at the beginning and/or end of the period in relation to net assets were not significant and accordingly, a reconciliation of Level 3 assets for the year ended January 31, 2018 is not presented. At January 31, 2018, the value of investments transferred between Level 1 and Level 2 during the year then ended was not significant.
Parametric Emerging Markets Fund
January 31, 2018
Report of Independent Registered Public Accounting Firm
To the Trustees of Eaton Vance Mutual Funds Trust and Shareholders of Parametric Emerging Markets Fund:
Opinion on the Financial Statements and Financial Highlights
We have audited the accompanying statement of assets and liabilities of Eaton Vance Parametric Emerging Markets Fund (the “Fund”) (one of the funds constituting Eaton Vance Mutual Funds Trust), including the portfolio of investments, as of January 31, 2018, the related statement of operations for the year then ended, the statements of changes in net assets for each of the two years in the period then ended, the financial highlights for each of the periods presented, and the related notes. In our opinion, the financial statements and financial highlights present fairly, in all material respects, the financial position of the Fund as of January 31, 2018, and the results of its operations for the year then ended, the changes in its net assets for each of the two years in the period then ended, and the financial highlights for each of the periods presented, in conformity with accounting principles generally accepted in the United States of America.
Basis for Opinion
These financial statements and financial highlights are the responsibility of the Fund’s management. Our responsibility is to express an opinion on the Fund’s financial statements and financial highlights based on our audits. We are a public accounting firm registered with the Public Company Accounting Oversight Board (United States) (PCAOB) and are required to be independent with respect to the Fund in accordance with the U.S. federal securities laws and the applicable rules and regulations of the Securities and Exchange Commission and the PCAOB.
We conducted our audits in accordance with the standards of the PCAOB. Those standards require that we plan and perform the audit to obtain reasonable assurance about whether the financial statements and financial highlights are free of material misstatement, whether due to error or fraud. The Fund is not required to have, nor were we engaged to perform, an audit of its internal control over financial reporting. As part of our audits we are required to obtain an understanding of internal control over financial reporting but not for the purpose of expressing an opinion on the effectiveness of the Fund’s internal control over financial reporting. Accordingly, we express no such opinion.
Our audits included performing procedures to assess the risks of material misstatement of the financial statements and financial highlights, whether due to error or fraud, and performing procedures that respond to those risks. Such procedures included examining, on a test basis, evidence regarding the amounts and disclosures in the financial statements and financial highlights. Our audits also included evaluating the accounting principles used and significant estimates made by management, as well as evaluating the overall presentation of the financial statements and financial highlights. Our procedures included confirmation of securities owned as of January 31, 2018, by correspondence with the custodian and brokers; when replies were not received from brokers, we performed other auditing procedures. We believe that our audits provide a reasonable basis for our opinion.
/s/ Deloitte & Touche LLP
Boston, Massachusetts
March 21, 2018
We have served as the auditor of one or more Eaton Vance investment companies since 1959.
Parametric Emerging Markets Fund
January 31, 2018
Federal Tax Information (Unaudited)
The Form 1099-DIV you receive in February 2019 will show the tax status of all distributions paid to your account in calendar year 2018. Shareholders are advised to consult their own tax adviser with respect to the tax consequences of their investment in the Fund. As required by the Internal Revenue Code and/or regulations, shareholders must be notified regarding the status of qualified dividend income for individuals and the foreign tax credit.
Qualified Dividend Income. For the fiscal year ended January 31, 2018, the Fund designates approximately $54,754,637, or up to the maximum amount of such dividends allowable pursuant to the Internal Revenue Code, as qualified dividend income eligible for the reduced tax rate of 15%.
Foreign Tax Credit. For the fiscal year ended January 31, 2018, the Fund paid foreign taxes of $9,221,797 and recognized foreign source income of $91,326,980.
Parametric Emerging Markets Fund
January 31, 2018
Management and Organization
Fund Management. The Trustees of Eaton Vance Mutual Funds Trust (the Trust) are responsible for the overall management and supervision of the Trust’s affairs. The Trustees and officers of the Trust are listed below. Except as indicated, each individual has held the office shown or other offices in the same company for the last five years. Trustees and officers of the Trust hold indefinite terms of office. The “noninterested Trustees” consist of those Trustees who are not “interested persons” of the Trust, as that term is defined under the 1940 Act. The business address of each Trustee and officer is Two International Place, Boston, Massachusetts 02110. As used below, “EVC” refers to Eaton Vance Corp., “EV” refers to Eaton Vance, Inc., “EVM” refers to Eaton Vance Management, “BMR” refers to Boston Management and Research and “EVD” refers to Eaton Vance Distributors, Inc. EVC and EV are the corporate parent and trustee, respectively, of EVM and BMR. EVD is the Fund’s principal underwriter and a wholly-owned subsidiary of EVC. Each officer affiliated with Eaton Vance may hold a position with other Eaton Vance affiliates that is comparable to his or her position with EVM listed below. Each Trustee oversees 177 portfolios in the Eaton Vance Complex (including all master and feeder funds in a master feeder structure). Each officer serves as an officer of certain other Eaton Vance funds. Each Trustee and officer serves until his or her successor is elected.
| | | | | | |
| Name and Year of Birth | | Position(s) with the Trust | | Trustee Since(1) | | Principal Occupation(s) and Directorships During Past Five Years and Other Relevant Experience |
Interested Trustee |
| | | |
Thomas E. Faust Jr. 1958 | | Trustee | | 2007 | | Chairman, Chief Executive Officer and President of EVC, Director and President of EV, Chief Executive Officer and President of EVM and BMR, and Director of EVD. Trustee and/or officer of 177 registered investment companies. Mr. Faust is an interested person because of his positions with EVM, BMR, EVD, EVC and EV, which are affiliates of the Trust. Directorships in the Last Five Years.(2) Director of EVC and Hexavest Inc. (investment management firm). |
| | | |
| | | | | | |
Noninterested Trustees |
| | | |
Mark R. Fetting 1954 | | Trustee | | 2016 | | Private investor. Formerly held various positions at Legg Mason, Inc. (investment management firm) (2000-2012), including President, Chief Executive Officer, Director and Chairman (2008-2012), Senior Executive Vice President (2004-2008) and Executive Vice President (2001-2004). Formerly, President of Legg Mason family of funds (2001-2008). Formerly, Division President and Senior Officer of Prudential Financial Group, Inc. and related companies (investment management firm) (1991-2000). Directorships in the Last Five Years. None. |
| | | |
Cynthia E. Frost 1961 | | Trustee | | 2014 | | Private investor. Formerly, Chief Investment Officer of Brown University (university endowment) (2000-2012); Formerly, Portfolio Strategist for Duke Management Company (university endowment manager) (1995-2000); Formerly, Managing Director, Cambridge Associates (investment consulting company) (1989-1995); Formerly, Consultant, Bain and Company (management consulting firm) (1987-1989); Formerly, Senior Equity Analyst, BA Investment Management Company (1983-1985). Directorships in the Last Five Years. None. |
| | | |
George J. Gorman 1952 | | Trustee | | 2014 | | Principal at George J. Gorman LLC (consulting firm). Formerly, Senior Partner at Ernst & Young LLP (a registered public accounting firm) (1974-2009). Directorships in the Last Five Years. Formerly, Trustee of the BofA Funds Series Trust (11 funds) (2011-2014) and of the Ashmore Funds (9 funds) (2010-2014). |
| | | |
Valerie A. Mosley 1960 | | Trustee | | 2014 | | Chairwoman and Chief Executive Officer of Valmo Ventures (a consulting and investment firm). Former Partner and Senior Vice President, Portfolio Manager and Investment Strategist at Wellington Management Company, LLP (investment management firm) (1992-2012). Former Chief Investment Officer, PG Corbin Asset Management (1990-1992). Formerly worked in institutional corporate bond sales at Kidder Peabody (1986-1990). Directorships in the Last Five Years.(2) Director of Dynex Capital, Inc. (mortgage REIT) (since 2013). |
Parametric Emerging Markets Fund
January 31, 2018
Management and Organization — continued
| | | | | | |
| Name and Year of Birth | | Position(s) with the Trust | | Trustee Since(1) | | Principal Occupation(s) and Directorships During Past Five Years and Other Relevant Experience |
Noninterested Trustees (continued) |
| | | |
William H. Park 1947 | | Chairperson of the Board and Trustee | | 2016 (Chairperson) 2003 (Trustee) | | Private investor. Formerly, Consultant (management and transactional) (2012-2014). Formerly, Chief Financial Officer, Aveon Group L.P. (investment management firm) (2010-2011). Formerly, Vice Chairman, Commercial Industrial Finance Corp. (specialty finance company) (2006-2010). Formerly, President and Chief Executive Officer, Prizm Capital Management, LLC (investment management firm) (2002-2005). Formerly, Executive Vice President and Chief Financial Officer, United Asset Management Corporation (investment management firm) (1982-2001). Formerly, Senior Manager, Price Waterhouse (now PricewaterhouseCoopers) (a registered public accounting firm) (1972-1981). Directorships in the Last Five Years.(2) None. |
| | | |
Helen Frame Peters 1948 | | Trustee | | 2008 | | Professor of Finance, Carroll School of Management, Boston College. Formerly, Dean, Carroll School of Management, Boston College (2000-2002). Formerly, Chief Investment Officer, Fixed Income, Scudder Kemper Investments (investment management firm) (1998-1999). Formerly, Chief Investment Officer, Equity and Fixed Income, Colonial Management Associates (investment management firm) (1991-1998). Directorships in the Last Five Years.(2) None. |
| | | |
Susan J. Sutherland 1957 | | Trustee | | 2015 | | Private investor. Formerly, Associate, Counsel and Partner at Skadden, Arps, Slate, Meagher & Flom LLP (law firm) (1982-2013). Directorships in the Last Five Years. Formerly, Director of Montpelier Re Holdings Ltd. (global provider of customized insurance and reinsurance products) (2013-2015). |
| | | |
Harriett Tee Taggart 1948 | | Trustee | | 2011 | | Managing Director, Taggart Associates (a professional practice firm). Formerly, Partner and Senior Vice President, Wellington Management Company, LLP (investment management firm) (1983-2006). Ms. Taggart has apprised the Board of Trustees that she intends to retire as a Trustee of all Eaton Vance Funds in 2018. Directorships in the Last Five Years.(2) Director of Albemarle Corporation (chemicals manufacturer) (since 2007) and The Hanover Group (specialty property and casualty insurance company) (since 2009). |
| | | |
Scott E. Wennerholm 1959 | | Trustee | | 2016 | | Trustee at Wheelock College (postsecondary institution) (since 2012). Formerly, Consultant at GF Parish Group (executive recruiting firm) (2016-2017). Formerly, Chief Operating Officer and Executive Vice President at BNY Mellon Asset Management (investment management firm) (2005-2011). Formerly, Chief Operating Officer and Chief Financial Officer at Natixis Global Asset Management (investment management firm) (1997-2004). Formerly, Vice President at Fidelity Investments Institutional Services (investment management firm) (1994-1997). Directorships in the Last Five Years. None. |
| | | |
| | | | | | |
Principal Officers who are not Trustees |
| Name and Year of Birth | | Position(s) with the Trust | | Officer
Since(3) | | Principal Occupation(s) During Past Five Years |
Payson F. Swaffield 1956 | | President | | 2003 | | Vice President and Chief Income Investment Officer of EVM and BMR. Also Vice President of Calvert Research and Management (“CRM”). |
| | | |
Maureen A. Gemma 1960 | | Vice President, Secretary and Chief Legal Officer | | 2005 | | Vice President of EVM and BMR. Also Vice President and officer of CRM. |
| | | |
James F. Kirchner 1967 | | Treasurer | | 2007 | | Vice President of EVM and BMR. Also Vice President and officer of CRM. |
Parametric Emerging Markets Fund
January 31, 2018
Management and Organization — continued
| | | | | | |
| Name and Year of Birth | | Position(s) with the Trust | | Officer
Since(3) | | Principal Occupation(s) During Past Five Years |
Principal Officers who are not Trustees (continued) |
| | | |
Richard F. Froio 1968 | | Chief Compliance Officer | | 2017 | | Vice President of EVM and BMR since 2017. Formerly Deputy Chief Compliance Officer (Adviser/Funds) and Chief Compliance Officer (Distribution) at PIMCO (2012-2017) and Managing Director at BlackRock/Barclays Global Investors (2009-2012). |
| (1) | Year first appointed to serve as Trustee for a fund in the Eaton Vance family of funds. Each Trustee has served continuously since appointment unless indicated otherwise. |
| (2) | During their respective tenures, the Trustees (except for Mmes. Frost and Sutherland and Messrs. Fetting, Gorman and Wennerholm) also served as Board members of one or more of the following funds (which operated in the years noted): eUnitsTM 2 Year U.S. Market Participation Trust: Upside to Cap / Buffered Downside (launched in 2012 and terminated in 2014); and eUnitsTM 2 Year U.S. Market Participation Trust II: Upside to Cap / Buffered Downside (launched in 2012 and terminated in 2014). However, Ms. Mosley did not serve as a Board member of eUnitsTM 2 Year U.S. Market Participation Trust: Upside to Cap / Buffered Downside (launched in 2012 and terminated in 2014). |
| (3) | Year first elected to serve as officer of a fund in the Eaton Vance family of funds when the officer has served continuously. Otherwise, year of most recent election as an officer of a fund in the Eaton Vance family of funds. Titles may have changed since initial election. |
The SAI for the Fund includes additional information about the Trustees and officers of the Fund and can be obtained without charge on Eaton Vance’s website at www.eatonvance.com or by calling 1-800-260-0761.
Eaton Vance Funds
IMPORTANT NOTICES
Privacy. The Eaton Vance organization is committed to ensuring your financial privacy. Each of the financial institutions identified below has in effect the following policy (“Privacy Policy”) with respect to nonpublic personal information about its customers:
| • | | Only such information received from you, through application forms or otherwise, and information about your Eaton Vance fund transactions will be collected. This may include information such as name, address, social security number, tax status, account balances and transactions. |
| • | | None of such information about you (or former customers) will be disclosed to anyone, except as permitted by law (which includes disclosure to employees necessary to service your account). In the normal course of servicing a customer’s account, Eaton Vance may share information with unaffiliated third parties that perform various required services such as transfer agents, custodians and broker-dealers. |
| • | | Policies and procedures (including physical, electronic and procedural safeguards) are in place that are designed to protect the confidentiality of such information. |
| • | | We reserve the right to change our Privacy Policy at any time upon proper notification to you. Customers may want to review our Privacy Policy periodically for changes by accessing the link on our homepage: www.eatonvance.com. |
Our pledge of privacy applies to the following entities within the Eaton Vance organization: the Eaton Vance Family of Funds, Eaton Vance Management, Eaton Vance Investment Counsel, Eaton Vance Distributors, Inc., Eaton Vance Trust Company, Eaton Vance Management (International) Limited,
Eaton Vance Advisers International Ltd., Eaton Vance Management’s Real Estate Investment Group and Boston Management and Research. In addition, our Privacy Policy applies only to those Eaton Vance customers who are individuals and who have a direct relationship with us. If a customer’s account (i.e., fund shares) is held in the name of a third-party financial advisor/broker-dealer, it is likely that only such advisor’s privacy policies apply to the customer. This notice supersedes all previously issued privacy disclosures. For more information about Eaton Vance’s Privacy Policy, please call 1-800-262-1122.
Delivery of Shareholder Documents. The Securities and Exchange Commission (SEC) permits funds to deliver only one copy of shareholder documents, including prospectuses, proxy statements and shareholder reports, to fund investors with multiple accounts at the same residential or post office box address. This practice is often called “householding” and it helps eliminate duplicate mailings to shareholders. Eaton Vance, or your financial advisor, may household the mailing of your documents indefinitely unless you instruct Eaton Vance, or your financial advisor, otherwise. If you would prefer that your Eaton Vance documents not be householded, please contact Eaton Vance at 1-800-260-0761, or contact your financial advisor. Your instructions that householding not apply to delivery of your Eaton Vance documents will typically be effective within 30 days of receipt by Eaton Vance or your financial advisor.
Portfolio Holdings. Each Eaton Vance Fund and its underlying Portfolio(s) (if applicable) will file a schedule of portfolio holdings on Form N-Q with the SEC for the first and third quarters of each fiscal year. The Form N-Q will be available on the Eaton Vance website at www.eatonvance.com, by calling Eaton Vance at 1-800-260-0761 or in the EDGAR database on the SEC’s website at www.sec.gov. Form N-Q may also be reviewed and copied at the SEC’s public reference room in Washington, D.C. (call 1-800-732-0330 for information on the operation of the public reference room).
Proxy Voting. From time to time, funds are required to vote proxies related to the securities held by the funds. The Eaton Vance Funds or their underlying Portfolios (if applicable) vote proxies according to a set of policies and procedures approved by the Funds’ and Portfolios’ Boards. You may obtain a description of these policies and procedures and information on how the Funds or Portfolios voted proxies relating to portfolio securities during the most recent 12-month period ended June 30, without charge, upon request, by calling 1-800-260-0761 and by accessing the SEC’s website at www.sec.gov.
This Page Intentionally Left Blank
Investment Adviser and Administrator
Eaton Vance Management
Two International Place
Boston, MA 02110
Sub-Adviser
Parametric Portfolio Associates LLC
1918 Eighth Avenue, Suite 3100
Seattle, WA 98101
Principal Underwriter*
Eaton Vance Distributors, Inc.
Two International Place
Boston, MA 02110
(617) 482-8260
Custodian
State Street Bank and Trust Company
State Street Financial Center, One Lincoln Street
Boston, MA 02111
Transfer Agent
BNY Mellon Investment Servicing (US) Inc.
Attn: Eaton Vance Funds
P.O. Box 9653
Providence, RI 02940-9653
(800) 260-0761
Independent Registered Public Accounting Firm
Deloitte & Touche LLP
200 Berkeley Street
Boston, MA 02116-5022
Fund Offices
Two International Place
Boston, MA 02110
| * | FINRA BrokerCheck. Investors may check the background of their Investment Professional by contacting the Financial Industry Regulatory Authority (FINRA). FINRA BrokerCheck is a free tool to help investors check the professional background of current and former FINRA-registered securities firms and brokers. FINRA BrokerCheck is available by calling 1-800-289-9999 and at www.FINRA.org. The FINRA BrokerCheck brochure describing this program is available to investors at www.FINRA.org. |
2774 1.31.18

Parametric International Equity Fund
Annual Report
January 31, 2018

Commodity Futures Trading Commission Registration. Effective December 31, 2012, the Commodity Futures Trading Commission (“CFTC”) adopted certain regulatory changes that subject registered investment companies and advisers to regulation by the CFTC if a fund invests more than a prescribed level of its assets in certain CFTC-regulated instruments (including futures, certain options and swap agreements) or markets itself as providing investment exposure to such instruments. The Fund has claimed an exclusion from the definition of the term “commodity pool operator” under the Commodity Exchange Act. Accordingly, neither the Fund nor the adviser with respect to the operation of the Fund is subject to CFTC regulation. Because of its management of other strategies, the Fund’s adviser is registered with the CFTC as a commodity pool operator and a commodity trading advisor.
Fund shares are not insured by the FDIC and are not deposits or other obligations of, or guaranteed by, any depository institution. Shares are subject to investment risks, including possible loss of principal invested.
This report must be preceded or accompanied by a current summary prospectus or prospectus. Before investing, investors should consider carefully the investment objective, risks, and charges and expenses of a mutual fund. This and other important information is contained in the summary prospectus and prospectus, which can be obtained from a financial advisor. Prospective investors should read the prospectus carefully before investing. For further information, please call 1-800-260-0761.
Annual Report January 31, 2018
Parametric International Equity Fund
Table of Contents
| | | | |
Management’s Discussion of Fund Performance | | | 2 | |
| |
Performance | | | 3 | |
| |
Fund Profile | | | 4 | |
| |
Endnotes and Additional Disclosures | | | 5 | |
| |
Fund Expenses | | | 6 | |
| |
Financial Statements | | | 7 | |
| |
Report of Independent Registered Public Accounting Firm | | | 33 | |
| |
Federal Tax Information | | | 34 | |
| |
Management and Organization | | | 35 | |
| |
Important Notices | | | 37 | |
Parametric International Equity Fund
January 31, 2018
Management’s Discussion of Fund Performance1
Economic and Market Conditions
Developed international equity markets advanced sharply over the 12-month period ended January 31, 2018, up 27.60% as measured by the MSCI EAFE Index (the Index).2 This rally was broad-based, with every country advancing over the 12-month period, and the majority of countries returning over 20%.
2017 saw broad gains in both Europe and Japan. In Europe, signs of recovery flickered, then strengthened, over the course of the year as economic growth data turned positive and a number of bank solvency worries in the periphery of Europe were successfully resolved. Additionally, elections in France and Germany were seen as breaking the chain of far-right electoral success, causing political risk to recede from consideration by many market participants. In the U.K., the impact of Brexit continued to worry many, but the resulting fall in the British pound provided a tailwind to many U.K. banks and manufacturers, as their globally-derived revenues increased in pound-relative terms.
In Japan, markets continued to react to positive economic growth numbers and corporate earnings. Additionally, the country saw initial signs of inflation, giving indications that the country may finally be working itself out of its decades-long deflationary spiral. Near the end of the 12-month period, a successful election by Prime Minister Abe re-energized stock returns, as this was taken to mean a continuation of his economic stimulus plan.
One additional contributor to Index returns over the 12-month period was the decline in the value of the U.S. dollar. Such a decline in the value of the dollar serves to increase the value of foreign-denominated assets, when stated in U.S. dollar terms.
Fund Performance
For the 12-month period ended January 31, 2018, the Parametric International Equity Fund (the Fund) had a total return of 27.29% for Investor Class shares at net asset value (NAV), modestly underperforming the Fund’s benchmark, the MSCI EAFE Index (the Index), which had a total return of 27.60% for the same period.
Factors detracting from the Fund’s performance relative to the Index included the sector diversification6 process within Hong Kong, which resulted in an overweight to the
telecommunication services, health care and utilities sectors. These defensive sectors lagged the broader Hong Kong market in the market rally. Similarly, the sector diversification process within Japan, and resulting overweights to the defensive telecommunication services and utilities sectors within the country, detracted, as Japanese equities experienced a sharp rally during the latter part of the period. The sector diversification process within Singapore also hurt relative Fund performance, partially due to the resulting underweight to the booming financials sector.
Factors contributing to the Fund’s performance relative to the Index included the Fund’s overweight to Italy. Italian equities broadly rallied over the time period, after it became apparent that the country’s weakened banking sector was going to be able to avoid insolvency. Additionally, the sector diversification process within Switzerland contributed to relative results. This was partially due to the resulting overweight to the consumer discretionary sector, which benefited from a rally in Swiss watchmakers. Finally, the sector diversification process in Australia contributed, partially due to the resulting overweight to the top-performing technology sector.
See Endnotes and Additional Disclosures in this report.
Past performance is no guarantee of future results. Returns are historical and are calculated by determining the percentage change in net asset value (NAV) or offering price (as applicable) with all distributions reinvested. Investment return and principal value will fluctuate so that shares, when redeemed, may be worth more or less than their original cost. Performance less than or equal to one year is cumulative. Performance is for the stated time period only; due to market volatility, the Fund’s current performance may be lower or higher than quoted. Returns are before taxes unless otherwise noted. For performance as of the most recent month-end, please refer to eatonvance.com.
Parametric International Equity Fund
January 31, 2018
Performance2,3
Portfolio Managers Thomas Seto, Timothy W. Atwill, Ph.D., CFA and Paul Bouchey, CFA, each of Parametric Portfolio Associates LLC
| | | | | | | | | | | | | | | | | | | | |
| % Average Annual Total Returns | | Class Inception Date | | | Performance Inception Date | | | One Year | | | Five Years | | | Since Inception | |
Investor Class at NAV | | | 04/01/2010 | | | | 04/01/2010 | | | | 27.29 | % | | | 8.13 | % | | | 7.35 | % |
Institutional Class at NAV | | | 04/01/2010 | | | | 04/01/2010 | | | | 27.60 | | | | 8.41 | | | | 7.63 | |
Class R at NAV | | | 08/10/2015 | | | | 04/01/2010 | | | | 26.90 | | | | 7.98 | | | | 7.26 | |
Class R6 at NAV | | | 08/10/2015 | | | | 04/01/2010 | | | | 27.67 | | | | 8.43 | | | | 7.64 | |
MSCI EAFE Index | | | — | | | | — | | | | 27.60 | % | | | 7.84 | % | | | 6.93 | % |
| | | | | |
| | | | | | | | | | | | | | | | | | | | |
| % Total Annual Operating Expense Ratios4 | | | | | Investor Class | | | Institutional Class | | | Class R | | | Class R6 | |
Gross | | | | | | | 0.92 | % | | | 0.67 | % | | | 1.17 | % | | | 0.65 | % |
Net | | | | | | | 0.75 | | | | 0.50 | | | | 1.00 | | | | 0.47 | |
Growth of $10,000
This graph shows the change in value of a hypothetical investment of $10,000 in Investor Class of the Fund for the period indicated. For comparison, the same investment is shown in the indicated index.
| | | | | | | | | | | | | | | | |
| Growth of Investment3 | | Amount Invested | | | Period Beginning | | | At NAV | | | With Maximum Sales Charge | |
Institutional Class | | $ | 50,000 | | | | 04/01/2010 | | | $ | 89,010 | | | | N.A. | |
Class R | | $ | 10,000 | | | | 04/01/2010 | | | $ | 17,327 | | | | N.A. | |
Class R6 | | $ | 1,000,000 | | | | 04/01/2010 | | | $ | 1,781,840 | | | | N.A. | |
See Endnotes and Additional Disclosures in this report.
Past performance is no guarantee of future results. Returns are historical and are calculated by determining the percentage change in net asset value (NAV) or offering price (as applicable) with all distributions reinvested. Investment return and principal value will fluctuate so that shares, when redeemed, may be worth more or less than their original cost. Performance less than or equal to one year is cumulative. Performance is for the stated time period only; due to market volatility, the Fund’s current performance may be lower or higher than quoted. Returns are before taxes unless otherwise noted. For performance as of the most recent month-end, please refer to eatonvance.com.
Parametric International Equity Fund
January 31, 2018
Fund Profile
Sector Allocation (% of net assets)5
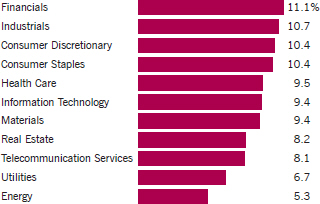
Top 10 Holdings (% of net assets)5
| | | | |
Nestle SA | | | 1.2 | % |
| |
Air Liquide SA | | | 0.8 | |
| |
Compagnie Financiere Richemont SA, Class A | | | 0.8 | |
| |
Total SA | | | 0.8 | |
| |
Deutsche Telekom AG | | | 0.7 | |
| |
CSL, Ltd. | | | 0.7 | |
| |
Vodafone Group PLC | | | 0.7 | |
| |
Novartis AG | | | 0.7 | |
| |
Unilever NV | | | 0.6 | |
| |
Orange SA | | | 0.6 | |
| |
Total | | | 7.6 | % |
Geographic Allocation (% of common stocks)
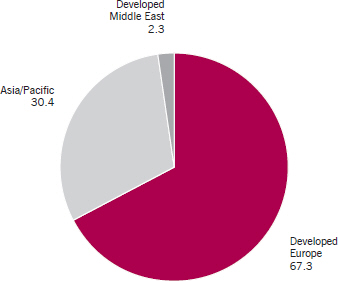
See Endnotes and Additional Disclosures in this report.
Parametric International Equity Fund
January 31, 2018
Endnotes and Additional Disclosures
| 1 | The views expressed in this report are those of the portfolio manager(s) and are current only through the date stated at the top of this page. These views are subject to change at any time based upon market or other conditions, and Eaton Vance and the Fund(s) disclaim any responsibility to update such views. These views may not be relied upon as investment advice and, because investment decisions are based on many factors, may not be relied upon as an indication of trading intent on behalf of any Eaton Vance fund. This commentary may contain statements that are not historical facts, referred to as “forward looking statements”. The Fund’s actual future results may differ significantly from those stated in any forward looking statement, depending on factors such as changes in securities or financial markets or general economic conditions, the volume of sales and purchases of Fund shares, the continuation of investment advisory, administrative and service contracts, and other risks discussed from time to time in the Fund’s filings with the Securities and Exchange Commission. |
| 2 | MSCI EAFE Index is an unmanaged index of equities in the developed markets, excluding the U.S. and Canada. MSCI indexes are net of foreign withholding taxes. Source: MSCI. MSCI data may not be reproduced or used for any other purpose. MSCI provides no warranties, has not prepared or approved this report, and has no liability hereunder. Unless otherwise stated, index returns do not reflect the effect of any applicable sales charges, commissions, expenses, taxes or leverage, as applicable. It is not possible to invest directly in an index. |
| 3 | Returns are historical and are calculated by determining the percentage change in NAV with all distributions reinvested. Unless otherwise stated, performance does not reflect the deduction of taxes on Fund distributions or redemptions of Fund shares. |
| | Performance prior to the inception date of a class may be linked to the performance of an older class of the Fund. This linked performance is adjusted for any applicable sales charge, but is not adjusted for class expense differences. If adjusted for such differences, the performance would be different. The performance of Class R is linked to Investor Class and the performance of Class R6 is linked to Institutional Class. Performance since inception for an index, if presented, is the performance since the Fund’s or oldest share class’ inception, as applicable. Performance presented in the Financial Highlights included in the financial statements is not linked. |
| 4 | Source: Fund prospectus. Net expense ratio reflects a contractual expense reimbursement that continues through 5/31/18. Without the reimbursement, if applicable, performance would have been lower. The expense ratios for the current reporting period can be found in the Financial Highlights section of this report. |
| 5 | Excludes cash and cash equivalents. |
| 6 | Diversification cannot ensure a profit or eliminate the risk of loss. |
| | Fund profile subject to change due to active management. |
Parametric International Equity Fund
January 31, 2018
Fund Expenses
Example: As a Fund shareholder, you incur two types of costs: (1) transaction costs, including sales charges (loads) on purchases and redemption fees (if applicable); and (2) ongoing costs, including management fees; distribution and/or service fees; and other Fund expenses. This Example is intended to help you understand your ongoing costs (in dollars) of Fund investing and to compare these costs with the ongoing costs of investing in other mutual funds. The Example is based on an investment of $1,000 invested at the beginning of the period and held for the entire period (August 1, 2017 – January 31, 2018).
Actual Expenses: The first section of the table below provides information about actual account values and actual expenses. You may use the information in this section, together with the amount you invested, to estimate the expenses that you paid over the period. Simply divide your account value by $1,000 (for example, an $8,600 account value divided by $1,000 = 8.6), then multiply the result by the number in the first section under the heading entitled “Expenses Paid During Period” to estimate the expenses you paid on your account during this period.
Hypothetical Example for Comparison Purposes: The second section of the table below provides information about hypothetical account values and hypothetical expenses based on the actual Fund expense ratio and an assumed rate of return of 5% per year (before expenses), which is not the actual Fund return. The hypothetical account values and expenses may not be used to estimate the actual ending account balance or expenses you paid for the period. You may use this information to compare the ongoing costs of investing in your Fund and other funds. To do so, compare this 5% hypothetical example with the 5% hypothetical examples that appear in the shareholder reports of the other funds.
Please note that the expenses shown in the table are meant to highlight your ongoing costs only and do not reflect any transactional costs, such as sales charges (loads) or redemption fees (if applicable). Therefore, the second section of the table is useful in comparing ongoing costs only, and will not help you determine the relative total costs of owning different funds. In addition, if these transactional costs were included, your costs would be higher.
| | | | | | | | | | | | | | | | |
| | | Beginning
Account Value
(8/1/17) | | | Ending
Account Value
(1/31/18) | | | Expenses Paid
During Period*
(8/1/17 – 1/31/18) | | | Annualized Expense
Ratio | |
| | | | |
| | | | | | | | | | | | | | | | |
Actual | | | | | | | | | | | | | |
Investor Class | | $ | 1,000.00 | | | $ | 1,105.70 | | | $ | 3.98 | ** | | | 0.75 | % |
Institutional Class | | $ | 1,000.00 | | | $ | 1,107.20 | | | $ | 2.66 | ** | | | 0.50 | % |
Class R | | $ | 1,000.00 | | | $ | 1,104.20 | | | $ | 5.30 | ** | | | 1.00 | % |
Class R6 | | $ | 1,000.00 | | | $ | 1,107.00 | | | $ | 2.50 | ** | | | 0.47 | % |
| | | | | | | | | | | | | | | | | |
| | | | |
| | | | | | | | | | | | | | | | |
Hypothetical | | | | | | | | | | | | | |
(5% return per year before expenses) | | | | | | | | | | | | | |
Investor Class | | $ | 1,000.00 | | | $ | 1,021.40 | | | $ | 3.82 | ** | | | 0.75 | % |
Institutional Class | | $ | 1,000.00 | | | $ | 1,022.70 | | | $ | 2.55 | ** | | | 0.50 | % |
Class R | | $ | 1,000.00 | | | $ | 1,020.20 | | | $ | 5.09 | ** | | | 1.00 | % |
Class R6 | | $ | 1,000.00 | | | $ | 1,022.80 | | | $ | 2.40 | ** | | | 0.47 | % |
| * | Expenses are equal to the Fund’s annualized expense ratio for the indicated Class, multiplied by the average account value over the period, multiplied by 184/365 (to reflect the one-half year period). The Example assumes that the $1,000 was invested at the net asset value per share determined at the close of business on July 31, 2017. |
| ** | Absent an allocation of certain expenses to affiliates, the expenses would be higher. |
Parametric International Equity Fund
January 31, 2018
Portfolio of Investments
| | | | | | | | |
| Common Stocks — 99.2% | |
| | |
| | | | | | | | |
| Security | | Shares | | | Value | |
| | | | | | | | |
|
Australia — 9.0% | |
Adelaide Brighton, Ltd. | | | 13,200 | | | $ | 69,057 | |
AGL Energy, Ltd. | | | 58,765 | | | | 1,107,172 | |
Altium, Ltd. | | | 17,033 | | | | 208,834 | |
Alumina, Ltd. | | | 55,500 | | | | 107,322 | |
Amcor, Ltd. | | | 17,100 | | | | 199,953 | |
AMP, Ltd. | | | 36,161 | | | | 152,740 | |
ARB Corp., Ltd. | | | 5,909 | | | | 87,169 | |
Aristocrat Leisure, Ltd. | | | 24,710 | | | | 474,775 | |
Asx, Ltd. | | | 1,485 | | | | 65,343 | |
Atlassian Corp. PLC, Class A(1) | | | 10,100 | | | | 545,299 | |
Aurizon Holdings, Ltd. | | | 31,941 | | | | 120,163 | |
AusNet Services | | | 252,683 | | | | 344,873 | |
Australian Pharmaceutical Industries, Ltd. | | | 100,174 | | | | 120,674 | |
Automotive Holdings Group, Ltd. | | | 23,000 | | | | 66,220 | |
Bank of Queensland, Ltd. | | | 6,700 | | | | 66,742 | |
Beach Energy, Ltd. | | | 231,000 | | | | 241,764 | |
Bendigo & Adelaide Bank, Ltd. | | | 14,170 | | | | 133,480 | |
Blackmores, Ltd. | | | 1,718 | | | | 214,893 | |
BlueScope Steel, Ltd. | | | 10,995 | | | | 127,685 | |
Boral, Ltd. | | | 21,487 | | | | 138,067 | |
Brambles, Ltd. | | | 44,248 | | | | 351,890 | |
BWP Trust | | | 21,500 | | | | 51,871 | |
Caltex Australia, Ltd. | | | 14,550 | | | | 407,254 | |
carsales.com, Ltd. | | | 30,179 | | | | 364,538 | |
Charter Hall Retail REIT | | | 15,800 | | | | 48,724 | |
Cimic Group, Ltd. | | | 2,560 | | | | 97,212 | |
Class, Ltd. | | | 17,193 | | | | 41,368 | |
Cleanaway Waste Management, Ltd. | | | 110,518 | | | | 128,379 | |
Coca-Cola Amatil, Ltd. | | | 25,021 | | | | 168,889 | |
Cochlear, Ltd. | | | 3,328 | | | | 464,492 | |
Commonwealth Bank of Australia | | | 9,235 | | | | 585,922 | |
CSL, Ltd. | | | 14,560 | | | | 1,711,955 | |
CSR, Ltd. | | | 25,925 | | | | 104,982 | |
Dexus | | | 30,795 | | | | 236,392 | |
Domain Holdings Australia, Ltd.(1) | | | 33,200 | | | | 84,538 | |
DuluxGroup, Ltd. | | | 13,768 | | | | 80,859 | |
Elders, Ltd. | | | 17,500 | | | | 110,595 | |
Evolution Mining, Ltd. | | | 44,676 | | | | 102,902 | |
G8 Education, Ltd. | | | 22,000 | | | | 59,533 | |
Goodman Group | | | 44,165 | | | | 288,202 | |
GPT Group (The) | | | 68,630 | | | | 278,185 | |
GrainCorp, Ltd., Class A | | | 25,572 | | | | 152,439 | |
GUD Holdings, Ltd. | | | 8,300 | | | | 81,948 | |
GWA Group, Ltd. | | | 44,335 | | | | 100,552 | |
| | | | | | | | |
| Security | | Shares | | | Value | |
|
Australia (continued) | |
Hansen Technologies, Ltd. | | | 30,805 | | | $ | 94,287 | |
Harvey Norman Holdings, Ltd. | | | 27,935 | | | | 101,422 | |
Iluka Resources, Ltd. | | | 9,500 | | | | 77,100 | |
Incitec Pivot, Ltd. | | | 24,973 | | | | 74,751 | |
Insurance Australia Group, Ltd. | | | 20,689 | | | | 120,490 | |
Investa Office Fund | | | 35,475 | | | | 126,464 | |
InvoCare, Ltd. | | | 7,600 | | | | 93,123 | |
IOOF Holdings, Ltd. | | | 7,250 | | | | 64,344 | |
James Hardie Industries PLC CDI | | | 6,121 | | | | 107,114 | |
JB Hi-Fi, Ltd. | | | 10,075 | | | | 237,057 | |
Link Administration Holdings, Ltd. | | | 45,000 | | | | 323,508 | |
Macquarie Atlas Roads Group | | | 33,880 | | | | 156,748 | |
Medibank Pvt, Ltd. | | | 42,014 | | | | 113,135 | |
Metcash, Ltd. | | | 68,363 | | | | 176,303 | |
Mirvac Group | | | 126,845 | | | | 225,396 | |
National Australia Bank, Ltd. | | | 15,330 | | | | 359,135 | |
Navitas, Ltd. | | | 16,799 | | | | 63,516 | |
Newcrest Mining, Ltd. | | | 10,706 | | | | 195,794 | |
Oil Search, Ltd. | | | 69,256 | | | | 422,395 | |
Orica, Ltd. | | | 5,800 | | | | 89,459 | |
Orora, Ltd. | | | 42,869 | | | | 112,230 | |
Premier Investments, Ltd. | | | 7,193 | | | | 85,238 | |
Qantas Airways, Ltd. | | | 38,249 | | | | 162,096 | |
REA Group, Ltd. | | | 4,583 | | | | 272,260 | |
Reliance Worldwide Corp, Ltd. | | | 24,300 | | | | 83,326 | |
Rio Tinto, Ltd. | | | 5,296 | | | | 326,065 | |
Scentre Group | | | 133,091 | | | | 446,593 | |
Sims Metal Management, Ltd. | | | 5,711 | | | | 75,515 | |
South32, Ltd. | | | 79,639 | | | | 244,560 | |
Southern Cross Media Group, Ltd. | | | 51,672 | | | | 48,816 | |
Spark Infrastructure Group | | | 215,726 | | | | 401,938 | |
SpeedCast International, Ltd. | | | 46,511 | | | | 204,615 | |
Star Entertainment Group, Ltd. (The) | | | 38,085 | | | | 185,758 | |
Stockland | | | 71,106 | | | | 242,530 | |
Suncorp Group, Ltd. | | | 10,356 | | | | 113,876 | |
Super Retail Group, Ltd. | | | 18,050 | | | | 127,240 | |
Sydney Airport | | | 45,111 | | | | 247,542 | |
Tabcorp Holdings, Ltd. | | | 89,236 | | | | 371,467 | |
Technology One, Ltd. | | | 32,500 | | | | 128,662 | |
Telstra Corp., Ltd. | | | 346,742 | | | | 1,025,161 | |
Tox Free Solutions, Ltd. | | | 37,052 | | | | 101,725 | |
Transurban Group | | | 71,615 | | | | 693,340 | |
Treasury Wine Estates, Ltd. | | | 28,241 | | | | 389,009 | |
Vicinity Centres | | | 132,611 | | | | 288,282 | |
Village Roadshow, Ltd.(1) | | | 13,829 | | | | 39,145 | |
Washington H. Soul Pattinson & Co., Ltd. | | | 17,626 | | | | 244,426 | |
| | | | |
| | 7 | | See Notes to Financial Statements. |
Parametric International Equity Fund
January 31, 2018
Portfolio of Investments — continued
| | | | | | | | |
| Security | | Shares | | | Value | |
|
Australia (continued) | |
Webjet, Ltd. | | | 9,738 | | | $ | 80,094 | |
Wesfarmers, Ltd. | | | 30,491 | | | | 1,075,496 | |
Westpac Banking Corp. | | | 18,462 | | | | 459,980 | |
WiseTech Global, Ltd. | | | 13,825 | | | | 172,692 | |
Woodside Petroleum, Ltd. | | | 31,976 | | | | 853,725 | |
| | | | | | | | | |
| | | $ | 23,220,789 | |
| | | | | | | | | |
|
Austria — 1.1% | |
ams AG | | | 2,617 | | | $ | 241,824 | |
ANDRITZ AG | | | 2,354 | | | | 141,320 | |
AT&S Austria Technologie & Systemtechnik AG | | | 1,392 | | | | 44,399 | |
BUWOG AG | | | 5,424 | | | | 194,953 | |
CA Immobilien Anlagen AG | | | 4,051 | | | | 124,447 | |
DO & Co. AG | | | 1,870 | | | | 124,757 | |
Erste Group Bank AG | | | 4,915 | | | | 247,568 | |
EVN AG | | | 2,151 | | | | 44,060 | |
Lenzing AG | | | 409 | | | | 52,041 | |
Oesterreichische Post AG | | | 3,050 | | | | 145,269 | |
OMV AG | | | 5,153 | | | | 331,783 | |
Porr AG | | | 1,731 | | | | 59,737 | |
Rhi Magnesita NV(1) | | | 2,046 | | | | 132,237 | |
S IMMO AG | | | 2,800 | | | | 52,415 | |
S&T AG | | | 1,638 | | | | 45,049 | |
Telekom Austria AG | | | 19,133 | | | | 184,961 | |
UNIQA Insurance Group AG | | | 4,365 | | | | 53,764 | |
Verbund AG | | | 13,823 | | | | 383,374 | |
Vienna Insurance Group | | | 2,101 | | | | 74,549 | |
Wienerberger AG | | | 6,800 | | | | 185,556 | |
| | | | | | | | | |
| | | $ | 2,864,063 | |
| | | | | | | | | |
|
Belgium — 2.2% | |
Ackermans & van Haaren NV | | | 418 | | | $ | 77,903 | |
Aedifica SA | | | 3,049 | | | | 293,363 | |
Ageas | | | 2,473 | | | | 130,756 | |
AGFA-Gevaert NV(1) | | | 8,433 | | | | 42,336 | |
Anheuser-Busch InBev SA/NV | | | 6,652 | | | | 753,402 | |
Barco NV | | | 1,818 | | | | 224,228 | |
Bekaert SA | | | 2,430 | | | | 110,392 | |
Biocartis NV(1)(2) | | | 6,300 | | | | 113,569 | |
bpost SA | | | 11,153 | | | | 370,825 | |
Cofinimmo | | | 2,089 | | | | 280,948 | |
Colruyt SA | | | 750 | | | | 41,520 | |
Econocom Group SA/NV | | | 26,944 | | | | 224,908 | |
Elia System Operator SA/NV | | | 2,190 | | | | 134,584 | |
Euronav SA | | | 10,959 | | | | 93,347 | |
| | | | | | | | |
| Security | | Shares | | | Value | |
|
Belgium (continued) | |
Gimv NV | | | 1,583 | | | $ | 101,250 | |
Groupe Bruxelles Lambert SA | | | 1,360 | | | | 160,213 | |
Ion Beam Applications | | | 3,519 | | | | 107,539 | |
KBC Group NV | | | 1,609 | | | | 154,699 | |
Kinepolis Group NV | | | 1,796 | | | | 132,586 | |
Ontex Group NV | | | 977 | | | | 28,867 | |
Orange Belgium SA | | | 1,888 | | | | 39,893 | |
Proximus SA | | | 13,655 | | | | 460,499 | |
Retail Estates NV | | | 755 | | | | 69,316 | |
Sofina SA | | | 347 | | | | 60,494 | |
Solvay SA | | | 1,639 | | | | 237,318 | |
Telenet Group Holding NV(1) | | | 4,666 | | | | 358,951 | |
UCB SA | | | 4,872 | | | | 424,656 | |
Umicore SA | | | 6,674 | | | | 351,346 | |
Van de Velde NV | | | 1,568 | | | | 83,464 | |
| | | | | | | | | |
| | | $ | 5,663,172 | |
| | | | | | | | | |
|
Denmark — 2.2% | |
Alm Brand A/S | | | 4,100 | | | $ | 50,534 | |
Bakkafrost P/F | | | 2,234 | | | | 91,040 | |
Carlsberg A/S, Class B | | | 3,846 | | | | 494,360 | |
Chr. Hansen Holding A/S | | | 4,046 | | | | 353,504 | |
Coloplast A/S, Class B | | | 1,302 | | | | 115,750 | |
Danske Bank A/S | | | 12,233 | | | | 496,744 | |
Dfds A/S | | | 1,122 | | | | 67,325 | |
DSV A/S | | | 1,975 | | | | 162,384 | |
H Lundbeck AS | | | 1,459 | | | | 74,372 | |
ISS A/S | | | 1,926 | | | | 75,146 | |
Matas A/S | | | 4,212 | | | | 52,912 | |
Nets A/S(1)(2) | | | 9,300 | | | | 256,027 | |
Nilfisk Holding A/S(1) | | | 1,020 | | | | 59,170 | |
NKT A/S(1) | | | 809 | | | | 35,273 | |
Novo Nordisk A/S, Class B | | | 10,335 | | | | 573,575 | |
Novozymes A/S, Class B | | | 6,973 | | | | 386,827 | |
Orsted A/S(2) | | | 11,758 | | | | 713,750 | |
Pandora A/S | | | 6,625 | | | | 627,818 | |
Ringkjoebing Landbobank A/S | | | 795 | | | | 43,832 | |
Rockwool International A/S | | | 246 | | | | 68,717 | |
Royal Unibrew A/S | | | 2,936 | | | | 178,428 | |
TDC A/S | | | 55,343 | | | | 369,392 | |
Topdanmark A/S(1) | | | 2,527 | | | | 120,724 | |
Vestas Wind Systems A/S | | | 2,869 | | | | 195,689 | |
William Demant Holding A/S(1) | | | 1,895 | | | | 59,925 | |
| | | | | | | | | |
| | | $ | 5,723,218 | |
| | | | | | | | | |
| | | | |
| | 8 | | See Notes to Financial Statements. |
Parametric International Equity Fund
January 31, 2018
Portfolio of Investments — continued
| | | | | | | | |
| Security | | Shares | | | Value | |
|
Finland — 2.3% | |
Amer Sports Oyj | | | 8,339 | | | $ | 235,422 | |
Caverion OYJ(1) | | | 4,767 | | | | 40,186 | |
Citycon Oyj | | | 50,397 | | | | 139,906 | |
Cramo Oyj | | | 3,655 | | | | 89,169 | |
DNA Oyj | | | 6,160 | | | | 115,547 | |
Elisa Oyj | | | 9,357 | | | | 398,265 | |
Ferratum Oyj | | | 2,041 | | | | 76,044 | |
Fortum Oyj | | | 26,787 | | | | 580,894 | |
Huhtamaki Oyj | | | 1,924 | | | | 82,134 | |
Kemira Oyj | | | 3,783 | | | | 53,555 | |
Kesko Oyj, Class B | | | 7,618 | | | | 444,320 | |
Kone Oyj, Class B | | | 4,394 | | | | 251,536 | |
Metsa Board Oyj | | | 9,623 | | | | 87,552 | |
Neste Oyj | | | 9,906 | | | | 685,586 | |
Nokia Oyj | | | 93,952 | | | | 453,182 | |
Nokian Renkaat Oyj | | | 4,149 | | | | 209,619 | |
Oriola Oyj, Series B | | | 21,185 | | | | 75,390 | |
Orion Oyj, Class B | | | 11,915 | | | | 477,960 | |
Raisio Oyj, Class V | | | 9,946 | | | | 55,131 | |
Sampo Oyj, Class A | | | 8,646 | | | | 502,314 | |
Technopolis Oyj | | | 15,622 | | | | 78,687 | |
Tieto Oyj | | | 2,033 | | | | 70,668 | |
Tokmanni Group Corp. | | | 7,975 | | | | 74,758 | |
UPM-Kymmene Oyj | | | 10,178 | | | | 343,187 | |
Uponor Oyj | | | 4,213 | | | | 89,181 | |
Valmet Oyj | | | 3,811 | | | | 85,510 | |
| | | | | | | | | |
| | | $ | 5,795,703 | |
| | | | | | | | | |
|
France — 8.8% | |
Aeroports de Paris | | | 489 | | | $ | 101,561 | |
Air Liquide SA | | | 15,495 | | | | 2,089,436 | |
Airbus SE | | | 3,305 | | | | 380,070 | |
Alstom SA | | | 2,298 | | | | 100,801 | |
Alten SA | | | 1,710 | | | | 173,113 | |
Altran Technologies SA | | | 7,912 | | | | 147,204 | |
Amundi SA(2) | | | 1,276 | | | | 120,402 | |
Atos SE | | | 2,791 | | | | 440,158 | |
AXA SA | | | 18,417 | | | | 605,688 | |
BioMerieux | | | 780 | | | | 73,847 | |
BNP Paribas SA | | | 10,149 | | | | 838,244 | |
Bollore SA | | | 11,284 | | | | 65,511 | |
Bouygues SA | | | 2,581 | | | | 143,448 | |
Bureau Veritas SA | | | 4,718 | | | | 138,252 | |
CNP Assurances | | | 5,800 | | | | 148,653 | |
Danone SA | | | 11,316 | | | | 973,928 | |
Dassault Systemes SE | | | 4,173 | | | | 481,075 | |
| | | | | | | | |
| Security | | Shares | | | Value | |
|
France (continued) | |
Eiffage SA | | | 672 | | | $ | 81,470 | |
Elior Group SA(2) | | | 3,613 | | | | 83,156 | |
Engie SA | | | 57,248 | | | | 994,059 | |
Essilor International Cie Generale d’Optique SA | | | 2,822 | | | | 400,624 | |
Euler Hermes Group | | | 672 | | | | 101,724 | |
Eurazeo SA | | | 460 | | | | 48,427 | |
Eutelsat Communications SA | | | 5,093 | | | | 112,096 | |
Fnac Darty SA(1) | | | 617 | | | | 71,970 | |
Gecina SA | | | 1,819 | | | | 355,430 | |
Getlink SE | | | 4,517 | | | | 63,346 | |
Hermes International | | | 349 | | | | 192,910 | |
ICADE | | | 2,907 | | | | 315,263 | |
Iliad SA | | | 2,351 | | | | 608,268 | |
Ingenico Group SA | | | 1,627 | | | | 185,192 | |
Kering | | | 624 | | | | 316,085 | |
Korian SA | | | 2,511 | | | | 80,842 | |
L’Oreal SA | | | 4,819 | | | | 1,095,139 | |
Lagardere SCA | | | 3,693 | | | | 115,175 | |
Legrand SA | | | 2,162 | | | | 179,874 | |
LVMH Moet Hennessy Louis Vuitton SE | | | 1,956 | | | | 612,719 | |
Mercialys SA | | | 6,623 | | | | 150,531 | |
Nexity SA | | | 4,423 | | | | 266,514 | |
Orange SA | | | 83,127 | | | | 1,502,078 | |
Orpea | | | 1,348 | | | | 168,239 | |
Publicis Groupe SA | | | 1,902 | | | | 131,442 | |
Rubis SCA | | | 3,910 | | | | 288,368 | |
Safran SA | | | 2,043 | | | | 230,821 | |
Sanofi | | | 14,239 | | | | 1,256,614 | |
Sartorius Stedim Biotech | | | 786 | | | | 68,087 | |
SCOR SE | | | 2,300 | | | | 102,944 | |
SEB SA | | | 492 | | | | 101,648 | |
Societe BIC SA | | | 456 | | | | 52,219 | |
Sodexo SA | | | 863 | | | | 110,621 | |
SOITEC(1) | | | 1,589 | | | | 130,343 | |
Sopra Steria Group | | | 819 | | | | 166,212 | |
Suez | | | 14,012 | | | | 208,870 | |
Teleperformance | | | 618 | | | | 93,660 | |
Thales SA | | | 1,146 | | | | 128,459 | |
Total SA | | | 33,738 | | | | 1,956,127 | |
Ubisoft Entertainment SA(1) | | | 2,315 | | | | 198,126 | |
Unibail-Rodamco SE | | | 3,794 | | | | 973,177 | |
Veolia Environnement SA | | | 19,808 | | | | 499,332 | |
Vinci SA | | | 3,092 | | | | 334,180 | |
Vivendi SA | | | 6,567 | | | | 192,410 | |
Wendel SA | | | 602 | | | | 112,247 | |
Worldline SA(1)(2) | | | 2,397 | | | | 135,514 | |
| | | | | | | | | |
| | | $ | 22,593,943 | |
| | | | | | | | | |
| | | | |
| | 9 | | See Notes to Financial Statements. |
Parametric International Equity Fund
January 31, 2018
Portfolio of Investments — continued
| | | | | | | | |
| Security | | Shares | | | Value | |
|
Germany — 8.8% | |
1&1 Drillisch AG | | | 1,305 | | | $ | 108,555 | |
adidas AG | | | 1,442 | | | | 335,085 | |
ADO Properties SA(2) | | | 4,405 | | | | 237,353 | |
Allianz SE | | | 4,074 | | | | 1,030,421 | |
alstria office REIT AG | | | 16,144 | | | | 254,934 | |
AURELIUS Equity Opportunities SE & Co. KGaA | | | 1,200 | | | | 88,170 | |
Aurubis AG | | | 1,067 | | | | 112,124 | |
Axel Springer SE | | | 773 | | | | 67,929 | |
BASF SE | | | 9,480 | | | | 1,111,793 | |
Bayer AG | | | 9,834 | | | | 1,288,621 | |
Bayerische Motoren Werke AG, PFC Shares | | | 1,536 | | | | 150,131 | |
Bechtle AG | | | 2,306 | | | | 210,314 | |
Beiersdorf AG | | | 3,580 | | | | 424,463 | |
Brenntag AG | | | 1,852 | | | | 120,228 | |
CANCOM SE | | | 1,114 | | | | 105,248 | |
Capital Stage AG | | | 18,946 | | | | 163,137 | |
Continental AG | | | 968 | | | | 290,795 | |
Covestro AG(2) | | | 1,700 | | | | 195,755 | |
Daimler AG | | | 7,929 | | | | 726,191 | |
Delivery Hero AG(1)(2) | | | 2,000 | | | | 85,896 | |
Deutsche Boerse AG | | | 2,447 | | | | 314,479 | |
Deutsche Lufthansa AG | | | 2,062 | | | | 73,660 | |
Deutsche Pfandbriefbank AG(2) | | | 4,793 | | | | 88,592 | |
Deutsche Post AG | | | 8,239 | | | | 389,164 | |
Deutsche Telekom AG | | | 103,156 | | | | 1,809,359 | |
Deutsche Wohnen SE, Bearer Shares | | | 16,314 | | | | 737,646 | |
E.ON SE | | | 109,140 | | | | 1,147,178 | |
Evonik Industries AG | | | 2,553 | | | | 100,883 | |
Fielmann AG | | | 567 | | | | 49,646 | |
Fraport AG | | | 716 | | | | 84,773 | |
Freenet AG | | | 4,137 | | | | 158,638 | |
Fresenius Medical Care AG & Co. KGaA | | | 2,362 | | | | 272,248 | |
Fresenius SE & Co. KGaA | | | 5,187 | | | | 454,000 | |
Fuchs Petrolub SE, PFC Shares | | | 1,895 | | | | 103,729 | |
GEA Group AG | | | 2,527 | | | | 125,686 | |
Gerresheimer AG | | | 913 | | | | 79,746 | |
Grand City Properties SA | | | 12,766 | | | | 310,726 | |
GRENKE AG | | | 857 | | | | 102,206 | |
Hannover Rueck SE | | | 1,092 | | | | 149,346 | |
Hella GmbH & Co. KGaA | | | 898 | | | | 63,994 | |
Henkel AG & Co. KGaA | | | 4,580 | | | | 573,300 | |
Henkel AG & Co. KGaA, PFC Shares | | | 7,797 | | | | 1,090,370 | |
Hochtief AG | | | 363 | | | | 65,646 | |
Hugo Boss AG | | | 1,223 | | | | 112,324 | |
Innogy SE(2) | | | 7,900 | | | | 301,171 | |
KION Group AG | | | 994 | | | | 91,363 | |
| | | | | | | | |
| Security | | Shares | | | Value | |
|
Germany (continued) | |
KWS Saat SE | | | 383 | | | $ | 161,689 | |
LEG Immobilien AG | | | 3,814 | | | | 430,432 | |
Linde AG | | | 1,381 | | | | 315,088 | |
Linde AG, Tendered Shares(1) | | | 772 | | | | 189,566 | |
MAN SE | | | 587 | | | | 69,839 | |
Merck KGaA | | | 1,900 | | | | 207,972 | |
MTU Aero Engines AG | | | 567 | | | | 101,645 | |
Muenchener Rueckversicherungs-Gesellschaft AG | | | 1,785 | | | | 419,951 | |
Osram Licht AG | | | 742 | | | | 64,849 | |
ProSiebenSat.1 Media SE | | | 3,293 | | | | 126,154 | |
Rational AG | | | 114 | | | | 80,190 | |
RWE AG, PFC Shares | | | 10,176 | | | | 177,976 | |
SAP SE | | | 11,135 | | | | 1,259,820 | |
Siemens AG | | | 5,978 | | | | 907,485 | |
Software AG | | | 2,606 | | | | 141,446 | |
Symrise AG | | | 1,730 | | | | 144,977 | |
Talanx AG | | | 1,940 | | | | 85,892 | |
Telefonica Deutschland Holding AG(2) | | | 22,223 | | | | 112,334 | |
TLG Immobilien AG | | | 9,950 | | | | 280,177 | |
TUI AG | | | 5,129 | | | | 115,958 | |
Uniper SE | | | 12,515 | | | | 373,611 | |
United Internet AG | | | 1,626 | | | | 118,634 | |
VERBIO Vereinigte BioEnergie AG | | | 4,576 | | | | 41,829 | |
Volkswagen AG | | | 452 | | | | 100,282 | |
Wirecard AG | | | 2,394 | | | | 298,481 | |
Zalando SE(1)(2) | | | 3,599 | | | | 210,945 | |
| | | | | | | | | |
| | | $ | 22,494,238 | |
| | | | | | | | | |
|
Hong Kong — 4.5% | |
AIA Group, Ltd. | | | 107,400 | | | $ | 917,357 | |
ASM Pacific Technology, Ltd. | | | 19,100 | | | | 260,152 | |
Beijing Gas Blue Sky Holdings, Ltd.(1) | | | 1,400,000 | | | | 105,577 | |
Beijing Tong Ren Tang Chinese Medicine Co., Ltd. | | | 38,000 | | | | 56,962 | |
BOC Hong Kong (Holdings), Ltd. | | | 31,500 | | | | 160,652 | |
Brightoil Petroleum Holdings, Ltd.(1)(3) | | | 262,000 | | | | 25,119 | |
Cafe de Coral Holdings, Ltd. | | | 18,000 | | | | 47,619 | |
Canvest Environmental Protection Group Co., Ltd. | | | 100,000 | | | | 57,910 | |
China Cord Blood Corp.(1) | | | 15,000 | | | | 156,150 | |
China Goldjoy Group, Ltd. | | | 996,000 | | | | 88,843 | |
China Innovationpay Group, Ltd.(1) | | | 1,120,000 | | | | 55,723 | |
China Regenerative Medicine International, Ltd.(1) | | | 3,140,000 | | | | 72,793 | |
Chow Tai Fook Jewellery Group, Ltd. | | | 78,600 | | | | 87,974 | |
CK Asset Holdings, Ltd. | | | 33,500 | | | | 318,772 | |
CK Infrastructure Holdings, Ltd. | | | 35,500 | | | | 315,929 | |
CLP Holdings, Ltd. | | | 66,500 | | | | 677,536 | |
Esprit Holdings, Ltd.(1) | | | 121,300 | | | | 48,808 | |
| | | | |
| | 10 | | See Notes to Financial Statements. |
Parametric International Equity Fund
January 31, 2018
Portfolio of Investments — continued
| | | | | | | | |
| Security | | Shares | | | Value | |
|
Hong Kong (continued) | |
First Pacific Co., Ltd. | | | 108,000 | | | $ | 77,028 | |
Fortune REIT | | | 70,000 | | | | 87,875 | |
Future World Financial Holdings, Ltd.(1) | | | 1,996,000 | | | | 62,476 | |
G-Resources Group, Ltd.(1) | | | 5,688,000 | | | | 69,593 | |
Hang Lung Group, Ltd. | | | 21,000 | | | | 79,710 | |
Hang Seng Bank, Ltd. | | | 6,700 | | | | 159,188 | |
HC International, Inc. | | | 134,000 | | | | 100,334 | |
Henderson Land Development Co., Ltd. | | | 18,320 | | | | 127,848 | |
HK Electric Investments & HK Electric Investments, Ltd.(2) | | | 145,500 | | | | 134,352 | |
HKBN, Ltd. | | | 105,000 | | | | 132,151 | |
HKT Trust and HKT, Ltd. | | | 339,000 | | | | 423,952 | |
Honbridge Holdings, Ltd.(1) | | | 640,000 | | | | 135,190 | |
Hong Kong & China Gas Co., Ltd. | | | 281,100 | | | | 555,209 | |
Hong Kong Exchanges and Clearing, Ltd. | | | 10,900 | | | | 411,210 | |
Hongkong Land Holdings, Ltd. | | | 23,200 | | | | 167,071 | |
Hopewell Highway Infrastructure, Ltd. | | | 120,000 | | | | 73,577 | |
Hysan Development Co., Ltd. | | | 18,000 | | | | 100,430 | |
Jardine Matheson Holdings, Ltd. | | | 9,000 | | | | 571,281 | |
Jardine Strategic Holdings, Ltd. | | | 7,900 | | | | 314,282 | |
Johnson Electric Holdings, Ltd. | | | 38,000 | | | | 155,060 | |
Kerry Logistics Network, Ltd. | | | 37,000 | | | | 53,234 | |
Kerry Properties, Ltd. | | | 26,500 | | | | 126,733 | |
KuangChi Science, Ltd.(1) | | | 301,000 | | | | 86,876 | |
Landing International Development, Ltd.(1) | | | 6,370,000 | | | | 283,556 | |
Lee’s Pharmaceutical Holdings, Ltd. | | | 53,000 | | | | 88,161 | |
Li & Fung, Ltd. | | | 266,000 | | | | 135,508 | |
Link REIT | | | 25,000 | | | | 221,261 | |
Macau Legend Development, Ltd.(1) | | | 273,000 | | | | 43,136 | |
Madison Holdings Group, Ltd.(1) | | | 192,000 | | | | 36,464 | |
Man Wah Holdings, Ltd. | | | 68,800 | | | | 73,178 | |
Melco International Development, Ltd. | | | 36,000 | | | | 107,777 | |
MGM China Holdings, Ltd. | | | 31,600 | | | | 97,164 | |
MTR Corp., Ltd. | | | 47,500 | | | | 271,656 | |
New World Development Co., Ltd. | | | 69,000 | | | | 111,226 | |
Nexteer Automotive Group, Ltd. | | | 48,000 | | | | 102,207 | |
NWS Holdings, Ltd. | | | 91,000 | | | | 176,871 | |
Pacific Textiles Holdings, Ltd. | | | 81,000 | | | | 84,923 | |
RM Group Holdings, Ltd.(1) | | | 720,000 | | | | 121,493 | |
Sands China, Ltd. | | | 35,600 | | | | 211,559 | |
Shangri-La Asia, Ltd. | | | 50,000 | | | | 126,779 | |
Sino Land Co., Ltd. | | | 70,000 | | | | 129,103 | |
SJM Holdings, Ltd. | | | 111,000 | | | | 110,689 | |
Stella International Holdings, Ltd. | | | 23,000 | | | | 33,317 | |
Superb Summit International Group, Ltd.(1)(3) | | | 230,000 | | | | 0 | |
Swire Pacific, Ltd., Class A | | | 9,500 | | | | 94,820 | |
Swire Properties, Ltd. | | | 25,400 | | | | 88,923 | |
| | | | | | | | |
| Security | | Shares | | | Value | |
|
Hong Kong (continued) | |
Techtronic Industries Co., Ltd. | | | 43,500 | | | $ | 289,843 | |
Television Broadcasts, Ltd. | | | 13,800 | | | | 49,238 | |
Texwinca Holdings, Ltd. | | | 70,000 | | | | 38,292 | |
Town Health International Medical Group, Ltd.(3) | | | 604,000 | | | | 42,621 | |
Vitasoy International Holdings, Ltd. | | | 96,000 | | | | 245,462 | |
VTech Holdings, Ltd. | | | 14,500 | | | | 200,013 | |
Wharf Real Estate Investment Co., Ltd.(1) | | | 15,000 | | | | 103,641 | |
Yue Yuen Industrial Holdings, Ltd. | | | 21,500 | | | | 97,164 | |
| | | | | | | | | |
| | | $ | 11,474,581 | |
| | | | | | | | | |
|
Ireland — 2.2% | |
Bank of Ireland Group PLC(1) | | | 85,370 | | | $ | 833,598 | |
C&C Group PLC | | | 23,800 | | | | 89,160 | |
Cairn Homes PLC(1) | | | 59,850 | | | | 141,003 | |
CRH PLC | | | 18,510 | | | | 687,428 | |
DCC PLC | | | 4,921 | | | | 517,231 | |
Grafton Group PLC | | | 33,399 | | | | 374,900 | |
Greencore Group PLC | | | 42,726 | | | | 118,018 | |
Hibernia REIT PLC | | | 202,785 | | | | 386,449 | |
ICON PLC(1) | | | 5,330 | | | | 583,741 | |
Irish Residential Properties REIT PLC | | | 93,395 | | | | 173,832 | |
Kerry Group PLC, Class A | | | 6,123 | | | | 652,468 | |
Paddy Power Betfair PLC | | | 6,261 | | | | 726,593 | |
Smurfit Kappa Group PLC | | | 4,388 | | | | 153,992 | |
UDG Healthcare PLC | | | 25,978 | | | | 302,600 | |
| | | | | | | | | |
| | | $ | 5,741,013 | |
| | | | | | | | | |
|
Israel — 2.3% | |
ADO Group, Ltd.(1) | | | 2,500 | | | $ | 49,832 | |
Amot Investments, Ltd. | | | 22,481 | | | | 134,357 | |
Azrieli Group, Ltd. | | | 2,874 | | | | 156,425 | |
Bank Hapoalim B.M. | | | 24,638 | | | | 184,075 | |
Bayside Land Corp. | | | 83 | | | | 41,726 | |
Bezeq The Israeli Telecommunication Corp., Ltd. | | | 347,644 | | | | 572,998 | |
Brack Capital Properties NV(1) | | | 537 | | | | 63,690 | |
Check Point Software Technologies, Ltd.(1) | | | 3,250 | | | | 336,082 | |
Delek Automotive Systems, Ltd. | | | 13,963 | | | | 108,432 | |
Delta-Galil Industries, Ltd. | | | 1,119 | | | | 39,586 | |
El Al Israel Airlines | | | 154,187 | | | | 63,545 | |
Elbit Systems, Ltd. | | | 2,388 | | | | 360,676 | |
Electra, Ltd. | | | 291 | | | | 77,693 | |
First International Bank of Israel, Ltd. | | | 4,135 | | | | 93,290 | |
Frutarom Industries, Ltd. | | | 5,892 | | | | 614,219 | |
IDI Insurance Co., Ltd. | | | 672 | | | | 48,572 | |
Inrom Construction Industries, Ltd. | | | 18,751 | | | | 92,818 | |
| | | | |
| | 11 | | See Notes to Financial Statements. |
Parametric International Equity Fund
January 31, 2018
Portfolio of Investments — continued
| | | | | | | | |
| Security | | Shares | | | Value | |
|
Israel (continued) | |
Israel Discount Bank, Ltd., Series A(1) | | | 46,000 | | | $ | 137,603 | |
Jerusalem Oil Exploration(1) | | | 1,706 | | | | 105,752 | |
Kenon Holdings, Ltd.(1) | | | 3,095 | | | | 92,464 | |
Melisron, Ltd. | | | 1,766 | | | | 78,956 | |
Mizrahi Tefahot Bank, Ltd. | | | 7,050 | | | | 137,215 | |
Nice, Ltd. | | | 1,437 | | | | 130,820 | |
Nova Measuring Instruments, Ltd.(1) | | | 2,500 | | | | 68,000 | |
Oil Refineries, Ltd. | | | 389,192 | | | | 184,332 | |
Orbotech, Ltd.(1) | | | 1,735 | | | | 92,406 | |
Paz Oil Co., Ltd. | | | 1,888 | | | | 325,226 | |
Rami Levi Chain Stores Hashikma Marketing 2006, Ltd. | | | 2,600 | | | | 152,413 | |
Reit 1, Ltd. | | | 19,864 | | | | 90,466 | |
Shufersal, Ltd. | | | 34,218 | | | | 246,337 | |
SodaStream International, Ltd.(1) | | | 5,100 | | | | 401,013 | |
Teva Pharmaceutical Industries, Ltd. ADR | | | 28,370 | | | | 579,032 | |
Tower Semiconductor, Ltd.(1) | | | 1 | | | | 29 | |
| | | | | | | | | |
| | | $ | 5,860,080 | |
| | | | | | | | | |
|
Italy — 4.4% | |
Amplifon SpA | | | 18,720 | | | $ | 332,895 | |
Anima Holding SpA(2) | | | 11,048 | | | | 92,694 | |
Ansaldo STS SpA(1) | | | 6,279 | | | | 95,082 | |
Assicurazioni Generali SpA | | | 10,926 | | | | 216,762 | |
ASTM SpA | | | 2,449 | | | | 66,497 | |
Atlantia SpA | | | 11,722 | | | | 387,994 | |
Autogrill SpA | | | 4,891 | | | | 68,105 | |
Banca Mediolanum SpA | | | 7,021 | | | | 68,880 | |
Banca Popolare di Sondrio SCPA | | | 17,850 | | | | 72,102 | |
Beni Stabili SpA SIIQ | | | 132,963 | | | | 123,177 | |
Brembo SpA | | | 4,505 | | | | 72,757 | |
Buzzi Unicem SpA | | | 1,362 | | | | 39,990 | |
Cementir Holding SpA | | | 30,224 | | | | 283,715 | |
Cerved Information Solutions SpA | | | 2,550 | | | | 35,962 | |
Danieli & C Officine Meccaniche SpA, PFC Shares | | | 3,048 | | | | 60,303 | |
Davide Campari-Milano SpA | | | 50,493 | | | | 402,183 | |
De’Longhi SpA | | | 1,326 | | | | 44,608 | |
Ei Towers SpA | | | 8,167 | | | | 499,043 | |
Enav SpA(2) | | | 13,855 | | | | 72,513 | |
Enel SpA | | | 134,561 | | | | 855,457 | |
ENI SpA | | | 49,309 | | | | 887,671 | |
ERG SpA | | | 5,150 | | | | 106,728 | |
EXOR NV | | | 1,123 | | | | 86,815 | |
Ferrari NV(4) | | | 400 | | | | 47,800 | |
Ferrari NV(4) | | | 2,400 | | | | 286,340 | |
FinecoBank Banca Fineco SpA | | | 4,180 | | | | 51,970 | |
Hera SpA | | | 14,846 | | | | 54,262 | |
| | | | | | | | |
| Security | | Shares | | | Value | |
|
Italy (continued) | |
Industria Macchine Automatiche SpA | | | 1,000 | | | $ | 87,508 | |
Infrastrutture Wireless Italiane SpA(2) | | | 90,346 | | | | 652,927 | |
International Game Technology PLC | | | 2,666 | | | | 77,501 | |
Interpump Group SpA | | | 2,600 | | | | 93,735 | |
Intesa Sanpaolo SpA | | | 112,599 | | | | 442,417 | |
Intesa Sanpaolo SpA, PFC Shares | | | 26,600 | | | | 101,533 | |
Iren SPA | | | 22,040 | | | | 71,316 | |
Italgas SpA | | | 13,643 | | | | 84,295 | |
Leonardo SpA | | | 13,286 | | | | 160,357 | |
Luxottica Group SpA | | | 3,446 | | | | 221,574 | |
MARR SpA | | | 2,736 | | | | 75,680 | |
Mediaset SpA(1) | | | 17,964 | | | | 71,502 | |
Moncler SpA | | | 4,402 | | | | 145,069 | |
OVS SpA(2) | | | 7,513 | | | | 55,650 | |
Parmalat SpA | | | 31,548 | | | | 122,480 | |
Poste Italiane SpA(2) | | | 12,640 | | | | 104,599 | |
Prada SpA | | | 18,400 | | | | 75,384 | |
Prysmian SpA | | | 4,968 | | | | 174,767 | |
Recordati SpA | | | 12,842 | | | | 584,804 | |
Reply SpA | | | 2,652 | | | | 172,280 | |
Retelit SpA(1) | | | 57,000 | | | | 128,180 | |
Salvatore Ferragamo SpA | | | 1,935 | | | | 54,508 | |
Saras SpA | | | 30,643 | | | | 66,942 | |
Snam SpA | | | 43,650 | | | | 212,325 | |
Societa Iniziative Autostradali e Servizi SpA | | | 2,769 | | | | 52,144 | |
STMicroelectronics NV | | | 50,109 | | | | 1,197,887 | |
Tenaris SA | | | 8,771 | | | | 153,208 | |
Terna Rete Elettrica Nazionale SpA | | | 25,640 | | | | 154,461 | |
Tod’s SpA | | | 613 | | | | 46,192 | |
Unipol Gruppo SpA | | | 15,281 | | | | 84,296 | |
UnipolSai Assicurazioni SpA | | | 28,030 | | | | 72,471 | |
Yoox Net-A-Porter Group SpA(1) | | | 2,038 | | | | 95,724 | |
| | | | | | | | | |
| | | $ | 11,306,021 | |
| | | | | | | | | |
|
Japan — 13.3% | |
Activia Properties, Inc. | | | 43 | | | $ | 191,623 | |
Advance Residence Investment Corp. | | | 88 | | | | 225,603 | |
Air Water, Inc. | | | 6,900 | | | | 148,066 | |
Aisin Seiki Co., Ltd. | | | 2,800 | | | | 163,888 | |
Ajinomoto Co., Inc. | | | 7,400 | | | | 140,762 | |
Asahi Group Holdings, Ltd. | | | 5,500 | | | | 277,874 | |
Asahi Kasei Corp. | | | 19,000 | | | | 249,280 | |
Astellas Pharma, Inc. | | | 24,800 | | | | 326,150 | |
Bandai Namco Holdings, Inc. | | | 4,000 | | | | 130,902 | |
Bridgestone Corp. | | | 4,200 | | | | 204,985 | |
Calbee, Inc. | | | 3,300 | | | | 116,595 | |
| | | | |
| | 12 | | See Notes to Financial Statements. |
Parametric International Equity Fund
January 31, 2018
Portfolio of Investments — continued
| | | | | | | | |
| Security | | Shares | | | Value | |
|
Japan (continued) | |
Canon, Inc. | | | 7,200 | | | $ | 287,280 | |
Central Japan Railway Co. | | | 1,100 | | | | 208,957 | |
Chiba Bank, Ltd. (The) | | | 10,000 | | | | 87,057 | |
Chugai Pharmaceutical Co., Ltd. | | | 3,600 | | | | 190,268 | |
Chugoku Bank, Ltd. (The) | | | 4,200 | | | | 55,362 | |
Chugoku Electric Power Co., Inc. (The) | | | 12,600 | | | | 139,580 | |
Citizen Watch Co., Ltd. | | | 12,000 | | | | 92,200 | |
Coca-Cola Bottlers Japan Holdings, Inc. | | | 3,200 | | | | 113,364 | |
Concordia Financial Group, Ltd. | | | 12,500 | | | | 76,221 | |
Cosmo Energy Holdings Co., Ltd. | | | 2,500 | | | | 98,429 | |
Dai Nippon Printing Co., Ltd. | | | 3,000 | | | | 67,084 | |
Daicel Corp. | | | 9,200 | | | | 111,873 | |
Daido Steel Co., Ltd. | | | 1,200 | | | | 70,982 | |
Daikin Industries, Ltd. | | | 1,300 | | | | 156,859 | |
Daito Trust Construction Co., Ltd. | | | 1,600 | | | | 280,422 | |
Daiwa House Industry Co., Ltd. | | | 11,100 | | | | 439,655 | |
Daiwa House REIT Investment Corp. | | | 92 | | | | 226,151 | |
Daiwa Securities Group, Inc. | | | 14,000 | | | | 100,779 | |
DeNA Co., Ltd. | | | 2,800 | | | | 60,813 | |
Denka Co., Ltd. | | | 2,400 | | | | 95,924 | |
Denso Corp. | | | 3,500 | | | | 220,030 | |
Dentsu, Inc. | | | 2,100 | | | | 94,226 | |
Disco Corp. | | | 300 | | | | 70,751 | |
East Japan Railway Co. | | | 1,600 | | | | 159,704 | |
Eisai Co., Ltd. | | | 4,000 | | | | 227,644 | |
Ezaki Glico Co., Ltd. | | | 2,200 | | | | 112,265 | |
FamilyMart UNY Holdings Co., Ltd. | | | 1,800 | | | | 121,058 | |
FANUC Corp. | | | 800 | | | | 217,135 | |
Fast Retailing Co., Ltd. | | | 500 | | | | 223,792 | |
FUJIFILM Holdings Corp. | | | 4,000 | | | | 154,188 | |
Fukuoka Financial Group, Inc. | | | 19,000 | | | | 110,558 | |
GLP J-Reit | | | 123 | | | | 142,588 | |
Hachijuni Bank, Ltd. (The) | | | 13,400 | | | | 79,679 | |
Hankyu Hanshin Holdings, Inc. | | | 2,700 | | | | 109,084 | |
Hirose Electric Co., Ltd. | | | 800 | | | | 120,455 | |
Hiroshima Bank, Ltd. (The) | | | 9,500 | | | | 79,846 | |
Hisamitsu Pharmaceutical Co., Inc. | | | 2,700 | | | | 185,048 | |
Hokkaido Electric Power Co., Inc. | | | 16,300 | | | | 106,317 | |
Hokuhoku Financial Group, Inc. | | | 4,000 | | | | 60,162 | |
Hokuriku Electric Power Co. | | | 14,300 | | | | 117,021 | |
Hulic Co., Ltd. | | | 10,000 | | | | 127,135 | |
Idemitsu Kosan Co., Ltd. | | | 7,100 | | | | 266,524 | |
ITOCHU Corp. | | | 8,400 | | | | 165,284 | |
Iyo Bank, Ltd. (The) | | | 9,200 | | | | 75,959 | |
Japan Airlines Co., Ltd. | | | 2,000 | | | | 75,575 | |
Japan Exchange Group, Inc. | | | 7,500 | | | | 135,433 | |
| | | | | | | | |
| Security | | Shares | | | Value | |
|
Japan (continued) | |
Japan Hotel REIT Investment Corp. | | | 191 | | | $ | 141,699 | |
Japan Post Holdings Co., Ltd. | | | 8,000 | | | | 95,634 | |
Japan Prime Realty Investment Corp. | | | 62 | | | | 219,155 | |
Japan Real Estate Investment Corp. | | | 34 | | | | 174,839 | |
Japan Retail Fund Investment Corp. | | | 95 | | | | 189,617 | |
Japan Tobacco, Inc. | | | 10,400 | | | | 344,654 | |
JSR Corp. | | | 6,500 | | | | 154,506 | |
JXTG Holdings, Inc. | | | 110,500 | | | | 735,665 | |
Kajima Corp. | | | 9,000 | | | | 89,353 | |
Kakaku.com, Inc. | | | 3,700 | | | | 65,007 | |
Kaneka Corp. | | | 9,000 | | | | 83,777 | |
Kansai Electric Power Co., Inc. (The) | | | 27,800 | | | | 346,408 | |
Kansai Paint Co., Ltd. | | | 2,900 | | | | 71,731 | |
Kao Corp. | | | 4,700 | | | | 326,597 | |
KDDI Corp. | | | 53,400 | | | | 1,355,201 | |
Keikyu Corp. | | | 5,900 | | | | 116,608 | |
Keio Corp. | | | 3,000 | | | | 142,848 | |
Kewpie Corp. | | | 2,900 | | | | 82,970 | |
Keyence Corp. | | | 600 | | | | 366,664 | |
Kikkoman Corp. | | | 4,500 | | | | 186,840 | |
Kintetsu Group Holdings Co., Ltd. | | | 2,700 | | | | 106,904 | |
Kirin Holdings Co., Ltd. | | | 9,900 | | | | 247,996 | |
Kobayashi Pharmaceutical Co., Ltd. | | | 1,400 | | | | 92,732 | |
Konami Holdings Corp. | | | 2,400 | | | | 138,297 | |
Kuraray Co., Ltd. | | | 6,400 | | | | 120,213 | |
Kyocera Corp. | | | 2,200 | | | | 146,862 | |
Kyowa Hakko Kirin Co., Ltd. | | | 8,900 | | | | 173,626 | |
Kyushu Electric Power Co., Inc. | | | 11,900 | | | | 130,823 | |
Lawson, Inc. | | | 1,600 | | | | 108,505 | |
Lion Corp. | | | 5,000 | | | | 93,819 | |
M3, Inc. | | | 4,500 | | | | 164,960 | |
Makita Corp. | | | 2,000 | | | | 94,488 | |
Marubeni Corp. | | | 12,600 | | | | 94,764 | |
Maruichi Steel Tube, Ltd. | | | 3,000 | | | | 90,291 | |
Mebuki Financial Group, Inc. | | | 21,500 | | | | 98,156 | |
MEIJI Holdings Co., Ltd. | | | 2,200 | | | | 184,517 | |
Miraca Holdings, Inc. | | | 2,700 | | | | 123,328 | |
Mitsubishi Gas Chemical Co., Inc. | | | 5,000 | | | | 141,729 | |
Mitsubishi Motors Corp. | | | 16,700 | | | | 124,264 | |
Mitsubishi Tanabe Pharma Corp. | | | 6,300 | | | | 128,125 | |
Mitsui & Co., Ltd. | | | 8,900 | | | | 156,591 | |
Mizuho Financial Group, Inc. | | | 180,000 | | | | 341,235 | |
MS&AD Insurance Group Holdings, Inc. | | | 6,300 | | | | 215,202 | |
NEC Corp. | | | 4,500 | | | | 136,057 | |
NH Foods, Ltd. | | | 6,000 | | | | 144,527 | |
Nidec Corp. | | | 1,500 | | | | 241,416 | |
| | | | |
| | 13 | | See Notes to Financial Statements. |
Parametric International Equity Fund
January 31, 2018
Portfolio of Investments — continued
| | | | | | | | |
| Security | | Shares | | | Value | |
|
Japan (continued) | |
Nintendo Co., Ltd. | | | 800 | | | $ | 362,332 | |
Nippon Building Fund, Inc. | | | 44 | | | | 236,050 | |
Nippon Express Co., Ltd. | | | 1,400 | | | | 100,885 | |
Nippon Kayaku Co., Ltd. | | | 5,000 | | | | 73,823 | |
Nippon Paper Industries Co., Ltd. | | | 5,100 | | | | 97,098 | |
Nippon Prologis REIT, Inc. | | | 100 | | | | 229,565 | |
Nippon Shinyaku Co., Ltd. | | | 2,000 | | | | 137,168 | |
Nippon Shokubai Co., Ltd. | | | 1,400 | | | | 99,696 | |
Nippon Steel & Sumitomo Metal Corp. | | | 10,400 | | | | 265,430 | |
Nippon Telegraph & Telephone Corp. | | | 22,600 | | | | 1,082,194 | |
Nissan Chemical Industries, Ltd. | | | 3,100 | | | | 126,750 | |
Nissan Motor Co., Ltd. | | | 15,900 | | | | 170,329 | |
Nisshin Seifun Group, Inc. | | | 7,100 | | | | 142,727 | |
Nissin Foods Holdings Co., Ltd. | | | 2,500 | | | | 185,490 | |
Nitori Holdings Co., Ltd. | | | 800 | | | | 127,643 | |
Nomura Real Estate Master Fund, Inc. | | | 74 | | | | 103,014 | |
Nomura Research Institute, Ltd. | | | 2,400 | | | | 110,808 | |
NTT Data Corp. | | | 12,500 | | | | 147,567 | |
NTT DoCoMo, Inc. | | | 43,100 | | | | 1,070,923 | |
Obic Co., Ltd. | | | 1,700 | | | | 132,864 | |
Odakyu Electric Railway Co., Ltd. | | | 4,900 | | | | 108,229 | |
Okinawa Electric Power Co., Inc. (The) | | | 4,730 | | | | 120,754 | |
Omron Corp. | | | 2,900 | | | | 181,767 | |
Ono Pharmaceutical Co., Ltd. | | | 9,000 | | | | 222,365 | |
Oracle Corp. Japan | | | 900 | | | | 72,692 | |
Oriental Land Co., Ltd. | | | 1,300 | | | | 127,066 | |
ORIX Corp. | | | 11,000 | | | | 206,048 | |
Orix JREIT, Inc. | | | 116 | | | | 178,951 | |
Osaka Gas Co., Ltd. | | | 13,200 | | | | 262,584 | |
Otsuka Holdings Co., Ltd. | | | 6,700 | | | | 297,631 | |
Rakuten, Inc. | | | 9,100 | | | | 82,354 | |
Recruit Holdings Co., Ltd. | | | 6,600 | | | | 161,177 | |
Relo Group, Inc. | | | 3,100 | | | | 92,060 | |
Resona Holdings, Inc. | | | 27,900 | | | | 168,960 | |
Ricoh Co., Ltd. | | | 15,500 | | | | 152,782 | |
Rinnai Corp. | | | 800 | | | | 75,535 | |
Santen Pharmaceutical Co., Ltd. | | | 10,000 | | | | 162,375 | |
Sawai Pharmaceutical Co., Ltd. | | | 1,900 | | | | 86,508 | |
SECOM Co., Ltd. | | | 1,300 | | | | 99,638 | |
Sekisui Chemical Co., Ltd. | | | 7,200 | | | | 137,667 | |
Sekisui House, Ltd. | | | 6,100 | | | | 112,077 | |
Seven Bank, Ltd. | | | 26,300 | | | | 97,206 | |
Shimadzu Corp. | | | 4,000 | | | | 101,607 | |
Shimamura Co., Ltd. | | | 1,000 | | | | 117,565 | |
Shimano, Inc. | | | 800 | | | | 114,671 | |
Shimizu Corp. | | | 6,000 | | | | 61,717 | |
| | | | | | | | |
| Security | | Shares | | | Value | |
|
Japan (continued) | |
Shin-Etsu Chemical Co., Ltd. | | | 4,300 | | | $ | 491,988 | |
Shionogi & Co., Ltd. | | | 3,900 | | | | 215,867 | |
Shizuoka Bank, Ltd. (The) | | | 8,000 | | | | 85,548 | |
Showa Denko K.K. | | | 3,100 | | | | 144,228 | |
Showa Shell Sekiyu K.K. | | | 15,300 | | | | 217,507 | |
Sompo Holdings, Inc. | | | 3,000 | | | | 120,462 | |
Sumitomo Corp. | | | 6,000 | | | | 103,744 | |
Sumitomo Electric Industries, Ltd. | | | 6,400 | | | | 109,537 | |
Sumitomo Metal Mining Co., Ltd. | | | 2,600 | | | | 122,079 | |
Sumitomo Mitsui Financial Group, Inc. | | | 10,000 | | | | 450,360 | |
Sumitomo Osaka Cement Co., Ltd. | | | 12,000 | | | | 56,493 | |
Suntory Beverage & Food, Ltd. | | | 2,200 | | | | 105,518 | |
Suruga Bank, Ltd. | | | 5,000 | | | | 101,371 | |
Suzuki Motor Corp. | | | 2,500 | | | | 143,588 | |
T&D Holdings, Inc. | | | 8,800 | | | | 157,786 | |
Taiheiyo Cement Corp. | | | 1,600 | | | | 67,902 | |
Taisei Corp. | | | 2,100 | | | | 107,185 | |
Taisho Pharmaceutical Holdings Co., Ltd. | | | 1,400 | | | | 114,030 | |
Takashimaya Co., Ltd. | | | 6,000 | | | | 62,432 | |
Takeda Pharmaceutical Co., Ltd. | | | 8,800 | | | | 515,449 | |
TEIJIN, Ltd. | | | 5,500 | | | | 121,944 | |
Terumo Corp. | | | 4,100 | | | | 200,673 | |
Toho Gas Co., Ltd. | | | 3,800 | | | | 111,578 | |
Tohoku Electric Power Co., Inc. | | | 19,200 | | | | 248,500 | |
Tokio Marine Holdings, Inc. | | | 4,600 | | | | 217,497 | |
Tokyo Electron, Ltd. | | | 1,000 | | | | 188,642 | |
Tokyo Gas Co., Ltd. | | | 12,900 | | | | 307,802 | |
Tokyu Corp. | | | 6,500 | | | | 109,027 | |
Toray Industries, Inc. | | | 17,900 | | | | 178,569 | |
Toshiba Corp.(1) | | | 34,000 | | | | 97,295 | |
Tosoh Corp. | | | 3,400 | | | | 78,276 | |
Toyota Motor Corp. | | | 11,100 | | | | 764,760 | |
Trend Micro, Inc. | | | 1,300 | | | | 70,373 | |
Tsuruha Holdings, Inc. | | | 600 | | | | 83,796 | |
Ube Industries, Ltd. | | | 3,200 | | | | 95,586 | |
United Urban Investment Corp. | | | 160 | | | | 253,015 | |
USS Co., Ltd. | | | 5,000 | | | | 111,982 | |
West Japan Railway Co. | | | 1,300 | | | | 97,789 | |
Yahoo! Japan Corp. | | | 24,900 | | | | 120,102 | |
Yakult Honsha Co., Ltd. | | | 2,100 | | | | 176,304 | |
Yamaguchi Financial Group, Inc. | | | 8,000 | | | | 94,051 | |
Yamato Holdings Co., Ltd. | | | 3,300 | | | | 85,222 | |
Yamazaki Baking Co., Ltd. | | | 4,400 | | | | 86,809 | |
Yaskawa Electric Corp. | | | 2,800 | | | | 144,910 | |
Zeon Corp. | | | 6,000 | | | | 90,552 | |
| | | | | | | | | |
| | | $ | 34,054,119 | |
| | | | | | | | | |
| | | | |
| | 14 | | See Notes to Financial Statements. |
Parametric International Equity Fund
January 31, 2018
Portfolio of Investments — continued
| | | | | | | | |
| Security | | Shares | | | Value | |
|
Netherlands — 4.5% | |
Aalberts Industries NV | | | 2,908 | | | $ | 158,773 | |
ABN AMRO Group NV(2) | | | 4,855 | | | | 164,332 | |
Accell Group | | | 4,836 | | | | 139,902 | |
Akzo Nobel NV | | | 8,135 | | | | 761,375 | |
Altice NV, Class B(1) | | | 6,916 | | | | 74,190 | |
AMG Advanced Metallurgical Group NV | | | 4,069 | | | | 217,586 | |
ASM International NV | | | 2,469 | | | | 177,682 | |
ASML Holding NV | | | 6,736 | | | | 1,365,646 | |
ASR Nederland NV | | | 2,400 | | | | 104,834 | |
Cimpress NV(1) | | | 1,473 | | | | 187,675 | |
Corbion NV | | | 6,263 | | | | 204,747 | |
Eurocommercial Properties NV | | | 1,439 | | | | 67,885 | |
Euronext NV(2) | | | 1,764 | | | | 119,502 | |
Flow Traders(2) | | | 2,849 | | | | 71,225 | |
Gemalto NV(4) | | | 975 | | | | 60,143 | |
Gemalto NV(4) | | | 2,249 | | | | 138,970 | |
GrandVision NV(2) | | | 5,474 | | | | 127,484 | |
IMCD Group NV | | | 2,169 | | | | 144,891 | |
ING Groep NV | | | 53,109 | | | | 1,042,809 | |
InterXion Holding NV(1) | | | 3,300 | | | | 207,075 | |
Koninklijke Ahold Delhaize NV | | | 24,123 | | | | 538,907 | |
Koninklijke KPN NV | | | 143,773 | | | | 503,817 | |
Koninklijke Philips NV | | | 25,141 | | | | 1,024,741 | |
Koninklijke Vopak NV | | | 2,501 | | | | 112,896 | |
NN Group NV | | | 5,540 | | | | 261,293 | |
NSI NV | | | 1,162 | | | | 51,297 | |
Philips Lighting NV(2) | | | 3,321 | | | | 130,581 | |
PostNL NV | | | 28,142 | | | | 140,308 | |
QIAGEN NV(1) | | | 6,909 | | | | 231,088 | |
Refresco Group NV(2) | | | 7,754 | | | | 191,346 | |
RELX NV | | | 17,050 | | | | 377,547 | |
SBM Offshore NV | | | 6,486 | | | | 121,137 | |
TKH Group NV | | | 1,737 | | | | 115,472 | |
TomTom NV(1) | | | 13,510 | | | | 147,085 | |
Unilever NV | | | 28,425 | | | | 1,640,751 | |
Vastned Retail NV | | | 1,000 | | | | 50,436 | |
Wolters Kluwer NV | | | 6,570 | | | | 347,752 | |
| | | | | | | | | |
| | | $ | 11,523,180 | |
| | | | | | | | | |
|
New Zealand — 1.1% | |
A2 Milk Co., Ltd.(1) | | | 51,923 | | | $ | 353,282 | |
Air New Zealand, Ltd. | | | 34,574 | | | | 78,381 | |
Auckland International Airport, Ltd. | | | 40,500 | | | | 199,540 | |
Contact Energy, Ltd. | | | 43,411 | | | | 178,806 | |
Fisher & Paykel Healthcare Corp., Ltd. | | | 11,759 | | | | 115,305 | |
Fletcher Building, Ltd. | | | 49,043 | | | | 282,920 | |
| | | | | | | | |
| Security | | Shares | | | Value | |
|
New Zealand (continued) | |
Goodman Property Trust | | | 65,888 | | | $ | 66,057 | |
Heartland Bank, Ltd. | | | 76,907 | | | | 117,215 | |
Infratil, Ltd. | | | 16,238 | | | | 38,831 | |
Kiwi Property Group, Ltd. | | | 70,000 | | | | 71,280 | |
Mercury NZ, Ltd. | | | 47,223 | | | | 119,862 | |
Precinct Properties New Zealand, Ltd. | | | 121,300 | | | | 118,018 | |
Restaurant Brands New Zealand, Ltd. | | | 8,227 | | | | 45,598 | |
Ryman Healthcare, Ltd. | | | 12,285 | | | | 99,196 | |
SKYCITY Entertainment Group, Ltd. | | | 41,260 | | | | 125,967 | |
Spark New Zealand, Ltd. | | | 98,888 | | | | 261,581 | |
Summerset Group Holdings, Ltd. | | | 16,945 | | | | 71,791 | |
Trade Me, Ltd. | | | 28,289 | | | | 94,017 | |
Xero, Ltd.(1) | | | 10,956 | | | | 273,957 | |
Z Energy, Ltd. | | | 43,700 | | | | 246,062 | |
| | | | | | | | | |
| | | $ | 2,957,666 | |
| | | | | | | | | |
|
Norway — 2.2% | |
Aker BP ASA | | | 3,100 | | | $ | 89,708 | |
Atea ASA | | | 18,187 | | | | 281,544 | |
Austevoll Seafood ASA | | | 16,139 | | | | 126,793 | |
Borregaard ASA | | | 13,595 | | | | 121,369 | |
DNB ASA | | | 16,445 | | | | 334,249 | |
Entra ASA(2) | | | 16,712 | | | | 252,591 | |
Europris ASA(2) | | | 11,200 | | | | 50,083 | |
Gjensidige Forsikring ASA | | | 7,400 | | | | 139,598 | |
Golar LNG, Ltd. | | | 2,320 | | | | 63,313 | |
Kongsberg Gruppen ASA | | | 11,096 | | | | 226,103 | |
Marine Harvest ASA | | | 19,910 | | | | 344,757 | |
Nordic American Tankers, Ltd. | | | 13,100 | | | | 30,261 | |
Nordic Nanovector ASA(1) | | | 4,831 | | | | 48,134 | |
Nordic Semiconductor ASA(1) | | | 40,251 | | | | 239,607 | |
Norsk Hydro ASA | | | 33,693 | | | | 245,330 | |
Norwegian Finans Holding ASA(1) | | | 8,625 | | | | 98,479 | |
Salmar ASA | | | 5,471 | | | | 148,754 | |
Scatec Solar ASA(2) | | | 8,900 | | | | 52,176 | |
Schibsted ASA, Class B | | | 13,669 | | | | 413,008 | |
Ship Finance International, Ltd. | | | 5,500 | | | | 84,150 | |
SpareBank 1 SMN | | | 4,478 | | | | 50,834 | |
SpareBank 1 SR-Bank ASA | | | 4,300 | | | | 51,326 | |
Statoil ASA | | | 17,807 | | | | 417,241 | |
Telenor ASA | | | 27,010 | | | | 631,484 | |
Tomra Systems ASA | | | 20,574 | | | | 348,475 | |
Veidekke ASA | | | 7,872 | | | | 84,222 | |
Wilh Wilhelmsen Holding ASA, Class A | | | 1,536 | | | | 50,712 | |
XXL ASA(2) | | | 21,116 | | | | 261,040 | |
Yara International ASA | | | 8,282 | | | | 398,370 | |
| | | | | | | | | |
| | | $ | 5,683,711 | |
| | | | | | | | | |
| | | | |
| | 15 | | See Notes to Financial Statements. |
Parametric International Equity Fund
January 31, 2018
Portfolio of Investments — continued
| | | | | | | | |
| Security | | Shares | | | Value | |
|
Portugal — 1.1% | |
Banco Comercial Portugues SA(1) | | | 1,107,823 | | | $ | 442,326 | |
CTT-Correios de Portugal SA | | | 69,614 | | | | 297,835 | |
EDP Renovaveis SA | | | 9,550 | | | | 83,546 | |
EDP-Energias de Portugal SA | | | 87,593 | | | | 307,337 | |
Galp Energia SGPS SA, Class B | | | 19,320 | | | | 369,056 | |
Jeronimo Martins SGPS SA | | | 19,002 | | | | 404,747 | |
Navigator Co. SA (The) | | | 61,000 | | | | 342,498 | |
NOS SGPS SA | | | 65,302 | | | | 444,553 | |
Pharol SGPS SA(1) | | | 189,661 | | | | 54,250 | |
REN - Redes Energeticas Nacionais SGPS SA | | | 15,211 | | | | 47,416 | |
Semapa-Sociedade de Investimento e Gestao | | | 4,106 | | | | 93,761 | |
| | | | | | | | | |
| | | $ | 2,887,325 | |
| | | | | | | | | |
|
Singapore — 2.2% | |
Ascendas Real Estate Investment Trust | | | 69,500 | | | $ | 145,979 | |
Best World International, Ltd. | | | 76,000 | | | | 78,164 | |
BOC Aviation, Ltd.(2) | | | 11,800 | | | | 69,291 | |
CapitaLand Commercial Trust, Ltd. | | | 39,500 | | | | 56,262 | |
CapitaLand Mall Trust | | | 45,800 | | | | 73,383 | |
CDL Hospitality Trusts | | | 40,000 | | | | 55,451 | |
China Aviation Oil Singapore Corp, Ltd. | | | 40,000 | | | | 49,599 | |
ComfortDelGro Corp., Ltd. | | | 49,300 | | | | 78,829 | |
DBS Group Holdings, Ltd. | | | 17,700 | | | | 355,258 | |
Ezion Holdings, Ltd.(1)(3) | | | 226,000 | | | | 16,970 | |
Flex, Ltd.(1) | | | 24,978 | | | | 449,854 | |
Frasers Logistics & Industrial Trust | | | 49,500 | | | | 43,063 | |
Genting Singapore PLC | | | 374,400 | | | | 384,440 | |
Hutchison Port Holdings Trust | | | 196,200 | | | | 81,144 | |
IGG, Inc. | | | 53,000 | | | | 58,788 | |
Keppel Infrastructure Trust | | | 291,400 | | | | 126,728 | |
Keppel REIT | | | 66,000 | | | | 64,809 | |
M1, Ltd. | | | 44,000 | | | | 62,031 | |
Mapletree Commercial Trust | | | 35,100 | | | | 45,173 | |
Mapletree Greater China Commercial Trust | | | 46,100 | | | | 44,305 | |
Mapletree Industrial Trust | | | 34,200 | | | | 55,290 | |
Mapletree Logistics Trust | | | 70,400 | | | | 73,575 | |
Metro Holdings, Ltd. | | | 53,000 | | | | 46,777 | |
Midas Holdings, Ltd.(1) | | | 480,000 | | | | 64,672 | |
mm2 Asia, Ltd.(1) | | | 142,500 | | | | 55,364 | |
Olam International, Ltd. | | | 50,200 | | | | 85,192 | |
Raffles Medical Group, Ltd. | | | 140,800 | | | | 119,041 | |
Sheng Siong Group, Ltd. | | | 91,200 | | | | 64,674 | |
Singapore Airlines, Ltd. | | | 22,900 | | | | 197,230 | |
Singapore Airport Terminal Services, Ltd. | | | 25,700 | | | | 108,073 | |
Singapore Exchange, Ltd. | | | 29,500 | | | | 184,105 | |
Singapore Post, Ltd. | | | 72,300 | | | | 71,133 | |
| | | | | | | | |
| Security | | Shares | | | Value | |
|
Singapore (continued) | |
Singapore Press Holdings, Ltd. | | | 123,000 | | | $ | 246,996 | |
Singapore Technologies Engineering, Ltd. | | | 47,600 | | | | 122,121 | |
Singapore Telecommunications, Ltd.(4) | | | 105,000 | | | | 283,917 | |
Singapore Telecommunications, Ltd.(4) | | | 144,100 | | | | 388,794 | |
StarHub, Ltd. | | | 21,000 | | | | 46,205 | |
Suntec Real Estate Investment Trust | | | 45,000 | | | | 70,882 | |
United Engineers, Ltd. | | | 17,000 | | | | 34,188 | |
United Overseas Bank, Ltd. | | | 15,700 | | | | 327,705 | |
Venture Corp., Ltd. | | | 13,300 | | | | 232,994 | |
Wilmar International, Ltd. | | | 213,500 | | | | 519,950 | |
| | | | | | | | | |
| | | $ | 5,738,399 | |
| | | | | | | | | |
|
Spain — 4.4% | |
Abertis Infraestructuras SA | | | 14,178 | | | $ | 343,964 | |
Acerinox SA | | | 8,856 | | | | 130,230 | |
Aena SME SA(2) | | | 1,300 | | | | 283,081 | |
Almirall SA | | | 16,800 | | | | 182,381 | |
Amadeus IT Group SA | | | 14,490 | | | | 1,123,393 | |
Axiare Patrimonio SOCIMI SA | | | 8,785 | | | | 191,901 | |
Banco Bilbao Vizcaya Argentaria SA | | | 38,700 | | | | 363,182 | |
Banco de Sabadell SA | | | 53,823 | | | | 127,927 | |
Bankia SA | | | 20,510 | | | | 103,822 | |
Bankinter SA | | | 11,334 | | | | 130,314 | |
Bolsas y Mercados Espanoles SHMSF SA | | | 1,920 | | | | 65,489 | |
CaixaBank SA | | | 34,214 | | | | 184,554 | |
Cellnex Telecom SA(2) | | | 3,584 | | | | 96,763 | |
Cia de Distribucion Integral Logista Holdings SA | | | 4,197 | | | | 102,579 | |
Coca-Cola European Partners PLC | | | 19,000 | | | | 763,040 | |
Construcciones y Auxiliar de Ferrocarriles SA | | | 2,050 | | | | 95,411 | |
Ebro Foods SA | | | 12,141 | | | | 299,034 | |
Enagas SA | | | 6,668 | | | | 181,645 | |
Endesa SA | | | 5,685 | | | | 127,614 | |
Ercros SA | | | 35,810 | | | | 131,974 | |
Gestamp Automocion SA(1)(2) | | | 12,257 | | | | 93,845 | |
Grifols SA | | | 20,691 | | | | 665,463 | |
Grifols SA ADR | | | 12,300 | | | | 305,655 | |
Grupo Catalana Occidente SA | | | 2,596 | | | | 121,474 | |
Hispania Activos Inmobiliarios SOCIMI SA | | | 12,545 | | | | 262,636 | |
Iberdrola SA(4) | | | 1,969 | | | | 16,031 | |
Iberdrola SA(4) | | | 90,570 | | | | 737,220 | |
Industria de Diseno Textil SA | | | 22,598 | | | | 808,633 | |
Inmobiliaria Colonial Socimi SA | | | 34,895 | | | | 389,803 | |
Lar Espana Real Estate Socimi SA | | | 14,031 | | | | 158,718 | |
Mapfre SA | | | 26,500 | | | | 94,099 | |
Neinor Homes SA(1)(2) | | | 4,963 | | | | 113,929 | |
Prosegur Cash SA(2) | | | 18,590 | | | | 64,197 | |
| | | | |
| | 16 | | See Notes to Financial Statements. |
Parametric International Equity Fund
January 31, 2018
Portfolio of Investments — continued
| | | | | | | | |
| Security | | Shares | | | Value | |
|
Spain (continued) | |
Prosegur Cia de Seguridad SA | | | 16,517 | | | $ | 137,317 | |
Red Electrica Corp. SA | | | 7,578 | | | | 159,839 | |
Repsol SA | | | 43,006 | | | | 809,412 | |
Saeta Yield SA | | | 4,126 | | | | 57,514 | |
Siemens Gamesa Renewable Energy SA | | | 5,400 | | | | 84,254 | |
Tecnicas Reunidas SA | | | 1,615 | | | | 55,060 | |
Telefonica SA | | | 96,683 | | | | 991,825 | |
Tubacex SA(1) | | | 34,340 | | | | 147,074 | |
| | | | | | | | | |
| | | $ | 11,302,296 | |
| | | | | | | | | |
|
Sweden — 4.5% | |
Alfa Laval AB | | | 3,749 | | | $ | 98,392 | |
Arjo AB(1) | | | 13,601 | | | | 44,532 | |
Assa Abloy AB, Class B | | | 9,306 | | | | 206,283 | |
Atlas Copco AB, Class B | | | 2,941 | | | | 122,748 | |
Attendo AB(2) | | | 14,762 | | | | 155,901 | |
Axfood AB | | | 7,649 | | | | 153,805 | |
BillerudKorsnas AB | | | 16,002 | | | | 246,383 | |
BioGaia AB, Class B | | | 2,949 | | | | 116,560 | |
Bonava AB, Class B | | | 4,887 | | | | 69,718 | |
Capio AB(2) | | | 22,400 | | | | 127,347 | |
Castellum AB | | | 23,503 | | | | 405,256 | |
Catena Media PLC(1) | | | 6,265 | | | | 100,412 | |
Cloetta AB, Class B | | | 24,800 | | | | 102,411 | |
Com Hem Holding AB | | | 17,822 | | | | 309,724 | |
D Carnegie & Co. AB(1) | | | 6,188 | | | | 96,517 | |
Dometic Group AB(2) | | | 18,000 | | | | 194,806 | |
Elekta AB, Class B | | | 33,916 | | | | 323,998 | |
Essity Aktiebolag, Class B(1) | | | 22,241 | | | | 666,244 | |
Fabege AB | | | 12,900 | | | | 282,447 | |
Getinge AB, Class B | | | 20,810 | | | | 285,155 | |
Granges AB | | | 7,960 | | | | 83,763 | |
Hennes & Mauritz AB, Class B | | | 25,700 | | | | 454,821 | |
Hexpol AB | | | 20,200 | | | | 216,896 | |
Holmen AB, Class B | | | 4,163 | | | | 219,305 | |
Hufvudstaden AB, Class A | | | 11,335 | | | | 182,428 | |
Industrivarden AB, Class A | | | 3,290 | | | | 92,712 | |
Industrivarden AB, Class C | | | 3,570 | | | | 95,106 | |
Kindred Group PLC SDR | | | 8,056 | | | | 134,519 | |
Kungsleden AB | | | 20,778 | | | | 147,188 | |
L E Lundbergforetagen, Class B | | | 2,000 | | | | 161,397 | |
LeoVegas AB(2) | | | 4,400 | | | | 62,724 | |
Lundin Petroleum AB(1) | | | 14,116 | | | | 352,178 | |
Medivir AB, Class B(1) | | | 11,060 | | | | 60,870 | |
Modern Times Group MTG AB, Class B | | | 2,700 | | | | 123,843 | |
| | | | | | | | |
| Security | | Shares | | | Value | |
|
Sweden (continued) | |
Mycronic AB | | | 12,782 | | | $ | 144,346 | |
NCC AB, Class B | | | 1,905 | | | | 37,768 | |
NetEnt AB | | | 26,464 | | | | 150,320 | |
Nibe Industrier AB, Class B | | | 15,288 | | | | 148,867 | |
Nordea Bank AB | | | 29,485 | | | | 363,995 | |
Pandox AB | | | 5,668 | | | | 106,491 | |
RaySearch Laboratories AB(1) | | | 6,321 | | | | 126,072 | |
Scandic Hotels Group AB(2) | | | 6,000 | | | | 66,387 | |
Securitas AB, Class B | | | 6,225 | | | | 115,228 | |
Skanska AB, Class B | | | 3,995 | | | | 81,199 | |
SKF AB, Class B | | | 3,418 | | | | 84,482 | |
Starbreeze AB(1) | | | 33,624 | | | | 39,453 | |
Svenska Cellulosa AB SCA, Class B | | | 43,531 | | | | 450,422 | |
Svenska Handelsbanken AB, Class A | | | 16,280 | | | | 236,942 | |
Swedbank AB, Class A | | | 10,493 | | | | 268,353 | |
Swedish Match AB | | | 8,034 | | | | 325,413 | |
Telefonaktiebolaget LM Ericsson, Class B | | | 114,300 | | | | 735,158 | |
Telia Co. AB | | | 196,135 | | | | 984,536 | |
Trelleborg AB, Class B | | | 2,484 | | | | 66,302 | |
Volvo AB | | | 12,900 | | | | 263,296 | |
Wihlborgs Fastigheter AB | | | 5,892 | | | | 143,396 | |
| | | | | | | | | |
| | | $ | 11,434,815 | |
| | | | | | | | | |
|
Switzerland — 9.1% | |
Allreal Holding AG | | | 1,304 | | | $ | 226,879 | |
ALSO Holding AG | | | 1,183 | | | | 174,298 | |
Ascom Holding AG | | | 5,950 | | | | 153,929 | |
Autoneum Holding AG | | | 372 | | | | 123,010 | |
Baloise Holding AG | | | 1,432 | | | | 234,279 | |
Banque Cantonale Vaudoise | | | 202 | | | | 169,911 | |
Belimo Holding AG | | | 28 | | | | 131,263 | |
BKW AG | | | 1,604 | | | | 102,577 | |
Burckhardt Compression Holdings AG | | | 260 | | | | 96,645 | |
Cembra Money Bank AG | | | 1,074 | | | | 105,946 | |
Clariant AG | | | 17,063 | | | | 488,390 | |
Comet Holding AG | | | 1,329 | | | | 231,661 | |
Compagnie Financiere Richemont SA, Class A | | | 21,335 | | | | 2,046,368 | |
Daetwyler Holding AG, Bearer Shares | | | 436 | | | | 92,575 | |
DKSH Holding AG | | | 1,552 | | | | 145,122 | |
dormakaba Holding AG | | | 136 | | | | 125,132 | |
EFG International AG | | | 8,368 | | | | 94,086 | |
Emmi AG | | | 245 | | | | 185,770 | |
Ems-Chemie Holding AG | | | 842 | | | | 618,967 | |
Flughafen Zurich AG | | | 707 | | | | 180,116 | |
Forbo Holding AG | | | 79 | | | | 133,592 | |
| | | | |
| | 17 | | See Notes to Financial Statements. |
Parametric International Equity Fund
January 31, 2018
Portfolio of Investments — continued
| | | | | | | | |
| Security | | Shares | | | Value | |
|
Switzerland (continued) | |
Geberit AG | | | 841 | | | $ | 398,323 | |
Georg Fischer AG | | | 150 | | | | 217,148 | |
Givaudan SA | | | 368 | | | | 885,869 | |
Helvetia Holding AG | | | 372 | | | | 221,623 | |
Inficon Holding AG | | | 320 | | | | 200,249 | |
Intershop Holding AG | | | 234 | | | | 123,244 | |
Julius Baer Group, Ltd. | | | 4,417 | | | | 303,431 | |
Kardex AG | | | 528 | | | | 71,822 | |
Komax Holding AG | | | 326 | | | | 112,428 | |
Kuehne & Nagel International AG | | | 1,725 | | | | 316,801 | |
Landis+Gyr Group AG(1) | | | 2,198 | | | | 181,689 | |
LEM Holding SA | | | 53 | | | | 95,199 | |
Mobimo Holding AG | | | 577 | | | | 161,415 | |
Nestle SA | | | 34,744 | | | | 3,001,254 | |
Novartis AG | | | 18,787 | | | | 1,695,659 | |
Panalpina Welttransport Holding AG | | | 731 | | | | 120,963 | |
Pargesa Holding SA, Bearer Shares | | | 1,628 | | | | 148,412 | |
Partners Group Holding AG | | | 326 | | | | 253,320 | |
Roche Holding AG | | | 473 | | | | 118,194 | |
Roche Holding AG PC | | | 5,093 | | | | 1,258,348 | |
Schindler Holding AG | | | 842 | | | | 204,928 | |
Schindler Holding AG PC | | | 1,220 | | | | 305,687 | |
Schmolz & Bickenbach AG(1) | | | 96,337 | | | | 82,729 | |
SFS Group AG | | | 1,027 | | | | 129,049 | |
SGS SA | | | 131 | | | | 352,149 | |
Sika AG, Bearer Shares | | | 133 | | | | 1,152,153 | |
Sonova Holding AG | | | 585 | | | | 94,273 | |
Straumann Holding AG | | | 149 | | | | 113,729 | |
Sulzer AG | | | 739 | | | | 105,024 | |
Swatch Group AG (The) | | | 3,577 | | | | 308,993 | |
Swatch Group AG (The), Bearer Shares | | | 1,354 | | | | 619,441 | |
Swiss Life Holding AG | | | 703 | | | | 263,975 | |
Swiss Prime Site AG | | | 4,888 | | | | 473,219 | |
Swiss Re AG | | | 4,990 | | | | 492,181 | |
Swisscom AG | | | 1,936 | | | | 1,057,229 | |
Temenos Group AG | | | 4,001 | | | | 552,924 | |
Valiant Holding AG | | | 1,138 | | | | 137,455 | |
Valora Holding AG | | | 268 | | | | 98,626 | |
VAT Group AG(2) | | | 929 | | | | 148,414 | |
Vontobel Holding AG | | | 2,114 | | | | 152,732 | |
Zurich Insurance Group AG | | | 2,123 | | | | 698,356 | |
| | | | | | | | | |
| | | $ | 23,289,173 | |
| | | | | | | | | |
|
United Kingdom — 9.0% | |
3i Group PLC | | | 7,509 | | | $ | 99,292 | |
Admiral Group PLC | | | 3,026 | | | | 79,466 | |
| | | | | | | | |
| Security | | Shares | | | Value | |
|
United Kingdom (continued) | |
Assura PLC | | | 171,909 | | | $ | 150,556 | |
AstraZeneca PLC | | | 11,023 | | | | 765,142 | |
Aveva Group PLC | | | 2,063 | | | | 87,477 | |
Aviva PLC | | | 25,000 | | | | 182,385 | |
Babcock International Group PLC | | | 11,872 | | | | 115,639 | |
BAE Systems PLC | | | 21,824 | | | | 184,131 | |
Bellway PLC | | | 1,558 | | | | 73,447 | |
Berkeley Group Holdings PLC | | | 1,364 | | | | 76,801 | |
BHP Billiton PLC | | | 16,329 | | | | 363,650 | |
Big Yellow Group PLC | | | 8,638 | | | | 106,313 | |
British American Tobacco PLC | | | 11,655 | | | | 796,580 | |
BTG PLC(1) | | | 19,439 | | | | 205,254 | |
Bunzl PLC | | | 2,708 | | | | 79,216 | |
Carnival PLC | | | 1,436 | | | | 101,316 | |
Compass Group PLC | | | 13,137 | | | | 276,598 | |
ConvaTec Group PLC(2) | | | 54,000 | | | | 154,988 | |
Croda International PLC | | | 1,321 | | | | 84,072 | |
Daily Mail & General Trust PLC, Class A | | | 7,483 | | | | 67,779 | |
Dignity PLC | | | 2,785 | | | | 32,303 | |
Direct Line Insurance Group PLC | | | 15,813 | | | | 82,905 | |
DS Smith PLC | | | 15,415 | | | | 110,175 | |
easyJet PLC | | | 5,421 | | | | 127,695 | |
Elementis PLC | | | 29,679 | | | | 121,974 | |
Essentra PLC | | | 15,665 | | | | 113,708 | |
Experian PLC | | | 5,985 | | | | 137,941 | |
F&C Commercial Property Trust, Ltd. | | | 51,629 | | | | 105,901 | |
Ferguson PLC | | | 1,572 | | | | 121,396 | |
Fidessa Group PLC | | | 2,212 | | | | 74,015 | |
FirstGroup PLC(1) | | | 47,376 | | | | 69,875 | |
Fresnillo PLC | | | 4,298 | | | | 82,288 | |
G4S PLC | | | 22,268 | | | | 89,876 | |
GlaxoSmithKline PLC | | | 44,465 | | | | 827,675 | |
Grainger PLC | | | 28,961 | | | | 118,910 | |
Great Portland Estates PLC | | | 13,736 | | | | 129,931 | |
Greene King PLC | | | 15,057 | | | | 111,597 | |
Halma PLC | | | 11,352 | | | | 206,031 | |
Hammerson PLC | | | 22,747 | | | | 159,337 | |
Howden Joinery Group PLC | | | 17,122 | | | | 112,905 | |
HSBC Holdings PLC | | | 62,500 | | | | 666,790 | |
Imperial Brands PLC | | | 7,136 | | | | 293,671 | |
Indivior PLC(1) | | | 15,000 | | | | 85,698 | |
Informa PLC | | | 7,581 | | | | 74,931 | |
Inmarsat PLC | | | 40,064 | | | | 264,075 | |
Intertek Group PLC | | | 2,463 | | | | 175,737 | |
John Wood Group PLC | | | 28,791 | | | | 265,401 | |
Johnson Matthey PLC | | | 1,835 | | | | 90,190 | |
| | | | |
| | 18 | | See Notes to Financial Statements. |
Parametric International Equity Fund
January 31, 2018
Portfolio of Investments — continued
| | | | | | | | |
| Security | | Shares | | | Value | |
|
United Kingdom (continued) | |
Just Eat PLC(1) | | | 12,902 | | | $ | 149,123 | |
Kingfisher PLC | | | 16,823 | | | | 82,815 | |
Land Securities Group PLC | | | 20,525 | | | | 292,215 | |
Legal & General Group PLC | | | 21,208 | | | | 81,468 | |
Lloyds Banking Group PLC | | | 221,427 | | | | 218,769 | |
London Stock Exchange Group PLC | | | 3,749 | | | | 209,138 | |
LondonMetric Property PLC | | | 65,200 | | | | 166,072 | |
Marks & Spencer Group PLC | | | 21,900 | | | | 93,651 | |
Meggitt PLC | | | 11,454 | | | | 75,455 | |
Melrose Industries PLC | | | 47,201 | | | | 151,691 | |
Merlin Entertainments PLC(2) | | | 18,929 | | | | 88,290 | |
Micro Focus International PLC | | | 18,295 | | | | 559,260 | |
Mimecast, Ltd.(1) | | | 2,500 | | | | 76,875 | |
Mondi PLC | | | 5,400 | | | | 143,927 | |
Moneysupermarket.com Group PLC | | | 19,945 | | | | 95,909 | |
National Grid PLC | | | 100,230 | | | | 1,148,451 | |
NCC Group PLC | | | 32,556 | | | | 92,904 | |
NEPI Rockcastle PLC | | | 8,700 | | | | 118,611 | |
Next PLC | | | 2,030 | | | | 146,578 | |
Pearson PLC | | | 10,040 | | | | 98,819 | |
Pennon Group PLC | | | 27,207 | | | | 278,118 | |
Persimmon PLC | | | 4,000 | | | | 142,194 | |
Playtech PLC | | | 15,021 | | | | 169,053 | |
Provident Financial PLC | | | 10,491 | | | | 100,439 | |
Randgold Resources, Ltd. | | | 1,380 | | | | 139,421 | |
Reckitt Benckiser Group PLC | | | 4,336 | | | | 418,728 | |
RELX PLC | | | 7,273 | | | | 160,950 | |
Rentokil Initial PLC | | | 17,999 | | | | 75,921 | |
Rightmove PLC | | | 3,180 | | | | 199,332 | |
Rio Tinto PLC | | | 9,070 | | | | 504,863 | |
Rolls-Royce Holdings PLC | | | 12,632 | | | | 156,745 | |
Royal Dutch Shell PLC, Class A | | | 25,050 | | | | 878,219 | |
Royal Dutch Shell PLC, Class B | | | 25,957 | | | | 920,759 | |
Royal Mail PLC | | | 12,695 | | | | 84,582 | |
RPC Group PLC | | | 11,288 | | | | 136,372 | |
RSA Insurance Group PLC | | | 15,015 | | | | 132,121 | |
Sage Group PLC (The) | | | 38,000 | | | | 404,609 | |
Savills PLC | | | 11,000 | | | | 160,223 | |
Segro PLC | | | 29,923 | | | | 247,469 | |
Severn Trent PLC | | | 13,453 | | | | 373,852 | |
Shaftesbury PLC | | | 10,274 | | | | 146,011 | |
Sky PLC(1) | | | 6,960 | | | | 104,677 | |
Spirax-Sarco Engineering PLC | | | 959 | | | | 77,240 | |
St. James’s Place PLC | | | 4,600 | | | | 77,663 | |
Standard Life Aberdeen PLC | | | 27,303 | | | | 165,033 | |
Synthomer PLC | | | 17,348 | | | | 116,792 | |
| | | | | | | | |
| Security | | Shares | | | Value | |
|
United Kingdom (continued) | |
TalkTalk Telecom Group PLC | | | 75,000 | | | $ | 126,690 | |
Tate & Lyle PLC | | | 16,484 | | | | 150,263 | |
Travis Perkins PLC | | | 3,350 | | | | 69,472 | |
Tritax Big Box REIT PLC | | | 51,456 | | | | 108,979 | |
UBM PLC | | | 7,535 | | | | 97,144 | |
Unilever PLC | | | 8,140 | | | | 460,694 | |
UNITE Group PLC (The) | | | 9,707 | | | | 109,935 | |
United Utilities Group PLC | | | 30,732 | | | | 322,368 | |
Victrex PLC | | | 3,358 | | | | 121,835 | |
Vodafone Group PLC | | | 536,500 | | | | 1,710,273 | |
WH Smith PLC | | | 2,540 | | | | 77,040 | |
Whitbread PLC | | | 1,688 | | | | 93,034 | |
William Hill PLC | | | 12,074 | | | | 53,092 | |
WPP PLC | | | 11,945 | | | | 216,324 | |
| | | | | | | | | |
| | | $ | 23,081,583 | |
| | | | | | | | | |
| |
Total Common Stocks
(identified cost $203,659,433) | | | $ | 254,689,088 | |
| | | | | | | | | |
|
| Short-Term Investments — 0.9% | |
| | |
| | | | | | | | |
| Description | | Units | | | Value | |
Eaton Vance Cash Reserves Fund, LLC, 1.65%(5) | | | 2,188,721 | | | $ | 2,188,941 | |
| | | | | | | | | |
| |
Total Short-Term Investments
(identified cost $2,188,722) | | | $ | 2,188,941 | |
| | | | | | | | | |
| |
Total Investments — 100.1%
(identified cost $205,848,155) | | | $ | 256,878,029 | |
| | | | | | | | | |
| |
Other Assets, Less Liabilities — (0.1)% | | | $ | (181,742 | ) |
| | | | | | | | | |
| |
Net Assets — 100.0% | | | $ | 256,696,287 | |
| | | | | | | | | |
The percentage shown for each investment category in the Portfolio of Investments is based on net assets.
| (1) | Non-income producing security. |
| (2) | Security exempt from registration pursuant to Rule 144A under the Securities Act of 1933, as amended. These securities may be sold in certain transactions in reliance on an exemption from registration (normally to qualified institutional buyers). At January 31, 2018, the aggregate value of these securities is $6,907,522 or 2.7% of the Fund’s net assets. |
| (3) | For fair value measurement disclosure purposes, security is categorized as Level 3 (see Note 9). |
| (4) | Securities are traded on separate exchanges for the same entity. |
| (5) | Affiliated investment company, available to Eaton Vance portfolios and funds, which invests in high quality, U.S. dollar denominated money market instruments. The rate shown is the annualized seven-day yield as of January 31, 2018. |
| | | | |
| | 19 | | See Notes to Financial Statements. |
Parametric International Equity Fund
January 31, 2018
Portfolio of Investments — continued
| | | | | | | | |
| Currency Concentration of Portfolio | |
| | |
| | | | | | | | |
| Currency | | Percentage of Net Assets | | | Value | |
Euro | | | 38.3 | % | | $ | 98,252,552 | |
Japanese Yen | | | 13.3 | | | | 34,054,119 | |
British Pound Sterling | | | 9.5 | | | | 24,314,804 | |
Swiss Franc | | | 9.2 | | | | 23,530,997 | |
Australian Dollar | | | 8.8 | | | | 22,675,490 | |
Swedish Krona | | | 4.5 | | | | 11,434,815 | |
Hong Kong Dollar | | | 4.1 | | | | 10,469,260 | |
United States Dollar | | | 3.2 | | | | 8,309,641 | |
Danish Krone | | | 2.2 | | | | 5,632,178 | |
Norwegian Krone | | | 2.2 | | | | 5,597,027 | |
Singapore Dollar | | | 2.0 | | | | 5,079,322 | |
Israeli Shekel | | | 1.7 | | | | 4,451,547 | |
New Zealand Dollar | | | 1.1 | | | | 2,957,666 | |
South African Rand | | | 0.0 | * | | | 118,611 | |
| | |
Total Investments | | | 100.1 | % | | $ | 256,878,029 | |
| | |
| * | Amount is less than 0.1%. |
| | | | | | | | |
| Sector Classification of Portfolio | |
| | |
| | | | | | | | |
| Sector | | Percentage
of Net Assets | | | Value | |
Financials | | | 11.1 | % | | $ | 28,560,047 | |
Industrials | | | 10.7 | | | | 27,475,987 | |
Consumer Discretionary | | | 10.4 | | | | 26,800,963 | |
Consumer Staples | | | 10.4 | | | | 26,545,682 | |
Health Care | | | 9.5 | | | | 24,406,197 | |
Information Technology | | | 9.4 | | | | 24,155,746 | |
Materials | | | 9.4 | | | | 23,979,071 | |
Real Estate | | | 8.2 | | | | 21,057,568 | |
Telecommunication Services | | | 8.1 | | | | 20,788,328 | |
Utilities | | | 6.7 | | | | 17,299,496 | |
Energy | | | 5.3 | | | | 13,620,003 | |
Short-Term Investments | | | 0.9 | | | | 2,188,941 | |
| | |
Total Investments | | | 100.1 | % | | $ | 256,878,029 | |
| | |
Abbreviations:
| | | | |
| ADR | | – | | American Depositary Receipt |
| CDI | | – | | CHESS Depositary Interest |
| PC | | – | | Participation Certificate |
| PFC Shares | | – | | Preference Shares |
| SDR | | – | | Swedish Depositary Receipt |
| | | | |
| | 20 | | See Notes to Financial Statements. |
Parametric International Equity Fund
January 31, 2018
Statement of Assets and Liabilities
| | | | |
| Assets | | January 31, 2018 | |
Unaffiliated investments, at value (identified cost, $203,659,433) | | $ | 254,689,088 | |
Affiliated investment, at value (identified cost, $2,188,722) | | | 2,188,941 | |
Foreign currency, at value (identified cost, $236,423) | | | 236,716 | |
Dividends receivable | | | 211,294 | |
Dividends receivable from affiliated investment | | | 2,852 | |
Receivable for Fund shares sold | | | 706,590 | |
Tax reclaims receivable | | | 331,879 | |
Receivable from affiliates | | | 31,377 | |
Total assets | | $ | 258,398,737 | |
| |
| Liabilities | | | | |
Payable for investments purchased | | $ | 1,381,325 | |
Payable for Fund shares redeemed | | | 58,152 | |
Payable to affiliates: | | | | |
Investment adviser and administration fee | | | 84,833 | |
Distribution and service fees | | | 12,761 | |
Accrued expenses | | | 165,379 | |
Total liabilities | | $ | 1,702,450 | |
Net Assets | | $ | 256,696,287 | |
| |
| Sources of Net Assets | | | | |
Paid-in capital | | $ | 205,880,760 | |
Accumulated distributions in excess of net investment income | | | (1,383,428 | ) |
Accumulated net realized gain | | | 1,142,923 | |
Net unrealized appreciation | | | 51,056,032 | |
Total | | $ | 256,696,287 | |
| |
| Investor Class Shares | | | | |
Net Assets | | $ | 59,857,569 | |
Shares Outstanding | | | 4,171,996 | |
Net Asset Value, Offering Price and Redemption Price Per Share | | | | |
(net assets ÷ shares of beneficial interest outstanding) | | $ | 14.35 | |
|
| Institutional Class Shares | |
Net Assets | | $ | 86,446,496 | |
Shares Outstanding | | | 6,000,047 | |
Net Asset Value, Offering Price and Redemption Price Per Share | | | | |
(net assets ÷ shares of beneficial interest outstanding) | | $ | 14.41 | |
|
| Class R Shares | |
Net Assets | | $ | 1,166,724 | |
Shares Outstanding | | | 81,629 | |
Net Asset Value, Offering Price and Redemption Price Per Share | | | | |
(net assets ÷ shares of beneficial interest outstanding) | | $ | 14.29 | |
|
| Class R6 Shares | |
Net Assets | | $ | 109,225,498 | |
Shares Outstanding | | | 7,581,766 | |
Net Asset Value, Offering Price and Redemption Price Per Share | | | | |
(net assets ÷ shares of beneficial interest outstanding) | | $ | 14.41 | |
| | | | |
| | 21 | | See Notes to Financial Statements. |
Parametric International Equity Fund
January 31, 2018
Statement of Operations
| | | | |
| Investment Income | | Year Ended
January 31, 2018 | |
Dividends (net of foreign taxes, $627,481) | | $ | 6,526,987 | |
Dividends from affiliated investment | | | 19,240 | |
Total investment income | | $ | 6,546,227 | |
| |
| Expenses | | | | |
Investment adviser and administration fee | | $ | 912,507 | |
Distribution and service fees | | | | |
Investor Class | | | 126,115 | |
Class R | | | 5,432 | |
Trustees’ fees and expenses | | | 11,738 | |
Custodian fee | | | 140,128 | |
Transfer and dividend disbursing agent fees | | | 89,928 | |
Legal and accounting services | | | 56,914 | |
Printing and postage | | | 23,807 | |
Registration fees | | | 86,524 | |
Miscellaneous | | | 43,287 | |
Total expenses | | $ | 1,496,380 | |
Deduct — | | | | |
Allocation of expenses to affiliates | | $ | 250,576 | |
Total expense reductions | | $ | 250,576 | |
| |
Net expenses | | $ | 1,245,804 | |
| |
Net investment income | | $ | 5,300,423 | |
| |
| Realized and Unrealized Gain (Loss) | | | | |
Net realized gain (loss) — | | | | |
Investment transactions | | $ | 5,582,905 | |
Investment transactions — affiliated investment | | | (127 | ) |
Foreign currency transactions | | | 3,362 | |
Net realized gain | | $ | 5,586,140 | |
Change in unrealized appreciation (depreciation) — | | | | |
Investments | | $ | 43,425,421 | |
Investments — affiliated investment | | | 219 | |
Foreign currency | | | 32,127 | |
Net change in unrealized appreciation (depreciation) | | $ | 43,457,767 | |
| |
Net realized and unrealized gain | | $ | 49,043,907 | |
| |
Net increase in net assets from operations | | $ | 54,344,330 | |
| | | | |
| | 22 | | See Notes to Financial Statements. |
Parametric International Equity Fund
January 31, 2018
Statements of Changes in Net Assets
| | | | | | | | |
| | | Year Ended January 31, | |
| Increase (Decrease) in Net Assets | | 2018 | | | 2017 | |
From operations — | | | | | | | | |
Net investment income | | $ | 5,300,423 | | | $ | 2,836,157 | |
Net realized gain (loss) | | | 5,586,140 | | | | (2,158,297 | ) |
Net change in unrealized appreciation (depreciation) | | | 43,457,767 | | | | 11,245,579 | |
Net increase in net assets from operations | | $ | 54,344,330 | | | $ | 11,923,439 | |
Distributions to shareholders — | | | | | | | | |
From net investment income | | | | | | | | |
Investor Class | | $ | (1,486,587 | ) | | $ | (467,005 | ) |
Institutional Class | | | (2,196,786 | ) | | | (820,850 | ) |
Class R | | | (25,865 | ) | | | (11,227 | ) |
Class R6 | | | (2,816,034 | ) | | | (1,351,722 | ) |
From net realized gain | | | | | | | | |
Investor Class | | | — | | | | (10,744 | ) |
Institutional Class | | | — | | | | (28,437 | ) |
Class R | | | — | | | | (4 | ) |
Class R6 | | | — | | | | (58,408 | ) |
Total distributions to shareholders | | $ | (6,525,272 | ) | | $ | (2,748,397 | ) |
Transactions in shares of beneficial interest — | | | | | | | | |
Proceeds from sale of shares | | | | | | | | |
Investor Class | | $ | 33,141,322 | | | $ | 28,247,632 | |
Institutional Class | | | 35,797,290 | | | | 29,423,191 | |
Class R | | | 463,484 | | | | 844,401 | |
Class R6 | | | 48,292,478 | | | | 39,653,684 | |
Net asset value of shares issued to shareholders in payment of distributions declared | | | | | | | | |
Investor Class | | | 1,162,366 | | | | 401,787 | |
Institutional Class | | | 1,799,165 | | | | 654,313 | |
Class R | | | 25,865 | | | | 11,215 | |
Class R6 | | | 2,215,954 | | | | 343,621 | |
Cost of shares redeemed | | | | | | | | |
Investor Class | | | (19,269,279 | ) | | | (7,455,796 | ) |
Institutional Class | | | (21,722,920 | ) | | | (8,314,075 | ) |
Class R | | | (343,580 | ) | | | (74,649 | ) |
Class R6 | | | (48,038,853 | ) | | | (21,042,590 | ) |
Net increase in net assets from Fund share transactions | | $ | 33,523,292 | | | $ | 62,692,734 | |
| | |
Net increase in net assets | | $ | 81,342,350 | | | $ | 71,867,776 | |
|
| Net Assets | |
At beginning of year | | $ | 175,353,937 | | | $ | 103,486,161 | |
At end of year | | $ | 256,696,287 | | | $ | 175,353,937 | |
|
Accumulated distributions in excess of net investment income
included in net assets | |
At end of year | | $ | (1,383,428 | ) | | $ | (252,648 | ) |
| | | | |
| | 23 | | See Notes to Financial Statements. |
Parametric International Equity Fund
January 31, 2018
Financial Highlights
| | | | | | | | | | | | | | | | | | | | |
| | | Investor Class | |
| | | Year Ended January 31, | |
| | | 2018 | | | 2017 | | | 2016 | | | 2015 | | | 2014 | |
Net asset value — Beginning of year | | $ | 11.570 | | | $ | 10.750 | | | $ | 11.410 | | | $ | 11.960 | | | $ | 11.180 | |
| | | | | |
| Income (Loss) From Operations | | | | | | | | | | | | | | | | | | | | |
Net investment income(1) | | $ | 0.272 | | | $ | 0.198 | | | $ | 0.217 | | | $ | 0.355 | (2) | | $ | 0.195 | |
Net realized and unrealized gain (loss) | | | 2.869 | | | | 0.810 | | | | (0.607 | ) | | | (0.242 | ) | | | 0.822 | |
| | | | | |
Total income (loss) from operations | | $ | 3.141 | | | $ | 1.008 | | | $ | (0.390 | ) | | $ | 0.113 | | | $ | 1.017 | |
| | | | | |
| Less Distributions | | | | | | | | | | | | | | | | | | | | |
From net investment income | | $ | (0.361 | ) | | $ | (0.178 | ) | | $ | (0.266 | ) | | $ | (0.251 | ) | | $ | (0.237 | ) |
From net realized gain | | | — | | | | (0.010 | ) | | | (0.004 | ) | | | (0.412 | ) | | | — | |
| | | | | |
Total distributions | | $ | (0.361 | ) | | $ | (0.188 | ) | | $ | (0.270 | ) | | $ | (0.663 | ) | | $ | (0.237 | ) |
| | | | | |
Net asset value — End of year | | $ | 14.350 | | | $ | 11.570 | | | $ | 10.750 | | | $ | 11.410 | | | $ | 11.960 | |
| | | | | |
Total Return(3)(4) | | | 27.29 | % | | | 9.55 | % | | | (3.73 | )% | | | 1.01 | % | | | 9.04 | % |
| | | | | |
| Ratios/Supplemental Data | | | | | | | | | | | | | | | | | | | | |
Net assets, end of year (000’s omitted) | | $ | 59,858 | | | $ | 34,386 | | | $ | 12,069 | | | $ | 8,503 | | | $ | 14,007 | |
Ratios (as a percentage of average daily net assets): | | | | | | | | | | | | | | | | | | | | |
Expenses(4)(5) | | | 0.75 | % | | | 0.84 | % | | | 0.90 | % | | | 0.97 | % | | | 1.05 | % |
Net investment income | | | 2.06 | % | | | 1.75 | % | | | 1.86 | % | | | 2.83 | %(2) | | | 1.65 | % |
Portfolio Turnover | | | 36 | % | | | 22 | % | | | 34 | % | | | 63 | % | | | 35 | % |
| (1) | Computed using average shares outstanding. |
| (2) | Net investment income per share reflects special dividends which amounted to $0.059 per share. Excluding special dividends, the ratio of net investment income to average daily net assets would have been 2.35%. |
| (3) | Returns are historical and are calculated by determining the percentage change in net asset value with all distributions reinvested and do not reflect the effect of sales charges, if applicable, which were eliminated effective March 1, 2013. |
| (4) | The investment adviser, sub-adviser and administrator reimbursed certain operating expenses (equal to 0.11%, 0.23%, 0.35%, 0.32%, and 0.29% of average daily net assets for the years ended January 31, 2018, 2017, 2016, 2015 and 2014, respectively). Absent this reimbursement, total return would be lower. |
| (5) | Excludes the effect of custody fee credits, if any, of less than 0.005%. Effective September 1, 2015, custody fee credits, which were earned on cash deposit balances, were discontinued by the custodian. |
| | | | |
| | 24 | | See Notes to Financial Statements. |
Parametric International Equity Fund
January 31, 2018
Financial Highlights — continued
| | | | | | | | | | | | | | | | | | | | |
| | | Institutional Class | |
| | | Year Ended January 31, | |
| | | 2018 | | | 2017 | | | 2016 | | | 2015 | | | 2014 | |
Net asset value — Beginning of year | | $ | 11.610 | | | $ | 10.770 | | | $ | 11.430 | | | $ | 11.990 | | | $ | 11.200 | |
| | | | | |
| Income (Loss) From Operations | | | | | | | | | | | | | | | | | | | | |
Net investment income(1) | | $ | 0.312 | | | $ | 0.257 | | | $ | 0.325 | | | $ | 0.333 | (2) | | $ | 0.259 | |
Net realized and unrealized gain (loss) | | | 2.874 | | | | 0.788 | | | | (0.693 | ) | | | (0.184 | ) | | | 0.790 | |
| | | | | |
Total income (loss) from operations | | $ | 3.186 | | | $ | 1.045 | | | $ | (0.368 | ) | | $ | 0.149 | | | $ | 1.049 | |
| | | | | |
| Less Distributions | | | | | | | | | | | | | | | | | | | | |
From net investment income | | $ | (0.386 | ) | | $ | (0.195 | ) | | $ | (0.288 | ) | | $ | (0.297 | ) | | $ | (0.259 | ) |
From net realized gain | | | — | | | | (0.010 | ) | | | (0.004 | ) | | | (0.412 | ) | | | — | |
| | | | | |
Total distributions | | $ | (0.386 | ) | | $ | (0.205 | ) | | $ | (0.292 | ) | | $ | (0.709 | ) | | $ | (0.259 | ) |
| | | | | |
Net asset value — End of year | | $ | 14.410 | | | $ | 11.610 | | | $ | 10.770 | | | $ | 11.430 | | | $ | 11.990 | |
| | | | | |
Total Return(3)(4) | | | 27.60 | % | | | 9.78 | % | | | (3.37 | )% | | | 1.22 | % | | | 9.31 | % |
| | | | | |
| Ratios/Supplemental Data | | | | | | | | | | | | | | | | | | | | |
Net assets, end of year (000’s omitted) | | $ | 86,446 | | | $ | 55,324 | | | $ | 30,808 | | | $ | 84,195 | | | $ | 68,911 | |
Ratios (as a percentage of average daily net assets): | | | | | | | | | | | | | | | | | | | | |
Expenses(4)(5) | | | 0.50 | % | | | 0.60 | % | | | 0.65 | % | | | 0.72 | % | | | 0.80 | % |
Net investment income | | | 2.36 | % | | | 2.26 | % | | | 2.72 | % | | | 2.66 | %(2) | | | 2.20 | % |
Portfolio Turnover | | | 36 | % | | | 22 | % | | | 34 | % | | | 63 | % | | | 35 | % |
| (1) | Computed using average shares outstanding. |
| (2) | Net investment income per share reflects special dividends which amounted to $0.048 per share. Excluding special dividends, the ratio of net investment income to average daily net assets would have been 2.28%. |
| (3) | Returns are historical and are calculated by determining the percentage change in net asset value with all distributions reinvested. |
| (4) | The investment adviser, sub-adviser and administrator reimbursed certain operating expenses (equal to 0.11%, 0.24%, 0.35%, 0.32%, and 0.29% of average daily net assets for the years ended January 31, 2018, 2017, 2016, 2015 and 2014, respectively). Absent this reimbursement, total return would be lower. |
| (5) | Excludes the effect of custody fee credits, if any, of less than 0.005%. Effective September 1, 2015, custody fee credits, which were earned on cash deposit balances, were discontinued by the custodian. |
| | | | |
| | 25 | | See Notes to Financial Statements. |
Parametric International Equity Fund
January 31, 2018
Financial Highlights — continued
| | | | | | | | | | | | |
| | | Class R | |
| | | Year Ended January 31, | | | Period Ended
January 31, 2016(1) | |
| | | 2018 | | | 2017 | | |
Net asset value — Beginning of period | | $ | 11.530 | | | $ | 10.740 | | | $ | 12.340 | |
| | | |
| Income (Loss) From Operations | | | | | | | | | | | | |
Net investment income(2) | | $ | 0.259 | | | $ | 0.064 | | | $ | 0.044 | |
Net realized and unrealized gain (loss) | | | 2.827 | | | | 0.919 | | | | (1.384 | ) |
| | | |
Total income (loss) from operations | | $ | 3.086 | | | $ | 0.983 | | | $ | (1.340 | ) |
| | | |
| Less Distributions | | | | | | | | | | | | |
From net investment income | | $ | (0.326 | ) | | $ | (0.183 | ) | | $ | (0.256 | ) |
From net realized gain | | | — | | | | (0.010 | ) | | | (0.004 | ) |
| | | |
Total distributions | | $ | (0.326 | ) | | $ | (0.193 | ) | | $ | (0.260 | ) |
| | | |
Net asset value — End of period | | $ | 14.290 | | | $ | 11.530 | | | $ | 10.740 | |
| | | |
Total Return(3)(4) | | | 26.90 | % | | | 9.22 | % | | | (10.98 | )%(5) |
| | | |
| Ratios/Supplemental Data | | | | | | | | | | | | |
Net assets, end of period (000’s omitted) | | $ | 1,167 | | | $ | 786 | | | $ | 1 | |
Ratios (as a percentage of average daily net assets): | | | | | | | | | | | | |
Expenses(4) | | | 1.00 | % | | | 1.04 | % | | | 1.15 | %(6) |
Net investment income | | | 1.98 | % | | | 0.56 | % | | | 0.82 | %(6) |
Portfolio Turnover | | | 36 | % | | | 22 | % | | | 34 | %(7) |
| (1) | For the period from commencement of operations, August 10, 2015, to January 31, 2016. |
| (2) | Computed using average shares outstanding. |
| (3) | Returns are historical and are calculated by determining the percentage change in net asset value with all distributions reinvested. |
| (4) | The investment adviser, sub-adviser and administrator reimbursed certain operating expenses (equal to 0.11%, 0.19% and 0.35% of average daily net assets for the years ended January 31, 2018 and 2017 and the period ended January 31, 2016, respectively). Absent this reimbursement, total return would be lower. |
| (7) | For the Fund’s year ended January 31, 2016. |
| | | | |
| | 26 | | See Notes to Financial Statements. |
Parametric International Equity Fund
January 31, 2018
Financial Highlights — continued
| | | | | | | | | | | | |
| | | Class R6 | |
| | | Year Ended January 31, | | | Period Ended January 31, 2016(1) | |
| | | 2018 | | | 2017 | | |
Net asset value — Beginning of period | | $ | 11.610 | | | $ | 10.770 | | | $ | 12.380 | |
|
| Income (Loss) From Operations | |
Net investment income(2) | | $ | 0.319 | | | $ | 0.267 | | | $ | 0.059 | |
Net realized and unrealized gain (loss) | | | 2.875 | | | | 0.780 | | | | (1.374 | ) |
| | | |
Total income (loss) from operations | | $ | 3.194 | | | $ | 1.047 | | | $ | (1.315 | ) |
|
| Less Distributions | |
From net investment income | | $ | (0.394 | ) | | $ | (0.197 | ) | | $ | (0.291 | ) |
From net realized gain | | | — | | | | (0.010 | ) | | | (0.004 | ) |
| | | |
Total distributions | | $ | (0.394 | ) | | $ | (0.207 | ) | | $ | (0.295 | ) |
| | | |
Net asset value — End of period | | $ | 14.410 | | | $ | 11.610 | | | $ | 10.770 | |
| | | |
Total Return(3)(4) | | | 27.67 | % | | | 9.79 | % | | | (10.77 | )%(5) |
|
| Ratios/Supplemental Data | |
Net assets, end of period (000’s omitted) | | $ | 109,225 | | | $ | 84,858 | | | $ | 60,608 | |
Ratios (as a percentage of average daily net assets): | | | | | | | | | | | | |
Expenses(4) | | | 0.47 | % | | | 0.58 | % | | | 0.62 | %(6) |
Net investment income | | | 2.42 | % | | | 2.34 | % | | | 1.10 | %(6) |
Portfolio Turnover | | | 36 | % | | | 22 | % | | | 34 | %(7) |
| (1) | For the period from commencement of operations, August 10, 2015, to January 31, 2016. |
| (2) | Computed using average shares outstanding. |
| (3) | Returns are historical and are calculated by determining the percentage change in net asset value with all distributions reinvested. |
| (4) | The investment adviser, sub-adviser and administrator reimbursed certain operating expenses (equal to 0.11%, 0.25% and 0.35% of average daily net assets for the years ended January 31, 2018 and 2017 and the period ended January 31, 2016, respectively). Absent this reimbursement, total return would be lower. |
| (7) | For the Fund’s year ended January 31, 2016. |
| | | | |
| | 27 | | See Notes to Financial Statements. |
Parametric International Equity Fund
January 31, 2018
Notes to Financial Statements
1 Significant Accounting Policies
Parametric International Equity Fund (the Fund) is a diversified series of Eaton Vance Mutual Funds Trust (the Trust). The Trust is a Massachusetts business trust registered under the Investment Company Act of 1940, as amended (the 1940 Act), as an open-end management investment company. The Fund’s investment objective is to seek long-term capital appreciation. The Fund offers four classes of shares, Investor Class, Institutional Class, Class R and Class R6, all of which are sold at net asset value and are not subject to a sales charge. Each class represents a pro-rata interest in the Fund, but votes separately on class-specific matters and (as noted below) is subject to different expenses. Realized and unrealized gains and losses and net investment income and losses, other than class-specific expenses, are allocated daily to each class of shares based on the relative net assets of each class to the total net assets of the Fund. Sub-accounting, recordkeeping and similar administrative fees payable to financial intermediaries, which are a component of transfer and dividend disbursing agent fees on the Statement of Operations, are not allocated to Class R6 shares. Each class of shares differs in its distribution plan and certain other class-specific expenses.
The following is a summary of significant accounting policies of the Fund. The policies are in conformity with accounting principles generally accepted in the United States of America (U.S. GAAP). The Fund is an investment company and follows accounting and reporting guidance in the Financial Accounting Standards Board (FASB) Accounting Standards Codification Topic 946.
A Investment Valuation — The following methodologies are used to determine the market value or fair value of investments.
Equity Securities. Equity securities listed on a U.S. securities exchange generally are valued at the last sale or closing price on the day of valuation or, if no sales took place on such date, at the mean between the closing bid and asked prices therefore on the exchange where such securities are principally traded. Equity securities listed on the NASDAQ Global or Global Select Market generally are valued at the NASDAQ official closing price. Unlisted or listed securities for which closing sales prices or closing quotations are not available are valued at the mean between the latest available bid and asked prices.
Foreign Securities and Currencies. Foreign securities and currencies are valued in U.S. dollars, based on foreign currency exchange rate quotations supplied by a third party pricing service. The pricing service uses a proprietary model to determine the exchange rate. Inputs to the model include reported trades and implied bid/ask spreads. The daily valuation of exchange-traded foreign securities generally is determined as of the close of trading on the principal exchange on which such securities trade. Events occurring after the close of trading on foreign exchanges may result in adjustments to the valuation of foreign securities to more accurately reflect their fair value as of the close of regular trading on the New York Stock Exchange. When valuing foreign equity securities that meet certain criteria, the Fund’s Trustees have approved the use of a fair value service that values such securities to reflect market trading that occurs after the close of the applicable foreign markets of comparable securities or other instruments that have a strong correlation to the fair-valued securities.
Affiliated Fund. The Fund may invest in Eaton Vance Cash Reserves Fund, LLC (Cash Reserves Fund), an affiliated investment company managed by Eaton Vance Management (EVM). While Cash Reserves Fund is not a registered money market mutual fund, it conducts all of its investment activities in accordance with the requirements of Rule 2a-7 under the 1940 Act. Investments in Cash Reserves Fund are valued at the closing net asset value per unit on the valuation day. Cash Reserves Fund generally values its investment securities based on available market quotations provided by a third party pricing service.
Fair Valuation. Investments for which valuations or market quotations are not readily available or are deemed unreliable are valued at fair value using methods determined in good faith by or at the direction of the Trustees of the Fund in a manner that fairly reflects the security’s value, or the amount that the Fund might reasonably expect to receive for the security upon its current sale in the ordinary course. Each such determination is based on a consideration of relevant factors, which are likely to vary from one pricing context to another. These factors may include, but are not limited to, the type of security, the existence of any contractual restrictions on the security’s disposition, the price and extent of public trading in similar securities of the issuer or of comparable companies or entities, quotations or relevant information obtained from broker/dealers or other market participants, information obtained from the issuer, analysts, and/or the appropriate stock exchange (for exchange-traded securities), an analysis of the company’s or entity’s financial condition, and an evaluation of the forces that influence the issuer and the market(s) in which the security is purchased and sold.
B Investment Transactions — Investment transactions for financial statement purposes are accounted for on a trade date basis. Realized gains and losses on investments sold are determined on the basis of identified cost.
C Income — Dividend income is recorded on the ex-dividend date for dividends received in cash and/or securities. However, if the ex-dividend date has passed, certain dividends from foreign securities are recorded as the Fund is informed of the ex-dividend date. Withholding taxes on foreign dividends and capital gains have been provided for in accordance with the Fund’s understanding of the applicable countries’ tax rules and rates. Interest income is recorded on the basis of interest accrued, adjusted for amortization of premium or accretion of discount.
D Federal Taxes — The Fund’s policy is to comply with the provisions of the Internal Revenue Code applicable to regulated investment companies and to distribute to shareholders each year substantially all of its net investment income, and all or substantially all of its net realized capital gains. Accordingly, no provision for federal income or excise tax is necessary.
As of January 31, 2018, the Fund had no uncertain tax positions that would require financial statement recognition, de-recognition, or disclosure. The Fund files a U.S. federal income tax return annually after its fiscal year-end, which is subject to examination by the Internal Revenue Service for a period of three years from the date of filing.
Parametric International Equity Fund
January 31, 2018
Notes to Financial Statements — continued
E Expenses — The majority of expenses of the Trust are directly identifiable to an individual fund. Expenses which are not readily identifiable to a specific fund are allocated taking into consideration, among other things, the nature and type of expense and the relative size of the funds.
F Foreign Currency Translation — Investment valuations, other assets, and liabilities initially expressed in foreign currencies are translated each business day into U.S. dollars based upon current exchange rates. Purchases and sales of foreign investment securities and income and expenses denominated in foreign currencies are translated into U.S. dollars based upon currency exchange rates in effect on the respective dates of such transactions. Recognized gains or losses on investment transactions attributable to changes in foreign currency exchange rates are recorded for financial statement purposes as net realized gains and losses on investments. That portion of unrealized gains and losses on investments that results from fluctuations in foreign currency exchange rates is not separately disclosed.
G Use of Estimates — The preparation of the financial statements in conformity with U.S. GAAP requires management to make estimates and assumptions that affect the reported amounts of assets and liabilities at the date of the financial statements and the reported amounts of income and expense during the reporting period. Actual results could differ from those estimates.
H Indemnifications — Under the Trust’s organizational documents, its officers and Trustees may be indemnified against certain liabilities and expenses arising out of the performance of their duties to the Fund. Under Massachusetts law, if certain conditions prevail, shareholders of a Massachusetts business trust (such as the Trust) could be deemed to have personal liability for the obligations of the Trust. However, the Trust’s Declaration of Trust contains an express disclaimer of liability on the part of Fund shareholders and the By-laws provide that the Trust shall assume the defense on behalf of any Fund shareholders. Moreover, the By-laws also provide for indemnification out of Fund property of any shareholder held personally liable solely by reason of being or having been a shareholder for all loss or expense arising from such liability. Additionally, in the normal course of business, the Fund enters into agreements with service providers that may contain indemnification clauses. The Fund’s maximum exposure under these arrangements is unknown as this would involve future claims that may be made against the Fund that have not yet occurred.
2 Distributions to Shareholders and Income Tax Information
It is the present policy of the Fund to make at least one distribution annually (normally in December) of all or substantially all of its net investment income and to distribute annually all or substantially all of its net realized capital gains. Distributions to shareholders are recorded on the ex-dividend date. Distributions are declared separately for each class of shares. Shareholders may reinvest income and capital gain distributions in additional shares of the same class of the Fund at the net asset value as of the ex-dividend date or, at the election of the shareholder, receive distributions in cash. Distributions to shareholders are determined in accordance with income tax regulations, which may differ from U.S. GAAP. As required by U.S. GAAP, only distributions in excess of tax basis earnings and profits are reported in the financial statements as a return of capital. Permanent differences between book and tax accounting relating to distributions are reclassified to paid-in capital. For tax purposes, distributions from short-term capital gains are considered to be from ordinary income.
The tax character of distributions declared for the years ended January 31, 2018 and January 31, 2017 was as follows:
| | | | | | | | |
| | | Year Ended January 31, | |
| | | 2018 | | | 2017 | |
| | |
Distributions declared from: | | | | | | | | |
Ordinary income | | $ | 6,525,272 | | | $ | 2,651,163 | |
Long-term capital gains | | $ | — | | | $ | 97,234 | |
During the year ended January 31, 2018, accumulated net realized gain was decreased by $1,774,757, accumulated distributions in excess of net investment income was decreased by $94,069 and paid-in capital was increased by $1,680,688 due to the Fund’s use of equalization accounting and differences between book and tax accounting, primarily for foreign currency gain (loss), investments in passive foreign investment companies (PFICs) and investments in partnerships. Tax equalization accounting allows the Fund to treat as a distribution that portion of redemption proceeds representing a redeeming shareholder’s portion of undistributed taxable income and net capital gains. These reclassifications had no effect on the net assets or net asset value per share of the Fund.
As of January 31, 2018, the components of distributable earnings (accumulated losses) on a tax basis were as follows:
| | | | |
Undistributed ordinary income | | $ | 2,225,288 | |
Undistributed long-term capital gains | | $ | 1,296,443 | |
Net unrealized appreciation | | $ | 47,293,796 | |
Parametric International Equity Fund
January 31, 2018
Notes to Financial Statements — continued
The differences between components of distributable earnings (accumulated losses) on a tax basis and the amounts reflected in the Statement of Assets and Liabilities are primarily due to wash sales, foreign currency transactions, investments in partnerships, investments in PFICs and the tax treatment of short-term capital gains.
The cost and unrealized appreciation (depreciation) of investments of the Fund at January 31, 2018, as determined on a federal income tax basis, were as follows:
| | | | |
| |
Aggregate cost | | $ | 209,609,760 | |
| |
Gross unrealized appreciation | | $ | 51,846,125 | |
Gross unrealized depreciation | | | (4,577,856 | ) |
| |
Net unrealized appreciation | | $ | 47,268,269 | |
3 Investment Adviser and Administration Fee and Other Transactions with Affiliates
The investment adviser and administration fee is earned by EVM as compensation for investment advisory and administrative services rendered to the Fund. Pursuant to the investment advisory and administrative agreement and subsequent fee reduction agreements between the Fund and EVM, the fee is computed at an annual rate of 0.40% of the Fund’s average daily net assets up to $1 billion and is payable monthly. On net assets of $1 billion and over, the annual fee is reduced. The fee reductions cannot be terminated or reduced without the approval of a majority vote of the Trustees of the Fund who are not interested persons of EVM or the Fund and by the vote of a majority of shareholders. For the year ended January 31, 2018, the investment adviser and administration fee amounted to $912,507 or 0.40% of the Fund’s average daily net assets. Pursuant to a sub-advisory agreement, EVM has delegated the investment management of the Fund to Parametric Portfolio Associates LLC (Parametric), a majority-owned subsidiary of Eaton Vance Corp. EVM pays Parametric a portion of its investment adviser and administration fee for sub-advisory services provided to the Fund. The Fund invests its cash in Cash Reserves Fund. EVM does not currently receive a fee for advisory services provided to Cash Reserves Fund.
EVM and Parametric have agreed to reimburse the Fund’s expenses to the extent that total annual operating expenses (relating to ordinary operating expenses only) exceed 0.75%, 0.50%, 1.00% and 0.47% of the Fund’s average daily net assets for Investor Class, Institutional Class, Class R and Class R6, respectively. This agreement may be changed or terminated after May 31, 2018. Pursuant to this agreement, EVM and Parametric were allocated $250,576 in total of the Fund’s operating expenses for the year ended January 31, 2018.
EVM provides sub-transfer agency and related services to the Fund pursuant to a Sub-Transfer Agency Support Services Agreement. For the year ended January 31, 2018, EVM earned $4,127 from the Fund pursuant to such agreement, which is included in transfer and dividend disbursing agent fees on the Statement of Operations. Eaton Vance Distributors, Inc. (EVD), an affiliate of EVM and the Fund’s principal underwriter, received distribution and service fees from Investor Class and Class R shares (see Note 4).
Trustees and officers of the Fund who are members of EVM’s organization receive remuneration for their services to the Fund out of the investment adviser and administration fee. Trustees of the Fund who are not affiliated with EVM may elect to defer receipt of all or a percentage of their annual fees in accordance with the terms of the Trustees Deferred Compensation Plan. For the year ended January 31, 2018, no significant amounts have been deferred. Certain officers and Trustees of the Fund are officers of EVM.
4 Distribution Plans
The Fund has in effect a distribution plan for Investor Class shares (Investor Class Plan) pursuant to Rule 12b-1 under the 1940 Act. Pursuant to the Investor Class Plan, the Fund pays EVD a distribution and service fee of 0.25% per annum of its average daily net assets attributable to Investor Class shares for distribution services and facilities provided to the Fund by EVD, as well as for personal services and/or the maintenance of shareholder accounts. Distribution and service fees paid or accrued to EVD for the year ended January 31, 2018 amounted to $126,115 for Investor Class shares.
The Fund also has in effect a distribution plan for Class R shares (Class R Plan) pursuant to Rule 12b-1 under the 1940 Act. The Class R Plan requires the Fund to pay EVD an amount up to 0.50% per annum of its average daily net assets attributable to Class R shares for providing ongoing distribution services and facilities to the Fund. The Trustees of the Trust have currently limited Class R distribution payments to 0.25% per annum of the average daily net assets attributable to Class R shares. For the year ended January 31, 2018, the Fund paid or accrued to EVD $2,716 for Class R shares.
Pursuant to the Class R Plan, the Fund also makes payments of service fees to EVD, financial intermediaries and other persons in amounts equal to 0.25% per annum of its average daily net assets attributable to that class. Service fees paid or accrued are for personal services and/or the maintenance of shareholder accounts. They are separate and distinct from the sales commissions and distribution fees payable to EVD. Service fees paid or accrued for the year ended January 31, 2018 amounted to $2,716 for Class R shares.
Distribution and service fees are subject to the limitations contained in the Financial Industry Regulatory Authority Rule 2341(d).
Parametric International Equity Fund
January 31, 2018
Notes to Financial Statements — continued
5 Purchases and Sales of Investments
Purchases and sales of investments, other than short-term obligations, aggregated $111,535,385 and $79,846,383, respectively, for the year ended January 31, 2018.
6 Shares of Beneficial Interest
The Fund’s Declaration of Trust permits the Trustees to issue an unlimited number of full and fractional shares of beneficial interest (without par value). Such shares may be issued in a number of different series (such as the Fund) and classes. Transactions in Fund shares were as follows:
| | | | | | | | |
| | | Year Ended January 31, | |
| Investor Class | | 2018 | | | 2017 | |
| | |
Sales | | | 2,564,884 | | | | 2,461,899 | |
Issued to shareholders electing to receive payments of distributions in Fund shares | | | 84,844 | | | | 36,143 | |
Redemptions | | | (1,449,992 | ) | | | (648,992 | ) |
| | |
Net increase | | | 1,199,736 | | | | 1,849,050 | |
| | |
| | | | | | | | |
| | | Year Ended January 31, | |
| Institutional Class | | 2018 | | | 2017 | |
| | |
Sales | | | 2,743,459 | | | | 2,578,901 | |
Issued to shareholders electing to receive payments of distributions in Fund shares | | | 130,848 | | | | 58,663 | |
Redemptions | | | (1,640,319 | ) | | | (732,346 | ) |
| | |
Net increase | | | 1,233,988 | | | | 1,905,218 | |
| | |
| | | | | | | | |
| | | Year Ended January 31, | |
| Class R | | 2018 | | | 2017 | |
| | |
Sales | | | 38,290 | | | | 73,744 | |
Issued to shareholders electing to receive payments of distributions in Fund shares | | | 1,895 | | | | 1,012 | |
Redemptions | | | (26,742 | ) | | | (6,651 | ) |
| | |
Net increase | | | 13,443 | | | | 68,105 | |
| | |
| | | | | | | | |
| | | Year Ended January 31, | |
| Class R6 | | 2018 | | | 2017 | |
| | |
Sales | | | 3,754,669 | | | | 3,485,699 | |
Issued to shareholders electing to receive payments of distributions in Fund shares | | | 161,160 | | | | 30,806 | |
Redemptions | | | (3,643,473 | ) | | | (1,835,321 | ) |
| | |
Net increase | | | 272,356 | | | | 1,681,184 | |
At January 31, 2018, donor advised and pooled income funds (established and maintained by a public charity) managed by EVM owned in the aggregate 22.1% of the value of the outstanding shares of the Fund.
Parametric International Equity Fund
January 31, 2018
Notes to Financial Statements — continued
7 Line of Credit
The Fund participates with other portfolios and funds managed by EVM and its affiliates in a $625 million unsecured line of credit agreement with a group of banks, which is in effect through October 30, 2018. Borrowings are made by the Fund solely to facilitate the handling of unusual and/or unanticipated short-term cash requirements. Interest is charged to the Fund based on its borrowings at an amount above either the Eurodollar rate or Federal Funds rate. In addition, a fee computed at an annual rate of 0.15% on the daily unused portion of the line of credit is allocated among the participating portfolios and funds at the end of each quarter. Because the line of credit is not available exclusively to the Fund, it may be unable to borrow some or all of its requested amounts at any particular time. The Fund did not have any significant borrowings or allocated fees during the year ended January 31, 2018.
8 Risks Associated with Foreign Investments
Investing in securities issued by companies whose principal business activities are outside the United States may involve significant risks not present in domestic investments. For example, there is generally less publicly available information about foreign companies, particularly those not subject to the disclosure and reporting requirements of the U.S. securities laws. Certain foreign issuers are generally not bound by uniform accounting, auditing, and financial reporting requirements and standards of practice comparable to those applicable to domestic issuers. Investments in foreign securities also involve the risk of possible adverse changes in investment or exchange control regulations, expropriation or confiscatory taxation, limitation on the removal of funds or other assets of the Fund, political or financial instability or diplomatic and other developments which could affect such investments. Foreign securities markets, while growing in volume and sophistication, are generally not as developed as those in the United States, and securities of some foreign issuers (particularly those located in developing countries) may be less liquid and more volatile than securities of comparable U.S. companies. In general, there is less overall governmental supervision and regulation of foreign securities markets, broker/dealers and issuers than in the United States.
9 Fair Value Measurements
Under generally accepted accounting principles for fair value measurements, a three-tier hierarchy to prioritize the assumptions, referred to as inputs, is used in valuation techniques to measure fair value. The three-tier hierarchy of inputs is summarized in the three broad levels listed below.
| • | | Level 1 – quoted prices in active markets for identical investments |
| • | | Level 2 – other significant observable inputs (including quoted prices for similar investments, interest rates, prepayment speeds, credit risk, etc.) |
| • | | Level 3 – significant unobservable inputs (including a fund’s own assumptions in determining the fair value of investments) |
In cases where the inputs used to measure fair value fall in different levels of the fair value hierarchy, the level disclosed is determined based on the lowest level input that is significant to the fair value measurement in its entirety. The inputs or methodology used for valuing securities are not necessarily an indication of the risk associated with investing in those securities.
At January 31, 2018, the hierarchy of inputs used in valuing the Fund’s investments, which are carried at value, were as follows:
| | | | | | | | | | | | | | | | |
| Asset Description | | Level 1 | | | Level 2 | | | Level 3* | | | Total | |
| | | | |
Common Stocks | | | | | | | | | | | | | | | | |
Asia/Pacific | | $ | 1,460,975 | | | $ | 75,899,869 | | | $ | 84,710 | | | $ | 77,445,554 | |
Developed Europe | | | 3,599,796 | | | | 167,783,658 | | | | — | | | | 171,383,454 | |
Developed Middle East | | | 1,408,533 | | | | 4,451,547 | | | | — | | | | 5,860,080 | |
| | | | |
Total Common Stocks | | $ | 6,469,304 | | | $ | 248,135,074 | ** | | $ | 84,710 | | | $ | 254,689,088 | |
| | | | |
Short-Term Investments | | $ | — | | | $ | 2,188,941 | | | $ | — | | | $ | 2,188,941 | |
| | | | |
Total Investments | | $ | 6,469,304 | | | $ | 250,324,015 | | | $ | 84,710 | | | $ | 256,878,029 | |
| * | None of the unobservable inputs for Level 3 assets, individually or collectively, had a material impact on the Fund. |
| ** | Includes foreign equity securities whose values were adjusted to reflect market trading of comparable securities or other correlated instruments that occurred after the close of trading in their applicable foreign markets. |
Level 3 investments at the beginning and/or end of the period in relation to net assets were not significant and accordingly, a reconciliation of Level 3 assets for the year ended January 31, 2018 is not presented. At January 31, 2018, the value of investments transferred between Level 1 and Level 2 during the year then ended was not significant.
Parametric International Equity Fund
January 31, 2018
Report of Independent Registered Public Accounting Firm
To the Trustees of Eaton Vance Mutual Funds Trust and Shareholders of Parametric International Equity Fund:
Opinion on the Financial Statements and Financial Highlights
We have audited the accompanying statement of assets and liabilities of Parametric International Equity Fund (the “Fund”) (one of the funds constituting Eaton Vance Mutual Funds Trust), including the portfolio of investments, as of January 31, 2018, the related statement of operations for the year then ended, the statements of changes in net assets for each of the two years in the period then ended, the financial highlights for each of the periods presented, and the related notes. In our opinion, the financial statements and financial highlights present fairly, in all material respects, the financial position of the Fund as of January 31, 2018, and the results of its operations for the year then ended, the changes in its net assets for each of the two years in the period then ended, and the financial highlights for each of the periods presented, in conformity with accounting principles generally accepted in the United States of America.
Basis for Opinion
These financial statements and financial highlights are the responsibility of the Fund’s management. Our responsibility is to express an opinion on the Fund’s financial statements and financial highlights based on our audits. We are a public accounting firm registered with the Public Company Accounting Oversight Board (United States) (PCAOB) and are required to be independent with respect to the Fund in accordance with the U.S. federal securities laws and the applicable rules and regulations of the Securities and Exchange Commission and the PCAOB.
We conducted our audits in accordance with the standards of the PCAOB. Those standards require that we plan and perform the audit to obtain reasonable assurance about whether the financial statements and financial highlights are free of material misstatement, whether due to error or fraud. The Fund is not required to have, nor were we engaged to perform, an audit of its internal control over financial reporting. As part of our audits we are required to obtain an understanding of internal control over financial reporting but not for the purpose of expressing an opinion on the effectiveness of the Fund’s internal control over financial reporting. Accordingly, we express no such opinion.
Our audits included performing procedures to assess the risks of material misstatement of the financial statements and financial highlights, whether due to error or fraud, and performing procedures that respond to those risks. Such procedures included examining, on a test basis, evidence regarding the amounts and disclosures in the financial statements and financial highlights. Our audits also included evaluating the accounting principles used and significant estimates made by management, as well as evaluating the overall presentation of the financial statements and financial highlights. Our procedures included confirmation of securities owned as of January 31, 2018, by correspondence with the custodian and brokers; when replies were not received from brokers, we performed other auditing procedures. We believe that our audits provide a reasonable basis for our opinion.
/s/ Deloitte & Touche LLP
Boston, Massachusetts
March 21, 2018
We have served as the auditor of one or more Eaton Vance investment companies since 1959.
Parametric International Equity Fund
January 31, 2018
Federal Tax Information (Unaudited)
The Form 1099-DIV you receive in February 2019 will show the tax status of all distributions paid to your account in calendar year 2018. Shareholders are advised to consult their own tax adviser with respect to the tax consequences of their investment in the Fund. As required by the Internal Revenue Code and/or regulations, shareholders must be notified regarding the status of qualified dividend income for individuals, the foreign tax credit and capital gains dividends.
Qualified Dividend Income. For the fiscal year ended January 31, 2018, the Fund designates approximately $6,082,326, or up to the maximum amount of such dividends allowable pursuant to the Internal Revenue Code, as qualified dividend income eligible for the reduced tax rate of 15%.
Foreign Tax Credit. For the fiscal year ended January 31, 2018, the Fund paid foreign taxes of $577,917 and recognized foreign source income of $7,154,468.
Capital Gains Dividends. The Fund hereby designates as a capital gain dividend with respect to the taxable year ended January 31, 2018, $1,915,061 or, if subsequently determined to be different, the net capital gain of such year.
Parametric International Equity Fund
January 31, 2018
Management and Organization
Fund Management. The Trustees of Eaton Vance Mutual Funds Trust (the Trust) are responsible for the overall management and supervision of the Trust’s affairs. The Trustees and officers of the Trust are listed below. Except as indicated, each individual has held the office shown or other offices in the same company for the last five years. Trustees and officers of the Trust hold indefinite terms of office. The “noninterested Trustees” consist of those Trustees who are not “interested persons” of the Trust, as that term is defined under the 1940 Act. The business address of each Trustee and officer is Two International Place, Boston, Massachusetts 02110. As used below, “EVC” refers to Eaton Vance Corp., “EV” refers to Eaton Vance, Inc., “EVM” refers to Eaton Vance Management, “BMR” refers to Boston Management and Research and “EVD” refers to Eaton Vance Distributors, Inc. EVC and EV are the corporate parent and trustee, respectively, of EVM and BMR. EVD is the Fund’s principal underwriter and a wholly-owned subsidiary of EVC. Each officer affiliated with Eaton Vance may hold a position with other Eaton Vance affiliates that is comparable to his or her position with EVM listed below. Each Trustee oversees 177 portfolios in the Eaton Vance Complex (including all master and feeder funds in a master feeder structure). Each officer serves as an officer of certain other Eaton Vance funds. Each Trustee and officer serves until his or her successor is elected.
| | | | | | |
| Name and Year of Birth | | Position(s) with the Trust | | Trustee Since(1) | | Principal Occupation(s) and Directorships During Past Five Years and Other Relevant Experience |
Interested Trustee | | | | | | |
| | | |
Thomas E. Faust Jr. 1958 | | Trustee | | 2007 | | Chairman, Chief Executive Officer and President of EVC, Director and President of EV, Chief Executive Officer and President of EVM and BMR, and Director of EVD. Trustee and/or officer of 177 registered investment companies. Mr. Faust is an interested person because of his positions with EVM, BMR, EVD, EVC and EV, which are affiliates of the Trust. Directorships in the Last Five Years.(2) Director of EVC and Hexavest Inc. (investment management firm). |
| | | |
| | | | | | |
Noninterested Trustees | | | | | | |
| | | |
Mark R. Fetting 1954 | | Trustee | | 2016 | | Private investor. Formerly held various positions at Legg Mason, Inc. (investment management firm) (2000-2012), including President, Chief Executive Officer, Director and Chairman (2008-2012), Senior Executive Vice President (2004-2008) and Executive Vice President (2001-2004). Formerly, President of Legg Mason family of funds (2001-2008). Formerly, Division President and Senior Officer of Prudential Financial Group, Inc. and related companies (investment management firm) (1991-2000). Directorships in the Last Five Years. None. |
| | | |
Cynthia E. Frost 1961 | | Trustee | | 2014 | | Private investor. Formerly, Chief Investment Officer of Brown University (university endowment) (2000-2012); Formerly, Portfolio Strategist for Duke Management Company (university endowment manager) (1995-2000); Formerly, Managing Director, Cambridge Associates (investment consulting company) (1989-1995); Formerly, Consultant, Bain and Company (management consulting firm) (1987-1989); Formerly, Senior Equity Analyst, BA Investment Management Company (1983-1985). Directorships in the Last Five Years. None. |
| | | |
George J. Gorman 1952 | | Trustee | | 2014 | | Principal at George J. Gorman LLC (consulting firm). Formerly, Senior Partner at Ernst & Young LLP (a registered public accounting firm) (1974-2009). Directorships in the Last Five Years. Formerly, Trustee of the BofA Funds Series Trust (11 funds) (2011-2014) and of the Ashmore Funds (9 funds) (2010-2014). |
| | | |
Valerie A. Mosley 1960 | | Trustee | | 2014 | | Chairwoman and Chief Executive Officer of Valmo Ventures (a consulting and investment firm). Former Partner and Senior Vice President, Portfolio Manager and Investment Strategist at Wellington Management Company, LLP (investment management firm) (1992-2012). Former Chief Investment Officer, PG Corbin Asset Management (1990-1992). Formerly worked in institutional corporate bond sales at Kidder Peabody (1986-1990). Directorships in the Last Five Years.(2) Director of Dynex Capital, Inc. (mortgage REIT) (since 2013). |
| | | |
William H. Park 1947 | | Chairperson of the Board and Trustee | | 2016 (Chairperson) 2003 (Trustee) | | Private investor. Formerly, Consultant (management and transactional) (2012-2014). Formerly, Chief Financial Officer, Aveon Group L.P. (investment management firm) (2010-2011). Formerly, Vice Chairman, Commercial Industrial Finance Corp. (specialty finance company) (2006-2010). Formerly, President and Chief Executive Officer, Prizm Capital Management, LLC (investment management firm) (2002-2005). Formerly, Executive Vice President and Chief Financial Officer, United Asset Management Corporation (investment management firm) (1982-2001). Formerly, Senior Manager, Price Waterhouse (now PricewaterhouseCoopers) (a registered public accounting firm) (1972-1981). Directorships in the Last Five Years.(2) None. |
Parametric International Equity Fund
January 31, 2018
Management and Organization — continued
| | | | | | |
| Name and Year of Birth | | Position(s) with the Trust | | Trustee Since(1) | | Principal Occupation(s) and Directorships During Past Five Years and Other Relevant Experience |
Noninterested Trustees (continued) |
| | | |
Helen Frame Peters 1948 | | Trustee | | 2008 | | Professor of Finance, Carroll School of Management, Boston College. Formerly, Dean, Carroll School of Management, Boston College (2000-2002). Formerly, Chief Investment Officer, Fixed Income, Scudder Kemper Investments (investment management firm) (1998-1999). Formerly, Chief Investment Officer, Equity and Fixed Income, Colonial Management Associates (investment management firm) (1991-1998). Directorships in the Last Five Years.(2) None. |
| | | |
Susan J. Sutherland 1957 | | Trustee | | 2015 | | Private investor. Formerly, Associate, Counsel and Partner at Skadden, Arps, Slate, Meagher & Flom LLP (law firm) (1982-2013). Directorships in the Last Five Years. Formerly, Director of Montpelier Re Holdings Ltd. (global provider of customized insurance and reinsurance products) (2013-2015). |
| | | |
Harriett Tee Taggart 1948 | | Trustee | | 2011 | | Managing Director, Taggart Associates (a professional practice firm). Formerly, Partner and Senior Vice President, Wellington Management Company, LLP (investment management firm) (1983-2006). Ms. Taggart has apprised the Board of Trustees that she intends to retire as a Trustee of all Eaton Vance Funds in 2018. Directorships in the Last Five Years.(2) Director of Albemarle Corporation (chemicals manufacturer) (since 2007) and The Hanover Group (specialty property and casualty insurance company) (since 2009). |
| | | |
Scott E. Wennerholm 1959 | | Trustee | | 2016 | | Trustee at Wheelock College (postsecondary institution) (since 2012). Formerly, Consultant at GF Parish Group (executive recruiting firm) (2016-2017). Formerly, Chief Operating Officer and Executive Vice President at BNY Mellon Asset Management (investment management firm) (2005-2011). Formerly, Chief Operating Officer and Chief Financial Officer at Natixis Global Asset Management (investment management firm) (1997-2004). Formerly, Vice President at Fidelity Investments Institutional Services (investment management firm) (1994-1997). Directorships in the Last Five Years. None. |
| | | |
| | | | | | |
Principal Officers who are not Trustees | | |
| Name and Year of Birth | | Position(s) with the Trust | | Officer
Since(3) | | Principal Occupation(s) During Past Five Years |
Payson F. Swaffield 1956 | | President | | 2003 | | Vice President and Chief Income Investment Officer of EVM and BMR. Also Vice President of Calvert Research and Management (“CRM”). |
| | | |
Maureen A. Gemma 1960 | | Vice President, Secretary and Chief Legal Officer | | 2005 | | Vice President of EVM and BMR. Also Vice President and officer of CRM. |
| | | |
James F. Kirchner 1967 | | Treasurer | | 2007 | | Vice President of EVM and BMR. Also Vice President and officer of CRM. |
| | | |
Richard F. Froio 1968 | | Chief Compliance Officer | | 2017 | | Vice President of EVM and BMR since 2017. Formerly Deputy Chief Compliance Officer (Adviser/Funds) and Chief Compliance Officer (Distribution) at PIMCO (2012-2017) and Managing Director at BlackRock/Barclays Global Investors (2009-2012). |
| (1) | Year first appointed to serve as Trustee for a fund in the Eaton Vance family of funds. Each Trustee has served continuously since appointment unless indicated otherwise. |
| (2) | During their respective tenures, the Trustees (except for Mmes. Frost and Sutherland and Messrs. Fetting, Gorman and Wennerholm) also served as Board members of one or more of the following funds (which operated in the years noted): eUnitsTM 2 Year U.S. Market Participation Trust: Upside to Cap / Buffered Downside (launched in 2012 and terminated in 2014); and eUnitsTM 2 Year U.S. Market Participation Trust II: Upside to Cap / Buffered Downside (launched in 2012 and terminated in 2014). However, Ms. Mosley did not serve as a Board member of eUnitsTM 2 Year U.S. Market Participation Trust: Upside to Cap / Buffered Downside (launched in 2012 and terminated in 2014). |
| (3) | Year first elected to serve as officer of a fund in the Eaton Vance family of funds when the officer has served continuously. Otherwise, year of most recent election as an officer of a fund in the Eaton Vance family of funds. Titles may have changed since initial election. |
The SAI for the Fund includes additional information about the Trustees and officers of the Fund and can be obtained without charge on Eaton Vance’s website at www.eatonvance.com or by calling 1-800-260-0761.
Eaton Vance Funds
IMPORTANT NOTICES
Privacy. The Eaton Vance organization is committed to ensuring your financial privacy. Each of the financial institutions identified below has in effect the following policy (“Privacy Policy”) with respect to nonpublic personal information about its customers:
| • | | Only such information received from you, through application forms or otherwise, and information about your Eaton Vance fund transactions will be collected. This may include information such as name, address, social security number, tax status, account balances and transactions. |
| • | | None of such information about you (or former customers) will be disclosed to anyone, except as permitted by law (which includes disclosure to employees necessary to service your account). In the normal course of servicing a customer’s account, Eaton Vance may share information with unaffiliated third parties that perform various required services such as transfer agents, custodians and broker-dealers. |
| • | | Policies and procedures (including physical, electronic and procedural safeguards) are in place that are designed to protect the confidentiality of such information. |
| • | | We reserve the right to change our Privacy Policy at any time upon proper notification to you. Customers may want to review our Privacy Policy periodically for changes by accessing the link on our homepage: www.eatonvance.com. |
Our pledge of privacy applies to the following entities within the Eaton Vance organization: the Eaton Vance Family of Funds, Eaton Vance Management, Eaton Vance Investment Counsel, Eaton Vance Distributors, Inc., Eaton Vance Trust Company, Eaton Vance Management (International) Limited, Eaton Vance Advisers International Ltd., Eaton Vance Management’s Real Estate Investment Group and Boston Management and Research. In addition, our Privacy Policy applies only to those Eaton Vance customers who are individuals and who have a direct relationship with us. If a customer’s account (i.e., fund shares) is held in the name of a third-party financial advisor/broker-dealer, it is likely that only such advisor’s privacy policies apply to the customer. This notice supersedes all previously issued privacy disclosures. For more information about Eaton Vance’s Privacy Policy, please call 1-800-262-1122.
Delivery of Shareholder Documents. The Securities and Exchange Commission (SEC) permits funds to deliver only one copy of shareholder documents, including prospectuses, proxy statements and shareholder reports, to fund investors with multiple accounts at the same residential or post office box address. This practice is often called “householding” and it helps eliminate duplicate mailings to shareholders. Eaton Vance, or your financial advisor, may household the mailing of your documents indefinitely unless you instruct Eaton Vance, or your financial advisor, otherwise. If you would prefer that your Eaton Vance documents not be householded, please contact Eaton Vance at 1-800-260-0761, or contact your financial advisor. Your instructions that householding not apply to delivery of your Eaton Vance documents will typically be effective within 30 days of receipt by Eaton Vance or your financial advisor.
Portfolio Holdings. Each Eaton Vance Fund and its underlying Portfolio(s) (if applicable) will file a schedule of portfolio holdings on Form N-Q with the SEC for the first and third quarters of each fiscal year. The Form N-Q will be available on the Eaton Vance website at www.eatonvance.com, by calling Eaton Vance at 1-800-260-0761 or in the EDGAR database on the SEC’s website at www.sec.gov. Form N-Q may also be reviewed and copied at the SEC’s public reference room in Washington, D.C. (call 1-800-732-0330 for information on the operation of the public reference room).
Proxy Voting. From time to time, funds are required to vote proxies related to the securities held by the funds. The Eaton Vance Funds or their underlying Portfolios (if applicable) vote proxies according to a set of policies and procedures approved by the Funds’ and Portfolios’ Boards. You may obtain a description of these policies and procedures and information on how the Funds or Portfolios voted proxies relating to portfolio securities during the most recent 12-month period ended June 30, without charge, upon request, by calling 1-800-260-0761 and by accessing the SEC’s website at www.sec.gov.
This Page Intentionally Left Blank
This Page Intentionally Left Blank
This Page Intentionally Left Blank
Investment Adviser and Administrator
Eaton Vance Management
Two International Place
Boston, MA 02110
Sub-Adviser
Parametric Portfolio Associates LLC
1918 Eighth Avenue, Suite 3100
Seattle, WA 98101
Principal Underwriter*
Eaton Vance Distributors, Inc.
Two International Place
Boston, MA 02110
(617) 482-8260
Custodian
State Street Bank and Trust Company
State Street Financial Center, One Lincoln Street
Boston, MA 02111
Transfer Agent
BNY Mellon Investment Servicing (US) Inc.
Attn: Eaton Vance Funds
P.O. Box 9653
Providence, RI 02940-9653
(800) 260-0761
Independent Registered Public Accounting Firm
Deloitte & Touche LLP
200 Berkeley Street
Boston, MA 02116-5022
Fund Offices
Two International Place
Boston, MA 02110
| * | FINRA BrokerCheck. Investors may check the background of their Investment Professional by contacting the Financial Industry Regulatory Authority (FINRA). FINRA BrokerCheck is a free tool to help investors check the professional background of current and former FINRA-registered securities firms and brokers. FINRA BrokerCheck is available by calling 1-800-289-9999 and at www.FINRA.org. The FINRA BrokerCheck brochure describing this program is available to investors at www.FINRA.org. |
4736 1.31.18

Parametric Volatility Risk Premium - Defensive Fund
Annual Report
January 31, 2018

Commodity Futures Trading Commission Registration. Effective December 31, 2012, the Commodity Futures Trading Commission (“CFTC”) adopted certain regulatory changes that subject registered investment companies and advisers to regulation by the CFTC if a fund invests more than a prescribed level of its assets in certain CFTC-regulated instruments (including futures, certain options and swap agreements) or markets itself as providing investment exposure to such instruments. The Fund has claimed an exclusion from the definition of the term “commodity pool operator” under the Commodity Exchange Act. Accordingly, neither the Fund nor the adviser with respect to the operation of the Fund is subject to CFTC regulation. Because of its management of other strategies, the Fund’s adviser is registered with the CFTC as a commodity pool operator and a commodity trading advisor.
Fund shares are not insured by the FDIC and are not deposits or other obligations of, or guaranteed by, any depository institution. Shares are subject to investment risks, including possible loss of principal invested.
This report must be preceded or accompanied by a current summary prospectus or prospectus. Before investing, investors should consider carefully the investment objective, risks, and charges and expenses of a mutual fund. This and other important information is contained in the summary prospectus and prospectus, which can be obtained from a financial advisor. Prospective investors should read the prospectus carefully before investing. For further information, please call 1-800-260-0761.
Annual Report January 31, 2018
Parametric Volatility Risk Premium - Defensive Fund
Table of Contents
| | | | |
| |
Management’s Discussion of Fund Performance | | | 2 | |
| |
Performance | | | 3 | |
| |
Fund Profile | | | 4 | |
| |
Endnotes and Additional Disclosures | | | 5 | |
| |
Fund Expenses | | | 6 | |
| |
Financial Statements | | | 7 | |
| |
Report of Independent Registered Public Accounting Firm | | | 22 | |
| |
Federal Tax Information | | | 23 | |
| |
Management and Organization | | | 24 | |
| |
Important Notices | | | 27 | |
Parametric Volatility Risk Premium - Defensive Fund
January 31, 2018
Management’s Discussion of Fund Performance1
Economic and Market Conditions
U.S. stock markets delivered strong returns in the nearly 12-month period beginning with the Fund’s inception on February 9, 2017, through January 31, 2018. Despite numerous distractions both domestically and overseas, investors focused on the virtuous circle of rising markets, wealth expansion, perceived absence of risk, and tax reform. During this period, the S&P 500 Index2 was up 24.69%.
The period began with a strong start in February 2017, with the S&P 500 Index up 3.97%, continuing on the momentum post-U.S. presidential election. In the following months, the market was up in each of the 12 months of calendar year 2017 and the strength carried into January 2018, with the S&P 500 Index posting 5.73%. While the strong returns of the S&P 500 Index are notable, what is more extraordinary is the path the S&P 500 Index followed to achieve those returns. For the first time in 90 years, in 2017 the S&P 500 Index had a positive return for all 12 months of a calendar year. Statistically, this is expected less than 2% of the time.
U.S. stocks were flat in March 2017, with the S&P 500 Index up only 0.12%, as the failure of President Trump’s health care bill in Congress raised concerns about prospects for the rest of the administration’s policy agenda, including tax reform and infrastructure spending. But U.S. stocks quickly regained their upward momentum, advancing steadily despite additional U.S. Federal Reserve rate hikes in March 2017 and again in June 2017. Encouraged by a range of favorable economic indicators, particularly U.S. job market gains, many investors viewed the rate hikes as a sign of a strengthening economy.
U.S. equity markets briefly pulled back in August 2017 with the S&P 500 up only 0.31% amid the North Korea stand-off and the devastation in Texas left by Hurricane Harvey. Stocks soon resumed their upward trend, propelled by strong corporate earnings and a range of strengthening economic indicators. Major U.S. indexes reached multiple record highs during the final three months of the period ended January 31, 2018. In terms of economic sectors, information technology strongly led the market advance during the reporting period.
Amid the calm, implied volatility, as measured by the CBOE Volatility Index (VIX), averaged just 11.03% during the reporting period, remaining low relative to long-term levels throughout the period. Realized volatility for the S&P 500 Index continued to be low for the reporting period, falling as low as 3.4% in mid-October and averaging just 6.8% for the reporting period – levels not seen in several decades. Further evidence of the low volatility in the S&P 500 Index was evidenced by the maximum drawdown during the 12-month period of 2.6%, the second lowest since the index began in 1928.
Fund Performance
For the period from its inception on February 9, 2017 through January 31, 2018, Parametric Volatility Risk Premium — Defensive Fund (the Fund) had a total return of 10.79% for Institutional Class shares at net asset value (NAV), outperforming the Fund’s primary benchmark, the CBOE S&P 500 BuyWrite Index (the Index), which had a total return of 10.77% for the same period. The Fund underperformed its secondary benchmark, a custom index
consisting of 50% S&P 500 Index / 50% ICE BofAML 3-Month U.S. Treasury Bill Index (the Secondary Index), which had a total return of 12.28% for the period.
The Fund’s investment strategy is to structurally de-risk the portfolio by holding a base portfolio of 50% equity and 50% cash-equivalents, and to write out-of-the money equity index calls and puts to enhance returns by harvesting the volatility risk premium (VRP). The VRP is the difference between implied volatility and subsequently realized volatility, and is historically positive and uncorrelated with other sources of returns. The implied-to-realized volatility spread averaged +4.5 volatility points over the reporting period. The Index is a passive covered call-writing index. The Fund performed in line with this options-writing Index, outperforming it by 0.02%.
Relative to the Secondary Index, the Fund’s options strategy, consisting of the systematic sale of out-of-the-money call and put options, was the primary detractor from performance, as would generally be expected during a period of significantly positive equity market performance. The strong rally in equities especially in the last three months of the period, in which the S&P 500 Index was up 10.18%, led to losses on call options. Options profits had been positive from the Fund’s inception through the third quarter of 2017 and contributed positively to returns through the third quarter.
The Fund’s common stock portfolio underperformed the S&P 500 Index and also detracted from returns relative to the Secondary Index with security selection in the energy and information technology sectors detracting from relative results. In particular, the Fund’s lack of exposure to Netflix, Inc. (Netflix) detracted from returns as Netflix’s return was 93.4% for the period. In addition, the Fund’s lack of exposure to PayPal Holdings, Inc. (PayPal) was also a detractor, as PayPal was up 105.2% during the reporting period. In addition, the Fund’s overweight to General Electric Co. (GE) relative to the Secondary Index was also a detractor, as GE was down -44.3% for the period.
In contrast, stock selection in the consumer staples and financials sectors aided performance relative to the Secondary Index. In addition, the Fund’s overweight to the Boeing Co. contributed to returns as the stock was up 109.5% over the reporting period.
As a reminder, the stock portfolio is passively managed to approximate the S&P 500 Index but actively managed to mitigate tax impact.
The Fund is performing as expected in the current market environment. Our thesis remains intact and we remain steadfast in our disciplines and confident that the Fund is well-positioned to continue producing attractive risk adjusted returns and deliver more attractive relative returns as markets normalize. Moreover, as volatility moved higher toward the end of January 2018, it has the positive effect of increasing option premium collection and widening out strikes on the newly established positions. A higher volatility environment will generally be favorable for harvesting the volatility risk premium moving forward into 2018.
See Endnotes and Additional Disclosures in this report.
Past performance is no guarantee of future results. Returns are historical and are calculated by determining the percentage change in net asset value (NAV) or offering price (as applicable) with all distributions reinvested. Investment return and principal value will fluctuate so that shares, when redeemed, may be worth more or less than their original cost. Performance less than or equal to one year is cumulative. Performance is for the stated time period only; due to market volatility, the Fund’s current performance may be lower or higher than quoted. Returns are before taxes unless otherwise noted. For performance as of the most recent month-end, please refer to eatonvance.com.
Parametric Volatility Risk Premium - Defensive Fund
January 31, 2018
Performance2,3
Portfolio Managers Thomas Seto, Thomas B. Lee, CFA and Jay Strohmaier, CFA, each of Parametric Portfolio Associates LLC
| | | | | | | | | | | | | | | | | | | | |
| % Cumulative Total Returns | | Class Inception Date | | | Performance Inception Date | | | One Year | | | Five Years | | | Since Inception | |
Institutional Class at NAV | | | 02/09/2017 | | | | 02/09/2017 | | | | — | | | | — | | | | 10.79 | % |
CBOE S&P 500 BuyWrite Index | | | — | | | | — | | | | 11.60 | % | | | 8.51 | % | | | 10.77 | % |
Blended Index | | | — | | | | — | | | | 13.05 | | | | 7.96 | | | | 12.28 | |
| | | | | |
| | | | | | | | | | | | | | | | | | | | |
| % Total Annual Operating Expense Ratios4 | | | | | | | | | | | | | | Institutional Class | |
Gross | | | | | | | | | | | | | | | | | | | 0.68 | % |
Net | | | | | | | | | | | | | | | | | | | 0.55 | |
Growth of $50,000
This graph shows the change in value of a hypothetical investment of $50,000 in Institutional Class of the Fund for the period indicated. For comparison, the same investment is shown in the indicated index.
See Endnotes and Additional Disclosures in this report.
Past performance is no guarantee of future results. Returns are historical and are calculated by determining the percentage change in net asset value (NAV) or offering price (as applicable) with all distributions reinvested. Investment return and principal value will fluctuate so that shares, when redeemed, may be worth more or less than their original cost. Performance less than or equal to one year is cumulative. Performance is for the stated time period only; due to market volatility, the Fund’s current performance may be lower or higher than quoted. Returns are before taxes unless otherwise noted. For performance as of the most recent month-end, please refer to eatonvance.com.
Parametric Volatility Risk Premium - Defensive Fund
January 31, 2018
Fund Profile
Common Stock Sector Allocation (% of net assets)
Asset Allocation (% of total investments)
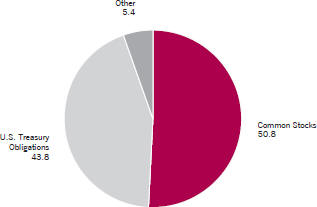
Top 10 Holdings (% of net assets)5
| | | | |
U.S. Treasury Note, 1.00%, 9/15/18 | | | 7.7 | % |
| |
U.S. Treasury Note, 1.00%, 5/15/18 | | | 6.7 | |
| |
U.S. Treasury Note, 1.25%, 10/31/18 | | | 5.1 | |
| |
U.S. Treasury Note, 1.00%, 3/15/18 | | | 4.5 | |
| |
Apple, Inc. | | | 1.9 | |
| |
Microsoft Corp. | | | 1.7 | |
| |
Amazon.com, Inc. | | | 1.4 | |
| |
Berkshire Hathaway, Inc., Class B | | | 1.0 | |
| |
JPMorgan Chase & Co. | | | 1.0 | |
| |
Facebook, Inc., Class A | | | 1.0 | |
| |
Total | | | 32.0 | % |
See Endnotes and Additional Disclosures in this report.
Parametric Volatility Risk Premium - Defensive Fund
January 31, 2018
Endnotes and Additional Disclosures
| 1 | The views expressed in this report are those of the portfolio manager(s) and are current only through the date stated at the top of this page. These views are subject to change at any time based upon market or other conditions, and Eaton Vance and the Fund(s) disclaim any responsibility to update such views. These views may not be relied upon as investment advice and, because investment decisions are based on many factors, may not be relied upon as an indication of trading intent on behalf of any Eaton Vance fund. This commentary may contain statements that are not historical facts, referred to as “forward looking statements”. The Fund’s actual future results may differ significantly from those stated in any forward looking statement, depending on factors such as changes in securities or financial markets or general economic conditions, the volume of sales and purchases of Fund shares, the continuation of investment advisory, administrative and service contracts, and other risks discussed from time to time in the Fund’s filings with the Securities and Exchange Commission. |
| 2 | S&P 500 Index is an unmanaged index of large-cap stocks commonly used as a measure of U.S. stock market performance. CBOE S&P 500 BuyWrite Index measures the performance of a hypothetical buy-write strategy on the S&P 500 Index. ICE BofAML 3-Month U.S. Treasury Bill Index is an unmanaged index of U.S. Treasury securities maturing in 90 days. ICE Data Indices, LLC not for redistribution or other uses; provided “as is”, without warranties, and with no liability. Eaton Vance has prepared this report, ICE Data Indicies, LLC does not endorse it, or guarantee, review, or endorse Eaton Vance’s products. The Blended Index consists of 50% S&P 500 Index and 50% ICE BofAML 3-Month U.S. Treasury Bill Index. Unless otherwise stated, index returns do not reflect the effect of any applicable sales charges, commissions, expenses, taxes or leverage, as applicable. It is not possible to invest directly in an index. |
| 3 | Institutional Class shares are offered at net asset value (NAV). Cumulative Total Returns are historical and are calculated by determining the percentage change in NAV with all distributions reinvested. Unless otherwise stated, performance does not reflect the deduction of taxes on Fund distributions or redemptions of Fund shares. Performance since inception for an index, if presented, is the performance since the Fund’s or oldest share class’ inception, as applicable. |
| 4 | Source: Fund prospectus. Net expense ratios reflect a contractual expense reimbursement that continues through 5/31/18. Without the reimbursement, performance would have been lower. The expense ratios for the current reporting period can be found in the Financial Highlights section of this report. |
| 5 | Depictions do not reflect the Fund’s option positions. Excludes short-term investments. |
| | Fund profile subject to change due to active management. |
Important Notice to Shareholders
| | Effective October 23, 2017, the BofA Merrill Lynch indices have been rebranded as Intercontinental Exchange’s (“ICE”) BofAML indices. |
Parametric Volatility Risk Premium - Defensive Fund
January 31, 2018
Fund Expenses
Example: As a Fund shareholder, you incur two types of costs: (1) transaction costs, including sales charges (loads) on purchases and redemption fees (if applicable); and (2) ongoing costs, including management fees; distribution and/or service fees; and other Fund expenses. This Example is intended to help you understand your ongoing costs (in dollars) of Fund investing and to compare these costs with the ongoing costs of investing in other mutual funds. The Example is based on an investment of $1,000 invested at the beginning of the period and held for the entire period (August 1, 2017 – January 31, 2018).
Actual Expenses: The first section of the table below provides information about actual account values and actual expenses. You may use the information in this section, together with the amount you invested, to estimate the expenses that you paid over the period. Simply divide your account value by $1,000 (for example, an $8,600 account value divided by $1,000 = 8.6), then multiply the result by the number in the first section under the heading entitled “Expenses Paid During Period” to estimate the expenses you paid on your account during this period.
Hypothetical Example for Comparison Purposes: The second section of the table below provides information about hypothetical account values and hypothetical expenses based on the actual Fund expense ratio and an assumed rate of return of 5% per year (before expenses), which is not the actual Fund return. The hypothetical account values and expenses may not be used to estimate the actual ending account balance or expenses you paid for the period. You may use this information to compare the ongoing costs of investing in your Fund and other funds. To do so, compare this 5% hypothetical example with the 5% hypothetical examples that appear in the shareholder reports of the other funds.
Please note that the expenses shown in the table are meant to highlight your ongoing costs only and do not reflect any transactional costs, such as sales charges (loads) or redemption fees (if applicable). Therefore, the second section of the table is useful in comparing ongoing costs only, and will not help you determine the relative total costs of owning different funds. In addition, if these transactional costs were included, your costs would be higher.
| | | | | | | | | | | | | | | | |
| | | Beginning
Account Value
(8/1/17) | | | Ending
Account Value
(1/31/18) | | | Expenses Paid
During Period*
(8/1/17 – 1/31/18) | | | Annualized
Expense
Ratio | |
| | | | |
| | | | | | | | | | | | | | | | |
Actual | | | | | | | | | | | | | |
Institutional Class | | $ | 1,000.00 | | | $ | 1,053.10 | | | $ | 2.85 | ** | | | 0.55 | % |
| | | | | | | | | | | | | | | | | |
| | | | |
| | | | | | | | | | | | | | | | |
Hypothetical | | | | | | | | | | | | | |
(5% return per year before expenses) | | | | | | | | | | | | | |
Institutional Class | | $ | 1,000.00 | | | $ | 1,022.40 | | | $ | 2.80 | ** | | | 0.55 | % |
| * | Expenses are equal to the Fund’s annualized expense ratio for the indicated Class, multiplied by the average account value over the period, multiplied by 184/365 (to reflect the one-half year period). The Example assumes that the $1,000 was invested at the net asset value per share determined at the close of business on July 31, 2017. |
| ** | Absent an allocation of certain expenses to affiliates, the expenses would be higher. |
Parametric Volatility Risk Premium - Defensive Fund
January 31, 2018
Portfolio of Investments
| | | | | | | | |
| Common Stocks — 51.0% | |
| | |
| | | | | | | | |
| Security | | Shares | | | Value | |
|
Aerospace & Defense — 1.4% | |
Boeing Co. (The) | | | 3,345 | | | $ | 1,185,368 | |
Harris Corp. | | | 2,299 | | | | 366,414 | |
Raytheon Co. | | | 2,739 | | | | 572,287 | |
United Technologies Corp. | | | 4,859 | | | | 670,590 | |
| | | | | | | | | |
| | | $ | 2,794,659 | |
| | | | | | | | | |
|
Air Freight & Logistics — 0.3% | |
C.H. Robinson Worldwide, Inc. | | | 2,720 | | | $ | 248,771 | |
Expeditors International of Washington, Inc. | | | 4,712 | | | | 306,045 | |
| | | | | | | | | |
| | | $ | 554,816 | |
| | | | | | | | | |
|
Airlines — 0.2% | |
Alaska Air Group, Inc. | | | 3,750 | | | $ | 246,488 | |
American Airlines Group, Inc. | | | 3,176 | | | | 172,520 | |
Southwest Airlines Co. | | | 865 | | | | 52,592 | |
| | | | | | | | | |
| | | $ | 471,600 | |
| | | | | | | | | |
|
Auto Components — 0.2% | |
BorgWarner, Inc. | | | 5,600 | | | $ | 315,056 | |
| | | | | | | | | |
| | | $ | 315,056 | |
| | | | | | | | | |
|
Banks — 3.6% | |
Bank of America Corp. | | | 49,561 | | | $ | 1,585,952 | |
Citigroup, Inc. | | | 14,807 | | | | 1,162,053 | |
Citizens Financial Group, Inc. | | | 4,594 | | | | 210,865 | |
Fifth Third Bancorp | | | 2,835 | | | | 93,838 | |
JPMorgan Chase & Co. | | | 16,764 | | | | 1,939,092 | |
People’s United Financial, Inc. | | | 1,616 | | | | 31,787 | |
U.S. Bancorp | | | 8,845 | | | | 505,403 | |
Wells Fargo & Co. | | | 22,105 | | | | 1,454,067 | |
Zions Bancorporation | | | 1,172 | | | | 63,323 | |
| | | | | | | | | |
| | | $ | 7,046,380 | |
| | | | | | | | | |
|
Beverages — 1.1% | |
Brown-Forman Corp., Class B | | | 66 | | | $ | 4,574 | |
Coca-Cola Co. (The) | | | 22,299 | | | | 1,061,209 | |
Constellation Brands, Inc., Class A | | | 437 | | | | 95,908 | |
Monster Beverage Corp.(1) | | | 1,189 | | | | 81,126 | |
PepsiCo, Inc. | | | 8,316 | | | | 1,000,415 | |
| | | | | | | | | |
| | | $ | 2,243,232 | |
| | | | | | | | | |
| | | | | | | | |
| Security | | Shares | | | Value | |
|
Biotechnology — 1.8% | |
AbbVie, Inc. | | | 8,249 | | | $ | 925,703 | |
Amgen, Inc. | | | 4,727 | | | | 879,458 | |
Celgene Corp.(1) | | | 2,098 | | | | 212,234 | |
Gilead Sciences, Inc. | | | 8,559 | | | | 717,244 | |
Incyte Corp.(1) | | | 3,115 | | | | 281,253 | |
Regeneron Pharmaceuticals, Inc.(1) | | | 480 | | | | 175,992 | |
Vertex Pharmaceuticals, Inc.(1) | | | 1,866 | | | | 311,380 | |
| | | | | | | | | |
| | | $ | 3,503,264 | |
| | | | | | | | | |
|
Building Products — 0.2% | |
A.O. Smith Corp. | | | 481 | | | $ | 32,121 | |
Allegion PLC | | | 720 | | | | 61,999 | |
Fortune Brands Home & Security, Inc. | | | 2,068 | | | | 146,684 | |
Masco Corp. | | | 4,506 | | | | 201,238 | |
| | | | | | | | | |
| | | $ | 442,042 | |
| | | | | | | | | |
|
Capital Markets — 1.8% | |
Affiliated Managers Group, Inc. | | | 159 | | | $ | 31,741 | |
Ameriprise Financial, Inc. | | | 429 | | | | 72,372 | |
Cboe Global Markets, Inc. | | | 511 | | | | 68,673 | |
Charles Schwab Corp. (The) | | | 10,267 | | | | 547,642 | |
E*TRADE Financial Corp.(1) | | | 5,242 | | | | 276,253 | |
Goldman Sachs Group, Inc. (The) | | | 2,435 | | | | 652,312 | |
Invesco, Ltd. | | | 3,013 | | | | 108,860 | |
Morgan Stanley | | | 11,561 | | | | 653,775 | |
Nasdaq, Inc. | | | 4,164 | | | | 336,909 | |
Northern Trust Corp. | | | 3,554 | | | | 374,556 | |
Raymond James Financial, Inc. | | | 677 | | | | 65,256 | |
S&P Global, Inc. | | | 1,315 | | | | 238,147 | |
| | | | | | | | | |
| | | $ | 3,426,496 | |
| | | | | | | | | |
|
Chemicals — 1.1% | |
Air Products and Chemicals, Inc. | | | 1,745 | | | $ | 293,806 | |
Albemarle Corp. | | | 1,137 | | | | 126,878 | |
CF Industries Holdings, Inc. | | | 4,816 | | | | 204,391 | |
DowDuPont, Inc. | | | 6,576 | | | | 497,014 | |
Eastman Chemical Co. | | | 528 | | | | 52,367 | |
Ecolab, Inc. | | | 366 | | | | 50,391 | |
FMC Corp. | | | 2,601 | | | | 237,549 | |
International Flavors & Fragrances, Inc. | | | 405 | | | | 60,872 | |
LyondellBasell Industries NV, Class A | | | 3,254 | | | | 389,959 | |
Sherwin-Williams Co. (The) | | | 393 | | | | 163,924 | |
| | | | | | | | | |
| | | $ | 2,077,151 | |
| | | | | | | | | |
| | | | |
| | 7 | | See Notes to Financial Statements. |
Parametric Volatility Risk Premium - Defensive Fund
January 31, 2018
Portfolio of Investments — continued
| | | | | | | | |
| Security | | Shares | | | Value | |
|
Commercial Services & Supplies — 0.1% | |
Cintas Corp. | | | 394 | | | $ | 66,369 | |
Republic Services, Inc. | | | 1,084 | | | | 74,579 | |
| | | | | | | | | |
| | | $ | 140,948 | |
| | | | | | | | | |
|
Communications Equipment — 0.6% | |
Cisco Systems, Inc. | | | 26,415 | | | $ | 1,097,279 | |
| | | | | | | | | |
| | | $ | 1,097,279 | |
| | | | | | | | | |
|
Construction & Engineering — 0.0%(2) | |
Fluor Corp. | | | 1,090 | | | $ | 66,163 | |
Jacobs Engineering Group, Inc. | | | 418 | | | | 29,034 | |
| | | | | | | | | |
| | | $ | 95,197 | |
| | | | | | | | | |
|
Containers & Packaging — 0.2% | |
Avery Dennison Corp. | | | 326 | | | $ | 39,994 | |
Sealed Air Corp. | | | 5,857 | | | | 277,329 | |
WestRock Co. | | | 2,020 | | | | 134,592 | |
| | | | | | | | | |
| | | $ | 451,915 | |
| | | | | | | | | |
|
Distributors — 0.0%(2) | |
LKQ Corp.(1) | | | 763 | | | $ | 32,069 | |
| | | | | | | | | |
| | | $ | 32,069 | |
| | | | | | | | | |
|
Diversified Consumer Services — 0.1% | |
H&R Block, Inc. | | | 9,531 | | | $ | 252,953 | |
| | | | | | | | | |
| | | $ | 252,953 | |
| | | | | | | | | |
|
Diversified Financial Services — 1.0% | |
Berkshire Hathaway, Inc., Class B(1) | | | 9,104 | | | $ | 1,951,716 | |
| | | | | | | | | |
| | | $ | 1,951,716 | |
| | | | | | | | | |
|
Diversified Telecommunication Services — 1.0% | |
AT&T, Inc. | | | 22,305 | | | $ | 835,322 | |
Verizon Communications, Inc. | | | 21,456 | | | | 1,160,126 | |
| | | | | | | | | |
| | | $ | 1,995,448 | |
| | | | | | | | | |
|
Electric Utilities — 0.7% | |
Alliant Energy Corp. | | | 3,205 | | | $ | 127,399 | |
Entergy Corp. | | | 2,613 | | | | 205,617 | |
Exelon Corp. | | | 7,122 | | | | 274,268 | |
FirstEnergy Corp. | | | 3,214 | | | | 105,740 | |
NextEra Energy, Inc. | | | 3,491 | | | | 553,044 | |
Pinnacle West Capital Corp. | | | 1,048 | | | | 83,788 | |
| | | | | | | | | |
| | | $ | 1,349,856 | |
| | | | | | | | | |
| | | | | | | | |
| Security | | Shares | | | Value | |
|
Electrical Equipment — 0.3% | |
AMETEK, Inc. | | | 909 | | | $ | 69,357 | |
Eaton Corp. PLC | | | 5,502 | | | | 462,003 | |
| | | | | | | | | |
| | | $ | 531,360 | |
| | | | | | | | | |
|
Electronic Equipment, Instruments & Components — 0.2% | |
FLIR Systems, Inc. | | | 1,201 | | | $ | 61,503 | |
TE Connectivity, Ltd. | | | 3,728 | | | | 382,232 | |
| | | | | | | | | |
| | | $ | 443,735 | |
| | | | | | | | | |
|
Energy Equipment & Services — 0.4% | |
National Oilwell Varco, Inc. | | | 10,441 | | | $ | 382,976 | |
Schlumberger, Ltd. | | | 4,289 | | | | 315,584 | |
| | | | | | | | | |
| | | $ | 698,560 | |
| | | | | | | | | |
|
Equity Real Estate Investment Trusts (REITs) — 1.2% | |
Alexandria Real Estate Equities, Inc. | | | 240 | | | $ | 31,128 | |
American Tower Corp. | | | 2,132 | | | | 314,896 | |
Digital Realty Trust, Inc. | | | 1,685 | | | | 188,636 | |
Duke Realty Corp. | | | 3,054 | | | | 80,656 | |
Essex Property Trust, Inc. | | | 311 | | | | 72,457 | |
Extra Space Storage, Inc. | | | 3,077 | | | | 256,868 | |
Federal Realty Investment Trust | | | 766 | | | | 92,533 | |
Host Hotels & Resorts, Inc. | | | 2,960 | | | | 61,450 | |
Iron Mountain, Inc. | | | 781 | | | | 27,358 | |
Kimco Realty Corp. | | | 15,181 | | | | 241,530 | |
Macerich Co. (The) | | | 4,840 | | | | 312,519 | |
Public Storage | | | 1,200 | | | | 234,912 | |
Realty Income Corp. | | | 3,060 | | | | 162,761 | |
Regency Centers Corp. | | | 1,016 | | | | 63,917 | |
SL Green Realty Corp. | | | 598 | | | | 60,111 | |
UDR, Inc. | | | 1,383 | | | | 50,521 | |
Weyerhaeuser Co. | | | 4,234 | | | | 158,944 | |
| | | | | | | | | |
| | | $ | 2,411,197 | |
| | | | | | | | | |
|
Food & Staples Retailing — 1.1% | |
CVS Health Corp. | | | 2,538 | | | $ | 199,715 | |
Kroger Co. (The) | | | 16,032 | | | | 486,732 | |
Sysco Corp. | | | 7,172 | | | | 450,904 | |
Wal-Mart Stores, Inc. | | | 8,577 | | | | 914,308 | |
| | | | | | | | | |
| | | $ | 2,051,659 | |
| | | | | | | | | |
|
Food Products — 0.6% | |
Hormel Foods Corp. | | | 2,394 | | | $ | 82,186 | |
JM Smucker Co. (The) | | | 3,020 | | | | 383,208 | |
| | | | |
| | 8 | | See Notes to Financial Statements. |
Parametric Volatility Risk Premium - Defensive Fund
January 31, 2018
Portfolio of Investments — continued
| | | | | | | | |
| Security | | Shares | | | Value | |
|
Food Products (continued) | |
McCormick & Co., Inc. | | | 3,348 | | | $ | 364,162 | |
Tyson Foods, Inc., Class A | | | 4,929 | | | | 375,146 | |
| | | | | | | | | |
| | | $ | 1,204,702 | |
| | | | | | | | | |
|
Health Care Equipment & Supplies — 1.0% | |
Boston Scientific Corp.(1) | | | 8,282 | | | $ | 231,565 | |
Cooper Cos., Inc. (The) | | | 276 | | | | 67,529 | |
IDEXX Laboratories, Inc.(1) | | | 2,236 | | | | 418,221 | |
Intuitive Surgical, Inc.(1) | | | 1,053 | | | | 454,548 | |
Medtronic PLC | | | 9,228 | | | | 792,593 | |
Varian Medical Systems, Inc.(1) | | | 594 | | | | 75,735 | |
| | | | | | | | | |
| | | $ | 2,040,191 | |
| | | | | | | | | |
|
Health Care Providers & Services — 1.8% | |
Aetna, Inc. | | | 2,676 | | | $ | 499,930 | |
Cardinal Health, Inc. | | | 6,327 | | | | 454,215 | |
Centene Corp.(1) | | | 654 | | | | 70,135 | |
Cigna Corp. | | | 2,146 | | | | 447,119 | |
Envision Healthcare Corp.(1) | | | 5,687 | | | | 204,675 | |
Express Scripts Holding Co.(1) | | | 5,739 | | | | 454,414 | |
Henry Schein, Inc.(1) | | | 2,606 | | | | 197,222 | |
Patterson Cos., Inc. | | | 763 | | | | 27,384 | |
UnitedHealth Group, Inc. | | | 5,012 | | | | 1,186,742 | |
| | | | | | | | | |
| | | $ | 3,541,836 | |
| | | | | | | | | |
|
Hotels, Restaurants & Leisure — 0.9% | |
McDonald’s Corp. | | | 4,006 | | | $ | 685,587 | |
Royal Caribbean Cruises, Ltd. | | | 2,692 | | | | 359,517 | |
Starbucks Corp. | | | 8,055 | | | | 457,604 | |
Wyndham Worldwide Corp. | | | 1,441 | | | | 178,871 | |
Wynn Resorts, Ltd. | | | 756 | | | | 125,186 | |
| | | | | | | | | |
| | | $ | 1,806,765 | |
| | | | | | | | | |
|
Household Durables — 0.2% | |
Garmin, Ltd. | | | 2,078 | | | $ | 130,789 | |
Leggett & Platt, Inc. | | | 598 | | | | 27,813 | |
Lennar Corp., Class A | | | 1,467 | | | | 91,922 | |
Lennar Corp., Class B | | | 29 | | | | 1,469 | |
PulteGroup, Inc. | | | 2,356 | | | | 74,992 | |
| | | | | | | | | |
| | | $ | 326,985 | |
| | | | | | | | | |
|
Household Products — 0.7% | |
Clorox Co. (The) | | | 1,632 | | | $ | 231,238 | |
Procter & Gamble Co. (The) | | | 13,919 | | | | 1,201,767 | |
| | | | | | | | | |
| | | $ | 1,433,005 | |
| | | | | | | | | |
| | | | | | | | |
| Security | | Shares | | | Value | |
|
Independent Power and Renewable Electricity Producers — 0.0%(2) | |
NRG Energy, Inc. | | | 2,933 | | | $ | 76,287 | |
| | | | | | | | | |
| | | $ | 76,287 | |
| | | | | | | | | |
|
Industrial Conglomerates — 1.1% | |
3M Co. | | | 3,455 | | | $ | 865,478 | |
General Electric Co. | | | 22,572 | | | | 364,989 | |
Honeywell International, Inc. | | | 5,184 | | | | 827,729 | |
Roper Technologies, Inc. | | | 144 | | | | 40,405 | |
| | | | | | | | | |
| | | $ | 2,098,601 | |
| | | | | | | | | |
|
Insurance — 1.3% | |
Aflac, Inc. | | | 4,961 | | | $ | 437,560 | |
Arthur J. Gallagher & Co. | | | 488 | | | | 33,340 | |
Assurant, Inc. | | | 308 | | | | 28,176 | |
Brighthouse Financial, Inc.(1) | | | 416 | | | | 26,732 | |
Chubb, Ltd. | | | 3,564 | | | | 556,519 | |
Cincinnati Financial Corp. | | | 1,699 | | | | 130,653 | |
Hartford Financial Services Group, Inc. | | | 4,457 | | | | 261,893 | |
Lincoln National Corp. | | | 1,238 | | | | 102,506 | |
Marsh & McLennan Cos., Inc. | | | 2,174 | | | | 181,573 | |
Progressive Corp. (The) | | | 2,744 | | | | 148,450 | |
Torchmark Corp. | | | 1,762 | | | | 160,078 | |
Travelers Cos., Inc. (The) | | | 2,329 | | | | 349,164 | |
Unum Group | | | 1,433 | | | | 76,221 | |
| | | | | | | | | |
| | | $ | 2,492,865 | |
| | | | | | | | | |
|
Internet & Direct Marketing Retail — 1.6% | |
Amazon.com, Inc.(1) | | | 1,882 | | | $ | 2,730,575 | |
Priceline Group, Inc. (The)(1) | | | 97 | | | | 185,469 | |
TripAdvisor, Inc.(1) | | | 3,538 | | | | 122,662 | |
| | | | | | | | | |
| | | $ | 3,038,706 | |
| | | | | | | | | |
|
Internet Software & Services — 2.7% | |
Akamai Technologies, Inc.(1) | | | 930 | | | $ | 62,301 | |
Alphabet, Inc., Class A(1) | | | 1,435 | | | | 1,696,486 | |
Alphabet, Inc., Class C(1) | | | 1,385 | | | | 1,620,367 | |
Facebook, Inc., Class A(1) | | | 10,267 | | | | 1,918,799 | |
VeriSign, Inc.(1) | | | 523 | | | | 60,103 | |
| | | | | | | | | |
| | | $ | 5,358,056 | |
| | | | | | | | | |
|
IT Services — 1.9% | |
Accenture PLC, Class A | | | 4,111 | | | $ | 660,638 | |
Fidelity National Information Services, Inc. | | | 4,004 | | | | 409,849 | |
Global Payments, Inc. | | | 975 | | | | 108,985 | |
| | | | |
| | 9 | | See Notes to Financial Statements. |
Parametric Volatility Risk Premium - Defensive Fund
January 31, 2018
Portfolio of Investments — continued
| | | | | | | | |
| Security | | Shares | | | Value | |
|
IT Services (continued) | |
International Business Machines Corp. | | | 1,853 | | | $ | 303,336 | |
Mastercard, Inc., Class A | | | 5,005 | | | | 845,845 | |
Total System Services, Inc. | | | 1,195 | | | | 106,188 | |
Visa, Inc., Class A | | | 9,485 | | | | 1,178,322 | |
Western Union Co. | | | 1,453 | | | | 30,208 | |
| | | | | | | | | |
| | | $ | 3,643,371 | |
| | | | | | | | | |
|
Life Sciences Tools & Services — 0.1% | |
PerkinElmer, Inc. | | | 2,006 | | | $ | 160,801 | |
| | | | | | | | | |
| | | $ | 160,801 | |
| | | | | | | | | |
|
Machinery — 0.9% | |
Cummins, Inc. | | | 1,796 | | | $ | 337,648 | |
Flowserve Corp. | | | 1,387 | | | | 62,859 | |
Fortive Corp. | | | 2,243 | | | | 170,513 | |
Illinois Tool Works, Inc. | | | 3,050 | | | | 529,694 | |
Ingersoll-Rand PLC | | | 353 | | | | 33,404 | |
PACCAR, Inc. | | | 5,722 | | | | 426,632 | |
Pentair PLC | | | 1,318 | | | | 94,237 | |
Xylem, Inc. | | | 915 | | | | 66,118 | |
| | | | | | | | | |
| | | $ | 1,721,105 | |
| | | | | | | | | |
|
Media — 1.6% | |
Comcast Corp., Class A | | | 26,697 | | | $ | 1,135,423 | |
Discovery Communications, Inc., Class A(1) | | | 9,024 | | | | 226,232 | |
News Corp., Class A | | | 18,862 | | | | 322,729 | |
News Corp., Class B | | | 1,881 | | | | 32,824 | |
Scripps Networks Interactive, Inc., Class A | | | 3,117 | | | | 274,265 | |
Twenty-First Century Fox, Inc., Class B | | | 2,260 | | | | 82,467 | |
Walt Disney Co. (The) | | | 9,142 | | | | 993,461 | |
| | | | | | | | | |
| | | $ | 3,067,401 | |
| | | | | | | | | |
|
Metals & Mining — 0.1% | |
Freeport-McMoRan, Inc.(1) | | | 8,076 | | | $ | 157,482 | |
Nucor Corp. | | | 1,454 | | | | 97,360 | |
| | | | | | | | | |
| | | $ | 254,842 | |
| | | | | | | | | |
|
Multi-Utilities — 0.5% | |
Centerpoint Energy, Inc. | | | 9,562 | | | $ | 269,457 | |
CMS Energy Corp. | | | 4,167 | | | | 186,473 | |
NiSource, Inc. | | | 3,423 | | | | 84,480 | |
SCANA Corp. | | | 5,903 | | | | 239,898 | |
WEC Energy Group, Inc. | | | 3,613 | | | | 232,316 | |
| | | | | | | | | |
| | | $ | 1,012,624 | |
| | | | | | | | | |
| | | | | | | | |
| Security | | Shares | | | Value | |
|
Multiline Retail — 0.2% | |
Dollar Tree, Inc.(1) | | | 2,251 | | | $ | 258,865 | |
Kohl’s Corp. | | | 1,427 | | | | 92,427 | |
| | | | | | | | | |
| | | $ | 351,292 | |
| | | | | | | | | |
|
Oil, Gas & Consumable Fuels — 2.7% | |
Andeavor | | | 2,749 | | | $ | 297,332 | |
Cabot Oil & Gas Corp. | | | 6,405 | | | | 168,772 | |
Chesapeake Energy Corp.(1) | | | 7,091 | | | | 24,819 | |
Chevron Corp. | | | 10,516 | | | | 1,318,181 | |
Cimarex Energy Co. | | | 2,817 | | | | 316,067 | |
Concho Resources, Inc.(1) | | | 1,219 | | | | 191,919 | |
EQT Corp. | | | 3,165 | | | | 171,828 | |
Exxon Mobil Corp. | | | 21,298 | | | | 1,859,315 | |
Hess Corp. | | | 1,840 | | | | 92,938 | |
Marathon Oil Corp. | | | 7,552 | | | | 137,371 | |
Newfield Exploration Co.(1) | | | 7,306 | | | | 231,308 | |
Noble Energy, Inc. | | | 7,679 | | | | 234,363 | |
ONEOK, Inc. | | | 3,909 | | | | 230,084 | |
| | | | | | | | | |
| | | $ | 5,274,297 | |
| | | | | | | | | |
|
Personal Products — 0.1% | |
Estee Lauder Cos., Inc. (The), Class A | | | 1,089 | | | $ | 146,971 | |
| | | | | | | | | |
| | | $ | 146,971 | |
| | | | | | | | | |
|
Pharmaceuticals — 2.4% | |
Bristol-Myers Squibb Co. | | | 9,605 | | | $ | 601,273 | |
Johnson & Johnson | | | 13,340 | | | | 1,843,455 | |
Merck & Co., Inc. | | | 13,530 | | | | 801,653 | |
Mylan NV(1) | | | 3,386 | | | | 145,090 | |
Pfizer, Inc. | | | 33,060 | | | | 1,224,542 | |
| | | | | | | | | |
| | | $ | 4,616,013 | |
| | | | | | | | | |
|
Professional Services — 0.3% | |
Equifax, Inc. | | | 1,811 | | | $ | 226,248 | |
Robert Half International, Inc. | | | 65 | | | | 3,762 | |
Verisk Analytics, Inc.(1) | | | 3,497 | | | | 349,875 | |
| | | | | | | | | |
| | | $ | 579,885 | |
| | | | | | | | | |
|
Real Estate Management & Development — 0.1% | |
CBRE Group, Inc., Class A(1) | | | 2,422 | | | $ | 110,661 | |
| | | | | | | | | |
| | | $ | 110,661 | |
| | | | | | | | | |
| | | | |
| | 10 | | See Notes to Financial Statements. |
Parametric Volatility Risk Premium - Defensive Fund
January 31, 2018
Portfolio of Investments — continued
| | | | | | | | |
| Security | | Shares | | | Value | |
|
Road & Rail — 0.5% | |
J.B. Hunt Transport Services, Inc. | | | 1,150 | | | $ | 138,955 | |
Kansas City Southern | | | 1,110 | | | | 125,574 | |
Union Pacific Corp. | | | 5,483 | | | | 731,980 | |
| | | | | | | | | |
| | | $ | 996,509 | |
| | | | | | | | | |
|
Semiconductors & Semiconductor Equipment — 1.9% | |
Analog Devices, Inc. | | | 2,192 | | | $ | 201,401 | |
Applied Materials, Inc. | | | 7,374 | | | | 395,468 | |
Broadcom, Ltd. | | | 2,771 | | | | 687,291 | |
Intel Corp. | | | 25,405 | | | | 1,222,997 | |
NVIDIA Corp. | | | 2,920 | | | | 717,736 | |
Qorvo, Inc.(1) | | | 473 | | | | 33,947 | |
QUALCOMM, Inc. | | | 429 | | | | 29,279 | |
Texas Instruments, Inc. | | | 3,778 | | | | 414,333 | |
| | | | | | | | | |
| | | $ | 3,702,452 | |
| | | | | | | | | |
|
Software — 2.6% | |
CA, Inc. | | | 9,838 | | | $ | 352,692 | |
Microsoft Corp. | | | 34,504 | | | | 3,278,225 | |
Oracle Corp. | | | 17,113 | | | | 882,860 | |
Red Hat, Inc.(1) | | | 2,737 | | | | 359,587 | |
Symantec Corp. | | | 6,659 | | | | 181,325 | |
| | | | | | | | | |
| | | $ | 5,054,689 | |
| | | | | | | | | |
|
Specialty Retail — 1.1% | |
Best Buy Co., Inc. | | | 969 | | | $ | 70,795 | |
CarMax, Inc.(1) | | | 1,743 | | | | 124,398 | |
Foot Locker, Inc. | | | 670 | | | | 32,930 | |
Home Depot, Inc. (The) | | | 6,412 | | | | 1,288,171 | |
L Brands, Inc. | | | 1,325 | | | | 66,369 | |
Ross Stores, Inc. | | | 4,329 | | | | 356,666 | |
Signet Jewelers, Ltd. | | | 505 | | | | 26,715 | |
Tiffany & Co. | | | 844 | | | | 90,013 | |
| | | | | | | | | |
| | | $ | 2,056,057 | |
| | | | | | | | | |
|
Technology Hardware, Storage & Peripherals — 2.1% | |
Apple, Inc. | | | 22,502 | | | $ | 3,767,510 | |
NetApp, Inc. | | | 2,400 | | | | 147,600 | |
Seagate Technology PLC | | | 2,048 | | | | 113,049 | |
| | | | | | | | | |
| | | $ | 4,028,159 | |
| | | | | | | | | |
|
Textiles, Apparel & Luxury Goods — 0.6% | |
Hanesbrands, Inc. | | | 15,742 | | | $ | 341,916 | |
Michael Kors Holdings, Ltd.(1) | | | 470 | | | | 31,020 | |
| | | | | | | | |
| Security | | Shares | | | Value | |
|
Textiles, Apparel & Luxury Goods (continued) | |
PVH Corp. | | | 2,492 | | | $ | 386,460 | |
Ralph Lauren Corp. | | | 1,633 | | | | 186,668 | |
Tapestry, Inc. | | | 1,403 | | | | 65,997 | |
Under Armour, Inc., Class A(1) | | | 7,388 | | | | 102,398 | |
Under Armour, Inc., Class C(1) | | | 5,671 | | | | 72,872 | |
| | | | | | | | | |
| | | $ | 1,187,331 | |
| | | | | | | | | |
|
Tobacco — 0.5% | |
Altria Group, Inc. | | | 3,071 | | | $ | 216,014 | |
Philip Morris International, Inc. | | | 6,706 | | | | 719,085 | |
| | | | | | | | | |
| | | $ | 935,099 | |
| | | | | | | | | |
|
Trading Companies & Distributors — 0.2% | |
Fastenal Co. | | | 960 | | | $ | 52,762 | |
United Rentals, Inc.(1) | | | 1,096 | | | | 198,496 | |
W.W. Grainger, Inc. | | | 386 | | | | 104,089 | |
| | | | | | | | | |
| | | $ | 355,347 | |
| | | | | | | | | |
|
Water Utilities — 0.1% | |
American Water Works Co., Inc. | | | 1,952 | | | $ | 162,348 | |
| | | | | | | | | |
| | | $ | 162,348 | |
| | | | | | | | | |
| |
Total Common Stocks
(identified cost $84,368,803) | | | $ | 99,213,841 | |
| | | | | | | | | |
|
| U.S. Treasury Obligations — 24.0% | |
| | |
| | | | | | | | |
| Security | | Principal
Amount
(000’s omitted) | | | Value | |
U.S. Treasury Notes: | | | | | | | | |
1.00%, 3/15/18(3) | | $ | 8,830 | | | $ | 8,826,470 | |
1.00%, 5/15/18 | | | 13,000 | | | | 12,982,571 | |
1.00%, 9/15/18 | | | 15,000 | | | | 14,930,566 | |
1.25%, 10/31/18(3) | | | 10,000 | | | | 9,957,422 | |
| | | | | | | | | |
| | |
Total U.S. Treasury Obligations
(identified cost $46,762,255) | | | | | | $ | 46,697,029 | |
| | | | | | | | | |
|
| Short-Term Investments — 25.3% | |
|
| U.S. Treasury Obligations — 19.9% | |
| | |
| | | | | | | | |
| Security | | Principal
Amount
(000’s omitted) | | | Value | |
U.S. Treasury Bills: | | | | | | | | |
0.00%, 3/29/18(3) | | $ | 5,500 | | | $ | 5,488,878 | |
0.00%, 4/26/18 | | | 3,600 | | | | 3,588,135 | |
| | | | |
| | 11 | | See Notes to Financial Statements. |
Parametric Volatility Risk Premium - Defensive Fund
January 31, 2018
Portfolio of Investments — continued
| | | | | | | | |
| Security | | Principal
Amount
(000’s omitted) | | | Value | |
U.S. Treasury Bills: (continued) | |
0.00%, 6/21/18 | | $ | 10,000 | | | $ | 9,941,861 | |
0.00%, 9/13/18 | | | 10,000 | | | | 9,898,367 | |
0.00%, 1/3/19 | | | 10,000 | | | | 9,836,247 | |
| | | | | | | | | |
| | |
Total U.S. Treasury Obligations
(identified cost $38,794,728) | | | | | | $ | 38,753,488 | |
| | | | | | | | | |
|
| Other — 5.4% | |
| | |
| | | | | | | | |
| Description | | Units | | | Value | |
Eaton Vance Cash Reserves Fund, LLC, 1.65%(4) | | | 10,587,532 | | | $ | 10,588,590 | |
| | | | | | | | | |
| |
Total Other
(identified cost $10,587,768) | | | $ | 10,588,590 | |
| | | | | | | | | |
| |
Total Short-Term Investments
(identified cost $49,382,496) | | | $ | 49,342,078 | |
| | | | | | | | | |
| |
Total Investments — 100.3%
(identified cost $180,513,554) | | | $ | 195,252,948 | |
| | | | | | | | | |
| |
Total Options Written — (0.5)%
(premiums received $607,686) | | | $ | (916,480 | ) |
| | | | | | | | | |
| |
Other Assets, Less Liabilities — 0.2% | | | $ | 254,605 | |
| | | | | | | | | |
| | |
Net Assets — 100.0% | | | | | | $ | 194,591,073 | |
| | | | | | | | | |
The percentage shown for each investment category in the Portfolio of Investments is based on net assets.
| (1) | Non-income producing security. |
| (2) | Amount is less than 0.05%. |
| (3) | Security (or a portion thereof) has been pledged as collateral for written options. |
| (4) | Affiliated investment company, available to Eaton Vance portfolios and funds, which invests in high quality, U.S. dollar denominated money market instruments. The rate shown is the annualized seven-day yield as of January 31, 2018. |
| | | | | | | | | | | | | | | | | | | | |
| Call Options Written — (0.3)% | |
|
| Exchange-Traded Options — (0.3)% | |
| | | | | |
| | | | | | | | | | | | | | | | | | | | |
| Description | | Number of
Contracts | | | Notional
Amount | | | Exercise
Price | | | Expiration
Date | | | Value | |
S&P 500 Index | | | 27 | | | $ | 7,624,287 | | | $ | 2,785 | | | | 2/2/18 | | | $ | (120,555 | ) |
S&P 500 Index | | | 28 | | | | 7,906,668 | | | | 2,790 | | | | 2/5/18 | | | | (117,460 | ) |
S&P 500 Index | | | 30 | | | | 8,471,430 | | | | 2,795 | | | | 2/7/18 | | | | (121,500 | ) |
S&P 500 Index | | | 29 | | | | 8,189,049 | | | | 2,835 | | | | 2/9/18 | | | | (51,185 | ) |
S&P 500 Index | | | 29 | | | | 8,189,049 | | | | 2,835 | | | | 2/12/18 | | | | (55,680 | ) |
S&P 500 Index | | | 25 | | | | 7,059,525 | | | | 2,860 | | | | 2/14/18 | | | | (27,000 | ) |
S&P 500 Index | | | 29 | | | | 8,189,049 | | | | 2,860 | | | | 2/16/18 | | | | (37,265 | ) |
S&P 500 Index | | | 31 | | | | 8,753,811 | | | | 2,880 | | | | 2/20/18 | | | | (23,715 | ) |
S&P 500 Index | | | 32 | | | | 9,036,192 | | | | 2,900 | | | | 2/21/18 | | | | (13,760 | ) |
S&P 500 Index | | | 31 | | | | 8,753,811 | | | | 2,920 | | | | 2/23/18 | | | | (8,293 | ) |
S&P 500 Index | | | 29 | | | | 8,189,049 | | | | 2,930 | | | | 2/26/18 | | | | (6,235 | ) |
S&P 500 Index | | | 30 | | | | 8,471,430 | | | | 2,880 | | | | 2/28/18 | | | | (32,550 | ) |
| | | | | | | | | | | | | | | | | | | | | |
| | | | | |
Total | | | | | | | | | | | | | | | | | | $ | (615,198 | ) |
| | | | | | | | | | | | | | | | | | | | | |
|
| Put Options Written — (0.2)% | |
|
| Exchange-Traded Options — (0.2)% | |
| | | | | |
| | | | | | | | | | | | | | | | | | | | |
| Description | | Number of
Contracts | | | Notional
Amount | | | Exercise
Price | | | Expiration
Date | | | Value | |
S&P 500 Index | | | 27 | | | $ | 7,624,287 | | | $ | 2,690 | | | | 2/2/18 | | | $ | (1,012 | ) |
S&P 500 Index | | | 29 | | | | 8,189,049 | | | | 2,700 | | | | 2/5/18 | | | | (1,595 | ) |
S&P 500 Index | | | 30 | | | | 8,471,430 | | | | 2,695 | | | | 2/7/18 | | | | (3,075 | ) |
S&P 500 Index | | | 29 | | | | 8,189,049 | | | | 2,730 | | | | 2/9/18 | | | | (9,135 | ) |
S&P 500 Index | | | 29 | | | | 8,189,049 | | | | 2,720 | | | | 2/12/18 | | | | (9,860 | ) |
S&P 500 Index | | | 25 | | | | 7,059,525 | | | | 2,740 | | | | 2/14/18 | | | | (15,625 | ) |
S&P 500 Index | | | 29 | | | | 8,189,049 | | | | 2,745 | | | | 2/16/18 | | | | (24,360 | ) |
S&P 500 Index | | | 29 | | | | 8,189,049 | | | | 2,765 | | | | 2/20/18 | | | | (34,655 | ) |
S&P 500 Index | | | 32 | | | | 9,036,192 | | | | 2,775 | | | | 2/21/18 | | | | (46,720 | ) |
S&P 500 Index | | | 31 | | | | 8,753,811 | | | | 2,795 | | | | 2/23/18 | | | | (64,325 | ) |
S&P 500 Index | | | 29 | | | | 8,189,049 | | | | 2,785 | | | | 2/26/18 | | | | (55,970 | ) |
S&P 500 Index | | | 30 | | | | 8,471,430 | | | | 2,730 | | | | 2/28/18 | | | | (34,950 | ) |
| | | | | | | | | | | | | | | | | | | | | |
| | | | | |
Total | | | | | | | | | | | | | | | | | | $ | (301,282 | ) |
| | | | | | | | | | | | | | | | | | | | | |
| | | | |
| | 12 | | See Notes to Financial Statements. |
Parametric Volatility Risk Premium - Defensive Fund
January 31, 2018
Statement of Assets and Liabilities
| | | | |
| Assets | | January 31, 2018 | |
Unaffiliated investments, at value (identified cost, $169,925,786) | | $ | 184,664,358 | |
Affiliated investment, at value (identified cost, $10,587,768) | | | 10,588,590 | |
Dividends receivable | | | 65,960 | |
Interest receivable | | | 151,626 | |
Dividends receivable from affiliated investment | | | 10,571 | |
Receivable for premiums on written options | | | 66,540 | |
Receivable for Fund shares sold | | | 347,418 | |
Total assets | | $ | 195,895,063 | |
| |
| Liabilities | | | | |
Written options outstanding, at value (premiums received, $607,686) | | $ | 916,480 | |
Payable for closed written options | | | 206,696 | |
Payable for Fund shares redeemed | | | 7,592 | |
Payable to affiliates: | | | | |
Investment adviser and administration fee | | | 63,814 | |
Due to affiliates | | | 7,961 | |
Accrued expenses | | | 101,447 | |
Total liabilities | | $ | 1,303,990 | |
Net Assets | | $ | 194,591,073 | |
| |
| Sources of Net Assets | | | | |
Paid-in capital | | $ | 184,116,900 | |
Accumulated undistributed net investment income | | | 47,369 | |
Accumulated net realized loss | | | (4,003,796 | ) |
Net unrealized appreciation | | | 14,430,600 | |
Total | | $ | 194,591,073 | |
|
| Institutional Class Shares | |
Net Assets | | $ | 194,591,073 | |
Shares Outstanding | | | 17,651,843 | |
Net Asset Value, Offering Price and Redemption Price Per Share | | | | |
(net assets ÷ shares of beneficial interest outstanding) | | $ | 11.02 | |
| | | | |
| | 13 | | See Notes to Financial Statements. |
Parametric Volatility Risk Premium - Defensive Fund
January 31, 2018
Statement of Operations
| | | | |
| Investment Income | | Period Ended
January 31, 2018(1) | |
Dividends | | $ | 1,030,291 | |
Dividends from affiliated investment | | | 77,301 | |
Interest | | | 567,153 | |
Total investment income | | $ | 1,674,745 | |
| |
| Expenses | | | | |
Investment adviser and administration fee | | $ | 431,627 | |
Trustees’ fees and expenses | | | 7,350 | |
Custodian fee | | | 79,444 | |
Transfer and dividend disbursing agent fees | | | 4,000 | |
Legal and accounting services | | | 68,773 | |
Printing and postage | | | 8,883 | |
Registration fees | | | 69,446 | |
Miscellaneous | | | 9,895 | |
Total expenses | | $ | 679,418 | |
Deduct — | | | | |
Allocation of expenses to affiliates | | $ | 85,136 | |
Total expense reductions | | $ | 85,136 | |
| |
Net expenses | | $ | 594,282 | |
| |
Net investment income | | $ | 1,080,463 | |
| |
| Realized and Unrealized Gain (Loss) | | | | |
Net realized gain (loss) — | | | | |
Investment transactions | | $ | (1,899,962 | ) |
Investment transactions — affiliated investment | | | (2,564 | ) |
Written options | | | (2,110,678 | ) |
Net realized loss | | $ | (4,013,204 | ) |
Change in unrealized appreciation (depreciation) — | | | | |
Investments | | $ | 14,738,572 | |
Investments — affiliated investment | | | 822 | |
Written options | | | (308,794 | ) |
Net change in unrealized appreciation (depreciation) | | $ | 14,430,600 | |
| |
Net realized and unrealized gain | | $ | 10,417,396 | |
| |
Net increase in net assets from operations | | $ | 11,497,859 | |
| (1) | For the period from the start of business, February 9, 2017, to January 31, 2018. |
| | | | |
| | 14 | | See Notes to Financial Statements. |
Parametric Volatility Risk Premium - Defensive Fund
January 31, 2018
Statement of Changes in Net Assets
| | | | |
| Increase (Decrease) in Net Assets | | Period Ended
January 31, 2018(1) | |
From operations — | | | | |
Net investment income | | $ | 1,080,463 | |
Net realized loss | | | (4,013,204 | ) |
Net change in unrealized appreciation (depreciation) | | | 14,430,600 | |
Net increase in net assets from operations | | $ | 11,497,859 | |
Distributions to shareholders — | | | | |
From net investment income | | $ | (912,813 | ) |
Total distributions to shareholders | | $ | (912,813 | ) |
Transactions in shares of beneficial interest — | | | | |
Proceeds from sale of shares | | $ | 216,359,045 | |
Net asset value of shares issued to shareholders in payment of distributions declared | | | 873,797 | |
Cost of shares redeemed | | | (33,226,815 | ) |
Net increase in net assets from Fund share transactions | | $ | 184,006,027 | |
| |
Net increase in net assets | | $ | 194,591,073 | |
|
| Net Assets | |
At beginning of period | | $ | — | |
At end of period | | $ | 194,591,073 | |
|
Accumulated undistributed net investment income
included in net assets | |
At end of period | | $ | 47,369 | |
| (1) | For the period from the start of business, February 9, 2017, to January 31, 2018. |
| | | | |
| | 15 | | See Notes to Financial Statements. |
Parametric Volatility Risk Premium - Defensive Fund
January 31, 2018
Financial Highlights
| | | | |
| | | Institutional Class | |
| | | Period Ended
January 31, 2018(1) | |
Net asset value — Beginning of period | | $ | 10.000 | |
| |
| Income (Loss) From Operations | | | | |
Net investment income(2) | | $ | 0.104 | |
Net realized and unrealized gain | | | 0.974 | |
| |
Total income from operations | | $ | 1.078 | |
| |
| Less Distributions | | | | |
From net investment income | | $ | (0.058 | ) |
| |
Total distributions | | $ | (0.058 | ) |
| |
Net asset value — End of period | | $ | 11.020 | |
| |
Total Return(3)(4) | | | 10.79 | %(5) |
| |
| Ratios/Supplemental Data | | | | |
Net assets, end of period (000’s omitted) | | $ | 194,591 | |
Ratios (as a percentage of average daily net assets): | | | | |
Expenses(4) | | | 0.55 | %(6) |
Net investment income | | | 1.00 | %(6) |
Portfolio Turnover | | | 26 | %(5) |
| (1) | For the period from the start of business, February 9, 2017, to January 31, 2018. |
| (2) | Computed using average shares outstanding. |
| (3) | Returns are historical and are calculated by determining the percentage change in net asset value with all distributions reinvested. |
| (4) | The investment adviser and administrator and sub-adviser reimbursed certain operating expenses (equal to 0.08% of average daily net assets for the period ended January 31, 2018). Absent this reimbursement, total return would be lower. |
| | | | |
| | 16 | | See Notes to Financial Statements. |
Parametric Volatility Risk Premium - Defensive Fund
January 31, 2018
Notes to Financial Statements
1 Significant Accounting Policies
Parametric Volatility Risk Premium - Defensive Fund (the Fund) is a diversified series of Eaton Vance Mutual Funds Trust (the Trust). The Trust is a Massachusetts business trust registered under the Investment Company Act of 1940, as amended (the 1940 Act), as an open-end management investment company. The Fund commenced operations on February 9, 2017. The Fund’s investment objective is total return. The Fund offers Institutional Class shares, which are sold at net asset value and are not subject to a sales charge.
The following is a summary of significant accounting policies of the Fund. The policies are in conformity with accounting principles generally accepted in the United States of America (U.S. GAAP). The Fund is an investment company and follows accounting and reporting guidance in the Financial Accounting Standards Board (FASB) Accounting Standards Codification Topic 946.
A Investment Valuation — The following methodologies are used to determine the market value or fair value of investments.
Equity Securities. Equity securities listed on a U.S. securities exchange generally are valued at the last sale or closing price on the day of valuation or, if no sales took place on such date, at the mean between the closing bid and asked prices therefore on the exchange where such securities are principally traded. Equity securities listed on the NASDAQ Global or Global Select Market generally are valued at the NASDAQ official closing price. Unlisted or listed securities for which closing sales prices or closing quotations are not available are valued at the mean between the latest available bid and asked prices.
Debt Obligations. Debt obligations are generally valued on the basis of valuations provided by third party pricing services, as derived from such services’ pricing models. Inputs to the models may include, but are not limited to, reported trades, executable bid and asked prices, broker/dealer quotations, prices or yields of securities with similar characteristics, interest rates, anticipated prepayments, benchmark curves or information pertaining to the issuer, as well as industry and economic events. The pricing services may use a matrix approach, which considers information regarding securities with similar characteristics to determine the valuation for a security. Short-term obligations purchased with a remaining maturity of sixty days or less for which a valuation from a third party pricing service is not readily available may be valued at amortized cost, which approximates fair value.
Derivatives. U.S. exchange-traded options are valued at the mean between the bid and asked prices at valuation time as reported by the Options Price Reporting Authority. Non U.S. exchange-traded options and over-the-counter options are valued by a third party pricing service using techniques that consider factors including the value of the underlying instrument, the volatility of the underlying instrument and the period of time until option expiration.
Affiliated Fund. The Fund may invest in Eaton Vance Cash Reserves Fund, LLC (Cash Reserves Fund), an affiliated investment company managed by Eaton Vance Management (EVM). While Cash Reserves Fund is not a registered money market mutual fund, it conducts all of its investment activities in accordance with the requirements of Rule 2a-7 under the 1940 Act. Investments in Cash Reserves Fund are valued at the closing net asset value per unit on the valuation day. Cash Reserves Fund generally values its investment securities based on available market quotations provided by a third party pricing service.
Fair Valuation. Investments for which valuations or market quotations are not readily available or are deemed unreliable are valued at fair value using methods determined in good faith by or at the direction of the Trustees of the Fund in a manner that fairly reflects the security’s value, or the amount that the Fund might reasonably expect to receive for the security upon its current sale in the ordinary course. Each such determination is based on a consideration of relevant factors, which are likely to vary from one pricing context to another. These factors may include, but are not limited to, the type of security, the existence of any contractual restrictions on the security’s disposition, the price and extent of public trading in similar securities of the issuer or of comparable companies or entities, quotations or relevant information obtained from broker/dealers or other market participants, information obtained from the issuer, analysts, and/or the appropriate stock exchange (for exchange-traded securities), an analysis of the company’s or entity’s financial condition, and an evaluation of the forces that influence the issuer and the market(s) in which the security is purchased and sold.
B Investment Transactions — Investment transactions for financial statement purposes are accounted for on a trade date basis. Realized gains and losses on investments sold are determined on the basis of identified cost.
C Income — Dividend income is recorded on the ex-dividend date for dividends received in cash and/or securities. Interest income is recorded on the basis of interest accrued, adjusted for amortization of premium or accretion of discount.
D Federal Taxes — The Fund’s policy is to comply with the provisions of the Internal Revenue Code applicable to regulated investment companies and to distribute to shareholders each year substantially all of its net investment income, and all or substantially all of its net realized capital gains. Accordingly, no provision for federal income or excise tax is necessary.
As of January 31, 2018, the Fund had no uncertain tax positions that would require financial statement recognition, de-recognition, or disclosure. The Fund files a U.S. federal income tax return annually after its fiscal year-end, which is subject to examination by the Internal Revenue Service for a period of three years from the date of filing.
E Expenses — The majority of expenses of the Trust are directly identifiable to an individual fund. Expenses which are not readily identifiable to a specific fund are allocated taking into consideration, among other things, the nature and type of expense and the relative size of the funds.
F Use of Estimates — The preparation of the financial statements in conformity with U.S. GAAP requires management to make estimates and assumptions that affect the reported amounts of assets and liabilities at the date of the financial statements and the reported amounts of income and expense during the reporting period. Actual results could differ from those estimates.
Parametric Volatility Risk Premium - Defensive Fund
January 31, 2018
Notes to Financial Statements — continued
G Indemnifications — Under the Trust’s organizational documents, its officers and Trustees may be indemnified against certain liabilities and expenses arising out of the performance of their duties to the Fund. Under Massachusetts law, if certain conditions prevail, shareholders of a Massachusetts business trust (such as the Trust) could be deemed to have personal liability for the obligations of the Trust. However, the Trust’s Declaration of Trust contains an express disclaimer of liability on the part of Fund shareholders and the By-laws provide that the Trust shall assume the defense on behalf of any Fund shareholders. Moreover, the By-laws also provide for indemnification out of Fund property of any shareholder held personally liable solely by reason of being or having been a shareholder for all loss or expense arising from such liability. Additionally, in the normal course of business, the Fund enters into agreements with service providers that may contain indemnification clauses. The Fund’s maximum exposure under these arrangements is unknown as this would involve future claims that may be made against the Fund that have not yet occurred.
H Written Options — Upon the writing of a call or a put option, the premium received by the Fund is included in the Statement of Assets and Liabilities as a liability. The amount of the liability is subsequently marked-to-market to reflect the current market value of the option written, in accordance with the Fund’s policies on investment valuations discussed above. Premiums received from writing options which expire are treated as realized gains. Premiums received from writing options which are exercised or are closed are added to or offset against the proceeds or amount paid on the transaction to determine the realized gain or loss. When an index option is exercised, the Fund is required to deliver an amount of cash determined by the excess of the strike price of the option over the value of the index (in the case of a put) or the excess of the value of the index over the strike price of the option (in the case of a call) at contract termination. If a put option on a security is exercised, the premium reduces the cost basis of the securities purchased by the Fund. The Fund, as a writer of an option, may have no control over whether the underlying securities or other assets may be sold (call) or purchased (put) and, as a result, bears the market risk of an unfavorable change in the price of the securities or other assets underlying the written option. The Fund may also bear the risk of not being able to enter into a closing transaction if a liquid secondary market does not exist.
2 Distributions to Shareholders and Income Tax Information
It is the present policy of the Fund to make at least one distribution annually (normally in December) of all or substantially all of its net investment income and to distribute annually all or substantially all of its net realized capital gains. Distributions to shareholders are recorded on the ex-dividend date. Shareholders may reinvest income and capital gain distributions in additional shares of the Fund at the net asset value as of the ex-dividend date or, at the election of the shareholder, receive distributions in cash. Distributions to shareholders are determined in accordance with income tax regulations, which may differ from U.S. GAAP. As required by U.S. GAAP, only distributions in excess of tax basis earnings and profits are reported in the financial statements as a return of capital. Permanent differences between book and tax accounting relating to distributions are reclassified to paid-in capital. For tax purposes, distributions from short-term capital gains are considered to be from ordinary income.
The tax character of distributions declared for the period ended January 31, 2018 was as follows:
| | | | |
| | | Period Ended
January 31, 2018 | |
| |
Distributions declared from: | | | | |
Ordinary income | | $ | 912,813 | |
During the period ended January 31, 2018, accumulated net realized loss was decreased by $9,408, accumulated undistributed net investment income was decreased by $120,281 and paid-in capital was increased by $110,873 due to the Fund’s use of equalization accounting and differences between book and tax accounting, primarily for accretion of market discount, distributions from real estate investment trusts (REITs) and non-deductible expenses. Tax equalization accounting allows the Fund to treat as a distribution that portion of redemption proceeds representing a redeeming shareholder’s portion of undistributed taxable income and net capital gains. These reclassifications had no effect on the net assets or net asset value per share of the Fund.
As of January 31, 2018, the components of distributable earnings (accumulated losses) on a tax basis were as follows:
| | | | |
Undistributed ordinary income | | $ | 47,347 | |
Deferred capital losses | | $ | (4,312,213 | ) |
Net unrealized appreciation | | $ | 14,739,039 | |
The differences between components of distributable earnings (accumulated losses) on a tax basis and the amounts reflected in the Statement of Assets and Liabilities are primarily due to wash sales, option contracts, distributions from REITs and accretion of market discount.
At January 31, 2018, the Fund, for federal income tax purposes, had deferred capital losses of $4,312,213 which would reduce its taxable income arising from future net realized gains on investment transactions, if any, to the extent permitted by the Internal Revenue Code, and thus would reduce the amount of distributions to shareholders, which would otherwise be necessary to relieve the Fund of any liability for federal income or excise tax. The deferred
Parametric Volatility Risk Premium - Defensive Fund
January 31, 2018
Notes to Financial Statements — continued
capital losses are treated as arising on the first day of the Fund’s next taxable year and retain the same short-term or long-term character as when originally deferred. Of the deferred capital losses at January 31, 2018, $2,866,373 are short-term and $1,445,840 are long-term.
The cost and unrealized appreciation (depreciation) of investments, including open derivative contracts, of the Fund at January 31, 2018, as determined on a federal income tax basis, were as follows:
| | | | |
| |
Aggregate cost | | $ | 180,513,909 | |
| |
Gross unrealized appreciation | | $ | 15,373,957 | |
Gross unrealized depreciation | | | (634,918 | ) |
| |
Net unrealized appreciation | | $ | 14,739,039 | |
3 Investment Adviser and Administration Fee and Other Transactions with Affiliates
The investment adviser and administration fee is earned by EVM as compensation for investment advisory and administrative services rendered to the Fund. The fee is computed at an annual rate of 0.40% of the Fund’s average daily net assets up to $1 billion and is payable monthly. On net assets of $1 billion and over, the annual fee is reduced. For the period ended January 31, 2018, the investment adviser and administration fee amounted to $431,627 or 0.40% (annualized) of the Fund’s average daily net assets. Pursuant to a sub-advisory agreement, EVM has delegated the investment management of the Fund to Parametric Portfolio Associates LLC (Parametric), a majority-owned subsidiary of Eaton Vance Corp. EVM pays Parametric a portion of its investment adviser and administration fee for sub-advisory services provided to the Fund. The Fund invests its cash in Cash Reserves Fund. EVM does not currently receive a fee for advisory services provided to Cash Reserves Fund.
EVM and Parametric have agreed to reimburse the Fund’s expenses to the extent that total annual operating expenses (relating to ordinary operating expenses only) exceed 0.55% of the Fund’s average daily net assets. This agreement may be changed or terminated after May 31, 2018. Pursuant to this agreement, EVM and Parametric were allocated $85,136 in total of the Fund’s operating expenses for the period ended January 31, 2018.
EVM provides sub-transfer agency and related services to the Fund pursuant to a Sub-Transfer Agency Support Services Agreement. For the period ended January 31, 2018, EVM earned $375 from the Fund pursuant to such agreement, which is included in transfer and dividend disbursing agent fees on the Statement of Operations.
Trustees and officers of the Fund who are members of EVM’s organization receive remuneration for their services to the Fund out of the investment adviser and administration fee. Trustees of the Fund who are not affiliated with EVM may elect to defer receipt of all or a percentage of their annual fees in accordance with the terms of the Trustees Deferred Compensation Plan. For the period ended January 31, 2018, no significant amounts have been deferred. Certain officers and Trustees of the Fund are officers of EVM.
4 Purchases and Sales of Investments
Purchases and sales of investments, other than short-term obligations, aggregated $107,341,805 and $21,079,706, respectively, for the period ended January 31, 2018.
5 Shares of Beneficial Interest
The Fund’s Declaration of Trust permits the Trustees to issue an unlimited number of full and fractional shares of beneficial interest (without par value). Transactions in Fund shares were as follows:
| | | | |
| | | Period Ended
January 31, 2018(1) | |
| |
Sales | | | 20,659,414 | |
Issued to shareholders electing to receive payments of distributions in Fund shares | | | 80,386 | |
Redemptions | | | (3,087,957 | ) |
| |
Net increase | | | 17,651,843 | |
| (1) | For the period from the start of business, February 9, 2017, to January 31, 2018. |
At January 31, 2018, one shareholder owned 29.2% of the outstanding shares of the Fund.
Parametric Volatility Risk Premium - Defensive Fund
January 31, 2018
Notes to Financial Statements — continued
6 Financial Instruments
The Fund may trade in financial instruments with off-balance sheet risk in the normal course of its investing activities. These financial instruments may include written options and may involve, to a varying degree, elements of risk in excess of the amounts recognized for financial statement purposes. The notional or contractual amounts of these instruments represent the investment the Fund has in particular classes of financial instruments and do not necessarily represent the amounts potentially subject to risk. The measurement of the risks associated with these instruments is meaningful only when all related and offsetting transactions are considered. A summary of obligations under these financial instruments at January 31, 2018 is included in the Portfolio of Investments. At January 31, 2018, the Fund had sufficient cash and/or securities to cover commitments under these contracts.
The Fund is subject to equity price risk in the normal course of pursuing its investment objective. The Fund employs a systematic, rules based options strategy of writing call and put options on the S&P 500 Index, that seeks to take advantage of the volatility risk premium ( i.e., the tendency for volatility priced into an option to be higher, on average, than the volatility actually experienced on the securities underlying the option). Premium received from writing options can offset the equity risk premium foregone.
The fair value of open derivative instruments (not considered to be hedging instruments for accounting disclosure purposes) and whose primary underlying risk exposure is equity price risk at January 31, 2018 was as follows:
| | | | | | | | |
| | | Fair Value | |
| Derivative | | Asset Derivative | | | Liability Derivative(1) | |
| | |
Written options | | $ | — | | | $ | (916,480 | ) |
| (1) | Statement of Assets and Liabilities location: Written options outstanding, at value. |
The effect of derivative instruments (not considered to be hedging instruments for accounting disclosure purposes) on the Statement of Operations and whose primary underlying risk exposure is equity price risk for the period ended January 31, 2018 was as follows:
| | | | | | | | |
| Derivative | | Realized Gain (Loss)
on Derivatives Recognized
in Income(1) | | | Change in Unrealized
Appreciation (Depreciation) on
Derivatives Recognized in Income(2) | |
| | |
Written options | | $ | (2,110,678 | ) | | $ | (308,794 | ) |
| (1) | Statement of Operations location: Net realized gain (loss) – Written options. |
| (2) | Statement of Operations location: Change in unrealized appreciation (depreciation) – Written options. |
The average number of written options contracts outstanding during the period ended January 31, 2018, which is indicative of the volume of this derivative type, was 448 contracts.
7 Line of Credit
The Fund participates with other portfolios and funds managed by EVM and its affiliates in a $625 million unsecured line of credit agreement with a group of banks, which is in effect through October 30, 2018. Borrowings are made by the Fund solely to facilitate the handling of unusual and/or unanticipated short-term cash requirements. Interest is charged to the Fund based on its borrowings at an amount above either the Eurodollar rate or Federal Funds rate. In addition, a fee computed at an annual rate of 0.15% on the daily unused portion of the line of credit is allocated among the participating portfolios and funds at the end of each quarter. Because the line of credit is not available exclusively to the Fund, it may be unable to borrow some or all of its requested amounts at any particular time. The Fund did not have any significant borrowings or allocated fees during the period ended January 31, 2018.
8 Fair Value Measurements
Under generally accepted accounting principles for fair value measurements, a three-tier hierarchy to prioritize the assumptions, referred to as inputs, is used in valuation techniques to measure fair value. The three-tier hierarchy of inputs is summarized in the three broad levels listed below.
| • | | Level 1 – quoted prices in active markets for identical investments |
| • | | Level 2 – other significant observable inputs (including quoted prices for similar investments, interest rates, prepayment speeds, credit risk, etc.) |
| • | | Level 3 – significant unobservable inputs (including a fund’s own assumptions in determining the fair value of investments) |
Parametric Volatility Risk Premium - Defensive Fund
January 31, 2018
Notes to Financial Statements — continued
In cases where the inputs used to measure fair value fall in different levels of the fair value hierarchy, the level disclosed is determined based on the lowest level input that is significant to the fair value measurement in its entirety. The inputs or methodology used for valuing securities are not necessarily an indication of the risk associated with investing in those securities.
At January 31, 2018, the hierarchy of inputs used in valuing the Fund’s investments and open derivative instruments, which are carried at value, were as follows:
| | | | | | | | | | | | | | | | |
| Asset Description | | Level 1 | | | Level 2 | | | Level 3 | | | Total | |
| | | | |
Common Stocks | | $ | 99,213,841 | * | | $ | — | | | $ | — | | | $ | 99,213,841 | |
U.S. Treasury Obligations | | | — | | | | 46,697,029 | | | | — | | | | 46,697,029 | |
Short-Term Investments — | | | | | | | | | | | | | | | | |
U.S. Treasury Obligations | | | — | | | | 38,753,488 | | | | — | | | | 38,753,488 | |
Other | | | — | | | | 10,588,590 | | | | — | | | | 10,588,590 | |
| | | | |
Total Investments | | $ | 99,213,841 | | | $ | 96,039,107 | | | $ | — | | | $ | 195,252,948 | |
| | | | |
Liability Description | | | | | | | | | | | | | | | | |
| | | | |
Call Options Written | | $ | (615,198 | ) | | $ | — | | | $ | — | | | $ | (615,198 | ) |
Put Options Written | | | (301,282 | ) | | | — | | | | — | | | | (301,282 | ) |
| | | | |
Total | | $ | (916,480 | ) | | $ | — | | | $ | — | | | $ | (916,480 | ) |
| * | The level classification by major category of investments is the same as the category presentation in the Portfolio of Investments. |
Parametric Volatility Risk Premium - Defensive Fund
January 31, 2018
Report of Independent Registered Public Accounting Firm
To the Trustees of Eaton Vance Mutual Funds Trust and Shareholders of Parametric Volatility Risk Premium - Defensive Fund:
Opinion on the Financial Statements and Financial Highlights
We have audited the accompanying statement of assets and liabilities of Parametric Volatility Risk Premium - Defensive Fund (the “Fund”) (one of the funds constituting Eaton Vance Mutual Funds Trust), including the portfolio of investments, as of January 31, 2018, and the related statement of operations, the statement of changes in net assets, and the financial highlights for the period from the start of business, February 9, 2017, to January 31, 2018, and the related notes. In our opinion, the financial statements and financial highlights present fairly, in all material respects, the financial position of the Fund as of January 31, 2018, and the results of its operations, the changes in its net assets, and the financial highlights for the period from the start of business, February 9, 2017, to January 31, 2018, in conformity with accounting principles generally accepted in the United States of America.
Basis for Opinion
These financial statements and financial highlights are the responsibility of the Fund’s management. Our responsibility is to express an opinion on the Fund’s financial statements and financial highlights based on our audit. We are a public accounting firm registered with the Public Company Accounting Oversight Board (United States) (PCAOB) and are required to be independent with respect to the Fund in accordance with the U.S. federal securities laws and the applicable rules and regulations of the Securities and Exchange Commission and the PCAOB.
We conducted our audit in accordance with the standards of the PCAOB. Those standards require that we plan and perform the audit to obtain reasonable assurance about whether the financial statements and financial highlights are free of material misstatement, whether due to error or fraud. The Fund is not required to have, nor were we engaged to perform, an audit of its internal control over financial reporting. As part of our audit we are required to obtain an understanding of internal control over financial reporting but not for the purpose of expressing an opinion on the effectiveness of the Fund’s internal control over financial reporting. Accordingly, we express no such opinion.
Our audit included performing procedures to assess the risks of material misstatement of the financial statements and financial highlights, whether due to error or fraud, and performing procedures that respond to those risks. Such procedures included examining, on a test basis, evidence regarding the amounts and disclosures in the financial statements and financial highlights. Our audit also included evaluating the accounting principles used and significant estimates made by management, as well as evaluating the overall presentation of the financial statements and financial highlights. Our procedures included confirmation of securities owned as of January 31, 2018, by correspondence with the custodian and brokers; when replies were not received from brokers, we performed other auditing procedures. We believe that our audit provides a reasonable basis for our opinion.
/s/ Deloitte & Touche LLP
Boston, Massachusetts
March 21, 2018
We have served as the auditor of one or more Eaton Vance investment companies since 1959.
Parametric Volatility Risk Premium - Defensive Fund
January 31, 2018
Federal Tax Information (Unaudited)
The Form 1099-DIV you receive in February 2019 will show the tax status of all distributions paid to your account in calendar year 2018. Shareholders are advised to consult their own tax adviser with respect to the tax consequences of their investment in the Fund. As required by the Internal Revenue Code and/or regulations, shareholders must be notified regarding the status of qualified dividend income for individuals and the dividends received deduction for corporations.
Qualified Dividend Income. For the fiscal period ended January 31, 2018, the Fund designates approximately $902,064, or up to the maximum amount of such dividends allowable pursuant to the Internal Revenue Code, as qualified dividend income eligible for the reduced tax rate of 15%.
Dividends Received Deduction. Corporate shareholders are generally entitled to take the dividends received deduction on the portion of the Fund’s dividend distribution that qualifies under tax law. For the Fund’s fiscal 2018 ordinary income dividends, 81.08% qualifies for the corporate dividends received deduction.
Parametric Volatility Risk Premium - Defensive Fund
January 31, 2018
Management and Organization
Fund Management. The Trustees of Eaton Vance Mutual Funds Trust (the Trust) are responsible for the overall management and supervision of the Trust’s affairs. The Trustees and officers of the Trust are listed below. Except as indicated, each individual has held the office shown or other offices in the same company for the last five years. Trustees and officers of the Trust hold indefinite terms of office. The “noninterested Trustees” consist of those Trustees who are not “interested persons” of the Trust, as that term is defined under the 1940 Act. The business address of each Trustee and officer is Two International Place, Boston, Massachusetts 02110. As used below, “EVC” refers to Eaton Vance Corp., “EV” refers to Eaton Vance, Inc., “EVM” refers to Eaton Vance Management, “BMR” refers to Boston Management and Research and “EVD” refers to Eaton Vance Distributors, Inc. EVC and EV are the corporate parent and trustee, respectively, of EVM and BMR. EVD is the Fund’s principal underwriter and a wholly-owned subsidiary of EVC. Each officer affiliated with Eaton Vance may hold a position with other Eaton Vance affiliates that is comparable to his or her position with EVM listed below. Each Trustee oversees 177 portfolios in the Eaton Vance Complex (including all master and feeder funds in a master feeder structure). Each officer serves as an officer of certain other Eaton Vance funds. Each Trustee and officer serves until his or her successor is elected.
| | | | | | |
| Name and Year of Birth | | Position(s) with the Trust | | Trustee Since(1) | | Principal Occupation(s) and Directorships During Past Five Years and Other Relevant Experience |
Interested Trustee | | | | | | |
| | | |
Thomas E. Faust Jr. 1958 | | Trustee | | 2007 | | Chairman, Chief Executive Officer and President of EVC, Director and President of EV, Chief Executive Officer and President of EVM and BMR, and Director of EVD. Trustee and/or officer of 177 registered investment companies. Mr. Faust is an interested person because of his positions with EVM, BMR, EVD, EVC and EV, which are affiliates of the Trust. Directorships in the Last Five Years.(2) Director of EVC and Hexavest Inc. (investment management firm). |
| | | |
| | | | | | |
Noninterested Trustees | | | | | | |
| | | |
Mark R. Fetting 1954 | | Trustee | | 2016 | | Private investor. Formerly held various positions at Legg Mason, Inc. (investment management firm) (2000-2012), including President, Chief Executive Officer, Director and Chairman (2008-2012), Senior Executive Vice President (2004-2008) and Executive Vice President (2001-2004). Formerly, President of Legg Mason family of funds (2001-2008). Formerly, Division President and Senior Officer of Prudential Financial Group, Inc. and related companies (investment management firm) (1991-2000). Directorships in the Last Five Years. None. |
| | | |
Cynthia E. Frost 1961 | | Trustee | | 2014 | | Private investor. Formerly, Chief Investment Officer of Brown University (university endowment) (2000-2012); Formerly, Portfolio Strategist for Duke Management Company (university endowment manager) (1995-2000); Formerly, Managing Director, Cambridge Associates (investment consulting company) (1989-1995); Formerly, Consultant, Bain and Company (management consulting firm) (1987-1989); Formerly, Senior Equity Analyst, BA Investment Management Company (1983-1985). Directorships in the Last Five Years. None. |
| | | |
George J. Gorman 1952 | | Trustee | | 2014 | | Principal at George J. Gorman LLC (consulting firm). Formerly, Senior Partner at Ernst & Young LLP (a registered public accounting firm) (1974-2009). Directorships in the Last Five Years. Formerly, Trustee of the BofA Funds Series Trust (11 funds) (2011-2014) and of the Ashmore Funds (9 funds) (2010-2014). |
| | | |
Valerie A. Mosley 1960 | | Trustee | | 2014 | | Chairwoman and Chief Executive Officer of Valmo Ventures (a consulting and investment firm). Former Partner and Senior Vice President, Portfolio Manager and Investment Strategist at Wellington Management Company, LLP (investment management firm) (1992-2012). Former Chief Investment Officer, PG Corbin Asset Management (1990-1992). Formerly worked in institutional corporate bond sales at Kidder Peabody (1986-1990). Directorships in the Last Five Years.(2) Director of Dynex Capital, Inc. (mortgage REIT) (since 2013). |
Parametric Volatility Risk Premium - Defensive Fund
January 31, 2018
Management and Organization — continued
| | | | | | |
| Name and Year of Birth | | Position(s) with the Trust | | Trustee Since(1) | | Principal Occupation(s) and Directorships During Past Five Years and Other Relevant Experience |
Noninterested Trustees (continued) |
| | | |
William H. Park 1947 | | Chairperson of the Board and Trustee | | 2016 (Chairperson) 2003 (Trustee) | | Private investor. Formerly, Consultant (management and transactional) (2012-2014). Formerly, Chief Financial Officer, Aveon Group L.P. (investment management firm) (2010-2011). Formerly, Vice Chairman, Commercial Industrial Finance Corp. (specialty finance company) (2006-2010). Formerly, President and Chief Executive Officer, Prizm Capital Management, LLC (investment management firm) (2002-2005). Formerly, Executive Vice President and Chief Financial Officer, United Asset Management Corporation (investment management firm) (1982-2001). Formerly, Senior Manager, Price Waterhouse (now PricewaterhouseCoopers) (a registered public accounting firm) (1972-1981). Directorships in the Last Five Years.(2) None. |
| | | |
Helen Frame Peters 1948 | | Trustee | | 2008 | | Professor of Finance, Carroll School of Management, Boston College. Formerly, Dean, Carroll School of Management, Boston College (2000-2002). Formerly, Chief Investment Officer, Fixed Income, Scudder Kemper Investments (investment management firm) (1998-1999). Formerly, Chief Investment Officer, Equity and Fixed Income, Colonial Management Associates (investment management firm) (1991-1998). Directorships in the Last Five Years.(2) None. |
| | | |
Susan J. Sutherland 1957 | | Trustee | | 2015 | | Private investor. Formerly, Associate, Counsel and Partner at Skadden, Arps, Slate, Meagher & Flom LLP (law firm) (1982-2013). Directorships in the Last Five Years. Formerly, Director of Montpelier Re Holdings Ltd. (global provider of customized insurance and reinsurance products) (2013-2015). |
| | | |
Harriett Tee Taggart 1948 | | Trustee | | 2011 | | Managing Director, Taggart Associates (a professional practice firm). Formerly, Partner and Senior Vice President, Wellington Management Company, LLP (investment management firm) (1983-2006). Ms. Taggart has apprised the Board of Trustees that she intends to retire as a Trustee of all Eaton Vance Funds in 2018. Directorships in the Last Five Years.(2) Director of Albemarle Corporation (chemicals manufacturer) (since 2007) and The Hanover Group (specialty property and casualty insurance company) (since 2009). |
| | | |
Scott E. Wennerholm 1959 | | Trustee | | 2016 | | Trustee at Wheelock College (postsecondary institution) (since 2012). Formerly, Consultant at GF Parish Group (executive recruiting firm) (2016-2017). Formerly, Chief Operating Officer and Executive Vice President at BNY Mellon Asset Management (investment management firm) (2005-2011). Formerly, Chief Operating Officer and Chief Financial Officer at Natixis Global Asset Management (investment management firm) (1997-2004). Formerly, Vice President at Fidelity Investments Institutional Services (investment management firm) (1994-1997). Directorships in the Last Five Years. None. |
| | | |
| | | | | | |
Principal Officers who are not Trustees | | |
| Name and Year of Birth | | Position(s) with the Trust | | Officer Since(3) | | Principal Occupation(s) During Past Five Years |
Payson F. Swaffield 1956 | | President | | 2003 | | Vice President and Chief Income Investment Officer of EVM and BMR. Also Vice President of Calvert Research and Management (“CRM”). |
| | | |
Maureen A. Gemma 1960 | | Vice President, Secretary and Chief Legal Officer | | 2005 | | Vice President of EVM and BMR. Also Vice President and officer of CRM. |
| | | |
James F. Kirchner 1967 | | Treasurer | | 2007 | | Vice President of EVM and BMR. Also Vice President and officer of CRM. |
Parametric Volatility Risk Premium - Defensive Fund
January 31, 2018
Management and Organization — continued
| | | | | | |
| Name and Year of Birth | | Position(s) with the Trust | | Officer Since(3) | | Principal Occupation(s) During Past Five Years |
Principal Officers who are not Trustees (continued) |
| | | |
Richard F. Froio 1968 | | Chief Compliance Officer | | 2017 | | Vice President of EVM and BMR since 2017. Formerly Deputy Chief Compliance Officer (Adviser/Funds) and Chief Compliance Officer (Distribution) at PIMCO (2012-2017) and Managing Director at BlackRock/Barclays Global Investors (2009-2012). |
| (1) | Year first appointed to serve as Trustee for a fund in the Eaton Vance family of funds. Each Trustee has served continuously since appointment unless indicated otherwise. |
| (2) | During their respective tenures, the Trustees (except for Mmes. Frost and Sutherland and Messrs. Fetting, Gorman and Wennerholm) also served as Board members of one or more of the following funds (which operated in the years noted): eUnitsTM 2 Year U.S. Market Participation Trust: Upside to Cap / Buffered Downside (launched in 2012 and terminated in 2014); and eUnitsTM 2 Year U.S. Market Participation Trust II: Upside to Cap / Buffered Downside (launched in 2012 and terminated in 2014). However, Ms. Mosley did not serve as a Board member of eUnitsTM 2 Year U.S. Market Participation Trust: Upside to Cap / Buffered Downside (launched in 2012 and terminated in 2014). |
| (3) | Year first elected to serve as officer of a fund in the Eaton Vance family of funds when the officer has served continuously. Otherwise, year of most recent election as an officer of a fund in the Eaton Vance family of funds. Titles may have changed since initial election. |
The SAI for the Fund includes additional information about the Trustees and officers of the Fund and can be obtained without charge on Eaton Vance’s website at www.eatonvance.com or by calling 1-800-260-0761.
Eaton Vance Funds
IMPORTANT NOTICES
Privacy. The Eaton Vance organization is committed to ensuring your financial privacy. Each of the financial institutions identified below has in effect the following policy (“Privacy Policy”) with respect to nonpublic personal information about its customers:
| • | | Only such information received from you, through application forms or otherwise, and information about your Eaton Vance fund transactions will be collected. This may include information such as name, address, social security number, tax status, account balances and transactions. |
| • | | None of such information about you (or former customers) will be disclosed to anyone, except as permitted by law (which includes disclosure to employees necessary to service your account). In the normal course of servicing a customer’s account, Eaton Vance may share information with unaffiliated third parties that perform various required services such as transfer agents, custodians and broker-dealers. |
| • | | Policies and procedures (including physical, electronic and procedural safeguards) are in place that are designed to protect the confidentiality of such information. |
| • | | We reserve the right to change our Privacy Policy at any time upon proper notification to you. Customers may want to review our Privacy Policy periodically for changes by accessing the link on our homepage: www.eatonvance.com. |
Our pledge of privacy applies to the following entities within the Eaton Vance organization: the Eaton Vance Family of Funds, Eaton Vance Management, Eaton Vance Investment Counsel, Eaton Vance Distributors, Inc., Eaton Vance Trust Company, Eaton Vance Management (International) Limited, Eaton Vance Advisers International Ltd., Eaton Vance Management’s Real Estate Investment Group and Boston Management and Research. In addition, our Privacy Policy applies only to those Eaton Vance customers who are individuals and who have a direct relationship with us. If a customer’s account (i.e., fund shares) is held in the name of a third-party financial advisor/broker-dealer, it is likely that only such advisor’s privacy policies apply to the customer. This notice supersedes all previously issued privacy disclosures. For more information about Eaton Vance’s Privacy Policy, please call 1-800-262-1122.
Delivery of Shareholder Documents. The Securities and Exchange Commission (SEC) permits funds to deliver only one copy of shareholder documents, including prospectuses, proxy statements and shareholder reports, to fund investors with multiple accounts at the same residential or post office box address. This practice is often called “householding” and it helps eliminate duplicate mailings to shareholders. Eaton Vance, or your financial advisor, may household the mailing of your documents indefinitely unless you instruct Eaton Vance, or your financial advisor, otherwise. If you would prefer that your Eaton Vance documents not be householded, please contact Eaton Vance at 1-800-260-0761, or contact your financial advisor. Your instructions that householding not apply to delivery of your Eaton Vance documents will typically be effective within 30 days of receipt by Eaton Vance or your financial advisor.
Portfolio Holdings. Each Eaton Vance Fund and its underlying Portfolio(s) (if applicable) will file a schedule of portfolio holdings on Form N-Q with the SEC for the first and third quarters of each fiscal year. The Form N-Q will be available on the Eaton Vance website at www.eatonvance.com, by calling Eaton Vance at 1-800-260-0761 or in the EDGAR database on the SEC’s website at www.sec.gov. Form N-Q may also be reviewed and copied at the SEC’s public reference room in Washington, D.C. (call 1-800-732-0330 for information on the operation of the public reference room).
Proxy Voting. From time to time, funds are required to vote proxies related to the securities held by the funds. The Eaton Vance Funds or their underlying Portfolios (if applicable) vote proxies according to a set of policies and procedures approved by the Funds’ and Portfolios’ Boards. You may obtain a description of these policies and procedures and information on how the Funds or Portfolios voted proxies relating to portfolio securities during the most recent 12-month period ended June 30, without charge, upon request, by calling 1-800-260-0761 and by accessing the SEC���s website at www.sec.gov.
This Page Intentionally Left Blank
Investment Adviser and Administrator
Eaton Vance Management
Two International Place
Boston, MA 02110
Sub-Adviser
Parametric Portfolio Associates LLC
1918 Eighth Avenue, Suite 3100
Seattle, WA 98101
Principal Underwriter*
Eaton Vance Distributors, Inc.
Two International Place
Boston, MA 02110
(617) 482-8260
Custodian
State Street Bank and Trust Company
State Street Financial Center, One Lincoln Street
Boston, MA 02111
Transfer Agent
BNY Mellon Investment Servicing (US) Inc.
Attn: Eaton Vance Funds
P.O. Box 9653
Providence, RI 02940-9653
(800) 260-0761
Independent Registered Public Accounting Firm
Deloitte & Touche LLP
200 Berkeley Street
Boston, MA 02116-5022
Fund Offices
Two International Place
Boston, MA 02110
| * | FINRA BrokerCheck. Investors may check the background of their Investment Professional by contacting the Financial Industry Regulatory Authority (FINRA). FINRA BrokerCheck is a free tool to help investors check the professional background of current and former FINRA-registered securities firms and brokers. FINRA BrokerCheck is available by calling 1-800-289-9999 and at www.FINRA.org. The FINRA BrokerCheck brochure describing this program is available to investors at www.FINRA.org. |
24691 1.31.18
Item 2. Code of Ethics
The registrant has adopted a code of ethics applicable to its Principal Executive Officer, Principal Financial Officer and Principal Accounting Officer. The registrant undertakes to provide a copy of such code of ethics to any person upon request, without charge, by calling 1-800-262-1122. The registrant has not amended the code of ethics as described in Form N-CSR during the period covered by this report. The registrant has not granted any waiver, including an implicit waiver, from a provision of the code of ethics as described in Form N-CSR during the period covered by this report.
Item 3. Audit Committee Financial Expert
The registrant’s Board has designated William H. Park, an independent trustee, as its audit committee financial expert. Mr. Park is a certified public accountant who is a private investor. Previously, he served as a consultant, as the Chief Financial Officer of Aveon Group, L.P. (an investment management firm), as the Vice Chairman of Commercial Industrial Finance Corp. (specialty finance company), as President and Chief Executive Officer of Prizm Capital Management, LLC (investment management firm), as Executive Vice
President and Chief Financial Officer of United Asset Management Corporation (an institutional investment management firm) and as a Senior Manager at Price Waterhouse (now PricewaterhouseCoopers) (an independent registered public accounting firm).
Item 4. Principal Accountant Fees and Services
Parametric Emerging Markets Fund, Parametric International Equity Fund and Parametric Volatility Risk Premium - Defensive Fund (the “Fund(s)”) are series of Eaton Vance Mutual Funds Trust (the “Trust”), a Massachusetts business trust, which, including the Funds, contains a total of 33 series (the “Series”). The Trust is registered under the Investment Company Act of 1940 as an open-end management investment company. This Form N-CSR relates to the Funds’ annual reports.
Rule 2-01(c)(1)(ii)(A) of Regulation S-X (the “Loan Rule”) prohibits an accounting firm, such as the Trust’s principal accountant, Deloitte & Touche LLP (“D&T”), from having certain financial relationships with their audit clients and affiliated entities. Specifically, the Loan Rule provides, in relevant part, that an accounting firm generally would not be independent if it or a “covered person” of the accounting firm (within the meaning of applicable SEC rules relating to auditor independence) receives a loan from a lender that is a “record or beneficial owner of more than ten percent of the audit client’s equity securities.” Based on information provided to the Audit Committee of the Board of Trustees (the “Audit Committee”) of the Eaton Vance family of funds by D&T, certain relationships between D&T and its affiliates (“Deloitte Entities”) and one or more lenders who are record owners of shares of one or more funds within the Eaton Vance family of funds (the “Funds”) implicate the Loan Rule, calling into question D&T’s independence with respect to the Funds. The Funds are providing this disclosure to explain the facts and circumstances as well as D&T’s conclusions concerning D&T’s objectivity and impartiality with respect to the audits of the Funds notwithstanding the existence of one or more breaches of the Loan Rule.
On June 20, 2016, the U.S. Securities and Exchange Commission (the “SEC”) issued no-action relief to another mutual fund complex (see Fidelity Management & Research Company et al., No-Action Letter (June 20, 2016) (the “No-Action Letter”)) related to an auditor independence issue arising under the Loan Rule. In the No-Action Letter, the SEC indicated that it would not recommend enforcement action against the fund group if the auditor is not in compliance with the Loan Rule provided that: (1) the auditor has complied with PCAOB Rule 3526(b)(1) and 3526(b)(2); (2) the auditor’s non-compliance under the Loan Rule is with respect to certain lending relationships; and (3) notwithstanding such non-compliance, the auditor has concluded that it is objective and impartial with respect to the issues encompassed within its engagement as auditor of the funds.
Based on information provided by D&T to the Audit Committee, the requirements of the No-Action Letter appear to be met with respect to D&T’s lending relationships described above. Among other things, D&T has advised the Audit Committee of its conclusion that the consequences of the breach of the Loan Rule have been satisfactorily addressed, that D&T’s objectivity and impartiality in the planning and conduct of the audits of the Fund’s financial statements has not been compromised and that, notwithstanding the breach, D&T is in a position to continue as the auditor for the Funds and D&T does not believe any actions need to be taken with respect to previously issued reports by D&T. D&T has advised the Audit Committee that these conclusions were based in part on its consideration of the No-Action Letter and other relevant information communicated to the Audit Committee.
(a)-(d)
The following table presents the aggregate fees billed to each Fund for the Fund’s fiscal years ended January 31, 2017 and January 31, 2018 by D&T, for professional services rendered for the audit of the Fund’s annual financial statements and fees billed for other services rendered by D&T during such periods.
Parametric Emerging Markets Fund
| | | | | | | | |
Fiscal Years Ended | | 1/31/17 | | | 1/31/18 | |
Audit Fees | | $ | 80,670 | | | $ | 80,670 | |
Audit-Related Fees(1) | | $ | 0 | | | $ | 0 | |
Tax Fees(2) | | $ | 23,686 | | | $ | 18,235 | |
All Other Fees(3) | | $ | 0 | | | $ | 0 | |
| | | | | | | | |
Total | | $ | 104,356 | | | $ | 98,905 | |
| | | | | | | | |
Parametric International Equity Fund
| | | | | | | | |
Fiscal Years Ended | | 1/31/17 | | | 1/31/18 | |
Audit Fees | | $ | 33,910 | | | $ | 36,910 | |
Audit-Related Fees(1) | | $ | 0 | | | $ | 0 | |
Tax Fees(2) | | $ | 13,125 | | | $ | 14,549 | |
All Other Fees(3) | | $ | 0 | | | $ | 0 | |
| | | | | | | | |
Total | | $ | 47,035 | | | $ | 51,459 | |
| | | | | | | | |
Parametric Volatility Risk Premium — Defensive Fund
| | | | | | |
Fiscal Period Ended * | | | | 1/31/18 | |
Audit Fees | | | | $ | 37,050 | |
Audit-Related Fees(1) | | | | $ | 0 | |
Tax Fees(2) | | | | $ | 20,100 | |
All Other Fees(3) | | | | $ | 0 | |
| | | | | | |
Total | | | | $ | 57,150 | |
| | | | | | |
| * | This fund commenced operations on February 9, 2017. |
| (1) | Audit-related fees consist of the aggregate fees billed for assurance and related services that are reasonably related to the performance of the audit of financial statements and are not reported under the category of audit fees. |
| (2) | Tax fees consist of the aggregate fees billed for professional services rendered by the principal accountant relating to tax compliance, tax advice, and tax planning and specifically include fees for tax return preparation and other related tax/compliance planning matters. |
| (3) | All other fees consist of the aggregate fees billed for products and services provided by the principal accountant other than audit, audit-related, and tax services. |
The various Series comprising the Trust have differing fiscal year ends (January 31, February 28, August 31, September 30, October 31 or December 31). The following table presents the aggregate audit, audit-related, tax, and other fees billed to all of the Series in the Trust by D&T for the last two fiscal years of each Series.
| | | | | | | | | | | | | | | | | | | | | | | | | | | | | | | | | | | | | | | | | | | | | | | | |
Fiscal
Years
Ended | | 2/29/16 | | | 8/31/16 | | | 9/30/16 | | | 10/31/16 | | | 12/31/16 | | | 1/31/17 | | | 2/28/17 | | | 8/31/17 | | | 9/30/17 | | | 10/31/17 | | | 12/31/17 | | | 1/31/18 | |
Audit Fees | | $ | 22,650 | | | $ | 48,950 | | | $ | 97,730 | | | $ | 570,575 | | | $ | 105,320 | | | $ | 114,580 | | | $ | 25,850 | | | $ | 48,950 | | | $ | 99,675 | | | $ | 571,663 | | | $ | 105,320 | | | $ | 154,630 | |
Audit-Related Fees(1) | | $ | 0 | | | $ | 0 | | | $ | 0 | | | $ | 0 | | | $ | 0 | | | $ | 0 | | | $ | 0 | | | $ | 0 | | | $ | 0 | | | $ | 0 | | | $ | 0 | | | $ | 0 | |
Tax Fees(2) | | $ | 9,648 | | | $ | 12,259 | | | $ | 25,000 | | | $ | 360,983 | | | $ | 61,414 | | | $ | 36,811 | | | $ | 9,744 | | | $ | 12,420 | | | $ | 25,606 | | | $ | 351,829 | | | $ | 63,439 | | | $ | 52,884 | |
All Other Fees(3) | | $ | 0 | | | $ | 0 | | | $ | 0 | | | $ | 0 | | | $ | 0 | | | $ | 0 | | | $ | 0 | | | $ | 0 | | | $ | 0 | | | $ | 0 | | | $ | 0 | | | $ | 0 | |
| | | | | | | | | | | | | | | | | | | | | | | | | | | | | | | | | | | | | | | | | | | | | | | | |
Total | | $ | 32,298 | | | $ | 61,209 | | | $ | 122,730 | | | $ | 931,558 | | | $ | 166,734 | | | $ | 151,391 | | | $ | 35,594 | | | $ | 61,370 | | | $ | 125,281 | | | $ | 923,492 | | | $ | 168,759 | | | $ | 207,514 | |
| | | | | | | | | | | | | | | | | | | | | | | | | | | | | | | | | | | | | | | | | | | | | | | | |
| (1) | Audit-related fees consist of the aggregate fees billed for assurance and related services that are reasonably related to the performance of the audit of financial statements and are not reported under the category of audit fees. |
| (2) | Tax fees consist of the aggregate fees billed for professional services rendered by the principal accountant relating to tax compliance, tax advice, and tax planning and specifically include fees for tax return preparation and other related tax/compliance planning matters. |
| (3) | All other fees consist of the aggregate fees billed for products and services provided by the principal accountant other than audit, audit-related, and tax services. |
(e)(1) The registrant’s audit committee has adopted policies and procedures relating to the pre-approval of services provided by the registrant’s principal accountant (the “Pre-Approval Policies”). The Pre-Approval Policies establish a framework intended to assist the audit committee in the proper discharge of its pre-approval responsibilities. As a general matter, the Pre-Approval Policies (i) specify certain types of audit, audit-related, tax, and other services determined to be pre-approved by the audit committee; and (ii) delineate specific procedures governing the mechanics of the pre-approval process, including the approval and monitoring of audit and non-audit service fees. Unless a service is specifically pre-approved under the Pre-Approval Policies, it must be separately pre-approved by the audit committee.
The Pre-Approval Policies and the types of audit and non-audit services pre-approved therein must be reviewed and ratified by the registrant’s audit committee at least annually. The registrant’s audit committee maintains full responsibility for the appointment, compensation, and oversight of the work of the registrant’s principal accountant.
(e)(2) No services described in paragraphs (b)-(d) above were approved by the registrant’s audit committee pursuant to the “de minimis exception” set forth in Rule 2-01(c)(7)(i)(C) of Regulation S-X.
(f) Not applicable.
(g) The following table presents (i) the aggregate non-audit fees (i.e., fees for audit-related, tax, and other services) billed for services rendered to all of the Series in the Trust by D&T for the last two fiscal years of each Series; and (ii) the aggregate non-audit fees (i.e., fees for audit-related, tax, and other services) billed to the Eaton Vance organization by D&T for the last two fiscal years of each Series.
| | | | | | | | | | | | | | | | | | | | | | | | | | | | | | | | | | | | | | | | | | | | | | | | |
Fiscal Years Ended | | 2/29/16 | | | 8/31/16 | | | 9/30/16 | | | 10/31/16 | | | 12/31/16 | | | 1/31/17 | | | 2/28/17 | | | 8/31/17 | | | 9/30/17 | | | 10/31/17 | | | 12/31/17 | | | 1/31/18 | |
Registrant(1) | | $ | 9,648 | | | $ | 12,259 | | | $ | 25,000 | | | $ | 360,983 | | | $ | 61,414 | | | $ | 36,811 | | | $ | 9,744 | | | $ | 12,420 | | | $ | 25,606 | | | $ | 351,829 | | | $ | 63,439 | | | $ | 52,884 | |
Eaton Vance(2) | | $ | 56,434 | | | $ | 56,434 | | | $ | 56,434 | | | $ | 56,434 | | | $ | 46,000 | | | $ | 46,000 | | | $ | 46,000 | | | $ | 148,018 | | | $ | 148,018 | | | $ | 148,018 | | | $ | 148,018 | | | $ | 148,018 | |
| (1) | Includes all of the Series of the Trust. During the fiscal years reported above, certain of the Funds were “feeder” funds in a “master-feeder” fund structure or funds of funds. |
| (2) | Various subsidiaries of Eaton Vance Corp. act in either an investment advisory and/or service provider capacity with respect to the Series and/or their respective “master” funds (if applicable). |
(h) The registrant’s audit committee has considered whether the provision by the registrant’s principal accountant of non-audit services to the registrant’s investment adviser and any entity controlling, controlled by, or under common control with the adviser that provides ongoing services to the registrant that were not pre-approved pursuant to Rule 2-01(c)(7)(ii) of Regulation S-X is compatible with maintaining the principal accountant’s independence.
Item 5. Audit Committee of Listed Registrants
Not applicable.
Item 6. Schedule of Investments
Please see schedule of investments contained in the Report to Stockholders included under Item 1 of this Form N-CSR.
Item 7. Disclosure of Proxy Voting Policies and Procedures for Closed-End Management Investment Companies
Not applicable.
Item 8. Portfolio Managers of Closed-End Management Investment Companies
Not applicable.
Item 9. Purchases of Equity Securities by Closed-End Management Investment Company and Affiliated Purchasers
Not applicable.
Item 10. Submission of Matters to a Vote of Security Holders
No material changes.
Item 11. Controls and Procedures
(a) It is the conclusion of the registrant’s principal executive officer and principal financial officer that the effectiveness of the registrant’s current disclosure controls and procedures (such disclosure controls and procedures having been evaluated within 90 days of the date of this filing) provide reasonable assurance that the information required to be disclosed by the registrant has been recorded, processed, summarized and reported within the time period specified in the Commission’s rules and forms and that the information required to be disclosed by the registrant has been accumulated and communicated to the registrant’s principal executive officer and principal financial officer in order to allow timely decisions regarding required disclosure.
(b) There have been no changes in the registrant’s internal controls over financial reporting during the second fiscal quarter of the period covered by this report that has materially affected, or is reasonably likely to materially affect, the registrant’s internal control over financial reporting.
Item 12. Disclosure of Securities Lending Activities for Closed-End Management Investment Companies
Not applicable.
Item 13. Exhibits
| | |
| (a)(1) | | Registrant’s Code of Ethics – Not applicable (please see Item 2). |
| |
| (a)(2)(i) | | Treasurer’s Section 302 certification. |
| |
| (a)(2)(ii) | | President’s Section 302 certification. |
| |
| (b) | | Combined Section 906 certification. |
Signatures
Pursuant to the requirements of the Securities Exchange Act of 1934 and the Investment Company Act of 1940, the registrant has duly caused this report to be signed on its behalf by the undersigned, thereunto duly authorized.
Eaton Vance Mutual Funds Trust
| | |
| By: | | /s/ Payson F. Swaffield |
| | Payson F. Swaffield |
| | President |
| |
| Date: | | March 27, 2018 |
Pursuant to the requirements of the Securities Exchange Act of 1934 and the Investment Company Act of 1940, this report has been signed below by the following persons on behalf of the registrant and in the capacities and on the dates indicated.
| | |
| By: | | /s/ James F. Kirchner |
| | James F. Kirchner |
| | Treasurer |
| |
| Date: | | March 27, 2018 |
| |
| By: | | /s/ Payson F. Swaffield |
| | Payson F. Swaffield |
| | President |
| |
| Date: | | March 27, 2018 |