UNITED STATES
SECURITIES AND EXCHANGE COMMISSION
Washington, D.C. 20549
Form N-CSR
CERTIFIED SHAREHOLDER REPORT OF REGISTERED
MANAGEMENT INVESTMENT COMPANIES
Investment Company Act File Number: 811-04015
Eaton Vance Mutual Funds Trust
(Exact Name of Registrant as Specified in Charter)
Two International Place, Boston, Massachusetts 02110
(Address of Principal Executive Offices)
Maureen A. Gemma
Two International Place, Boston, Massachusetts 02110
(Name and Address of Agent for Services)
(617) 482-8260
(Registrant’s Telephone Number)
January 31
Date of Fiscal Year End
January 31, 2021
Date of Reporting Period
| Item 1. | Reports to Stockholders |

Eaton Vance
Emerging Markets Debt Fund
Annual Report
January 31, 2021

Commodity Futures Trading Commission Registration. The Commodity Futures Trading Commission (“CFTC”) has adopted regulations that subject registered investment companies and advisers to regulation by the CFTC if a fund invests more than a prescribed level of its assets in certain CFTC-regulated instruments (including futures, certain options and swap agreements) or markets itself as providing investment exposure to such instruments. The adviser is registered with the CFTC as a commodity pool operator with respect to its management of the Fund. As the commodity pool operator of the Fund, the adviser has claimed relief under the Commodity Exchange Act from certain reporting and recordkeeping requirements. The adviser is also registered as a commodity trading advisor.
Fund shares are not insured by the FDIC and are not deposits or other obligations of, or guaranteed by, any depository institution. Shares are subject to investment risks, including possible loss of principal invested.
This report must be preceded or accompanied by a current summary prospectus or prospectus. Before investing, investors should consider carefully the investment objective, risks, and charges and expenses of a mutual fund. This and other important information is contained in the summary prospectus and prospectus, which can be obtained from a financial intermediary. Prospective investors should read the prospectus carefully before investing. For further information, please call 1-800-262-1122.
Annual Report January 31, 2021
Eaton Vance
Emerging Markets Debt Fund
Eaton Vance
Emerging Markets Debt Fund
January 31, 2021
Management’s Discussion of Fund Performance1
Economic and Market Conditions
The 12-month period that began on February 1, 2020, was dominated by a black swan event: the outbreak of a new coronavirus in China that became known as COVID-19. As the virus turned into a global pandemic in February and March, it ended the longest-ever U.S. economic expansion and triggered a global economic slowdown. Credit markets along with equity markets plunged in value amid unprecedented volatility.
Emerging market (EM) economies were particularly hard-hit as many workers in those nations could not work remotely and were part of an informal economy with few government supports. In contrast with developed nations where many workers shifted to working safely from home, most workers in EMs faced the choice of going to work despite COVID-19, or losing their income. Oil-exporting EM nations suffered the additional shock of plunging prices for their exports as demand for transportation fuels slowed to a trickle. Tourism and remittances from family members overseas — additional sources of income for many EM economies — also declined dramatically during the period.
In response to the pandemic slowdown, the U.S. Federal Reserve announced two emergency rate cuts in March 2020 — lowering the federal funds rate to 0.00%-0.25% — along with other measures designed to shore up the markets. Across the globe, other central banks and governments launched aggressive monetary and fiscal responses to help mitigate the economic effects of COVID-19. These actions provided liquidity to the global economy that, in turn, helped calm investment markets and initiated a fixed-income rally that began in April and lasted through most of the summer.
For EM bond issuers specifically, this combination also helped to re-open the market for new debt issues and provide the much-needed ability to refinance maturing bonds. As economies started to emerge from COVID-19 lockdowns, factories resumed production and global market indexes reflected investor optimism.
In September and October, however, the fixed-income rally stalled as the pandemic appeared to increase its drag on the global economy. Across Europe, nations that seemed to have beaten back the coronavirus during the summer initiated new lockdowns to combat a second wave of infections. In the U.S., coronavirus cases were on the rise in virtually every state. Reflecting an increasingly grim economic outlook for fall and winter, EM fixed-income indexes, along with many of their developed-market counterparts, reported negative returns in September and October.
In the closing months of 2020, however, bonds reversed course again. Joe Biden’s victory in the November U.S. presidential election eased political uncertainties that had dogged investment markets through much of the fall. Additionally, the announcement that two COVID-19 vaccine candidates had proven more than 90% effective in late-stage trials — and the initial distribution of those vaccines in December — boosted investor optimism and powered a global market rally. But in the final month of the period, bond returns turned negative amid concerns over variant strains of the virus as well as an increase in real yields in the U.S.
Nonetheless, the EM debt asset class ended the period solidly in positive territory for the period, although it lagged developed-market returns. For the 12 tumultuous months ended January 31, 2021, the J.P. Morgan Emerging Markets Bond Index (EMBI) Global Diversified (the Index), a broad measure of the asset class, returned 2.55%, while the Bloomberg Barclays U.S. Aggregate Bond Index, a broad measure of the U.S. fixed-income market, returned 4.72%.
Fund Performance
For the 12-month period ended January 31, 2021, Eaton Vance Emerging Markets Debt Fund (the Fund) returned 2.81% for Class I shares at net asset value (NAV), outperforming its benchmark, the Index, which returned 2.55%.
On a regional basis, the largest contributors to Fund performance versus the Index were the Fund’s allocations to the Middle East, Eastern Europe, and Asia. In the Middle East, concerns about the potential effects of the nascent COVID-19 outbreak led the Fund to sell its position in Bahrain government bonds in mid-February 2020, after a strong rally during the prior 18 months sparked by fiscal reforms and the repair of relations with Bahrain’s neighbor Saudi Arabia. Prices of Bahraini bonds plunged during the pandemic market downturn, and not owning them in March was a further boost to relative returns. Beginning in April, however, the Fund then acquired an overweight position relative to the Index in Bahraini debt, which subsequently rallied and contributed to Fund performance versus the Index during the period.
In Eastern Europe, the Fund’s overweight position in Ukrainian sovereign debt also helped performance versus the Index. Despite considerable volatility during the period, prices of Ukrainian debt ended the period about where they began, while the debt delivered a notably higher yield than the Index throughout the period. In Asia, not owning Sri Lankan debt, an Index component, contributed to relative returns as well. Sri Lankan debt levels had been high entering the period, and the virtual absence of tourism — a key driver of the nation’s economy — during the pandemic led Sri Lankan bond prices to decline substantially to distressed levels.
In contrast, the Fund’s U.S. duration positioning and exposure to Latin American debt detracted from performance versus the Index. The Fund’s average duration, or sensitivity to interest rate changes, was generally less than that of the Index. As a result, the Fund benefited less than the Index when interest rates declined during the period.
In Latin America, the Fund’s overweight positions in Costa Rican, El Salvadoran and Ecuadorian sovereign debt negatively impacted relative returns. As tourism — a mainstay of the Costa Rican economy — virtually disappeared during the pandemic, the country’s debt declined in value and was sold from the Fund. In El Salvador, a new president elected on a reform platform in 2019 appeared to turn more authoritarian in the face of the pandemic, and El Salvadoran debt lost value and was also sold from the Fund.
See Endnotes and Additional Disclosures in this report.
Past performance is no guarantee of future results. Returns are historical and are calculated by determining the percentage change in net asset value (NAV) or offering price (as applicable) with all distributions reinvested. Investment return and principal value will fluctuate so that shares, when redeemed, may be worth more or less than their original cost. Performance for periods less than or equal to one year is cumulative. Performance is for the stated time period only; due to market volatility, current Fund performance may be lower or higher than the quoted return. For performance as of the most recent month-end, please refer to eatonvance.com.
Eaton Vance
Emerging Markets Debt Fund
January 31, 2021
Management’s Discussion of Fund Performance1 — continued
The Fund’s Ecuador debt position was initiated in early February 2020 in response to an improving political environment. But as falling oil prices during the pandemic hurt Ecuador’s oil-dependent economy, its bonds declined in price and were sold from the Fund. After the bonds subsequently defaulted, the Fund initiated a new Ecuador position in October as the debt was restructured.
As a whole, the Fund’s use of derivatives contributed to returns versus the Index. Interest rate futures and swaps, which were used to manage interest rate exposures, positively impacted performance. Sovereign credit default swaps also contributed to performance versus the Index during the period. However, currency forwards, generally used to hedge euro exposure in the Fund’s euro-denominated holdings, detracted from performance relative to the Index.
See Endnotes and Additional Disclosures in this report.
Past performance is no guarantee of future results. Returns are historical and are calculated by determining the percentage change in net asset value (NAV) or offering price (as applicable) with all distributions reinvested. Investment return and principal value will fluctuate so that shares, when redeemed, may be worth more or less than their original cost. Performance for periods less than or equal to one year is cumulative. Performance is for the stated time period only; due to market volatility, current Fund performance may be lower or higher than the quoted return. For performance as of the most recent month-end, please refer to eatonvance.com.
Eaton Vance
Emerging Markets Debt Fund
January 31, 2021
Performance2,3
Portfolio Managers John R. Baur, Michael A. Cirami, CFA and Eric A. Stein, CFA
| | | | | | | | | | | | | | | | | | | | |
| % Average Annual Total Returns | | Class
Inception Date | | | Performance
Inception Date | | | One Year | | | Five Years | | | Since
Inception | |
| | | | | |
Class I at NAV | | | 05/01/2018 | | | | 05/01/2018 | | | | 2.81 | % | | | — | | | | 6.97 | % |
|
| |
| | | | | |
J.P. Morgan Emerging Markets Bond Index (EMBI) Global Diversified | | | — | | | | — | | | | 2.55 | % | | | 6.88 | % | | | 6.45 | % |
| | | | | |
| % Total Annual Operating Expense Ratios4 | | | | | | | | | | | | | | Class I | |
| | | | | |
Gross | | | | | | | | | | | | | | | | | | | 2.73 | % |
Net | | | | | | | | | | | | | | | | | | | 0.85 | |
Growth of $250,000
This graph shows the change in value of a hypothetical investment of $250,000 in Class I of the Fund for the period indicated. For comparison, the same investment is shown in the indicated index.
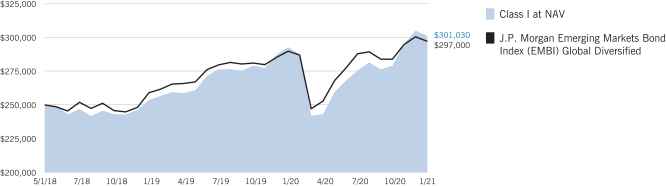
See Endnotes and Additional Disclosures in this report.
Past performance is no guarantee of future results. Returns are historical and are calculated by determining the percentage change in net asset value (NAV) or offering price (as applicable) with all distributions reinvested. Investment return and principal value will fluctuate so that shares, when redeemed, may be worth more or less than their original cost. Performance for periods less than or equal to one year is cumulative. Performance is for the stated time period only; due to market volatility, current Fund performance may be lower or higher than the quoted return. For performance as of the most recent month-end, please refer to eatonvance.com.
Eaton Vance
Emerging Markets Debt Fund
January 31, 2021
Fund Profile
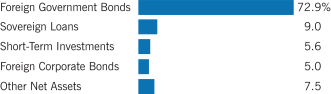
Asset Allocation (% of net assets)5
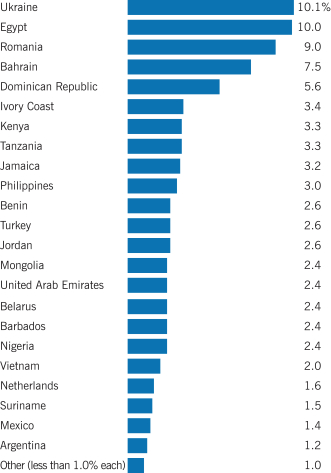
Country Allocation (% of net assets)6
See Endnotes and Additional Disclosures in this report.
Eaton Vance
Emerging Markets Debt Fund
January 31, 2021
Endnotes and Additional Disclosures
| 1 | The views expressed in this report are those of the portfolio manager(s) and are current only through the date stated at the top of this page. These views are subject to change at any time based upon market or other conditions, and Eaton Vance and the Fund(s) disclaim any responsibility to update such views. These views may not be relied upon as investment advice and, because investment decisions are based on many factors, may not be relied upon as an indication of trading intent on behalf of any Eaton Vance fund. This commentary may contain statements that are not historical facts, referred to as “forward-looking statements.” The Fund’s actual future results may differ significantly from those stated in any forward-looking statement, depending on factors such as changes in securities or financial markets or general economic conditions, the volume of sales and purchases of Fund shares, the continuation of investment advisory, administrative and service contracts, and other risks discussed from time to time in the Fund’s filings with the Securities and Exchange Commission. |
| 2 | J.P. Morgan Emerging Markets Bond Index (EMBI) Global Diversified is a market-cap weighted index that measures USD-denominated Brady Bonds, Eurobonds, and traded loans issued by sovereign entities. Information has been obtained from sources believed to be reliable but J.P. Morgan does not warrant its completeness or accuracy. The Index is used with permission. The Index may not be copied, used, or distributed without J.P. Morgan’s prior written approval. Copyright 2021, J.P. Morgan Chase & Co. All rights reserved. Unless otherwise stated, index returns do not reflect the effect of any applicable sales charges, commissions, expenses, taxes or leverage, as applicable. It is not possible to invest directly in an index. |
| 3 | Class I shares are offered at net asset value (NAV). Total Returns are historical and are calculated by determining the percentage change in NAV with all distributions reinvested. Unless otherwise stated, performance does not reflect the deduction of taxes on Fund distributions or redemptions of Fund shares. Performance since inception for an index, if presented, is the performance since the Fund’s or oldest share class’ inception, as applicable. |
| 4 | Source: Fund prospectus. Net expense ratio reflects a contractual expense reimbursement that continues through 5/31/21. Without the reimbursement, performance would have been lower. The expense ratios for the current reporting period can be found in the Financial Highlights section of this report. |
| 5 | Other Net Assets represents other assets less liabilities and includes any investment type that represents less than 1% of net assets. |
| 6 | Excludes cash and cash equivalents. |
Fund profile subject to change due to active management.
Additional Information
Bloomberg Barclays U.S. Aggregate Bond Index is an unmanaged index of domestic investment-grade bonds, including corporate, government and mortgage-backed securities.
Duration is a measure of the expected change in price of a bond — in percentage terms — given a one percent change in interest rates, all else being constant. Securities with lower durations tend to be less sensitive to interest rate changes.
Important Notice to Shareholders
Effective April 1, 2021, the portfolio management team for the Fund will be John R. Baur and Michael A. Cirami.
Eaton Vance
Emerging Markets Debt Fund
January 31, 2021
Fund Expenses
Example: As a Fund shareholder, you incur two types of costs: (1) transaction costs, including sales charges (loads) on purchases and redemption fees (if applicable); and (2) ongoing costs, including management fees; and other Fund expenses. This Example is intended to help you understand your ongoing costs (in dollars) of Fund investing and to compare these costs with the ongoing costs of investing in other mutual funds. The Example is based on an investment of $1,000 invested at the beginning of the period and held for the entire period (August 1, 2020 – January 31, 2021).
Actual Expenses: The first section of the table below provides information about actual account values and actual expenses. You may use the information in this section, together with the amount you invested, to estimate the expenses that you paid over the period. Simply divide your account value by $1,000 (for example, an $8,600 account value divided by $1,000 = 8.6), then multiply the result by the number in the first section under the heading entitled “Expenses Paid During Period” to estimate the expenses you paid on your account during this period.
Hypothetical Example for Comparison Purposes: The second section of the table below provides information about hypothetical account values and hypothetical expenses based on the actual Fund expense ratio and an assumed rate of return of 5% per year (before expenses), which is not the actual Fund return. The hypothetical account values and expenses may not be used to estimate the actual ending account balance or expenses you paid for the period. You may use this information to compare the ongoing costs of investing in your Fund and other funds. To do so, compare this 5% hypothetical example with the 5% hypothetical examples that appear in the shareholder reports of the other funds.
Please note that the expenses shown in the table are meant to highlight your ongoing costs only and do not reflect any transactional costs, such as sales charges (loads) or redemption fees (if applicable). Therefore, the second section of the table is useful in comparing ongoing costs only, and will not help you determine the relative total costs of owning different funds. In addition, if these transactional costs were included, your costs would be higher.
| | | | | | | | | | | | | | | | |
| | | Beginning
Account Value
(8/1/20) | | | Ending
Account Value
(1/31/21) | | | Expenses Paid
During Period*
(8/1/20 – 1/31/21) | | | Annualized
Expense
Ratio | |
| | | | |
Actual | | | | | | | | | | | | | | | | |
Class I | | $ | 1,000.00 | | | $ | 1,092.50 | | | $ | 4.47 | ** | | | 0.85 | % |
| | | | | |
Hypothetical* | | | | | | | | | | | | | | | | |
(5% return per year before expenses) | | | | | | | | | | | | | | | | |
Class I | | $ | 1,000.00 | | | $ | 1,020.90 | | | $ | 4.32 | ** | | | 0.85 | % |
| * | Expenses are equal to the Fund’s annualized expense ratio for the indicated Class, multiplied by the average account value over the period, multiplied by 184/366 (to reflect the one-half year period). The Example assumes that the $1,000 was invested at the net asset value per share determined at the close of business on July 31, 2020. |
| ** | Absent an allocation of certain expenses to an affiliate, expenses would be higher. |
Eaton Vance
Emerging Markets Debt Fund
January 31, 2021
Portfolio of Investments
| | | | | | | | | | |
| Foreign Corporate Bonds — 5.0% | |
| Security | | | | Principal
Amount*
(000’s omitted) | | | Value | |
|
| Brazil — 1.6% | |
| | | |
Petrobras Global Finance BV, 6.90%, 3/19/49 | | | | | 120 | | | $ | 144,602 | |
| |
Total Brazil | | | $ | 144,602 | |
|
| Mexico — 1.4% | |
| | | |
Petroleos Mexicanos, 6.75%, 9/21/47 | | | | | 142 | | | $ | 124,270 | |
| |
Total Mexico | | | $ | 124,270 | |
|
| Vietnam — 2.0% | |
| | | |
Debt and Asset Trading Corp., 1.00%, 10/10/25(1) | | | | | 200 | | | $ | 175,500 | |
| |
Total Vietnam | | | $ | 175,500 | |
| |
Total Foreign Corporate Bonds
(identified cost $404,406) | | | $ | 444,372 | |
|
| Foreign Government Bonds — 72.9% | |
| Security | | | | Principal
Amount*
(000’s omitted) | | | Value | |
|
| Argentina — 1.2% | |
| | | |
Republic of Argentina, 0.125% to 3/15/21, 7/9/35(2) | | | | | 187 | | | $ | 64,421 | |
| | | |
Republic of Argentina, 0.125% to 3/15/21, 7/9/41(2) | | | | | 43 | | | | 15,695 | |
| | | |
Republic of Argentina, 0.125% to 3/15/21, 7/9/46(2) | | | | | 71 | | | | 24,637 | |
| |
Total Argentina | | | $ | 104,753 | |
|
| Bahrain — 7.5% | |
| | | |
Bahrain Government International Bond, 5.45%, 9/16/32(1) | | | | | 200 | | | $ | 203,648 | |
| | | |
Bahrain Government International Bond, 7.00%, 1/26/26(1) | | | | | 200 | | | | 231,979 | |
| | | |
CBB International Sukuk Programme Co., 6.25%, 11/14/24(1) | | | | | 200 | | | | 221,344 | |
| |
Total Bahrain | | | $ | 656,971 | |
|
| Barbados — 2.4% | |
| | | |
Government of Barbados, 6.50%, 10/1/29(3) | | | | | 206 | | | $ | 207,656 | |
| |
Total Barbados | | | $ | 207,656 | |
|
| Belarus — 2.4% | |
| | | |
Republic of Belarus, 6.875%, 2/28/23(1) | | | | | 200 | | | $ | 208,694 | |
| |
Total Belarus | | | $ | 208,694 | |
|
| Benin — 2.6% | |
| | | |
Benin Government International Bond, 6.875%, 1/19/52(1) | | EUR | | | 180 | | | $ | 231,184 | |
| |
Total Benin | | | $ | 231,184 | |
| | | | | | | | | | |
| Security | | | | Principal
Amount*
(000’s omitted) | | | Value | |
|
| Dominican Republic — 5.6% | |
| | | |
Dominican Republic, 4.50%, 1/30/30(1) | | | | | 220 | | | $ | 230,835 | |
| | | |
Dominican Republic, 5.875%, 1/30/60(1) | | | | | 250 | | | | 263,000 | |
| |
Total Dominican Republic | | | $ | 493,835 | |
|
| Ecuador — 0.7% | |
| | | |
Republic of Ecuador, 0.50% to 6/20/21, 7/31/40(1)(2) | | | | | 182 | | | $ | 62,426 | |
| |
Total Ecuador | | | $ | 62,426 | |
|
| Egypt — 10.0% | |
| | | |
Arab Republic of Egypt, 8.15%, 11/20/59(1) | | | | | 200 | | | $ | 213,244 | |
| | | |
Arab Republic of Egypt, 8.50%, 1/31/47(1) | | | | | 400 | | | | 441,393 | |
| | | |
Arab Republic of Egypt, 8.875%, 5/29/50(1) | | | | | 200 | | | | 227,108 | |
| |
Total Egypt | | | $ | 881,745 | |
|
| Ivory Coast — 3.4% | |
| | | |
Ivory Coast Government International Bond, 4.875%, 1/30/32(1) | | EUR | | | 100 | | | $ | 125,208 | |
| | | |
Ivory Coast Government International Bond, 6.625%, 3/22/48(1) | | EUR | | | 131 | | | | 172,925 | |
| |
Total Ivory Coast | | | $ | 298,133 | |
|
| Jamaica — 3.2% | |
| | | |
Jamaica Government International Bond, 7.875%, 7/28/45 | | | | | 200 | | | $ | 282,500 | |
| |
Total Jamaica | | | $ | 282,500 | |
|
| Jordan — 2.6% | |
| | | |
Jordan Government International Bond, 7.375%, 10/10/47(1) | | | | | 200 | | | $ | 228,453 | |
| |
Total Jordan | | | $ | 228,453 | |
|
| Lebanon — 0.3% | |
| | | |
Lebanese Republic, 6.25%, 11/4/24(1)(4) | | | | | 33 | | | $ | 4,322 | |
| | | |
Lebanese Republic, 6.40%, 5/26/23(4) | | | | | 33 | | | | 4,328 | |
| | | |
Lebanese Republic, 6.65%, 4/22/24(1)(4) | | | | | 33 | | | | 4,363 | |
| | | |
Lebanese Republic, 6.65%, 11/3/28(1)(4) | | | | | 14 | | | | 1,876 | |
| | | |
Lebanese Republic, 6.85%, 3/23/27(1)(4) | | | | | 26 | | | | 3,456 | |
| | | |
Lebanese Republic, 6.85%, 5/25/29(4) | | | | | 45 | | | | 6,007 | |
| | | |
Lebanese Republic, 7.00%, 12/3/24(4) | | | | | 15 | | | | 1,964 | |
| | | |
Lebanese Republic, 7.00%, 3/20/28(1)(4) | | | | | 11 | | | | 1,465 | |
| | | |
Lebanese Republic, 7.05%, 11/2/35(1)(4) | | | | | 5 | | | | 663 | |
| |
Total Lebanon | | | $ | 28,444 | |
| | | | |
| | 8 | | See Notes to Financial Statements. |
Eaton Vance
Emerging Markets Debt Fund
January 31, 2021
Portfolio of Investments — continued
| | | | | | | | | | |
| Security | | | | Principal
Amount*
(000’s omitted) | | | Value | |
|
| Mongolia — 2.4% | |
| | | |
Mongolia Government International Bond, 5.125%, 4/7/26(1) | | | | | 200 | | | $ | 214,484 | |
| |
Total Mongolia | | | $ | 214,484 | |
|
| Philippines — 3.0% | |
| | | |
Republic of the Philippines, 2.95%, 5/5/45 | | | | | 255 | | | $ | 264,761 | |
| |
Total Philippines | | | $ | 264,761 | |
|
| Romania — 9.0% | |
| | | |
Romanian Government International Bond, 2.625%, 12/2/40(1) | | EUR | | | 13 | | | $ | 16,495 | |
| | | |
Romanian Government International Bond, 2.75%, 2/26/26(1) | | EUR | | | 30 | | | | 40,312 | |
| | | |
Romanian Government International Bond, 3.375%, 1/28/50(1) | | EUR | | | 177 | | | | 242,521 | |
| | | |
Romanian Government International Bond, 3.624%, 5/26/30(1) | | EUR | | | 50 | | | | 72,367 | |
| | | |
Romanian Government International Bond, 4.625%, 4/3/49(1) | | EUR | | | 261 | | | | 425,710 | |
| |
Total Romania | | | $ | 797,405 | |
|
| Suriname — 1.5% | |
| | | |
Republic of Suriname, 9.25%, 10/26/26(1) | | | | | 205 | | | $ | 134,623 | |
| |
Total Suriname | | | $ | 134,623 | |
|
| Turkey — 2.6% | |
| | | |
Republic of Turkey, 7.625%, 4/26/29 | | | | | 200 | | | $ | 231,179 | |
| |
Total Turkey | | | $ | 231,179 | |
|
| Ukraine — 10.1% | |
| | | |
Ukraine Government International Bond, 0.00%, GDP-Linked, 5/31/40(1)(3)(5) | | | | | 144 | | | $ | 163,054 | |
| | | |
Ukraine Government International Bond, 9.75%, 11/1/28(1) | | | | | 600 | | | | 729,783 | |
| |
Total Ukraine | | | $ | 892,837 | |
|
| United Arab Emirates — 2.4% | |
| | | |
Abu Dhabi Government International Bond, 3.125%, 9/30/49(1) | | | | | 200 | | | $ | 210,196 | |
| |
Total United Arab Emirates | | | $ | 210,196 | |
| |
Total Foreign Government Bonds
(identified cost $5,811,940) | | | $ | 6,430,279 | |
| | | | | | | | | | |
| Sovereign Loans — 9.0% | |
| Borrower | | | | Principal
Amount
(000’s omitted) | | | Value | |
|
| Kenya — 3.3% | |
| | | |
Government of Kenya, Term Loan, 6.71%, (6 mo. USD LIBOR + 6.45%), Maturing June 29, 2025(6) | | | | $ | 293 | | | $ | 294,984 | |
| |
Total Kenya | | | $ | 294,984 | |
|
| Nigeria — 2.4% | |
| | | |
Bank of Industry Limited, Term Loan, 6.22%, (3 mo. USD LIBOR + 6.00%), Maturing December 14, 2023(6)(7) | | | | $ | 205 | | | $ | 207,334 | |
| |
Total Nigeria | | | $ | 207,334 | |
|
| Tanzania — 3.3% | |
| | | |
Government of the United Republic of Tanzania, Term Loan, 5.46%, (6 mo. USD LIBOR + 5.20%), Maturing May 23, 2023(6) | | | | $ | 286 | | | $ | 288,080 | |
| |
Total Tanzania | | | $ | 288,080 | |
| |
Total Sovereign Loans
(identified cost $781,308) | | | $ | 790,398 | |
|
| Short-Term Investments — 5.6% | |
| Description | | | | Units | | | Value | |
| | | |
Eaton Vance Cash Reserves Fund, LLC, 0.11%(8) | | | | | 499,206 | | | $ | 499,206 | |
| |
Total Short-Term Investments
(identified cost $499,206) | | | $ | 499,206 | |
| |
Total Investments — 92.5%
(identified cost $7,496,860) | | | $ | 8,164,255 | |
| |
Other Assets, Less Liabilities — 7.5% | | | $ | 658,487 | |
| |
Net Assets — 100.0% | | | $ | 8,822,742 | |
The percentage shown for each investment category in the Portfolio of Investments is based on net assets.
| | * | In U.S. dollars unless otherwise indicated. |
| | (1) | Security exempt from registration under Regulation S of the Securities Act of 1933, as amended, which exempts from registration securities offered and sold outside the United States. Security may not be offered or sold in the United States except pursuant to an exemption from, or in a transaction not subject to, the registration requirements of the Securities Act of 1933, as amended. At January 31, 2021, the aggregate value of these securities is $5,502,631 or 62.4% of the Fund’s net assets. |
| | (2) | Step coupon security. Interest rate represents the rate in effect at January 31, 2021. |
| | | | |
| | 9 | | See Notes to Financial Statements. |
Eaton Vance
Emerging Markets Debt Fund
January 31, 2021
Portfolio of Investments — continued
| | (3) | Security exempt from registration under Rule 144A of the Securities Act of 1933, as amended. These securities may be sold in certain transactions in reliance on an exemption from registration (normally to qualified institutional buyers). At January 31, 2021, the aggregate value of these securities is $370,710 or 4.2% of the Fund’s net assets. |
| | (4) | Issuer is in default with respect to interest payments. |
| | (5) | Amounts payable in respect of the security are contingent upon and determined by reference to Ukraine’s GDP and Real GDP Growth Rate. Principal amount represents the notional amount used to calculate payments due to the security holder and does not represent an entitlement for payment. |
| | (6) | Variable rate security. The stated interest rate represents the rate in effect at January 31, 2021. |
| | (7) | Loan is subject to scheduled mandatory prepayments. Maturity date shown reflects the final maturity date. |
| | (8) | Affiliated investment company, available to Eaton Vance portfolios and funds, which invests in high quality, U.S. dollar denominated money market instruments. The rate shown is the annualized seven-day yield as of January 31, 2021. |
| | | | | | | | | | | | | | | | | | | | | | | | | | |
| Centrally Cleared Forward Foreign Currency Exchange Contracts | |
| | | | | |
| Currency Purchased | | | | | | Currency Sold | | | | | | Settlement
Date | | | Value/Unrealized
Appreciation
(Depreciation) | |
| | | | | | | |
| EUR | | | 171,832 | | | | | | | USD | | | 208,759 | | | | | | | | 2/2/21 | | | $ | (232 | ) |
| | | | | | | |
| EUR | | | 130,000 | | | | | | | USD | | | 158,045 | | | | | | | | 2/2/21 | | | | (284 | ) |
| | | | | | | |
| EUR | | | 130,000 | | | | | | | USD | | | 158,029 | | | | | | | | 3/2/21 | | | | (268 | ) |
| | | | | | | |
| USD | | | 157,937 | | | | | | | EUR | | | 130,000 | | | | | | | | 2/2/21 | | | | 176 | |
| | | | | | | |
| USD | | | 208,902 | | | | | | | EUR | | | 171,832 | | | | | | | | 2/2/21 | | | | 376 | |
| | | | | | | |
| USD | | | 208,880 | | | | | | | EUR | | | 171,832 | | | | | | | | 3/2/21 | | | | 226 | |
| | | | | | | |
| | | | | | | | | | | | | | | | | | | | | | | | | $ | (6 | ) |
| | | | | | | | | | | | | | | | | | | | | | | | |
| Forward Foreign Currency Exchange Contracts | |
| | | | | |
| Currency Purchased | | | Currency Sold | | | Counterparty | | Settlement
Date | | | Unrealized
Appreciation | | | Unrealized
(Depreciation) | |
| | | | | | | |
| USD | | | 712,749 | | | EUR | | | 578,427 | | | Standard Chartered Bank | | | 2/8/21 | | | $ | 10,710 | | | $ | — | |
| | | | | | | |
| USD | | | 291,470 | | | EUR | | | 236,540 | | | Standard Chartered Bank | | | 2/8/21 | | | | 4,380 | | | | — | |
| | | | | | | |
| USD | | | 171,511 | | | EUR | | | 139,188 | | | Standard Chartered Bank | | | 2/8/21 | | | | 2,577 | | | | — | |
| | | | | | | |
| USD | | | 96,864 | | | EUR | | | 80,000 | | | UBS AG | | | 2/8/21 | | | | — | | | | (232 | ) |
| | | | | | | |
| | | | | | | | | | | | | | | | | | | $ | 17,667 | | | $ | (232 | ) |
| | | | | | | | | | | | | | | | | | | | |
| Futures Contracts | |
| | | | | |
| Description | | Number of
Contracts | | | Position | | | Expiration
Date | | | Notional
Amount | | | Value/Unrealized
Appreciation
(Depreciation) | |
| | | | | |
Interest Rate Futures | | | | | | | | | | | | | | | | | | | | |
| | | | | |
| U.S. Long Treasury Bond | | | 1 | | | | Long | | �� | | 3/22/21 | | | $ | 168,719 | | | $ | (96 | ) |
| | | | | |
| U.S. Ultra-Long Treasury Bond | | | 8 | | | | Long | | | | 3/22/21 | | | | 1,637,750 | | | | (53,424 | ) |
| | | | | |
| Euro-Bobl | | | (1 | ) | | | Short | | | | 3/8/21 | | | | (164,133 | ) | | | 11 | |
| | | | | |
| Euro-Bund | | | (4 | ) | | | Short | | | | 3/8/21 | | | | (860,407 | ) | | | 903 | |
| | | | | |
| | | | | | | | | | | | | | | | | | | $ | (52,606 | ) |
| | | | |
| | 10 | | See Notes to Financial Statements. |
Eaton Vance
Emerging Markets Debt Fund
January 31, 2021
Portfolio of Investments — continued
| | | | | | | | | | | | | | | | | | | | | | | | |
| Centrally Cleared Interest Rate Swaps | | | | | | | | | |
| | | | | | | |
Notional
Amount
(000’s omitted) | | | Fund Pays/
Receives
Floating Rate | | Floating Rate | | Annual Fixed Rate | | Termination
Date | | Value | | | Unamortized
Upfront
Receipts
(Payments) | | | Unrealized
Appreciation
(Depreciation) | |
| | | | | | | | |
| EUR | | | 19 | | | Receives | | 6-month EURIBOR (pays semi-annually) | | 0.37%
(pays annually) | | 2/12/50 | | $ | (1,804 | ) | | $ | — | | | $ | (1,804 | ) |
| | | | | | | | |
| EUR | | | 19 | | | Receives | | 6-month EURIBOR (pays semi-annually) | | 0.39%
(pays annually) | | 2/13/50 | | | (1,866 | ) | | | — | | | | (1,866 | ) |
| | | | | | | | |
| EUR | | | 5 | | | Receives | | 6-month EURIBOR (pays semi-annually) | | 0.38%
(pays annually) | | 2/13/50 | | | (485 | ) | | | — | | | | (485 | ) |
| | | | | | | | |
| EUR | | | 16 | | | Receives | | 6-month EURIBOR (pays semi-annually) | | 0.38%
(pays annually) | | 2/13/50 | | | (1,557 | ) | | | — | | | | (1,557 | ) |
| | | | | | | | |
| EUR | | | 8 | | | Receives | | 6-month EURIBOR (pays semi-annually) | | 0.39%
(pays annually) | | 2/14/50 | | | (814 | ) | | | — | | | | (814 | ) |
| | | | | | | | |
| EUR | | | 7 | | | Receives | | 6-month EURIBOR (pays semi-annually) | | 0.34%
(pays annually) | | 2/20/50 | | | (583 | ) | | | — | | | | (583 | ) |
| | | | | | | | |
| EUR | | | 58 | | | Receives | | 6-month EURIBOR (pays semi-annually) | | 0.32%
(pays annually) | | 2/21/50 | | | (4,392 | ) | | | — | | | | (4,392 | ) |
| | | | | | | | |
| EUR | | | 62 | | | Receives | | 6-month EURIBOR (pays semi-annually) | | 0.26%
(pays annually) | | 2/25/50 | | | (3,375 | ) | | | — | | | | (3,375 | ) |
| | | | | | | | |
| EUR | | | 16 | | | Receives | | 6-month EURIBOR (pays semi-annually) | | 0.21%
(pays annually) | | 2/26/50 | | | (571 | ) | | | — | | | | (571 | ) |
| | | | | | | | |
| EUR | | | 49 | | | Receives | | 6-month EURIBOR (pays semi-annually) | | 0.12%
(pays annually) | | 6/8/50 | | | (104 | ) | | | — | | | | (104 | ) |
| | | | | | | | |
| USD | | | 200 | | | Receives | | 3-month USD-LIBOR (pays quarterly) | | 0.55%
(pays semi-annually) | | 3/12/23 | | | (1,864 | ) | | | — | | | | (1,864 | ) |
| | | | | | | | |
| USD | | | 1,605 | | | Pays | | 3-month USD-LIBOR (pays quarterly) | | 0.61%
(pays semi-annually) | | 3/16/25 | | | 16,734 | | | | — | | | | 16,734 | |
| | | | | | | | |
| USD | | | 169 | | | Receives | | 3-month USD-LIBOR (pays quarterly) | | 0.33%
(pays semi-annually) | | 5/12/25 | | | 601 | | | | — | | | | 601 | |
| | | | | | | | |
| USD | | | 147 | | | Receives | | 3-month USD-LIBOR (pays quarterly) | | 1.74%
(pays semi-annually) | | 12/16/26 | | | (9,586 | ) | | | — | | | | (9,586 | ) |
| | | | | | | | |
| USD | | | 140 | | | Receives | | 3-month USD-LIBOR (pays quarterly) | | 0.57%
(pays semi-annually) | | 4/17/27 | | | 928 | | | | — | | | | 928 | |
| | | | | | | | |
| USD | | | 209 | | | Pays | | 3-month USD-LIBOR (pays quarterly) | | 2.34%
(pays semi-annually) | | 5/17/29 | | | 24,230 | | | | — | | | | 24,230 | |
| | | | | | | | |
| USD | | | 438 | | | Receives | | 3-month USD-LIBOR (pays quarterly) | | 2.09%
(pays semi-annually) | | 7/15/29 | | | (40,367 | ) | | | 126 | | | | (40,241 | ) |
| | | | | | | | |
| USD | | | 150 | | | Receives | | 3-month USD-LIBOR (pays quarterly) | | 0.69%
(pays semi-annually) | | 4/17/30 | | | 4,576 | | | | — | | | | 4,576 | |
| | | | | | | | |
| USD | | | 10 | | | Receives | | 3-month USD-LIBOR (pays quarterly) | | 0.74%
(pays semi-annually) | | 6/18/30 | | | 296 | | | | — | | | | 296 | |
| | | | | | | | |
| USD | | | 95 | | | Receives | | 3-month USD-LIBOR (pays quarterly) | | 2.88%
(pays semi-annually) | | 1/31/49 | | | (28,979 | ) | | | (47 | ) | | | (29,026 | ) |
| | | | |
| | 11 | | See Notes to Financial Statements. |
Eaton Vance
Emerging Markets Debt Fund
January 31, 2021
Portfolio of Investments — continued
| | | | | | | | | | | | | | | | | | | | | | | | |
| Centrally Cleared Interest Rate Swaps (continued) | | | | | | | | | |
| | | | | | | |
Notional
Amount
(000’s omitted) | | | Fund Pays/
Receives
Floating Rate | | Floating Rate | | Annual Fixed Rate | | Termination
Date | | Value | | | Unamortized
Upfront
Receipts
(Payments) | | | Unrealized
Appreciation
(Depreciation) | |
| | | | | | | | |
| USD | | | 121 | | | Receives | | 3-month USD-LIBOR (pays quarterly) | | 2.54% (pays semi-annually) | | 5/17/49 | | $ | (28,048 | ) | | $ | 14,178 | | | $ | (13,870 | ) |
| | | | | | | | |
| USD | | | 99 | | | Receives | | 3-month USD-LIBOR (pays quarterly) | | 1.65%
(pays semi-annually) | | 9/9/49 | | | (1,940 | ) | | | — | | | | (1,940 | ) |
| | | | | | | | |
| USD | | | 7 | | | Receives | | 3-month USD-LIBOR (pays quarterly) | | 1.70%
(pays semi-annually) | | 9/12/49 | | | (219 | ) | | | — | | | | (219 | ) |
| | | | | | | | |
| USD | | | 110 | | | Receives | | 3-month USD-LIBOR (pays quarterly) | | 1.87%
(pays semi-annually) | | 10/25/49 | | | (7,910 | ) | | | — | | | | (7,910 | ) |
| | | | | | | | |
| USD | | | 37 | | | Receives | | 3-month USD-LIBOR (pays quarterly) | | 1.97%
(pays semi-annually) | | 11/15/49 | | | (3,493 | ) | | | — | | | | (3,493 | ) |
| | | | | | | | |
| USD | | | 130 | | | Receives | | 3-month USD-LIBOR (pays quarterly) | | 0.84%
(pays semi-annually) | | 3/30/50 | | | 23,649 | | | | — | | | | 23,649 | |
| | | | | | | | |
| USD | | | 160 | | | Receives | | 3-month USD-LIBOR (pays quarterly) | | 0.83%
(pays semi-annually) | | 4/29/50 | | | 29,725 | | | | — | | | | 29,725 | |
| | | | | | | | |
| USD | | | 50 | | | Receives | | 3-month USD-LIBOR (pays quarterly) | | 0.93%
(pays semi-annually) | | 5/26/50 | | | 8,102 | | | | — | | | | 8,102 | |
| | | | | | | | |
| USD | | | 100 | | | Receives | | 3-month USD-LIBOR (pays quarterly) | | 0.97%
(pays semi-annually) | | 6/17/50 | | | 15,272 | | | | — | | | | 15,272 | |
| | | | | | | | |
Total | | | | | | | | | | | | | | $ | (13,844 | ) | | $ | 14,257 | | | $ | 413 | |
| | | | | | | | | | | | | | | | | | | | | | | | |
| Centrally Cleared Credit Default Swaps — Sell Protection | |
| | | | | | | |
| Reference Entity | | Notional
Amount*
(000’s omitted) | | | Contract Annual
Fixed Rate** | | Termination
Date | | Current
Market Annual
Fixed Rate*** | | | Value | | | Unamortized
Upfront
Receipts
(Payments) | | | Unrealized
Appreciation (Depreciation) | |
| | | | | | | |
| Brazil | | $ | 130 | | | 1.00% (pays quarterly)(1) | | 12/20/25 | | | 1.72 | % | | $ | (4,298 | ) | | $ | 6,787 | | | $ | 2,489 | |
| | | | | | | |
| Colombia | | | 275 | | | 1.00% (pays quarterly)(1) | | 12/20/25 | | | 1.13 | | | | (1,359 | ) | | | 4,175 | | | | 2,816 | |
| | | | | | | |
| Indonesia | | | 320 | | | 1.00% (pays quarterly)(1) | | 12/20/25 | | | 0.76 | | | | 4,055 | | | | — | | | | 4,055 | |
| | | | | | | |
| Mexico | | | 290 | | | 1.00% (pays quarterly)(1) | | 12/20/30 | | | 1.56 | | | | (14,278 | ) | | | 14,658 | | | | 380 | |
| | | | | | | |
| South Africa | | | 150 | | | 1.00% (pays quarterly)(1) | | 6/20/21 | | | 0.50 | | | | 477 | | | | 685 | | | | 1,162 | |
| | | | | | | |
| Turkey | | | 137 | | | 1.00% (pays quarterly)(1) | | 6/20/21 | | | 1.35 | | | | (26 | ) | | | 2,540 | | | | 2,514 | |
| | | | |
| | 12 | | See Notes to Financial Statements. |
Eaton Vance
Emerging Markets Debt Fund
January 31, 2021
Portfolio of Investments — continued
| | | | | | | | | | | | | | | | | | | | | | | | |
| Centrally Cleared Credit Default Swaps — Sell Protection (continued) | |
| | | | | | | |
| Reference Entity | | Notional
Amount*
(000’s omitted) | | | Contract Annual
Fixed Rate** | | Termination
Date | | Current
Market Annual
Fixed Rate*** | | | Value | | | Unamortized
Upfront
Receipts
(Payments) | | | Unrealized
Appreciation (Depreciation) | |
| | | | | | | |
| Turkey | | $ | 90 | | | 1.00% (pays quarterly)(1) | | 6/20/25 | | | 2.98 | % | | $ | (7,210 | ) | | $ | 14,122 | | | $ | 6,912 | |
| | | | | | | |
Total | | $ | 1,392 | | | | | | | | | | | $ | (22,639 | ) | | $ | 42,967 | | | $ | 20,328 | |
| * | If the Fund is the seller of credit protection, the notional amount is the maximum potential amount of future payments the Fund could be required to make if a credit event, as defined in the credit default swap agreement, were to occur. At January 31, 2021, such maximum potential amount for all open credit default swaps in which the Fund is the seller was $1,392,000. |
| ** | The contract annual fixed rate represents the fixed rate of interest received by the Fund (as a seller of protection) on the notional amount of the credit default swap contract. |
| *** | Current market annual fixed rates, utilized in determining the net unrealized appreciation or depreciation as of period end, serve as an indicator of the market’s perception of the current status of the payment/performance risk associated with the credit derivative. The current market annual fixed rate of a particular reference entity reflects the cost, as quoted by the pricing vendor, of selling protection against default of that entity as of period end and may include upfront payments required to be made to enter into the agreement. The higher the fixed rate, the greater the market perceived risk of a credit event involving the reference entity. A rate identified as “Defaulted” indicates a credit event has occurred for the reference entity. |
| (1) | Upfront payment is exchanged with the counterparty as a result of the standardized trading coupon. |
Abbreviations:
| | | | |
| | |
| EURIBOR | | – | | Euro Interbank Offered Rate |
| | |
| GDP | | – | | Gross Domestic Product |
| | |
| LIBOR | | – | | London Interbank Offered Rate |
Currency Abbreviations:
| | | | |
| | |
| EUR | | – | | Euro |
| | |
| USD | | – | | United States Dollar |
| | | | |
| | 13 | | See Notes to Financial Statements. |
Eaton Vance
Emerging Markets Debt Fund
January 31, 2021
Statement of Assets and Liabilities
| | | | |
| Assets | | January 31, 2021 | |
| |
Unaffiliated investments, at value (identified cost, $6,997,654) | | $ | 7,665,049 | |
| |
Affiliated investment, at value (identified cost, $499,206) | | | 499,206 | |
| |
Deposits for derivatives collateral — | | | | |
| |
Financial futures contracts | | | 81,673 | |
| |
Centrally cleared derivatives | | | 491,743 | |
| |
Foreign currency, at value (identified cost, $41,238) | | | 41,191 | |
| |
Interest receivable | | | 138,721 | |
| |
Dividends receivable from affiliated investment | | | 28 | |
| |
Receivable for investments sold | | | 591,908 | |
| |
Receivable for variation margin on open centrally cleared derivatives | | | 11,401 | |
| |
Receivable for open forward foreign currency exchange contracts | | | 17,667 | |
| |
Receivable from affiliate | | | 5,319 | |
| |
Total assets | | $ | 9,543,906 | |
|
| Liabilities | |
| |
Payable for investments purchased | | $ | 394,913 | |
| |
Payable for variation margin on open financial futures contracts | | | 9,912 | |
| |
Payable for open forward foreign currency exchange contracts | | | 232 | |
| |
Due to custodian | | | 204,998 | |
| |
Payable to affiliate: | | | | |
| |
Investment adviser and administration fee | | | 4,890 | |
| |
Accrued expenses | | | 106,219 | |
| |
Total liabilities | | $ | 721,164 | |
| |
Net Assets | | $ | 8,822,742 | |
|
| Sources of Net Assets | |
| |
Paid-in capital | | $ | 8,620,718 | |
| |
Distributable earnings | | | 202,024 | |
| |
Total | | $ | 8,822,742 | |
|
| Class I Shares | |
| |
Net Assets | | $ | 8,822,742 | |
| |
Shares Outstanding | | | 852,310 | |
| |
Net Asset Value, Offering Price and Redemption Price Per Share | | | | |
| |
(net assets ÷ shares of beneficial interest outstanding) | | $ | 10.35 | |
| | | | |
| | 14 | | See Notes to Financial Statements. |
Eaton Vance
Emerging Markets Debt Fund
January 31, 2021
Statement of Operations
| | | | |
| Investment Income | | Year Ended January 31, 2021 | |
| |
Interest | | $ | 480,012 | |
| |
Dividends from affiliated investment | | | 2,634 | |
| |
Total investment income | | $ | 482,646 | |
| |
| Expenses | | | | |
| |
Investment adviser and administration fee | | $ | 54,610 | |
| |
Trustees’ fees and expenses | | | 937 | |
| |
Custodian fee | | | 94,481 | |
| |
Transfer and dividend disbursing agent fees | | | 478 | |
| |
Legal and accounting services | | | 60,827 | |
| |
Printing and postage | | | 12,493 | |
| |
Registration fees | | | 23,784 | |
| |
Interest expense | | | 754 | |
| |
Miscellaneous | | | 11,122 | |
| |
Total expenses | | $ | 259,486 | |
| |
Deduct — | | | | |
| |
Allocation of expenses to affiliate | | $ | 187,115 | |
| |
Total expense reductions | | $ | 187,115 | |
| |
Net expenses | | $ | 72,371 | |
| |
Net investment income | | $ | 410,275 | |
| |
| Realized and Unrealized Gain (Loss) | | | | |
| |
Net realized gain (loss) — | | | | |
| |
Investment transactions | | $ | (461,640 | ) |
| |
Investment transactions — affiliated investment | | | (19 | ) |
| |
Financial futures contracts | | | 484,385 | |
| |
Swap contracts | | | (280,332 | ) |
| |
Foreign currency transactions | | | (3,760 | ) |
| |
Forward foreign currency exchange contracts | | | (101,078 | ) |
| |
Net realized loss | | $ | (362,444 | ) |
| |
Change in unrealized appreciation (depreciation) — | | | | |
| |
Investments | | $ | 85,571 | |
| |
Investments — affiliated investment | | | (35 | ) |
| |
Financial futures contracts | | | (144,808 | ) |
| |
Swap contracts | | | 140,921 | |
| |
Foreign currency | | | 372 | |
| |
Forward foreign currency exchange contracts | | | 17,100 | |
| |
Net change in unrealized appreciation (depreciation) | | $ | 99,121 | |
| |
Net realized and unrealized loss | | $ | (263,323 | ) |
| |
Net increase in net assets from operations | | $ | 146,952 | |
| | | | |
| | 15 | | See Notes to Financial Statements. |
Eaton Vance
Emerging Markets Debt Fund
January 31, 2021
Statements of Changes in Net Assets
| | | | | | | | |
| | | Year Ended January 31, | |
| Increase (Decrease) in Net Assets | | 2021 | | | 2020 | |
| | |
From operations — | | | | | | | | |
| | |
Net investment income | | $ | 410,275 | | | $ | 421,165 | |
| | |
Net realized gain (loss) | | | (362,444 | ) | | | 40,324 | |
| | |
Net change in unrealized appreciation (depreciation) | | | 99,121 | | | | 728,203 | |
| | |
Net increase in net assets from operations | | $ | 146,952 | | | $ | 1,189,692 | |
| | |
Distributions to shareholders — | | | | | | | | |
| | |
Class I | | $ | (446,396 | ) | | $ | (562,574 | ) |
| | |
Total distributions to shareholders | | $ | (446,396 | ) | | $ | (562,574 | ) |
| | |
Transactions in shares of beneficial interest — | | | | | | | | |
| | |
Proceeds from sale of shares | | $ | 1,796,027 | | | $ | 23,743 | |
| | |
Net asset value of shares issued to shareholders in payment of distributions declared | | | 32,636 | | | | 654 | |
| | |
Cost of shares redeemed | | | (1,236,464 | ) | | | — | |
| | |
Net increase in net assets from Fund share transactions | | $ | 592,199 | | | $ | 24,397 | |
| | |
Net increase in net assets | | $ | 292,755 | | | $ | 651,515 | |
|
| Net Assets | |
| | |
At beginning of year | | $ | 8,529,987 | | | $ | 7,878,472 | |
| | |
At end of year | | $ | 8,822,742 | | | $ | 8,529,987 | |
| | | | |
| | 16 | | See Notes to Financial Statements. |
Eaton Vance
Emerging Markets Debt Fund
January 31, 2021
Financial Highlights
| | | | | | | | | | | | |
| | | Class I | |
| | | Year Ended January 31, | | | Period Ended
January 31, 2019(1) | |
| | | 2021 | | | 2020 | |
| | | | |
Net asset value — Beginning of period | | $ | 10.620 | | | $ | 9.840 | | | $ | 10.000 | |
| | | |
| Income (Loss) From Operations | | | | | | | | | | | | |
| | | |
Net investment income(2) | | $ | 0.476 | | | $ | 0.526 | | | $ | 0.286 | |
| | | |
Net realized and unrealized gain (loss) | | | (0.229 | ) | | | 0.956 | | | | (0.151 | ) |
| | | |
Total income from operations | | $ | 0.247 | | | $ | 1.482 | | | $ | 0.135 | |
| | | |
| Less Distributions | | | | | | | | | | | | |
| | | |
From net investment income | | $ | (0.517 | ) | | $ | (0.577 | ) | | $ | (0.219 | ) |
| | | |
From net realized gain | | | — | | | | (0.125 | ) | | | (0.076 | ) |
| | | |
Total distributions | | $ | (0.517 | ) | | $ | (0.702 | ) | | $ | (0.295 | ) |
| | | |
Net asset value — End of period | | $ | 10.350 | | | $ | 10.620 | | | $ | 9.840 | |
| | | |
Total Return(3)(4) | | | 2.81 | % | | | 15.57 | % | | | 1.34 | %(5) |
| | | |
| Ratios/Supplemental Data | | | | | | | | | | | | |
| | | |
Net assets, end of period (000’s omitted) | | $ | 8,823 | | | $ | 8,530 | | | $ | 7,878 | |
| | | |
Ratios (as a percentage of average daily net assets): | | | | | | | | | | | | |
| | | |
Expenses(4) | | | 0.86 | %(6) | | | 0.85 | % | | | 0.85 | %(7) |
| | | |
Net investment income | | | 4.88 | % | | | 5.12 | % | | | 3.92 | %(7) |
| | | |
Portfolio Turnover | | | 220 | % | | | 187 | % | | | 82 | %(5) |
| (1) | For the period from the start of business, May 1, 2018, to January 31, 2019. |
| (2) | Computed using average shares outstanding. |
| (3) | Returns are historical and are calculated by determining the percentage change in net asset value with all distributions reinvested. |
| (4) | The investment adviser and administrator reimbursed certain operating expenses (equal to 2.23%, 1.88% and 2.24% of average daily net assets for the years ended January 31, 2021, 2020 and the period ended January 31, 2019, respectively). Absent this reimbursement, total return would be lower. |
| (6) | Includes interest expense of 0.01% for the year ended January 31, 2021. |
| | | | |
| | 17 | | See Notes to Financial Statements. |
Eaton Vance
Emerging Markets Debt Fund
January 31, 2021
Notes to Financial Statements
1 Significant Accounting Policies
Eaton Vance Emerging Markets Debt Fund (the Fund) is a non-diversified series of Eaton Vance Mutual Funds Trust (the Trust). The Trust is a Massachusetts business trust registered under the Investment Company Act of 1940, as amended (the 1940 Act), as an open-end management investment company. The Fund’s investment objective is total return. The Fund offers Class I shares, which are sold at net asset value and are not subject to a sales charge.
The following is a summary of significant accounting policies of the Fund. The policies are in conformity with accounting principles generally accepted in the United States of America (U.S. GAAP). The Fund is an investment company and follows accounting and reporting guidance in the Financial Accounting Standards Board (FASB) Accounting Standards Codification Topic 946.
A Investment Valuation — The following methodologies are used to determine the market value or fair value of investments.
Debt Obligations. Debt obligations are generally valued on the basis of valuations provided by third party pricing services, as derived from such services’ pricing models. Inputs to the models may include, but are not limited to, reported trades, executable bid and ask prices, broker/dealer quotations, prices or yields of securities with similar characteristics, interest rates, anticipated prepayments, benchmark curves or information pertaining to the issuer, as well as industry and economic events. The pricing services may use a matrix approach, which considers information regarding securities with similar characteristics to determine the valuation for a security. Short-term debt obligations purchased with a remaining maturity of sixty days or less for which a valuation from a third party pricing service is not readily available may be valued at amortized cost, which approximates fair value.
Derivatives. Financial futures contracts are valued at the closing settlement price established by the board of trade or exchange on which they are traded. Forward foreign currency exchange contracts are generally valued at the mean of the average bid and average ask prices that are reported by currency dealers to a third party pricing service at the valuation time. Such third party pricing service valuations are supplied for specific settlement periods and the Fund’s forward foreign currency exchange contracts are valued at an interpolated rate between the closest preceding and subsequent settlement period reported by the third party pricing service. Swaps are normally valued using valuations provided by a third party pricing service. Such pricing service valuations are based on the present value of fixed and projected floating rate cash flows over the term of the swap contract, and in the case of credit default swaps, based on credit spread quotations obtained from broker/dealers and expected default recovery rates determined by the pricing service using proprietary models. Future cash flows on swaps are discounted to their present value using swap rates provided by electronic data services or by broker/dealers.
Foreign Securities and Currencies. Foreign securities and currencies are valued in U.S. dollars, based on foreign currency exchange rate quotations supplied by a third party pricing service. The pricing service uses a proprietary model to determine the exchange rate. Inputs to the model include reported trades and implied bid/ask spreads.
Affiliated Fund. The Fund may invest in Eaton Vance Cash Reserves Fund, LLC (Cash Reserves Fund), an affiliated investment company managed by Eaton Vance Management (EVM). While Cash Reserves Fund is not a registered money market mutual fund, it conducts all of its investment activities in accordance with the requirements of Rule 2a-7 under the 1940 Act. Investments in Cash Reserves Fund are valued at the closing net asset value per unit on the valuation day. Cash Reserves Fund generally values its investment securities based on available market quotations provided by a third party pricing service.
Fair Valuation. Investments for which valuations or market quotations are not readily available or are deemed unreliable are valued at fair value using methods determined in good faith by or at the direction of the Trustees of the Fund in a manner that most fairly reflects the security’s “fair value”, which is the amount that the Fund might reasonably expect to receive for the security upon its current sale in the ordinary course. Each such determination is based on a consideration of relevant factors, which are likely to vary from one pricing context to another. These factors may include, but are not limited to, the type of security, the existence of any contractual restrictions on the security’s disposition, the price and extent of public trading in similar securities of the issuer or of comparable companies or entities, quotations or relevant information obtained from broker/dealers or other market participants, information obtained from the issuer, analysts, and/or the appropriate stock exchange (for exchange-traded securities), an analysis of the company’s or entity’s financial statements, and an evaluation of the forces that influence the issuer and the market(s) in which the security is purchased and sold.
B Investment Transactions — Investment transactions for financial statement purposes are accounted for on a trade date basis. Realized gains and losses on investments sold are determined on the basis of identified cost.
C Income — Interest income is recorded on the basis of interest accrued, adjusted for amortization of premium or accretion of discount. Dividend income is recorded on the ex-dividend date for dividends received in cash and/or securities.
D Federal Taxes — The Fund’s policy is to comply with the provisions of the Internal Revenue Code applicable to regulated investment companies and to distribute to shareholders each year substantially all of its net investment income, and all or substantially all of its net realized capital gains. Accordingly, no provision for federal income or excise tax is necessary.
As of January 31, 2021, the Fund had no uncertain tax positions that would require financial statement recognition, de-recognition, or disclosure. The Fund files a U.S. federal income tax return annually after its fiscal year-end, which is subject to examination by the Internal Revenue Service for a period of three years from the date of filing.
Eaton Vance
Emerging Markets Debt Fund
January 31, 2021
Notes to Financial Statements — continued
E Foreign Currency Translation — Investment valuations, other assets, and liabilities initially expressed in foreign currencies are translated each business day into U.S. dollars based upon current exchange rates. Purchases and sales of foreign investment securities and income and expenses denominated in foreign currencies are translated into U.S. dollars based upon currency exchange rates in effect on the respective dates of such transactions. Recognized gains or losses on investment transactions attributable to changes in foreign currency exchange rates are recorded for financial statement purposes as net realized gains and losses on investments. That portion of unrealized gains and losses on investments that results from fluctuations in foreign currency exchange rates is not separately disclosed.
F Unfunded Loan Commitments — The Fund may enter into certain loan agreements all or a portion of which may be unfunded. The Fund is obligated to fund these commitments at the borrower’s discretion. These commitments, if any, are disclosed in the accompanying Portfolio of Investments.
G Use of Estimates — The preparation of the financial statements in conformity with U.S. GAAP requires management to make estimates and assumptions that affect the reported amounts of assets and liabilities at the date of the financial statements and the reported amounts of income and expense during the reporting period. Actual results could differ from those estimates.
H Indemnifications — Under the Trust’s organizational documents, its officers and Trustees may be indemnified against certain liabilities and expenses arising out of the performance of their duties to the Fund. Under Massachusetts law, if certain conditions prevail, shareholders of a Massachusetts business trust (such as the Trust) could be deemed to have personal liability for the obligations of the Trust. However, the Trust’s Declaration of Trust contains an express disclaimer of liability on the part of Fund shareholders and the By-laws provide that the Trust shall assume, upon request by the shareholder, the defense on behalf of any Fund shareholders. Moreover, the By-laws also provide for indemnification out of Fund property of any shareholder held personally liable solely by reason of being or having been a shareholder for all loss or expense arising from such liability. Additionally, in the normal course of business, the Fund enters into agreements with service providers that may contain indemnification clauses. The Fund’s maximum exposure under these arrangements is unknown as this would involve future claims that may be made against the Fund that have not yet occurred.
I Financial Futures Contracts — Upon entering into a financial futures contract, the Fund is required to deposit with the broker, either in cash or securities, an amount equal to a certain percentage of the contract amount (initial margin). Subsequent payments, known as variation margin, are made or received by the Fund each business day, depending on the daily fluctuations in the value of the underlying security, and are recorded as unrealized gains or losses by the Fund. Gains (losses) are realized upon the expiration or closing of the financial futures contracts. Should market conditions change unexpectedly, the Fund may not achieve the anticipated benefits of the financial futures contracts and may realize a loss. Futures contracts have minimal counterparty risk as they are exchange traded and the clearinghouse for the exchange is substituted as the counterparty, guaranteeing counterparty performance.
J Forward Foreign Currency Exchange Contracts — The Fund may enter into forward foreign currency exchange contracts for the purchase or sale of a specific foreign currency at a fixed price on a future date. The forward foreign currency exchange contracts are adjusted by the daily exchange rate of the underlying currency and any gains or losses are recorded as unrealized until such time as the contracts have been closed. While forward foreign currency exchange contracts are privately negotiated agreements between the Fund and a counterparty, certain contracts may be “centrally cleared”, whereby all payments made or received by the Fund pursuant to the contract are with a central clearing party (CCP) rather than the original counterparty. The CCP guarantees the performance of the original parties to the contract. Upon entering into centrally cleared contracts, the Fund is required to deposit with the CCP, either in cash or securities, an amount of initial margin determined by the CCP, which is subject to adjustment. For centrally cleared contracts, the daily change in valuation is recorded as a receivable or payable for variation margin and settled in cash with the CCP daily. Risks may arise upon entering these contracts from the potential inability of counterparties to meet the terms of their contracts and from movements in the value of a foreign currency relative to the U.S. dollar. In the case of centrally cleared contracts, counterparty risk is minimal due to protections provided by the CCP.
K Interest Rate Swaps — Pursuant to interest rate swap agreements, the Fund either makes floating-rate payments to the counterparty (or CCP in the case of centrally cleared swaps) based on a benchmark interest rate in exchange for fixed-rate payments or the Fund makes fixed-rate payments to the counterparty (or CCP in the case of a centrally cleared swap) in exchange for payments on a floating benchmark interest rate. Payments received or made, including amortization of upfront payments/receipts, are recorded as realized gains or losses. During the term of the outstanding swap agreement, changes in the underlying value of the swap are recorded as unrealized gains or losses. For centrally cleared swaps, the daily change in valuation is recorded as a receivable or payable for variation margin and settled in cash with the CCP daily. The value of the swap is determined by changes in the relationship between two rates of interest. The Fund is exposed to credit loss in the event of non-performance by the swap counterparty. In the case of centrally cleared swaps, counterparty risk is minimal due to protections provided by the CCP. Risk may also arise from movements in interest rates.
L Credit Default Swaps — When the Fund is the buyer of a credit default swap contract, the Fund is entitled to receive the par (or other agreed-upon) value of a referenced debt obligation (or basket of debt obligations) from the counterparty (or CCP in the case of a centrally cleared swap) to the contract if a credit event by a third party, such as a U.S. or foreign corporate issuer or sovereign issuer, on the debt obligation occurs. In return, the Fund pays the counterparty a periodic stream of payments over the term of the contract provided that no credit event has occurred. If no credit event occurs, the Fund would have spent the stream of payments and received no proceeds from the contract. When the Fund is the seller of a credit default swap contract, it receives the stream of payments, but is obligated to pay to the buyer of the protection an amount up to the notional amount of the swap and in certain instances take delivery of securities of the reference entity upon the occurrence of a credit event, as defined under the terms of that particular swap agreement. Credit events are contract specific but may include bankruptcy, failure to pay, restructuring, obligation acceleration and repudiation/moratorium. If the Fund is a seller of protection and a credit event occurs, the maximum potential amount of future payments that the Fund could be required to make would be an amount equal to the notional amount of the agreement. This potential amount would be partially offset by any recovery value
Eaton Vance
Emerging Markets Debt Fund
January 31, 2021
Notes to Financial Statements — continued
of the respective referenced obligation, or net amount received from the settlement of a buy protection credit default swap agreement entered into by the Fund for the same referenced obligation. As the seller, the Fund may create economic leverage to its portfolio because, in addition to its total net assets, the Fund is subject to investment exposure on the notional amount of the swap. The interest fee paid or received on the swap contract, which is based on a specified interest rate on a fixed notional amount, is accrued daily as a component of unrealized appreciation (depreciation) and is recorded as realized gain upon receipt or realized loss upon payment. The Fund also records an increase or decrease to unrealized appreciation (depreciation) in an amount equal to the daily valuation. For centrally cleared swaps, the daily change in valuation is recorded as a receivable or payable for variation margin and settled in cash with the CCP daily. For financial reporting purposes, unamortized upfront payments or receipts, if any, are netted with unrealized appreciation or depreciation on swap contracts to determine the market value of swaps as presented in Notes 6 and 10. The Fund segregates assets in the form of cash or liquid securities in an amount equal to the notional amount of the credit default swaps of which it is the seller. The Fund segregates assets in the form of cash or liquid securities in an amount equal to any unrealized depreciation of the credit default swaps of which it is the buyer, marked-to-market on a daily basis. These transactions involve certain risks, including the risk that the seller may be unable to fulfill the transaction. In the case of centrally cleared swaps, counterparty risk is minimal due to protections provided by the CCP.
2 Distributions to Shareholders and Income Tax Information
It is the present policy of the Fund to make monthly distributions of all or substantially all of its net investment income and to distribute annually all or substantially all of its net realized capital gains. Distributions to shareholders are recorded on the ex-dividend date. Shareholders may reinvest income and capital gain distributions in additional shares of the Fund at the net asset value as of the ex-dividend date or, at the election of the shareholder, receive distributions in cash. Distributions to shareholders are determined in accordance with income tax regulations, which may differ from U.S. GAAP. As required by U.S. GAAP, only distributions in excess of tax basis earnings and profits are reported in the financial statements as a return of capital. Permanent differences between book and tax accounting relating to distributions are reclassified to paid-in capital. For tax purposes, distributions from short-term capital gains are considered to be from ordinary income.
The tax character of distributions declared for the years ended January 31, 2021 and January 31, 2020 was as follows:
| | | | | | | | |
| | | Year Ended January 31, | |
| | | 2021 | | | 2020 | |
| | |
Ordinary income | | $ | 446,396 | | | $ | 510,625 | |
| | |
Long-term capital gains | | $ | — | | | $ | 51,949 | |
As of January 31, 2021, the components of distributable earnings (accumulated loss) on a tax basis were as follows:
| | | | |
| | |
Undistributed ordinary income | | $ | 13,564 | |
| |
Deferred capital losses | | $ | (410,899 | ) |
| |
Net unrealized appreciation | | $ | 599,359 | |
At January 31, 2021, the Fund, for federal income tax purposes, had deferred capital losses of $410,899 which would reduce its taxable income arising from future net realized gains on investment transactions, if any, to the extent permitted by the Internal Revenue Code, and thus would reduce the amount of distributions to shareholders, which would otherwise be necessary to relieve the Fund of any liability for federal income or excise tax. The deferred capital losses are treated as arising on the first day of the Fund’s next taxable year and retain the same short-term or long-term character as when originally deferred. Of the deferred capital losses at January 31, 2021, $410,899 are short-term.
The cost and unrealized appreciation (depreciation) of investments, including open derivative contracts, of the Fund at January 31, 2021, as determined on a federal income tax basis, were as follows:
| | | | |
| |
Aggregate cost | | $ | 7,581,269 | |
| |
Gross unrealized appreciation | | $ | 657,666 | |
| |
Gross unrealized depreciation | | | (58,985 | ) |
| |
Net unrealized appreciation | | $ | 598,681 | |
Eaton Vance
Emerging Markets Debt Fund
January 31, 2021
Notes to Financial Statements — continued
3 Investment Adviser and Administration Fee and Other Transactions with Affiliates
The investment adviser and administration fee is earned by EVM, a wholly-owned subsidiary of Eaton Vance Corp., as compensation for investment advisory and administrative services rendered to the Fund. The fee is computed at an annual rate of 0.65% of the Fund’s average daily net assets up to $500 million and is payable monthly. On net assets of $500 million and over, the annual fee is reduced. For the year ended January 31, 2021, the investment adviser and administration fee amounted to $54,610 or 0.65% of the Fund’s average daily net assets. The Fund invests its cash in Cash Reserves Fund. EVM does not currently receive a fee for advisory services provided to Cash Reserves Fund.
EVM has agreed to reimburse the Fund’s expenses to the extent that total annual operating expenses (relating to ordinary operating expenses only and excluding such expenses as borrowing costs, taxes or litigation expenses) exceed 0.85% of the Fund’s average daily net assets for Class I. This agreement may be changed or terminated after May 31, 2021. Pursuant to this agreement, EVM was allocated $187,115 of the Fund’s operating expenses for the year ended January 31, 2021.
EVM provides sub-transfer agency and related services to the Fund pursuant to a Sub-Transfer Agency Support Services Agreement. For the year ended January 31, 2021, EVM earned $120 from the Fund pursuant to such agreement, which is included in transfer and dividend disbursing agent fees on the Statement of Operations.
Trustees and officers of the Fund who are members of EVM’s organization receive remuneration for their services to the Fund out of the investment adviser and administration fee. Trustees of the Fund who are not affiliated with EVM may elect to defer receipt of all or a percentage of their annual fees in accordance with the terms of the Trustees Deferred Compensation Plan. For the year ended January 31, 2021, no significant amounts have been deferred. Certain officers and Trustees of the Fund are officers of EVM.
4 Purchases and Sales of Investments
Purchases and sales of investments, other than short-term obligations, aggregated $16,608,344 and $15,980,675, respectively, for the year ended January 31, 2021.
5 Shares of Beneficial Interest
The Trust’s Declaration of Trust permits the Trustees to issue an unlimited number of full and fractional shares of beneficial interest (without par value) in one or more series (such as the Fund). Transactions in Fund shares were as follows:
| | | | | | | | |
| | | Year Ended January 31, | |
| | | 2021 | | | 2020 | |
| | |
Sales | | | 180,018 | | | | 2,254 | |
| | |
Issued to shareholders electing to receive payments of distributions in Fund shares | | | 3,429 | | | | 63 | |
| | |
Redemptions | | | (134,224 | ) | | | — | |
| | |
Net increase | | | 49,223 | | | | 2,317 | |
At January 31, 2021, EVM owned 93.8% of the outstanding shares of the Fund.
6 Financial Instruments
The Fund may trade in financial instruments with off-balance sheet risk in the normal course of its investing activities. These financial instruments may include forward foreign currency exchange contracts, financial futures contracts and swap contracts and may involve, to a varying degree, elements of risk in excess of the amounts recognized for financial statement purposes. The notional or contractual amounts of these instruments represent the investment the Fund has in particular classes of financial instruments and do not necessarily represent the amounts potentially subject to risk. The measurement of the risks associated with these instruments is meaningful only when all related and offsetting transactions are considered. A summary of obligations under these financial instruments at January 31, 2021 is included in the Portfolio of Investments. At January 31, 2021, the Fund had sufficient cash and/or securities to cover commitments under these contracts.
In the normal course of pursuing its investment objective, the Fund is subject to the following risks:
Credit Risk: The Fund enters into credit default swap contracts to enhance total return and/or as a substitute for the purchase or sale of securities.
Foreign Exchange Risk: The Fund engages in forward foreign currency exchange contracts to enhance total return and/or to seek to hedge against fluctuations in currency exchange rates.
Eaton Vance
Emerging Markets Debt Fund
January 31, 2021
Notes to Financial Statements — continued
Interest Rate Risk: The Fund utilizes various interest rate derivatives including interest rate futures contracts and interest rate swaps to enhance total return, to seek to hedge against fluctuations in interest rates, and/or to change the effective duration of its portfolio.
The Fund enters into over-the-counter (OTC) derivatives that may contain provisions whereby the counterparty may terminate the contract under certain conditions, including but not limited to a decline in the Fund’s net assets below a certain level over a certain period of time, which would trigger a payment by the Fund for those derivatives in a liability position. At January 31, 2021, the fair value of derivatives with credit-related contingent features in a net liability position was $232. At January 31, 2021, there were no assets pledged by the Fund for such liability.
The OTC derivatives in which the Fund invests are subject to the risk that the counterparty to the contract fails to perform its obligations under the contract. To mitigate this risk, the Fund has entered into an International Swaps and Derivatives Association, Inc. Master Agreement (“ISDA Master Agreement”) or similar agreement with substantially all its derivative counterparties. An ISDA Master Agreement is a bilateral agreement between the Fund and a counterparty that governs certain OTC derivatives and typically contains, among other things, set-off provisions in the event of a default and/or termination event as defined under the relevant ISDA Master Agreement. Under an ISDA Master Agreement, the Fund may, under certain circumstances, offset with the counterparty certain derivative financial instruments’ payables and/or receivables with collateral held and/or posted and create one single net payment. The provisions of the ISDA Master Agreement typically permit a single net payment in the event of default including the bankruptcy or insolvency of the counterparty. However, bankruptcy or insolvency laws of a particular jurisdiction may impose restrictions on or prohibitions against the right of offset in bankruptcy or insolvency. Certain ISDA Master Agreements allow counterparties to OTC derivatives to terminate derivative contracts prior to maturity in the event the Fund’s net assets decline by a stated percentage or the Fund fails to meet the terms of its ISDA Master Agreements, which would cause the counterparty to accelerate payment by the Fund of any net liability owed to it.
The collateral requirements for derivatives traded under an ISDA Master Agreement are governed by a Credit Support Annex to the ISDA Master Agreement. Collateral requirements are determined at the close of business each day and are typically based on changes in market values for each transaction under an ISDA Master Agreement and netted into one amount for such agreement. Generally, the amount of collateral due from or to a counterparty is subject to a minimum transfer threshold amount before a transfer is required, which may vary by counterparty. Collateral pledged for the benefit of the Fund and/or counterparty is held in segregated accounts by the Fund’s custodian and cannot be sold, re-pledged, assigned or otherwise used while pledged. The portion of such collateral representing cash, if any, is reflected as deposits for derivatives collateral and, in the case of cash pledged by a counterparty for the benefit of the Fund, a corresponding liability on the Statement of Assets and Liabilities. Securities pledged by the Fund as collateral, if any, are identified as such in the Portfolio of Investments.
The fair value of open derivative instruments (not considered to be hedging instruments for accounting disclosure purposes) by risk exposure at January 31, 2021 was as follows:
| | | | | | | | | | | | | | | | |
| | | Fair Value | |
| Statement of Assets and Liabilities Caption | | Credit | | | Foreign
Exchange | | | Interest Rate | | | Total | |
| | | | |
Distributable earnings | | $ | 4,532 | | | $ | 778 | * | | $ | 125,027 | * | | $ | 130,337 | |
| | | | |
Receivable for open forward foreign currency exchange contracts | | | — | | | | 17,667 | | | | — | | | | 17,667 | |
| | | | |
Total Asset Derivatives | | $ | 4,532 | | | $ | 18,445 | | | $ | 125,027 | | | $ | 148,004 | |
| | | | |
Derivatives not subject to master netting or similar agreements | | $ | 4,532 | | | $ | 778 | | | $ | 125,027 | | | $ | 130,337 | |
| | | | |
Total Asset Derivatives subject to master netting or similar agreements | | $ | — | | | $ | 17,667 | | | $ | — | | | $ | 17,667 | |
| | | | |
Distributable earnings | | $ | (27,171 | )* | | $ | (784 | )* | | $ | (191,477 | )* | | $ | (219,432 | ) |
| | | | |
Payable for open forward foreign currency exchange contracts | | | — | | | | (232 | ) | | | — | | | | (232 | ) |
| | | | |
Total Liability Derivatives | | $ | (27,171 | ) | | $ | (1,016 | ) | | $ | (191,477 | ) | | $ | (219,664 | ) |
| | | | |
Derivatives not subject to master netting or similar agreements | | $ | (27,171 | ) | | $ | (784 | ) | | $ | (191,477 | ) | | $ | (219,432 | ) |
| | | | |
Total Liability Derivatives subject to master netting or similar agreements | | $ | — | | | $ | (232 | ) | | $ | — | | | $ | (232 | ) |
| * | Only the current day’s variation margin on open futures contracts and centrally cleared derivatives is reported within the Statement of Assets and Liabilities as Receivable or Payable for variation margin on open financial futures contracts and centrally cleared derivatives, as applicable. |
Eaton Vance
Emerging Markets Debt Fund
January 31, 2021
Notes to Financial Statements — continued
The Fund’s derivative assets and liabilities at fair value by risk, which are reported gross in the Statement of Assets and Liabilities, are presented in the table above. The following tables present the Fund’s derivative assets and liabilities by counterparty, net of amounts available for offset under a master netting agreement and net of the related collateral received by the Fund for such assets and pledged by the Fund for such liabilities as of January 31, 2021.
| | | | | | | | | | | | | | | | | | | | |
| Counterparty | | Derivative Assets
Subject to
Master Netting
Agreement | | | Derivatives
Available
for Offset | | | Non-cash
Collateral
Received(a) | | | Cash
Collateral
Received(a) | | | Net Amount
of Derivative
Assets(b) | |
| | | | | |
Standard Chartered Bank | | $ | 17,667 | | | $ | — | | | $ | — | | | $ | — | | | $ | 17,667 | |
| | | | | |
| Counterparty | | Derivative Liabilities
Subject to
Master Netting
Agreement | | | Derivatives
Available
for Offset | | | Non-cash
Collateral
Pledged(a) | | | Cash
Collateral
Pledged(a) | | | Net Amount
of Derivative
Liabilities(c) | |
| | | | | |
UBS AG | | $ | (232 | ) | | $ | — | | | $ | — | | | $ | — | | | $ | (232 | ) |
| (a) | In some instances, the total collateral received and/or pledged may be more than the amount shown due to overcollateralization. |
| (b) | Net amount represents the net amount due from the counterparty in the event of default. |
| (c) | Net amount represents the net amount payable to the counterparty in the event of default. |
The effect of derivative instruments (not considered to be hedging instruments for accounting disclosure purposes) on the Statement of Operations by risk exposure for the year ended January 31, 2021 was as follows:
| | | | | | | | | | | | | | | | |
| Statement of Operations Caption | | Credit | | | Foreign
Exchange | | | Interest
Rate | | | Total | |
| | | | |
Net realized gain (loss) — | | | | | | | | | | | | | | | | |
| | | | |
Financial futures contracts | | $ | — | | | $ | — | | | $ | 484,385 | | | $ | 484,385 | |
| | | | |
Swap contracts | | | 22,713 | | | | — | | | | (303,045 | ) | | | (280,332 | ) |
| | | | |
Forward foreign currency exchange contracts | | | — | | | | (101,078 | ) | | | — | | | | (101,078 | ) |
| | | | |
Total | | $ | 22,713 | | | $ | (101,078 | ) | | $ | 181,340 | | | $ | 102,975 | |
| | | | |
Change in unrealized appreciation (depreciation) — | | | | | | | | | | | | | | | | |
| | | | |
Financial futures contracts | | $ | — | | | $ | — | | | $ | (144,808 | ) | | $ | (144,808 | ) |
| | | | |
Swap contracts | | | 4,227 | | | | — | | | | 136,694 | | | | 140,921 | |
| | | | |
Forward foreign currency exchange contracts | | | — | | | | 17,100 | | | | — | | | | 17,100 | |
| | | | |
Total | | $ | 4,227 | | | $ | 17,100 | | | $ | (8,114 | ) | | $ | 13,213 | |
The average notional cost of futures contracts and average notional amounts of other derivative contracts outstanding during the year ended January 31, 2021, which are indicative of the volume of these derivative types, were approximately as follows:
| | | | | | | | | | | | | | |
Futures
Contracts — Long | | | Futures
Contracts — Short | | | Forward
Foreign Currency
Exchange Contracts* | | | Swap
Contracts | |
| | | |
| | $4,025,000 | | | $ | 644,000 | | | $ | 1,210,000 | | | $ | 6,314,000 | |
| * | The average notional amount for forward foreign currency exchange contracts is based on the absolute value of notional amounts of currency purchased and currency sold. |
Eaton Vance
Emerging Markets Debt Fund
January 31, 2021
Notes to Financial Statements — continued
7 Line of Credit
The Fund participates with other portfolios and funds managed by EVM and its affiliates in an $800 million unsecured line of credit agreement with a group of banks, which is in effect through October 26, 2021. Borrowings are made by the Fund solely for temporary purposes related to redemptions and other short-term cash needs. Interest is charged to the Fund based on its borrowings at an amount above either the Eurodollar rate or Federal Funds rate. In addition, a fee computed at an annual rate of 0.15% on the daily unused portion of the line of credit is allocated among the participating portfolios and funds at the end of each quarter. In connection with the renewal of the agreement in October 2020, an upfront fee and arrangement fee totaling $950,000 was incurred that was allocated to the participating portfolios and funds. Because the line of credit is not available exclusively to the Fund, it may be unable to borrow some or all of its requested amounts at any particular time. The Fund did not have any significant borrowings or allocated fees during the year ended January 31, 2021.
8 Overdraft Advances
Pursuant to the custodian agreement, State Street Bank and Trust Company (SSBT) may, in its discretion, advance funds to the Fund to make properly authorized payments. When such payments result in an overdraft, the Fund is obligated to repay SSBT at the current rate of interest charged by SSBT for secured loans (currently, the Federal Funds rate plus 2%). This obligation is payable on demand to SSBT. SSBT has a lien on the Fund’s assets to the extent of any overdraft. At January 31, 2021, the Fund had a payment due to SSBT pursuant to the foregoing arrangement of $204,998. Based on the short-term nature of these payments and the variable interest rate, the carrying value of the overdraft advances approximated its fair value at January 31, 2021. If measured at fair value, overdraft advances would have been considered as Level 2 in the fair value hierarchy (see Note 10) at January 31, 2021. The Fund’s average overdraft advances during the year ended January 31, 2021 were not significant.
9 Investments in Affiliated Funds
At January 31, 2021, the value of the Fund’s investment in affiliated funds was $499,206, which represents 5.6% of the Fund’s net assets. Transactions in affiliated funds by the Fund for the year ended January 31, 2021 were as follows:
| | | | | | | | | | | | | | | | | | | | | | | | | | | | | | | | |
| Name of affiliated fund | | Value,
beginning
of period | | | Purchases | | | Sales
proceeds | | | Net
realized
gain (loss) | | | Change in
unrealized
appreciation
(depreciation) | | | Value, end
of period | | | Dividend
income | | | Units, end
of period | |
|
Short-Term Investments | |
| | | | | | | | |
Eaton Vance Cash Reserves Fund, LLC | | $ | 589,017 | | | $ | 8,713,387 | | | $ | (8,803,144 | ) | | $ | (19 | ) | | $ | (35 | ) | | $ | 499,206 | | | $ | 2,634 | | | | 499,206 | |
10 Fair Value Measurements
Under generally accepted accounting principles for fair value measurements, a three-tier hierarchy to prioritize the assumptions, referred to as inputs, is used in valuation techniques to measure fair value. The three-tier hierarchy of inputs is summarized in the three broad levels listed below.
| • | | Level 1 – quoted prices in active markets for identical investments |
| • | | Level 2 – other significant observable inputs (including quoted prices for similar investments, interest rates, prepayment speeds, credit risk, etc.) |
| • | | Level 3 – significant unobservable inputs (including a fund’s own assumptions in determining the fair value of investments) |
In cases where the inputs used to measure fair value fall in different levels of the fair value hierarchy, the level disclosed is determined based on the lowest level input that is significant to the fair value measurement in its entirety. The inputs or methodology used for valuing securities are not necessarily an indication of the risk associated with investing in those securities.
Eaton Vance
Emerging Markets Debt Fund
January 31, 2021
Notes to Financial Statements — continued
At January 31, 2021, the hierarchy of inputs used in valuing the Fund’s investments and open derivative instruments, which are carried at value, were as follows:
| | | | | | | | | | | | | | | | |
| Asset Description | | Level 1 | | | Level 2 | | | Level 3 | | | Total | |
| | | | |
Foreign Corporate Bonds | | $ | — | | | $ | 444,372 | | | $ | — | | | $ | 444,372 | |
| | | | |
Foreign Government Bonds | | | — | | | | 6,430,279 | | | | — | | | | 6,430,279 | |
| | | | |
Sovereign Loans | | | — | | | | 790,398 | | | | — | | | | 790,398 | |
| | | | |
Short-Term Investments | | | — | | | | 499,206 | | | | — | | | | 499,206 | |
| | | | |
Total Investments | | $ | — | | | $ | 8,164,255 | | | $ | — | | | $ | 8,164,255 | |
| | | | |
Forward Foreign Currency Exchange Contracts | | $ | — | | | $ | 18,445 | | | $ | — | | | $ | 18,445 | |
| | | | |
Futures Contracts | | | 914 | | | | — | | | | — | | | | 914 | |
| | | | |
Swap Contracts | | | — | | | | 128,645 | | | | — | | | | 128,645 | |
| | | | |
Total | | $ | 914 | | | $ | 8,311,345 | | | $ | — | | | $ | 8,312,259 | |
| | | | |
Liability Description | | | | | | | | | | | | | | | | |
| | | | |
Forward Foreign Currency Exchange Contracts | | $ | — | | | $ | (1,016 | ) | | $ | — | | | $ | (1,016 | ) |
| | | | |
Futures Contracts | | | (53,520 | ) | | | — | | | | — | | | | (53,520 | ) |
| | | | |
Swap Contracts | | | — | | | | (165,128 | ) | | | — | | | | (165,128 | ) |
| | | | |
Total | | $ | (53,520 | ) | | $ | (166,144 | ) | | $ | — | | | $ | (219,664 | ) |
11 Risks and Uncertainties
Risks Associated with Foreign Investments
The Fund’s investments in foreign instruments can be adversely affected by changes in currency exchange rates and political, economic and market developments abroad. In emerging or less developed countries, these risks can be more significant. Investment markets in emerging market countries are typically substantially smaller, less liquid and more volatile than the major markets in developed countries. Emerging market countries may have relatively unstable governments and economies. Emerging market investments often are subject to speculative trading, which typically contributes to volatility.
The Fund may have difficulties enforcing its legal or contractual rights in a foreign country. Economic data as reported by foreign governments and other issuers may be delayed, inaccurate or fraudulent. In the event of a default by a sovereign entity, there are typically no assets to be seized or cash flows to be attached. Furthermore, the willingness or ability of a foreign government to renegotiate defaulted debt may be limited.
Pandemic Risk
An outbreak of respiratory disease caused by a novel coronavirus was first detected in China in December 2019 and subsequently spread internationally. This coronavirus has resulted in closing borders, enhanced health screenings, changes to healthcare service preparation and delivery, quarantines, cancellations, disruptions to supply chains and customer activity, as well as general concern and uncertainty. Health crises caused by outbreaks, such as the coronavirus outbreak, may exacerbate other pre-existing political, social and economic risks and disrupt normal market conditions and operations. The impact of this outbreak has negatively affected the worldwide economy, the economies of individual countries, individual companies, and the market in general, and may continue to do so in significant and unforeseen ways, as may other epidemics and pandemics that may arise in the future. Any such impact could adversely affect the Fund’s performance, or the performance of the securities in which the Fund invests.
12 Additional Information
On October 8, 2020, Morgan Stanley and Eaton Vance Corp. (“Eaton Vance”) announced that they had entered into a definitive agreement under which Morgan Stanley would acquire Eaton Vance. Under the Investment Company Act of 1940, as amended, consummation of this transaction may have been deemed to result in the automatic termination of an Eaton Vance Fund’s investment advisory agreement and, where applicable, any related sub-advisory agreement. On November 24, 2020, the Fund’s Board approved a new investment advisory and administrative agreement. The new investment advisory and administrative agreement was approved by Fund shareholders at a joint special meeting of shareholders held on February 18, 2021, and became effective upon the consummation of the transaction on March 1, 2021.
Eaton Vance
Emerging Markets Debt Fund
January 31, 2021
Report of Independent Registered Public Accounting Firm
To the Trustees of Eaton Vance Mutual Funds Trust and Shareholders of Eaton Vance Emerging Markets Debt Fund:
Opinion on the Financial Statements and Financial Highlights
We have audited the accompanying statement of assets and liabilities of Eaton Vance Emerging Markets Debt Fund (the “Fund”) (one of the funds constituting Eaton Vance Mutual Funds Trust), including the portfolio of investments, as of January 31, 2021, the related statement of operations for the year then ended, the statements of changes in net assets for each of the two years in the period then ended, the financial highlights for each of the two years in the period then ended and the period from the start of business, May 1, 2018, to January 31, 2019, and the related notes. In our opinion, the financial statements and financial highlights present fairly, in all material respects, the financial position of the Fund as of January 31, 2021, and the results of its operations for the year then ended, the changes in its net assets for each of the two years in the period then ended, and the financial highlights for each of the two years in the period then ended and the period from the start of business, May 1, 2018, to January 31, 2019, in conformity with accounting principles generally accepted in the United States of America.
Basis for Opinion
These financial statements and financial highlights are the responsibility of the Fund’s management. Our responsibility is to express an opinion on the Fund’s financial statements and financial highlights based on our audits. We are a public accounting firm registered with the Public Company Accounting Oversight Board (United States) (PCAOB) and are required to be independent with respect to the Fund in accordance with the U.S. federal securities laws and the applicable rules and regulations of the Securities and Exchange Commission and the PCAOB.
We conducted our audits in accordance with the standards of the PCAOB. Those standards require that we plan and perform the audit to obtain reasonable assurance about whether the financial statements and financial highlights are free of material misstatement, whether due to error or fraud. The Fund is not required to have, nor were we engaged to perform, an audit of its internal control over financial reporting. As part of our audits we are required to obtain an understanding of internal control over financial reporting but not for the purpose of expressing an opinion on the effectiveness of the Fund’s internal control over financial reporting. Accordingly, we express no such opinion.
Our audits included performing procedures to assess the risks of material misstatement of the financial statements and financial highlights, whether due to error or fraud, and performing procedures that respond to those risks. Such procedures included examining, on a test basis, evidence regarding the amounts and disclosures in the financial statements and financial highlights. Our audits also included evaluating the accounting principles used and significant estimates made by management, as well as evaluating the overall presentation of the financial statements and financial highlights. Our procedures included confirmation of securities owned as of January 31, 2021, by correspondence with the custodian and brokers; when replies were not received from brokers, we performed other auditing procedures. We believe that our audits provide a reasonable basis for our opinion.
/s/ Deloitte & Touche LLP
Boston, Massachusetts
March 19, 2021
We have served as the auditor of one or more Eaton Vance investment companies since 1959.
Eaton Vance
Emerging Markets Debt Fund
January 31, 2021
Federal Tax Information (Unaudited)
The Form 1099-DIV you receive in February 2022 will show the tax status of all distributions paid to your account in calendar year 2021. Shareholders are advised to consult their own tax adviser with respect to the tax consequences of their investment in the Fund. As required by the Internal Revenue Code and/or regulations, shareholders must be notified regarding the status of 163(j) interest dividends.
163(j) Interest Dividends. For the fiscal year ended January 31, 2021, the Fund designates 91.97% of distributions from net investment income as a 163(j) interest dividend.
Eaton Vance
Emerging Markets Debt Fund
January 31, 2021
Board of Trustees’ Contract Approval
Overview of the Contract Review Process
Even though the following description of the Board’s (as defined below) consideration of investment advisory and, as applicable, sub-advisory agreements covers multiple funds, for purposes of this shareholder report, the description is only relevant as to Eaton Vance Emerging Markets Debt Fund.
| | | | |
| Fund | | Investment Adviser | | Investment Sub-Adviser |
| | |
Eaton Vance Emerging Markets Debt Fund | | Eaton Vance Management | | None |
At a meeting held on November 24, 2020 (the “November Meeting”), the Board of each Eaton Vance open-end Fund and portfolios in which each such Fund invests, as applicable (each, a “Fund” and, collectively, the “Funds”), including a majority of the Board members (the “Independent Trustees”) who are not “interested persons” (as defined in the Investment Company Act of 1940 (the “1940 Act”)) of the Funds, Eaton Vance Management (“EVM”) or Boston Management and Research (“BMR” and, together with EVM, the “Advisers”), voted to approve a new investment advisory agreement between each Fund and either EVM or BMR (the “New Investment Advisory Agreements”) and, for certain Funds, a new investment sub-advisory agreement between an Adviser and the applicable Sub-Adviser (the “New Investment Sub-Advisory Agreements”(1) and, together with the New Investment Advisory Agreements, the “New Agreements”), each of which is intended to go into effect upon the completion of the Transaction (as defined below), as more fully described below. In voting its approval of the New Agreements at the November Meeting, the Board relied on an order issued by the Securities and Exchange Commission in response to the impacts of the COVID-19 pandemic that provided temporary relief from the in-person meeting requirements under Section 15 of the 1940 Act.
In voting its approval of the New Agreements, the Board of each Fund relied upon the recommendation of its Contract Review Committee, which is a committee comprised exclusively of Independent Trustees. Prior to and during meetings leading up to the November Meeting, the Contract Review Committee reviewed and discussed information furnished by the Advisers, the Sub-Advisers, and Morgan Stanley, as requested by the Independent Trustees, that the Contract Review Committee considered reasonably necessary to evaluate the terms of the New Agreements and to form its recommendation. Such information included, among other things, the terms and anticipated impacts of Morgan Stanley’s pending acquisition of Eaton Vance Corp. (the “Transaction”) on the Funds and their shareholders. In addition to considering information furnished specifically to evaluate the impact of the Transaction on the Funds and their respective shareholders, the Board and its Contract Review Committee also considered information furnished for prior meetings of the Board and its committees, including information provided in connection with the annual contract review process for the Funds, which most recently culminated in April 2020 (the “2020 Annual Approval Process”).
The Board of each Fund, including the Independent Trustees, concluded that the applicable New Investment Advisory Agreement and, as applicable, New Investment Sub-Advisory Agreement, including the fees payable thereunder, was fair and reasonable, and it voted to approve the New Investment Advisory Agreement and, as applicable, New Investment Sub-Advisory Agreement and to recommend that shareholders do so as well.
Shortly after the announcement of the Transaction, the Board, including all of the Independent Trustees, met with senior representatives from the Advisers and Morgan Stanley at its meeting held on October 13, 2020 to discuss certain aspects of the Transaction and the expected impacts of the Transaction on the Funds and their shareholders. As part of the Board’s evaluation process, counsel to the Independent Trustees, on behalf of the Contract Review Committee, requested additional information to assist the Independent Trustees in their evaluation of the New Agreements and the implications of the Transaction, as well as other contractual arrangements that may be affected by the Transaction. The Contract Review Committee considered information furnished by the Advisers and Morgan Stanley, their respective affiliates, and, as applicable, the Sub-Advisers during meetings on November 5, 2020, November 10, 2020, November 13, 2020, November 17, 2020 and November 24, 2020.
During its meetings on November 10, 2020 and November 17, 2020, the Contract Review Committee further discussed the approval of the New Agreements with senior representatives of the Advisers, the Affiliated Sub-Advisers, and Morgan Stanley. The representatives from the Advisers, the Affiliated Sub-Advisers, and Morgan Stanley each made presentations to, and responded to questions from, the Independent Trustees. The Contract Review Committee considered the Advisers’, the Affiliated Sub-Advisers’ and Morgan Stanley’s responses related to the Transaction and specifically to the Funds, as well as information received in connection with the 2020 Annual Approval Process, with respect to its evaluation of the New Agreements. Among other information, the Board considered:
Information about the Transaction and its Terms
| | • | | Information about the material terms and conditions, and expected impacts, of the Transaction that relate to the Funds, including the expected impacts on the businesses conducted by the Advisers, the Affiliated Sub-Advisers and Eaton Vance Distributors, Inc., as the distributor of Fund shares; |
| (1) | With respect to certain of the Funds, the applicable Adviser is currently a party to a sub-advisory agreement (collectively, the “Current Sub-Advisory Agreements”) with Atlanta Capital Management Company, LLC (“Atlanta Capital”), BMO Global Asset Management (Asia) Limited, Eaton Vance Advisers International Ltd. (“EVAIL”), Goldman Sachs Asset Management, L.P., Hexavest Inc. (“Hexavest”), Parametric Portfolio Associates LLC (“Parametric”) or Richard Bernstein Advisors LLC (collectively, the “Sub-Advisers” and, with respect to Atlanta Capital, EVAIL, Hexavest and Parametric, each an affiliate of the Advisers, the “Affiliated Sub-Advisers”). Accordingly, references to the “Sub-Advisers,” the “Affiliated Sub-Advisers” or the “New Sub-Advisory Agreements” are not applicable to all Funds. |
Eaton Vance
Emerging Markets Debt Fund
January 31, 2021
Board of Trustees’ Contract Approval — continued
| | • | | Information about the advantages of the Transaction as they relate to the Funds and their shareholders; |
| | • | | A commitment that the Funds would not bear any expenses, directly or indirectly, in connection with the Transaction; |
| | • | | A commitment that, for a period of three years after the Closing, at least 75% of each Fund’s Board members must not be “interested persons” (as defined in the 1940 Act) of the investment adviser (or predecessor investment adviser, if applicable) pursuant to Section 15(f)(1)(A) of the 1940 Act; |
| | • | | A commitment that Morgan Stanley would use its reasonable best efforts to ensure that it did not impose any “unfair burden” (as that term is used in section 15(f)(1)(B) of the 1940 Act) on the Funds as a result of the Transaction; |
| | • | | Information with respect to personnel and/or other resources of the Advisers and their affiliates, including the Affiliated Sub-Advisers, as a result of the Transaction, as well as any expected changes to compensation, including any retention-based compensation intended to incentivize key personnel at the Advisers and their affiliates, including the Affiliated Sub-Advisers; |
| | • | | Information regarding any changes that are expected with respect to the Funds’ slate of officers as a result of the Transaction; |
Information about Morgan Stanley
| | • | | Information about Morgan Stanley’s overall business, including information about the advisory, brokerage and related businesses that Morgan Stanley operates; |
| | • | | Information about Morgan Stanley’s financial condition, including its access to capital and other resources required to support the investment advisory businesses related to the Funds; |
| | • | | Information on how the Funds are expected to fit within Morgan Stanley’s overall business strategy, and any changes that Morgan Stanley contemplates implementing to the Funds in the short- or long-term following the closing of the Transaction (the “Closing”); |
| | • | | Information regarding risk management functions at Morgan Stanley and its affiliates, including how existing risk management protocols and procedures may impact the Funds and/or the businesses of the Advisers and their affiliates, including the Affiliated Sub-Advisers, as they relate to the Funds; |
| | • | | Information on the anticipated benefits of the Transaction to the Funds with respect to potential additional distribution capabilities and the ability to access new markets and customer segments through Morgan Stanley’s distribution network, including, in particular, its institutional client base; |
| | • | | Information regarding the financial condition and reputation of Morgan Stanley, its worldwide presence, experience as a fund sponsor and manager, commitment to maintain a high level of cooperation with, and support to, the Funds, strong client service capabilities, and relationships in the asset management industry; |
Information about the New Agreements for Funds
| | • | | A representation that, after the Closing, all of the Funds will continue to be advised by their current Adviser and Sub-Adviser, as applicable; |
| | • | | Information regarding the terms of the New Agreements, including certain changes as compared to the current investment advisory agreement between each Fund and its Adviser (collectively, the “Current Advisory Agreements”) and, as applicable, the current investment sub-advisory agreement between a Fund and a Sub-Adviser (together with the Current Advisory Agreements, the “Current Agreements”); |
| | • | | Information confirming that the fee rates payable under the New Agreements are not changed as compared to the Current Agreements; |
| | • | | A representation that the New Agreements will not cause any diminution in the nature, extent and quality of services provided by the Advisers and the Sub-Advisers to the Funds and their respective shareholders, including with respect to compliance and other non-advisory services; |
Information about Fund Performance, Fees and Expenses
| | • | | A report from an independent data provider comparing the investment performance of each Fund (including, as relevant, total return data, income data, Sharpe ratios and information ratios) to the investment performance of comparable funds and, as applicable, benchmark indices, over various time periods as of the 2020 Annual Approval Process, as well as performance information as of a more recent date; |
| | • | | A report from an independent data provider comparing each Fund’s total expense ratio (and its components) to those of comparable funds as of the 2020 Annual Approval Process, as well as fee and expense information as of a more recent date; |
| | • | | In certain instances, data regarding investment performance relative to customized groups of peer funds and blended indices identified by the Advisers in consultation with the Portfolio Management Committee of the Board as of the 2020 Annual Approval Process, as well as corresponding performance information as of a more recent date; |
| | • | | Comparative information concerning the fees charged and services provided by the Adviser and the Sub-Adviser to each Fund in managing other accounts (which may include other mutual funds, collective investment funds and institutional accounts) using investment strategies and techniques similar to those used in managing such Fund(s), if any; |
| | • | | Profitability analyses of the Advisers and the Affiliated Sub-Advisers, as applicable, with respect to each of the Funds as of the 2020 Annual Approval Process, as well as information regarding the impact of the Transaction on profitability; |
Information about Portfolio Management and Trading
| | • | | Descriptions of the investment management services currently provided and expected to be provided to each Fund after the Transaction, as well as each of the Funds’ investment strategies and policies; |
| | • | | The procedures and processes used to determine the fair value of Fund assets, when necessary, and actions taken to monitor and test the effectiveness of such procedures and processes; |
Eaton Vance
Emerging Markets Debt Fund
January 31, 2021
Board of Trustees’ Contract Approval — continued
| | • | | Information about any changes to the policies and practices of the Advisers and, as applicable, each Fund’s Sub-Adviser with respect to trading, including their processes for seeking best execution of portfolio transactions; |
| | • | | Information regarding the impact on trading and access to capital markets associated with the Funds’ affiliations with Morgan Stanley and its affiliates, including potential restrictions with respect to the Funds’ ability to execute portfolio transactions with Morgan Stanley and its affiliates; |
Information about the Advisers and the Sub-Advisers
| | • | | Information about the financial results and condition of the Advisers and the Affiliated Sub-Advisers since the culmination of the 2020 Annual Approval Process and any material changes in financial condition that are reasonably expected to occur before and after the Closing; |
| | • | | Information regarding contemplated changes to the individual investment professionals whose responsibilities include portfolio management and investment research for the Funds, and, for portfolio managers and certain other investment professionals, information relating to their responsibilities with respect to managing other mutual funds and investment accounts, as applicable, post-Closing; |
| | • | | The Code of Ethics of the Advisers and their affiliates, including the Affiliated Sub-Advisers, together with information relating to compliance with, and the administration of, such codes; |
| | • | | Policies and procedures relating to proxy voting and the handling of corporate actions and class actions; |
| | • | | Information concerning the resources devoted to compliance efforts undertaken by the Advisers and their affiliates, including the Affiliated Sub-Advisers, including descriptions of their various compliance programs and their record of compliance; |
| | • | | Information concerning the business continuity and disaster recovery plans of the Advisers and their affiliates, including the Affiliated Sub-Advisers; |
| | • | | A description of the Advisers’ oversight of the Sub-Advisers, including with respect to regulatory and compliance issues, investment management and other matters; |
Other Relevant Information
| | • | | Information concerning the nature, cost and character of the administrative and other non-investment advisory services provided by the Advisers and their affiliates; |
| | • | | Information concerning oversight of the relationship with the custodian, subcustodians and fund accountants by EVM and/or administrator to each of the Funds; |
| | • | | Confirmation that the Advisers intend to continue to manage the Funds in a manner materially consistent with each Fund’s current investment objective(s) and principal investment strategies; |
| | • | | Information regarding Morgan Stanley’s commitment to maintaining competitive compensation arrangements to attract and retain highly qualified personnel; |
| | • | | Confirmation that the Advisers’ current senior management teams have indicated their strong support of the Transaction; and |
| | • | | Information regarding the fact that Morgan Stanley and Eaton Vance Corp. will each derive benefits from the Transaction and that, as a result, they have a financial interest in the matters that were being considered. |
As indicated above, the Board and its Contract Review Committee also considered information received at its regularly scheduled meetings throughout the year, which included information from portfolio managers and other investment professionals of the Advisers and the Sub-Advisers regarding investment and performance matters, and considered various investment and trading strategies used in pursuing the Funds’ investment objectives. The Board also received information regarding risk management techniques employed in connection with the management of the Funds. The Board and its committees evaluated issues pertaining to industry and regulatory developments, compliance procedures, fund governance and other issues with respect to the Funds, and received and participated in reports and presentations provided by the Advisers and their affiliates, including the Affiliated Sub-Advisers, with respect to such matters.
The Contract Review Committee was advised throughout the evaluation process by Goodwin Procter LLP, independent legal counsel for the Independent Trustees. The members of the Contract Review Committee, with the advice of such counsel, exercised their own business judgment in determining the material factors to be considered in evaluating the New Agreements and the weight to be given to each such factor. The conclusions reached with respect to the New Agreements were based on a comprehensive evaluation of all the information provided and not any single factor. Moreover, each Independent Trustee may have placed varying emphasis on particular factors in reaching conclusions with respect to the New Agreements.
Nature, Extent and Quality of Services
In considering whether to approve the New Agreements, the Board evaluated the nature, extent and quality of services currently provided to each Fund by the Advisers and, as applicable, the Sub-Advisers under the Current Agreements. In evaluating the nature, extent and quality of services to be provided by the Advisers and the Sub-Advisers under the New Agreements, the Board considered, among other information, the expected impact, if any, of the Transaction on the operations, facilities, organization and personnel of the Advisers and the Sub-Advisers, and that Morgan Stanley and the Advisers have advised the Board that, following the Transaction, there is not expected to be any diminution in the nature, extent and quality of services provided by the Advisers and the Sub-Advisers, as applicable, to the Funds and their shareholders, including compliance and other non-advisory services, and that there are not expected to be any changes in portfolio management personnel as a result of the Transaction.
Eaton Vance
Emerging Markets Debt Fund
January 31, 2021
Board of Trustees’ Contract Approval — continued
The Board also considered the financial resources of Morgan Stanley and the Advisers and the importance of having a Fund manager with, or with access to, significant organizational and financial resources. The Board considered the benefits to the Funds of being part of a larger combined organization with greater financial resources following the Transaction, particularly during periods of market disruptions and volatility. In this regard, the Board considered information provided by Morgan Stanley regarding its business and operating structure, scale of operation, leadership and reputation, distribution capabilities, and financial condition, as well as information on how the Funds are expected to fit within Morgan Stanley’s overall business strategy and any changes that Morgan Stanley contemplates in the short- or long-term following the Closing. The Board also noted Morgan Stanley’s and the Advisers’ commitment to keep the Board apprised of developments with respect to its long-term integration plans for the Advisers, the Affiliated Sub-Advisers, and existing Morgan Stanley affiliates and their respective personnel.
The Board considered the Advisers’ and the Sub-Advisers’ management capabilities and investment processes in light of the types of investments held by each Fund, including the education, experience and number of investment professionals and other personnel who provide portfolio management, investment research, and similar services to each Fund. In particular, the Board considered the abilities and experience of the Advisers’ and, as applicable, the Sub-Advisers’ investment professionals in implementing each Fund’s investment strategies. The Board also took into account the resources dedicated to portfolio management and other services, the compensation methods of the Advisers and other factors, including the reputation and resources of the Advisers to recruit and retain highly qualified research, advisory and supervisory investment professionals. With respect to the recruitment and retention of key personnel, the Board noted information from Morgan Stanley and the Advisers regarding the benefits of joining Morgan Stanley. In addition, the Board considered the time and attention devoted to the Funds by senior management, as well as the infrastructure, operational capabilities and support staff in place to assist in the portfolio management and operations of the Funds, including the provision of administrative services. With respect to the foregoing, the Board also considered information from the Advisers and Morgan Stanley regarding the anticipated impact of the Transaction on such matters. The Board also considered the business-related and other risks to which the Advisers or their affiliates may be subject in managing the Funds and in connection with the Transaction.
The Board considered the compliance programs of the Advisers and relevant affiliates thereof, including the Affiliated Sub-Advisers. The Board considered compliance and reporting matters regarding, among other things, personal trading by investment professionals, disclosure of portfolio holdings, late trading, frequent trading, portfolio valuation, business continuity and the allocation of investment opportunities. The Board also considered the responses of the Advisers and their affiliates to requests in recent years from regulatory authorities, such as the Securities and Exchange Commission and the Financial Industry Regulatory Authority. The Board also considered certain information relating to the compliance record of Morgan Stanley and its affiliates, including information requests in recent years from regulatory authorities. With respect to the foregoing, including the compliance programs of the Advisers and the Sub-Advisers, the Board noted information regarding the impacts of the Transaction, as well as the Advisers’ and Morgan Stanley’s commitment to keep the Board apprised of developments with respect to its long-term integration plans for the Advisers, the Affiliated Sub-Advisers and existing Morgan Stanley affiliates and their respective personnel.
The Board considered other administrative services provided and to be provided or overseen by the Advisers and their affiliates, including transfer agency and accounting services. The Board evaluated the benefits to shareholders of investing in a fund that is a part of a large fund complex offering exposure to a variety of asset classes and investment disciplines, as well as the ability, in many cases, to exchange an investment among different funds without incurring additional sales charges. The Board noted information that the Transaction was not expected to have any material impact on such matters in the near-term.
In evaluating the nature, extent and quality of the services to be provided under the New Agreements, the Board also considered investment performance information provided for each Fund in connection with the 2020 Annual Approval Process, as well as information provided as of a more recent date. In this regard, the Board compared each Fund’s investment performance to that of comparable funds identified by an independent data provider (the peer group), as well as appropriate benchmark indices and, for certain Funds, a custom peer group of similarly managed funds. The Board also considered, where applicable, Fund-specific performance explanations based on criteria established by the Board in connection with the 2020 Annual Approval Process and, where applicable, performance explanations as of a more recent date. In addition to the foregoing information, it was also noted that the Board has received and discussed with management information throughout the year at periodic intervals comparing each Fund’s performance against applicable benchmark indices and peer groups. In addition, the Board considered each Fund’s performance in light of overall financial market conditions. Where a Fund’s relative underperformance to its peers was significant during one or more specified periods, the Board noted the explanation from the applicable Adviser concerning the Fund’s relative performance versus its peer group.
After consideration of the foregoing factors, among others, and based on their review of the materials provided and the assurances received from, and recommendations of, the Advisers and Morgan Stanley, the Board determined that the Transaction was not expected to adversely affect the nature, extent and quality of services provided to the Funds by the Advisers and their affiliates, including the Affiliated Sub-Advisers, and that the Transaction was not expected to have an adverse effect on the ability of the Advisers and their affiliates, including the Affiliated Sub-Advisers, to provide those services. The
Board concluded that the nature, extent and quality of services expected to be provided by the Advisers and the Sub-Advisers, taken as a whole, are appropriate and expected to be consistent with the terms of the New Agreements.
Management Fees and Expenses
The Board considered contractual fee rates payable by each Fund for advisory and administrative services (referred to collectively as “management fees”) in connection with the 2020 Annual Approval Process, as well as information provided as of a more recent date. As part of its review, the Board considered
Eaton Vance
Emerging Markets Debt Fund
January 31, 2021
Board of Trustees’ Contract Approval — continued
each Fund’s management fees and total expense ratio over various periods, as compared to those of comparable funds, before and after giving effect to any undertaking to waive fees or reimburse expenses. The Board also considered factors, and, where applicable, certain Fund-specific factors, that had an impact on a Fund’s total expense ratio relative to comparable funds, as identified by the Advisers in response to inquiries from the Contract Review Committee. The Board considered that the New Agreements do not change a Fund’s management fee rate or the computation method for calculating such fees, including any separately executed permanent contractual management fee reduction currently in place for the Fund.
The Board also received and considered, where applicable, information about the services offered and the fee rates charged by the Advisers and the Sub-Advisers to other types of accounts with investment objectives and strategies that are substantially similar to and/or managed in a similar investment style as a Fund. In this regard, the Board received information about the differences in the nature and scope of services the Advisers and the Sub-Advisers, as applicable, provide to the Funds as compared to other types of accounts and the material differences in compliance, reporting and other legal burdens and risks to the Advisers and such Sub-Advisers as between each Fund and other types of accounts.
After considering the foregoing information, and in light of the nature, extent and quality of the services expected to be provided by the Advisers and the Sub-Advisers, the Board concluded that the management fees charged for advisory and related services are reasonable with respect to its approval of the New Agreements.
Profitability and “Fall-Out” Benefits
During the 2020 Annual Approval Process, the Board considered the level of profits realized by the Advisers and relevant affiliates thereof, including the Affiliated Sub-Advisers, in providing investment advisory and administrative services to the Funds and to all Eaton Vance funds as a group. The Board considered the level of profits realized without regard to marketing support or other payments by the Advisers and their affiliates to third parties in respect of distribution or other services. In light of the foregoing factors and the nature, extent and quality of the services rendered, the profits realized by the Advisers and their affiliates, including the Sub-Advisers, were not deemed to be excessive by the Board.
The Board noted that Morgan Stanley and the Advisers are expected to realize, over time, cost savings from the Transaction based on eliminating duplicate corporate overhead expenses. The Board considered, however, information from the Advisers and Morgan Stanley that such cost savings are not expected to be realized immediately upon the Closing and that, accordingly, there are currently no specific expected changes in the levels of profitability associated with the advisory and other services provided to the Funds that are contemplated as a result of the Transaction. The Board noted that it will continue to receive information regarding profitability during its annual contract review processes, including the extent to which cost savings and/or other efficiencies result in changes to profitability levels.
The Board also considered direct or indirect fall-out benefits received by the Advisers and their affiliates, including the Affiliated Sub-Advisers, in connection with their respective relationships with the Funds, including the benefits of research services that may be available to the Advisers and their affiliates as a result of securities transactions effected for the Funds and other investment advisory clients. In evaluating the fall-out benefits to be received by the Advisers and their affiliates under the New Agreements, the Board considered whether the Transaction would have an impact on the fall-out benefits currently realized by the Advisers and their affiliates in connection with services provided pursuant to the Current Advisory Agreements.
The Board of each Fund considered that Morgan Stanley may derive reputational and other benefits from its ability to use the names of the Advisers and their affiliates in connection with operating and marketing the Funds. The Board considered that the Transaction, if completed, would significantly increase Morgan Stanley’s assets under management and expand Morgan Stanley’s investment capabilities.
Economies of Scale
The Board also considered the extent to which the Advisers and their affiliates, on the one hand, and the Funds, on the other hand, can expect to realize benefits from economies of scale as the assets of the Funds increase. The Board acknowledged the difficulty in accurately measuring the benefits resulting from economies of scale, if any, with respect to the management of any specific Fund or group of funds. As part of the 2020 Annual Approval Process, the Board reviewed data summarizing the increases and decreases in the assets of the Funds and of all Eaton Vance funds as a group over various time periods, and evaluated the extent to which the total expense ratio of each Fund and the profitability of the Advisers and their affiliates may have been affected by such increases or decreases.
The Board noted that Morgan Stanley and the Advisers are expected to benefit from possible growth of the Funds resulting from enhanced distribution capabilities, including with respect to the Funds’ potential access to Morgan Stanley’s institutional client base. Based upon the foregoing, the Board concluded that the Funds currently share in the benefits from economies of scale, if any, when they are realized by the Advisers, and that the Transaction is not expected to impede a Fund from continuing to benefit from any future economies of scale realized by its Adviser.
Conclusion
Based on its consideration of the foregoing, and such other information it deemed relevant, including the factors and conclusions described above, the Contract Review Committee recommended to the Board approval of the New Agreements. Based on the recommendation of the Contract Review Committee, the Board, including a majority of the Independent Trustees, unanimously voted to approve the New Agreements for the Funds and recommended that shareholders approve the New Agreements.
Eaton Vance
Emerging Markets Debt Fund
January 31, 2021
Management and Organization
Fund Management. The Trustees of Eaton Vance Mutual Funds Trust (the Trust) are responsible for the overall management and supervision of the Trust’s affairs. The Trustees and officers of the Trust are listed below. Except as indicated, each individual has held the office shown or other offices in the same company for the last five years. Trustees and officers of the Trust hold indefinite terms of office. The “noninterested Trustees” consist of those Trustees who are not “interested persons” of the Trust, as that term is defined under the 1940 Act. The business address of each Trustee and officer is Two International Place, Boston, Massachusetts 02110. As used below, “EVC” refers to Eaton Vance Corp., “EV” refers to EV LLC, “EVM” refers to Eaton Vance Management, “BMR” refers to Boston Management and Research and “EVD” refers to Eaton Vance Distributors, Inc. EV is the trustee of each of EVM and BMR. Effective March 1, 2021, each of EVM, BMR, EVD and EV are indirect wholly-owned subsidiaries of Morgan Stanley. Each officer affiliated with EVM may hold a position with other EVM affiliates that is comparable to his or her position with EVM listed below. Each Trustee oversees 139 portfolios (with the exception of Messrs. Faust and Wennerholm and Ms. Frost who oversee 138 portfolios) in the Eaton Vance Complex (including all master and feeder funds in a master feeder structure). Each officer serves as an officer of certain other Eaton Vance funds. Each Trustee and officer serves until his or her successor is elected.
| | | | | | |
| Name and Year of Birth | | Position(s)
with the
Trust | | Trustee
Since(1) | | Principal Occupation(s) and Directorships
During Past Five Years and Other Relevant Experience |
|
| Interested Trustee |
| | | |
Thomas E. Faust Jr. 1958 | | Trustee | | 2007 | | Chairman of Morgan Stanley Investment Management, Inc. (MSIM), Manager and President of EV, Chief Executive Officer of EVM and BMR, and Director of EVD. Formerly, Chairman, Chief Executive Officer and President of EVC. Trustee and/or officer of 138 registered investment companies. Mr. Faust is an interested person because of his positions with MSIM, BMR, EVM, EVD, and EV, which are affiliates of the Trust, and his former position with EVC, which was an affiliate of the Trust prior to March 1, 2021. Directorships in the Last Five Years. Formerly, Director of EVC (2007-2021) and Hexavest Inc. (2012-2021) (investment management firm). |
|
| Noninterested Trustees |
| | | |
Mark R. Fetting 1954 | | Trustee | | 2016 | | Private investor. Formerly held various positions at Legg Mason, Inc. (investment management firm) (2000-2012), including President, Chief Executive Officer, Director and Chairman (2008-2012), Senior Executive Vice President (2004-2008) and Executive Vice President (2001-2004). Formerly, President of Legg Mason family of funds (2001-2008). Formerly, Division President and Senior Officer of Prudential Financial Group, Inc. and related companies (investment management firm) (1991-2000). Other Directorships in the Last Five Years. None. |
| | | |
Cynthia E. Frost 1961 | | Trustee | | 2014 | | Private investor. Formerly, Chief Investment Officer of Brown University (university endowment) (2000-2012). Formerly, Portfolio Strategist for Duke Management Company (university endowment manager) (1995-2000). Formerly, Managing Director, Cambridge Associates (investment consulting company) (1989-1995). Formerly, Consultant, Bain and Company (management consulting firm) (1987-1989). Formerly, Senior Equity Analyst, BA Investment Management Company (1983-1985). Other Directorships in the Last Five Years. None. |
| | | |
George J. Gorman 1952 | | Vice-Chairperson of the Board and Trustee | | 2021 (Vice-Chairperson) 2014 (Trustee) | | Principal at George J. Gorman LLC (consulting firm). Formerly, Senior Partner at Ernst & Young LLP (a registered public accounting firm) (1974-2009). Other Directorships in the Last Five Years. None. |
| | | |
Valerie A. Mosley 1960 | | Trustee | | 2014 | | Chairwoman and Chief Executive Officer of Valmo Ventures (a consulting and investment firm). Founder of Upward Wealth, Inc., dba BrightUP, a fintech platform. Formerly, Partner and Senior Vice President, Portfolio Manager and Investment Strategist at Wellington Management Company, LLP (investment management firm) (1992-2012). Formerly, Chief Investment Officer, PG Corbin Asset Management (1990-1992). Formerly worked in institutional corporate bond sales at Kidder Peabody (1986-1990). Other Directorships in the Last Five Years. Director of DraftKings, Inc. (digital sports entertainment and gaming company) (since September 2020). Director of Groupon, Inc. (e-commerce provider) (since April 2020). Director of Envestnet, Inc. (provider of intelligent systems for wealth management and financial wellness) (since 2018). Formerly, Director of Dynex Capital, Inc. (mortgage REIT) (2013-2020). |
Eaton Vance
Emerging Markets Debt Fund
January 31, 2021
Management and Organization — continued
| | | | | | |
| Name and Year of Birth | | Position(s)
with the
Trust | | Trustee
Since(1) | | Principal Occupation(s) and Directorships
During Past Five Years and Other Relevant Experience |
|
| Noninterested Trustees (continued) |
| | | |
William H. Park 1947 | | Chairperson of the Board and Trustee | | 2016 (Chairperson) 2003 (Trustee) | | Private investor. Formerly, Consultant (management and transactional) (2012-2014). Formerly, Chief Financial Officer, Aveon Group L.P. (investment management firm) (2010-2011). Formerly, Vice Chairman, Commercial Industrial Finance Corp. (specialty finance company) (2006-2010). Formerly, President and Chief Executive Officer, Prizm Capital Management, LLC (investment management firm) (2002-2005). Formerly, Executive Vice President and Chief Financial Officer, United Asset Management Corporation (investment management firm) (1982-2001). Formerly, Senior Manager, Price Waterhouse (now PricewaterhouseCoopers) (a registered public accounting firm) (1972-1981). Other Directorships in the Last Five Years. None. |
| | | |
Helen Frame Peters 1948 | | Trustee | | 2008 | | Professor of Finance, Carroll School of Management, Boston College. Formerly, Dean, Carroll School of Management, Boston College (2000-2002). Formerly, Chief Investment Officer, Fixed Income, Scudder Kemper Investments (investment management firm) (1998-1999). Formerly, Chief Investment Officer, Equity and Fixed Income, Colonial Management Associates (investment management firm) (1991-1998). Other Directorships in the Last Five Years. None. |
| | | |
Keith Quinton 1958 | | Trustee | | 2018 | | Private investor, researcher and lecturer. Independent Investment Committee Member at New Hampshire Retirement System (since 2017). Formerly, Portfolio Manager and Senior Quantitative Analyst at Fidelity Investments (investment management firm) (2001-2014). Other Directorships in the Last Five Years. Director (since 2016) and Chairman (since 2019) of New Hampshire Municipal Bond Bank. |
| | | |
Marcus L. Smith 1966 | | Trustee | | 2018 | | Private investor. Member of Posse Boston Advisory Board (foundation) (since 2015). Formerly, Portfolio Manager at MFS Investment Management (investment management firm) (1994-2017). Other Directorships in the Last Five Years. Director of First Industrial Realty Trust, Inc. (an industrial REIT) (since 2021). Director of MSCI Inc. (global provider of investment decision support tools) (since 2017). Formerly, Director of DCT Industrial Trust Inc. (logistics real estate company) (2017-2018). |
| | | |
Susan J. Sutherland 1957 | | Trustee | | 2015 | | Private investor. Director of Ascot Group Limited and certain of its subsidiaries (insurance and reinsurance) (since 2017). Formerly, Director of Hagerty Holding Corp. (insurance and reinsurance) (2015-2018). Formerly, Associate, Counsel and Partner at Skadden, Arps, Slate, Meagher & Flom LLP (law firm) (1982-2013). Other Directorships in the Last Five Years. Director of Kairos Acquisition Corp. (insurance/InsurTech acquisition company) (since 2021). |
| | | |
Scott E. Wennerholm 1959 | | Trustee | | 2016 | | Private investor. Formerly, Trustee at Wheelock College (postsecondary institution) (2012-2018). Formerly, Consultant at GF Parish Group (executive recruiting firm) (2016-2017). Formerly, Chief Operating Officer and Executive Vice President at BNY Mellon Asset Management (investment management firm) (2005-2011). Formerly, Chief Operating Officer and Chief Financial Officer at Natixis Global Asset Management (investment management firm) (1997-2004). Formerly, Vice President at Fidelity Investments Institutional Services (investment management firm) (1994-1997). Other Directorships in the Last Five Years. None. |
| | | | | | |
| Name and Year of Birth | | Position(s) with the Trust | | Officer
Since(2) | | Principal Occupation(s) During Past Five Years |
|
| Principal Officers who are not Trustees |
| | | |
Eric A. Stein 1980 | | President | | 2020 | | Vice President and Chief Investment Officer, Fixed Income of EVM and BMR. Prior to November 1, 2020, Mr. Stein was a co-Director of Eaton Vance’s Global Income Investments. Also Vice President of Calvert Research and Management (“CRM”). |
| | | |
Deidre E. Walsh 1971 | | Vice President | | 2009 | | Vice President of EVM and BMR. |
Eaton Vance
Emerging Markets Debt Fund
January 31, 2021
Management and Organization — continued
| | | | | | |
| Name and Year of Birth | | Position(s) with the Trust | | Officer
Since(2) | | Principal Occupation(s) During Past Five Years |
|
| Principal Officers who are not Trustees (continued) |
| | | |
Maureen A. Gemma 1960 | | Secretary and Chief Legal Officer | | 2005 | | Vice President of EVM and BMR. Also Vice President of CRM. |
| | | |
James F. Kirchner 1967 | | Treasurer | | 2007 | | Vice President of EVM and BMR. Also Vice President of CRM. |
| | | |
Richard F. Froio 1968 | | Chief Compliance Officer | | 2017 | | Vice President of EVM and BMR since 2017. Formerly, Deputy Chief Compliance Officer (Adviser/Funds) and Chief Compliance Officer (Distribution) at PIMCO (2012-2017) and Managing Director at BlackRock/Barclays Global Investors (2009-2012). |
| (1) | Year first appointed to serve as Trustee for a fund in the Eaton Vance family of funds. Each Trustee has served continuously since appointment unless indicated otherwise. |
| (2) | Year first elected to serve as officer of a fund in the Eaton Vance family of funds when the officer has served continuously. Otherwise, year of most recent election as an officer of a fund in the Eaton Vance family of funds. Titles may have changed since initial election. |
The SAI for the Fund includes additional information about the Trustees and officers of the Fund and can be obtained without charge on Eaton Vance’s website at www.eatonvance.com or by calling 1-800-262-1122.
Eaton Vance Funds
IMPORTANT NOTICES
Privacy. The Eaton Vance organization is committed to ensuring your financial privacy. Each entity listed below has adopted privacy policy and procedures (“Privacy Program”) Eaton Vance believes is reasonably designed to protect your personal information and to govern when and with whom Eaton Vance may share your personal information.
| • | | At the time of opening an account, Eaton Vance generally requires you to provide us with certain information such as name, address, social security number, tax status, account numbers, and account balances. This information is necessary for us to both open an account for you and to allow us to satisfy legal requirements such as applicable anti-money laundering reviews and know-your-customer requirements. |
| • | | On an ongoing basis, in the normal course of servicing your account, Eaton Vance may share your information with unaffiliated third parties that perform various services for Eaton Vance and/or your account. These third parties include transfer agents, custodians, broker/dealers and our professional advisers including auditors, accountants, and legal counsel. Eaton Vance may share your personal information with our affiliates. Eaton Vance may also share your information as required or permitted by applicable law. |
| • | | We have adopted a Privacy Program we believe is reasonably designed to protect the confidentiality of your personal information and to prevent unauthorized access to your information. |
| • | | We reserve the right to change our Privacy Program at any time upon proper notification to you. You may want to review our Privacy Program periodically for changes by accessing the link on our homepage: www.eatonvance.com. |
Our pledge of protecting your personal information applies to the following entities within the Eaton Vance organization: the Eaton Vance Family of Funds, Eaton Vance Management, Eaton Vance WaterOak Advisors, Eaton Vance Distributors, Inc., Eaton Vance Trust Company, Eaton Vance Management (International) Limited, Eaton Vance Advisers International Ltd., Eaton Vance Global Advisors Limited, Eaton Vance Management’s Real Estate Investment Group, Boston Management and Research, Calvert Research and Management, and Calvert Funds. This notice supersedes all previously issued privacy disclosures. For more information about Eaton Vance’s Privacy Program or about how your personal information may be used, please call 1-800-262-1122.
Delivery of Shareholder Documents. The Securities and Exchange Commission (SEC) permits funds to deliver only one copy of shareholder documents, including prospectuses, proxy statements and shareholder reports, to fund investors with multiple accounts at the same residential or post office box address. This practice is often called “householding” and it helps eliminate duplicate mailings to shareholders. Eaton Vance, or your financial intermediary, may household the mailing of your documents indefinitely unless you instruct Eaton Vance, or your financial intermediary, otherwise. If you would prefer that your Eaton Vance documents not be householded, please contact Eaton Vance at 1-800-262-1122, or contact your financial intermediary. Your instructions that householding not apply to delivery of your Eaton Vance documents will typically be effective within 30 days of receipt by Eaton Vance or your financial intermediary.
Portfolio Holdings. Each Eaton Vance Fund and its underlying Portfolio(s) (if applicable) files a schedule of portfolio holdings on Part F to Form N-PORT with the SEC. Certain information filed on Form N-PORT may be viewed on the Eaton Vance website at www.eatonvance.com, by calling Eaton Vance at 1-800-262-1122 or in the EDGAR database on the SEC’s website at www.sec.gov.
Proxy Voting. From time to time, funds are required to vote proxies related to the securities held by the funds. The Eaton Vance Funds or their underlying Portfolios (if applicable) vote proxies according to a set of policies and procedures approved by the Funds’ and Portfolios’ Boards. You may obtain a description of these policies and procedures and information on how the Funds or Portfolios voted proxies relating to portfolio securities during the most recent 12-month period ended June 30, without charge, upon request, by calling 1-800-262-1122 and by accessing the SEC’s website at www.sec.gov.
Investment Adviser and Administrator
Eaton Vance Management
Two International Place
Boston, MA 02110
Principal Underwriter*
Eaton Vance Distributors, Inc.
Two International Place
Boston, MA 02110
(617) 482-8260
Custodian
State Street Bank and Trust Company
State Street Financial Center, One Lincoln Street
Boston, MA 02111
Transfer Agent
BNY Mellon Investment Servicing (US) Inc.
Attn: Eaton Vance Funds
P.O. Box 9653
Providence, RI 02940-9653
(800) 262-1122
Independent Registered Public Accounting Firm
Deloitte & Touche LLP
200 Berkeley Street
Boston, MA 02116-5022
Fund Offices
Two International Place
Boston, MA 02110
| * | FINRA BrokerCheck. Investors may check the background of their Investment Professional by contacting the Financial Industry Regulatory Authority (FINRA). FINRA BrokerCheck is a free tool to help investors check the professional background of current and former FINRA-registered securities firms and brokers. FINRA BrokerCheck is available by calling 1-800-289-9999 and at www.FINRA.org. The FINRA BrokerCheck brochure describing this program is available to investors at www.FINRA.org. |

29948 1.31.21

Parametric
Emerging Markets Fund
Annual Report
January 31, 2021

Commodity Futures Trading Commission Registration. The Commodity Futures Trading Commission (“CFTC”) has adopted regulations that subject registered investment companies and advisers to regulation by the CFTC if a fund invests more than a prescribed level of its assets in certain CFTC-regulated instruments (including futures, certain options and swap agreements) or markets itself as providing investment exposure to such instruments. The investment adviser has claimed an exclusion from the definition of “commodity pool operator” under the Commodity Exchange Act with respect to its management of the Fund. Accordingly, neither the Fund nor the adviser with respect to the operation of the Fund is subject to CFTC regulation. Because of its management of other strategies, the Fund’s adviser and Parametric Portfolio Associates LLC (Parametric), sub-adviser to the Fund, are registered with the CFTC as commodity pool operators. The adviser and Parametric are also registered as commodity trading advisors.
Fund shares are not insured by the FDIC and are not deposits or other obligations of, or guaranteed by, any depository institution. Shares are subject to investment risks, including possible loss of principal invested.
This report must be preceded or accompanied by a current summary prospectus or prospectus. Before investing, investors should consider carefully the investment objective, risks, and charges and expenses of a mutual fund. This and other important information is contained in the summary prospectus and prospectus, which can be obtained from a financial intermediary. Prospective investors should read the prospectus carefully before investing. For further information, please call 1-800-260-0761.
Annual Report January 31, 2021
Parametric
Emerging Markets Fund
Parametric
Emerging Markets Fund
January 31, 2021
Management’s Discussion of Fund Performance1
Economic and Market Conditions
Emerging market equities experienced two starkly different performance regimes over 2020. Panicked selling in response to coronavirus fears eventually gave way to optimism that 2021 and beyond would bring a vaccine and a boost to the corporate bottom line. This optimism drove overall markets into positive territory with the MSCI Emerging Markets Index (the Index) ending the 12-month period ended January 31, 2021 up 27.89%.
Looking beyond the aggregate reveals some key trends. From a country perspective, the three largest countries in the Index (China, Taiwan, and Korea) significantly outperformed all of the remaining 24 countries. Smaller countries generally trailed, and in some cases by a significant margin. Many of the energy-producing markets including Russia, Colombia, and Brazil experienced significant declines as oil and many other commodities were hit hard by excess supply and falling demand. In addition, frontier markets experienced broad weakness because many were far less resourced to manage the pandemic.
Fund Performance
For the 12-month period ended January 31, 2021, Parametric Emerging Markets Fund (the Fund) had a total return of 7.23% for Investor Class shares at net asset value, underperforming the Fund’s benchmark, the Index, which had a total return of 27.89% for the same period.
The Fund’s emphasis on diversification via a system of target country weights and systematic rebalancing back to these target weights detracted from relative performance during the period. The diversification targets consistently have the Fund underweight larger countries and overweight smaller countries. The Fund’s emphasis on diversification at the sector level within each country contributed to returns relative to the Index. Finally, frontier countries included in the Fund, but not in the Index, detracted from relative performance, as the Fund held overweight positions to the frontier market countries that underperformed the Index.
An underweight to China detracted from performance relative to the Index, as did the sector diversification process which led to an underweight to consumer discretionary stocks within the country. China’s market proved remarkably resilient to coronavirus fears throughout the year and was supported by strong gains from many of its discretionary names as consumers adjusted to a more digitalized economy. An underweight to Taiwan also harmed relative results, as U.S. dollar returns were supported by a large gain from the country’s dominant technology sector and a rally in the Taiwanese dollar. Furthermore, an underweight to Korea detracted from relative performance as local equities and the Korean won were boosted by a targeted monetary and fiscal response to the pandemic and a robust rebound in export demand, particularly in the technology sector.
The sector diversification process within Thailand benefited results relative to the Index. This was particularly due to an overweight to the information technology sector which benefited from a triple-digit gain from its sole constituent. An underweight to India also enhanced relative returns, as Indian equity markets lagged the broader Index over concerns
that the country’s fragile health care system would become overwhelmed due to Covid-19. In addition, an underweight to Brazil contributed to relative performance, as a modest gain from local stocks was more than wiped out by a sharp drop in the Brazilian real versus the U.S. dollar.
See Endnotes and Additional Disclosures in this report.
Past performance is no guarantee of future results. Returns are historical and are calculated by determining the percentage change in net asset value (NAV) or offering price (as applicable) with all distributions reinvested. Investment return and principal value will fluctuate so that shares, when redeemed, may be worth more or less than their original cost. Performance for periods less than or equal to one year is cumulative. Performance is for the stated time period only; due to market volatility, current Fund performance may be lower or higher than the quoted return. For performance as of the most recent month-end, please refer to eatonvance.com.
Parametric
Emerging Markets Fund
January 31, 2021
Performance2,3
Portfolio Managers Thomas C. Seto, Paul Bouchey, CFA and Jennifer Sireklove, CFA, each of Parametric Portfolio Associates LLC
| | | | | | | | | | | | | | | | | | | | |
| % Average Annual Total Returns | | Class Inception Date | | | Performance Inception Date | | | One Year | | | Five Years | | | Ten Years | |
| | | | | |
Investor Class at NAV | | | 06/30/2006 | | | | 06/30/2006 | | | | 7.23 | % | | | 8.06 | % | | | 1.14 | % |
Class C at NAV | | | 06/30/2006 | | | | 06/30/2006 | | | | 6.42 | | | | 7.25 | | | | 0.38 | |
Class C with 1% Maximum Sales Charge | | | — | | | | — | | | | 5.42 | | | | 7.25 | | | | 0.38 | |
Institutional Class at NAV | | | 06/30/2006 | | | | 06/30/2006 | | | | 7.50 | | | | 8.32 | | | | 1.40 | |
Class R6 at NAV | | | 07/01/2014 | | | | 06/30/2006 | | | | 7.45 | | | | 8.36 | | | | 1.43 | |
|
| |
| | | | | |
MSCI Emerging Markets Index | | | — | | | | — | | | | 27.89 | % | | | 15.01 | % | | | 4.22 | % |
| | | | | |
| % Total Annual Operating Expense Ratios4 | | | | | Investor Class | | | Class C | | | Institutional Class | | | Class R6 | |
| | | | | |
| | | | | | | 1.45 | % | | | 2.20 | % | | | 1.20 | % | | | 1.14 | % |
Growth of $10,000
This graph shows the change in value of a hypothetical investment of $10,000 in Investor Class of the Fund for the period indicated. For comparison, the same investment is shown in the indicated index.
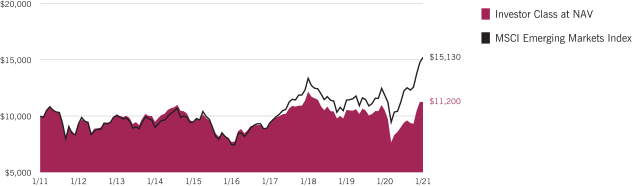
| | | | | | | | | | | | | | | | |
| Growth of Investment3 | | Amount Invested | | | Period Beginning | | | At NAV | | | With Maximum Sales Charge | |
| | | | |
Class C | | | $10,000 | | | | 01/31/2011 | | | | $10,390 | | | | N.A. | |
Institutional Class | | | $50,000 | | | | 01/31/2011 | | | | $57,440 | | | | N.A. | |
| | | | |
Class R6 | | | $1,000,000 | | | | 01/31/2011 | | | | $1,152,416 | | | | N.A. | |
See Endnotes and Additional Disclosures in this report.
Past performance is no guarantee of future results. Returns are historical and are calculated by determining the percentage change in net asset value (NAV) or offering price (as applicable) with all distributions reinvested. Investment return and principal value will fluctuate so that shares, when redeemed, may be worth more or less than their original cost. Performance for periods less than or equal to one year is cumulative. Performance is for the stated time period only; due to market volatility, current Fund performance may be lower or higher than the quoted return. For performance as of the most recent month-end, please refer to eatonvance.com.
Parametric
Emerging Markets Fund
January 31, 2021
Fund Profile
Sector Allocation (% of net assets)5
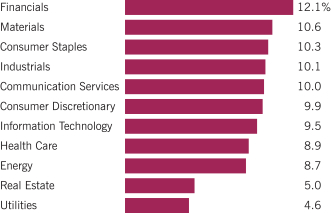
Geographic Allocation (% of common stocks)
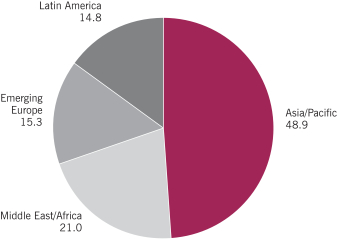
Top 10 Holdings (% of net assets)5
| | | | |
Tencent Holdings, Ltd. | | | 1.4 | % |
| |
Samsung Electronics Co., Ltd. | | | 0.9 | |
| |
Taiwan Semiconductor Manufacturing Co., Ltd. | | | 0.8 | |
| |
Naspers, Ltd., Class N | | | 0.8 | |
| |
Alibaba Group Holding, Ltd. ADR | | | 0.8 | |
| |
Delta Electronics (Thailand) PCL | | | 0.7 | |
| |
Saudi Arabian Oil Co. | | | 0.6 | |
| |
America Movil SAB de CV, Series L | | | 0.6 | |
| |
Yandex NV, Class A | | | 0.6 | |
| |
MercadoLibre, Inc. | | | 0.5 | |
| |
Total | | | 7.7 | % |
See Endnotes and Additional Disclosures in this report.
Parametric
Emerging Markets Fund
January 31, 2021
Endnotes and Additional Disclosures
| 1 | The views expressed in this report are those of the portfolio manager(s) and are current only through the date stated at the top of this page. These views are subject to change at any time based upon market or other conditions, and Eaton Vance and the Fund(s) disclaim any responsibility to update such views. These views may not be relied upon as investment advice and, because investment decisions are based on many factors, may not be relied upon as an indication of trading intent on behalf of any Eaton Vance fund. This commentary may contain statements that are not historical facts, referred to as “forward-looking statements.” The Fund’s actual future results may differ significantly from those stated in any forward-looking statement, depending on factors such as changes in securities or financial markets or general economic conditions, the volume of sales and purchases of Fund shares, the continuation of investment advisory, administrative and service contracts, and other risks discussed from time to time in the Fund’s filings with the Securities and Exchange Commission. |
| 2 | MSCI Emerging Markets Index is an unmanaged index of emerging markets common stocks. MSCI indexes are net of foreign withholding taxes. Source: MSCI. MSCI data may not be reproduced or used for any other purpose. MSCI provides no warranties, has not prepared or approved this report, and has no liability hereunder. Unless otherwise stated, index returns do not reflect the effect of any applicable sales charges, commissions, expenses, taxes or leverage, as applicable. It is not possible to invest directly in an index. |
| 3 | Total Returns at NAV do not include applicable sales charges. If sales charges were deducted, the returns would be lower. Total Returns shown with maximum sales charge reflect the stated maximum sales charge. Investor Class, Institutional Class and Class R6 shares are offered without a sales charge. Unless otherwise stated, performance does not reflect the deduction of taxes on Fund distributions or redemptions of Fund shares. |
Performance prior to the inception date of a class may be linked to the performance of an older class of the Fund. This linked performance is adjusted for any applicable sales charge, but is not adjusted for class expense differences. If adjusted for such differences, the performance would be different. The performance of Class R6 is linked to Institutional Class. Performance presented in the Financial Highlights included in the financial statements is not linked.
| 4 | Source: Fund prospectus. The expense ratios for the current reporting period can be found in the Financial Highlights section of this report. |
| 5 | Excludes cash and cash equivalents. |
Fund profile subject to change due to active management.
Additional Information
Diversification cannot ensure a profit or eliminate the risk of loss.
Parametric
Emerging Markets Fund
January 31, 2021
Fund Expenses
Example: As a Fund shareholder, you incur two types of costs: (1) transaction costs, including sales charges (loads) on purchases and redemption fees (if applicable); and (2) ongoing costs, including management fees; distribution and/or service fees; and other Fund expenses. This Example is intended to help you understand your ongoing costs (in dollars) of Fund investing and to compare these costs with the ongoing costs of investing in other mutual funds. The Example is based on an investment of $1,000 invested at the beginning of the period and held for the entire period (August 1, 2020 – January 31, 2021).
Actual Expenses: The first section of the table below provides information about actual account values and actual expenses. You may use the information in this section, together with the amount you invested, to estimate the expenses that you paid over the period. Simply divide your account value by $1,000 (for example, an $8,600 account value divided by $1,000 = 8.6), then multiply the result by the number in the first section under the heading entitled “Expenses Paid During Period” to estimate the expenses you paid on your account during this period.
Hypothetical Example for Comparison Purposes: The second section of the table below provides information about hypothetical account values and hypothetical expenses based on the actual Fund expense ratio and an assumed rate of return of 5% per year (before expenses), which is not the actual Fund return. The hypothetical account values and expenses may not be used to estimate the actual ending account balance or expenses you paid for the period. You may use this information to compare the ongoing costs of investing in your Fund and other funds. To do so, compare this 5% hypothetical example with the 5% hypothetical examples that appear in the shareholder reports of the other funds.
Please note that the expenses shown in the table are meant to highlight your ongoing costs only and do not reflect any transactional costs, such as sales charges (loads) or redemption fees (if applicable). Therefore, the second section of the table is useful in comparing ongoing costs only, and will not help you determine the relative total costs of owning different funds. In addition, if these transactional costs were included, your costs would be higher.
| | | | | | | | | | | | | | | | |
| | | Beginning
Account Value
(8/1/20) | | | Ending
Account Value
(1/31/21) | | | Expenses Paid
During Period*
(8/1/20 – 1/31/21) | | | Annualized
Expense
Ratio | |
| | | | |
Actual | | | | | | | | | | | | | | | | |
Investor Class | | $ | 1,000.00 | | | $ | 1,198.50 | | | $ | 8.29 | | | | 1.50 | % |
Class C | | $ | 1,000.00 | | | $ | 1,194.00 | | | $ | 12.30 | | | | 2.23 | % |
Institutional Class | | $ | 1,000.00 | | | $ | 1,199.20 | | | $ | 6.97 | | | | 1.26 | % |
Class R6 | | $ | 1,000.00 | | | $ | 1,199.70 | | | $ | 6.52 | | | | 1.18 | % |
| | | | | |
Hypothetical | | | | | | | | | | | | | | | | |
(5% return per year before expenses) | | | | | | | | | | | | | | | | |
Investor Class | | $ | 1,000.00 | | | $ | 1,017.60 | | | $ | 7.61 | | | | 1.50 | % |
Class C | | $ | 1,000.00 | | | $ | 1,013.90 | | | $ | 11.29 | | | | 2.23 | % |
Institutional Class | | $ | 1,000.00 | | | $ | 1,018.80 | | | $ | 6.39 | | | | 1.26 | % |
Class R6 | | $ | 1,000.00 | | | $ | 1,019.20 | | | $ | 5.99 | | | | 1.18 | % |
| * | Expenses are equal to the Fund’s annualized expense ratio for the indicated Class, multiplied by the average account value over the period, multiplied by 184/366 (to reflect the one-half year period). The Example assumes that the $1,000 was invested at the net asset value per share determined at the close of business on July 31, 2020. |
Parametric
Emerging Markets Fund
January 31, 2021
Portfolio of Investments
| | | | | | | | |
| Common Stocks — 99.7% | |
| Security | | Shares | | | Value | |
|
| Argentina — 0.6% | |
| | |
Arcos Dorados Holdings, Inc., Class A | | | 14,242 | | | $ | 70,356 | |
| | |
Grupo Financiero Galicia S.A., Class B ADR(1) | | | 3,387 | | | | 25,267 | |
| | |
MercadoLibre, Inc.(2) | | | 1,496 | | | | 2,662,147 | |
| | |
Pampa Energia S.A. ADR(1)(2) | | | 2,099 | | | | 26,468 | |
| | |
Transportadora de Gas del Sur S.A. ADR(2) | | | 11,563 | | | | 58,046 | |
| | |
YPF S.A. ADR(2) | | | 11,024 | | | | 40,238 | |
| |
| | | | $ | 2,882,522 | |
|
| Bahrain — 0.9% | |
| | |
Ahli United Bank BSC | | | 2,768,393 | | | $ | 2,044,058 | |
| | |
Al Salam Bank-Bahrain BSC | | | 5,961,324 | | | | 1,152,558 | |
| | |
GFH Financial Group BSC | | | 1,280,190 | | | | 224,610 | |
| | |
Ithmaar Holding BSC(2) | | | 14,771,027 | | | | 1,073,580 | |
| |
| | | | $ | 4,494,806 | |
|
| Bangladesh — 0.6% | |
| | |
ACI, Ltd. | | | 36,966 | | | $ | 113,126 | |
| | |
Bangladesh Export Import Co., Ltd. | | | 109,867 | | | | 109,670 | |
| | |
Beximco Pharmaceuticals, Ltd. | | | 128,063 | | | | 276,162 | |
| | |
City Bank, Ltd. (The) | | | 435,051 | | | | 157,170 | |
| | |
Grameenphone, Ltd. | | | 47,579 | | | | 211,608 | |
| | |
Heidelberger Cement Bangladesh, Ltd.(2) | | | 80,232 | | | | 154,080 | |
| | |
Islami Bank Bangladesh, Ltd. | | | 238,618 | | | | 77,720 | |
| | |
Jamuna Oil Co., Ltd. | | | 41,841 | | | | 79,730 | |
| | |
Khulna Power Co., Ltd. | | | 180,134 | | | | 96,369 | |
| | |
Meghna Petroleum, Ltd. | | | 52,773 | | | | 117,288 | |
| | |
Olympic Industries, Ltd. | | | 121,003 | | | | 261,529 | |
| | |
Padma Oil Co., Ltd. | | | 24,924 | | | | 58,642 | |
| | |
Pubali Bank, Ltd. | | | 477,334 | | | | 138,811 | |
| | |
Renata, Ltd. | | | 12,838 | | | | 177,774 | |
| | |
Social Islami Bank, Ltd. | | | 840,676 | | | | 133,779 | |
| | |
Square Pharmaceuticals, Ltd. | | | 171,709 | | | | 479,774 | |
| | |
Summit Power, Ltd. | | | 213,128 | | | | 125,301 | |
| | |
Titas Gas Transmission & Distribution Co., Ltd. | | | 278,098 | | | | 113,421 | |
| | |
Unique Hotel & Resorts, Ltd. | | | 419,519 | | | | 195,263 | |
| | |
United Commercial Bank, Ltd. | | | 881,064 | | | | 159,338 | |
| |
| | | | $ | 3,236,555 | |
|
| Botswana — 0.9% | |
| | |
Absa Bank Botswana, Ltd. | | | 644,814 | | | $ | 311,506 | |
| | |
Botswana Insurance Holdings, Ltd. | | | 706,169 | | | | 1,126,428 | |
| | |
First National Bank of Botswana, Ltd. | | | 4,416,706 | | | | 887,469 | |
| | |
Letshego Holdings, Ltd. | | | 2,275,836 | | | | 155,713 | |
| | | | | | | | |
| Security | | Shares | | | Value | |
|
| Botswana (continued) | |
| | |
Sechaba Breweries Holdings, Ltd. | | | 1,098,655 | | | $ | 2,067,941 | |
| |
| | | | $ | 4,549,057 | |
|
| Brazil — 4.7% | |
| | |
AMBEV S.A. | | | 234,450 | | | $ | 647,465 | |
| | |
B2W Cia Digital(2) | | | 21,080 | | | | 317,159 | |
| | |
B3 S.A. - Brasil Bolsa Balcao | | | 26,800 | | | | 292,912 | |
| | |
Banco Bradesco S.A., PFC Shares | | | 94,796 | | | | 428,639 | |
| | |
Banco do Brasil S.A. | | | 22,198 | | | | 137,373 | |
| | |
BB Seguridade Participacoes S.A. | | | 19,700 | | | | 99,591 | |
| | |
Bradespar S.A., PFC Shares | | | 8,800 | | | | 100,539 | |
| | |
BRF S.A.(2) | | | 63,340 | | | | 245,655 | |
| | |
CCR S.A. | | | 73,900 | | | | 163,700 | |
| | |
Centrais Eletricas Brasileiras S.A., PFC Shares | | | 33,600 | | | | 176,493 | |
| | |
Cia Brasileira de Distribuicao | | | 11,369 | | | | 156,840 | |
| | |
Cia de Saneamento Basico do Estado de Sao Paulo | | | 20,960 | | | | 156,566 | |
| | |
Cia de Saneamento de Minas Gerais-COPASA | | | 43,200 | | | | 122,461 | |
| | |
Cia de Transmissao de Energia Eletrica Paulista, PFC Shares | | | 25,460 | | | | 122,614 | |
| | |
Cia Energetica de Minas Gerais, PFC Shares | | | 58,337 | | | | 146,072 | |
| | |
Cia Energetica de Sao Paulo, Class B, PFC Shares | | | 22,100 | | | | 118,146 | |
| | |
Cia Hering | | | 68,200 | | | | 215,143 | |
| | |
Cia Paranaense de Energia, PFC Shares | | | 10,700 | | | | 127,663 | |
| | |
Cia Siderurgica Nacional S.A. | | | 19,600 | | | | 108,901 | |
| | |
Cielo S.A. | | | 566,406 | | | | 425,472 | |
| | |
Cogna Educacao(2) | | | 289,536 | | | | 239,190 | |
| | |
Cosan S.A. | | | 16,300 | | | | 223,613 | |
| | |
Cyrela Brazil Realty S.A. Empreendimentos e Participacoes | | | 63,400 | | | | 296,988 | |
| | |
Embraer S.A. ADR(1)(2) | | | 28,248 | | | | 181,352 | |
| | |
Engie Brasil Energia S.A. | | | 16,250 | | | | 127,591 | |
| | |
Equatorial Energia S.A. | | | 51,900 | | | | 213,618 | |
| | |
Ez Tec Empreendimentos e Participacoes S.A. | | | 16,227 | | | | 108,785 | |
| | |
Fleury S.A. | | | 87,400 | | | | 419,476 | |
| | |
Gerdau S.A., PFC Shares | | | 35,500 | | | | 150,853 | |
| | |
Hypera S.A. | | | 126,700 | | | | 747,732 | |
| | |
Iochpe Maxion S.A. | | | 61,000 | | | | 155,973 | |
| | |
Itau Unibanco Holding S.A., PFC Shares | | | 85,520 | | | | 442,965 | |
| | |
Itausa S.A., PFC Shares | | | 92,775 | | | | 179,907 | |
| | |
JBS S.A. | | | 68,325 | | | | 301,952 | |
| | |
Klabin S.A., PFC Shares | | | 103,800 | | | | 103,584 | |
| | |
Localiza Rent a Car S.A. | | | 42,789 | | | | 499,572 | |
| | |
Lojas Americanas S.A., PFC Shares | | | 95,341 | | | | 419,776 | |
| | |
Lojas Renner S.A. | | | 55,977 | | | | 424,273 | |
| | |
Magazine Luiza S.A. | | | 40,000 | | | | 184,742 | |
| | |
Marfrig Global Foods S.A.(2) | | | 38,855 | | | | 94,379 | |
| | |
MRV Engenharia e Participacoes S.A. | | | 45,900 | | | | 159,392 | |
| | | | |
| | 7 | | See Notes to Financial Statements. |
Parametric
Emerging Markets Fund
January 31, 2021
Portfolio of Investments — continued
| | | | | | | | |
| Security | | Shares | | | Value | |
|
| Brazil (continued) | |
| | |
Multiplan Empreendimentos Imobiliarios S.A. | | | 30,700 | | | $ | 118,953 | |
| | |
Natura & Co. Holding S.A.(2) | | | 34,100 | | | | 305,762 | |
| | |
Notre Dame Intermedica Participacoes S.A. | | | 112,100 | | | | 1,936,150 | |
| | |
Odontoprev S.A. | | | 110,900 | | | | 287,212 | |
| | |
Pagseguro Digital, Ltd., Class A(2) | | | 44,800 | | | | 2,192,960 | |
| | |
Petroleo Brasileiro S.A., PFC Shares | | | 472,200 | | | | 2,303,436 | |
| | |
Qualicorp Consultoria e Corretora de Seguros S.A. | | | 60,200 | | | | 342,293 | |
| | |
Rumo S.A.(2) | | | 133,419 | | | | 495,011 | |
| | |
StoneCo, Ltd., Class A(2) | | | 23,400 | | | | 1,682,460 | |
| | |
Suzano S.A.(2) | | | 18,720 | | | | 212,300 | |
| | |
Telefonica Brasil S.A., PFC Shares | | | 40,700 | | | | 336,228 | |
| | |
TIM S.A. | | | 136,650 | | | | 332,172 | |
| | |
Totvs S.A. | | | 210,270 | | | | 1,091,433 | |
| | |
Transmissora Alianca de Energia Electrica S.A. | | | 24,900 | | | | 146,040 | |
| | |
Ultrapar Participacoes S.A. | | | 46,968 | | | | 186,965 | |
| | |
Vale S.A. | | | 71,947 | | | | 1,156,512 | |
| | |
Weg S.A. | | | 55,452 | | | | 849,202 | |
| | |
YDUQS Participacoes S.A. | | | 24,300 | | | | 149,005 | |
| |
| | | | $ | 24,109,211 | |
|
| Bulgaria — 0.2% | |
| | |
CB First Investment Bank AD(2) | | | 235,000 | | | $ | 265,390 | |
| | |
Chimimport AD(2) | | | 329,922 | | | | 204,604 | |
| | |
MonBat AD(2) | | | 60,235 | | | | 171,811 | |
| | |
Petrol AD(2) | | | 25,625 | | | | 4,340 | |
| | |
Sopharma AD | | | 254,600 | | | | 536,440 | |
| |
| | | | $ | 1,182,585 | |
|
| Chile — 2.4% | |
| | |
Aguas Andinas S.A., Series A | | | 483,322 | | | $ | 146,695 | |
| | |
Banco de Chile | | | 6,284,563 | | | | 640,338 | |
| | |
Banco de Credito e Inversiones S.A. | | | 7,803 | | | | 327,061 | |
| | |
Banco Santander Chile | | | 9,060,612 | | | | 458,625 | |
| | |
CAP S.A. | | | 17,326 | | | | 220,422 | |
| | |
Cencosud S.A. | | | 441,352 | | | | 765,714 | |
| | |
Cia Cervecerias Unidas S.A. | | | 62,053 | | | | 508,389 | |
| | |
Cia Sud Americana de Vapores S.A.(2) | | | 10,656,196 | | | | 449,420 | |
| | |
Colbun S.A. | | | 1,345,305 | | | | 231,974 | |
| | |
Embotelladora Andina S.A., Class B, PFC Shares | | | 93,248 | | | | 236,112 | |
| | |
Empresa Nacional de Telecomunicaciones S.A. | | | 73,583 | | | | 450,700 | |
| | |
Empresas CMPC S.A. | | | 202,216 | | | | 540,723 | |
| | |
Empresas COPEC S.A. | | | 175,577 | | | | 1,843,393 | |
| | |
Enel Americas S.A. | | | 4,179,631 | | | | 628,590 | |
| | |
Enel Chile S.A.(2) | | | 4,113,329 | | | | 298,036 | |
| | |
Engie Energia Chile S.A. | | | 113,637 | | | | 135,765 | |
| | | | | | | | |
| Security | | Shares | | | Value | |
|
| Chile (continued) | |
| | |
Falabella S.A. | | | 380,140 | | | $ | 1,300,997 | |
| | |
Parque Arauco S.A. | | | 541,699 | | | | 793,593 | |
| | |
Ripley Corp. S.A. | | | 721,671 | | | | 214,034 | |
| | |
Sociedad Matriz SAAM S.A. | | | 5,008,549 | | | | 388,496 | |
| | |
Sociedad Quimica y Minera de Chile S.A., Series B, PFC Shares | | | 21,616 | | | | 1,094,763 | |
| | |
Sonda S.A. | | | 377,536 | | | | 218,233 | |
| | |
Vina Concha y Toro S.A. | | | 194,743 | | | | 312,545 | |
| |
| | | | $ | 12,204,618 | |
|
| China — 19.4% | |
| | |
3SBio, Inc.(2)(3) | | | 508,000 | | | $ | 472,238 | |
| | |
AAC Technologies Holdings, Inc.(1) | | | 69,500 | | | | 376,865 | |
| | |
AECC Aviation Power Co., Ltd. | | | 40,221 | | | | 370,095 | |
| | |
Agile Group Holdings, Ltd. | | | 254,000 | | | | 315,611 | |
| | |
Aier Eye Hospital Group Co., Ltd., Class A | | | 51,114 | | | | 621,269 | |
| | |
Air China, Ltd., Class H | | | 628,000 | | | | 434,561 | |
| | |
Aisino Corp. | | | 38,800 | | | | 68,578 | |
| | |
Alibaba Group Holding, Ltd. ADR(2) | | | 15,200 | | | | 3,858,216 | |
| | |
Aluminum Corp. of China, Ltd., Class H(2) | | | 1,672,000 | | | | 507,159 | |
| | |
Angang Steel Co., Ltd., Class H(1) | | | 306,400 | | | | 120,042 | |
| | |
Anhui Conch Cement Co., Ltd., Class H | | | 172,500 | | | | 1,019,100 | |
| | |
ANTA Sports Products, Ltd. | | | 26,000 | | | | 428,182 | |
| | |
Baidu, Inc. ADR(2) | | | 5,032 | | | | 1,182,621 | |
| | |
Bank of Beijing Co., Ltd. | | | 182,760 | | | | 133,625 | |
| | |
Bank of China, Ltd., Class H | | | 896,000 | | | | 303,282 | |
| | |
Bank of Ningbo Co., Ltd., Class A | | | 33,500 | | | | 199,075 | |
| | |
BeiGene, Ltd. ADR(2) | | | 2,200 | | | | 704,000 | |
| | |
Beijing Capital International Airport Co., Ltd., Class H | | | 436,000 | | | | 335,128 | |
| | |
Beijing Enterprises Holdings, Ltd. | | | 75,000 | | | | 245,161 | |
| | |
Beijing Enterprises Water Group, Ltd. | | | 648,000 | | | | 263,143 | |
| | |
Beijing Originwater Technology Co., Ltd., Class A | | | 127,500 | | | | 142,307 | |
| | |
BOE Technology Group Co., Ltd., Class A | | | 341,100 | | | | 324,699 | |
| | |
Brilliance China Automotive Holdings, Ltd. | | | 326,000 | | | | 254,873 | |
| | |
BYD Co., Ltd., Class H(1) | | | 7,654 | | | | 231,178 | |
| | |
BYD Electronic (International) Co., Ltd. | | | 42,500 | | | | 292,704 | |
| | |
Changchun High & New Technology Industry Group, Inc., Class A | | | 6,200 | | | | 435,407 | |
| | |
Changjiang Securities Co., Ltd., Class A | | | 112,200 | | | | 133,849 | |
| | |
Chengdu Xingrong Environment Co., Ltd., Class A | | | 125,700 | | | | 88,140 | |
| | |
China Biologic Products Holdings, Inc.(2) | | | 5,300 | | | | 624,605 | |
| | |
China Bluechemical, Ltd., Class H | | | 1,270,000 | | | | 254,817 | |
| | |
China Coal Energy Co., Ltd., Class H | | | 772,000 | | | | 223,696 | |
| | |
China Communications Services Corp., Ltd., Class H | | | 658,000 | | | | 293,631 | |
| | |
China Construction Bank Corp., Class H | | | 1,469,630 | | | | 1,113,125 | |
| | |
China Dongxiang Group Co., Ltd. | | | 1,842,624 | | | | 182,611 | |
| | | | |
| | 8 | | See Notes to Financial Statements. |
Parametric
Emerging Markets Fund
January 31, 2021
Portfolio of Investments — continued
| | | | | | | | |
| Security | | Shares | | | Value | |
|
| China (continued) | |
| | |
China Everbright Environment Group, Ltd. | | | 373,925 | | | $ | 209,877 | |
| | |
China Evergrande Group(1) | | | 135,000 | | | | 258,919 | |
| | |
China Fortune Land Development Co., Ltd.(4) | | | 68,027 | | | | 99,420 | |
| | |
China Gas Holdings, Ltd. | | | 234,600 | | | | 825,668 | |
| | |
China International Marine Containers Co., Ltd. | | | 229,206 | | | | 369,115 | |
| | |
China Jinmao Holdings Group, Ltd. | | | 586,000 | | | | 229,360 | |
| | |
China Life Insurance Co., Ltd., Class H | | | 92,000 | | | | 195,386 | |
| | |
China Longyuan Power Group Corp., Ltd., Class H | | | 476,000 | | | | 696,783 | |
| | |
China Mengniu Dairy Co., Ltd. | | | 268,000 | | | | 1,593,783 | |
| | |
China Merchants Bank Co., Ltd., Class H | | | 58,524 | | | | 448,169 | |
| | |
China Merchants Port Holdings Co., Ltd. | | | 318,035 | | | | 442,720 | |
| | |
China Merchants Shekou Industrial Zone Holdings Co., Ltd., Class A | | | 74,674 | | | | 136,188 | |
| | |
China Molybdenum Co., Ltd., Class H | | | 915,000 | | | | 575,227 | |
| | |
China National Building Material Co., Ltd., Class H | | | 382,000 | | | | 455,273 | |
| | |
China Northern Rare Earth Group High-Tech Co.,
Ltd.(2) | | | 117,100 | | | | 321,394 | |
| | |
China Oilfield Services, Ltd., Class H(1) | | | 368,000 | | | | 405,156 | |
| | |
China Overseas Land & Investment, Ltd. | | | 314,160 | | | | 713,637 | |
| | |
China Petroleum & Chemical Corp., Class H | | | 3,909,741 | | | | 1,851,582 | |
| | |
China Railway Group, Ltd., Class H | | | 412,000 | | | | 187,025 | |
| | |
China Resources Beer Holdings Co., Ltd. | | | 72,000 | | | | 634,811 | |
| | |
China Resources Gas Group, Ltd. | | | 96,000 | | | | 478,187 | |
| | |
China Resources Land, Ltd. | | | 196,000 | | | | 775,600 | |
| | |
China Resources Medical Holdings Co., Ltd. | | | 355,000 | | | | 349,149 | |
| | |
China Resources Power Holdings Co., Ltd. | | | 267,600 | | | | 282,347 | |
| | |
China Shenhua Energy Co., Ltd., Class H | | | 765,000 | | | | 1,413,095 | |
| | |
China Shineway Pharmaceutical Group, Ltd. | | | 381,000 | | | | 269,357 | |
| | |
China Shipbuilding Industry Co., Ltd.(2) | | | 185,800 | | | | 117,126 | |
| | |
China Southern Airlines Co., Ltd., Class H(2) | | | 564,000 | | | | 314,041 | |
| | |
China State Construction Engineering Corp., Ltd. | | | 156,440 | | | | 116,183 | |
| | |
China Tourism Group Duty Free Corp., Ltd. | | | 6,700 | | | | 303,523 | |
| | |
China Travel International Investment Hong Kong, Ltd.(2) | | | 1,372,855 | | | | 187,128 | |
| | |
China Vanke Co., Ltd., Class H | | | 227,977 | | | | 815,668 | |
| | |
China Yangtze Power Co., Ltd. | | | 162,200 | | | | 493,169 | |
| | |
Chongqing Changan Automobile Co., Ltd., Class A(2) | | | 98,800 | | | | 262,560 | |
| | |
CIFI Holdings Group Co., Ltd. | | | 374,000 | | | | 306,568 | |
| | |
CITIC, Ltd. | | | 458,000 | | | | 356,540 | |
| | |
COSCO SHIPPING Development Co., Ltd., Class H | | | 2,095,000 | | | | 331,462 | |
| | |
COSCO SHIPPING Energy Transportation Co., Ltd., Class H | | | 792,000 | | | | 316,706 | |
| | |
COSCO SHIPPING Holdings Co., Ltd., Class H(1)(2) | | | 314,975 | | | | 318,809 | |
| | |
COSCO SHIPPING Ports, Ltd. | | | 516,000 | | | | 366,050 | |
| | |
Country Garden Holdings Co., Ltd. | | | 533,880 | | | | 641,268 | |
| | |
Country Garden Services Holdings Co., Ltd. | | | 114,589 | | | | 931,337 | |
| | |
CSPC Pharmaceutical Group, Ltd. | | | 755,760 | | | | 768,304 | |
| | |
Daqin Railway Co., Ltd. | | | 235,100 | | | | 231,490 | |
| | |
Dong-E-E-Jiao Co., Ltd., Class A | | | 16,200 | | | | 81,803 | |
| | | | | | | | |
| Security | | Shares | | | Value | |
|
| China (continued) | |
| | |
Dongfeng Motor Group Co., Ltd., Class H | | | 264,000 | | | $ | 260,050 | |
| | |
East Money Information Co., Ltd., Class A | | | 70,358 | | | | 381,754 | |
| | |
Focus Media Information Technology Co., Ltd., Class A | | | 196,344 | | | | 329,056 | |
| | |
Ganfeng Lithium Co., Ltd., Class A | | | 51,150 | | | | 941,944 | |
| | |
GDS Holdings, Ltd. ADR(2) | | | 9,300 | | | | 963,108 | |
| | |
Gemdale Corp. | | | 80,700 | | | | 134,833 | |
| | |
Golden Eagle Retail Group, Ltd. | | | 287,941 | | | | 260,220 | |
| | |
Great Wall Motor Co., Ltd., Class H | | | 50,000 | | | | 155,885 | |
| | |
Gree Electric Appliances, Inc. of Zhuhai, Class A | | | 11,100 | | | | 96,314 | |
| | |
Guangdong Baolihua New Energy Stock Co., Ltd., Class A | | | 86,500 | | | | 101,309 | |
| | |
Guangdong Investment, Ltd. | | | 258,000 | | | | 451,878 | |
| | |
Guangzhou Automobile Group Co., Ltd., Class H | | | 199,218 | | | | 180,818 | |
| | |
Guangzhou Baiyunshan Pharmaceutical Holdings Co., Ltd., Class H | | | 220,000 | | | | 551,653 | |
| | |
Guangzhou R&F Properties Co., Ltd., Class H | | | 178,000 | | | | 218,937 | |
| | |
Haier Smart Home Co., Ltd. | | | 66,800 | | | | 327,943 | |
| | |
Haier Smart Home Co., Ltd., Class H(1)(2) | | | 47,553 | | | | 196,879 | |
| | |
Han’s Laser Technology Industry Group Co., Ltd., Class A | | | 23,400 | | | | 154,494 | |
| | |
Hengan International Group Co., Ltd. | | | 110,000 | | | | 786,722 | |
| | |
Hengtong Optic-electric Co., Ltd. | | | 38,780 | | | | 73,618 | |
| | |
Hesteel Co., Ltd., Class A(2) | | | 506,400 | | | | 161,083 | |
| | |
Huadian Power International Corp., Ltd., Class H(1) | | | 460,000 | | | | 117,211 | |
| | |
Huadong Medicine Co., Ltd., Class A | | | 56,653 | | | | 230,540 | |
| | |
Huaneng Power International, Inc., Class H | | | 670,000 | | | | 236,995 | |
| | |
Huayu Automotive Systems Co., Ltd. | | | 53,308 | | | | 245,079 | |
| | |
Hubei Energy Group Co., Ltd., Class A | | | 277,714 | | | | 151,943 | |
| | |
Huishan Dairy(1)(4) | | | 1,800,000 | | | | 0 | |
| | |
Hundsun Technologies, Inc. | | | 17,303 | | | | 259,117 | |
| | |
Iflytek Co., Ltd., Class A | | | 34,550 | | | | 248,818 | |
| | |
Industrial & Commercial Bank of China, Ltd., Class H | | | 1,167,000 | | | | 744,394 | |
| | |
Industrial Bank Co., Ltd. | | | 97,902 | | | | 349,259 | |
| | |
Inner Mongolia BaoTou Steel Union Co., Ltd.(2) | | | 707,000 | | | | 125,508 | |
| | |
Inner Mongolia Yili Industrial Group Co., Ltd., Class A | | | 53,200 | | | | 363,036 | |
| | |
Innovent Biologics, Inc.(2)(3) | | | 72,500 | | | | 824,124 | |
| | |
JD.com, Inc. ADR(2) | | | 8,606 | | | | 763,266 | |
| | |
Jiangsu Expressway Co., Ltd., Class H | | | 214,000 | | | | 248,166 | |
| | |
Jiangsu Hengrui Medicine Co., Ltd. | | | 32,301 | | | | 516,902 | |
| | |
Jiangsu Yanghe Brewery Joint-Stock Co., Ltd., Class A | | | 14,600 | | | | 459,672 | |
| | |
Jiangxi Copper Co., Ltd., Class H | | | 154,000 | | | | 252,996 | |
| | |
Jinke Properties Group Co., Ltd., Class A | | | 130,499 | | | | 139,991 | |
| | |
Jinyu Bio-Technology Co., Ltd. | | | 43,862 | | | | 154,181 | |
| | |
Jizhong Energy Resources Co., Ltd., Class A | | | 231,400 | | | | 115,352 | |
| | |
Kingboard Holdings., Ltd. | | | 46,600 | | | | 189,897 | |
| | |
Kingdee International Software Group Co., Ltd. | | | 246,000 | | | | 985,419 | |
| | |
Kingsoft Corp, Ltd.(1) | | | 105,000 | | | | 809,401 | |
| | |
Kunlun Energy Co., Ltd. | | | 338,000 | | | | 288,065 | |
| | | | |
| | 9 | | See Notes to Financial Statements. |
Parametric
Emerging Markets Fund
January 31, 2021
Portfolio of Investments — continued
| | | | | | | | |
| Security | | Shares | | | Value | |
|
| China (continued) | |
| | |
Kweichow Moutai Co., Ltd. | | | 2,900 | | | $ | 947,756 | |
| | |
KWG Group Holdings, Ltd. | | | 156,000 | | | | 206,692 | |
| | |
KWG Living Group Holdings, Ltd.(2) | | | 78,000 | | | | 82,193 | |
| | |
Lee & Man Paper Manufacturing, Ltd. | | | 275,000 | | | | 241,136 | |
| | |
Lenovo Group, Ltd. | | | 640,000 | | | | 744,923 | |
| | |
Lepu Medical Technology Beijing Co., Ltd., Class A | | | 33,300 | | | | 138,375 | |
| | |
Li Ning Co., Ltd. | | | 75,708 | | | | 471,646 | |
| | |
Longfor Group Holdings, Ltd.(3) | | | 128,000 | | | | 720,828 | |
| | |
LONGi Green Energy Technology Co., Ltd. | | | 60,242 | | | | 996,965 | |
| | |
Luxshare Precision Industry Co., Ltd., Class A | | | 71,034 | | | | 579,247 | |
| | |
Luye Pharma Group, Ltd.(1)(3) | | | 496,500 | | | | 248,468 | |
| | |
Maanshan Iron & Steel Co., Ltd., Class H(1) | | | 1,498,000 | | | | 414,705 | |
| | |
NARI Technology Co., Ltd. | | | 48,600 | | | | 220,603 | |
| | |
NetEase, Inc. ADR | | | 9,710 | | | | 1,116,553 | |
| | |
New Oriental Education & Technology Group, Inc. ADR(2) | | | 2,300 | | | | 385,250 | |
| | |
Nine Dragons Paper Holdings, Ltd. | | | 195,000 | | | | 300,399 | |
| | |
Oceanwide Holdings Co., Ltd., Class A | | | 204,000 | | | | 92,283 | |
| | |
Offshore Oil Engineering Co., Ltd. | | | 141,100 | | | | 92,025 | |
| | |
OFILM Group Co., Ltd., Class A | | | 65,800 | | | | 104,176 | |
| | |
Oriental Pearl Group Co., Ltd., Class A | | | 75,920 | | | | 102,236 | |
| | |
PetroChina Co., Ltd., Class H | | | 4,802,000 | | | | 1,448,186 | |
| | |
Ping An Bank Co., Ltd., Class A | | | 79,188 | | | | 282,356 | |
| | |
Ping An Insurance (Group) Co. of China, Ltd., Class H | | | 95,000 | | | | 1,118,889 | |
| | |
Pingdingshan Tianan Coal Mining Co., Ltd. | | | 131,900 | | | | 99,646 | |
| | |
Poly Developments and Holdings Group Co., Ltd., Class A | | | 94,900 | | | | 202,148 | |
| | |
Poly Property Group Co., Ltd. | | | 700,000 | | | | 201,248 | |
| | |
Power Construction Corp. of China, Ltd. | | | 354,500 | | | | 206,832 | |
| | |
RiseSun Real Estate Development Co., Ltd., Class A | | | 163,200 | | | | 158,211 | |
| | |
SAIC Motor Corp., Ltd. | | | 55,100 | | | | 186,403 | |
| | |
Sanan Optoelectronics Co., Ltd. | | | 84,900 | | | | 386,599 | |
| | |
SDIC Power Holdings Co., Ltd. | | | 98,000 | | | | 131,597 | |
| | |
Shan Xi Hua Yang Group New Energy Co., Ltd. | | | 126,000 | | | | 93,127 | |
| | |
Shandong Gold Mining Co., Ltd. | | | 50,680 | | | | 172,710 | |
| | |
Shandong Weigao Group Medical Polymer Co., Ltd., Class H | | | 456,000 | | | | 851,611 | |
| | |
Shanghai Electric Group Co., Ltd., Class H(2) | | | 1,184,000 | | | | 432,292 | |
| | |
Shanghai Industrial Holdings, Ltd. | | | 204,000 | | | | 279,528 | |
| | |
Shanghai Pudong Development Bank Co., Ltd., Class A | | | 136,500 | | | | 210,024 | |
| | |
Shanxi Coking Coal Energy Group Co., Ltd., Class A | | | 198,510 | | | | 147,688 | |
| | |
Shanxi Lu’an Environmental Energy Development Co., Ltd. | | | 152,200 | | | | 128,272 | |
| | |
Shenzhen Inovance Technology Co., Ltd., Class A | | | 18,600 | | | | 273,222 | |
| | |
Shenzhen Investment, Ltd. | | | 674,000 | | | | 222,617 | |
| | |
Shenzhen Zhongjin Lingnan Nonfemet Co., Ltd., Class A | | | 171,300 | | | | 110,893 | |
| | |
Shimao Group Holdings, Ltd. | | | 118,500 | | | | 342,624 | |
| | |
Siasun Robot & Automation Co., Ltd., Class A(2) | | | 55,000 | | | | 100,915 | |
| | |
Sichuan Chuantou Energy Co., Ltd. | | | 88,600 | | | | 150,032 | |
| | | | | | | | |
| Security | | Shares | | | Value | |
|
| China (continued) | |
| | |
Sihuan Pharmaceutical Holdings Group, Ltd. | | | 3,161,000 | | | $ | 783,744 | |
| | |
SINA Corp.(2) | | | 5,700 | | | | 238,374 | |
| | |
Sino Biopharmaceutical, Ltd. | | | 639,500 | | | | 593,686 | |
| | |
Sino-Ocean Group Holding, Ltd. | | | 659,000 | | | | 132,823 | |
| | |
Sinopec Shanghai Petrochemical Co., Ltd., Class H | | | 1,963,000 | | | | 433,877 | |
| | |
Sinopharm Group Co., Ltd., Class H | | | 302,000 | | | | 740,097 | |
| | |
Sunac China Holdings, Ltd. | | | 188,000 | | | | 698,489 | |
| | |
Sunac Services Holdings, Ltd.(2)(3) | | | 6,048 | | | | 17,005 | |
| | |
Sunny Optical Technology Group Co., Ltd. | | | 50,900 | | | | 1,329,708 | |
| | |
TCL Technology Group Corp., Class A | | | 373,200 | | | | 493,343 | |
| | |
Tencent Holdings, Ltd. | | | 80,839 | | | | 7,203,019 | |
| | |
Tianqi Lithium Corp., Class A(2) | | | 58,305 | | | | 538,546 | |
| | |
Tingyi (Cayman Islands) Holding Corp. | | | 484,000 | | | | 961,728 | |
| | |
Tongling Nonferrous Metals Group Co., Ltd., Class A | | | 424,000 | | | | 149,772 | |
| | |
Trip.com Group, Ltd. ADR(2) | | | 9,254 | | | | 294,555 | |
| | |
Tsingtao Brewery Co., Ltd., Class H | | | 77,566 | | | | 748,023 | |
| | |
Wanhua Chemical Group Co., Ltd. | | | 19,665 | | | | 338,963 | |
| | |
Want Want China Holdings, Ltd. | | | 1,157,920 | | | | 831,514 | |
| | |
Weichai Power Co., Ltd., Class H | | | 244,742 | | | | 721,828 | |
| | |
Weimob, Inc.(1)(2)(3) | | | 99,000 | | | | 283,290 | |
| | |
Wens Foodstuffs Group Co., Ltd., Class A | | | 51,000 | | | | 133,651 | |
| | |
West China Cement, Ltd. | | | 1,502,000 | | | | 218,176 | |
| | |
WH Group, Ltd.(3) | | | 834,000 | | | | 675,835 | |
| | |
Wuliangye Yibin Co., Ltd., Class A | | | 18,600 | | | | 835,482 | |
| | |
Wuxi Biologics Cayman, Inc.(2)(3) | | | 130,500 | | | | 1,827,251 | |
| | |
Xiaomi Corp., Class B(2)(3) | | | 621,800 | | | | 2,322,227 | |
| | |
Xinhu Zhongbao Co., Ltd. | | | 301,800 | | | | 140,401 | |
| | |
Xinyi Solar Holdings, Ltd. | | | 438,000 | | | | 958,344 | |
| | |
Yangzijiang Shipbuilding Holdings, Ltd. | | | 326,900 | | | | 241,418 | |
| | |
Yanzhou Coal Mining Co., Ltd., Class H | | | 522,000 | | | | 403,487 | |
| | |
Yonghui Superstores Co., Ltd. | | | 124,700 | | | | 131,415 | |
| | |
Yuan Longping High-tech Agriculture Co., Ltd., Class A(2) | | | 65,900 | | | | 183,170 | |
| | |
Yuexiu Property Co., Ltd. | | | 1,130,000 | | | | 220,733 | |
| | |
Yunnan Baiyao Group Co., Ltd., Class A | | | 21,200 | | | | 435,168 | |
| | |
Zhaojin Mining Industry Co., Ltd., Class H | | | 372,500 | | | | 400,792 | |
| | |
Zhejiang Dahua Technology Co., Ltd., Class A | | | 69,550 | | | | 261,444 | |
| | |
Zhejiang Expressway Co., Ltd., Class H | | | 422,000 | | | | 341,274 | |
| | |
Zhejiang Huahai Pharmaceutical Co., Ltd. | | | 41,250 | | | | 155,985 | |
| | |
Zhongjin Gold Corp., Ltd. | | | 115,900 | | | | 150,164 | |
| | |
Zhongtian Financial Group Co., Ltd., Class A(2) | | | 315,000 | | | | 131,087 | |
| | |
Zhuzhou CRRC Times Electric Co., Ltd., Class H | | | 89,500 | | | | 448,237 | |
| | |
Zijin Mining Group Co., Ltd., Class H | | | 980,000 | | | | 1,081,788 | |
| | |
ZTE Corp., Class H(1) | | | 155,303 | | | | 439,467 | |
| | |
ZTO Express Cayman, Inc. ADR | | | 6,900 | | | | 228,252 | |
| |
| | | | $ | 99,620,147 | |
| | | | |
| | 10 | | See Notes to Financial Statements. |
Parametric
Emerging Markets Fund
January 31, 2021
Portfolio of Investments — continued
| | | | | | | | |
| Security | | Shares | | | Value | |
|
| Colombia — 1.1% | |
| | |
Bancolombia S.A. | | | 36,723 | | | $ | 314,856 | |
| | |
Bancolombia S.A. ADR, PFC Shares | | | 15,255 | | | | 536,824 | |
| | |
Celsia S.A. ESP | | | 144,823 | | | | 194,774 | |
| | |
Cementos Argos S.A. | | | 283,280 | | | | 463,534 | |
| | |
Corp. Financiera Colombiana S.A.(2) | | | 13,924 | | | | 125,702 | |
| | |
Ecopetrol S.A. | | | 2,468,635 | | | | 1,404,125 | |
| | |
Grupo Argos S.A. | | | 172,980 | | | | 644,615 | |
| | |
Grupo Aval Acciones y Valores S.A., PFC Shares | | | 673,418 | | | | 218,497 | |
| | |
Grupo de Inversiones Suramericana S.A. | | | 27,791 | | | | 176,760 | |
| | |
Grupo de Inversiones Suramericana S.A., PFC Shares | | | 17,097 | | | | 98,203 | |
| | |
Grupo Nutresa S.A. | | | 125,847 | | | | 860,371 | |
| | |
Interconexion Electrica S.A. | | | 124,080 | | | | 801,704 | |
| |
| | | | $ | 5,839,965 | |
|
| Croatia — 0.6% | |
| | |
Adris Grupa DD, PFC Shares(2) | | | 8,306 | | | $ | 546,552 | |
| | |
Atlantic Grupa DD | | | 832 | | | | 178,774 | |
| | |
Ericsson Nikola Tesla DD | | | 1,039 | | | | 249,511 | |
| | |
Hrvatski Telekom DD | | | 16,850 | | | | 496,924 | |
| | |
Koncar-Elektroindustrija DD(2) | | | 1,251 | | | | 124,087 | |
| | |
Podravka Prehrambena Ind DD | | | 3,233 | | | | 253,869 | |
| | |
Valamar Riviera DD(2) | | | 233,109 | | | | 1,113,541 | |
| | |
Zagrebacka Banka DD(2) | | | 14,722 | | | | 131,169 | |
| |
| | | | $ | 3,094,427 | |
|
| Czech Republic — 0.6% | |
| | |
CEZ AS | | | 80,821 | | | $ | 1,938,080 | |
| | |
Komercni Banka AS(2) | | | 27,280 | | | | 828,003 | |
| | |
O2 Czech Republic AS | | | 8,600 | | | | 100,959 | |
| | |
Philip Morris CR AS | | | 504 | | | | 357,193 | |
| |
| | | | $ | 3,224,235 | |
|
| Egypt — 0.6% | |
| | |
Cleopatra Hospital(2) | | | 330,000 | | | $ | 101,396 | |
| | |
Commercial International Bank Egypt SAE | | | 210,183 | | | | 845,181 | |
| | |
Eastern Co. SAE | | | 594,265 | | | | 554,623 | |
| | |
Egypt Kuwait Holding Co. SAE | | | 465,000 | | | | 486,046 | |
| | |
Egyptian Financial Group-Hermes Holding Co.(2) | | | 120,844 | | | | 120,599 | |
| | |
ElSewedy Electric Co. | | | 281,156 | | | | 185,816 | |
| | |
Ibnsina Pharma SAE | | | 257,560 | | | | 84,836 | |
| | |
Juhayna Food Industries | | | 264,000 | | | | 117,580 | |
| | |
Medinet Nasr Housing & Development | | | 500,000 | | | | 126,619 | |
| | |
Oriental Weavers | | | 271,447 | | | | 122,589 | |
| | |
Six of October Development & Investment Co. | | | 134,471 | | | | 133,895 | |
| | |
Talaat Moustafa Group | | | 316,254 | | | | 149,511 | |
| | | | | | | | |
| Security | | Shares | | | Value | |
|
| Egypt (continued) | |
| | |
Telecom Egypt Co. | | | 267,772 | | | $ | 196,148 | |
| |
| | | | $ | 3,224,839 | |
|
| Estonia — 0.6% | |
| | |
AS Merko Ehitus(2) | | | 8,852 | | | $ | 114,338 | |
| | |
AS Tallink Grupp(2) | | | 1,844,311 | | | | 1,547,963 | |
| | |
AS Tallinna Kaubamaja Grupp | | | 66,001 | | | | 760,680 | |
| | |
AS Tallinna Vesi | | | 32,785 | | | | 552,375 | |
| |
| | | | $ | 2,975,356 | |
|
| Ghana — 0.4% | |
| | |
CalBank PLC | | | 1,765,286 | | | $ | 229,497 | |
| | |
Ghana Commercial Bank, Ltd. | | | 1,434,648 | | | | 1,086,125 | |
| | |
Standard Chartered Bank of Ghana, Ltd. | | | 215,500 | | | | 671,473 | |
| |
| | | | $ | 1,987,095 | |
|
| Greece — 1.2% | |
| | |
Aegean Airlines S.A.(2) | | | 27,897 | | | $ | 139,013 | |
| | |
Alpha Bank AE(2) | | | 252,670 | | | | 228,604 | |
| | |
Athens Water Supply & Sewage Co. S.A. | | | 12,891 | | | | 102,331 | |
| | |
Costamare, Inc. | | | 17,619 | | | | 140,952 | |
| | |
Eurobank Ergasias Services and Holdings S.A.(2) | | | 501,026 | | | | 330,928 | |
| | |
FF Group(2)(4) | | | 46,335 | | | | 0 | |
| | |
GEK Terna Holding Real Estate Construction S.A.(2) | | | 35,563 | | | | 308,557 | |
| | |
Hellenic Petroleum S.A. | | | 46,772 | | | | 310,506 | |
| | |
Hellenic Telecommunications Organization S.A. | | | 62,260 | | | | 904,989 | |
| | |
Holding Co. ADMIE IPTO S.A. | | | 26,908 | | | | 77,689 | |
| | |
JUMBO S.A. | | | 35,549 | | | | 556,874 | |
| | |
Motor Oil (Hellas) Corinth Refineries S.A. | | | 35,902 | | | | 504,665 | |
| | |
Mytilineos S.A. | | | 42,775 | | | | 622,794 | |
| | |
National Bank of Greece S.A.(2) | | | 102,241 | | | | 239,936 | |
| | |
OPAP S.A. | | | 65,464 | | | | 801,422 | |
| | |
Public Power Corp. S.A.(2) | | | 24,112 | | | | 205,807 | |
| | |
Terna Energy S.A. | | | 7,268 | | | | 123,909 | |
| | |
Titan Cement International S.A. | | | 17,213 | | | | 301,349 | |
| | |
Tsakos Energy Navigation, Ltd. | | | 16,120 | | | | 134,441 | |
| |
| | | | $ | 6,034,766 | |
|
| Hungary — 0.6% | |
| | |
Magyar Telekom Telecommunications PLC | | | 102,640 | | | $ | 136,866 | |
| | |
MOL Hungarian Oil & Gas PLC(2) | | | 120,135 | | | | 902,129 | |
| | |
OTP Bank Nyrt.(2) | | | 18,380 | | | | 838,050 | |
| | |
Richter Gedeon Nyrt. | | | 45,522 | | | | 1,282,331 | |
| |
| | | | $ | 3,159,376 | |
| | | | |
| | 11 | | See Notes to Financial Statements. |
Parametric
Emerging Markets Fund
January 31, 2021
Portfolio of Investments — continued
| | | | | | | | |
| Security | | Shares | | | Value | |
|
| India — 4.7% | |
| | |
ABB India, Ltd. | | | 6,696 | | | $ | 127,037 | |
| | |
ACC, Ltd. | | | 4,578 | | | | 100,455 | |
| | |
Adani Enterprises, Ltd. | | | 19,174 | | | | 131,443 | |
| | |
Adani Ports and Special Economic Zone, Ltd. | | | 35,949 | | | | 250,746 | |
| | |
Alkem Laboratories, Ltd. | | | 4,518 | | | | 186,282 | |
| | |
Apollo Hospitals Enterprise, Ltd. | | | 9,012 | | | | 315,948 | |
| | |
Asian Paints, Ltd. | | | 10,700 | | | | 353,303 | |
| | |
Aurobindo Pharma, Ltd. | | | 20,924 | | | | 259,240 | |
| | |
Axis Bank, Ltd.(2) | | | 16,772 | | | | 152,807 | |
| | |
Bajaj Auto, Ltd. | | | 4,334 | | | | 238,713 | |
| | |
Bharat Forge, Ltd. | | | 28,189 | | | | 226,155 | |
| | |
Bharat Heavy Electricals, Ltd.(2) | | | 277,624 | | | | 137,108 | |
| | |
Bharat Petroleum Corp., Ltd. | | | 30,291 | | | | 159,870 | |
| | |
Bharti Airtel, Ltd. | | | 117,185 | | | | 885,285 | |
| | |
Biocon, Ltd.(2) | | | 54,499 | | | | 277,955 | |
| | |
Cadila Healthcare, Ltd. | | | 32,897 | | | | 203,046 | |
| | |
Cipla, Ltd. | | | 38,493 | | | | 436,145 | |
| | |
Coal India, Ltd. | | | 73,904 | | | | 127,140 | |
| | |
Coforge, Ltd. | | | 4,821 | | | | 156,829 | |
| | |
Container Corp. of India, Ltd. | | | 33,600 | | | | 200,926 | |
| | |
Crompton Greaves Consumer Electricals, Ltd. | | | 19,469 | | | | 113,157 | |
| | |
Cummins India, Ltd. | | | 12,800 | | | | 115,480 | |
| | |
Dabur India, Ltd. | | | 29,492 | | | | 207,303 | |
| | |
Divi’s Laboratories, Ltd. | | | 9,150 | | | | 422,760 | |
| | |
DLF, Ltd. | | | 36,243 | | | | 126,807 | |
| | |
Dr. Reddy’s Laboratories, Ltd. | | | 7,621 | | | | 478,602 | |
| | |
Eicher Motors, Ltd. | | | 3,860 | | | | 145,586 | |
| | |
GAIL (India), Ltd. | | | 104,139 | | | | 177,946 | |
| | |
GlaxoSmithKline Pharmaceuticals, Ltd. | | | 7,462 | | | | 149,933 | |
| | |
Glenmark Pharmaceuticals, Ltd. | | | 21,554 | | | | 139,469 | |
| | |
Godrej Consumer Products, Ltd. | | | 20,875 | | | | 214,112 | |
| | |
Grasim Industries, Ltd. | | | 12,543 | | | | 182,094 | |
| | |
Gujarat State Petronet, Ltd. | | | 48,082 | | | | 130,730 | |
| | |
Havells India, Ltd. | | | 14,443 | | | | 206,389 | |
| | |
HCL Technologies, Ltd. | | | 35,417 | | | | 442,698 | |
| | |
Hero MotoCorp, Ltd. | | | 5,743 | | | | 257,000 | |
| | |
Hindalco Industries, Ltd. | | | 50,236 | | | | 154,466 | |
| | |
Hindustan Unilever, Ltd. | | | 17,701 | | | | 548,170 | |
| | |
Housing Development Finance Corp., Ltd. | | | 16,467 | | | | 535,501 | |
| | |
ICICI Bank, Ltd.(2) | | | 64,117 | | | | 475,639 | |
| | |
Indian Oil Corp., Ltd. | | | 99,120 | | | | 126,443 | |
| | |
Indus Towers, Ltd. | | | 59,046 | | | | 187,176 | |
| | |
Infosys, Ltd. | | | 120,258 | | | | 2,055,743 | |
| | |
Ipca Laboratories, Ltd. | | | 6,586 | | | | 168,017 | |
| | |
ITC, Ltd. | | | 76,886 | | | | 213,739 | |
| | |
JSW Steel, Ltd. | | | 41,470 | | | | 206,233 | |
| | | | | | | | |
| Security | | Shares | | | Value | |
|
| India (continued) | |
| | |
Kotak Mahindra Bank, Ltd.(2) | | | 8,924 | | | $ | 208,754 | |
| | |
Larsen & Toubro, Ltd. | | | 32,335 | | | | 590,966 | |
| | |
Lupin, Ltd. | | | 28,226 | | | | 389,483 | |
| | |
Mahindra & Mahindra, Ltd. | | | 37,002 | | | | 380,750 | |
| | |
Maruti Suzuki India, Ltd. | | | 5,154 | | | | 509,097 | |
| | |
Nestle India, Ltd. | | | 1,119 | | | | 262,604 | |
| | |
NTPC, Ltd. | | | 271,426 | | | | 329,317 | |
| | |
Oil & Natural Gas Corp., Ltd. | | | 123,509 | | | | 150,473 | |
| | |
Piramal Enterprises, Ltd. | | | 9,852 | | | | 176,138 | |
| | |
Power Grid Corporation of India, Ltd. | | | 150,500 | | | | 378,682 | |
| | |
Reliance Industries, Ltd. | | | 74,874 | | | | 1,887,340 | |
| | |
Siemens, Ltd. | | | 5,381 | | | | 117,076 | |
| | |
Sun Pharmaceutical Industries, Ltd. | | | 88,876 | | | | 714,852 | |
| | |
Sun TV Network, Ltd. | | | 26,788 | | | | 174,944 | |
| | |
Tata Consultancy Services, Ltd. | | | 34,951 | | | | 1,494,505 | |
| | |
Tata Consumer Products, Ltd. | | | 18,584 | | | | 141,011 | |
| | |
Tata Motors, Ltd.(2) | | | 78,747 | | | | 281,139 | |
| | |
Tata Power Co., Ltd. (The) | | | 149,699 | | | | 154,426 | |
| | |
Tata Steel, Ltd. | | | 17,980 | | | | 147,408 | |
| | |
Tech Mahindra, Ltd. | | | 28,861 | | | | 378,774 | |
| | |
Titan Co., Ltd. | | | 16,302 | | | | 317,073 | |
| | |
Torrent Pharmaceuticals, Ltd. | | | 4,744 | | | | 168,143 | |
| | |
UltraTech Cement, Ltd. | | | 2,833 | | | | 206,135 | |
| | |
UPL, Ltd. | | | 24,538 | | | | 188,954 | |
| | |
Vedanta, Ltd. | | | 41,367 | | | | 91,100 | |
| | |
Vodafone Idea, Ltd.(2) | | | 759,569 | | | | 114,663 | |
| | |
Voltas, Ltd. | | | 20,000 | | | | 246,733 | |
| | |
Wipro, Ltd. | | | 71,474 | | | | 411,416 | |
| | |
WNS Holdings, Ltd. ADR(2) | | | 3,000 | | | | 201,540 | |
| | |
Zee Entertainment Enterprises, Ltd. | | | 44,401 | | | | 133,028 | |
| |
| | | | $ | 24,054,150 | |
|
| Indonesia — 2.2% | |
| | |
Ace Hardware Indonesia Tbk PT | | | 1,088,200 | | | $ | 120,745 | |
| | |
Adaro Energy Tbk PT | | | 4,096,500 | | | | 349,002 | |
| | |
AKR Corporindo Tbk PT | | | 470,000 | | | | 94,674 | |
| | |
Aneka Tambang Tbk | | | 1,730,400 | | | | 272,166 | |
| | |
Astra Argo Lestari Tbk PT | | | 159,300 | | | | 126,348 | |
| | |
Astra International Tbk PT | | | 3,968,600 | | | | 1,719,710 | |
| | |
Bank Central Asia Tbk PT | | | 310,700 | | | | 747,274 | |
| | |
Bank Mandiri Persero Tbk PT | | | 430,100 | | | | 201,223 | |
| | |
Bank Negara Indonesia Persero Tbk PT | | | 359,100 | | | | 141,289 | |
| | |
Bank Rakyat Indonesia Persero Tbk PT | | | 1,547,100 | | | | 458,664 | |
| | |
Bintang Oto Global Tbk PT(2) | | | 1,572,600 | | | | 145,080 | |
| | |
Bukit Asam Tbk PT | | | 1,334,900 | | | | 244,415 | |
| | |
Bumi Serpong Damai Tbk PT(2) | | | 3,215,100 | | | | 256,940 | |
| | | | |
| | 12 | | See Notes to Financial Statements. |
Parametric
Emerging Markets Fund
January 31, 2021
Portfolio of Investments — continued
| | | | | | | | |
| Security | | Shares | | | Value | |
|
| Indonesia (continued) | |
| | |
Charoen Pokphand Indonesia Tbk PT | | | 801,800 | | | $ | 327,432 | |
| | |
Erajaya Swasembada Tbk PT(2) | | | 981,500 | | | | 192,988 | |
| | |
Gudang Garam Tbk PT(2) | | | 89,300 | | | | 239,812 | |
| | |
Hanson International Tbk PT(2)(4) | | | 23,744,500 | | | | 0 | |
| | |
Indocement Tunggal Prakarsa Tbk PT | | | 342,500 | | | | 325,343 | |
| | |
Indofood Sukses Makmur Tbk PT | | | 672,300 | | | | 289,325 | |
| | |
Jasa Marga (Persero) Tbk PT | | | 780,500 | | | | 239,769 | |
| | |
Kalbe Farma Tbk PT | | | 4,445,600 | | | | 463,407 | |
| | |
Lippo Karawaci Tbk PT(2) | | | 19,017,880 | | | | 236,229 | |
| | |
Medco Energi Internasional Tbk PT(2) | | | 3,858,120 | | | | 177,650 | |
| | |
Media Nusantara Citra Tbk PT(2) | | | 1,995,400 | | | | 146,572 | |
| | |
Mitra Adiperkasa Tbk PT(2) | | | 2,749,100 | | | | 150,431 | |
| | |
Mitra Keluarga Karyasehat Tbk PT | | | 1,185,700 | | | | 244,831 | |
| | |
Perusahaan Gas Negara Tbk PT | | | 1,221,100 | | | | 116,349 | |
| | |
Perusahaan Perkebunan London Sumatra Indonesia Tbk PT | | | 1,193,000 | | | | 112,968 | |
| | |
PP Persero Tbk PT | | | 1,377,389 | | | | 159,545 | |
| | |
Semen Indonesia Persero Tbk PT | | | 509,000 | | | | 383,519 | |
| | |
Sigmagold Inti Perkasa Tbk PT(2)(4) | | | 17,097,000 | | | | 0 | |
| | |
Telkom Indonesia Persero Tbk PT | | | 4,521,300 | | | | 999,298 | |
| | |
Tower Bersama Infrastructure Tbk PT | | | 2,018,000 | | | | 321,055 | |
| | |
Unilever Indonesia Tbk PT | | | 596,900 | | | | 294,064 | |
| | |
United Tractors Tbk PT | | | 322,883 | | | | 524,256 | |
| | |
Vale Indonesia Tbk PT(2) | | | 690,800 | | | | 269,060 | |
| | |
Waskita Karya Persero Tbk PT | | | 2,474,900 | | | | 248,530 | |
| | |
Wijaya Karya Persero Tbk PT | | | 982,300 | | | | 125,344 | |
| | |
XL Axiata Tbk PT | | | 485,100 | | | | 76,463 | |
| |
| | | | $ | 11,541,770 | |
|
| Jordan — 0.6% | |
| | |
Arab Bank PLC(2) | | | 249,678 | | | $ | 1,474,518 | |
| | |
Arab Potash Co. PLC | | | 22,442 | | | | 686,723 | |
| | |
Bank of Jordan(2) | | | 83,270 | | | | 233,025 | |
| | |
Jordan Islamic Bank(2) | | | 30,248 | | | | 132,379 | |
| | |
Jordan Petroleum Refinery | | | 85,173 | | | | 283,524 | |
| | |
Jordanian Electric Power Co. | | | 94,235 | | | | 155,415 | |
| |
| | | | $ | 2,965,584 | |
|
| Kazakhstan — 0.6% | |
| | |
Halyk Savings Bank of Kazakhstan JSC GDR(5) | | | 21,561 | | | $ | 273,449 | |
| | |
KAZ Minerals PLC | | | 168,039 | | | | 1,661,991 | |
| | |
Kcell JSC GDR(5) | | | 185,789 | | | | 1,208,695 | |
| |
| | | | $ | 3,144,135 | |
| | | | | | | | |
| Security | | Shares | | | Value | |
|
| Kenya — 0.6% | |
| | |
ABSA Bank Kenya PLC | | | 1,104,860 | | | $ | 93,065 | |
| | |
ARM Cement, Ltd.(2)(4) | | | 1,653,600 | | | | 0 | |
| | |
British American Tobacco Kenya PLC | | | 35,200 | | | | 130,329 | |
| | |
Co-operative Bank of Kenya, Ltd. (The) | | | 285,821 | | | | 32,518 | |
| | |
East African Breweries, Ltd. | | | 442,080 | | | | 601,450 | |
| | |
Equity Group Holdings PLC(2) | | | 816,800 | | | | 270,831 | |
| | |
KCB Group, Ltd. | | | 709,420 | | | | 230,021 | |
| | |
Kenya Power & Lighting, Ltd.(2) | | | 4,351,554 | | | | 59,092 | |
| | |
Nation Media Group PLC(2) | | | 334,602 | | | | 45,583 | |
| | |
Safaricom PLC | | | 5,216,872 | | | | 1,678,136 | |
| | |
Standard Chartered Bank Kenya, Ltd. | | | 37,446 | | | | 47,252 | |
| |
| | | | $ | 3,188,277 | |
|
| Kuwait — 1.3% | |
| | |
Agility Public Warehousing Co. KSC | | | 389,573 | | | $ | 963,312 | |
| | |
Boubyan Bank KSCP | | | 108,984 | | | | 206,904 | |
| | |
Boubyan Petrochemicals Co. KSCP | | | 146,006 | | | | 322,112 | |
| | |
Burgan Bank SAK | | | 129,020 | | | | 93,759 | |
| | |
Gulf Bank KSCP | | | 196,041 | | | | 142,439 | |
| | |
Kuwait Finance House KSCP | | | 406,584 | | | | 960,612 | |
| | |
Kuwait Real Estate Co. KSC(2) | | | 220,214 | | | | 82,885 | |
| | |
Mabanee Co. KPSC | | | 198,852 | | | | 463,632 | |
| | |
Mobile Telecommunications Co. KSCP | | | 630,904 | | | | 1,319,942 | |
| | |
National Bank of Kuwait SAK | | | 582,312 | | | | 1,677,389 | |
| | |
National Industries Group Holding SAK | | | 522,891 | | | | 328,396 | |
| |
| | | | $ | 6,561,382 | |
|
| Lithuania — 0.4% | |
| | |
Apranga PVA(2) | | | 317,588 | | | $ | 659,072 | |
| | |
Klaipedos Nafta AB | | | 815,900 | | | | 314,290 | |
| | |
Rokiskio Suris | | | 122,500 | | | | 431,169 | |
| | |
Siauliu Bankas(2) | | | 1,084,702 | | | | 695,675 | |
| |
| | | | $ | 2,100,206 | |
|
| Malaysia — 2.4% | |
| | |
Aeon Co. (M) Bhd | | | 440,600 | | | $ | 100,630 | |
| | |
Axiata Group Bhd | | | 194,650 | | | | 159,936 | |
| | |
Berjaya Sports Toto Bhd | | | 274,265 | | | | 137,597 | |
| | |
CIMB Group Holdings Bhd | | | 172,700 | | | | 163,673 | |
| | |
Dialog Group Bhd | | | 1,024,731 | | | | 768,073 | |
| | |
Digi.com Bhd | | | 173,244 | | | | 162,076 | |
| | |
Gamuda Bhd | | | 308,500 | | | | 251,339 | |
| | |
Genting Bhd | | | 522,600 | | | | 512,999 | |
| | |
Genting Malaysia Bhd | | | 654,000 | | | | 397,206 | |
| | |
Globetronics Technology Bhd | | | 582,200 | | | | 457,198 | |
| | | | |
| | 13 | | See Notes to Financial Statements. |
Parametric
Emerging Markets Fund
January 31, 2021
Portfolio of Investments — continued
| | | | | | | | |
| Security | | Shares | | | Value | |
|
| Malaysia (continued) | |
| | |
Hartalega Holdings Bhd | | | 212,408 | | | $ | 674,032 | |
| | |
Hong Leong Bank Bhd | | | 26,900 | | | | 114,677 | |
| | |
IGB Real Estate Investment Trust | | | 192,600 | | | | 80,958 | |
| | |
IHH Healthcare Bhd | | | 476,500 | | | | 601,366 | |
| | |
IJM Corp. Bhd | | | 323,680 | | | | 119,842 | |
| | |
Inari Amertron Bhd | | | 1,026,300 | | | | 857,603 | |
| | |
IOI Corp. Bhd | | | 71,207 | | | | 74,257 | |
| | |
IOI Properties Group Bhd | | | 266,058 | | | | 85,290 | |
| | |
KLCCP Stapled Group | | | 42,600 | | | | 74,257 | |
| | |
Kossan Rubber Industries | | | 210,000 | | | | 230,613 | |
| | |
Kuala Lumpur Kepong Bhd | | | 14,600 | | | | 83,706 | |
| | |
Magnum Bhd | | | 315,867 | | | | 164,564 | |
| | |
Malayan Banking Bhd | | | 113,587 | | | | 219,084 | |
| | |
Malaysia Airports Holdings Bhd | | | 141,100 | | | | 179,597 | |
| | |
Maxis Bhd | | | 126,200 | | | | 148,654 | |
| | |
MISC Bhd | | | 121,500 | | | | 178,737 | |
| | |
MMC Corp. Bhd | | | 750,200 | | | | 143,047 | |
| | |
My EG Services Bhd | | | 1,150,050 | | | | 543,371 | |
| | |
Nestle Malaysia Bhd | | | 2,600 | | | | 87,917 | |
| | |
Petronas Chemicals Group Bhd | | | 242,400 | | | | 400,745 | |
| | |
Petronas Dagangan Bhd | | | 79,300 | | | | 378,820 | |
| | |
Petronas Gas Bhd | | | 39,500 | | | | 156,418 | |
| | |
PPB Group Bhd | | | 30,500 | | | | 139,347 | |
| | |
Press Metal Aluminium Holdings Bhd | | | 118,520 | | | | 233,451 | |
| | |
Public Bank Bhd | | | 266,690 | | | | 275,889 | |
| | |
RHB Bank Bhd | | | 101,700 | | | | 127,985 | |
| | |
Silverlake Axis, Ltd. | | | 627,992 | | | | 124,477 | |
| | |
Sime Darby Bhd | | | 241,339 | | | | 130,894 | |
| | |
Sime Darby Plantation Bhd | | | 81,539 | | | | 97,495 | |
| | |
Sunway Bhd | | | 339,006 | | | | 125,611 | |
| | |
Supermax Corp. Bhd(2) | | | 213,440 | | | | 357,633 | |
| | |
Telekom Malaysia Bhd | | | 111,400 | | | | 174,546 | |
| | |
Tenaga Nasional Bhd | | | 51,238 | | | | 122,081 | |
| | |
Top Glove Corp. Bhd | | | 567,100 | | | | 943,284 | |
| | |
VS Industry Bhd | | | 676,700 | | | | 455,548 | |
| | |
YTL Corp. Bhd(2) | | | 404,791 | | | | 64,330 | |
| |
| | | | $ | 12,080,853 | |
|
| Mauritius — 0.6% | |
| | |
Alteo, Ltd. | | | 436,204 | | | $ | 223,076 | |
| | |
CIEL, Ltd. | | | 1,801,109 | | | | 174,553 | |
| | |
MCB Group, Ltd.(2) | | | 171,702 | | | | 1,023,175 | |
| | |
Phoenix Beverages, Ltd. | | | 24,345 | | | | 366,210 | |
| | |
Rogers & Co., Ltd.(2) | | | 898,291 | | | | 457,880 | |
| | |
SBM Holdings, Ltd.(2) | | | 2,636,400 | | | | 235,203 | |
| | |
Sun, Ltd., Class A(2) | | | 516,880 | | | | 167,556 | |
| | | | | | | | |
| Security | | Shares | | | Value | |
|
| Mauritius (continued) | |
| | |
Terra Mauricia, Ltd. | | | 432,330 | | | $ | 217,493 | |
| | |
United Basalt Products, Ltd. | | | 107,345 | | | | 341,334 | |
| |
| | | | $ | 3,206,480 | |
|
| Mexico — 4.6% | |
| | |
Alfa SAB de CV, Series A | | | 775,172 | | | $ | 486,681 | |
| | |
Alsea SAB de CV(1)(2) | | | 258,700 | | | | 290,263 | |
| | |
America Movil SAB de CV, Series L | | | 4,364,505 | | | | 2,906,263 | |
| | |
Arca Continental SAB de CV | | | 63,680 | | | | 289,867 | |
| | |
Bolsa Mexicana de Valores SAB de CV | | | 78,775 | | | | 176,695 | |
| | |
Cemex SAB de CV, Series CPO(2) | | | 2,066,439 | | | | 1,187,504 | |
| | |
Coca-Cola Femsa SAB de CV, Series L | | | 85,355 | | | | 372,832 | |
| | |
Corp. Inmobiliaria Vesta SAB de CV | | | 182,300 | | | | 343,719 | |
| | |
El Puerto de Liverpool SAB de CV(1) | | | 69,380 | | | | 219,691 | |
| | |
Fibra Uno Administracion S.A. de CV | | | 1,655,790 | | | | 1,856,999 | |
| | |
Fomento Economico Mexicano SAB de CV, Series UBD | | | 253,456 | | | | 1,726,058 | |
| | |
Genomma Lab Internacional SAB de CV(2) | | | 221,300 | | | | 225,413 | |
| | |
Gruma SAB de CV, Class B | | | 30,000 | | | | 329,284 | |
| | |
Grupo Aeroportuario del Centro Norte SAB de CV(2) | | | 90,200 | | | | 527,674 | |
| | |
Grupo Aeroportuario del Pacifico SAB de CV,
Class B(2) | | | 107,687 | | | | 1,082,806 | |
| | |
Grupo Aeroportuario del Sureste SAB de CV,
Class B(2) | | | 55,260 | | | | 869,835 | |
| | |
Grupo Bimbo SAB de CV, Series A | | | 221,045 | | | | 416,663 | |
| | |
Grupo Carso SAB de CV, Series A1(2) | | | 293,000 | | | | 735,966 | |
| | |
Grupo Elektra SAB de CV(1) | | | 5,748 | | | | 389,327 | |
| | |
Grupo Financiero Banorte SAB de CV, Class O(2) | | | 217,800 | | | | 1,084,803 | |
| | |
Grupo Financiero Inbursa SAB de CV, Class O(2) | | | 238,800 | | | | 214,115 | |
| | |
Grupo Mexico SAB de CV, Series B | | | 435,579 | | | | 1,879,881 | |
| | |
Grupo Televisa SAB ADR(2) | | | 77,600 | | | | 582,776 | |
| | |
Grupo Televisa SAB, Series CPO(2) | | | 124,100 | | | | 188,641 | |
| | |
Industrias Penoles SAB de CV(2) | | | 16,880 | | | | 251,994 | |
| | |
Infraestructura Energetica Nova SAB de CV(2) | | | 125,500 | | | | 459,046 | |
| | |
Kimberly-Clark de Mexico SAB de CV, Class A | | | 256,500 | | | | 450,586 | |
| | |
Macquarie Mexico Real Estate Management S.A. de CV(3) | | | 240,600 | | | | 296,129 | |
| | |
Orbia Advance Corp., SAB de CV | | | 174,399 | | | | 372,807 | |
| | |
PLA Administradora Industrial S de RL de CV | | | 127,200 | | | | 178,709 | |
| | |
Promotora y Operadora de Infraestructura SAB de CV | | | 57,915 | | | | 436,700 | |
| | |
Telesites SAB de CV(1)(2) | | | 236,668 | | | | 240,490 | |
| | |
Ternium S.A. ADR(2) | | | 9,400 | | | | 248,630 | |
| | |
Vista Oil & Gas SAB de CV ADR(1)(2) | | | 48,000 | | | | 119,520 | |
| | |
Wal-Mart de Mexico SAB de CV, Series V | | | 695,980 | | | | 1,981,772 | |
| |
| | | | $ | 23,420,139 | |
|
| Morocco — 0.6% | |
| | |
Attijariwafa Bank | | | 7,338 | | | $ | 357,111 | |
| | |
Bank of Africa | | | 8,400 | | | | 150,650 | |
| | | | |
| | 14 | | See Notes to Financial Statements. |
Parametric
Emerging Markets Fund
January 31, 2021
Portfolio of Investments — continued
| | | | | | | | |
| Security | | Shares | | | Value | |
|
| Morocco (continued) | |
| | |
Banque Centrale Populaire | | | 7,451 | | | $ | 215,283 | |
| | |
Co Sucrerie Marocaine et de Raffinage | | | 13,010 | | | | 335,229 | |
| | |
Label Vie | | | 499 | | | | 176,847 | |
| | |
LafargeHolcim Maroc S.A. | | | 3,640 | | | | 667,092 | |
| | |
Lesieur Cristal | | | 4,686 | | | | 88,843 | |
| | |
Maroc Telecom | | | 47,538 | | | | 780,723 | |
| | |
Societe d’Exploitation des Ports | | | 10,039 | | | | 245,612 | |
| | |
TAQA Morocco S.A. | | | 695 | | | | 72,592 | |
| | |
TOTAL Maroc S.A. | | | 466 | | | | 65,206 | |
| |
| | | | $ | 3,155,188 | |
|
| Nigeria — 1.0% | |
| | |
Access Bank PLC(4) | | | 9,080,193 | | | $ | 176,055 | |
| | |
Dangote Cement PLC(4) | | | 2,401,432 | | | | 1,185,855 | |
| | |
FBN Holdings PLC(4) | | | 8,190,197 | | | | 130,088 | |
| | |
Flour Mills of Nigeria PLC(4) | | | 3,215,556 | | | | 232,133 | |
| | |
Guaranty Trust Bank PLC(4) | | | 8,113,125 | | | | 583,815 | |
| | |
Lafarge Africa PLC(4) | | | 3,378,540 | | | | 211,811 | |
| | |
MTN Nigeria Communications PLC(4) | | | 1,163,700 | | | | 450,080 | |
| | |
Nestle Nigeria PLC(4) | | | 141,303 | | | | 445,334 | |
| | |
Nigerian Breweries PLC(4) | | | 2,570,740 | | | | 344,980 | |
| | |
SEPLAT Petroleum Development Co. PLC(3) | | | 528,379 | | | | 528,727 | |
| | |
Stanbic IBTC Holdings PLC(4) | | | 1,298,604 | | | | 121,989 | |
| | |
Transnational Corp. of Nigeria PLC(4) | | | 44,100,342 | | | | 94,805 | |
| | |
United Bank for Africa PLC(4) | | | 10,544,352 | | | | 198,003 | |
| | |
Zenith Bank PLC(4) | | | 7,051,959 | | | | 399,390 | |
| |
| | | | $ | 5,103,065 | |
|
| Oman — 0.6% | |
| | |
Bank Dhofar SAOG | | | 238,170 | | | $ | 64,933 | |
| | |
Bank Muscat SAOG | | | 666,889 | | | | 694,760 | |
| | |
Bank Nizwa SAOG(2) | | | 427,781 | | | | 106,447 | |
| | |
HSBC Bank Oman SAOG | | | 391,338 | | | | 84,429 | |
| | |
National Bank of Oman SAOG | | | 297,921 | | | | 100,425 | |
| | |
Oman Cables Industry SAOG | | | 64,900 | | | | 75,990 | |
| | |
Oman Cement Co. SAOG | | | 304,694 | | | | 221,255 | |
| | |
Oman Flour Mills Co. SAOG | | | 90,796 | | | | 158,106 | |
| | |
Oman Telecommunications Co. SAOG | | | 375,888 | | | | 742,102 | |
| | |
Omani Qatari Telecommunications Co. SAOG | | | 310,885 | | | | 344,230 | |
| | |
Ominvest | | | 103,161 | | | | 83,993 | |
| | |
Renaissance Services SAOG | | | 249,496 | | | | 227,777 | |
| | |
Sembcorp Salalah Power & Water Co. | | | 776,242 | | | | 195,577 | |
| | |
Sohar International Bank SAOG | | | 649,633 | | | | 152,556 | |
| |
| | | | $ | 3,252,580 | |
| | | | | | | | |
| Security | | Shares | | | Value | |
|
| Pakistan — 0.6% | |
| | |
Bank Alfalah, Ltd. | | | 369,958 | | | $ | 84,263 | |
| | |
Engro Corp., Ltd. | | | 90,410 | | | | 173,578 | |
| | |
Engro Fertilizers, Ltd. | | | 158,054 | | | | 64,160 | |
| | |
Fauji Fertilizer Co., Ltd. | | | 220,485 | | | | 151,475 | |
| | |
Habib Bank, Ltd. | | | 269,518 | | | | 238,882 | |
| | |
Hub Power Co., Ltd. (The) | | | 403,309 | | | | 220,330 | |
| | |
Lucky Cement, Ltd.(2) | | | 56,709 | | | | 257,333 | |
| | |
Mari Petroleum Co., Ltd. | | | 17,083 | | | | 149,991 | |
| | |
MCB Bank, Ltd. | | | 163,295 | | | | 196,313 | |
| | |
Millat Tractors, Ltd. | | | 46,738 | | | | 312,682 | |
| | |
Nishat Mills, Ltd. | | | 211,771 | | | | 149,395 | |
| | |
Oil & Gas Development Co., Ltd. | | | 382,291 | | | | 253,555 | |
| | |
Pakistan Oilfields, Ltd. | | | 56,711 | | | | 143,680 | |
| | |
Pakistan Petroleum, Ltd. | | | 387,571 | | | | 220,755 | |
| | |
Pakistan State Oil Co., Ltd.(2) | | | 144,660 | | | | 219,103 | |
| | |
Searle Co., Ltd. (The) | | | 121,651 | | | | 198,691 | |
| | |
United Bank, Ltd. | | | 219,304 | | | | 187,164 | |
| |
| | | | $ | 3,221,350 | |
|
| Panama — 0.2% | |
| | |
Banco Latinoamericano de Comercio Exterior S.A., Class E | | | 33,600 | | | $ | 512,064 | |
| | |
Copa Holdings S.A., Class A | | | 8,929 | | | | 690,837 | |
| |
| | | | $ | 1,202,901 | |
|
| Peru — 1.2% | |
| | |
Cia de Minas Buenaventura SAA ADR(2) | | | 108,350 | | | $ | 1,103,003 | |
| | |
Credicorp, Ltd. | | | 13,700 | | | | 2,059,521 | |
| | |
Ferreycorp SAA | | | 779,746 | | | | 439,408 | |
| | |
Southern Copper Corp. | | | 34,476 | | | | 2,289,551 | |
| | |
Volcan Cia Minera SAA, Class B(2) | | | 1,290,875 | | | | 216,459 | |
| |
| | | | $ | 6,107,942 | |
|
| Philippines — 2.3% | |
| | |
Aboitiz Equity Ventures, Inc. | | | 397,000 | | | $ | 328,265 | |
| | |
Aboitiz Power Corp. | | | 730,800 | | | | 364,371 | |
| | |
Alliance Global Group, Inc. | | | 772,200 | | | | 158,669 | |
| | |
Ayala Corp. | | | 35,395 | | | | 565,081 | |
| | |
Ayala Land, Inc. | | | 817,831 | | | | 638,801 | |
| | |
Ayala Land, Inc. GDR, PFC Shares(4) | | | 3,951,800 | | | | 0 | |
| | |
Bank of the Philippine Islands | | | 144,030 | | | | 237,810 | |
| | |
BDO Unibank, Inc. | | | 184,394 | | | | 385,035 | |
| | |
Bloomberry Resorts Corp. | | | 2,210,600 | | | | 365,320 | |
| | |
Cosco Capital, Inc. | | | 2,744,100 | | | | 293,455 | |
| | |
D&L Industries, Inc. | | | 1,162,500 | | | | 160,002 | |
| | |
First Gen Corp. | | | 319,822 | | | | 197,961 | |
| | | | |
| | 15 | | See Notes to Financial Statements. |
Parametric
Emerging Markets Fund
January 31, 2021
Portfolio of Investments — continued
| | | | | | | | |
| Security | | Shares | | | Value | |
|
| Philippines (continued) | |
| | |
Globe Telecom, Inc. | | | 10,029 | | | $ | 404,318 | |
| | |
International Container Terminal Services, Inc. | | | 133,500 | | | | 328,719 | |
| | |
JG Summit Holdings, Inc. | | | 453,358 | | | | 571,247 | |
| | |
Jollibee Foods Corp. | | | 175,326 | | | | 646,450 | |
| | |
Manila Electric Co. | | | 49,700 | | | | 269,273 | |
| | |
Manila Water Co.(2) | | | 415,800 | | | | 125,185 | |
| | |
Megaworld Corp. | | | 1,361,400 | | | | 107,772 | |
| | |
Metropolitan Bank & Trust Co. | | | 303,732 | | | | 283,515 | |
| | |
Nickel Asia Corp. | | | 1,816,240 | | | | 176,770 | |
| | |
Petron Corp. | | | 2,007,400 | | | | 147,495 | |
| | |
PLDT, Inc. | | | 30,440 | | | | 830,448 | |
| | |
Puregold Price Club, Inc. | | | 337,403 | | | | 252,133 | |
| | |
San Miguel Corp. | | | 82,970 | | | | 210,735 | |
| | |
Semirara Mining & Power Corp. | | | 681,020 | | | | 173,649 | |
| | |
SM Investments Corp. | | | 67,671 | | | | 1,383,883 | |
| | |
SM Prime Holdings, Inc. | | | 1,228,829 | | | | 899,171 | |
| | |
Universal Robina Corp. | | | 375,105 | | | | 1,052,560 | |
| |
| | | | $ | 11,558,093 | |
|
| Poland — 2.4% | |
| | |
AmRest Holdings SE(2) | | | 39,708 | | | $ | 301,118 | |
| | |
Asseco Poland S.A. | | | 47,782 | | | | 869,779 | |
| | |
Bank Polska Kasa Opieki S.A.(2) | | | 18,661 | | | | 317,611 | |
| | |
Budimex S.A. | | | 9,658 | | | | 836,598 | |
| | |
Cyfrowy Polsat S.A. | | | 81,987 | | | | 671,373 | |
| | |
Enea S.A.(2) | | | 80,414 | | | | 147,458 | |
| | |
Eurocash S.A.(1)(2) | | | 317,200 | | | | 1,162,273 | |
| | |
Grupa Azoty S.A.(2) | | | 25,745 | | | | 199,588 | |
| | |
Grupa Lotos S.A. | | | 23,698 | | | | 244,626 | |
| | |
KGHM Polska Miedz S.A.(2) | | | 19,644 | | | | 988,735 | |
| | |
LPP S.A.(2) | | | 815 | | | | 1,675,726 | |
| | |
mBank S.A.(2) | | | 1,863 | | | | 97,422 | |
| | |
Neuca S.A. | | | 662 | | | | 120,804 | |
| | |
Orange Polska S.A.(2) | | | 471,620 | | | | 830,188 | |
| | |
PGE S.A.(2) | | | 134,122 | | | | 234,211 | |
| | |
Polski Koncern Naftowy ORLEN S.A. | | | 77,189 | | | | 1,156,853 | |
| | |
Polskie Gornictwo Naftowe i Gazownictwo S.A. | | | 484,200 | | | | 732,882 | |
| | |
Powszechna Kasa Oszczednosci Bank Polski S.A.(2) | | | 94,583 | | | | 730,280 | |
| | |
Powszechny Zaklad Ubezpieczen S.A.(2) | | | 65,560 | | | | 523,299 | |
| | |
Santander Bank Polska S.A.(2) | | | 5,775 | | | | 279,453 | |
| | |
Tauron Polska Energia S.A.(2) | | | 318,408 | | | | 238,893 | |
| |
| | | | $ | 12,359,170 | |
|
| Qatar — 1.2% | |
| | |
Aamal Co. QSC | | | 465,350 | | | $ | 109,210 | |
| | |
Al Meera Consumer Goods Co. | | | 36,720 | | | | 202,102 | |
| | | | | | | | |
| Security | | Shares | | | Value | |
|
| Qatar (continued) | |
| | |
Barwa Real Estate Co. | | | 438,180 | | | $ | 395,429 | |
| | |
Commercial Bank PSQC (The) | | | 112,207 | | | | 130,848 | |
| | |
Gulf International Services QSC(2) | | | 443,811 | | | | 191,214 | |
| | |
Industries Qatar | | | 392,804 | | | | 1,294,346 | |
| | |
Masraf Al Rayan QSC | | | 228,674 | | | | 274,388 | |
| | |
Medicare Group | | | 45,960 | | | | 110,229 | |
| | |
Ooredoo QPSC | | | 210,500 | | | | 479,750 | |
| | |
Qatar Electricity & Water Co. QSC | | | 64,821 | | | | 315,230 | |
| | |
Qatar Gas Transport Co., Ltd. | | | 922,290 | | | | 831,928 | |
| | |
Qatar International Islamic Bank | | | 62,147 | | | | 151,200 | |
| | |
Qatar Islamic Bank | | | 48,537 | | | | 220,010 | |
| | |
Qatar National Bank QPSC | | | 234,986 | | | | 1,155,468 | |
| | |
United Development Co. QSC | | | 396,214 | | | | 169,354 | |
| | |
Vodafone Qatar QSC | | | 422,193 | | | | 173,131 | |
| |
| | | | $ | 6,203,837 | |
|
| Romania — 0.8% | |
| | |
Banca Transilvania S.A. | | | 1,083,999 | | | $ | 617,362 | |
| | |
BRD-Groupe Societe Generale S.A.(2) | | | 71,221 | | | | 266,084 | |
| | |
NEPI Rockcastle PLC | | | 136,380 | | | | 824,383 | |
| | |
OMV Petrom S.A. | | | 11,647,882 | | | | 1,151,204 | |
| | |
Societatea Energetica Electrica S.A. | | | 58,301 | | | | 189,558 | |
| | |
Societatea Nationala de Gaze Naturale ROMGAZ S.A. | | | 87,362 | | | | 670,350 | |
| | |
Transelectrica S.A. | | | 15,017 | | | | 105,684 | |
| | |
Transgaz S.A. Medias | | | 2,688 | | | | 204,332 | |
| |
| | | | $ | 4,028,957 | |
|
| Russia — 4.8% | |
| | |
Aeroflot PJSC(2) | | | 320,440 | | | $ | 293,589 | |
| | |
Alrosa PJSC | | | 275,900 | | | | 361,371 | |
| | |
Detsky Mir PJSC(3) | | | 223,540 | | | | 420,218 | |
| | |
Evraz PLC | | | 50,131 | | | | 342,766 | |
| | |
Federal Grid Co. Unified Energy System PJSC | | | 153,745,440 | | | | 425,152 | |
| | |
Gazprom PJSC ADR | | | 319,540 | | | | 1,776,296 | |
| | |
Globaltrans Investment PLC GDR(5) | | | 56,001 | | | | 377,013 | |
| | |
Inter RAO UES PJSC | | | 14,928,070 | | | | 1,031,288 | |
| | |
LSR Group PJSC GDR(5) | | | 82,952 | | | | 196,950 | |
| | |
Lukoil PJSC ADR | | | 18,549 | | | | 1,312,797 | |
| | |
Magnit PJSC | | | 32,440 | | | | 2,104,227 | |
| | |
Magnitogorsk Iron & Steel Works PJSC | | | 377,300 | | | | 255,495 | |
| | |
Mail.Ru Group, Ltd. GDR(2)(5) | | | 15,136 | | | | 394,309 | |
| | |
MMC Norilsk Nickel PJSC ADR(6) | | | 54,880 | | | | 1,761,996 | |
| | |
MMC Norilsk Nickel PJSC ADR(6) | | | 8,578 | | | | 277,155 | |
| | |
Mobile TeleSystems PJSC | | | 130,217 | | | | 565,358 | |
| | |
Moscow Exchange MICEX-RTS PJSC | | | 84,490 | | | | 174,461 | |
| | |
Novatek PJSC GDR(5) | | | 5,296 | | | | 883,738 | |
| | | | |
| | 16 | | See Notes to Financial Statements. |
Parametric
Emerging Markets Fund
January 31, 2021
Portfolio of Investments — continued
| | | | | | | | |
| Security | | Shares | | | Value | |
|
| Russia (continued) | |
| | |
Novolipetskiy Metallurgicheskiy Kombinat PAO GDR(5) | | | 11,326 | | | $ | 315,024 | |
| | |
OGK-2 PJSC | | | 12,211,000 | | | | 122,609 | |
| | |
PhosAgro PJSC GDR(5) | | | 22,492 | | | | 351,956 | |
| | |
PIK Group PJSC | | | 20,850 | | | | 194,167 | |
| | |
Polymetal International PLC | | | 28,470 | | | | 614,488 | |
| | |
QIWI PLC ADR(1) | | | 22,466 | | | | 217,696 | |
| | |
Rosneft Oil Co. PJSC GDR(5)(6) | | | 3,905 | | | | 24,203 | |
| | |
Rosneft Oil Co. PJSC GDR(5)(6) | | | 92,461 | | | | 570,572 | |
| | |
Rosseti PJSC | | | 8,311,000 | | | | 175,335 | |
| | |
Rostelecom PJSC(2) | | | 178,067 | | | | 236,678 | |
| | |
RusHydro PJSC | | | 62,585,080 | | | | 645,807 | |
| | |
Sberbank of Russia PJSC | | | 322,298 | | | | 1,094,969 | |
| | |
Severstal PAO GDR(5) | | | 25,659 | | | | 428,478 | |
| | |
Sistema PJSFC | | | 807,378 | | | | 334,262 | |
| | |
Surgutneftegas PJSC ADR | | | 85,751 | | | | 374,022 | |
| | |
Surgutneftegas PJSC, PFC Shares | | | 421,400 | | | | 223,236 | |
| | |
Tatneft PJSC ADR | | | 14,679 | | | | 568,947 | |
| | |
Transneft PJSC, PFC Shares | | | 148 | | | | 279,839 | |
| | |
Unipro PJSC | | | 3,687,000 | | | | 136,917 | |
| | |
VEON, Ltd. ADR | | | 112,584 | | | | 181,260 | |
| | |
VTB Bank PJSC | | | 267,370,000 | | | | 129,142 | |
| | |
X5 Retail Group NV GDR(5)(6) | | | 33,518 | | | | 1,181,760 | |
| | |
X5 Retail Group NV GDR(5)(6) | | | 8,586 | | | | 303,773 | |
| | |
Yandex NV, Class A(1)(2) | | | 45,300 | | | | 2,837,592 | |
| |
| | | | $ | 24,496,911 | |
|
| Saudi Arabia — 5.0% | |
| | |
Abdullah Al Othaim Markets Co. | | | 11,103 | | | $ | 368,604 | |
| | |
Advanced Petrochemical Co. | | | 9,504 | | | | 161,663 | |
| | |
Al Hammadi Co. for Development and
Investment(2) | | | 31,678 | | | | 235,638 | |
| | |
Al Rajhi Bank | | | 36,453 | | | | 708,254 | |
| | |
Alandalus Property Co. | | | 41,044 | | | | 234,909 | |
| | |
Aldrees Petroleum and Transport Services Co. | | | 7,178 | | | | 124,292 | |
| | |
Alinma Bank(2) | | | 41,348 | | | | 179,941 | |
| | |
Almarai Co. JSC | | | 66,532 | | | | 954,669 | |
| | |
Arabian Centres Co., Ltd. | | | 48,197 | | | | 304,838 | |
| | |
Arriyadh Development Co. | | | 72,620 | | | | 350,750 | |
| | |
Astra Industrial Group(2) | | | 26,471 | | | | 181,128 | |
| | |
Bank AlBilad | | | 13,959 | | | | 103,147 | |
| | |
Banque Saudi Fransi | | | 17,591 | | | | 157,528 | |
| | |
Dallah Healthcare Co. | | | 11,134 | | | | 162,925 | |
| | |
Dar Al Arkan Real Estate Development Co.(2) | | | 293,087 | | | | 671,325 | |
| | |
Dr Sulaiman Al Habib Medical Services Group Co. | | | 40,333 | | | | 1,238,509 | |
| | |
Dur Hospitality Co. | | | 17,800 | | | | 138,283 | |
| | |
Emaar Economic City(2) | | | 217,285 | | | | 522,825 | |
| | |
Etihad Etisalat Co.(2) | | | 51,337 | | | | 390,909 | |
| | | | | | | | |
| Security | | Shares | | | Value | |
|
| Saudi Arabia (continued) | |
| | |
Fawaz Abdulaziz Al Hokair & Co.(2) | | | 30,477 | | | $ | 172,613 | |
| | |
Herfy Food Services Co. | | | 12,001 | | | | 186,064 | |
| | |
Jadwa REIT Saudi Fund | | | 21,152 | | | | 80,500 | |
| | |
Jarir Marketing Co. | | | 30,570 | | | | 1,422,279 | |
| | |
Leejam Sports Co. JSC(2) | | | 15,200 | | | | 298,034 | |
| | |
Maharah Human Resources Co. | | | 8,190 | | | | 166,284 | |
| | |
Middle East Healthcare Co.(2) | | | 22,602 | | | | 208,566 | |
| | |
Mobile Telecommunications Co. Saudi Arabia(2) | | | 52,345 | | | | 191,273 | |
| | |
Mouwasat Medical Services Co. | | | 22,928 | | | | 878,674 | |
| | |
National Agriculture Development Co. (The)(2) | | | 22,099 | | | | 169,324 | |
| | |
National Commercial Bank | | | 47,545 | | | | 546,499 | |
| | |
National Gas & Industrialization Co.(2) | | | 12,747 | | | | 102,841 | |
| | |
National Medical Care Co. | | | 8,200 | | | | 114,738 | |
| | |
Rabigh Refining & Petrochemical Co.(2) | | | 28,719 | | | | 107,004 | |
| | |
Riyad Bank | | | 33,722 | | | | 191,495 | |
| | |
SABIC Agri-Nutrients Co. | | | 11,770 | | | | 290,675 | |
| | |
Sahara International Petrochemical Co. | | | 34,099 | | | | 166,792 | |
| | |
Samba Financial Group | | | 24,713 | | | | 198,308 | |
| | |
Saudi Airlines Catering Co. | | | 20,273 | | | | 414,649 | |
| | |
Saudi Arabian Mining Co.(2) | | | 22,495 | | | | 251,103 | |
| | |
Saudi Arabian Oil Co.(3) | | | 319,869 | | | | 2,961,474 | |
| | |
Saudi Basic Industries Corp. | | | 42,981 | | | | 1,173,703 | |
| | |
Saudi British Bank (The) | | | 26,256 | | | | 187,283 | |
| | |
Saudi Ceramic Co.(2) | | | 21,140 | | | | 273,187 | |
| | |
Saudi Chemical Co. Holding(2) | | | 23,815 | | | | 217,555 | |
| | |
Saudi Electricity Co. | | | 300,173 | | | | 1,770,080 | |
| | |
Saudi Ground Services Co.(2) | | | 51,767 | | | | 429,725 | |
| | |
Saudi Industrial Investment Group | | | 24,764 | | | | 169,740 | |
| | |
Saudi Industrial Services Co. | | | 17,935 | | | | 169,965 | |
| | |
Saudi Kayan Petrochemical Co.(2) | | | 59,809 | | | | 229,449 | |
| | |
Saudi Pharmaceutical Industries & Medical Appliances Corp. | | | 19,138 | | | | 196,275 | |
| | |
Saudi Public Transport Co.(2) | | | 35,200 | | | | 163,985 | |
| | |
Saudi Telecom Co. | | | 70,824 | | | | 2,134,002 | |
| | |
Saudia Dairy & Foodstuff Co. | | | 4,476 | | | | 191,231 | |
| | |
Savola Group (The) | | | 62,022 | | | | 650,019 | |
| | |
Seera Group Holding(2) | | | 79,590 | | | | 384,016 | |
| | |
United Electronics Co. | | | 17,042 | | | | 423,842 | |
| | |
United International Transportation Co. | | | 15,846 | | | | 164,974 | |
| | |
Yanbu National Petrochemical Co. | | | 18,600 | | | | 317,298 | |
| |
| | | | $ | 25,555,655 | |
|
| Slovenia — 0.6% | |
| | |
Cinkarna Celje DD | | | 468 | | | $ | 105,068 | |
| | |
KRKA DD | | | 17,069 | | | | 1,970,716 | |
| | |
Luka Koper | | | 4,115 | | | | 101,726 | |
| | | | |
| | 17 | | See Notes to Financial Statements. |
Parametric
Emerging Markets Fund
January 31, 2021
Portfolio of Investments — continued
| | | | | | | | |
| Security | | Shares | | | Value | |
|
| Slovenia (continued) | |
| | |
Petrol | | | 1,221 | | | $ | 498,094 | |
| | |
Pozavarovalnica Sava DD(2) | | | 6,675 | | | | 159,953 | |
| | |
Telekom Slovenije DD | | | 1,849 | | | | 103,188 | |
| | |
Zavarovalnica Triglav DD(2) | | | 6,306 | | | | 242,451 | |
| |
| | | | $ | 3,181,196 | |
|
| South Africa — 4.9% | |
| | |
African Rainbow Minerals, Ltd. | | | 9,775 | | | $ | 176,196 | |
| | |
Anglo American Platinum, Ltd. | | | 3,644 | | | | 362,525 | |
| | |
AngloGold Ashanti, Ltd. | | | 23,304 | | | | 543,045 | |
| | |
Aspen Pharmacare Holdings, Ltd.(2) | | | 132,591 | | | | 1,251,678 | |
| | |
AVI, Ltd. | | | 52,938 | | | | 263,597 | |
| | |
Barloworld, Ltd.(2) | | | 123,543 | | | | 768,911 | |
| | |
Bid Corp., Ltd. | | | 43,400 | | | | 720,693 | |
| | |
Bidvest Group, Ltd. (The) | | | 98,842 | | | | 1,018,870 | |
| | |
Capitec Bank Holdings, Ltd.(1)(2) | | | 2,132 | | | | 195,157 | |
| | |
Clicks Group, Ltd. | | | 36,700 | | | | 602,992 | |
| | |
DataTec, Ltd.(2) | | | 160,600 | | | | 261,286 | |
| | |
Discovery, Ltd. | | | 21,090 | | | | 178,772 | |
| | |
Equites Property Fund, Ltd. | | | 104,000 | | | | 115,199 | |
| | |
Exxaro Resources, Ltd. | | | 85,410 | | | | 848,372 | |
| | |
FirstRand, Ltd. | | | 239,835 | | | | 753,262 | |
| | |
Fortress REIT, Ltd., Class A | | | 395,418 | | | | 340,854 | |
| | |
Foschini Group, Ltd. (The)(2) | | | 27,608 | | | | 186,306 | |
| | |
Gold Fields, Ltd. | | | 51,097 | | | | 479,105 | |
| | |
Growthpoint Properties, Ltd. | | | 976,000 | | | | 780,022 | |
| | |
Harmony Gold Mining Co., Ltd.(2) | | | 39,953 | | | | 177,215 | |
| | |
Hyprop Investments, Ltd.(1) | | | 165,000 | | | | 270,720 | |
| | |
Impala Platinum Holdings, Ltd. | | | 43,462 | | | | 586,935 | |
| | |
Imperial Logistics, Ltd. | | | 60,958 | | | | 170,558 | |
| | |
Kumba Iron Ore, Ltd. | | | 4,760 | | | | 190,693 | |
| | |
Life Healthcare Group Holdings, Ltd.(2) | | | 258,186 | | | | 329,651 | |
| | |
Mediclinic International PLC(2) | | | 175,506 | | | | 683,139 | |
| | |
Mr Price Group, Ltd. | | | 12,155 | | | | 138,115 | |
| | |
MTN Group, Ltd.(1) | | | 330,800 | | | | 1,364,733 | |
| | |
MultiChoice Group, Ltd. | | | 44,057 | | | | 375,186 | |
| | |
Naspers, Ltd., Class N | | | 17,507 | | | | 4,049,880 | |
| | |
Netcare, Ltd. | | | 662,637 | | | | 585,316 | |
| | |
Northam Platinum, Ltd.(2) | | | 22,902 | | | | 284,521 | |
| | |
Pick’n Pay Stores, Ltd. | | | 68,562 | | | | 241,219 | |
| | |
Redefine Properties, Ltd.(1)(2) | | | 1,426,091 | | | | 313,224 | |
| | |
Resilient REIT, Ltd. | | | 80,000 | | | | 209,572 | |
| | |
Reunert, Ltd.(1) | | | 148,479 | | | | 373,959 | |
| | |
Sanlam, Ltd. | | | 28,912 | | | | 110,165 | |
| | |
Sasol, Ltd.(2) | | | 26,893 | | | | 289,890 | |
| | |
Shoprite Holdings, Ltd. | | | 77,515 | | | | 716,417 | |
| | | | | | | | |
| Security | | Shares | | | Value | |
|
| South Africa (continued) | |
| | |
Sibanye Stillwater, Ltd. | | | 109,812 | | | $ | 416,865 | |
| | |
SPAR Group, Ltd. (The) | | | 35,131 | | | | 449,224 | |
| | |
Standard Bank Group, Ltd. | | | 16,101 | | | | 133,481 | |
| | |
Telkom S.A. SOC, Ltd.(1) | | | 126,250 | | | | 280,130 | |
| | |
Tiger Brands, Ltd. | | | 30,240 | | | | 397,457 | |
| | |
Truworths International, Ltd.(1) | | | 58,994 | | | | 173,316 | |
| | |
Vodacom Group, Ltd. | | | 170,100 | | | | 1,387,534 | |
| | |
Wilson Bayly Holmes-Ovcon, Ltd.(2) | | | 56,523 | | | | 307,030 | |
| | |
Woolworths Holdings, Ltd. | | | 46,024 | | | | 136,356 | |
| |
| | | | $ | 24,989,343 | |
|
| South Korea — 4.6% | |
| | |
Alteogen, Inc.(2) | | | 1,032 | | | $ | 121,931 | |
| | |
AMOREPACIFIC Corp. | | | 1,675 | | | | 333,864 | |
| | |
AMOREPACIFIC Group | | | 3,776 | | | | 198,833 | |
| | |
Bukwang Pharmaceutical Co., Ltd. | | | 7,850 | | | | 156,373 | |
| | |
Celltrion Healthcare Co., Ltd.(2) | | | 4,045 | | | | 518,156 | |
| | |
Celltrion Pharm, Inc.(2) | | | 1,249 | | | | 195,144 | |
| | |
Celltrion, Inc.(2) | | | 4,022 | | | | 1,161,000 | |
| | |
Cheil Worldwide, Inc. | | | 6,871 | | | | 118,273 | |
| | |
CJ CheilJedang Corp. | | | 423 | | | | 160,623 | |
| | |
CJ ENM Co., Ltd. | | | 525 | | | | 71,579 | |
| | |
CJ Logistics Corp.(2) | | | 1,141 | | | | 171,072 | |
| | |
Coway Co., Ltd.(2) | | | 2,548 | | | | 158,242 | |
| | |
Daewoo Industrial Development Co., Ltd.(2) | | | 3,657 | | | | 11,917 | |
| | |
DL E&C Co., Ltd.(2) | | | 963 | | | | 95,983 | |
| | |
DL Holdings Co., Ltd. | | | 768 | | | | 41,747 | |
| | |
E-MART, Inc. | | | 1,232 | | | | 180,480 | |
| | |
GS Engineering & Construction Corp. | | | 4,785 | | | | 162,947 | |
| | |
GS Holdings Corp. | | | 3,569 | | | | 115,819 | |
| | |
Hana Financial Group, Inc. | | | 4,716 | | | | 137,492 | |
| | |
Hanjin Kal Corp. | | | 2,015 | | | | 109,781 | |
| | |
Hankook Tire and Technology Co., Ltd. | | | 3,779 | | | | 138,536 | |
| | |
Hanmi Pharm Co., Ltd. | | | 910 | | | | 310,056 | |
| | |
Hanwha Solutions Corp. | | | 3,548 | | | | 157,851 | |
| | |
Helixmith Co., Ltd.(2) | | | 6,351 | | | | 144,686 | |
| | |
Hugel, Inc.(2) | | | 1,353 | | | | 236,809 | |
| | |
Hyundai Department Store Co., Ltd. | | | 1,615 | | | | 112,886 | |
| | |
Hyundai Engineering & Construction Co., Ltd. | | | 4,384 | | | | 157,497 | |
| | |
Hyundai Glovis Co., Ltd. | | | 758 | | | | 128,543 | |
| | |
Hyundai Heavy Industries Holdings Co., Ltd. | | | 522 | | | | 109,690 | |
| | |
Hyundai Mobis Co., Ltd. | | | 1,774 | | | | 502,732 | |
| | |
Hyundai Motor Co. | | | 3,829 | | | | 780,700 | |
| | |
Hyundai Steel Co. | | | 3,449 | | | | 119,329 | |
| | |
Kakao Corp.(2) | | | 1,323 | | | | 519,736 | |
| | |
Kangwon Land, Inc. | | | 5,706 | | | | 119,926 | |
| | | | |
| | 18 | | See Notes to Financial Statements. |
Parametric
Emerging Markets Fund
January 31, 2021
Portfolio of Investments — continued
| | | | | | | | |
| Security | | Shares | | | Value | |
|
| South Korea (continued) | |
| | |
KB Financial Group, Inc.(2) | | | 3,231 | | | $ | 116,656 | |
| | |
Kia Motors Corp. | | | 5,941 | | | | 435,405 | |
| | |
Korea Electric Power Corp.(2) | | | 4,640 | | | | 94,679 | |
| | |
Korea Shipbuilding & Offshore Engineering Co., Ltd.(2) | | | 1,749 | | | | 146,500 | |
| | |
Korea Zinc Co., Ltd. | | | 591 | | | | 213,248 | |
| | |
KT&G Corp.(2) | | | 5,452 | | | | 390,072 | |
| | |
Kumho Petrochemical Co., Ltd. | | | 743 | | | | 163,211 | |
| | |
LG Chem, Ltd. | | | 852 | | | | 694,936 | |
| | |
LG Corp. | | | 4,000 | | | | 353,706 | |
| | |
LG Electronics, Inc. | | | 3,189 | | | | 435,373 | |
| | |
LG Household & Health Care, Ltd. | | | 353 | | | | 491,398 | |
| | |
LG Uplus Corp. | | | 7,151 | | | | 76,287 | |
| | |
Lotte Chemical Corp. | | | 814 | | | | 189,308 | |
| | |
Lotte Corp. | | | 2,725 | | | | 78,994 | |
| | |
MedPacto, Inc.(2) | | | 1,418 | | | | 97,119 | |
| | |
Medytox, Inc. | | | 1,454 | | | | 157,700 | |
| | |
Mezzion Pharma Co., Ltd.(2) | | | 1,299 | | | | 155,223 | |
| | |
Naver Corp. | | | 3,055 | | | | 932,176 | |
| | |
NCsoft Corp. | | | 372 | | | | 315,177 | |
| | |
NHN Corp.(2) | | | 1,349 | | | | 84,017 | |
| | |
Nong Shim Co., Ltd. | | | 592 | | | | 149,207 | |
| | |
Orion Corp. of Republic of Korea | | | 1,268 | | | | 135,934 | |
| | |
POSCO | | | 2,031 | | | | 445,816 | |
| | |
S-Oil Corp. | | | 3,651 | | | | 222,799 | |
| | |
S1 Corp. | | | 1,533 | | | | 110,503 | |
| | |
Samsung Biologics Co., Ltd.(2)(3) | | | 829 | | | | 586,927 | |
| | |
Samsung C&T Corp. | | | 2,297 | | | | 266,175 | |
| | |
Samsung Electro-Mechanics Co., Ltd. | | | 1,243 | | | | 226,087 | |
| | |
Samsung Electronics Co., Ltd. | | | 60,082 | | | | 4,392,413 | |
| | |
Samsung Heavy Industries Co., Ltd.(2) | | | 11,850 | | | | 65,737 | |
| | |
Samsung SDI Co., Ltd. | | | 823 | | | | 537,667 | |
| | |
Samsung SDS Co., Ltd. | | | 1,370 | | | | 238,565 | |
| | |
Seegene, Inc. | | | 1,630 | | | | 237,803 | |
| | |
Shinhan Financial Group Co., Ltd.(2) | | | 4,669 | | | | 128,045 | |
| | |
Shinsegae, Inc. | | | 727 | | | | 151,878 | |
| | |
SK Holdings Co., Ltd. | | | 1,250 | | | | 347,351 | |
| | |
SK Hynix, Inc. | | | 6,250 | | | | 682,378 | |
| | |
SK Innovation Co., Ltd. | | | 3,846 | | | | 960,135 | |
| | |
SK Telecom Co., Ltd. | | | 1,060 | | | | 231,174 | |
| | |
Yuhan Corp. | | | 3,861 | | | | 226,468 | |
| | |
Zyle Motor Sales Corp.(2) | | | 5,113 | | | | 5,485 | |
| |
| | | | $ | 23,729,965 | |
|
| Sri Lanka — 0.6% | |
| | |
Ceylon Tobacco Co. PLC | | | 38,480 | | | $ | 221,749 | |
| | |
Chevron Lubricants Lanka PLC | | | 343,215 | | | | 198,598 | |
| | | | | | | | |
| Security | | Shares | | | Value | |
|
| Sri Lanka (continued) | |
| | |
Commercial Bank of Ceylon PLC | | | 340,279 | | | $ | 179,587 | |
| | |
Dialog Axiata PLC | | | 2,513,619 | | | | 167,013 | |
| | |
Hatton National Bank PLC | | | 218,856 | | | | 177,397 | |
| | |
Hemas Holdings PLC | | | 285,028 | | | | 144,823 | |
| | |
John Keells Holdings PLC | | | 1,335,887 | | | | 1,180,699 | |
| | |
Lanka IOC PLC | | | 537,378 | | | | 74,700 | |
| | |
Melstacorp PLC | | | 1,431,058 | | | | 498,922 | |
| | |
National Development Bank PLC | | | 184,215 | | | | 94,546 | |
| | |
Sampath Bank PLC | | | 170,952 | | | | 181,560 | |
| | |
Teejay Lanka PLC | | | 836,829 | | | | 195,317 | |
| |
| | | | $ | 3,314,911 | |
|
| Taiwan — 4.7% | |
| | |
AcBel Polytech, Inc. | | | 287,000 | | | $ | 288,026 | |
| | |
Accton Technology Corp. | | | 20,000 | | | | 191,982 | |
| | |
Acer, Inc. | | | 119,519 | | | | 115,095 | |
| | |
Advantech Co., Ltd. | | | 18,697 | | | | 230,556 | |
| | |
AirTAC International Group | | | 10,178 | | | | 362,125 | |
| | |
ASE Technology Holding Co., Ltd. | | | 48,561 | | | | 159,907 | |
| | |
Asustek Computer, Inc. | | | 18,325 | | | | 187,256 | |
| | |
AU Optronics Corp.(2) | | | 187,837 | | | | 98,772 | |
| | |
Catcher Technology Co., Ltd. | | | 20,183 | | | | 142,322 | |
| | |
Cathay Financial Holding Co., Ltd. | | | 96,916 | | | | 137,854 | |
| | |
Center Laboratories, Inc. | | | 195,079 | | | | 416,728 | |
| | |
Cheng Shin Rubber Industry Co., Ltd. | | | 257,672 | | | | 366,829 | |
| | |
China Motor Corp.(2) | | | 112,926 | | | | 186,927 | |
| | |
China Steel Corp. | | | 497,734 | | | | 407,506 | |
| | |
Chunghwa Telecom Co., Ltd. | | | 346,746 | | | | 1,338,331 | |
| | |
Compal Electronics, Inc. | | | 260,345 | | | | 199,132 | |
| | |
CTBC Financial Holding Co., Ltd. | | | 171,275 | | | | 116,032 | |
| | |
Delta Electronics, Inc. | | | 23,151 | | | | 233,028 | |
| | |
E.Sun Financial Holding Co., Ltd. | | | 133,890 | | | | 112,834 | |
| | |
Eclat Textile Co., Ltd. | | | 18,159 | | | | 262,388 | |
| | |
EVA Airways Corp. | | | 463,861 | | | | 207,666 | |
| | |
Evergreen International Storage & Transport Corp. | | | 354,000 | | | | 196,975 | |
| | |
Evergreen Marine Corp.(2) | | | 329,441 | | | | 366,159 | |
| | |
Far Eastern Department Stores, Ltd. | | | 212,990 | | | | 163,463 | |
| | |
Far Eastern New Century Corp. | | | 386,695 | | | | 358,146 | |
| | |
Far EasTone Telecommunications Co., Ltd. | | | 139,084 | | | | 297,848 | |
| | |
Feng Hsin Steel Co., Ltd. | | | 71,260 | | | | 160,063 | |
| | |
First Financial Holding Co., Ltd. | | | 158,120 | | | | 113,926 | |
| | |
Formosa Chemicals & Fibre Corp. | | | 135,014 | | | | 373,136 | |
| | |
Formosa Petrochemical Corp. | | | 146,320 | | | | 464,321 | |
| | |
Formosa Plastics Corp. | | | 171,183 | | | | 531,612 | |
| | |
Formosa Taffeta Co., Ltd. | | | 182,149 | | | | 189,002 | |
| | |
Fubon Financial Holding Co., Ltd. | | | 77,596 | | | | 125,993 | |
| | | | |
| | 19 | | See Notes to Financial Statements. |
Parametric
Emerging Markets Fund
January 31, 2021
Portfolio of Investments — continued
| | | | | | | | |
| Security | | Shares | | | Value | |
|
| Taiwan (continued) | |
| | |
Giant Manufacturing Co., Ltd. | | | 36,208 | | | $ | 351,303 | |
| | |
Great Wall Enterprise Co., Ltd. | | | 151,102 | | | | 259,993 | |
| | |
Hiwin Technologies Corp. | | | 26,082 | | | | 367,906 | |
| | |
Hon Hai Precision Industry Co., Ltd. | | | 131,443 | | | | 522,763 | |
| | |
Hota Industrial Manufacturing Co., Ltd. | | | 62,659 | | | | 255,545 | |
| | |
Hotai Motor Co., Ltd. | | | 22,000 | | | | 443,323 | |
| | |
Inventec Corp. | | | 178,966 | | | | 148,592 | |
| | |
Kenda Rubber Industrial Co., Ltd. | | | 139,902 | | | | 159,589 | |
| | |
Largan Precision Co., Ltd. | | | 1,795 | | | | 187,884 | |
| | |
MediaTek, Inc. | | | 17,462 | | | | 545,402 | |
| | |
Mega Financial Holding Co., Ltd. | | | 128,303 | | | | 128,862 | |
| | |
Merida Industry Co., Ltd. | | | 17,657 | | | | 166,820 | |
| | |
Nan Kang Rubber Tire Co., Ltd. | | | 95,253 | | | | 128,094 | |
| | |
Nan Ya Plastics Corp. | | | 236,214 | | | | 553,485 | |
| | |
Novatek Microelectronics Corp. | | | 9,000 | | | | 126,203 | |
| | |
Pegatron Corp. | | | 92,028 | | | | 257,517 | |
| | |
PharmaEssentia Corp.(2) | | | 45,064 | | | | 145,372 | |
| | |
Pou Chen Corp. | | | 151,819 | | | | 151,515 | |
| | |
Powertech Technology, Inc. | | | 59,865 | | | | 207,574 | |
| | |
President Chain Store Corp. | | | 57,664 | | | | 549,448 | |
| | |
Quanta Computer, Inc. | | | 42,508 | | | | 122,292 | |
| | |
Radium Life Tech Co., Ltd. | | | 1 | | | | 0 | |
| | |
Realtek Semiconductor Corp. | | | 13,002 | | | | 209,158 | |
| | |
Ruentex Development Co., Ltd. | | | 56,790 | | | | 78,371 | |
| | |
Sanyang Motor Co., Ltd. | | | 224,866 | | | | 252,436 | |
| | |
St. Shine Optical Co., Ltd. | | | 22,000 | | | | 208,099 | |
| | |
Tainan Spinning Co., Ltd. | | | 224,822 | | | | 100,996 | |
| | |
Taiwan Cement Corp. | | | 156,441 | | | | 223,920 | |
| | |
Taiwan Mobile Co., Ltd. | | | 136,296 | | | | 467,981 | |
| | |
Taiwan Semiconductor Manufacturing Co., Ltd. | | | 202,369 | | | | 4,276,743 | |
| | |
Teco Electric & Machinery Co., Ltd. | | | 120,000 | | | | 114,859 | |
| | |
Tong Yang Industry Co., Ltd. | | | 105,608 | | | | 134,910 | |
| | |
TTY Biopharm Co., Ltd. | | | 194,096 | | | | 424,049 | |
| | |
Tung Ho Steel Enterprise Corp. | | | 118,060 | | | | 132,204 | |
| | |
Uni-President Enterprises Corp. | | | 378,831 | | | | 919,588 | |
| | |
United Microelectronics Corp. | | | 156,090 | | | | 279,676 | |
| | |
Walsin Lihwa Corp. | | | 462,000 | | | | 271,081 | |
| | |
Wan Hai Lines, Ltd. | | | 72,962 | | | | 111,156 | |
| | |
Wei Chuan Foods Corp. | | | 179,000 | | | | 128,343 | |
| | |
Win Semiconductors Corp. | | | 16,000 | | | | 234,894 | |
| | |
Xxentria Technology Materials Corp. | | | 143,700 | | | | 294,793 | |
| | |
Yageo Corp. | | | 13,000 | | | | 265,393 | |
| | |
Yang Ming Marine Transport(2) | | | 179,621 | | | | 126,473 | |
| | |
Yieh Phui Enterprise Co., Ltd.(2) | | | 212,046 | | | | 85,743 | |
| |
| | | | $ | 24,222,288 | |
| | | | | | | | |
| Security | | Shares | | | Value | |
|
| Thailand — 4.9% | |
| | |
Advanced Info Service PCL(7) | | | 153,900 | | | $ | 882,688 | |
| | |
Airports of Thailand PCL(7) | | | 669,800 | | | | 1,325,955 | |
| | |
Asset World Corp. PCL(7) | | | 2,001,200 | | | | 306,175 | |
| | |
Bangkok Bank PCL(7) | | | 68,500 | | | | 258,678 | |
| | |
Bangkok Chain Hospital PCL(7) | | | 974,100 | | | | 471,916 | |
| | |
Bangkok Dusit Medical Services PCL(7) | | | 2,541,100 | | | | 1,753,151 | |
| | |
Bangkok Expressway & Metro PCL(7) | | | 1,065,400 | | | | 289,505 | |
| | |
Bangkok Land PCL(7) | | | 4,163,800 | | | | 143,292 | |
| | |
Banpu PCL(7) | | | 365,500 | | | | 126,266 | |
| | |
BTS Group Holdings PCL(7) | | | 1,082,800 | | | | 341,107 | |
| | |
Bumrungrad Hospital PCL(7) | | | 234,200 | | | | 979,272 | |
| | |
Carabao Group PCL(7) | | | 27,500 | | | | 133,028 | |
| | |
Central Pattana PCL(7) | | | 255,500 | | | | 416,435 | |
| | |
Central Retail Corp. PCL(2)(7) | | | 729,066 | | | | 745,356 | |
| | |
CH. Karnchang PCL(2)(7) | | | 187,120 | | | | 95,950 | |
| | |
Charoen Pokphand Foods PCL(7) | | | 412,400 | | | | 374,576 | |
| | |
Chularat Hospital PCL(7) | | | 3,228,500 | | | | 280,458 | |
| | |
CP ALL PCL(2)(7) | | | 390,200 | | | | 744,863 | |
| | |
Delta Electronics (Thailand) PCL(7) | | | 195,200 | | | | 3,427,191 | |
| | |
Electricity Generating PCL(7) | | | 35,200 | | | | 209,109 | |
| | |
Energy Absolute PCL(7) | | | 157,000 | | | | 339,242 | |
| | |
Global Power Synergy PCL(7) | | | 92,100 | | | | 239,814 | |
| | |
Gulf Energy Development PCL(7) | | | 396,400 | | | | 442,539 | |
| | |
Hana Microelectronics PCL(7) | | | 287,900 | | | | 515,066 | |
| | |
Home Product Center PCL(7) | | | 945,455 | | | | 431,139 | |
| | |
Indorama Ventures PCL(7) | | | 365,900 | | | | 426,145 | |
| | |
IRPC PCL(7) | | | 2,001,600 | | | | 226,028 | |
| | |
Jasmine International PCL(7) | | | 2,514,300 | | | | 253,321 | |
| | |
Jay Mart PCL(7) | | | 333,000 | | | | 249,228 | |
| | |
Kasikornbank PCL(7) | | | 86,600 | | | | 365,576 | |
| | |
KCE Electronics PCL(7) | | | 281,900 | | | | 515,753 | |
| | |
Land & Houses PCL(7) | | | 862,500 | | | | 223,856 | |
| | |
Mega Lifesciences PCL(7) | | | 324,800 | | | | 437,997 | |
| | |
Minor International PCL(2)(7) | | | 585,044 | | | | 483,003 | |
| | |
Pruksa Holding PCL(7) | | | 518,200 | | | | 212,401 | |
| | |
PTG Energy PCL(7) | | | 277,800 | | | | 159,645 | |
| | |
PTT Exploration & Production PCL(7) | | | 209,398 | | | | 719,030 | |
| | |
PTT Global Chemical PCL(7) | | | 291,500 | | | | 571,545 | |
| | |
PTT PCL(7) | | | 1,024,200 | | | | 1,284,904 | |
| | |
Quality House PCL(7) | | | 2,194,346 | | | | 171,257 | |
| | |
Ratch Group PCL(7) | | | 86,900 | | | | 143,339 | |
| | |
Samart Corp. PCL(7) | | | 556,600 | | | | 119,760 | |
| | |
Siam Cement PCL(7) | | | 51,600 | | | | 650,240 | |
| | |
Siam City Cement PCL(7) | | | 39,783 | | | | 180,301 | |
| | |
Siam Commercial Bank PCL(7) | | | 113,600 | | | | 356,074 | |
| | |
Siam Global House PCL(7) | | | 581,522 | | | | 402,149 | |
| | | | |
| | 20 | | See Notes to Financial Statements. |
Parametric
Emerging Markets Fund
January 31, 2021
Portfolio of Investments — continued
| | | | | | | | |
| Security | | Shares | �� | | Value | |
|
| Thailand (continued) | |
| | |
Sino-Thai Engineering & Construction PCL(7) | | | 251,357 | | | $ | 98,738 | |
| | |
Sri Trang Agro-Industry PCL(7) | | | 201,600 | | | | 202,072 | |
| | |
Thai Beverage PCL(7) | | | 772,600 | | | | 478,386 | |
| | |
Thai Oil PCL(7) | | | 122,400 | | | | 221,219 | |
| | |
Total Access Communication PCL(7) | | | 197,600 | | | | 213,927 | |
| | |
True Corp. PCL(7) | | | 2,633,690 | | | | 280,666 | |
| | |
VGI PCL(7) | | | 729,400 | | | | 162,324 | |
| | |
WHA Corp. PCL(7) | | | 1,909,300 | | | | 191,571 | |
| |
| | | | $ | 25,273,226 | |
|
| Tunisia — 0.6% | |
| | |
Attijari Bank(2) | | | 12,409 | | | $ | 116,604 | |
| | |
Banque de Tunisie(2) | | | 137,839 | | | | 320,712 | |
| | |
Banque Internationale Arabe de Tunisie(2) | | | 4,129 | | | | 141,896 | |
| | |
Banque Nationale Agricole(2) | | | 65,193 | | | | 190,257 | |
| | |
Carthage Cement(2) | | | 597,550 | | | | 414,141 | |
| | |
Euro Cycles S.A. | | | 20,636 | | | | 197,635 | |
| | |
Poulina Group | | | 121,415 | | | | 449,294 | |
| | |
Societe d’Articles Hygieniques S.A. | | | 54,642 | | | | 245,540 | |
| | |
Societe Frigorifique et Brasserie de Tunis S.A. | | | 102,438 | | | | 718,436 | |
| | |
Telnet Holding | | | 80,460 | | | | 244,854 | |
| | |
Union Internationale de Banques S.A.(2) | | | 15,493 | | | | 90,649 | |
| |
| | | | $ | 3,130,018 | |
|
| Turkey — 2.4% | |
| | |
AG Anadolu Grubu Holding AS(2) | | | 29,984 | | | $ | 111,127 | |
| | |
Akbank T.A.S.(2) | | | 173,896 | | | | 150,478 | |
| | |
Aksa Akrilik Kimya Sanayii AS | | | 115,402 | | | | 230,135 | |
| | |
Anadolu Efes Biracilik ve Malt Sanayii AS | | | 70,980 | | | | 240,146 | |
| | |
Arcelik AS(2) | | | 105,751 | | | | 475,748 | |
| | |
Aselsan Elektronik Sanayi Ve Ticaret AS | | | 123,586 | | | | 291,826 | |
| | |
Aygaz AS | | | 214,571 | | | | 531,766 | |
| | |
Bera Holding AS(2) | | | 64,248 | | | | 179,578 | |
| | |
BIM Birlesik Magazalar AS | | | 79,132 | | | | 778,763 | |
| | |
EGE Endustri VE Ticaret AS | | | 780 | | | | 178,653 | |
| | |
Emlak Konut Gayrimenkul Yatirim Ortakligi AS | | | 844,248 | | | | 277,839 | |
| | |
Enka Insaat ve Sanayi AS | | | 223,270 | | | | 237,126 | |
| | |
Eregli Demir ve Celik Fabrikalari TAS | | | 253,414 | | | | 495,181 | |
| | |
Ford Otomotiv Sanayi AS | | | 36,741 | | | | 720,087 | |
| | |
Haci Omer Sabanci Holding AS | | | 124,627 | | | | 178,645 | |
| | |
Ipek Dogal Enerji Kaynaklari Arastirma Ve Uretim AS(2) | | | 90,659 | | | | 156,456 | |
| | |
Is Gayrimenkul Yatirim Ortakligi AS(2) | | | 294,820 | | | | 97,783 | |
| | |
Kardemir Karabuk Demir Celik Sanayi ve Ticaret AS, Class D(2) | | | 319,727 | | | | 291,089 | |
| | |
KOC Holding AS | | | 181,039 | | | | 495,759 | |
| | | | | | | | |
| Security | | Shares | | | Value | |
|
| Turkey (continued) | |
| | |
Koza Altin Isletmeleri AS(2) | | | 11,612 | | | $ | 182,217 | |
| | |
Koza Anadolu Metal Madencilik Isletmeleri AS(2) | | | 96,193 | | | | 202,236 | |
| | |
Logo Yazilim Sanayi Ve Ticaret AS(2) | | | 16,770 | | | | 317,562 | |
| | |
Mavi Giyim Sanayi Ve Ticaret AS, Class B(2)(3) | | | 16,665 | | | | 120,342 | |
| | |
Migros Ticaret AS(2) | | | 29,279 | | | | 176,085 | |
| | |
MLP Saglik Hizmetleri AS(2)(3) | | | 115,614 | | | | 359,949 | |
| | |
Petkim Petrokimya Holding AS(2) | | | 333,696 | | | | 228,126 | |
| | |
Selcuk Ecza Deposu Ticaret ve Sanayi AS | | | 167,309 | | | | 290,987 | |
| | |
Tofas Turk Otomobil Fabrikasi AS | | | 72,038 | | | | 354,772 | |
| | |
Turk Hava Yollari AO(2) | | | 136,076 | | | | 224,489 | |
| | |
Turk Telekomunikasyon AS | | | 271,014 | | | | 292,016 | |
| | |
Turkcell Iletisim Hizmetleri AS | | | 536,300 | | | | 1,174,412 | |
| | |
Turkiye Garanti Bankasi AS(2) | | | 132,898 | | | | 168,345 | |
| | |
Turkiye Is Bankasi AS, Class C(2) | | | 182,514 | | | | 152,270 | |
| | |
Turkiye Petrol Rafinerileri AS(2) | | | 111,203 | | | | 1,503,321 | |
| | |
Turkiye Sise ve Cam Fabrikalari AS | | | 252,910 | | | | 249,128 | |
| | |
Ulker Biskuvi Sanayi AS(2) | | | 45,810 | | | | 141,203 | |
| | |
Vestel Elektronik Sanayi ve Ticaret AS(2) | | | 32,694 | | | | 116,683 | |
| |
| | | | $ | 12,372,328 | |
|
| United Arab Emirates — 1.2% | |
| | |
Abu Dhabi Commercial Bank PJSC | | | 244,653 | | | $ | 427,662 | |
| | |
Agthia Group PJSC | | | 54,046 | | | | 77,829 | |
| | |
Air Arabia PJSC | | | 617,797 | | | | 213,968 | |
| | |
Aldar Properties PJSC | | | 448,750 | | | | 426,569 | |
| | |
Dana Gas PJSC | | | 1,146,811 | | | | 212,108 | |
| | |
Dubai Investments PJSC | | | 551,381 | | | | 247,685 | |
| | |
Dubai Islamic Bank PJSC | | | 185,711 | | | | 253,640 | |
| | |
DXB Entertainments PJSC(2) | | | 2,622,754 | | | | 58,928 | |
| | |
Emaar Development PJSC(2) | | | 214,000 | | | | 170,758 | |
| | |
Emaar Malls PJSC(2) | | | 290,300 | | | | 142,690 | |
| | |
Emaar Properties PJSC(2) | | | 501,217 | | | | 517,232 | |
| | |
Emirates Telecommunications Group Co. PJSC | | | 370,519 | | | | 2,001,072 | |
| | |
First Abu Dhabi Bank PJSC | | | 279,636 | | | | 1,140,721 | |
| | |
Network International Holdings PLC(2)(3) | | | 54,200 | | | | 252,510 | |
| | |
RAK Properties PJSC | | | 762,162 | | �� | | 119,944 | |
| |
| | | | $ | 6,263,316 | |
|
| Vietnam — 1.1% | |
| | |
Bank for Foreign Trade of Vietnam JSC | | | 71,355 | | | $ | 286,642 | |
| | |
Bao Viet Holdings | | | 76,930 | | | | 187,671 | |
| | |
FLC Faros Construction JSC(2) | | | 2 | | | | 0 | |
| | |
Hoa Phat Group JSC | | | 768,644 | | | | 1,299,526 | |
| | |
Hoang Anh Gia Lai International Agriculture JSC(2) | | | 107,600 | | | | 52,129 | |
| | |
Kinh Bac City Development Share Holding Corp.(2) | | | 60 | | | | 95 | |
| | | | |
| | 21 | | See Notes to Financial Statements. |
Parametric
Emerging Markets Fund
January 31, 2021
Portfolio of Investments — continued
| | | | | | | | |
| Security | | Shares | | | Value | |
|
| Vietnam (continued) | |
| | |
Masan Group Corp. | | | 100,680 | | | $ | 371,947 | |
| | |
No Va Land Investment Group Corp.(2) | | | 68,640 | | | | 238,557 | |
| | |
PetroVietnam Drilling & Well Services JSC(2) | | | 156,985 | | | | 119,599 | |
| | |
PetroVietnam Gas JSC | | | 74,340 | | | | 244,626 | |
| | |
PetroVietnam Technical Services Corp. | | | 141,700 | | | | 101,620 | |
| | |
Phu Nhuan Jewelry JSC | | | 3 | | | | 12 | |
| | |
Saigon Beer Alcohol Beverage Corp. | | | 24,110 | | | | 168,692 | |
| | |
Vietjet Aviation JSC(2) | | | 150,066 | | | | 817,997 | |
| | |
Vietnam Dairy Products JSC | | | 157,192 | | | | 698,849 | |
| | |
Vincom Retail JSC(2) | | | 131,380 | | | | 181,746 | |
| | |
Vingroup JSC(2) | | | 137,687 | | | | 591,810 | |
| | |
Vinhomes JSC(2)(3) | | | 103,000 | | | | 415,505 | |
| |
| | | | $ | 5,777,023 | |
| |
Total Common Stocks
(identified cost $389,655,172) | | | $ | 512,581,799 | |
|
| Rights (2) — 0.0%(8) | |
| Security | | Shares | | | Value | |
| | |
Banque Nationale Agricole, Exp. 4/15/49 | | | 50 | | | $ | 3 | |
| | |
Hanwha Solutions Corp., Exp. 2/25/21 | | | 555 | | | | 2,431 | |
| | |
No Va Land Investment Group Corp., Exp. 3/9/21 | | | 68,640 | | | | 4,919 | |
| | |
Societe Frigorifique et Brasserie de Tunis S.A., Exp. 7/20/50 | | | 3 | | | | 0 | |
| | |
Telnet Holding, Exp. 7/1/49 | | | 6 | | | | 0 | |
| |
Total Rights
(identified cost $0) | | | $ | 7,353 | |
|
| Short-Term Investments — 0.3% | |
| Description | | Shares | | | Value | |
| | |
State Street Navigator Securities Lending Government Money Market Portfolio, 0.06%(9) | | | 1,561,493 | | | $ | 1,561,493 | |
| |
Total Short-Term Investments
(identified cost $1,561,493) | | | $ | 1,561,493 | |
| |
Total Investments — 100.0%
(identified cost $391,216,665) | | | $ | 514,150,645 | |
| |
Other Assets, Less Liabilities — 0.0%(8) | | | $ | 17,557 | |
| |
Net Assets — 100.0% | | | $ | 514,168,202 | |
The percentage shown for each investment category in the Portfolio of Investments is based on net assets.
| (1) | All or a portion of this security was on loan at January 31, 2021. The aggregate market value of securities on loan at January 31, 2021 was $10,205,813. |
| (2) | Non-income producing security. |
| (3) | Security exempt from registration under Rule 144A of the Securities Act of 1933, as amended. These securities may be sold in certain transactions in reliance on an exemption from registration (normally to qualified institutional buyers). At January 31, 2021, the aggregate value of these securities is $13,333,047 or 2.6% of the Fund’s net assets. |
| (4) | For fair value measurement disclosure purposes, security is categorized as Level 3 (see Note 10). |
| (5) | Security exempt from registration under Regulation S of the Securities Act of 1933, as amended, which exempts from registration securities offered and sold outside the United States. Security may not be offered or sold in the United States except pursuant to an exemption from, or in a transaction not subject to, the registration requirements of the Securities Act of 1933, as amended. At January 31, 2021, the aggregate value of these securities is $6,509,920 or 1.3% of the Fund’s net assets. |
| (6) | Securities are traded on separate exchanges for the same entity. |
| (7) | Indicates a foreign registered security. Shares issued to foreign investors in markets that have foreign ownership limits. |
| (8) | Amount is less than 0.05%. |
| (9) | Represents investment of cash collateral received in connection with securities lending. |
| | | | | | | | |
| Sector Classification of Portfolio | |
| Sector | | Percentage
of Net Assets | | | Value | |
| | |
Financials | | | 12.1 | % | | $ | 62,119,423 | |
| | |
Materials | | | 10.6 | | | | 54,233,114 | |
| | |
Consumer Staples | | | 10.3 | | | | 53,131,004 | |
| | |
Industrials | | | 10.1 | | | | 51,996,813 | |
| | |
Communication Services | | | 10.0 | | | | 51,483,871 | |
| | |
Consumer Discretionary | | | 9.9 | | | | 51,053,885 | |
| | |
Information Technology | | | 9.5 | | | | 48,641,309 | |
| | |
Health Care | | | 8.9 | | | | 45,676,424 | |
| | |
Energy | | | 8.7 | | | | 44,535,384 | |
| | |
Real Estate | | | 5.0 | | | | 25,843,063 | |
| | |
Utilities | | | 4.6 | | | | 23,874,862 | |
| | |
Short-Term Investments | | | 0.3 | | | | 1,561,493 | |
| | |
Total Investments | | | 100.0 | % | | $ | 514,150,645 | |
Abbreviations:
| | | | |
| | |
| ADR | | – | | American Depositary Receipt |
| | |
| GDR | | – | | Global Depositary Receipt |
| | |
| PCL | | – | | Public Company Ltd. |
| | |
| PFC Shares | | – | | Preference Shares |
| | | | |
| | 22 | | See Notes to Financial Statements. |
Parametric
Emerging Markets Fund
January 31, 2021
Statement of Assets and Liabilities
| | | | |
| Assets | | January 31, 2021 | |
| |
Unaffiliated investments, at value including $10,205,813 of securities on loan (identified cost, $391,216,665) | | $ | 514,150,645 | |
| |
Cash | | | 1,202,202 | |
| |
Foreign currency, at value (identified cost, $3,712,882) | | | 3,463,373 | |
| |
Dividends receivable | | | 402,391 | |
| |
Receivable for investments sold | | | 189,451 | |
| |
Receivable for Fund shares sold | | | 294,788 | |
| |
Securities lending income receivable | | | 4,171 | |
| |
Tax reclaims receivable | | | 67,402 | |
| |
Total assets | | $ | 519,774,423 | |
|
| Liabilities | |
| |
Collateral for securities loaned | | $ | 1,561,493 | |
| |
Payable for investments purchased | | | 80,549 | |
| |
Payable for Fund shares redeemed | | | 1,795,856 | |
|
Payable to affiliates: | |
| |
Investment adviser fee | | | 393,231 | |
| |
Administration fee | | | 69,761 | |
| |
Distribution and service fees | | | 10,630 | |
| |
Accrued foreign capital gains taxes | | | 836,865 | |
| |
Accrued expenses | | | 857,836 | |
| |
Total liabilities | | $ | 5,606,221 | |
| |
Net Assets | | $ | 514,168,202 | |
|
| Sources of Net Assets | |
| |
Paid-in capital | | $ | 739,294,613 | |
| |
Accumulated loss | | | (225,126,411 | ) |
| |
Total | | $ | 514,168,202 | |
|
| Investor Class Shares | |
| |
Net Assets | | $ | 45,629,303 | |
| |
Shares Outstanding | | | 3,101,736 | |
| |
Net Asset Value, Offering Price and Redemption Price Per Share | | | | |
| |
(net assets ÷ shares of beneficial interest outstanding) | | $ | 14.71 | |
|
| Class C Shares | |
| |
Net Assets | | $ | 592,030 | |
| |
Shares Outstanding | | | 40,906 | |
| |
Net Asset Value and Offering Price Per Share* | | | | |
| |
(net assets ÷ shares of beneficial interest outstanding) | | $ | 14.47 | |
|
| Institutional Class Shares | |
| |
Net Assets | | $ | 383,983,508 | |
| |
Shares Outstanding | | | 26,103,578 | |
| |
Net Asset Value, Offering Price and Redemption Price Per Share | | | | |
| |
(net assets ÷ shares of beneficial interest outstanding) | | $ | 14.71 | |
|
| Class R6 Shares | |
| |
Net Assets | | $ | 83,963,361 | |
| |
Shares Outstanding | | | 5,714,245 | |
| |
Net Asset Value, Offering Price and Redemption Price Per Share | | | | |
| |
(net assets ÷ shares of beneficial interest outstanding) | | $ | 14.69 | |
| * | Redemption price per share is equal to the net asset value less any applicable contingent deferred sales charge. |
| | | | |
| | 23 | | See Notes to Financial Statements. |
Parametric
Emerging Markets Fund
January 31, 2021
Statement of Operations
| | | | |
| Investment Income | | Year Ended
January 31, 2021 | |
| |
Dividends (net of foreign taxes, $1,971,130) | | $ | 18,634,292 | |
| |
Interest | | | 23 | |
| |
Securities lending income, net | | | 106,170 | |
| |
Other income | | | 22,148 | |
| |
Total investment income | | $ | 18,762,633 | |
|
| Expenses | |
| |
Investment adviser fee | | $ | 5,237,982 | |
| |
Administration fee | | | 935,439 | |
|
Distribution and service fees | |
| |
Investor Class | | | 172,258 | |
| |
Class C | | | 15,771 | |
| |
Trustees’ fees and expenses | | | 30,472 | |
| |
Custodian fee | | | 785,017 | |
| |
Transfer and dividend disbursing agent fees | | | 499,914 | |
| |
Legal and accounting services | | | 175,572 | |
| |
Printing and postage | | | 79,978 | |
| |
Registration fees | | | 85,109 | |
| |
Interest expense and fees | | | 75,719 | |
| |
Miscellaneous | | | 94,078 | |
| |
Total expenses | | $ | 8,187,309 | |
| |
Net investment income | | $ | 10,575,324 | |
| |
| Realized and Unrealized Gain (Loss) | | | | |
|
Net realized gain (loss) — | |
| |
Investment transactions (net of foreign capital gains taxes of $97,762) | | $ | (28,359,771 | ) |
| |
Foreign currency transactions | | | (1,501,307 | ) |
| |
Net realized loss | | $ | (29,861,078 | ) |
|
Change in unrealized appreciation (depreciation) — | |
| |
Investments (including net increase in accrued foreign capital gains taxes of $228,513) | | $ | (19,764,694 | ) |
| |
Foreign currency | | | (188,798 | ) |
| |
Net change in unrealized appreciation (depreciation) | | $ | (19,953,492 | ) |
| |
Net realized and unrealized loss | | $ | (49,814,570 | ) |
| |
Net decrease in net assets from operations | | $ | (39,239,246 | ) |
| | | | |
| | 24 | | See Notes to Financial Statements. |
Parametric
Emerging Markets Fund
January 31, 2021
Statements of Changes in Net Assets
| | | | | | | | |
| | | Year Ended January 31, | |
| Increase (Decrease) in Net Assets | | 2021 | | | 2020 | |
|
From operations — | |
| | |
Net investment income | | $ | 10,575,324 | | | $ | 33,480,366 | |
| | |
Net realized gain (loss) | | | (29,861,078 | ) | | | 25,937,211 | |
| | |
Net change in unrealized appreciation (depreciation) | | | (19,953,492 | ) | | | (63,992,378 | ) |
| | |
Net decrease in net assets from operations | | $ | (39,239,246 | ) | | $ | (4,574,801 | ) |
|
Distributions to shareholders — | |
| | |
Investor Class | | $ | (517,127 | ) | | $ | (3,563,992 | ) |
| | |
Class C | | | (2,636 | ) | | | (71,989 | ) |
| | |
Institutional Class | | | (6,548,939 | ) | | | (26,125,933 | ) |
| | |
Class R6 | | | (1,365,394 | ) | | | (1,708,275 | ) |
| | |
Total distributions to shareholders | | $ | (8,434,096 | ) | | $ | (31,470,189 | ) |
|
Transactions in shares of beneficial interest — | |
| | |
Proceeds from sale of shares | | | | | | | | |
| | |
Investor Class | | $ | 19,968,785 | | | $ | 22,407,787 | |
| | |
Class C | | | 7,509 | | | | 25,393 | |
| | |
Institutional Class | | | 113,192,804 | | | | 101,088,906 | |
| | |
Class R6 | | | 57,809,024 | | | | 13,876,477 | |
| | |
Net asset value of shares issued to shareholders in payment of distributions declared | | | | | | | | |
| | |
Investor Class | | | 473,732 | | | | 3,415,839 | |
| | |
Class C | | | 2,299 | | | | 67,952 | |
| | |
Institutional Class | | | 4,692,336 | | | | 19,632,098 | |
| | |
Class R6 | | | 1,365,394 | | | | 1,688,797 | |
| | |
Cost of shares redeemed | | | | | | | | |
| | |
Investor Class | | | (102,246,783 | ) | | | (58,261,381 | ) |
| | |
Class C | | | (2,368,248 | ) | | | (1,054,357 | ) |
| | |
Institutional Class | | | (563,557,711 | ) | | | (490,943,703 | ) |
| | |
Class R6 | | | (31,591,503 | ) | | | (53,323,266 | ) |
| | |
Net asset value of shares converted | | | | | | | | |
| | |
Investor Class | | | 847,874 | | | | 707,712 | |
| | |
Class C | | | (847,874 | ) | | | (707,712 | ) |
| | |
Net decrease in net assets from Fund share transactions | | $ | (502,252,362 | ) | | $ | (441,379,458 | ) |
| | |
Net decrease in net assets | | $ | (549,925,704 | ) | | $ | (477,424,448 | ) |
|
| Net Assets | |
| | |
At beginning of year | | $ | 1,064,093,906 | | | $ | 1,541,518,354 | |
| | |
At end of year | | $ | 514,168,202 | | | $ | 1,064,093,906 | |
| | | | |
| | 25 | | See Notes to Financial Statements. |
Parametric
Emerging Markets Fund
January 31, 2021
Financial Highlights
| | | | | | | | | | | | | | | | | | | | |
| | | Investor Class | |
| |
| | | Year Ended January 31, | |
| | | 2021 | | | 2020 | | | 2019 | | | 2018 | | | 2017 | |
| | | | | |
Net asset value — Beginning of year | | $ | 13.870 | | | $ | 14.280 | | | $ | 16.850 | | | $ | 13.340 | | | $ | 10.990 | |
| | | | | |
| Income (Loss) From Operations | | | | | | | | | | | | | | | | | | | | |
| | | | | |
Net investment income(1) | | $ | 0.213 | | | $ | 0.326 | | | $ | 0.283 | | | $ | 0.223 | | | $ | 0.179 | |
| | | | | |
Net realized and unrealized gain (loss) | | | 0.786 | (2) | | | (0.376 | ) | | | (2.570 | ) | | | 3.650 | | | | 2.364 | |
| | | | | |
Total income (loss) from operations | | $ | 0.999 | | | $ | (0.050 | ) | | $ | (2.287 | ) | | $ | 3.873 | | | $ | 2.543 | |
| | | | | |
| Less Distributions | | | | | | | | | | | | | | | | | | | | |
| | | | | |
From net investment income | | $ | (0.159 | ) | | $ | (0.360 | ) | | $ | (0.283 | ) | | $ | (0.363 | ) | | $ | (0.193 | ) |
| | | | | |
Total distributions | | $ | (0.159 | ) | | $ | (0.360 | ) | | $ | (0.283 | ) | | $ | (0.363 | ) | | $ | (0.193 | ) |
| | | | | |
Net asset value — End of year | | $ | 14.710 | | | $ | 13.870 | | | $ | 14.280 | | | $ | 16.850 | | | $ | 13.340 | |
| | | | | |
Total Return(3) | | | 7.23 | % | | | (0.46 | )% | | | (13.43 | )% | | | 29.33 | % | | | 23.32 | % |
| | | | | |
| Ratios/Supplemental Data | | | | | | | | | | | | | | | | | | | | |
| | | | | |
Net assets, end of year (000’s omitted) | | $ | 45,629 | | | $ | 136,829 | | | $ | 172,773 | | | $ | 400,814 | | | $ | 520,939 | |
| | | | | |
Ratios (as a percentage of average daily net assets): | | | | | | | | | | | | | | | | | | | | |
| | | | | |
Expenses | | | 1.55 | % | | | 1.45 | % | | | 1.44 | % | | | 1.37 | % | | | 1.38 | % |
| | | | | |
Net investment income | | | 1.74 | % | | | 2.30 | % | | | 1.89 | % | | | 1.52 | % | | | 1.44 | % |
| | | | | |
Portfolio Turnover | | | 19 | % | | | 2 | % | | | 2 | % | | | 3 | % | | | 6 | % |
| (1) | Computed using average shares outstanding. |
| (2) | The per share amount is not in accord with the net realized and unrealized gain (loss) for the period because of the timing of Fund share transactions and the amount of the per share realized and unrealized gains and losses at such time. |
| (3) | Returns are historical and are calculated by determining the percentage change in net asset value with all distributions reinvested. |
| | | | |
| | 26 | | See Notes to Financial Statements. |
Parametric
Emerging Markets Fund
January 31, 2021
Financial Highlights — continued
| | | | | | | | | | | | | | | | | | | | |
| | | Class C | |
| |
| | | Year Ended January 31, | |
| | | 2021 | | | 2020 | | | 2019 | | | 2018 | | | 2017 | |
| | | | | |
Net asset value — Beginning of year | | $ | 13.620 | | | $ | 14.010 | | | $ | 16.530 | | | $ | 13.120 | | | $ | 10.840 | |
| | | | | |
| Income (Loss) From Operations | | | | | | | | | | | | | | | | | | | | |
| | | | | |
Net investment income(1) | | $ | 0.116 | | | $ | 0.220 | | | $ | 0.146 | | | $ | 0.096 | | | $ | 0.083 | |
| | | | | |
Net realized and unrealized gain (loss) | | | 0.755 | (2) | | | (0.379 | ) | | | (2.484 | ) | | | 3.580 | | | | 2.340 | |
| | | | | |
Total income (loss) from operations | | $ | 0.871 | | | $ | (0.159 | ) | | $ | (2.338 | ) | | $ | 3.676 | | | $ | 2.423 | |
| | | | | |
| Less Distributions | | | | | | | | | | | | | | | | | | | | |
| | | | | |
From net investment income | | $ | (0.021 | ) | | $ | (0.231 | ) | | $ | (0.182 | ) | | $ | (0.266 | ) | | $ | (0.143 | ) |
| | | | | |
Total distributions | | $ | (0.021 | ) | | $ | (0.231 | ) | | $ | (0.182 | ) | | $ | (0.266 | ) | | $ | (0.143 | ) |
| | | | | |
Net asset value — End of year | | $ | 14.470 | | | $ | 13.620 | | | $ | 14.010 | | | $ | 16.530 | | | $ | 13.120 | |
| | | | | |
Total Return(3) | | | 6.42 | % | | | (1.21 | )% | | | (14.10 | )% | | | 28.32 | % | | | 22.50 | % |
| | | | | |
| Ratios/Supplemental Data | | | | | | | | | | | | | | | | | | | | |
| | | | | |
Net assets, end of year (000’s omitted) | | $ | 592 | | | $ | 4,094 | | | $ | 5,885 | | | $ | 10,152 | | | $ | 9,209 | |
| | | | | |
Ratios (as a percentage of average daily net assets): | | | | | | | | | | | | | | | | | | | | |
| | | | | |
Expenses | | | 2.30 | % | | | 2.20 | % | | | 2.19 | % | | | 2.12 | % | | | 2.13 | % |
| | | | | |
Net investment income | | | 0.96 | % | | | 1.59 | % | | | 1.01 | % | | | 0.66 | % | | | 0.68 | % |
| | | | | |
Portfolio Turnover | | | 19 | % | | | 2 | % | | | 2 | % | | | 3 | % | | | 6 | % |
| (1) | Computed using average shares outstanding. |
| (2) | The per share amount is not in accord with the net realized and unrealized gain (loss) for the period because of the timing of Fund share transactions and the amount of the per share realized and unrealized gains and losses at such time. |
| (3) | Returns are historical and are calculated by determining the percentage change in net asset value with all distributions reinvested and do not reflect the effect of sales charges. |
| | | | |
| | 27 | | See Notes to Financial Statements. |
Parametric
Emerging Markets Fund
January 31, 2021
Financial Highlights — continued
| | | | | | | | | | | | | | | | | | | | |
| | | Institutional Class | |
| |
| | | Year Ended January 31, | |
| | | 2021 | | | 2020 | | | 2019 | | | 2018 | | | 2017 | |
| | | | | |
Net asset value — Beginning of year | | $ | 13.900 | | | $ | 14.310 | | | $ | 16.910 | | | $ | 13.400 | | | $ | 11.040 | |
| | | | | |
| Income (Loss) From Operations | | | | | | | | | | | | | | | | | | | | |
| | | | | |
Net investment income(1) | | $ | 0.210 | | | $ | 0.367 | | | $ | 0.304 | | | $ | 0.245 | | | $ | 0.212 | |
| | | | | |
Net realized and unrealized gain (loss) | | | 0.827 | (2) | | | (0.378 | ) | | | (2.565 | ) | | | 3.673 | | | | 2.375 | |
| | | | | |
Total income (loss) from operations | | $ | 1.037 | | | $ | (0.011 | ) | | $ | (2.261 | ) | | $ | 3.918 | | | $ | 2.587 | |
| | | | | |
| Less Distributions | | | | | | | | | | | | | | | | | | | | |
| | | | | |
From net investment income | | $ | (0.227 | ) | | $ | (0.399 | ) | | $ | (0.339 | ) | | $ | (0.408 | ) | | $ | (0.227 | ) |
| | | | | |
Total distributions | | $ | (0.227 | ) | | $ | (0.399 | ) | | $ | (0.339 | ) | | $ | (0.408 | ) | | $ | (0.227 | ) |
| | | | | |
Net asset value — End of year | | $ | 14.710 | | | $ | 13.900 | | | $ | 14.310 | | | $ | 16.910 | | | $ | 13.400 | |
| | | | | |
Total Return(3) | | | 7.50 | % | | | (0.20 | )% | | | (13.20 | )% | | | 29.56 | % | | | 23.64 | % |
| | | | | |
| Ratios/Supplemental Data | | | | | | | | | | | | | | | | | | | | |
| | | | | |
Net assets, end of year (000’s omitted) | | $ | 383,984 | | | $ | 868,666 | | | $ | 1,268,618 | | | $ | 2,030,663 | | | $ | 1,884,610 | |
| | | | | |
Ratios (as a percentage of average daily net assets): | | | | | | | | | | | | | | | | | | | | |
| | | | | |
Expenses | | | 1.30 | % | | | 1.20 | % | | | 1.19 | % | | | 1.12 | % | | | 1.13 | % |
| | | | | |
Net investment income | | | 1.68 | % | | | 2.59 | % | | | 2.04 | % | | | 1.65 | % | | | 1.68 | % |
| | | | | |
Portfolio Turnover | | | 19 | % | | | 2 | % | | | 2 | % | | | 3 | % | | | 6 | % |
| (1) | Computed using average shares outstanding. |
| (2) | The per share amount is not in accord with the net realized and unrealized gain (loss) for the period because of the timing of Fund share transactions and the amount of the per share realized and unrealized gains and losses at such time. |
| (3) | Returns are historical and are calculated by determining the percentage change in net asset value with all distributions reinvested. |
| | | | |
| | 28 | | See Notes to Financial Statements. |
Parametric
Emerging Markets Fund
January 31, 2021
Financial Highlights — continued
| | | | | | | | | | | | | | | | | | | | |
| | | Class R6 | |
| |
| | | Year Ended January 31, | |
| | | 2021 | | | 2020 | | | 2019 | | | 2018 | | | 2017 | |
| | | | | |
Net asset value — Beginning of year | | $ | 13.890 | | | $ | 14.300 | | | $ | 16.910 | | | $ | 13.400 | | | $ | 11.040 | |
| | | | | |
| Income (Loss) From Operations | | | | | | | | | | | | | | | | | | | | |
| | | | | |
Net investment income(1) | | $ | 0.228 | | | $ | 0.379 | | | $ | 0.380 | | | $ | 0.249 | | | $ | 0.225 | |
| | | | | |
Net realized and unrealized gain (loss) | | | 0.813 | (2) | | | (0.379 | ) | | | (2.639 | ) | | | 3.676 | | | | 2.370 | |
| | | | | |
Total income (loss) from operations | | $ | 1.041 | | | $ | — | | | $ | (2.259 | ) | | $ | 3.925 | | | $ | 2.595 | |
| | | | | |
| Less Distributions | | | | | | | | | | | | | | | | | | | | |
| | | | | |
From net investment income | | $ | (0.241 | ) | | $ | (0.410 | ) | | $ | (0.351 | ) | | $ | (0.415 | ) | | $ | (0.235 | ) |
| | | | | |
Total distributions | | $ | (0.241 | ) | | $ | (0.410 | ) | | $ | (0.351 | ) | | $ | (0.415 | ) | | $ | (0.235 | ) |
| | | | | |
Net asset value — End of year | | $ | 14.690 | | | $ | 13.890 | | | $ | 14.300 | | | $ | 16.910 | | | $ | 13.400 | |
| | | | | |
Total Return(3) | | | 7.45 | % | | | (0.13 | )% | | | (13.18 | )% | | | 29.69 | % | | | 23.71 | % |
| | | | | |
| Ratios/Supplemental Data | | | | | | | | | | | | | | | | | | | | |
| | | | | |
Net assets, end of year (000’s omitted) | | $ | 83,963 | | | $ | 54,504 | | | $ | 94,243 | | | $ | 601,629 | | | $ | 539,794 | |
| | | | | |
Ratios (as a percentage of average daily net assets): | | | | | | | | | | | | | | | | | | | | |
| | | | | |
Expenses | | | 1.21 | % | | | 1.14 | % | | | 1.13 | % | | | 1.07 | % | | | 1.08 | % |
| | | | | |
Net investment income | | | 1.83 | % | | | 2.67 | % | | | 2.48 | % | | | 1.67 | % | | | 1.79 | % |
| | | | | |
Portfolio Turnover | | | 19 | % | | | 2 | % | | | 2 | % | | | 3 | % | | | 6 | % |
| (1) | Computed using average shares outstanding. |
| (2) | The per share amount is not in accord with the net realized and unrealized gain (loss) for the period because of the timing of Fund share transactions and the amount of the per share realized and unrealized gains and losses at such time. |
| (3) | Returns are historical and are calculated by determining the percentage change in net asset value with all distributions reinvested. |
| | | | |
| | 29 | | See Notes to Financial Statements. |
Parametric
Emerging Markets Fund
January 31, 2021
Notes to Financial Statements
1 Significant Accounting Policies
Parametric Emerging Markets Fund (the Fund) is a diversified series of Eaton Vance Mutual Funds Trust (the Trust). The Trust is a Massachusetts business trust registered under the Investment Company Act of 1940, as amended (the 1940 Act), as an open-end management investment company. The Fund’s investment objective is to seek long-term capital appreciation. The Fund offers four classes of shares. Investor Class, Institutional Class and Class R6 shares are sold at net asset value and are not subject to a sales charge. Class C shares are sold at net asset value and are generally subject to a contingent deferred sales charge (see Note 5). Effective March 1, 2013, Class C shares of the Fund are no longer available for purchase, except by existing shareholders (including shares acquired through the reinvestment of dividends and distributions) or employer sponsored retirement plans. Effective January 25, 2019, Class C shares of the Fund generally automatically convert to Investor Class shares ten years after their purchase and, effective November 5, 2020, automatically convert to Investor Class shares eight years after their purchase as described in the Fund’s prospectus. Each class represents a pro-rata interest in the Fund, but votes separately on class-specific matters and (as noted below) is subject to different expenses. Realized and unrealized gains and losses and net investment income and losses, other than class-specific expenses, are allocated daily to each class of shares based on the relative net assets of each class to the total net assets of the Fund. Sub-accounting, recordkeeping and similar administrative fees payable to financial intermediaries, which are a component of transfer and dividend disbursing agent fees on the Statement of Operations, are not allocated to Class R6 shares. Each class of shares differs in its distribution plan and certain other class-specific expenses.
The following is a summary of significant accounting policies of the Fund. The policies are in conformity with accounting principles generally accepted in the United States of America (U.S. GAAP). The Fund is an investment company and follows accounting and reporting guidance in the Financial Accounting Standards Board (FASB) Accounting Standards Codification Topic 946.
A Investment Valuation — The following methodologies are used to determine the market value or fair value of investments.
Equity Securities. Equity securities listed on a U.S. securities exchange generally are valued at the last sale or closing price on the day of valuation or, if no sales took place on such date, at the mean between the closing bid and ask prices on the exchange where such securities are principally traded. Equity securities listed on the NASDAQ Global or Global Select Market generally are valued at the NASDAQ official closing price. Unlisted or listed securities for which closing sales prices or closing quotations are not available are valued at the mean between the latest available bid and ask prices.
Foreign Securities and Currencies. Foreign securities and currencies are valued in U.S. dollars, based on foreign currency exchange rate quotations supplied by a third party pricing service. The pricing service uses a proprietary model to determine the exchange rate. Inputs to the model include reported trades and implied bid/ask spreads. The daily valuation of exchange-traded foreign securities generally is determined as of the close of trading on the principal exchange on which such securities trade. Events occurring after the close of trading on foreign exchanges may result in adjustments to the valuation of foreign securities to more accurately reflect their fair value as of the close of regular trading on the New York Stock Exchange. When valuing foreign equity securities that meet certain criteria, the Fund’s Trustees have approved the use of a fair value service that values such securities to reflect market trading that occurs after the close of the applicable foreign markets of comparable securities or other instruments that have a strong correlation to the fair-valued securities.
Other. Investments in registered investment companies (including money market funds) that do not trade on an exchange are valued at the net asset value per share on the valuation day.
Fair Valuation. Investments for which valuations or market quotations are not readily available or are deemed unreliable are valued at fair value using methods determined in good faith by or at the direction of the Trustees of the Fund in a manner that most fairly reflects the security’s “fair value”, which is the amount that the Fund might reasonably expect to receive for the security upon its current sale in the ordinary course. Each such determination is based on a consideration of relevant factors, which are likely to vary from one pricing context to another. These factors may include, but are not limited to, the type of security, the existence of any contractual restrictions on the security’s disposition, the price and extent of public trading in similar securities of the issuer or of comparable companies or entities, quotations or relevant information obtained from broker/dealers or other market participants, information obtained from the issuer, analysts, and/or the appropriate stock exchange (for exchange-traded securities), an analysis of the company’s or entity’s financial statements, and an evaluation of the forces that influence the issuer and the market(s) in which the security is purchased and sold.
B Investment Transactions — Investment transactions for financial statement purposes are accounted for on a trade date basis. Realized gains and losses on investments sold are determined on the basis of identified cost.
C Income — Dividend income is recorded on the ex-dividend date for dividends received in cash and/or securities. However, if the ex-dividend date has passed, certain dividends from foreign securities are recorded as the Fund is informed of the ex-dividend date. Withholding taxes on foreign dividends and capital gains have been provided for in accordance with the Fund’s understanding of the applicable countries’ tax rules and rates. In consideration of recent decisions rendered by European courts, the Fund has filed additional tax reclaims for previously withheld taxes on dividends earned in certain European Union countries. These filings are subject to various administrative and judicial proceedings within these countries. During the year ended January 31, 2020, the Fund received approximately $22,000 from Poland for previously withheld foreign taxes and interest thereon. Such amount is included in other income on the Statement of Operations. No other amounts for additional tax reclaims are reflected in the financial statements due to the uncertainty as to the ultimate resolution of proceedings, the likelihood of receipt of these reclaims, and the potential timing of payment. Interest income is recorded on the basis of interest accrued.
D Federal and Other Taxes — The Fund’s policy is to comply with the provisions of the Internal Revenue Code applicable to regulated investment companies and to distribute to shareholders each year substantially all of its net investment income, and all or substantially all of its net realized capital gains. Accordingly, no provision for federal income or excise tax is necessary.
Parametric
Emerging Markets Fund
January 31, 2021
Notes to Financial Statements — continued
In addition to the requirements of the Internal Revenue Code, the Fund may also be subject to local taxes on the recognition of capital gains in certain countries. In determining the daily net asset value, the Fund estimates the accrual for such taxes, if any, based on the unrealized appreciation on certain portfolio securities and the related tax rates. Taxes attributable to unrealized appreciation are included in the change in unrealized appreciation (depreciation) on investments. Capital gains taxes on securities sold are included in net realized gain (loss) on investments.
As of January 31, 2021, the Fund had no uncertain tax positions that would require financial statement recognition, de-recognition, or disclosure. The Fund files a U.S. federal income tax return annually after its fiscal year-end, which is subject to examination by the Internal Revenue Service for a period of three years from the date of filing.
E Expenses — The majority of expenses of the Trust are directly identifiable to an individual fund. Expenses which are not readily identifiable to a specific fund are allocated taking into consideration, among other things, the nature and type of expense and the relative size of the funds.
F Foreign Currency Translation — Investment valuations, other assets, and liabilities initially expressed in foreign currencies are translated each business day into U.S. dollars based upon current exchange rates. Purchases and sales of foreign investment securities and income and expenses denominated in foreign currencies are translated into U.S. dollars based upon currency exchange rates in effect on the respective dates of such transactions. Recognized gains or losses on investment transactions attributable to changes in foreign currency exchange rates are recorded for financial statement purposes as net realized gains and losses on investments. That portion of unrealized gains and losses on investments that results from fluctuations in foreign currency exchange rates is not separately disclosed.
G Use of Estimates — The preparation of the financial statements in conformity with U.S. GAAP requires management to make estimates and assumptions that affect the reported amounts of assets and liabilities at the date of the financial statements and the reported amounts of income and expense during the reporting period. Actual results could differ from those estimates.
H Indemnifications — Under the Trust’s organizational documents, its officers and Trustees may be indemnified against certain liabilities and expenses arising out of the performance of their duties to the Fund. Under Massachusetts law, if certain conditions prevail, shareholders of a Massachusetts business trust (such as the Trust) could be deemed to have personal liability for the obligations of the Trust. However, the Trust’s Declaration of Trust contains an express disclaimer of liability on the part of Fund shareholders and the By-laws provide that the Trust shall assume, upon request by the shareholder, the defense on behalf of any Fund shareholders. Moreover, the By-laws also provide for indemnification out of Fund property of any shareholder held personally liable solely by reason of being or having been a shareholder for all loss or expense arising from such liability. Additionally, in the normal course of business, the Fund enters into agreements with service providers that may contain indemnification clauses. The Fund’s maximum exposure under these arrangements is unknown as this would involve future claims that may be made against the Fund that have not yet occurred.
2 Distributions to Shareholders and Income Tax Information
It is the present policy of the Fund to make at least one distribution annually (normally in December) of all or substantially all of its net investment income and to distribute annually all or substantially all of its net realized capital gains. Distributions to shareholders are recorded on the ex-dividend date. Distributions are declared separately for each class of shares. Shareholders may reinvest income and capital gain distributions in additional shares of the same class of the Fund at the net asset value as of the ex-dividend date or, at the election of the shareholder, receive distributions in cash. Distributions to shareholders are determined in accordance with income tax regulations, which may differ from U.S. GAAP. As required by U.S. GAAP, only distributions in excess of tax basis earnings and profits are reported in the financial statements as a return of capital. Permanent differences between book and tax accounting relating to distributions are reclassified to paid-in capital. For tax purposes, distributions from short-term capital gains are considered to be from ordinary income.
The tax character of distributions declared for the years ended January 31, 2021 and January 31, 2020 was as follows:
| | | | | | | | |
| | | Year Ended January 31, | |
| | | 2021 | | | 2020 | |
| | |
Ordinary income | | $ | 8,434,096 | | | $ | 31,470,189 | |
During the year ended January 31, 2021, accumulated loss was increased by $2,247,016 and paid-in capital was increased by $2,247,016 due to the Fund’s use of equalization accounting. Tax equalization accounting allows the Fund to treat as a distribution that portion of redemption proceeds representing a redeeming shareholder’s portion of undistributed taxable income and net capital gains. These reclassifications had no effect on the net assets or net asset value per share of the Fund.
Parametric
Emerging Markets Fund
January 31, 2021
Notes to Financial Statements — continued
As of January 31, 2021, the components of distributable earnings (accumulated loss) on a tax basis were as follows:
| | | | |
| | |
Undistributed ordinary income | | $ | 15,729 | |
| |
Deferred capital losses | | $ | (334,221,137 | ) |
| |
Net unrealized appreciation | | $ | 109,078,997 | |
At January 31, 2021, the Fund, for federal income tax purposes, had deferred capital losses of $334,221,137 which would reduce its taxable income arising from future net realized gains on investment transactions, if any, to the extent permitted by the Internal Revenue Code, and thus would reduce the amount of distributions to shareholders, which would otherwise be necessary to relieve the Fund of any liability for federal income or excise tax. The deferred capital losses are treated as arising on the first day of the Fund’s next taxable year and retain the same short-term or long-term character as when originally deferred. Of the deferred capital losses at January 31, 2021, $334,221,137 are long-term.
The cost and unrealized appreciation (depreciation) of investments of the Fund at January 31, 2021, as determined on a federal income tax basis, were as follows:
| | | | |
| |
Aggregate cost | | $ | 403,978,200 | |
| |
Gross unrealized appreciation | | $ | 189,458,393 | |
| |
Gross unrealized depreciation | | | (79,285,948 | ) |
| |
Net unrealized appreciation | | $ | 110,172,445 | |
3 Investment Adviser Fee and Other Transactions with Affiliates
The investment adviser fee is earned by Eaton Vance Management (EVM), a wholly-owned subsidiary of Eaton Vance Corp., as compensation for management and investment advisory services rendered to the Fund. Pursuant to the investment advisory agreement and subsequent fee reduction agreement between the Fund and EVM, the fee is computed at an annual rate of 0.85% of the Fund’s average daily net assets up to $500 million, 0.80% on net assets of $500 million but less than $1 billion, 0.775% on net assets of $1 billion but less than $2.5 billion, 0.75% on net assets of $2.5 billion but less than $5 billion, 0.73% on net assets of $5 billion but less than $7.5 billion and 0.71% on net assets of $7.5 billion and over, and is payable monthly. The fee reduction cannot be terminated or reduced without the approval of a majority vote of the Trustees of the Fund who are not interested persons of EVM or the Fund and by the vote of a majority of shareholders. For the year ended January 31, 2021, the investment adviser fee amounted to $5,237,982 or 0.84% of the Fund’s average daily net assets. Pursuant to a sub-advisory agreement, EVM has delegated the investment management of the Fund to Parametric Portfolio Associates LLC (Parametric), a wholly-owned indirect subsidiary of Eaton Vance Corp. EVM pays Parametric a portion of its investment adviser fee for sub-advisory services provided to the Fund. The administration fee is earned by EVM for administering the business affairs of the Fund and is computed at an annual rate of 0.15% of the Fund’s average daily net assets. For the year ended January 31, 2021, the administration fee amounted to $935,439.
EVM provides sub-transfer agency and related services to the Fund pursuant to a Sub-Transfer Agency Support Services Agreement. For the year ended January 31, 2021, EVM earned $5,866 from the Fund pursuant to such agreement, which is included in transfer and dividend disbursing agent fees on the Statement of Operations. Eaton Vance Distributors, Inc. (EVD), an affiliate of EVM and the Fund’s principal underwriter, received distribution and service fees from Investor Class and Class C shares (see Note 4) and contingent deferred sales charges (see Note 5).
During the year ended January 31, 2021, Parametric reimbursed the Fund $63,809 for a net realized loss due to a trading error. The impact of the reimbursement was less than $0.01 per share for each class and had no significant impact on total return.
Trustees and officers of the Fund who are members of EVM’s organization receive remuneration for their services to the Fund out of the investment adviser fee. Trustees of the Fund who are not affiliated with EVM may elect to defer receipt of all or a percentage of their annual fees in accordance with the terms of the Trustees Deferred Compensation Plan. For the year ended January 31, 2021, no significant amounts have been deferred. Certain officers and Trustees of the Fund are officers of EVM.
4 Distribution Plans
The Fund has in effect a distribution plan for Investor Class shares (Investor Class Plan) pursuant to Rule 12b-1 under the 1940 Act. Pursuant to the Investor Class Plan, the Fund pays EVD a distribution and service fee of 0.25% per annum of its average daily net assets attributable to Investor Class shares for distribution services and facilities provided to the Fund by EVD, as well as for personal services and/or the maintenance of shareholder accounts. Distribution and service fees paid or accrued to EVD for the year ended January 31, 2021 amounted to $172,258 for Investor Class shares.
Parametric
Emerging Markets Fund
January 31, 2021
Notes to Financial Statements — continued
The Fund also has in effect a distribution plan for Class C shares (Class C Plan) pursuant to Rule 12b-1 under the 1940 Act. Pursuant to the Class C Plan, the Fund pays EVD amounts equal to 0.75% per annum of its average daily net assets attributable to Class C shares for providing ongoing distribution services and facilities to the Fund. For the year ended January 31, 2021, the Fund paid or accrued to EVD $11,828 for Class C shares.
Pursuant to the Class C Plan, the Fund also makes payments of service fees to EVD, financial intermediaries and other persons in amounts equal to 0.25% per annum of its average daily net assets attributable to that class. Service fees paid or accrued are for personal services and/or the maintenance of shareholder accounts. They are separate and distinct from the sales commissions and distribution fees payable to EVD. Service fees paid or accrued for the year ended January 31, 2021 amounted to $3,943 for Class C shares.
Distribution and service fees are subject to the limitations contained in the Financial Industry Regulatory Authority Rule 2341(d).
5 Contingent Deferred Sales Charges
A contingent deferred sales charge (CDSC) of 1% generally is imposed on redemptions of Class C shares made within 12 months of purchase. Generally, the CDSC is based upon the lower of the net asset value at date of redemption or date of purchase. No charge is levied on shares acquired by reinvestment of dividends or capital gain distributions. For the year ended January 31, 2021, the Fund was informed that EVD received less than $100 of CDSCs paid by Class C shareholders.
6 Purchases and Sales of Investments
Purchases and sales of investments, other than short-term obligations, aggregated $115,755,958 and $614,948,792, respectively, for the year ended January 31, 2021.
7 Shares of Beneficial Interest
The Fund’s Declaration of Trust permits the Trustees to issue an unlimited number of full and fractional shares of beneficial interest (without par value). Such shares may be issued in a number of different series (such as the Fund) and classes. Transactions in Fund shares were as follows:
| | | | | | | | |
| | | Year Ended January 31, | |
| Investor Class | | 2021 | | | 2020 | |
| | |
Sales | | | 1,768,073 | | | | 1,591,889 | |
| | |
Issued to shareholders electing to receive payments of distributions in Fund shares | | | 33,222 | | | | 235,413 | |
| | |
Redemptions | | | (8,628,672 | ) | | | (4,111,999 | ) |
| | |
Converted from Class C shares | | | 64,738 | | | | 49,295 | |
| | |
Net decrease | | | (6,762,639 | ) | | | (2,235,402 | ) |
| |
| | | Year Ended January 31, | |
| Class C | | 2021 | | | 2020 | |
| | |
Sales | | | 615 | | | | 1,831 | |
| | |
Issued to shareholders electing to receive payments of distributions in Fund shares | | | 185 | | | | 4,765 | |
| | |
Redemptions | | | (194,163 | ) | | | (75,626 | ) |
| | |
Converted to Investor Class shares | | | (66,255 | ) | | | (50,449 | ) |
| | |
Net decrease | | | (259,618 | ) | | | (119,479 | ) |
Parametric
Emerging Markets Fund
January 31, 2021
Notes to Financial Statements — continued
| | | | | | | | |
| | | Year Ended January 31, | |
| Institutional Class | | 2021 | | | 2020 | |
| | |
Sales | | | 9,494,655 | | | | 7,138,019 | |
| | |
Issued to shareholders electing to receive payments of distributions in Fund shares | | | 326,892 | | | | 1,350,213 | |
| | |
Redemptions | | | (46,196,534 | ) | | | (34,644,045 | ) |
| | |
Net decrease | | | (36,374,987 | ) | | | (26,155,813 | ) |
| |
| | | Year Ended January 31, | |
| Class R6 | | 2021 | | | 2020 | |
| | |
Sales | | | 4,381,694 | | | | 981,777 | |
| | |
Issued to shareholders electing to receive payments of distributions in Fund shares | | | 94,763 | | | | 116,228 | |
| | |
Redemptions | | | (2,685,140 | ) | | | (3,763,784 | ) |
| | |
Net increase (decrease) | | | 1,791,317 | | | | (2,665,779 | ) |
8 Line of Credit
The Fund participates with other portfolios and funds managed by EVM and its affiliates in an $800 million unsecured line of credit agreement with a group of banks, which is in effect through October 26, 2021. Borrowings are made by the Fund solely for temporary purposes related to redemptions and other short-term cash needs. Interest is charged to the Fund based on its borrowings at an amount above either the Eurodollar rate or Federal Funds rate. In addition, a fee computed at an annual rate of 0.15% on the daily unused portion of the line of credit is allocated among the participating portfolios and funds at the end of each quarter. In connection with the renewal of the agreement in October 2020, an upfront fee and arrangement fee totaling $950,000 was incurred that was allocated to the participating portfolios and funds. Because the line of credit is not available exclusively to the Fund, it may be unable to borrow some or all of its requested amounts at any particular time. Average borrowings and the average annual interest rate (excluding fees) for the year ended January 31, 2021 were $4,335,519 and 1.54%, respectively.
9 Securities Lending Agreement
The Fund has established a securities lending agreement with State Street Bank and Trust Company (SSBT) as securities lending agent in which the Fund lends portfolio securities to qualified borrowers in exchange for collateral consisting of either cash or securities issued or guaranteed by the U.S. government or its agencies or instrumentalities in an amount at least equal to the market value of the securities on loan. The market value of securities loaned is determined daily and any additional required collateral is delivered to the Fund on the next business day. Cash collateral is invested in the State Street Navigator Securities Lending Government Money Market Portfolio, a money market fund registered under the 1940 Act. The Fund earns interest on the amount invested but it must pay (and at times receive from) the broker a loan rebate fee computed as a varying percentage of the collateral received. For security loans secured by non-cash collateral, the Fund earns a negotiated lending fee from the borrower. A portion of the income earned by the Fund from its investment of cash collateral, net of rebate fees, and lending fees received is allocated to SSBT for its services as lending agent and the portion allocated to the Fund is presented as securities lending income, net on the Statement of Operations. Non-cash collateral is held by the lending agent on behalf of the Fund and cannot be sold or re-pledged by the Fund; accordingly, such collateral is not reflected in the Statement of Assets and Liabilities.
The Fund is subject to possible delay in the recovery of loaned securities. Pursuant to the securities lending agreement, SSBT has provided indemnification to the Fund in the event of default by a borrower with respect to a loan. The Fund bears the risk of loss with respect to the investment of cash collateral.
At January 31, 2021, the value of the securities loaned and the value of the collateral received, which exceeded the value of the securities loaned, amounted to $10,205,813 and $10,875,897, respectively. Collateral received was comprised of cash of $1,561,493 and U.S. government and/or agencies securities of $9,314,404. The securities lending transactions have no contractual maturity date and each of the Fund and borrower has the option to terminate a loan at any time.
Parametric
Emerging Markets Fund
January 31, 2021
Notes to Financial Statements — continued
The following table provides a breakdown of securities lending transactions accounted for as secured borrowings, the obligations by class of collateral pledged, and the remaining contractual maturity of those transactions as of January 31, 2021.
| | | | | | | | | | | | | | | | | | | | |
| | | Remaining Contractual Maturity of the Transactions | | | Total | |
| | | Overnight and
Continuous | | | <30 days | | | 30 to 90 days | | | >90 days | |
| | | | | |
Common Stocks | | $ | 1,561,493 | | | $ | — | | | $ | — | | | $ | — | | | $ | 1,561,493 | |
The carrying amount of the liability for collateral for securities loaned at January 31, 2021 approximated its fair value. If measured at fair value, such liability would have been considered as Level 2 in the fair value hierarchy (see Note 10) at January 31, 2021.
10 Fair Value Measurements
Under generally accepted accounting principles for fair value measurements, a three-tier hierarchy to prioritize the assumptions, referred to as inputs, is used in valuation techniques to measure fair value. The three-tier hierarchy of inputs is summarized in the three broad levels listed below.
| • | | Level 1 – quoted prices in active markets for identical investments |
| • | | Level 2 – other significant observable inputs (including quoted prices for similar investments, interest rates, prepayment speeds, credit risk, etc.) |
| • | | Level 3 – significant unobservable inputs (including a fund’s own assumptions in determining the fair value of investments) |
In cases where the inputs used to measure fair value fall in different levels of the fair value hierarchy, the level disclosed is determined based on the lowest level input that is significant to the fair value measurement in its entirety. The inputs or methodology used for valuing securities are not necessarily an indication of the risk associated with investing in those securities.
At January 31, 2021, the hierarchy of inputs used in valuing the Fund’s investments, which are carried at value, were as follows:
| | | | | | | | | | | | | | | | |
| Asset Description | | Level 1 | | | Level 2 | | | Level 3* | | | Total | |
| | | | |
Common Stocks | | | | | | | | | | | | | | | | |
| | | | |
Asia/Pacific | | $ | 12,227,185 | | | $ | 238,447,861 | | | $ | 99,420 | | | $ | 250,774,466 | |
| | | | |
Emerging Europe | | | 4,121,412 | | | | 74,088,101 | | | | 0 | | | | 78,209,513 | |
| | | | |
Latin America | | | 63,562,680 | | | | 12,204,618 | | | | — | | | | 75,767,298 | |
| | | | |
Middle East/Africa | | | 3,505,875 | | | | 99,750,309 | | | | 4,574,338 | | | | 107,830,522 | |
| | | | |
Total Common Stocks | | $ | 83,417,152 | | | $ | 424,490,889 | ** | | $ | 4,673,758 | | | $ | 512,581,799 | |
| | | | |
Rights | | $ | 3 | | | $ | 7,350 | | | $ | — | | | $ | 7,353 | |
| | | | |
Short-Term Investments | | | 1,561,493 | | | | — | | | | — | | | | 1,561,493 | |
| | | | |
Total Investments | | $ | 84,978,648 | | | $ | 424,498,239 | | | $ | 4,673,758 | | | $ | 514,150,645 | |
| * | None of the unobservable inputs for Level 3 assets, individually or collectively, had a material impact on the Fund. |
| ** | Includes foreign equity securities whose values were adjusted to reflect market trading of comparable securities or other correlated instruments that occurred after the close of trading in their applicable foreign markets. |
Level 3 investments at the beginning and/or end of the period in relation to net assets were not significant and accordingly, a reconciliation of Level 3 assets for the year ended January 31, 2021 is not presented.
Parametric
Emerging Markets Fund
January 31, 2021
Notes to Financial Statements — continued
11 Risks and Uncertainties
Risks Associated with Foreign Investments
Investments in foreign issuers could be affected by factors not present in the United States, including expropriation, armed conflict, confiscatory taxation, lack of uniform accounting and auditing standards, less publicly available financial and other information, and potential difficulties in enforcing contractual obligations. Settlements of securities transactions in foreign countries are subject to risk of loss, may be delayed and are generally less frequent than in the United States. Evidence of ownership of certain foreign investments may be held outside the United States, and the Fund may be subject to the risks associated with the holding of such property overseas. Foreign issuers may become subject to sanctions imposed by the United States or another country, which could result in the immediate freeze of the foreign issuers’ assets or securities. Trading in certain foreign markets is also subject to liquidity risk. Political events in foreign countries may cause market disruptions.
The risks of foreign investments can be more significant in emerging markets. Political and economic structures in emerging market countries generally lack the social, political and economic stability of developed countries. Securities markets within emerging market countries may experience low or non-existent trading volume. Governmental actions can have a significant effect on the economic conditions in emerging market countries. In particular, trade disputes may result in governmental actions, including but not limited to restrictions on investments in, or required divestment of, particular issuers or industries. There may be less publicly available information about issuers in emerging markets than would be available about issuers in more developed capital markets. The laws of emerging market countries relating to the limited liability of corporate shareholders, fiduciary duties of officers and directors, and bankruptcy of state enterprises are generally less developed than or different from such laws in the United States. It may be more difficult to make a claim or obtain a judgment in the courts of these countries than it is in the United States. The possibility of fraud, negligence, undue influence being exerted by an issuer or refusal to recognize ownership exists in some emerging markets. The prices at which investments may be acquired may be affected by trading by persons with information that is not publicly available and by securities transactions by brokers in anticipation of transactions in particular securities. Disruptions due to work stoppages and trading improprieties in foreign securities markets have caused such markets to close. Emerging market securities are also subject to speculative trading, which contributes to their volatility. These foregoing risks may be even greater in frontier markets.
Pandemic Risk
An outbreak of respiratory disease caused by a novel coronavirus was first detected in China in December 2019 and subsequently spread internationally. This coronavirus has resulted in closing borders, enhanced health screenings, changes to healthcare service preparation and delivery, quarantines, cancellations, disruptions to supply chains and customer activity, as well as general concern and uncertainty. Health crises caused by outbreaks, such as the coronavirus outbreak, may exacerbate other pre-existing political, social and economic risks and disrupt normal market conditions and operations. The impact of this outbreak has negatively affected the worldwide economy, the economies of individual countries, individual companies, and the market in general, and may continue to do so in significant and unforeseen ways, as may other epidemics and pandemics that may arise in the future. Any such impact could adversely affect the Fund’s performance, or the performance of the securities in which the Fund invests.
12 Additional Information
On October 8, 2020, Morgan Stanley and Eaton Vance Corp. (“Eaton Vance”) announced that they had entered into a definitive agreement under which Morgan Stanley would acquire Eaton Vance. Under the Investment Company Act of 1940, as amended, consummation of this transaction may have been deemed to result in the automatic termination of an Eaton Vance Fund’s investment advisory agreement and, where applicable, any related sub-advisory agreement. On November 24, 2020, the Fund’s Board approved a new investment advisory agreement and a new sub-advisory agreement. The new investment advisory agreement and new sub-advisory agreement were approved by Fund shareholders at a joint special meeting of shareholders held on February 18, 2021, and became effective upon the consummation of the transaction on March 1, 2021.
Parametric
Emerging Markets Fund
January 31, 2021
Report of Independent Registered Public Accounting Firm
To the Trustees of Eaton Vance Mutual Funds Trust and Shareholders of Parametric Emerging Markets Fund:
Opinion on the Financial Statements and Financial Highlights
We have audited the accompanying statement of assets and liabilities of Parametric Emerging Markets Fund (the “Fund”) (one of the funds constituting Eaton Vance Mutual Funds Trust), including the portfolio of investments, as of January 31, 2021, the related statement of operations for the year then ended, the statements of changes in net assets for each of the two years in the period then ended, the financial highlights for each of the five years in the period then ended, and the related notes. In our opinion, the financial statements and financial highlights present fairly, in all material respects, the financial position of the Fund as of January 31, 2021, and the results of its operations for the year then ended, the changes in its net assets for each of the two years in the period then ended, and the financial highlights for each of the five years in the period then ended, in conformity with accounting principles generally accepted in the United States of America.
Basis for Opinion
These financial statements and financial highlights are the responsibility of the Fund’s management. Our responsibility is to express an opinion on the Fund’s financial statements and financial highlights based on our audits. We are a public accounting firm registered with the Public Company Accounting Oversight Board (United States) (PCAOB) and are required to be independent with respect to the Fund in accordance with the U.S. federal securities laws and the applicable rules and regulations of the Securities and Exchange Commission and the PCAOB.
We conducted our audits in accordance with the standards of the PCAOB. Those standards require that we plan and perform the audit to obtain reasonable assurance about whether the financial statements and financial highlights are free of material misstatement, whether due to error or fraud. The Fund is not required to have, nor were we engaged to perform, an audit of its internal control over financial reporting. As part of our audits we are required to obtain an understanding of internal control over financial reporting but not for the purpose of expressing an opinion on the effectiveness of the Fund’s internal control over financial reporting. Accordingly, we express no such opinion.
Our audits included performing procedures to assess the risks of material misstatement of the financial statements and financial highlights, whether due to error or fraud, and performing procedures that respond to those risks. Such procedures included examining, on a test basis, evidence regarding the amounts and disclosures in the financial statements and financial highlights. Our audits also included evaluating the accounting principles used and significant estimates made by management, as well as evaluating the overall presentation of the financial statements and financial highlights. Our procedures included confirmation of securities owned as of January 31, 2021, by correspondence with the custodian and brokers; when replies were not received from brokers, we performed other auditing procedures. We believe that our audits provide a reasonable basis for our opinion.
/s/ Deloitte & Touche LLP
Boston, Massachusetts
March 19, 2021
We have served as the auditor of one or more Eaton Vance investment companies since 1959.
Parametric
Emerging Markets Fund
January 31, 2021
Federal Tax Information (Unaudited)
The Form 1099-DIV you receive in February 2022 will show the tax status of all distributions paid to your account in calendar year 2021. Shareholders are advised to consult their own tax adviser with respect to the tax consequences of their investment in the Fund. As required by the Internal Revenue Code and/or regulations, shareholders must be notified regarding the status of qualified dividend income for individuals.
Qualified Dividend Income. For the fiscal year ended January 31, 2021, the Fund designates approximately $10,372,456, or up to the maximum amount of such dividends allowable pursuant to the Internal Revenue Code, as qualified dividend income eligible for the reduced tax rate of 15%.
Parametric
Emerging Markets Fund
January 31, 2021
Board of Trustees’ Contract Approval
Overview of the Contract Review Process
Even though the following description of the Board’s (as defined below) consideration of investment advisory and, as applicable, sub-advisory agreements covers multiple funds, for purposes of this shareholder report, the description is only relevant as to Parametric Emerging Markets Fund.
| | | | |
| Fund | | Investment Adviser | | Investment Sub-Adviser |
| | |
Parametric Emerging Markets Fund | | Eaton Vance Management | | Parametric Portfolio Associates LLC |
At a meeting held on November 24, 2020 (the “November Meeting”), the Board of each Eaton Vance open-end Fund and portfolios in which each such Fund invests, as applicable (each, a “Fund” and, collectively, the “Funds”), including a majority of the Board members (the “Independent Trustees”) who are not “interested persons” (as defined in the Investment Company Act of 1940 (the “1940 Act”)) of the Funds, Eaton Vance Management (“EVM”) or Boston Management and Research (“BMR” and, together with EVM, the “Advisers”), voted to approve a new investment advisory agreement between each Fund and either EVM or BMR (the “New Investment Advisory Agreements”) and, for certain Funds, a new investment sub-advisory agreement between an Adviser and the applicable Sub-Adviser (the “New Investment Sub-Advisory Agreements”(1) and, together with the New Investment Advisory Agreements, the “New Agreements”), each of which is intended to go into effect upon the completion of the Transaction (as defined below), as more fully described below. In voting its approval of the New Agreements at the November Meeting, the Board relied on an order issued by the Securities and Exchange Commission in response to the impacts of the COVID-19 pandemic that provided temporary relief from the in-person meeting requirements under Section 15 of the 1940 Act.
In voting its approval of the New Agreements, the Board of each Fund relied upon the recommendation of its Contract Review Committee, which is a committee comprised exclusively of Independent Trustees. Prior to and during meetings leading up to the November Meeting, the Contract Review Committee reviewed and discussed information furnished by the Advisers, the Sub-Advisers, and Morgan Stanley, as requested by the Independent Trustees, that the Contract Review Committee considered reasonably necessary to evaluate the terms of the New Agreements and to form its recommendation. Such information included, among other things, the terms and anticipated impacts of Morgan Stanley’s pending acquisition of Eaton Vance Corp. (the “Transaction”) on the Funds and their shareholders. In addition to considering information furnished specifically to evaluate the impact of the Transaction on the Funds and their respective shareholders, the Board and its Contract Review Committee also considered information furnished for prior meetings of the Board and its committees, including information provided in connection with the annual contract review process for the Funds, which most recently culminated in April 2020 (the “2020 Annual Approval Process”).
The Board of each Fund, including the Independent Trustees, concluded that the applicable New Investment Advisory Agreement and, as applicable, New Investment Sub-Advisory Agreement, including the fees payable thereunder, was fair and reasonable, and it voted to approve the New Investment Advisory Agreement and, as applicable, New Investment Sub-Advisory Agreement and to recommend that shareholders do so as well.
Shortly after the announcement of the Transaction, the Board, including all of the Independent Trustees, met with senior representatives from the Advisers and Morgan Stanley at its meeting held on October 13, 2020 to discuss certain aspects of the Transaction and the expected impacts of the Transaction on the Funds and their shareholders. As part of the Board’s evaluation process, counsel to the Independent Trustees, on behalf of the Contract Review Committee, requested additional information to assist the Independent Trustees in their evaluation of the New Agreements and the implications of the Transaction, as well as other contractual arrangements that may be affected by the Transaction. The Contract Review Committee considered information furnished by the Advisers and Morgan Stanley, their respective affiliates, and, as applicable, the Sub-Advisers during meetings on November 5, 2020, November 10, 2020, November 13, 2020, November 17, 2020 and November 24, 2020.
During its meetings on November 10, 2020 and November 17, 2020, the Contract Review Committee further discussed the approval of the New Agreements with senior representatives of the Advisers, the Affiliated Sub-Advisers, and Morgan Stanley. The representatives from the Advisers, the Affiliated Sub-Advisers, and Morgan Stanley each made presentations to, and responded to questions from, the Independent Trustees. The Contract Review Committee considered the Advisers’, the Affiliated Sub-Advisers’ and Morgan Stanley’s responses related to the Transaction and specifically to the Funds, as well as information received in connection with the 2020 Annual Approval Process, with respect to its evaluation of the New Agreements. Among other information, the Board considered:
Information about the Transaction and its Terms
| | • | | Information about the material terms and conditions, and expected impacts, of the Transaction that relate to the Funds, including the expected impacts on the businesses conducted by the Advisers, the Affiliated Sub-Advisers and Eaton Vance Distributors, Inc., as the distributor of Fund shares; |
| (1) | With respect to certain of the Funds, the applicable Adviser is currently a party to a sub-advisory agreement (collectively, the “Current Sub-Advisory Agreements”) with Atlanta Capital Management Company, LLC (“Atlanta Capital”), BMO Global Asset Management (Asia) Limited, Eaton Vance Advisers International Ltd. (“EVAIL”), Goldman Sachs Asset Management, L.P., Hexavest Inc. (“Hexavest”), Parametric Portfolio Associates LLC (“Parametric”) or Richard Bernstein Advisors LLC (collectively, the “Sub-Advisers” and, with respect to Atlanta Capital, EVAIL, Hexavest and Parametric, each an affiliate of the Advisers, the “Affiliated Sub-Advisers”). Accordingly, references to the “Sub-Advisers,” the “Affiliated Sub-Advisers” or the “New Sub-Advisory Agreements” are not applicable to all Funds. |
Parametric
Emerging Markets Fund
January 31, 2021
Board of Trustees’ Contract Approval — continued
| | • | | Information about the advantages of the Transaction as they relate to the Funds and their shareholders; |
| | • | | A commitment that the Funds would not bear any expenses, directly or indirectly, in connection with the Transaction; |
| | • | | A commitment that, for a period of three years after the Closing, at least 75% of each Fund’s Board members must not be “interested persons” (as defined in the 1940 Act) of the investment adviser (or predecessor investment adviser, if applicable) pursuant to Section 15(f)(1)(A) of the 1940 Act; |
| | • | | A commitment that Morgan Stanley would use its reasonable best efforts to ensure that it did not impose any “unfair burden” (as that term is used in section 15(f)(1)(B) of the 1940 Act) on the Funds as a result of the Transaction; |
| | • | | Information with respect to personnel and/or other resources of the Advisers and their affiliates, including the Affiliated Sub-Advisers, as a result of the Transaction, as well as any expected changes to compensation, including any retention-based compensation intended to incentivize key personnel at the Advisers and their affiliates, including the Affiliated Sub-Advisers; |
| | • | | Information regarding any changes that are expected with respect to the Funds’ slate of officers as a result of the Transaction; |
Information about Morgan Stanley
| | • | | Information about Morgan Stanley’s overall business, including information about the advisory, brokerage and related businesses that Morgan Stanley operates; |
| | • | | Information about Morgan Stanley’s financial condition, including its access to capital and other resources required to support the investment advisory businesses related to the Funds; |
| | • | | Information on how the Funds are expected to fit within Morgan Stanley’s overall business strategy, and any changes that Morgan Stanley contemplates implementing to the Funds in the short- or long-term following the closing of the Transaction (the “Closing”); |
| | • | | Information regarding risk management functions at Morgan Stanley and its affiliates, including how existing risk management protocols and procedures may impact the Funds and/or the businesses of the Advisers and their affiliates, including the Affiliated Sub-Advisers, as they relate to the Funds; |
| | • | | Information on the anticipated benefits of the Transaction to the Funds with respect to potential additional distribution capabilities and the ability to access new markets and customer segments through Morgan Stanley’s distribution network, including, in particular, its institutional client base; |
| | • | | Information regarding the financial condition and reputation of Morgan Stanley, its worldwide presence, experience as a fund sponsor and manager, commitment to maintain a high level of cooperation with, and support to, the Funds, strong client service capabilities, and relationships in the asset management industry; |
Information about the New Agreements for Funds
| | • | | A representation that, after the Closing, all of the Funds will continue to be advised by their current Adviser and Sub-Adviser, as applicable; |
| | • | | Information regarding the terms of the New Agreements, including certain changes as compared to the current investment advisory agreement between each Fund and its Adviser (collectively, the “Current Advisory Agreements”) and, as applicable, the current investment sub-advisory agreement between a Fund and a Sub-Adviser (together with the Current Advisory Agreements, the “Current Agreements”); |
| | • | | Information confirming that the fee rates payable under the New Agreements are not changed as compared to the Current Agreements; |
| | • | | A representation that the New Agreements will not cause any diminution in the nature, extent and quality of services provided by the Advisers and the Sub-Advisers to the Funds and their respective shareholders, including with respect to compliance and other non-advisory services; |
Information about Fund Performance, Fees and Expenses
| | • | | A report from an independent data provider comparing the investment performance of each Fund (including, as relevant, total return data, income data, Sharpe ratios and information ratios) to the investment performance of comparable funds and, as applicable, benchmark indices, over various time periods as of the 2020 Annual Approval Process, as well as performance information as of a more recent date; |
| | • | | A report from an independent data provider comparing each Fund’s total expense ratio (and its components) to those of comparable funds as of the 2020 Annual Approval Process, as well as fee and expense information as of a more recent date; |
| | • | | In certain instances, data regarding investment performance relative to customized groups of peer funds and blended indices identified by the Advisers in consultation with the Portfolio Management Committee of the Board as of the 2020 Annual Approval Process, as well as corresponding performance information as of a more recent date; |
| | • | | Comparative information concerning the fees charged and services provided by the Adviser and the Sub-Adviser to each Fund in managing other accounts (which may include other mutual funds, collective investment funds and institutional accounts) using investment strategies and techniques similar to those used in managing such Fund(s), if any; |
| | • | | Profitability analyses of the Advisers and the Affiliated Sub-Advisers, as applicable, with respect to each of the Funds as of the 2020 Annual Approval Process, as well as information regarding the impact of the Transaction on profitability; |
Information about Portfolio Management and Trading
| | • | | Descriptions of the investment management services currently provided and expected to be provided to each Fund after the Transaction, as well as each of the Funds’ investment strategies and policies; |
| | • | | The procedures and processes used to determine the fair value of Fund assets, when necessary, and actions taken to monitor and test the effectiveness of such procedures and processes; |
Parametric
Emerging Markets Fund
January 31, 2021
Board of Trustees’ Contract Approval — continued
| | • | | Information about any changes to the policies and practices of the Advisers and, as applicable, each Fund’s Sub-Adviser with respect to trading, including their processes for seeking best execution of portfolio transactions; |
| | • | | Information regarding the impact on trading and access to capital markets associated with the Funds’ affiliations with Morgan Stanley and its affiliates, including potential restrictions with respect to the Funds’ ability to execute portfolio transactions with Morgan Stanley and its affiliates; |
Information about the Advisers and the Sub-Advisers
| | • | | Information about the financial results and condition of the Advisers and the Affiliated Sub-Advisers since the culmination of the 2020 Annual Approval Process and any material changes in financial condition that are reasonably expected to occur before and after the Closing; |
| | • | | Information regarding contemplated changes to the individual investment professionals whose responsibilities include portfolio management and investment research for the Funds, and, for portfolio managers and certain other investment professionals, information relating to their responsibilities with respect to managing other mutual funds and investment accounts, as applicable, post-Closing; |
| | • | | The Code of Ethics of the Advisers and their affiliates, including the Affiliated Sub-Advisers, together with information relating to compliance with, and the administration of, such codes; |
| | • | | Policies and procedures relating to proxy voting and the handling of corporate actions and class actions; |
| | • | | Information concerning the resources devoted to compliance efforts undertaken by the Advisers and their affiliates, including the Affiliated Sub-Advisers, including descriptions of their various compliance programs and their record of compliance; |
| | • | | Information concerning the business continuity and disaster recovery plans of the Advisers and their affiliates, including the Affiliated Sub-Advisers; |
| | • | | A description of the Advisers’ oversight of the Sub-Advisers, including with respect to regulatory and compliance issues, investment management and other matters; |
Other Relevant Information
| | • | | Information concerning the nature, cost and character of the administrative and other non-investment advisory services provided by the Advisers and their affiliates; |
| | • | | Information concerning oversight of the relationship with the custodian, subcustodians and fund accountants by EVM and/or administrator to each of the Funds; |
| | • | | Confirmation that the Advisers intend to continue to manage the Funds in a manner materially consistent with each Fund’s current investment objective(s) and principal investment strategies; |
| | • | | Information regarding Morgan Stanley’s commitment to maintaining competitive compensation arrangements to attract and retain highly qualified personnel; |
| | • | | Confirmation that the Advisers’ current senior management teams have indicated their strong support of the Transaction; and |
| | • | | Information regarding the fact that Morgan Stanley and Eaton Vance Corp. will each derive benefits from the Transaction and that, as a result, they have a financial interest in the matters that were being considered. |
As indicated above, the Board and its Contract Review Committee also considered information received at its regularly scheduled meetings throughout the year, which included information from portfolio managers and other investment professionals of the Advisers and the Sub-Advisers regarding investment and performance matters, and considered various investment and trading strategies used in pursuing the Funds’ investment objectives. The Board also received information regarding risk management techniques employed in connection with the management of the Funds. The Board and its committees evaluated issues pertaining to industry and regulatory developments, compliance procedures, fund governance and other issues with respect to the Funds, and received and participated in reports and presentations provided by the Advisers and their affiliates, including the Affiliated Sub-Advisers, with respect to such matters.
The Contract Review Committee was advised throughout the evaluation process by Goodwin Procter LLP, independent legal counsel for the Independent Trustees. The members of the Contract Review Committee, with the advice of such counsel, exercised their own business judgment in determining the material factors to be considered in evaluating the New Agreements and the weight to be given to each such factor. The conclusions reached with respect to the New Agreements were based on a comprehensive evaluation of all the information provided and not any single factor. Moreover, each Independent Trustee may have placed varying emphasis on particular factors in reaching conclusions with respect to the New Agreements.
Nature, Extent and Quality of Services
In considering whether to approve the New Agreements, the Board evaluated the nature, extent and quality of services currently provided to each Fund by the Advisers and, as applicable, the Sub-Advisers under the Current Agreements. In evaluating the nature, extent and quality of services to be provided by the Advisers and the Sub-Advisers under the New Agreements, the Board considered, among other information, the expected impact, if any, of the Transaction on the operations, facilities, organization and personnel of the Advisers and the Sub-Advisers, and that Morgan Stanley and the Advisers have advised the Board that, following the Transaction, there is not expected to be any diminution in the nature, extent and quality of services provided by the Advisers and the Sub-Advisers, as applicable, to the Funds and their shareholders, including compliance and other non-advisory services, and that there are not expected to be any changes in portfolio management personnel as a result of the Transaction.
Parametric
Emerging Markets Fund
January 31, 2021
Board of Trustees’ Contract Approval — continued
The Board also considered the financial resources of Morgan Stanley and the Advisers and the importance of having a Fund manager with, or with access to, significant organizational and financial resources. The Board considered the benefits to the Funds of being part of a larger combined organization with greater financial resources following the Transaction, particularly during periods of market disruptions and volatility. In this regard, the Board considered information provided by Morgan Stanley regarding its business and operating structure, scale of operation, leadership and reputation, distribution capabilities, and financial condition, as well as information on how the Funds are expected to fit within Morgan Stanley’s overall business strategy and any changes that Morgan Stanley contemplates in the short- or long-term following the Closing. The Board also noted Morgan Stanley’s and the Advisers’ commitment to keep the Board apprised of developments with respect to its long-term integration plans for the Advisers, the Affiliated Sub-Advisers, and existing Morgan Stanley affiliates and their respective personnel.
The Board considered the Advisers’ and the Sub-Advisers’ management capabilities and investment processes in light of the types of investments held by each Fund, including the education, experience and number of investment professionals and other personnel who provide portfolio management, investment research, and similar services to each Fund. In particular, the Board considered the abilities and experience of the Advisers’ and, as applicable, the Sub-Advisers’ investment professionals in implementing each Fund’s investment strategies. The Board also took into account the resources dedicated to portfolio management and other services, the compensation methods of the Advisers and other factors, including the reputation and resources of the Advisers to recruit and retain highly qualified research, advisory and supervisory investment professionals. With respect to the recruitment and retention of key personnel, the Board noted information from Morgan Stanley and the Advisers regarding the benefits of joining Morgan Stanley. In addition, the Board considered the time and attention devoted to the Funds by senior management, as well as the infrastructure, operational capabilities and support staff in place to assist in the portfolio management and operations of the Funds, including the provision of administrative services. With respect to the foregoing, the Board also considered information from the Advisers and Morgan Stanley regarding the anticipated impact of the Transaction on such matters. The Board also considered the business-related and other risks to which the Advisers or their affiliates may be subject in managing the Funds and in connection with the Transaction.
The Board considered the compliance programs of the Advisers and relevant affiliates thereof, including the Affiliated Sub-Advisers. The Board considered compliance and reporting matters regarding, among other things, personal trading by investment professionals, disclosure of portfolio holdings, late trading, frequent trading, portfolio valuation, business continuity and the allocation of investment opportunities. The Board also considered the responses of the Advisers and their affiliates to requests in recent years from regulatory authorities, such as the Securities and Exchange Commission and the Financial Industry Regulatory Authority. The Board also considered certain information relating to the compliance record of Morgan Stanley and its affiliates, including information requests in recent years from regulatory authorities. With respect to the foregoing, including the compliance programs of the Advisers and the Sub-Advisers, the Board noted information regarding the impacts of the Transaction, as well as the Advisers’ and Morgan Stanley’s commitment to keep the Board apprised of developments with respect to its long-term integration plans for the Advisers, the Affiliated Sub-Advisers and existing Morgan Stanley affiliates and their respective personnel.
The Board considered other administrative services provided and to be provided or overseen by the Advisers and their affiliates, including transfer agency and accounting services. The Board evaluated the benefits to shareholders of investing in a fund that is a part of a large fund complex offering exposure to a variety of asset classes and investment disciplines, as well as the ability, in many cases, to exchange an investment among different funds without incurring additional sales charges. The Board noted information that the Transaction was not expected to have any material impact on such matters in the near-term.
In evaluating the nature, extent and quality of the services to be provided under the New Agreements, the Board also considered investment performance information provided for each Fund in connection with the 2020 Annual Approval Process, as well as information provided as of a more recent date. In this regard, the Board compared each Fund’s investment performance to that of comparable funds identified by an independent data provider (the peer group), as well as appropriate benchmark indices and, for certain Funds, a custom peer group of similarly managed funds. The Board also considered, where applicable, Fund-specific performance explanations based on criteria established by the Board in connection with the 2020 Annual Approval Process and, where applicable, performance explanations as of a more recent date. In addition to the foregoing information, it was also noted that the Board has received and discussed with management information throughout the year at periodic intervals comparing each Fund’s performance against applicable benchmark indices and peer groups. In addition, the Board considered each Fund’s performance in light of overall financial market conditions. Where a Fund’s relative underperformance to its peers was significant during one or more specified periods, the Board noted the explanation from the applicable Adviser concerning the Fund’s relative performance versus its peer group.
After consideration of the foregoing factors, among others, and based on their review of the materials provided and the assurances received from, and recommendations of, the Advisers and Morgan Stanley, the Board determined that the Transaction was not expected to adversely affect the nature, extent and quality of services provided to the Funds by the Advisers and their affiliates, including the Affiliated Sub-Advisers, and that the Transaction was not expected to have an adverse effect on the ability of the Advisers and their affiliates, including the Affiliated Sub-Advisers, to provide those services. The Board concluded that the nature, extent and quality of services expected to be provided by the Advisers and the Sub-Advisers, taken as a whole, are appropriate and expected to be consistent with the terms of the New Agreements.
Management Fees and Expenses
The Board considered contractual fee rates payable by each Fund for advisory and administrative services (referred to collectively as “management fees”) in connection with the 2020 Annual Approval Process, as well as information provided as of a more recent date. As part of its review, the Board considered
Parametric
Emerging Markets Fund
January 31, 2021
Board of Trustees’ Contract Approval — continued
each Fund’s management fees and total expense ratio over various periods, as compared to those of comparable funds, before and after giving effect to any undertaking to waive fees or reimburse expenses. The Board also considered factors, and, where applicable, certain Fund-specific factors, that had an impact on a Fund’s total expense ratio relative to comparable funds, as identified by the Advisers in response to inquiries from the Contract Review Committee. The Board considered that the New Agreements do not change a Fund’s management fee rate or the computation method for calculating such fees, including any separately executed permanent contractual management fee reduction currently in place for the Fund.
The Board also received and considered, where applicable, information about the services offered and the fee rates charged by the Advisers and the Sub-Advisers to other types of accounts with investment objectives and strategies that are substantially similar to and/or managed in a similar investment style as a Fund. In this regard, the Board received information about the differences in the nature and scope of services the Advisers and the Sub-Advisers, as applicable, provide to the Funds as compared to other types of accounts and the material differences in compliance, reporting and other legal burdens and risks to the Advisers and such Sub-Advisers as between each Fund and other types of accounts.
After considering the foregoing information, and in light of the nature, extent and quality of the services expected to be provided by the Advisers and the Sub-Advisers, the Board concluded that the management fees charged for advisory and related services are reasonable with respect to its approval of the New Agreements.
Profitability and “Fall-Out” Benefits
During the 2020 Annual Approval Process, the Board considered the level of profits realized by the Advisers and relevant affiliates thereof, including the Affiliated Sub-Advisers, in providing investment advisory and administrative services to the Funds and to all Eaton Vance funds as a group. The Board considered the level of profits realized without regard to marketing support or other payments by the Advisers and their affiliates to third parties in respect of distribution or other services. In light of the foregoing factors and the nature, extent and quality of the services rendered, the profits realized by the Advisers and their affiliates, including the Sub-Advisers, were not deemed to be excessive by the Board.
The Board noted that Morgan Stanley and the Advisers are expected to realize, over time, cost savings from the Transaction based on eliminating duplicate corporate overhead expenses. The Board considered, however, information from the Advisers and Morgan Stanley that such cost savings are not expected to be realized immediately upon the Closing and that, accordingly, there are currently no specific expected changes in the levels of profitability associated with the advisory and other services provided to the Funds that are contemplated as a result of the Transaction. The Board noted that it will continue to receive information regarding profitability during its annual contract review processes, including the extent to which cost savings and/or other efficiencies result in changes to profitability levels.
The Board also considered direct or indirect fall-out benefits received by the Advisers and their affiliates, including the Affiliated Sub-Advisers, in connection with their respective relationships with the Funds, including the benefits of research services that may be available to the Advisers and their affiliates as a result of securities transactions effected for the Funds and other investment advisory clients. In evaluating the fall-out benefits to be received by the Advisers and their affiliates under the New Agreements, the Board considered whether the Transaction would have an impact on the fall-out benefits currently realized by the Advisers and their affiliates in connection with services provided pursuant to the Current Advisory Agreements.
The Board of each Fund considered that Morgan Stanley may derive reputational and other benefits from its ability to use the names of the Advisers and their affiliates in connection with operating and marketing the Funds. The Board considered that the Transaction, if completed, would significantly increase Morgan Stanley’s assets under management and expand Morgan Stanley’s investment capabilities.
Economies of Scale
The Board also considered the extent to which the Advisers and their affiliates, on the one hand, and the Funds, on the other hand, can expect to realize benefits from economies of scale as the assets of the Funds increase. The Board acknowledged the difficulty in accurately measuring the benefits resulting from economies of scale, if any, with respect to the management of any specific Fund or group of funds. As part of the 2020 Annual Approval Process, the Board reviewed data summarizing the increases and decreases in the assets of the Funds and of all Eaton Vance funds as a group over various time periods, and evaluated the extent to which the total expense ratio of each Fund and the profitability of the Advisers and their affiliates may have been affected by such increases or decreases.
The Board noted that Morgan Stanley and the Advisers are expected to benefit from possible growth of the Funds resulting from enhanced distribution capabilities, including with respect to the Funds’ potential access to Morgan Stanley’s institutional client base. Based upon the foregoing, the Board concluded that the Funds currently share in the benefits from economies of scale, if any, when they are realized by the Advisers, and that the Transaction is not expected to impede a Fund from continuing to benefit from any future economies of scale realized by its Adviser.
Conclusion
Based on its consideration of the foregoing, and such other information it deemed relevant, including the factors and conclusions described above, the Contract Review Committee recommended to the Board approval of the New Agreements. Based on the recommendation of the Contract Review Committee, the Board, including a majority of the Independent Trustees, unanimously voted to approve the New Agreements for the Funds and recommended that shareholders approve the New Agreements.
Parametric
Emerging Markets Fund
January 31, 2021
Management and Organization
Fund Management. The Trustees of Eaton Vance Mutual Funds Trust (the Trust) are responsible for the overall management and supervision of the Trust’s affairs. The Trustees and officers of the Trust are listed below. Except as indicated, each individual has held the office shown or other offices in the same company for the last five years. Trustees and officers of the Trust hold indefinite terms of office. The “noninterested Trustees” consist of those Trustees who are not “interested persons” of the Trust, as that term is defined under the 1940 Act. The business address of each Trustee and officer is Two International Place, Boston, Massachusetts 02110. As used below, “EVC” refers to Eaton Vance Corp., “EV” refers to EV LLC, “EVM” refers to Eaton Vance Management, “BMR” refers to Boston Management and Research and “EVD” refers to Eaton Vance Distributors, Inc. EV is the trustee of each of EVM and BMR. Effective March 1, 2021, each of EVM, BMR, EVD and EV are indirect wholly-owned subsidiaries of Morgan Stanley. Each officer affiliated with EVM may hold a position with other EVM affiliates that is comparable to his or her position with EVM listed below. Each Trustee oversees 139 portfolios (with the exception of Messrs. Faust and Wennerholm and Ms. Frost who oversee 138 portfolios) in the Eaton Vance Complex (including all master and feeder funds in a master feeder structure). Each officer serves as an officer of certain other Eaton Vance funds. Each Trustee and officer serves until his or her successor is elected.
| | | | | | |
| Name and Year of Birth | | Position(s)
with the
Trust | | Trustee
Since(1) | | Principal Occupation(s) and Directorships
During Past Five Years and Other Relevant Experience |
|
| Interested Trustee |
| | | |
Thomas E. Faust Jr. 1958 | | Trustee | | 2007 | | Chairman of Morgan Stanley Investment Management, Inc. (MSIM), Manager and President of EV, Chief Executive Officer of EVM and BMR, and Director of EVD. Formerly, Chairman, Chief Executive Officer and President of EVC. Trustee and/or officer of 138 registered investment companies. Mr. Faust is an interested person because of his positions with MSIM, BMR, EVM, EVD, and EV, which are affiliates of the Trust, and his former position with EVC, which was an affiliate of the Trust prior to March 1, 2021. Directorships in the Last Five Years. Formerly, Director of EVC (2007-2021) and Hexavest Inc. (2012-2021) (investment management firm). |
|
| Noninterested Trustees |
| | | |
Mark R. Fetting 1954 | | Trustee | | 2016 | | Private investor. Formerly held various positions at Legg Mason, Inc. (investment management firm) (2000-2012), including President, Chief Executive Officer, Director and Chairman (2008-2012), Senior Executive Vice President (2004-2008) and Executive Vice President (2001-2004). Formerly, President of Legg Mason family of funds (2001-2008). Formerly, Division President and Senior Officer of Prudential Financial Group, Inc. and related companies (investment management firm) (1991-2000). Other Directorships in the Last Five Years. None. |
| | | |
Cynthia E. Frost 1961 | | Trustee | | 2014 | | Private investor. Formerly, Chief Investment Officer of Brown University (university endowment) (2000-2012). Formerly, Portfolio Strategist for Duke Management Company (university endowment manager) (1995-2000). Formerly, Managing Director, Cambridge Associates (investment consulting company) (1989-1995). Formerly, Consultant, Bain and Company (management consulting firm) (1987-1989). Formerly, Senior Equity Analyst, BA Investment Management Company (1983-1985). Other Directorships in the Last Five Years. None. |
| | | |
George J. Gorman 1952 | | Vice-Chairperson of the Board and Trustee | | 2021 (Vice-Chairperson) 2014 (Trustee) | | Principal at George J. Gorman LLC (consulting firm). Formerly, Senior Partner at Ernst & Young LLP (a registered public accounting firm) (1974-2009). Other Directorships in the Last Five Years. None. |
| | | |
Valerie A. Mosley 1960 | | Trustee | | 2014 | | Chairwoman and Chief Executive Officer of Valmo Ventures (a consulting and investment firm). Founder of Upward Wealth, Inc., dba BrightUP, a fintech platform. Formerly, Partner and Senior Vice President, Portfolio Manager and Investment Strategist at Wellington Management Company, LLP (investment management firm) (1992-2012). Formerly, Chief Investment Officer, PG Corbin Asset Management (1990-1992). Formerly worked in institutional corporate bond sales at Kidder Peabody (1986-1990). Other Directorships in the Last Five Years. Director of DraftKings, Inc. (digital sports entertainment and gaming company) (since September 2020). Director of Groupon, Inc. (e-commerce provider) (since April 2020). Director of Envestnet, Inc. (provider of intelligent systems for wealth management and financial wellness) (since 2018). Formerly, Director of Dynex Capital, Inc. (mortgage REIT) (2013-2020). |
Parametric
Emerging Markets Fund
January 31, 2021
Management and Organization — continued
| | | | | | |
| Name and Year of Birth | | Position(s)
with the
Trust | | Trustee
Since(1) | | Principal Occupation(s) and Directorships
During Past Five Years and Other Relevant Experience |
|
| Noninterested Trustees (continued) |
| | | |
William H. Park 1947 | | Chairperson of the Board and Trustee | | 2016 (Chairperson) 2003 (Trustee) | | Private investor. Formerly, Consultant (management and transactional) (2012-2014). Formerly, Chief Financial Officer, Aveon Group L.P. (investment management firm) (2010-2011). Formerly, Vice Chairman, Commercial Industrial Finance Corp. (specialty finance company) (2006-2010). Formerly, President and Chief Executive Officer, Prizm Capital Management, LLC (investment management firm) (2002-2005). Formerly, Executive Vice President and Chief Financial Officer, United Asset Management Corporation (investment management firm) (1982-2001). Formerly, Senior Manager, Price Waterhouse (now PricewaterhouseCoopers) (a registered public accounting firm) (1972-1981). Other Directorships in the Last Five Years. None. |
| | | |
Helen Frame Peters 1948 | | Trustee | | 2008 | | Professor of Finance, Carroll School of Management, Boston College. Formerly, Dean, Carroll School of Management, Boston College (2000-2002). Formerly, Chief Investment Officer, Fixed Income, Scudder Kemper Investments (investment management firm) (1998-1999). Formerly, Chief Investment Officer, Equity and Fixed Income, Colonial Management Associates (investment management firm) (1991-1998). Other Directorships in the Last Five Years. None. |
| | | |
Keith Quinton 1958 | | Trustee | | 2018 | | Private investor, researcher and lecturer. Independent Investment Committee Member at New Hampshire Retirement System (since 2017). Formerly, Portfolio Manager and Senior Quantitative Analyst at Fidelity Investments (investment management firm) (2001-2014). Other Directorships in the Last Five Years. Director (since 2016) and Chairman (since 2019) of New Hampshire Municipal Bond Bank. |
| | | |
Marcus L. Smith 1966 | | Trustee | | 2018 | | Private investor. Member of Posse Boston Advisory Board (foundation) (since 2015). Formerly, Portfolio Manager at MFS Investment Management (investment management firm) (1994-2017). Other Directorships in the Last Five Years. Director of First Industrial Realty Trust, Inc. (an industrial REIT) (since 2021). Director of MSCI Inc. (global provider of investment decision support tools) (since 2017). Formerly, Director of DCT Industrial Trust Inc. (logistics real estate company) (2017-2018). |
| | | |
Susan J. Sutherland 1957 | | Trustee | | 2015 | | Private investor. Director of Ascot Group Limited and certain of its subsidiaries (insurance and reinsurance) (since 2017). Formerly, Director of Hagerty Holding Corp. (insurance and reinsurance) (2015-2018). Formerly, Associate, Counsel and Partner at Skadden, Arps, Slate, Meagher & Flom LLP (law firm) (1982-2013). Other Directorships in the Last Five Years. Director of Kairos Acquisition Corp. (insurance/InsurTech acquisition company) (since 2021). |
| | | |
Scott E. Wennerholm 1959 | | Trustee | | 2016 | | Private investor. Formerly, Trustee at Wheelock College (postsecondary institution) (2012-2018). Formerly, Consultant at GF Parish Group (executive recruiting firm) (2016-2017). Formerly, Chief Operating Officer and Executive Vice President at BNY Mellon Asset Management (investment management firm) (2005-2011). Formerly, Chief Operating Officer and Chief Financial Officer at Natixis Global Asset Management (investment management firm) (1997-2004). Formerly, Vice President at Fidelity Investments Institutional Services (investment management firm) (1994-1997). Other Directorships in the Last Five Years. None. |
| | | | | | |
| Name and Year of Birth | | Position(s)
with the
Trust | | Officer
Since(2) | | Principal Occupation(s)
During Past Five Years |
|
| Principal Officers who are not Trustees |
| | | |
Eric A. Stein 1980 | | President | | 2020 | | Vice President and Chief Investment Officer, Fixed Income of EVM and BMR. Prior to November 1, 2020, Mr. Stein was a co-Director of Eaton Vance’s Global Income Investments. Also Vice President of Calvert Research and Management (“CRM”). |
| | | |
Deidre E. Walsh 1971 | | Vice President | | 2009 | | Vice President of EVM and BMR. |
Parametric
Emerging Markets Fund
January 31, 2021
Management and Organization — continued
| | | | | | |
| Name and Year of Birth | | Position(s)
with the
Trust | | Officer
Since(2) | | Principal Occupation(s)
During Past Five Years |
|
| Principal Officers who are not Trustees (continued) |
| | | |
Maureen A. Gemma 1960 | | Secretary and Chief Legal Officer | | 2005 | | Vice President of EVM and BMR. Also Vice President of CRM. |
| | | |
James F. Kirchner 1967 | | Treasurer | | 2007 | | Vice President of EVM and BMR. Also Vice President of CRM. |
| | | |
Richard F. Froio 1968 | | Chief Compliance Officer | | 2017 | | Vice President of EVM and BMR since 2017. Formerly, Deputy Chief Compliance Officer (Adviser/Funds) and Chief Compliance Officer (Distribution) at PIMCO (2012-2017) and Managing Director at BlackRock/Barclays Global Investors (2009-2012). |
| (1) | Year first appointed to serve as Trustee for a fund in the Eaton Vance family of funds. Each Trustee has served continuously since appointment unless indicated otherwise. |
| (2) | Year first elected to serve as officer of a fund in the Eaton Vance family of funds when the officer has served continuously. Otherwise, year of most recent election as an officer of a fund in the Eaton Vance family of funds. Titles may have changed since initial election. |
The SAI for the Fund includes additional information about the Trustees and officers of the Fund and can be obtained without charge on Eaton Vance’s website at www.eatonvance.com or by calling 1-800-260-0761.
Eaton Vance Funds
IMPORTANT NOTICES
Privacy. The Eaton Vance organization is committed to ensuring your financial privacy. Each entity listed below has adopted privacy policy and procedures (“Privacy Program”) Eaton Vance believes is reasonably designed to protect your personal information and to govern when and with whom Eaton Vance may share your personal information.
| • | | At the time of opening an account, Eaton Vance generally requires you to provide us with certain information such as name, address, social security number, tax status, account numbers, and account balances. This information is necessary for us to both open an account for you and to allow us to satisfy legal requirements such as applicable anti-money laundering reviews and know-your-customer requirements. |
| • | | On an ongoing basis, in the normal course of servicing your account, Eaton Vance may share your information with unaffiliated third parties that perform various services for Eaton Vance and/or your account. These third parties include transfer agents, custodians, broker/dealers and our professional advisers including auditors, accountants, and legal counsel. Eaton Vance may share your personal information with our affiliates. Eaton Vance may also share your information as required or permitted by applicable law. |
| • | | We have adopted a Privacy Program we believe is reasonably designed to protect the confidentiality of your personal information and to prevent unauthorized access to your information. |
| • | | We reserve the right to change our Privacy Program at any time upon proper notification to you. You may want to review our Privacy Program periodically for changes by accessing the link on our homepage: www.eatonvance.com. |
Our pledge of protecting your personal information applies to the following entities within the Eaton Vance organization: the Eaton Vance Family of Funds, Eaton Vance Management, Eaton Vance WaterOak Advisors, Eaton Vance Distributors, Inc., Eaton Vance Trust Company, Eaton Vance Management (International) Limited, Eaton Vance Advisers International Ltd., Eaton Vance Global Advisors Limited, Eaton Vance Management’s Real Estate Investment Group, Boston Management and Research, Calvert Research and Management, and Calvert Funds. This notice supersedes all previously issued privacy disclosures. For more information about Eaton Vance’s Privacy Program or about how your personal information may be used, please call 1-800-262-1122.
Delivery of Shareholder Documents. The Securities and Exchange Commission (SEC) permits funds to deliver only one copy of shareholder documents, including prospectuses, proxy statements and shareholder reports, to fund investors with multiple accounts at the same residential or post office box address. This practice is often called “householding” and it helps eliminate duplicate mailings to shareholders. Eaton Vance, or your financial intermediary, may household the mailing of your documents indefinitely unless you instruct Eaton Vance, or your financial intermediary, otherwise. If you would prefer that your Eaton Vance documents not be householded, please contact Eaton Vance at 1-800-260-0761, or contact your financial intermediary. Your instructions that householding not apply to delivery of your Eaton Vance documents will typically be effective within 30 days of receipt by Eaton Vance or your financial intermediary.
Portfolio Holdings. Each Eaton Vance Fund and its underlying Portfolio(s) (if applicable) files a schedule of portfolio holdings on Part F to Form N-PORT with the SEC. Certain information filed on Form N-PORT may be viewed on the Eaton Vance website at www.eatonvance.com, by calling Eaton Vance at 1-800-260-0761 or in the EDGAR database on the SEC’s website at www.sec.gov.
Proxy Voting. From time to time, funds are required to vote proxies related to the securities held by the funds. The Eaton Vance Funds or their underlying Portfolios (if applicable) vote proxies according to a set of policies and procedures approved by the Funds’ and Portfolios’ Boards. You may obtain a description of these policies and procedures and information on how the Funds or Portfolios voted proxies relating to portfolio securities during the most recent 12-month period ended June 30, without charge, upon request, by calling 1-800-260-0761 and by accessing the SEC’s website at www.sec.gov.
This Page Intentionally Left Blank
Investment Adviser and Administrator
Eaton Vance Management
Two International Place
Boston, MA 02110
Investment Sub-Adviser
Parametric Portfolio Associates LLC
800 Fifth Avenue, Suite 2800
Seattle, WA 98104
Principal Underwriter*
Eaton Vance Distributors, Inc.
Two International Place
Boston, MA 02110
(617) 482-8260
Custodian
State Street Bank and Trust Company
State Street Financial Center, One Lincoln Street
Boston, MA 02111
Transfer Agent
BNY Mellon Investment Servicing (US) Inc.
Attn: Eaton Vance Funds
P.O. Box 9653
Providence, RI 02940-9653
(800) 260-0761
Independent Registered Public Accounting Firm
Deloitte & Touche LLP
200 Berkeley Street
Boston, MA 02116-5022
Fund Offices
Two International Place
Boston, MA 02110
| * | FINRA BrokerCheck. Investors may check the background of their Investment Professional by contacting the Financial Industry Regulatory Authority (FINRA). FINRA BrokerCheck is a free tool to help investors check the professional background of current and former FINRA-registered securities firms and brokers. FINRA BrokerCheck is available by calling 1-800-289-9999 and at www.FINRA.org. The FINRA BrokerCheck brochure describing this program is available to investors at www.FINRA.org. |

2774 1.31.21

Parametric
International Equity Fund
Annual Report
January 31, 2021

Commodity Futures Trading Commission Registration. The Commodity Futures Trading Commission (“CFTC”) has adopted regulations that subject registered investment companies and advisers to regulation by the CFTC if a fund invests more than a prescribed level of its assets in certain CFTC-regulated instruments (including futures, certain options and swap agreements) or markets itself as providing investment exposure to such instruments. The investment adviser has claimed an exclusion from the definition of “commodity pool operator” under the Commodity Exchange Act with respect to its management of the Fund. Accordingly, neither the Fund nor the adviser with respect to the operation of the Fund is subject to CFTC regulation. Because of its management of other strategies, the Fund’s adviser and Parametric Portfolio Associates LLC (Parametric), sub-adviser to the Fund, are registered with the CFTC as commodity pool operators. The adviser and Parametric are also registered as commodity trading advisors.
Fund shares are not insured by the FDIC and are not deposits or other obligations of, or guaranteed by, any depository institution. Shares are subject to investment risks, including possible loss of principal invested.
This report must be preceded or accompanied by a current summary prospectus or prospectus. Before investing, investors should consider carefully the investment objective, risks, and charges and expenses of a mutual fund. This and other important information is contained in the summary prospectus and prospectus, which can be obtained from a financial intermediary. Prospective investors should read the prospectus carefully before investing. For further information, please call 1-800-260-0761.
Annual Report January 31, 2021
Parametric
International Equity Fund
Parametric
International Equity Fund
January 31, 2021
Management’s Discussion of Fund Performance1
Economic and Market Conditions
Developed equity markets outside the U.S., as measured by the MSCI EAFE Index (the Index), delivered solid returns during the 12-month period ended January 31, 2021. Returns were broadly positive, with only four of the 23 countries within the index delivering negative results.
The strong year-end results masked underlying volatility during the period. International equities experienced two starkly different performance regimes over the 2020 calendar year. The first quarter brought panicked selling as investors reacted to the many unknowns of the coronavirus. Sentiment improved later in March, rather resoundingly. In the second quarter, local equities advanced in all member countries as stocks rebounded. Governments gradually began to lift stay-at-home orders and business shutdowns, which positively shifted investor sentiment and resulted in rising worldwide equity prices. Additionally, central banks took interventional measures utilizing a variety of monetary policy tools to backstop domestic economies and aid a stressed citizenry facing unprecedented spikes in unemployment. Following gains in July and the best August returns in years, equities sold-off in September as an uptick in new Covid-19 cases popped up across the globe spurring new restrictions and shutdown precautions. Announcements of vaccine approvals and the conclusion of the U.S. Presidential election pushed November returns to historic levels, which persisted into December. The market turned downward slightly in January to end the period.
Fund Performance
For the 12-month period ended January 31, 2021, the Parametric International Equity Fund (the Fund) had a total return of 10.35% for Class A shares at net asset value (NAV), outperforming the Fund’s benchmark, the Index, which had a total return of 8.94% for the same period.
Factors contributing to the Fund’s performance relative to the Index included the Fund’s underweight to the U.K. The combination of local challenges emanating from Covid-19 and the sluggish pace of trade negotiations with the European Union stifled much of the potential rebound for British equities. Additionally, the Fund’s sector allocation process in Switzerland boosted relative results due to overweight positions in information technology and consumer discretionary. The Fund’s sector diversification within Norway also contributed.
Factors detracting from the Fund’s performance relative to the Index included an underweight to Japan. Japanese equities flourished relative to larger, developed market peers as the country proved more resilient amid the second wave of virus outbreaks later in the year. An overweight to Spain also weighed on relative results. The country experienced a broad-based sell-off following a disheartening spike in new virus cases during the latter part of the year. The Fund’s sector diversification process within Portugal also detracted from relative performance during the period.
See Endnotes and Additional Disclosures in this report.
Past performance is no guarantee of future results. Returns are historical and are calculated by determining the percentage change in net asset value (NAV) or offering price (as applicable) with all distributions reinvested. Investment return and principal value will fluctuate so that shares, when redeemed, may be worth more or less than their original cost. Performance for periods less than or equal to one year is cumulative. Performance is for the stated time period only; due to market volatility, current Fund performance may be lower or higher than the quoted return. For performance as of the most recent month-end, please refer to eatonvance.com.
Parametric
International Equity Fund
January 31, 2021
Performance2,3
Portfolio Managers Thomas C. Seto, Paul Bouchey, CFA and Jennifer Sireklove, CFA, each of Parametric Portfolio Associates LLC
| | | | | | | | | | | | | | | | | | | | |
| % Average Annual Total Returns | | Class
Inception Date | | | Performance
Inception Date | | | One Year | | | Five Years | | | Ten Years | |
| | | | | |
Class A at NAV | | | 04/01/2010 | | | | 04/01/2010 | | | | 10.35 | % | | | 9.14 | % | | | 5.79 | % |
Class A with 5.75% Maximum Sales Charge | | | — | | | | — | | | | 4.04 | | | | 7.85 | | | | 5.16 | |
Institutional Class at NAV | | | 04/01/2010 | | | | 04/01/2010 | | | | 10.75 | | | | 9.42 | | | | 6.07 | |
Class R at NAV | | | 08/10/2015 | | | | 04/01/2010 | | | | 10.20 | | | | 8.87 | | | | 5.65 | |
Class R6 at NAV | | | 08/10/2015 | | | | 04/01/2010 | | | | 10.75 | | | | 9.43 | | | | 6.08 | |
|
| |
| | | | | |
MSCI EAFE Index | | | — | | | | — | | | | 8.94 | % | | | 8.83 | % | | | 5.15 | % |
| | | | | |
| % Total Annual Operating Expense Ratios4 | | | | | Class A | | | Institutional
Class | | | Class R | | | Class R6 | |
| | | | | |
Gross | | | | | | | 0.81 | % | | | 0.56 | % | | | 1.06 | % | | | 0.53 | % |
Net | | | | | | | 0.75 | | | | 0.50 | | | | 1.00 | | | | 0.47 | |
Growth of $10,000
This graph shows the change in value of a hypothetical investment of $10,000 in Class A of the Fund for the period indicated. For comparison, the same investment is shown in the indicated index.
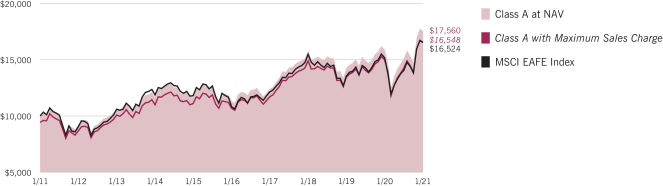
| | | | | | | | | | | | | | | | |
| Growth of Investment3 | | Amount Invested | | | Period Beginning | | | At NAV | | | With Maximum Sales Charge | |
| | | | |
Institutional Class | | | $50,000 | | | | 01/31/2011 | | | | $90,191 | | | | N.A. | |
Class R | | | $10,000 | | | | 01/31/2011 | | | | $17,327 | | | | N.A. | |
Class R6 | | | $1,000,000 | | | | 01/31/2011 | | | | $1,805,822 | | | | N.A. | |
See Endnotes and Additional Disclosures in this report.
Past performance is no guarantee of future results. Returns are historical and are calculated by determining the percentage change in net asset value (NAV) or offering price (as applicable) with all distributions reinvested. Investment return and principal value will fluctuate so that shares, when redeemed, may be worth more or less than their original cost. Performance for periods less than or equal to one year is cumulative. Performance is for the stated time period only; due to market volatility, current Fund performance may be lower or higher than the quoted return. For performance as of the most recent month-end, please refer to eatonvance.com.
Parametric
International Equity Fund
January 31, 2021
Fund Profile
Sector Allocation (% of net assets)5
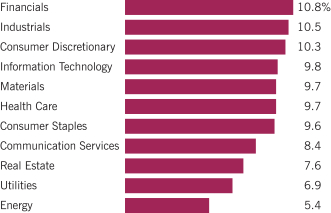
Geographic Allocation (% of common stocks)
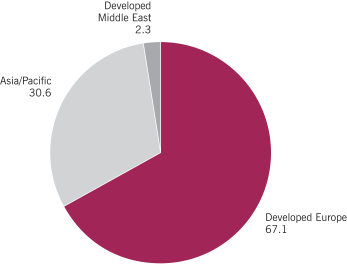
Top 10 Holdings (% of net assets)5
| | | | |
Nestle S.A. | | | 1.2 | % |
| |
Cie Financiere Richemont S.A. | | | 0.9 | |
| |
TOTAL SE | | | 0.9 | |
| |
Air Liquide S.A. | | | 0.8 | |
| |
ASML Holding NV | | | 0.8 | |
| |
SAP SE | | | 0.7 | |
| |
Sanofi | | | 0.7 | |
| |
Deutsche Telekom AG | | | 0.7 | |
| |
BASF SE | | | 0.6 | |
| |
CSL, Ltd. | | | 0.5 | |
| |
Total | | | 7.8 | % |
See Endnotes and Additional Disclosures in this report.
Parametric
International Equity Fund
January 31, 2021
Endnotes and Additional Disclosures
| 1 | The views expressed in this report are those of the portfolio manager(s) and are current only through the date stated at the top of this page. These views are subject to change at any time based upon market or other conditions, and Eaton Vance and the Fund(s) disclaim any responsibility to update such views. These views may not be relied upon as investment advice and, because investment decisions are based on many factors, may not be relied upon as an indication of trading intent on behalf of any Eaton Vance fund. This commentary may contain statements that are not historical facts, referred to as “forward-looking statements.” The Fund’s actual future results may differ significantly from those stated in any forward-looking statement, depending on factors such as changes in securities or financial markets or general economic conditions, the volume of sales and purchases of Fund shares, the continuation of investment advisory, administrative and service contracts, and other risks discussed from time to time in the Fund’s filings with the Securities and Exchange Commission. |
| 2 | MSCI EAFE Index is an unmanaged index of equities in the developed markets, excluding the U.S. and Canada. MSCI indexes are net of foreign withholding taxes. Source: MSCI. MSCI data may not be reproduced or used for any other purpose. MSCI provides no warranties, has not prepared or approved this report, and has no liability hereunder. Unless otherwise stated, index returns do not reflect the effect of any applicable sales charges, commissions, expenses, taxes or leverage, as applicable. It is not possible to invest directly in an index. |
| 3 | Total Returns at NAV do not include applicable sales charges. If sales charges were deducted, the returns would be lower. Total Returns shown with maximum sales charge reflect the stated maximum sales charge. Unless otherwise stated, performance does not reflect the deduction of taxes on Fund distributions or redemptions of Fund shares. |
Performance prior to the inception date of a class may be linked to the performance of an older class of the Fund. This linked performance is adjusted for any applicable sales charge, but is not adjusted for class expense differences. If adjusted for such differences, the performance would be different. The performance of Class R is linked to Class A and the performance of Class R6 is linked to Institutional Class. Performance presented in the Financial Highlights included in the financial statements is not linked.
| 4 | Source: Fund prospectus. Net expense ratios reflect a contractual expense reimbursement that continues through 5/31/21. Without the reimbursement, performance would have been lower. The expense ratios for the current reporting period can be found in the Financial Highlights section of this report. |
| 5 | Excludes cash and cash equivalents. |
Fund profile subject to change due to active management.
Additional Information
Diversification cannot ensure a profit or eliminate the risk of loss.
Parametric
International Equity Fund
January 31, 2021
Fund Expenses
Example: As a Fund shareholder, you incur two types of costs: (1) transaction costs, including sales charges (loads) on purchases and redemption fees (if applicable); and (2) ongoing costs, including management fees; distribution and/or service fees; and other Fund expenses. This Example is intended to help you understand your ongoing costs (in dollars) of Fund investing and to compare these costs with the ongoing costs of investing in other mutual funds. The Example is based on an investment of $1,000 invested at the beginning of the period and held for the entire period (August 1, 2020 – January 31, 2021).
Actual Expenses: The first section of the table below provides information about actual account values and actual expenses. You may use the information in this section, together with the amount you invested, to estimate the expenses that you paid over the period. Simply divide your account value by $1,000 (for example, an $8,600 account value divided by $1,000 = 8.6), then multiply the result by the number in the first section under the heading entitled “Expenses Paid During Period” to estimate the expenses you paid on your account during this period.
Hypothetical Example for Comparison Purposes: The second section of the table below provides information about hypothetical account values and hypothetical expenses based on the actual Fund expense ratio and an assumed rate of return of 5% per year (before expenses), which is not the actual Fund return. The hypothetical account values and expenses may not be used to estimate the actual ending account balance or expenses you paid for the period. You may use this information to compare the ongoing costs of investing in your Fund and other funds. To do so, compare this 5% hypothetical example with the 5% hypothetical examples that appear in the shareholder reports of the other funds.
Please note that the expenses shown in the table are meant to highlight your ongoing costs only and do not reflect any transactional costs, such as sales charges (loads) or redemption fees (if applicable). Therefore, the second section of the table is useful in comparing ongoing costs only, and will not help you determine the relative total costs of owning different funds. In addition, if these transactional costs were included, your costs would be higher.
| | | | | | | | | | | | | | | | |
| | | Beginning
Account Value
(8/1/20) | | | Ending
Account Value
(1/31/21) | | | Expenses Paid
During Period*
(8/1/20 – 1/31/21) | | | Annualized
Expense
Ratio | |
| | | | |
Actual | | | | | | | | | | | | | | | | |
Class A | | $ | 1,000.00 | | | $ | 1,161.20 | | | $ | 4.07 | ** | | | 0.75 | % |
Institutional Class | | $ | 1,000.00 | | | $ | 1,162.50 | | | $ | 2.72 | ** | | | 0.50 | % |
Class R | | $ | 1,000.00 | | | $ | 1,160.00 | | | $ | 5.43 | ** | | | 1.00 | % |
Class R6 | | $ | 1,000.00 | | | $ | 1,162.50 | | | $ | 2.55 | ** | | | 0.47 | % |
| | | | | |
Hypothetical | | | | | | | | | | | | | | | | |
(5% return per year before expenses) | | | | | | | | | | | | | | | | |
Class A | | $ | 1,000.00 | | | $ | 1,021.40 | | | $ | 3.81 | ** | | | 0.75 | % |
Institutional Class | | $ | 1,000.00 | | | $ | 1,022.60 | | | $ | 2.54 | ** | | | 0.50 | % |
Class R | | $ | 1,000.00 | | | $ | 1,020.10 | | | $ | 5.08 | ** | | | 1.00 | % |
Class R6 | | $ | 1,000.00 | | | $ | 1,022.80 | | | $ | 2.39 | ** | | | 0.47 | % |
| * | Expenses are equal to the Fund’s annualized expense ratio for the indicated Class, multiplied by the average account value over the period, multiplied by 184/366 (to reflect the one-half year period). The Example assumes that the $1,000 was invested at the net asset value per share determined at the close of business on July 31, 2020. |
| ** | Absent an allocation of certain expenses to affiliates, the expenses would be higher. |
Parametric
International Equity Fund
January 31, 2021
Portfolio of Investments
| | | | | | | | |
| Common Stocks — 98.7% | |
| Security | | Shares | | | Value | |
|
| Australia — 8.6% | |
| | |
Abacus Property Group | | | 53,600 | | | $ | 111,039 | |
| | |
AGL Energy, Ltd. | | | 148,900 | | | | 1,301,617 | |
| | |
Alumina, Ltd. | | | 71,500 | | | | 91,781 | |
| | |
AMA Group, Ltd.(1)(2) | | | 248,700 | | | | 121,976 | |
| | |
Ampol, Ltd. | | | 36,100 | | | | 718,753 | |
| | |
ARB Corp., Ltd.(1) | | | 10,500 | | | | 280,440 | |
| | |
ASX, Ltd. | | | 7,100 | | | | 387,958 | |
| | |
Atlas Arteria, Ltd. | | | 64,200 | | | | 309,426 | |
| | |
Atlassian Corp. PLC, Class A(2) | | | 10,500 | | | | 2,426,865 | |
| | |
Aurizon Holdings, Ltd. | | | 129,400 | | | | 364,997 | |
| | |
AusNet Services | | | 790,600 | | | | 1,040,739 | |
| | |
Austal, Ltd. | | | 72,300 | | | | 141,098 | |
| | |
Australian Agricultural Co., Ltd.(1)(2) | | | 99,614 | | | | 84,057 | |
| | |
Bank of Queensland, Ltd.(1) | | | 45,200 | | | | 273,585 | |
| | |
Bapcor, Ltd. | | | 45,765 | | | | 261,377 | |
| | |
Bendigo & Adelaide Bank, Ltd.(1) | | | 46,000 | | | | 321,505 | |
| | |
BHP Group, Ltd. | | | 60,444 | | | | 2,015,747 | |
| | |
Boral, Ltd. | | | 45,753 | | | | 168,179 | |
| | |
Brambles, Ltd. | | | 104,724 | | | | 842,623 | |
| | |
Bravura Solutions, Ltd.(1) | | | 100,400 | | | | 231,188 | |
| | |
Breville Group, Ltd. | | | 13,134 | | | | 288,814 | |
| | |
Centuria Office REIT | | | 67,500 | | | | 100,391 | |
| | |
Charter Hall Group | | | 42,400 | | | | 438,101 | |
| | |
Charter Hall Long Wale REIT | | | 52,200 | | | | 182,935 | |
| | |
Charter Hall Retail REIT | | | 42,000 | | | | 113,424 | |
| | |
Cleanaway Waste Management, Ltd. | | | 189,000 | | | | 318,403 | |
| | |
Coca-Cola Amatil, Ltd. | | | 99,170 | | | | 987,147 | |
| | |
Collins Foods, Ltd.(1) | | | 20,500 | | | | 150,277 | |
| | |
Commonwealth Bank of Australia | | | 30,923 | | | | 1,963,357 | |
| | |
Computershare, Ltd. | | | 59,912 | | | | 653,924 | |
| | |
Cromwell Property Group | | | 165,783 | | | | 102,208 | |
| | |
Crown Resorts, Ltd.(1) | | | 25,500 | | | | 186,229 | |
| | |
CSL, Ltd. | | | 17,300 | | | | 3,586,662 | |
| | |
CSR, Ltd. | | | 49,000 | | | | 196,603 | |
| | |
Dexus | | | 66,800 | | | | 457,459 | |
| | |
Domain Holdings Australia, Ltd. | | | 126,219 | | | | 477,280 | |
| | |
Domino’s Pizza Enterprises, Ltd. | | | 3,100 | | | | 216,783 | |
| | |
Eagers Automotive, Ltd.(1) | | | 25,700 | | | | 259,352 | |
| | |
EML Payments, Ltd.(1)(2) | | | 73,900 | | | | 215,364 | |
| | |
Evolution Mining, Ltd. | | | 80,276 | | | | 286,701 | |
| | |
Flight Centre Travel Group, Ltd.(1)(2) | | | 5,800 | | | | 61,857 | |
| | |
Goodman Group | | | 73,900 | | | | 994,471 | |
| | |
GPT Group (The) | | | 125,200 | | | | 411,446 | |
| | |
GUD Holdings, Ltd.(1) | | | 15,500 | | | | 140,590 | |
| | | | | | | | |
| Security | | Shares | | | Value | |
|
| Australia (continued) | |
| | |
GWA Group, Ltd.(1) | | | 67,200 | | | $ | 176,002 | |
| | |
Hansen Technologies, Ltd. | | | 30,805 | | | | 90,764 | |
| | |
Harvey Norman Holdings, Ltd.(1) | | | 71,004 | | | | 287,572 | |
| | |
IDP Education, Ltd.(1) | | | 15,800 | | | | 275,002 | |
| | |
Infomedia, Ltd. | | | 61,241 | | | | 84,600 | |
| | |
Ingenia Communities Group | | | 56,700 | | | | 215,959 | |
| | |
Inghams Group, Ltd.(1) | | | 205,700 | | | | 516,022 | |
| | |
InvoCare, Ltd.(1) | | | 17,400 | | | | 147,734 | |
| | |
IRESS, Ltd.(1) | | | 53,584 | | | | 407,173 | |
| | |
James Hardie Industries PLC CDI(2) | | | 13,706 | | | | 383,094 | |
| | |
JB Hi-Fi, Ltd.(1) | | | 10,699 | | | | 420,495 | |
| | |
Link Administration Holdings, Ltd. | | | 96,491 | | | | 349,582 | |
| | |
Medibank Pvt, Ltd. | | | 167,700 | | | | 372,511 | |
| | |
Megaport, Ltd.(1)(2) | | | 29,807 | | | | 303,582 | |
| | |
Mirvac Group | | | 234,000 | | | | 422,264 | |
| | |
National Australia Bank, Ltd. | | | 61,500 | | | | 1,102,393 | |
| | |
National Storage REIT | | | 157,700 | | | | 229,265 | |
| | |
Newcrest Mining, Ltd. | | | 23,300 | | | | 442,850 | |
| | |
NEXTDC, Ltd.(2) | | | 46,000 | | | | 405,043 | |
| | |
Northern Star Resources, Ltd. | | | 33,400 | | | | 323,221 | |
| | |
Oil Search, Ltd. | | | 273,800 | | | | 804,956 | |
| | |
Orica, Ltd. | | | 16,599 | | | | 192,676 | |
| | |
Orora, Ltd. | | | 65,655 | | | | 125,375 | |
| | |
Premier Investments, Ltd. | | | 11,500 | | | | 195,854 | |
| | |
Qantas Airways, Ltd.(2) | | | 60,000 | | | | 205,295 | |
| | |
Qube Holdings, Ltd. | | | 143,942 | | | | 311,905 | |
| | |
Ramsay Health Care, Ltd. | | | 11,000 | | | | 527,826 | |
| | |
REA Group, Ltd.(1) | | | 12,200 | | | | 1,356,080 | |
| | |
Regis Resources, Ltd. | | | 52,500 | | | | 144,308 | |
| | |
Rio Tinto, Ltd. | | | 9,700 | | | | 811,880 | |
| | |
Santos, Ltd. | | | 236,080 | | | | 1,163,596 | |
| | |
Saracen Mineral Holdings, Ltd.(2) | | | 62,175 | | | | 228,673 | |
| | |
Scentre Group | | | 311,000 | | | | 644,281 | |
| | |
Select Harvests, Ltd.(1) | | | 74,600 | | | | 296,130 | |
| | |
Service Stream, Ltd.(1) | | | 75,800 | | | | 109,876 | |
| | |
Shopping Centres Australasia Property Group | | | 118,852 | | | | 210,166 | |
| | |
Sonic Healthcare, Ltd. | | | 20,400 | | | | 533,131 | |
| | |
Spark Infrastructure Group(1) | | | 758,533 | | | | 1,271,090 | |
| | |
St. Barbara, Ltd. | | | 108,600 | | | | 181,260 | |
| | |
Star Entertainment Group, Ltd. (The) | | | 62,300 | | | | 162,950 | |
| | |
Suncorp Group, Ltd. | | | 46,300 | | | | 354,728 | |
| | |
Sydney Airport(1)(2) | | | 78,700 | | | | 341,975 | |
| | |
Tabcorp Holdings, Ltd. | | | 131,400 | | | | 398,192 | |
| | |
Technology One, Ltd.(1) | | | 50,588 | | | | 332,216 | |
| | |
Telstra Corp., Ltd. | | | 892,573 | | | | 2,119,745 | |
| | |
TPG Telecom, Ltd.(1)(2) | | | 106,300 | | | | 596,780 | |
| | | | |
| | 7 | | See Notes to Financial Statements. |
Parametric
International Equity Fund
January 31, 2021
Portfolio of Investments — continued
| | | | | | | | |
| Security | | Shares | | | Value | |
|
| Australia (continued) | |
| | |
Transurban Group(1) | | | 146,041 | | | $ | 1,471,524 | |
| | |
Tuas, Ltd.(1)(2) | | | 53,150 | | | | 30,203 | |
| | |
United Malt Grp, Ltd. | | | 36,900 | | | | 112,262 | |
| | |
Viva Energy Group, Ltd.(3) | | | 245,901 | | | | 327,139 | |
| | |
Vocus Group, Ltd.(2) | | | 262,382 | | | | 820,760 | |
| | |
Washington H. Soul Pattinson & Co., Ltd.(1) | | | 21,300 | | | | 441,211 | |
| | |
Waypoint REIT | | | 96,300 | | | | 188,231 | |
| | |
Wesfarmers, Ltd. | | | 54,885 | | | | 2,278,240 | |
| | |
Westpac Banking Corp. | | | 68,400 | | | | 1,096,533 | |
| | |
Whitehaven Coal, Ltd.(1) | | | 299,361 | | | | 339,708 | |
| | |
Woodside Petroleum, Ltd. | | | 118,100 | | | | 2,192,118 | |
| | |
Woolworths Group, Ltd. | | | 109,096 | | | | 3,393,292 | |
| |
| | | | $ | 57,552,021 | |
|
| Austria — 1.2% | |
| | |
Agrana Beteiligungs AG | | | 5,979 | | | $ | 127,122 | |
| | |
ams AG(2) | | | 27,700 | | | | 692,855 | |
| | |
ANDRITZ AG | | | 15,966 | | | | 758,470 | |
| | |
BAWAG Group AG(2)(3) | | | 5,440 | | | | 236,519 | |
| | |
CA Immobilien Anlagen AG | | | 16,401 | | | | 706,358 | |
| | |
Erste Group Bank AG(2) | | | 15,837 | | | | 483,649 | |
| | |
IMMOFINANZ AG(1)(2) | | | 20,512 | | | | 433,306 | |
| | |
Lenzing AG(2) | | | 2,500 | | | | 321,450 | |
| | |
Oesterreichische Post AG(1) | | | 6,444 | | | | 272,523 | |
| | |
OMV AG | | | 21,502 | | | | 902,263 | |
| | |
Porr AG(1)(2) | | | 3,440 | | | | 57,846 | |
| | |
Rhi Magnesita NV | | | 4,792 | | | | 254,080 | |
| | |
S&T AG(2) | | | 9,400 | | | | 246,702 | |
| | |
Telekom Austria AG | | | 70,800 | | | | 538,867 | |
| | |
UNIQA Insurance Group AG | | | 14,300 | | | | 110,774 | |
| | |
Verbund AG(1) | | | 10,478 | | | | 944,408 | |
| | |
Vienna Insurance Group AG Wiener Versicherung Gruppe | | | 2,987 | | | | 76,469 | |
| | |
Wienerberger AG | | | 16,700 | | | | 567,165 | |
| |
| | | | $ | 7,730,826 | |
|
| Belgium — 2.2% | |
| | |
Ackermans & van Haaren NV | | | 1,660 | | | $ | 253,718 | |
| | |
Ageas S.A./NV | | | 9,300 | | | | 476,132 | |
| | |
AGFA-Gevaert NV(2) | | | 57,503 | | | | 266,316 | |
| | |
Anheuser-Busch InBev S.A./NV | | | 26,635 | | | | 1,671,950 | |
| | |
Barco NV(1) | | | 31,255 | | | | 603,802 | |
| | |
Befimmo S.A. | | | 5,550 | | | | 236,045 | |
| | |
Bekaert S.A. | | | 17,140 | | | | 589,566 | |
| | |
Biocartis Group NV(2)(3) | | | 11,000 | | | | 60,079 | |
| | |
bpost S.A.(2) | | | 38,532 | | | | 455,866 | |
| | | | | | | | |
| Security | | Shares | | | Value | |
|
| Belgium (continued) | |
| | |
Cofinimmo S.A. | | | 3,691 | | | $ | 551,799 | |
| | |
D’Ieteren S.A./NV | | | 6,400 | | | | 504,596 | |
| | |
Econocom Group S.A./NV | | | 45,600 | | | | 140,876 | |
| | |
Elia Group S.A./NV | | | 9,400 | | | | 1,131,257 | |
| | |
Etablissements Franz Colruyt NV | | | 1,550 | | | | 95,614 | |
| | |
Euronav S.A. | | | 48,660 | | | | 389,927 | |
| | |
EVS Broadcast Equipment S.A.(2) | | | 3,375 | | | | 62,609 | |
| | |
Fagron | | | 11,540 | | | | 285,355 | |
| | |
Gimv NV | | | 1,766 | | | | 105,272 | |
| | |
Groupe Bruxelles Lambert S.A. | | | 6,034 | | | | 596,884 | |
| | |
KBC Ancora(2) | | | 2,150 | | | | 83,845 | |
| | |
Materialise NV ADR(1)(2) | | | 12,600 | | | | 822,654 | |
| | |
Montea C.V.A. | | | 2,560 | | | | 312,134 | |
| | |
Orange Belgium S.A. | | | 10,380 | | | | 279,986 | |
| | |
Proximus SADP | | | 65,274 | | | | 1,375,531 | |
| | |
Sofina S.A. | | | 1,080 | | | | 349,120 | |
| | |
Solvay S.A.(1) | | | 10,917 | | | | 1,241,700 | |
| | |
Tessenderlo Group S.A.(2) | | | 6,179 | | | | 263,640 | |
| | |
UCB S.A. | | | 9,000 | | | | 931,970 | |
| | |
Warehouses De Pauw CVA | | | 13,800 | | | | 495,495 | |
| |
| | | | $ | 14,633,738 | |
|
| China — 0.3% | |
| | |
Alibaba Health Information Technology, Ltd.(2) | | | 686,000 | | | $ | 2,138,656 | |
| |
| | | | $ | 2,138,656 | |
|
| Denmark — 2.2% | |
| | |
ALK-Abello A/S(2) | | | 515 | | | $ | 201,367 | |
| | |
Alm Brand A/S | | | 16,800 | | | | 187,853 | |
| | |
Bakkafrost P/F(2) | | | 3,922 | | | | 276,150 | |
| | |
Carlsberg A/S, Class B | | | 8,337 | | | | 1,217,970 | |
| | |
Chr. Hansen Holding A/S(2) | | | 8,939 | | | | 808,702 | |
| | |
Coloplast A/S, Class B | | | 1,700 | | | | 253,755 | |
| | |
Drilling Co. of 1972 A/S (The)(2) | | | 4,300 | | | | 117,725 | |
| | |
DSV PANALPINA A/S | | | 4,700 | | | | 733,319 | |
| | |
ISS A/S(2) | | | 7,300 | | | | 125,371 | |
| | |
Jyske Bank A/S(2) | | | 8,666 | | | | 323,916 | |
| | |
Netcompany Group A/S(2)(3) | | | 2,500 | | | | 233,222 | |
| | |
Novo Nordisk A/S, Class B | | | 22,678 | | | | 1,579,935 | |
| | |
Novozymes A/S, Class B | | | 18,400 | | | | 1,104,340 | |
| | |
Orsted A/S(3) | | | 11,417 | | | | 2,168,397 | |
| | |
Pandora A/S | | | 14,660 | | | | 1,410,678 | |
| | |
Ringkjoebing Landbobank A/S | | | 4,160 | | | | 365,448 | |
| | |
Rockwool International A/S, Class B | | | 600 | | | | 226,351 | |
| | |
Royal Unibrew A/S | | | 4,000 | | | | 394,861 | |
| | | | |
| | 8 | | See Notes to Financial Statements. |
Parametric
International Equity Fund
January 31, 2021
Portfolio of Investments — continued
| | | | | | | | |
| Security | | Shares | | | Value | |
|
| Denmark (continued) | |
| | |
SimCorp A/S | | | 7,565 | | | $ | 979,169 | |
| | |
Spar Nord Bank A/S(2) | | | 15,000 | | | | 136,736 | |
| | |
Sydbank A/S(2) | | | 12,000 | | | | 249,329 | |
| | |
Topdanmark A/S | | | 4,627 | | | | 213,647 | |
| | |
Tryg A/S | | | 14,915 | | | | 464,009 | |
| | |
Vestas Wind Systems A/S | | | 3,800 | | | | 815,927 | |
| |
| | | | $ | 14,588,177 | |
|
| Finland — 2.2% | |
| | |
Citycon Oyj(1) | | | 17,313 | | | $ | 169,621 | |
| | |
Elisa Oyj | | | 21,597 | | | | 1,285,817 | |
| | |
Fortum Oyj | | | 56,906 | | | | 1,376,436 | |
| | |
Huhtamaki Oyj | | | 6,300 | | | | 308,925 | |
| | |
Kemira Oyj | | | 9,600 | | | | 162,499 | |
| | |
Kesko Oyj, Class B | | | 59,056 | | | | 1,533,484 | |
| | |
Kojamo Oyj | | | 23,100 | | | | 492,280 | |
| | |
Kone Oyj, Class B | | | 12,214 | | | | 960,571 | |
| | |
Metsa Board Oyj | | | 21,700 | | | | 233,235 | |
| | |
Neste Oyj | | | 27,035 | | | | 1,904,361 | |
| | |
Nokia Oyj(2) | | | 265,527 | | | | 1,276,013 | |
| | |
Nokian Renkaat Oyj | | | 2,900 | | | | 106,184 | |
| | |
Nordea Bank Abp(2) | | | 96,500 | | | | 782,104 | |
| | |
Orion Oyj, Class B | | | 21,335 | | | | 978,882 | |
| | |
Revenio Group Oyj | | | 3,900 | | | | 237,676 | |
| | |
Sampo Oyj, Class A | | | 12,300 | | | | 517,111 | |
| | |
TietoEVRY Oyj | | | 4,494 | | | | 147,665 | |
| | |
Tokmanni Group Corp. | | | 69,346 | | | | 1,342,384 | |
| | |
UPM-Kymmene Oyj | | | 21,860 | | | | 781,101 | |
| | |
Valmet Oyj | | | 8,331 | | | | 266,699 | |
| | |
YIT Oyj(1) | | | 23,700 | | | | 140,874 | |
| |
| | | | $ | 15,003,922 | |
|
| France — 8.8% | |
| | |
Accor S.A.(2) | | | 4,792 | | | $ | 161,135 | |
| | |
Aeroports de Paris(2) | | | 2,445 | | | | 280,602 | |
| | |
Air Liquide S.A. | | | 31,340 | | | | 5,125,560 | |
| | |
Alstom S.A.(2) | | | 7,150 | | | | 387,670 | |
| | |
Alten S.A.(2) | | | 3,012 | | | | 317,131 | |
| | |
Atos SE(2) | | | 8,580 | | | | 658,425 | |
| | |
AXA S.A. | | | 85,700 | | | | 1,898,627 | |
| | |
BNP Paribas S.A.(2) | | | 46,900 | | | | 2,249,120 | |
| | |
Bouygues S.A. | | | 7,300 | | | | 286,392 | |
| | |
Bureau Veritas S.A.(2) | | | 12,318 | | | | 323,221 | |
| | |
Casino Guichard Perrachon S.A.(1)(2) | | | 25,468 | | | | 863,831 | |
| | |
Christian Dior SE | | | 406 | | | | 211,937 | |
| | | | | | | | |
| Security | | Shares | | | Value | |
|
| France (continued) | |
| | |
Cie Generale des Etablissements Michelin SCA | | | 3,940 | | | $ | 542,961 | |
| | |
CNP Assurances(2) | | | 25,862 | | | | 391,966 | |
| | |
Coface S.A.(2) | | | 14,300 | | | | 140,675 | |
| | |
Covivio | | | 8,980 | | | | 737,350 | |
| | |
Criteo S.A. ADR(2) | | | 18,200 | | | | 338,520 | |
| | |
Danone S.A. | | | 37,118 | | | | 2,468,295 | |
| | |
Dassault Aviation S.A.(2) | | | 200 | | | | 208,527 | |
| | |
Dassault Systemes SE | | | 9,786 | | | | 1,953,514 | |
| | |
Edenred | | | 9,450 | | | | 511,848 | |
| | |
Eiffage S.A.(2) | | | 3,370 | | | | 305,887 | |
| | |
Electricite de France S.A.(2) | | | 46,000 | | | | 571,990 | |
| | |
Elior Group S.A.(1)(3) | | | 11,967 | | | | 75,395 | |
| | |
Engie S.A.(2) | | | 169,700 | | | | 2,633,619 | |
| | |
EssilorLuxottica S.A. | | | 4,834 | | | | 683,806 | |
| | |
Eurazeo SE(2) | | | 6,400 | | | | 448,223 | |
| | |
Eutelsat Communications S.A. | | | 24,500 | | | | 291,768 | |
| | |
Gaztransport Et Technigaz S.A. | | | 1,301 | | | | 118,506 | |
| | |
Gecina S.A. | | | 7,840 | | | | 1,113,861 | |
| | |
Getlink SE(2) | | | 15,500 | | | | 238,865 | |
| | |
Hermes International | | | 670 | | | | 683,625 | |
| | |
Iliad S.A. | | | 3,000 | | | | 554,797 | |
| | |
Klepierre S.A.(1) | | | 34,800 | | | | 834,056 | |
| | |
La Francaise des Jeux SAEM(3) | | | 3,200 | | | | 137,445 | |
| | |
Lagardere SCA(1)(2) | | | 17,800 | | | | 413,748 | |
| | |
Legrand S.A. | | | 6,562 | | | | 602,962 | |
| | |
LVMH Moet Hennessy Louis Vuitton SE | | | 4,370 | | | | 2,642,080 | |
| | |
Mercialys S.A. | | | 25,100 | | | | 227,576 | |
| | |
Metropole Television S.A.(2) | | | 7,662 | | | | 130,175 | |
| | |
Neoen S.A.(1)(2)(3) | | | 4,431 | | | | 312,419 | |
| | |
Orange S.A. | | | 138,000 | | | | 1,619,626 | |
| | |
Pernod-Ricard S.A. | | | 11,578 | | | | 2,182,013 | |
| | |
Quadient S.A. | | | 11,000 | | | | 240,133 | |
| | |
Renault S.A.(2) | | | 6,180 | | | | 262,826 | |
| | |
Safran S.A.(2) | | | 6,400 | | | | 804,528 | |
| | |
Sanofi | | | 49,604 | | | | 4,665,169 | |
| | |
SCOR SE(2) | | | 14,170 | | | | 430,890 | |
| | |
SEB S.A. | | | 700 | | | | 133,027 | |
| | |
Societe BIC S.A. | | | 3,200 | | | | 182,638 | |
| | |
Sodexo S.A.(2) | | | 2,860 | | | | 254,471 | |
| | |
Sopra Steria Group(2) | | | 1,900 | | | | 315,197 | |
| | |
Suez S.A. | | | 39,200 | | | | 804,523 | |
| | |
Talend S.A. ADR(1)(2) | | | 8,600 | | | | 376,164 | |
| | |
Teleperformance | | | 1,408 | | | | 460,531 | |
| | |
Thales S.A. | | | 4,200 | | | | 376,854 | |
| | |
TOTAL SE | | | 143,415 | | | | 6,044,709 | |
| | |
Unibail-Rodamco-Westfield | | | 19,900 | | | | 1,680,345 | |
| | | | |
| | 9 | | See Notes to Financial Statements. |
Parametric
International Equity Fund
January 31, 2021
Portfolio of Investments — continued
| | | | | | | | |
| Security | | Shares | | | Value | |
|
| France (continued) | |
| | |
Veolia Environnement S.A. | | | 50,330 | | | $ | 1,341,203 | |
| | |
Vinci S.A. | | | 10,230 | | | | 948,609 | |
| | |
Vivendi S.A. | | | 57,500 | | | | 1,766,888 | |
| | |
Wendel SE | | | 3,900 | | | | 450,245 | |
| | |
Worldline S.A.(2)(3) | | | 8,496 | | | | 718,166 | |
| |
| | | | $ | 59,136,865 | |
|
| Germany — 8.7% | |
| | |
adidas AG(2) | | | 3,900 | | | $ | 1,236,607 | |
| | |
Allianz SE | | | 12,080 | | | | 2,730,189 | |
| | |
Amadeus Fire AG(2) | | | 502 | | | | 68,650 | |
| | |
Aroundtown S.A. | | | 116,780 | | | | 810,719 | |
| | |
BASF SE | | | 48,181 | | | | 3,723,726 | |
| | |
Bayer AG | | | 31,643 | | | | 1,915,124 | |
| | |
Bayerische Motoren Werke AG | | | 8,860 | | | | 750,166 | |
| | |
Bayerische Motoren Werke AG, PFC Shares | | | 4,800 | | | | 313,266 | |
| | |
Befesa S.A.(3) | | | 4,524 | | | | 300,213 | |
| | |
Beiersdorf AG | | | 17,677 | | | | 1,929,534 | |
| | |
Carl Zeiss Meditec AG | | | 2,900 | | | | 453,227 | |
| | |
Continental AG | | | 3,700 | | | | 517,830 | |
| | |
Delivery Hero SE(2)(3) | | | 5,167 | | | | 784,789 | |
| | |
Deutsche Boerse AG | | | 6,040 | | | | 969,740 | |
| | |
Deutsche Lufthansa AG(2) | | | 17,146 | | | | 220,884 | |
| | |
Deutsche Telekom AG | | | 248,395 | | | | 4,417,098 | |
| | |
Deutsche Wohnen SE | | | 29,100 | | | | 1,440,058 | |
| | |
E.ON SE | | | 236,000 | | | | 2,496,534 | |
| | |
Fielmann AG(2) | | | 2,817 | | | | 244,419 | |
| | |
Fraport AG Frankfurt Airport Services Worldwide(2) | | | 3,330 | | | | 180,407 | |
| | |
Fresenius Medical Care AG & Co. KGaA | | | 6,800 | | | | 550,112 | |
| | |
Fresenius SE & Co. KGaA | | | 13,155 | | | | 585,828 | |
| | |
FUCHS PETROLUB SE | | | 3,686 | | | | 164,477 | |
| | |
Gerresheimer AG | | | 3,000 | | | | 319,192 | |
| | |
Hannover Rueck SE | | | 2,400 | | | | 371,911 | |
| | |
HeidelbergCement AG | | | 11,589 | | | | 856,650 | |
| | |
Henkel AG & Co. KGaA | | | 18,721 | | | | 1,750,507 | |
| | |
Hochtief AG | | | 2,480 | | | | 230,588 | |
| | |
HUGO BOSS AG | | | 4,900 | | | | 174,413 | |
| | |
Knorr-Bremse AG | | | 3,291 | | | | 435,503 | |
| | |
KWS Saat SE and Co. KGaA | | | 1,025 | | | | 89,667 | |
| | |
Merck KGaA | | | 5,220 | | | | 870,011 | |
| | |
Metro AG | | | 80,910 | | | | 944,133 | |
| | |
MTU Aero Engines AG | | | 2,061 | | | | 478,221 | |
| | |
Muenchener Rueckversicherungs-Gesellschaft AG | | | 4,469 | | | | 1,184,991 | |
| | |
Nordex SE(2) | | | 18,820 | | | | 532,798 | |
| | |
Puma SE(2) | | | 4,602 | | | | 450,321 | |
| | |
QIAGEN NV(2) | | | 12,000 | | | | 650,618 | |
| | | | | | | | |
| Security | | Shares | | | Value | |
|
| Germany (continued) | |
| | |
Rational AG | | | 340 | | | $ | 326,835 | |
| | |
RWE AG | | | 70,537 | | | | 3,030,148 | |
| | |
SAP SE | | | 37,952 | | | | 4,815,653 | |
| | |
Siemens AG | | | 19,540 | | | | 3,027,530 | |
| | |
Siemens Energy AG(2) | | | 9,770 | | | | 361,036 | |
| | |
Siemens Healthineers AG(3) | | | 8,326 | | | | 466,934 | |
| | |
Suedzucker AG | | | 42,800 | | | | 623,793 | |
| | |
Symrise AG | | | 9,900 | | | | 1,231,991 | |
| | |
TAG Immobilien AG | | | 21,338 | | | | 655,220 | |
| | |
Talanx AG(2) | | | 7,137 | | | | 266,528 | |
| | |
TeamViewer AG(2)(3) | | | 21,345 | | | | 1,103,846 | |
| | |
Telefonica Deutschland Holding AG | | | 364,647 | | | | 999,294 | |
| | |
TUI AG(1) | | | 33,700 | | | | 161,697 | |
| | |
Varta AG(1)(2) | | | 3,100 | | | | 551,766 | |
| | |
Volkswagen AG | | | 900 | | | | 189,928 | |
| | |
Volkswagen AG, PFC Shares | | | 4,126 | | | | 780,022 | |
| | |
Vonovia SE | | | 40,861 | | | | 2,728,288 | |
| | |
Washtec AG(2) | | | 1,347 | | | | 79,937 | |
| | |
Zalando SE(2)(3) | | | 3,800 | | | | 435,712 | |
| |
| | | | $ | 57,979,279 | |
|
| Hong Kong — 4.3% | |
| | |
AIA Group, Ltd. | | | 203,000 | | | $ | 2,447,519 | |
| | |
ASM Pacific Technology, Ltd. | | | 61,700 | | | | 895,969 | |
| | |
Bank of East Asia, Ltd. (The) | | | 27,800 | | | | 60,163 | |
| | |
Beijing Tong Ren Tang Chinese Medicine Co., Ltd.(1) | | | 83,000 | | | | 89,028 | |
| | |
BOC Hong Kong Holdings, Ltd. | | | 60,000 | | | | 178,920 | |
| | |
Budweiser Brewing Co. APAC Ltd.(3) | | | 443,900 | | | | 1,484,131 | |
| | |
C-Mer Eye Care Holdings, Ltd. | | | 180,000 | | | | 144,837 | |
| | |
Cafe de Coral Holdings, Ltd. | | | 84,000 | | | | 172,458 | |
| | |
Cathay Pacific Airways, Ltd.(1)(2) | | | 317,000 | | | | 244,073 | |
| | |
Champion REIT | | | 149,000 | | | | 85,495 | |
| | |
China Evergrande New Energy Vehicle Group, Ltd.(1)(2) | | | 360,500 | | | | 1,962,002 | |
| | |
China Tobacco International HK Co., Ltd.(1) | | | 43,000 | | | | 83,603 | |
| | |
China Traditional Chinese Medicine Holdings Co., Ltd. | | | 662,000 | | | | 361,458 | |
| | |
China Youzan, Ltd.(2) | | | 3,432,000 | | | | 1,473,354 | |
| | |
Chow Sang Sang Holdings International, Ltd. | | | 153,000 | | | | 183,516 | |
| | |
Chow Tai Fook Jewellery Group, Ltd. | | | 251,200 | | | | 301,590 | |
| | |
CK Hutchison Holdings, Ltd. | | | 154,000 | | | | 1,062,758 | |
| | |
CLP Holdings, Ltd. | | | 132,000 | | | | 1,238,762 | |
| | |
Dairy Farm International Holdings, Ltd. | | | 146,500 | | | | 630,510 | |
| | |
Fortune REIT | | | 129,000 | | | | 114,961 | |
| | |
Global Cord Blood Corp.(2) | | | 29,600 | | | | 114,552 | |
| | |
Glory Sun Financial Group, Ltd.(1)(2) | | | 2,992,000 | | | | 117,484 | |
| | |
Hang Lung Group, Ltd. | | | 48,000 | | | | 121,399 | |
| | |
Hang Lung Properties, Ltd. | | | 86,000 | | | | 228,537 | |
| | | | |
| | 10 | | See Notes to Financial Statements. |
Parametric
International Equity Fund
January 31, 2021
Portfolio of Investments — continued
| | | | | | | | |
| Security | | Shares | | | Value | |
|
| Hong Kong (continued) | |
| | |
Hang Seng Bank, Ltd. | | | 13,000 | | | $ | 234,447 | |
| | |
Henderson Land Development Co., Ltd. | | | 49,867 | | | | 203,955 | |
| | |
HK Electric Investments & HK Electric Investments, Ltd. | | | 355,500 | | | | 350,913 | |
| | |
HKBN, Ltd. | | | 357,000 | | | | 516,456 | |
| | |
HKT Trust and HKT, Ltd. | | | 912,000 | | | | 1,200,353 | |
| | |
Hong Kong & China Gas Co., Ltd. | | | 911,907 | | | | 1,309,713 | |
| | |
Hong Kong Exchanges & Clearing, Ltd. | | | 20,000 | | | | 1,278,643 | |
| | |
Hongkong Land Holdings, Ltd. | | | 61,200 | | | | 282,152 | |
| | |
Hysan Development Co., Ltd. | | | 37,000 | | | | 134,180 | |
| | |
Jardine Matheson Holdings, Ltd. | | | 15,900 | | | | 916,431 | |
| | |
Jardine Strategic Holdings, Ltd. | | | 16,700 | | | | 432,946 | |
| | |
Johnson Electric Holdings, Ltd. | | | 47,500 | | | | 140,291 | |
| | |
Kerry Logistics Network, Ltd. | | | 116,500 | | | | 248,455 | |
| | |
Kerry Properties, Ltd. | | | 32,500 | | | | 84,114 | |
| | |
Lifestyle International Holdings, Ltd.(1)(2) | | | 152,500 | | | | 108,403 | |
| | |
Link REIT | | | 70,900 | | | | 615,075 | |
| | |
Luk Fook Holdings International, Ltd. | | | 45,000 | | | | 97,482 | |
| | |
Man Wah Holdings, Ltd. | | | 176,800 | | | | 389,942 | |
| | |
Melco International Development, Ltd. | | | 108,000 | | | | 188,450 | |
| | |
MGM China Holdings, Ltd. | | | 166,400 | | | | 250,760 | |
| | |
MTR Corp., Ltd. | | | 108,500 | | | | 629,657 | |
| | |
Nexteer Automotive Group, Ltd.(1) | | | 113,000 | | | | 181,193 | |
| | |
NWS Holdings, Ltd. | | | 295,000 | | | | 283,632 | |
| | |
Pacific Textiles Holdings, Ltd. | | | 244,000 | | | | 151,462 | |
| | |
PAX Global Technology, Ltd. | | | 180,000 | | | | 176,798 | |
| | |
Power Assets Holdings, Ltd. | | | 151,000 | | | | 801,305 | |
| | |
Sands China, Ltd. | | | 200,400 | | | | 795,858 | |
| | |
Shangri-La Asia, Ltd.(2) | | | 200,000 | | | | 169,952 | |
| | |
Sino Land Co., Ltd. | | | 116,000 | | | | 160,667 | |
| | |
SJM Holdings, Ltd. | | | 233,000 | | | | 249,823 | |
| | |
Sun Hung Kai Properties, Ltd. | | | 56,000 | | | | 764,972 | |
| | |
Swire Pacific, Ltd., Class A | | | 23,500 | | | | 146,865 | |
| | |
Swire Pacific, Ltd., Class B | | | 87,500 | | | | 88,874 | |
| | |
Swire Properties, Ltd. | | | 45,400 | | | | 131,598 | |
| | |
Town Health International Medical Group, Ltd.(1)(2)(4) | | | 604,000 | | | | 0 | |
| | |
UNTRADE.BRIGHTOIL(4) | | | 262,000 | | | | 0 | |
| | |
UNTRADE.SUPERB SUMMIT(1)(4) | | | 230,000 | | | | 0 | |
| | |
VSTECS Holdings, Ltd. | | | 154,000 | | | | 134,453 | |
| | |
VTech Holdings, Ltd. | | | 48,500 | | | | 387,724 | |
| | |
Wharf Holdings, Ltd. (The) | | | 54,000 | | | | 118,816 | |
| | |
Wharf Real Estate Investment Co., Ltd. | | | 73,000 | | | | 385,557 | |
| | |
Yue Yuen Industrial Holdings, Ltd. | | | 130,500 | | | | 283,880 | |
| | |
Yuexiu Real Estate Investment Trust | | | 120,000 | | | | 57,877 | |
| |
| | | | $ | 28,881,203 | |
| | | | | | | | |
| Security | | Shares | | | Value | |
|
| Ireland — 2.1% | |
| | |
AIB Group PLC(1)(2) | | | 300,977 | | | $ | 535,189 | |
| | |
Bank of Ireland Group PLC(2) | | | 353,265 | | | | 1,312,334 | |
| | |
Cairn Homes PLC(2) | | | 146,637 | | | | 162,496 | |
| | |
CRH PLC | | | 59,402 | | | | 2,437,549 | |
| | |
Fineos Corp. Holdings PLC CDI(2) | | | 41,347 | | | | 113,145 | |
| | |
Flutter Entertainment PLC(2) | | | 12,153 | | | | 2,262,813 | |
| | |
Fly Leasing, Ltd. ADR(2) | | | 27,800 | | | | 265,212 | |
| | |
Glenveagh Properties PLC(2)(3) | | | 77,242 | | | | 78,888 | |
| | |
Grafton Group PLC | | | 50,858 | | | | 600,495 | |
| | |
Hibernia REIT PLC | | | 69,210 | | | | 91,882 | |
| | |
ICON PLC(2) | | | 9,100 | | | | 1,854,671 | |
| | |
Irish Continental Group PLC(1)(2) | | | 57,130 | | | | 265,873 | |
| | |
Irish Residential Properties REIT PLC | | | 311,874 | | | | 547,932 | |
| | |
Kerry Group PLC, Class A | | | 14,363 | | | | 1,949,159 | |
| | |
Kingspan Group PLC(2) | | | 15,053 | | | | 1,021,880 | |
| | |
Nabriva Therapeutics PLC(1)(2) | | | 13,289 | | | | 34,817 | |
| | |
Origin Enterprises PLC | | | 36,000 | | | | 143,668 | |
| | |
UDG Healthcare PLC | | | 41,868 | | | | 466,828 | |
| | |
Uniphar PLC(2) | | | 37,081 | | | | 114,961 | |
| |
| | | | $ | 14,259,792 | |
|
| Israel — 2.3% | |
| | |
Airport City, Ltd.(2) | | | 16,700 | | | $ | 239,483 | |
| | |
Amot Investments, Ltd. | | | 40,781 | | | | 224,618 | |
| | |
AudioCodes, Ltd.(1) | | | 3,200 | | | | 96,000 | |
| | |
Azrieli Group, Ltd. | | | 10,067 | | | | 611,977 | |
| | |
Bank Hapoalim B.M.(2) | | | 55,057 | | | | 387,443 | |
| | |
Bank Leumi Le-Israel B.M. | | | 92,631 | | | | 570,825 | |
| | |
Bezeq The Israeli Telecommunication Corp., Ltd.(2) | | | 1,151,312 | | | | 1,186,532 | |
| | |
Check Point Software Technologies, Ltd.(2) | | | 4,700 | | | | 600,378 | |
| | |
Danel Adir Yeoshua, Ltd. | | | 1,100 | | | | 164,030 | |
| | |
Elbit Systems, Ltd. | | | 3,930 | | | | 542,417 | |
| | |
Electra, Ltd. | | | 720 | | | | 378,364 | |
| | |
Energix-Renewable Energies, Ltd. | | | 109,890 | | | | 410,117 | |
| | |
Enlight Renewable Energy, Ltd.(2) | | | 210,055 | | | | 389,824 | |
| | |
Fattal Holdings 1998, Ltd.(2) | | | 7,224 | | | | 700,348 | |
| | |
FIBI Holdings, Ltd. | | | 2,300 | | | | 68,731 | |
| | |
First International Bank of Israel, Ltd. | | | 7,535 | | | | 196,753 | |
| | |
Hilan, Ltd. | | | 3,200 | | | | 146,672 | |
| | |
ICL Group, Ltd | | | 317,723 | | | | 1,690,336 | |
| | |
Inrom Construction Industries, Ltd. | | | 40,400 | | | | 184,046 | |
| | |
Kenon Holdings, Ltd. | | | 13,168 | | | | 357,399 | |
| | |
Matrix IT, Ltd. | | | 7,477 | | | | 161,094 | |
| | |
Maytronics, Ltd. | | | 41,700 | | | | 723,624 | |
| | |
Melisron, Ltd. | | | 6,004 | | | | 308,293 | |
| | |
Mizrahi Tefahot Bank, Ltd. | | | 12,760 | | | | 296,758 | |
| | | | |
| | 11 | | See Notes to Financial Statements. |
Parametric
International Equity Fund
January 31, 2021
Portfolio of Investments — continued
| | | | | | | | |
| Security | | Shares | | | Value | |
|
| Israel (continued) | |
| | |
Nice, Ltd.(2) | | | 1,294 | | | $ | 337,387 | |
| | |
Oil Refineries, Ltd.(2) | | | 912,196 | | | | 181,705 | |
| | |
Paz Oil Co., Ltd. | | | 5,234 | | | | 514,471 | |
| | |
Radware, Ltd.(2) | | | 6,000 | | | | 170,100 | |
| | |
Redhill Biopharma, Ltd. ADR(1)(2) | | | 8,400 | | | | 70,728 | |
| | |
Reit 1, Ltd. | | | 72,916 | | | | 335,739 | |
| | |
Shapir Engineering and Industry, Ltd. | | | 30,000 | | | | 215,370 | |
| | |
Shufersal, Ltd. | | | 62,623 | | | | 520,827 | |
| | |
Strauss Group, Ltd. | | | 26,926 | | | | 767,682 | |
| | |
Taro Pharmaceutical Industries, Ltd.(2) | | | 2,100 | | | | 156,954 | |
| | |
Teva Pharmaceutical Industries, Ltd. ADR(2) | | | 107,600 | | | | 1,267,528 | |
| | |
UroGen Pharma, Ltd.(1)(2) | | | 4,300 | | | | 94,901 | |
| |
| | | | $ | 15,269,454 | |
|
| Italy — 4.3% | |
| | |
A2A SpA | | | 85,363 | | | $ | 138,423 | |
| | |
Arnoldo Mondadori Editore SpA(2) | | | 66,000 | | | | 108,608 | |
| | |
Assicurazioni Generali SpA | | | 32,700 | | | | 558,085 | |
| | |
ASTM SpA(2) | | | 12,765 | | | | 284,020 | |
| | |
Atlantia SpA(2) | | | 43,200 | | | | 684,375 | |
| | |
Autogrill SpA(1)(2) | | | 29,700 | | | | 157,191 | |
| | |
Azimut Holding SpA | | | 7,000 | | | | 147,088 | |
| | |
Banca Mediolanum SpA(2) | | | 14,000 | | | | 110,940 | |
| | |
Banca Popolare di Sondrio SCPA(2) | | | 35,600 | | | | 87,357 | |
| | |
Banco BPM SpA(2) | | | 78,600 | | | | 172,020 | |
| | |
Bio-On SpA(1)(2)(4) | | | 12,900 | | | | 0 | |
| | |
BPER Banca(2) | | | 32,400 | | | | 59,523 | |
| | |
Brunello Cucinelli SpA(1)(2) | | | 6,234 | | | | 249,545 | |
| | |
Buzzi Unicem SpA(1) | | | 7,400 | | | | 182,065 | |
| | |
Cementir Holding NV | | | 48,418 | | | | 397,804 | |
| | |
Cerved Group SpA(2) | | | 9,600 | | | | 81,973 | |
| | |
COSMO Pharmaceuticals NV(1)(2) | | | 3,282 | | | | 299,626 | |
| | |
Datalogic SpA | | | 5,730 | | | | 99,610 | |
| | |
Davide Campari-Milano NV | | | 127,434 | | | | 1,369,704 | |
| | |
De’Longhi SpA | | | 10,450 | | | | 375,036 | |
| | |
DiaSorin SpA | | | 7,620 | | | | 1,666,374 | |
| | |
Enav SpA(3) | | | 46,000 | | | | 194,945 | |
| | |
Enel SpA | | | 242,788 | | | | 2,407,968 | |
| | |
Eni SpA | | | 312,531 | | | | 3,156,804 | |
| | |
Ferrari NV | | | 7,500 | | | | 1,560,667 | |
| | |
Fila SpA(2) | | | 5,500 | | | | 56,207 | |
| | |
Fincantieri SpA(1)(2) | | | 128,000 | | | | 80,070 | |
| | |
FinecoBank Banca Fineco SpA(2) | | | 16,600 | | | | 258,126 | |
| | |
Hera SpA | | | 46,677 | | | | 163,069 | |
| | |
Infrastrutture Wireless Italiane SpA(3) | | | 104,600 | | | | 1,123,320 | |
| | |
Interpump Group SpA | | | 11,400 | | | | 511,291 | |
| | | | | | | | |
| Security | | Shares | | | Value | |
|
| Italy (continued) | |
| | |
Intesa Sanpaolo SpA(2) | | | 535,073 | | | $ | 1,166,516 | |
| | |
Iren SPA | | | 42,400 | | | | 104,499 | |
| | |
Italgas SpA | | | 24,300 | | | | 145,743 | |
| | |
Leonardo SpA | | | 39,700 | | | | 275,067 | |
| | |
Mediaset SpA(1)(2) | | | 390,900 | | | | 1,011,381 | |
| | |
Mediobanca Banca di Credito Finanziario SpA(2) | | | 33,377 | | | | 297,031 | |
| | |
Nexi SpA(2)(3) | | | 11,200 | | | | 198,701 | |
| | |
Poste Italiane SpA(3) | | | 16,700 | | | | 163,190 | |
| | |
Prada SpA(2) | | | 62,700 | | | | 385,283 | |
| | |
Prysmian SpA | | | 24,700 | | | | 795,687 | |
| | |
Recordati Industria Chimica e Farmaceutica SpA | | | 22,594 | | | | 1,169,222 | |
| | |
Reply SpA | | | 4,480 | | | | 548,021 | |
| | |
Retelit SpA(1) | | | 222,200 | | | | 614,257 | |
| | |
Salvatore Ferragamo SpA(2) | | | 11,072 | | | | 215,357 | |
| | |
Saras SpA(1)(2) | | | 254,500 | | | | 166,994 | |
| | |
STMicroelectronics NV | | | 85,300 | | | | 3,419,542 | |
| | |
Technogym SpA(2)(3) | | | 16,800 | | | | 171,606 | |
| | |
Terna Rete Elettrica Nazionale SpA | | | 52,300 | | | | 379,287 | |
| | |
Unipol Gruppo SpA(2) | | | 33,400 | | | | 146,545 | |
| | |
UnipolSai Assicurazioni SpA | | | 64,182 | | | | 162,577 | |
| | |
Webuild SpA(1) | | | 166,800 | | | | 247,308 | |
| |
| | | | $ | 28,525,648 | |
|
| Japan — 13.6% | |
| | |
Acom Co., Ltd.(1) | | | 41,900 | | | $ | 184,189 | |
| | |
Activia Properties, Inc. | | | 50 | | | | 199,935 | |
| | |
Advance Residence Investment Corp.(1) | | | 88 | | | | 261,248 | |
| | |
AGC, Inc. | | | 4,800 | | | | 166,746 | |
| | |
Air Water, Inc. | | | 12,300 | | | | 198,857 | |
| | |
Ajinomoto Co., Inc. | | | 17,200 | | | | 406,714 | |
| | |
Alps Alpine Co., Ltd. | | | 7,800 | | | | 104,236 | |
| | |
Aozora Bank, Ltd. | | | 13,600 | | | | 250,653 | |
| | |
Asahi Group Holdings, Ltd. | | | 13,500 | | | | 545,026 | |
| | |
Asahi Intecc Co., Ltd. | | | 8,800 | | | | 288,925 | |
| | |
Asahi Kasei Corp. | | | 50,800 | | | | 564,886 | |
| | |
Bandai Namco Holdings, Inc. | | | 4,200 | | | | 358,139 | |
| | |
Bridgestone Corp. | | | 8,600 | | | | 320,414 | |
| | |
Brother Industries, Ltd. | | | 7,500 | | | | 167,239 | |
| | |
Calbee, Inc. | | | 7,600 | | | | 224,757 | |
| | |
Canon, Inc. | | | 19,500 | | | | 431,369 | |
| | |
Capcom Co., Ltd. | | | 4,900 | | | | 307,423 | |
| | |
Casio Computer Co., Ltd. | | | 7,300 | | | | 128,969 | |
| | |
Central Japan Railway Co. | | | 1,700 | | | | 243,427 | |
| | |
Chubu Electric Power Co., Inc. | | | 62,200 | | | | 761,809 | |
| | |
Chugai Pharmaceutical Co., Ltd. | | | 13,300 | | | | 695,977 | |
| | |
Chugoku Electric Power Co., Inc. (The)(1) | | | 36,100 | | | | 445,145 | |
| | | | |
| | 12 | | See Notes to Financial Statements. |
Parametric
International Equity Fund
January 31, 2021
Portfolio of Investments — continued
| | | | | | | | |
| Security | | Shares | | | Value | |
|
| Japan (continued) | |
| | |
Citizen Watch Co., Ltd. | | | 27,900 | | | $ | 84,835 | |
| | |
Coca-Cola Bottlers Japan Holdings, Inc. | | | 12,900 | | | | 195,835 | |
| | |
COSMOS Pharmaceutical NV | | | 1,000 | | | | 152,468 | |
| | |
CyberAgent, Inc. | | | 6,700 | | | | 419,450 | |
| | |
Dai Nippon Printing Co., Ltd. | | | 5,700 | | | | 98,252 | |
| | |
Daicel Corp. | | | 19,800 | | | | 150,621 | |
| | |
Daido Steel Co., Ltd. | | | 4,700 | | | | 192,328 | |
| | |
Daiichi Sankyo Co., Ltd. | | | 34,500 | | | | 1,110,590 | |
| | |
Daikin Industries, Ltd. | | | 2,500 | | | | 527,831 | |
| | |
Daito Trust Construction Co., Ltd. | | | 3,600 | | | | 375,170 | |
| | |
Daiwa House REIT Investment Corp. | | | 141 | | | | 379,828 | |
| | |
Daiwa Office Investment Corp. | | | 35 | | | | 226,909 | |
| | |
Daiwa Securities Group, Inc. | | | 73,100 | | | | 347,915 | |
| | |
DeNA Co., Ltd. | | | 17,400 | | | | 324,839 | |
| | |
Denso Corp. | | | 5,600 | | | | 311,277 | |
| | |
Dentsu Group, Inc. | | | 12,100 | | | | 385,934 | |
| | |
DIC Corp. | | | 5,600 | | | | 137,107 | |
| | |
East Japan Railway Co. | | | 4,400 | | | | 290,233 | |
| | |
ENEOS Holdings, Inc. | | | 262,200 | | | | 1,062,629 | |
| | |
Ezaki Glico Co., Ltd. | | | 3,400 | | | | 149,390 | |
| | |
FANUC Corp. | | | 1,600 | | | | 417,711 | |
| | |
Fast Retailing Co., Ltd. | | | 700 | | | | 601,665 | |
| | |
FUJIFILM Holdings Corp. | | | 7,400 | | | | 423,887 | |
| | |
Fujitsu, Ltd. | | | 2,600 | | | | 396,760 | |
| | |
GLP J-REIT | | | 270 | | | | 434,983 | |
| | |
Hakuhodo DY Holdings, Inc. | | | 21,800 | | | | 315,899 | |
| | |
Hamamatsu Photonics K.K. | | | 6,800 | | | | 394,414 | |
| | |
Hankyu Hanshin Holdings, Inc. | | | 4,400 | | | | 142,362 | |
| | |
Hikari Tsushin, Inc. | | | 600 | | | | 125,829 | |
| | |
Hirose Electric Co., Ltd. | | | 1,040 | | | | 163,289 | |
| | |
Hitachi Metals, Ltd.(1) | | | 12,900 | | | | 205,815 | |
| | |
Hitachi, Ltd. | | | 16,300 | | | | 671,483 | |
| | |
House Foods Group, Inc. | | | 4,300 | | | | 158,848 | |
| | |
Hoya Corp. | | | 7,400 | | | | 946,859 | |
| | |
Hulic Co., Ltd. | | | 29,000 | | | | 327,875 | |
| | |
Industrial & Infrastructure Fund Investment Corp. | | | 174 | | | | 313,207 | |
| | |
Inpex Corp. | | | 101,600 | | | | 588,116 | |
| | |
Invincible Investment Corp. | | | 490 | | | | 163,358 | |
| | |
Ito En, Ltd. | | | 3,200 | | | | 199,673 | |
| | |
ITOCHU Corp.(1) | | | 14,500 | | | | 415,265 | |
| | |
Iwatani Corp. | | | 8,200 | | | | 505,781 | |
| | |
Japan Exchange Group, Inc. | | | 19,100 | | | | 445,899 | |
| | |
Japan Hotel REIT Investment Corp. | | | 505 | | | | 254,381 | |
| | |
Japan Logistics Fund, Inc.(1) | | | 71 | | | | 212,378 | |
| | |
Japan Petroleum Exploration Co., Ltd. | | | 9,900 | | | | 188,261 | |
| | |
Japan Post Bank Co., Ltd. | | | 33,500 | | | | 289,674 | |
| | | | | | | | |
| Security | | Shares | | | Value | |
|
| Japan (continued) | |
| | |
Japan Post Holdings Co., Ltd. | | | 47,600 | | | $ | 378,542 | |
| | |
Japan Prime Realty Investment Corp. | | | 87 | | | | 306,947 | |
| | |
Japan Real Estate Investment Corp. | | | 83 | | | | 505,789 | |
| | |
Japan Retail Fund Investment Corp. | | | 207 | | | | 392,790 | |
| | |
Japan Tobacco, Inc. | | | 29,100 | | | | 578,051 | |
| | |
JFE Holdings, Inc.(2) | | | 34,900 | | | | 302,804 | |
| | |
JSR Corp. | | | 10,200 | | | | 311,259 | |
| | |
Kajima Corp. | | | 10,500 | | | | 140,685 | |
| | |
Kakaku.com, Inc. | | | 9,700 | | | | 280,936 | |
| | |
Kansai Electric Power Co., Inc. (The) | | | 72,800 | | | | 713,759 | |
| | |
Kansai Paint Co., Ltd. | | | 10,500 | | | | 309,068 | |
| | |
Kao Corp. | | | 11,900 | | | | 863,425 | |
| | |
KDDI Corp. | | | 44,700 | | | | 1,313,855 | |
| | |
Keikyu Corp.(1) | | | 6,200 | | | | 99,448 | |
| | |
Keio Corp. | | | 2,200 | | | | 161,007 | |
| | |
Keisei Electric Railway Co., Ltd. | | | 5,800 | | | | 196,932 | |
| | |
Kenedix Office Investment Corp.(1) | | | 30 | | | | 193,091 | |
| | |
Kewpie Corp. | | | 9,800 | | | | 225,978 | |
| | |
Keyence Corp. | | | 2,700 | | | | 1,449,579 | |
| | |
Kikkoman Corp. | | | 6,600 | | | | 465,715 | |
| | |
Kintetsu Group Holdings Co., Ltd. | | | 2,700 | | | | 113,640 | |
| | |
Kirin Holdings Co., Ltd. | | | 24,900 | | | | 535,201 | |
| | |
Konami Holdings Corp. | | | 7,700 | | | | 471,868 | |
| | |
Konica Minolta, Inc. | | | 64,200 | | | | 278,505 | |
| | |
Kubota Corp. | | | 14,300 | | | | 314,187 | |
| | |
Kuraray Co., Ltd. | | | 19,500 | | | | 208,912 | |
| | |
Kyocera Corp. | | | 6,300 | | | | 403,781 | |
| | |
Kyowa Kirin Co., Ltd. | | | 9,500 | | | | 281,590 | |
| | |
Kyushu Electric Power Co., Inc. | | | 55,000 | | | | 510,242 | |
| | |
LaSalle Logiport REIT | | | 165 | | | | 258,892 | |
| | |
Lawson, Inc. | | | 2,800 | | | | 135,990 | |
| | |
Lion Corp. | | | 11,700 | | | | 267,415 | |
| | |
Lixil Corp. | | | 7,400 | | | | 172,570 | |
| | |
Makita Corp. | | | 4,000 | | | | 190,879 | |
| | |
Marubeni Corp. | | | 31,400 | | | | 208,631 | |
| | |
Marui Group Co., Ltd. | | | 5,700 | | | | 102,150 | |
| | |
Maruichi Steel Tube, Ltd. | | | 5,100 | | | | 110,109 | |
| | |
Medipal Holdings Corp. | | | 12,500 | | | | 255,934 | |
| | |
MEIJI Holdings Co., Ltd. | | | 5,300 | | | | 361,778 | |
| | |
Mitsubishi Chemical Holdings Corp. | | | 50,700 | | | | 346,784 | |
| | |
Mitsubishi Corp. | | | 14,300 | | | | 362,249 | |
| | |
Mitsubishi Electric Corp. | | | 18,100 | | | | 276,112 | |
| | |
Mitsubishi Estate Co., Ltd. | | | 60,800 | | | | 961,855 | |
| | |
Mitsubishi Heavy Industries, Ltd. | | | 4,700 | | | | 135,000 | |
| | |
Mitsubishi Materials Corp. | | | 7,400 | | | | 157,233 | |
| | |
Mitsubishi UFJ Financial Group, Inc. | | | 324,800 | | | | 1,466,725 | |
| | | | |
| | 13 | | See Notes to Financial Statements. |
Parametric
International Equity Fund
January 31, 2021
Portfolio of Investments — continued
| | | | | | | | |
| Security | | Shares | | | Value | |
|
| Japan (continued) | |
| | |
Mitsui & Co., Ltd. | | | 18,200 | | | $ | 337,693 | |
| | |
Mitsui Chemicals, Inc. | | | 10,600 | | | | 303,740 | |
| | |
Mitsui Fudosan Logistics Park, Inc. | | | 42 | | | | 209,963 | |
| | |
Mizuho Financial Group, Inc. | | | 64,680 | | | | 852,633 | |
| | |
Mori Hills REIT Investment Corp.(1) | | | 160 | | | | 223,038 | |
| | |
MS&AD Insurance Group Holdings, Inc. | | | 16,500 | | | | 474,727 | |
| | |
Murata Manufacturing Co., Ltd. | | | 8,900 | | | | 854,827 | |
| | |
Nagoya Railroad Co., Ltd. | | | 4,300 | | | | 109,520 | |
| | |
NEC Corp. | | | 4,000 | | | | 217,635 | |
| | |
Nexon Co., Ltd. | | | 14,200 | | | | 430,876 | |
| | |
NH Foods, Ltd. | | | 4,300 | | | | 184,269 | |
| | |
Nichirei Corp. | | | 7,300 | | | | 211,518 | |
| | |
Nidec Corp. | | | 4,500 | | | | 598,852 | |
| | |
Nihon Kohden Corp. | | | 4,100 | | | | 122,172 | |
| | |
Nintendo Co., Ltd. | | | 3,100 | | | | 1,784,469 | |
| | |
Nippon Accommodations Fund, Inc. | | | 35 | | | | 192,602 | |
| | |
Nippon Building Fund, Inc. | | | 91 | | | | 549,645 | |
| | |
Nippon Express Co., Ltd. | | | 2,500 | | | | 169,854 | |
| | |
Nippon Kayaku Co., Ltd. | | | 17,700 | | | | 167,081 | |
| | |
Nippon Paint Holdings Co., Ltd.(1) | | | 7,100 | | | | 638,466 | |
| | |
Nippon Paper Industries Co., Ltd. | | | 10,000 | | | | 122,101 | |
| | |
Nippon Prologis REIT, Inc. | | | 135 | | | | 440,084 | |
| | |
Nippon Sanso Holdings Corp. | | | 12,000 | | | | 231,325 | |
| | |
Nippon Shinyaku Co., Ltd. | | | 2,200 | | | | 161,961 | |
| | |
Nippon Shokubai Co., Ltd. | | | 3,500 | | | | 196,029 | |
| | |
Nippon Steel Corp.(2) | | | 36,900 | | | | 426,254 | |
| | |
Nippon Telegraph & Telephone Corp. | | | 37,700 | | | | 942,267 | |
| | |
Nissan Chemical Corp. | | | 7,300 | | | | 415,801 | |
| | |
Nissan Motor Co., Ltd.(2) | | | 40,500 | | | | 208,806 | |
| | |
Nisshin Seifun Group, Inc. | | | 11,500 | | | | 193,568 | |
| | |
Nissin Foods Holdings Co., Ltd. | | | 3,200 | | | | 276,589 | |
| | |
Nitori Holdings Co., Ltd. | | | 900 | | | | 178,617 | |
| | |
NOF Corp. | | | 4,300 | | | | 206,634 | |
| | |
Nomura Real Estate Master Fund, Inc. | | | 295 | | | | 449,159 | |
| | |
Nomura Research Institute, Ltd. | | | 6,400 | | | | 215,580 | |
| | |
NTT Data Corp. | | | 20,600 | | | | 295,839 | |
| | |
Obayashi Corp. | | | 14,900 | | | | 124,805 | |
| | |
Obic Co., Ltd. | | | 1,700 | | | | 318,076 | |
| | |
Odakyu Electric Railway Co., Ltd.(1) | | | 5,100 | | | | 148,244 | |
| | |
Oji Holdings Corp. | | | 48,300 | | | | 292,000 | |
| | |
Olympus Corp. | | | 29,300 | | | | 529,767 | |
| | |
Ono Pharmaceutical Co., Ltd. | | | 13,500 | | | | 402,963 | |
| | |
Oracle Corp. Japan | | | 1,900 | | | | 223,854 | |
| | |
Oriental Land Co., Ltd. | | | 2,800 | | | | 438,232 | |
| | |
ORIX Corp. | | | 36,100 | | | | 579,257 | |
| | |
Orix JREIT, Inc. | | | 205 | | | | 343,752 | |
| | | | | | | | |
| Security | | Shares | | | Value | |
|
| Japan (continued) | |
| | |
Otsuka Corp. | | | 4,400 | | | $ | 221,544 | |
| | |
Otsuka Holdings Co., Ltd. | | | 13,300 | | | | 567,929 | |
| | |
Pan Pacific International Holdings Corp. | | | 5,900 | | | | 132,489 | |
| | |
Panasonic Corp. | | | 30,900 | | | | 401,151 | |
| | |
Rakuten, Inc.(2) | | | 18,600 | | | | 183,074 | |
| | |
Recruit Holdings Co., Ltd. | | | 13,400 | | | | 582,865 | |
| | |
Resona Holdings, Inc. | | | 91,700 | | | | 318,325 | |
| | |
Ricoh Co., Ltd. | | | 25,600 | | | | 194,098 | |
| | |
Rinnai Corp. | | | 1,700 | | | | 177,562 | |
| | |
ROHM Co., Ltd. | | | 1,900 | | | | 192,779 | |
| | |
Ryohin Keikaku Co., Ltd. | | | 9,000 | | | | 215,197 | |
| | |
Santen Pharmaceutical Co., Ltd. | | | 16,700 | | | | 276,198 | |
| | |
Sawai Pharmaceutical Co., Ltd. | | | 3,400 | | | | 155,424 | |
| | |
SECOM Co., Ltd. | | | 1,700 | | | | 154,035 | |
| | |
Seiko Epson Corp. | | | 11,300 | | | | 192,494 | |
| | |
Sekisui Chemical Co., Ltd. | | | 12,600 | | | | 227,256 | |
| | |
Sekisui House Reit, Inc. | | | 380 | | | | 275,019 | |
| | |
Sekisui House, Ltd.(1) | | | 11,000 | | | | 212,525 | |
| | |
Seven & i Holdings Co., Ltd. | | | 20,700 | | | | 790,492 | |
| | |
Seven Bank, Ltd. | | | 101,900 | | | | 224,492 | |
| | |
SG Holdings Co., Ltd. | | | 11,400 | | | | 292,212 | |
| | |
Shikoku Electric Power Co., Inc. | | | 45,400 | | | | 309,174 | |
| | |
Shimadzu Corp. | | | 7,900 | | | | 302,026 | |
| | |
Shimano, Inc. | | | 900 | | | | 211,026 | |
| | |
Shimizu Corp. | | | 15,300 | | | | 107,777 | |
| | |
Shin-Etsu Chemical Co., Ltd. | | | 12,300 | | | | 2,141,167 | |
| | |
Shionogi & Co., Ltd. | | | 7,000 | | | | 380,030 | |
| | |
Shizuoka Bank, Ltd. (The) | | | 29,100 | | | | 211,541 | |
| | |
SMC Corp. | | | 700 | | | | 423,614 | |
| | |
Softbank Corp.(1) | | | 51,900 | | | | 681,782 | |
| | |
Sompo Holdings, Inc. | | | 12,800 | | | | 511,134 | |
| | |
Sony Corp. | | | 13,400 | | | | 1,282,549 | |
| | |
Square Enix Holdings Co., Ltd. | | | 7,100 | | | | 408,276 | |
| | |
Stanley Electric Co., Ltd. | | | 6,700 | | | | 209,593 | |
| | |
Subaru Corp. | | | 11,400 | | | | 218,997 | |
| | |
Sumitomo Chemical Co., Ltd. | | | 76,900 | | | | 361,999 | |
| | |
Sumitomo Corp. | | | 15,000 | | | | 199,118 | |
| | |
Sumitomo Dainippon Pharma Co., Ltd. | | | 14,700 | | | | 238,965 | |
| | |
Sumitomo Mitsui Financial Group, Inc. | | | 34,300 | | | | 1,065,643 | |
| | |
Sumitomo Mitsui Trust Holdings, Inc. | | | 13,900 | | | | 415,857 | |
| | |
Sumitomo Osaka Cement Co., Ltd. | | | 4,000 | | | | 120,999 | |
| | |
Sumitomo Realty & Development Co., Ltd. | | | 21,300 | | | | 642,958 | |
| | |
Suntory Beverage & Food, Ltd. | | | 6,700 | | | | 234,046 | |
| | |
Suzuken Co., Ltd. | | | 5,100 | | | | 197,517 | |
| | |
Suzuki Motor Corp. | | | 7,800 | | | | 351,999 | |
| | |
Sysmex Corp. | | | 4,900 | | | | 571,645 | |
| | | | |
| | 14 | | See Notes to Financial Statements. |
Parametric
International Equity Fund
January 31, 2021
Portfolio of Investments — continued
| | | | | | | | |
| Security | | Shares | | | Value | |
|
| Japan (continued) | |
| | |
Taiheiyo Cement Corp. | | | 8,600 | | | $ | 214,114 | |
| | |
Taisei Corp. | | | 4,500 | | | | 145,787 | |
| | |
Takashimaya Co., Ltd.(1) | | | 12,400 | | | | 117,738 | |
| | |
Takeda Pharmaceutical Co., Ltd. | | | 31,700 | | | | 1,114,877 | |
| | |
TEIJIN, Ltd. | | | 12,200 | | | | 223,193 | |
| | |
Terumo Corp. | | | 16,400 | | | | 637,397 | |
| | |
TIS, Inc. | | | 8,700 | | | | 193,459 | |
| | |
Tobu Railway Co., Ltd. | | | 3,900 | | | | 110,052 | |
| | |
Toho Co., Ltd. | | | 9,300 | | | | 360,235 | |
| | |
Toho Gas Co., Ltd.(1) | | | 10,100 | | | | 593,739 | |
| | |
Tokio Marine Holdings, Inc. | | | 19,000 | | | | 933,296 | |
| | |
Tokyo Electric Power Co. Holdings, Inc.(2) | | | 148,900 | | | | 571,167 | |
| | |
Tokyo Electron, Ltd. | | | 2,500 | | | | 950,632 | |
| | |
Tokyo Gas Co., Ltd. | | | 33,700 | | | | 738,458 | |
| | |
Tokyu Corp. | | | 9,800 | | | | 115,230 | |
| | |
Toppan Printing Co., Ltd. | | | 7,900 | | | | 112,354 | |
| | |
Toray Industries, Inc. | | | 58,000 | | | | 378,434 | |
| | |
Toshiba Corp. | | | 6,400 | | | | 208,999 | |
| | |
TOTO, Ltd. | | | 3,200 | | | | 177,235 | |
| | |
Toyo Seikan Group Holdings, Ltd. | | | 10,900 | | | | 116,813 | |
| | |
Toyo Suisan Kaisha, Ltd. | | | 4,500 | | | | 221,464 | |
| | |
Toyota Industries Corp. | | | 2,500 | | | | 196,927 | |
| | |
Toyota Motor Corp. | | | 26,700 | | | | 1,872,627 | |
| | |
Toyota Tsusho Corp. | | | 4,900 | | | | 191,392 | |
| | |
Trend Micro, Inc.(2) | | | 3,900 | | | | 214,636 | |
| | |
Tsuruha Holdings, Inc. | | | 1,300 | | | | 172,628 | |
| | |
Unicharm Corp. | | | 11,300 | | | | 506,799 | |
| | |
United Urban Investment Corp. | | | 268 | | | | 364,619 | |
| | |
USS Co., Ltd. | | | 8,100 | | | | 159,502 | |
| | |
Welcia Holdings Co., Ltd.(1) | | | 5,200 | | | | 176,168 | |
| | |
West Japan Railway Co. | | | 2,500 | | | | 133,277 | |
| | |
Yakult Honsha Co., Ltd. | | | 6,500 | | | | 332,000 | |
| | |
Yamaguchi Financial Group, Inc. | | | 32,200 | | | | 183,107 | |
| | |
Yamaha Corp. | | | 3,200 | | | | 180,340 | |
| | |
Yamato Holdings Co., Ltd. | | | 6,600 | | | | 163,751 | |
| | |
Yamazaki Baking Co., Ltd.(1) | | | 8,800 | | | | 162,018 | |
| | |
Yokogawa Electric Corp. | | | 10,000 | | | | 216,184 | |
| | |
Z Holdings Corp. | | | 120,000 | | | | 745,479 | |
| | |
ZOZO, Inc. | | | 8,300 | | | | 232,425 | |
| |
| | | | $ | 90,781,376 | |
|
| Netherlands — 4.5% | |
| | |
ABN AMRO Bank NV(2)(3) | | | 19,600 | | | $ | 204,703 | |
| | |
Accell Group(2) | | | 2,450 | | | | 86,782 | |
| | |
Akzo Nobel NV | | | 17,396 | | | | 1,770,903 | |
| | |
Arcadis NV(2) | | | 8,400 | | | | 294,507 | |
| | | | | | | | |
| Security | | Shares | | | Value | |
|
| Netherlands (continued) | |
| | |
ASML Holding NV | | | 9,428 | | | $ | 5,033,173 | |
| | |
ASR Nederland NV | | | 5,300 | | | | 205,450 | |
| | |
Basic-Fit NV(1)(2)(3) | | | 2,000 | | | | 68,498 | |
| | |
Boskalis Westminster(2) | | | 4,300 | | | | 120,804 | |
| | |
Corbion NV | | | 20,000 | | | | 1,167,990 | |
| | |
Eurocommercial Properties NV(2) | | | 8,200 | | | | 158,234 | |
| | |
Euronext NV(3) | | | 2,900 | | | | 312,321 | |
| | |
Flow Traders(3) | | | 4,600 | | | | 176,254 | |
| | |
GrandVision NV(2)(3) | | | 6,200 | | | | 184,149 | |
| | |
IMCD NV | | | 4,176 | | | | 518,259 | |
| | |
ING Groep NV(2) | | | 212,100 | | | | 1,885,857 | |
| | |
Intertrust NV(2)(3) | | | 5,200 | | | | 79,949 | |
| | |
JDE Peet’s NV(2) | | | 36,560 | | | | 1,409,722 | |
| | |
Just Eat Takeaway.com NV(1)(2)(3) | | | 2,700 | | | | 309,652 | |
| | |
Koninklijke BAM Groep NV(2) | | | 66,800 | | | | 131,670 | |
| | |
Koninklijke DSM NV | | | 5,408 | | | | 945,390 | |
| | |
Koninklijke KPN NV | | | 746,650 | | | | 2,332,534 | |
| | |
Koninklijke Philips NV(2) | | | 63,457 | | | | 3,458,986 | |
| | |
Koninklijke Vopak NV | | | 13,000 | | | | 657,965 | |
| | |
NN Group NV | | | 18,350 | | | | 764,305 | |
| | |
NSI NV | | | 5,968 | | | | 246,060 | |
| | |
Pharming Group NV(1)(2) | | | 316,678 | | | | 449,541 | |
| | |
PostNL NV(2) | | | 71,792 | | | | 295,965 | |
| | |
Prosus NV | | | 28,673 | | | | 3,349,890 | |
| | |
Randstad NV(2) | | | 8,944 | | | | 558,801 | |
| | |
SBM Offshore NV | | | 42,517 | | | | 729,799 | |
| | |
Signify NV(2)(3) | | | 11,700 | | | | 558,278 | |
| | |
Stellantis NV | | | 27,700 | | | | 421,200 | |
| | |
Vastned Retail NV | | | 7,610 | | | | 215,623 | |
| | |
Wolters Kluwer NV | | | 15,920 | | | | 1,322,796 | |
| |
| | | | $ | 30,426,010 | |
|
| New Zealand — 1.1% | |
| | |
a2 Milk Co., Ltd. (The)(1)(2) | | | 64,294 | | | $ | 530,231 | |
| | |
Argosy Property, Ltd. | | | 99,700 | | | | 110,132 | |
| | |
Auckland International Airport, Ltd.(2) | | | 145,752 | | | | 775,387 | |
| | |
Contact Energy, Ltd. | | | 53,366 | | | | 311,453 | |
| | |
Fisher & Paykel Healthcare Corp., Ltd. | | | 29,761 | | | | 737,587 | |
| | |
Fletcher Building, Ltd.(2) | | | 202,321 | | | | 899,295 | |
| | |
Genesis Energy, Ltd. | | | 38,800 | | | | 108,828 | |
| | |
Goodman Property Trust | | | 179,900 | | | | 290,604 | |
| | |
Mercury NZ, Ltd. | | | 54,400 | | | | 277,429 | |
| | |
Meridian Energy, Ltd. | | | 54,600 | | | | 278,697 | |
| | |
Precinct Properties New Zealand, Ltd. | | | 189,100 | | | | 233,430 | |
| | |
Pushpay Holdings, Ltd.(2) | | | 115,268 | | | | 135,796 | |
| | |
Restaurant Brands New Zealand, Ltd.(2) | | | 19,660 | | | | 165,566 | |
| | | | |
| | 15 | | See Notes to Financial Statements. |
Parametric
International Equity Fund
January 31, 2021
Portfolio of Investments — continued
| | | | | | | | |
| Security | | Shares | | | Value | |
|
| New Zealand (continued) | |
| | |
SKYCITY Entertainment Group, Ltd. | | | 231,739 | | | $ | 504,909 | |
| | |
Spark New Zealand, Ltd. | | | 222,031 | | | | 762,310 | |
| | |
Xero, Ltd.(2) | | | 6,814 | | | | 672,192 | |
| | |
Z Energy, Ltd.(2) | | | 168,235 | | | | 355,230 | |
| |
| | | | $ | 7,149,076 | |
|
| Norway — 2.3% | |
| | |
Adevinta ASA, Class B(2) | | | 38,998 | | | $ | 578,629 | |
| | |
Atea ASA | | | 48,489 | | | | 737,770 | |
| | |
Borregaard ASA | | | 27,054 | | | | 495,142 | |
| | |
BW Energy, Ltd.(2) | | | 4,101 | | | | 11,441 | |
| | |
DHT Holdings, Inc. | | | 13,700 | | | | 73,569 | |
| | |
DNB ASA(2) | | | 54,951 | | | | 1,069,811 | |
| | |
Entra ASA(1)(3) | | | 58,483 | | | | 1,301,555 | |
| | |
Equinor ASA | | | 60,110 | | | | 1,077,242 | |
| | |
Europris ASA(3) | | | 82,000 | | | | 454,055 | |
| | |
Fjordkraft Holding ASA(3) | | | 18,200 | | | | 154,583 | |
| | |
Frontline, Ltd. | | | 20,000 | | | | 115,563 | |
| | |
Gjensidige Forsikring ASA(1) | | | 16,200 | | | | 372,535 | |
| | |
Golar LNG, Ltd.(1)(2) | | | 17,900 | | | | 193,857 | |
| | |
Kongsberg Gruppen ASA | | | 25,020 | | | | 483,973 | |
| | |
Mowi ASA | | | 40,150 | | | | 889,362 | |
| | |
Nordic American Tankers, Ltd. | | | 20,400 | | | | 60,384 | |
| | |
Nordic Nanovector ASA(1)(2) | | | 42,000 | | | | 66,715 | |
| | |
Norwegian Finans Holding ASA(2) | | | 18,080 | | | | 152,639 | |
| | |
Opera, Ltd. ADR(2) | | | 61,800 | | | | 532,098 | |
| | |
Orkla ASA | | | 75,100 | | | | 730,023 | |
| | |
Sbanken ASA(2)(3) | | | 7,500 | | | | 59,001 | |
| | |
Scatec ASA(3) | | | 40,263 | | | | 1,523,518 | |
| | |
SFL Corp, Ltd. | | | 7,300 | | | | 46,136 | |
| | |
SpareBank 1 SMN | | | 14,400 | | | | 167,629 | |
| | |
SpareBank 1 SR-Bank ASA(2) | | | 13,600 | | | | 149,174 | |
| | |
Telenor ASA | | | 56,200 | | | | 927,097 | |
| | |
Tomra Systems ASA | | | 22,377 | | | | 1,024,117 | |
| | |
Veidekke ASA | | | 20,997 | | | | 252,484 | |
| | |
Yara International ASA | | | 33,282 | | | | 1,547,621 | |
| |
| | | | $ | 15,247,723 | |
|
| Portugal — 1.1% | |
| | |
Banco Comercial Portugues S.A.(1)(2) | | | 7,064,053 | | | $ | 978,603 | |
| | |
Corticeira Amorim SGPS S.A. | | | 23,600 | | | | 318,901 | |
| | |
CTT - Correios de Portugal S.A.(2) | | | 155,356 | | | | 449,889 | |
| | |
EDP - Energias de Portugal S.A. | | | 211,095 | | | | 1,324,237 | |
| | |
Galp Energia SGPS S.A., Class B | | | 123,229 | | | | 1,236,865 | |
| | |
Jeronimo Martins SGPS S.A. | | | 65,721 | | | | 1,074,740 | |
| | | | | | | | |
| Security | | Shares | | | Value | |
|
| Portugal (continued) | |
| | |
Navigator Co. S.A. (The) | | | 260,814 | | | $ | 782,759 | |
| | |
NOS SGPS S.A. | | | 227,848 | | | | 785,713 | |
| | |
REN - Redes Energeticas Nacionais SGPS S.A. | | | 29,300 | | | | 83,384 | |
| | |
Semapa-Sociedade de Investimento e Gestao | | | 24,067 | | | | 255,602 | |
| | |
Sonae SGPS S.A. | | | 105,586 | | | | 84,645 | |
| |
| | | | $ | 7,375,338 | |
|
| Singapore — 2.3% | |
| | |
AEM Holdings, Ltd. | | | 49,600 | | | $ | 148,255 | |
| | |
Ascendas Real Estate Investment Trust | | | 109,000 | | | | 251,499 | |
| | |
Ascott Residence Trust | | | 185,500 | | | | 145,814 | |
| | |
BOC Aviation, Ltd.(3) | | | 21,900 | | | | 178,349 | |
| | |
BW LPG, Ltd.(3) | | | 9,091 | | | | 59,378 | |
| | |
CapitaLand Integrated Commercial Trust | | | 215,740 | | | | 344,677 | |
| | |
CDL Hospitality Trusts | | | 80,000 | | | | 73,823 | |
| | |
China Aviation Oil Singapore Corp, Ltd. | | | 96,100 | | | | 81,574 | |
| | |
ComfortDelGro Corp., Ltd. | | | 201,100 | | | | 238,622 | |
| | |
Ezion Holdings, Ltd.(2)(4) | | | 1,126,000 | | | | 0 | |
| | |
Flex, Ltd.(2) | | | 81,400 | | | | 1,435,896 | |
| | |
Frasers Centrepoint Trust | | | 56,900 | | | | 110,622 | |
| | |
Frasers Logistics & Commercial Trust | | | 110,000 | | | | 118,903 | |
| | |
Genting Singapore, Ltd. | | | 1,170,700 | | | | 751,338 | |
| | |
Hi-P International, Ltd. | | | 84,400 | | | | 126,021 | |
| | |
Hutchison Port Holdings Trust | | | 446,200 | | | | 91,121 | |
| | |
Jardine Cycle & Carriage, Ltd. | | | 22,400 | | | | 362,205 | |
| | |
Keppel DC REIT | | | 92,156 | | | | 205,940 | |
| | |
Keppel Infrastructure Trust | | | 801,185 | | | | 334,092 | |
| | |
Keppel REIT(1) | | | 110,000 | | | | 100,525 | |
| | |
Manulife US Real Estate Investment Trust | | | 113,000 | | | | 82,712 | |
| | |
Mapletree Commercial Trust | | | 83,109 | | | | 128,580 | |
| | |
Mapletree Industrial Trust | | | 68,200 | | | | 146,853 | |
| | |
Mapletree Logistics Trust | | | 154,800 | | | | 229,590 | |
| | |
Mapletree North Asia Commercial Trust | | | 106,100 | | | | 77,763 | |
| | |
Medtecs International Corp, Ltd. | | | 233,700 | | | | 182,573 | |
| | |
Midas Holdings, Ltd.(2)(4) | | | 480,000 | | | | 0 | |
| | |
Oversea-Chinese Banking Corp., Ltd. | | | 118,100 | | | | 915,305 | |
| | |
Parkway Life Real Estate Investment Trust | | | 33,400 | | | | 104,189 | |
| | |
Raffles Medical Group, Ltd. | | | 220,700 | | | | 154,822 | |
| | |
SATS, Ltd.(1)(2) | | | 70,100 | | | | 202,357 | |
| | |
Sembcorp Industries, Ltd. | | | 141,300 | | | | 174,583 | |
| | |
Sheng Siong Group, Ltd. | | | 269,200 | | | | 327,378 | |
| | |
SIA Engineering Co., Ltd. | | | 86,000 | | | | 122,185 | |
| | |
Singapore Airlines, Ltd.(2) | | | 162,600 | | | | 501,556 | |
| | |
Singapore Exchange, Ltd. | | | 57,600 | | | | 427,912 | |
| | |
Singapore Post, Ltd. | | | 211,600 | | | | 109,582 | |
| | |
Singapore Press Holdings, Ltd.(1) | | | 563,700 | | | | 498,762 | |
| | | | |
| | 16 | | See Notes to Financial Statements. |
Parametric
International Equity Fund
January 31, 2021
Portfolio of Investments — continued
| | | | | | | | |
| Security | | Shares | | | Value | |
|
| Singapore (continued) | |
| | |
Singapore Technologies Engineering, Ltd. | | | 186,800 | | | $ | 520,815 | |
| | |
Singapore Telecommunications, Ltd.(5) | | | 84,700 | | | | 150,871 | |
| | |
Singapore Telecommunications, Ltd.(5) | | | 638,600 | | | | 1,131,309 | |
| | |
StarHub, Ltd. | | | 360,700 | | | | 346,746 | |
| | |
Suntec Real Estate Investment Trust | | | 89,800 | | | | 107,593 | |
| | |
United Overseas Bank, Ltd. | | | 48,900 | | | | 859,164 | |
| | |
Venture Corp., Ltd. | | | 38,100 | | | | 566,242 | |
| | |
Wilmar International, Ltd. | | | 579,300 | | | | 2,292,836 | |
| |
| | | | $ | 15,520,932 | |
|
| Spain — 4.3% | |
| | |
Acerinox S.A. | | | 74,810 | | | $ | 830,648 | |
| | |
Aena SME S.A.(2)(3) | | | 5,371 | | | | 828,298 | |
| | |
Almirall S.A.(1) | | | 48,572 | | | | 665,020 | |
| | |
Amadeus IT Group S.A. | | | 42,650 | | | | 2,722,913 | |
| | |
Applus Services S.A.(2) | | | 29,000 | | | | 290,051 | |
| | |
Banco Bilbao Vizcaya Argentaria S.A. | | | 206,830 | | | | 943,706 | |
| | |
Banco Santander S.A.(2) | | | 545,973 | | | | 1,593,642 | |
| | |
Bankia S.A. | | | 81,600 | | | | 139,861 | |
| | |
Bankinter S.A. | | | 18,384 | | | | 103,188 | |
| | |
CaixaBank S.A. | | | 101,600 | | | | 256,387 | |
| | |
Cellnex Telecom S.A.(3) | | | 28,184 | | | | 1,651,125 | |
| | |
Cia de Distribucion Integral Logista Holdings S.A. | | | 14,897 | | | | 280,249 | |
| | |
Construcciones y Auxiliar de Ferrocarriles S.A. | | | 4,950 | | | | 222,109 | |
| | |
Deoleo S.A.(2) | | | 879,200 | | | | 265,453 | |
| | |
Ebro Foods S.A.(1) | | | 29,300 | | | | 638,860 | |
| | |
Endesa S.A. | | | 14,100 | | | | 360,357 | |
| | |
Faes Farma S.A. | | | 89,053 | | | | 396,967 | |
| | |
Ferrovial S.A. | | | 37,362 | | | | 895,698 | |
| | |
Fluidra S.A.(1) | | | 4,323 | | | | 103,988 | |
| | |
Global Dominion Access S.A.(3) | | | 31,250 | | | | 143,613 | |
| | |
Grifols S.A.(1) | | | 62,700 | | | | 1,845,740 | |
| | |
Grupo Catalana Occidente S.A. | | | 2,596 | | | | 88,199 | |
| | |
Iberdrola S.A. | | | 2,451 | | | | 33,274 | |
| | |
Iberdrola S.A. | | | 171,598 | | | | 2,323,297 | |
| | |
Industria de Diseno Textil S.A. | | | 94,975 | | | | 2,816,786 | |
| | |
Laboratorios Farmaceuticos Rovi S.A. | | | 6,200 | | | | 305,229 | |
| | |
Mapfre S.A. | | | 82,487 | | | | 151,382 | |
| | |
Merlin Properties Socimi S.A. | | | 187,800 | | | | 1,798,669 | |
| | |
Neinor Homes S.A.(2)(3) | | | 10,000 | | | | 134,677 | |
| | |
Prosegur Cash S.A.(1)(3) | | | 47,137 | | | | 41,333 | |
| | |
Red Electrica Corp. S.A. | | | 17,578 | | | | 333,769 | |
| | |
Repsol S.A. | | | 334,067 | | | | 3,281,768 | |
| | |
Tecnicas Reunidas S.A.(2) | | | 7,006 | | | | 92,007 | |
| | |
Telefonica S.A. | | | 384,515 | | | | 1,659,140 | |
| | |
Telepizza Group S.A.(2)(3)(4) | | | 3,701 | | | | 0 | |
| | | | | | | | |
| Security | | Shares | | | Value | |
|
| Spain (continued) | |
| | |
Tubacex S.A.(2) | | | 34,340 | | | $ | 55,059 | |
| | |
Zardoya Otis S.A. | | | 30,400 | | | | 200,053 | |
| |
| | | | $ | 28,492,515 | |
|
| Sweden — 4.5% | |
| | |
AAK AB | | | 16,363 | | | $ | 319,827 | |
| | |
Alfa Laval AB(2) | | | 6,950 | | | | 182,137 | |
| | |
Arjo AB, Class B | | | 55,760 | | | | 414,152 | |
| | |
Assa Abloy AB, Class B | | | 16,810 | | | | 415,741 | |
| | |
Atrium Ljungberg AB, Class B | | | 7,700 | | | | 148,120 | |
| | |
Attendo AB(2)(3) | | | 51,800 | | | | 289,872 | |
| | |
Avanza Bank Holding AB | | | 31,760 | | | | 865,420 | |
| | |
Axfood AB | | | 24,587 | | | | 590,892 | |
| | |
Betsson AB | | | 23,476 | | | | 220,618 | |
| | |
Bilia AB, Class A(2) | | | 16,300 | | | | 202,114 | |
| | |
BillerudKorsnas AB | | | 27,011 | | | | 482,692 | |
| | |
BioGaia AB, Class B | | | 4,249 | | | | 235,982 | |
| | |
Bonava AB, Class B(2) | | | 18,268 | | | | 193,054 | |
| | |
Castellum AB | | | 30,000 | | | | 719,741 | |
| | |
Catena AB | | | 2,100 | | | | 97,794 | |
| | |
Dios Fastigheter AB | | | 19,400 | | | | 166,020 | |
| | |
Dustin Group AB(3) | | | 25,800 | | | | 244,580 | |
| | |
Elekta AB, Class B | | | 58,578 | | | | 841,680 | |
| | |
Embracer Group AB(2) | | | 20,945 | | | | 472,136 | |
| | |
Epiroc AB, Class A | | | 16,126 | | | | 308,956 | |
| | |
Epiroc AB, Class B | | | 11,200 | | | | 192,240 | |
| | |
Essity AB, Class B | | | 46,385 | | | | 1,481,575 | |
| | |
Evolution Gaming Group AB(3) | | | 7,183 | | | | 698,999 | |
| | |
Fabege AB | | | 29,200 | | | | 435,126 | |
| | |
Fingerprint Cards AB, Class B(1)(2) | | | 205,863 | | | | 479,042 | |
| | |
Granges AB(2) | | | 33,564 | | | | 385,349 | |
| | |
Hennes & Mauritz AB, Class B(2) | | | 52,488 | | | | 1,122,160 | |
| | |
Hexpol AB | | | 58,200 | | | | 636,065 | |
| | |
Holmen AB, Class B | | | 16,216 | | | | 742,359 | |
| | |
Husqvarna AB, Class B | | | 34,170 | | | | 422,771 | |
| | |
ICA Gruppen AB | | | 14,700 | | | | 736,830 | |
| | |
Indutrade AB(2) | | | 9,447 | | | | 193,611 | |
| | |
Investor AB, Class B | | | 9,400 | | | | 689,484 | |
| | |
JM AB | | | 7,000 | | | | 244,317 | |
| | |
Karo Pharma AB(2) | | | 29,600 | | | | 169,740 | |
| | |
Lifco AB, Class B | | | 2,000 | | | | 183,598 | |
| | |
Lundin Energy AB | | | 29,152 | | | | 791,857 | |
| | |
Medicover AB(2) | | | 6,400 | | | | 120,812 | |
| | |
Modern Times Group MTG AB, Class B(1)(2) | | | 32,300 | | | | 489,515 | |
| | |
Mycronic AB(1) | | | 26,942 | | | | 755,229 | |
| | |
NCC AB, Class B | | | 6,000 | | | | 100,487 | |
| | | | |
| | 17 | | See Notes to Financial Statements. |
Parametric
International Equity Fund
January 31, 2021
Portfolio of Investments — continued
| | | | | | | | |
| Security | | Shares | | | Value | |
|
| Sweden (continued) | |
| | |
Nibe Industrier AB, Class B | | | 12,473 | | | $ | 416,341 | |
| | |
Nordic Entertainment Group AB, Class B(2) | | | 12,020 | | | | 627,462 | |
| | |
Nyfosa AB(2) | | | 21,257 | | | | 205,392 | |
| | |
Pandox AB(2) | | | 9,800 | | | | 147,154 | |
| | |
Paradox Interactive AB | | | 8,600 | | | | 239,330 | |
| | |
RaySearch Laboratories AB(1)(2) | | | 11,321 | | | | 117,335 | |
| | |
Saab AB, Class B(2) | | | 4,437 | | | | 124,190 | |
| | |
Samhallsbyggnadsbolaget i Norden AB(1) | | | 161,789 | | | | 529,853 | |
| | |
Scandic Hotels Group AB(2)(3) | | | 11,600 | | | | 43,152 | |
| | |
Sectra AB(1) | | | 2,600 | | | | 221,323 | |
| | |
Securitas AB, Class B | | | 12,200 | | | | 187,985 | |
| | |
Skandinaviska Enskilda Banken AB, Class A(2) | | | 91,100 | | | | 991,121 | |
| | |
Skanska AB, Class B | | | 9,000 | | | | 232,560 | |
| | |
Stillfront Group AB(2) | | | 9,000 | | | | 95,479 | |
| | |
Svenska Cellulosa AB SCA, Class B(2) | | | 71,064 | | | | 1,251,782 | |
| | |
Svenska Handelsbanken AB, Class A(2) | | | 82,000 | | | | 817,457 | |
| | |
Swedish Orphan Biovitrum AB(2) | | | 22,039 | | | | 416,126 | |
| | |
Tele2 AB, Class B | | | 46,720 | | | | 644,775 | |
| | |
Telefonaktiebolaget LM Ericsson, Class B | | | 140,700 | | | | 1,771,616 | |
| | |
Telia Co. AB | | | 130,400 | | | | 571,450 | |
| | |
Tethys Oil AB | | | 12,500 | | | | 77,759 | |
| | |
Tobii AB(2) | | | 23,500 | | | | 150,315 | |
| | |
Trelleborg AB, Class B(2) | | | 13,600 | | | | 307,595 | |
| | |
Vitrolife AB(2) | | | 11,800 | | | | 311,866 | |
| | |
Volvo AB, Class B(2) | | | 22,095 | | | | 544,391 | |
| | |
Wallenstam AB, Class B | | | 24,800 | | | | 377,587 | |
| | |
Wihlborgs Fastigheter AB | | | 18,900 | | | | 388,131 | |
| |
| | | | $ | 30,292,221 | |
|
| Switzerland — 9.0% | |
| | |
Adecco Group AG | | | 12,870 | | | $ | 803,929 | |
| | |
Allreal Holding AG | | | 2,088 | | | | 454,850 | |
| | |
ALSO Holding AG | | | 2,411 | | | | 647,180 | |
| | |
Baloise Holding AG | | | 3,668 | | | | 614,249 | |
| | |
Banque Cantonale Vaudoise | | | 4,280 | | | | 452,876 | |
| | |
Belimo Holding AG | | | 59 | | | | 454,675 | |
| | |
BKW AG | | | 2,892 | | | | 330,343 | |
| | |
Cembra Money Bank AG | | | 3,380 | | | | 367,227 | |
| | |
Cie Financiere Richemont S.A. | | | 67,396 | | | | 6,260,012 | |
| | |
Clariant AG | | | 14,579 | | | | 309,745 | |
| | |
Comet Holding AG | | | 3,411 | | | | 779,161 | |
| | |
DKSH Holding AG | | | 6,642 | | | | 534,187 | |
| | |
dormakaba Holding AG | | | 591 | | | | 354,209 | |
| | |
Dufry AG(1)(2) | | | 7,593 | | | | 408,243 | |
| | |
Ems-Chemie Holding AG | | | 1,460 | | | | 1,377,071 | |
| | |
Flughafen Zurich AG(2) | | | 2,182 | | | | 359,535 | |
| | | | | | | | |
| Security | | Shares | | | Value | |
|
| Switzerland (continued) | |
| | |
Forbo Holding AG | | | 376 | | | $ | 640,198 | |
| | |
Galenica AG(3) | | | 5,783 | | | | 381,996 | |
| | |
Geberit AG | | | 2,318 | | | | 1,418,771 | |
| | |
Givaudan S.A. | | | 710 | | | | 2,860,428 | |
| | |
Gurit Holding AG | | | 178 | | | | 523,110 | |
| | |
Helvetia Holding AG | | | 4,114 | | | | 412,085 | |
| | |
Huber+Suhner AG | | | 3,060 | | | | 252,052 | |
| | |
Inficon Holding AG | | | 575 | | | | 623,508 | |
| | |
Intershop Holding AG | | | 234 | | | | 157,462 | |
| | |
Kuehne & Nagel International AG | | | 3,878 | | | | 882,462 | |
| | |
Landis+Gyr Group AG(2) | | | 3,118 | | | | 229,711 | |
| | |
LEM Holding S.A. | | | 200 | | | | 409,042 | |
| | |
Logitech International S.A. | | | 24,583 | | | | 2,553,153 | |
| | |
Nestle S.A. | | | 71,495 | | | | 8,014,345 | |
| | |
Novartis AG | | | 36,345 | | | | 3,290,862 | |
| | |
Partners Group Holding AG | | | 914 | | | | 1,079,243 | |
| | |
PSP Swiss Property AG | | | 7,028 | | | | 899,153 | |
| | |
Roche Holding AG PC | | | 10,316 | | | | 3,560,173 | |
| | |
Roche Holding AG, Bearer Shares | | | 1,080 | | | | 380,512 | |
| | |
Schindler Holding AG | | | 1,944 | | | | 511,383 | |
| | |
Schindler Holding AG PC | | | 2,895 | | | | 764,061 | |
| | |
Schweiter Technologies AG | | | 220 | | | | 380,444 | |
| | |
SGS S.A., Class R | | | 348 | | | | 1,055,482 | |
| | |
SIG Combibloc Group AG | | | 14,131 | | | | 335,397 | |
| | |
Sika AG | | | 11,917 | | | | 3,242,755 | |
| | |
Softwareone Holding AG(2) | | | 14,221 | | | | 444,071 | |
| | |
Sonova Holding AG(2) | | | 2,027 | | | | 488,991 | |
| | |
Stadler Rail AG(1) | | | 7,634 | | | | 381,386 | |
| | |
Swatch Group AG (The) | | | 3,859 | | | | 1,111,590 | |
| | |
Swiss Life Holding AG | | | 1,733 | | | | 790,170 | |
| | |
Swiss Prime Site AG | | | 11,100 | | | | 1,078,829 | |
| | |
Swiss Re AG | | | 13,276 | | | | 1,170,435 | |
| | |
Swisscom AG | | | 4,086 | | | | 2,223,922 | |
| | |
Valiant Holding AG | | | 3,200 | | | | 306,114 | |
| | |
Valora Holding AG(2) | | | 1,474 | | | | 281,909 | |
| | |
Vontobel Holding AG | | | 5,350 | | | | 432,250 | |
| | |
Zurich Insurance Group AG | | | 5,566 | | | | 2,225,546 | |
| |
| | | | $ | 60,300,493 | |
|
| United Kingdom — 8.8% | |
| | |
3i Group PLC | | | 23,056 | | | $ | 349,379 | |
| | |
Admiral Group PLC | | | 5,900 | | | | 232,524 | |
| | |
Aggreko PLC | | | 23,600 | | | | 187,185 | |
| | |
Assura PLC | | | 231,800 | | | | 229,556 | |
| | |
AstraZeneca PLC | | | 33,000 | | | | 3,366,368 | |
| | |
Atlantica Sustainable Infrastructure PLC | | | 3,300 | | | | 136,455 | |
| | | | |
| | 18 | | See Notes to Financial Statements. |
Parametric
International Equity Fund
January 31, 2021
Portfolio of Investments — continued
| | | | | | | | |
| Security | | Shares | | | Value | |
|
| United Kingdom (continued) | |
| | |
Auto Trader Group PLC(3) | | | 65,800 | | | $ | 507,290 | |
| | |
Avast PLC(3) | | | 59,900 | | | | 386,219 | |
| | |
Aveva Group PLC | | | 5,400 | | | | 267,998 | |
| | |
Aviva PLC | | | 80,319 | | | | 367,386 | |
| | |
B&M European Value Retail S.A. | | | 40,600 | | | | 296,765 | |
| | |
BAE Systems PLC | | | 53,000 | | | | 334,415 | |
| | |
Barclays PLC(2) | | | 236,832 | | | | 432,028 | |
| | |
Barratt Developments PLC(2) | | | 31,795 | | | | 276,900 | |
| | |
Bellway PLC | | | 5,400 | | | | 203,099 | |
| | |
Berkeley Group Holdings PLC | | | 4,400 | | | | 251,633 | |
| | |
BHP Group PLC | | | 59,700 | | | | 1,636,098 | |
| | |
Big Yellow Group PLC | | | 13,089 | | | | 197,512 | |
| | |
BMO Commercial Property Trust | | | 89,046 | | | | 95,028 | |
| | |
BP PLC | | | 709,300 | | | | 2,635,726 | |
| | |
Britvic PLC | | | 19,000 | | | | 193,354 | |
| | |
BT Group PLC | | | 536,600 | | | | 920,093 | |
| | |
Bunzl PLC | | | 6,100 | | | | 195,808 | |
| | |
Capita PLC(2) | | | 45,100 | | | | 21,505 | |
| | |
Centamin PLC | | | 159,300 | | | | 249,312 | |
| | |
Civitas Social Housing PLC | | | 80,000 | | | | 117,922 | |
| | |
Coca-Cola European Partners PLC | | | 18,400 | | | | 855,048 | |
| | |
Compass Group PLC(2) | | | 48,700 | | | | 869,917 | |
| | |
Computacenter PLC | | | 8,800 | | | | 281,710 | |
| | |
Countryside Properties PLC(2)(3) | | | 32,015 | | | | 188,461 | |
| | |
Croda International PLC | | | 5,987 | | | | 514,395 | |
| | |
Daily Mail & General Trust PLC, Class A | | | 24,002 | | | | 252,178 | |
| | |
Derwent London PLC | | | 8,000 | | | | 346,293 | |
| | |
Diageo PLC | | | 31,400 | | | | 1,260,621 | |
| | |
Diploma PLC | | | 3,800 | | | | 120,075 | |
| | |
Direct Line Insurance Group PLC | | | 42,288 | | | | 173,565 | |
| | |
Domino’s Pizza Group PLC | | | 39,048 | | | | 175,664 | |
| | |
easyJet PLC | | | 18,400 | | | | 182,217 | |
| | |
Elementis PLC(2) | | | 58,068 | | | | 87,507 | |
| | |
Endava PLC ADR(2) | | | 3,200 | | | | 252,992 | |
| | |
Equiniti Group PLC(2)(3) | | | 48,600 | | | | 77,390 | |
| | |
Essentra PLC(2) | | | 29,000 | | | | 114,285 | |
| | |
Experian PLC | | | 14,700 | | | | 513,803 | |
| | |
FDM Group Holdings PLC | | | 10,700 | | | | 146,336 | |
| | |
Ferguson PLC | | | 3,745 | | | | 434,827 | |
| | |
FirstGroup PLC(2) | | | 104,625 | | | | 102,426 | |
| | |
Fresnillo PLC | | | 32,200 | | | | 433,885 | |
| | |
Games Workshop Group PLC | | | 1,807 | | | | 254,986 | |
| | |
GlaxoSmithKline PLC | | | 72,400 | | | | 1,344,562 | |
| | |
Great Portland Estates PLC | | | 23,683 | | | | 210,954 | |
| | |
Greggs PLC(2) | | | 7,435 | | | | 210,668 | |
| | |
Halma PLC | | | 33,980 | | | | 1,145,337 | |
| | | | | | | | |
| Security | | Shares | | | Value | |
|
| United Kingdom (continued) | |
| | |
Hill & Smith Holdings PLC | | | 9,718 | | | $ | 179,383 | |
| | |
Hiscox, Ltd.(2) | | | 11,000 | | | | 140,305 | |
| | |
HomeServe PLC | | | 10,900 | | | | 155,388 | |
| | |
Howden Joinery Group PLC(2) | | | 23,000 | | | | 210,885 | |
| | |
HSBC Holdings PLC(2) | | | 268,700 | | | | 1,406,001 | |
| | |
Ibstock PLC(2)(3) | | | 66,300 | | | | 186,934 | |
| | |
IG Group Holdings PLC | | | 14,640 | | | | 150,032 | |
| | |
Imperial Brands PLC | | | 25,000 | | | | 501,790 | |
| | |
Inchcape PLC(2) | | | 19,600 | | | | 177,642 | |
| | |
InterContinental Hotels Group PLC(2) | | | 6,175 | | | | 380,424 | |
| | |
Intermediate Capital Group PLC | | | 8,334 | | | | 193,301 | |
| | |
Intertek Group PLC | | | 4,100 | | | | 308,784 | |
| | |
IWG PLC(2) | | | 64,800 | | | | 276,966 | |
| | |
John Laing Group PLC(3) | | | 15,800 | | | | 68,270 | |
| | |
Land Securities Group PLC | | | 51,600 | | | | 432,036 | |
| | |
Lloyds Banking Group PLC(2) | | | 1,173,520 | | | | 526,595 | |
| | |
London Stock Exchange Group PLC | | | 4,413 | | | | 523,889 | |
| | |
LondonMetric Property PLC | | | 90,700 | | | | 282,301 | |
| | |
LXI REIT PLC | | | 62,400 | | | | 106,465 | |
| | |
M&G PLC | | | 55,100 | | | | 132,188 | |
| | |
Manchester United PLC, Class A(1) | | | 9,700 | | | | 139,777 | |
| | |
Marks & Spencer Group PLC(2) | | | 83,100 | | | | 160,500 | |
| | |
Marshalls PLC(2) | | | 23,600 | | | | 209,495 | |
| | |
Meggitt PLC(2) | | | 24,500 | | | | 132,486 | |
| | |
Mondi PLC | | | 19,940 | | | | 469,585 | |
| | |
Moneysupermarket.com Group PLC | | | 34,300 | | | | 125,109 | |
| | |
National Express Group PLC(2) | | | 54,600 | | | | 186,621 | |
| | |
National Grid PLC | | | 198,500 | | | | 2,305,715 | |
| | |
Natwest Group PLC(2) | | | 146,005 | | | | 293,130 | |
| | |
NCC Group PLC | | | 72,058 | | | | 243,061 | |
| | |
Next PLC(2) | | | 3,900 | | | | 411,738 | |
| | |
Nomad Foods, Ltd.(2) | | | 11,900 | | | | 298,690 | |
| | |
Pearson PLC(1) | | | 61,614 | | | | 682,627 | |
| | |
Pennon Group PLC | | | 48,800 | | | | 623,155 | |
| | |
Persimmon PLC | | | 9,800 | | | | 341,123 | |
| | |
Phoenix Group Holdings PLC | | | 17,800 | | | | 164,040 | |
| | |
Primary Health Properties PLC | | | 90,643 | | | | 179,857 | |
| | |
QinetiQ Group PLC | | | 19,500 | | | | 80,082 | |
| | |
Reckitt Benckiser Group PLC | | | 11,400 | | | | 966,474 | |
| | |
Redrow PLC(2) | | | 21,200 | | | | 152,236 | |
| | |
RELX PLC | | | 29,880 | | | | 739,783 | |
| | |
Rentokil Initial PLC(2) | | | 39,000 | | | | 264,686 | |
| | |
Rightmove PLC(2) | | | 66,300 | | | | 542,718 | |
| | |
Rio Tinto PLC | | | 27,400 | | | | 2,078,759 | |
| | |
Royal Dutch Shell PLC, Class A | | | 150,900 | | | | 2,792,298 | |
| | |
Royal Mail PLC(2) | | | 29,400 | | | | 162,419 | |
| | | | |
| | 19 | | See Notes to Financial Statements. |
Parametric
International Equity Fund
January 31, 2021
Portfolio of Investments — continued
| | | | | | | | |
| Security | | Shares | | | Value | |
|
| United Kingdom (continued) | |
| | |
RSA Insurance Group PLC | | | 28,100 | | | $ | 259,055 | |
| | |
Safestore Holdings PLC | | | 19,133 | | | | 211,844 | |
| | |
Sage Group PLC (The) | | | 100,200 | | | | 806,813 | |
| | |
Segro PLC | | | 83,400 | | | | 1,085,407 | |
| | |
Serco Group PLC(2) | | | 78,000 | | | | 124,601 | |
| | |
Severn Trent PLC | | | 24,400 | | | | 771,356 | |
| | |
Shaftesbury PLC(1)(2) | | | 20,508 | | | | 156,540 | |
| | |
Signature Aviation PLC(2) | | | 29,360 | | | | 164,950 | |
| | |
Softcat PLC | | | 18,500 | | | | 380,938 | |
| | |
Spirax-Sarco Engineering PLC | | | 1,720 | | | | 260,047 | |
| | |
Spirent Communications PLC | | | 89,600 | | | | 291,611 | |
| | |
SSP Group PLC | | | 21,800 | | | | 86,229 | |
| | |
St. Modwen Properties PLC | | | 12,396 | | | | 65,661 | |
| | |
Standard Life Aberdeen PLC | | | 48,718 | | | | 200,555 | |
| | |
Tate & Lyle PLC | | | 32,900 | | | | 309,873 | |
| | |
Taylor Wimpey PLC(2) | | | 90,000 | | | | 179,624 | |
| | |
Travis Perkins PLC(2) | | | 9,000 | | | | 165,621 | |
| | |
Tritax Big Box REIT PLC | | | 152,000 | | | | 382,799 | |
| | |
UK Commercial Property REIT, Ltd. | | | 77,300 | | | | 68,943 | |
| | |
Unilever PLC(5) | | | 17,280 | | | | 1,006,649 | |
| | |
Unilever PLC(5) | | | 25,541 | | | | 1,484,673 | |
| | |
UNITE Group PLC (The)(2) | | | 33,800 | | | | 443,305 | |
| | |
United Utilities Group PLC | | | 65,000 | | | | 819,312 | |
| | |
Vistry Group PLC(2) | | | 14,949 | | | | 172,157 | |
| | |
Vodafone Group PLC | | | 1,379,000 | | | | 2,354,985 | |
| | |
WH Smith PLC | | | 11,648 | | | | 243,227 | |
| | |
Whitbread PLC(2) | | | 7,267 | | | | 276,168 | |
| | |
WM Morrison Supermarkets PLC | | | 148,000 | | | | 362,954 | |
| |
| | | | $ | 58,859,300 | |
| |
Total Common Stocks
(identified cost $557,253,032) | | | $ | 660,144,565 | |
|
| Rights (2) — 0.0% | |
| Security | | Shares | | | Value | |
| | |
BUWOG AG(4) | | | 3,930 | | | $ | 0 | |
| |
Total Rights
(identified cost $0) | | | $ | 0 | |
| | | | | | | | |
| Warrants (2) — 0.0% | |
| Security | | Shares | | | Value | |
| | |
Ezion Holdings, Ltd., Exp. 4/16/23, Strike SGD 0.2763(4) | | | 135,600 | | | $ | 0 | |
| |
Total Warrants
(identified cost $0) | | | $ | 0 | |
|
| Short-Term Investments — 2.5% | |
| Description | | Units/Shares | | | Value | |
| | |
Eaton Vance Cash Reserves Fund, LLC,
0.11%(6) | | | 5,041,104 | | | $ | 5,041,104 | |
| | |
State Street Navigator Securities Lending Government Money Market Portfolio,
0.06%(7) | | | 11,326,945 | | | | 11,326,945 | |
| |
Total Short-Term Investments
(identified cost $16,368,049) | | | $ | 16,368,049 | |
| |
Total Investments — 101.2%
(identified cost $573,621,081) | | | $ | 676,512,614 | |
| |
Other Assets, Less Liabilities — (1.2)% | | | $ | (7,870,330 | ) |
| |
Net Assets — 100.0% | | | $ | 668,642,284 | |
The percentage shown for each investment category in the Portfolio of Investments is based on net assets.
| (1) | All or a portion of this security was on loan at January 31, 2021. The aggregate market value of securities on loan at January 31, 2021 was $32,819,264. |
| (2) | Non-income producing security. |
| (3) | Security exempt from registration under Rule 144A of the Securities Act of 1933, as amended. These securities may be sold in certain transactions in reliance on an exemption from registration (normally to qualified institutional buyers). At January 31, 2021, the aggregate value of these securities is $22,271,508 or 3.3% of the Fund’s net assets. |
| (4) | For fair value measurement disclosure purposes, security is categorized as Level 3 (see Note 11). |
| (5) | Securities are traded on separate exchanges for the same entity. |
| (6) | Affiliated investment company, available to Eaton Vance portfolios and funds, which invests in high quality, U.S. dollar denominated money market instruments. The rate shown is the annualized seven-day yield as of January 31, 2021. |
| (7) | Represents investment of cash collateral received in connection with securities lending. |
| | | | |
| | 20 | | See Notes to Financial Statements. |
Parametric
International Equity Fund
January 31, 2021
Portfolio of Investments — continued
| | | | | | | | |
| Sector Classification of Portfolio | |
| Sector | | Percentage
of Net Assets | | | Value | |
| | |
Financials | | | 10.8 | % | | $ | 72,265,193 | |
| | |
Industrials | | | 10.5 | | | | 69,926,046 | |
| | |
Consumer Discretionary | | | 10.3 | | | | 68,636,917 | |
| | |
Information Technology | | | 9.8 | | | | 65,845,840 | |
| | |
Materials | | | 9.7 | | | | 65,166,543 | |
| | |
Health Care | | | 9.7 | | | | 65,078,564 | |
| | |
Consumer Staples | | | 9.6 | | | | 63,978,183 | |
| | |
Communication Services | | | 8.4 | | | | 55,935,431 | |
| | |
Real Estate | | | 7.6 | | | | 51,238,965 | |
| | |
Utilities | | | 6.9 | | | | 45,872,732 | |
| | |
Energy | | | 5.4 | | | | 36,200,151 | |
| | |
Short-Term Investments | | | 2.5 | | | | 16,368,049 | |
| | |
Total Investments | | | 101.2 | % | | $ | 676,512,614 | |
Abbreviations:
| | | | |
| | |
| ADR | | – | | American Depositary Receipt |
| | |
| CDI | | – | | CHESS Depositary Interest |
| | |
| PC | | – | | Participation Certificate |
| | |
| PFC Shares | | – | | Preference Shares |
Currency Abbreviations:
| | | | |
| | 21 | | See Notes to Financial Statements. |
Parametric
International Equity Fund
January 31, 2021
Statement of Assets and Liabilities
| | | | |
| Assets | | January 31, 2021 | |
| |
Unaffiliated investments, at value including $32,819,264 of securities on loan (identified cost, $568,579,977) | | $ | 671,471,510 | |
| |
Affiliated investment, at value (identified cost, $5,041,104) | | | 5,041,104 | |
| |
Foreign currency, at value (identified cost, $2,169,715) | | | 2,178,166 | |
| |
Dividends receivable | | | 382,358 | |
| |
Dividends receivable from affiliated investment | | | 156 | |
| |
Receivable for investments sold | | | 325,000 | |
| |
Receivable for Fund shares sold | | | 1,529,764 | |
| |
Securities lending income receivable | | | 74,693 | |
| |
Tax reclaims receivable | | | 948,406 | |
| |
Receivable from affiliates | | | 61,438 | |
| |
Total assets | | $ | 682,012,595 | |
|
| Liabilities | |
| |
Collateral for securities loaned | | $ | 11,326,945 | |
| |
Payable for investments purchased | | | 85,069 | |
| |
Payable for Fund shares redeemed | | | 1,394,725 | |
| |
Payable to affiliates: | | | | |
| |
Investment adviser and administration fee | | | 232,467 | |
| |
Distribution and service fees | | | 26,759 | |
| |
Accrued expenses | | | 304,346 | |
| |
Total liabilities | | $ | 13,370,311 | |
| |
Net Assets | | $ | 668,642,284 | |
| |
| Sources of Net Assets | | | | |
| |
Paid-in capital | | $ | 572,243,122 | |
| |
Distributable earnings | | | 96,399,162 | |
| |
Total | | $ | 668,642,284 | |
| |
| Class A Shares | | | | |
| |
Net Assets | | $ | 113,340,044 | |
| |
Shares Outstanding | | | 7,609,346 | |
| |
Net Asset Value and Redemption Price Per Share | | | | |
| |
(net assets ÷ shares of beneficial interest outstanding) | | $ | 14.89 | |
| |
Maximum Offering Price Per Share | | | | |
| |
(100 ÷ 94.25 of net asset value per share) | | $ | 15.80 | |
| |
| Institutional Class Shares | | | | |
| |
Net Assets | | $ | 400,149,381 | |
| |
Shares Outstanding | | | 26,718,540 | |
| |
Net Asset Value, Offering Price and Redemption Price Per Share | | | | |
| |
(net assets ÷ shares of beneficial interest outstanding) | | $ | 14.98 | |
|
| Class R Shares | |
| |
Net Assets | | $ | 5,081,797 | |
| |
Shares Outstanding | | | 343,626 | |
| |
Net Asset Value, Offering Price and Redemption Price Per Share | | | | |
| |
(net assets ÷ shares of beneficial interest outstanding) | | $ | 14.79 | |
|
| Class R6 Shares | |
| |
Net Assets | | $ | 150,071,062 | |
| |
Shares Outstanding | | | 10,029,147 | |
| |
Net Asset Value, Offering Price and Redemption Price Per Share | | | | |
| |
(net assets ÷ shares of beneficial interest outstanding) | | $ | 14.96 | |
On sales of $50,000 or more, the offering price of Class A shares is reduced.
| | | | |
| | 22 | | See Notes to Financial Statements. |
Parametric
International Equity Fund
January 31, 2021
Statement of Operations
| | | | |
| Investment Income | | Year Ended
January 31, 2021 | |
| |
Dividends (net of foreign taxes, $1,410,106) | | $ | 13,193,246 | |
| |
Non-cash dividends | | | 797,896 | |
| |
Dividends from affiliated investment | | | 13,172 | |
| |
Securities lending income, net | | | 684,484 | |
| |
Total investment income | | $ | 14,688,798 | |
| |
| Expenses | | | | |
| |
Investment adviser and administration fee | | $ | 2,252,538 | |
| |
Distribution and service fees | | | | |
| |
Class A | | | 263,364 | |
| |
Class R | | | 21,126 | |
| |
Trustees’ fees and expenses | | | 31,866 | |
| |
Custodian fee | | | 269,903 | |
| |
Transfer and dividend disbursing agent fees | | | 352,936 | |
| |
Legal and accounting services | | | 63,770 | |
| |
Printing and postage | | | 49,542 | |
| |
Registration fees | | | 90,548 | |
| |
Miscellaneous | | | 60,240 | |
| |
Total expenses | | $ | 3,455,833 | |
| |
Deduct — | | | | |
| |
Allocation of expenses to affiliates | | $ | 381,495 | |
| |
Total expense reductions | | $ | 381,495 | |
| |
Net expenses | | $ | 3,074,338 | |
| |
Net investment income | | $ | 11,614,460 | |
| |
| Realized and Unrealized Gain (Loss) | | | | |
| |
Net realized gain (loss) — | | | | |
| |
Investment transactions (net of foreign capital gains taxes of $15,009) | | $ | (1,494,806 | ) |
| |
Investment transactions — affiliated investment | | | 3,064 | |
| |
Foreign currency transactions | | | (7,335 | ) |
| |
Net realized loss | | $ | (1,499,077 | ) |
| |
Change in unrealized appreciation (depreciation) — | | | | |
| |
Investments | | $ | 48,234,634 | |
| |
Foreign currency | | | 76,900 | |
| |
Net change in unrealized appreciation (depreciation) | | $ | 48,311,534 | |
| |
Net realized and unrealized gain | | $ | 46,812,457 | |
| |
Net increase in net assets from operations | | $ | 58,426,917 | |
| | | | |
| | 23 | | See Notes to Financial Statements. |
Parametric
International Equity Fund
January 31, 2021
Statements of Changes in Net Assets
| | | | | | | | |
| | | Year Ended January 31, | |
| Increase (Decrease) in Net Assets | | 2021 | | | 2020 | |
| | |
From operations — | | | | | | | | |
| | |
Net investment income | | $ | 11,614,460 | | | $ | 10,243,297 | |
| | |
Net realized gain (loss) | | | (1,499,077 | ) | | | 1,608,485 | |
| | |
Net change in unrealized appreciation (depreciation) | | | 48,311,534 | | | | 35,714,204 | |
| | |
Net increase in net assets from operations | | $ | 58,426,917 | | | $ | 47,565,986 | |
| | |
Distributions to shareholders — | | | | | | | | |
| | |
Class A | | $ | (1,549,610 | ) | | $ | (2,323,594 | ) |
| | |
Institutional Class | | | (6,125,067 | ) | | | (8,604,172 | ) |
| | |
Class R | | | (64,563 | ) | | | (79,368 | ) |
| | |
Class R6 | | | (2,442,274 | ) | | | (3,166,819 | ) |
| | |
Total distributions to shareholders | | $ | (10,181,514 | ) | | $ | (14,173,953 | ) |
| | |
Transactions in shares of beneficial interest — | | | | | | | | |
| | |
Proceeds from sale of shares | | | | | | | | |
| | |
Class A | | $ | 44,397,162 | | | $ | 58,029,682 | |
| | |
Institutional Class | | | 139,733,312 | | | | 239,503,303 | |
| | |
Class R | | | 1,563,824 | | | | 1,962,624 | |
| | |
Class R6 | | | 68,788,701 | | | | 66,622,968 | |
| | |
Net asset value of shares issued to shareholders in payment of distributions declared | | | | | | | | |
| | |
Class A | | | 1,543,298 | | | | 2,173,207 | |
| | |
Institutional Class | | | 5,899,391 | | | | 8,190,266 | |
| | |
Class R | | | 64,560 | | | | 79,363 | |
| | |
Class R6 | | | 2,442,274 | | | | 3,166,819 | |
| | |
Cost of shares redeemed | | | | | | | | |
| | |
Class A | | | (47,308,228 | ) | | | (27,691,982 | ) |
| | |
Institutional Class | | | (130,778,358 | ) | | | (58,370,463 | ) |
| | |
Class R | | | (794,029 | ) | | | (480,749 | ) |
| | |
Class R6 | | | (44,347,344 | ) | | | (56,859,037 | ) |
| | |
Net increase in net assets from Fund share transactions | | $ | 41,204,563 | | | $ | 236,326,001 | |
| | |
Net increase in net assets | | $ | 89,449,966 | | | $ | 269,718,034 | |
| | |
| Net Assets | | | | | | | | |
| | |
At beginning of year | | $ | 579,192,318 | | | $ | 309,474,284 | |
| | |
At end of year | | $ | 668,642,284 | | | $ | 579,192,318 | |
| | | | |
| | 24 | | See Notes to Financial Statements. |
Parametric
International Equity Fund
January 31, 2021
Financial Highlights
| | | | | | | | | | | | | | | | | | | | |
| | | Class A | |
| |
| | | Year Ended January 31, | |
| | | 2021 | | | 2020 | | | 2019 | | | 2018 | | | 2017 | |
| | | | | |
Net asset value — Beginning of year | | $ | 13.670 | | | $ | 12.560 | | | $ | 14.350 | | | $ | 11.570 | | | $ | 10.750 | |
| | | | | |
| Income (Loss) From Operations | | | | | | | | | | | | | | | | | | | | |
| | | | | |
Net investment income(1) | | $ | 0.249 | | | $ | 0.298 | | | $ | 0.301 | | | $ | 0.272 | | | $ | 0.198 | |
| | | | | |
Net realized and unrealized gain (loss) | | | 1.175 | | | | 1.144 | | | | (1.700 | ) | | | 2.869 | | | | 0.810 | |
| | | | | |
Total income (loss) from operations | | $ | 1.424 | | | $ | 1.442 | | | $ | (1.399 | ) | | $ | 3.141 | | | $ | 1.008 | |
| | | | | |
| Less Distributions | | | | | | | | | | | | | | | | | | | | |
| | | | | |
From net investment income | | $ | (0.195 | ) | | $ | (0.277 | ) | | $ | (0.211 | ) | | $ | (0.361 | ) | | $ | (0.178 | ) |
| | | | | |
From net realized gain | | | (0.009 | ) | | | (0.055 | ) | | | (0.180 | ) | | | — | | | | (0.010 | ) |
| | | | | |
Total distributions | | $ | (0.204 | ) | | $ | (0.332 | ) | | $ | (0.391 | ) | | $ | (0.361 | ) | | $ | (0.188 | ) |
| | | | | |
Net asset value — End of year | | $ | 14.890 | | | $ | 13.670 | | | $ | 12.560 | | | $ | 14.350 | | | $ | 11.570 | |
| | | | | |
Total Return(2)(3) | | | 10.35 | % | | | 11.53 | % | | | (9.73 | )% | | | 27.29 | % | | | 9.55 | % |
| | | | | |
| Ratios/Supplemental Data | | | | | | | | | | | | | | | | | | | | |
| | | | | |
Net assets, end of year (000’s omitted) | | $ | 113,340 | | | $ | 103,801 | | | $ | 65,056 | | | $ | 59,858 | | | $ | 34,386 | |
| | | | | |
Ratios (as a percentage of average daily net assets): | | | | | | | | | | | | | | | | | | | | |
| | | | | |
Expenses(3) | | | 0.75 | % | | | 0.75 | % | | | 0.75 | % | | | 0.75 | % | | | 0.84 | % |
| | | | | |
Net investment income | | | 1.90 | % | | | 2.24 | % | | | 2.27 | % | | | 2.06 | % | | | 1.75 | % |
| | | | | |
Portfolio Turnover | | | 16 | % | | | 27 | % | | | 30 | % | | | 36 | % | | | 22 | % |
| (1) | Computed using average shares outstanding. |
| (2) | Returns are historical and are calculated by determining the percentage change in net asset value with all distributions reinvested and do not reflect the effect of sales charges, if applicable. |
| (3) | The investment adviser, sub-adviser and administrator reimbursed certain operating expenses (equal to 0.07%, 0.06%, 0.11%, 0.11% and 0.23% of average daily net assets for the years ended January 31, 2021, 2020, 2019, 2018 and 2017, respectively). Absent this reimbursement, total return would be lower. |
| | | | |
| | 25 | | See Notes to Financial Statements. |
Parametric
International Equity Fund
January 31, 2021
Financial Highlights — continued
| | | | | | | | | | | | | | | | | | | | |
| | | Institutional Class | |
| |
| | | Year Ended January 31, | |
| | | 2021 | | | 2020 | | | 2019 | | | 2018 | | | 2017 | |
| | | | | |
Net asset value — Beginning of year | | $ | 13.740 | | | $ | 12.610 | | | $ | 14.410 | | | $ | 11.610 | | | $ | 10.770 | |
| | | | | |
| Income (Loss) From Operations | | | | | | | | | | | | | | | | | | | | |
| | | | | |
Net investment income(1) | | $ | 0.279 | | | $ | 0.297 | | | $ | 0.310 | | | $ | 0.312 | | | $ | 0.257 | |
| | | | | |
Net realized and unrealized gain (loss) | | | 1.196 | | | | 1.194 | | | | (1.689 | ) | | | 2.874 | | | | 0.788 | |
| | | | | |
Total income (loss) from operations | | $ | 1.475 | | | $ | 1.491 | | | $ | (1.379 | ) | | $ | 3.186 | | | $ | 1.045 | |
| | | | | |
| Less Distributions | | | | | | | | | | | | | | | | | | | | |
| | | | | |
From net investment income | | $ | (0.226 | ) | | $ | (0.306 | ) | | $ | (0.241 | ) | | $ | (0.386 | ) | | $ | (0.195 | ) |
| | | | | |
From net realized gain | | | (0.009 | ) | | | (0.055 | ) | | | (0.180 | ) | | | — | | | | (0.010 | ) |
| | | | | |
Total distributions | | $ | (0.235 | ) | | $ | (0.361 | ) | | $ | (0.421 | ) | | $ | (0.386 | ) | | $ | (0.205 | ) |
| | | | | |
Net asset value — End of year | | $ | 14.980 | | | $ | 13.740 | | | $ | 12.610 | | | $ | 14.410 | | | $ | 11.610 | |
| | | | | |
Total Return(2)(3) | | | 10.75 | % | | | 11.79 | % | | | (9.53 | )% | | | 27.60 | % | | | 9.78 | % |
| | | | | |
| Ratios/Supplemental Data | | | | | | | | | | | | | | | | | | | | |
| | | | | |
Net assets, end of year (000’s omitted) | | $ | 400,149 | | | $ | 359,605 | | | $ | 151,107 | | | $ | 86,446 | | | $ | 55,324 | |
| | | | | |
Ratios (as a percentage of average daily net assets): | | | | | | | | | | | | | | | | | | | | |
| | | | | |
Expenses(3) | | | 0.50 | % | | | 0.50 | % | | | 0.50 | % | | | 0.50 | % | | | 0.60 | % |
| | | | | |
Net investment income | | | 2.11 | % | | | 2.21 | % | | | 2.35 | % | | | 2.36 | % | | | 2.26 | % |
| | | | | |
Portfolio Turnover | | | 16 | % | | | 27 | % | | | 30 | % | | | 36 | % | | | 22 | % |
| (1) | Computed using average shares outstanding. |
| (2) | Returns are historical and are calculated by determining the percentage change in net asset value with all distributions reinvested. |
| (3) | The investment adviser, sub-adviser and administrator reimbursed certain operating expenses (equal to 0.07%, 0.06%, 0.11%, 0.11% and 0.24% of average daily net assets for the years ended January 31, 2021, 2020, 2019, 2018 and 2017, respectively). Absent this reimbursement, total return would be lower. |
| | | | |
| | 26 | | See Notes to Financial Statements. |
Parametric
International Equity Fund
January 31, 2021
Financial Highlights — continued
| | | | | | | | | | | | | | | | | | | | |
| | | Class R | |
| |
| | | Year Ended January 31, | |
| | | 2021 | | | 2020 | | | 2019 | | | 2018 | | | 2017 | |
| | | | | |
Net asset value — Beginning of year | | $ | 13.590 | | | $ | 12.490 | | | $ | 14.290 | | | $ | 11.530 | | | $ | 10.740 | |
| | | | | |
| Income (Loss) From Operations | | | | | | | | | | | | | | | | | | | | |
| | | | | |
Net investment income(1) | | $ | 0.204 | | | $ | 0.237 | | | $ | 0.231 | | | $ | 0.259 | | | $ | 0.064 | |
| | | | | |
Net realized and unrealized gain (loss) | | | 1.180 | | | | 1.172 | | | | (1.657 | ) | | | 2.827 | | | | 0.919 | |
| | | | | |
Total income (loss) from operations | | $ | 1.384 | | | $ | 1.409 | | | $ | (1.426 | ) | | $ | 3.086 | | | $ | 0.983 | |
| | | | | |
| Less Distributions | | | | | | | | | | | | | | | | | | | | |
| | | | | |
From net investment income | | $ | (0.175 | ) | | $ | (0.254 | ) | | $ | (0.194 | ) | | $ | (0.326 | ) | | $ | (0.183 | ) |
| | | | | |
From net realized gain | | | (0.009 | ) | | | (0.055 | ) | | | (0.180 | ) | | | — | | | | (0.010 | ) |
| | | | | |
Total distributions | | $ | (0.184 | ) | | $ | (0.309 | ) | | $ | (0.374 | ) | | $ | (0.326 | ) | | $ | (0.193 | ) |
| | | | | |
Net asset value — End of year | | $ | 14.790 | | | $ | 13.590 | | | $ | 12.490 | | | $ | 14.290 | | | $ | 11.530 | |
| | | | | |
Total Return(2)(3) | | | 10.20 | % | | | 11.25 | % | | | (9.96 | )% | | | 26.90 | % | | | 9.22 | % |
| | | | | |
| Ratios/Supplemental Data | | | | | | | | | | | | | | | | | | | | |
| | | | | |
Net assets, end of year (000’s omitted) | | $ | 5,082 | | | $ | 3,713 | | | $ | 1,939 | | | $ | 1,167 | | | $ | 786 | |
| | | | | |
Ratios (as a percentage of average daily net assets): | | | | | | | | | | | | | | | | | | | | |
| | | | | |
Expenses(3) | | | 1.00 | % | | | 1.00 | % | | | 1.00 | % | | | 1.00 | % | | | 1.04 | % |
| | | | | |
Net investment income | | | 1.55 | % | | | 1.79 | % | | | 1.77 | % | | | 1.98 | % | | | 0.56 | % |
| | | | | |
Portfolio Turnover | | | 16 | % | | | 27 | % | | | 30 | % | | | 36 | % | | | 22 | % |
| (1) | Computed using average shares outstanding. |
| (2) | Returns are historical and are calculated by determining the percentage change in net asset value with all distributions reinvested. |
| (3) | The investment adviser, sub-adviser and administrator reimbursed certain operating expenses (equal to 0.07%, 0.06%, 0.11%, 0.11% and 0.19% of average daily net assets for the years ended January 31, 2021, 2020, 2019, 2018 and 2017, respectively). Absent this reimbursement, total return would be lower. |
| | | | |
| | 27 | | See Notes to Financial Statements. |
Parametric
International Equity Fund
January 31, 2021
Financial Highlights — continued
| | | | | | | | | | | | | | | | | | | | |
| | | Class R6 | |
| |
| | | Year Ended January 31, | |
| | | 2021 | | | 2020 | | | 2019 | | | 2018 | | | 2017 | |
| | | | | |
Net asset value — Beginning of year | | $ | 13.730 | | | $ | 12.600 | | | $ | 14.410 | | | $ | 11.610 | | | $ | 10.770 | |
| | | | | |
| Income (Loss) From Operations | | | | | | | | | | | | | | | | | | | | |
| | | | | |
Net investment income(1) | | $ | 0.275 | | | $ | 0.342 | | | $ | 0.363 | | | $ | 0.319 | | | $ | 0.267 | |
| | | | | |
Net realized and unrealized gain (loss) | | | 1.198 | | | | 1.155 | | | | (1.746 | ) | | | 2.875 | | | | 0.780 | |
| | | | | |
Total income (loss) from operations | | $ | 1.473 | | | $ | 1.497 | | | $ | (1.383 | ) | | $ | 3.194 | | | $ | 1.047 | |
| | | | | |
| Less Distributions | | | | | | | | | | | | | | | | | | | | |
| | | | | |
From net investment income | | $ | (0.234 | ) | | $ | (0.312 | ) | | $ | (0.247 | ) | | $ | (0.394 | ) | | $ | (0.197 | ) |
| | | | | |
From net realized gain | | | (0.009 | ) | | | (0.055 | ) | | | (0.180 | ) | | | — | | | | (0.010 | ) |
| | | | | |
Total distributions | | $ | (0.243 | ) | | $ | (0.367 | ) | | $ | (0.427 | ) | | $ | (0.394 | ) | | $ | (0.207 | ) |
| | | | | |
Net asset value — End of year | | $ | 14.960 | | | $ | 13.730 | | | $ | 12.600 | | | $ | 14.410 | | | $ | 11.610 | |
| | | | | |
Total Return(2)(3) | | | 10.75 | % | | | 11.85 | % | | | (9.56 | )% | | | 27.67 | % | | | 9.79 | % |
| | | | | |
| Ratios/Supplemental Data | | | | | | | | | | | | | | | | | | | | |
| | | | | |
Net assets, end of year (000’s omitted) | | $ | 150,071 | | | $ | 112,074 | | | $ | 91,371 | | | $ | 109,225 | | | $ | 84,858 | |
| | | | | |
Ratios (as a percentage of average daily net assets): | | | | | | | | | | | | | | | | | | | | |
| | | | | |
Expenses(3) | | | 0.47 | % | | | 0.47 | % | | | 0.47 | % | | | 0.47 | % | | | 0.58 | % |
| | | | | |
Net investment income | | | 2.07 | % | | | 2.56 | % | | | 2.72 | % | | | 2.42 | % | | | 2.34 | % |
| | | | | |
Portfolio Turnover | | | 16 | % | | | 27 | % | | | 30 | % | | | 36 | % | | | 22 | % |
| (1) | Computed using average shares outstanding. |
| (2) | Returns are historical and are calculated by determining the percentage change in net asset value with all distributions reinvested. |
| (3) | The investment adviser, sub-adviser and administrator reimbursed certain operating expenses (equal to 0.07%, 0.06%, 0.11%, 0.11% and 0.25% of average daily net assets for the years ended January 31, 2021, 2020, 2019, 2018 and 2017, respectively). Absent this reimbursement, total return would be lower. |
| | | | |
| | 28 | | See Notes to Financial Statements. |
Parametric
International Equity Fund
January 31, 2021
Notes to Financial Statements
1 Significant Accounting Policies
Parametric International Equity Fund (the Fund) is a diversified series of Eaton Vance Mutual Funds Trust (the Trust). The Trust is a Massachusetts business trust registered under the Investment Company Act of 1940, as amended (the 1940 Act), as an open-end management investment company. The Fund’s investment objective is to seek long-term capital appreciation. The Fund offers four classes of shares. Class A shares are generally sold subject to a sales charge imposed at time of purchase. Class A shares are offered at net asset value to shareholders who owned Investor Class shares which were redesignated as Class A shares on January 15, 2020, and only for such shareholders’ accounts established prior to such date. Institutional Class, Class R and Class R6 shares are sold at net asset value and are not subject to a sales charge. Each class represents a pro-rata interest in the Fund, but votes separately on class-specific matters and (as noted below) is subject to different expenses. Realized and unrealized gains and losses and net investment income and losses, other than class-specific expenses, are allocated daily to each class of shares based on the relative net assets of each class to the total net assets of the Fund. Sub-accounting, recordkeeping and similar administrative fees payable to financial intermediaries, which are a component of transfer and dividend disbursing agent fees on the Statement of Operations, are not allocated to Class R6 shares. Each class of shares differs in its distribution plan and certain other class-specific expenses.
The following is a summary of significant accounting policies of the Fund. The policies are in conformity with accounting principles generally accepted in the United States of America (U.S. GAAP). The Fund is an investment company and follows accounting and reporting guidance in the Financial Accounting Standards Board (FASB) Accounting Standards Codification Topic 946.
A Investment Valuation — The following methodologies are used to determine the market value or fair value of investments.
Equity Securities. Equity securities listed on a U.S. securities exchange generally are valued at the last sale or closing price on the day of valuation or, if no sales took place on such date, at the mean between the closing bid and ask prices on the exchange where such securities are principally traded. Equity securities listed on the NASDAQ Global or Global Select Market generally are valued at the NASDAQ official closing price. Unlisted or listed securities for which closing sales prices or closing quotations are not available are valued at the mean between the latest available bid and ask prices.
Foreign Securities and Currencies. Foreign securities and currencies are valued in U.S. dollars, based on foreign currency exchange rate quotations supplied by a third party pricing service. The pricing service uses a proprietary model to determine the exchange rate. Inputs to the model include reported trades and implied bid/ask spreads. The daily valuation of exchange-traded foreign securities generally is determined as of the close of trading on the principal exchange on which such securities trade. Events occurring after the close of trading on foreign exchanges may result in adjustments to the valuation of foreign securities to more accurately reflect their fair value as of the close of regular trading on the New York Stock Exchange. When valuing foreign equity securities that meet certain criteria, the Fund’s Trustees have approved the use of a fair value service that values such securities to reflect market trading that occurs after the close of the applicable foreign markets of comparable securities or other instruments that have a strong correlation to the fair-valued securities.
Affiliated Fund. The Fund may invest in Eaton Vance Cash Reserves Fund, LLC (Cash Reserves Fund), an affiliated investment company managed by Eaton Vance Management (EVM). While Cash Reserves Fund is not a registered money market mutual fund, it conducts all of its investment activities in accordance with the requirements of Rule 2a-7 under the 1940 Act. Investments in Cash Reserves Fund are valued at the closing net asset value per unit on the valuation day. Cash Reserves Fund generally values its investment securities based on available market quotations provided by a third party pricing service.
Other. Investments in registered investment companies (including money market funds) that do not trade on an exchange are valued at the net asset value per share on the valuation day.
Fair Valuation. Investments for which valuations or market quotations are not readily available or are deemed unreliable are valued at fair value using methods determined in good faith by or at the direction of the Trustees of the Fund in a manner that most fairly reflects the security’s “fair value”, which is the amount that the Fund might reasonably expect to receive for the security upon its current sale in the ordinary course. Each such determination is based on a consideration of relevant factors, which are likely to vary from one pricing context to another. These factors may include, but are not limited to, the type of security, the existence of any contractual restrictions on the security’s disposition, the price and extent of public trading in similar securities of the issuer or of comparable companies or entities, quotations or relevant information obtained from broker/dealers or other market participants, information obtained from the issuer, analysts, and/or the appropriate stock exchange (for exchange-traded securities), an analysis of the company’s or entity’s financial statements, and an evaluation of the forces that influence the issuer and the market(s) in which the security is purchased and sold.
B Investment Transactions — Investment transactions for financial statement purposes are accounted for on a trade date basis. Realized gains and losses on investments sold are determined on the basis of identified cost.
C Income — Dividend income is recorded on the ex-dividend date for dividends received in cash and/or securities. However, if the ex-dividend date has passed, certain dividends from foreign securities are recorded as the Fund is informed of the ex-dividend date. Non-cash dividends are recorded at the fair value of the securities received. Withholding taxes on foreign dividends and capital gains have been provided for in accordance with the Fund’s understanding of the applicable countries’ tax rules and rates.
D Federal and Other Taxes — The Fund’s policy is to comply with the provisions of the Internal Revenue Code applicable to regulated investment companies and to distribute to shareholders each year substantially all of its net investment income, and all or substantially all of its net realized capital gains. Accordingly, no provision for federal income or excise tax is necessary.
Parametric
International Equity Fund
January 31, 2021
Notes to Financial Statements — continued
In addition to the requirements of the Internal Revenue Code, the Fund may also be subject to local taxes on the recognition of capital gains in certain countries. Capital gains taxes on securities sold are included in net realized gain (loss) on investments.
As of January 31, 2021, the Fund had no uncertain tax positions that would require financial statement recognition, de-recognition, or disclosure. The Fund files a U.S. federal income tax return annually after its fiscal year-end, which is subject to examination by the Internal Revenue Service for a period of three years from the date of filing.
E Expenses — The majority of expenses of the Trust are directly identifiable to an individual fund. Expenses which are not readily identifiable to a specific fund are allocated taking into consideration, among other things, the nature and type of expense and the relative size of the funds.
F Foreign Currency Translation — Investment valuations, other assets, and liabilities initially expressed in foreign currencies are translated each business day into U.S. dollars based upon current exchange rates. Purchases and sales of foreign investment securities and income and expenses denominated in foreign currencies are translated into U.S. dollars based upon currency exchange rates in effect on the respective dates of such transactions. Recognized gains or losses on investment transactions attributable to changes in foreign currency exchange rates are recorded for financial statement purposes as net realized gains and losses on investments. That portion of unrealized gains and losses on investments that results from fluctuations in foreign currency exchange rates is not separately disclosed.
G Use of Estimates — The preparation of the financial statements in conformity with U.S. GAAP requires management to make estimates and assumptions that affect the reported amounts of assets and liabilities at the date of the financial statements and the reported amounts of income and expense during the reporting period. Actual results could differ from those estimates.
H Indemnifications — Under the Trust’s organizational documents, its officers and Trustees may be indemnified against certain liabilities and expenses arising out of the performance of their duties to the Fund. Under Massachusetts law, if certain conditions prevail, shareholders of a Massachusetts business trust (such as the Trust) could be deemed to have personal liability for the obligations of the Trust. However, the Trust’s Declaration of Trust contains an express disclaimer of liability on the part of Fund shareholders and the By-laws provide that the Trust shall assume, upon request by the shareholder, the defense on behalf of any Trust shareholders. Moreover, the By-laws also provide for indemnification out of Fund property of any shareholder held personally liable solely by reason of being or having been a shareholder for all loss or expense arising from such liability. Additionally, in the normal course of business, the Fund enters into agreements with service providers that may contain indemnification clauses. The Fund’s maximum exposure under these arrangements is unknown as this would involve future claims that may be made against the Fund that have not yet occurred.
2 Distributions to Shareholders and Income Tax Information
It is the present policy of the Fund to make at least one distribution annually (normally in December) of all or substantially all of its net investment income and to distribute annually all or substantially all of its net realized capital gains. Distributions to shareholders are recorded on the ex-dividend date. Distributions are declared separately for each class of shares. Shareholders may reinvest income and capital gain distributions in additional shares of the same class of the Fund at the net asset value as of the ex-dividend date or, at the election of the shareholder, receive distributions in cash. Distributions to shareholders are determined in accordance with income tax regulations, which may differ from U.S. GAAP. As required by U.S. GAAP, only distributions in excess of tax basis earnings and profits are reported in the financial statements as a return of capital. Permanent differences between book and tax accounting relating to distributions are reclassified to paid-in capital. For tax purposes, distributions from short-term capital gains are considered to be from ordinary income.
The tax character of distributions declared for the years ended January 31, 2021 and January 31, 2020 was as follows:
| | | | | | | | |
| | | Year Ended January 31, | |
| | | 2021 | | | 2020 | |
| | |
Ordinary income | | $ | 9,972,146 | | | $ | 12,464,313 | |
| | |
Long-term capital gains | | $ | 209,368 | | | $ | 1,709,640 | |
During the year ended January 31, 2021, distributable earnings was decreased by $1,248,407 and paid-in capital was increased by $1,248,407 primarily due to the Fund’s use of equalization accounting. Tax equalization accounting allows the Fund to treat as a distribution that portion of redemption proceeds representing a redeeming shareholder’s portion of undistributed taxable income and net capital gains. These reclassifications had no effect on the net assets or net asset value per share of the Fund.
Parametric
International Equity Fund
January 31, 2021
Notes to Financial Statements — continued
As of January 31, 2021, the components of distributable earnings (accumulated loss) on a tax basis were as follows:
| | | | |
| | |
Undistributed ordinary income | | $ | 1,485,913 | |
| |
Deferred capital losses | | $ | (591,703 | ) |
| |
Net unrealized appreciation | | $ | 95,504,952 | |
At January 31, 2021, the Fund, for federal income tax purposes, had deferred capital losses of $591,703 which would reduce its taxable income arising from future net realized gains on investment transactions, if any, to the extent permitted by the Internal Revenue Code, and thus would reduce the amount of distributions to shareholders, which would otherwise be necessary to relieve the Fund of any liability for federal income or excise tax. The deferred capital losses are treated as arising on the first day of the Fund’s next taxable year and retain the same short-term or long-term character as when originally deferred. Of the deferred capital losses at January 31, 2021, $591,703 are short-term.
The cost and unrealized appreciation (depreciation) of investments of the Fund at January 31, 2021, as determined on a federal income tax basis, were as follows:
| | | | |
| |
Aggregate cost | | $ | 581,084,555 | |
| |
Gross unrealized appreciation | | $ | 132,424,490 | |
| |
Gross unrealized depreciation | | | (36,996,431 | ) |
| |
Net unrealized appreciation | | $ | 95,428,059 | |
3 Investment Adviser and Administration Fee and Other Transactions with Affiliates
The investment adviser and administration fee is earned by EVM, a wholly-owned subsidiary of Eaton Vance Corp., as compensation for investment advisory and administrative services rendered to the Fund. Pursuant to the investment advisory and administrative agreement and subsequent fee reduction agreements between the Fund and EVM, the fee is computed at an annual rate of 0.40% of the Fund’s average daily net assets up to $1 billion and is payable monthly. On net assets of $1 billion and over, the annual fee is reduced. The fee reductions cannot be terminated or reduced without the approval of a majority vote of the Trustees of the Fund who are not interested persons of EVM or the Fund and by the vote of a majority of shareholders. For the year ended January 31, 2021, the investment adviser and administration fee amounted to $2,252,538 or 0.40% of the Fund’s average daily net assets. Pursuant to a sub-advisory agreement, EVM has delegated the investment management of the Fund to Parametric Portfolio Associates LLC (Parametric), a wholly-owned indirect subsidiary of Eaton Vance Corp. EVM pays Parametric a portion of its investment adviser and administration fee for sub-advisory services provided to the Fund. The Fund invests its cash in Cash Reserves Fund. EVM does not currently receive a fee for advisory services provided to Cash Reserves Fund.
EVM and Parametric have agreed to reimburse the Fund’s expenses to the extent that total annual operating expenses (relating to ordinary operating expenses only) exceed 0.75%, 0.50%, 1.00% and 0.47% of the Fund’s average daily net assets for Class A, Institutional Class, Class R and Class R6, respectively. This agreement may be changed or terminated after May 31, 2021. Pursuant to this agreement, EVM and Parametric were allocated $381,495 in total of the Fund’s operating expenses for the year ended January 31, 2021.
EVM provides sub-transfer agency and related services to the Fund pursuant to a Sub-Transfer Agency Support Services Agreement. For the year ended January 31, 2021, EVM earned $17,458 from the Fund pursuant to such agreement, which is included in transfer and dividend disbursing agent fees on the Statement of Operations. The Fund was informed that Eaton Vance Distributors, Inc. (EVD), an affiliate of EVM and the Fund’s principal underwriter, received $16 as its portion of the sales charge on sales of Class A shares for the year ended January 31, 2021. EVD also received distribution and service fees from Class A and Class R shares (see Note 4) and contingent deferred sales charges (see Note 5).
Trustees and officers of the Fund who are members of EVM’s organization receive remuneration for their services to the Fund out of the investment adviser and administration fee. Trustees of the Fund who are not affiliated with EVM may elect to defer receipt of all or a percentage of their annual fees in accordance with the terms of the Trustees Deferred Compensation Plan. For the year ended January 31, 2021, no significant amounts have been deferred. Certain officers and Trustees of the Fund are officers of EVM.
4 Distribution Plans
The Fund has in effect a distribution plan for Class A shares (Class A Plan) pursuant to Rule 12b-1 under the 1940 Act. Pursuant to the Class A Plan, the Fund pays EVD a distribution and service fee of 0.25% per annum of its average daily net assets attributable to Class A shares for distribution services and
Parametric
International Equity Fund
January 31, 2021
Notes to Financial Statements — continued
facilities provided to the Fund by EVD, as well as for personal services and/or the maintenance of shareholder accounts. Distribution and service fees paid or accrued to EVD for the year ended January 31, 2021 amounted to $263,364 for Class A shares.
The Fund also has in effect a distribution plan for Class R shares (Class R Plan) pursuant to Rule 12b-1 under the 1940 Act. The Class R Plan requires the Fund to pay EVD an amount up to 0.50% per annum of its average daily net assets attributable to Class R shares for providing ongoing distribution services and facilities to the Fund. The Trustees of the Trust have currently limited Class R distribution payments to 0.25% per annum of the average daily net assets attributable to Class R shares. For the year ended January 31, 2021, the Fund paid or accrued to EVD $10,563 for Class R shares.
Pursuant to the Class R Plan, the Fund also makes payments of service fees to EVD, financial intermediaries and other persons in amounts equal to 0.25% per annum of its average daily net assets attributable to that class. Service fees paid or accrued are for personal services and/or the maintenance of shareholder accounts. They are separate and distinct from the sales commissions and distribution fees payable to EVD. Service fees paid or accrued for the year ended January 31, 2021 amounted to $10,563 for Class R shares.
Distribution and service fees are subject to the limitations contained in the Financial Industry Regulatory Authority Rule 2341(d).
5 Contingent Deferred Sales Charges
Class A shares may be subject to a 1% contingent deferred sales charge (CDSC) if redeemed within 18 months of purchase (depending on the circumstances of purchase). Generally, the CDSC is based upon the lower of the net asset value at date of redemption or date of purchase. No charge is levied on shares acquired by reinvestment of dividends or capital gain distributions. For the year ended January 31, 2021, the Fund was informed that EVD received approximately $300 of CDSCs paid by Class A shareholders.
6 Purchases and Sales of Investments
Purchases and sales of investments, other than short-term obligations, aggregated $128,211,799 and $88,965,579, respectively, for the year ended January 31, 2021.
7 Shares of Beneficial Interest
The Fund’s Declaration of Trust permits the Trustees to issue an unlimited number of full and fractional shares of beneficial interest (without par value). Such shares may be issued in a number of different series (such as the Fund) and classes. Transactions in Fund shares were as follows:
| | | | | | | | |
| | | Year Ended January 31, | |
| Class A | | 2021 | | | 2020 | |
| | |
Sales | | | 3,721,595 | | | | 4,339,952 | |
| | |
Issued to shareholders electing to receive payments of distributions in Fund shares | | | 104,777 | | | | 156,288 | |
| | |
Redemptions | | | (3,807,911 | ) | | | (2,086,386 | ) |
| | |
Net increase | | | 18,461 | | | | 2,409,854 | |
| |
| | | Year Ended January 31, | |
| Institutional Class | | 2021 | | | 2020 | |
| | |
Sales | | | 10,891,613 | | | | 17,962,909 | |
| | |
Issued to shareholders electing to receive payments of distributions in Fund shares | | | 397,595 | | | | 586,544 | |
| | |
Redemptions | | | (10,741,029 | ) | | | (4,361,469 | ) |
| | |
Net increase | | | 548,179 | | | | 14,187,984 | |
Parametric
International Equity Fund
January 31, 2021
Notes to Financial Statements — continued
| | | | | | | | |
| | | Year Ended January 31, | |
| Class R | | 2021 | | | 2020 | |
| | |
Sales | | | 125,033 | | | | 148,954 | |
| | |
Issued to shareholders electing to receive payments of distributions in Fund shares | | | 4,415 | | | | 5,743 | |
| | |
Redemptions | | | (58,975 | ) | | | (36,765 | ) |
| | |
Net increase | | | 70,473 | | | | 117,932 | |
| |
| | | Year Ended January 31, | |
| Class R6 | | 2021 | | | 2020 | |
| | |
Sales | | | 5,086,627 | | | | 4,896,576 | |
| | |
Issued to shareholders electing to receive payments of distributions in Fund shares | | | 164,536 | | | | 226,857 | |
| | |
Redemptions | | | (3,383,215 | ) | | | (4,211,327 | ) |
| | |
Net increase | | | 1,867,948 | | | | 912,106 | |
8 Line of Credit
The Fund participates with other portfolios and funds managed by EVM and its affiliates in an $800 million unsecured line of credit agreement with a group of banks, which is in effect through October 26, 2021. Borrowings are made by the Fund solely for temporary purposes related to redemptions and other short-term cash needs. Interest is charged to the Fund based on its borrowings at an amount above either the Eurodollar rate or Federal Funds rate. In addition, a fee computed at an annual rate of 0.15% on the daily unused portion of the line of credit is allocated among the participating portfolios and funds at the end of each quarter. In connection with the renewal of the agreement in October 2020, an upfront fee and arrangement fee totaling $950,000 was incurred that was allocated to the participating portfolios and funds. Because the line of credit is not available exclusively to the Fund, it may be unable to borrow some or all of its requested amounts at any particular time. The Fund did not have any significant borrowings or allocated fees during the year ended January 31, 2021.
9 Securities Lending Agreement
The Fund has established a securities lending agreement with State Street Bank and Trust Company (SSBT) as securities lending agent in which the Fund lends portfolio securities to qualified borrowers in exchange for collateral consisting of either cash or securities issued or guaranteed by the U.S. government or its agencies or instrumentalities in an amount at least equal to the market value of the securities on loan. The market value of securities loaned is determined daily and any additional required collateral is delivered to the Fund on the next business day. Cash collateral is invested in the State Street Navigator Securities Lending Government Money Market Portfolio, a money market fund registered under the 1940 Act. The Fund earns interest on the amount invested but it must pay (and at times receive from) the broker a loan rebate fee computed as a varying percentage of the collateral received. For security loans secured by non-cash collateral, the Fund earns a negotiated lending fee from the borrower. A portion of the income earned by the Fund from its investment of cash collateral, net of rebate fees, and lending fees received is allocated to SSBT for its services as lending agent and the portion allocated to the Fund is presented as securities lending income, net on the Statement of Operations. Non-cash collateral is held by the lending agent on behalf of the Fund and cannot be sold or re-pledged by the Fund; accordingly, such collateral is not reflected in the Statement of Assets and Liabilities.
The Fund is subject to possible delay in the recovery of loaned securities. Pursuant to the securities lending agreement, SSBT has provided indemnification to the Fund in the event of default by a borrower with respect to a loan. The Fund bears the risk of loss with respect to the investment of cash collateral.
At January 31, 2021, the value of the securities loaned and the value of the collateral received, which exceeded the value of the securities loaned, amounted to $32,819,264 and $35,375,563, respectively. Collateral received was comprised of cash of $11,326,945 and U.S. government and/or agencies securities of $24,048,618. The securities lending transactions have no contractual maturity date and each of the Fund and borrower has the option to terminate a loan at any time.
Parametric
International Equity Fund
January 31, 2021
Notes to Financial Statements — continued
The following table provides a breakdown of securities lending transactions accounted for as secured borrowings, the obligations by class of collateral pledged, and the remaining contractual maturity of those transactions as of January 31, 2021.
| | | | | | | | | | | | | | | | | | | | |
| | | Remaining Contractual Maturity of the Transactions | |
| | | Overnight and
Continuous | | | <30 days | | | 30 to 90 days | | | >90 days | | | Total | |
| | | | | |
Common Stocks | | $ | 11,326,945 | | | $ | — | | | $ | — | | | $ | — | | | $ | 11,326,945 | |
The carrying amount of the liability for collateral for securities loaned at January 31, 2021 approximated its fair value. If measured at fair value, such liability would have been considered as Level 2 in the fair value hierarchy (see Note 11) at January 31, 2021.
10 Investments in Affiliated Funds
At January 31, 2021, the value of the Fund’s investment in affiliated funds was $5,041,104, which represents 0.8% of the Fund’s net assets. Transactions in affiliated funds by the Fund for the year ended January 31, 2021 were as follows:
| | | | | | | | | | | | | | | | | | | | | | | | | | | | | | | | |
Name of affiliated fund | | Value,
beginning
of period | | | Purchases | | | Sales proceeds | | | Net
realized
gain (loss) | | | Change in
unrealized
appreciation
(depreciation) | | | Value,
end of
period | | | Dividend
income | | | Units, end
of period | |
| | | | | | | | |
Short-Term Investments | | | | | | | | | | | | | | | | | | | | | | | | | | | | | | | | |
| | | | | | | | |
Eaton Vance Cash Reserves Fund, LLC | | $ | 2,163,390 | | | $ | 127,361,455 | | | $ | (124,486,805 | ) | | $ | 3,064 | | | $ | — | | | $ | 5,041,104 | | | $ | 13,172 | | | | 5,041,104 | |
11 Fair Value Measurements
Under generally accepted accounting principles for fair value measurements, a three-tier hierarchy to prioritize the assumptions, referred to as inputs, is used in valuation techniques to measure fair value. The three-tier hierarchy of inputs is summarized in the three broad levels listed below.
| • | | Level 1 – quoted prices in active markets for identical investments |
| • | | Level 2 – other significant observable inputs (including quoted prices for similar investments, interest rates, prepayment speeds, credit risk, etc.) |
| • | | Level 3 – significant unobservable inputs (including a fund’s own assumptions in determining the fair value of investments) |
In cases where the inputs used to measure fair value fall in different levels of the fair value hierarchy, the level disclosed is determined based on the lowest level input that is significant to the fair value measurement in its entirety. The inputs or methodology used for valuing securities are not necessarily an indication of the risk associated with investing in those securities.
At January 31, 2021, the hierarchy of inputs used in valuing the Fund’s investments, which are carried at value, were as follows:
| | | | | | | | | | | | | | | | |
| Asset Description | | Level 1 | | | Level 2 | | | Level 3* | | | Total | |
| | | | |
Common Stocks | | | | | | | | | | | | | | | | |
| | | | |
Asia/Pacific | | $ | 3,977,313 | | | $ | 198,045,950 | | | $ | 0 | | | $ | 202,023,263 | |
| | | | |
Developed Europe | | | 8,220,191 | | | | 434,631,656 | | | | 0 | | | | 442,851,847 | |
| | | | |
Developed Middle East | | | 2,456,589 | | | | 12,812,866 | | | | — | | | | 15,269,455 | |
| | | | |
Total Common Stocks | | $ | 14,654,093 | | | $ | 645,490,472 | ** | | $ | 0 | | | $ | 660,144,565 | |
Parametric
International Equity Fund
January 31, 2021
Notes to Financial Statements — continued
| | | | | | | | | | | | | | | | |
| Asset Description | | Level 1 | | | Level 2 | | | Level 3* | | | Total | |
| | | | |
Rights | | $ | — | | | $ | — | | | $ | 0 | | | $ | 0 | |
| | | | |
Warrants | | | — | | | | — | | | | 0 | | | | 0 | |
| | | | |
Short-Term Investments | | | 11,326,945 | | | | 5,041,104 | | | | — | | | | 16,368,049 | |
| | | | |
Total Investments | | $ | 25,981,038 | | | $ | 650,531,576 | | | $ | 0 | | | $ | 676,512,614 | |
| * | None of the unobservable inputs for Level 3 assets, individually or collectively, had a material impact on the Fund. |
| ** | Includes foreign equity securities whose values were adjusted to reflect market trading of comparable securities or other correlated instruments that occurred after the close of trading in their applicable foreign markets. |
Level 3 investments at the beginning and/or end of the period were valued at $0 and accordingly, a reconciliation of Level 3 assets for the year ended January 31, 2021 is not presented.
12 Risks and Uncertainties
Risks Associated with Foreign Investments
Investments in foreign issuers could be affected by factors not present in the United States, including expropriation, armed conflict, confiscatory taxation, lack of uniform accounting and auditing standards, less publicly available financial and other information, and potential difficulties in enforcing contractual obligations. Because foreign issuers may not be subject to uniform accounting, auditing and financial reporting standard practices and requirements and regulatory measures comparable to those in the United States, there may be less publicly available information about such foreign issuers. Settlements of securities transactions in foreign countries are subject to risk of loss, may be delayed and are generally less frequent than in the United States. Evidence of ownership of certain foreign investments may be held outside the United States, and the Fund may be subject to the risks associated with the holding of such property overseas. Foreign issuers may become subject to sanctions imposed by the United States or another country, which could result in the immediate freeze of the foreign issuers’ assets or securities. Trading in certain foreign markets is also subject to liquidity risk. Political events in foreign countries may cause market disruptions.
Pandemic Risk
An outbreak of respiratory disease caused by a novel coronavirus was first detected in China in December 2019 and subsequently spread internationally. This coronavirus has resulted in closing borders, enhanced health screenings, changes to healthcare service preparation and delivery, quarantines, cancellations, disruptions to supply chains and customer activity, as well as general concern and uncertainty. Health crises caused by outbreaks, such as the coronavirus outbreak, may exacerbate other pre-existing political, social and economic risks and disrupt normal market conditions and operations. The impact of this outbreak has negatively affected the worldwide economy, the economies of individual countries, individual companies, and the market in general, and may continue to do so in significant and unforeseen ways, as may other epidemics and pandemics that may arise in the future. Any such impact could adversely affect the Fund’s performance, or the performance of the securities in which the Fund invests.
13 Additional Information
On October 8, 2020, Morgan Stanley and Eaton Vance Corp. (“Eaton Vance”) announced that they had entered into a definitive agreement under which Morgan Stanley would acquire Eaton Vance. Under the Investment Company Act of 1940, as amended, consummation of this transaction may have been deemed to result in the automatic termination of an Eaton Vance Fund’s investment advisory agreement and, where applicable, any related sub-advisory agreement. On November 24, 2020, the Fund’s Board approved a new investment advisory and administrative agreement and a new sub-advisory agreement. The new investment advisory and administrative agreement and new sub-advisory agreement were approved by Fund shareholders at a joint special meeting of shareholders held on February 18, 2021, and became effective upon the consummation of the transaction on March 1, 2021.
Parametric
International Equity Fund
January 31, 2021
Report of Independent Registered Public Accounting Firm
To the Trustees of Eaton Vance Mutual Funds Trust and Shareholders of Parametric International Equity Fund:
Opinion on the Financial Statements and Financial Highlights
We have audited the accompanying statement of assets and liabilities of Parametric International Equity Fund (the “Fund”) (one of the funds constituting Eaton Vance Mutual Funds Trust), including the portfolio of investments, as of January 31, 2021, the related statement of operations for the year then ended, the statements of changes in net assets for each of the two years in the period then ended, the financial highlights for each of the five years in the period then ended, and the related notes. In our opinion, the financial statements and financial highlights present fairly, in all material respects, the financial position of the Fund as of January 31, 2021, and the results of its operations for the year then ended, the changes in its net assets for each of the two years in the period then ended, and the financial highlights for each of the five years in the period then ended, in conformity with accounting principles generally accepted in the United States of America.
Basis for Opinion
These financial statements and financial highlights are the responsibility of the Fund’s management. Our responsibility is to express an opinion on the Fund’s financial statements and financial highlights based on our audits. We are a public accounting firm registered with the Public Company Accounting Oversight Board (United States) (PCAOB) and are required to be independent with respect to the Fund in accordance with the U.S. federal securities laws and the applicable rules and regulations of the Securities and Exchange Commission and the PCAOB.
We conducted our audits in accordance with the standards of the PCAOB. Those standards require that we plan and perform the audit to obtain reasonable assurance about whether the financial statements and financial highlights are free of material misstatement, whether due to error or fraud. The Fund is not required to have, nor were we engaged to perform, an audit of its internal control over financial reporting. As part of our audits we are required to obtain an understanding of internal control over financial reporting but not for the purpose of expressing an opinion on the effectiveness of the Fund’s internal control over financial reporting. Accordingly, we express no such opinion.
Our audits included performing procedures to assess the risks of material misstatement of the financial statements and financial highlights, whether due to error or fraud, and performing procedures that respond to those risks. Such procedures included examining, on a test basis, evidence regarding the amounts and disclosures in the financial statements and financial highlights. Our audits also included evaluating the accounting principles used and significant estimates made by management, as well as evaluating the overall presentation of the financial statements and financial highlights. Our procedures included confirmation of securities owned as of January 31, 2021, by correspondence with the custodian and brokers; when replies were not received from brokers, we performed other auditing procedures. We believe that our audits provide a reasonable basis for our opinion.
/s/ Deloitte & Touche LLP
Boston, Massachusetts
March 19, 2021
We have served as the auditor of one or more Eaton Vance investment companies since 1959.
Parametric
International Equity Fund
January 31, 2021
Federal Tax Information (Unaudited)
The Form 1099-DIV you receive in February 2022 will show the tax status of all distributions paid to your account in calendar year 2021. Shareholders are advised to consult their own tax adviser with respect to the tax consequences of their investment in the Fund. As required by the Internal Revenue Code and/or regulations, shareholders must be notified regarding the status of qualified dividend income for individuals and the foreign tax credit.
Qualified Dividend Income. For the fiscal year ended January 31, 2021, the Fund designates approximately $10,070,176, or up to the maximum amount of such dividends allowable pursuant to the Internal Revenue Code, as qualified dividend income eligible for the reduced tax rate of 15%.
Foreign Tax Credit. For the fiscal year ended January 31, 2021, the Fund paid foreign taxes of $909,442 and recognized foreign source income of $12,099,226.
Parametric
International Equity Fund
January 31, 2021
Board of Trustees’ Contract Approval
Overview of the Contract Review Process
Even though the following description of the Board’s (as defined below) consideration of investment advisory and, as applicable, sub-advisory agreements covers multiple funds, for purposes of this shareholder report, the description is only relevant as to Parametric International Equity Fund.
| | | | |
| Fund | | Investment Adviser | | Investment Sub-Adviser |
| | |
Parametric International Equity Fund | | Eaton Vance Management | | Parametric Portfolio Associates LLC |
At a meeting held on November 24, 2020 (the “November Meeting”), the Board of each Eaton Vance open-end Fund and portfolios in which each such Fund invests, as applicable (each, a “Fund” and, collectively, the “Funds”), including a majority of the Board members (the “Independent Trustees”) who are not “interested persons” (as defined in the Investment Company Act of 1940 (the “1940 Act”)) of the Funds, Eaton Vance Management (“EVM”) or Boston Management and Research (“BMR” and, together with EVM, the “Advisers”), voted to approve a new investment advisory agreement between each Fund and either EVM or BMR (the “New Investment Advisory Agreements”) and, for certain Funds, a new investment sub-advisory agreement between an Adviser and the applicable Sub-Adviser (the “New Investment Sub-Advisory Agreements”(1) and, together with the New Investment Advisory Agreements, the “New Agreements”), each of which is intended to go into effect upon the completion of the Transaction (as defined below), as more fully described below. In voting its approval of the New Agreements at the November Meeting, the Board relied on an order issued by the Securities and Exchange Commission in response to the impacts of the COVID-19 pandemic that provided temporary relief from the in-person meeting requirements under Section 15 of the 1940 Act.
In voting its approval of the New Agreements, the Board of each Fund relied upon the recommendation of its Contract Review Committee, which is a committee comprised exclusively of Independent Trustees. Prior to and during meetings leading up to the November Meeting, the Contract Review Committee reviewed and discussed information furnished by the Advisers, the Sub-Advisers, and Morgan Stanley, as requested by the Independent Trustees, that the Contract Review Committee considered reasonably necessary to evaluate the terms of the New Agreements and to form its recommendation. Such information included, among other things, the terms and anticipated impacts of Morgan Stanley’s pending acquisition of Eaton Vance Corp. (the “Transaction”) on the Funds and their shareholders. In addition to considering information furnished specifically to evaluate the impact of the Transaction on the Funds and their respective shareholders, the Board and its Contract Review Committee also considered information furnished for prior meetings of the Board and its committees, including information provided in connection with the annual contract review process for the Funds, which most recently culminated in April 2020 (the “2020 Annual Approval Process”).
The Board of each Fund, including the Independent Trustees, concluded that the applicable New Investment Advisory Agreement and, as applicable, New Investment Sub-Advisory Agreement, including the fees payable thereunder, was fair and reasonable, and it voted to approve the New Investment Advisory Agreement and, as applicable, New Investment Sub-Advisory Agreement and to recommend that shareholders do so as well.
Shortly after the announcement of the Transaction, the Board, including all of the Independent Trustees, met with senior representatives from the Advisers and Morgan Stanley at its meeting held on October 13, 2020 to discuss certain aspects of the Transaction and the expected impacts of the Transaction on the Funds and their shareholders. As part of the Board’s evaluation process, counsel to the Independent Trustees, on behalf of the Contract Review Committee, requested additional information to assist the Independent Trustees in their evaluation of the New Agreements and the implications of the Transaction, as well as other contractual arrangements that may be affected by the Transaction. The Contract Review Committee considered information furnished by the Advisers and Morgan Stanley, their respective affiliates, and, as applicable, the Sub-Advisers during meetings on November 5, 2020, November 10, 2020, November 13, 2020, November 17, 2020 and November 24, 2020.
During its meetings on November 10, 2020 and November 17, 2020, the Contract Review Committee further discussed the approval of the New Agreements with senior representatives of the Advisers, the Affiliated Sub-Advisers, and Morgan Stanley. The representatives from the Advisers, the Affiliated Sub-Advisers, and Morgan Stanley each made presentations to, and responded to questions from, the Independent Trustees. The Contract Review Committee considered the Advisers’, the Affiliated Sub-Advisers’ and Morgan Stanley’s responses related to the Transaction and specifically to the Funds, as well as information received in connection with the 2020 Annual Approval Process, with respect to its evaluation of the New Agreements. Among other information, the Board considered:
| (1) | With respect to certain of the Funds, the applicable Adviser is currently a party to a sub-advisory agreement (collectively, the “Current Sub-Advisory Agreements”) with Atlanta Capital Management Company, LLC (“Atlanta Capital”), BMO Global Asset Management (Asia) Limited, Eaton Vance Advisers International Ltd. (“EVAIL”), Goldman Sachs Asset Management, L.P., Hexavest Inc. (“Hexavest”), Parametric Portfolio Associates LLC (“Parametric”) or Richard Bernstein Advisors LLC (collectively, the “Sub-Advisers” and, with respect to Atlanta Capital, EVAIL, Hexavest and Parametric, each an affiliate of the Advisers, the “Affiliated Sub-Advisers”). Accordingly, references to the “Sub-Advisers,” the “Affiliated Sub-Advisers” or the “New Sub-Advisory Agreements” are not applicable to all Funds. |
Parametric
International Equity Fund
January 31, 2021
Board of Trustees’ Contract Approval — continued
Information about the Transaction and its Terms
| | • | | Information about the material terms and conditions, and expected impacts, of the Transaction that relate to the Funds, including the expected impacts on the businesses conducted by the Advisers, the Affiliated Sub-Advisers and Eaton Vance Distributors, Inc., as the distributor of Fund shares; |
| | • | | Information about the advantages of the Transaction as they relate to the Funds and their shareholders; |
| | • | | A commitment that the Funds would not bear any expenses, directly or indirectly, in connection with the Transaction; |
| | • | | A commitment that, for a period of three years after the Closing, at least 75% of each Fund’s Board members must not be “interested persons” (as defined in the 1940 Act) of the investment adviser (or predecessor investment adviser, if applicable) pursuant to Section 15(f)(1)(A) of the 1940 Act; |
| | • | | A commitment that Morgan Stanley would use its reasonable best efforts to ensure that it did not impose any “unfair burden” (as that term is used in section 15(f)(1)(B) of the 1940 Act) on the Funds as a result of the Transaction; |
| | • | | Information with respect to personnel and/or other resources of the Advisers and their affiliates, including the Affiliated Sub-Advisers, as a result of the Transaction, as well as any expected changes to compensation, including any retention-based compensation intended to incentivize key personnel at the Advisers and their affiliates, including the Affiliated Sub-Advisers; |
| | • | | Information regarding any changes that are expected with respect to the Funds’ slate of officers as a result of the Transaction; |
Information about Morgan Stanley
| | • | | Information about Morgan Stanley’s overall business, including information about the advisory, brokerage and related businesses that Morgan Stanley operates; |
| | • | | Information about Morgan Stanley’s financial condition, including its access to capital and other resources required to support the investment advisory businesses related to the Funds; |
| | • | | Information on how the Funds are expected to fit within Morgan Stanley’s overall business strategy, and any changes that Morgan Stanley contemplates implementing to the Funds in the short- or long-term following the closing of the Transaction (the “Closing”); |
| | • | | Information regarding risk management functions at Morgan Stanley and its affiliates, including how existing risk management protocols and procedures may impact the Funds and/or the businesses of the Advisers and their affiliates, including the Affiliated Sub-Advisers, as they relate to the Funds; |
| | • | | Information on the anticipated benefits of the Transaction to the Funds with respect to potential additional distribution capabilities and the ability to access new markets and customer segments through Morgan Stanley’s distribution network, including, in particular, its institutional client base; |
| | • | | Information regarding the financial condition and reputation of Morgan Stanley, its worldwide presence, experience as a fund sponsor and manager, commitment to maintain a high level of cooperation with, and support to, the Funds, strong client service capabilities, and relationships in the asset management industry; |
Information about the New Agreements for Funds
| | • | | A representation that, after the Closing, all of the Funds will continue to be advised by their current Adviser and Sub-Adviser, as applicable; |
| | • | | Information regarding the terms of the New Agreements, including certain changes as compared to the current investment advisory agreement between each Fund and its Adviser (collectively, the “Current Advisory Agreements”) and, as applicable, the current investment sub-advisory agreement between a Fund and a Sub-Adviser (together with the Current Advisory Agreements, the “Current Agreements”); |
| | • | | Information confirming that the fee rates payable under the New Agreements are not changed as compared to the Current Agreements; |
| | • | | A representation that the New Agreements will not cause any diminution in the nature, extent and quality of services provided by the Advisers and the Sub-Advisers to the Funds and their respective shareholders, including with respect to compliance and other non-advisory services; |
Information about Fund Performance, Fees and Expenses
| | • | | A report from an independent data provider comparing the investment performance of each Fund (including, as relevant, total return data, income data, Sharpe ratios and information ratios) to the investment performance of comparable funds and, as applicable, benchmark indices, over various time periods as of the 2020 Annual Approval Process, as well as performance information as of a more recent date; |
| | • | | A report from an independent data provider comparing each Fund’s total expense ratio (and its components) to those of comparable funds as of the 2020 Annual Approval Process, as well as fee and expense information as of a more recent date; |
| | • | | In certain instances, data regarding investment performance relative to customized groups of peer funds and blended indices identified by the Advisers in consultation with the Portfolio Management Committee of the Board as of the 2020 Annual Approval Process, as well as corresponding performance information as of a more recent date; |
| | • | | Comparative information concerning the fees charged and services provided by the Adviser and the Sub-Adviser to each Fund in managing other accounts (which may include other mutual funds, collective investment funds and institutional accounts) using investment strategies and techniques similar to those used in managing such Fund(s), if any; |
| | • | | Profitability analyses of the Advisers and the Affiliated Sub-Advisers, as applicable, with respect to each of the Funds as of the 2020 Annual Approval Process, as well as information regarding the impact of the Transaction on profitability; |
Parametric
International Equity Fund
January 31, 2021
Board of Trustees’ Contract Approval — continued
Information about Portfolio Management and Trading
| | • | | Descriptions of the investment management services currently provided and expected to be provided to each Fund after the Transaction, as well as each of the Funds’ investment strategies and policies; |
| | • | | The procedures and processes used to determine the fair value of Fund assets, when necessary, and actions taken to monitor and test the effectiveness of such procedures and processes; |
| | • | | Information about any changes to the policies and practices of the Advisers and, as applicable, each Fund’s Sub-Adviser with respect to trading, including their processes for seeking best execution of portfolio transactions; |
| | • | | Information regarding the impact on trading and access to capital markets associated with the Funds’ affiliations with Morgan Stanley and its affiliates, including potential restrictions with respect to the Funds’ ability to execute portfolio transactions with Morgan Stanley and its affiliates; |
Information about the Advisers and the Sub-Advisers
| | • | | Information about the financial results and condition of the Advisers and the Affiliated Sub-Advisers since the culmination of the 2020 Annual Approval Process and any material changes in financial condition that are reasonably expected to occur before and after the Closing; |
| | • | | Information regarding contemplated changes to the individual investment professionals whose responsibilities include portfolio management and investment research for the Funds, and, for portfolio managers and certain other investment professionals, information relating to their responsibilities with respect to managing other mutual funds and investment accounts, as applicable, post-Closing; |
| | • | | The Code of Ethics of the Advisers and their affiliates, including the Affiliated Sub-Advisers, together with information relating to compliance with, and the administration of, such codes; |
| | • | | Policies and procedures relating to proxy voting and the handling of corporate actions and class actions; |
| | • | | Information concerning the resources devoted to compliance efforts undertaken by the Advisers and their affiliates, including the Affiliated Sub-Advisers, including descriptions of their various compliance programs and their record of compliance; |
| | • | | Information concerning the business continuity and disaster recovery plans of the Advisers and their affiliates, including the Affiliated Sub-Advisers; |
| | • | | A description of the Advisers’ oversight of the Sub-Advisers, including with respect to regulatory and compliance issues, investment management and other matters; |
Other Relevant Information
| | • | | Information concerning the nature, cost and character of the administrative and other non-investment advisory services provided by the Advisers and their affiliates; |
| | • | | Information concerning oversight of the relationship with the custodian, subcustodians and fund accountants by EVM and/or administrator to each of the Funds; |
| | • | | Confirmation that the Advisers intend to continue to manage the Funds in a manner materially consistent with each Fund’s current investment objective(s) and principal investment strategies; |
| | • | | Information regarding Morgan Stanley’s commitment to maintaining competitive compensation arrangements to attract and retain highly qualified personnel; |
| | • | | Confirmation that the Advisers’ current senior management teams have indicated their strong support of the Transaction; and |
| | • | | Information regarding the fact that Morgan Stanley and Eaton Vance Corp. will each derive benefits from the Transaction and that, as a result, they have a financial interest in the matters that were being considered. |
As indicated above, the Board and its Contract Review Committee also considered information received at its regularly scheduled meetings throughout the year, which included information from portfolio managers and other investment professionals of the Advisers and the Sub-Advisers regarding investment and performance matters, and considered various investment and trading strategies used in pursuing the Funds’ investment objectives. The Board also received information regarding risk management techniques employed in connection with the management of the Funds. The Board and its committees evaluated issues pertaining to industry and regulatory developments, compliance procedures, fund governance and other issues with respect to the Funds, and received and participated in reports and presentations provided by the Advisers and their affiliates, including the Affiliated Sub-Advisers, with respect to such matters.
The Contract Review Committee was advised throughout the evaluation process by Goodwin Procter LLP, independent legal counsel for the Independent Trustees. The members of the Contract Review Committee, with the advice of such counsel, exercised their own business judgment in determining the material factors to be considered in evaluating the New Agreements and the weight to be given to each such factor. The conclusions reached with respect to the New Agreements were based on a comprehensive evaluation of all the information provided and not any single factor. Moreover, each Independent Trustee may have placed varying emphasis on particular factors in reaching conclusions with respect to the New Agreements.
Nature, Extent and Quality of Services
In considering whether to approve the New Agreements, the Board evaluated the nature, extent and quality of services currently provided to each Fund by the Advisers and, as applicable, the Sub-Advisers under the Current Agreements. In evaluating the nature, extent and quality of services to be provided by
Parametric
International Equity Fund
January 31, 2021
Board of Trustees’ Contract Approval — continued
the Advisers and the Sub-Advisers under the New Agreements, the Board considered, among other information, the expected impact, if any, of the Transaction on the operations, facilities, organization and personnel of the Advisers and the Sub-Advisers, and that Morgan Stanley and the Advisers have advised the Board that, following the Transaction, there is not expected to be any diminution in the nature, extent and quality of services provided by the Advisers and the Sub-Advisers, as applicable, to the Funds and their shareholders, including compliance and other non-advisory services, and that there are not expected to be any changes in portfolio management personnel as a result of the Transaction.
The Board also considered the financial resources of Morgan Stanley and the Advisers and the importance of having a Fund manager with, or with access to, significant organizational and financial resources. The Board considered the benefits to the Funds of being part of a larger combined organization with greater financial resources following the Transaction, particularly during periods of market disruptions and volatility. In this regard, the Board considered information provided by Morgan Stanley regarding its business and operating structure, scale of operation, leadership and reputation, distribution capabilities, and financial condition, as well as information on how the Funds are expected to fit within Morgan Stanley’s overall business strategy and any changes that Morgan Stanley contemplates in the short- or long-term following the Closing. The Board also noted Morgan Stanley’s and the Advisers’ commitment to keep the Board apprised of developments with respect to its long-term integration plans for the Advisers, the Affiliated Sub-Advisers, and existing Morgan Stanley affiliates and their respective personnel.
The Board considered the Advisers’ and the Sub-Advisers’ management capabilities and investment processes in light of the types of investments held by each Fund, including the education, experience and number of investment professionals and other personnel who provide portfolio management, investment research, and similar services to each Fund. In particular, the Board considered the abilities and experience of the Advisers’ and, as applicable, the Sub-Advisers’ investment professionals in implementing each Fund’s investment strategies. The Board also took into account the resources dedicated to portfolio management and other services, the compensation methods of the Advisers and other factors, including the reputation and resources of the Advisers to recruit and retain highly qualified research, advisory and supervisory investment professionals. With respect to the recruitment and retention of key personnel, the Board noted information from Morgan Stanley and the Advisers regarding the benefits of joining Morgan Stanley. In addition, the Board considered the time and attention devoted to the Funds by senior management, as well as the infrastructure, operational capabilities and support staff in place to assist in the portfolio management and operations of the Funds, including the provision of administrative services. With respect to the foregoing, the Board also considered information from the Advisers and Morgan Stanley regarding the anticipated impact of the Transaction on such matters. The Board also considered the business-related and other risks to which the Advisers or their affiliates may be subject in managing the Funds and in connection with the Transaction.
The Board considered the compliance programs of the Advisers and relevant affiliates thereof, including the Affiliated Sub-Advisers. The Board considered compliance and reporting matters regarding, among other things, personal trading by investment professionals, disclosure of portfolio holdings, late trading, frequent trading, portfolio valuation, business continuity and the allocation of investment opportunities. The Board also considered the responses of the Advisers and their affiliates to requests in recent years from regulatory authorities, such as the Securities and Exchange Commission and the Financial Industry Regulatory Authority. The Board also considered certain information relating to the compliance record of Morgan Stanley and its affiliates, including information requests in recent years from regulatory authorities. With respect to the foregoing, including the compliance programs of the Advisers and the Sub-Advisers, the Board noted information regarding the impacts of the Transaction, as well as the Advisers’ and Morgan Stanley’s commitment to keep the Board apprised of developments with respect to its long-term integration plans for the Advisers, the Affiliated Sub-Advisers and existing Morgan Stanley affiliates and their respective personnel.
The Board considered other administrative services provided and to be provided or overseen by the Advisers and their affiliates, including transfer agency and accounting services. The Board evaluated the benefits to shareholders of investing in a fund that is a part of a large fund complex offering exposure to a variety of asset classes and investment disciplines, as well as the ability, in many cases, to exchange an investment among different funds without incurring additional sales charges. The Board noted information that the Transaction was not expected to have any material impact on such matters in the near-term.
In evaluating the nature, extent and quality of the services to be provided under the New Agreements, the Board also considered investment performance information provided for each Fund in connection with the 2020 Annual Approval Process, as well as information provided as of a more recent date. In this regard, the Board compared each Fund’s investment performance to that of comparable funds identified by an independent data provider (the peer group), as well as appropriate benchmark indices and, for certain Funds, a custom peer group of similarly managed funds. The Board also considered, where applicable, Fund-specific performance explanations based on criteria established by the Board in connection with the 2020 Annual Approval Process and, where applicable, performance explanations as of a more recent date. In addition to the foregoing information, it was also noted that the Board has received and discussed with management information throughout the year at periodic intervals comparing each Fund’s performance against applicable benchmark indices and peer groups. In addition, the Board considered each Fund’s performance in light of overall financial market conditions. Where a Fund’s relative underperformance to its peers was significant during one or more specified periods, the Board noted the explanation from the applicable Adviser concerning the Fund’s relative performance versus its peer group.
After consideration of the foregoing factors, among others, and based on their review of the materials provided and the assurances received from, and recommendations of, the Advisers and Morgan Stanley, the Board determined that the Transaction was not expected to adversely affect the nature, extent and quality of services provided to the Funds by the Advisers and their affiliates, including the Affiliated Sub-Advisers, and that the Transaction was not expected to have an adverse effect on the ability of the Advisers and their affiliates, including the Affiliated Sub-Advisers, to provide those services. The
Parametric
International Equity Fund
January 31, 2021
Board of Trustees’ Contract Approval — continued
Board concluded that the nature, extent and quality of services expected to be provided by the Advisers and the Sub-Advisers, taken as a whole, are appropriate and expected to be consistent with the terms of the New Agreements.
Management Fees and Expenses
The Board considered contractual fee rates payable by each Fund for advisory and administrative services (referred to collectively as “management fees”) in connection with the 2020 Annual Approval Process, as well as information provided as of a more recent date. As part of its review, the Board considered each Fund’s management fees and total expense ratio over various periods, as compared to those of comparable funds, before and after giving effect to any undertaking to waive fees or reimburse expenses. The Board also considered factors, and, where applicable, certain Fund-specific factors, that had an impact on a Fund’s total expense ratio relative to comparable funds, as identified by the Advisers in response to inquiries from the Contract Review Committee. The Board considered that the New Agreements do not change a Fund’s management fee rate or the computation method for calculating such fees, including any separately executed permanent contractual management fee reduction currently in place for the Fund.
The Board also received and considered, where applicable, information about the services offered and the fee rates charged by the Advisers and the Sub-Advisers to other types of accounts with investment objectives and strategies that are substantially similar to and/or managed in a similar investment style as a Fund. In this regard, the Board received information about the differences in the nature and scope of services the Advisers and the Sub-Advisers, as applicable, provide to the Funds as compared to other types of accounts and the material differences in compliance, reporting and other legal burdens and risks to the Advisers and such Sub-Advisers as between each Fund and other types of accounts.
After considering the foregoing information, and in light of the nature, extent and quality of the services expected to be provided by the Advisers and the Sub-Advisers, the Board concluded that the management fees charged for advisory and related services are reasonable with respect to its approval of the New Agreements.
Profitability and “Fall-Out” Benefits
During the 2020 Annual Approval Process, the Board considered the level of profits realized by the Advisers and relevant affiliates thereof, including the Affiliated Sub-Advisers, in providing investment advisory and administrative services to the Funds and to all Eaton Vance funds as a group. The Board considered the level of profits realized without regard to marketing support or other payments by the Advisers and their affiliates to third parties in respect of distribution or other services. In light of the foregoing factors and the nature, extent and quality of the services rendered, the profits realized by the Advisers and their affiliates, including the Sub-Advisers, were not deemed to be excessive by the Board.
The Board noted that Morgan Stanley and the Advisers are expected to realize, over time, cost savings from the Transaction based on eliminating duplicate corporate overhead expenses. The Board considered, however, information from the Advisers and Morgan Stanley that such cost savings are not expected to be realized immediately upon the Closing and that, accordingly, there are currently no specific expected changes in the levels of profitability associated with the advisory and other services provided to the Funds that are contemplated as a result of the Transaction. The Board noted that it will continue to receive information regarding profitability during its annual contract review processes, including the extent to which cost savings and/or other efficiencies result in changes to profitability levels.
The Board also considered direct or indirect fall-out benefits received by the Advisers and their affiliates, including the Affiliated Sub-Advisers, in connection with their respective relationships with the Funds, including the benefits of research services that may be available to the Advisers and their affiliates as a result of securities transactions effected for the Funds and other investment advisory clients. In evaluating the fall-out benefits to be received by the Advisers and their affiliates under the New Agreements, the Board considered whether the Transaction would have an impact on the fall-out benefits currently realized by the Advisers and their affiliates in connection with services provided pursuant to the Current Advisory Agreements.
The Board of each Fund considered that Morgan Stanley may derive reputational and other benefits from its ability to use the names of the Advisers and their affiliates in connection with operating and marketing the Funds. The Board considered that the Transaction, if completed, would significantly increase Morgan Stanley’s assets under management and expand Morgan Stanley’s investment capabilities.
Economies of Scale
The Board also considered the extent to which the Advisers and their affiliates, on the one hand, and the Funds, on the other hand, can expect to realize benefits from economies of scale as the assets of the Funds increase. The Board acknowledged the difficulty in accurately measuring the benefits resulting from economies of scale, if any, with respect to the management of any specific Fund or group of funds. As part of the 2020 Annual Approval Process, the Board reviewed data summarizing the increases and decreases in the assets of the Funds and of all Eaton Vance funds as a group over various time periods, and evaluated the extent to which the total expense ratio of each Fund and the profitability of the Advisers and their affiliates may have been affected by such increases or decreases.
The Board noted that Morgan Stanley and the Advisers are expected to benefit from possible growth of the Funds resulting from enhanced distribution capabilities, including with respect to the Funds’ potential access to Morgan Stanley’s institutional client base. Based upon the foregoing, the Board
Parametric
International Equity Fund
January 31, 2021
Board of Trustees’ Contract Approval — continued
concluded that the Funds currently share in the benefits from economies of scale, if any, when they are realized by the Advisers, and that the Transaction is not expected to impede a Fund from continuing to benefit from any future economies of scale realized by its Adviser.
Conclusion
Based on its consideration of the foregoing, and such other information it deemed relevant, including the factors and conclusions described above, the Contract Review Committee recommended to the Board approval of the New Agreements. Based on the recommendation of the Contract Review Committee, the Board, including a majority of the Independent Trustees, unanimously voted to approve the New Agreements for the Funds and recommended that shareholders approve the New Agreements.
Parametric
International Equity Fund
January 31, 2021
Management and Organization
Fund Management. The Trustees of Eaton Vance Mutual Funds Trust (the Trust) are responsible for the overall management and supervision of the Trust’s affairs. The Trustees and officers of the Trust are listed below. Except as indicated, each individual has held the office shown or other offices in the same company for the last five years. Trustees and officers of the Trust hold indefinite terms of office. The “noninterested Trustees” consist of those Trustees who are not “interested persons” of the Trust, as that term is defined under the 1940 Act. The business address of each Trustee and officer is Two International Place, Boston, Massachusetts 02110. As used below, “EVC” refers to Eaton Vance Corp., “EV” refers to EV LLC, “EVM” refers to Eaton Vance Management, “BMR” refers to Boston Management and Research and “EVD” refers to Eaton Vance Distributors, Inc. EV is the trustee of each of EVM and BMR. Effective March 1, 2021, each of EVM, BMR, EVD and EV are indirect wholly-owned subsidiaries of Morgan Stanley. Each officer affiliated with EVM may hold a position with other EVM affiliates that is comparable to his or her position with EVM listed below. Each Trustee oversees 139 portfolios (with the exception of Messrs. Faust and Wennerholm and Ms. Frost who oversee 138 portfolios) in the Eaton Vance Complex (including all master and feeder funds in a master feeder structure). Each officer serves as an officer of certain other Eaton Vance funds. Each Trustee and officer serves until his or her successor is elected.
| | | | | | |
| Name and Year of Birth | | Position(s) with the Trust | | Trustee Since(1) | | Principal Occupation(s) and Directorships During Past Five Years and Other Relevant Experience |
|
| Interested Trustee |
| | | |
Thomas E. Faust Jr. 1958 | | Trustee | | 2007 | | Chairman of Morgan Stanley Investment Management, Inc. (MSIM), Manager and President of EV, Chief Executive Officer of EVM and BMR, and Director of EVD. Formerly, Chairman, Chief Executive Officer and President of EVC. Trustee and/or officer of 138 registered investment companies. Mr. Faust is an interested person because of his positions with MSIM, BMR, EVM, EVD, and EV, which are affiliates of the Trust, and his former position with EVC, which was an affiliate of the Trust prior to March 1, 2021. Directorships in the Last Five Years. Formerly, Director of EVC (2007-2021) and Hexavest Inc. (2012-2021) (investment management firm). |
|
| Noninterested Trustees |
| | | |
Mark R. Fetting 1954 | | Trustee | | 2016 | | Private investor. Formerly held various positions at Legg Mason, Inc. (investment management firm) (2000-2012), including President, Chief Executive Officer, Director and Chairman (2008-2012), Senior Executive Vice President (2004-2008) and Executive Vice President (2001-2004). Formerly, President of Legg Mason family of funds (2001-2008). Formerly, Division President and Senior Officer of Prudential Financial Group, Inc. and related companies (investment management firm) (1991-2000). Other Directorships in the Last Five Years. None. |
| | | |
Cynthia E. Frost 1961 | | Trustee | | 2014 | | Private investor. Formerly, Chief Investment Officer of Brown University (university endowment) (2000-2012). Formerly, Portfolio Strategist for Duke Management Company (university endowment manager) (1995-2000). Formerly, Managing Director, Cambridge Associates (investment consulting company) (1989-1995). Formerly, Consultant, Bain and Company (management consulting firm) (1987-1989). Formerly, Senior Equity Analyst, BA Investment Management Company (1983-1985). Other Directorships in the Last Five Years. None. |
| | | |
George J. Gorman 1952 | | Vice-Chairperson of the Board and Trustee | | 2021 (Vice-Chairperson) 2014 (Trustee) | | Principal at George J. Gorman LLC (consulting firm). Formerly, Senior Partner at Ernst & Young LLP (a registered public accounting firm) (1974-2009). Other Directorships in the Last Five Years. None. |
| | | |
Valerie A. Mosley 1960 | | Trustee | | 2014 | | Chairwoman and Chief Executive Officer of Valmo Ventures (a consulting and investment firm). Founder of Upward Wealth, Inc., dba BrightUP, a fintech platform. Formerly, Partner and Senior Vice President, Portfolio Manager and Investment Strategist at Wellington Management Company, LLP (investment management firm) (1992-2012). Formerly, Chief Investment Officer, PG Corbin Asset Management (1990-1992). Formerly worked in institutional corporate bond sales at Kidder Peabody (1986-1990). Other Directorships in the Last Five Years. Director of DraftKings, Inc. (digital sports entertainment and gaming company) (since September 2020). Director of Groupon, Inc. (e-commerce provider) (since April 2020). Director of Envestnet, Inc. (provider of intelligent systems for wealth management and financial wellness) (since 2018). Formerly, Director of Dynex Capital, Inc. (mortgage REIT) (2013-2020). |
Parametric
International Equity Fund
January 31, 2021
Management and Organization — continued
| | | | | | |
| Name and Year of Birth | | Position(s) with the Trust | | Trustee Since(1) | | Principal Occupation(s) and Directorships During Past Five Years and Other Relevant Experience |
|
| Noninterested Trustees (continued) |
| | | |
William H. Park 1947 | | Chairperson of the Board and Trustee | | 2016 (Chairperson) 2003 (Trustee) | | Private investor. Formerly, Consultant (management and transactional) (2012-2014). Formerly, Chief Financial Officer, Aveon Group L.P. (investment management firm) (2010-2011). Formerly, Vice Chairman, Commercial Industrial Finance Corp. (specialty finance company) (2006-2010). Formerly, President and Chief Executive Officer, Prizm Capital Management, LLC (investment management firm) (2002-2005). Formerly, Executive Vice President and Chief Financial Officer, United Asset Management Corporation (investment management firm) (1982-2001). Formerly, Senior Manager, Price Waterhouse (now PricewaterhouseCoopers) (a registered public accounting firm) (1972-1981). Other Directorships in the Last Five Years. None. |
| | | |
Helen Frame Peters 1948 | | Trustee | | 2008 | | Professor of Finance, Carroll School of Management, Boston College. Formerly, Dean, Carroll School of Management, Boston College (2000-2002). Formerly, Chief Investment Officer, Fixed Income, Scudder Kemper Investments (investment management firm) (1998-1999). Formerly, Chief Investment Officer, Equity and Fixed Income, Colonial Management Associates (investment management firm) (1991-1998). Other Directorships in the Last Five Years. None. |
| | | |
Keith Quinton 1958 | | Trustee | | 2018 | | Private investor, researcher and lecturer. Independent Investment Committee Member at New Hampshire Retirement System (since 2017). Formerly, Portfolio Manager and Senior Quantitative Analyst at Fidelity Investments (investment management firm) (2001-2014). Other Directorships in the Last Five Years. Director (since 2016) and Chairman (since 2019) of New Hampshire Municipal Bond Bank. |
| | | |
Marcus L. Smith 1966 | | Trustee | | 2018 | | Private investor. Member of Posse Boston Advisory Board (foundation) (since 2015). Formerly, Portfolio Manager at MFS Investment Management (investment management firm) (1994-2017). Other Directorships in the Last Five Years. Director of First Industrial Realty Trust, Inc. (an industrial REIT) (since 2021). Director of MSCI Inc. (global provider of investment decision support tools) (since 2017). Formerly, Director of DCT Industrial Trust Inc. (logistics real estate company) (2017-2018). |
| | | |
Susan J. Sutherland 1957 | | Trustee | | 2015 | | Private investor. Director of Ascot Group Limited and certain of its subsidiaries (insurance and reinsurance) (since 2017). Formerly, Director of Hagerty Holding Corp. (insurance and reinsurance) (2015-2018). Formerly, Associate, Counsel and Partner at Skadden, Arps, Slate, Meagher & Flom LLP (law firm) (1982-2013). Other Directorships in the Last Five Years. Director of Kairos Acquisition Corp. (insurance/InsurTech acquisition company) (since 2021). |
| | | |
Scott E. Wennerholm 1959 | | Trustee | | 2016 | | Private investor. Formerly, Trustee at Wheelock College (postsecondary institution) (2012-2018). Formerly, Consultant at GF Parish Group (executive recruiting firm) (2016-2017). Formerly, Chief Operating Officer and Executive Vice President at BNY Mellon Asset Management (investment management firm) (2005-2011). Formerly, Chief Operating Officer and Chief Financial Officer at Natixis Global Asset Management (investment management firm) (1997-2004). Formerly, Vice President at Fidelity Investments Institutional Services (investment management firm) (1994-1997). Other Directorships in the Last Five Years. None. |
Parametric
International Equity Fund
January 31, 2021
Management and Organization — continued
| | | | | | |
| Name and Year of Birth | | Position(s) with the Trust | | Officer Since(2) | | Principal Occupation(s) During Past Five Years |
|
| Principal Officers who are not Trustees |
| | | |
Eric A. Stein 1980 | | President | | 2020 | | Vice President and Chief Investment Officer, Fixed Income of EVM and BMR. Prior to November 1, 2020, Mr. Stein was a co-Director of Eaton Vance’s Global Income Investments. Also Vice President of Calvert Research and Management (“CRM”). |
| | | |
Deidre E. Walsh 1971 | | Vice President | | 2009 | | Vice President of EVM and BMR. |
| | | |
Maureen A. Gemma 1960 | | Secretary and Chief Legal Officer | | 2005 | | Vice President of EVM and BMR. Also Vice President of CRM. |
| | | |
James F. Kirchner 1967 | | Treasurer | | 2007 | | Vice President of EVM and BMR. Also Vice President of CRM. |
| | | |
Richard F. Froio 1968 | | Chief Compliance Officer | | 2017 | | Vice President of EVM and BMR since 2017. Formerly, Deputy Chief Compliance Officer (Adviser/Funds) and Chief Compliance Officer (Distribution) at PIMCO (2012-2017) and Managing Director at BlackRock/Barclays Global Investors (2009-2012). |
| (1) | Year first appointed to serve as Trustee for a fund in the Eaton Vance family of funds. Each Trustee has served continuously since appointment unless indicated otherwise. |
| (2) | Year first elected to serve as officer of a fund in the Eaton Vance family of funds when the officer has served continuously. Otherwise, year of most recent election as an officer of a fund in the Eaton Vance family of funds. Titles may have changed since initial election. |
The SAI for the Fund includes additional information about the Trustees and officers of the Fund and can be obtained without charge on Eaton Vance’s website at www.eatonvance.com or by calling 1-800-260-0761.
Eaton Vance Funds
IMPORTANT NOTICES
Privacy. The Eaton Vance organization is committed to ensuring your financial privacy. Each entity listed below has adopted privacy policy and procedures (“Privacy Program”) Eaton Vance believes is reasonably designed to protect your personal information and to govern when and with whom Eaton Vance may share your personal information.
| • | | At the time of opening an account, Eaton Vance generally requires you to provide us with certain information such as name, address, social security number, tax status, account numbers, and account balances. This information is necessary for us to both open an account for you and to allow us to satisfy legal requirements such as applicable anti-money laundering reviews and know-your-customer requirements. |
| • | | On an ongoing basis, in the normal course of servicing your account, Eaton Vance may share your information with unaffiliated third parties that perform various services for Eaton Vance and/or your account. These third parties include transfer agents, custodians, broker/dealers and our professional advisers including auditors, accountants, and legal counsel. Eaton Vance may share your personal information with our affiliates. Eaton Vance may also share your information as required or permitted by applicable law. |
| • | | We have adopted a Privacy Program we believe is reasonably designed to protect the confidentiality of your personal information and to prevent unauthorized access to your information. |
| • | | We reserve the right to change our Privacy Program at any time upon proper notification to you. You may want to review our Privacy Program periodically for changes by accessing the link on our homepage: www.eatonvance.com. |
Our pledge of protecting your personal information applies to the following entities within the Eaton Vance organization: the Eaton Vance Family of Funds, Eaton Vance Management, Eaton Vance WaterOak Advisors, Eaton Vance Distributors, Inc., Eaton Vance Trust Company, Eaton Vance Management (International) Limited, Eaton Vance Advisers International Ltd., Eaton Vance Global Advisors Limited, Eaton Vance Management’s Real Estate Investment Group, Boston Management and Research, Calvert Research and Management, and Calvert Funds. This notice supersedes all previously issued privacy disclosures. For more information about Eaton Vance’s Privacy Program or about how your personal information may be used, please call 1-800-262-1122.
Delivery of Shareholder Documents. The Securities and Exchange Commission (SEC) permits funds to deliver only one copy of shareholder documents, including prospectuses, proxy statements and shareholder reports, to fund investors with multiple accounts at the same residential or post office box address. This practice is often called “householding” and it helps eliminate duplicate mailings to shareholders. Eaton Vance, or your financial intermediary, may household the mailing of your documents indefinitely unless you instruct Eaton Vance, or your financial intermediary, otherwise. If you would prefer that your Eaton Vance documents not be householded, please contact Eaton Vance at 1-800-260-0761, or contact your financial intermediary. Your instructions that householding not apply to delivery of your Eaton Vance documents will typically be effective within 30 days of receipt by Eaton Vance or your financial intermediary.
Portfolio Holdings. Each Eaton Vance Fund and its underlying Portfolio(s) (if applicable) files a schedule of portfolio holdings on Part F to Form N-PORT with the SEC. Certain information filed on Form N-PORT may be viewed on the Eaton Vance website at www.eatonvance.com, by calling Eaton Vance at 1-800-260-0761 or in the EDGAR database on the SEC’s website at www.sec.gov.
Proxy Voting. From time to time, funds are required to vote proxies related to the securities held by the funds. The Eaton Vance Funds or their underlying Portfolios (if applicable) vote proxies according to a set of policies and procedures approved by the Funds’ and Portfolios’ Boards. You may obtain a description of these policies and procedures and information on how the Funds or Portfolios voted proxies relating to portfolio securities during the most recent 12-month period ended June 30, without charge, upon request, by calling 1-800-260-0761 and by accessing the SEC’s website at www.sec.gov.
This Page Intentionally Left Blank
Investment Adviser and Administrator
Eaton Vance Management
Two International Place
Boston, MA 02110
Investment Sub-Adviser
Parametric Portfolio Associates LLC
800 Fifth Avenue, Suite 2800
Seattle, WA 98104
Principal Underwriter*
Eaton Vance Distributors, Inc.
Two International Place
Boston, MA 02110
(617) 482-8260
Custodian
State Street Bank and Trust Company
State Street Financial Center, One Lincoln Street
Boston, MA 02111
Transfer Agent
BNY Mellon Investment Servicing (US) Inc.
Attn: Eaton Vance Funds
P.O. Box 9653
Providence, RI 02940-9653
(800) 260-0761
Independent Registered Public Accounting Firm
Deloitte & Touche LLP
200 Berkeley Street
Boston, MA 02116-5022
Fund Offices
Two International Place
Boston, MA 02110
| * | FINRA BrokerCheck. Investors may check the background of their Investment Professional by contacting the Financial Industry Regulatory Authority (FINRA). FINRA BrokerCheck is a free tool to help investors check the professional background of current and former FINRA-registered securities firms and brokers. FINRA BrokerCheck is available by calling 1-800-289-9999 and at www.FINRA.org. The FINRA BrokerCheck brochure describing this program is available to investors at www.FINRA.org. |

4736 1.31.21

Parametric
Volatility Risk Premium - Defensive Fund
Annual Report
January 31, 2021

Commodity Futures Trading Commission Registration. The Commodity Futures Trading Commission (“CFTC”) has adopted regulations that subject registered investment companies and advisers to regulation by the CFTC if a fund invests more than a prescribed level of its assets in certain CFTC-regulated instruments (including futures, certain options and swap agreements) or markets itself as providing investment exposure to such instruments. The investment adviser has claimed an exclusion from the definition of “commodity pool operator” under the Commodity Exchange Act with respect to its management of the Fund. Accordingly, neither the Fund nor the adviser with respect to the operation of the Fund is subject to CFTC regulation. Because of its management of other strategies, the Fund’s adviser and Parametric Portfolio Associates LLC (Parametric), sub-adviser to the Fund, are registered with the CFTC as commodity pool operators. The adviser and Parametric are also registered as commodity trading advisors.
Fund shares are not insured by the FDIC and are not deposits or other obligations of, or guaranteed by, any depository institution. Shares are subject to investment risks, including possible loss of principal invested.
This report must be preceded or accompanied by a current summary prospectus or prospectus. Before investing, investors should consider carefully the investment objective, risks, and charges and expenses of a mutual fund. This and other important information is contained in the summary prospectus and prospectus, which can be obtained from a financial intermediary. Prospective investors should read the prospectus carefully before investing. For further information, please call 1-800-260-0761.
Annual Report January 31, 2021
Parametric
Volatility Risk Premium - Defensive Fund
Parametric
Volatility Risk Premium - Defensive Fund
January 31, 2021
Management’s Discussion of Fund Performance1
Economic and Market Conditions
For the 12-month period ended January 31, 2021, amid a pandemic driving the swiftest equity drawdown in stock market history — at one point dropping 34% in 23 trading days — the S&P 500® Index subsequently set an all-time high, closing the entire period up 17.25%. Nearly all risk assets exhibited rebounds that erased drawdowns that had occurred during the first quarter of 2020. This volatile time frame highlighted the disconnect between Wall Street and Main Street as economic data was dismal and daily COVID-19 cases grew to pandemic levels.
The U.S. Federal Reserve’s easing monetary policies entered uncharted territory in 2020 in response to the economic downturn as America’s central bank expanded its balance sheet to over $7 trillion. Against that backdrop, U.S. 10-Year Treasurys traded below 0.5% in March, before closing the period at approximately 1%. After widening sharply during the first-quarter chaos, credit spreads declined back to pre-pandemic levels by period-end.
While many option portfolios suffered sharp losses during the first quarter of 2020, options pricing countered with the fastest increase ever. The Cboe Volatility Index® set an all-time high at 82.69 during the period, and remained well above long-term averages throughout the period, despite the swift equity recovery.
Fund Performance
For the 12-month period ended January 31, 2021, Parametric Volatility Risk Premium — Defensive Fund (the Fund) returned 4.73% for Institutional Class shares at net asset value (NAV), outperforming its primary benchmark, the Cboe S&P 500 BuyWrite IndexSM (the Index), which returned –1.54%. The Fund underperformed its secondary benchmark — a blended benchmark consisting of 50% S&P 500® Index/50% ICE BofA 3-Month U.S. Treasury Bill Index (the Secondary Index) — which returned 9.46% during the period. The Index is a passive covered call-writing index.
The Fund pursues its objective by investing in a base portfolio generally composed of an approximately equal mix of equity securities and money market instruments, such as Treasury bills. The Fund writes (sells) call and put options on the S&P 500® Index, a broad-based U.S. stock market index, or a substitute for the S&P 500® Index. The written call and put options are intended to harvest the volatility risk premium (VRP). The VRP is the difference between implied volatility and subsequent realized volatility, and is historically positive and uncorrelated with other sources of returns.
The long equity securities held in the Fund are passively managed to reflect the S&P 500® Index, but actively managed to maximize after-tax results. Sampling techniques are used to help mitigate the tax impact on investors, and no capital gains were distributed to Fund investors in 2020. For the period, equities contributed 9.96% to total Fund returns. Treasury bills and cash equivalents contributed approximately 0.49%. Net option returns for written call and put options detracted 4.38% from Fund returns during the period.
See Endnotes and Additional Disclosures in this report.
Past performance is no guarantee of future results. Returns are historical and are calculated by determining the percentage change in net asset value (NAV) or offering price (as applicable) with all distributions reinvested. Investment return and principal value will fluctuate so that shares, when redeemed, may be worth more or less than their original cost. Performance for periods less than or equal to one year is cumulative. Performance is for the stated time period only; due to market volatility, current Fund performance may be lower or higher than the quoted return. For performance as of the most recent month-end, please refer to eatonvance.com.
Parametric
Volatility Risk Premium - Defensive Fund
January 31, 2021
Performance2,3
Portfolio Managers Thomas C. Seto, Thomas B. Lee, CFA and Jay Strohmaier, CFA, each of Parametric Portfolio Associates LLC
| | | | | | | | | | | | | | | | | | | | |
| % Average Annual Total Returns | | Class
Inception Date | | | Performance
Inception Date | | | One Year | | | Five Years | | | Since
Inception | |
| | | | | |
Institutional Class at NAV | | | 02/09/2017 | | | | 02/09/2017 | | | | 4.73 | % | | | — | | | | 6.57 | % |
|
| |
| | | | | |
Cboe S&P 500 BuyWrite IndexSM | | | — | | | | — | | | | –1.54 | % | | | 6.26 | % | | | 4.18 | % |
S&P 500® Index | | | — | | | | — | | | | 17.25 | | | | 16.14 | | | | 14.91 | |
ICE BofA 3-Month U.S. Treasury Bill Index | | | — | | | | — | | | | 0.54 | | | | 1.20 | | | | 1.41 | |
Blended Index | | | — | | | | — | | | | 9.46 | | | | 8.75 | | | | 8.33 | |
| | | | | |
| % Total Annual Operating Expense Ratio4 | | | | | | | | | | | | | | Institutional
Class | |
| | | | | |
| | | | | | | | | | | | | | | | | | | 0.48 | % |
Growth of $50,000
This graph shows the change in value of a hypothetical investment of $50,000 in Institutional Class of the Fund for the period indicated. For comparison, the same investment is shown in the indicated index.
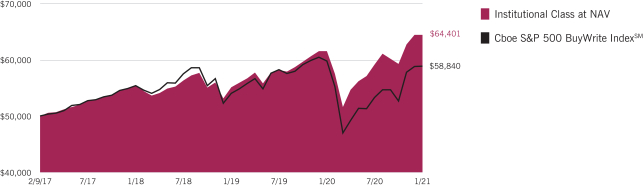
See Endnotes and Additional Disclosures in this report.
Past performance is no guarantee of future results. Returns are historical and are calculated by determining the percentage change in net asset value (NAV) or offering price (as applicable) with all distributions reinvested. Investment return and principal value will fluctuate so that shares, when redeemed, may be worth more or less than their original cost. Performance for periods less than or equal to one year is cumulative. Performance is for the stated time period only; due to market volatility, current Fund performance may be lower or higher than the quoted return. For performance as of the most recent month-end, please refer to eatonvance.com.
Parametric
Volatility Risk Premium - Defensive Fund
January 31, 2021
Fund Profile
Common Stock Sector Allocation (% of net assets)
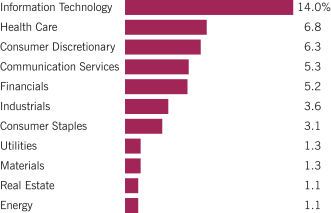
Asset Allocation (% of total investments)
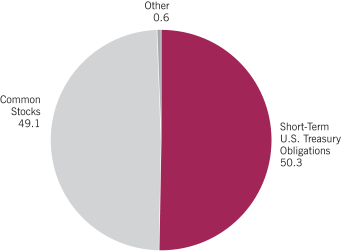
Top 10 Holdings (% of net assets)5
| | | | |
Apple, Inc. | | | 3.5 | % |
| |
Microsoft Corp. | | | 2.9 | |
| |
Amazon.com, Inc. | | | 2.2 | |
| |
Facebook, Inc., Class A | | | 1.1 | |
| |
Alphabet, Inc., Class C | | | 0.9 | |
| |
Alphabet, Inc., Class A | | | 0.9 | |
| |
Tesla, Inc. | | | 0.9 | |
| |
Berkshire Hathaway, Inc., Class B | | | 0.8 | |
| |
Johnson & Johnson | | | 0.8 | |
| |
JPMorgan Chase & Co. | | | 0.7 | |
| |
Total | | | 14.7 | % |
See Endnotes and Additional Disclosures in this report.
Parametric
Volatility Risk Premium - Defensive Fund
January 31, 2021
Endnotes and Additional Disclosures
| 1 | The views expressed in this report are those of the portfolio manager(s) and are current only through the date stated at the top of this page. These views are subject to change at any time based upon market or other conditions, and Eaton Vance and the Fund(s) disclaim any responsibility to update such views. These views may not be relied upon as investment advice and, because investment decisions are based on many factors, may not be relied upon as an indication of trading intent on behalf of any Eaton Vance fund. This commentary may contain statements that are not historical facts, referred to as “forward-looking statements.” The Fund’s actual future results may differ significantly from those stated in any forward-looking statement, depending on factors such as changes in securities or financial markets or general economic conditions, the volume of sales and purchases of Fund shares, the continuation of investment advisory, administrative and service contracts, and other risks discussed from time to time in the Fund’s filings with the Securities and Exchange Commission. |
| 2 | Cboe S&P 500 BuyWrite IndexSM measures the performance of a hypothetical buy-write strategy on the S&P 500® Index. S&P 500® Index is an unmanaged index of large-cap stocks commonly used as a measure of U.S. stock market performance. S&P Dow Jones Indices are a product of S&P Dow Jones Indices LLC (“S&P DJI”) and have been licensed for use. S&P® and S&P 500® are registered trademarks of S&P DJI; Dow Jones® is a registered trademark of Dow Jones Trademark Holdings LLC (“Dow Jones”); S&P DJI, Dow Jones and their respective affiliates do not sponsor, endorse, sell or promote the Fund, will not have any liability with respect thereto and do not have any liability for any errors, omissions, or interruptions of the S&P Dow Jones Indices. ICE BofA 3-Month U.S. Treasury Bill Index is an unmanaged index of U.S. Treasury securities maturing in 90 days. ICE® BofA® indices are not for redistribution or other uses; provided “as is”, without warranties, and with no liability. Eaton Vance has prepared this report and ICE Data Indices, LLC does not endorse it, or guarantee, review, or endorse Eaton Vance’s products. BofA® is a licensed registered trademark of Bank of America Corporation in the United States and other countries. The Blended Index consists of 50% S&P 500® Index and 50% ICE BofA 3-Month U.S. Treasury Bill Index, rebalanced monthly. Unless otherwise stated, index returns do not reflect the effect of any applicable sales charges, commissions, expenses, taxes or leverage, as applicable. It is not possible to invest directly in an index. |
| 3 | Institutional Class shares are offered at net asset value (NAV). Returns are historical and are calculated by determining the percentage change in NAV with all distributions reinvested. Unless otherwise stated, performance does not reflect the deduction of taxes on Fund distributions or redemptions of Fund shares. Performance since inception for an index, if presented, is the performance since the Fund’s or oldest share class’ inception, as applicable. |
| 4 | Source: Fund prospectus. The expense ratio for the current reporting period can be found in the Financial Highlights section of this report. |
| 5 | Depictions do not reflect the Fund’s option positions. Excludes short-term investments. |
Fund profile subject to change due to active management.
Additional Information
Credit spread is the difference in yield between a U.S. Treasury bond and another debt security of the same maturity but different credit quality.
Cboe Volatility Index® tracks the implied volatilities of a wide range of S&P 500® Index options.
Important Notice to Shareholders
Effective April 1, 2021, the portfolio management team for the Fund will be Thomas C. Seto, Thomas B. Lee and Alex Zweber.
Parametric
Volatility Risk Premium - Defensive Fund
January 31, 2021
Fund Expenses
Example: As a Fund shareholder, you incur two types of costs: (1) transaction costs, including sales charges (loads) on purchases and redemption fees (if applicable); and (2) ongoing costs, including management fees; distribution and/or service fees; and other Fund expenses. This Example is intended to help you understand your ongoing costs (in dollars) of Fund investing and to compare these costs with the ongoing costs of investing in other mutual funds. The Example is based on an investment of $1,000 invested at the beginning of the period and held for the entire period (August 1, 2020 – January 31, 2021).
Actual Expenses: The first section of the table below provides information about actual account values and actual expenses. You may use the information in this section, together with the amount you invested, to estimate the expenses that you paid over the period. Simply divide your account value by $1,000 (for example, an $8,600 account value divided by $1,000 = 8.6), then multiply the result by the number in the first section under the heading entitled “Expenses Paid During Period” to estimate the expenses you paid on your account during this period.
Hypothetical Example for Comparison Purposes: The second section of the table below provides information about hypothetical account values and hypothetical expenses based on the actual Fund expense ratio and an assumed rate of return of 5% per year (before expenses), which is not the actual Fund return. The hypothetical account values and expenses may not be used to estimate the actual ending account balance or expenses you paid for the period. You may use this information to compare the ongoing costs of investing in your Fund and other funds. To do so, compare this 5% hypothetical example with the 5% hypothetical examples that appear in the shareholder reports of the other funds.
Please note that the expenses shown in the table are meant to highlight your ongoing costs only and do not reflect any transactional costs, such as sales charges (loads) or redemption fees (if applicable). Therefore, the second section of the table is useful in comparing ongoing costs only, and will not help you determine the relative total costs of owning different funds. In addition, if these transactional costs were included, your costs would be higher.
| | | | | | | | | | | | | | | | |
| | | Beginning
Account Value
(8/1/20) | | | Ending
Account Value
(1/31/21) | | | Expenses Paid
During Period*
(8/1/20 – 1/31/21) | | | Annualized
Expense
Ratio | |
| | | | |
Actual | | | | | | | | | | | | | | | | |
Institutional Class | | $ | 1,000.00 | | | $ | 1,089.30 | | | $ | 2.47 | | | | 0.47 | % |
| | | | | |
Hypothetical | | | | | | | | | | | | | | | | |
(5% return per year before expenses) | | | | | | | | | | | | | | | | |
Institutional Class | | $ | 1,000.00 | | | $ | 1,022.80 | | | $ | 2.39 | | | | 0.47 | % |
| * | Expenses are equal to the Fund’s annualized expense ratio for the indicated Class, multiplied by the average account value over the period, multiplied by 184/366 (to reflect the one-half year period). The Example assumes that the $1,000 was invested at the net asset value per share determined at the close of business on July 31, 2020. |
Parametric
Volatility Risk Premium - Defensive Fund
January 31, 2021
Portfolio of Investments
| | | | | | | | |
| Common Stocks — 49.1% | |
| Security | | Shares | | | Value | |
|
| Aerospace & Defense — 0.5% | |
| | |
Boeing Co. (The) | | | 4,195 | | | $ | 814,627 | |
| | |
Huntington Ingalls Industries, Inc. | | | 7,410 | | | | 1,165,815 | |
| | |
L3Harris Technologies, Inc. | | | 10,720 | | | | 1,838,587 | |
| | |
Raytheon Technologies Corp. | | | 18,120 | | | | 1,209,148 | |
| | |
| | | | | | | $ | 5,028,177 | |
|
| Air Freight & Logistics — 0.2% | |
| | |
Expeditors International of Washington, Inc. | | | 16,774 | | | $ | 1,501,609 | |
| | |
United Parcel Service, Inc., Class B | | | 2,162 | | | | 335,110 | |
| | |
| | | | | | | $ | 1,836,719 | |
|
| Airlines — 0.2% | |
| | |
Alaska Air Group, Inc. | | | 26,965 | | | $ | 1,316,701 | |
| | |
American Airlines Group, Inc.(1) | | | 36,250 | | | | 622,412 | |
| | |
| | | | | | | $ | 1,939,113 | |
|
| Auto Components — 0.1% | |
| | |
BorgWarner, Inc. | | | 31,928 | | | $ | 1,340,657 | |
| | |
| | | | | | | $ | 1,340,657 | |
|
| Automobiles — 0.9% | |
| | |
Tesla, Inc.(2) | | | 11,347 | | | $ | 9,004,185 | |
| | |
| | | | | | | $ | 9,004,185 | |
|
| Banks — 2.1% | |
| | |
Bank of America Corp. | | | 165,149 | | | $ | 4,896,668 | |
| | |
Citigroup, Inc. | | | 43,544 | | | | 2,525,116 | |
| | |
Fifth Third Bancorp | | | 30,206 | | | | 873,859 | |
| | |
Huntington Bancshares, Inc. | | | 62,582 | | | | 827,647 | |
| | |
JPMorgan Chase & Co. | | | 60,078 | | | | 7,730,236 | |
| | |
KeyCorp | | | 90,709 | | | | 1,529,354 | |
| | |
People’s United Financial, Inc. | | | 76,589 | | | | 1,046,206 | |
| | |
Regions Financial Corp. | | | 116,292 | | | | 1,978,127 | |
| | |
Wells Fargo & Co. | | | 25,203 | | | | 753,066 | |
| | |
| | | | | | | $ | 22,160,279 | |
|
| Beverages — 0.9% | |
| | |
Brown-Forman Corp., Class B | | | 12,544 | | | $ | 899,028 | |
| | |
Coca-Cola Co. (The) | | | 80,646 | | | | 3,883,105 | |
| | |
PepsiCo, Inc. | | | 32,236 | | | | 4,402,471 | |
| | |
| | | | | | | $ | 9,184,604 | |
| | | | | | | | |
| Security | | Shares | | | Value | |
|
| Biotechnology — 0.7% | |
| | |
AbbVie, Inc. | | | 41,425 | | | $ | 4,245,234 | |
| | |
Amgen, Inc. | | | 10,840 | | | | 2,617,101 | |
| | |
| | | | | | | $ | 6,862,335 | |
|
| Building Products — 0.2% | |
| | |
A.O. Smith Corp. | | | 17,325 | | | $ | 940,748 | |
| | |
Carrier Global Corp. | | | 30,701 | | | | 1,181,988 | |
| | |
| | | | | | | $ | 2,122,736 | |
|
| Capital Markets — 1.4% | |
| | |
Ameriprise Financial, Inc. | | | 9,372 | | | $ | 1,854,438 | |
| | |
Invesco, Ltd. | | | 106,572 | | | | 2,194,317 | |
| | |
MarketAxess Holdings, Inc. | | | 1,987 | | | | 1,074,490 | |
| | |
Morgan Stanley | | | 51,353 | | | | 3,443,219 | |
| | |
Nasdaq, Inc. | | | 11,516 | | | | 1,557,769 | |
| | |
S&P Global, Inc. | | | 7,673 | | | | 2,432,341 | |
| | |
State Street Corp. | | | 24,132 | | | | 1,689,240 | |
| | |
| | | | | | | $ | 14,245,814 | |
|
| Chemicals — 0.7% | |
| | |
CF Industries Holdings, Inc. | | | 13,525 | | | $ | 559,665 | |
| | |
FMC Corp. | | | 12,940 | | | | 1,401,273 | |
| | |
Linde PLC | | | 13,488 | | | | 3,309,955 | |
| | |
Sherwin-Williams Co. (The) | | | 3,674 | | | | 2,541,673 | |
| | |
| | | | | | | $ | 7,812,566 | |
|
| Commercial Services & Supplies — 0.1% | |
| | |
Republic Services, Inc. | | | 17,069 | | | $ | 1,545,086 | |
| | |
| | | | | | | $ | 1,545,086 | |
|
| Communications Equipment — 0.5% | |
| | |
Arista Networks, Inc.(2) | | | 3,763 | | | $ | 1,157,348 | |
| | |
Cisco Systems, Inc. | | | 56,306 | | | | 2,510,122 | |
| | |
F5 Networks, Inc.(2) | | | 7,494 | | | | 1,468,449 | |
| | |
Juniper Networks, Inc. | | | 20,553 | | | | 501,904 | |
| | |
| | | | | | | $ | 5,637,823 | |
|
| Construction & Engineering — 0.2% | |
| | |
Jacobs Engineering Group, Inc. | | | 13,603 | | | $ | 1,373,359 | |
| | |
Quanta Services, Inc. | | | 10,835 | | | | 763,542 | |
| | |
| | | | | | | $ | 2,136,901 | |
| | | | |
| | 7 | | See Notes to Financial Statements. |
Parametric
Volatility Risk Premium - Defensive Fund
January 31, 2021
Portfolio of Investments — continued
| | | | | | | | |
| Security | | Shares | | | Value | |
|
| Consumer Finance — 0.2% | |
| | |
Synchrony Financial | | | 48,420 | | | $ | 1,629,333 | |
| | |
| | | | | | | $ | 1,629,333 | |
|
| Containers & Packaging — 0.2% | |
| | |
Avery Dennison Corp. | | | 6,757 | | | $ | 1,019,429 | |
| | |
Packaging Corp. of America | | | 6,949 | | | | 934,362 | |
| | |
Sealed Air Corp. | | | 14,789 | | | | 625,131 | |
| | |
| | | | | | | $ | 2,578,922 | |
|
| Distributors — 0.1% | |
| | |
LKQ Corp.(2) | | | 29,388 | | | $ | 1,031,225 | |
| | |
| | | | | | | $ | 1,031,225 | |
|
| Diversified Financial Services — 0.8% | |
| | |
Berkshire Hathaway, Inc., Class B(2) | | | 37,878 | | | $ | 8,631,260 | |
| | |
| | | | | | | $ | 8,631,260 | |
|
| Diversified Telecommunication Services — 0.6% | |
| | |
AT&T, Inc. | | | 68,060 | | | $ | 1,948,558 | |
| | |
Verizon Communications, Inc. | | | 88,271 | | | | 4,832,837 | |
| | |
| | | | | | | $ | 6,781,395 | |
|
| Electric Utilities — 0.8% | |
| | |
Alliant Energy Corp. | | | 27,469 | | | $ | 1,336,367 | |
| | |
Entergy Corp. | | | 12,589 | | | | 1,200,109 | |
| | |
Evergy, Inc. | | | 25,626 | | | | 1,376,885 | |
| | |
FirstEnergy Corp. | | | 8,233 | | | | 253,247 | |
| | |
NextEra Energy, Inc. | | | 48,023 | | | | 3,883,620 | |
| | |
| | | | | | | $ | 8,050,228 | |
|
| Electrical Equipment — 0.3% | |
| | |
Eaton Corp. PLC | | | 23,530 | | | $ | 2,769,481 | |
| | |
| | | | | | | $ | 2,769,481 | |
|
| Electronic Equipment, Instruments & Components — 0.3% | |
| | |
FLIR Systems, Inc. | | | 19,164 | | | $ | 997,486 | |
| | |
TE Connectivity, Ltd. | | | 15,672 | | | | 1,886,909 | |
| | |
| | | | | | | $ | 2,884,395 | |
|
| Energy Equipment & Services — 0.0%(3) | |
| | |
NOV, Inc. | | | 26,722 | | | $ | 330,818 | |
| | |
| | | | | | | $ | 330,818 | |
| | | | | | | | |
| Security | | Shares | | | Value | |
|
| Entertainment — 1.0% | |
| | |
Netflix, Inc.(2) | | | 7,595 | | | $ | 4,043,502 | |
| | |
Walt Disney Co. (The)(2) | | | 37,119 | | | | 6,242,302 | |
| | |
| | | | | | | $ | 10,285,804 | |
|
| Equity Real Estate Investment Trusts (REITs) — 1.1% | |
| | |
Alexandria Real Estate Equities, Inc. | | | 7,796 | | | $ | 1,302,790 | |
| | |
American Tower Corp. | | | 8,727 | | | | 1,984,171 | |
| | |
Duke Realty Corp. | | | 28,306 | | | | 1,119,785 | |
| | |
Equity Residential | | | 26,176 | | | | 1,613,489 | |
| | |
Extra Space Storage, Inc. | | | 12,455 | | | | 1,417,254 | |
| | |
Healthpeak Properties, Inc. | | | 54,054 | | | | 1,602,701 | |
| | |
Mid-America Apartment Communities, Inc. | | | 12,456 | | | | 1,653,534 | |
| | |
Public Storage | | | 5,646 | | | | 1,285,142 | |
| | |
| | | | | | | $ | 11,978,866 | |
|
| Food & Staples Retailing — 0.8% | |
| | |
Costco Wholesale Corp. | | | 9,170 | | | $ | 3,231,783 | |
| | |
Kroger Co. (The) | | | 23,992 | | | | 827,724 | |
| | |
Walmart, Inc. | | | 31,758 | | | | 4,461,682 | |
| | |
| | | | | | | $ | 8,521,189 | |
|
| Food Products — 0.4% | |
| | |
Campbell Soup Co. | | | 12,740 | | | $ | 612,922 | |
| | |
Conagra Brands, Inc. | | | 39,326 | | | | 1,360,680 | |
| | |
Hormel Foods Corp. | | | 15,841 | | | | 742,309 | |
| | |
McCormick & Co., Inc. | | | 15,832 | | | | 1,417,597 | |
| | |
| | | | | | | $ | 4,133,508 | |
|
| Health Care Equipment & Supplies — 2.0% | |
| | |
Abbott Laboratories | | | 40,952 | | | $ | 5,061,258 | |
| | |
Boston Scientific Corp.(2) | | | 28,504 | | | | 1,010,182 | |
| | |
Cooper Cos., Inc. (The) | | | 4,414 | | | | 1,606,873 | |
| | |
Danaher Corp. | | | 18,205 | | | | 4,329,877 | |
| | |
DENTSPLY SIRONA, Inc. | | | 17,799 | | | | 952,068 | |
| | |
IDEXX Laboratories, Inc.(2) | | | 4,146 | | | | 1,984,607 | |
| | |
Intuitive Surgical, Inc.(2) | | | 3,436 | | | | 2,568,891 | |
| | |
Medtronic PLC | | | 33,210 | | | | 3,697,269 | |
| | |
| | | | | | | $ | 21,211,025 | |
|
| Health Care Providers & Services — 1.1% | |
| | |
AmerisourceBergen Corp. | | | 8,818 | | | $ | 918,836 | |
| | |
DaVita, Inc.(2) | | | 16,015 | | | | 1,879,681 | |
| | |
Quest Diagnostics, Inc. | | | 11,628 | | | | 1,501,756 | |
| | |
UnitedHealth Group, Inc. | | | 20,771 | | | | 6,928,790 | |
| | | | |
| | 8 | | See Notes to Financial Statements. |
Parametric
Volatility Risk Premium - Defensive Fund
January 31, 2021
Portfolio of Investments — continued
| | | | | | | | |
| Security | | Shares | | | Value | |
|
| Health Care Providers & Services (continued) | |
| | |
Universal Health Services, Inc., Class B | | | 6,456 | | | $ | 804,934 | |
| | |
| | | | | | | $ | 12,033,997 | |
|
| Hotels, Restaurants & Leisure — 0.8% | |
| | |
Carnival Corp. | | | 61,777 | | | $ | 1,153,377 | |
| | |
McDonald’s Corp. | | | 14,017 | | | | 2,913,293 | |
| | |
Royal Caribbean Cruises, Ltd. | | | 7,286 | | | | 473,590 | |
| | |
Starbucks Corp. | | | 28,890 | | | | 2,796,841 | |
| | |
Wynn Resorts, Ltd. | | | 9,982 | | | | 993,508 | |
| | |
| | | | | | | $ | 8,330,609 | |
|
| Household Durables — 0.3% | |
| | |
Leggett & Platt, Inc. | | | 25,899 | | | $ | 1,061,859 | |
| | |
Lennar Corp., Class A | | | 21,924 | | | | 1,822,981 | |
| | |
| | | | | | | $ | 2,884,840 | |
|
| Household Products — 0.8% | |
| | |
Clorox Co. (The) | | | 7,282 | | | $ | 1,525,288 | |
| | |
Procter & Gamble Co. (The) | | | 50,222 | | | | 6,438,962 | |
| | |
| | | | | | | $ | 7,964,250 | |
|
| Industrial Conglomerates — 0.4% | |
| | |
Honeywell International, Inc. | | | 19,531 | | | $ | 3,815,771 | |
| | |
| | | | | | | $ | 3,815,771 | |
|
| Insurance — 0.7% | |
| | |
Arthur J. Gallagher & Co. | | | 13,928 | | | $ | 1,607,431 | |
| | |
Assurant, Inc. | | | 8,078 | | | | 1,094,327 | |
| | |
Everest Re Group, Ltd. | | | 4,315 | | | | 910,810 | |
| | |
Globe Life, Inc. | | | 13,114 | | | | 1,185,374 | |
| | |
Progressive Corp. (The) | | | 18,233 | | | | 1,589,735 | |
| | |
Unum Group | | | 59,356 | | | | 1,378,840 | |
| | |
| | | | | | | $ | 7,766,517 | |
|
| Interactive Media & Services — 2.9% | |
| | |
Alphabet, Inc., Class A(2) | | | 5,097 | | | $ | 9,314,054 | |
| | |
Alphabet, Inc., Class C(2) | | | 5,349 | | | | 9,819,373 | |
| | |
Facebook, Inc., Class A(2) | | | 42,323 | | | | 10,933,301 | |
| | |
| | | | | | | $ | 30,066,728 | |
|
| Internet & Direct Marketing Retail — 2.4% | |
| | |
Amazon.com, Inc.(2) | | | 7,285 | | | $ | 23,357,167 | |
| | |
eBay, Inc. | | | 14,642 | | | | 827,420 | |
| | |
Expedia Group, Inc. | | | 10,474 | | | | 1,299,823 | |
| | |
| | | | | | | $ | 25,484,410 | |
| | | | | | | | |
| Security | | Shares | | | Value | |
|
| IT Services — 2.5% | |
| | |
Accenture PLC, Class A | | | 15,413 | | | $ | 3,728,713 | |
| | |
Global Payments, Inc. | | | 8,666 | | | | 1,529,722 | |
| | |
International Business Machines Corp. | | | 10,362 | | | | 1,234,218 | |
| | |
Mastercard, Inc., Class A | | | 18,122 | | | | 5,731,807 | |
| | |
PayPal Holdings, Inc.(2) | | | 27,789 | | | | 6,511,241 | |
| | |
Visa, Inc., Class A | | | 34,419 | | | | 6,651,472 | |
| | |
Western Union Co. (The) | | | 34,757 | | | | 774,038 | |
| | |
| | | | | | | $ | 26,161,211 | |
|
| Life Sciences Tools & Services — 0.8% | |
| | |
IQVIA Holdings, Inc.(2) | | | 10,609 | | | $ | 1,886,280 | |
| | |
Thermo Fisher Scientific, Inc. | | | 10,530 | | | | 5,367,141 | |
| | |
Waters Corp.(2) | | | 6,071 | | | | 1,606,812 | |
| | |
| | | | | | | $ | 8,860,233 | |
|
| Machinery — 0.7% | |
| | |
Flowserve Corp. | | | 18,592 | | | $ | 661,132 | |
| | |
IDEX Corp. | | | 7,570 | | | | 1,409,458 | |
| | |
PACCAR, Inc. | | | 20,593 | | | | 1,878,494 | |
| | |
Stanley Black & Decker, Inc. | | | 10,057 | | | | 1,744,789 | |
| | |
Westinghouse Air Brake Technologies Corp. | | | 20,340 | | | | 1,509,431 | |
| | |
| | | | | | | $ | 7,203,304 | |
|
| Media — 0.8% | |
| | |
Comcast Corp., Class A | | | 73,770 | | | $ | 3,656,779 | |
| | |
Discovery, Inc., Class A(1)(2) | | | 27,746 | | | | 1,149,239 | |
| | |
DISH Network Corp., Class A(2) | | | 17,017 | | | | 493,833 | |
| | |
Fox Corp., Class B | | | 9,291 | | | | 277,708 | |
| | |
ViacomCBS, Inc., Class B | | | 51,547 | | | | 2,500,030 | |
| | |
| | | | | | | $ | 8,077,589 | |
|
| Metals & Mining — 0.3% | |
| | |
Freeport-McMoRan, Inc. | | | 98,237 | | | $ | 2,643,558 | |
| | |
| | | | | | | $ | 2,643,558 | |
|
| Multi-Utilities — 0.4% | |
| | |
CMS Energy Corp. | | | 26,920 | | | $ | 1,531,210 | |
| | |
Dominion Energy, Inc. | | | 15,714 | | | | 1,145,393 | |
| | |
WEC Energy Group, Inc. | | | 17,811 | | | | 1,583,398 | |
| | |
| | | | | | | $ | 4,260,001 | |
|
| Multiline Retail — 0.1% | |
| | |
Kohl’s Corp. | | | 32,738 | | | $ | 1,442,436 | |
| | |
| | | | | | | $ | 1,442,436 | |
| | | | |
| | 9 | | See Notes to Financial Statements. |
Parametric
Volatility Risk Premium - Defensive Fund
January 31, 2021
Portfolio of Investments — continued
| | | | | | | | |
| Security | | Shares | | | Value | |
|
| Oil, Gas & Consumable Fuels — 1.1% | |
| | |
Apache Corp. | | | 43,582 | | | $ | 622,351 | |
| | |
Chevron Corp. | | | 32,932 | | | | 2,805,806 | |
| | |
Devon Energy Corp. | | | 45,847 | | | | 754,642 | |
| | |
EOG Resources, Inc. | | | 28,002 | | | | 1,426,982 | |
| | |
Exxon Mobil Corp. | | | 64,478 | | | | 2,891,193 | |
| | |
HollyFrontier Corp. | | | 39,132 | | | | 1,113,697 | |
| | |
Marathon Oil Corp. | | | 122,678 | | | | 888,189 | |
| | |
ONEOK, Inc. | | | 23,516 | | | | 936,642 | |
| | |
| | | | | | | $ | 11,439,502 | |
|
| Pharmaceuticals — 2.1% | |
| | |
Bristol-Myers Squibb Co. | | | 49,328 | | | $ | 3,030,219 | |
| | |
Eli Lilly & Co. | | | 15,663 | | | | 3,257,434 | |
| | |
Johnson & Johnson | | | 51,461 | | | | 8,394,833 | |
| | |
Merck & Co., Inc. | | | 52,464 | | | | 4,043,400 | |
| | |
Pfizer, Inc. | | | 94,364 | | | | 3,387,668 | |
| | |
Viatris, Inc.(2) | | | 6,113 | | | | 103,860 | |
| | |
| | | | | | | $ | 22,217,414 | |
|
| Professional Services — 0.2% | |
| | |
Verisk Analytics, Inc. | | | 9,226 | | | $ | 1,692,971 | |
| | |
| | | | | | | $ | 1,692,971 | |
|
| Road & Rail — 0.5% | |
| | |
J.B. Hunt Transport Services, Inc. | | | 10,244 | | | $ | 1,379,457 | |
| | |
Union Pacific Corp. | | | 17,714 | | | | 3,497,984 | |
| | |
| | | | | | | $ | 4,877,441 | |
|
| Semiconductors & Semiconductor Equipment — 2.7% | |
| | |
Broadcom, Inc. | | | 9,769 | | | $ | 4,400,934 | |
| | |
Intel Corp. | | | 58,758 | | | | 3,261,657 | |
| | |
KLA Corp. | | | 9,319 | | | | 2,609,972 | |
| | |
NVIDIA Corp. | | | 12,227 | | | | 6,353,027 | |
| | |
Qorvo, Inc.(2) | | | 14,470 | | | | 2,472,634 | |
| | |
QUALCOMM, Inc. | | | 23,952 | | | | 3,743,219 | |
| | |
Teradyne, Inc. | | | 11,352 | | | | 1,288,225 | |
| | |
Texas Instruments, Inc. | | | 25,021 | | | | 4,145,729 | |
| | |
| | | | | | | $ | 28,275,397 | |
|
| Software — 4.4% | |
| | |
Adobe, Inc.(2) | | | 11,333 | | | $ | 5,199,240 | |
| | |
Intuit, Inc. | | | 6,767 | | | | 2,444,443 | |
| | |
Microsoft Corp. | | | 130,236 | | | | 30,209,543 | |
| | |
Oracle Corp. | | | 55,883 | | | | 3,377,010 | |
| | | | | | | | |
| Security | | Shares | | | Value | |
|
| Software (continued) | |
| | |
salesforce.com, inc.(2) | | | 21,075 | | | $ | 4,753,677 | |
| | |
| | | | | | | $ | 45,983,913 | |
|
| Specialty Retail — 1.1% | |
| | |
Advance Auto Parts, Inc. | | | 8,733 | | | $ | 1,302,440 | |
| | |
Home Depot, Inc. (The) | | | 22,409 | | | | 6,068,805 | |
| | |
L Brands, Inc. | | | 26,068 | | | | 1,062,532 | |
| | |
Lowe’s Cos., Inc. | | | 12,417 | | | | 2,071,776 | |
| | |
Ross Stores, Inc. | | | 7,737 | | | | 861,051 | |
| | |
| | | | | | | $ | 11,366,604 | |
|
| Technology Hardware, Storage & Peripherals — 3.6% | |
| | |
Apple, Inc. | | | 275,950 | | | $ | 36,414,362 | |
| | |
Western Digital Corp. | | | 16,191 | | | | 913,658 | |
| | |
Xerox Holdings Corp. | | | 20,610 | | | | 433,428 | |
| | |
| | | | | | | $ | 37,761,448 | |
|
| Textiles, Apparel & Luxury Goods — 0.5% | |
| | |
NIKE, Inc., Class B | | | 27,693 | | | $ | 3,699,508 | |
| | |
Ralph Lauren Corp. | | | 5,261 | | | | 531,624 | |
| | |
Under Armour, Inc., Class A(2) | | | 27,955 | | | | 489,213 | |
| | |
Under Armour, Inc., Class C(2) | | | 29,952 | | | | 448,381 | |
| | |
| | | | | | | $ | 5,168,726 | |
|
| Tobacco — 0.3% | |
| | |
Philip Morris International, Inc. | | | 39,140 | | | $ | 3,117,501 | |
| | |
| | | | | | | $ | 3,117,501 | |
|
| Trading Companies & Distributors — 0.2% | |
| | |
Fastenal Co. | | | 24,668 | | | $ | 1,124,614 | |
| | |
W.W. Grainger, Inc. | | | 2,835 | | | | 1,033,046 | |
| | |
| | | | | | | $ | 2,157,660 | |
|
| Water Utilities — 0.1% | |
| | |
American Water Works Co., Inc. | | | 7,694 | | | $ | 1,223,500 | |
| | |
| | | | | | | $ | 1,223,500 | |
| |
Total Common Stocks
(identified cost $333,030,804) | | | $ | 513,951,975 | |
| | | | |
| | 10 | | See Notes to Financial Statements. |
Parametric
Volatility Risk Premium - Defensive Fund
January 31, 2021
Portfolio of Investments — continued
| | | | | | | | |
| Short-Term Investments — 50.8% | |
|
| U.S. Treasury Obligations — 50.3% | |
| Security | | Principal
Amount
(000’s omitted) | | | Value | |
| | |
| U.S. Treasury Bills: | | | | | | |
| | |
0.00%, 2/25/21 | | $ | 12,870 | | | $ | 12,869,700 | |
| | |
0.00%, 3/4/21 | | | 26,000 | | | | 25,999,104 | |
| | |
0.00%, 4/22/21 | | | 52,500 | | | | 52,494,750 | |
| | |
0.00%, 5/20/21 | | | 30,988 | | | | 30,982,073 | |
| | |
0.00%, 6/17/21(4) | | | 42,000 | | | | 41,990,480 | |
| | |
0.00%, 8/12/21(1)(4) | | | 109,700 | | | | 109,667,822 | |
| | |
0.00%, 9/9/21 | | | 49,160 | | | | 49,140,473 | |
| | |
0.00%, 10/7/21 | | | 33,050 | | | | 33,034,632 | |
| | |
0.00%, 12/2/21 | | | 49,000 | | | | 48,972,553 | |
| | |
0.00%, 12/30/21 | | | 27,000 | | | | 26,982,383 | |
| | |
| | | | | | | $ | 432,133,970 | |
| | |
| U.S. Treasury Notes: | | | | | | |
| | |
1.375%, 4/30/21 | | $ | 34,500 | | | $ | 34,607,719 | |
| | |
2.625%, 5/15/21 | | | 16,000 | | | | 16,116,711 | |
| | |
2.75%, 8/15/21 | | | 7,750 | | | | 7,861,829 | |
| | |
1.75%, 11/30/21 | | | 18,000 | | | | 18,251,818 | |
| | |
2.125%, 12/31/21 | | | 17,400 | | | | 17,724,460 | |
| | |
| | | | | | | $ | 94,562,537 | |
| |
Total U.S. Treasury Obligations
(identified cost $526,548,713) | | | $ | 526,696,507 | |
| | | | | | | | |
| Other — 0.5% | |
| Description | | Units/Shares | | | Value | |
| | |
Eaton Vance Cash Reserves Fund, LLC, 0.11%(5) | | | 5,138,768 | | | $ | 5,138,768 | |
| | |
State Street Navigator Securities Lending Government Money Market Portfolio, 0.06%(6) | | | 663,910 | | | | 663,910 | |
| |
Total Other
(identified cost $5,802,678) | | | $ | 5,802,678 | |
| |
Total Short-Term Investments
(identified cost $532,351,391) | | | $ | 532,499,185 | |
| |
Total Investments — 99.9%
(identified cost $865,382,195) | | | $ | 1,046,451,160 | |
| |
Total Written Options — (0.6)%
(premiums received $4,329,506) | | | $ | (5,975,688 | ) |
| |
Other Assets, Less Liabilities — 0.7% | | | $ | 6,875,986 | |
| |
Net Assets — 100.0% | | | $ | 1,047,351,458 | |
The percentage shown for each investment category in the Portfolio of Investments is based on net assets.
| (1) | All or a portion of this security was on loan at January 31, 2021. The aggregate market value of securities on loan at January 31, 2021 was $55,644,573. |
| (2) | Non-income producing security. |
| (3) | Amount is less than 0.05%. |
| (4) | Security (or a portion thereof) has been pledged as collateral for written options. |
| (5) | Affiliated investment company, available to Eaton Vance portfolios and funds, which invests in high quality, U.S. dollar denominated money market instruments. The rate shown is the annualized seven-day yield as of January 31, 2021. |
| (6) | Represents investment of cash collateral received in connection with securities lending. |
| | | | | | | | | | | | | | | | | | | | |
| Written Call Options — (0.1)% | |
|
| Exchange-Traded Options — (0.1)% | |
| | | | | |
| Description | | Number of
Contracts | | | Notional Amount | | | Exercise
Price | | | Expiration
Date | | | Value | |
| | | | | |
S&P 500 Index | | | 115 | | | $ | 42,713,760 | | | $ | 3,855 | | | | 2/5/21 | | | $ | (109,135 | ) |
| | | | | |
S&P 500 Index | | | 100 | | | | 37,142,400 | | | | 3,930 | | | | 2/5/21 | | | | (6,750 | ) |
| | | | | |
S&P 500 Index | | | 115 | | | | 42,713,760 | | | | 3,950 | | | | 2/10/21 | | | | (15,813 | ) |
| | | | | |
S&P 500 Index | | | 115 | | | | 42,713,760 | | | | 3,855 | | | | 2/12/21 | | | | (182,505 | ) |
| | | | | |
S&P 500 Index | | | 115 | | | | 42,713,760 | | | | 3,925 | | | | 2/16/21 | | | | (52,325 | ) |
| | | | | |
S&P 500 Index | | | 115 | | | | 42,713,760 | | | | 3,970 | | | | 2/19/21 | | | | (41,400 | ) |
| | | | | |
S&P 500 Index | | | 115 | | | | 42,713,760 | | | | 3,950 | | | | 2/24/21 | | | | (86,250 | ) |
| |
Total | | | $ | (494,178 | ) |
| | | | |
| | 11 | | See Notes to Financial Statements. |
Parametric
Volatility Risk Premium - Defensive Fund
January 31, 2021
Portfolio of Investments — continued
| | | | | | | | | | | | | | | | | | | | |
| Written Put Options — (0.5)% | |
|
| Exchange-Traded Options — (0.5)% | |
| | | | | |
| Description | | Number of
Contracts | | | Notional Amount | | | Exercise
Price | | | Expiration
Date | | | Value | |
| | | | | |
S&P 500 Index | | | 120 | | | $ | 44,570,880 | | | $ | 3,730 | | | | 2/1/21 | | | $ | (414,600 | ) |
| | | | | |
S&P 500 Index | | | 115 | | | | 42,713,760 | | | | 3,680 | | | | 2/3/21 | | | | (414,575 | ) |
| | | | | |
S&P 500 Index | | | 117 | | | | 43,456,608 | | | | 3,720 | | | | 2/3/21 | | | | (539,955 | ) |
| | | | | |
S&P 500 Index | | | 110 | | | | 40,856,640 | | | | 3,600 | | | | 2/5/21 | | | | (277,750 | ) |
| | | | | |
S&P 500 Index | | | 120 | | | | 44,570,880 | | | | 3,615 | | | | 2/5/21 | | | | (215,880 | ) |
| | | | | |
S&P 500 Index | | | 120 | | | | 44,570,880 | | | | 3,690 | | | | 2/8/21 | | | | (620,400 | ) |
| | | | | |
S&P 500 Index | | | 118 | | | | 43,828,032 | | | | 3,620 | | | | 2/10/21 | | | | (504,450 | ) |
| | | | | |
S&P 500 Index | | | 120 | | | | 44,570,880 | | | | 3,490 | | | | 2/12/21 | | | | (411,720 | ) |
| | | | | |
S&P 500 Index | | | 117 | | | | 43,456,608 | | | | 3,600 | | | | 2/16/21 | | | | (579,150 | ) |
| | | | | |
S&P 500 Index | | | 117 | | | | 43,456,608 | | | | 3,640 | | | | 2/19/21 | | | | (817,830 | ) |
| | | | | |
S&P 500 Index | | | 120 | | | | 44,570,880 | | | | 3,550 | | | | 2/24/21 | | | | (685,200 | ) |
| |
Total | | | $ | (5,481,510 | ) |
| | | | |
| | 12 | | See Notes to Financial Statements. |
Parametric
Volatility Risk Premium - Defensive Fund
January 31, 2021
Statement of Assets and Liabilities
| | | | |
| Assets | | January 31, 2021 | |
| |
Unaffiliated investments, at value including $55,644,573 of securities on loan (identified cost, $860,243,427) | | $ | 1,041,312,392 | |
| |
Affiliated investment, at value (identified cost, $5,138,768) | | | 5,138,768 | |
| |
Cash | | | 13,987 | |
| |
Dividends receivable | | | 542,130 | |
| |
Interest receivable | | | 398,026 | |
| |
Dividends receivable from affiliated investment | | | 1,056 | |
| |
Receivable for investments sold | | | 2,756,434 | |
| |
Receivable for premiums on written options | | | 919,240 | |
| |
Receivable for Fund shares sold | | | 5,297,000 | |
| |
Securities lending income receivable | | | 1,316 | |
| |
Total assets | | $ | 1,056,380,349 | |
|
| Liabilities | |
| |
Collateral for securities loaned | | $ | 663,910 | |
| |
Written options outstanding, at value (premiums received, $4,329,506) | | | 5,975,688 | |
| |
Payable for closed written options | | | 603,978 | |
| |
Payable for Fund shares redeemed | | | 1,160,458 | |
| |
Payable to affiliate: | | | | |
| |
Investment adviser and administration fee | | | 356,216 | |
| |
Accrued expenses | | | 268,641 | |
| |
Total liabilities | | $ | 9,028,891 | |
| |
Net Assets | | $ | 1,047,351,458 | |
|
| Sources of Net Assets | |
| |
Paid-in capital | | $ | 923,949,299 | |
| |
Distributable earnings | | | 123,402,159 | |
| |
Total | | $ | 1,047,351,458 | |
|
| Institutional Class Shares | |
| |
Net Assets | | $ | 1,047,351,458 | |
| |
Shares Outstanding | | | 84,411,159 | |
| |
Net Asset Value, Offering Price and Redemption Price Per Share | | | | |
| |
(net assets ÷ shares of beneficial interest outstanding) | | $ | 12.41 | |
| | | | |
| | 13 | | See Notes to Financial Statements. |
Parametric
Volatility Risk Premium - Defensive Fund
January 31, 2021
Statement of Operations
| | | | |
| Investment Income | | Year Ended
January 31, 2021 | |
| |
Dividends | | $ | 8,464,654 | |
| |
Dividends from affiliated investment | | | 74,470 | |
| |
Interest | | | 3,771,216 | |
| |
Securities lending income, net | | | 67,548 | |
| |
Total investment income | | $ | 12,377,888 | |
| |
| Expenses | | | | |
| |
Investment adviser and administration fee | | $ | 3,607,188 | |
| |
Trustees’ fees and expenses | | | 49,208 | |
| |
Custodian fee | | | 263,544 | |
| |
Transfer and dividend disbursing agent fees | | | 181,970 | |
| |
Legal and accounting services | | | 75,730 | |
| |
Printing and postage | | | 14,526 | |
| |
Registration fees | | | 43,662 | |
| |
Miscellaneous | | | 41,511 | |
| |
Total expenses | | $ | 4,277,339 | |
| |
Net investment income | | $ | 8,100,549 | |
|
| Realized and Unrealized Gain (Loss) | |
| |
Net realized gain (loss) — | | | | |
| |
Investment transactions | | $ | (17,531,146 | ) |
| |
Investment transactions — affiliated investment | | | (1,063 | ) |
| |
Written options | | | (25,417,876 | ) |
| |
Net realized loss | | $ | (42,950,085 | ) |
| |
Change in unrealized appreciation (depreciation) — | | | | |
| |
Investments | | $ | 105,254,089 | |
| |
Investments — affiliated investment | | | (254 | ) |
| |
Written options | | | (807,527 | ) |
| |
Net change in unrealized appreciation (depreciation) | | $ | 104,446,308 | |
| |
Net realized and unrealized gain | | $ | 61,496,223 | |
| |
Net increase in net assets from operations | | $ | 69,596,772 | |
| | | | |
| | 14 | | See Notes to Financial Statements. |
Parametric
Volatility Risk Premium - Defensive Fund
January 31, 2021
Statements of Changes in Net Assets
| | | | | | | | |
| | | Year Ended January 31, | |
| Increase (Decrease) in Net Assets | | 2021 | | | 2020 | |
| | |
From operations — | | | | | | | | |
| | |
Net investment income | | $ | 8,100,549 | | | $ | 9,902,143 | |
| | |
Net realized loss | | | (42,950,085 | ) | | | (1,947,240 | ) |
| | |
Net change in unrealized appreciation (depreciation) | | | 104,446,308 | | | | 57,508,857 | |
| | |
Net increase in net assets from operations | | $ | 69,596,772 | | | $ | 65,463,760 | |
| | |
Distributions to shareholders — | | | | | | | | |
| | |
Institutional Class | | $ | (7,816,386 | ) | | $ | (8,675,190 | ) |
| | |
Total distributions to shareholders | | $ | (7,816,386 | ) | | $ | (8,675,190 | ) |
| | |
Transactions in shares of beneficial interest — | | | | | | | | |
| | |
Proceeds from sale of shares | | $ | 537,434,530 | | | $ | 336,655,367 | |
| | |
Net asset value of shares issued to shareholders in payment of distributions declared | | | 6,364,015 | | | | 5,698,916 | |
| | |
Cost of shares redeemed | | | (325,348,450 | ) | | | (71,680,256 | ) |
| | |
Net increase in net assets from Fund share transactions | | $ | 218,450,095 | | | $ | 270,674,027 | |
| | |
Net increase in net assets | | $ | 280,230,481 | | | $ | 327,462,597 | |
| | |
| Net Assets | | | | | | | | |
| | |
At beginning of year | | $ | 767,120,977 | | | $ | 439,658,380 | |
| | |
At end of year | | $ | 1,047,351,458 | | | $ | 767,120,977 | |
| | | | |
| | 15 | | See Notes to Financial Statements. |
Parametric
Volatility Risk Premium - Defensive Fund
January 31, 2021
Financial Highlights
| | | | | | | | | | | | | | | | |
| | | Institutional Class | |
| | |
| | | Year Ended January 31, | | | Period Ended
January 31, 2018(1) | |
| | | 2021 | | | 2020 | | | 2019 | |
| | | | | |
Net asset value — Beginning of period | | $ | 11.940 | | | $ | 10.830 | | | $ | 11.020 | | | $ | 10.000 | |
| | | | |
| Income (Loss) From Operations | | | | | | | | | | | | | | | | |
| | | | |
Net investment income(2) | | $ | 0.103 | | | $ | 0.188 | | | $ | 0.165 | | | $ | 0.104 | |
| | | | |
Net realized and unrealized gain (loss) | | | 0.460 | | | | 1.069 | | | | (0.226 | ) | | | 0.974 | |
| | | | |
Total income (loss) from operations | | $ | 0.563 | | | $ | 1.257 | | | $ | (0.061 | ) | | $ | 1.078 | |
| | | | |
| Less Distributions | | | | | | | | | | | | | | | | |
| | | | |
From net investment income | | $ | (0.093 | ) | | $ | (0.147 | ) | | $ | (0.129 | ) | | $ | (0.058 | ) |
| | | | |
Total distributions | | $ | (0.093 | ) | | $ | (0.147 | ) | | $ | (0.129 | ) | | $ | (0.058 | ) |
| | | | |
Net asset value — End of period | | $ | 12.410 | | | $ | 11.940 | | | $ | 10.830 | | | $ | 11.020 | |
| | | | |
Total Return(3) | | | 4.73 | % | | | 11.62 | % | | | (0.55 | )% | | | 10.79 | %(4)(5) |
| | | | |
| Ratios/Supplemental Data | | | | | | | | | | | | | | | | |
| | | | |
Net assets, end of period (000’s omitted) | | $ | 1,047,351 | | | $ | 767,121 | | | $ | 439,658 | | | $ | 194,591 | |
| | | | |
Ratios (as a percentage of average daily net assets): | | | | | | | | | | | | | | | | |
| | | | |
Expenses | | | 0.47 | % | | | 0.48 | % | | | 0.52 | % | | | 0.55 | %(5)(6) |
| | | | |
Net investment income | | | 0.90 | % | | | 1.64 | % | | | 1.50 | % | | | 1.00 | %(6) |
| | | | |
Portfolio Turnover | | | 69 | % | | | 21 | % | | | 55 | % | | | 26 | %(4) |
| (1) | For the period from the start of business, February 9, 2017, to January 31, 2018. |
| (2) | Computed using average shares outstanding. |
| (3) | Returns are historical and are calculated by determining the percentage change in net asset value with all distributions reinvested. |
| (5) | The investment adviser and administrator and sub-adviser reimbursed certain operating expenses (equal to 0.08% of average daily net assets for the period ended January 31, 2018). Absent this reimbursement, total return would be lower. |
| | | | |
| | 16 | | See Notes to Financial Statements. |
Parametric
Volatility Risk Premium - Defensive Fund
January 31, 2021
Notes to Financial Statements
1 Significant Accounting Policies
Parametric Volatility Risk Premium - Defensive Fund (the Fund) is a diversified series of Eaton Vance Mutual Funds Trust (the Trust). The Trust is a Massachusetts business trust registered under the Investment Company Act of 1940, as amended (the 1940 Act), as an open-end management investment company. The Fund’s investment objective is total return. The Fund offers Institutional Class shares, which are sold at net asset value and are not subject to a sales charge.
The following is a summary of significant accounting policies of the Fund. The policies are in conformity with accounting principles generally accepted in the United States of America (U.S. GAAP). The Fund is an investment company and follows accounting and reporting guidance in the Financial Accounting Standards Board (FASB) Accounting Standards Codification Topic 946.
A Investment Valuation — The following methodologies are used to determine the market value or fair value of investments.
Equity Securities. Equity securities listed on a U.S. securities exchange generally are valued at the last sale or closing price on the day of valuation or, if no sales took place on such date, at the mean between the closing bid and ask prices on the exchange where such securities are principally traded. Equity securities listed on the NASDAQ Global or Global Select Market generally are valued at the NASDAQ official closing price. Unlisted or listed securities for which closing sales prices or closing quotations are not available are valued at the mean between the latest available bid and ask prices.
Debt Obligations. Debt obligations are generally valued on the basis of valuations provided by third party pricing services, as derived from such services’ pricing models. Inputs to the models may include, but are not limited to, reported trades, executable bid and ask prices, broker/dealer quotations, prices or yields of securities with similar characteristics, interest rates, anticipated prepayments, benchmark curves or information pertaining to the issuer, as well as industry and economic events. The pricing services may use a matrix approach, which considers information regarding securities with similar characteristics to determine the valuation for a security. Short-term debt obligations purchased with a remaining maturity of sixty days or less for which a valuation from a third party pricing service is not readily available may be valued at amortized cost, which approximates fair value.
Derivatives. U.S. exchange-traded options are valued at the mean between the bid and ask prices at valuation time as reported by the Options Price Reporting Authority. Non U.S. exchange-traded options and over-the-counter options are valued by a third party pricing service using techniques that consider factors including the value of the underlying instrument, the volatility of the underlying instrument and the period of time until option expiration.
Affiliated Fund. The Fund may invest in Eaton Vance Cash Reserves Fund, LLC (Cash Reserves Fund), an affiliated investment company managed by Eaton Vance Management (EVM). While Cash Reserves Fund is not a registered money market mutual fund, it conducts all of its investment activities in accordance with the requirements of Rule 2a-7 under the 1940 Act. Investments in Cash Reserves Fund are valued at the closing net asset value per unit on the valuation day. Cash Reserves Fund generally values its investment securities based on available market quotations provided by a third party pricing service.
Other. Investments in registered investment companies (including money market funds) that do not trade on an exchange are valued at the net asset value per share on the valuation day.
Fair Valuation. Investments for which valuations or market quotations are not readily available or are deemed unreliable are valued at fair value using methods determined in good faith by or at the direction of the Trustees of the Fund in a manner that most fairly reflects the security’s “fair value”, which is the amount that the Fund might reasonably expect to receive for the security upon its current sale in the ordinary course. Each such determination is based on a consideration of relevant factors, which are likely to vary from one pricing context to another. These factors may include, but are not limited to, the type of security, the existence of any contractual restrictions on the security’s disposition, the price and extent of public trading in similar securities of the issuer or of comparable companies or entities, quotations or relevant information obtained from broker/dealers or other market participants, information obtained from the issuer, analysts, and/or the appropriate stock exchange (for exchange-traded securities), an analysis of the company’s or entity’s financial statements, and an evaluation of the forces that influence the issuer and the market(s) in which the security is purchased and sold.
B Investment Transactions — Investment transactions for financial statement purposes are accounted for on a trade date basis. Realized gains and losses on investments sold are determined on the basis of identified cost.
C Income — Dividend income is recorded on the ex-dividend date for dividends received in cash and/or securities. However, if the ex-dividend date has passed, certain dividends from foreign securities are recorded as the Fund is informed of the ex-dividend date. Withholding taxes on foreign dividends and capital gains have been provided for in accordance with the Fund’s understanding of the applicable countries’ tax rules and rates. Interest income is recorded on the basis of interest accrued, adjusted for amortization of premium or accretion of discount.
D Federal Taxes — The Fund’s policy is to comply with the provisions of the Internal Revenue Code applicable to regulated investment companies and to distribute to shareholders each year substantially all of its net investment income, and all or substantially all of its net realized capital gains. Accordingly, no provision for federal income or excise tax is necessary.
As of January 31, 2021, the Fund had no uncertain tax positions that would require financial statement recognition, de-recognition, or disclosure. The Fund files a U.S. federal income tax return annually after its fiscal year-end, which is subject to examination by the Internal Revenue Service for a period of three years from the date of filing.
E Expenses — The majority of expenses of the Trust are directly identifiable to an individual fund. Expenses which are not readily identifiable to a specific fund are allocated taking into consideration, among other things, the nature and type of expense and the relative size of the funds.
Parametric
Volatility Risk Premium - Defensive Fund
January 31, 2021
Notes to Financial Statements — continued
F Use of Estimates — The preparation of the financial statements in conformity with U.S. GAAP requires management to make estimates and assumptions that affect the reported amounts of assets and liabilities at the date of the financial statements and the reported amounts of income and expense during the reporting period. Actual results could differ from those estimates.
G Indemnifications — Under the Trust’s organizational documents, its officers and Trustees may be indemnified against certain liabilities and expenses arising out of the performance of their duties to the Fund. Under Massachusetts law, if certain conditions prevail, shareholders of a Massachusetts business trust (such as the Trust) could be deemed to have personal liability for the obligations of the Trust. However, the Trust’s Declaration of Trust contains an express disclaimer of liability on the part of Fund shareholders and the By-laws provide that the Trust shall assume, upon request by the shareholder, the defense on behalf of any Fund shareholders. Moreover, the By-laws also provide for indemnification out of Fund property of any shareholder held personally liable solely by reason of being or having been a shareholder for all loss or expense arising from such liability. Additionally, in the normal course of business, the Fund enters into agreements with service providers that may contain indemnification clauses. The Fund’s maximum exposure under these arrangements is unknown as this would involve future claims that may be made against the Fund that have not yet occurred.
H Written Options — Upon the writing of a call or a put option, the premium received by the Fund is included in the Statement of Assets and Liabilities as a liability. The amount of the liability is subsequently marked-to-market to reflect the current market value of the option written, in accordance with the Fund’s policies on investment valuations discussed above. Premiums received from writing options which expire are treated as realized gains. Premiums received from writing options which are exercised or are closed are added to or offset against the proceeds or amount paid on the transaction to determine the realized gain or loss. When an index option is exercised, the Fund is required to deliver an amount of cash determined by the excess of the exercise price of the option over the value of the index (in the case of a put) or the excess of the value of the index over the exercise price of the option (in the case of a call) at contract termination. If a put option on a security is exercised, the premium reduces the cost basis of the securities purchased by the Fund. The Fund, as a writer of an option, may have no control over whether the underlying securities or other assets may be sold (call) or purchased (put) and, as a result, bears the market risk of an unfavorable change in the price of the securities or other assets underlying the written option. The Fund may also bear the risk of not being able to enter into a closing transaction if a liquid secondary market does not exist.
2 Distributions to Shareholders and Income Tax Information
It is the present policy of the Fund to make at least one distribution annually (normally in December) of all or substantially all of its net investment income and to distribute annually all or substantially all of its net realized capital gains. Distributions to shareholders are recorded on the ex-dividend date. Shareholders may reinvest income and capital gain distributions in additional shares of the Fund at the net asset value as of the ex-dividend date or, at the election of the shareholder, receive distributions in cash. Distributions to shareholders are determined in accordance with income tax regulations, which may differ from U.S. GAAP. As required by U.S. GAAP, only distributions in excess of tax basis earnings and profits are reported in the financial statements as a return of capital. Permanent differences between book and tax accounting relating to distributions are reclassified to paid-in capital. For tax purposes, distributions from short-term capital gains are considered to be from ordinary income.
The tax character of distributions declared for the years ended January 31, 2021 and January 31, 2020 was as follows:
| | | | | | | | |
| | | Year Ended January 31, | |
| | | 2021 | | | 2020 | |
| | |
Ordinary income | | $ | 7,816,386 | | | $ | 8,675,190 | |
During the year ended January 31, 2021, distributable earnings was decreased by $840,452 and paid-in capital was increased by $840,452 primarily due to the Fund’s use of equalization accounting. Tax equalization accounting allows the Fund to treat as a distribution that portion of redemption proceeds representing a redeeming shareholder’s portion of undistributed taxable income and net capital gains. These reclassifications had no effect on the net assets or net asset value per share of the Fund.
As of January 31, 2021, the components of distributable earnings (accumulated loss) on a tax basis were as follows:
| | | | |
| | |
Undistributed ordinary income | | $ | 233,838 | |
| |
Deferred capital losses | | $ | (57,607,421 | ) |
| |
Net unrealized appreciation | | $ | 180,775,742 | |
At January 31, 2021, the Fund, for federal income tax purposes, had deferred capital losses of $57,607,421 which would reduce its taxable income arising from future net realized gains on investment transactions, if any, to the extent permitted by the Internal Revenue Code, and thus would reduce the amount of distributions to shareholders, which would otherwise be necessary to relieve the Fund of any liability for federal income or excise tax. The deferred capital losses are treated as arising on the first day of the Fund’s next taxable year and retain the same short-term or long-term character as when originally deferred. Of the deferred capital losses at January 31, 2021, $39,840,983 are short-term and $17,766,438 are long-term.
Parametric
Volatility Risk Premium - Defensive Fund
January 31, 2021
Notes to Financial Statements — continued
The cost and unrealized appreciation (depreciation) of investments, including open derivative contracts, of the Fund at January 31, 2021, as determined on a federal income tax basis, were as follows:
| | | | |
| |
Aggregate cost | | $ | 865,675,418 | |
| |
Gross unrealized appreciation | | $ | 181,036,975 | |
| |
Gross unrealized depreciation | | | (261,233 | ) |
| |
Net unrealized appreciation | | $ | 180,775,742 | |
3 Investment Adviser and Administration Fee and Other Transactions with Affiliates
The investment adviser and administration fee is earned by EVM, a wholly-owned subsidiary of Eaton Vance Corp., as compensation for investment advisory and administrative services rendered to the Fund. The fee is computed at an annual rate of 0.40% of the Fund’s average daily net assets up to $1 billion, 0.375% on net assets of $1 billion but less than $2.5 billion and at reduced rates on average daily net assets of $2.5 billion or more, and is payable monthly. For the year ended January 31, 2021, the investment adviser and administration fee amounted to $3,607,188 or 0.40% of the Fund’s average daily net assets. Pursuant to a sub-advisory agreement, EVM has delegated the investment management of the Fund to Parametric Portfolio Associates LLC (Parametric), a wholly-owned indirect subsidiary of Eaton Vance Corp. EVM pays Parametric a portion of its investment adviser and administration fee for sub-advisory services provided to the Fund. The Fund invests its cash in Cash Reserves Fund. EVM does not currently receive a fee for advisory services provided to Cash Reserves Fund.
EVM provides sub-transfer agency and related services to the Fund pursuant to a Sub-Transfer Agency Support Services Agreement. For the year ended January 31, 2021, EVM earned $57,426 from the Fund pursuant to such agreement, which is included in transfer and dividend disbursing agent fees on the Statement of Operations.
Trustees and officers of the Fund who are members of EVM’s organization receive remuneration for their services to the Fund out of the investment adviser and administration fee. Trustees of the Fund who are not affiliated with EVM may elect to defer receipt of all or a percentage of their annual fees in accordance with the terms of the Trustees Deferred Compensation Plan. For the year ended January 31, 2021, no significant amounts have been deferred. Certain officers and Trustees of the Fund are officers of EVM.
4 Purchases and Sales of Investments
Purchases and sales of investments, other than short-term obligations, aggregated $349,619,144 and $312,948,115, respectively, for the year ended January 31, 2021.
5 Shares of Beneficial Interest
The Fund’s Declaration of Trust permits the Trustees to issue an unlimited number of full and fractional shares of beneficial interest (without par value). Transactions in Fund shares were as follows:
| | | | | | | | |
| | | Year Ended January 31, | |
| Institutional Class | | 2021 | | | 2020 | |
| | |
Sales | | | 48,917,770 | | | | 29,384,549 | |
| | |
Issued to shareholders electing to receive payments of distributions in Fund shares | | | 522,438 | | | | 481,327 | |
| | |
Redemptions | | | (29,268,917 | ) | | | (6,211,427 | ) |
| | |
Net increase | | | 20,171,291 | | | | 23,654,449 | |
6 Financial Instruments
The Fund may trade in financial instruments with off-balance sheet risk in the normal course of its investing activities. These financial instruments may include written options and may involve, to a varying degree, elements of risk in excess of the amounts recognized for financial statement purposes. The notional or contractual amounts of these instruments represent the investment the Fund has in particular classes of financial instruments and do not necessarily represent the amounts potentially subject to risk. The measurement of the risks associated with these instruments is meaningful only when all
Parametric
Volatility Risk Premium - Defensive Fund
January 31, 2021
Notes to Financial Statements — continued
related and offsetting transactions are considered. A summary of obligations under these financial instruments at January 31, 2021 is included in the Portfolio of Investments. At January 31, 2021, the Fund had sufficient cash and/or securities to cover commitments under these contracts.
The Fund is subject to equity price risk in the normal course of pursuing its investment objective. The Fund employs a systematic, rules based options strategy of writing call and put options on the S&P 500 Index, that seeks to take advantage of the volatility risk premium (i.e., the tendency for volatility priced into an option to be higher, on average, than the volatility actually experienced on the securities underlying the option). Premiums received from writing options can offset the equity risk premium foregone.
The fair value of open derivative instruments (not considered to be hedging instruments for accounting disclosure purposes) and whose primary underlying risk exposure is equity price risk at January 31, 2021 was as follows:
| | | | | | | | |
| | | Fair Value | |
| Derivative | | Asset Derivative | | | Liability Derivative(1) | |
| | |
Written options | | $ | — | | | $ | (5,975,688 | ) |
| (1) | Statement of Assets and Liabilities location: Written options outstanding, at value. |
The effect of derivative instruments (not considered to be hedging instruments for accounting disclosure purposes) on the Statement of Operations and whose primary underlying risk exposure is equity price risk for the year ended January 31, 2021 was as follows:
| | | | | | | | |
| Derivative | | Realized Gain (Loss)
on Derivatives Recognized
in Income(1) | | | Change in Unrealized
Appreciation (Depreciation) on
Derivatives Recognized in Income(2) | |
| | |
Written options | | $ | (25,417,876 | ) | | $ | (807,527 | ) |
| (1) | Statement of Operations location: Net realized gain (loss) – Written options. |
| (2) | Statement of Operations location: Change in unrealized appreciation (depreciation) – Written options. |
The average number of written options contracts outstanding during the year ended January 31, 2021, which is indicative of the volume of this derivative type, was 2,237 contracts.
7 Line of Credit
The Fund participates with other portfolios and funds managed by EVM and its affiliates in an $800 million unsecured line of credit agreement with a group of banks, which is in effect through October 26, 2021. Borrowings are made by the Fund solely for temporary purposes related to redemptions and other short-term cash needs. Interest is charged to the Fund based on its borrowings at an amount above either the Eurodollar rate or Federal Funds rate. In addition, a fee computed at an annual rate of 0.15% on the daily unused portion of the line of credit is allocated among the participating portfolios and funds at the end of each quarter. In connection with the renewal of the agreement in October 2020, an upfront fee and arrangement fee totaling $950,000 was incurred that was allocated to the participating portfolios and funds. Because the line of credit is not available exclusively to the Fund, it may be unable to borrow some or all of its requested amounts at any particular time. The Fund did not have any significant borrowings or allocated fees during the year ended January 31, 2021.
8 Securities Lending Agreement
The Fund has established a securities lending agreement with State Street Bank and Trust Company (SSBT) as securities lending agent in which the Fund lends portfolio securities to qualified borrowers in exchange for collateral consisting of either cash or securities issued or guaranteed by the U.S. government or its agencies or instrumentalities in an amount at least equal to the market value of the securities on loan. The market value of securities loaned is determined daily and any additional required collateral is delivered to the Fund on the next business day. Cash collateral is invested in the State Street Navigator Securities Lending Government Money Market Portfolio, a money market fund registered under the 1940 Act. The Fund earns interest on the amount invested but it must pay (and at times receive from) the broker a loan rebate fee computed as a varying percentage of the collateral received. For security loans secured by non-cash collateral, the Fund earns a negotiated lending fee from the borrower. A portion of the income earned by the Fund from its investment of cash collateral, net of rebate fees, and lending fees received is allocated to SSBT for its services as lending agent and the portion allocated to the Fund is presented as securities lending income, net on the Statement of Operations. Non-cash collateral is held by the lending agent on behalf of the Fund and cannot be sold or re-pledged by the Fund; accordingly, such collateral is not reflected in the Statement of Assets and Liabilities.
The Fund is subject to possible delay in the recovery of loaned securities. Pursuant to the securities lending agreement, SSBT has provided indemnification to the Fund in the event of default by a borrower with respect to a loan. The Fund bears the risk of loss with respect to the investment of cash collateral.
Parametric
Volatility Risk Premium - Defensive Fund
January 31, 2021
Notes to Financial Statements — continued
At January 31, 2021, the value of the securities loaned and the value of the collateral received, which exceeded the value of the securities loaned, amounted to $55,644,573 and $56,805,560, respectively. Collateral received was comprised of cash of $663,910 and U.S. government and/or agencies securities of $56,141,650. The securities lending transactions have no contractual maturity date and each of the Fund and borrower has the option to terminate a loan at any time.
The following table provides a breakdown of securities lending transactions accounted for as secured borrowings, the obligations by class of collateral pledged, and the remaining contractual maturity of those transactions as of January 31, 2021.
| | | | | | | | | | | | | | | | | | | | |
| | | Remaining Contractual Maturity of the Transactions | |
| | | Overnight and
Continuous | | | <30 days | | | 30 to 90 days | | | >90 days | | | Total | |
| | | | | |
Common Stocks | | $ | 663,910 | | | $ | — | | | $ | — | | | $ | — | | | $ | 663,910 | |
The carrying amount of the liability for collateral for securities loaned at January 31, 2021 approximated its fair value. If measured at fair value, such liability would have been considered as Level 2 in the fair value hierarchy (see Note 10) at January 31, 2021.
9 Investments in Affiliated Funds
At January 31, 2021, the value of the Fund’s investment in affiliated funds was $5,138,768, which represents 0.5% of the Fund’s net assets. Transactions in affiliated funds by the Fund for the year ended January 31, 2021 were as follows:
| | | | | | | | | | | | | | | | | | | | | | | | | | | | | | | | |
| Name of affiliated fund | | Value,
beginning
of period | | | Purchases | | | Sales proceeds | | | Net realized
gain (loss) | | | Change in
unrealized
appreciation
(depreciation) | | | Value, end
of period | | | Dividend
income | | | Units, end
of period | |
|
Short-Term Investments | |
| | | | | | | | |
Eaton Vance Cash Reserves Fund, LLC | | $ | 9,875,469 | | | $ | 503,156,455 | | | $ | (507,891,839 | ) | | $ | (1,063 | ) | | $ | (254 | ) | | $ | 5,138,768 | | | $ | 74,470 | | | | 5,138,768 | |
10 Fair Value Measurements
Under generally accepted accounting principles for fair value measurements, a three-tier hierarchy to prioritize the assumptions, referred to as inputs, is used in valuation techniques to measure fair value. The three-tier hierarchy of inputs is summarized in the three broad levels listed below.
| • | | Level 1 – quoted prices in active markets for identical investments |
| • | | Level 2 – other significant observable inputs (including quoted prices for similar investments, interest rates, prepayment speeds, credit risk, etc.) |
| • | | Level 3 – significant unobservable inputs (including a fund’s own assumptions in determining the fair value of investments) |
In cases where the inputs used to measure fair value fall in different levels of the fair value hierarchy, the level disclosed is determined based on the lowest level input that is significant to the fair value measurement in its entirety. The inputs or methodology used for valuing securities are not necessarily an indication of the risk associated with investing in those securities.
Parametric
Volatility Risk Premium - Defensive Fund
January 31, 2021
Notes to Financial Statements — continued
At January 31, 2021, the hierarchy of inputs used in valuing the Fund’s investments and open derivative instruments, which are carried at value, were as follows:
| | | | | | | | | | | | | | | | |
| Asset Description | | Level 1 | | | Level 2 | | | Level 3 | | | Total | |
| | | | |
Common Stocks | | $ | 513,951,975 | * | | $ | — | | | $ | — | | | $ | 513,951,975 | |
| | | | |
Short-Term Investments — | | | | | | | | | | | | | | | | |
| | | | |
U.S. Treasury Obligations | | | — | | | | 526,696,507 | | | | — | | | | 526,696,507 | |
| | | | |
Other | | | 663,910 | | | | 5,138,768 | | | | — | | | | 5,802,678 | |
| | | | |
Total Investments | | $ | 514,615,885 | | | $ | 531,835,275 | | | $ | — | | | $ | 1,046,451,160 | |
| | | | |
Liability Description | | | | | | | | | | | | | | | | |
| | | | |
Written Call Options | | $ | (494,178 | ) | | $ | — | | | $ | — | | | $ | (494,178 | ) |
| | | | |
Written Put Options | | | (5,481,510 | ) | | | — | | | | — | | | | (5,481,510 | ) |
| | | | |
Total | | $ | (5,975,688 | ) | | $ | — | | | $ | — | | | $ | (5,975,688 | ) |
| * | The level classification by major category of investments is the same as the category presentation in the Portfolio of Investments. |
11 Risks and Uncertainties
Pandemic Risk
An outbreak of respiratory disease caused by a novel coronavirus was first detected in China in December 2019 and subsequently spread internationally. This coronavirus has resulted in closing borders, enhanced health screenings, changes to healthcare service preparation and delivery, quarantines, cancellations, disruptions to supply chains and customer activity, as well as general concern and uncertainty. Health crises caused by outbreaks, such as the coronavirus outbreak, may exacerbate other pre-existing political, social and economic risks and disrupt normal market conditions and operations. The impact of this outbreak has negatively affected the worldwide economy, the economies of individual countries, individual companies, and the market in general, and may continue to do so in significant and unforeseen ways, as may other epidemics and pandemics that may arise in the future. Any such impact could adversely affect the Fund’s performance, or the performance of the securities in which the Fund invests.
12 Additional Information
On October 8, 2020, Morgan Stanley and Eaton Vance Corp. (“Eaton Vance”) announced that they had entered into a definitive agreement under which Morgan Stanley would acquire Eaton Vance. Under the Investment Company Act of 1940, as amended, consummation of this transaction may have been deemed to result in the automatic termination of an Eaton Vance Fund’s investment advisory agreement and where applicable, any related sub-advisory agreement. On November 24, 2020, the Fund’s Board approved a new investment advisory and administrative agreement and new sub-advisory agreement. The new investment advisory and administrative agreement and new sub-advisory agreement were approved by Fund shareholders at a joint special meeting of shareholders held on February 18, 2021, and became effective upon the consummation of the transaction on March 1, 2021.
Parametric
Volatility Risk Premium - Defensive Fund
January 31, 2021
Report of Independent Registered Public Accounting Firm
To the Trustees of Eaton Vance Mutual Funds Trust and Shareholders of Parametric Volatility Risk Premium - Defensive Fund:
Opinion on the Financial Statements and Financial Highlights
We have audited the accompanying statement of assets and liabilities of Parametric Volatility Risk Premium - Defensive Fund (the “Fund”) (one of the funds constituting Eaton Vance Mutual Funds Trust), including the portfolio of investments, as of January 31, 2021, the related statement of operations for the year then ended, the statements of changes in net assets for each of the two years in the period then ended, the financial highlights for each of the three years in the period then ended and the period from the start of business, February 9, 2017 to January 31, 2018, and the related notes. In our opinion, the financial statements and financial highlights present fairly, in all material respects, the financial position of the Fund as of January 31, 2021, and the results of its operations for the year then ended, the changes in its net assets for each of the two years in the period then ended, and the financial highlights for each of the three years in the period then ended and the period from the start of business, February 9, 2017 to January 31, 2018, in conformity with accounting principles generally accepted in the United States of America.
Basis for Opinion
These financial statements and financial highlights are the responsibility of the Fund’s management. Our responsibility is to express an opinion on the Fund’s financial statements and financial highlights based on our audits. We are a public accounting firm registered with the Public Company Accounting Oversight Board (United States) (PCAOB) and are required to be independent with respect to the Fund in accordance with the U.S. federal securities laws and the applicable rules and regulations of the Securities and Exchange Commission and the PCAOB.
We conducted our audits in accordance with the standards of the PCAOB. Those standards require that we plan and perform the audit to obtain reasonable assurance about whether the financial statements and financial highlights are free of material misstatement, whether due to error or fraud. The Fund is not required to have, nor were we engaged to perform, an audit of its internal control over financial reporting. As part of our audits we are required to obtain an understanding of internal control over financial reporting but not for the purpose of expressing an opinion on the effectiveness of the Fund’s internal control over financial reporting. Accordingly, we express no such opinion.
Our audits included performing procedures to assess the risks of material misstatement of the financial statements and financial highlights, whether due to error or fraud, and performing procedures that respond to those risks. Such procedures included examining, on a test basis, evidence regarding the amounts and disclosures in the financial statements and financial highlights. Our audits also included evaluating the accounting principles used and significant estimates made by management, as well as evaluating the overall presentation of the financial statements and financial highlights. Our procedures included confirmation of securities owned as of January 31, 2021, by correspondence with the custodian and brokers; when replies were not received from brokers, we performed other auditing procedures. We believe that our audits provide a reasonable basis for our opinion.
/s/ Deloitte & Touche LLP
Boston, Massachusetts
March 19, 2021
We have served as the auditor of one or more Eaton Vance investment companies since 1959.
Parametric
Volatility Risk Premium - Defensive Fund
January 31, 2021
Federal Tax Information (Unaudited)
The Form 1099-DIV you receive in February 2022 will show the tax status of all distributions paid to your account in calendar year 2021. Shareholders are advised to consult their own tax adviser with respect to the tax consequences of their investment in the Fund. As required by the Internal Revenue Code and/or regulations, shareholders must be notified regarding the status of qualified business income, qualified dividend income for individuals, the dividends received deduction for corporations and 163(j) interest dividends.
Qualified Business Income. For the fiscal year ended January 31, 2021, the Fund designates $128,943, or up to the maximum amount of such dividends allowable pursuant to the Internal Revenue Code, as qualified business income.
Qualified Dividend Income. For the fiscal year ended January 31, 2021, the Fund designates approximately $7,687,443, or up to the maximum amount of such dividends allowable pursuant to the Internal Revenue Code, as qualified dividend income eligible for the reduced tax rate of 15%.
Dividends Received Deduction. Corporate shareholders are generally entitled to take the dividends received deduction on the portion of the Fund’s dividend distribution that qualifies under tax law. For the Fund’s fiscal 2021 ordinary income dividends, 89.94% qualifies for the corporate dividends received deduction.
163(j) Interest Dividends. For the fiscal year ended January 31, 2021, the Fund designates 32.44% of distributions from net investment income as a 163(j) interest dividend.
Parametric
Volatility Risk Premium - Defensive Fund
January 31, 2021
Board of Trustees’ Contract Approval
Overview of the Contract Review Process
Even though the following description of the Board’s (as defined below) consideration of investment advisory and, as applicable, sub-advisory agreements covers multiple funds, for purposes of this shareholder report, the description is only relevant as to Parametric Volatility Risk Premium - Defensive Fund.
| | | | |
| Fund | | Investment Adviser | | Investment Sub-Adviser |
| | |
Parametric Volatility Risk Premium - Defensive Fund | | Eaton Vance Management | | Parametric Portfolio Associates LLC |
At a meeting held on November 24, 2020 (the “November Meeting”), the Board of each Eaton Vance open-end Fund and portfolios in which each such Fund invests, as applicable (each, a “Fund” and, collectively, the “Funds”), including a majority of the Board members (the “Independent Trustees”) who are not “interested persons” (as defined in the Investment Company Act of 1940 (the “1940 Act”)) of the Funds, Eaton Vance Management (“EVM”) or Boston Management and Research (“BMR” and, together with EVM, the “Advisers”), voted to approve a new investment advisory agreement between each Fund and either EVM or BMR (the “New Investment Advisory Agreements”) and, for certain Funds, a new investment sub-advisory agreement between an Adviser and the applicable Sub-Adviser (the “New Investment Sub-Advisory Agreements”(1) and, together with the New Investment Advisory Agreements, the “New Agreements”), each of which is intended to go into effect upon the completion of the Transaction (as defined below), as more fully described below. In voting its approval of the New Agreements at the November Meeting, the Board relied on an order issued by the Securities and Exchange Commission in response to the impacts of the COVID-19 pandemic that provided temporary relief from the in-person meeting requirements under Section 15 of the 1940 Act.
In voting its approval of the New Agreements, the Board of each Fund relied upon the recommendation of its Contract Review Committee, which is a committee comprised exclusively of Independent Trustees. Prior to and during meetings leading up to the November Meeting, the Contract Review Committee reviewed and discussed information furnished by the Advisers, the Sub-Advisers, and Morgan Stanley, as requested by the Independent Trustees, that the Contract Review Committee considered reasonably necessary to evaluate the terms of the New Agreements and to form its recommendation. Such information included, among other things, the terms and anticipated impacts of Morgan Stanley’s pending acquisition of Eaton Vance Corp. (the “Transaction”) on the Funds and their shareholders. In addition to considering information furnished specifically to evaluate the impact of the Transaction on the Funds and their respective shareholders, the Board and its Contract Review Committee also considered information furnished for prior meetings of the Board and its committees, including information provided in connection with the annual contract review process for the Funds, which most recently culminated in April 2020 (the “2020 Annual Approval Process”).
The Board of each Fund, including the Independent Trustees, concluded that the applicable New Investment Advisory Agreement and, as applicable, New Investment Sub-Advisory Agreement, including the fees payable thereunder, was fair and reasonable, and it voted to approve the New Investment Advisory Agreement and, as applicable, New Investment Sub-Advisory Agreement and to recommend that shareholders do so as well.
Shortly after the announcement of the Transaction, the Board, including all of the Independent Trustees, met with senior representatives from the Advisers and Morgan Stanley at its meeting held on October 13, 2020 to discuss certain aspects of the Transaction and the expected impacts of the Transaction on the Funds and their shareholders. As part of the Board’s evaluation process, counsel to the Independent Trustees, on behalf of the Contract Review Committee, requested additional information to assist the Independent Trustees in their evaluation of the New Agreements and the implications of the Transaction, as well as other contractual arrangements that may be affected by the Transaction. The Contract Review Committee considered information furnished by the Advisers and Morgan Stanley, their respective affiliates, and, as applicable, the Sub-Advisers during meetings on November 5, 2020, November 10, 2020, November 13, 2020, November 17, 2020 and November 24, 2020.
During its meetings on November 10, 2020 and November 17, 2020, the Contract Review Committee further discussed the approval of the New Agreements with senior representatives of the Advisers, the Affiliated Sub-Advisers, and Morgan Stanley. The representatives from the Advisers, the Affiliated Sub-Advisers, and Morgan Stanley each made presentations to, and responded to questions from, the Independent Trustees. The Contract Review Committee considered the Advisers’, the Affiliated Sub-Advisers’ and Morgan Stanley’s responses related to the Transaction and specifically to the Funds, as well as information received in connection with the 2020 Annual Approval Process, with respect to its evaluation of the New Agreements. Among other information, the Board considered:
Information about the Transaction and its Terms
| | • | | Information about the material terms and conditions, and expected impacts, of the Transaction that relate to the Funds, including the expected impacts on the businesses conducted by the Advisers, the Affiliated Sub-Advisers and Eaton Vance Distributors, Inc., as the distributor of Fund shares; |
| (1) | With respect to certain of the Funds, the applicable Adviser is currently a party to a sub-advisory agreement (collectively, the “Current Sub-Advisory Agreements”) with Atlanta Capital Management Company, LLC (“Atlanta Capital”), BMO Global Asset Management (Asia) Limited, Eaton Vance Advisers International Ltd. (“EVAIL”), Goldman Sachs Asset Management, L.P., Hexavest Inc. (“Hexavest”), Parametric Portfolio Associates LLC (“Parametric”) or Richard Bernstein Advisors LLC (collectively, the “Sub-Advisers” and, with respect to Atlanta Capital, EVAIL, Hexavest and Parametric, each an affiliate of the Advisers, the “Affiliated Sub-Advisers”). Accordingly, references to the “Sub-Advisers,” the “Affiliated Sub-Advisers” or the “New Sub-Advisory Agreements” are not applicable to all Funds. |
Parametric
Volatility Risk Premium - Defensive Fund
January 31, 2021
Board of Trustees’ Contract Approval — continued
| | • | | Information about the advantages of the Transaction as they relate to the Funds and their shareholders; |
| | • | | A commitment that the Funds would not bear any expenses, directly or indirectly, in connection with the Transaction; |
| | • | | A commitment that, for a period of three years after the Closing, at least 75% of each Fund’s Board members must not be “interested persons” (as defined in the 1940 Act) of the investment adviser (or predecessor investment adviser, if applicable) pursuant to Section 15(f)(1)(A) of the 1940 Act; |
| | • | | A commitment that Morgan Stanley would use its reasonable best efforts to ensure that it did not impose any “unfair burden” (as that term is used in section 15(f)(1)(B) of the 1940 Act) on the Funds as a result of the Transaction; |
| | • | | Information with respect to personnel and/or other resources of the Advisers and their affiliates, including the Affiliated Sub-Advisers, as a result of the Transaction, as well as any expected changes to compensation, including any retention-based compensation intended to incentivize key personnel at the Advisers and their affiliates, including the Affiliated Sub-Advisers; |
| | • | | Information regarding any changes that are expected with respect to the Funds’ slate of officers as a result of the Transaction; |
Information about Morgan Stanley
| | • | | Information about Morgan Stanley’s overall business, including information about the advisory, brokerage and related businesses that Morgan Stanley operates; |
| | • | | Information about Morgan Stanley’s financial condition, including its access to capital and other resources required to support the investment advisory businesses related to the Funds; |
| | • | | Information on how the Funds are expected to fit within Morgan Stanley’s overall business strategy, and any changes that Morgan Stanley contemplates implementing to the Funds in the short- or long-term following the closing of the Transaction (the “Closing”); |
| | • | | Information regarding risk management functions at Morgan Stanley and its affiliates, including how existing risk management protocols and procedures may impact the Funds and/or the businesses of the Advisers and their affiliates, including the Affiliated Sub-Advisers, as they relate to the Funds; |
| | • | | Information on the anticipated benefits of the Transaction to the Funds with respect to potential additional distribution capabilities and the ability to access new markets and customer segments through Morgan Stanley’s distribution network, including, in particular, its institutional client base; |
| | • | | Information regarding the financial condition and reputation of Morgan Stanley, its worldwide presence, experience as a fund sponsor and manager, commitment to maintain a high level of cooperation with, and support to, the Funds, strong client service capabilities, and relationships in the asset management industry; |
Information about the New Agreements for Funds
| | • | | A representation that, after the Closing, all of the Funds will continue to be advised by their current Adviser and Sub-Adviser, as applicable; |
| | • | | Information regarding the terms of the New Agreements, including certain changes as compared to the current investment advisory agreement between each Fund and its Adviser (collectively, the “Current Advisory Agreements”) and, as applicable, the current investment sub-advisory agreement between a Fund and a Sub-Adviser (together with the Current Advisory Agreements, the “Current Agreements”); |
| | • | | Information confirming that the fee rates payable under the New Agreements are not changed as compared to the Current Agreements; |
| | • | | A representation that the New Agreements will not cause any diminution in the nature, extent and quality of services provided by the Advisers and the Sub-Advisers to the Funds and their respective shareholders, including with respect to compliance and other non-advisory services; |
Information about Fund Performance, Fees and Expenses
| | • | | A report from an independent data provider comparing the investment performance of each Fund (including, as relevant, total return data, income data, Sharpe ratios and information ratios) to the investment performance of comparable funds and, as applicable, benchmark indices, over various time periods as of the 2020 Annual Approval Process, as well as performance information as of a more recent date; |
| | • | | A report from an independent data provider comparing each Fund’s total expense ratio (and its components) to those of comparable funds as of the 2020 Annual Approval Process, as well as fee and expense information as of a more recent date; |
| | • | | In certain instances, data regarding investment performance relative to customized groups of peer funds and blended indices identified by the Advisers in consultation with the Portfolio Management Committee of the Board as of the 2020 Annual Approval Process, as well as corresponding performance information as of a more recent date; |
| | • | | Comparative information concerning the fees charged and services provided by the Adviser and the Sub-Adviser to each Fund in managing other accounts (which may include other mutual funds, collective investment funds and institutional accounts) using investment strategies and techniques similar to those used in managing such Fund(s), if any; |
| | • | | Profitability analyses of the Advisers and the Affiliated Sub-Advisers, as applicable, with respect to each of the Funds as of the 2020 Annual Approval Process, as well as information regarding the impact of the Transaction on profitability; |
Information about Portfolio Management and Trading
| | • | | Descriptions of the investment management services currently provided and expected to be provided to each Fund after the Transaction, as well as each of the Funds’ investment strategies and policies; |
| | • | | The procedures and processes used to determine the fair value of Fund assets, when necessary, and actions taken to monitor and test the effectiveness of such procedures and processes; |
Parametric
Volatility Risk Premium - Defensive Fund
January 31, 2021
Board of Trustees’ Contract Approval — continued
| | • | | Information about any changes to the policies and practices of the Advisers and, as applicable, each Fund’s Sub-Adviser with respect to trading, including their processes for seeking best execution of portfolio transactions; |
| | • | | Information regarding the impact on trading and access to capital markets associated with the Funds’ affiliations with Morgan Stanley and its affiliates, including potential restrictions with respect to the Funds’ ability to execute portfolio transactions with Morgan Stanley and its affiliates; |
Information about the Advisers and the Sub-Advisers
| | • | | Information about the financial results and condition of the Advisers and the Affiliated Sub-Advisers since the culmination of the 2020 Annual Approval Process and any material changes in financial condition that are reasonably expected to occur before and after the Closing; |
| | • | | Information regarding contemplated changes to the individual investment professionals whose responsibilities include portfolio management and investment research for the Funds, and, for portfolio managers and certain other investment professionals, information relating to their responsibilities with respect to managing other mutual funds and investment accounts, as applicable, post-Closing; |
| | • | | The Code of Ethics of the Advisers and their affiliates, including the Affiliated Sub-Advisers, together with information relating to compliance with, and the administration of, such codes; |
| | • | | Policies and procedures relating to proxy voting and the handling of corporate actions and class actions; |
| | • | | Information concerning the resources devoted to compliance efforts undertaken by the Advisers and their affiliates, including the Affiliated Sub-Advisers, including descriptions of their various compliance programs and their record of compliance; |
| | • | | Information concerning the business continuity and disaster recovery plans of the Advisers and their affiliates, including the Affiliated Sub-Advisers; |
| | • | | A description of the Advisers’ oversight of the Sub-Advisers, including with respect to regulatory and compliance issues, investment management and other matters; |
Other Relevant Information
| | • | | Information concerning the nature, cost and character of the administrative and other non-investment advisory services provided by the Advisers and their affiliates; |
| | • | | Information concerning oversight of the relationship with the custodian, subcustodians and fund accountants by EVM and/or administrator to each of the Funds; |
| | • | | Confirmation that the Advisers intend to continue to manage the Funds in a manner materially consistent with each Fund’s current investment objective(s) and principal investment strategies; |
| | • | | Information regarding Morgan Stanley’s commitment to maintaining competitive compensation arrangements to attract and retain highly qualified personnel; |
| | • | | Confirmation that the Advisers’ current senior management teams have indicated their strong support of the Transaction; and |
| | • | | Information regarding the fact that Morgan Stanley and Eaton Vance Corp. will each derive benefits from the Transaction and that, as a result, they have a financial interest in the matters that were being considered. |
As indicated above, the Board and its Contract Review Committee also considered information received at its regularly scheduled meetings throughout the year, which included information from portfolio managers and other investment professionals of the Advisers and the Sub-Advisers regarding investment and performance matters, and considered various investment and trading strategies used in pursuing the Funds’ investment objectives. The Board also received information regarding risk management techniques employed in connection with the management of the Funds. The Board and its committees evaluated issues pertaining to industry and regulatory developments, compliance procedures, fund governance and other issues with respect to the Funds, and received and participated in reports and presentations provided by the Advisers and their affiliates, including the Affiliated Sub-Advisers, with respect to such matters.
The Contract Review Committee was advised throughout the evaluation process by Goodwin Procter LLP, independent legal counsel for the Independent Trustees. The members of the Contract Review Committee, with the advice of such counsel, exercised their own business judgment in determining the material factors to be considered in evaluating the New Agreements and the weight to be given to each such factor. The conclusions reached with respect to the New Agreements were based on a comprehensive evaluation of all the information provided and not any single factor. Moreover, each Independent Trustee may have placed varying emphasis on particular factors in reaching conclusions with respect to the New Agreements.
Nature, Extent and Quality of Services
In considering whether to approve the New Agreements, the Board evaluated the nature, extent and quality of services currently provided to each Fund by the Advisers and, as applicable, the Sub-Advisers under the Current Agreements. In evaluating the nature, extent and quality of services to be provided by the Advisers and the Sub-Advisers under the New Agreements, the Board considered, among other information, the expected impact, if any, of the Transaction on the operations, facilities, organization and personnel of the Advisers and the Sub-Advisers, and that Morgan Stanley and the Advisers have advised the Board that, following the Transaction, there is not expected to be any diminution in the nature, extent and quality of services provided by the Advisers and the Sub-Advisers, as applicable, to the Funds and their shareholders, including compliance and other non-advisory services, and that there are not expected to be any changes in portfolio management personnel as a result of the Transaction.
Parametric
Volatility Risk Premium - Defensive Fund
January 31, 2021
Board of Trustees’ Contract Approval — continued
The Board also considered the financial resources of Morgan Stanley and the Advisers and the importance of having a Fund manager with, or with access to, significant organizational and financial resources. The Board considered the benefits to the Funds of being part of a larger combined organization with greater financial resources following the Transaction, particularly during periods of market disruptions and volatility. In this regard, the Board considered information provided by Morgan Stanley regarding its business and operating structure, scale of operation, leadership and reputation, distribution capabilities, and financial condition, as well as information on how the Funds are expected to fit within Morgan Stanley’s overall business strategy and any changes that Morgan Stanley contemplates in the short- or long-term following the Closing. The Board also noted Morgan Stanley’s and the Advisers’ commitment to keep the Board apprised of developments with respect to its long-term integration plans for the Advisers, the Affiliated Sub-Advisers, and existing Morgan Stanley affiliates and their respective personnel.
The Board considered the Advisers’ and the Sub-Advisers’ management capabilities and investment processes in light of the types of investments held by each Fund, including the education, experience and number of investment professionals and other personnel who provide portfolio management, investment research, and similar services to each Fund. In particular, the Board considered the abilities and experience of the Advisers’ and, as applicable, the Sub-Advisers’ investment professionals in implementing each Fund’s investment strategies. The Board also took into account the resources dedicated to portfolio management and other services, the compensation methods of the Advisers and other factors, including the reputation and resources of the Advisers to recruit and retain highly qualified research, advisory and supervisory investment professionals. With respect to the recruitment and retention of key personnel, the Board noted information from Morgan Stanley and the Advisers regarding the benefits of joining Morgan Stanley. In addition, the Board considered the time and attention devoted to the Funds by senior management, as well as the infrastructure, operational capabilities and support staff in place to assist in the portfolio management and operations of the Funds, including the provision of administrative services. With respect to the foregoing, the Board also considered information from the Advisers and Morgan Stanley regarding the anticipated impact of the Transaction on such matters. The Board also considered the business-related and other risks to which the Advisers or their affiliates may be subject in managing the Funds and in connection with the Transaction.
The Board considered the compliance programs of the Advisers and relevant affiliates thereof, including the Affiliated Sub-Advisers. The Board considered compliance and reporting matters regarding, among other things, personal trading by investment professionals, disclosure of portfolio holdings, late trading, frequent trading, portfolio valuation, business continuity and the allocation of investment opportunities. The Board also considered the responses of the Advisers and their affiliates to requests in recent years from regulatory authorities, such as the Securities and Exchange Commission and the Financial Industry Regulatory Authority. The Board also considered certain information relating to the compliance record of Morgan Stanley and its affiliates, including information requests in recent years from regulatory authorities. With respect to the foregoing, including the compliance programs of the Advisers and the Sub-Advisers, the Board noted information regarding the impacts of the Transaction, as well as the Advisers’ and Morgan Stanley’s commitment to keep the Board apprised of developments with respect to its long-term integration plans for the Advisers, the Affiliated Sub-Advisers and existing Morgan Stanley affiliates and their respective personnel.
The Board considered other administrative services provided and to be provided or overseen by the Advisers and their affiliates, including transfer agency and accounting services. The Board evaluated the benefits to shareholders of investing in a fund that is a part of a large fund complex offering exposure to a variety of asset classes and investment disciplines, as well as the ability, in many cases, to exchange an investment among different funds without incurring additional sales charges. The Board noted information that the Transaction was not expected to have any material impact on such matters in the near-term.
In evaluating the nature, extent and quality of the services to be provided under the New Agreements, the Board also considered investment performance information provided for each Fund in connection with the 2020 Annual Approval Process, as well as information provided as of a more recent date. In this regard, the Board compared each Fund’s investment performance to that of comparable funds identified by an independent data provider (the peer group), as well as appropriate benchmark indices and, for certain Funds, a custom peer group of similarly managed funds. The Board also considered, where applicable, Fund-specific performance explanations based on criteria established by the Board in connection with the 2020 Annual Approval Process and, where applicable, performance explanations as of a more recent date. In addition to the foregoing information, it was also noted that the Board has received and discussed with management information throughout the year at periodic intervals comparing each Fund’s performance against applicable benchmark indices and peer groups. In addition, the Board considered each Fund’s performance in light of overall financial market conditions. Where a Fund’s relative underperformance to its peers was significant during one or more specified periods, the Board noted the explanation from the applicable Adviser concerning the Fund’s relative performance versus its peer group.
After consideration of the foregoing factors, among others, and based on their review of the materials provided and the assurances received from, and recommendations of, the Advisers and Morgan Stanley, the Board determined that the Transaction was not expected to adversely affect the nature, extent and quality of services provided to the Funds by the Advisers and their affiliates, including the Affiliated Sub-Advisers, and that the Transaction was not expected to have an adverse effect on the ability of the Advisers and their affiliates, including the Affiliated Sub-Advisers, to provide those services. The Board concluded that the nature, extent and quality of services expected to be provided by the Advisers and the Sub-Advisers, taken as a whole, are appropriate and expected to be consistent with the terms of the New Agreements.
Management Fees and Expenses
The Board considered contractual fee rates payable by each Fund for advisory and administrative services (referred to collectively as “management fees”) in connection with the 2020 Annual Approval Process, as well as information provided as of a more recent date. As part of its review, the Board considered each Fund’s management fees and total expense ratio over various periods, as compared to those of comparable funds, before and after giving effect to any
Parametric
Volatility Risk Premium - Defensive Fund
January 31, 2021
Board of Trustees’ Contract Approval — continued
undertaking to waive fees or reimburse expenses. The Board also considered factors, and, where applicable, certain Fund-specific factors, that had an impact on a Fund’s total expense ratio relative to comparable funds, as identified by the Advisers in response to inquiries from the Contract Review Committee. The Board considered that the New Agreements do not change a Fund’s management fee rate or the computation method for calculating such fees, including any separately executed permanent contractual management fee reduction currently in place for the Fund.
The Board also received and considered, where applicable, information about the services offered and the fee rates charged by the Advisers and the Sub-Advisers to other types of accounts with investment objectives and strategies that are substantially similar to and/or managed in a similar investment style as a Fund. In this regard, the Board received information about the differences in the nature and scope of services the Advisers and the Sub-Advisers, as applicable, provide to the Funds as compared to other types of accounts and the material differences in compliance, reporting and other legal burdens and risks to the Advisers and such Sub-Advisers as between each Fund and other types of accounts.
After considering the foregoing information, and in light of the nature, extent and quality of the services expected to be provided by the Advisers and the Sub-Advisers, the Board concluded that the management fees charged for advisory and related services are reasonable with respect to its approval of the New Agreements.
Profitability and “Fall-Out” Benefits
During the 2020 Annual Approval Process, the Board considered the level of profits realized by the Advisers and relevant affiliates thereof, including the Affiliated Sub-Advisers, in providing investment advisory and administrative services to the Funds and to all Eaton Vance funds as a group. The Board considered the level of profits realized without regard to marketing support or other payments by the Advisers and their affiliates to third parties in respect of distribution or other services. In light of the foregoing factors and the nature, extent and quality of the services rendered, the profits realized by the Advisers and their affiliates, including the Sub-Advisers, were not deemed to be excessive by the Board.
The Board noted that Morgan Stanley and the Advisers are expected to realize, over time, cost savings from the Transaction based on eliminating duplicate corporate overhead expenses. The Board considered, however, information from the Advisers and Morgan Stanley that such cost savings are not expected to be realized immediately upon the Closing and that, accordingly, there are currently no specific expected changes in the levels of profitability associated with the advisory and other services provided to the Funds that are contemplated as a result of the Transaction. The Board noted that it will continue to receive information regarding profitability during its annual contract review processes, including the extent to which cost savings and/or other efficiencies result in changes to profitability levels.
The Board also considered direct or indirect fall-out benefits received by the Advisers and their affiliates, including the Affiliated Sub-Advisers, in connection with their respective relationships with the Funds, including the benefits of research services that may be available to the Advisers and their affiliates as a result of securities transactions effected for the Funds and other investment advisory clients. In evaluating the fall-out benefits to be received by the Advisers and their affiliates under the New Agreements, the Board considered whether the Transaction would have an impact on the fall-out benefits currently realized by the Advisers and their affiliates in connection with services provided pursuant to the Current Advisory Agreements.
The Board of each Fund considered that Morgan Stanley may derive reputational and other benefits from its ability to use the names of the Advisers and their affiliates in connection with operating and marketing the Funds. The Board considered that the Transaction, if completed, would significantly increase Morgan Stanley’s assets under management and expand Morgan Stanley’s investment capabilities.
Economies of Scale
The Board also considered the extent to which the Advisers and their affiliates, on the one hand, and the Funds, on the other hand, can expect to realize benefits from economies of scale as the assets of the Funds increase. The Board acknowledged the difficulty in accurately measuring the benefits resulting from economies of scale, if any, with respect to the management of any specific Fund or group of funds. As part of the 2020 Annual Approval Process, the Board reviewed data summarizing the increases and decreases in the assets of the Funds and of all Eaton Vance funds as a group over various time periods, and evaluated the extent to which the total expense ratio of each Fund and the profitability of the Advisers and their affiliates may have been affected by such increases or decreases.
The Board noted that Morgan Stanley and the Advisers are expected to benefit from possible growth of the Funds resulting from enhanced distribution capabilities, including with respect to the Funds’ potential access to Morgan Stanley’s institutional client base. Based upon the foregoing, the Board concluded that the Funds currently share in the benefits from economies of scale, if any, when they are realized by the Advisers, and that the Transaction is not expected to impede a Fund from continuing to benefit from any future economies of scale realized by its Adviser.
Conclusion
Based on its consideration of the foregoing, and such other information it deemed relevant, including the factors and conclusions described above, the Contract Review Committee recommended to the Board approval of the New Agreements. Based on the recommendation of the Contract Review Committee, the Board, including a majority of the Independent Trustees, unanimously voted to approve the New Agreements for the Funds and recommended that shareholders approve the New Agreements.
Parametric
Volatility Risk Premium - Defensive Fund
January 31, 2021
Management and Organization
Fund Management. The Trustees of Eaton Vance Mutual Funds Trust (the Trust) are responsible for the overall management and supervision of the Trust’s affairs. The Trustees and officers of the Trust are listed below. Except as indicated, each individual has held the office shown or other offices in the same company for the last five years. Trustees and officers of the Trust hold indefinite terms of office. The “noninterested Trustees” consist of those Trustees who are not “interested persons” of the Trust, as that term is defined under the 1940 Act. The business address of each Trustee and officer is Two International Place, Boston, Massachusetts 02110. As used below, “EVC” refers to Eaton Vance Corp., “EV” refers to EV LLC, “EVM” refers to Eaton Vance Management, “BMR” refers to Boston Management and Research and “EVD” refers to Eaton Vance Distributors, Inc. EV is the trustee of each of EVM and BMR. Effective March 1, 2021, each of EVM, BMR, EVD and EV are indirect wholly-owned subsidiaries of Morgan Stanley. Each officer affiliated with EVM may hold a position with other EVM affiliates that is comparable to his or her position with EVM listed below. Each Trustee oversees 139 portfolios (with the exception of Messrs. Faust and Wennerholm and Ms. Frost who oversee 138 portfolios) in the Eaton Vance Complex (including all master and feeder funds in a master feeder structure). Each officer serves as an officer of certain other Eaton Vance funds. Each Trustee and officer serves until his or her successor is elected.
| | | | | | |
| Name and Year of Birth | | Position(s)
with the
Trust | | Trustee
Since(1) | | Principal Occupation(s) and Directorships
During Past Five Years and Other Relevant Experience |
|
| Interested Trustee |
| | | |
Thomas E. Faust Jr. 1958 | | Trustee | | 2007 | | Chairman of Morgan Stanley Investment Management, Inc. (MSIM), Manager and President of EV, Chief Executive Officer of EVM and BMR, and Director of EVD. Formerly, Chairman, Chief Executive Officer and President of EVC. Trustee and/or officer of 138 registered investment companies. Mr. Faust is an interested person because of his positions with MSIM, BMR, EVM, EVD, and EV, which are affiliates of the Trust, and his former position with EVC, which was an affiliate of the Trust prior to March 1, 2021. Directorships in the Last Five Years. Formerly, Director of EVC (2007-2021) and Hexavest Inc. (2012-2021) (investment management firm). |
|
| Noninterested Trustees |
| | | |
Mark R. Fetting 1954 | | Trustee | | 2016 | | Private investor. Formerly held various positions at Legg Mason, Inc. (investment management firm) (2000-2012), including President, Chief Executive Officer, Director and Chairman (2008-2012), Senior Executive Vice President (2004-2008) and Executive Vice President (2001-2004). Formerly, President of Legg Mason family of funds (2001-2008). Formerly, Division President and Senior Officer of Prudential Financial Group, Inc. and related companies (investment management firm) (1991-2000). Other Directorships in the Last Five Years. None. |
| | | |
Cynthia E. Frost 1961 | | Trustee | | 2014 | | Private investor. Formerly, Chief Investment Officer of Brown University (university endowment) (2000-2012). Formerly, Portfolio Strategist for Duke Management Company (university endowment manager) (1995-2000). Formerly, Managing Director, Cambridge Associates (investment consulting company) (1989-1995). Formerly, Consultant, Bain and Company (management consulting firm) (1987-1989). Formerly, Senior Equity Analyst, BA Investment Management Company (1983-1985). Other Directorships in the Last Five Years. None. |
| | | |
George J. Gorman 1952 | | Vice-Chairperson of the Board and Trustee | | 2021 (Vice-Chairperson) 2014 Trustee | | Principal at George J. Gorman LLC (consulting firm). Formerly, Senior Partner at Ernst & Young LLP (a registered public accounting firm) (1974-2009). Other Directorships in the Last Five Years. None. |
| | | |
Valerie A. Mosley 1960 | | Trustee | | 2014 | | Chairwoman and Chief Executive Officer of Valmo Ventures (a consulting and investment firm). Founder of Upward Wealth, Inc., dba BrightUP, a fintech platform. Formerly, Partner and Senior Vice President, Portfolio Manager and Investment Strategist at Wellington Management Company, LLP (investment management firm) (1992-2012). Formerly, Chief Investment Officer, PG Corbin Asset Management (1990-1992). Formerly worked in institutional corporate bond sales at Kidder Peabody (1986-1990). Other Directorships in the Last Five Years. Director of DraftKings, Inc. (digital sports entertainment and gaming company) (since September 2020). Director of Groupon, Inc. (e-commerce provider) (since April 2020). Director of Envestnet, Inc. (provider of intelligent systems for wealth management and financial wellness) (since 2018). Formerly, Director of Dynex Capital, Inc. (mortgage REIT) (2013-2020). |
Parametric
Volatility Risk Premium - Defensive Fund
January 31, 2021
Management and Organization — continued
| | | | | | |
| Name and Year of Birth | | Position(s)
with the
Trust | | Trustee
Since(1) | | Principal Occupation(s) and Directorships
During Past Five Years and Other Relevant Experience |
|
| Noninterested Trustees (continued) |
| | | |
William H. Park 1947 | | Chairperson of the Board and Trustee | | 2016 (Chairperson) 2003 (Trustee) | | Private investor. Formerly, Consultant (management and transactional) (2012-2014). Formerly, Chief Financial Officer, Aveon Group L.P. (investment management firm) (2010-2011). Formerly, Vice Chairman, Commercial Industrial Finance Corp. (specialty finance company) (2006-2010). Formerly, President and Chief Executive Officer, Prizm Capital Management, LLC (investment management firm) (2002-2005). Formerly, Executive Vice President and Chief Financial Officer, United Asset Management Corporation (investment management firm) (1982-2001). Formerly, Senior Manager, Price Waterhouse (now PricewaterhouseCoopers) (a registered public accounting firm) (1972-1981). Other Directorships in the Last Five Years. None. |
| | | |
Helen Frame Peters 1948 | | Trustee | | 2008 | | Professor of Finance, Carroll School of Management, Boston College. Formerly, Dean, Carroll School of Management, Boston College (2000-2002). Formerly, Chief Investment Officer, Fixed Income, Scudder Kemper Investments (investment management firm) (1998-1999). Formerly, Chief Investment Officer, Equity and Fixed Income, Colonial Management Associates (investment management firm) (1991-1998). Other Directorships in the Last Five Years. None. |
| | | |
Keith Quinton 1958 | | Trustee | | 2018 | | Private investor, researcher and lecturer. Independent Investment Committee Member at New Hampshire Retirement System (since 2017). Formerly, Portfolio Manager and Senior Quantitative Analyst at Fidelity Investments (investment management firm) (2001-2014). Other Directorships in the Last Five Years. Director (since 2016) and Chairman (since 2019) of New Hampshire Municipal Bond Bank. |
| | | |
Marcus L. Smith 1966 | | Trustee | | 2018 | | Private investor. Member of Posse Boston Advisory Board (foundation) (since 2015). Formerly, Portfolio Manager at MFS Investment Management (investment management firm) (1994-2017). Other Directorships in the Last Five Years. Director of First Industrial Realty Trust, Inc. (an industrial REIT) (since 2021). Director of MSCI Inc. (global provider of investment decision support tools) (since 2017). Formerly, Director of DCT Industrial Trust Inc. (logistics real estate company) (2017-2018). |
| | | |
Susan J. Sutherland 1957 | | Trustee | | 2015 | | Private investor. Director of Ascot Group Limited and certain of its subsidiaries (insurance and reinsurance) (since 2017). Formerly, Director of Hagerty Holding Corp. (insurance and reinsurance) (2015-2018). Formerly, Associate, Counsel and Partner at Skadden, Arps, Slate, Meagher & Flom LLP (law firm) (1982-2013). Other Directorships in the Last Five Years. Director of Kairos Acquisition Corp. (insurance/InsurTech acquisition company) (since 2021). |
| | | |
Scott E. Wennerholm 1959 | | Trustee | | 2016 | | Private investor. Formerly, Trustee at Wheelock College (postsecondary institution) (2012-2018). Formerly, Consultant at GF Parish Group (executive recruiting firm) (2016-2017). Formerly, Chief Operating Officer and Executive Vice President at BNY Mellon Asset Management (investment management firm) (2005-2011). Formerly, Chief Operating Officer and Chief Financial Officer at Natixis Global Asset Management (investment management firm) (1997-2004). Formerly, Vice President at Fidelity Investments Institutional Services (investment management firm) (1994-1997). Other Directorships in the Last Five Years. None. |
| | | | | | |
| Name and Year of Birth | | Position(s)
with the
Trust | | Officer
Since(2) | | Principal Occupation(s)
During Past Five Years |
|
| Principal Officers who are not Trustees |
| | | |
Eric A. Stein 1980 | | President | | 2020 | | Vice President and Chief Investment Officer, Fixed Income of EVM and BMR. Prior to November 1, 2020, Mr. Stein was a co-Director of Eaton Vance’s Global Income Investments. Also Vice President of Calvert Research and Management (“CRM”). |
Parametric
Volatility Risk Premium - Defensive Fund
January 31, 2021
Management and Organization — continued
| | | | | | |
| Name and Year of Birth | | Position(s)
with the
Trust | | Officer
Since(2) | | Principal Occupation(s)
During Past Five Years |
|
| Principal Officers who are not Trustees (continued) |
| | | |
Deidre E. Walsh 1971 | | Vice President | | 2009 | | Vice President of EVM and BMR. |
| | | |
Maureen A. Gemma 1960 | | Secretary and Chief Legal Officer | | 2005 | | Vice President of EVM and BMR. Also Vice President of CRM. |
| | | |
James F. Kirchner 1967 | | Treasurer | | 2007 | | Vice President of EVM and BMR. Also Vice President of CRM. |
| | | |
Richard F. Froio 1968 | | Chief Compliance Officer | | 2017 | | Vice President of EVM and BMR since 2017. Formerly, Deputy Chief Compliance Officer (Adviser/Funds) and Chief Compliance Officer (Distribution) at PIMCO (2012-2017) and Managing Director at BlackRock/Barclays Global Investors (2009-2012). |
| (1) | Year first appointed to serve as Trustee for a fund in the Eaton Vance family of funds. Each Trustee has served continuously since appointment unless indicated otherwise. |
| (2) | Year first elected to serve as officer of a fund in the Eaton Vance family of funds when the officer has served continuously. Otherwise, year of most recent election as an officer of a fund in the Eaton Vance family of funds. Titles may have changed since initial election. |
The SAI for the Fund includes additional information about the Trustees and officers of the Fund and can be obtained without charge on Eaton Vance’s website at www.eatonvance.com or by calling 1-800-260-0761.
Eaton Vance Funds
IMPORTANT NOTICES
Privacy. The Eaton Vance organization is committed to ensuring your financial privacy. Each entity listed below has adopted privacy policy and procedures (“Privacy Program”) Eaton Vance believes is reasonably designed to protect your personal information and to govern when and with whom Eaton Vance may share your personal information.
| • | | At the time of opening an account, Eaton Vance generally requires you to provide us with certain information such as name, address, social security number, tax status, account numbers, and account balances. This information is necessary for us to both open an account for you and to allow us to satisfy legal requirements such as applicable anti-money laundering reviews and know-your-customer requirements. |
| • | | On an ongoing basis, in the normal course of servicing your account, Eaton Vance may share your information with unaffiliated third parties that perform various services for Eaton Vance and/or your account. These third parties include transfer agents, custodians, broker/dealers and our professional advisers including auditors, accountants, and legal counsel. Eaton Vance may share your personal information with our affiliates. Eaton Vance may also share your information as required or permitted by applicable law. |
| • | | We have adopted a Privacy Program we believe is reasonably designed to protect the confidentiality of your personal information and to prevent unauthorized access to your information. |
| • | | We reserve the right to change our Privacy Program at any time upon proper notification to you. You may want to review our Privacy Program periodically for changes by accessing the link on our homepage: www.eatonvance.com. |
Our pledge of protecting your personal information applies to the following entities within the Eaton Vance organization: the Eaton Vance Family of Funds, Eaton Vance Management, Eaton Vance WaterOak Advisors, Eaton Vance Distributors, Inc., Eaton Vance Trust Company, Eaton Vance Management (International) Limited, Eaton Vance Advisers International Ltd., Eaton Vance Global Advisors Limited, Eaton Vance Management’s Real Estate Investment Group, Boston Management and Research, Calvert Research and Management, and Calvert Funds. This notice supersedes all previously issued privacy disclosures. For more information about Eaton Vance’s Privacy Program or about how your personal information may be used, please call 1-800-262-1122.
Delivery of Shareholder Documents. The Securities and Exchange Commission (SEC) permits funds to deliver only one copy of shareholder documents, including prospectuses, proxy statements and shareholder reports, to fund investors with multiple accounts at the same residential or post office box address. This practice is often called “householding” and it helps eliminate duplicate mailings to shareholders. Eaton Vance, or your financial intermediary, may household the mailing of your documents indefinitely unless you instruct Eaton Vance, or your financial intermediary, otherwise. If you would prefer that your Eaton Vance documents not be householded, please contact Eaton Vance at 1-800-260-0761, or contact your financial intermediary. Your instructions that householding not apply to delivery of your Eaton Vance documents will typically be effective within 30 days of receipt by Eaton Vance or your financial intermediary.
Portfolio Holdings. Each Eaton Vance Fund and its underlying Portfolio(s) (if applicable) files a schedule of portfolio holdings on Part F to Form N-PORT with the SEC. Certain information filed on Form N-PORT may be viewed on the Eaton Vance website at www.eatonvance.com, by calling Eaton Vance at 1-800-260-0761 or in the EDGAR database on the SEC’s website at www.sec.gov.
Proxy Voting. From time to time, funds are required to vote proxies related to the securities held by the funds. The Eaton Vance Funds or their underlying Portfolios (if applicable) vote proxies according to a set of policies and procedures approved by the Funds’ and Portfolios’ Boards. You may obtain a description of these policies and procedures and information on how the Funds or Portfolios voted proxies relating to portfolio securities during the most recent 12-month period ended June 30, without charge, upon request, by calling 1-800-260-0761 and by accessing the SEC’s website at www.sec.gov.
This Page Intentionally Left Blank
This Page Intentionally Left Blank
This Page Intentionally Left Blank
Investment Adviser and Administrator
Eaton Vance Management
Two International Place
Boston, MA 02110
Investment Sub-Adviser
Parametric Portfolio Associates LLC
800 Fifth Avenue, Suite 2800
Seattle, WA 98104
Principal Underwriter*
Eaton Vance Distributors, Inc.
Two International Place
Boston, MA 02110
(617) 482-8260
Custodian
State Street Bank and Trust Company
State Street Financial Center, One Lincoln Street
Boston, MA 02111
Transfer Agent
BNY Mellon Investment Servicing (US) Inc.
Attn: Eaton Vance Funds
P.O. Box 9653
Providence, RI 02940-9653
(800) 260-0761
Independent Registered Public Accounting Firm
Deloitte & Touche LLP
200 Berkeley Street
Boston, MA 02116-5022
Fund Offices
Two International Place
Boston, MA 02110
| * | FINRA BrokerCheck. Investors may check the background of their Investment Professional by contacting the Financial Industry Regulatory Authority (FINRA). FINRA BrokerCheck is a free tool to help investors check the professional background of current and former FINRA-registered securities firms and brokers. FINRA BrokerCheck is available by calling 1-800-289-9999 and at www.FINRA.org. The FINRA BrokerCheck brochure describing this program is available to investors at www.FINRA.org. |

24691 1.31.21
The registrant (sometimes referred to as the “Fund”) has adopted a code of ethics applicable to its Principal Executive Officer, Principal Financial Officer and Principal Accounting Officer. The registrant undertakes to provide a copy of such code of ethics to any person upon request, without charge, by calling 1-800-262-1122. The registrant has not amended the code of ethics as described in Form N-CSR during the period covered by this report. The registrant has not granted any waiver, including an implicit waiver, from a provision of the code of ethics as described in Form N-CSR during the period covered by this report.
| Item 3. | Audit Committee Financial Expert |
The registrant’s Board of Trustees (the “Board”) has designated George J. Gorman and William H. Park, each an independent trustee, as audit committee financial experts. Mr. Gorman is a certified public accountant who is the Principal at George J. Gorman LLC (a consulting firm). Previously, Mr. Gorman served in various capacities at Ernst & Young LLP (a registered public accounting firm), including as Senior Partner.
Mr. Gorman also has experience serving as an independent trustee and audit committee financial expert of other mutual fund complexes. Mr. Park is a certified public accountant who is a private investor. Previously, he served as a consultant, as the Chief Financial Officer of Aveon Group, L.P. (an investment management firm), as the Vice Chairman of Commercial Industrial Finance Corp. (specialty finance company), as President and Chief Executive Officer of Prizm Capital Management, LLC (investment management firm), as Executive Vice President and Chief Financial Officer of United Asset Management Corporation (an institutional investment management firm) and as a Senior Manager at Price Waterhouse (now PricewaterhouseCoopers) (a registered public accounting firm).
| Item 4. | Principal Accountant Fees and Services |
Eaton Vance Emerging Markets Debt Fund, Parametric Emerging Markets Fund, Parametric International Equity Fund and Parametric Volatility Risk Premium - Defensive Fund (the “Fund(s)”) are series of Eaton Vance Mutual Funds Trust (the “Trust”), a Massachusetts business trust, which, including the Funds, contains a total of 34 series (the “Series”). The Trust is registered under the Investment Company Act of 1940 as an open-end management investment company. This Form N-CSR relates to the Funds’ annual reports.
(a)-(d)
The following tables present the aggregate fees billed to each Fund for the Fund’s fiscal periods ended January 31, 2020 and January 31, 2021 by the registrant’s principal accountant, Deloitte & Touche LLP (“D&T”), for professional services rendered for the audit of the Fund’s annual financial statements and fees billed for other services rendered by D&T during such periods.
| | | | | | | | |
| Eaton Vance Emerging Markets Debt Fund | | | | | | |
Fiscal Years Ended | | 1/31/20 | | | 1/31/21 | |
Audit Fees | | $ | 42,900 | | | $ | 44,450 | |
Audit-Related Fees(1) | | $ | 0 | | | $ | 0 | |
Tax Fees(2) | | $ | 18,740 | | | $ | 14,330 | |
All Other Fees(3) | | $ | 0 | | | $ | 0 | |
| | | | | | | | |
Total | | $ | 61,640 | | | $ | 58,780 | |
| | | | | | | | |
.
| | | | | | | | |
| Parametric Emerging Markets Fund | | | | | | |
Fiscal Years Ended | | 1/31/20 | | | 1/31/21 | |
Audit Fees | | $ | 81,850 | | | $ | 81,850 | |
Audit-Related Fees(1) | | $ | 0 | | | $ | 0 | |
Tax Fees(2) | | $ | 35,417 | | | $ | 30,082 | |
All Other Fees(3) | | $ | 0 | | | $ | 0 | |
| | | | | | | | |
Total | | $ | 117,267 | | | $ | 111,932 | |
| | | | | | | | |
| | | | | | | | |
| Parametric International Equity Fund | | | | | | |
Fiscal Years Ended | | 1/31/20 | | | 1/31/21 | |
Audit Fees | | $ | 37,450 | | | $ | 37,450 | |
Audit-Related Fees(1) | | $ | 0 | | | $ | 0 | |
Tax Fees(2) | | $ | 15,701 | | | $ | 12,391 | |
All Other Fees(3) | | $ | 0 | | | $ | 0 | |
| | | | | | | | |
Total | | $ | 53,131 | | | $ | 49,841 | |
| | | | | | | | |
| | | | | | | | |
| Parametric Volatility Risk Premium - Defensive Fund | | | | | | |
Fiscal Years Ended | | 1/31/20 | | | 1/31/21 | |
Audit Fees | | $ | 37,550 | | | $ | 37,550 | |
Audit-Related Fees(1) | | $ | 0 | | | $ | 0 | |
Tax Fees(2) | | $ | 17,955 | | | $ | 17,170 | |
All Other Fees(3) | | $ | 0 | | | $ | 0 | |
| | | | | | | | |
Total | | $ | 55,505 | | | $ | 54,720 | |
| | | | | | | | |
| (1) | Audit-related fees consist of the aggregate fees billed for assurance and related services that are reasonably related to the performance of the audit of financial statements and are not reported under the category of audit fees. |
| (2) | Tax fees consist of the aggregate fees billed for professional services rendered by the principal accountant relating to tax compliance, tax advice, and tax planning and specifically include fees for tax return preparation and other related tax/compliance planning matters. |
| (3) | All other fees consist of the aggregate fees billed for products and services provided by the principal accountant other than audit, audit-related, and tax services. |
The various Series comprising the Trust have differing fiscal year ends (January 31, February 28/29, September 30, October 31 or December 31). The following table presents the aggregate audit, audit-related, tax, and other fees billed to all of the Series in the Trust by D&T for the last two fiscal years of each Series.
| | | | | | | | | | | | | | | | | | | | | | | | | | | | | | | | | | | | | | | | |
Fiscal Years Ended | | 2/28/19 | | | 9/30/19 | | | 10/31/19 | | | 12/31/19 | | | 1/31/20 | | | 2/29/20 | | | 9/30/20 | | | 10/31/20 | | | 12/31/20 | | | 1/31/21 | |
Audit Fees | | $ | 25,850 | | | $ | 98,300 | | | $ | 661,708 | | | $ | 106,700 | | | $ | 156,850 | | | $ | 26,250 | | | $ | 110,800 | | | $ | 719,575 | | | $ | 106,700 | | | $ | 201,300 | |
Audit-Related Fees(1) | | $ | 0 | | | $ | 0 | | | $ | 0 | | | $ | 0 | | | $ | 0 | | | $ | 0 | | | $ | 0 | | | $ | 0 | | | $ | 0 | | | $ | 0 | |
Tax Fees(2) | | $ | 11,190 | | | $ | 24,768 | | | $ | 345,480 | | | $ | 63,478 | | | $ | 69,073 | | | $ | 11,413 | | | $ | 24,948 | | | $ | 260,719 | | | $ | 60,338 | | | $ | 73,973 | |
All Other Fees(3) | | $ | 0 | | | $ | 0 | | | $ | 0 | | | $ | 0 | | | $ | 0 | | | $ | 0 | | | $ | 0 | | | $ | 0 | | | $ | 0 | | | $ | 0 | |
| | | | | | | | | | | | | | | | | | | | | | | | | | | | | | | | | | | | | | | | |
Total | | $ | 37,040 | | | $ | 123,068 | | | $ | 1,007,188 | | | $ | 170,178 | | | $ | 225,923 | | | $ | 37,663 | | | $ | 135,748 | | | $ | 980,294 | | | $ | 167,038 | | | $ | 275,273 | |
| | | | | | | | | | | | | | | | | | | | | | | | | | | | | | | | | | | | | | | | |
| (1) | Audit-related fees consist of the aggregate fees billed for assurance and related services that are reasonably related to the performance of the audit of financial statements and are not reported under the category of audit fees. |
| (2) | Tax fees consist of the aggregate fees billed for professional services rendered by the principal accountant relating to tax compliance, tax advice, and tax planning and specifically include fees for tax return preparation and other related tax/compliance planning matters. |
| (3) | All other fees consist of the aggregate fees billed for products and services provided by the principal accountant other than audit, audit-related, and tax services. |
(e)(1) The registrant’s audit committee has adopted policies and procedures relating to the pre-approval of services provided by the registrant’s principal accountant (the “Pre-Approval Policies”). The Pre-Approval Policies establish a framework intended to assist the audit committee in the proper discharge of its pre-approval responsibilities. As a general matter, the Pre-Approval Policies (i) specify certain types of audit, audit-related, tax, and other services determined to be pre-approved by the audit committee; and (ii) delineate specific procedures governing the mechanics of the pre-approval process, including the approval and monitoring of audit and non-audit service fees. Unless a service is specifically pre-approved under the Pre-Approval Policies, it must be separately pre-approved by the audit committee.
The Pre-Approval Policies and the types of audit and non-audit services pre-approved therein must be reviewed and ratified by the registrant’s audit committee at least annually. The registrant’s audit committee maintains full responsibility for the appointment, compensation, and oversight of the work of the registrant’s principal accountant.
(e)(2) No services described in paragraphs (b)-(d) above were approved by the registrant’s audit committee pursuant to the “de minimis exception” set forth in Rule 2-01(c)(7)(i)(C) of Regulation S-X.
(f) Not applicable.
(g) The following table presents (i) the aggregate non-audit fees (i.e., fees for audit-related, tax, and other services) billed for services rendered to all of the Series in the Trust by D&T for the last two fiscal years of each Series; and (ii) the aggregate non-audit fees (i.e., fees for audit-related, tax, and other services) billed to the Eaton Vance organization by D&T for the last two fiscal years of each Series.
| | | | | | | | | | | | | | | | | | | | | | | | | | | | | | | | | | | | | | | | |
Fiscal Years Ended | | 2/28/19 | | | 9/30/19 | | | 10/31/19 | | | 12/31/19 | | | 1/31/20 | | | 2/29/20 | | | 9/30/20 | | | 10/31/20 | | | 12/31/20 | | | 1/31/21 | |
Registrant(1) | | $ | 11,190 | | | $ | 24,768 | | | $ | 345,480 | | | $ | 63,478 | | | $ | 69,073 | | | $ | 11,413 | | | $ | 24,948 | | | $ | 260,719 | | | $ | 60,338 | | | $ | 73,973 | |
Eaton Vance(2) | | $ | 126,485 | | | $ | 59,903 | | | $ | 59,903 | | | $ | 59,903 | | | $ | 59,903 | | | $ | 59,903 | | | $ | 51,800 | | | $ | 51,800 | | | $ | 150,300 | | | $ | 150,300 | |
| (1) | Includes all of the Series of the Trust. During the fiscal years reported above, certain of the Funds were “feeder” funds in a. “master-feeder” fund structure or funds of funds |
| (2) | Various subsidiaries of Morgan Stanley act in either an investment advisory and/or service provider capacity with respect to the Series and/or their respective “master” funds (if applicable). |
(h) The registrant’s audit committee has considered whether the provision by the registrant’s principal accountant of non-audit services to the registrant’s investment adviser and any entity controlling, controlled by, or under common control with the adviser that provides ongoing services to the registrant that were not pre-approved pursuant to Rule 2-01(c)(7)(ii) of Regulation S-X is compatible with maintaining the principal accountant’s independence.
| Item 5. | Audit Committee of Listed Registrants |
Not applicable.
| Item 6. | Schedule of Investments |
Please see schedule of investments contained in the Report to Stockholders included under Item 1 of this Form N-CSR.
| Item 7. | Disclosure of Proxy Voting Policies and Procedures for Closed-End Management Investment Companies |
Not applicable.
| Item 8. | Portfolio Managers of Closed-End Management Investment Companies |
Not applicable.
| Item 9. | Purchases of Equity Securities by Closed-End Management Investment Company and Affiliated Purchasers |
Not applicable.
| Item 10. | Submission of Matters to a Vote of Security Holders |
No material changes.
| Item 11. | Controls and Procedures |
(a) It is the conclusion of the registrant’s principal executive officer and principal financial officer that the effectiveness of the registrant’s current disclosure controls and procedures (such disclosure controls and procedures having been evaluated within 90 days of the date of this filing) provide reasonable assurance that the information required to be disclosed by the registrant has been recorded, processed, summarized and reported within the time period specified in the Commission’s rules and forms and that the information required to be disclosed by the registrant has been accumulated and communicated to the registrant’s principal executive officer and principal financial officer in order to allow timely decisions regarding required disclosure.
(b) There have been no changes in the registrant’s internal controls over financial reporting during the period covered by this report that has materially affected, or is reasonably likely to materially affect, the registrant’s internal control over financial reporting.
| Item 12. | Disclosure of Securities Lending Activities for Closed-End Management Investment Companies |
Not applicable.
Signatures
Pursuant to the requirements of the Securities Exchange Act of 1934 and the Investment Company Act of 1940, the registrant has duly caused this report to be signed on its behalf by the undersigned, thereunto duly authorized.
| | |
| Eaton Vance Mutual Funds Trust |
| |
| By: | | /s/ Eric A. Stein |
| | Eric A. Stein |
| | President |
| |
| Date: | | March 22, 2021 |
Pursuant to the requirements of the Securities Exchange Act of 1934 and the Investment Company Act of 1940, this report has been signed below by the following persons on behalf of the registrant and in the capacities and on the dates indicated.
| | |
| By: | | /s/ James F. Kirchner |
| | James F. Kirchner |
| | Treasurer |
| |
| Date: | | March 22, 2021 |
| | |
| By: | | /s/ Eric A. Stein |
| | Eric A. Stein |
| | President |
| |
| Date: | | March 22, 2021 |