UNITED STATES
SECURITIES AND EXCHANGE COMMISSION
Washington, D.C. 20549
Form N-CSR
CERTIFIED SHAREHOLDER REPORT OF REGISTERED
MANAGEMENT INVESTMENT COMPANIES
Investment Company Act File Number: 811-04015
Eaton Vance Mutual Funds Trust
(Exact Name of Registrant as Specified in Charter)
Two International Place, Boston, Massachusetts 02110
(Address of Principal Executive Offices)
Deidre E. Walsh
Two International Place, Boston, Massachusetts 02110
(Name and Address of Agent for Services)
(617) 482-8260
(Registrant’s Telephone Number)
February 28
Date of Fiscal Year End
February 28, 2023
Date of Reporting Period
Item 1. Reports to Stockholders


| % Average Annual Total Returns1,2 | Class Inception Date | Performance Inception Date | One Year | Five Years | Since Inception |
| Class A at NAV | 03/26/2014 | 03/26/2014 | 1.45% | 7.81% | 9.11% |
| Class A with 5.25% Maximum Sales Charge | — | — | (3.88) | 6.64 | 8.46 |
| Class I at NAV | 03/26/2014 | 03/26/2014 | 1.68 | 8.08 | 9.39 |
| Russell 1000® Value Index | — | — | (2.81)% | 7.21% | 8.11% |
| % Total Annual Operating Expense Ratios3 | Class A | Class I |
| Gross | 0.89% | 0.64% |
| Net | 0.65 | 0.40 |
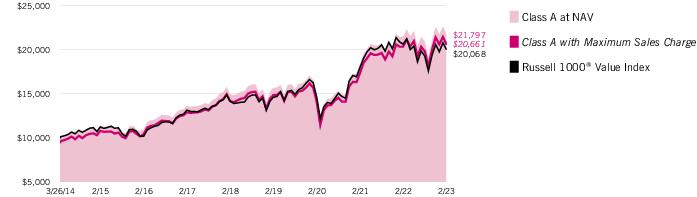
| Growth of Investment | Amount Invested | Period Beginning | At NAV | With Maximum Sales Charge |
| Class I, at minimum investment | $1,000,000 | 03/26/2014 | $2,228,830 | N.A. |
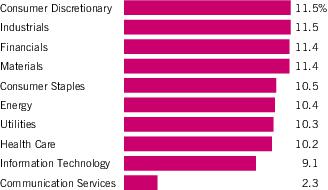
| Sector Allocation (% of net assets)1 |
| Top 10 Holdings (% of net assets)1 | |
| National Instruments Corp. | 0.8% |
| Kontoor Brands, Inc. | 0.7 |
| Reliance Steel & Aluminum Co. | 0.7 |
| Watsco, Inc. | 0.6 |
| Southern Copper Corp. | 0.6 |
| Dolby Laboratories, Inc., Class A | 0.6 |
| Foot Locker, Inc. | 0.6 |
| MDC Holdings, Inc. | 0.7 |
| Landstar System, Inc. | 0.6 |
| Cincinnati Financial Corp. | 0.6 |
| Total | 6.5% |
| 1 | Excludes cash and cash equivalents. |
| † | The views expressed in this report are those of the portfolio manager(s) and are current only through the date stated at the top of this page. These views are subject to change at any time based upon market or other conditions, and Eaton Vance and the Fund(s) disclaim any responsibility to update such views. These views may not be relied upon as investment advice and, because investment decisions are based on many factors, may not be relied upon as an indication of trading intent on behalf of any Eaton Vance fund. This commentary may contain statements that are not historical facts, referred to as “forward-looking statements.” The Fund’s actual future results may differ significantly from those stated in any forward-looking statement, depending on factors such as changes in securities or financial markets or general economic conditions, the volume of sales and purchases of Fund shares, the continuation of investment advisory, administrative and service contracts, and other risks discussed from time to time in the Fund’s filings with the Securities and Exchange Commission. |
| 1 | Russell 1000® Value Index is an unmanaged index of U.S. large-cap value stocks. Unless otherwise stated, index returns do not reflect the effect of any applicable sales charges, commissions, expenses, taxes or leverage, as applicable. It is not possible to invest directly in an index. |
| 2 | Total Returns at NAV do not include applicable sales charges. If sales charges were deducted, the returns would be lower. Total Returns shown with maximum sales charge reflect the stated maximum sales charge. Unless otherwise stated, performance does not reflect the deduction of taxes on Fund distributions or redemptions of Fund shares. Performance since inception for an index, if presented, is the performance since the Fund’s or oldest share class’ inception, as applicable. |
| 3 | Source: Fund prospectus. Net expense ratios reflect a contractual expense reimbursement that continues through 6/30/23. The expense ratios for the current reporting period can be found in the Financial Highlights section of this report. Performance reflects expenses waived and/or reimbursed, if applicable. Without such waivers and/or reimbursements, performance would have been lower. |
| Fund profile subject to change due to active management. |
| Additional Information | |
| S&P 500® Index is an unmanaged index of large-cap stocks commonly used as a measure of U.S. stock market performance. Dow Jones Industrial Average® is a price-weighted average of 30 blue-chip stocks that are generally the leaders in their industry. S&P Dow Jones Indices are a product of S&P Dow Jones Indices LLC (“S&P DJI”) and have been licensed for use. S&P® and S&P 500® are registered trademarks of S&P DJI; Dow Jones is a registered trademark of Dow Jones Trademark Holdings LLC (“Dow Jones”); S&P DJI, Dow Jones and their respective affiliates do not sponsor, endorse, sell or promote the Fund, will not have any liability with respect thereto and do not have any liability for any errors, omissions, or interruptions of the S&P Dow Jones Indices. Nasdaq Composite Index is a market capitalization-weighted index of all domestic and international securities listed on Nasdaq. Source: Nasdaq, Inc. The information is provided by Nasdaq (with its affiliates, are referred to as the “Corporations”) and Nasdaq’s third party licensors on an “as is” basis and the Corporations make no guarantees and bear no liability of any kind with respect to the information or the Fund. | |
| Diversification cannot ensure a profit or eliminate the risk of loss. | |
| Important Notice to Shareholders | |
| Effective April 29, 2022, the Fund's Investor Class shares were redesignated as Class A shares. Class A shares are subject to a front-end sales charge, subject to certain exceptions. Former Investor Class shareholders, who established their Fund accounts before April 29, 2022, did not pay a sales charge in connection with the redesignation or will not be subject to this sales charge on future purchases of Class A shares for such accounts. Effective April 29, 2022, the Fund's Institutional Class shares were redesignated as Class I shares. This share class redesignation did not result in changes to the annual operating expenses of Class I or the Fund. |
| Beginning Account Value (9/1/22) | Ending Account Value (2/28/23) | Expenses Paid During Period* (9/1/22 – 2/28/23) | Annualized Expense Ratio | |
| Actual | ||||
| Class A | $1,000.00 | $1,041.20 | $3.29** | 0.65% |
| Class I | $1,000.00 | $1,042.70 | $2.03** | 0.40% |
| Hypothetical | ||||
| (5% return per year before expenses) | ||||
| Class A | $1,000.00 | $1,021.57 | $3.26** | 0.65% |
| Class I | $1,000.00 | $1,022.81 | $2.01** | 0.40% |
| * | Expenses are equal to the Fund's annualized expense ratio for the indicated Class, multiplied by the average account value over the period, multiplied by 181/365 (to reflect the one-half year period). The Example assumes that the $1,000 was invested at the net asset value per share determined at the close of business on August 31, 2022. |
| ** | Absent an allocation of certain expenses to affiliates, expenses would be higher. |
| Common Stocks — 98.6% |
| Security | Shares | Value | |
| Aerospace & Defense — 1.1% | |||
| General Dynamics Corp. | 2,994 | $ 682,363 | |
| Lockheed Martin Corp. | 1,398 | 663,015 | |
| $ 1,345,378 | |||
| Air Freight & Logistics — 0.5% | |||
| Expeditors International of Washington, Inc. | 6,552 | $ 685,077 | |
| $ 685,077 | |||
| Auto Components — 0.6% | |||
| Gentex Corp. | 26,329 | $ 751,693 | |
| $ 751,693 | |||
| Banks — 2.8% | |||
| Commerce Bancshares, Inc. | 10,485 | $ 693,583 | |
| CVB Financial Corp. | 27,750 | 664,057 | |
| F.N.B. Corp. | 52,030 | 742,468 | |
| Prosperity Bancshares, Inc. | 9,417 | 692,055 | |
| United Bankshares, Inc. | 16,671 | 679,677 | |
| $ 3,471,840 | |||
| Beverages — 2.1% | |||
| Brown-Forman Corp., Class B | 10,278 | $ 666,734 | |
| Coca-Cola Co. (The) | 10,781 | 641,577 | |
| Keurig Dr Pepper, Inc. | 18,981 | 655,793 | |
| PepsiCo, Inc. | 3,790 | 657,679 | |
| $ 2,621,783 | |||
| Biotechnology — 1.5% | |||
| AbbVie, Inc. | 4,182 | $ 643,610 | |
| Amgen, Inc. | 2,585 | 598,841 | |
| Gilead Sciences, Inc. | 7,977 | 642,388 | |
| $ 1,884,839 | |||
| Building Products — 0.6% | |||
| A.O. Smith Corp. | 11,957 | $ 784,738 | |
| $ 784,738 | |||
| Capital Markets — 4.1% | |||
| Artisan Partners Asset Management, Inc., Class A | 22,669 | $ 747,397 | |
| CME Group, Inc. | 4,022 | 745,518 | |
| Houlihan Lokey, Inc. | 7,668 | 733,827 | |
| Janus Henderson Group PLC | 28,406 | 780,029 | |
| Security | Shares | Value | |
| Capital Markets (continued) | |||
| Moelis & Co., Class A | 17,531 | $ 750,853 | |
| SEI Investments Co. | 11,468 | 690,947 | |
| T. Rowe Price Group, Inc. | 6,108 | 685,806 | |
| $ 5,134,377 | |||
| Chemicals — 6.3% | |||
| Air Products and Chemicals, Inc. | 2,182 | $ 624,008 | |
| Celanese Corp. | 6,569 | 763,515 | |
| Corteva, Inc. | 11,667 | 726,737 | |
| Dow, Inc. | 13,427 | 768,024 | |
| DuPont de Nemours, Inc. | 9,916 | 724,166 | |
| Eastman Chemical Co. | 8,274 | 704,945 | |
| Huntsman Corp. | 24,558 | 720,532 | |
| International Flavors & Fragrances, Inc. | 6,670 | 621,644 | |
| Linde PLC | 2,121 | 738,893 | |
| LyondellBasell Industries NV, Class A | 8,204 | 787,502 | |
| RPM International, Inc. | 7,402 | 656,039 | |
| $ 7,836,005 | |||
| Communications Equipment — 1.1% | |||
| Cisco Systems, Inc. | 15,228 | $ 737,340 | |
| Juniper Networks, Inc. | 21,467 | 660,754 | |
| $ 1,398,094 | |||
| Containers & Packaging — 2.8% | |||
| Amcor PLC | 56,575 | $ 630,246 | |
| AptarGroup, Inc. | 6,137 | 716,311 | |
| International Paper Co. | 19,557 | 711,679 | |
| Packaging Corp. of America | 5,272 | 720,788 | |
| Sonoco Products Co. | 11,172 | 659,818 | |
| $ 3,438,842 | |||
| Distributors — 0.6% | |||
| Genuine Parts Co. | 4,061 | $ 718,229 | |
| $ 718,229 | |||
| Diversified Telecommunication Services — 1.1% | |||
| AT&T, Inc. | 37,643 | $ 711,829 | |
| Verizon Communications, Inc. | 18,007 | 698,852 | |
| $ 1,410,681 | |||
| Electric Utilities — 6.1% | |||
| ALLETE, Inc. | 10,402 | $ 636,498 | |
| Alliant Energy Corp. | 12,303 | 630,775 | |
| American Electric Power Co., Inc. | 7,182 | 631,801 | |
| Avangrid, Inc.(1) | 15,617 | 609,531 | |
| Security | Shares | Value | |
| Electric Utilities (continued) | |||
| Duke Energy Corp. | 6,549 | $ 617,309 | |
| Evergy, Inc. | 11,403 | 670,610 | |
| IDACORP, Inc. | 6,334 | 654,936 | |
| OGE Energy Corp. | 16,905 | 603,847 | |
| Pinnacle West Capital Corp. | 8,817 | 649,637 | |
| Portland General Electric Co. | 14,524 | 694,247 | |
| PPL Corp. | 22,928 | 620,661 | |
| Southern Co. (The) | 10,021 | 631,924 | |
| $ 7,651,776 | |||
| Electrical Equipment — 1.7% | |||
| Eaton Corp. PLC | 4,323 | $ 756,222 | |
| Emerson Electric Co. | 7,055 | 583,519 | |
| Hubbell, Inc. | 2,890 | 726,951 | |
| $ 2,066,692 | |||
| Electronic Equipment, Instruments & Components — 0.8% | |||
| National Instruments Corp. | 18,609 | $ 939,941 | |
| $ 939,941 | |||
| Energy Equipment & Services — 1.1% | |||
| Baker Hughes Co. | 24,684 | $ 755,330 | |
| Helmerich & Payne, Inc. | 14,248 | 599,556 | |
| $ 1,354,886 | |||
| Food & Staples Retailing — 0.5% | |||
| Walgreens Boots Alliance, Inc. | 19,227 | $ 683,135 | |
| $ 683,135 | |||
| Food Products — 3.6% | |||
| Archer-Daniels-Midland Co. | 7,302 | $ 581,239 | |
| General Mills, Inc. | 8,065 | 641,248 | |
| Hormel Foods Corp. | 15,384 | 682,742 | |
| Ingredion, Inc. | 6,927 | 688,544 | |
| Kellogg Co. | 9,517 | 627,551 | |
| Kraft Heinz Co. (The) | 16,969 | 660,773 | |
| Mondelez International, Inc., Class A | 10,155 | 661,903 | |
| $ 4,544,000 | |||
| Gas Utilities — 1.1% | |||
| Atmos Energy Corp. | 6,310 | $ 711,831 | |
| Spire, Inc. | 9,690 | 682,176 | |
| $ 1,394,007 | |||
| Security | Shares | Value | |
| Health Care Equipment & Supplies — 2.1% | |||
| Abbott Laboratories | 6,167 | $ 627,307 | |
| Becton, Dickinson and Co. | 2,645 | 620,385 | |
| Medtronic PLC | 8,741 | 723,755 | |
| Zimmer Biomet Holdings, Inc. | 5,319 | 658,864 | |
| $ 2,630,311 | |||
| Health Care Providers & Services — 4.1% | |||
| AmerisourceBergen Corp. | 4,096 | $ 637,174 | |
| Cardinal Health, Inc. | 8,750 | 662,462 | |
| Chemed Corp. | 1,313 | 684,835 | |
| CVS Health Corp. | 7,278 | 608,004 | |
| Patterson Cos., Inc. | 24,121 | 639,689 | |
| Premier, Inc., Class A | 20,781 | 668,940 | |
| Quest Diagnostics, Inc. | 4,339 | 600,344 | |
| UnitedHealth Group, Inc. | 1,286 | 612,059 | |
| $ 5,113,507 | |||
| Hotels, Restaurants & Leisure — 1.2% | |||
| Cracker Barrel Old Country Store, Inc. | 7,064 | $ 769,693 | |
| Darden Restaurants, Inc. | 4,853 | 693,931 | |
| $ 1,463,624 | |||
| Household Durables — 3.0% | |||
| Garmin, Ltd. | 7,766 | $ 762,078 | |
| Leggett & Platt, Inc. | 22,299 | 769,092 | |
| MDC Holdings, Inc. | 21,523 | 796,351 | |
| Newell Brands, Inc. | 51,751 | 760,222 | |
| Whirlpool Corp. | 4,795 | 661,614 | |
| $ 3,749,357 | |||
| Household Products — 2.1% | |||
| Church & Dwight Co., Inc. | 8,336 | $ 698,390 | |
| Colgate-Palmolive Co. | 8,624 | 632,139 | |
| Kimberly-Clark Corp. | 4,955 | 619,623 | |
| Procter & Gamble Co. (The) | 4,456 | 612,967 | |
| $ 2,563,119 | |||
| Industrial Conglomerates — 1.0% | |||
| 3M Co. | 6,012 | $ 647,733 | |
| Honeywell International, Inc. | 3,210 | 614,651 | |
| $ 1,262,384 | |||
| Insurance — 4.5% | |||
| Assurant, Inc. | 5,372 | $ 684,339 | |
| Cincinnati Financial Corp. | 6,526 | 787,688 | |
| Fidelity National Financial, Inc. | 17,910 | 713,893 | |
| Security | Shares | Value | |
| Insurance (continued) | |||
| Hanover Insurance Group, Inc. (The) | 4,980 | $ 694,610 | |
| Old Republic International Corp. | 28,032 | 739,204 | |
| Principal Financial Group, Inc. | 7,952 | 712,181 | |
| Prudential Financial, Inc. | 6,903 | 690,300 | |
| Travelers Cos., Inc. (The) | 3,589 | 664,396 | |
| $ 5,686,611 | |||
| IT Services — 4.3% | |||
| Accenture PLC, Class A | 2,635 | $ 699,724 | |
| Amdocs, Ltd. | 7,943 | 727,658 | |
| Automatic Data Processing, Inc. | 2,825 | 620,991 | |
| Cognizant Technology Solutions Corp., Class A | 12,320 | 771,602 | |
| International Business Machines Corp. | 4,820 | 623,226 | |
| Jack Henry & Associates, Inc. | 3,832 | 629,368 | |
| Paychex, Inc. | 5,841 | 644,846 | |
| Western Union Co. (The) | 52,085 | 675,022 | |
| $ 5,392,437 | |||
| Leisure Products — 0.5% | |||
| Hasbro, Inc. | 11,151 | $ 613,417 | |
| $ 613,417 | |||
| Life Sciences Tools & Services — 0.5% | |||
| Agilent Technologies, Inc. | 4,499 | $ 638,723 | |
| $ 638,723 | |||
| Machinery — 2.9% | |||
| Cummins, Inc. | 2,898 | $ 704,446 | |
| Donaldson Co., Inc. | 12,109 | 765,894 | |
| Graco, Inc. | 10,167 | 707,013 | |
| IDEX Corp. | 3,143 | 707,112 | |
| Snap-on, Inc. | 2,997 | 745,294 | |
| $ 3,629,759 | |||
| Media — 1.2% | |||
| Interpublic Group of Cos., Inc. (The) | 20,252 | $ 719,756 | |
| Omnicom Group, Inc. | 8,336 | 754,992 | |
| $ 1,474,748 | |||
| Metals & Mining — 2.4% | |||
| Newmont Corp. | 14,604 | $ 636,880 | |
| Reliance Steel & Aluminum Co. | 3,351 | 830,512 | |
| Royal Gold, Inc. | 6,059 | 719,749 | |
| Southern Copper Corp. | 11,007 | 811,106 | |
| $ 2,998,247 | |||
| Security | Shares | Value | |
| Multi-Utilities — 3.1% | |||
| Consolidated Edison, Inc. | 7,047 | $ 629,649 | |
| Dominion Energy, Inc. | 11,520 | 640,742 | |
| DTE Energy Co. | 5,688 | 624,031 | |
| NorthWestern Corp. | 11,365 | 656,670 | |
| Public Service Enterprise Group, Inc. | 10,998 | 664,609 | |
| WEC Energy Group, Inc. | 7,126 | 631,791 | |
| $ 3,847,492 | |||
| Oil, Gas & Consumable Fuels — 9.3% | |||
| Antero Midstream Corp. | 62,502 | $ 658,771 | |
| Chevron Corp. | 3,811 | 612,694 | |
| ConocoPhillips | 5,992 | 619,273 | |
| Coterra Energy, Inc. | 27,731 | 692,443 | |
| Diamondback Energy, Inc. | 4,989 | 701,354 | |
| DT Midstream, Inc. | 12,320 | 618,464 | |
| Enviva, Inc.(1) | 13,136 | 572,204 | |
| EOG Resources, Inc. | 5,279 | 596,633 | |
| Exxon Mobil Corp. | 6,258 | 687,817 | |
| HF Sinclair Corp. | 13,206 | 656,602 | |
| Kinder Morgan, Inc. | 37,466 | 639,170 | |
| Marathon Petroleum Corp. | 6,225 | 769,410 | |
| ONEOK, Inc. | 10,311 | 674,855 | |
| Phillips 66 | 6,533 | 670,024 | |
| Pioneer Natural Resources Co. | 3,199 | 641,112 | |
| Texas Pacific Land Corp. | 291 | 518,035 | |
| Valero Energy Corp. | 5,433 | 715,689 | |
| Williams Cos., Inc. (The) | 20,626 | 620,843 | |
| $ 11,665,393 | |||
| Personal Products — 1.1% | |||
| Medifast, Inc. | 5,999 | $ 672,668 | |
| Nu Skin Enterprises, Inc., Class A | 16,062 | 639,910 | |
| $ 1,312,578 | |||
| Pharmaceuticals — 2.0% | |||
| Bristol-Myers Squibb Co. | 10,015 | $ 690,634 | |
| Johnson & Johnson | 3,902 | 598,021 | |
| Merck & Co., Inc. | 6,551 | 695,978 | |
| Pfizer, Inc. | 13,249 | 537,512 | |
| $ 2,522,145 | |||
| Professional Services — 1.1% | |||
| ManpowerGroup, Inc. | 8,146 | $ 691,432 | |
| Robert Half International, Inc. | 9,204 | 742,027 | |
| $ 1,433,459 | |||
| Security | Shares | Value | |
| Road & Rail — 0.6% | |||
| Landstar System, Inc. | 4,369 | $ 789,872 | |
| $ 789,872 | |||
| Semiconductors & Semiconductor Equipment — 1.7% | |||
| Analog Devices, Inc. | 4,157 | $ 762,685 | |
| Intel Corp. | 25,945 | 646,809 | |
| Texas Instruments, Inc. | 4,228 | 724,890 | |
| $ 2,134,384 | |||
| Software — 1.2% | |||
| Dolby Laboratories, Inc., Class A | 9,822 | $ 808,154 | |
| Microsoft Corp. | 2,906 | 724,815 | |
| $ 1,532,969 | |||
| Specialty Retail — 3.4% | |||
| Advance Auto Parts, Inc. | 4,934 | $ 715,233 | |
| American Eagle Outfitters, Inc. | 48,606 | 698,468 | |
| Best Buy Co., Inc. | 8,368 | 695,465 | |
| Buckle, Inc. (The) | 15,517 | 632,938 | |
| Foot Locker, Inc. | 18,256 | 798,152 | |
| Home Depot, Inc. (The) | 2,232 | 661,877 | |
| $ 4,202,133 | |||
| Textiles, Apparel & Luxury Goods — 2.3% | |||
| Carter's, Inc.(1) | 9,023 | $ 680,244 | |
| Hanesbrands, Inc.(1) | 110,135 | 625,567 | |
| Kontoor Brands, Inc.(1) | 17,141 | 893,903 | |
| VF Corp. | 25,965 | 644,451 | |
| $ 2,844,165 | |||
| Tobacco — 1.1% | |||
| Altria Group, Inc. | 14,827 | $ 688,418 | |
| Philip Morris International, Inc. | 6,722 | 654,050 | |
| $ 1,342,468 | |||
| Trading Companies & Distributors — 1.8% | |||
| Fastenal Co. | 15,126 | $ 779,897 | |
| MSC Industrial Direct Co., Inc., Class A | 8,291 | 700,755 | |
| Watsco, Inc. | 2,692 | 820,279 | |
| $ 2,300,931 | |||
| Total Common Stocks (identified cost $112,653,442) | $123,260,246 | ||
| Short-Term Investments — 1.3% |
| Affiliated Fund — 1.3% |
| Security | Shares | Value | |
| Morgan Stanley Institutional Liquidity Funds - Government Portfolio, Institutional Class, 4.43%(2) | 1,601,137 | $ 1,601,137 | |
| Total Affiliated Fund (identified cost $1,601,137) | $ 1,601,137 | ||
| Securities Lending Collateral — 0.0%(3) |
| Security | Shares | Value | |
| State Street Navigator Securities Lending Government Money Market Portfolio, 4.60%(4) | 957 | $ 957 | |
| Total Securities Lending Collateral (identified cost $957) | $ 957 | ||
| Total Short-Term Investments (identified cost $1,602,094) | $ 1,602,094 | ||
| Total Investments — 99.9% (identified cost $114,255,536) | $124,862,340 | ||
| Other Assets, Less Liabilities — 0.1% | $ 159,952 | ||
| Net Assets — 100.0% | $125,022,292 | ||
| The percentage shown for each investment category in the Portfolio of Investments is based on net assets. | |
| (1) | All or a portion of this security was on loan at February 28, 2023. The aggregate market value of securities on loan at February 28, 2023 was $3,034,012. |
| (2) | May be deemed to be an affiliated investment company. The rate shown is the annualized seven-day yield as of February 28, 2023. |
| (3) | Amount is less than 0.05%. |
| (4) | Represents investment of cash collateral received in connection with securities lending. |
| February 28, 2023 | |
| Assets | |
| Unaffiliated investments, at value (identified cost $112,654,399) — including $3,034,012 of securities on loan | $ 123,261,203 |
| Affiliated investment, at value (identified cost $1,601,137) | 1,601,137 |
| Dividends receivable | 303,250 |
| Dividends receivable from affiliated investment | 4,857 |
| Receivable for Fund shares sold | 45,507 |
| Securities lending income receivable | 429 |
| Receivable from affiliates | 12,206 |
| Total assets | $125,228,589 |
| Liabilities | |
| Collateral for securities loaned | $ 957 |
| Payable for Fund shares redeemed | 87,430 |
| Payable to affiliates: | |
| Investment adviser and administration fee | 29,061 |
| Distribution and service fees | 773 |
| Accrued expenses | 88,076 |
| Total liabilities | $ 206,297 |
| Net Assets | $125,022,292 |
| Sources of Net Assets | |
| Paid-in capital | $ 119,824,431 |
| Distributable earnings | 5,197,861 |
| Net Assets | $125,022,292 |
| Class A Shares | |
| Net Assets | $ 3,998,253 |
| Shares Outstanding | 248,755 |
| Net Asset Value and Redemption Price Per Share (net assets ÷ shares of beneficial interest outstanding) | $ 16.07 |
| Maximum Offering Price Per Share (100 ÷ 94.75 of net asset value per share) | $ 16.96 |
| Class I Shares | |
| Net Assets | $ 121,024,039 |
| Shares Outstanding | 7,512,272 |
| Net Asset Value, Offering Price and Redemption Price Per Share (net assets ÷ shares of beneficial interest outstanding) | $ 16.11 |
| On sales of $50,000 or more, the offering price of Class A shares is reduced. |
| Year Ended | |
| February 28, 2023 | |
| Investment Income | |
| Dividend income | $ 3,108,783 |
| Dividend income from affiliated investments | 34,749 |
| Securities lending income, net | 2,353 |
| Total investment income | $ 3,145,885 |
| Expenses | |
| Investment adviser and administration fee | $ 274,123 |
| Distribution and service fees: | |
| Class A | 7,899 |
| Trustees’ fees and expenses | 7,438 |
| Custodian fee | 40,124 |
| Transfer and dividend disbursing agent fees | 31,139 |
| Legal and accounting services | 47,461 |
| Printing and postage | 3,099 |
| Registration fees | 53,712 |
| Miscellaneous | 12,720 |
| Total expenses | $ 477,715 |
| Deduct: | |
| Waiver and/or reimbursement of expenses by affiliates | $ 105,754 |
| Total expense reductions | $ 105,754 |
| Net expenses | $ 371,961 |
| Net investment income | $ 2,773,924 |
| Realized and Unrealized Gain (Loss) | |
| Net realized gain (loss): | |
| Investment transactions | $ (1,643,128) |
| Investment transactions - affiliated investment | (17) |
| Net realized loss | $(1,643,145) |
| Change in unrealized appreciation (depreciation): | |
| Investments | $ 602,353 |
| Investments - affiliated investment | 14 |
| Net change in unrealized appreciation (depreciation) | $ 602,367 |
| Net realized and unrealized loss | $(1,040,778) |
| Net increase in net assets from operations | $ 1,733,146 |
| Year Ended February 28, | ||
| 2023 | 2022 | |
| Increase (Decrease) in Net Assets | ||
| From operations: | ||
| Net investment income | $ 2,773,924 | $ 976,803 |
| Net realized gain (loss) | (1,643,145) | 3,110,736 |
| Net change in unrealized appreciation (depreciation) | 602,367 | 1,956,275 |
| Net increase in net assets from operations | $ 1,733,146 | $ 6,043,814 |
| Distributions to shareholders: | ||
| Class A | $ (75,569) | $ (83,961) |
| Class I | (2,209,944) | (897,896) |
| Total distributions to shareholders | $ (2,285,513) | $ (981,857) |
| Transactions in shares of beneficial interest: | ||
| Class A | $ 1,102,953 | $ (673,893) |
| Class I | 85,989,031 | (140,117) |
| Net increase (decrease) in net assets from Fund share transactions | $ 87,091,984 | $ (814,010) |
| Net increase in net assets | $ 86,539,617 | $ 4,247,947 |
| Net Assets | ||
| At beginning of year | $ 38,482,675 | $ 34,234,728 |
| At end of year | $125,022,292 | $38,482,675 |
| Class A | |||||
| Year Ended February 28, | Year Ended February 29, 2020 | Year Ended February 28, | |||
| 2023 | 2022 | 2021 | 2019 | ||
| Net asset value — Beginning of year | $ 16.230 | $ 14.130 | $ 11.950 | $ 12.870 | $ 12.910 |
| Income (Loss) From Operations | �� | ||||
| Net investment income(1) | $ 0.436 | $ 0.377 | $ 0.349 | $ 0.362 | $ 0.366 |
| Net realized and unrealized gain (loss) | (0.211) | 2.105 | 2.194 | (0.950) | 0.216 |
| Total income (loss) from operations | $ 0.225 | $ 2.482 | $ 2.543 | $ (0.588) | $ 0.582 |
| Less Distributions | |||||
| From net investment income | $ (0.385) | $ (0.382) | $ (0.363) | $ (0.325) | $ (0.306) |
| From net realized gain | — | — | — | (0.007) | (0.316) |
| Total distributions | $ (0.385) | $ (0.382) | $ (0.363) | $ (0.332) | $ (0.622) |
| Net asset value — End of year | $16.070 | $16.230 | $14.130 | $11.950 | $12.870 |
| Total Return(2)(3) | 1.45% | 17.74% | 22.15% | (4.76)% | 4.81% |
| Ratios/Supplemental Data | |||||
| Net assets, end of year (000's omitted) | $ 3,998 | $ 2,943 | $ 3,140 | $ 3,612 | $ 6,597 |
| Ratios (as a percentage of average daily net assets): | |||||
| Expenses (3) | 0.65% (4) | 0.65% | 0.65% | 0.65% | 0.65% |
| Net investment income | 2.71% | 2.39% | 2.92% | 2.78% | 2.82% |
| Portfolio Turnover | 38% | 45% | 61% | 51% | 77% |
| (1) | Computed using average shares outstanding. |
| (2) | Returns are historical and are calculated by determining the percentage change in net asset value with all distributions reinvested and do not reflect the effect of sales charges. |
| (3) | The investment adviser and administrator and the sub-adviser reimbursed certain operating expenses (equal to 0.11%, 0.24%, 0.34%, 0.17% and 0.26% of average daily net assets for the years ended February 28, 2023, 2022 and 2021, February 29, 2020 and February 28, 2019, respectively). Absent this reimbursement, total return would be lower. |
| (4) | Includes a reduction by the investment adviser and administrator of a portion of its investment adviser and administration fee due to the Fund’s investment in the Liquidity Fund (equal to less than 0.005% of average daily net assets for the year ended February 28, 2023). |
| Class I | |||||
| Year Ended February 28, | Year Ended February 29, 2020 | Year Ended February 28, | |||
| 2023 | 2022 | 2021 | 2019 | ||
| Net asset value — Beginning of year | $ 16.260 | $ 14.150 | $ 11.970 | $ 12.890 | $ 12.930 |
| Income (Loss) From Operations | |||||
| Net investment income(1) | $ 0.487 | $ 0.420 | $ 0.380 | $ 0.394 | $ 0.399 |
| Net realized and unrealized gain (loss) | (0.227) | 2.111 | 2.195 | (0.947) | 0.215 |
| Total income (loss) from operations | $ 0.260 | $ 2.531 | $ 2.575 | $ (0.553) | $ 0.614 |
| Less Distributions | |||||
| From net investment income | $ (0.410) | $ (0.421) | $ (0.395) | $ (0.360) | $ (0.338) |
| From net realized gain | — | — | — | (0.007) | (0.316) |
| Total distributions | $ (0.410) | $ (0.421) | $ (0.395) | $ (0.367) | $ (0.654) |
| Net asset value — End of year | $ 16.110 | $16.260 | $14.150 | $11.970 | $12.890 |
| Total Return(2)(3) | 1.68% | 18.09% | 22.47% | (4.50)% | 5.06% |
| Ratios/Supplemental Data | |||||
| Net assets, end of year (000’s omitted) | $121,024 | $ 35,539 | $ 31,094 | $ 43,096 | $ 51,344 |
| Ratios (as a percentage of average daily net assets): | |||||
| Expenses (3) | 0.40% (4) | 0.40% | 0.40% | 0.40% | 0.40% |
| Net investment income | 3.04% | 2.66% | 3.19% | 3.01% | 3.07% |
| Portfolio Turnover | 38% | 45% | 61% | 51% | 77% |
| (1) | Computed using average shares outstanding. |
| (2) | Returns are historical and are calculated by determining the percentage change in net asset value with all distributions reinvested. |
| (3) | The investment adviser and administrator and the sub-adviser reimbursed certain operating expenses (equal to 0.11%, 0.24%, 0.34%, 0.17% and 0.26% of average daily net assets for the years ended February 28, 2023, 2022 and 2021, February 29, 2020 and February 28, 2019, respectively). Absent this reimbursement, total return would be lower. |
| (4) | Includes a reduction by the investment adviser and administrator of a portion of its investment adviser and administration fee due to the Fund’s investment in the Liquidity Fund (equal to less than 0.005% of average daily net assets for the year ended February 28, 2023). |
| Year Ended February 28, | ||
| 2023 | 2022 | |
| Ordinary income | $2,285,513 | $981,857 |
| Undistributed ordinary income | $ 477,849 |
| Deferred capital losses | (1,743,504) |
| Net unrealized appreciation | 6,463,516 |
| Distributable earnings | $ 5,197,861 |
| Aggregate cost | $118,398,824 |
| Gross unrealized appreciation | $ 9,468,743 |
| Gross unrealized depreciation | (3,005,227) |
| Net unrealized appreciation | $ 6,463,516 |
| Average Daily Net Assets | Annual Fee Rate |
| Up to $1 billion | 0.3000% |
| $1 billion but less than $2.5 billion | 0.2875% |
| $2.5 billion but less than $5 billion | 0.2750% |
| $5 billion and over | 0.2675% |
| Year Ended February 28, 2023 | Year Ended February 28, 2022 | ||||
| Shares | Amount | Shares | Amount | ||
| Class A | |||||
| Sales | 95,974 | $ 1,560,658 | 25,845 | $ 408,706 | |
| Issued to shareholders electing to receive payments of distributions in Fund shares | 4,796 | 75,569 | 5,464 | 83,961 | |
| Redemptions | (33,307) | (533,274) | (72,264) | (1,166,560) | |
| Net increase (decrease) | 67,463 | $ 1,102,953 | (40,955) | $ (673,893) | |
| Class I | |||||
| Sales | 6,492,492 | $ 104,729,807 | 406,269 | $ 6,403,457 | |
| Issued to shareholders electing to receive payments of distributions in Fund shares | 45,506 | 715,398 | 19,992 | 308,263 | |
| Redemptions | (1,211,471) | (19,456,174) | (437,583) | (6,851,837) | |
| Net increase (decrease) | 5,326,527 | $ 85,989,031 | (11,322) | $ (140,117) | |
| Remaining Contractual Maturity of the Transactions | |||||
| Overnight and Continuous | <30 days | 30 to 90 days | >90 days | Total | |
| Common Stocks | $957 | $ — | $ — | $ — | $957 |
| Name | Value, beginning of period | Purchases | Sales proceeds | Net realized gain (loss) | Change in unrealized appreciation (depreciation) | Value, end of period | Dividend income | Units/Shares, end of period |
| Short-Term Investments | ||||||||
| Cash Reserves Fund | $327,783 | $15,693,475 | $(16,021,255) | $ (17) | $ 14 | $ — | $ 72 | — |
| Liquidity Fund | — | 80,598,844 | (78,997,707) | — | — | 1,601,137 | 34,677 | 1,601,137 |
| Total | $ (17) | $ 14 | $1,601,137 | $34,749 | ||||
| • | Level 1 – quoted prices in active markets for identical investments |
| • | Level 2 – other significant observable inputs (including quoted prices for similar investments, interest rates, prepayment speeds, credit risk, etc.) |
| • | Level 3 – significant unobservable inputs (including a fund's own assumptions in determining the fair value of investments) |
| Asset Description | Level 1 | Level 2 | Level 3 | Total |
| Common Stocks | $ 123,260,246* | $ — | $ — | $ 123,260,246 |
| Short-Term Investments: | ||||
| Affiliated Fund | 1,601,137 | — | — | 1,601,137 |
| Securities Lending Collateral | 957 | — | — | 957 |
| Total Investments | $124,862,340 | $ — | $ — | $124,862,340 |
| * | The level classification by major category of investments is the same as the category presentation in the Portfolio of Investments. |
Boston, Massachusetts
April 18, 2023
| Name and Year of Birth | Trust Position(s) | Length of Service | Principal Occupation(s) and Other Directorships During Past Five Years and Other Relevant Experience |
| Interested Trustees | |||
| Thomas E. Faust Jr. 1958 | Trustee | Since 2007 | Chairman of Morgan Stanley Investment Management, Inc. (MSIM), member of the Board of Managers and President of EV (since 2021), Chief Executive Officer of EVM and BMR. Formerly, Chairman, Chief Executive Officer (2007-2021) and President (2006-2021) of EVC and Director of EVD (2007-2022). Mr. Faust is an interested person because of his positions with MSIM, BMR, EVM and EV, which are affiliates of the Trust. Mr. Faust has apprised the Board of Trustees that he intends to retire as a Trustee of all Eaton Vance Funds effective on or about August 3, 2023. Other Directorships. Formerly, Director of EVC (2007-2021) and Hexavest Inc. (investment management firm) (2012-2021). |
| Anchal Pachnanda(1) 1980 | Trustee | Since 2023 | Co-Head of Strategy of MSIM (since 2019). Formerly, Head of Strategy of MSIM (2017-2019). Ms. Pachnanda is an interested person because of her position with MSIM, which is an affiliate of the Trust. Other Directorships. None. |
| Noninterested Trustees | |||
| Alan C. Bowser 1962 | Trustee | Since 2022 | Formerly, Chief Diversity Officer, Partner and a member of the Operating Committee, and formerly served as Senior Advisor on Diversity and Inclusion for the firm’s chief executive officer, Co-Head of the Americas Region, and Senior Client Advisor of Bridgewater Associates, an asset management firm (2011- 2023). Other Directorships. None. |
| Mark R. Fetting 1954 | Trustee | Since 2016 | Private investor. Formerly held various positions at Legg Mason, Inc. (investment management firm) (2000-2012), including President, Chief Executive Officer, Director and Chairman (2008-2012), Senior Executive Vice President (2004-2008) and Executive Vice President (2001-2004). Formerly, President of Legg Mason family of funds (2001-2008). Formerly, Division President and Senior Officer of Prudential Financial Group, Inc. and related companies (investment management firm) (1991-2000). Other Directorships. None. |
| Cynthia E. Frost 1961 | Trustee | Since 2014 | Private investor. Formerly, Chief Investment Officer of Brown University (university endowment) (2000-2012). Formerly, Portfolio Strategist for Duke Management Company (university endowment manager) (1995-2000). Formerly, Managing Director, Cambridge Associates (investment consulting company) (1989-1995). Formerly, Consultant, Bain and Company (management consulting firm) (1987-1989). Formerly, Senior Equity Analyst, BA Investment Management Company (1983-1985). Other Directorships. None. |
| George J. Gorman 1952 | Chairperson of the Board and Trustee | Since 2021 (Chairperson) and 2014 (Trustee) | Principal at George J. Gorman LLC (consulting firm). Formerly, Senior Partner at Ernst & Young LLP (a registered public accounting firm) (1974-2009). Other Directorships. None. |
| Name and Year of Birth | Trust Position(s) | Length of Service | Principal Occupation(s) and Other Directorships During Past Five Years and Other Relevant Experience |
| Noninterested Trustees (continued) | |||
| Valerie A. Mosley 1960 | Trustee | Since 2014 | Chairwoman and Chief Executive Officer of Valmo Ventures (a consulting and investment firm). Founder of Upward Wealth, Inc., dba BrightUp, a fintech platform. Formerly, Partner and Senior Vice President, Portfolio Manager and Investment Strategist at Wellington Management Company, LLP (investment management firm) (1992-2012). Formerly, Chief Investment Officer, PG Corbin Asset Management (1990-1992). Formerly worked in institutional corporate bond sales at Kidder Peabody (1986-1990). Other Directorships. Director of DraftKings, Inc. (digital sports entertainment and gaming company) (since September 2020). Director of Envestnet, Inc. (provider of intelligent systems for wealth management and financial wellness) (since 2018). Formerly, Director of Dynex Capital, Inc. (mortgage REIT) (2013-2020) and Director of Groupon, Inc. (e-commerce provider) (2020-2022). |
| Keith Quinton 1958 | Trustee | Since 2018 | Private investor, researcher and lecturer. Formerly, Independent Investment Committee Member at New Hampshire Retirement System (2017-2021). Formerly, Portfolio Manager and Senior Quantitative Analyst at Fidelity Investments (investment management firm) (2001-2014). Other Directorships. Formerly, Director (2016-2021) and Chairman (2019-2021) of New Hampshire Municipal Bond Bank. |
| Marcus L. Smith 1966 | Trustee | Since 2018 | Private investor and independent corporate director. Formerly, Chief Investment Officer, Canada (2012-2017), Chief Investment Officer, Asia (2010-2012), Director of Asian Research (2004-2010) and portfolio manager (2001-2017) at MFS Investment Management (investment management firm). Other Directorships. Director of First Industrial Realty Trust, Inc. (an industrial REIT) (since 2021). Director of MSCI Inc. (global provider of investment decision support tools) (since 2017). Formerly, Director of DCT Industrial Trust Inc. (logistics real estate company) (2017-2018). |
| Susan J. Sutherland 1957 | Trustee | Since 2015 | Private investor. Director of Ascot Group Limited and certain of its subsidiaries (insurance and reinsurance) (since 2017). Formerly, Director of Hagerty Holding Corp. (insurance) (2015-2018) and Montpelier Re Holdings Ltd. (insurance and reinsurance) (2013-2015). Formerly, Associate, Counsel and Partner at Skadden, Arps, Slate, Meagher & Flom LLP (law firm) (1982-2013). Other Directorships. Formerly, Director of Kairos Acquisition Corp. (insurance/InsurTech acquisition company) (2021-2023). |
| Scott E. Wennerholm 1959 | Trustee | Since 2016 | Private investor. Formerly, Trustee at Wheelock College (postsecondary institution) (2012-2018). Formerly, Consultant at GF Parish Group (executive recruiting firm) (2016-2017). Formerly, Chief Operating Officer and Executive Vice President at BNY Mellon Asset Management (investment management firm) (2005-2011). Formerly, Chief Operating Officer and Chief Financial Officer at Natixis Global Asset Management (investment management firm) (1997-2004). Formerly, Vice President at Fidelity Investments Institutional Services (investment management firm) (1994-1997). Other Directorships. None. |
| Nancy A. Wiser 1967 | Trustee | Since 2022 | Formerly, Executive Vice President and the Global Head of Operations at Wells Fargo Asset Management (2011-2021). Other Directorships. None. |
| Name and Year of Birth | Trust Position(s) | Length of Service | Principal Occupation(s) During Past Five Years |
| Principal Officers who are not Trustees | |||
| Eric A. Stein 1980 | President | Since 2020 | Vice President and Chief Investment Officer, Fixed Income of EVM and BMR. Prior to November 1, 2020, Mr. Stein was a co-Director of Eaton Vance’s Global Income Investments. Also Vice President of Calvert Research and Management (“CRM”). |
| Deidre E. Walsh 1971 | Vice President and Chief Legal Officer | Since 2009 | Vice President of EVM and BMR. Also Vice President of CRM. |
| James F. Kirchner 1967 | Treasurer | Since 2007 | Vice President of EVM and BMR. Also Vice President of CRM. |
| Name and Year of Birth | Trust Position(s) | Length of Service | Principal Occupation(s) During Past Five Years |
| Principal Officers who are not Trustees (continued) | |||
| Nicholas S. Di Lorenzo 1987 | Secretary | Since 2022 | Formerly, associate (2012-2021) and counsel (2022) at Dechert LLP. |
| Richard F. Froio 1968 | Chief Compliance Officer | Since 2017 | Vice President of EVM and BMR since 2017. Formerly, Deputy Chief Compliance Officer (Adviser/Funds) and Chief Compliance Officer (Distribution) at PIMCO (2012-2017) and Managing Director at BlackRock/Barclays Global Investors (2009-2012). |
| Privacy Notice | April 2021 |
| FACTS | WHAT DOES EATON VANCE DO WITH YOUR PERSONAL INFORMATION? |
| Why? | Financial companies choose how they share your personal information. Federal law gives consumers the right to limit some but not all sharing. Federal law also requires us to tell you how we collect, share, and protect your personal information. Please read this notice carefully to understand what we do. |
| What? | The types of personal information we collect and share depend on the product or service you have with us. This information can include:■ Social Security number and income ■ investment experience and risk tolerance ■ checking account number and wire transfer instructions |
| How? | All financial companies need to share customers’ personal information to run their everyday business. In the section below, we list the reasons financial companies can share their customers’ personal information; the reasons Eaton Vance chooses to share; and whether you can limit this sharing. |
| Reasons we can share your personal information | Does Eaton Vance share? | Can you limit this sharing? |
| For our everyday business purposes — such as to process your transactions, maintain your account(s), respond to court orders and legal investigations, or report to credit bureaus | Yes | No |
| For our marketing purposes — to offer our products and services to you | Yes | No |
| For joint marketing with other financial companies | No | We don’t share |
| For our investment management affiliates’ everyday business purposes — information about your transactions, experiences, and creditworthiness | Yes | Yes |
| For our affiliates’ everyday business purposes — information about your transactions and experiences | Yes | No |
| For our affiliates’ everyday business purposes — information about your creditworthiness | No | We don’t share |
| For our investment management affiliates to market to you | Yes | Yes |
| For our affiliates to market to you | No | We don’t share |
| For nonaffiliates to market to you | No | We don’t share |
| To limit our sharing | Call toll-free 1-800-262-1122 or email: EVPrivacy@eatonvance.comPlease note:If you are a new customer, we can begin sharing your information 30 days from the date we sent this notice. When you are no longer our customer, we continue to share your information as described in this notice. However, you can contact us at any time to limit our sharing. |
| Questions? | Call toll-free 1-800-262-1122 or email: EVPrivacy@eatonvance.com |
| Privacy Notice — continued | April 2021 |
| Who we are | |
| Who is providing this notice? | Eaton Vance Management, Eaton Vance Distributors, Inc., Eaton Vance Trust Company, Eaton Vance Management (International) Limited, Eaton Vance Advisers International Ltd., Eaton Vance Global Advisors Limited, Eaton Vance Management’s Real Estate Investment Group, Boston Management and Research, Calvert Research and Management, Eaton Vance and Calvert Fund Families and our investment advisory affiliates (“Eaton Vance”) (see Investment Management Affiliates definition below) |
| What we do | |
| How does Eaton Vance protect my personal information? | To protect your personal information from unauthorized access and use, we use security measures that comply with federal law. These measures include computer safeguards and secured files and buildings. We have policies governing the proper handling of customer information by personnel and requiring third parties that provide support to adhere to appropriate security standards with respect to such information. |
| How does Eaton Vance collect my personal information? | We collect your personal information, for example, when you■ open an account or make deposits or withdrawals from your account ■ buy securities from us or make a wire transfer ■ give us your contact informationWe also collect your personal information from others, such as credit bureaus, affiliates, or other companies. |
| Why can’t I limit all sharing? | Federal law gives you the right to limit only■ sharing for affiliates’ everyday business purposes — information about your creditworthiness ■ affiliates from using your information to market to you ■ sharing for nonaffiliates to market to youState laws and individual companies may give you additional rights to limit sharing. See below for more on your rights under state law. |
| Definitions | |
| Investment Management Affiliates | Eaton Vance Investment Management Affiliates include registered investment advisers, registered broker- dealers, and registered and unregistered funds. Investment Management Affiliates does not include entities associated with Morgan Stanley Wealth Management, such as Morgan Stanley Smith Barney LLC and Morgan Stanley & Co. |
| Affiliates | Companies related by common ownership or control. They can be financial and nonfinancial companies.■ Our affiliates include companies with a Morgan Stanley name and financial companies such as Morgan Stanley Smith Barney LLC and Morgan Stanley & Co. |
| Nonaffiliates | Companies not related by common ownership or control. They can be financial and nonfinancial companies.■ Eaton Vance does not share with nonaffiliates so they can market to you. |
| Joint marketing | A formal agreement between nonaffiliated financial companies that together market financial products or services to you.■ Eaton Vance doesn’t jointly market. |
| Other important information | |
| Vermont: Except as permitted by law, we will not share personal information we collect about Vermont residents with Nonaffiliates unless you provide us with your written consent to share such information.California: Except as permitted by law, we will not share personal information we collect about California residents with Nonaffiliates and we will limit sharing such personal information with our Affiliates to comply with California privacy laws that apply to us. | |
Two International Place
Boston, MA 02110
800 Fifth Avenue, Suite 2800
Seattle, WA 98104
Two International Place
Boston, MA 02110
(617) 482-8260
State Street Financial Center, One Lincoln Street
Boston, MA 02111
Attn: Eaton Vance Funds
P.O. Box 534439
Pittsburgh, PA 15253-4439
(800) 260-0761
200 Berkeley Street
Boston, MA 02116-5022
Boston, MA 02110
Item 2. Code of Ethics
The registrant (sometimes referred to as the “Fund”) has adopted a code of ethics applicable to its Principal Executive Officer, Principal Financial Officer and Principal Accounting Officer. The registrant undertakes to provide a copy of such code of ethics to any person upon request, without charge, by calling 1-800-262-1122. The registrant has not amended the code of ethics as described in Form N-CSR during the period covered by this report. The registrant has not granted any waiver, including an implicit waiver, from a provision of the code of ethics as described in Form N-CSR during the period covered by this report.
Item 3. Audit Committee Financial Expert
The registrant’s Board of Trustees (the “Board”) has designated George J. Gorman and Scott E. Wennerholm, each an independent trustee, as audit committee financial experts. Mr. Gorman is a certified public accountant who is the Principal at George J. Gorman LLC (a consulting firm). Previously, Mr. Gorman served in various capacities at Ernst & Young LLP (a registered public accounting firm), including as Senior Partner. Mr. Gorman also has experience serving as an independent trustee and audit committee financial expert of other mutual fund complexes. Mr. Wennerholm is a private investor. Previously, Mr. Wennerholm served as a
Trustee at Wheelock College (postsecondary institution), as a Consultant at GF Parish Group (executive recruiting firm), Chief Operating Officer and Executive Vice President at BNY Mellon Asset Management (investment management firm), Chief Operating Officer and Chief Financial Officer at Natixis Global Asset Management (investment management firm), and Vice President at Fidelity Investments Institutional Services (investment management firm).
Item 4. Principal Accountant Fees and Services
Parametric Dividend Income Fund (the “Fund(s)”) is a series of Eaton Vance Mutual Funds Trust (the “Trust”), a Massachusetts business trust, which, including the Fund, contains a total of 34 series (the “Series”). The Trust is registered under the Investment Company Act of 1940 as an open-end management investment company. This Form N-CSR relates to the Fund’s annual report.
(a)-(d)
The following table presents the aggregate fees billed to the Fund for the Fund’s fiscal years ended February 28, 2022 and February 28, 2023 by the Fund’s principal accountant, Deloitte & Touche LLP (“D&T”), for professional services rendered for the audit of the Fund’s annual financial statements and fees billed for other services rendered by D&T during such periods.
Parametric Dividend Income Fund
Fiscal Years Ended | 2/28/22 | 2/28/23 | ||||||
Audit Fees | $ | 24,050 | $ | 27,150 | ||||
Audit-Related Fees(1) | $ | 0 | $ | 0 | ||||
Tax Fees(2) | $ | 8,478 | $ | 1,650 | ||||
All Other Fees(3) | $ | 0 | $ | 0 | ||||
|
|
|
| |||||
Total | $ | 32,528 | $ | 28,800 | ||||
|
|
|
| |||||
| (1) | Audit-related fees consist of the aggregate fees billed for assurance and related services that are reasonably related to the performance of the audit of financial statements and are not reported under the category of audit fees. |
| (2) | Tax fees consist of the aggregate fees billed for professional services rendered by the principal accountant relating to tax compliance, tax advice, and tax planning and specifically include fees for tax return preparation and other related tax compliance/planning matters. |
| (3) | All other fees consist of the aggregate fees billed for products and services provided by the principal accountant other than audit, audit-related, and tax services. |
The various Series comprising the Trust have differing fiscal year ends (January 31, February 28, September 30, October 31 November 30 or December 31). The following table presents the aggregate audit, audit-related, tax, and other fees billed to all of the Series in the Trust by D&T for the last two fiscal years of each Series.
Fiscal Years Ended | 9/30/21 | 10/31/21 | 11/30/21 | 12/31/21 | 1/31/22 | 2/28/22 | 9/30/22 | 10/31/22 | 11/30/22 | 12/31/22 | 1/31/23 | 2/28/23 | ||||||||||||||||||||||||||||||||||||
Audit Fees | $ | 91,600 | $ | 729,872 | $ | 37,050 | $ | 111,700 | $ | 198,900 | $ | 24,050 | $ | 104,200 | $ | 816,633 | $ | 41,150 | $ | 130,600 | $ | 172,250 | $ | 27,150 | ||||||||||||||||||||||||
Audit-Related Fees(1) | $ | 0 | $ | 0 | $ | 0 | $ | 0 | $ | 0 | $ | 0 | $ | 0 | $ | 0 | $ | 0 | $ | 0 | $ | 0 | $ | 0 | ||||||||||||||||||||||||
Tax Fees(2) | $ | 23,248 | $ | 271,569 | $ | 13,000 | $ | 61,738 | $ | 78,353 | $ | 8,478 | $ | 5,000 | $ | 44,100 | $ | 0 | $ | 16,150 | $ | 14,695 | $ | 1,650 | ||||||||||||||||||||||||
All Other Fees(3) | $ | 0 | $ | 0 | $ | 0 | $ | 0 | $ | 0 | $ | 0 | $ | 0 | $ | 0 | $ | 0 | $ | 0 | $ | 0 | $ | 0 | ||||||||||||||||||||||||
|
|
|
|
|
|
|
|
|
|
|
|
|
|
|
|
|
|
|
|
|
|
|
| |||||||||||||||||||||||||
Total | $ | 114,848 | $ | 1,001,441 | $ | 50,050 | $ | 173,438 | $ | 277,253 | $ | 32,528 | $ | 109,200 | $ | 860,733 | $ | 41,150 | $ | 146,750 | $ | 186,945 | $ | 28,800 | ||||||||||||||||||||||||
|
|
|
|
|
|
|
|
|
|
|
|
|
|
|
|
|
|
|
|
|
|
|
| |||||||||||||||||||||||||
| (1) | Audit-related fees consist of the aggregate fees billed for assurance and related services that are reasonably related to the performance of the audit of financial statements and are not reported under the category of audit fees. Includes consent fee for N-14 registration statements related to fund mergers. |
| (2) | Tax fees consist of the aggregate fees billed for professional services rendered by the principal accountant relating to tax compliance, tax advice, and tax planning and specifically include fees for tax return preparation and other related tax compliance/planning matters. |
| (3) | All other fees consist of the aggregate fees billed for products and services provided by the principal accountant other than audit, audit-related, and tax services. |
(e)(1) The registrant’s audit committee has adopted policies and procedures relating to the pre-approval of services provided by the registrant’s principal accountant (the “Pre-Approval Policies”). The Pre-Approval Policies establish a framework intended to assist the audit committee in the proper discharge of its pre-approval responsibilities. As a general matter, the Pre-Approval Policies (i) specify certain types of audit, audit-related, tax, and other services determined to be pre-approved by the audit committee; and (ii) delineate specific procedures governing the mechanics of the pre-approval process, including the approval and monitoring of audit and non-audit service fees. Unless a service is specifically pre-approved under the Pre-Approval Policies, it must be separately pre-approved by the audit committee.
The Pre-Approval Policies and the types of audit and non-audit services pre-approved therein must be reviewed and ratified by the registrant’s audit committee at least annually. The registrant’s audit committee maintains full responsibility for the appointment, compensation, and oversight of the work of the registrant’s principal accountant.
(e)(2) No services described in paragraphs (b)-(d) above were approved by the registrant’s audit committee pursuant to the “de minimis exception” set forth in Rule 2-01(c)(7)(i)(C) of Regulation S-X.
(f) Not applicable.
(g) The following table presents (i) the aggregate non-audit fees (i.e., fees for audit-related, tax, and other services) billed for services rendered to all of the Series in the Trust by D&T for the last two fiscal years of each Series; and (ii) the aggregate non-audit fees (i.e., fees for audit-related, tax, and other services) billed to the Eaton Vance organization by D&T for the last two fiscal years of each Series.
Fiscal Years Ended | 9/30/21 | 10/31/21 | 11/30/21 | 12/31/21 | 1/31/22 | 2/28/22 | 9/30/22 | 10/31/22 | 11/30/22 | 12/31/22 | 1/31/23 | 2/28/23 | ||||||||||||||||||||||||||||||||||||
Registrant(1) | $ | 23,248 | $ | 271,569 | $ | 13,000 | $ | 61,738 | $ | 78,353 | $ | 8,478 | $ | 5,000 | $ | 44,100 | $ | 0 | $ | 16,150 | $ | 14,695 | $ | 1,650 | ||||||||||||||||||||||||
Eaton Vance(2) | $ | 51,800 | $ | 51,800 | $ | 51,800 | $ | 51,800 | $ | 51,800 | $ | 51,800 | $ | 52,836 | $ | 52,836 | $ | 52,836 | $ | 52,836 | $ | 52,836 | $ | 52,836 | ||||||||||||||||||||||||
| (1) | Includes all of the Series of the Trust. During the fiscal years reported above, certain of the Funds were “feeder” funds in a “master-feeder” fund structure or funds of funds. |
| (2) | Various subsidiaries of Morgan Stanley act in either an investment advisory and/or service provider capacity with respect to the Series and/or their respective “master” funds (if applicable). |
(h) The registrant’s audit committee has considered whether the provision by the registrant’s principal accountant of non-audit services to the registrant’s investment adviser and any entity controlling, controlled by, or under common control with the adviser that provides ongoing services to the registrant that were not pre-approved pursuant to Rule 2-01(c)(7)(ii) of Regulation S-X is compatible with maintaining the principal accountant’s independence.
(i) Not applicable.
(j) Not applicable.
Item 5. Audit Committee of Listed Registrants
Not applicable.
Item 6. Schedule of Investments
Please see schedule of investments contained in the Report to Stockholders included under Item 1 of this Form N-CSR.
Item 7. Disclosure of Proxy Voting Policies and Procedures for Closed-End Management Investment Companies
Not applicable.
Item 8. Portfolio Managers of Closed-End Management Investment Companies
Not applicable.
Item 9. Purchases of Equity Securities by Closed-End Management Investment Company and Affiliated Purchasers
Not applicable.
Item 10. Submission of Matters to a Vote of Security Holders
No material changes.
Item 11. Controls and Procedures
(a) It is the conclusion of the registrant’s principal executive officer and principal financial officer that the effectiveness of the registrant’s current disclosure controls and procedures (such disclosure controls and procedures having been evaluated within 90 days of the date of this filing) provide reasonable assurance that the information required to be disclosed by the registrant has been recorded, processed, summarized and reported within the time period specified in the Commission’s rules and forms and that the information required to be disclosed by the registrant has been accumulated and communicated to the registrant’s principal executive officer and principal financial officer in order to allow timely decisions regarding required disclosure.
(b) There have been no changes in the registrant’s internal controls over financial reporting during the period covered by this report that has materially affected, or is reasonably likely to materially affect, the registrant’s internal control over financial reporting.
Item 12. Disclosure of Securities Lending Activities for Closed-End Management Investment Companies
Not applicable.
Item 13. Exhibits
| (a)(1) | Registrant’s Code of Ethics – Not applicable (please see Item 2). | |
| (a)(2)(i) | Treasurer’s Section 302 certification. | |
| (a)(2)(ii) | President’s Section 302 certification. | |
| (b) | Combined Section 906 certification. | |
Signatures
Pursuant to the requirements of the Securities Exchange Act of 1934 and the Investment Company Act of 1940, the registrant has duly caused this report to be signed on its behalf by the undersigned, thereunto duly authorized.
Eaton Vance Mutual Funds Trust
| By: | /s/ Eric A. Stein | |
| Eric A. Stein | ||
| President |
Date: April 25, 2023
Pursuant to the requirements of the Securities Exchange Act of 1934 and the Investment Company Act of 1940, this report has been signed below by the following persons on behalf of the registrant and in the capacities and on the dates indicated.
| By: | /s/ James F. Kirchner | |
| James F. Kirchner | ||
| Treasurer |
Date: April 25, 2023
| By: | /s/ Eric A. Stein | |
| Eric A. Stein | ||
| President |
Date: April 25, 2023