UNITED STATES
SECURITIES AND EXCHANGE COMMISSION
Washington, D.C. 20549
Form N-CSR
CERTIFIED SHAREHOLDER REPORT OF REGISTERED
MANAGEMENT INVESTMENT COMPANIES
Investment Company Act File Number: 811-04015
Eaton Vance Mutual Funds Trust
(Exact Name of Registrant as Specified in Charter)
Two International Place, Boston, Massachusetts 02110
(Address of Principal Executive Offices)
Deidre E. Walsh
Two International Place, Boston, Massachusetts 02110
(Name and Address of Agent for Services)
(617) 482-8260
(Registrant’s Telephone Number)
December 31
Date of Fiscal Year End
December 31, 2023
Date of Reporting Period
Item 1. Reports to Stockholders
Eaton Vance
Stock Fund
Annual Report
December 31, 2023
Commodity Futures Trading Commission Registration. The Commodity Futures Trading Commission (“CFTC”) has adopted regulations that subject registered investment companies and advisers to regulation by the CFTC if a fund invests more than a prescribed level of its assets in certain CFTC-regulated instruments (including futures, certain options and swap agreements) or markets itself as providing investment exposure to such instruments. The investment adviser has claimed an exclusion from the definition of “commodity pool operator” under the Commodity Exchange Act with respect to its management of the Fund. Accordingly, neither the Fund nor the adviser with respect to the operation of the Fund is subject to CFTC regulation. Because of its management of other strategies, the Fund's adviser is registered with the CFTC as a commodity pool operator. The adviser is also registered as a commodity trading advisor.
Fund shares are not insured by the FDIC and are not deposits or other obligations of, or guaranteed by, any depository institution. Shares are subject to investment risks, including possible loss of principal invested.
This report must be preceded or accompanied by a current summary prospectus or prospectus. Before investing, investors should consider carefully the investment objective, risks, and charges and expenses of a mutual fund. This and other important information is contained in the summary prospectus and prospectus, which can be obtained from a financial intermediary. Prospective investors should read the prospectus carefully before investing. For further information, please call 1-800-262-1122.
Annual Report December 31, 2023
Eaton Vance
Stock Fund
Eaton Vance
Stock Fund
December 31, 2023
Management’s Discussion of Fund Performance†
Economic and Market Conditions
For U.S. equity investors, the 12-month period ended December 31, 2023, was a roller-coaster ride, driven largely by shifting perceptions of whether the U.S. Federal Reserve (the Fed) could bring the world’s largest economy in for a soft landing, and changing expectations of how long interest rates might remain high.
As the period opened in January 2023, U.S. equities began a rally that lasted through July. The initial tailwind was ChatGPT, an artificial intelligence (AI) application that led investors to perceive AI might become the next big innovation to drive the information technology (IT) sector. As a result, IT -- one of the worst-performing sectors in 2022 -- became a standout sector in 2023. Earlier recession fears that had weighed on stock prices receded as more investors came to view the U.S. economy as doing surprisingly well.
But from August through October 2023, the bond market halted the stock market’s momentum. As investors feared the Fed might keep rates higher for longer than they had anticipated just a few months earlier, longer-term bond interest rates rose sharply. Given the potential for relatively attractive returns with lower risk than stocks, many investors shifted asset allocations from equities to bonds.
In the final two months of the period, however, U.S. equities made another U-turn, as investors again revised their expectations of what the Fed might do. Encouraged by cooling economic data and declining inflation, investors began to conclude the Fed was done raising interest rates -- and might begin lowering rates as early as March 2024.
In response, the U.S. stock market ended the period on a high note, with the S&P 500® Index, a broad measure of U.S. stocks; the blue-chip Dow Jones Industrial Average®; and the technology-laden Nasdaq Composite Index each rising more than 9% in November and more than 4% in December 2023. Unlike the equity rally during the first half of the period driven by a handful of large-cap technology-related stocks, the year-end rally extended across a wider range of market capitalizations, with the small-cap Russell 2000® Index keeping pace with its large-cap brethren in November, and significantly outperforming them in December.
For the period as a whole, U.S. equity performance was also strong. The S&P 500® Index returned 26.29%, the Dow Jones Industrial Average® returned 16.18%, the Nasdaq Composite Index returned 44.64%, and the Russell 2000® Index returned 16.93%.
Fund Performance
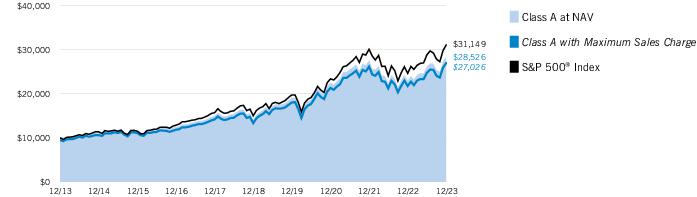
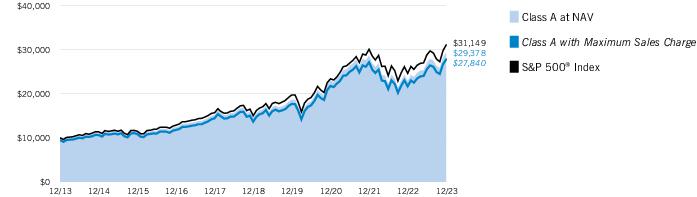
For the 12-month period ended December 31, 2023, Eaton Vance Stock Fund (the Fund) returned 24.02% for Class A shares at net asset value (NAV), underperforming its benchmark, the S&P 500® Index (the Index), which returned 26.29%.
On an individual stock basis, the largest detractors from Fund performance versus the Index during the period were underweight positions in NVIDIA Corp. (NVIDIA) and Meta Platforms, Inc. (Meta), and not owning Index component Tesla, Inc. (Tesla).
Semiconductor maker NVIDIA’s share price more than tripled during the period, lifted by increased demand for its high-end graphics processing units in the burgeoning artificial intelligence (AI) industry.
The share price of Meta -- the social media giant behind Facebook, Instagram, and Messenger -- nearly tripled during the period, as advertising revenues rebounded on improved ad targeting, while profit margins exceeded expectations due to more rational spending on longer-term initiatives.
Both NVIDIA and Meta were added to the portfolio later in the period, missing much of the run-up in each company’s share price.
To stimulate sales, electric vehicle maker Tesla announced price cuts during the period that weighed on profit margins and led the company to lower its earnings projections. Despite that negative news, Tesla’s stock price doubled during the period, as investors still viewed the company as a leader in long-term growth opportunities involving electric cars and autonomous driving.
On a sector basis, stock selections in the information technology, communication services, and utilities sectors detracted from Fund performance versus the Index during the period.
In contrast, the largest individual stock contributors to Fund performance relative to the Index were overweight positions in Lam Research Corp. (Lam Research) and Eli Lilly & Co. (Eli Lilly).
Lam Research manufactures equipment used to fabricate semiconductor microchips. Although sales and earnings were relatively weak during the period, the company’s stock price nearly doubled on investor enthusiasm over AI and the potential for stronger sales in 2024 and beyond to supply chip producers with new equipment.
See Endnotes and Additional Disclosures in this report.
Past performance is no guarantee of future results. Returns are historical and are calculated by determining the percentage change in net asset value (NAV) or offering price (as applicable) with all distributions reinvested. Furthermore, returns do not reflect the deduction of taxes that shareholders may have to pay on Fund distributions or upon the redemption of Fund shares. Investment return and principal value will fluctuate so that shares, when redeemed, may be worth more or less than their original cost. Performance for periods less than or equal to one year is cumulative. Performance is for the stated time period only; due to market volatility, current Fund performance may be lower or higher than the quoted return. For performance as of the most recent month-end, please refer to eatonvance.com.
Eaton Vance
Stock Fund
December 31, 2023
Management’s Discussion of Fund Performance† — continued
Eli Lilly is a global drugmaker specializing in diabetes, oncology, and immunology therapies. The company’s share price appreciated during the period, with its best performance occurring in August 2023 after Eli Lilly reported strong second-quarter earnings, driven in part by sales of its diabetes drug, Mounjaro. An additional tailwind for Eli Lilly’s stock price was the U.S. Food and Drug Administration’s approval in November 2023 of Zepbound™, the company’s new treatment for obesity and overweight conditions with weight-related medical issues.
On a sector basis, stock selections and underweight positions in the health care and energy sectors, along with stock selections in the financials sector, contributed to Fund performance versus the Index during the period.
See Endnotes and Additional Disclosures in this report.
Past performance is no guarantee of future results. Returns are historical and are calculated by determining the percentage change in net asset value (NAV) or offering price (as applicable) with all distributions reinvested. Furthermore, returns do not reflect the deduction of taxes that shareholders may have to pay on Fund distributions or upon the redemption of Fund shares. Investment return and principal value will fluctuate so that shares, when redeemed, may be worth more or less than their original cost. Performance for periods less than or equal to one year is cumulative. Performance is for the stated time period only; due to market volatility, current Fund performance may be lower or higher than the quoted return. For performance as of the most recent month-end, please refer to eatonvance.com.
Eaton Vance
Stock Fund
December 31, 2023
Performance
Portfolio Manager(s) Charles B. Gaffney
| % Average Annual Total Returns1,2 | Class
Inception Date | Performance
Inception Date | One Year | Five Years | Ten Years |
| Class A at NAV | 11/01/2001 | 11/01/2001 | 24.02% | 15.12% | 11.05% |
| Class A with 5.25% Maximum Sales Charge | — | — | 17.51 | 13.88 | 10.45 |
| Class C at NAV | 10/01/2009 | 11/01/2001 | 23.13 | 14.26 | 10.39 |
| Class C with 1% Maximum Deferred Sales Charge | — | — | 22.13 | 14.26 | 10.39 |
| Class I at NAV | 09/03/2008 | 11/01/2001 | 24.41 | 15.41 | 11.32 |
|
| S&P 500® Index | — | — | 26.29% | 15.68% | 12.03% |
| % Total Annual Operating Expense Ratios3 | Class A | Class C | Class I |
| Gross | 1.11% | 1.86% | 0.86% |
| Net | 0.98 | 1.73 | 0.73 |
Growth of $10,000
This graph shows the change in value of a hypothetical investment of $10,000 in Class A of the Fund for the period indicated. For comparison, the same investment is shown in the indicated index.
| Growth of Investment | Amount Invested | Period Beginning | At NAV | With Maximum Sales Charge |
| Class C | $10,000 | 12/31/2013 | $26,879 | N.A. |
| Class I, at minimum investment | $1,000,000 | 12/31/2013 | $2,925,038 | N.A. |
See Endnotes and Additional Disclosures in this report.
Past performance is no guarantee of future results. Returns are historical and are calculated by determining the percentage change in net asset value (NAV) or offering price (as applicable) with all distributions reinvested. Furthermore, returns do not reflect the deduction of taxes that shareholders may have to pay on Fund distributions or upon the redemption of Fund shares. Investment return and principal value will fluctuate so that shares, when redeemed, may be worth more or less than their original cost. Performance for periods less than or equal to one year is cumulative. Performance is for the stated time period only; due to market volatility, current Fund performance may be lower or higher than the quoted return. For performance as of the most recent month-end, please refer to eatonvance.com.
Eaton Vance
Stock Fund
December 31, 2023
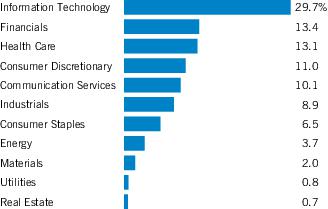
| Sector Allocation (% of net assets)1 |
| Top 10 Holdings (% of net assets)1 |
| Microsoft Corp. | 8.9% |
| Apple, Inc. | 7.7 |
| Amazon.com, Inc. | 4.8 |
| Alphabet, Inc., Class C | 4.8 |
| NVIDIA Corp. | 4.2 |
| Visa, Inc., Class A | 2.6 |
| Meta Platforms, Inc., Class A | 2.6 |
| Eli Lilly & Co. | 2.4 |
| Walmart, Inc. | 2.3 |
| AbbVie, Inc. | 2.2 |
| Total | 42.5% |
Fund invests in an affiliated investment company (Portfolio) with the same objective(s) and policies as the Fund. References to investments are to the Portfolio’s holdings.
Footnotes:
| 1 | Excludes cash and cash equivalents. |
Eaton Vance
Stock Fund
December 31, 2023
Endnotes and Additional Disclosures
| † | The views expressed in this report are those of the portfolio manager(s) and are current only through the date stated at the top of this page. These views are subject to change at any time based upon market or other conditions, and Eaton Vance and the Fund(s) disclaim any responsibility to update such views. These views may not be relied upon as investment advice and, because investment decisions are based on many factors, may not be relied upon as an indication of trading intent on behalf of any Eaton Vance fund. This commentary may contain statements that are not historical facts, referred to as “forward-looking statements.” The Fund’s actual future results may differ significantly from those stated in any forward-looking statement, depending on factors such as changes in securities or financial markets or general economic conditions, the volume of sales and purchases of Fund shares, the continuation of investment advisory, administrative and service contracts, and other risks discussed from time to time in the Fund’s filings with the Securities and Exchange Commission. |
| | |
| 1 | S&P 500® Index is an unmanaged index of large-cap stocks commonly used as a measure of U.S. stock market performance. S&P Dow Jones Indices are a product of S&P Dow Jones Indices LLC (“S&P DJI”) and have been licensed for use. S&P® and S&P 500® are registered trademarks of S&P DJI; Dow Jones® is a registered trademark of Dow Jones Trademark Holdings LLC (“Dow Jones”); S&P DJI, Dow Jones and their respective affiliates do not sponsor, endorse, sell or promote the Fund, will not have any liability with respect thereto and do not have any liability for any errors, omissions, or interruptions of the S&P Dow Jones Indices. Unless otherwise stated, index returns do not reflect the effect of any applicable sales charges, commissions, expenses, taxes or leverage, as applicable. It is not possible to invest directly in an index. |
| 2 | Total Returns at NAV do not include applicable sales charges. If sales charges were deducted, the returns would be lower. Total Returns shown with maximum sales charge reflect the stated maximum sales charge. Unless otherwise stated, performance does not reflect the deduction of taxes on Fund distributions or redemptions of Fund shares.Effective November 5, 2020, Class C shares automatically convert to Class A shares eight years after purchase. The average annual total returns listed for Class C reflect conversion to Class A shares after eight years. Prior to November 5, 2020, Class C shares automatically converted to Class A shares ten years after purchase. |
| 3 | Source: Fund prospectus. Net expense ratios reflect a contractual expense reimbursement that continues through 4/30/24. The expense ratios for the current reporting period can be found in the Financial Highlights section of this report. Performance reflects expenses waived and/or reimbursed, if applicable. Without such waivers and/or reimbursements, performance would have been lower. |
| | Fund profile subject to change due to active management. |
| | Additional Information |
| | Dow Jones Industrial Average® is a price-weighted average of 30 blue-chip stocks that are generally the leaders in their industry. Nasdaq Composite Index is a market capitalization-weighted index of all domestic and international securities listed on Nasdaq. Source: Nasdaq, Inc. The information is provided by Nasdaq (with its affiliates, are referred to as the “Corporations”) and Nasdaq’s third party licensors on an “as is” basis and the Corporations make no guarantees and bear no liability of any kind with respect to the information or the Fund. Russell 2000® Index is an unmanaged index of 2,000 U.S. small-cap stocks. |
Eaton Vance
Stock Fund
December 31, 2023
Example
As a Fund shareholder, you incur two types of costs: (1) transaction costs, including sales charges (loads) on purchases; and (2) ongoing costs, including management fees; distribution and/or service fees; and other Fund expenses. This Example is intended to help you understand your ongoing costs (in dollars) of Fund investing and to compare these costs with the ongoing costs of investing in other mutual funds. The Example is based on an investment of $1,000 invested at the beginning of the period and held for the entire period (July 1, 2023 to December 31, 2023).
Actual Expenses
The first section of the table below provides information about actual account values and actual expenses. You may use the information in this section, together with the amount you invested, to estimate the expenses that you paid over the period. Simply divide your account value by $1,000 (for example, an $8,600 account value divided by $1,000 = 8.6), then multiply the result by the number in the first section under the heading entitled “Expenses Paid During Period” to estimate the expenses you paid on your account during this period.
Hypothetical Example for Comparison Purposes
The second section of the table below provides information about hypothetical account values and hypothetical expenses based on the actual Fund expense ratio and an assumed rate of return of 5% per year (before expenses), which is not the actual Fund return. The hypothetical account values and expenses may not be used to estimate the actual ending account balance or expenses you paid for the period. You may use this information to compare the ongoing costs of investing in your Fund and other funds. To do so, compare this 5% hypothetical example with the 5% hypothetical examples that appear in the shareholder reports of the other funds.
Please note that the expenses shown in the table are meant to highlight your ongoing costs only and do not reflect any transactional costs, such as sales charges (loads). Therefore, the second section of the table is useful in comparing ongoing costs only, and will not help you determine the relative total costs of owning different funds. In addition, if these transactional costs were included, your costs would be higher.
| | Beginning
Account Value
(7/1/23) | Ending
Account Value
(12/31/23) | Expenses Paid
During Period*
(7/1/23 – 12/31/23) | Annualized
Expense
Ratio |
| Actual | | | | |
| Class A | $1,000.00 | $1,091.30 | $5.17** | 0.98% |
| Class C | $1,000.00 | $1,087.50 | $9.10** | 1.73% |
| Class I | $1,000.00 | $1,093.10 | $3.85** | 0.73% |
| |
| Hypothetical | | | | |
| (5% return per year before expenses) | | | | |
| Class A | $1,000.00 | $1,020.27 | $4.99** | 0.98% |
| Class C | $1,000.00 | $1,016.48 | $8.79** | 1.73% |
| Class I | $1,000.00 | $1,021.53 | $3.72** | 0.73% |
| * | Expenses are equal to the Fund’s annualized expense ratio for the indicated Class, multiplied by the average account value over the period, multiplied by 184/365 (to reflect the one-half year period). The Example assumes that the $1,000 was invested at the net asset value per share determined at the close of business on June 30, 2023. The Example reflects the expenses of both the Fund and the Portfolio. |
| ** | Absent an allocation of certain expenses to affiliate(s), expenses would be higher. |
Eaton Vance
Stock Fund
December 31, 2023
Statement of Assets and Liabilities
| | December 31, 2023 |
| Assets | |
| Investment in Stock Portfolio, at value (identified cost $39,515,794) | $ 79,559,485 |
| Receivable for Fund shares sold | 19,953 |
| Total assets | $79,579,438 |
| Liabilities | |
| Payable for Fund shares redeemed | $ 28,314 |
| Payable to affiliates: | |
| Distribution and service fees | 15,346 |
| Trustees' fees | 125 |
| Other | 489 |
| Accrued expenses | 51,347 |
| Total liabilities | $ 95,621 |
| Net Assets | $79,483,817 |
| Sources of Net Assets | |
| Paid-in capital | $ 52,710,082 |
| Distributable earnings | 26,773,735 |
| Net Assets | $79,483,817 |
| Class A Shares | |
| Net Assets | $ 52,274,183 |
| Shares Outstanding | 2,825,746 |
Net Asset Value and Redemption Price Per Share
(net assets ÷ shares of beneficial interest outstanding) | $ 18.50 |
Maximum Offering Price Per Share
(100 ÷ 94.75 of net asset value per share) | $ 19.53 |
| Class C Shares | |
| Net Assets | $ 5,027,473 |
| Shares Outstanding | 287,400 |
Net Asset Value and Offering Price Per Share*
(net assets ÷ shares of beneficial interest outstanding) | $ 17.49 |
| Class I Shares | |
| Net Assets | $ 22,182,161 |
| Shares Outstanding | 1,197,922 |
Net Asset Value, Offering Price and Redemption Price Per Share
(net assets ÷ shares of beneficial interest outstanding) | $ 18.52 |
| On sales of $50,000 or more, the offering price of Class A shares is reduced. |
| * | Redemption price per share is equal to the net asset value less any applicable contingent deferred sales charge. |
8
See Notes to Financial Statements.
Eaton Vance
Stock Fund
December 31, 2023
| | Year Ended |
| | December 31, 2023 |
| Investment Income | |
| Dividend income allocated from Portfolio (net of foreign taxes withheld of $2,201) | $ 935,072 |
| Expenses allocated from Portfolio | (485,111) |
| Total investment income from Portfolio | $ 449,961 |
| Expenses | |
| Distribution and service fees: | |
| Class A | $ 120,490 |
| Class C | 53,687 |
| Trustees’ fees and expenses | 500 |
| Custodian fee | 18,095 |
| Transfer and dividend disbursing agent fees | 51,003 |
| Legal and accounting services | 21,125 |
| Printing and postage | 12,779 |
| Registration fees | 47,904 |
| Miscellaneous | 10,089 |
| Total expenses | $ 335,672 |
| Deduct: | |
| Waiver and/or reimbursement of expenses by affiliates | $ 95,774 |
| Total expense reductions | $ 95,774 |
| Net expenses | $ 239,898 |
| Net investment income | $ 210,063 |
| Realized and Unrealized Gain (Loss) from Portfolio | |
| Net realized gain (loss): | |
| Investment transactions | $ 6,121,890 |
| Foreign currency transactions | (836) |
| Net realized gain | $ 6,121,054 |
| Change in unrealized appreciation (depreciation): | |
| Investments | $ 10,128,035 |
| Foreign currency | 995 |
| Net change in unrealized appreciation (depreciation) | $10,129,030 |
| Net realized and unrealized gain | $16,250,084 |
| Net increase in net assets from operations | $16,460,147 |
9
See Notes to Financial Statements.
Eaton Vance
Stock Fund
December 31, 2023
Statements of Changes in Net Assets
| | Year Ended December 31, |
| | 2023 | 2022 |
| Increase (Decrease) in Net Assets | | |
| From operations: | | |
| Net investment income | $ 210,063 | $ 423,932 |
| Net realized gain | 6,121,054 | 4,149,623 |
| Net change in unrealized appreciation (depreciation) | 10,129,030 | (21,219,077) |
| Net increase (decrease) in net assets from operations | $ 16,460,147 | $ (16,645,522) |
| Distributions to shareholders: | | |
| Class A | $ (8,061,895) | $ (6,076,816) |
| Class C | (777,005) | (696,918) |
| Class I | (3,368,037) | (2,898,052) |
| Total distributions to shareholders | $(12,206,937) | $ (9,671,786) |
| Transactions in shares of beneficial interest: | | |
| Class A | $ 3,221,556 | $ 1,339,943 |
| Class C | (878,150) | 138,239 |
| Class I | (1,183,453) | (2,388,215) |
| Net increase (decrease) in net assets from Fund share transactions | $ 1,159,953 | $ (910,033) |
| Other capital: | | |
| Portfolio transaction fee contributed to Portfolio | $ — | $ (95,021) |
| Portfolio transaction fee allocated from Portfolio | — | 112,799 |
| Net increase in net assets from other capital | $ — | $ 17,778 |
| Net increase (decrease) in net assets | $ 5,413,163 | $ (27,209,563) |
| Net Assets | | |
| At beginning of year | $ 74,070,654 | $101,280,217 |
| At end of year | $ 79,483,817 | $ 74,070,654 |
10
See Notes to Financial Statements.
Eaton Vance
Stock Fund
December 31, 2023
| | Class A |
| | Year Ended December 31, |
| | 2023 | 2022 | 2021 | 2020 | 2019 |
| Net asset value — Beginning of year | $ 17.510 | $ 24.120 | $ 22.120 | $ 19.110 | $ 14.720 |
| Income (Loss) From Operations | | | | | |
| Net investment income(1) | $ 0.050 | $ 0.102 | $ 0.049 | $ 0.097 | $ 0.114 |
| Net realized and unrealized gain (loss) | 4.144 | (4.175) | 4.959 | 3.346 | 5.023 |
| Total income (loss) from operations | $ 4.194 | $ (4.073) | $ 5.008 | $ 3.443 | $ 5.137 |
| Less Distributions | | | | | |
| From net investment income | $ (0.043) | $ (0.118) | $ (0.097) | $ (0.041) | $ (0.096) |
| From net realized gain | (3.161) | (2.423) | (2.913) | (0.392) | (0.653) |
| Total distributions | $ (3.204) | $ (2.541) | $ (3.010) | $ (0.433) | $ (0.749) |
| Portfolio transaction fee, net(1) | $ — | $ 0.004 | $ 0.002 | $ (0.000)(2) | $ 0.002 |
| Net asset value — End of year | $18.500 | $17.510 | $24.120 | $22.120 | $19.110 |
| Total Return(3)(4) | 24.02% | (16.78)% | 22.78% | 18.22% | 35.01% |
| Ratios/Supplemental Data | | | | | |
| Net assets, end of year (000’s omitted) | $ 52,274 | $ 46,464 | $ 61,304 | $ 60,148 | $ 53,153 |
| Ratios (as a percentage of average daily net assets):(5) | | | | | |
| Expenses (4) | 0.98% (6) | 0.98% (6) | 0.98% | 0.98% | 0.98% |
| Net investment income | 0.26% | 0.49% | 0.20% | 0.51% | 0.65% |
| Portfolio Turnover of the Portfolio | 44% | 52% | 44% | 70% | 55% |
| (1) | Computed using average shares outstanding. |
| (2) | Amount is less than $(0.0005). |
| (3) | Returns are historical and are calculated by determining the percentage change in net asset value with all distributions reinvested and do not reflect the effect of sales charges. |
| (4) | The administrator reimbursed certain operating expenses (equal to 0.13%, 0.13%, 0.07%, 0.10% and 0.12% of average daily net assets for the years ended December 31, 2023, 2022, 2021, 2020 and 2019, respectively). Absent this reimbursement, total return would be lower. |
| (5) | Includes the Fund’s share of the Portfolio's allocated expenses. |
| (6) | Includes a reduction by the investment adviser of a portion of the Portfolio's adviser fee due to the Portfolio's investment in the Liquidity Fund (equal to less than 0.005% of average daily net assets for the years ended December 31, 2023 and 2022). |
11
See Notes to Financial Statements.
Eaton Vance
Stock Fund
December 31, 2023
Financial Highlights — continued
| | Class C |
| | Year Ended December 31, |
| | 2023 | 2022 | 2021 | 2020 | 2019 |
| Net asset value — Beginning of year | $ 16.790 | $ 23.230 | $ 21.400 | $ 18.610 | $ 14.380 |
| Income (Loss) From Operations | | | | | |
| Net investment loss(1) | $ (0.089) | $ (0.054) | $ (0.130) | $ (0.040) | $ (0.018) |
| Net realized and unrealized gain (loss) | 3.950 | (4.014) | 4.784 | 3.235 | 4.899 |
| Total income (loss) from operations | $ 3.861 | $ (4.068) | $ 4.654 | $ 3.195 | $ 4.881 |
| Less Distributions | | | | | |
| From net investment income | $ — | $ — | $ — | $ (0.013) | $ — |
| From net realized gain | (3.161) | (2.376) | (2.826) | (0.392) | (0.653) |
| Total distributions | $ (3.161) | $ (2.376) | $ (2.826) | $ (0.405) | $ (0.653) |
| Portfolio transaction fee, net(1) | $ — | $ 0.004 | $ 0.002 | $ (0.000)(2) | $ 0.002 |
| Net asset value — End of year | $17.490 | $16.790 | $23.230 | $21.400 | $18.610 |
| Total Return(3)(4) | 23.13% | (17.46)% | 21.88% | 17.36% | 34.04% |
| Ratios/Supplemental Data | | | | | |
| Net assets, end of year (000’s omitted) | $ 5,027 | $ 5,579 | $ 7,418 | $ 6,728 | $ 11,418 |
| Ratios (as a percentage of average daily net assets):(5) | | | | | |
| Expenses (4) | 1.73% (6) | 1.73% (6) | 1.73% | 1.73% | 1.73% |
| Net investment loss | (0.49)% | (0.27)% | (0.55)% | (0.22)% | (0.11)% |
| Portfolio Turnover of the Portfolio | 44% | 52% | 44% | 70% | 55% |
| (1) | Computed using average shares outstanding. |
| (2) | Amount is less than $(0.0005). |
| (3) | Returns are historical and are calculated by determining the percentage change in net asset value with all distributions reinvested and do not reflect the effect of sales charges. |
| (4) | The administrator reimbursed certain operating expenses (equal to 0.13%, 0.13%, 0.07%, 0.10% and 0.12% of average daily net assets for the years ended December 31, 2023, 2022, 2021, 2020 and 2019, respectively). Absent this reimbursement, total return would be lower. |
| (5) | Includes the Fund’s share of the Portfolio's allocated expenses. |
| (6) | Includes a reduction by the investment adviser of a portion of the Portfolio's adviser fee due to the Portfolio's investment in the Liquidity Fund (equal to less than 0.005% of average daily net assets for the years ended December 31, 2023 and 2022). |
12
See Notes to Financial Statements.
Eaton Vance
Stock Fund
December 31, 2023
Financial Highlights — continued
| | Class I |
| | Year Ended December 31, |
| | 2023 | 2022 | 2021 | 2020 | 2019 |
| Net asset value — Beginning of year | $ 17.520 | $ 24.140 | $ 22.130 | $ 19.110 | $ 14.720 |
| Income (Loss) From Operations | | | | | |
| Net investment income(1) | $ 0.098 | $ 0.154 | $ 0.110 | $ 0.146 | $ 0.158 |
| Net realized and unrealized gain (loss) | 4.153 | (4.181) | 4.974 | 3.354 | 5.023 |
| Total income (loss) from operations | $ 4.251 | $ (4.027) | $ 5.084 | $ 3.500 | $ 5.181 |
| Less Distributions | | | | | |
| From net investment income | $ (0.090) | $ (0.174) | $ (0.163) | $ (0.088) | $ (0.140) |
| From net realized gain | (3.161) | (2.423) | (2.913) | (0.392) | (0.653) |
| Total distributions | $ (3.251) | $ (2.597) | $ (3.076) | $ (0.480) | $ (0.793) |
| Portfolio transaction fee, net(1) | $ — | $ 0.004 | $ 0.002 | $ (0.000)(2) | $ 0.002 |
| Net asset value — End of year | $18.520 | $17.520 | $24.140 | $22.130 | $19.110 |
| Total Return(3)(4) | 24.41% | (16.62)% | 23.12% | 18.52% | 35.32% |
| Ratios/Supplemental Data | | | | | |
| Net assets, end of year (000’s omitted) | $ 22,182 | $ 22,027 | $ 32,558 | $ 40,943 | $ 37,375 |
| Ratios (as a percentage of average daily net assets):(5) | | | | | |
| Expenses (4) | 0.73% (6) | 0.73% (6) | 0.73% | 0.73% | 0.73% |
| Net investment income | 0.51% | 0.73% | 0.45% | 0.76% | 0.89% |
| Portfolio Turnover of the Portfolio | 44% | 52% | 44% | 70% | 55% |
| (1) | Computed using average shares outstanding. |
| (2) | Amount is less than $(0.0005). |
| (3) | Returns are historical and are calculated by determining the percentage change in net asset value with all distributions reinvested. |
| (4) | The administrator reimbursed certain operating expenses (equal to 0.13%, 0.13%, 0.07%, 0.10% and 0.12% of average daily net assets for the years ended December 31, 2023, 2022, 2021, 2020 and 2019, respectively). Absent this reimbursement, total return would be lower. |
| (5) | Includes the Fund’s share of the Portfolio's allocated expenses. |
| (6) | Includes a reduction by the investment adviser of a portion of the Portfolio's adviser fee due to the Portfolio's investment in the Liquidity Fund (equal to less than 0.005% of average daily net assets for the years ended December 31, 2023 and 2022). |
13
See Notes to Financial Statements.
Eaton Vance
Stock Fund
December 31, 2023
Notes to Financial Statements
1 Significant Accounting Policies
Eaton Vance Stock Fund (the Fund) is a diversified series of Eaton Vance Mutual Funds Trust (the Trust). The Trust is a Massachusetts business trust registered under the Investment Company Act of 1940, as amended (the 1940 Act), as an open-end management investment company. The Fund offers three classes of shares. Class A shares are generally sold subject to a sales charge imposed at time of purchase. Class C shares are sold at net asset value and are generally subject to a contingent deferred sales charge (see Note 5). Effective November 5, 2020, Class C shares automatically convert to Class A shares eight years after their purchase as described in the Fund’s prospectus. Class I shares are sold at net asset value and are not subject to a sales charge. Each class represents a pro rata interest in the Fund, but votes separately on class-specific matters and (as noted below) is subject to different expenses. Realized and unrealized gains and losses and net investment income and losses, other than class-specific expenses, are allocated daily to each class of shares based on the relative net assets of each class to the total net assets of the Fund. Each class of shares differs in its distribution plan and certain other class-specific expenses. The Fund invests all of its investable assets in interests in Stock Portfolio (the Portfolio), a Massachusetts business trust, having the same investment objective and policies as the Fund. The value of the Fund’s investment in the Portfolio reflects the Fund’s proportionate interest in the net assets of the Portfolio (13.4% at December 31, 2023). The performance of the Fund is directly affected by the performance of the Portfolio. The financial statements of the Portfolio, including the portfolio of investments, are included elsewhere in this report and should be read in conjunction with the Fund’s financial statements.
The following is a summary of significant accounting policies of the Fund. The policies are in conformity with accounting principles generally accepted in the United States of America (U.S. GAAP). The Fund is an investment company and follows accounting and reporting guidance in the Financial Accounting Standards Board (FASB) Accounting Standards Codification Topic 946.
A Investment Valuation—Valuation of securities by the Portfolio is discussed in Note 1A of the Portfolio's Notes to Financial Statements, which are included elsewhere in this report.
B Income—The Fund's net investment income or loss consists of the Fund's pro rata share of the net investment income or loss of the Portfolio, less all actual and accrued expenses of the Fund.
C Federal Taxes—The Fund’s policy is to comply with the provisions of the Internal Revenue Code applicable to regulated investment companies and to distribute to shareholders each year substantially all of its net investment income, and all or substantially all of its net realized capital gains. Accordingly, no provision for federal income or excise tax is necessary.
As of December 31, 2023, the Fund had no uncertain tax positions that would require financial statement recognition, de-recognition, or disclosure. The Fund files a U.S. federal income tax return annually after its fiscal year-end, which is subject to examination by the Internal Revenue Service for a period of three years from the date of filing.
D Expenses—The majority of expenses of the Trust are directly identifiable to an individual fund. Expenses which are not readily identifiable to a specific fund are allocated taking into consideration, among other things, the nature and type of expense and the relative size of the funds.
E Use of Estimates—The preparation of the financial statements in conformity with U.S. GAAP requires management to make estimates and assumptions that affect the reported amounts of assets and liabilities at the date of the financial statements and the reported amounts of income and expense during the reporting period. Actual results could differ from those estimates.
F Indemnifications—Under the Trust’s organizational documents, its officers and Trustees may be indemnified against certain liabilities and expenses arising out of the performance of their duties to the Fund. Under Massachusetts law, if certain conditions prevail, shareholders of a Massachusetts business trust (such as the Trust) could be deemed to have personal liability for the obligations of the Trust. However, the Trust’s Declaration of Trust contains an express disclaimer of liability on the part of Fund shareholders and the By-laws provide that the Trust shall assume, upon request by the shareholder, the defense on behalf of any Fund shareholders. Moreover, the By-laws also provide for indemnification out of Fund property of any shareholder held personally liable solely by reason of being or having been a shareholder for all loss or expense arising from such liability. Additionally, in the normal course of business, the Fund enters into agreements with service providers that may contain indemnification clauses. The Fund's maximum exposure under these arrangements is unknown as this would involve future claims that may be made against the Fund that have not yet occurred.
G Other—Investment transactions are accounted for on a trade date basis.
Eaton Vance
Stock Fund
December 31, 2023
Notes to Financial Statements — continued
2 Distributions to Shareholders and Income Tax Information
It is the present policy of the Fund to make at least one distribution annually (normally in December) of all or substantially all of its net investment income and to distribute annually all or substantially all of its net realized capital gains. Distributions to shareholders are recorded on the ex-dividend date. Distributions are declared separately for each class of shares. Shareholders may reinvest income and capital gain distributions in additional shares of the same class of the Fund at the net asset value as of the ex-dividend date or, at the election of the shareholder, receive distributions in cash. Distributions to shareholders are determined in accordance with income tax regulations, which may differ from U.S. GAAP. As required by U.S. GAAP, only distributions in excess of tax basis earnings and profits are reported in the financial statements as a return of capital. Permanent differences between book and tax accounting relating to distributions are reclassified to paid-in capital. For tax purposes, distributions from short-term capital gains are considered to be from ordinary income.
The tax character of distributions declared for the years ended December 31, 2023 and December 31, 2022 was as follows:
| | Year Ended December 31, |
| | 2023 | 2022 |
| Ordinary income | $ 200,302 | $ 652,176 |
| Long-term capital gains | $12,006,635 | $9,019,610 |
During the year ended December 31, 2023, distributable earnings was decreased by $1,009,411 and paid-in capital was increased by $1,009,411 due to the Fund’s use of equalization accounting. Tax equalization accounting allows the Fund to treat as a distribution that portion of redemption proceeds representing a redeeming shareholder’s portion of undistributed taxable income and net capital gains. These reclassifications had no effect on the net assets or net asset value per share of the Fund.
As of December 31, 2023, the components of distributable earnings (accumulated loss) on a tax basis were as follows:
| Undistributed long-term capital gains | $ 5,023,592 |
| Net unrealized appreciation | 21,750,143 |
| Distributable earnings | $26,773,735 |
3 Investment Adviser Fee and Other Transactions with Affiliates
The investment adviser fee is earned by Eaton Vance Management (EVM), an indirect, wholly-owned subsidiary of Morgan Stanley, as compensation for investment advisory services rendered to the Fund. The investment adviser fee is computed at an annual rate as a percentage of the Fund’s average daily net assets that are not invested in other investment companies for which EVM or its affiliates serve as investment adviser and receive an advisory fee as follows and is payable monthly:
| Average Daily Net Assets | Annual Fee Rate |
| Up to $500 million | 0.600% |
| $500 million but less than $1 billion | 0.575% |
| $1 billion but less than $2.5 billion | 0.550% |
| $2.5 billion but less than $5 billion | 0.530% |
| $5 billion and over | 0.515% |
For the year ended December 31, 2023, the Fund incurred no investment adviser fee on such assets. To the extent that the Fund’s assets are invested in the Portfolio, the Fund is allocated its share of the Portfolio’s investment adviser fee. The Portfolio has engaged Boston Management and Research (BMR) to render investment advisory services. See Note 2 of the Portfolio’s Notes to Financial Statements which are included elsewhere in this report. EVM also serves as the administrator of the Fund, but receives no compensation.
Eaton Vance
Stock Fund
December 31, 2023
Notes to Financial Statements — continued
EVM has agreed to reimburse the Fund’s expenses to the extent that total annual operating expenses (relating to ordinary operating expenses only and excluding such expenses as brokerage commissions, acquired fund fees and expenses of unaffiliated funds, borrowing costs, taxes or litigation expenses) exceed 0.98%, 1.73% and 0.73% of the Fund’s average daily net assets for Class A, Class C and Class I, respectively. This agreement may be changed or terminated after April 30, 2024. Pursuant to this agreement, EVM was allocated $95,774 of the Fund’s operating expenses for the year ended December 31, 2023.
EVM provides sub-transfer agency and related services to the Fund pursuant to a Sub-Transfer Agency Support Services Agreement. For the year ended December 31, 2023, EVM earned $11,887 from the Fund pursuant to such agreement, which is included in transfer and dividend disbursing agent fees on the Statement of Operations. The Fund was informed that Eaton Vance Distributors, Inc. (EVD), an affiliate of EVM and the Fund’s principal underwriter, received $2,325 as its portion of the sales charge on sales of Class A shares for the year ended December 31, 2023. EVD also received distribution and service fees from Class A and Class C shares (see Note 4) and contingent deferred sales charges (see Note 5).
Trustees and officers of the Fund who are members of EVM’s or BMR’s organizations receive remuneration for their services to the Fund out of the investment adviser fee. Certain officers and Trustees of the Fund and the Portfolio are officers of the above organizations.
4 Distribution Plans
The Fund has in effect a distribution plan for Class A shares (Class A Plan) pursuant to Rule 12b-1 under the 1940 Act. Pursuant to the Class A Plan, the Fund pays EVD a distribution and service fee of 0.25% per annum of its average daily net assets attributable to Class A shares for distribution services and facilities provided to the Fund by EVD, as well as for personal services and/or the maintenance of shareholder accounts. Distribution and service fees paid or accrued to EVD for the year ended December 31, 2023 amounted to $120,490 for Class A shares.
The Fund also has in effect a distribution plan for Class C shares (Class C Plan) pursuant to Rule 12b-1 under the 1940 Act. Pursuant to the Class C Plan, the Fund pays EVD amounts equal to 0.75% per annum of its average daily net assets attributable to Class C shares for providing ongoing distribution services and facilities to the Fund. For the year ended December 31, 2023, the Fund paid or accrued to EVD $40,265 for Class C shares.
Pursuant to the Class C Plan, the Fund also makes payments of service fees to EVD, financial intermediaries and other persons in amounts equal to 0.25% per annum of its average daily net assets attributable to that class. Service fees paid or accrued are for personal services and/or the maintenance of shareholder accounts. They are separate and distinct from the sales commissions and distribution fees payable to EVD. Service fees paid or accrued for the year ended December 31, 2023 amounted to $13,422 for Class C shares.
Distribution and service fees are subject to the limitations contained in the Financial Industry Regulatory Authority Rule 2341(d).
5 Contingent Deferred Sales Charges
A contingent deferred sales charge (CDSC) of 1% generally is imposed on redemptions of Class C shares made within 12 months of purchase. Class A shares may be subject to a 1% CDSC if redeemed within 12 months of purchase (depending on the circumstances of purchase). Generally, the CDSC is based upon the lower of the net asset value at date of redemption or date of purchase. No charge is levied on shares acquired by reinvestment of dividends or capital gain distributions. For the year ended December 31, 2023, the Fund was informed that EVD received $513 of CDSCs paid by Class C shareholders and no CDSCs paid by Class A shareholders.
6 Investment Transactions
For the year ended December 31, 2023, increases and decreases in the Fund's investment in the Portfolio aggregated $3,345,676 and $14,887,418, respectively. Prior to December 24, 2022, a Portfolio transaction fee was imposed by the Portfolio on the combined daily inflows or outflows of the Fund and the Portfolio’s other investors as more fully described at Note 1H of the Portfolio’s financial statements included herein. Such fee was allocated to the Fund based on its pro rata interest in the Portfolio. The amount of the Portfolio transaction fee imposed on the Fund, if any, and the allocation of such fee are presented as Other capital on the Statements of Changes in Net Assets. Effective after the close of business on December 23, 2022, the Portfolio transaction fee was discontinued.
Eaton Vance
Stock Fund
December 31, 2023
Notes to Financial Statements — continued
7 Shares of Beneficial Interest
The Fund’s Declaration of Trust permits the Trustees to issue an unlimited number of full and fractional shares of beneficial interest (without par value). Such shares may be issued in a number of different series (such as the Fund) and classes. Transactions in Fund shares, including direct exchanges pursuant to share class conversions, were as follows:
| | Year Ended
December 31, 2023 | | Year Ended
December 31, 2022 |
| | Shares | Amount | | Shares | Amount |
| Class A | | | | | |
| Sales | 241,532 | $ 4,759,148 | | 148,144 | $ 3,098,707 |
| Issued to shareholders electing to receive payments of distributions in Fund shares | 426,500 | 7,830,540 | | 338,719 | 5,907,268 |
| Redemptions | (495,112) | (9,368,132) | | (375,257) | (7,666,032) |
| Net increase | 172,920 | $ 3,221,556 | | 111,606 | $ 1,339,943 |
| Class C | | | | | |
| Sales | 19,000 | $ 359,148 | | 54,832 | $ 1,143,010 |
| Issued to shareholders electing to receive payments of distributions in Fund shares | 44,733 | 777,005 | | 41,657 | 696,918 |
| Redemptions | (108,565) | (2,014,303) | | (83,602) | (1,701,689) |
| Net increase (decrease) | (44,832) | $ (878,150) | | 12,887 | $ 138,239 |
| Class I | | | | | |
| Sales | 93,175 | $ 1,865,470 | | 87,274 | $ 1,843,491 |
| Issued to shareholders electing to receive payments of distributions in Fund shares | 183,245 | 3,368,037 | | 166,077 | 2,898,052 |
| Redemptions | (335,433) | (6,416,960) | | (344,905) | (7,129,758) |
| Net decrease | (59,013) | $(1,183,453) | | (91,554) | $(2,388,215) |
Eaton Vance
Stock Fund
December 31, 2023
Report of Independent Registered Public Accounting Firm
To the Trustees of Eaton Vance Mutual Funds Trust and Shareholders of Eaton Vance Stock Fund:
Opinion on the Financial Statements and Financial Highlights
We have audited the accompanying statement of assets and liabilities of Eaton Vance Stock Fund (the “Fund”) (one of the funds constituting Eaton Vance Mutual Funds Trust), as of December 31, 2023, the related statement of operations for the year then ended, the statements of changes in net assets for each of the two years in the period then ended, the financial highlights for each of the five years in the period then ended, and the related notes. In our opinion, the financial statements and financial highlights present fairly, in all material respects, the financial position of the Fund as of December 31, 2023, and the results of its operations for the year then ended, the changes in its net assets for each of the two years in the period then ended, and the financial highlights for each of the five years in the period then ended, in conformity with accounting principles generally accepted in the United States of America.
Basis for Opinion
These financial statements and financial highlights are the responsibility of the Fund's management. Our responsibility is to express an opinion on the Fund's financial statements and financial highlights based on our audits. We are a public accounting firm registered with the Public Company Accounting Oversight Board (United States) (PCAOB) and are required to be independent with respect to the Fund in accordance with the U.S. federal securities laws and the applicable rules and regulations of the Securities and Exchange Commission and the PCAOB.
We conducted our audits in accordance with the standards of the PCAOB. Those standards require that we plan and perform the audit to obtain reasonable assurance about whether the financial statements and financial highlights are free of material misstatement, whether due to error or fraud. The Fund is not required to have, nor were we engaged to perform, an audit of its internal control over financial reporting. As part of our audits, we are required to obtain an understanding of internal control over financial reporting but not for the purpose of expressing an opinion on the effectiveness of the Fund’s internal control over financial reporting. Accordingly, we express no such opinion.
Our audits included performing procedures to assess the risks of material misstatement of the financial statements and financial highlights, whether due to error or fraud, and performing procedures that respond to those risks. Such procedures included examining, on a test basis, evidence regarding the amounts and disclosures in the financial statements and financial highlights. Our audits also included evaluating the accounting principles used and significant estimates made by management, as well as evaluating the overall presentation of the financial statements and financial highlights. We believe that our audits provide a reasonable basis for our opinion.
/s/ Deloitte & Touche LLP
Boston, Massachusetts
February 23, 2024
We have served as the auditor of one or more Eaton Vance investment companies since 1959.
Eaton Vance
Stock Fund
December 31, 2023
Federal Tax Information (Unaudited)
The Form 1099-DIV you received in February 2024 showed the tax status of all distributions paid to your account in calendar year 2023. Shareholders are advised to consult their own tax adviser with respect to the tax consequences of their investment in the Fund. As required by the Internal Revenue Code and/or regulations, shareholders must be notified regarding the status of qualified dividend income for individuals, the dividends received deduction for corporations and capital gains dividends.
Qualified Dividend Income. For the fiscal year ended December 31, 2023, the Fund designates approximately $895,808, or up to the maximum amount of such dividends allowable pursuant to the Internal Revenue Code, as qualified dividend income eligible for the reduced tax rate of 15%.
Dividends Received Deduction. Corporate shareholders are generally entitled to take the dividends received deduction on the portion of the Fund’s dividend distribution that qualifies under tax law. For the Fund’s fiscal 2023 ordinary income dividends, 100% qualifies for the corporate dividends received deduction.
Capital Gains Dividends. The Fund hereby designates as a capital gain dividend with respect to the taxable year ended December 31, 2023, $18,032,060 or, if subsequently determined to be different, the net capital gain of such year.
Stock Portfolio
December 31, 2023
| Security | Shares | Value |
| Aerospace & Defense — 0.8% |
| HEICO Corp. | | 26,800 | $ 4,793,716 |
| | | | $ 4,793,716 |
| Biotechnology — 2.2% |
| AbbVie, Inc. | | 84,016 | $ 13,019,959 |
| | | | $ 13,019,959 |
| Broadline Retail — 4.8% |
| Amazon.com, Inc.(1) | | 189,089 | $ 28,730,183 |
| | | | $ 28,730,183 |
| Capital Markets — 6.3% |
| Intercontinental Exchange, Inc. | | 89,304 | $ 11,469,313 |
| S&P Global, Inc. | | 22,836 | 10,059,715 |
| Stifel Financial Corp. | | 114,519 | 7,918,989 |
| Tradeweb Markets, Inc., Class A | | 90,429 | 8,218,187 |
| | | | $ 37,666,204 |
| Chemicals — 1.5% |
| Linde PLC | | 21,306 | $ 8,750,587 |
| | | | $ 8,750,587 |
| Commercial Services & Supplies — 1.8% |
| GFL Environmental, Inc. | | 120,129 | $ 4,145,652 |
| Waste Management, Inc. | | 38,173 | 6,836,784 |
| | | | $ 10,982,436 |
| Consumer Staples Distribution & Retail — 2.3% |
| Walmart, Inc. | | 85,600 | $ 13,494,840 |
| | | | $ 13,494,840 |
| Containers & Packaging — 1.4% |
| AptarGroup, Inc. | | 66,580 | $ 8,230,620 |
| | | | $ 8,230,620 |
| Electric Utilities — 1.3% |
| NextEra Energy, Inc. | | 123,397 | $ 7,495,134 |
| | | | $ 7,495,134 |
| Security | Shares | Value |
| Electrical Equipment — 1.4% |
| AMETEK, Inc. | | 50,957 | $ 8,402,300 |
| | | | $ 8,402,300 |
| Financial Services — 3.7% |
| Shift4 Payments, Inc., Class A(1) | | 89,200 | $ 6,631,128 |
| Visa, Inc., Class A | | 59,330 | 15,446,565 |
| | | | $ 22,077,693 |
| Ground Transportation — 2.2% |
| Uber Technologies, Inc.(1) | | 84,000 | $ 5,171,880 |
| Union Pacific Corp. | | 33,224 | 8,160,479 |
| | | | $ 13,332,359 |
| Health Care Equipment & Supplies — 2.8% |
| Intuitive Surgical, Inc.(1) | | 24,857 | $ 8,385,758 |
| Stryker Corp. | | 26,633 | 7,975,518 |
| | | | $ 16,361,276 |
| Health Care Providers & Services — 1.4% |
| Humana, Inc. | | 18,200 | $ 8,332,142 |
| | | | $ 8,332,142 |
| Hotels, Restaurants & Leisure — 1.6% |
| Domino's Pizza, Inc. | | 7,989 | $ 3,293,305 |
| Marriott International, Inc., Class A | | 28,408 | 6,406,288 |
| | | | $ 9,699,593 |
| Household Products — 1.8% |
| Procter & Gamble Co. (The) | | 74,400 | $ 10,902,576 |
| | | | $ 10,902,576 |
| Insurance — 3.7% |
| Allstate Corp. (The) | | 81,270 | $ 11,376,175 |
| W.R. Berkley Corp. | | 147,000 | 10,395,840 |
| | | | $ 21,772,015 |
| Interactive Media & Services — 7.4% |
| Alphabet, Inc., Class C(1) | | 203,497 | $ 28,678,832 |
| Meta Platforms, Inc., Class A(1) | | 42,612 | 15,082,944 |
| | | | $ 43,761,776 |
| IT Services — 1.3% |
| Gartner, Inc.(1) | | 17,755 | $ 8,009,458 |
| | | | $ 8,009,458 |
20
See Notes to Financial Statements.
Stock Portfolio
December 31, 2023
Portfolio of Investments — continued
| Security | Shares | Value |
| Life Sciences Tools & Services — 3.4% |
| Danaher Corp. | | 27,520 | $ 6,366,477 |
| Illumina, Inc.(1) | | 36,655 | 5,103,842 |
| Thermo Fisher Scientific, Inc. | | 15,980 | 8,482,024 |
| | | | $ 19,952,343 |
| Machinery — 0.9% |
| Parker-Hannifin Corp. | | 12,100 | $ 5,574,470 |
| | | | $ 5,574,470 |
| Media — 1.6% |
| Comcast Corp., Class A | | 221,105 | $ 9,695,454 |
| | | | $ 9,695,454 |
| Multi-Utilities — 0.6% |
| Sempra | | 48,826 | $ 3,648,767 |
| | | | $ 3,648,767 |
| Oil, Gas & Consumable Fuels — 1.9% |
| ConocoPhillips | | 95,256 | $ 11,056,364 |
| | | | $ 11,056,364 |
| Pharmaceuticals — 2.4% |
| Eli Lilly & Co. | | 24,800 | $ 14,456,416 |
| | | | $ 14,456,416 |
| Professional Services — 4.6% |
| Automatic Data Processing, Inc. | | 40,836 | $ 9,513,563 |
| Booz Allen Hamilton Holding Corp. | | 44,590 | 5,703,507 |
| TransUnion | | 173,470 | 11,919,123 |
| | | | $ 27,136,193 |
| Real Estate Management & Development — 1.5% |
| FirstService Corp. | | 53,264 | $ 8,633,562 |
| | | | $ 8,633,562 |
| Semiconductors & Semiconductor Equipment — 9.0% |
| Analog Devices, Inc. | | 49,713 | $ 9,871,013 |
| Broadcom, Inc. | | 9,707 | 10,835,439 |
| Lam Research Corp. | | 9,645 | 7,554,543 |
| NVIDIA Corp. | | 50,500 | 25,008,610 |
| | | | $ 53,269,605 |
| Software — 11.7% |
| ANSYS, Inc.(1) | | 24,201 | $ 8,782,059 |
| Security | Shares | Value |
| Software (continued) |
| Fair Isaac Corp.(1) | | 7,000 | $ 8,148,070 |
| Microsoft Corp. | | 140,264 | 52,744,874 |
| | | | $ 69,675,003 |
| Specialty Retail — 2.4% |
| Burlington Stores, Inc.(1) | | 34,081 | $ 6,628,073 |
| TJX Cos., Inc. (The) | | 78,122 | 7,328,625 |
| | | | $ 13,956,698 |
| Technology Hardware, Storage & Peripherals — 7.7% |
| Apple, Inc. | | 237,484 | $ 45,722,794 |
| | | | $ 45,722,794 |
| Textiles, Apparel & Luxury Goods — 1.1% |
| NIKE, Inc., Class B | | 60,367 | $ 6,554,045 |
| | | | $ 6,554,045 |
| Wireless Telecommunication Services — 1.2% |
| T-Mobile US, Inc. | | 46,008 | $ 7,376,463 |
| | | | $ 7,376,463 |
Total Common Stocks
(identified cost $365,929,040) | | | $592,523,044 |
| Short-Term Investments — 0.4% |
| Security | Shares | Value |
| Morgan Stanley Institutional Liquidity Funds - Government Portfolio, Institutional Class, 5.27%(2) | | 2,428,547 | $ 2,428,547 |
Total Short-Term Investments
(identified cost $2,428,547) | | | $ 2,428,547 |
Total Investments — 100.1%
(identified cost $368,357,587) | | | $594,951,591 |
| Other Assets, Less Liabilities — (0.1)% | | | $ (469,556) |
| Net Assets — 100.0% | | | $594,482,035 |
| The percentage shown for each investment category in the Portfolio of Investments is based on net assets. |
| (1) | Non-income producing security. |
| (2) | May be deemed to be an affiliated investment company. The rate shown is the annualized seven-day yield as of December 31, 2023. |
21
See Notes to Financial Statements.
Stock Portfolio
December 31, 2023
Statement of Assets and Liabilities
| | December 31, 2023 |
| Assets | |
| Unaffiliated investments, at value (identified cost $365,929,040) | $ 592,523,044 |
| Affiliated investments, at value (identified cost $2,428,547) | 2,428,547 |
| Dividends receivable | 373,160 |
| Dividends receivable from affiliated investments | 14,084 |
| Tax reclaims receivable | 22,146 |
| Trustees' deferred compensation plan | 56,331 |
| Total assets | $595,417,312 |
| Liabilities | |
| Payable for investments purchased | $ 440,920 |
| Payable to affiliates: | |
| Investment adviser fee | 297,775 |
| Trustees' fees | 9,205 |
| Trustees' deferred compensation plan | 56,331 |
| Accrued expenses | 131,046 |
| Total liabilities | $ 935,277 |
| Net Assets applicable to investors' interest in Portfolio | $594,482,035 |
22
See Notes to Financial Statements.
Stock Portfolio
December 31, 2023
| | Year Ended |
| | December 31, 2023 |
| Investment Income | |
| Dividend income (net of foreign taxes withheld of $16,419) | $ 6,918,566 |
| Dividend income from affiliated investments | 135,448 |
| Total investment income | $ 7,054,014 |
| Expenses | |
| Investment adviser fee | $ 3,392,163 |
| Trustees’ fees and expenses | 25,823 |
| Custodian fee | 138,280 |
| Legal and accounting services | 71,158 |
| Miscellaneous | 35,550 |
| Total expenses | $ 3,662,974 |
| Deduct: | |
| Waiver and/or reimbursement of expenses by affiliates | $ 3,963 |
| Total expense reductions | $ 3,963 |
| Net expenses | $ 3,659,011 |
| Net investment income | $ 3,395,003 |
| Realized and Unrealized Gain (Loss) | |
| Net realized gain (loss): | |
| Investment transactions | $ 45,847,288 |
| Foreign currency transactions | (6,344) |
| Net realized gain | $ 45,840,944 |
| Change in unrealized appreciation (depreciation): | |
| Investments | $ 74,494,795 |
| Foreign currency | 7,523 |
| Net change in unrealized appreciation (depreciation) | $ 74,502,318 |
| Net realized and unrealized gain | $120,343,262 |
| Net increase in net assets from operations | $123,738,265 |
23
See Notes to Financial Statements.
Stock Portfolio
December 31, 2023
Statements of Changes in Net Assets
| | Year Ended December 31, |
| | 2023 | 2022 |
| Increase (Decrease) in Net Assets | | |
| From operations: | | |
| Net investment income | $ 3,395,003 | $ 5,289,328 |
| Net realized gain | 45,840,944 | 32,248,543 |
| Net change in unrealized appreciation (depreciation) | 74,502,318 | (166,975,429) |
| Net increase (decrease) in net assets from operations | $123,738,265 | $(129,437,558) |
| Capital transactions: | | |
| Contributions | $ 11,099,572 | $ 5,305,309 |
| Withdrawals | (90,392,247) | (198,020,738) |
| Portfolio transaction fee | — | 879,886 |
| Net decrease in net assets from capital transactions | $ (79,292,675) | $(191,835,543) |
| Net increase (decrease) in net assets | $ 44,445,590 | $(321,273,101) |
| Net Assets | | |
| At beginning of year | $ 550,036,445 | $ 871,309,546 |
| At end of year | $594,482,035 | $ 550,036,445 |
24
See Notes to Financial Statements.
Stock Portfolio
December 31, 2023
| | Year Ended December 31, |
| Ratios/Supplemental Data | 2023 | 2022 | 2021 | 2020 | 2019 |
| Ratios (as a percentage of average daily net assets): | | | | | |
| Expenses | 0.64% (1) | 0.64% (1) | 0.63% | 0.64% | 0.63% |
| Net investment income | 0.60% | 0.82% | 0.55% | 0.84% | 0.99% |
| Portfolio Turnover | 44% | 52% | 44% | 70% | 55% |
| Total Return | 24.43% | (16.49)% | 23.21% | 18.61% | 35.47% |
| Net assets, end of year (000’s omitted) | $594,482 | $550,036 | $871,310 | $804,446 | $683,548 |
| (1) | Includes a reduction by the investment adviser of a portion of its adviser fee due to the Portfolio’s investment in the Liquidity Fund (equal to less than 0.005% of average daily net assets for the years ended December 31, 2023 and 2022). |
25
See Notes to Financial Statements.
Stock Portfolio
December 31, 2023
Notes to Financial Statements
1 Significant Accounting Policies
Stock Portfolio (the Portfolio) is a Massachusetts business trust registered under the Investment Company Act of 1940, as amended (the 1940 Act), as a diversified, open-end management investment company. The Portfolio's investment objective is to achieve long-term capital appreciation by investing in a diversified portfolio of equity securities. The Declaration of Trust permits the Trustees to issue interests in the Portfolio. At December 31, 2023, Eaton Vance Stock Fund and Eaton Vance Balanced Fund held an interest of 13.4% and 86.6%, respectively, in the Portfolio.
The following is a summary of significant accounting policies of the Portfolio. The policies are in conformity with accounting principles generally accepted in the United States of America (U.S. GAAP). The Portfolio is an investment company and follows accounting and reporting guidance in the Financial Accounting Standards Board (FASB) Accounting Standards Codification Topic 946.
A Investment Valuation—The following methodologies are used to determine the market value or fair value of investments.
Equity Securities. Equity securities listed on a U.S. securities exchange generally are valued at the last sale or closing price on the day of valuation or, if no sales took place on such date, at the mean between the closing bid and ask prices on the exchange where such securities are principally traded. Equity securities listed on the NASDAQ National Market System are valued at the NASDAQ official closing price. Unlisted or listed securities for which closing sales prices or closing quotations are not available are valued at the mean between the latest available bid and ask prices.
Foreign Currencies. Foreign currencies are valued in U.S. dollars, based on foreign currency exchange rate quotations supplied by a third party pricing service. The pricing service uses a proprietary model to determine the exchange rate. Inputs to the model include reported trades and implied bid/ask spreads.
Other. Investments in management investment companies (including money market funds) that do not trade on an exchange are valued at the net asset value as of the close of each business day.
Fair Valuation. In connection with Rule 2a-5 of the 1940 Act, the Trustees have designated the Portfolio’s investment adviser as its valuation designee. Investments for which valuations or market quotations are not readily available or are deemed unreliable are valued by the investment adviser, as valuation designee, at fair value using methods that most fairly reflect the security’s “fair value”, which is the amount that the Portfolio might reasonably expect to receive for the security upon its current sale in the ordinary course. Each such determination is based on a consideration of relevant factors, which are likely to vary from one pricing context to another. These factors may include, but are not limited to, the type of security, the existence of any contractual restrictions on the security’s disposition, the price and extent of public trading in similar securities of the issuer or of comparable companies or entities, quotations or relevant information obtained from broker/dealers or other market participants, information obtained from the issuer, analysts, and/or the appropriate stock exchange (for exchange-traded securities), an analysis of the company’s or entity’s financial statements, and an evaluation of the forces that influence the issuer and the market(s) in which the security is purchased and sold.
B Investment Transactions—Investment transactions for financial statement purposes are accounted for on a trade date basis. Realized gains and losses on investments sold are determined on the basis of identified cost.
C Income—Dividend income is recorded on the ex-dividend date for dividends received in cash and/or securities. However, if the ex-dividend date has passed, certain dividends from foreign securities are recorded as the Portfolio is informed of the ex-dividend date. Withholding taxes on foreign dividends and capital gains have been provided for in accordance with the Portfolio’s understanding of the applicable countries’ tax rules and rates.
D Federal Taxes—The Portfolio has elected to be treated as a partnership for federal tax purposes. No provision is made by the Portfolio for federal or state taxes on any taxable income of the Portfolio because each investor in the Portfolio is ultimately responsible for the payment of any taxes on its share of taxable income. Since at least one of the Portfolio's investors is a regulated investment company that invests all or substantially all of its assets in the Portfolio, the Portfolio normally must satisfy the applicable source of income and diversification requirements (under the Internal Revenue Code) in order for its investors to satisfy them. The Portfolio will allocate, at least annually among its investors, each investor's distributive share of the Portfolio's net investment income, net realized capital gains and losses and any other items of income, gain, loss, deduction or credit.
As of December 31, 2023, the Portfolio had no uncertain tax positions that would require financial statement recognition, de-recognition, or disclosure. The Portfolio files a U.S. federal income tax return annually after its fiscal year-end, which is subject to examination by the Internal Revenue Service for a period of three years from the date of filing.
E Foreign Currency Translation—Other assets and liabilities initially expressed in foreign currencies are translated each business day into U.S. dollars based upon current exchange rates. Income and expenses denominated in foreign currencies are translated into U.S. dollars based upon currency exchange rates in effect on the respective dates of such transactions.
F Use of Estimates—The preparation of the financial statements in conformity with U.S. GAAP requires management to make estimates and assumptions that affect the reported amounts of assets and liabilities at the date of the financial statements and the reported amounts of income and expense during the reporting period. Actual results could differ from those estimates.
Stock Portfolio
December 31, 2023
Notes to Financial Statements — continued
G Indemnifications—Under the Portfolio’s organizational documents, its officers and Trustees may be indemnified against certain liabilities and expenses arising out of the performance of their duties to the Portfolio. Under Massachusetts law, if certain conditions prevail, interestholders in the Portfolio could be deemed to have personal liability for the obligations of the Portfolio. However, the Portfolio’s Declaration of Trust contains an express disclaimer of liability on the part of Portfolio interestholders. Additionally, in the normal course of business, the Portfolio enters into agreements with service providers that may contain indemnification clauses. The Portfolio’s maximum exposure under these arrangements is unknown as this would involve future claims that may be made against the Portfolio that have not yet occurred.
H Capital Transactions—To seek to protect the Portfolio (and, indirectly, other investors in the Portfolio) against the costs of accommodating investor inflows and outflows, prior to December 24, 2022, the Portfolio imposed a fee (“Portfolio transaction fee”) on inflows and outflows by Portfolio investors. The Portfolio transaction fee was sized to cover the estimated cost to the Portfolio of, in connection with issuing interests, converting the cash and/or other instruments it received to the desired composition and, in connection with redeeming its interests, converting Portfolio holdings to cash and/or other instruments to be distributed. Such fee, which may have varied over time, was limited to amounts that had been authorized by the Board of Trustees and determined by Eaton Vance Management (EVM) to be appropriate. The maximum Portfolio transaction fee was 2% of the amount of net contributions or withdrawals. The Portfolio transaction fee was recorded as a component of capital transactions on the Statements of Changes in Net Assets. Effective after the close of business on December 23, 2022, the Portfolio transaction fee was discontinued.
2 Investment Adviser Fee and Other Transactions with Affiliates
The investment adviser fee is earned by Boston Management and Research (BMR), an indirect, wholly-owned subsidiary of Morgan Stanley, as compensation for investment advisory services rendered to the Portfolio. The fee is computed at an annual rate as a percentage of the Portfolio’s average daily net assets as follows and is payable monthly:
| Average Daily Net Assets | Annual Fee Rate |
| Up to $500 million | 0.600% |
| $500 million but less than $1 billion | 0.575% |
| $1 billion but less than $2.5 billion | 0.550% |
| $2.5 billion but less than $5 billion | 0.530% |
| $5 billion and over | 0.515% |
For the year ended December 31, 2023, the Portfolio's investment adviser fee amounted to $3,392,163 or 0.60% of the Portfolio’s average daily net assets.
The Portfolio may invest in a money market fund, the Institutional Class of the Morgan Stanley Institutional Liquidity Funds - Government Portfolio (the "Liquidity Fund"), an open-end management investment company managed by Morgan Stanley Investment Management Inc., a wholly-owned subsidiary of Morgan Stanley. The investment adviser fee paid by the Portfolio is reduced by an amount equal to its pro rata share of the advisory and administration fees paid by the Portfolio due to its investment in the Liquidity Fund. For the year ended December 31, 2023, the investment adviser fee paid was reduced by $3,963 relating to the Portfolio's investment in the Liquidity Fund.
Trustees and officers of the Portfolio who are members of BMR’s organization receive remuneration for their services to the Portfolio out of the investment adviser fee. Trustees of the Portfolio who are not affiliated with the investment adviser may elect to defer receipt of all or a percentage of their annual fees in accordance with the terms of the Trustees Deferred Compensation Plan. Certain officers and Trustees of the Portfolio are officers of the above organization.
3 Purchases and Sales of Investments
Purchases and sales of investments, other than short-term obligations, aggregated $247,069,992 and $323,019,446, respectively, for the year ended December 31, 2023.
Stock Portfolio
December 31, 2023
Notes to Financial Statements — continued
4 Federal Income Tax Basis of Investments
The cost and unrealized appreciation (depreciation) of investments of the Portfolio at December 31, 2023, as determined on a federal income tax basis, were as follows:
| Aggregate cost | $370,127,195 |
| Gross unrealized appreciation | $ 225,968,999 |
| Gross unrealized depreciation | (1,144,603) |
| Net unrealized appreciation | $224,824,396 |
5 Line of Credit
The Portfolio participates with other portfolios and funds managed by BMR and its affiliates in a $650 million unsecured revolving line of credit agreement with a group of banks, which is in effect through October 22, 2024. In connection with the renewal of the agreement on October 24, 2023, the borrowing limit was decreased from $725 million. Borrowings are made by the Portfolio solely for temporary purposes related to redemptions and other short-term cash needs. Interest is charged to the Portfolio based on its borrowings at an amount above either the Secured Overnight Financing Rate (SOFR) or Federal Funds rate. In addition, a fee computed at an annual rate of 0.15% on the daily unused portion of the line of credit is allocated among the participating portfolios and funds at the end of each quarter. In connection with the renewal of the agreement in October 2023, an arrangement fee totaling $150,000 was incurred that was allocated to the participating portfolios and funds. Because the line of credit is not available exclusively to the Portfolio, it may be unable to borrow some or all of its requested amounts at any particular time. The Portfolio did not have any significant borrowings or allocated fees during the year ended December 31, 2023.
6 Affiliated Investments
At December 31, 2023, the value of the Portfolio's investment in funds that may be deemed to be affiliated was $2,428,547, which represents 0.4% of the Portfolio's net assets. Transactions in such investments by the Portfolio for the year ended December 31, 2023 were as follows:
| Name | Value,
beginning
of period | Purchases | Sales
proceeds | Net
realized
gain (loss) | Change in
unrealized
appreciation
(depreciation) | Value, end
of period | Dividend
income | Shares,
end of period |
| Short-Term Investments |
| Liquidity Fund | $4,125 | $90,266,983 | $(87,842,561) | $ — | $ — | $2,428,547 | $135,448 | 2,428,547 |
7 Fair Value Measurements
Under generally accepted accounting principles for fair value measurements, a three-tier hierarchy to prioritize the assumptions, referred to as inputs, is used in valuation techniques to measure fair value. The three-tier hierarchy of inputs is summarized in the three broad levels listed below.
| • | Level 1 – quoted prices in active markets for identical investments |
| • | Level 2 – other significant observable inputs (including quoted prices for similar investments, interest rates, prepayment speeds, credit risk, etc.) |
| • | Level 3 – significant unobservable inputs (including a fund's own assumptions in determining the fair value of investments) |
In cases where the inputs used to measure fair value fall in different levels of the fair value hierarchy, the level disclosed is determined based on the lowest level input that is significant to the fair value measurement in its entirety. The inputs or methodology used for valuing securities are not necessarily an indication of the risk associated with investing in those securities.
Stock Portfolio
December 31, 2023
Notes to Financial Statements — continued
At December 31, 2023, the hierarchy of inputs used in valuing the Portfolio's investments, which are carried at fair value, were as follows:
| Asset Description | Level 1 | Level 2 | Level 3 | Total |
| Common Stocks | $ 592,523,044* | $ — | $ — | $ 592,523,044 |
| Short-Term Investments | 2,428,547 | — | — | 2,428,547 |
| Total Investments | $ 594,951,591 | $ — | $ — | $594,951,591 |
| * | The level classification by major category of investments is the same as the category presentation in the Portfolio of Investments. |
Stock Portfolio
December 31, 2023
Report of Independent Registered Public Accounting Firm
To the Trustees and Investors of Stock Portfolio:
Opinion on the Financial Statements and Financial Highlights
We have audited the accompanying statement of assets and liabilities of Stock Portfolio (the “Portfolio”), including the portfolio of investments, as of December 31, 2023, the related statement of operations for the year then ended, the statements of changes in net assets for each of the two years in the period then ended, the financial highlights for each of the five years in the period then ended, and the related notes. In our opinion, the financial statements and financial highlights present fairly, in all material respects, the financial position of the Portfolio as of December 31, 2023, and the results of its operations for the year then ended, the changes in its net assets for each of the two years in the period then ended, and the financial highlights for each of the five years in the period then ended, in conformity with accounting principles generally accepted in the United States of America.
Basis for Opinion
These financial statements and financial highlights are the responsibility of the Portfolio's management. Our responsibility is to express an opinion on the Portfolio's financial statements and financial highlights based on our audits. We are a public accounting firm registered with the Public Company Accounting Oversight Board (United States) (PCAOB) and are required to be independent with respect to the Portfolio in accordance with the U.S. federal securities laws and the applicable rules and regulations of the Securities and Exchange Commission and the PCAOB.
We conducted our audits in accordance with the standards of the PCAOB. Those standards require that we plan and perform the audit to obtain reasonable assurance about whether the financial statements and financial highlights are free of material misstatement, whether due to error or fraud. The Portfolio is not required to have, nor were we engaged to perform, an audit of its internal control over financial reporting. As part of our audits, we are required to obtain an understanding of internal control over financial reporting but not for the purpose of expressing an opinion on the effectiveness of the Portfolio’s internal control over financial reporting. Accordingly, we express no such opinion.
Our audits included performing procedures to assess the risks of material misstatement of the financial statements and financial highlights, whether due to error or fraud, and performing procedures that respond to those risks. Such procedures included examining, on a test basis, evidence regarding the amounts and disclosures in the financial statements and financial highlights. Our audits also included evaluating the accounting principles used and significant estimates made by management, as well as evaluating the overall presentation of the financial statements and financial highlights. Our procedures included confirmation of securities owned as of December 31, 2023, by correspondence with the custodian and brokers; when replies were not received from brokers, we performed other auditing procedures. We believe that our audits provide a reasonable basis for our opinion.
/s/ Deloitte & Touche LLP
Boston, Massachusetts
February 23, 2024
We have served as the auditor of one or more Eaton Vance investment companies since 1959.
Eaton Vance
Stock Fund
December 31, 2023
Management and Organization
Fund Management. The Trustees of Eaton Vance Mutual Funds Trust (the Trust) and Stock Portfolio (the Portfolio) are responsible for the overall management and supervision of the Trust's and the Portfolio's affairs. The Board members and officers of the Trust and the Portfolio are listed below. Except as indicated, each individual has held the office shown or other offices in the same company for the last five years. Board members hold indefinite terms of office. Each Trustee holds office until his or her successor is elected and qualified, subject to a prior death, resignation, retirement, disqualification or removal. Under the terms of the Fund's and the Portfolio's current Trustee retirement policy, an Independent Trustee must retire and resign as a Trustee on the earlier of: (i) the first day of July following his or her 74th birthday; or (ii), with limited exception, December 31st of the 20th year in which he or she has served as a Trustee. However, if such retirement and resignation would cause the Fund and the Portfolio to be out of compliance with Section 16
of the 1940 Act or any other regulations or guidance of the SEC, then such retirement and resignation will not become effective until such time as action has been taken for the Fund and the Portfolio to be in compliance therewith. The “noninterested Trustees” consist of those Trustees who are not “interested persons” of the Trust and the Portfolio, as that term is defined under the 1940 Act. The business address of each Board member and officer is Two International Place, Boston, Massachusetts 02110. As used below, “BMR” refers to Boston Management and Research, “EV” refers to EV LLC, “EVM” refers to Eaton Vance Management, “MSIM" refers to Morgan Stanley Investment Management Inc. and “EVD” refers to Eaton Vance Distributors, Inc. EV is the trustee of each of EVM and BMR. Each of EVM, BMR, EVD and EV are indirect, wholly owned subsidiaries of Morgan Stanley. Each officer affiliated with EVM may hold a position with other EVM affiliates that is comparable to his or her position with EVM listed below. Each Trustee oversees 127 funds in the Eaton Vance fund complex (including both funds and portfolios in a hub and spoke structure).
| Name and Year of Birth | Trust/Portfolio
Position(s) | Length of Service | Principal Occupation(s) and Other Directorships
During Past Five Years and Other Relevant Experience |
| Interested Trustee |
Anchal Pachnanda(1)
1980 | Trustee | Since 2023 | Co-Head of Strategy of MSIM (since 2019). Formerly, Head of Strategy of MSIM (2017-2019). Ms. Pachnanda is an interested person because of her position with MSIM, which is an affiliate of the Trust.
Other Directorships. None. |
| Noninterested Trustees |
Alan C. Bowser
1962 | Trustee | Since 2022 | Private investor. Formerly, Chief Diversity Officer, Partner and a member of the Operating Committee, and formerly served as Senior Advisor on Diversity and Inclusion for the firm’s chief executive officer, Co-Head of the Americas Region, and Senior Client Advisor of Bridgewater Associates, an asset management firm (2011- 2023).
Other Directorships. Independent Director of Stout Risius Ross (a middle market professional services advisory firm) (since 2021). |
Mark R. Fetting
1954 | Trustee | Since 2016 | Private investor. Formerly held various positions at Legg Mason, Inc. (investment management firm) (2000-2012), including President, Chief Executive Officer, Director and Chairman (2008-2012), Senior Executive Vice President (2004-2008) and Executive Vice President (2001-2004). Formerly, President of Legg Mason family of funds (2001-2008). Formerly, Division President and Senior Officer of Prudential Financial Group, Inc. and related companies (investment management firm) (1991-2000).
Other Directorships. None. |
Cynthia E. Frost
1961 | Trustee | Since 2014 | Private investor. Formerly, Chief Investment Officer of Brown University (university endowment) (2000-2012). Formerly, Portfolio Strategist for Duke Management Company (university endowment manager) (1995-2000). Formerly, Managing Director, Cambridge Associates (investment consulting company) (1989-1995). Formerly, Consultant, Bain and Company (management consulting firm) (1987- 1989). Formerly, Senior Equity Analyst, BA Investment Management Company (1983-1985).
Other Directorships. None. |
George J. Gorman
1952 | Chairperson of the
Board and Trustee | Since 2021
(Chairperson) and 2014 (Trustee) | Principal at George J. Gorman LLC (consulting firm). Formerly, Senior Partner at Ernst & Young LLP (a registered public accounting firm) (1974-2009).
Other Directorships. None. |
Eaton Vance
Stock Fund
December 31, 2023
Management and Organization — continued
| Name and Year of Birth | Trust/Portfolio
Position(s) | Length of Service | Principal Occupation(s) and Other Directorships
During Past Five Years and Other Relevant Experience |
| Noninterested Trustees (continued) |
Valerie A. Mosley
1960 | Trustee | Since 2014 | Chairwoman and Chief Executive Officer of Valmo Ventures (a consulting and investment firm). Founder of Upward Wealth, Inc., dba BrightUp, a fintech platform. Formerly, Partner and Senior Vice President, Portfolio Manager and Investment Strategist at Wellington Management Company, LLP (investment management firm) (1992-2012). Formerly, Chief Investment Officer, PG Corbin Asset Management (1990-1992). Formerly worked in institutional corporate bond sales at Kidder Peabody (1986-1990).
Other Directorships. Director of DraftKings, Inc. (digital sports entertainment and gaming company) (since September 2020). Director of Envestnet, Inc. (provider of intelligent systems for wealth management and financial wellness) (since 2018). Formerly, Director of Dynex Capital, Inc. (mortgage REIT) (2013-2020) and Director of Groupon, Inc. (e-commerce provider) (2020-2022). |
Keith Quinton
1958 | Trustee | Since 2018 | Private investor, researcher and lecturer. Formerly, Independent Investment Committee Member at New Hampshire Retirement System (2017-2021). Formerly, Portfolio Manager and Senior Quantitative Analyst at Fidelity Investments (investment management firm) (2001-2014).
Other Directorships. Formerly, Director (2016-2021) and Chairman (2019-2021) of New Hampshire Municipal Bond Bank. |
Marcus L. Smith
1966 | Trustee | Since 2018 | Private investor and independent corporate director. Formerly, Chief Investment Officer, Canada (2012-2017), Chief Investment Officer, Asia (2010-2012), Director of Asian Research (2004-2010) and portfolio manager (2001-2017) at MFS Investment Management (investment management firm).
Other Directorships. Director of First Industrial Realty Trust, Inc. (an industrial REIT) (since 2021). Director of MSCI Inc. (global provider of investment decision support tools) (since 2017). Formerly, Director of DCT Industrial Trust Inc. (logistics real estate company) (2017-2018). |
Susan J. Sutherland
1957 | Trustee | Since 2015 | Private investor. Director of Ascot Group Limited and certain of its subsidiaries (insurance and reinsurance) (since 2017). Formerly, Director of Hagerty Holding Corp. (insurance) (2015-2018) and Montpelier Re Holdings Ltd. (insurance and reinsurance) (2013-2015). Formerly, Associate, Counsel and Partner at Skadden, Arps, Slate, Meagher & Flom LLP (law firm) (1982-2013).
Other Directorships. Formerly, Director of Kairos Acquisition Corp. (insurance/InsurTech acquisition company) (2021-2023). |
Scott E. Wennerholm
1959 | Trustee | Since 2016 | Private investor. Formerly, Trustee at Wheelock College (postsecondary institution) (2012-2018). Formerly, Consultant at GF Parish Group (executive recruiting firm) (2016-2017). Formerly, Chief Operating Officer and Executive Vice President at BNY Mellon Asset Management (investment management firm) (2005-2011). Formerly, Chief Operating Officer and Chief Financial Officer at Natixis Global Asset Management (investment management firm) (1997-2004). Formerly, Vice President at Fidelity Investments Institutional Services (investment management firm) (1994-1997).
Other Directorships. None. |
Nancy A. Wiser
1967 | Trustee | Since 2022 | Formerly, Executive Vice President and the Global Head of Operations at Wells Fargo Asset Management (2011-2021).
Other Directorships. None. |
| Name and Year of Birth | Trust/Portfolio
Position(s) | Length of Service | Principal Occupation(s)
During Past Five Years |
| Principal Officers who are not Trustees |
Kenneth A. Topping
1966 | President of the Trust | Since 2023 | Vice President and Chief Administrative Officer of EVM and BMR and Chief Operating Officer for Public Markets at MSIM. Also Vice President of Calvert Research and Management (“CRM”) since 2021. Formerly, Chief Operating Officer for Goldman Sachs Asset Management `Classic' (2009-2020). |
R. Kelly Williams, Jr.
1971 | President of the Portfolio | Since 2023 | President and Chief Operating Officer of Atlanta Capital Management Company, LLC. Officer of 21 registered investment companies managed by Eaton Vance or BMR. |
Deidre E. Walsh
1971 | Vice President and Chief Legal Officer | Since 2009 | Vice President of EVM and BMR. Also Vice President of CRM. |
Eaton Vance
Stock Fund
December 31, 2023
Management and Organization — continued
| Name and Year of Birth | Trust/Portfolio
Position(s) | Length of Service | Principal Occupation(s)
During Past Five Years |
| Principal Officers who are not Trustees (continued) |
James F. Kirchner
1967 | Treasurer | Since 2007 | Vice President of EVM and BMR. Also Vice President of CRM. |
Nicholas S. Di Lorenzo
1987 | Secretary | Since 2022 | Formerly, associate (2012-2021) and counsel (2022) at Dechert LLP. |
Laura T. Donovan
1976 | Chief Compliance
Officer | Since 2024 | Vice President of EVM and BMR. |
(1) Ms. Pachnanda began serving as Trustee effective April 1, 2023.
The SAI for the Fund includes additional information about the Trustees and officers of the Fund and the Portfolio and can be obtained without charge on Eaton Vance’s website at www.eatonvance.com or by calling 1-800-262-1122.
| FACTS | WHAT DOES EATON VANCE DO WITH YOUR
PERSONAL INFORMATION? |
| Why? | Financial companies choose how they share your personal information. Federal law gives consumers the right to limit some but not all sharing. Federal law also requires us to tell you how we collect, share, and protect your personal information. Please read this notice carefully to understand what we do. |
| |
| What? | The types of personal information we collect and share depend on the product or service you have with us. This information can include:■ Social Security number and income
■ investment experience and risk tolerance
■ checking account number and wire transfer instructions |
| |
| How? | All financial companies need to share customers’ personal information to run their everyday business. In the section below, we list the reasons financial companies can share their customers’ personal information; the reasons Eaton Vance chooses to share; and whether you can limit this sharing. |
Reasons we can share your
personal information | Does Eaton Vance
share? | Can you limit
this sharing? |
| For our everyday business purposes — such as to process your transactions, maintain your account(s), respond to court orders and legal investigations, or report to credit bureaus | Yes | No |
| For our marketing purposes — to offer our products and services to you | Yes | No |
| For joint marketing with other financial companies | No | We don’t share |
| For our investment management affiliates’ everyday business purposes — information about your transactions, experiences, and creditworthiness | Yes | Yes |
| For our affiliates’ everyday business purposes — information about your transactions and experiences | Yes | No |
| For our affiliates’ everyday business purposes — information about your creditworthiness | No | We don’t share |
| For our investment management affiliates to market to you | Yes | Yes |
| For our affiliates to market to you | No | We don’t share |
| For nonaffiliates to market to you | No | We don’t share |
To limit our
sharing | Call toll-free 1-800-262-1122 or email: EVPrivacy@eatonvance.comPlease note:If you are a new customer, we can begin sharing your information 30 days from the date we sent this notice. When you are no longer our customer, we continue to share your information as described in this notice. However, you can contact us at any time to limit our sharing. |
| Questions? | Call toll-free 1-800-262-1122 or email: EVPrivacy@eatonvance.com |
| Privacy Notice — continued | April 2021 |
| Who we are |
| Who is providing this notice? | Eaton Vance Management, Eaton Vance Distributors, Inc., Eaton Vance Trust Company, Eaton Vance Management (International) Limited, Eaton Vance Advisers International Ltd., Eaton Vance Global Advisors Limited, Eaton Vance Management’s Real Estate Investment Group, Boston Management and Research, Calvert Research and Management, Eaton Vance and Calvert Fund Families and our investment advisory affiliates (“Eaton Vance”) (see Investment Management Affiliates definition below) |
| What we do |
How does Eaton Vance
protect my personal
information? | To protect your personal information from unauthorized access and use, we use security measures that comply with federal law. These measures include computer safeguards and secured files and buildings. We have policies governing the proper handling of customer information by personnel and requiring third parties that provide support to adhere to appropriate security standards with respect to such information. |
How does Eaton Vance
collect my personal
information? | We collect your personal information, for example, when you■ open an account or make deposits or withdrawals from your account
■ buy securities from us or make a wire transfer
■ give us your contact informationWe also collect your personal information from others, such as credit bureaus, affiliates, or other companies. |
| Why can’t I limit all sharing? | Federal law gives you the right to limit only■ sharing for affiliates’ everyday business purposes — information about your creditworthiness
■ affiliates from using your information to market to you
■ sharing for nonaffiliates to market to youState laws and individual companies may give you additional rights to limit sharing. See below for more on your rights under state law. |
| Definitions |
Investment Management
Affiliates | Eaton Vance Investment Management Affiliates include registered investment advisers, registered broker- dealers, and registered and unregistered funds. Investment Management Affiliates does not include entities associated with Morgan Stanley Wealth Management, such as Morgan Stanley Smith Barney LLC and Morgan Stanley & Co. |
| Affiliates | Companies related by common ownership or control. They can be financial and nonfinancial companies.■ Our affiliates include companies with a Morgan Stanley name and financial companies such as Morgan Stanley Smith Barney LLC and Morgan Stanley & Co. |
| Nonaffiliates | Companies not related by common ownership or control. They can be financial and nonfinancial companies.■ Eaton Vance does not share with nonaffiliates so they can market to you. |
| Joint marketing | A formal agreement between nonaffiliated financial companies that together market financial products or services to you.■ Eaton Vance doesn’t jointly market. |
| Other important information |
| Vermont: Except as permitted by law, we will not share personal information we collect about Vermont residents with Nonaffiliates unless you provide us with your written consent to share such information.California: Except as permitted by law, we will not share personal information we collect about California residents with Nonaffiliates and we will limit sharing such personal information with our Affiliates to comply with California privacy laws that apply to us. |
Delivery of Shareholder Documents. The Securities and Exchange Commission (SEC) permits funds to deliver only one copy of shareholder documents, including prospectuses, proxy statements and shareholder reports, to fund investors with multiple accounts at the same residential or post office box address. This practice is often called “householding” and it helps eliminate duplicate mailings to shareholders. Eaton Vance, or your financial intermediary, may household the mailing of your documents indefinitely unless you instruct Eaton Vance, or your financial intermediary, otherwise. If you would prefer that your Eaton Vance documents not be householded, please contact Eaton Vance at 1-800-262-1122, or contact your financial intermediary. Your instructions that householding not apply to delivery of your Eaton Vance documents will typically be effective within 30 days of receipt by Eaton Vance or your financial intermediary.
Portfolio Holdings. Each Eaton Vance Fund and its underlying Portfolio(s) (if applicable) files a schedule of portfolio holdings on Part F to Form N-PORT with the SEC. Certain information filed on Form N-PORT may be viewed on the Eaton Vance website at www.eatonvance.com, by calling Eaton Vance at 1-800-262-1122 or in the EDGAR database on the SEC’s website at www.sec.gov.
Proxy Voting. From time to time, funds are required to vote proxies related to the securities held by the funds. The Eaton Vance Funds or their underlying Portfolios (if applicable) vote proxies according to a set of policies and procedures approved by the Funds’ and Portfolios’ Boards. You may obtain a description of these policies and procedures and information on how the Funds or Portfolios voted proxies relating to portfolio securities during the most recent 12-month period ended June 30, without charge, upon request, by calling 1-800-262-1122 and by accessing the SEC’s website at www.sec.gov.
Tailored Shareholder Reports. Effective January 24, 2023, the SEC adopted rule and form amendments to require open-end mutual funds and ETFs to transmit concise and visually engaging streamlined annual and semiannual reports to shareholders that highlight key information. Other information, including financial statements, will no longer appear in a streamlined shareholder report but must be available online, delivered free of charge upon request, and filed on a semiannual basis on Form N-CSR. The rule and form amendments have a compliance date of July 24, 2024. At this time, management is evaluating the impact of these amendments on the shareholder reports for the Eaton Vance Funds.
Investment Adviser of Stock Portfolio
Boston Management and Research
Two International Place
Boston, MA 02110
Investment Adviser and Administrator of Eaton Vance
Stock Fund
Eaton Vance Management
Two International Place
Boston, MA 02110
Principal Underwriter*
Eaton Vance Distributors, Inc.
Two International Place
Boston, MA 02110
(617) 482-8260
Custodian
State Street Bank and Trust Company
One Congress Street, Suite 1
Boston, MA 02114-2016
Transfer Agent
BNY Mellon Investment Servicing (US) Inc.
Attn: Eaton Vance Funds
P.O. Box 534439
Pittsburgh, PA 15253-4439
(800) 262-1122
Independent Registered Public Accounting Firm
Deloitte & Touche LLP
200 Berkeley Street
Boston, MA 02116-5022
Fund Offices
Two International Place
Boston, MA 02110
* FINRA BrokerCheck. Investors may check the background of their Investment Professional by contacting the Financial Industry Regulatory Authority (FINRA). FINRA BrokerCheck is a free tool to help investors check the professional background of current and former FINRA-registered securities firms and brokers. FINRA BrokerCheck is available by calling 1-800-289-9999 and at www.FINRA.org. The FINRA BrokerCheck brochure describing this program is available to investors at www.FINRA.org.
Eaton Vance
Tax-Managed Growth Funds 1.1 and 1.2
Annual Report
December 31, 2023
Commodity Futures Trading Commission Registration. The Commodity Futures Trading Commission (“CFTC”) has adopted regulations that subject registered investment companies and advisers to regulation by the CFTC if a fund invests more than a prescribed level of its assets in certain CFTC-regulated instruments (including futures, certain options and swap agreements) or markets itself as providing investment exposure to such instruments. The investment adviser has claimed an exclusion from the definition of “commodity pool operator” under the Commodity Exchange Act with respect to its management of each Fund. Accordingly, neither the Funds nor the adviser with respect to the operation of the Funds is subject to CFTC regulation. Because of its management of other strategies, the Funds' adviser is registered with the CFTC as a commodity pool operator. The adviser is also registered as a commodity trading advisor.
Fund shares are not insured by the FDIC and are not deposits or other obligations of, or guaranteed by, any depository institution. Shares are subject to investment risks, including possible loss of principal invested.
This report must be preceded or accompanied by a current summary prospectus or prospectus. Before investing, investors should consider carefully the investment objective, risks, and charges and expenses of a mutual fund. This and other important information is contained in the summary prospectus and prospectus, which can be obtained from a financial intermediary. Prospective investors should read the prospectus carefully before investing. For further information, please call 1-800-262-1122.
Annual Report December 31, 2023
Eaton Vance
Tax-Managed Growth Funds 1.1 and 1.2
Eaton Vance
Tax-Managed Growth Funds 1.1 and 1.2
December 31, 2023
Management’s Discussion of Fund Performance†
Economic and Market Conditions
For U.S. equity investors, the 12-month period ended December 31, 2023, was a roller-coaster ride, driven largely by shifting perceptions of whether the U.S. Federal Reserve (the Fed) could bring the world’s largest economy in for a soft landing, and changing expectations of how long interest rates might remain high.
As the period opened in January 2023, U.S. equities began a rally that lasted through July. The initial tailwind was ChatGPT, an artificial intelligence (AI) application that led investors to perceive AI might become the next big innovation to drive the information technology (IT) sector. As a result, IT -- one of the worst-performing sectors in 2022 -- became a standout sector in 2023. Earlier recession fears that had weighed on stock prices receded as more investors came to view the U.S. economy as doing surprisingly well.
But from August through October 2023, the bond market halted the stock market’s momentum. As investors feared the Fed might keep rates higher for longer than they had anticipated just a few months earlier, longer-term bond interest rates rose sharply. Given the potential for relatively attractive returns with lower risk than stocks, many investors shifted asset allocations from equities to bonds.
In the final two months of the period, however, U.S. equities made another U-turn, as investors again revised their expectations of what the Fed might do. Encouraged by cooling economic data and declining inflation, investors began to conclude the Fed was done raising interest rates -- and might begin lowering rates as early as March 2024.
In response, the U.S. stock market ended the period on a high note, with the S&P 500® Index, a broad measure of U.S. stocks; the blue-chip Dow Jones Industrial Average; and the technology-laden Nasdaq Composite Index each rising more than 9% in November and more than 4% in December 2023. Unlike the equity rally during the first half of the period driven by a handful of large-cap technology-related stocks, the year-end rally extended across a wider range of market capitalizations, with the small-cap Russell 2000® Index keeping pace with its large-cap brethren in November, and significantly outperforming them in December.
For the period as a whole, U.S. equity performance was also strong. The S&P 500® Index returned 26.29%, the Dow Jones Industrial Average® returned 16.18%, the Nasdaq Composite Index returned 44.64%, and the Russell 2000® Index returned 16.93%.
Fund Performance
For the 12-month period ended December 31, 2023, Eaton Vance Tax-Managed Growth Fund 1.1 and Eaton Vance Tax-Managed Growth Fund 1.2 (collectively, the Funds) returned 28.24% and 28.05%, respectively, for Class A shares at net asset value (NAV), outperforming their benchmark, the S&P 500® Index (the Index), which returned 26.29%.
On an individual stock basis, the largest contributors to the Funds’ performance versus the Index during the period were overweight positions in Meta Platforms, Inc. (Meta), Palo Alto Networks, Inc. (Palo Alto), and Eli Lilly & Co. (Eli Lilly).
The share price of Meta -- the social media giant behind Facebook, Instagram, and Messenger -- nearly tripled during the period, as advertising revenues rebounded on improved ad targeting, while profit margins exceeded expectations due to more rational spending on longer-term initiatives.
Palo Alto, a provider of cybersecurity technologies, was added to the S&P 500 in June 2023. Palo Alto’s stock price more than doubled during the period as businesses increasingly deployed protective technologies to guard against ransomware and other cyber risks. A new Securities and Exchange Commission rule requiring firms to disclose cybersecurity incidents was an additional driver of Palo Alto’s business.
Eli Lilly is a global drugmaker specializing in diabetes, oncology, and immunology therapies. Eli Lilly’s share price appreciated during the period, with its best performance occurring in August 2023 after the company reported strong second-quarter earnings, boosted by sales of its diabetes drug, Mounjaro. An additional tailwind for Eli Lilly’s stock price was the U.S. Food and Drug Administration’s approval in November 2023 of Zepbound™, the company’s new treatment for obesity and overweight conditions with weight-related medical issues.
On a sector basis, contributors to the Funds’ performance versus the Index during the period included stock selections and an overweight position in the communication services sector; stock selections in the health care sector; and an underweight position in the utilities sector -- the worst-performing sector within the Index during the period.
In contrast, the largest individual stock detractors from the Funds’ performance relative to the Index were underweight positions in Tesla, Inc. (Tesla) and Microsoft Corp. (Microsoft).
See Endnotes and Additional Disclosures in this report.
Past performance is no guarantee of future results. Returns are historical and are calculated by determining the percentage change in net asset value (NAV) or offering price (as applicable) with all distributions reinvested. Furthermore, returns do not reflect the deduction of taxes that shareholders may have to pay on Fund distributions or upon the redemption of Fund shares. Investment return and principal value will fluctuate so that shares, when redeemed, may be worth more or less than their original cost. Performance for periods less than or equal to one year is cumulative. Performance is for the stated time period only; due to market volatility, current Fund performance may be lower or higher than the quoted return. For performance as of the most recent month-end, please refer to eatonvance.com.
Eaton Vance
Tax-Managed Growth Funds 1.1 and 1.2
December 31, 2023
Management’s Discussion of Fund Performance† — continued
To stimulate sales, electric vehicle maker Tesla announced price cuts during the period that weighed on profit margins and led the company to lower its earnings projections. Despite that negative news, Tesla’s stock price doubled during the period, as investors still viewed the company as a leader in long-term growth opportunities involving electric cars and autonomous driving.
Microsoft’s stock price rose during the period on investor enthusiasm over its collaboration with OpenAI -- the company behind the popular artificial intelligence (AI) application ChatGPT -- and progress in incorporating AI into Microsoft software and services.
On a sector basis, stock selections in the consumer discretionary sector, stock selections and an overweight position in the industrials sector, and an overweight position in the consumer staples sector detracted from the Funds’ performance versus the Index during the period.
See Endnotes and Additional Disclosures in this report.
Past performance is no guarantee of future results. Returns are historical and are calculated by determining the percentage change in net asset value (NAV) or offering price (as applicable) with all distributions reinvested. Furthermore, returns do not reflect the deduction of taxes that shareholders may have to pay on Fund distributions or upon the redemption of Fund shares. Investment return and principal value will fluctuate so that shares, when redeemed, may be worth more or less than their original cost. Performance for periods less than or equal to one year is cumulative. Performance is for the stated time period only; due to market volatility, current Fund performance may be lower or higher than the quoted return. For performance as of the most recent month-end, please refer to eatonvance.com.
Eaton Vance
Tax-Managed Growth Fund 1.1
December 31, 2023
Performance
Portfolio Manager(s) Yana S. Barton, CFA and Kenneth D. Zinner, CFA
| % Average Annual Total Returns1,2 | Class
Inception Date | Performance
Inception Date | One Year | Five Years | Ten Years |
| Class A at NAV | 03/28/1996 | 03/29/1966 | 28.24% | 15.26% | 11.37% |
| Class A with 5.25% Maximum Sales Charge | — | — | 21.50 | 14.02 | 10.77 |
| Class C at NAV | 08/02/1996 | 03/29/1966 | 27.28 | 14.37 | 10.70 |
| Class C with 1% Maximum Deferred Sales Charge | — | — | 26.28 | 14.37 | 10.70 |
| Class I at NAV | 07/02/1999 | 03/29/1966 | 28.56 | 15.53 | 11.65 |
|
| S&P 500® Index | — | — | 26.29% | 16.13% | 12.03% |
| % After-Tax Returns with Maximum Sales Charge | Class
Inception Date | Performance
Inception Date | One Year | Five Years | Ten Years |
| Class A After Taxes on Distributions | 03/28/1996 | 03/29/1966 | 28.07% | 15.11% | 11.18% |
| Class A After Taxes on Distributions and Sale of Fund Shares | — | — | 16.84 | 12.32 | 9.42 |
| Class C After Taxes on Distributions | 08/02/1996 | 03/29/1966 | 27.28 | 14.37 | 10.63 |
| Class C After Taxes on Distributions and Sale of Fund Shares | — | — | 16.15 | 11.57 | 8.87 |
| Class I After Taxes on Distributions | 07/02/1999 | 03/29/1966 | 28.30 | 15.31 | 11.37 |
| Class I After Taxes on Distributions and Sale of Fund Shares | — | — | 17.10 | 12.55 | 9.64 |
| % Total Annual Operating Expense Ratios3 | Class A | Class C | Class I |
| | 0.74% | 1.49% | 0.49% |
Growth of $10,000
This graph shows the change in value of a hypothetical investment of $10,000 in Class A of the Fund for the period indicated. For comparison, the same investment is shown in the indicated index.
| Growth of Investment | Amount Invested | Period Beginning | At NAV | With Maximum Sales Charge |
| Class C | $10,000 | 12/31/2023 | $27,659 | N.A. |
| Class I, at minimum investment | $1,000,000 | 12/31/2023 | $3,010,880 | N.A. |
See Endnotes and Additional Disclosures in this report.
Past performance is no guarantee of future results. Returns are historical and are calculated by determining the percentage change in net asset value (NAV) or offering price (as applicable) with all distributions reinvested. Furthermore, returns do not reflect the deduction of taxes that shareholders may have to pay on Fund distributions or upon the redemption of Fund shares. Investment return and principal value will fluctuate so that shares, when redeemed, may be worth more or less than their original cost. Performance for periods less than or equal to one year is cumulative. Performance is for the stated time period only; due to market volatility, current Fund performance may be lower or higher than the quoted return. For performance as of the most recent month-end, please refer to eatonvance.com.
Eaton Vance
Tax-Managed Growth Fund 1.2
December 31, 2023
Performance
Portfolio Manager(s) Yana S. Barton, CFA and Kenneth D. Zinner, CFA
| % Average Annual Total Returns1,2 | Class
Inception Date | Performance
Inception Date | One Year | Five Years | Ten Years |
| Class A at NAV | 02/28/2001 | 03/29/1966 | 28.05% | 15.08% | 11.20% |
| Class A with 5.25% Maximum Sales Charge | — | — | 21.32 | 13.85 | 10.60 |
| Class C at NAV | 02/28/2001 | 03/29/1966 | 27.11 | 14.21 | 10.54 |
| Class C with 1% Maximum Deferred Sales Charge | — | — | 26.11 | 14.21 | 10.54 |
| Class I at NAV | 02/28/2001 | 03/29/1966 | 28.37 | 15.37 | 11.48 |
|
| S&P 500® Index | — | — | 26.29% | 15.68% | 12.03% |
| % After-Tax Returns with Maximum Sales Charge | Class
Inception Date | Performance
Inception Date | One Year | Five Years | Ten Years |
| Class A After Taxes on Distributions | 02/28/2001 | 03/29/1966 | 27.92% | 14.98% | 11.04% |
| Class A After Taxes on Distributions and Sale of Fund Shares | — | — | 16.70 | 12.17 | 9.28 |
| Class C After Taxes on Distributions | 02/28/2001 | 03/29/1966 | 27.11 | 14.21 | 10.50 |
| Class C After Taxes on Distributions and Sale of Fund Shares | — | — | 16.05 | 11.44 | 8.74 |
| Class I After Taxes on Distributions | 02/28/2001 | 03/29/1966 | 28.16 | 15.21 | 11.26 |
| Class I After Taxes on Distributions and Sale of Fund Shares | — | — | 16.94 | 12.41 | 9.51 |
| % Total Annual Operating Expense Ratios3 | Class A | Class C | Class I |
| | 0.89% | 1.65% | 0.64% |
Growth of $10,000
This graph shows the change in value of a hypothetical investment of $10,000 in Class A of the Fund for the period indicated. For comparison, the same investment is shown in the indicated index.
| Growth of Investment | Amount Invested | Period Beginning | At NAV | With Maximum Sales Charge |
| Class C | $10,000 | 12/31/2023 | $27,249 | N.A. |
| Class I, at minimum investment | $1,000,000 | 12/31/2023 | $2,966,426 | N.A. |
See Endnotes and Additional Disclosures in this report.
Past performance is no guarantee of future results. Returns are historical and are calculated by determining the percentage change in net asset value (NAV) or offering price (as applicable) with all distributions reinvested. Furthermore, returns do not reflect the deduction of taxes that shareholders may have to pay on Fund distributions or upon the redemption of Fund shares. Investment return and principal value will fluctuate so that shares, when redeemed, may be worth more or less than their original cost. Performance for periods less than or equal to one year is cumulative. Performance is for the stated time period only; due to market volatility, current Fund performance may be lower or higher than the quoted return. For performance as of the most recent month-end, please refer to eatonvance.com.
Eaton Vance
Tax-Managed Growth Funds 1.1 and 1.2
December 31, 2023
| Sector Allocation (% of net assets)1 |
| Top 10 Holdings (% of net assets)1 |
| Apple, Inc. | 7.6% |
| Microsoft Corp. | 6.8 |
| Amazon.com, Inc. | 4.2 |
| NVIDIA Corp. | 3.0 |
| Meta Platforms, Inc., Class A | 2.7 |
| Alphabet, Inc., Class C | 2.7 |
| Alphabet, Inc., Class A | 2.4 |
| JPMorgan Chase & Co. | 1.7 |
| Eli Lilly & Co. | 1.7 |
| Berkshire Hathaway, Inc., Class B | 1.6 |
| Total | 34.4% |
Fund invests in an affiliated investment company (Portfolio) with the same objective(s) and policies as the Fund. References to investments are to the Portfolio’s holdings.
Footnotes:
| 1 | Excludes cash and cash equivalents. |
Eaton Vance
Tax-Managed Growth Funds 1.1 and 1.2
December 31, 2023
Endnotes and Additional Disclosures
| † | The views expressed in this report are those of the Fund’s investment adviser and are subject to change at any time based upon market or other conditions, and Eaton Vance and the Fund(s) disclaim any responsibility to update such views. These views may not be relied upon as investment advice and, because investment decisions are based on many factors, may not be relied upon as an indication of trading intent on behalf of any Eaton Vance fund. This commentary may contain statements that are not historical facts, referred to as “forward-looking statements.” The Fund’s actual future results may differ significantly from those stated in any forward-looking statement, depending on factors such as changes in securities or financial markets or general economic conditions, the volume of sales and purchases of Fund shares, the continuation of investment advisory, administrative and service contracts, and other risks discussed from time to time in the Fund’s filings with the Securities and Exchange Commission. |
| | |
| 1 | S&P 500® Index is an unmanaged index of large-cap stocks commonly used as a measure of U.S. stock market performance. S&P Dow Jones Indices are a product of S&P Dow Jones Indices LLC (“S&P DJI”) and have been licensed for use. S&P® and S&P 500® are registered trademarks of S&P DJI; Dow Jones® is a registered trademark of Dow Jones Trademark Holdings LLC (“Dow Jones”); S&P DJI, Dow Jones and their respective affiliates do not sponsor, endorse, sell or promote the Fund, will not have any liability with respect thereto and do not have any liability for any errors, omissions, or interruptions of the S&P Dow Jones Indices. Unless otherwise stated, index returns do not reflect the effect of any applicable sales charges, commissions, expenses, taxes or leverage, as applicable. It is not possible to invest directly in an index. |
| 2 | Total Returns at NAV do not include applicable sales charges. If sales charges were deducted, the returns would be lower. Total Returns shown with maximum sales charge reflect the stated maximum sales charge. Unless otherwise stated, performance does not reflect the deduction of taxes on Fund distributions or redemptions of Fund shares. Performance since inception for an index, if presented, is the performance since the Fund’s or oldest share class’ inception, as applicable. After-tax returns are calculated using certain assumptions, including using the highest historical individual federal income tax rates, and do not reflect the impact of state/local taxes. Actual after-tax returns depend on a shareholder’s tax situation and the actual characterization of distributions and may differ from those shown. After-tax returns are not relevant to shareholders who hold shares in tax-deferred accounts or shares held by nontaxable entities. Return After Taxes on Distributions may be the same as Return Before Taxes for the same period because no taxable distributions were made during that period. Return After Taxes on Distributions and Sale of Fund Shares may be greater than or equal to Return After Taxes on Distributions for the same period because of losses realized on the sale of Fund shares. The Fund’s after-tax returns also may reflect foreign tax credits passed by the Fund to its shareholders.Effective November 5, 2020, Class C shares automatically convert to Class A shares eight years after purchase. The average annual total returns listed for Class C reflect conversion to Class A shares after eight years. Prior to November 5, 2020, Class C shares automatically converted to Class A shares ten years after purchase. |
| 3 | Source: Fund prospectus. The expense ratios for the current reporting period can be found in the Financial Highlights section of this report. |
| | Fund profile subject to change due to active management. |
Eaton Vance
Tax-Managed Growth Funds 1.1 and 1.2
December 31, 2023
Example
As a Fund shareholder, you incur two types of costs: (1) transaction costs, including sales charges (loads) on purchases; and (2) ongoing costs, including management fees; distribution or service fees; and other Fund expenses. This Example is intended to help you understand your ongoing costs (in dollars) of Fund investing and to compare these costs with the ongoing costs of investing in other mutual funds. The Example is based on an investment of $1,000 invested at the beginning of the period and held for the entire period (July 1, 2023 to December 31, 2023).
Actual Expenses
The first section of the table below provides information about actual account values and actual expenses. You may use the information in this section, together with the amount you invested, to estimate the expenses that you paid over the period. Simply divide your account value by $1,000 (for example, an $8,600 account value divided by $1,000 = 8.6), then multiply the result by the number in the first section under the heading entitled “Expenses Paid During Period” to estimate the expenses you paid on your account during this period.
Hypothetical Example for Comparison Purposes
The second section of the table below provides information about hypothetical account values and hypothetical expenses based on the actual Fund expense ratio and an assumed rate of return of 5% per year (before expenses), which is not the actual Fund return. The hypothetical account values and expenses may not be used to estimate the actual ending account balance or expenses you paid for the period. You may use this information to compare the ongoing costs of investing in your Fund and other funds. To do so, compare this 5% hypothetical example with the 5% hypothetical examples that appear in the shareholder reports of the other funds.
Please note that the expenses shown in the table are meant to highlight your ongoing costs only and do not reflect any transactional costs, such as sales charges (loads). Therefore, the second section of the table is useful in comparing ongoing costs only, and will not help you determine the relative total costs of owning different funds. In addition, if these transactional costs were included, your costs would be higher.
Eaton Vance Tax-Managed Growth Fund 1.1
| | Beginning
Account Value
(7/1/23) | Ending
Account Value
(12/31/23) | Expenses Paid
During Period*
(7/1/23 – 12/31/23) | Annualized
Expense
Ratio |
| Actual | | | | |
| Class A | $1,000.00 | $1,088.60 | $3.95 | 0.75% |
| Class C | $1,000.00 | $1,084.40 | $7.88 | 1.50% |
| Class I | $1,000.00 | $1,089.90 | $2.63 | 0.50% |
| |
| Hypothetical | | | | |
| (5% return per year before expenses) | | | | |
| Class A | $1,000.00 | $1,021.43 | $3.82 | 0.75% |
| Class C | $1,000.00 | $1,017.64 | $7.63 | 1.50% |
| Class I | $1,000.00 | $1,022.69 | $2.55 | 0.50% |
| * | Expenses are equal to the Fund’s annualized expense ratio for the indicated Class, multiplied by the average account value over the period, multiplied by 184/365 (to reflect the one-half year period). The Example assumes that the $1,000 was invested at the net asset value per share determined at the close of business on June 30, 2023.The Example reflects the expenses of both the Fund and the Portfolio. |
Eaton Vance
Tax-Managed Growth Funds 1.1 and 1.2
December 31, 2023
Fund Expenses — continued
Eaton Vance Tax-Managed Growth Fund 1.2
| | Beginning
Account Value
(7/1/23) | Ending
Account Value
(12/31/23) | Expenses Paid
During Period*
(7/1/23 – 12/31/23) | Annualized
Expense
Ratio |
| Actual | | | | |
| Class A | $1,000.00 | $1,087.70 | $4.68 | 0.89% |
| Class C | $1,000.00 | $1,083.60 | $8.56 | 1.63% |
| Class I | $1,000.00 | $1,089.10 | $3.37 | 0.64% |
| |
| Hypothetical | | | | |
| (5% return per year before expenses) | | | | |
| Class A | $1,000.00 | $1,020.72 | $4.53 | 0.89% |
| Class C | $1,000.00 | $1,016.99 | $8.29 | 1.63% |
| Class I | $1,000.00 | $1,021.98 | $3.26 | 0.64% |
| * | Expenses are equal to the Fund’s annualized expense ratio for the indicated Class, multiplied by the average account value over the period, multiplied by 184/365 (to reflect the one-half year period). The Example assumes that the $1,000 was invested at the net asset value per share determined at the close of business on June 30, 2023.The Example reflects the expenses of both the Fund and the Portfolio. |
Eaton Vance
Tax-Managed Growth Funds 1.1 and 1.2
December 31, 2023
Statements of Assets and Liabilities
| | December 31, 2023 |
| | Tax-Managed
Growth Fund 1.1 | Tax-Managed
Growth Fund 1.2 |
| Assets | | |
| Investment in Tax-Managed Growth Portfolio, at value | $ 2,260,624,288 | $ 1,238,476,309 |
| Receivable for Fund shares sold | 5,383,741 | 4,429,638 |
| Total assets | $2,266,008,029 | $1,242,905,947 |
| Liabilities | | |
| Payable for Fund shares redeemed | $ 6,310,862 | $ 3,052,426 |
| Payable to affiliates: | | |
| Administration fee | — | 154,841 |
| Distribution and service fees | 407,563 | 218,790 |
| Trustees' fees | 125 | 125 |
| Accrued expenses | 454,492 | 203,165 |
| Total liabilities | $ 7,173,042 | $ 3,629,347 |
| Net Assets | $2,258,834,987 | $1,239,276,600 |
| Sources of Net Assets | | |
| Paid-in capital | $ 1,145,641,598 | $ 808,194,680 |
| Distributable earnings | 1,113,193,389 | 431,081,920 |
| Net Assets | $2,258,834,987 | $1,239,276,600 |
| Class A Shares | | |
| Net Assets | $ 1,921,882,255 | $ 854,180,603 |
| Shares Outstanding | 20,241,713 | 19,996,467 |
Net Asset Value and Redemption Price Per Share
(net assets ÷ shares of beneficial interest outstanding) | $ 94.95 | $ 42.72 |
Maximum Offering Price Per Share
(100 ÷ 94.75 of net asset value per share) | $ 100.21 | $ 45.09 |
| Class C Shares | | |
| Net Assets | $ 5,935,222 | $ 47,967,229 |
| Shares Outstanding | 70,078 | 1,170,433 |
Net Asset Value and Offering Price Per Share*
(net assets ÷ shares of beneficial interest outstanding) | $ 84.70 | $ 40.98 |
| Class I Shares | | |
| Net Assets | $ 331,017,510 | $ 337,128,768 |
| Shares Outstanding | 3,748,081 | 7,872,862 |
Net Asset Value, Offering Price and Redemption Price Per Share
(net assets ÷ shares of beneficial interest outstanding) | $ 88.32 | $ 42.82 |
| On sales of $50,000 or more, the offering price of Class A shares is reduced. |
| * | Redemption price per share is equal to the net asset value less any applicable contingent deferred sales charge. |
10
See Notes to Financial Statements.
Eaton Vance
Tax-Managed Growth Funds 1.1 and 1.2
December 31, 2023
| | Year Ended December 31, 2023 |
| | Tax-Managed
Growth Fund 1.1 | Tax-Managed
Growth Fund 1.2 |
| Investment Income | | |
| Dividend income allocated from Portfolio (net of foreign taxes, $282,319 and $152,652, respectively) | $ 28,611,901 | $ 15,512,577 |
| Expenses allocated from Portfolio | (8,853,480) | (4,798,487) |
| Total investment income from Portfolio | $ 19,758,421 | $ 10,714,090 |
| Expenses | | |
| Administration fee | $ — | $ 1,666,944 |
| Distribution and service fees: | | |
| Class A | 4,410,814 | 1,926,395 |
| Class C | 58,460 | 457,465 |
| Trustees’ fees and expenses | 500 | 500 |
| Custodian fee | 62,715 | 62,855 |
| Transfer and dividend disbursing agent fees | 923,461 | 375,914 |
| Professional fees | 58,043 | 43,278 |
| Printing and postage | 60,547 | 36,850 |
| Registration fees | 51,858 | 55,154 |
| Miscellaneous | 145,833 | 74,867 |
| Total expenses | $ 5,772,231 | $ 4,700,222 |
| Net investment income | $ 13,986,190 | $ 6,013,868 |
| Realized and Unrealized Gain (Loss) from Portfolio | | |
| Net realized gain (loss): | | |
| Investment transactions(1) | $ 35,154,823 | $ 19,114,330 |
| Foreign currency transactions | 300 | 163 |
| Net realized gain | $ 35,155,123 | $ 19,114,493 |
| Change in unrealized appreciation (depreciation): | | |
| Investments | $ 461,194,675 | $ 250,070,876 |
| Foreign currency | 11,883 | 6,471 |
| Net change in unrealized appreciation (depreciation) | $461,206,558 | $250,077,347 |
| Net realized and unrealized gain | $496,361,681 | $269,191,840 |
| Net increase in net assets from operations | $510,347,871 | $275,205,708 |
| (1) | Includes $55,611,121 and $30,186,327 respectively, of net realized gains from redemptions in-kind. |
11
See Notes to Financial Statements.
Eaton Vance
Tax-Managed Growth Funds 1.1 and 1.2
December 31, 2023
Statements of Changes in Net Assets
| | Tax-Managed Growth Fund 1.1 |
| | Year Ended
December 31, 2023 | Year Ended
December 31, 2022 |
| Increase (Decrease) in Net Assets | | |
| From operations: | | |
| Net investment income | $ 13,986,190 | $ 12,982,974 |
| Net realized gain | 35,155,123 | 48,224,998 |
| Net change in unrealized appreciation (depreciation) | 461,206,558 | (541,685,345) |
| Net increase (decrease) in net assets from operations | $ 510,347,871 | $ (480,477,373) |
| Distributions to shareholders: | | |
| Class A | $ (11,070,935) | $ (10,236,397) |
| Class I | (2,836,689) | (2,363,145) |
| Total distributions to shareholders | $ (13,907,624) | $ (12,599,542) |
| Transactions in shares of beneficial interest: | | |
| Class A | $ (104,263,620) | $ (79,923,549) |
| Class C | (1,141,693) | (1,393,535) |
| Class I | 23,238,891 | 4,272,826 |
| Net decrease in net assets from Fund share transactions | $ (82,166,422) | $ (77,044,258) |
| Net increase (decrease) in net assets | $ 414,273,825 | $ (570,121,173) |
| Net Assets | | |
| At beginning of year | $ 1,844,561,162 | $ 2,414,682,335 |
| At end of year | $2,258,834,987 | $1,844,561,162 |
12
See Notes to Financial Statements.
Eaton Vance
Tax-Managed Growth Funds 1.1 and 1.2
December 31, 2023
Statements of Changes in Net Assets — continued
| | Tax-Managed Growth Fund 1.2 |
| | Year Ended
December 31, 2023 | Year Ended
December 31, 2022 |
| Increase (Decrease) in Net Assets | | |
| From operations: | | |
| Net investment income | $ 6,013,868 | $ 5,339,249 |
| Net realized gain | 19,114,493 | 25,869,296 |
| Net change in unrealized appreciation (depreciation) | 250,077,347 | (289,689,625) |
| Net increase (decrease) in net assets from operations | $ 275,205,708 | $ (258,481,080) |
| Distributions to shareholders: | | |
| Class A | $ (3,752,755) | $ (3,205,430) |
| Class I | (2,219,213) | (1,929,809) |
| Total distributions to shareholders | $ (5,971,968) | $ (5,135,239) |
| Transactions in shares of beneficial interest: | | |
| Class A | $ (22,436,758) | $ (21,908,458) |
| Class C | (6,578,837) | (5,446,627) |
| Class I | 4,515,887 | 2,634,963 |
| Net decrease in net assets from Fund share transactions | $ (24,499,708) | $ (24,720,122) |
| Net increase (decrease) in net assets | $ 244,734,032 | $ (288,336,441) |
| Net Assets | | |
| At beginning of year | $ 994,542,568 | $1,282,879,009 |
| At end of year | $1,239,276,600 | $ 994,542,568 |
13
See Notes to Financial Statements.
Eaton Vance
Tax-Managed Growth Funds 1.1 and 1.2
December 31, 2023
| | Tax-Managed Growth Fund 1.1 — Class A |
| | Year Ended December 31, |
| | 2023 | 2022 | 2021 | 2020 | 2019 |
| Net asset value — Beginning of year | $ 74.460 | $ 93.810 | $ 75.510 | $ 61.750 | $ 48.150 |
| Income (Loss) From Operations | | | | | |
| Net investment income(1) | $ 0.550 | $ 0.491 | $ 0.338 | $ 0.481 | $ 0.539 |
| Net realized and unrealized gain (loss) | 20.489 | (19.363) | 18.292 | 13.748 | 13.572 |
| Total income (loss) from operations | $ 21.039 | $ (18.872) | $ 18.630 | $ 14.229 | $ 14.111 |
| Less Distributions | | | | | |
| From net investment income | $ (0.549) | $ (0.478) | $ (0.330) | $ (0.469) | $ (0.511) |
| Total distributions | $ (0.549) | $ (0.478) | $ (0.330) | $ (0.469) | $ (0.511) |
| Net asset value — End of year | $ 94.950 | $ 74.460 | $ 93.810 | $ 75.510 | $ 61.750 |
| Total Return(2) | 28.24% | (20.11)% | 24.68% | 23.05% | 29.45% |
| Ratios/Supplemental Data | | | | | |
| Net assets, end of year (000’s omitted) | $1,921,882 | $1,598,685 | $2,108,253 | $1,784,383 | $1,565,795 |
| Ratios (as a percentage of average daily net assets):(3) | | | | | |
| Expenses | 0.74% (4) | 0.74% (4) | 0.73% | 0.76% | 0.78% |
| Net investment income | 0.65% | 0.62% | 0.40% | 0.77% | 0.96% |
| Portfolio Turnover of the Portfolio(5) | 7% | 3% | 1% | 1% | 1% |
| (1) | Computed using average shares outstanding. |
| (2) | Returns are historical and are calculated by determining the percentage change in net asset value with all distributions reinvested and do not reflect the effect of sales charges. |
| (3) | Includes the Fund’s share of the Portfolio's allocated expenses. |
| (4) | Includes a reduction by the investment adviser of a portion of the Portfolio's adviser fee due to the Portfolio's investment in the Liquidity Fund (equal to less than 0.005% of average daily net assets for the years ended December 31, 2023 and 2022). |
| (5) | Excludes the value of portfolio securities contributed or distributed as a result of in-kind shareholder transactions. |
14
See Notes to Financial Statements.
Eaton Vance
Tax-Managed Growth Funds 1.1 and 1.2
December 31, 2023
Financial Highlights — continued
| | Tax-Managed Growth Fund 1.1 — Class C |
| | Year Ended December 31, |
| | 2023 | 2022 | 2021 | 2020 | 2019 |
| Net asset value — Beginning of year | $ 66.540 | $ 83.920 | $ 67.810 | $ 55.530 | $ 43.280 |
| Income (Loss) From Operations | | | | | |
| Net investment income (loss)(1) | $ (0.074) | $ (0.099) | $ (0.268) | $ 0.015 | $ (0.018) |
| Net realized and unrealized gain (loss) | 18.234 | (17.281) | 16.378 | 12.265 | 12.268 |
| Total income (loss) from operations | $18.160 | $(17.380) | $16.110 | $12.280 | $12.250 |
| Net asset value — End of year | $84.700 | $ 66.540 | $83.920 | $67.810 | $55.530 |
| Total Return(2) | 27.28% | (20.71)% | 23.76% | 22.11% | 28.34% |
| Ratios/Supplemental Data | | | | | |
| Net assets, end of year (000’s omitted) | $ 5,935 | $ 5,665 | $ 8,801 | $ 9,517 | $ 13,730 |
| Ratios (as a percentage of average daily net assets):(3) | | | | | |
| Expenses | 1.49% (4) | 1.49% (4) | 1.48% | 1.51% | 1.55% |
| Net investment income (loss) | (0.10)% | (0.14)% | (0.35)% | 0.03% | (0.04)% |
| Portfolio Turnover of the Portfolio(5) | 7% | 3% | 1% | 1% | 1% |
| (1) | Computed using average shares outstanding. |
| (2) | Returns are historical and are calculated by determining the percentage change in net asset value with all distributions reinvested and do not reflect the effect of sales charges. |
| (3) | Includes the Fund’s share of the Portfolio's allocated expenses. |
| (4) | Includes a reduction by the investment adviser of a portion of the Portfolio's adviser fee due to the Portfolio's investment in the Liquidity Fund (equal to less than 0.005% of average daily net assets for the years ended December 31, 2023 and 2022). |
| (5) | Excludes the value of portfolio securities contributed or distributed as a result of in-kind shareholder transactions. |
15
See Notes to Financial Statements.
Eaton Vance
Tax-Managed Growth Funds 1.1 and 1.2
December 31, 2023
Financial Highlights — continued
| | Tax-Managed Growth Fund 1.1 — Class I |
| | Year Ended December 31, |
| | 2023 | 2022 | 2021 | 2020 | 2019 |
| Net asset value — Beginning of year | $ 69.290 | $ 87.380 | $ 70.350 | $ 57.570 | $ 44.920 |
| Income (Loss) From Operations | | | | | |
| Net investment income(1) | $ 0.708 | $ 0.644 | $ 0.514 | $ 0.594 | $ 0.628 |
| Net realized and unrealized gain (loss) | 19.094 | (18.050) | 17.064 | 12.817 | 12.675 |
| Total income (loss) from operations | $ 19.802 | $ (17.406) | $ 17.578 | $ 13.411 | $ 13.303 |
| Less Distributions | | | | | |
| From net investment income | $ (0.772) | $ (0.684) | $ (0.548) | $ (0.631) | $ (0.653) |
| Total distributions | $ (0.772) | $ (0.684) | $ (0.548) | $ (0.631) | $ (0.653) |
| Net asset value — End of year | $ 88.320 | $ 69.290 | $ 87.380 | $ 70.350 | $ 57.570 |
| Total Return(2) | 28.56% | (19.92)% | 25.00% | 23.31% | 29.74% |
| Ratios/Supplemental Data | | | | | |
| Net assets, end of year (000’s omitted) | $331,018 | $240,211 | $297,628 | $227,801 | $183,702 |
| Ratios (as a percentage of average daily net assets):(3) | | | | | |
| Expenses | 0.50% (4) | 0.49% (4) | 0.48% | 0.51% | 0.53% |
| Net investment income | 0.90% | 0.87% | 0.64% | 1.01% | 1.20% |
| Portfolio Turnover of the Portfolio(5) | 7% | 3% | 1% | 1% | 1% |
| (1) | Computed using average shares outstanding. |
| (2) | Returns are historical and are calculated by determining the percentage change in net asset value with all distributions reinvested. |
| (3) | Includes the Fund’s share of the Portfolio's allocated expenses. |
| (4) | Includes a reduction by the investment adviser of a portion of the Portfolio's adviser fee due to the Portfolio's investment in the Liquidity Fund (equal to less than 0.005% of average daily net assets for the years ended December 31, 2023 and 2022). |
| (5) | Excludes the value of portfolio securities contributed or distributed as a result of in-kind shareholder transactions. |
16
See Notes to Financial Statements.
Eaton Vance
Tax-Managed Growth Funds 1.1 and 1.2
December 31, 2023
Financial Highlights — continued
| | Tax-Managed Growth Fund 1.2 — Class A |
| | Year Ended December 31, |
| | 2023 | 2022 | 2021 | 2020 | 2019 |
| Net asset value — Beginning of year | $ 33.500 | $ 42.190 | $ 33.950 | $ 27.770 | $ 21.650 |
| Income (Loss) From Operations | | | | | |
| Net investment income(1) | $ 0.192 | $ 0.166 | $ 0.093 | $ 0.171 | $ 0.205 |
| Net realized and unrealized gain (loss) | 9.216 | (8.700) | 8.216 | 6.171 | 6.108 |
| Total income (loss) from operations | $ 9.408 | $ (8.534) | $ 8.309 | $ 6.342 | $ 6.313 |
| Less Distributions | | | | | |
| From net investment income | $ (0.188) | $ (0.156) | $ (0.069) | $ (0.162) | $ (0.193) |
| Total distributions | $ (0.188) | $ (0.156) | $ (0.069) | $ (0.162) | $ (0.193) |
| Net asset value — End of year | $ 42.720 | $ 33.500 | $ 42.190 | $ 33.950 | $ 27.770 |
| Total Return(2) | 28.05% | (20.23)% | 24.48% | 22.84% | 29.28% |
| Ratios/Supplemental Data | | | | | |
| Net assets, end of year (000’s omitted) | $854,181 | $689,946 | $894,809 | $736,814 | $629,530 |
| Ratios (as a percentage of average daily net assets):(3) | | | | | |
| Expenses | 0.89% (4) | 0.89% (4) | 0.88% | 0.92% | 0.93% |
| Net investment income | 0.51% | 0.46% | 0.24% | 0.61% | 0.81% |
| Portfolio Turnover of the Portfolio(5) | 7% | 3% | 1% | 1% | 1% |
| (1) | Computed using average shares outstanding. |
| (2) | Returns are historical and are calculated by determining the percentage change in net asset value with all distributions reinvested and do not reflect the effect of sales charges. |
| (3) | Includes the Fund’s share of the Portfolio's allocated expenses. |
| (4) | Includes a reduction by the investment adviser of a portion of the Portfolio's adviser fee due to the Portfolio's investment in the Liquidity Fund (equal to less than 0.005% of average daily net assets for the years ended December 31, 2023 and 2022). |
| (5) | Excludes the value of portfolio securities contributed or distributed as a result of in-kind shareholder transactions. |
17
See Notes to Financial Statements.
Eaton Vance
Tax-Managed Growth Funds 1.1 and 1.2
December 31, 2023
Financial Highlights — continued
| | Tax-Managed Growth Fund 1.2 — Class C |
| | Year Ended December 31, |
| | 2023 | 2022 | 2021 | 2020 | 2019 |
| Net asset value — Beginning of year | $ 32.240 | $ 40.720 | $ 32.960 | $ 27.030 | $ 21.080 |
| Income (Loss) From Operations | | | | | |
| Net investment income (loss)(1) | $ (0.089) | $ (0.099) | $ (0.188) | $ (0.037) | $ 0.003 |
| Net realized and unrealized gain (loss) | 8.829 | (8.381) | 7.948 | 5.967 | 5.947 |
| Total income (loss) from operations | $ 8.740 | $ (8.480) | $ 7.760 | $ 5.930 | $ 5.950 |
| Net asset value — End of year | $40.980 | $32.240 | $40.720 | $32.960 | $27.030 |
| Total Return(2) | 27.11% | (20.83)% | 23.54% | 21.94% | 28.22% |
| Ratios/Supplemental Data | | | | | |
| Net assets, end of year (000’s omitted) | $ 47,967 | $ 43,673 | $ 61,484 | $ 54,119 | $ 61,397 |
| Ratios (as a percentage of average daily net assets):(3) | | | | | |
| Expenses | 1.64% (4) | 1.65% (4) | 1.63% | 1.67% | 1.68% |
| Net investment income (loss) | (0.24)% | (0.29)% | (0.51)% | (0.14)% | 0.01% |
| Portfolio Turnover of the Portfolio(5) | 7% | 3% | 1% | 1% | 1% |
| (1) | Computed using average shares outstanding. |
| (2) | Returns are historical and are calculated by determining the percentage change in net asset value with all distributions reinvested and do not reflect the effect of sales charges. |
| (3) | Includes the Fund’s share of the Portfolio's allocated expenses. |
| (4) | Includes a reduction by the investment adviser of a portion of the Portfolio's adviser fee due to the Portfolio's investment in the Liquidity Fund (equal to less than 0.005% of average daily net assets for the years ended December 31, 2023 and 2022). |
| (5) | Excludes the value of portfolio securities contributed or distributed as a result of in-kind shareholder transactions. |
18
See Notes to Financial Statements.
Eaton Vance
Tax-Managed Growth Funds 1.1 and 1.2
December 31, 2023
Financial Highlights — continued
| | Tax-Managed Growth Fund 1.2 — Class I |
| | Year Ended December 31, |
| | 2023 | 2022 | 2021 | 2020 | 2019 |
| Net asset value — Beginning of year | $ 33.580 | $ 42.290 | $ 34.030 | $ 27.830 | $ 21.690 |
| Income (Loss) From Operations | | | | | |
| Net investment income(1) | $ 0.288 | $ 0.257 | $ 0.190 | $ 0.242 | $ 0.266 |
| Net realized and unrealized gain (loss) | 9.238 | (8.719) | 8.235 | 6.192 | 6.130 |
| Total income (loss) from operations | $ 9.526 | $ (8.462) | $ 8.425 | $ 6.434 | $ 6.396 |
| Less Distributions | | | | | |
| From net investment income | $ (0.286) | $ (0.248) | $ (0.165) | $ (0.234) | $ (0.256) |
| Total distributions | $ (0.286) | $ (0.248) | $ (0.165) | $ (0.234) | $ (0.256) |
| Net asset value — End of year | $ 42.820 | $ 33.580 | $ 42.290 | $ 34.030 | $ 27.830 |
| Total Return(2) | 28.37% | (20.01)% | 24.77% | 23.13% | 29.61% |
| Ratios/Supplemental Data | | | | | |
| Net assets, end of year (000’s omitted) | $337,129 | $260,923 | $326,586 | $256,802 | $223,771 |
| Ratios (as a percentage of average daily net assets):(3) | | | | | |
| Expenses | 0.64% (4) | 0.64% (4) | 0.63% | 0.67% | 0.68% |
| Net investment income | 0.75% | 0.72% | 0.49% | 0.85% | 1.05% |
| Portfolio Turnover of the Portfolio(5) | 7% | 3% | 1% | 1% | 1% |
| (1) | Computed using average shares outstanding. |
| (2) | Returns are historical and are calculated by determining the percentage change in net asset value with all distributions reinvested. |
| (3) | Includes the Fund’s share of the Portfolio's allocated expenses. |
| (4) | Includes a reduction by the investment adviser of a portion of the Portfolio's adviser fee due to the Portfolio's investment in the Liquidity Fund (equal to less than 0.005% of average daily net assets for the years ended December 31, 2023 and 2022). |
| (5) | Excludes the value of portfolio securities contributed or distributed as a result of in-kind shareholder transactions. |
19
See Notes to Financial Statements.
Eaton Vance
Tax-Managed Growth Funds 1.1 and 1.2
December 31, 2023
Notes to Financial Statements
1 Significant Accounting Policies
Eaton Vance Tax-Managed Growth Fund 1.1 (Tax-Managed Growth Fund 1.1) and Eaton Vance Tax-Managed Growth Fund 1.2 (Tax-Managed Growth Fund 1.2) (each a Fund, and collectively the Funds) are diversified series of the Eaton Vance Mutual Funds Trust (the Trust). The Trust is a Massachusetts business trust registered under the Investment Company Act of 1940, as amended (the 1940 Act), as an open-end management investment company. Each Fund currently offers Class A, Class C and Class I shares. Class A shares are generally sold subject to a sales charge imposed at time of purchase. Class C shares are sold at net asset value and are generally subject to a contingent deferred sales charge (see Note 5). Effective November 5, 2020, Class C shares automatically convert to Class A shares eight years after their purchase as described in the Fund’s prospectus. Class I shares are sold at net asset value and are not subject to a sales charge. Tax-Managed Growth Fund 1.1 is closed to new investors. Each class represents a pro rata interest in each Fund, but votes separately on class-specific matters and (as noted below) is subject to different expenses. Realized and unrealized gains and losses and net investment income and losses, other than class-specific expenses, are allocated daily to each class of shares based on the relative net assets of each class to the total net assets of each Fund. Each class of shares differs in its distribution plan and certain other class-specific expenses. Each Fund typically invests its assets in interests in Tax-Managed Growth Portfolio (the Portfolio), a Massachusetts business trust, having the same investment objective and policies as the Funds. The value of each Fund’s investment in the Portfolio reflects the Fund’s proportionate interest in the net assets of the Portfolio (44.9% and 24.6% for Tax-Managed Growth Fund 1.1 and Tax-Managed Growth Fund 1.2, respectively, at December 31, 2023). The performance of each Fund is directly affected by the performance of the Portfolio. The financial statements of the Portfolio, including the portfolio of investments, are included elsewhere in this report and should be read in conjunction with the Funds’ financial statements.
The following is a summary of significant accounting policies of the Funds. The policies are in conformity with accounting principles generally accepted in the United States of America (U.S. GAAP). Each Fund is an investment company and follows accounting and reporting guidance in the Financial Accounting Standards Board (FASB) Accounting Standards Codification Topic 946 “Financial Services-Investment Companies.”
A Investment Valuation—Valuation of securities by the Portfolio is discussed in Note 1A of the Portfolio's Notes to Financial Statements, which are included elsewhere in this report.
B Income—Each Fund's net investment income or loss consists of the Fund's pro rata share of the net investment income or loss of the Portfolio, less all actual and accrued expenses of each Fund.
C Federal Taxes—Each Fund's policy is to comply with the provisions of the Internal Revenue Code applicable to regulated investment companies and to distribute to shareholders each year substantially all of its net investment income, and all or substantially all of its net realized capital gains. Accordingly, no provision for federal income or excise tax is necessary.
As of December 31, 2023, the Funds had no uncertain tax positions that would require financial statement recognition, de-recognition, or disclosure. Each Fund files a U.S. federal income tax return annually after its fiscal year-end, which is subject to examination by the Internal Revenue Service for a period of three years from the date of filing.
D Expenses—The majority of expenses of the Trust are directly identifiable to an individual fund. Expenses which are not readily identifiable to a specific fund are allocated taking into consideration, among other things, the nature and type of expense and the relative size of the funds.
E Use of Estimates—The preparation of the financial statements in conformity with U.S. GAAP requires management to make estimates and assumptions that affect the reported amounts of assets and liabilities at the date of the financial statements and the reported amounts of income and expense during the reporting period. Actual results could differ from those estimates.
F Indemnifications—Under the Trust’s organizational documents, its officers and Trustees may be indemnified against certain liabilities and expenses arising out of the performance of their duties to each Fund. Under Massachusetts law, if certain conditions prevail, shareholders of a Massachusetts business trust (such as the Trust) could be deemed to have personal liability for the obligations of the Trust. However, the Trust’s Declaration of Trust contains an express disclaimer of liability on the part of Fund shareholders and the By-laws provide that the Trust shall assume, upon request by the shareholder, the defense on behalf of any Fund shareholders. Moreover, the By-laws also provide for indemnification out of Fund property of any shareholder held personally liable solely by reason of being or having been a shareholder for all loss or expense arising from such liability. Additionally, in the normal course of business, each Fund enters into agreements with service providers that may contain indemnification clauses. Each Fund’s maximum exposure under these arrangements is unknown as this would involve future claims that may be made against each Fund that have not yet occurred.
G Other—Investment transactions are accounted for on a trade date basis.
Eaton Vance
Tax-Managed Growth Funds 1.1 and 1.2
December 31, 2023
Notes to Financial Statements — continued
2 Distributions to Shareholders and Income Tax Information
It is the present policy of each Fund to make at least one distribution annually (normally in December) of all or substantially all of its net investment income and to distribute annually all or substantially all of its net realized capital gains (reduced by available capital loss carryforwards from prior years). Distributions to shareholders are recorded on the ex-dividend date. Distributions are declared separately for each class of shares. Shareholders may reinvest income and capital gain distributions in additional shares of the same class of a Fund at the net asset value as of the ex-dividend date or, at the election of the shareholder, receive distributions in cash. Distributions to shareholders are determined in accordance with income tax regulations, which may differ from U.S. GAAP. As required by U.S. GAAP, only distributions in excess of tax basis earnings and profits are reported in the financial statements as a return of capital. Permanent differences between book and tax accounting relating to distributions are reclassified to paid-in capital. For tax purposes, distributions from short-term capital gains are considered to be from ordinary income.
The tax character of distributions declared for the years ended December 31, 2023 and December 31, 2022 was as follows:
| | Year Ended December 31, 2023 |
| | Tax-Managed
Growth Fund 1.1 | Tax-Managed
Growth Fund 1.2 |
| Distributions declared from: | | |
| Ordinary income | $13,907,624 | $5,971,968 |
| | Year Ended December 31, 2022 |
| | Tax-Managed
Growth Fund 1.1 | Tax-Managed
Growth Fund 1.2 |
| Distributions declared from: | | |
| Ordinary income | $12,599,542 | $5,135,239 |
During the year ended December 31, 2023, the following amounts were reclassified due to the Fund's use of equalization accounting and differences between book and tax accounting for the Fund's investment in the Portfolio. Tax equalization accounting allows the Funds to treat as a distribution that portion of redemption proceeds representing a redeeming shareholder’s portion of undistributed taxable income and net capital gains.
| | Tax-Managed
Growth Fund 1.1 | Tax-Managed
Growth Fund 1.2 |
| Change in: | | |
| Paid-in capital | $ 52,829,386 | $ 24,826,532 |
| Distributable earnings | $(52,829,386) | $(24,826,532) |
These reclassifications had no effect on the net assets or net asset value per share of the Funds.
As of December 31, 2023, the components of distributable earnings (accumulated loss) and unrealized appreciation (depreciation) on a tax basis were as follows:
| | Tax-Managed
Growth Fund 1.1 | Tax-Managed
Growth Fund 1.2 |
| Undistributed ordinary income | $ — | $ 11,563 |
| Deferred capital losses | (621,977) | (349,710) |
| Net unrealized appreciation | 1,113,815,366 | 431,420,067 |
| Distributable earnings | $1,113,193,389 | $431,081,920 |
At December 31, 2023, the following Funds, for federal income tax purposes, had deferred capital losses which would reduce the respective Fund’s taxable income arising from future net realized gains on investment transactions, if any, to the extent permitted by the Internal Revenue Code, and thus would
Eaton Vance
Tax-Managed Growth Funds 1.1 and 1.2
December 31, 2023
Notes to Financial Statements — continued
reduce the amount of distributions to shareholders, which would otherwise be necessary to relieve the Funds of any liability for federal income or excise tax. The deferred capital losses are treated as arising on the first day of a respective Fund’s next taxable year and retain the same short-term or long-term character as when originally deferred. The amounts of the deferred capital losses are as follows:
| | Tax-Managed
Growth Fund 1.1 | Tax-Managed
Growth Fund 1.2 |
| Deferred capital losses: | | |
| Short-term | $621,977 | $349,710 |
3 Investment Adviser and Administration Fee and Other Transactions with Affiliates
The investment adviser and administration fee is earned by Eaton Vance Management (EVM), an indirect, wholly-owned subsidiary of Morgan Stanley, as compensation for investment advisory and administrative services rendered to each Fund. The fee is computed at an annual rate as a percentage of average daily net assets as follows and is payable monthly:
| Average Daily Net Assets | Annual Fee Rate
(Effective January 13, 2023)* | Annual Fee Rate
(Prior to January 13, 2023) |
| Up to $500 million | 0.5575% | 0.6250% |
| $500 million but less than $1 billion | 0.4950% | 0.5625% |
| $1 billion but less than $1.5 billion | 0.4325% | 0.5000% |
| $1.5 billion but less than $7 billion | 0.3700% | 0.4375% |
| $7 billion but less than $10 billion | 0.3575% | 0.4250% |
| $10 billion but less than $15 billion | 0.3450% | 0.4125% |
| $15 billion but less than $20 billion | 0.3325% | 0.4000% |
| $20 billion but less than $25 billion | 0.3225% | 0.3900% |
| $25 billion but less than $30 billion | 0.3125% | 0.3800% |
| $30 billion but less than $35 billion | 0.3020% | 0.3700% |
| $35 billion but less than $45 billion | 0.2970% | 0.3650% |
| $45 billion and over | 0.2920% | 0.3600% |
| * | Pursuant to an amendment to the investment advisory agreement effective January 13, 2023, EVM contractually agreed to reduce the annual fee rate of the average daily net asset levels as stated above in order to approximately match the effective annualized fee rate in effect prior to the redemption described in Note 1 of the Portfolio’s Notes to Financial Statements which are included elsewhere in this report. |
For the year ended December 31, 2023, the Funds incurred no investment adviser fee on such assets. To the extent each Fund’s assets are invested in the Portfolio, each Fund is allocated its pro rata share of the Portfolio’s investment adviser fee. The Portfolio has engaged Boston Management and Research (BMR) to render investment advisory services. See Note 2 of the Portfolio’s Notes to Financial Statements which are included elsewhere in this report. EVM serves as the administrator of the Funds. EVM receives no compensation from Tax-Managed Growth Fund 1.1 for such services and an administration fee computed at an annual rate of 0.15% of average daily net assets from Tax-Managed Growth Fund 1.2 for such services. For the year ended December 31, 2023, the administration fee for Tax-Managed Growth Fund 1.2 amounted to $1,666,944.
EVM provides sub-transfer agency and related services to the Funds pursuant to a Sub-Transfer Agency Support Services Agreement. Eaton Vance Distributors, Inc. (EVD), an affiliate of EVM and the Funds' principal underwriter, received a portion of the sales charge on sales of Class A shares of the Funds. Morgan Stanley affiliated broker-dealers, which may be deemed to be affiliates of BMR, EVM and EVD, also received a portion of the sales charge on sales of Class A shares. EVD also received distribution and service fees from Class A and Class C shares (see Note 4) and contingent deferred sales
Eaton Vance
Tax-Managed Growth Funds 1.1 and 1.2
December 31, 2023
Notes to Financial Statements — continued
charges (see Note 5). Sub-transfer agent fees earned by EVM, which are included in transfer and dividend disbursing agent fees on the Statements of Operations, and Class A sales charges that the Funds were informed were received by EVD and Morgan Stanley affiliated broker-dealers for year ended December 31, 2023 were as follows:
| | Tax-Managed
Growth Fund 1.1 | Tax-Managed
Growth Fund 1.2 |
| EVM's Sub-Transfer Agent Fees | $231,947 | $80,993 |
| EVD's Class A Sales Charges | $ 4,969 | $48,840 |
| Morgan Stanley affiliated broker-dealers’ Class A Sales Charges | $ 1,280 | $13,868 |
Trustees and officers of the Funds who are members of EVM’s or BMR's organizations receive remuneration for their services to the Funds out of the investment adviser fee. Certain officers and Trustees of the Funds and the Portfolio are officers of the above organizations.
4 Distribution Plans
Each Fund has in effect a distribution plan for Class A shares (Class A Plan) pursuant to Rule 12b-1 under the 1940 Act. Pursuant to the Class A Plan, each Fund pays EVD a distribution and service fee of 0.25% per annum of its average daily net assets attributable to Class A shares for distribution services and facilities provided to each Fund by EVD, as well as for personal services and/or the maintenance of shareholder accounts. Distribution and service fees paid or accrued to EVD for the year ended December 31, 2023 for Class A shares amounted to the following:
| | Tax-Managed
Growth Fund 1.1 | Tax-Managed
Growth Fund 1.2 |
| Class A Distribution and Service Fees | $4,410,814 | $1,926,395 |
Each Fund also has in effect a distribution plan for Class C shares (Class C Plan) pursuant to Rule 12b-1 under the 1940 Act. Pursuant to the Class C Plan each Fund pays EVD amounts equal to 0.75% per annum of its average daily net assets attributable to Class C shares for providing ongoing distribution services and facilities to the respective Funds. For the year ended December 31, 2023, the Funds paid or accrued to EVD the following distribution fees for Class C shares:
| | Tax-Managed
Growth Fund 1.1 | Tax-Managed
Growth Fund 1.2 |
| Class C Distribution Fees | $43,845 | $343,099 |
Pursuant to the Class C Plan, each Fund also make payments of service fees to EVD, financial intermediaries and other persons in amounts equal to 0.25% per annum of the average daily net assets attributable to that class. Service fees paid or accrued are for personal services and/or the maintenance of shareholder accounts. They are separate and distinct from the sales commissions and distribution fees payable to EVD. Service fees paid or accrued for the year ended December 31, 2023 amounted to the following for Class C shares:
| | Tax-Managed
Growth Fund 1.1 | Tax-Managed
Growth Fund 1.2 |
| Class C Service Fees | $14,615 | $114,366 |
Distribution and service fees are subject to the limitations contained in the Financial Industry Regulatory Authority Rule 2341(d).
Eaton Vance
Tax-Managed Growth Funds 1.1 and 1.2
December 31, 2023
Notes to Financial Statements — continued
5 Contingent Deferred Sales Charges
A contingent deferred sales charge (CDSC) of 1% generally is imposed on redemptions of Class C shares made within 12 months of purchase. Class A shares may be subject to a 1% CDSC if redeemed within 12 months of purchase (depending on the circumstances of purchase). Generally, the CDSC is based upon the lower of the net asset value at date of redemption or date of purchase. No charge is levied on shares acquired by reinvestment of dividends or capital gain distributions. For the year ended December 31, 2023, the Funds were informed that EVD received approximately the following amounts of CDSCs paid by Class A and Class C shareholders:
| | Tax-Managed
Growth Fund 1.1 | Tax-Managed
Growth Fund 1.2 |
| Class A | $ — | $1,057 |
| Class C | $ 157 | $1,992 |
6 Investment Transactions
For the year ended December 31, 2023, increases and decreases in each Fund's investment in the Portfolio aggregated, as follows:
| Fund | Increases | Decreases |
| Tax-Managed Growth Fund 1.1 | $ 231,839 | $101,205,191 |
| Tax-Managed Growth Fund 1.2 | $7,359,446 | $ 44,137,386 |
Decreases in each Fund's investment in the Portfolio include distributions of securities as the result of redemptions in-kind, as follows:
| Fund | Redemptions in-kind |
| Tax-Managed Growth Fund 1.1 | $67,995,612 |
| Tax-Managed Growth Fund 1.2 | $28,072,944 |
7 Shares of Beneficial Interest
Each Fund’s Declaration of Trust permits the Trustees to issue an unlimited number of full and fractional shares of beneficial interest (without par value). Such shares may be issued in a number of different series (such as the Funds) and classes. Sales and redemptions of Class I shares include shares purchased and redeemed in connection with the ReFlow liquidity program, a program designed to provide an alternative liquidity source for mutual funds experiencing net redemptions of their shares. Transactions in Fund shares, including direct exchanges pursuant to share class conversions for all periods presented, were as follows:
| Tax-Managed Growth Fund 1.1 | | | |
| | | Year Ended
December 31, 2023 | | Year Ended
December 31, 2022 |
| | | Shares | Amount | Shares | Amount |
| Class A | | | | | |
| Sales | | 87,027 | $ 7,401,737 | 123,797 | $ 9,949,166 |
| Issued to shareholders electing to receive payments of distributions in Fund shares | | 99,334 | 9,452,625 | 117,410 | 8,702,407 |
| Redemptions | | (1,415,112) | (121,117,982) | (1,244,901) | (98,575,122) |
| Net decrease | | (1,228,751) | $(104,263,620) | (1,003,694) | $ (79,923,549) |
Eaton Vance
Tax-Managed Growth Funds 1.1 and 1.2
December 31, 2023
Notes to Financial Statements — continued
| Tax-Managed Growth Fund 1.1 (continued) | | | |
| | | Year Ended
December 31, 2023 | | Year Ended
December 31, 2022 |
| | | Shares | Amount | Shares | Amount |
| Class C | | | | | |
| Sales | | 3,003 | $ 221,476 | 3,385 | $ 236,996 |
| Redemptions | | (18,066) | (1,363,169) | (23,126) | (1,630,531) |
| Net decrease | | (15,063) | $ (1,141,693) | (19,741) | $ (1,393,535) |
| Class I | | | | | |
| Sales | | 1,466,176 | $ 116,507,251 | 1,411,860 | $ 103,779,131 |
| Issued to shareholders electing to receive payments of distributions in Fund shares | | 27,698 | 2,451,513 | 29,105 | 2,007,120 |
| Redemptions | | (1,212,568) | (95,719,873) | (1,380,511) | (101,513,425) |
| Net increase | | 281,306 | $ 23,238,891 | 60,454 | $ 4,272,826 |
| Tax-Managed Growth Fund 1.2 | | | |
| | | Year Ended
December 31, 2023 | | Year Ended
December 31, 2022 |
| | | Shares | Amount | Shares | Amount |
| Class A | | | | | |
| Sales | | 712,652 | $ 27,465,299 | 795,564 | $ 28,654,869 |
| Issued to shareholders electing to receive payments of distributions in Fund shares | | 78,737 | 3,370,736 | 85,705 | 2,858,246 |
| Redemptions | | (1,389,390) | (53,272,793) | (1,495,117) | (53,421,573) |
| Net decrease | | (598,001) | $(22,436,758) | (613,848) | $(21,908,458) |
| Class C | | | | | |
| Sales | | 152,687 | $ 5,662,028 | 177,706 | $ 6,099,640 |
| Redemptions | | (336,827) | (12,240,865) | (333,067) | (11,546,267) |
| Net decrease | | (184,140) | $ (6,578,837) | (155,361) | $ (5,446,627) |
| Class I | | | | | |
| Sales | | 1,623,779 | $ 62,042,021 | 2,025,220 | $ 73,018,705 |
| Issued to shareholders electing to receive payments of distributions in Fund shares | | 48,137 | 2,066,034 | 52,848 | 1,766,194 |
| Redemptions | | (1,570,170) | (59,592,168) | (2,028,730) | (72,149,936) |
| Net increase | | 101,746 | $ 4,515,887 | 49,338 | $ 2,634,963 |
Eaton Vance
Tax-Managed Growth Funds 1.1 and 1.2
December 31, 2023
Report of Independent Registered Public Accounting Firm
To the Trustees of Eaton Vance Mutual Funds Trust and Shareholders of Eaton Vance Tax-Managed Growth Fund 1.1 and Eaton Vance Tax-Managed Growth Fund 1.2:
Opinion on the Financial Statements and Financial Highlights
We have audited the accompanying statements of assets and liabilities of Eaton Vance Tax-Managed Growth Fund 1.1 and Eaton Vance Tax-Managed Growth Fund 1.2 (collectively the “Funds") (each a fund constituting Eaton Vance Mutual Funds Trust) as of December 31, 2023, the related statements of operations for the year then ended, the statements of changes in net assets for each of the two years in the period then ended, the financial highlights for each of the five years in the period then ended, and the related notes. In our opinion, the financial statements and financial highlights present fairly, in all material respects, the financial position of the Funds as of December 31, 2023, and the results of their operations for the year then ended, the changes in their net assets for each of the two years in the period then ended, and the financial highlights for each of the five years in the period then ended, in conformity with accounting principles generally accepted in the United States of America.
Basis for Opinion
These financial statements and financial highlights are the responsibility of the Funds’ management. Our responsibility is to express an opinion on the Funds' financial statements and financial highlights based on our audits. We are a public accounting firm registered with the Public Company Accounting Oversight Board (United States) (PCAOB) and are required to be independent with respect to the Funds in accordance with the U.S. federal securities laws and the applicable rules and regulations of the Securities and Exchange Commission and the PCAOB.
We conducted our audits in accordance with the standards of the PCAOB. Those standards require that we plan and perform the audits to obtain reasonable assurance about whether the financial statements and financial highlights are free of material misstatement, whether due to error or fraud. The Funds are not required to have, nor were we engaged to perform, an audit of their internal control over financial reporting. As part of our audits, we are required to obtain an understanding of internal control over financial reporting but not for the purpose of expressing an opinion on the effectiveness of the Funds’ internal control over financial reporting. Accordingly, we express no such opinion.
Our audits included performing procedures to assess the risks of material misstatement of the financial statements and financial highlights, whether due to error or fraud, and performing procedures that respond to those risks. Such procedures included examining, on a test basis, evidence regarding the amounts and disclosures in the financial statements and financial highlights. Our audits also included evaluating the accounting principles used and significant estimates made by management, as well as evaluating the overall presentation of the financial statements and financial highlights. We believe that our audits provide a reasonable basis for our opinion.
/s/ Deloitte & Touche LLP
Boston, Massachusetts
February 23, 2024
We have served as the auditor of one or more Eaton Vance investment companies since 1959.
Eaton Vance
Tax-Managed Growth Funds 1.1 and 1.2
December 31, 2023
Federal Tax Information (Unaudited)
The Form 1099-DIV you received in February 2024 showed the tax status of all distributions paid to your account in calendar year 2023. Shareholders are advised to consult their own tax adviser with respect to the tax consequences of their investment in the Fund. As required by the Internal Revenue Code and/or regulations, shareholders must be notified regarding the status of qualified business income, qualified dividend income for individuals and the dividends received deduction for corporations.
Qualified Business Income. For the fiscal year ended December 31, 2023, the Funds designate approximately the following amounts, or up to the maximum amount of such dividends allowable pursuant to the Internal Revenue Code, as qualified business income.
| Tax-Managed Growth Fund 1.1 | $ — |
| Tax-Managed Growth Fund 1.2 | $46,709 |
Qualified Dividend Income. For the fiscal year ended December 31, 2023, the Funds designate approximately the following amounts, or up to the maximum amount of such dividends allowable pursuant to the Internal Revenue Code, as qualified dividend income eligible for the reduced tax rate of 15%.
| Tax-Managed Growth Fund 1.1 | $27,101,193 |
| Tax-Managed Growth Fund 1.2 | $14,693,512 |
Dividends Received Deduction. Corporate shareholders are generally entitled to take the dividends received deduction on the portion of the Funds’ dividend distribution that qualifies under tax law. For the Funds’ fiscal 2023 ordinary income dividends, the following amounts qualify for the corporate dividends received deduction:
| Tax-Managed Growth Fund 1.1 | 100.00% |
| Tax-Managed Growth Fund 1.2 | 96.18% |
Tax-Managed Growth Portfolio
December 31, 2023
| Security | Shares | Value |
| Aerospace & Defense — 1.5% |
| Boeing Co. (The)(1) | | 142,446 | $ 37,129,974 |
| General Dynamics Corp. | | 37,550 | 9,750,609 |
| Lockheed Martin Corp. | | 18,733 | 8,490,545 |
| Northrop Grumman Corp. | | 16,117 | 7,545,012 |
| RTX Corp. | | 126,984 | 10,684,434 |
| | | | $ 73,600,574 |
| Air Freight & Logistics — 0.9% |
| C.H. Robinson Worldwide, Inc. | | 72,701 | $ 6,280,639 |
| FedEx Corp. | | 76,559 | 19,367,130 |
| United Parcel Service, Inc., Class B | | 127,908 | 20,110,975 |
| | | | $ 45,758,744 |
| Automobiles — 0.7% |
| Tesla, Inc.(1) | | 136,281 | $ 33,863,103 |
| | | | $ 33,863,103 |
| Banks — 3.3% |
| Bank of America Corp. | | 478,599 | $ 16,114,429 |
| Fifth Third Bancorp | | 491,355 | 16,946,834 |
| JPMorgan Chase & Co. | | 514,622 | 87,537,202 |
| PNC Financial Services Group, Inc. (The) | | 15,834 | 2,451,895 |
| Regions Financial Corp. | | 261,997 | 5,077,502 |
| Truist Financial Corp. | | 311,559 | 11,502,758 |
| U.S. Bancorp | | 76,801 | 3,323,947 |
| Wells Fargo & Co. | | 446,596 | 21,981,455 |
| | | | $ 164,936,022 |
| Beverages — 1.2% |
| Constellation Brands, Inc., Class A | | 66,155 | $ 15,992,971 |
| Monster Beverage Corp.(1) | | 142,992 | 8,237,769 |
| PepsiCo, Inc. | | 228,875 | 38,872,130 |
| | | | $ 63,102,870 |
| Biotechnology — 2.5% |
| AbbVie, Inc. | | 193,103 | $ 29,925,172 |
| Amgen, Inc. | | 97,100 | 27,966,742 |
| Argenx SE ADR(1) | | 41,279 | 15,703,770 |
| Biogen, Inc.(1) | | 7,070 | 1,829,504 |
| Gilead Sciences, Inc. | | 193,738 | 15,694,715 |
| Vertex Pharmaceuticals, Inc.(1) | | 83,684 | 34,050,183 |
| | | | $ 125,170,086 |
| Security | Shares | Value |
| Broadline Retail — 4.2% |
| Amazon.com, Inc.(1) | | 1,399,500 | $ 212,640,030 |
| | | | $ 212,640,030 |
| Building Products — 0.2% |
| Carrier Global Corp. | | 189,214 | $ 10,870,344 |
| | | | $ 10,870,344 |
| Capital Markets — 3.7% |
| Ameriprise Financial, Inc. | | 30,879 | $ 11,728,771 |
| Bank of New York Mellon Corp. (The) | | 149,031 | 7,757,063 |
| BlackRock, Inc. | | 7,289 | 5,917,210 |
| Cboe Global Markets, Inc. | | 75,857 | 13,545,026 |
| Charles Schwab Corp. (The) | | 371,381 | 25,551,013 |
| CME Group, Inc. | | 36,417 | 7,669,420 |
| Goldman Sachs Group, Inc. (The) | | 128,899 | 49,725,367 |
| Intercontinental Exchange, Inc. | | 60,970 | 7,830,377 |
| LPL Financial Holdings, Inc. | | 33,113 | 7,537,181 |
| Moody's Corp. | | 66,944 | 26,145,649 |
| S&P Global, Inc. | | 32,008 | 14,100,164 |
| T. Rowe Price Group, Inc. | | 105,316 | 11,341,480 |
| | | | $ 188,848,721 |
| Chemicals — 1.7% |
| Corteva, Inc. | | 18,814 | $ 901,567 |
| Dow, Inc. | | 18,955 | 1,039,492 |
| DuPont de Nemours, Inc. | | 142,744 | 10,981,296 |
| Ecolab, Inc. | | 110,020 | 21,822,467 |
| Linde PLC | | 72,347 | 29,713,636 |
| PPG Industries, Inc. | | 89,144 | 13,331,485 |
| Sherwin-Williams Co. (The) | | 32,982 | 10,287,086 |
| | | | $ 88,077,029 |
| Commercial Services & Supplies — 0.6% |
| Waste Connections, Inc. | | 57,850 | $ 8,635,270 |
| Waste Management, Inc. | | 108,692 | 19,466,737 |
| | | | $ 28,102,007 |
| Communications Equipment — 1.2% |
| Arista Networks, Inc.(1) | | 143,663 | $ 33,834,073 |
| Cisco Systems, Inc. | | 517,461 | 26,142,130 |
| | | | $ 59,976,203 |
| Consumer Finance — 0.8% |
| American Express Co. | | 121,531 | $ 22,767,618 |
28
See Notes to Financial Statements.
Tax-Managed Growth Portfolio
December 31, 2023
Portfolio of Investments — continued
| Security | Shares | Value |
| Consumer Finance (continued) |
| Discover Financial Services | | 144,856 | $ 16,281,814 |
| | | | $ 39,049,432 |
| Consumer Staples Distribution & Retail — 2.7% |
| Costco Wholesale Corp. | | 113,479 | $ 74,905,218 |
| Sprouts Farmers Market, Inc.(1) | | 182,261 | 8,768,577 |
| Walmart, Inc. | | 322,400 | 50,826,360 |
| | | | $ 134,500,155 |
| Electric Utilities — 0.7% |
| Duke Energy Corp. | | 234,233 | $ 22,729,970 |
| Edison International | | 197,713 | 14,134,503 |
| | | | $ 36,864,473 |
| Electrical Equipment — 0.9% |
| AMETEK, Inc. | | 23,362 | $ 3,852,160 |
| Eaton Corp. PLC | | 8,651 | 2,083,334 |
| Emerson Electric Co. | | 269,079 | 26,189,459 |
| Rockwell Automation, Inc. | | 50,722 | 15,748,167 |
| | | | $ 47,873,120 |
| Energy Equipment & Services — 0.3% |
| Halliburton Co. | | 166,374 | $ 6,014,420 |
| Schlumberger NV | | 206,344 | 10,738,142 |
| | | | $ 16,752,562 |
| Entertainment — 2.0% |
| Netflix, Inc.(1) | | 112,484 | $ 54,766,210 |
| Walt Disney Co. (The) | | 534,448 | 48,255,310 |
| | | | $ 103,021,520 |
| Financial Services — 4.1% |
| Berkshire Hathaway, Inc., Class A(1) | | 84 | $ 45,580,503 |
| Berkshire Hathaway, Inc., Class B(1) | | 224,230 | 79,973,872 |
| Mastercard, Inc., Class A | | 36,635 | 15,625,194 |
| PayPal Holdings, Inc.(1) | | 146,905 | 9,021,436 |
| Visa, Inc., Class A | | 212,810 | 55,405,083 |
| | | | $ 205,606,088 |
| Food Products — 0.7% |
| Flowers Foods, Inc. | | 138,111 | $ 3,108,879 |
| Hershey Co. (The) | | 47,710 | 8,895,052 |
| Lamb Weston Holdings, Inc. | | 73,135 | 7,905,162 |
| Security | Shares | Value |
| Food Products (continued) |
| McCormick & Co., Inc., Non Voting Shares | | 96,258 | $ 6,585,972 |
| Nestle S.A. | | 94,686 | 10,975,988 |
| | | | $ 37,471,053 |
| Ground Transportation — 1.5% |
| CSX Corp. | | 52,770 | $ 1,829,536 |
| Norfolk Southern Corp. | | 65,062 | 15,379,355 |
| Uber Technologies, Inc.(1) | | 331,498 | 20,410,332 |
| Union Pacific Corp. | | 148,572 | 36,492,255 |
| | | | $ 74,111,478 |
| Health Care Equipment & Supplies — 3.0% |
| Abbott Laboratories | | 260,303 | $ 28,651,551 |
| Becton Dickinson & Co. | | 8,470 | 2,065,240 |
| Boston Scientific Corp.(1) | | 289,826 | 16,754,841 |
| Dexcom, Inc.(1) | | 143,376 | 17,791,528 |
| GE HealthCare Technologies, Inc. | | 135,517 | 10,478,174 |
| Intuitive Surgical, Inc.(1) | | 101,205 | 34,142,519 |
| Medtronic PLC | | 110,455 | 9,099,283 |
| Stryker Corp. | | 72,313 | 21,654,851 |
| Zimmer Biomet Holdings, Inc. | | 77,057 | 9,377,837 |
| | | | $ 150,015,824 |
| Health Care Providers & Services — 2.2% |
| Cardinal Health, Inc. | | 14,717 | $ 1,483,474 |
| CVS Health Corp. | | 168,934 | 13,339,029 |
| Elevance Health, Inc. | | 29,512 | 13,916,679 |
| HCA Healthcare, Inc. | | 64,083 | 17,345,986 |
| UnitedHealth Group, Inc. | | 123,171 | 64,845,836 |
| | | | $ 110,931,004 |
| Hotels, Restaurants & Leisure — 2.6% |
| Airbnb, Inc., Class A(1) | | 74,000 | $ 10,074,360 |
| Booking Holdings, Inc.(1) | | 15,067 | 53,445,964 |
| Chipotle Mexican Grill, Inc.(1) | | 3,990 | 9,124,970 |
| Marriott International, Inc., Class A | | 46,029 | 10,380,000 |
| McDonald's Corp. | | 5,400 | 1,601,154 |
| Starbucks Corp. | | 393,521 | 37,781,951 |
| Yum! Brands, Inc. | | 79,662 | 10,408,637 |
| | | | $ 132,817,036 |
| Household Products — 1.3% |
| Colgate-Palmolive Co. | | 397,371 | $ 31,674,442 |
29
See Notes to Financial Statements.
Tax-Managed Growth Portfolio
December 31, 2023
Portfolio of Investments — continued
| Security | Shares | Value |
| Household Products (continued) |
| Kimberly-Clark Corp. | | 6,282 | $ 763,326 |
| Procter & Gamble Co. (The) | | 220,699 | 32,341,232 |
| | | | $ 64,779,000 |
| Industrial Conglomerates — 0.5% |
| General Electric Co. | | 163,119 | $ 20,818,878 |
| Honeywell International, Inc. | | 20,192 | 4,234,464 |
| | | | $ 25,053,342 |
| Industrial REITs — 0.1% |
| EastGroup Properties, Inc. | | 39,500 | $ 7,249,830 |
| | | | $ 7,249,830 |
| Insurance — 1.5% |
| Aflac, Inc. | | 154,400 | $ 12,738,000 |
| Aon PLC, Class A | | 27,135 | 7,896,828 |
| Arthur J. Gallagher & Co. | | 47,054 | 10,581,503 |
| Markel Group, Inc.(1) | | 6,362 | 9,033,404 |
| Marsh & McLennan Cos., Inc. | | 46,353 | 8,782,503 |
| Progressive Corp. (The) | | 151,029 | 24,055,899 |
| Travelers Cos., Inc. (The) | | 20,353 | 3,877,043 |
| | | | $ 76,965,180 |
| Interactive Media & Services — 7.9% |
| Alphabet, Inc., Class A(1) | | 857,372 | $ 119,766,295 |
| Alphabet, Inc., Class C(1) | | 980,031 | 138,115,769 |
| Meta Platforms, Inc., Class A(1) | | 390,562 | 138,243,325 |
| | | | $ 396,125,389 |
| IT Services — 1.7% |
| Accenture PLC, Class A | | 147,914 | $ 51,904,502 |
| Akamai Technologies, Inc.(1) | | 137,414 | 16,262,947 |
| International Business Machines Corp. | | 92,900 | 15,193,795 |
| | | | $ 83,361,244 |
| Life Sciences Tools & Services — 1.3% |
| Agilent Technologies, Inc. | | 151,400 | $ 21,049,142 |
| Danaher Corp. | | 182,007 | 42,105,499 |
| Illumina, Inc.(1) | | 10,000 | 1,392,400 |
| | | | $ 64,547,041 |
| Machinery — 2.1% |
| Caterpillar, Inc. | | 56,089 | $ 16,583,835 |
| Deere & Co. | | 32,269 | 12,903,405 |
| Donaldson Co., Inc. | | 82,526 | 5,393,074 |
| Security | Shares | Value |
| Machinery (continued) |
| Dover Corp. | | 97,408 | $ 14,982,324 |
| Illinois Tool Works, Inc. | | 143,086 | 37,479,947 |
| Otis Worldwide Corp. | | 68,364 | 6,116,527 |
| PACCAR, Inc. | | 28,969 | 2,828,823 |
| Parker-Hannifin Corp. | | 16,957 | 7,812,090 |
| Snap-on, Inc. | | 14,911 | 4,306,893 |
| | | | $ 108,406,918 |
| Media — 0.2% |
| Comcast Corp., Class A | | 218,452 | $ 9,579,120 |
| | | | $ 9,579,120 |
| Metals & Mining — 0.3% |
| Alcoa Corp. | | 195,000 | $ 6,630,000 |
| Nucor Corp. | | 35,624 | 6,200,001 |
| | | | $ 12,830,001 |
| Multi-Utilities — 0.1% |
| Consolidated Edison, Inc. | | 50,472 | $ 4,591,438 |
| | | | $ 4,591,438 |
| Oil, Gas & Consumable Fuels — 3.3% |
| Antero Resources Corp.(1) | | 328,489 | $ 7,450,130 |
| Cheniere Energy, Inc. | | 149,498 | 25,520,804 |
| ConocoPhillips | | 285,715 | 33,162,940 |
| Devon Energy Corp. | | 33,163 | 1,502,284 |
| EOG Resources, Inc. | | 16,793 | 2,031,113 |
| Exxon Mobil Corp. | | 752,802 | 75,265,144 |
| Hess Corp. | | 20,651 | 2,977,048 |
| Marathon Petroleum Corp. | | 69,480 | 10,308,053 |
| Murphy Oil Corp. | | 41,407 | 1,766,423 |
| Phillips 66 | | 51,867 | 6,905,572 |
| | | | $ 166,889,511 |
| Personal Care Products — 0.1% |
| Estee Lauder Cos., Inc. (The), Class A | | 26,451 | $ 3,868,459 |
| Kenvue, Inc. | | 102,541 | 2,207,707 |
| | | | $ 6,076,166 |
| Pharmaceuticals — 4.2% |
| AstraZeneca PLC ADR | | 182,272 | $ 12,276,019 |
| Bristol-Myers Squibb Co. | | 143,581 | 7,367,141 |
| Catalent, Inc.(1) | | 45,943 | 2,064,219 |
| Eli Lilly & Co. | | 148,712 | 86,687,199 |
| Johnson & Johnson | | 267,485 | 41,925,599 |
| Merck & Co., Inc. | | 215,040 | 23,443,661 |
30
See Notes to Financial Statements.
Tax-Managed Growth Portfolio
December 31, 2023
Portfolio of Investments — continued
| Security | Shares | Value |
| Pharmaceuticals (continued) |
| Pfizer, Inc. | | 311,715 | $ 8,974,275 |
| Zoetis, Inc. | | 142,003 | 28,027,132 |
| | | | $ 210,765,245 |
| Professional Services — 0.7% |
| ASGN, Inc.(1) | | 12,284 | $ 1,181,352 |
| Automatic Data Processing, Inc. | | 68,245 | 15,899,038 |
| Jacobs Solutions, Inc. | | 55,476 | 7,200,785 |
| Verisk Analytics, Inc. | | 46,792 | 11,176,737 |
| | | | $ 35,457,912 |
| Residential REITs — 0.2% |
| Invitation Homes, Inc. | | 230,000 | $ 7,845,300 |
| | | | $ 7,845,300 |
| Semiconductors & Semiconductor Equipment — 7.3% |
| Analog Devices, Inc. | | 133,698 | $ 26,547,075 |
| Applied Materials, Inc. | | 187,182 | 30,336,587 |
| Broadcom, Inc. | | 24,966 | 27,868,297 |
| Intel Corp. | | 656,645 | 32,996,411 |
| Lam Research Corp. | | 25,000 | 19,581,500 |
| Marvell Technology, Inc. | | 91,890 | 5,541,886 |
| NVIDIA Corp. | | 302,592 | 149,849,610 |
| QUALCOMM, Inc. | | 314,846 | 45,536,177 |
| Texas Instruments, Inc. | | 158,452 | 27,009,728 |
| | | | $ 365,267,271 |
| Software — 12.0% |
| Adobe, Inc.(1) | | 80,840 | $ 48,229,144 |
| Cadence Design Systems, Inc.(1) | | 83,984 | 22,874,722 |
| Check Point Software Technologies, Ltd.(1) | | 54,716 | 8,360,058 |
| Fortinet, Inc.(1) | | 100,000 | 5,853,000 |
| Intuit, Inc. | | 46,644 | 29,153,899 |
| Microsoft Corp. | | 909,092 | 341,854,956 |
| Oracle Corp. | | 80,569 | 8,494,390 |
| Palo Alto Networks, Inc.(1) | | 153,052 | 45,131,974 |
| Salesforce, Inc.(1) | | 112,456 | 29,591,672 |
| ServiceNow, Inc.(1) | | 66,921 | 47,279,017 |
| Workday, Inc., Class A(1) | | 54,405 | 15,019,044 |
| | | | $ 601,841,876 |
| Specialized REITs — 0.4% |
| American Tower Corp. | | 10,718 | $ 2,313,802 |
| Public Storage | | 51,744 | 15,781,920 |
| | | | $ 18,095,722 |
| Security | Shares | Value |
| Specialty Retail — 2.6% |
| Best Buy Co., Inc. | | 58,781 | $ 4,601,377 |
| Lowe's Cos., Inc. | | 212,443 | 47,279,190 |
| O'Reilly Automotive, Inc.(1) | | 18,600 | 17,671,488 |
| Ross Stores, Inc. | | 141,093 | 19,525,860 |
| TJX Cos., Inc. (The) | | 219,657 | 20,606,023 |
| Tractor Supply Co. | | 50,157 | 10,785,260 |
| Ulta Beauty, Inc.(1) | | 17,591 | 8,619,414 |
| | | | $ 129,088,612 |
| Technology Hardware, Storage & Peripherals — 7.6% |
| Apple, Inc. | | 1,986,542 | $ 382,468,931 |
| | | | $ 382,468,931 |
| Textiles, Apparel & Luxury Goods — 0.9% |
| NIKE, Inc., Class B | | 422,533 | $ 45,874,408 |
| | | | $ 45,874,408 |
| Tobacco — 0.4% |
| Altria Group, Inc. | | 157,274 | $ 6,344,433 |
| Philip Morris International, Inc. | | 162,661 | 15,303,147 |
| | | | $ 21,647,580 |
Total Common Stocks
(identified cost $1,646,715,327) | | | $5,028,766,515 |
| Short-Term Investments — 0.0%(2) |
| Security | Shares | Value |
| Morgan Stanley Institutional Liquidity Funds - Government Portfolio, Institutional Class, 5.27%(3) | | 2,564,731 | $ 2,564,731 |
Total Short-Term Investments
(identified cost $2,564,731) | | | $ 2,564,731 |
Total Investments — 99.9%
(identified cost $1,649,280,058) | | | $5,031,331,246 |
| Other Assets, Less Liabilities — 0.1% | | | $ 3,540,139 |
| Net Assets — 100.0% | | | $5,034,871,385 |
| The percentage shown for each investment category in the Portfolio of Investments is based on net assets. |
| (1) | Non-income producing security. |
| (2) | Amount is less than 0.05%. |
| (3) | May be deemed to be an affiliated investment company. The rate shown is the annualized seven-day yield as of December 31, 2023. |
31
See Notes to Financial Statements.
Tax-Managed Growth Portfolio
December 31, 2023
Portfolio of Investments — continued
| Abbreviations: |
| ADR | – American Depositary Receipt |
| REITs | – Real Estate Investment Trusts |
32
See Notes to Financial Statements.
Tax-Managed Growth Portfolio
December 31, 2023
Statement of Assets and Liabilities
| | December 31, 2023 |
| Assets | |
| Unaffiliated investments, at value (identified cost $1,646,715,327) | $ 5,028,766,515 |
| Affiliated investments, at value (identified cost $2,564,731) | 2,564,731 |
| Dividends receivable | 4,905,951 |
| Dividends receivable from affiliated investments | 27,626 |
| Receivable for investments sold | 263,164 |
| Tax reclaims receivable | 406,333 |
| Receivable from affiliates | 614,861 |
| Trustees' deferred compensation plan | 255,377 |
| Total assets | $5,037,804,558 |
| Liabilities | |
| Payable to affiliates: | |
| Investment adviser fee | $ 1,715,260 |
| Trustees' fees | 27,125 |
| Trustees' deferred compensation plan | 255,377 |
| Accrued expenses | 935,411 |
| Total liabilities | $ 2,933,173 |
| Net Assets applicable to investors' interest in Portfolio | $5,034,871,385 |
33
See Notes to Financial Statements.
Tax-Managed Growth Portfolio
December 31, 2023
| | Year Ended |
| | December 31, 2023 |
| Investment Income | |
| Dividend income (net of foreign taxes withheld of $2,058,994) | $ 75,338,595 |
| Dividend income from affiliated investments | 1,573,276 |
| Total investment income | $ 76,911,871 |
| Expenses | |
| Investment adviser fee | $ 22,844,487 |
| Trustees’ fees and expenses | 108,500 |
| Custodian fee | 1,476,037 |
| Professional fees | 402,763 |
| Miscellaneous | 294,110 |
| Total expenses | $ 25,125,897 |
| Deduct: | |
| Waiver and/or reimbursement of expenses by affiliates | $ 1,209,005 |
| Total expense reductions | $ 1,209,005 |
| Net expenses | $ 23,916,892 |
| Net investment income | $ 52,994,979 |
| Realized and Unrealized Gain (Loss) | |
| Net realized gain (loss): | |
| Investment transactions(1) | $ 50,916,817 |
| Investment transactions - affiliated investments(1) | 8,727,060 |
| Foreign currency transactions | 673 |
| Net realized gain | $ 59,644,550 |
| Change in unrealized appreciation (depreciation): | |
| Investments | $ 2,157,750,748 |
| Investments - affiliated investments | (2,778,056) |
| Foreign currency | 31,825 |
| Net change in unrealized appreciation (depreciation) | $2,155,004,517 |
| Net realized and unrealized gain | $2,214,649,067 |
| Net increase in net assets from operations | $2,267,644,046 |
| (1) | Aggregate amount includes $119,056,116 of net realized gains from redemptions in-kind. |
34
See Notes to Financial Statements.
Tax-Managed Growth Portfolio
December 31, 2023
Statements of Changes in Net Assets
| | Year Ended December 31, |
| | 2023 | 2022 |
| Increase (Decrease) in Net Assets | | |
| From operations: | | |
| Net investment income | $ 52,994,979 | $ 300,457,402 |
| Net realized gain | 59,644,550 | 778,434,816 |
| Net change in unrealized appreciation (depreciation) | 2,155,004,517 | (8,569,954,185) |
| Net increase (decrease) in net assets from operations | $ 2,267,644,046 | $ (7,491,061,967) |
| Capital transactions: | | |
| Contributions | $ 90,713,310 | $ 2,468,619,619 |
| Withdrawals | (27,916,548,380) | (1,697,105,702) |
| Net increase (decrease) in net assets from capital transactions | $(27,825,835,070) | $ 771,513,917 |
| Net decrease in net assets | $(25,558,191,024) | $ (6,719,548,050) |
| Net Assets | | |
| At beginning of year | $ 30,593,062,409 | $ 37,312,610,459 |
| At end of year | $ 5,034,871,385 | $30,593,062,409 |
35
See Notes to Financial Statements.
Tax-Managed Growth Portfolio
December 31, 2023
| | Year Ended December 31, |
| Ratios/Supplemental Data | 2023 | 2022 | 2021 | 2020 | 2019 |
| Ratios (as a percentage of average daily net assets): | | | | | |
| Expenses | 0.43% (1)(2) | 0.43% (2) | 0.43% | 0.44% | 0.45% |
| Net investment income | 0.95% | 0.93% | 0.69% | 1.07% | 1.28% |
| Portfolio Turnover(3) | 7% | 3% | 1% | 1% | 1% |
| Total Return | 28.67% | (19.86)% | 25.05% | 23.42% | 29.87% |
| Net assets, end of year (000’s omitted) | $5,034,871 | $30,593,062 | $37,312,610 | $27,986,714 | $22,013,353 |
| (1) | The investment adviser reimbursed certain operating expenses (equal to 0.02% of average daily net assets for the year ended December 31, 2023). Absent this reimbursement, total return would be lower. |
| (2) | Includes a reduction by the investment adviser of a portion of its adviser fee due to the Portfolio’s investment in the Liquidity Fund (equal to less than 0.005% of average daily net assets for the years ended December 31, 2023 and 2022). |
| (3) | Excludes the value of portfolio securities contributed or distributed as a result of in-kind shareholder transactions. |
36
See Notes to Financial Statements.
Tax-Managed Growth Portfolio
December 31, 2023
Notes to Financial Statements
1 Significant Accounting Policies
Tax-Managed Growth Portfolio (the Portfolio) is a Massachusetts business trust registered under the Investment Company Act of 1940, as amended (the 1940 Act), as a diversified, open-end management investment company. The Portfolio’s investment objective is to achieve long-term, after-tax returns for interestholders through investing in a diversified portfolio of equity securities. The Declaration of Trust permits the Trustees to issue interests in the Portfolio. At December 31, 2023, Eaton Vance Tax-Managed Growth Fund 1.0, Eaton Vance Tax-Managed Growth Fund 1.1, Eaton Vance Tax-Managed Growth Fund 1.2 and Eaton Vance Tax-Managed Equity Asset Allocation Fund held an interest of 25.5%, 44.9%, 24.6%, and 5.0% respectively, in the Portfolio. As of the close of business on January 13, 2023, the unregistered fund redeemed in-kind its entire interest in the Portfolio amounting to $27,556,262,973. The in-kind redemption of the unregistered fund’s interest in the Portfolio did not result in the Portfolio’s recognition of any gain or loss for federal income tax purposes and is not expected to materially affect the Portfolio���s investment strategy, fees and expenses, or tax position.
The following is a summary of significant accounting policies of the Portfolio. The policies are in conformity with accounting principles generally accepted in the United States of America (U.S. GAAP). The Portfolio is an investment company and follows accounting and reporting guidance in the Financial Accounting Standards Board (FASB) Accounting Standards Codification Topic 946 “Financial Services — Investment Companies.”
A Investment Valuation—The following methodologies are used to determine the market value or fair value of investments.
Equity Securities. Equity securities listed on a U.S. securities exchange generally are valued at the last sale or closing price on the day of valuation or, if no sales took place on such date, at the mean between the closing bid and ask prices on the exchange where such securities are principally traded. Equity securities listed on the NASDAQ National Market System are valued at the NASDAQ official closing price. Unlisted or listed securities for which closing sales prices or closing quotations are not available are valued at the mean between the latest available bid and ask prices.
Foreign Securities and Currencies. Foreign securities and currencies are valued in U.S. dollars, based on foreign currency exchange rate quotations supplied by a third party pricing service. The pricing service uses a proprietary model to determine the exchange rate. Inputs to the model include reported trades and implied bid/ask spreads. The daily valuation of exchange-traded foreign securities generally is determined as of the close of trading on the principal exchange on which such securities trade. Events occurring after the close of trading on foreign exchanges may result in adjustments to the valuation of foreign securities to more accurately reflect their fair value as of the close of regular trading on the New York Stock Exchange. When valuing foreign equity securities that meet certain criteria, the Portfolio's Trustees have approved the use of a fair value service that values such securities to reflect market trading that occurs after the close of the applicable foreign markets of comparable securities or other instruments that have a strong correlation to the fair-valued securities.
Other. Investments in management investment companies (including money market funds) that do not trade on an exchange are valued at the net asset value as of the close of each business day.
Fair Valuation. In connection with Rule 2a-5 of the 1940 Act, the Trustees have designated the Portfolio’s investment adviser as its valuation designee. Investments for which valuations or market quotations are not readily available or are deemed unreliable are valued by the investment adviser, as valuation designee, at fair value using methods that most fairly reflect the security’s “fair value”, which is the amount that the Portfolio might reasonably expect to receive for the security upon its current sale in the ordinary course. Each such determination is based on a consideration of relevant factors, which are likely to vary from one pricing context to another. These factors may include, but are not limited to, the type of security, the existence of any contractual restrictions on the security’s disposition, the price and extent of public trading in similar securities of the issuer or of comparable companies or entities, quotations or relevant information obtained from broker/dealers or other market participants, information obtained from the issuer, analysts, and/or the appropriate stock exchange (for exchange-traded securities), an analysis of the company’s or entity’s financial statements, and an evaluation of the forces that influence the issuer and the market(s) in which the security is purchased and sold.
B Investment Transactions—Investment transactions for financial statement purposes are accounted for on a trade date basis. Realized gains and losses on investments sold are determined on the basis of identified cost.
C Income—Dividend income is recorded on the ex-dividend date for dividends received in cash and/or securities. However, if the ex-dividend date has passed, certain dividends from foreign securities are recorded as the Portfolio is informed of the ex-dividend date. Withholding taxes on foreign dividends and capital gains have been provided for in accordance with the Portfolio's understanding of the applicable countries’ tax rules and rates. In consideration of recent decisions rendered by European courts, the Portfolio has filed additional tax reclaims for previously withheld taxes on dividends earned in certain European Union countries. These filings are subject to various administrative and judicial proceedings within these countries. Due to the uncertainty as to the ultimate resolution of these proceedings, the likelihood of receipt of these reclaims, and the potential timing of payment, no amounts are reflected in the financial statements for such reclaims.
D Federal Taxes—The Portfolio has elected to be treated as a partnership for federal tax purposes. No provision is made by the Portfolio for federal or state taxes on any taxable income of the Portfolio because each investor in the Portfolio is ultimately responsible for the payment of any taxes on its share of taxable income. Since at least one of the Portfolio's investors is a regulated investment company that invests all or substantially all of its assets in the Portfolio, the Portfolio normally must satisfy the applicable source of income and diversification requirements (under the Internal Revenue Code) in order for its investors to satisfy them. The Portfolio will allocate, at least annually among its investors, each investor's distributive share of the Portfolio's net investment income, net realized capital gains and losses and any other items of income, gain, loss, deduction or credit.
Tax-Managed Growth Portfolio
December 31, 2023
Notes to Financial Statements — continued
As of December 31, 2023, the Portfolio had no uncertain tax positions that would require financial statement recognition, de-recognition, or disclosure. The Portfolio files a U.S. federal income tax return annually after its fiscal year-end, which is subject to examination by the Internal Revenue Service for a period of three years from the date of filing.
E Foreign Currency Translation—Investment valuations, other assets, and liabilities initially expressed in foreign currencies are translated each business day into U.S. dollars based upon current exchange rates. Purchases and sales of foreign investment securities and income and expenses denominated in foreign currencies are translated into U.S. dollars based upon currency exchange rates in effect on the respective dates of such transactions. Recognized gains or losses on investment transactions attributable to changes in foreign currency exchange rates are recorded for financial statement purposes as net realized gains and losses on investments. That portion of unrealized gains and losses on investments that results from fluctuations in foreign currency exchange rates is not separately disclosed.
F Use of Estimates—The preparation of the financial statements in conformity with U.S. GAAP requires management to make estimates and assumptions that affect the reported amounts of assets and liabilities at the date of the financial statements and the reported amounts of income and expense during the reporting period. Actual results could differ from those estimates.
G Indemnifications—Under the Portfolio’s organizational documents, its officers and Trustees may be indemnified against certain liabilities and expenses arising out of the performance of their duties to the Portfolio. Under Massachusetts law, if certain conditions prevail, interestholders in the Portfolio could be deemed to have personal liability for the obligations of the Portfolio. However, the Portfolio’s Declaration of Trust contains an express disclaimer of liability on the part of Portfolio interestholders. Additionally, in the normal course of business, the Portfolio enters into agreements with service providers that may contain indemnification clauses. The Portfolio’s maximum exposure under these arrangements is unknown as this would involve future claims that may be made against the Portfolio that have not yet occurred.
2 Investment Adviser Fee and Other Transactions with Affiliates
The investment adviser fee is earned by Boston Management and Research (BMR) an indirect, wholly-owned subsidiary of Morgan Stanley, as compensation for investment advisory services rendered to the Portfolio. The investment adviser fee is based upon an annual rate of the Portfolio's average daily net assets as follows and is payable monthly:
| Average Daily Net Assets | Annual Fee Rate
(Effective January 13, 2023)* | Annual Fee Rate
(Prior to January 13, 2023) |
| Up to $500 million | 0.5575% | 0.6250% |
| $500 million but less than $1 billion | 0.4950% | 0.5625% |
| $1 billion but less than $1.5 billion | 0.4325% | 0.5000% |
| $1.5 billion but less than $7 billion | 0.3700% | 0.4375% |
| $7 billion but less than $10 billion | 0.3575% | 0.4250% |
| $10 billion but less than $15 billion | 0.3450% | 0.4125% |
| $15 billion but less than $20 billion | 0.3325% | 0.4000% |
| $20 billion but less than $25 billion | 0.3225% | 0.3900% |
| $25 billion but less than $30 billion | 0.3125% | 0.3800% |
| $30 billion but less than $35 billion | 0.3020% | 0.3700% |
| $35 billion but less than $45 billion | 0.2970% | 0.3650% |
| $45 billion and over | 0.2920% | 0.3600% |
| * | Pursuant to an amendment to the investment advisory agreement effective January 13, 2023, BMR contractually agreed to reduce the annual fee rate of the average daily net asset levels as stated above in order to approximately match the effective annualized fee rate in effect prior to the redemption described in Note 1. |
For the year ended December 31, 2023, the Portfolio's investment adviser fee amounted to $22,844,487 or 0.41% of the Portfolio's average daily net assets.
The Portfolio may invest in a money market fund, the Institutional Class of the Morgan Stanley Institutional Liquidity Funds - Government Portfolio (the “Liquidity Fund”), an open-end management investment company managed by Morgan Stanley Investment Management Inc., a wholly-owned subsidiary of Morgan Stanley. The investment adviser fee paid by the Portfolio is reduced by an amount equal to its pro rata share of the advisory and administration fees paid by the Portfolio due to its investment in the Liquidity Fund. For the year ended December 31, 2023, the investment adviser fee paid was reduced by $46,820 relating to the Portfolio’s investment in the Liquidity Fund.
Tax-Managed Growth Portfolio
December 31, 2023
Notes to Financial Statements — continued
Effective after the close of business on January 13, 2023, BMR has agreed to waive its advisory fee and/or reimburse the Portfolio's operating expenses to the extent that total annual operating expenses (excluding expenses such as brokerage commissions, borrowing costs, taxes or litigation expenses, indemnification expenses, and other expenses not incurred in the ordinary course of the Portfolio's business) exceed 0.43% of Portfolio's average daily net assets. The expense reimbursement agreement with BMR may be changed or terminated after January 13, 2026. For the period from the close of business on January 13, 2023 to December 31, 2023, BMR waived or reimbursed expenses of $1,162,185.
Officers and Trustees of the Portfolio who are members of EVM’s or BMR’s organizations receive remuneration for their services to the Portfolio out of the investment adviser fee. Trustees of the Portfolio who are not affiliated with the investment adviser may elect to defer receipt of all or a percentage of their annual fees in accordance with the terms of the Trustees Deferred Compensation Plan. Certain officers and Trustees of the Portfolio are officers of the above organizations.
3 Purchases and Sales of Investments
Purchases and sales of investments, other than short-term obligations and investments transferred from the Portfolio, aggregated $479,831,905 and $511,038,928, respectively, for the year ended December 31, 2023. In addition, investors contributed securities with an aggregate market value of $75,679,239 and investments having an aggregate market value of $251,372,203 were distributed in payment for capital withdrawals during the year ended December 31, 2023.
As of the close of business on January 13, 2023, the unregistered fund redeemed in-kind its entire interest in the Portfolio amounting to $27,556,262,973 of which $27,357,403,265 represented securities and $198,859,708 represented cash. For financial reporting purposes, the identified cost of the aggregate investments redeemed amounting to $16,339,977,895 was carried forward to the unregistered fund and no gain or loss was recognized on the in-kind redemption.
4 Federal Income Tax Basis of Investments
The cost and unrealized appreciation (depreciation) of investments of the Fund at December 31, 2023, as determined on a federal income tax basis, were as follows:
| Aggregate cost | $1,818,776,681 |
| Gross unrealized appreciation | $ 3,213,892,732 |
| Gross unrealized depreciation | (1,338,167) |
| Net unrealized appreciation | $3,212,554,565 |
5 Line of Credit
The Portfolio participates with other portfolios and funds managed by EVM and its affiliates in a $650 million unsecured revolving line of credit agreement with a group of banks, which is in effect through October 22, 2024. In connection with the renewal of the agreement on October 24, 2023, the borrowing limit was decreased from $725 million. Borrowings are made by the Portfolio solely for temporary purposes related to redemptions and other short-term cash needs. Interest is charged to the Portfolio based on its borrowings at an amount above either the Secured Overnight Financing Rate (SOFR) or Federal Funds rate. In addition, a fee computed at an annual rate of 0.15% on the daily unused portion of the line of credit is allocated among the participating portfolios and funds at the end of each quarter. In connection with the renewal of the agreement in October 2023, an arrangement fee totaling $150,000 was incurred that was allocated to the participating portfolios and funds. Because the line of credit is not available exclusively to the Portfolio, it may be unable to borrow some or all of its requested amounts at any particular time. The Portfolio did not have any significant borrowings or allocated fees during the year ended December 31, 2023.
Tax-Managed Growth Portfolio
December 31, 2023
Notes to Financial Statements — continued
6 Affiliated Investments
At December 31, 2023, the value of the Portfolio's investment in affiliated issuers and funds that may be deemed to be affiliated was $2,564,731, which represents less than 0.1% of the Portfolio's net assets. Transactions in such investments by the Portfolio for the year ended December 31, 2023 were as follows:
| Name | Value,
beginning
of period | Purchases | Sales
proceeds | Net
realized
gain (loss) | Change in
unrealized
appreciation
(depreciation) | Value, end
of period | Dividend
income | Shares,
end of period |
| Common Stocks |
| Morgan Stanley | $ 90,143,050 | $ — | $ (96,092,054) | $ 8,727,060 | $ (2,778,056) | $ — | $ 189,077 | — |
| Short-Term Investments |
| Liquidity Fund | 170,972,940 | 297,770,467 | (466,178,676) | — | — | 2,564,731 | 1,384,199 | 2,564,731 |
| Total | | | | $8,727,060 | $(2,778,056) | $2,564,731 | $1,573,276 | |
7 Fair Value Measurements
Under generally accepted accounting principles for fair value measurements, a three-tier hierarchy to prioritize the assumptions, referred to as inputs, is used in valuation techniques to measure fair value. The three-tier hierarchy of inputs is summarized in the three broad levels listed below.
| • | Level 1 – quoted prices in active markets for identical investments |
| • | Level 2 – other significant observable inputs (including quoted prices for similar investments, interest rates, prepayment speeds, credit risk, etc.) |
| • | Level 3 – significant unobservable inputs (including a fund's own assumptions in determining the fair value of investments) |
In cases where the inputs used to measure fair value fall in different levels of the fair value hierarchy, the level disclosed is determined based on the lowest level input that is significant to the fair value measurement in its entirety. The inputs or methodology used for valuing securities are not necessarily an indication of the risk associated with investing in those securities.
At December 31, 2023, the hierarchy of inputs used in valuing the Portfolio's investments, which are carried at fair value, were as follows:
| Asset Description | Level 1 | Level 2 | Level 3 | Total |
| Common Stocks: | | | | |
| Communication Services | $ 508,726,029 | $ — | $ — | $ 508,726,029 |
| Consumer Discretionary | 554,283,189 | — | — | 554,283,189 |
| Consumer Staples | 316,600,836 | 10,975,988 | — | 327,576,824 |
| Energy | 183,642,073 | — | — | 183,642,073 |
| Financials | 675,405,443 | — | — | 675,405,443 |
| Health Care | 661,429,200 | — | — | 661,429,200 |
| Industrials | 449,234,439 | — | — | 449,234,439 |
| Information Technology | 1,492,915,525 | — | — | 1,492,915,525 |
| Materials | 100,907,030 | — | — | 100,907,030 |
| Real Estate | 33,190,852 | — | — | 33,190,852 |
| Utilities | 41,455,911 | — | — | 41,455,911 |
| Total Common Stocks | $5,017,790,527 | $ 10,975,988* | $ — | $5,028,766,515 |
Tax-Managed Growth Portfolio
December 31, 2023
Notes to Financial Statements — continued
| Asset Description (continued) | Level 1 | Level 2 | Level 3 | Total |
| Short-Term Investments | $ 2,564,731 | $ — | $ — | $ 2,564,731 |
| Total Investments | $5,020,355,258 | $ 10,975,988 | $ — | $5,031,331,246 |
| * | Includes foreign equity securities whose values were adjusted to reflect market trading of comparable securities or other correlated instruments that occurred after the close of trading in their applicable foreign markets. |
Tax-Managed Growth Portfolio
December 31, 2023
Report of Independent Registered Public Accounting Firm
To the Trustees and Investors of Tax-Managed Growth Portfolio:
Opinion on the Financial Statements and Financial Highlights
We have audited the accompanying statement of assets and liabilities of Tax-Managed Growth Portfolio (the “Portfolio"), including the portfolio of investments, as of December 31, 2023, the related statement of operations for the year then ended, the statements of changes in net assets for each of the two years in the period then ended, the financial highlights for each of the five years in the period then ended, and the related notes. In our opinion, the financial statements and financial highlights present fairly, in all material respects, the financial position of the Portfolio as of December 31, 2023, and the results of its operations for the year then ended, the changes in its net assets for each of the two years in the period then ended, and the financial highlights for each of the five years in the period then ended in conformity with accounting principles generally accepted in the United States of America.
Basis for Opinion
These financial statements and financial highlights are the responsibility of the Portfolio’s management. Our responsibility is to express an opinion on the Portfolio’s financial statements and financial highlights based on our audits. We are a public accounting firm registered with the Public Company Accounting Oversight Board (United States) (PCAOB) and are required to be independent with respect to the Portfolio in accordance with the U.S. federal securities laws and the applicable rules and regulations of the Securities and Exchange Commission and the PCAOB.
We conducted our audits in accordance with the standards of the PCAOB. Those standards require that we plan and perform the audit to obtain reasonable assurance about whether the financial statements and financial highlights are free of material misstatement, whether due to error or fraud. The Portfolio is not required to have, nor were we engaged to perform, an audit of its internal control over financial reporting. As part of our audits, we are required to obtain an understanding of internal control over financial reporting but not for the purpose of expressing an opinion on the effectiveness of the Portfolio’s internal control over financial reporting. Accordingly, we express no such opinion.
Our audits included performing procedures to assess the risks of material misstatement of the financial statements and financial highlights, whether due to error or fraud, and performing procedures that respond to those risks. Such procedures included examining, on a test basis, evidence regarding the amounts and disclosures in the financial statements and financial highlights. Our audits also included evaluating the accounting principles used and significant estimates made by management, as well as evaluating the overall presentation of the financial statements and financial highlights. Our procedures included confirmation of securities owned as of December 31, 2023, by correspondence with the custodian and brokers; when replies were not received from brokers, we performed other auditing procedures. We believe that our audits provide a reasonable basis for our opinion.
/s/ Deloitte & Touche LLP
Boston, Massachusetts
February 23, 2024
We have served as the auditor of one or more Eaton Vance investment companies since 1959.
Eaton Vance
Tax-Managed Growth Fund 1.1
December 31, 2023
Management and Organization
Fund Management. The Trustees of Eaton Vance Mutual Funds Trust (the Trust) and Tax-Managed Growth Portfolio (the Portfolio) are responsible for the overall management and supervision of the Trust's and the Portfolio's affairs. The Board members and officers of the Trust and the Portfolio are listed below. Except as indicated, each individual has held the office shown or other offices in the same company for the last five years. Board members hold indefinite terms of office. Each Trustee holds office until his or her successor is elected and qualified, subject to a prior death, resignation, retirement, disqualification or removal. Under the terms of the Fund's and the Portfolio's current Trustee retirement policy, an Independent Trustee must retire and resign as a Trustee on the earlier of: (i) the first day of July following his or her 74th birthday; or (ii), with limited exception, December 31st of the 20th year in which he or she has served as a Trustee. However, if such retirement and resignation would cause the Fund and the Portfolio to be out of compliance with Section 16 of the 1940 Act or any other regulations or guidance of the SEC, then such retirement and resignation will not become effective until such time as action has been taken for the Fund and the Portfolio to be in compliance therewith. The “noninterested Trustees” consist of those Trustees who are not “interested persons” of the Trust and the Portfolio, as that term is defined under the 1940 Act. The business address of each Board member and officer is Two International Place, Boston, Massachusetts 02110. As used below, “BMR” refers to Boston Management and Research, “EV” refers to EV LLC, “EVM” refers to Eaton Vance Management, “MSIM" refers to Morgan Stanley Investment Management Inc. and “EVD” refers to Eaton Vance Distributors, Inc. EV is the trustee of each of EVM and BMR. Each of EVM, BMR, EVD and EV are indirect, wholly owned subsidiaries of Morgan Stanley. Each officer affiliated with EVM may hold a position with other EVM affiliates that is comparable to his or her position with EVM listed below. Each Trustee oversees 127 funds in the Eaton Vance fund complex (including both funds and portfolios in a hub and spoke structure).
| Name and Year of Birth | Trust/Portfolio
Position(s) | Length of Service | Principal Occupation(s) and Other Directorships
During Past Five Years and Other Relevant Experience |
| Interested Trustee |
Anchal Pachnanda(1)
1980 | Trustee | Since 2023 | Co-Head of Strategy of MSIM (since 2019). Formerly, Head of Strategy of MSIM (2017-2019). Ms. Pachnanda is an interested person because of her position with MSIM, which is an affiliate of the Trust.
Other Directorships. None. |
| Noninterested Trustees |
Alan C. Bowser
1962 | Trustee | Since 2022 | Private investor. Formerly, Chief Diversity Officer, Partner and a member of the Operating Committee, and formerly served as Senior Advisor on Diversity and Inclusion for the firm’s chief executive officer, Co-Head of the Americas Region, and Senior Client Advisor of Bridgewater Associates, an asset management firm (2011- 2023).
Other Directorships. Independent Director of Stout Risius Ross (a middle market professional services advisory firm) (since 2021). |
Mark R. Fetting
1954 | Trustee | Since 2016 | Private investor. Formerly held various positions at Legg Mason, Inc. (investment management firm) (2000-2012), including President, Chief Executive Officer, Director and Chairman (2008-2012), Senior Executive Vice President (2004-2008) and Executive Vice President (2001-2004). Formerly, President of Legg Mason family of funds (2001-2008). Formerly, Division President and Senior Officer of Prudential Financial Group, Inc. and related companies (investment management firm) (1991-2000).
Other Directorships. None. |
Cynthia E. Frost
1961 | Trustee | Since 2014 | Private investor. Formerly, Chief Investment Officer of Brown University (university endowment) (2000-2012). Formerly, Portfolio Strategist for Duke Management Company (university endowment manager) (1995-2000). Formerly, Managing Director, Cambridge Associates (investment consulting company) (1989-1995). Formerly, Consultant, Bain and Company (management consulting firm) (1987-1989). Formerly, Senior Equity Analyst, BA Investment Management Company (1983-1985).
Other Directorships. None. |
George J. Gorman
1952 | Chairperson
of the Board
and Trustee | Since 2021
(Chairperson) and
2014 (Trustee) | Principal at George J. Gorman LLC (consulting firm). Formerly, Senior Partner at Ernst & Young LLP (a registered public accounting firm) (1974-2009).
Other Directorships. None. |
Eaton Vance
Tax-Managed Growth Fund 1.1
December 31, 2023
Management and Organization — continued
| Name and Year of Birth | Trust/Portfolio
Position(s) | Length of Service | Principal Occupation(s) and Other Directorships
During Past Five Years and Other Relevant Experience |
| Noninterested Trustees (continued) |
Valerie A. Mosley
1960 | Trustee | Since 2014 | Chairwoman and Chief Executive Officer of Valmo Ventures (a consulting and investment firm). Founder of Upward Wealth, Inc., dba BrightUp, a fintech platform. Formerly, Partner and Senior Vice President, Portfolio Manager and Investment Strategist at Wellington Management Company, LLP (investment management firm) (1992-2012). Formerly, Chief Investment Officer, PG Corbin Asset Management (1990-1992). Formerly worked in institutional corporate bond sales at Kidder Peabody (1986-1990).
Other Directorships. Director of DraftKings, Inc. (digital sports entertainment and gaming company) (since September 2020). Director of Envestnet, Inc. (provider of intelligent systems for wealth management and financial wellness) (since 2018). Formerly, Director of Dynex Capital, Inc. (mortgage REIT) (2013-2020) and Director of Groupon, Inc. (e-commerce provider) (2020-2022). |
Keith Quinton
1958 | Trustee | Since 2018 | Private investor, researcher and lecturer. Formerly, Independent Investment Committee Member at New Hampshire Retirement System (2017-2021). Formerly, Portfolio Manager and Senior Quantitative Analyst at Fidelity Investments (investment management firm) (2001-2014).
Other Directorships. Formerly, Director (2016-2021) and Chairman (2019-2021) of New Hampshire Municipal Bond Bank. |
Marcus L. Smith
1966 | Trustee | Since 2018 | Private investor and independent corporate director. Formerly, Chief Investment Officer, Canada (2012-2017), Chief Investment Officer, Asia (2010-2012), Director of Asian Research (2004-2010) and portfolio manager (2001-2017) at MFS Investment Management (investment management firm).
Other Directorships. Director of First Industrial Realty Trust, Inc. (an industrial REIT) (since 2021). Director of MSCI Inc. (global provider of investment decision support tools) (since 2017). Formerly, Director of DCT Industrial Trust Inc. (logistics real estate company) (2017-2018). |
Susan J. Sutherland
1957 | Trustee | Since 2015 | Private investor. Director of Ascot Group Limited and certain of its subsidiaries (insurance and reinsurance) (since 2017). Formerly, Director of Hagerty Holding Corp. (insurance) (2015-2018) and Montpelier Re Holdings Ltd. (insurance and reinsurance) (2013-2015). Formerly, Associate, Counsel and Partner at Skadden, Arps, Slate, Meagher & Flom LLP (law firm) (1982-2013).
Other Directorships. Formerly, Director of Kairos Acquisition Corp. (insurance/InsurTech acquisition company) (2021-2023). |
Scott E. Wennerholm
1959 | Trustee | Since 2016 | Private investor. Formerly, Trustee at Wheelock College (postsecondary institution) (2012-2018). Formerly, Consultant at GF Parish Group (executive recruiting firm) (2016-2017). Formerly, Chief Operating Officer and Executive Vice President at BNY Mellon Asset Management (investment management firm) (2005-2011). Formerly, Chief Operating Officer and Chief Financial Officer at Natixis Global Asset Management (investment management firm) (1997-2004). Formerly, Vice President at Fidelity Investments Institutional Services (investment management firm) (1994-1997).
Other Directorships. None. |
Nancy A. Wiser
1967 | Trustee | Since 2022 | Formerly, Executive Vice President and the Global Head of Operations at Wells Fargo Asset Management (2011-2021).
Other Directorships. None. |
| Name and Year of Birth | Trust/Portfolio
Position(s) | Length of Service | Principal Occupation(s)
During Past Five Years |
| Principal Officers who are not Trustees |
Kenneth A. Topping
1966 | President of the Trust | Since 2023 | Vice President and Chief Administrative Officer of EVM and BMR and Chief Operating Officer for Public Markets at MSIM. Also Vice President of Calvert Research and Management (“CRM”) since 2021. Formerly, Chief Operating Officer for Goldman Sachs Asset Management ‘Classic’ (2009-2020). |
R. Kelly Williams, Jr.
1971 | President of the Portfolio | Since 2023 | President and Chief Operating Officer of Atlanta Capital Management Company, LLC. Officer of 21 registered investment companies managed by Eaton Vance or BMR. |
Deidre E. Walsh
1971 | Vice President and
Chief Legal Officer | Since 2009 | Vice President of EVM and BMR. Also Vice President of CRM. |
Eaton Vance
Tax-Managed Growth Fund 1.1
December 31, 2023
Management and Organization — continued
| Name and Year of Birth | Trust/Portfolio
Position(s) | Length of Service | Principal Occupation(s)
During Past Five Years |
| Principal Officers who are not Trustees (continued) |
James F. Kirchner
1967 | Treasurer | Since 2007 | Vice President of EVM and BMR. Also Vice President of CRM. |
Nicholas S. Di Lorenzo
1987 | Secretary | Since 2022 | Formerly, associate (2012-2021) and counsel (2022) at Dechert LLP. |
Laura T. Donovan
1976 | Chief Compliance
Officer | Since 2024 | Vice President of EVM and BMR. |
(1) Ms. Pachnanda began serving as Trustee effective April 1, 2023.
The SAI for the Funds includes additional information about the Trustees and officers of the Funds and can be obtained without charge on Eaton Vance’s website at www.eatonvance.com or by calling 1-800-262-1122.
Eaton Vance
Tax-Managed Growth Fund 1.2
December 31, 2023
Management and Organization
Fund Management. The Trustees of Eaton Vance Mutual Funds Trust (the Trust) and Tax-Managed Growth Portfolio (the Portfolio) are responsible for the overall management and supervision of the Trust's and the Portfolio's affairs. The Board members and officers of the Trust and the Portfolio are listed below. Except as indicated, each individual has held the office shown or other offices in the same company for the last five years. Board members hold indefinite terms of office. Each Trustee holds office until his or her successor is elected and qualified, subject to a prior death, resignation, retirement, disqualification or removal. Under the terms of the Fund's and the Portfolio's current Trustee retirement policy, an Independent Trustee must retire and resign as a Trustee on the earlier of: (i) the first day of July following his or her 74th birthday; or (ii), with limited exception, December 31st of the 20th year in which he or she has served as a Trustee. However, if such retirement and resignation would cause the Fund and the Portfolio to be out of compliance with Section 16 of the 1940 Act or any other regulations or guidance of the SEC, then such retirement and resignation will not become effective until such time as action has been taken for the Fund and the Portfolio to be in compliance therewith. The “noninterested Trustees” consist of those Trustees who are not “interested persons” of the Trust and the Portfolio, as that term is defined under the 1940 Act. The business address of each Board member and officer is Two International Place, Boston, Massachusetts 02110. As used below, “BMR” refers to Boston Management and Research, “EV” refers to EV LLC, “EVM” refers to Eaton Vance Management, “MSIM" refers to Morgan Stanley Investment Management Inc. and “EVD” refers to Eaton Vance Distributors, Inc. EV is the trustee of each of EVM and BMR. Each of EVM, BMR, EVD and EV are indirect, wholly owned subsidiaries of Morgan Stanley. Each officer affiliated with EVM may hold a position with other EVM affiliates that is comparable to his or her position with EVM listed below. Each Trustee oversees 127 funds in the Eaton Vance fund complex (including both funds and portfolios in a hub and spoke structure).
| Name and Year of Birth | Trust/Portfolio
Position(s) | Length of Service | Principal Occupation(s) and Other Directorships
During Past Five Years and Other Relevant Experience |
| Interested Trustee |
Anchal Pachnanda(1)
1980 | Trustee | Since 2023 | Co-Head of Strategy of MSIM (since 2019). Formerly, Head of Strategy of MSIM (2017-2019). Ms. Pachnanda is an interested person because of her position with MSIM, which is an affiliate of the Trust.
Other Directorships. None. |
| Noninterested Trustees |
Alan C. Bowser
1962 | Trustee | Since 2022 | Private investor. Formerly, Chief Diversity Officer, Partner and a member of the Operating Committee, and formerly served as Senior Advisor on Diversity and Inclusion for the firm’s chief executive officer, Co-Head of the Americas Region, and Senior Client Advisor of Bridgewater Associates, an asset management firm (2011- 2023).
Other Directorships. Independent Director of Stout Risius Ross (a middle market professional services advisory firm) (since 2021). |
Mark R. Fetting
1954 | Trustee | Since 2016 | Private investor. Formerly held various positions at Legg Mason, Inc. (investment management firm) (2000-2012), including President, Chief Executive Officer, Director and Chairman (2008-2012), Senior Executive Vice President (2004-2008) and Executive Vice President (2001-2004). Formerly, President of Legg Mason family of funds (2001-2008). Formerly, Division President and Senior Officer of Prudential Financial Group, Inc. and related companies (investment management firm) (1991-2000).
Other Directorships. None. |
Cynthia E. Frost
1961 | Trustee | Since 2014 | Private investor. Formerly, Chief Investment Officer of Brown University (university endowment) (2000-2012). Formerly, Portfolio Strategist for Duke Management Company (university endowment manager) (1995-2000). Formerly, Managing Director, Cambridge Associates (investment consulting company) (1989-1995). Formerly, Consultant, Bain and Company (management consulting firm) (1987-1989). Formerly, Senior Equity Analyst, BA Investment Management Company (1983-1985).
Other Directorships. None. |
George J. Gorman
1952 | Chairperson
of the Board
and Trustee | Since 2021
(Chairperson) and
2014 (Trustee) | Principal at George J. Gorman LLC (consulting firm). Formerly, Senior Partner at Ernst & Young LLP (a registered public accounting firm) (1974-2009).
Other Directorships. None. |
Eaton Vance
Tax-Managed Growth Fund 1.2
December 31, 2023
Management and Organization — continued
| Name and Year of Birth | Trust/Portfolio
Position(s) | Length of Service | Principal Occupation(s) and Other Directorships
During Past Five Years and Other Relevant Experience |
| Noninterested Trustees (continued) |
Valerie A. Mosley
1960 | Trustee | Since 2014 | Chairwoman and Chief Executive Officer of Valmo Ventures (a consulting and investment firm). Founder of Upward Wealth, Inc., dba BrightUp, a fintech platform. Formerly, Partner and Senior Vice President, Portfolio Manager and Investment Strategist at Wellington Management Company, LLP (investment management firm) (1992-2012). Formerly, Chief Investment Officer, PG Corbin Asset Management (1990-1992). Formerly worked in institutional corporate bond sales at Kidder Peabody (1986-1990).
Other Directorships. Director of DraftKings, Inc. (digital sports entertainment and gaming company) (since September 2020). Director of Envestnet, Inc. (provider of intelligent systems for wealth management and financial wellness) (since 2018). Formerly, Director of Dynex Capital, Inc. (mortgage REIT) (2013-2020) and Director of Groupon, Inc. (e-commerce provider) (2020-2022). |
Keith Quinton
1958 | Trustee | Since 2018 | Private investor, researcher and lecturer. Formerly, Independent Investment Committee Member at New Hampshire Retirement System (2017-2021). Formerly, Portfolio Manager and Senior Quantitative Analyst at Fidelity Investments (investment management firm) (2001-2014).
Other Directorships. Formerly, Director (2016-2021) and Chairman (2019-2021) of New Hampshire Municipal Bond Bank. |
Marcus L. Smith
1966 | Trustee | Since 2018 | Private investor and independent corporate director. Formerly, Chief Investment Officer, Canada (2012-2017), Chief Investment Officer, Asia (2010-2012), Director of Asian Research (2004-2010) and portfolio manager (2001-2017) at MFS Investment Management (investment management firm).
Other Directorships. Director of First Industrial Realty Trust, Inc. (an industrial REIT) (since 2021). Director of MSCI Inc. (global provider of investment decision support tools) (since 2017). Formerly, Director of DCT Industrial Trust Inc. (logistics real estate company) (2017-2018). |
Susan J. Sutherland
1957 | Trustee | Since 2015 | Private investor. Director of Ascot Group Limited and certain of its subsidiaries (insurance and reinsurance) (since 2017). Formerly, Director of Hagerty Holding Corp. (insurance) (2015-2018) and Montpelier Re Holdings Ltd. (insurance and reinsurance) (2013-2015). Formerly, Associate, Counsel and Partner at Skadden, Arps, Slate, Meagher & Flom LLP (law firm) (1982-2013).
Other Directorships. Formerly, Director of Kairos Acquisition Corp. (insurance/InsurTech acquisition company) (2021-2023). |
Scott E. Wennerholm
1959 | Trustee | Since 2016 | Private investor. Formerly, Trustee at Wheelock College (postsecondary institution) (2012-2018). Formerly, Consultant at GF Parish Group (executive recruiting firm) (2016-2017). Formerly, Chief Operating Officer and Executive Vice President at BNY Mellon Asset Management (investment management firm) (2005-2011). Formerly, Chief Operating Officer and Chief Financial Officer at Natixis Global Asset Management (investment management firm) (1997-2004). Formerly, Vice President at Fidelity Investments Institutional Services (investment management firm) (1994-1997).
Other Directorships. None. |
Nancy A. Wiser
1967 | Trustee | Since 2022 | Formerly, Executive Vice President and the Global Head of Operations at Wells Fargo Asset Management (2011-2021).
Other Directorships. None. |
| Name and Year of Birth | Trust/Portfolio
Position(s) | Length of Service | Principal Occupation(s)
During Past Five Years |
| Principal Officers who are not Trustees |
Kenneth A. Topping
1966 | President of the Trust | Since 2023 | Vice President and Chief Administrative Officer of EVM and BMR and Chief Operating Officer for Public Markets at MSIM. Also Vice President of Calvert Research and Management (“CRM”) since 2021. Formerly, Chief Operating Officer for Goldman Sachs Asset Management ‘Classic’ (2009-2020). |
R. Kelly Williams, Jr.
1971 | President of the Portfolio | Since 2023 | President and Chief Operating Officer of Atlanta Capital Management Company, LLC. Officer of 21 registered investment companies managed by Eaton Vance or BMR. |
Deidre E. Walsh
1971 | Vice President and
Chief Legal Officer | Since 2009 | Vice President of EVM and BMR. Also Vice President of CRM. |
Eaton Vance
Tax-Managed Growth Fund 1.2
December 31, 2023
Management and Organization — continued
| Name and Year of Birth | Trust/Portfolio
Position(s) | Length of Service | Principal Occupation(s)
During Past Five Years |
| Principal Officers who are not Trustees (continued) |
James F. Kirchner
1967 | Treasurer | Since 2007 | Vice President of EVM and BMR. Also Vice President of CRM. |
Nicholas S. Di Lorenzo
1987 | Secretary | Since 2022 | Formerly, associate (2012-2021) and counsel (2022) at Dechert LLP. |
Laura T. Donovan
1976 | Chief Compliance
Officer | Since 2024 | Vice President of EVM and BMR. |
(1) Ms. Pachnanda began serving as Trustee effective April 1, 2023.
The SAI for the Funds includes additional information about the Trustees and officers of the Funds and can be obtained without charge on Eaton Vance’s website at www.eatonvance.com or by calling 1-800-262-1122.
| FACTS | WHAT DOES EATON VANCE DO WITH YOUR
PERSONAL INFORMATION? |
| Why? | Financial companies choose how they share your personal information. Federal law gives consumers the right to limit some but not all sharing. Federal law also requires us to tell you how we collect, share, and protect your personal information. Please read this notice carefully to understand what we do. |
| |
| What? | The types of personal information we collect and share depend on the product or service you have with us. This information can include:■ Social Security number and income
■ investment experience and risk tolerance
■ checking account number and wire transfer instructions |
| |
| How? | All financial companies need to share customers’ personal information to run their everyday business. In the section below, we list the reasons financial companies can share their customers’ personal information; the reasons Eaton Vance chooses to share; and whether you can limit this sharing. |
Reasons we can share your
personal information | Does Eaton Vance
share? | Can you limit
this sharing? |
| For our everyday business purposes — such as to process your transactions, maintain your account(s), respond to court orders and legal investigations, or report to credit bureaus | Yes | No |
| For our marketing purposes — to offer our products and services to you | Yes | No |
| For joint marketing with other financial companies | No | We don’t share |
| For our investment management affiliates’ everyday business purposes — information about your transactions, experiences, and creditworthiness | Yes | Yes |
| For our affiliates’ everyday business purposes — information about your transactions and experiences | Yes | No |
| For our affiliates’ everyday business purposes — information about your creditworthiness | No | We don’t share |
| For our investment management affiliates to market to you | Yes | Yes |
| For our affiliates to market to you | No | We don’t share |
| For nonaffiliates to market to you | No | We don’t share |
To limit our
sharing | Call toll-free 1-800-262-1122 or email: EVPrivacy@eatonvance.comPlease note:If you are a new customer, we can begin sharing your information 30 days from the date we sent this notice. When you are no longer our customer, we continue to share your information as described in this notice. However, you can contact us at any time to limit our sharing. |
| Questions? | Call toll-free 1-800-262-1122 or email: EVPrivacy@eatonvance.com |
| Privacy Notice — continued | April 2021 |
| Who we are |
| Who is providing this notice? | Eaton Vance Management, Eaton Vance Distributors, Inc., Eaton Vance Trust Company, Eaton Vance Management (International) Limited, Eaton Vance Advisers International Ltd., Eaton Vance Global Advisors Limited, Eaton Vance Management’s Real Estate Investment Group, Boston Management and Research, Calvert Research and Management, Eaton Vance and Calvert Fund Families and our investment advisory affiliates (“Eaton Vance”) (see Investment Management Affiliates definition below) |
| What we do |
How does Eaton Vance
protect my personal
information? | To protect your personal information from unauthorized access and use, we use security measures that comply with federal law. These measures include computer safeguards and secured files and buildings. We have policies governing the proper handling of customer information by personnel and requiring third parties that provide support to adhere to appropriate security standards with respect to such information. |
How does Eaton Vance
collect my personal
information? | We collect your personal information, for example, when you■ open an account or make deposits or withdrawals from your account
■ buy securities from us or make a wire transfer
■ give us your contact informationWe also collect your personal information from others, such as credit bureaus, affiliates, or other companies. |
| Why can’t I limit all sharing? | Federal law gives you the right to limit only■ sharing for affiliates’ everyday business purposes — information about your creditworthiness
■ affiliates from using your information to market to you
■ sharing for nonaffiliates to market to youState laws and individual companies may give you additional rights to limit sharing. See below for more on your rights under state law. |
| Definitions |
Investment Management
Affiliates | Eaton Vance Investment Management Affiliates include registered investment advisers, registered broker- dealers, and registered and unregistered funds. Investment Management Affiliates does not include entities associated with Morgan Stanley Wealth Management, such as Morgan Stanley Smith Barney LLC and Morgan Stanley & Co. |
| Affiliates | Companies related by common ownership or control. They can be financial and nonfinancial companies.■ Our affiliates include companies with a Morgan Stanley name and financial companies such as Morgan Stanley Smith Barney LLC and Morgan Stanley & Co. |
| Nonaffiliates | Companies not related by common ownership or control. They can be financial and nonfinancial companies.■ Eaton Vance does not share with nonaffiliates so they can market to you. |
| Joint marketing | A formal agreement between nonaffiliated financial companies that together market financial products or services to you.■ Eaton Vance doesn’t jointly market. |
| Other important information |
| Vermont: Except as permitted by law, we will not share personal information we collect about Vermont residents with Nonaffiliates unless you provide us with your written consent to share such information.California: Except as permitted by law, we will not share personal information we collect about California residents with Nonaffiliates and we will limit sharing such personal information with our Affiliates to comply with California privacy laws that apply to us. |
Delivery of Shareholder Documents. The Securities and Exchange Commission (SEC) permits funds to deliver only one copy of shareholder documents, including prospectuses, proxy statements and shareholder reports, to fund investors with multiple accounts at the same residential or post office box address. This practice is often called “householding” and it helps eliminate duplicate mailings to shareholders. Eaton Vance, or your financial intermediary, may household the mailing of your documents indefinitely unless you instruct Eaton Vance, or your financial intermediary, otherwise. If you would prefer that your Eaton Vance documents not be householded, please contact Eaton Vance at 1-800-262-1122, or contact your financial intermediary. Your instructions that householding not apply to delivery of your Eaton Vance documents will typically be effective within 30 days of receipt by Eaton Vance or your financial intermediary.
Portfolio Holdings. Each Eaton Vance Fund and its underlying Portfolio(s) (if applicable) files a schedule of portfolio holdings on Part F to Form N-PORT with the SEC. Certain information filed on Form N-PORT may be viewed on the Eaton Vance website at www.eatonvance.com, by calling Eaton Vance at 1-800-262-1122 or in the EDGAR database on the SEC’s website at www.sec.gov.
Proxy Voting. From time to time, funds are required to vote proxies related to the securities held by the funds. The Eaton Vance Funds or their underlying Portfolios (if applicable) vote proxies according to a set of policies and procedures approved by the Funds’ and Portfolios’ Boards. You may obtain a description of these policies and procedures and information on how the Funds or Portfolios voted proxies relating to portfolio securities during the most recent 12-month period ended June 30, without charge, upon request, by calling 1-800-262-1122 and by accessing the SEC’s website at www.sec.gov.
Tailored Shareholder Reports. Effective January 24, 2023, the SEC adopted rule and form amendments to require open-end mutual funds and ETFs to transmit concise and visually engaging streamlined annual and semiannual reports to shareholders that highlight key information. Other information, including financial statements, will no longer appear in a streamlined shareholder report but must be available online, delivered free of charge upon request, and filed on a semiannual basis on Form N-CSR. The rule and form amendments have a compliance date of July 24, 2024. At this time, management is evaluating the impact of these amendments on the shareholder reports for the Eaton Vance Funds.
This Page Intentionally Left Blank
Investment Adviser of Tax-Managed Growth Portfolio
Boston Management and Research
Two International Place
Boston, MA 02110
Investment Adviser and Administrator of Eaton Vance
Tax-Managed Growth Funds 1.1 and 1.2
Eaton Vance Management
Two International Place
Boston, MA 02110
Principal Underwriter*
Eaton Vance Distributors, Inc.
Two International Place
Boston, MA 02110
(617) 482-8260
Custodian
State Street Bank and Trust Company
One Congress Street, Suite 1
Boston, MA 02114-2016
Transfer Agent
BNY Mellon Investment Servicing (US) Inc.
Attn: Eaton Vance Funds
P.O. Box 534439
Pittsburgh, PA 15253-4439
(800) 262-1122
Independent Registered Public Accounting Firm
Deloitte & Touche LLP
200 Berkeley Street
Boston, MA 02116-5022
Fund Offices
Two International Place
Boston, MA 02110
* FINRA BrokerCheck. Investors may check the background of their Investment Professional by contacting the Financial Industry Regulatory Authority (FINRA). FINRA BrokerCheck is a free tool to help investors check the professional background of current and former FINRA-registered securities firms and brokers. FINRA BrokerCheck is available by calling 1-800-289-9999 and at www.FINRA.org. The FINRA BrokerCheck brochure describing this program is available to investors at www.FINRA.org.
Parametric
Commodity Strategy Fund
Annual Report
December 31, 2023
Commodity Futures Trading Commission Registration. The Commodity Futures Trading Commission (“CFTC”) has adopted regulations that subject registered investment companies and advisers to regulation by the CFTC if a fund invests more than a prescribed level of its assets in certain CFTC-regulated instruments (including futures, certain options and swap agreements) or markets itself as providing investment exposure to such instruments. The adviser and Parametric Portfolio Associates LLC (Parametric), the sub-adviser to the Fund, are registered with the CFTC as commodity pool operators and commodity trading advisors. As the “commodity pool operator” of the Fund, the adviser has claimed relief under the Commodity Exchange Act from certain reporting and recordkeeping requirements.
Fund shares are not insured by the FDIC and are not deposits or other obligations of, or guaranteed by, any depository institution. Shares are subject to investment risks, including possible loss of principal invested.
This report must be preceded or accompanied by a current summary prospectus or prospectus. Before investing, investors should consider carefully the investment objective, risks, and charges and expenses of a mutual fund. This and other important information is contained in the summary prospectus and prospectus, which can be obtained from a financial intermediary. Prospective investors should read the prospectus carefully before investing. For further information, please call 1-800-260-0761.
Annual Report December 31, 2023
Parametric
Commodity Strategy Fund
Parametric
Commodity Strategy Fund
December 31, 2023
Management’s Discussion of Fund Performance†
Economic and Market Conditions
The commodity asset class declined in value in 2023, hampered by reduced global demand for certain commodities and tight monetary conditions by the U.S. Federal Reserve (the Fed) and other central banks worldwide. For the 12-month period ended December 31, 2023, the Bloomberg Commodity Index Total Return (the Index) returned -7.91%.
Losses in the energy and grains sectors proved too much to overcome, despite pockets of strength in precious metals and soft commodities during the period.
Crude oil prices ended 2023 effectively where they began. Despite experiencing a fair bit of volatility within the calendar year, crude oil prices rose as high as $94 per barrel in the U.S. during the period, aided by a combination of surprise production cuts by OPEC+ countries and mounting geopolitical turmoil. A wave of bearish oil demand indicators brought prices back down in the fourth quarter.
Natural gas was a notable drag on sector performance, crashing a staggering -50% in the first quarter of 2023 alone. Consecutive warmer-than-average winter seasons left natural gas inventories at their highest levels since 2019.
Conversely, the price of precious metals -- particularly gold -- rose during the period. A regional banking crisis in the U.S. and multiple military conflicts globally boosted demand for so-called “safe haven” precious metals. Further benefiting the precious metals sector was the moderating pace of inflation and the market’s expectation of a dovish pivot in monetary policy by the Fed. Historically, lower interest rates have been viewed as a positive sign for non-interest-bearing precious metals.
For the period as a whole, performance in the agriculture sector diverged significantly, with soft commodity prices rising, while grain prices fell during the period. Supply bottlenecks in key growing regions of India, West Africa, and Brazil proved to be a boon for the price of sugar, cocoa, and coffee. Meanwhile, wheat and corn prices sank as bumper harvests in parts of the Northern Hemisphere more than offset tensions in the Black Sea region, signaling some easing of global food inflation.
Fund Performance
For the 12-month period ended December 31, 2023, Parametric Commodity Strategy Fund (the Fund) returned -4.86% for Class A shares at net asset value (NAV), outperforming its benchmark, the Bloomberg Commodity Index Total Return (the Index), which returned -7.91%.
The Fund’s inclusion of cocoa contributed to performance relative to the Index during the period. Cocoa prices surged to a nearly 50-year high as poor weather conditions in key growing regions deteriorated crop quality and reduced supply.
The Fund’s overweight exposure to unleaded gasoline also benefitted Index-relative returns. Gasoline prices modestly climbed as automotive fuel demand grew during the robust summer travel season. Additionally, the ownership of longer-dated futures contracts in natural gas contributed to Index-relative returns during the period. This was mainly due to front-month futures trading -- the contract implicitly held by the benchmark -- which significantly underperformed deferred contracts in the first quarter of 2023.
In contrast, a main detractor from the Fund's relative performance versus the Index was its underweight position in gold. Gold prices caught a so-called “safe-haven” bid in March 2023 amid sudden stress in the banking sector, and again in October 2023 following Hamas’s surprise attack on Israel. The Fund’s underweight position in crude oil also hurt Index-relative returns, as the commodity outperformed the broad Index during the period.
Additionally, the Fund’s overweight exposure to nickel detracted from Index-relative returns during the period.
See Endnotes and Additional Disclosures in this report.
Past performance is no guarantee of future results. Returns are historical and are calculated by determining the percentage change in net asset value (NAV) or offering price (as applicable) with all distributions reinvested. Furthermore, returns do not reflect the deduction of taxes that shareholders may have to pay on Fund distributions or upon the redemption of Fund shares. Investment return and principal value will fluctuate so that shares, when redeemed, may be worth more or less than their original cost. Performance for periods less than or equal to one year is cumulative. Performance is for the stated time period only; due to market volatility, current Fund performance may be lower or higher than the quoted return. For performance as of the most recent month-end, please refer to eatonvance.com.
Parametric
Commodity Strategy Fund
December 31, 2023
Performance
Portfolio Manager(s) Thomas C. Seto and Gregory J. Liebl, CFA, each of Parametric Portfolio Associates LLC
| % Average Annual Total Returns1,2 | Class
Inception Date | Performance
Inception Date | One Year | Five Years | Ten Years |
| Class A at NAV | 01/03/2012 | 05/25/2011 | (4.86)% | 11.16% | 2.11% |
| Class A with 3.25% Maximum Sales Charge | — | — | (7.90) | 10.45 | 1.78 |
| Class I at NAV | 05/25/2011 | 05/25/2011 | (4.69) | 11.42 | 2.35 |
|
| Bloomberg Commodity Index Total Return | — | — | (7.91)% | 7.23% | (1.11)% |
| % Total Annual Operating Expense Ratios3 | Class A | Class I |
| | 0.90% | 0.65% |
Growth of $10,000
This graph shows the change in value of a hypothetical investment of $10,000 in Class A of the Fund for the period indicated. For comparison, the same investment is shown in the indicated index.
| Growth of Investment | Amount Invested | Period Beginning | At NAV | With Maximum Sales Charge |
| Class I, at minimum investment | $1,000,000 | 12/31/2013 | $1,261,309 | N.A. |
See Endnotes and Additional Disclosures in this report.
Past performance is no guarantee of future results. Returns are historical and are calculated by determining the percentage change in net asset value (NAV) or offering price (as applicable) with all distributions reinvested. Furthermore, returns do not reflect the deduction of taxes that shareholders may have to pay on Fund distributions or upon the redemption of Fund shares. Investment return and principal value will fluctuate so that shares, when redeemed, may be worth more or less than their original cost. Performance for periods less than or equal to one year is cumulative. Performance is for the stated time period only; due to market volatility, current Fund performance may be lower or higher than the quoted return. For performance as of the most recent month-end, please refer to eatonvance.com.
Parametric
Commodity Strategy Fund
December 31, 2023
| Commodity Exposure (% of net assets)1 |
| Agriculture | 26.11% |
| Corn | 3.68 |
| Soybeans | 3.64 |
| Soybean Oil | 3.61 |
| Coffee | 3.50 |
| Wheat | 1.89 |
| Cotton | 1.88 |
| Soybean Meal | 1.82 |
| Cocoa | 1.78 |
| Sugar | 1.61 |
| Kansas Wheat | 0.96 |
| Robusta Coffee | 0.91 |
| White Sugar | 0.83 |
| Energy | 24.86% |
| Unleaded Gas | 7.16 |
| Natural Gas | 7.10 |
| Heating Oil | 3.52 |
| Gas Oil | 3.51 |
| Crude Oil-Brent | 1.79 |
| Crude Oil-WTI | 1.78 |
| Industrial Metals | 24.73% |
| Aluminum | 7.29 |
| Copper | 7.28 |
| Zinc | 3.69 |
| Nickel | 3.67 |
| Lead | 1.86 |
| Tin | 0.94 |
| Precious Metals | 18.05% |
| Gold | 7.31 |
| Silver | 7.20 |
| Platinum | 1.86 |
| Palladium | 1.68 |
| Livestock | 6.36% |
| Live Cattle | 3.68 |
| Lean Hogs | 1.77 |
| Feeder Cattle | 0.91 |
| Asset Allocation (% of net assets)2,3 |
Footnotes:
| 1 | Commodity Exposure reflects the Fund’s net exposure to commodities through its investment in commodity futures contracts and commodity exchange-traded funds. |
| 2 | Other Net Assets represents other assets less liabilities and includes any investment type that represents less than 1% of net assets. |
| 3 | Short-Term Investments are held as collateral for the Fund’s futures contracts positions. |
See Endnotes and Additional Disclosures in this report.
Parametric
Commodity Strategy Fund
December 31, 2023
Endnotes and Additional Disclosures
| † | The views expressed in this report are those of the portfolio manager(s) and are current only through the date stated at the top of this page. These views are subject to change at any time based upon market or other conditions, and Eaton Vance and the Fund(s) disclaim any responsibility to update such views. These views may not be relied upon as investment advice and, because investment decisions are based on many factors, may not be relied upon as an indication of trading intent on behalf of any Eaton Vance fund. This commentary may contain statements that are not historical facts, referred to as “forward-looking statements.” The Fund’s actual future results may differ significantly from those stated in any forward-looking statement, depending on factors such as changes in securities or financial markets or general economic conditions, the volume of sales and purchases of Fund shares, the continuation of investment advisory, administrative and service contracts, and other risks discussed from time to time in the Fund’s filings with the Securities and Exchange Commission. |
| | |
| 1 | Bloomberg Commodity Index Total Return is designed to provide diversified commodity exposure, with weightings based on each underlying commodity’s liquidity and economic significance. Unless otherwise stated, index returns do not reflect the effect of any applicable sales charges, commissions, expenses, taxes or leverage, as applicable. It is not possible to invest directly in an index. |
| 2 | Total Returns at NAV do not include applicable sales charges. If sales charges were deducted, the returns would be lower. Total Returns shown with maximum sales charge reflect the stated maximum sale charge. Unless otherwise stated, performance does not reflect the deduction of taxes on Fund distributions or redemptions of Fund shares.Performance prior to the inception date of a class may be linked to the performance of an older class of the Fund. This linked performance is adjusted for any applicable sales charge, but is not adjusted for class expense differences. If adjusted for such differences, the performance would be different. |
| 3 | Source: Fund prospectus. The expense ratios for the current reporting period can be found in the Financial Highlights section of this report. Performance reflects expenses waived and/or reimbursed, if applicable. Without such waivers and/or reimbursements, performance would have been lower. |
| | Fund profile subject to change due to active management. |
Parametric
Commodity Strategy Fund
December 31, 2023
Example
As a Fund shareholder, you incur two types of costs: (1) transaction costs, including sales charges (loads) on purchases; and (2) ongoing costs, including management fees; distribution and/or service fees; and other Fund expenses. This Example is intended to help you understand your ongoing costs (in dollars) of Fund investing and to compare these costs with the ongoing costs of investing in other mutual funds. The Example is based on an investment of $1,000 invested at the beginning of the period and held for the entire period (July 1, 2023 to December 31, 2023).
Actual Expenses
The first section of the table below provides information about actual account values and actual expenses. You may use the information in this section, together with the amount you invested, to estimate the expenses that you paid over the period. Simply divide your account value by $1,000 (for example, an $8,600 account value divided by $1,000 = 8.6), then multiply the result by the number in the first section under the heading entitled “Expenses Paid During Period” to estimate the expenses you paid on your account during this period.
Hypothetical Example for Comparison Purposes
The second section of the table below provides information about hypothetical account values and hypothetical expenses based on the actual Fund expense ratio and an assumed rate of return of 5% per year (before expenses), which is not the actual Fund return. The hypothetical account values and expenses may not be used to estimate the actual ending account balance or expenses you paid for the period. You may use this information to compare the ongoing costs of investing in your Fund and other funds. To do so, compare this 5% hypothetical example with the 5% hypothetical examples that appear in the shareholder reports of the other funds.
Please note that the expenses shown in the table are meant to highlight your ongoing costs only and do not reflect any transactional costs, such as sales charges (loads). Therefore, the second section of the table is useful in comparing ongoing costs only, and will not help you determine the relative total costs of owning different funds. In addition, if these transactional costs were included, your costs would be higher.
| | Beginning
Account Value
(7/1/23) | Ending
Account Value
(12/31/23) | Expenses Paid
During Period*
(7/1/23 – 12/31/23) | Annualized
Expense
Ratio |
| Actual | | | | |
| Class A | $1,000.00 | $1,005.00 | $4.70 | 0.93% |
| Class I | $1,000.00 | $1,006.20 | $3.44 | 0.68% |
| |
| Hypothetical | | | | |
| (5% return per year before expenses) | | | | |
| Class A | $1,000.00 | $1,020.52 | $4.74 | 0.93% |
| Class I | $1,000.00 | $1,021.78 | $3.47 | 0.68% |
| * | Expenses are equal to the Fund’s annualized expense ratio for the indicated Class, multiplied by the average account value over the period, multiplied by 184/365 (to reflect the one-half year period). The Example assumes that the $1,000 was invested at the net asset value per share determined at the close of business on June 30, 2023. |
Parametric
Commodity Strategy Fund
December 31, 2023
Consolidated Portfolio of Investments
| Exchange-Traded Funds — 5.4% |
| Security | Shares | Value |
| Equity Funds — 5.4% |
| SPDR Gold MiniShares Trust(1) | | 1,577,000 | $ 64,515,071 |
Total Exchange-Traded Funds
(identified cost $54,345,419) | | | $ 64,515,071 |
| Short-Term Investments — 95.2% |
| Security | Shares | Value |
| Morgan Stanley Institutional Liquidity Funds - Government Portfolio, Institutional Class, 5.27%(2) | | 66,269,993 | $ 66,269,993 |
Total Affiliated Fund
(identified cost $66,269,993) | | | $ 66,269,993 |
| U.S. Treasury Obligations — 89.7% |
| Security | Principal
Amount
(000's omitted) | Value |
| U.S. Treasury Bills: | | | |
| 0.00%, 1/2/24 | $ | 13,750 | $ 13,750,000 |
| 0.00%, 1/4/24 | | 18,000 | 17,994,774 |
| 0.00%, 1/11/24(3) | | 103,000 | 102,865,537 |
| 0.00%, 1/18/24(3) | | 60,000 | 59,859,296 |
| 0.00%, 1/25/24(3) | | 150,000 | 149,495,174 |
| 0.00%, 2/15/24 | | 13,750 | 13,662,006 |
| 0.00%, 2/29/24 | | 13,750 | 13,633,493 |
| 0.00%, 3/21/24(3) | | 58,750 | 58,081,306 |
| 0.00%, 5/16/24(3) | | 70,000 | 68,659,150 |
| 0.00%, 6/13/24 | | 63,750 | 62,293,457 |
| 0.00%, 7/11/24 | | 18,000 | 17,548,046 |
| 0.00%, 8/8/24 | | 81,750 | 79,400,136 |
| Security | Principal
Amount
(000's omitted) | Value |
| U.S. Treasury Inflation-Indexed Notes:(4) | | | |
| 0.125%, 7/15/24 | $ | 129,577 | $ 127,361,664 |
| 0.50%, 4/15/24 | | 140,291 | 138,524,610 |
| 0.625%, 1/15/24 | | 32,966 | 32,878,051 |
| U.S. Treasury Notes: | | | |
| 0.125%, 1/15/24 | | 36,000 | 35,933,864 |
| 0.125%, 2/15/24 | | 36,000 | 35,776,714 |
| 0.25%, 3/15/24 | | 10,000 | 9,900,489 |
| 0.375%, 8/15/24 | | 13,750 | 13,356,165 |
| 1.25%, 8/31/24 | | 13,750 | 13,413,663 |
| 3.00%, 7/31/24 | | 13,750 | 13,588,177 |
Total U.S. Treasury Obligations
(identified cost $1,078,648,227) | | | $1,077,975,772 |
Total Short-Term Investments
(identified cost $1,144,918,220) | | | $1,144,245,765 |
Total Investments — 100.6%
(identified cost $1,199,263,639) | | | $1,208,760,836 |
| Other Assets, Less Liabilities — (0.6)% | | | $ (7,004,915) |
| Net Assets — 100.0% | | | $1,201,755,921 |
| The percentage shown for each investment category in the Consolidated Portfolio of Investments is based on net assets. |
| (1) | Non-income producing security. |
| (2) | May be deemed to be an affiliated investment company. The rate shown is the annualized seven-day yield as of December 31, 2023. |
| (3) | Security (or a portion thereof) has been pledged as collateral for open futures contracts. |
| (4) | Inflation-linked security whose principal is adjusted for inflation based on changes in the U.S. Consumer Price Index. Interest is calculated based on the inflation-adjusted principal. |
| Futures Contracts |
| Description | Number of
Contracts | Position | Expiration
Date | Notional
Amount | Value/Unrealized
Appreciation
(Depreciation) |
| Commodity Futures | | | | | |
| Brent Crude Oil | 280 | Long | 2/29/24 | $ 21,534,800 | $ 344,644 |
| Cocoa | 510 | Long | 3/13/24 | 21,399,600 | 3,907,738 |
| Coffee | 596 | Long | 3/18/24 | 42,085,050 | 9,313,248 |
| Copper | 451 | Long | 3/26/24 | 43,865,388 | 3,364,212 |
| Corn | 1,875 | Long | 3/14/24 | 44,179,687 | (3,323,425) |
| Cotton No. 2 | 558 | Long | 3/6/24 | 22,599,000 | (1,876,581) |
7
See Notes to Consolidated Financial Statements.
Parametric
Commodity Strategy Fund
December 31, 2023
Consolidated Portfolio of Investments — continued
| Futures Contracts (continued) |
| Description | Number of
Contracts | Position | Expiration
Date | Notional
Amount | Value/Unrealized
Appreciation
(Depreciation) |
| Commodity Futures (continued) | | | | | |
| Feeder Cattle | 98 | Long | 3/28/24 | $ 10,931,900 | $ (860,882) |
| Gold | 112 | Long | 4/26/24 | 23,428,160 | 323,048 |
| Kansas Wheat | 360 | Long | 3/14/24 | 11,556,000 | (802,627) |
| Lean Hogs | 709 | Long | 4/12/24 | 21,227,460 | (317,612) |
| Live Cattle | 642 | Long | 4/30/24 | 44,233,800 | 837,862 |
| LME Copper | 246 | Long | 1/15/24 | 52,204,275 | 3,428,900 |
| LME Copper | 244 | Long | 2/19/24 | 52,023,851 | 1,894,813 |
| LME Copper | 219 | Long | 3/18/24 | 46,841,363 | 1,298,894 |
| LME Lead | 465 | Long | 1/15/24 | 23,764,407 | (962,313) |
| LME Lead | 464 | Long | 2/19/24 | 23,925,000 | (1,350,975) |
| LME Lead | 435 | Long | 3/18/24 | 22,538,438 | 325,570 |
| LME Nickel | 437 | Long | 1/15/24 | 43,092,570 | (5,781,675) |
| LME Nickel | 458 | Long | 2/19/24 | 45,398,334 | (5,114,154) |
| LME Nickel | 457 | Long | 3/18/24 | 45,498,006 | 994,449 |
| LME Primary Aluminum | 1,829 | Long | 1/15/24 | 107,522,338 | 5,078,675 |
| LME Primary Aluminum | 1,777 | Long | 2/19/24 | 105,242,826 | 4,166,813 |
| LME Primary Aluminum | 1,685 | Long | 3/18/24 | 100,299,625 | 9,212,866 |
| LME Tin | 103 | Long | 1/15/24 | 12,988,300 | 605,625 |
| LME Tin | 103 | Long | 2/19/24 | 13,050,100 | 415,345 |
| LME Tin | 94 | Long | 3/18/24 | 11,940,350 | 505,840 |
| LME Zinc | 820 | Long | 1/15/24 | 54,181,501 | 3,261,538 |
| LME Zinc | 797 | Long | 2/19/24 | 52,990,538 | 2,177,300 |
| LME Zinc | 741 | Long | 3/18/24 | 49,341,338 | 4,409,060 |
| Low Sulphur Gasoil | 574 | Long | 3/12/24 | 42,174,650 | (504,349) |
| Natural Gas | 2,245 | Long | 12/27/24 | 85,310,000 | (5,902,908) |
| NY Harbor ULSD | 404 | Long | 2/29/24 | 42,338,553 | (653,971) |
| Palladium | 182 | Long | 3/26/24 | 20,189,260 | (314,058) |
| Platinum | 443 | Long | 4/26/24 | 22,353,780 | 2,263,302 |
| RBOB Gasoline | 964 | Long | 2/29/24 | 86,069,391 | 1,585,863 |
| Robusta Coffee | 386 | Long | 3/22/24 | 10,966,260 | 1,201,834 |
| Silver | 719 | Long | 3/26/24 | 86,589,170 | 9,707,374 |
| Soybean Meal | 566 | Long | 3/14/24 | 21,847,600 | (2,113,295) |
| Soybean Oil | 1,500 | Long | 3/14/24 | 43,362,000 | (1,456,294) |
| Soybeans | 674 | Long | 3/14/24 | 43,742,600 | (2,549,084) |
| Sugar No. 11 | 838 | Long | 2/29/24 | 19,315,565 | (3,216,551) |
| Wheat | 722 | Long | 3/14/24 | 22,670,800 | 1,033,849 |
| White Sugar | 336 | Long | 2/14/24 | 10,016,160 | (2,583,111) |
| WTI Crude Oil | 298 | Long | 2/20/24 | 21,408,320 | 193,250 |
| LME Copper | (246) | Short | 1/15/24 | (52,204,275) | (1,788,266) |
| LME Copper | (244) | Short | 2/19/24 | (52,023,851) | (1,397,663) |
| LME Copper | (15) | Short | 3/18/24 | (3,208,313) | 15,913 |
| LME Lead | (465) | Short | 1/15/24 | (23,764,407) | 1,572,181 |
| LME Lead | (464) | Short | 2/19/24 | (23,925,000) | (287,042) |
8
See Notes to Consolidated Financial Statements.
Parametric
Commodity Strategy Fund
December 31, 2023
Consolidated Portfolio of Investments — continued
| Futures Contracts (continued) |
| Description | Number of
Contracts | Position | Expiration
Date | Notional
Amount | Value/Unrealized
Appreciation
(Depreciation) |
| Commodity Futures (continued) | | | | | |
| LME Lead | (5) | Short | 3/18/24 | $ (259,063) | $ (688) |
| LME Nickel | (437) | Short | 1/15/24 | (43,092,570) | 4,849,404 |
| LME Nickel | (458) | Short | 2/19/24 | (45,398,334) | (1,000,959) |
| LME Nickel | (14) | Short | 3/18/24 | (1,393,812) | 19,488 |
| LME Primary Aluminum | (1,829) | Short | 1/15/24 | (107,522,337) | (4,058,722) |
| LME Primary Aluminum | (1,777) | Short | 2/19/24 | (105,242,825) | (9,591,863) |
| LME Primary Aluminum | (213) | Short | 3/18/24 | (12,678,825) | (286,050) |
| LME Tin | (103) | Short | 1/15/24 | (12,988,300) | (390,110) |
| LME Tin | (103) | Short | 2/19/24 | (13,050,100) | (555,355) |
| LME Tin | (5) | Short | 3/18/24 | (635,125) | (8,875) |
| LME Zinc | (820) | Short | 1/15/24 | (54,181,500) | (1,985,937) |
| LME Zinc | (797) | Short | 2/19/24 | (52,990,538) | (4,668,774) |
| LME Zinc | (75) | Short | 3/18/24 | (4,994,063) | (103,388) |
| | | | | | $12,501,341 |
| Abbreviations: |
| LME | – London Metal Exchange |
| RBOB | – Reformulated Blendstock for Oxygenate Blending |
| ULSD | – Ultra-Low Sulfur Diesel |
| WTI | – West Texas Intermediate |
9
See Notes to Consolidated Financial Statements.
Parametric
Commodity Strategy Fund
December 31, 2023
Consolidated Statement of Assets and Liabilities
| | December 31, 2023 |
| Assets | |
| Unaffiliated investments, at value (identified cost $1,132,993,646) | $ 1,142,490,843 |
| Affiliated investments, at value (identified cost $66,269,993) | 66,269,993 |
| Interest receivable | 614,873 |
| Dividends receivable from affiliated investments | 488,220 |
| Receivable for Fund shares sold | 9,820,753 |
| Trustees' deferred compensation plan | 19,988 |
| Total assets | $1,219,704,670 |
| Liabilities | |
| Payable for Fund shares redeemed | $ 12,665,298 |
| Payable for variation margin on open futures contracts | 4,003,600 |
| Payable to affiliates: | |
| Investment adviser and administration fee | 570,428 |
| Distribution and service fees | 23,004 |
| Trustees' fees | 27,125 |
| Trustees' deferred compensation plan | 19,988 |
| Accrued expenses | 639,306 |
| Total liabilities | $ 17,948,749 |
| Net Assets | $1,201,755,921 |
| Sources of Net Assets | |
| Paid-in capital | $ 1,694,632,134 |
| Accumulated loss | (492,876,213) |
| Net Assets | $1,201,755,921 |
| Class A Shares | |
| Net Assets | $ 104,221,854 |
| Shares Outstanding | 17,771,414 |
Net Asset Value and Redemption Price Per Share
(net assets ÷ shares of beneficial interest outstanding) | $ 5.86 |
Maximum Offering Price Per Share
(100 ÷ 96.75 of net asset value per share) | $ 6.06 |
| Class I Shares | |
| Net Assets | $ 1,097,534,067 |
| Shares Outstanding | 185,298,410 |
Net Asset Value, Offering Price and Redemption Price Per Share
(net assets ÷ shares of beneficial interest outstanding) | $ 5.92 |
| On sales of $100,000 or more, the offering price of Class A shares is reduced. |
10
See Notes to Consolidated Financial Statements.
Parametric
Commodity Strategy Fund
December 31, 2023
Consolidated Statement of Operations
| | Year Ended |
| | December 31, 2023 |
| Investment Income | |
| Dividend income from affiliated investments (net of foreign taxes withheld of $397,884) | $ 4,560,602 |
| Interest income | 59,778,498 |
| Total investment income | $ 64,339,100 |
| Expenses | |
| Investment adviser and administration fee | $ 8,113,336 |
| Distribution and service fees: | |
| Class A | 314,146 |
| Trustees’ fees and expenses | 99,229 |
| Custodian fee | 400,564 |
| Transfer and dividend disbursing agent fees | 1,132,955 |
| Legal and accounting services | 129,535 |
| Printing and postage | 155,647 |
| Registration fees | 123,677 |
| Miscellaneous | 75,100 |
| Total expenses | $ 10,544,189 |
| Deduct: | |
| Waiver and/or reimbursement of expenses by affiliates | $ 160,006 |
| Total expense reductions | $ 160,006 |
| Net expenses | $ 10,384,183 |
| Net investment income | $ 53,954,917 |
| Realized and Unrealized Gain (Loss) | |
| Net realized gain (loss): | |
| Investment transactions | $ 1,526,554 |
| Futures contracts | (95,653,981) |
| Net realized loss | $ (94,127,427) |
| Change in unrealized appreciation (depreciation): | |
| Investments | $ 16,125,000 |
| Futures contracts | (54,400,579) |
| Net change in unrealized appreciation (depreciation) | $ (38,275,579) |
| Net realized and unrealized loss | $(132,403,006) |
| Net decrease in net assets from operations | $ (78,448,089) |
11
See Notes to Consolidated Financial Statements.
Parametric
Commodity Strategy Fund
December 31, 2023
Consolidated Statements of Changes in Net Assets
| | Year Ended December 31, |
| | 2023 | 2022 |
| Increase (Decrease) in Net Assets | | |
| From operations: | | |
| Net investment income | $ 53,954,917 | $ 21,168,781 |
| Net realized gain (loss) | (94,127,427) | 207,739,483 |
| Net change in unrealized appreciation (depreciation) | (38,275,579) | (11,162,268) |
| Net increase (decrease) in net assets from operations | $ (78,448,089) | $ 217,745,996 |
| Distributions to shareholders: | | |
| Class A | $ (3,611,212) | $ (19,249,919) |
| Class I | (40,103,075) | (219,962,295) |
| Total distributions to shareholders | $ (43,714,287) | $ (239,212,214) |
| Transactions in shares of beneficial interest: | | |
| Class A | $ (29,164,244) | $ 57,346,413 |
| Class I | (416,072,596) | 280,777,143 |
| Net increase (decrease) in net assets from Fund share transactions | $ (445,236,840) | $ 338,123,556 |
| Net increase (decrease) in net assets | $ (567,399,216) | $ 316,657,338 |
| Net Assets | | |
| At beginning of year | $ 1,769,155,137 | $ 1,452,497,799 |
| At end of year | $1,201,755,921 | $1,769,155,137 |
12
See Notes to Consolidated Financial Statements.
Parametric
Commodity Strategy Fund
December 31, 2023
Consolidated Financial Highlights
| | Class A |
| | Year Ended December 31, |
| | 2023 | 2022 | 2021 | 2020 | 2019 |
| Net asset value — Beginning of year | $ 6.370 | $ 6.260 | $ 5.510 | $ 5.270 | $ 4.880 |
| Income (Loss) From Operations | | | | | |
| Net investment income (loss)(1) | $ 0.210 | $ 0.059 | $ (0.047) | $ (0.002) | $ 0.077 |
| Net realized and unrealized gain (loss) | (0.519) | 0.994 | 1.657 | 0.408 | 0.372 |
| Total income (loss) from operations | $ (0.309) | $ 1.053 | $ 1.610 | $ 0.406 | $ 0.449 |
| Less Distributions | | | | | |
| From net investment income | $ (0.201) | $ (0.943) | $ (0.860) | $ (0.161) | $ (0.059) |
| From net realized gain | — | — | — | (0.005) | — |
| Total distributions | $ (0.201) | $ (0.943) | $ (0.860) | $ (0.166) | $(0.059) |
| Net asset value — End of year | $ 5.860 | $ 6.370 | $ 6.260 | $ 5.510 | $ 5.270 |
| Total Return(2)(3) | (4.86)% | 17.05% | 29.60% | 7.73% | 9.18% |
| Ratios/Supplemental Data | | | | | |
| Net assets, end of year (000's omitted) | $104,222 | $143,687 | $92,413 | $27,473 | $ 9,700 |
| Ratios (as a percentage of average daily net assets): | | | | | |
| Expenses (3) | 0.92% (4) | 0.90% (4) | 0.91% | 0.93% | 0.90% |
| Net investment income (loss) | 3.38% | 0.81% | (0.71)% | (0.03)% | 1.51% |
| Portfolio Turnover | 0% | 20% | 0% | 0% | 0% |
| (1) | Computed using average shares outstanding. |
| (2) | Returns are historical and are calculated by determining the percentage change in net asset value with all distributions reinvested and do not reflect the effect of sales charges, if any. |
| (3) | The investment adviser and administrator and sub-adviser reimbursed certain operating expenses (equal to 0.01%, 0.06% and 0.08% of average daily net assets for the years ended December 31, 2020, 2019 and 2018, respectively). Absent this reimbursement, total return would be lower. |
| (4) | Includes a reduction by the investment adviser of a portion of its adviser and administration fee due to the Fund’s investment in the Liquidity Fund (equal to less than 0.01% and less than 0.005% of average daily net assets for the years ended December 31, 2023 and 2022, respectively.) |
13
See Notes to Consolidated Financial Statements.
Parametric
Commodity Strategy Fund
December 31, 2023
Consolidated Financial Highlights — continued
| | Class I |
| | Year Ended December 31, |
| | 2023 | 2022 | 2021 | 2020 | 2019 |
| Net asset value — Beginning of year | $ 6.440 | $ 6.310 | $ 5.550 | $ 5.310 | $ 4.930 |
| Income (Loss) From Operations | | | | | |
| Net investment income (loss)(1) | $ 0.228 | $ 0.075 | $ (0.031) | $ 0.018 | $ 0.088 |
| Net realized and unrealized gain (loss) | (0.529) | 1.017 | 1.664 | 0.394 | 0.374 |
| Total income (loss) from operations | $ (0.301) | $ 1.092 | $ 1.633 | $ 0.412 | $ 0.462 |
| Less Distributions | | | | | |
| From net investment income | $ (0.219) | $ (0.962) | $ (0.873) | $ (0.167) | $ (0.082) |
| From net realized gain | — | — | — | (0.005) | — |
| Total distributions | $ (0.219) | $ (0.962) | $ (0.873) | $ (0.172) | $ (0.082) |
| Net asset value — End of year | $ 5.920 | $ 6.440 | $ 6.310 | $ 5.550 | $ 5.310 |
| Total Return(2)(3) | (4.69)% | 17.56% | 29.80% | 7.79% | 9.58% |
| Ratios/Supplemental Data | | | | | |
| Net assets, end of year (000’s omitted) | $1,097,534 | $1,625,468 | $1,360,085 | $410,539 | $332,240 |
| Ratios (as a percentage of average daily net assets): | | | | | |
| Expenses (3) | 0.67% (4) | 0.65% (4) | 0.66% | 0.68% | 0.65% |
| Net investment income (loss) | 3.63% | 1.02% | (0.46)% | 0.37% | 1.70% |
| Portfolio Turnover | 0% | 20% | 0% | 0% | 0% |
| (1) | Computed using average shares outstanding. |
| (2) | Returns are historical and are calculated by determining the percentage change in net asset value with all distributions reinvested. |
| (3) | The investment adviser and administrator and sub-adviser reimbursed certain operating expenses (equal to 0.01%, 0.06% and 0.08% of average daily net assets for the years ended December 31, 2020, 2019 and 2018, respectively). Absent this reimbursement, total return would be lower. |
| (4) | Includes a reduction by the investment adviser of a portion of its adviser and administration fee due to the Fund’s investment in the Liquidity Fund (equal to less than 0.01% and less than 0.005% of average daily net assets for the years ended December 31, 2023 and 2022, respectively.) |
14
See Notes to Consolidated Financial Statements.
Parametric
Commodity Strategy Fund
December 31, 2023
Notes to Consolidated Financial Statements
1 Significant Accounting Policies
Parametric Commodity Strategy Fund (the Fund) is a diversified series of Eaton Vance Mutual Funds Trust (the Trust). The Trust is a Massachusetts business trust registered under the Investment Company Act of 1940, as amended (the 1940 Act), as an open-end management investment company. The Fund’s investment objective is to seek total return. The Fund offers two classes of shares. Class A shares are generally sold subject to a sales charge imposed at time of purchase. Class A shares are offered at net asset value to shareholders who owned Investor Class shares, which were redesignated as Class A shares on April 29, 2022, and only for such shareholders’ accounts established prior to such date. Class I shares are sold at net asset value and are not subject to a sales charge. Each class represents a pro rata interest in the Fund, but votes separately on class-specific matters and (as noted below) is subject to different expenses. Realized and unrealized gains and losses and net investment income and losses, other than class-specific expenses, are allocated daily to each class of shares based on the relative net assets of each class to the total net assets of the Fund. Each class of shares differs in its distribution plan and certain other class-specific expenses.
The Fund seeks to gain exposure to the commodity markets, in whole or in part, through investments in PSC Commodity Subsidiary, Ltd. (the Subsidiary), a wholly-owned subsidiary of the Fund organized under the laws of the Cayman Islands with the same objective and investment policies and restrictions as the Fund. The Fund may invest up to 25% of its total assets in the Subsidiary. The net assets of the Subsidiary at December 31, 2023 were $262,926,704 or 21.9% of the Fund’s consolidated net assets. The accompanying consolidated financial statements include the accounts of the Subsidiary. Intercompany balances and transactions have been eliminated in consolidation.
The following is a summary of significant accounting policies of the Fund. The policies are in conformity with accounting principles generally accepted in the United States of America (U.S. GAAP). The Fund is an investment company and follows accounting and reporting guidance in the Financial Accounting Standards Board (FASB) Accounting Standards Codification Topic 946.
A Investment Valuation—The following methodologies are used to determine the market value or fair value of investments.
Debt Obligations. Debt obligations are generally valued on the basis of valuations provided by third party pricing services, as derived from such services’ pricing models. Inputs to the models may include, but are not limited to, reported trades, executable bid and ask prices, broker/dealer quotations, prices or yields of securities with similar characteristics, interest rates, anticipated prepayments, benchmark curves or information pertaining to the issuer, as well as industry and economic events. The pricing services may use a matrix approach, which considers information regarding securities with similar characteristics to determine the valuation for a security. Short-term debt obligations purchased with a remaining maturity of sixty days or less for which a valuation from a third party pricing service is not readily available may be valued at amortized cost, which approximates fair value.
Equity Securities. Equity securities (exchange-traded funds) listed on a U.S. securities exchange generally are valued at the last sale or closing price on the day of valuation or, if no sales took place on such date, at the mean between the closing bid and ask prices on the exchange where such securities are principally traded. Equity securities listed on the NASDAQ National Market System are valued at the NASDAQ official closing price. Unlisted or listed securities for which closing sales prices or closing quotations are not available are valued at the mean between the latest available bid and ask prices.
Derivatives. Futures contracts are valued at the closing settlement price established by the board of trade or exchange on which they are traded.
Other. Investments in management investment companies (including money market funds) that do not trade on an exchange are valued at the net asset value as of the close of each business day.
Fair Valuation. In connection with Rule 2a-5 of the 1940 Act, the Trustees have designated the Fund’s investment adviser as its valuation designee. Investments for which valuations or market quotations are not readily available or are deemed unreliable are valued by the investment adviser, as valuation designee, at fair value using methods that most fairly reflect the security’s “fair value”, which is the amount that the Fund might reasonably expect to receive for the security upon its current sale in the ordinary course. Each such determination is based on a consideration of relevant factors, which are likely to vary from one pricing context to another. These factors may include, but are not limited to, the type of security, the existence of any contractual restrictions on the security’s disposition, the price and extent of public trading in similar securities of the issuer or of comparable companies or entities, quotations or relevant information obtained from broker/dealers or other market participants, information obtained from the issuer, analysts, and/or the appropriate stock exchange (for exchange-traded securities), an analysis of the company’s or entity’s financial statements, and an evaluation of the forces that influence the issuer and the market(s) in which the security is purchased and sold.
B Investment Transactions—Investment transactions for financial statement purposes are accounted for on a trade date basis. Realized gains and losses on investments sold are determined on the basis of identified cost.
C Income—Interest income is recorded on the basis of interest accrued, adjusted for amortization of premium or accretion of discount. Inflation adjustments to the principal amount of inflation-adjusted bonds and notes are reflected as interest income. Deflation adjustments to the principal amount of an inflation-adjusted bond or note are reflected as reductions to interest income to the extent of interest income previously recorded on such bond or note. Dividend income is recorded on the ex-dividend date for dividends received in cash and/or securities. Withholding taxes on dividends have been provided for in accordance with the Fund's understanding of the applicable countries' tax rules and rates.
Parametric
Commodity Strategy Fund
December 31, 2023
Notes to Consolidated Financial Statements — continued
D Federal Taxes—The Fund’s policy is to comply with the provisions of the Internal Revenue Code applicable to regulated investment companies and to distribute to shareholders each year substantially all of its net investment income, and all or substantially all of its net realized capital gains. Accordingly, no provision for federal income or excise tax is necessary.
The Subsidiary is treated as a controlled foreign corporation under the Internal Revenue Code and is not expected to be subject to U.S. federal income tax. The Fund is treated as a U.S. shareholder of the Subsidiary. As a result, the Fund is required to include in gross income for U.S. federal tax purposes all of the Subsidiary's income, whether or not such income is distributed by the Subsidiary. If a net loss is realized by the Subsidiary, such loss is not generally available to offset the income earned by the Fund.
As of December 31, 2023, the Fund had no uncertain tax positions that would require financial statement recognition, de-recognition, or disclosure. The Fund files a U.S. federal income tax return annually after its fiscal year-end, which is subject to examination by the Internal Revenue Service for a period of three years from the date of filing.
E Expenses—The majority of expenses of the Trust are directly identifiable to an individual fund. Expenses which are not readily identifiable to a specific fund are allocated taking into consideration, among other things, the nature and type of expense and the relative size of the funds.
F Use of Estimates—The preparation of the consolidated financial statements in conformity with U.S. GAAP requires management to make estimates and assumptions that affect the reported amounts of assets and liabilities at the date of the consolidated financial statements and the reported amounts of income and expense during the reporting period. Actual results could differ from those estimates.
G Indemnifications — Under the Trust’s organizational documents, its officers and Trustees may be indemnified against certain liabilities and expenses arising out of the performance of their duties to the Fund. Under Massachusetts law, if certain conditions prevail, shareholders of a Massachusetts business trust (such as the Trust) could be deemed to have personal liability for the obligations of the Trust. However, the Trust’s Declaration of Trust contains an express disclaimer of liability on the part of Fund shareholders and the By-laws provide that the Trust shall assume, upon request by the shareholder, the defense on behalf of any Fund shareholders. Moreover, the By-laws also provide for indemnification out of Fund property of any shareholder held personally liable solely by reason of being or having been a shareholder for all loss or expense arising from such liability. Additionally, in the normal course of business, the Fund enters into agreements with service providers that may contain indemnification clauses. The Fund’s maximum exposure under these arrangements is unknown as this would involve future claims that may be made against the Fund that have not yet occurred.
H Futures Contracts—Upon entering into a futures contract, the Fund is required to deposit with the broker, either in cash or securities, an amount equal to a certain percentage of the contract amount (initial margin). Subsequent payments, known as variation margin, are made or received by the Fund each business day (except for futures contracts traded on the London Metal Exchange, which make payments at contract expiration), depending on the daily fluctuations in the value of the underlying security, commodity or currency, and are recorded as unrealized gains or losses by the Fund. Gains (losses) are realized upon the expiration or closing of the futures contracts. Should market conditions change unexpectedly, the Fund may not achieve the anticipated benefits of the futures contracts and may realize a loss. Futures contracts have minimal counterparty risk as they are exchange traded and the clearinghouse for the exchange is substituted as the counterparty, guaranteeing counterparty performance.
2 Distributions to Shareholders and Income Tax Information
It is the present policy of the Fund to make at least one distribution annually (normally in December) of all or substantially all of its net investment income and to distribute annually all or substantially all of its net realized capital gains. Distributions to shareholders are recorded on the ex-dividend date. Distributions are declared separately for each class of shares. Shareholders may reinvest income and capital gain distributions in additional shares of the same class of the Fund at the net asset value as of the ex-dividend date or, at the election of the shareholder, receive distributions in cash. Distributions to shareholders are determined in accordance with income tax regulations, which may differ from U.S. GAAP. As required by U.S. GAAP, only distributions in excess of tax basis earnings and profits are reported in the financial statements as a return of capital. Permanent differences between book and tax accounting relating to distributions are reclassified to paid-in capital. For tax purposes, distributions from short-term capital gains are considered to be from ordinary income.
The tax character of distributions declared for the years ended December 31, 2023 and December 31, 2022 was as follows:
| | Year Ended December 31, |
| | 2023 | 2022 |
| Ordinary income | $43,714,287 | $239,212,214 |
Parametric
Commodity Strategy Fund
December 31, 2023
Notes to Consolidated Financial Statements — continued
During the year ended December 31, 2023, accumulated loss was decreased by $80,262,080 and paid-in capital was decreased by $80,262,080 due to the Fund’s use of equalization accounting and differences between book and tax accounting for the Fund’s investment in the Subsidiary. Tax equalization accounting allows the Fund to treat as a distribution that portion of redemption proceeds representing a redeeming shareholder’s portion of undistributed taxable income and net capital gains. These reclassifications had no effect on the net assets or net asset value per share of the Fund.
As of December 31, 2023, the components of distributable earnings (accumulated loss) on a tax basis were as follows:
| Deferred capital losses | $ (36,302,192) |
| Net unrealized depreciation | (456,574,021) |
| Accumulated loss | $(492,876,213) |
At December 31, 2023, the Fund, for federal income tax purposes, had deferred capital losses of $36,302,192 which would reduce its taxable income arising from future net realized gains on investment transactions, if any, to the extent permitted by the Internal Revenue Code, and thus would reduce the amount of distributions to shareholders, which would otherwise be necessary to relieve the Fund of any liability for federal income or excise tax. The deferred capital losses are treated as arising on the first day of the Fund's next taxable year and retain the same short-term or long-term character as when originally deferred. Of the deferred capital losses at December 31, 2023, $36,302,192 are short-term.
The cost and unrealized appreciation (depreciation) of investments of the Fund, including open derivative contracts and the Fund's investment in the Subsidiary, at December 31, 2023, as determined on a federal income tax basis, were as follows:
| Aggregate cost | $1,365,564,880 |
| Gross unrealized appreciation | $ 379,768 |
| Gross unrealized depreciation | (161,139,958) |
| Net unrealized depreciation | $ (160,760,190) |
3 Investment Adviser and Administration Fee and Other Transactions with Affiliates
The investment adviser and administration fee is earned by Eaton Vance Management (EVM), an indirect, wholly-owned subsidiary of Morgan Stanley, as compensation for investment advisory and administrative services rendered to the Fund and the Subsidiary. The investment adviser and adminstration fee is computed at an annual rate as a percentage of the Fund’s consolidated average daily net assets as follows and is payable monthly:
| Consolidated Average Daily Net Assets | Annual Fee Rate |
| Up to $1 billion | 0.550% |
| $1 billion but less than $2.5 billion | 0.525% |
| $2.5 billion but less than $5 billion | 0.505% |
| $5 billion and over | 0.490% |
For the year ended December 31, 2023, the investment adviser and administration fee amounted to $8,113,336 or 0.54% of the Fund’s consolidated average daily net assets. Pursuant to an investment sub-advisory agreement, EVM has delegated the investment management of the Fund to Parametric Portfolio Associates LLC (Parametric), an affiliate of EVM and an indirect, wholly-owned subsidiary of Morgan Stanley. EVM pays Parametric a portion of its investment adviser and administration fee for sub-advisory services provided to the Fund.
The Fund may invest in a money market fund, the Institutional Class of the Morgan Stanley Institutional Liquidity Funds - Government Portfolio (the “Liquidity Fund”), an open-end management investment company managed by Morgan Stanley Investment Management Inc., a wholly-owned subsidiary of Morgan Stanley. The investment adviser fee paid by the Fund is reduced by an amount equal to its pro rata share of the advisory and administration fees paid by the Fund due to its investment in the Liquidity Fund. For the year ended December 31, 2023, the investment adviser and administration fee paid was reduced by $160,006 relating to the Fund’s investment in the Liquidity Fund.
EVM provides sub-transfer agency and related services to the Fund pursuant to a Sub-Transfer Agency Support Services Agreement. For the year ended December 31, 2023, EVM earned $22,243 from the Fund pursuant to such agreement, which is included in transfer and dividend disbursing agent fees on the Consolidated Statement of Operations. The Fund was informed that Eaton Vance Distributors, Inc. (EVD), an affiliate of EVM and the Fund's
Parametric
Commodity Strategy Fund
December 31, 2023
Notes to Consolidated Financial Statements — continued
principal underwriter, received $1,424 as its portion of the sales charge on sales of Class A shares for the year ended December 31, 2023. EVD also received distribution and service fees from Class A shares (see Note 4).
Trustees and officers of the Fund who are members of EVM’s organization receive remuneration for their services to the Fund out of the investment adviser and administration fee. Trustees of the Fund who are not affiliated with EVM may elect to defer receipt of all or a percentage of their annual fees in accordance with the terms of the Trustees Deferred Compensation Plan. Certain officers and Trustees of the Fund are officers of the above organizations.
4 Distribution Plan
The Fund has in effect a distribution plan for Class A shares (Class A Plan) pursuant to Rule 12b-1 under the 1940 Act. Pursuant to the Class A Plan, the Fund pays EVD a distribution and service fee of 0.25% per annum of its average daily net assets attributable to Class A shares for distribution services and facilities provided to the Fund by EVD, as well as for personal services and/or the maintenance of shareholder accounts. Distribution and service fees paid or accrued to EVD for the year ended December 31, 2023 amounted to $314,146 for Class A shares.
Distribution and service fees are subject to the limitations contained in the Financial Industry Regulatory Authority Rule 2341(d).
5 Contingent Deferred Sales Charges
Class A shares may be subject to a 0.75% contingent deferred sales charge (CDSC) if redeemed within 12 months of purchase (depending on the circumstances of purchase). Redemptions of Class A shares by former Investor Class shareholders are not subject to a CDSC. Generally, the CDSC is based upon the lower of the net asset value at date of redemption or date of purchase. No charge is levied on shares acquired by reinvestment of dividends or capital gain distributions. For the year ended December 31, 2023, the Fund was informed that EVD received no CDSCs paid by Class A shareholders.
6 Purchases and Sales of Investments
There were no purchases of investments, other than short-term obligations, for the year ended December 31, 2023. Sales of investments, other than short-term obligations, aggregated $18,719,646 for the year ended December 31, 2023.
7 Shares of Beneficial Interest
The Fund’s Declaration of Trust permits the Trustees to issue an unlimited number of full and fractional shares of beneficial interest (without par value). Such shares may be issued in a number of different series (such as the Fund) and classes. Transactions in Fund shares were as follows:
| | Year Ended
December 31, 2023 | | Year Ended
December 31, 2022 |
| | Shares | Amount | | Shares | Amount |
| Class A | | | | | |
| Sales | 5,893,400 | $ 36,774,602 | | 25,028,622 | $ 184,940,440 |
| Issued to shareholders electing to receive payments of distributions in Fund shares | 605,339 | 3,559,393 | | 3,006,513 | 18,850,834 |
| Redemptions | (11,269,576) | (69,498,239) | | (20,262,433) | (146,444,861) |
| Net increase (decrease) | (4,770,837) | $ (29,164,244) | | 7,772,702 | $ 57,346,413 |
| Class I | | | | | |
| Sales | 87,143,649 | $ 547,778,007 | | 201,140,323 | $ 1,493,955,145 |
| Issued to shareholders electing to receive payments of distributions in Fund shares | 6,566,252 | 39,003,536 | | 33,183,117 | 210,049,130 |
| Redemptions | (160,884,990) | (1,002,854,139) | | (197,297,429) | (1,423,227,132) |
| Net increase (decrease) | (67,175,089) | $ (416,072,596) | | 37,026,011 | $ 280,777,143 |
8 Financial Instruments
The Fund may trade in financial instruments with off-balance sheet risk in the normal course of its investing activities. These financial instruments may
Parametric
Commodity Strategy Fund
December 31, 2023
Notes to Consolidated Financial Statements — continued
include futures contracts and may involve, to a varying degree, elements of risk in excess of the amounts recognized for financial statement purposes. The notional or contractual amounts of these instruments represent the investment the Fund has in particular classes of financial instruments and do not necessarily represent the amounts potentially subject to risk. The measurement of the risks associated with these instruments is meaningful only when all related and offsetting transactions are considered. A summary of obligations under these financial instruments at December 31, 2023 is included in the Consolidated Portfolio of Investments. At December 31, 2023, the Fund had sufficient cash and/or securities to cover commitments under these contracts.
The Fund is subject to commodity risk in the normal course of pursuing its investment objective. Commodity risk is the risk that the value of a commodity or commodity index will fluctuate based on increases or decreases in the commodities market and factors specific to a particular industry or commodity. The Fund invests primarily in commodities-linked derivative investments, including commodity futures contracts and commodity exchange-traded funds that provide exposure to the investment returns of the commodities markets, without investing directly in physical commodities.
The fair value of open derivative instruments (not considered to be hedging instruments for accounting disclosure purposes) and whose primary underlying risk exposure is commodity risk at December 31, 2023 was as follows:
| | Fair Value |
| Derivative | Asset Derivative | Liability Derivative |
| Futures contracts | $78,308,898 (1) | $(65,807,557) (1) |
| (1) | Amount represents cumulative unrealized appreciation or (depreciation) on futures contracts. Only the variation margin on open futures contracts is reported within the Consolidated Statement of Assets and Liabilities as Receivable or Payable for variation margin on open futures contracts, as applicable. |
The effect of derivative instruments (not considered to be hedging instruments for accounting disclosure purposes) on the Consolidated Statement of Operations and whose primary underlying risk exposure is commodity risk for the year ended December 31, 2023 was as follows:
| Derivative | Realized Gain (Loss)
on Derivatives Recognized
in Income | Change in Unrealized
Appreciation (Depreciation) on
Derivatives Recognized in Income |
| Futures contracts | $(95,653,981) (1) | $(54,400,579) (2) |
| (1) | Consolidated Statement of Operations location: Net realized gain (loss) - Futures contracts. |
| (2) | Consolidated Statement of Operations location: Change in unrealized appreciation (depreciation) - Futures contracts. |
The average notional cost of futures contracts outstanding during the year ended December 31, 2023, which are indicative of the volume of these derivative types, were approximately as follows:
Futures
Contracts — Long | Futures
Contracts — Short |
| $2,135,534,000 | $672,867,000 |
9 Line of Credit
The Fund participates with other portfolios and funds managed by EVM and its affiliates in a $650 million unsecured revolving line of credit agreement with a group of banks, which is in effect through October 22, 2024. In connection with the renewal of the agreement on October 24, 2023, the borrowing limit was decreased from $725 million. Borrowings are made by the Fund solely for temporary purposes related to redemptions and other short-term cash needs. Interest is charged to the Fund based on its borrowings at an amount above either the Secured Overnight Financing Rate (SOFR) or Federal Funds rate. In addition, a fee computed at an annual rate of 0.15% on the daily unused portion of the line of credit is allocated among the participating portfolios and funds at the end of each quarter. In connection with the renewal of the agreement in October 2023, an arrangement fee totaling $150,000 was incurred that was allocated to the participating portfolios and funds. Because the line of credit is not available exclusively to the Fund, it may be unable to borrow some or all of its requested amounts at any particular time. The Fund did not have any significant borrowings or allocated fees during the year ended December 31, 2023.
Parametric
Commodity Strategy Fund
December 31, 2023
Notes to Consolidated Financial Statements — continued
10 Affiliated Investments
At December 31, 2023, the value of the Fund's investment in funds that may be deemed to be affiliated was $66,269,993, which represents 5.5% of the Fund's net assets. Transactions in such investments by the Fund for the year ended December 31, 2023 were as follows:
| Name | Value,
beginning
of period | Purchases | Sales
proceeds | Net
realized
gain (loss) | Change in
unrealized
appreciation
(depreciation) | Value, end
of period | Dividend
income | Shares,
end of period |
| Short-Term Investments |
| Liquidity Fund | $127,956,732 | $3,103,534,316 | $(3,165,221,055) | $ — | $ — | $66,269,993 | $4,560,602 | 66,269,993 |
11 Fair Value Measurements
Under generally accepted accounting principles for fair value measurements, a three-tier hierarchy to prioritize the assumptions, referred to as inputs, is used in valuation techniques to measure fair value. The three-tier hierarchy of inputs is summarized in the three broad levels listed below.
| • | Level 1 – quoted prices in active markets for identical investments |
| • | Level 2 – other significant observable inputs (including quoted prices for similar investments, interest rates, prepayment speeds, credit risk, etc.) |
| • | Level 3 – significant unobservable inputs (including a fund's own assumptions in determining the fair value of investments) |
In cases where the inputs used to measure fair value fall in different levels of the fair value hierarchy, the level disclosed is determined based on the lowest level input that is significant to the fair value measurement in its entirety. The inputs or methodology used for valuing securities are not necessarily an indication of the risk associated with investing in those securities.
At December 31, 2023, the hierarchy of inputs used in valuing the Fund’s investments and open derivative instruments, which are carried at fair value, were as follows:
| Asset Description | Level 1 | Level 2 | Level 3 | Total |
| Exchange-Traded Funds | $ 64,515,071 | $ — | $ — | $ 64,515,071 |
| Short-Term Investments: | | | | |
| Affiliated Fund | 66,269,993 | — | — | 66,269,993 |
| U.S. Treasury Obligations | — | 1,077,975,772 | — | 1,077,975,772 |
| Total Investments | $ 130,785,064 | $ 1,077,975,772 | $ — | $ 1,208,760,836 |
| Futures Contracts | $ 78,308,898 | $ — | $ — | $ 78,308,898 |
| Total | $ 209,093,962 | $ 1,077,975,772 | $ — | $ 1,287,069,734 |
| Liability Description | | | | |
| Futures Contracts | $ (65,807,557) | $ — | $ — | $ (65,807,557) |
| Total | $ (65,807,557) | $ — | $ — | $ (65,807,557) |
Parametric
Commodity Strategy Fund
December 31, 2023
Notes to Consolidated Financial Statements — continued
12 Risks and Uncertainties
Risks Associated with Commodities
The commodities which underlie commodity-linked derivatives in which the Fund invests may be subject to additional economic and non-economic variables, such as drought, floods, weather, livestock disease, embargoes, tariffs, and international economic, political and regulatory developments. These factors may have a larger impact on commodity prices and commodity-linked instruments than on traditional securities. Certain commodities are also subject to limited pricing flexibility because of supply and demand factors. Others are subject to broad price fluctuations as a result of the volatility of the prices for certain raw materials and the instability of supplies of other materials. These additional variables may create additional investment risks which subject the Fund’s investments to greater volatility than investments in traditional securities.
Parametric
Commodity Strategy Fund
December 31, 2023
Report of Independent Registered Public Accounting Firm
To the Trustees of Eaton Vance Mutual Funds Trust and Shareholders of Parametric Commodity Strategy Fund:
Opinion on the Financial Statements and Financial Highlights
We have audited the accompanying consolidated statement of assets and liabilities of Parametric Commodity Strategy Fund and subsidiary (the "Fund") (one of the funds constituting Eaton Vance Mutual Funds Trust), including the consolidated portfolio of investments, as of December 31, 2023, the related consolidated statement of operations for the year then ended, the consolidated statements of changes in net assets for each of the two years in the period then ended, the consolidated financial highlights for each of the five years in the period then ended, and the related notes (collectively referred to as the “financial statements and financial highlights”). In our opinion, the financial statements and financial highlights present fairly, in all material respects, the financial position of the Fund as of December 31, 2023, and the results of its operations for the year then ended, the changes in its net assets for each of the two years in the period then ended, and the financial highlights for each of the five years in the period then ended, in conformity with accounting principles generally accepted in the United States of America.
Basis for Opinion
These financial statements and financial highlights are the responsibility of the Fund's management. Our responsibility is to express an opinion on the Fund's financial statements and financial highlights based on our audits. We are a public accounting firm registered with the Public Company Accounting Oversight Board (United States) (PCAOB) and are required to be independent with respect to the Fund in accordance with the U.S. federal securities laws and the applicable rules and regulations of the Securities and Exchange Commission and the PCAOB.
We conducted our audits in accordance with the standards of the PCAOB. Those standards require that we plan and perform the audit to obtain reasonable assurance about whether the financial statements and financial highlights are free of material misstatement, whether due to error or fraud. The Fund is not required to have, nor were we engaged to perform, an audit of its internal control over financial reporting. As part of our audits, we are required to obtain an understanding of internal control over financial reporting but not for the purpose of expressing an opinion on the effectiveness of the Fund’s internal control over financial reporting. Accordingly, we express no such opinion.
Our audits included performing procedures to assess the risks of material misstatement of the financial statements and financial highlights, whether due to error or fraud, and performing procedures that respond to those risks. Such procedures included examining, on a test basis, evidence regarding the amounts and disclosures in the financial statements and financial highlights. Our audits also included evaluating the accounting principles used and significant estimates made by management, as well as evaluating the overall presentation of the financial statements and financial highlights. Our procedures included confirmation of securities owned as of December 31, 2023, by correspondence with the custodian and brokers; when replies were not received from brokers, we performed other auditing procedures. We believe that our audits provide a reasonable basis for our opinion.
/s/ Deloitte & Touche LLP
Boston, Massachusetts
February 23, 2024
We have served as the auditor of one or more Eaton Vance investment companies since 1959.
Parametric
Commodity Strategy Fund
December 31, 2023
Federal Tax Information (Unaudited)
The Form 1099-DIV you received in February 2024 showed the tax status of all distributions paid to your account in calendar year 2023. Shareholders are advised to consult their own tax adviser with respect to the tax consequences of their investment in the Fund.
Parametric
Commodity Strategy Fund
December 31, 2023
Management and Organization
Fund Management. The Trustees of Eaton Vance Mutual Funds Trust (the Trust) are responsible for the overall management and supervision of the Trust's affairs. The Board members and officers of the Trust are listed below. Except as indicated, each individual has held the office shown or other offices in the same company for the last five years. Board members hold indefinite terms of office. Each Trustee holds office until his or her successor is elected and qualified, subject to a prior death, resignation, retirement, disqualification or removal. Under the terms of the Fund’s current Trustee retirement policy, an Independent Trustee must retire and resign as a Trustee on the earlier of: (i) the first day of July following his or her 74th birthday; or (ii), with limited exception, December 31st of the 20th year in which he or she has served as a Trustee. However, if such retirement and resignation would cause the Fund to be out of compliance with Section 16 of the 1940 Act or any other regulations or guidance of the SEC, then such retirement and resignation will not become effective until such time as action has been taken for the Fund to be in compliance therewith. The “noninterested Trustees” consist of those Trustees who are not “interested persons” of the Trust, as that term is defined under the 1940 Act. The business address of each Board member and officer is Two International Place, Boston, Massachusetts 02110. As used below, “BMR” refers to Boston Management and Research, “EV” refers to EV LLC, “EVM” refers to Eaton Vance Management, “MSIM" refers to Morgan Stanley Investment Management Inc. and “EVD” refers to Eaton Vance Distributors, Inc. EV is the trustee of each of EVM and BMR. Each of EVM, BMR, EVD and EV are indirect, wholly owned subsidiaries of Morgan Stanley. Each officer affiliated with EVM may hold a position with other EVM affiliates that is comparable to his or her position with EVM listed below. Each Trustee oversees 127 funds in the Eaton Vance fund complex (including both funds and portfolios in a hub and spoke structure).
| Name and Year of Birth | Trust
Position(s) | Length of Service | Principal Occupation(s) and Other Directorships
During Past Five Years and Other Relevant Experience |
| Interested Trustee |
Anchal Pachnanda(1)
1980 | Trustee | Since 2023 | Co-Head of Strategy of MSIM (since 2019). Formerly, Head of Strategy of MSIM (2017-2019). Ms. Pachnanda is an interested person because of her position with MSIM, which is an affiliate of the Trust.
Other Directorships. None. |
| Noninterested Trustees |
Alan C. Bowser
1962 | Trustee | Since 2022 | Private investor. Formerly, Chief Diversity Officer, Partner and a member of the Operating Committee, and formerly served as Senior Advisor on Diversity and Inclusion for the firm’s chief executive officer, Co-Head of the Americas Region, and Senior Client Advisor of Bridgewater Associates, an asset management firm (2011-2023).
Other Directorships. Independent Director of Stout Risius Ross (a middle market professional services advisory firm) (since 2021). |
Mark R. Fetting
1954 | Trustee | Since 2016 | Private investor. Formerly held various positions at Legg Mason, Inc. (investment management firm) (2000-2012), including President, Chief Executive Officer, Director and Chairman (2008-2012), Senior Executive Vice President (2004-2008) and Executive Vice President (2001-2004). Formerly, President of Legg Mason family of funds (2001-2008). Formerly, Division President and Senior Officer of Prudential Financial Group, Inc. and related companies (investment management firm) (1991-2000).
Other Directorships. None. |
Cynthia E. Frost
1961 | Trustee | Since 2014 | Private investor. Formerly, Chief Investment Officer of Brown University (university endowment) (2000-2012). Formerly, Portfolio Strategist for Duke Management Company (university endowment manager) (1995-2000). Formerly, Managing Director, Cambridge Associates (investment consulting company) (1989-1995). Formerly, Consultant, Bain and Company (management consulting firm) (1987-1989). Formerly, Senior Equity Analyst, BA Investment Management Company (1983-1985).
Other Directorships. None. |
George J. Gorman
1952 | Chairperson
of the Board
and Trustee | Since 2021
(Chairperson) and
2014 (Trustee) | Principal at George J. Gorman LLC (consulting firm). Formerly, Senior Partner at Ernst & Young LLP (a registered public accounting firm) (1974-2009).
Other Directorships. None. |
Parametric
Commodity Strategy Fund
December 31, 2023
Management and Organization — continued
| Name and Year of Birth | Trust
Position(s) | Length of Service | Principal Occupation(s) and Other Directorships
During Past Five Years and Other Relevant Experience |
| Noninterested Trustees (continued) |
Valerie A. Mosley
1960 | Trustee | Since 2014 | Chairwoman and Chief Executive Officer of Valmo Ventures (a consulting and investment firm). Founder of Upward Wealth, Inc., dba BrightUp, a fintech platform. Formerly, Partner and Senior Vice President, Portfolio Manager and Investment Strategist at Wellington Management Company, LLP (investment management firm) (1992-2012). Formerly, Chief Investment Officer, PG Corbin Asset Management (1990-1992). Formerly worked in institutional corporate bond sales at Kidder Peabody (1986-1990).
Other Directorships. Director of DraftKings, Inc. (digital sports entertainment and gaming company) (since September 2020). Director of Envestnet, Inc. (provider of intelligent systems for wealth management and financial wellness) (since 2018). Formerly, Director of Dynex Capital, Inc. (mortgage REIT) (2013-2020) and Director of Groupon, Inc. (e-commerce provider) (2020-2022). |
Keith Quinton
1958 | Trustee | Since 2018 | Private investor, researcher and lecturer. Formerly, Independent Investment Committee Member at New Hampshire Retirement System (2017-2021). Formerly, Portfolio Manager and Senior Quantitative Analyst at Fidelity Investments (investment management firm) (2001-2014).
Other Directorships. Formerly, Director (2016-2021) and Chairman (2019-2021) of New Hampshire Municipal Bond Bank. |
Marcus L. Smith
1966 | Trustee | Since 2018 | Private investor and independent corporate director. Formerly, Chief Investment Officer, Canada (2012-2017), Chief Investment Officer, Asia (2010-2012), Director of Asian Research (2004-2010) and portfolio manager (2001-2017) at MFS Investment Management (investment management firm).
Other Directorships. Director of First Industrial Realty Trust, Inc. (an industrial REIT) (since 2021). Director of MSCI Inc. (global provider of investment decision support tools) (since 2017). Formerly, Director of DCT Industrial Trust Inc. (logistics real estate company) (2017-2018). |
Susan J. Sutherland
1957 | Trustee | Since 2015 | Private investor. Director of Ascot Group Limited and certain of its subsidiaries (insurance and reinsurance) (since 2017). Formerly, Director of Hagerty Holding Corp. (insurance) (2015-2018) and Montpelier Re Holdings Ltd. (insurance and reinsurance) (2013-2015). Formerly, Associate, Counsel and Partner at Skadden, Arps, Slate, Meagher & Flom LLP (law firm) (1982-2013).
Other Directorships. Formerly, Director of Kairos Acquisition Corp. (insurance/InsurTech acquisition company) (2021-2023). |
Scott E. Wennerholm
1959 | Trustee | Since 2016 | Private investor. Formerly, Trustee at Wheelock College (postsecondary institution) (2012-2018). Formerly, Consultant at GF Parish Group (executive recruiting firm) (2016-2017). Formerly, Chief Operating Officer and Executive Vice President at BNY Mellon Asset Management (investment management firm) (2005-2011). Formerly, Chief Operating Officer and Chief Financial Officer at Natixis Global Asset Management (investment management firm) (1997-2004). Formerly, Vice President at Fidelity Investments Institutional Services (investment management firm) (1994-1997).
Other Directorships. None. |
Nancy A. Wiser
1967 | Trustee | Since 2022 | Formerly, Executive Vice President and the Global Head of Operations at Wells Fargo Asset Management (2011-2021).
Other Directorships. None. |
| Name and Year of Birth | Trust
Position(s) | Length of Service | Principal Occupation(s)
During Past Five Years |
| Principal Officers who are not Trustees |
Kenneth A. Topping
1966 | President | Since 2023 | Vice President and Chief Administrative Officer of EVM and BMR and Chief Operating Officer for Public Markets at MSIM. Also Vice President of Calvert Research and Management (“CRM”) since 2021. Formerly, Chief Operating Officer for Goldman Sachs Asset Management 'Classic’ (2009-2020). |
Deidre E. Walsh
1971 | Vice President and
Chief Legal Officer | Since 2009 | Vice President of EVM and BMR. Also Vice President of CRM. |
James F. Kirchner
1967 | Treasurer | Since 2007 | Vice President of EVM and BMR. Also Vice President of CRM. |
Parametric
Commodity Strategy Fund
December 31, 2023
Management and Organization — continued
| Name and Year of Birth | Trust
Position(s) | Length of Service | Principal Occupation(s)
During Past Five Years |
| Principal Officers who are not Trustees (continued) |
Nicholas S. Di Lorenzo
1987 | Secretary | Since 2022 | Formerly, associate (2012-2021) and counsel (2022) at Dechert LLP. |
Laura T. Donovan
1976 | Chief Compliance
Officer | Since 2024 | Vice President of EVM and BMR. |
(1) Ms. Pachnanda began serving as Trustee effective April 1, 2023.
The SAI for the Fund includes additional information about the Trustees and officers of the Fund and can be obtained without charge on Eaton Vance’s website at www.eatonvance.com or by calling 1-800-260-0761.
| FACTS | WHAT DOES EATON VANCE DO WITH YOUR
PERSONAL INFORMATION? |
| Why? | Financial companies choose how they share your personal information. Federal law gives consumers the right to limit some but not all sharing. Federal law also requires us to tell you how we collect, share, and protect your personal information. Please read this notice carefully to understand what we do. |
| |
| What? | The types of personal information we collect and share depend on the product or service you have with us. This information can include:■ Social Security number and income
■ investment experience and risk tolerance
■ checking account number and wire transfer instructions |
| |
| How? | All financial companies need to share customers’ personal information to run their everyday business. In the section below, we list the reasons financial companies can share their customers’ personal information; the reasons Eaton Vance chooses to share; and whether you can limit this sharing. |
Reasons we can share your
personal information | Does Eaton Vance
share? | Can you limit
this sharing? |
| For our everyday business purposes — such as to process your transactions, maintain your account(s), respond to court orders and legal investigations, or report to credit bureaus | Yes | No |
| For our marketing purposes — to offer our products and services to you | Yes | No |
| For joint marketing with other financial companies | No | We don’t share |
| For our investment management affiliates’ everyday business purposes — information about your transactions, experiences, and creditworthiness | Yes | Yes |
| For our affiliates’ everyday business purposes — information about your transactions and experiences | Yes | No |
| For our affiliates’ everyday business purposes — information about your creditworthiness | No | We don’t share |
| For our investment management affiliates to market to you | Yes | Yes |
| For our affiliates to market to you | No | We don’t share |
| For nonaffiliates to market to you | No | We don’t share |
To limit our
sharing | Call toll-free 1-800-262-1122 or email: EVPrivacy@eatonvance.comPlease note:If you are a new customer, we can begin sharing your information 30 days from the date we sent this notice. When you are no longer our customer, we continue to share your information as described in this notice. However, you can contact us at any time to limit our sharing. |
| Questions? | Call toll-free 1-800-262-1122 or email: EVPrivacy@eatonvance.com |
| Privacy Notice — continued | April 2021 |
| Who we are |
| Who is providing this notice? | Eaton Vance Management, Eaton Vance Distributors, Inc., Eaton Vance Trust Company, Eaton Vance Management (International) Limited, Eaton Vance Advisers International Ltd., Eaton Vance Global Advisors Limited, Eaton Vance Management’s Real Estate Investment Group, Boston Management and Research, Calvert Research and Management, Eaton Vance and Calvert Fund Families and our investment advisory affiliates (“Eaton Vance”) (see Investment Management Affiliates definition below) |
| What we do |
How does Eaton Vance
protect my personal
information? | To protect your personal information from unauthorized access and use, we use security measures that comply with federal law. These measures include computer safeguards and secured files and buildings. We have policies governing the proper handling of customer information by personnel and requiring third parties that provide support to adhere to appropriate security standards with respect to such information. |
How does Eaton Vance
collect my personal
information? | We collect your personal information, for example, when you■ open an account or make deposits or withdrawals from your account
■ buy securities from us or make a wire transfer
■ give us your contact informationWe also collect your personal information from others, such as credit bureaus, affiliates, or other companies. |
| Why can’t I limit all sharing? | Federal law gives you the right to limit only■ sharing for affiliates’ everyday business purposes — information about your creditworthiness
■ affiliates from using your information to market to you
■ sharing for nonaffiliates to market to youState laws and individual companies may give you additional rights to limit sharing. See below for more on your rights under state law. |
| Definitions |
Investment Management
Affiliates | Eaton Vance Investment Management Affiliates include registered investment advisers, registered broker- dealers, and registered and unregistered funds. Investment Management Affiliates does not include entities associated with Morgan Stanley Wealth Management, such as Morgan Stanley Smith Barney LLC and Morgan Stanley & Co. |
| Affiliates | Companies related by common ownership or control. They can be financial and nonfinancial companies.■ Our affiliates include companies with a Morgan Stanley name and financial companies such as Morgan Stanley Smith Barney LLC and Morgan Stanley & Co. |
| Nonaffiliates | Companies not related by common ownership or control. They can be financial and nonfinancial companies.■ Eaton Vance does not share with nonaffiliates so they can market to you. |
| Joint marketing | A formal agreement between nonaffiliated financial companies that together market financial products or services to you.■ Eaton Vance doesn’t jointly market. |
| Other important information |
| Vermont: Except as permitted by law, we will not share personal information we collect about Vermont residents with Nonaffiliates unless you provide us with your written consent to share such information.California: Except as permitted by law, we will not share personal information we collect about California residents with Nonaffiliates and we will limit sharing such personal information with our Affiliates to comply with California privacy laws that apply to us. |
Delivery of Shareholder Documents. The Securities and Exchange Commission (SEC) permits funds to deliver only one copy of shareholder documents, including prospectuses, proxy statements and shareholder reports, to fund investors with multiple accounts at the same residential or post office box address. This practice is often called “householding” and it helps eliminate duplicate mailings to shareholders. Eaton Vance, or your financial intermediary, may household the mailing of your documents indefinitely unless you instruct Eaton Vance, or your financial intermediary, otherwise. If you would prefer that your Eaton Vance documents not be householded, please contact Eaton Vance at 1-800-260-0761, or contact your financial intermediary. Your instructions that householding not apply to delivery of your Eaton Vance documents will typically be effective within 30 days of receipt by Eaton Vance or your financial intermediary.
Portfolio Holdings. Each Eaton Vance Fund and its underlying Portfolio(s) (if applicable) files a schedule of portfolio holdings on Part F to Form N-PORT with the SEC. Certain information filed on Form N-PORT may be viewed on the Eaton Vance website at www.eatonvance.com, by calling Eaton Vance at 1-800-260-0761 or in the EDGAR database on the SEC’s website at www.sec.gov.
Proxy Voting. From time to time, funds are required to vote proxies related to the securities held by the funds. The Eaton Vance Funds or their underlying Portfolios (if applicable) vote proxies according to a set of policies and procedures approved by the Funds’ and Portfolios’ Boards. You may obtain a description of these policies and procedures and information on how the Funds or Portfolios voted proxies relating to portfolio securities during the most recent 12-month period ended June 30, without charge, upon request, by calling 1-800-260-0761 and by accessing the SEC’s website at www.sec.gov.
Tailored Shareholder Reports. Effective January 24, 2023, the SEC adopted rule and form amendments to require open-end mutual funds and ETFs to transmit concise and visually engaging streamlined annual and semiannual reports to shareholders that highlight key information. Other information, including financial statements, will no longer appear in a streamlined shareholder report but must be available online, delivered free of charge upon request, and filed on a semiannual basis on Form N-CSR. The rule and form amendments have a compliance date of July 24, 2024. At this time, management is evaluating the impact of these amendments on the shareholder reports for the Eaton Vance Funds.
This Page Intentionally Left Blank
This Page Intentionally Left Blank
This Page Intentionally Left Blank
Investment Adviser and Administrator
Eaton Vance Management
Two International Place
Boston, MA 02110
Investment Sub-Adviser
Parametric Portfolio Associates LLC
800 Fifth Avenue, Suite 2800
Seattle, WA 98104
Principal Underwriter*
Eaton Vance Distributors, Inc.
Two International Place
Boston, MA 02110
(617) 482-8260
Custodian
State Street Bank and Trust Company
One Congress Street, Suite 1
Boston, MA 02114-2016
Transfer Agent
BNY Mellon Investment Servicing (US) Inc.
Attn: Eaton Vance Funds
P.O. Box 534439
Pittsburgh, PA 15253-4439
(800) 260-0761
Fund Offices
Two International Place
Boston, MA 02110
* FINRA BrokerCheck. Investors may check the background of their Investment Professional by contacting the Financial Industry Regulatory Authority (FINRA). FINRA BrokerCheck is a free tool to help investors check the professional background of current and former FINRA-registered securities firms and brokers. FINRA BrokerCheck is available by calling 1-800-289-9999 and at www.FINRA.org. The FINRA BrokerCheck brochure describing this program is available to investors at www.FINRA.org.
Item 2. Code of Ethics
The registrant (sometimes referred to as the “Fund”) has adopted a code of ethics applicable to its Principal Executive Officer, Principal Financial Officer and Principal Accounting Officer. The registrant undertakes to provide a copy of such code of ethics to any person upon request, without charge, by calling 1-800-262-1122. The registrant has not amended the code of ethics as described in Form N-CSR during the period covered by this report. The registrant has not granted any waiver, including an implicit waiver, from a provision of the code of ethics as described in Form N-CSR during the period covered by this report.
Item 3. Audit Committee Financial Expert
The registrant’s Board of Trustees (the “Board”) has designated George J. Gorman and Scott E. Wennerholm, each an independent trustee, as audit committee financial experts. Mr. Gorman is a certified public accountant who is the Principal at George J. Gorman LLC (a consulting firm). Previously, Mr. Gorman served in various capacities at Ernst & Young LLP (a registered public accounting firm), including as Senior Partner. Mr. Gorman also has experience serving as an independent trustee and audit committee financial expert of other
mutual fund complexes. Mr. Wennerholm is a private investor. Previously, Mr. Wennerholm served as a Trustee at Wheelock College (postsecondary institution), as a Consultant at GF Parish Group (executive recruiting firm), Chief Operating Officer and Executive Vice President at BNY Mellon Asset Management (investment management firm), Chief Operating Officer and Chief Financial Officer at Natixis Global Asset Management (investment management firm), and Vice President at Fidelity Investments Institutional Services (investment management firm).
Item 4. Principal Accountant Fees and Services
Parametric Commodity Strategy Fund, Eaton Vance Stock Fund, Eaton Vance Tax-Managed Growth Fund 1.1 and Eaton Vance Tax-Managed Growth Fund 1.2 (the “Fund(s)”) are series of Eaton Vance Mutual Funds Trust (the “Trust”), a Massachusetts business trust, which, including the Funds, contains a total of 31 series (the “Series”). The Trust is registered under the Investment Company Act of 1940 as an open-end management investment company. This Form N-CSR relates to the Funds’ annual reports.
(a)-(d)
The following tables present the aggregate fees billed to each Fund for the Fund’s fiscal years ended December 31, 2022 and December 31, 2023 by the registrant’s principal accountant, Deloitte & Touche LLP (“D&T”), for professional services rendered for the audit of the Fund’s annual financial statements and fees billed for other services rendered by D&T during such periods.
Parametric Commodity Strategy Fund
| | | | | | | | |
Fiscal Years Ended | | 12/31/22 | | | 12/31/23 | |
Audit Fees | | $ | 68,650 | | | $ | 79,100 | |
Audit-Related Fees(1) | | $ | 0 | | | $ | 0 | |
Tax Fees(2) | | $ | 9,625 | | | $ | 0 | |
All Other Fees(3) | | $ | 0 | | | $ | 0 | |
| | | | | | | | |
Total | | $ | 78,275 | | | $ | 79,100 | |
| | | | | | | | |
Eaton Vance Stock Fund
| | | | | | | | |
Fiscal Years Ended | | 12/31/22 | | | 12/31/23 | |
Audit Fees | | $ | 18,650 | | | $ | 19,100 | |
Audit-Related Fees(1) | | $ | 0 | | | $ | 0 | |
Tax Fees(2) | | $ | 2,175 | | | $ | 0 | |
All Other Fees(3) | | $ | 0 | | | $ | 0 | |
| | | | | | | | |
Total | | $ | 20,825 | | | $ | 19,100 | |
| | | | | | | | |
Eaton Vance Tax-Managed Growth Fund 1.1
| | | | | | | | |
Fiscal Years Ended | | 12/31/22 | | | 12/31/23 | |
Audit Fees | | $ | 21,650 | | | $ | 22,100 | |
Audit-Related Fees(1) | | $ | 0 | | | $ | 0 | |
Tax Fees(2) | | $ | 2,175 | | | $ | 0 | |
All Other Fees(3) | | $ | 0 | | | $ | 0 | |
| | | | | | | | |
Total | | $ | 23,825 | | | $ | 22,100 | |
| | | | | | | | |
Eaton Vance Tax-Managed Growth Fund 1.2
| | | | | | | | |
Fiscal Years Ended | | 12/31/22 | | | 12/31/23 | |
Audit Fees | | $ | 21,650 | | | $ | 22,100 | |
Audit-Related Fees(1) | | $ | 0 | | | $ | 0 | |
Tax Fees(2) | | $ | 2,175 | | | $ | 0 | |
All Other Fees(3) | | $ | 0 | | | $ | 0 | |
| | | | | | | | |
Total | | $ | 23,825 | | | $ | 22,100 | |
| | | | | | | | |
| (1) | Audit-related fees consist of the aggregate fees billed for assurance and related services that are reasonably related to the performance of the audit of financial statements and are not reported under the category of audit fees. |
| (2) | Tax fees consist of the aggregate fees billed for professional services rendered by the principal accountant relating to tax compliance, tax advice, and tax planning and specifically include fees for tax return preparation and other related tax compliance/planning matters. |
| (3) | All other fees consist of the aggregate fees billed for products and services provided by the principal accountant other than audit, audit-related, and tax services. |
The various Series comprising the Trust have differing fiscal year ends (January 31, February 28, September 30, October 31, November 30 or December 31). The following table presents the aggregate audit, audit-related, tax, and other fees billed to all of the Series in the Trust by D&T for the last two fiscal years of each Series.
| | | | | | | | | | | | | | | | | | | | | | | | | | | | | | | | | | | | | | | | | | | | |
Fiscal Years Ended | | 1/31/22 | | | 2/28/22 | | | 9/30/22 | | | 10/31/22 | | | 11/30/22 | | | 12/31/22 | | | 1/31/23 | | | 2/28/23 | | | 9/30/23 | | | 10/31/23 | | | 12/31/23 | |
Audit Fees | | $ | 198,900 | | | $ | 24,050 | | | $ | 104,200 | | | $ | 816,633 | | | $ | 41,150 | | | $ | 130,600 | | | $ | 172,250 | | | $ | 27,150 | | | $ | 117,600 | | | $ | 828,300 | | | $ | 142,400 | |
Audit-Related Fees(1) | | $ | 0 | | | $ | 0 | | | $ | 0 | | | $ | 0 | | | $ | 0 | | | $ | 0 | | | $ | 0 | | | $ | 0 | | | $ | 0 | | | $ | 0 | | | $ | 0 | |
Tax Fees(2) | | $ | 78,353 | | | $ | 8,478 | | | $ | 5,000 | | | $ | 44,100 | | | $ | 0 | | | $ | 16,150 | | | $ | 14,695 | | | $ | 1,650 | | | $ | 0 | | | $ | 0 | | | $ | 0 | |
All Other Fees(3) | | $ | 0 | | | $ | 0 | | | $ | 0 | | | $ | 0 | | | $ | 0 | | | $ | 0 | | | $ | 0 | | | $ | 0 | | | $ | 0 | | | $ | 5,566 | | | $ | 0 | |
| | | | | | | | | | | | | | | | | | | | | | | | | | | | | | | | | | | | | | | | | | | | |
Total | | $ | 277,253 | | | $ | 32,528 | | | $ | 109,200 | | | $ | 860,733 | | | $ | 41,150 | | | $ | 146,750 | | | $ | 186,945 | | | $ | 28,800 | | | $ | 117,600 | | | $ | 833,866 | | | $ | 142,400 | |
| | | | | | | | | | | | | | | | | | | | | | | | | | | | | | | | | | | | | | | | | | | | |
| (1) | Audit-related fees consist of the aggregate fees billed for assurance and related services that are reasonably related to the performance of the audit of financial statements and are not reported under the category of audit fees. |
| (2) | Tax fees consist of the aggregate fees billed for professional services rendered by the principal accountant relating to tax compliance, tax advice, and tax planning and specifically include fees for tax return preparation and other related tax compliance/planning matters. |
| (3) | All other fees consist of the aggregate fees billed for products and services provided by the principal accountant other than audit, audit-related, and tax services. |
(e)(1) The registrant’s audit committee has adopted policies and procedures relating to the pre-approval of services provided by the registrant’s principal accountant (the “Pre-Approval Policies”). The Pre-Approval Policies establish a framework intended to assist the audit committee in the proper discharge of its pre-approval responsibilities. As a general matter, the Pre-Approval Policies (i) specify certain types of audit, audit-related, tax, and other services determined to be pre-approved by the audit committee; and (ii) delineate specific procedures governing the mechanics of the pre-approval process, including the approval and monitoring of audit and non-audit service fees. Unless a service is specifically pre-approved under the Pre-Approval Policies, it must be separately pre-approved by the audit committee.
The Pre-Approval Policies and the types of audit and non-audit services pre-approved therein must be reviewed and ratified by the registrant’s audit committee at least annually. The registrant’s audit committee maintains full responsibility for the appointment, compensation, and oversight of the work of the registrant’s principal accountant.
(e)(2) No services described in paragraphs (b)-(d) above were approved by the registrant’s audit committee pursuant to the “de minimis exception” set forth in Rule 2-01(c)(7)(i)(C) of Regulation S-X.
(f) Not applicable.
(g) The following table presents (i) the aggregate non-audit fees (i.e., fees for audit-related, tax, and other services) billed for services rendered to all of the Series in the Trust by D&T for the last two fiscal years of each Series; and (ii) the aggregate non-audit fees (i.e., fees for audit-related, tax, and other services) billed to the Eaton Vance organization by D&T for the last two fiscal years of each Series.
| | | | | | | | | | | | | | | | | | | | | | | | | | | | | | | | | | | | | | | | | | | | |
Fiscal Years Ended | | 1/31/22 | | | 2/28/22 | | | 9/30/22 | | | 10/31/22 | | | 11/30/22 | | | 12/31/22 | | | 1/31/23 | | | 2/28/23 | | | 9/30/23 | | | 10/31/23 | | | 12/31/23 | |
Registrant(1) | | $ | 78,353 | | | $ | 8,478 | | | $ | 5,000 | | | $ | 44,100 | | | $ | 0 | | | $ | 16,150 | | | $ | 14,695 | | | $ | 4,350 | | | $ | 0 | | | $ | 5,566 | | | $ | 0 | |
Eaton Vance(2) | | $ | 51,800 | | | $ | 51,800 | | | $ | 52,836 | | | $ | 52,836 | | | $ | 52,836 | | | $ | 0 | | | $ | 0 | | | $ | 0 | | | $ | 52,836 | | | $ | 0 | | | $ | 0 | |
| (1) | Includes all of the Series of the Trust. During the fiscal years reported above, certain of the Funds were “feeder” funds in a “master-feeder” fund structure or funds of funds. |
| (2) | Various subsidiaries of Morgan Stanley act in either an investment advisory and/or service provider capacity with respect to the Series and/or their respective “master” funds (if applicable). |
(h) The registrant’s audit committee has considered whether the provision by the registrant’s principal accountant of non-audit services to the registrant’s investment adviser and any entity controlling, controlled by, or under common control with the adviser that provides ongoing services to the registrant that were not pre-approved pursuant to Rule 2-01(c)(7)(ii) of Regulation S-X is compatible with maintaining the principal accountant’s independence.
(i) Not applicable.
(j) Not applicable.
Item 5. Audit Committee of Listed Registrants
Not applicable.
Item 6. Schedule of Investments
Please see schedule of investments contained in the Report to Stockholders included under Item 1 of this Form N-CSR.
Item 7. Disclosure of Proxy Voting Policies and Procedures for Closed-End Management Investment Companies
Not applicable.
Item 8. Portfolio Managers of Closed-End Management Investment Companies
Not applicable.
Item 9. Purchases of Equity Securities by Closed-End Management Investment Company and Affiliated Purchasers
Not applicable.
Item 10. Submission of Matters to a Vote of Security Holders
No material changes.
Item 11. Controls and Procedures
(a) It is the conclusion of the registrant’s principal executive officer and principal financial officer that the effectiveness of the registrant’s current disclosure controls and procedures (such disclosure controls and procedures having been evaluated within 90 days of the date of this filing) provide reasonable assurance that the information required to be disclosed by the registrant has been recorded, processed, summarized and reported within the time period specified in the Commission’s rules and forms and that the information required to be disclosed by the registrant has been accumulated and communicated to the registrant’s principal executive officer and principal financial officer in order to allow timely decisions regarding required disclosure.
(b) There have been no changes in the registrant’s internal controls over financial reporting during the period covered by this report that has materially affected, or is reasonably likely to materially affect, the registrant’s internal control over financial reporting.
Item 12. Disclosure of Securities Lending Activities for Closed-End Management Investment Companies
Not applicable.
Item 13. Exhibits
Signatures
Pursuant to the requirements of the Securities Exchange Act of 1934 and the Investment Company Act of 1940, the registrant has duly caused this report to be signed on its behalf by the undersigned, thereunto duly authorized.
| | |
| Eaton Vance Mutual Funds Trust |
| |
| By: | | /s/ Kenneth A. Topping |
| | Kenneth A. Topping |
| | President |
|
| Date: February 27, 2024 |
Pursuant to the requirements of the Securities Exchange Act of 1934 and the Investment Company Act of 1940, this report has been signed below by the following persons on behalf of the registrant and in the capacities and on the dates indicated.
| | |
| By: | | /s/ James F. Kirchner |
| | James F. Kirchner |
| | Treasurer |
|
| Date: February 27, 2024 |
| | |
| By: | | /s/ Kenneth A. Topping |
| | Kenneth A. Topping |
| | President |
|
| Date: February 27, 2024 |