UNITED STATES
SECURITIES AND EXCHANGE COMMISSION
Washington, D.C. 20549
Form N-CSR
CERTIFIED SHAREHOLDER REPORT OF REGISTERED
MANAGEMENT INVESTMENT COMPANIES
Investment Company Act File Number: 811-04015
Eaton Vance Mutual Funds Trust
(Exact Name of Registrant as Specified in Charter)
One Post Office Square, Boston, Massachusetts 02109
(Address of Principal Executive Offices)
Deidre E. Walsh
One Post Office Square, Boston, Massachusetts 02109
(Name and Address of Agent for Services)
(617) 482-8260
(Registrant’s Telephone Number)
September 30
Date of Fiscal Year End
March 31, 2024
Date of Reporting Period
Item 1. Reports to Stockholders


| % Average Annual Total Returns1,2 | Class Inception Date | Performance Inception Date | Six Months | One Year | Five Years | Ten Years |
| Class A at NAV | 11/17/2009 | 11/17/2009 | 7.57% | 4.39% | 1.37% | 2.90% |
| Class A with 3.25% Maximum Sales Charge | — | — | 4.08 | 0.99 | 0.71 | 2.55 |
| Class C at NAV | 11/17/2009 | 11/17/2009 | 7.18 | 3.52 | 0.62 | 2.28 |
| Class C with 1% Maximum Deferred Sales Charge | — | — | 6.18 | 2.53 | 0.62 | 2.28 |
| Class I at NAV | 11/17/2009 | 11/17/2009 | 7.71 | 4.65 | 1.63 | 3.14 |
| Class R6 at NAV | 06/30/2023 | 11/17/2009 | 7.74 | 4.70 | 1.63 | 3.15 |
| Bloomberg U.S. Aggregate Bond Index | — | — | 5.99% | 1.70% | 0.36% | 1.54% |
| % Total Annual Operating Expense Ratios3 | Class A | Class C | Class I | Class R6 |
| Gross | 0.87% | 1.62% | 0.62% | 0.56% |
| Net | 0.74 | 1.49 | 0.49 | 0.43 |
| Asset Allocation (% of total investments) |

| Credit Quality (% of bond holdings)1 |
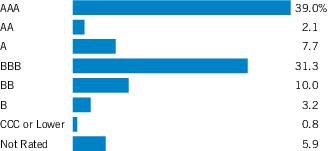
| 1 | For purposes of the Fund’s rating restrictions, ratings are based on Moody’s Investors Service, Inc. (“Moody’s”), S&P Global Ratings (“S&P”) or Fitch Ratings (“Fitch”), or Kroll for securitized debt instruments only (such as asset-backed securities and mortgage-backed securities) as applicable. If securities are rated differently by the ratings agencies, the highest rating is applied. Ratings, which are subject to change, apply to the creditworthiness of the issuers of the underlying securities and not to the Fund or its shares. Credit ratings measure the quality of a bond based on the issuer’s creditworthiness, with ratings ranging from AAA, being the highest, to D, being the lowest based on S&P’s measures. Ratings of BBB or higher by S&P, Fitch or Kroll (Baa or higher by Moody’s) are considered to be investment-grade quality. Credit ratings are based largely on the ratings agency’s analysis at the time of rating. The rating assigned to any particular security is not necessarily a reflection of the issuer’s current financial condition and does not necessarily reflect its assessment of the volatility of a security’s market value or of the liquidity of an investment in the security. Holdings designated as “Not Rated” (if any) are not rated by the national ratings agencies stated above. |
| 1 | Bloomberg U.S. Aggregate Bond Index is an unmanaged index of domestic investment-grade bonds, including corporate, government and mortgage-backed securities. Unless otherwise stated, index returns do not reflect the effect of any applicable sales charges, commissions, expenses, taxes or leverage, as applicable. It is not possible to invest directly in an index. |
| 2 | Total Returns at NAV do not include applicable sales charges. If sales charges were deducted, the returns would be lower. Total Returns shown with maximum sales charge reflect the stated maximum sales charge. Unless otherwise stated, performance does not reflect the deduction of taxes on Fund distributions or redemptions of Fund shares.Effective November 5, 2020, Class C shares automatically convert to Class A shares eight years after purchase. The average annual total returns listed for Class C reflect conversion to Class A shares after eight years. Prior to November 5, 2020, Class C shares automatically converted to Class A shares ten years after purchase.Performance prior to the inception date of a class may be linked to the performance of an older class of the Fund. This linked performance is adjusted for any applicable sales charge, but is not adjusted for class expense differences. If adjusted for such differences, the performance would be different. The performance of Class R6 is linked to Class I. Performance presented in the Financial Highlights included in the financial statements is not linked.Effective May 1, 2015, the Fund changed its investment objective and policies. Prior to May 1, 2015, the Fund invested primarily in Build America Bonds. Performance prior to May 1, 2015 reflects the Fund’s performance under its former investment objective and policies. |
| 3 | Source: Fund prospectus. Net expense ratios reflect a contractual expense reimbursement that continues through 2/1/25. The expense ratios for the current reporting period can be found in the Financial Highlights section of this report. Performance reflects expenses waived and/or reimbursed, if applicable. Without such waivers and/or reimbursements, performance would have been lower. |
| Fund profile subject to change due to active management. |
| Beginning Account Value (10/1/23) | Ending Account Value (3/31/24) | Expenses Paid During Period* (10/1/23 – 3/31/24) | Annualized Expense Ratio | |
| Actual | ||||
| Class A | $1,000.00 | $1,075.70 | $3.89** | 0.75% |
| Class C | $1,000.00 | $1,071.80 | $7.77** | 1.50% |
| Class I | $1,000.00 | $1,077.10 | $2.60** | 0.50% |
| Class R6 | $1,000.00 | $1,077.40 | $2.18** | 0.42% |
| Hypothetical | ||||
| (5% return per year before expenses) | ||||
| Class A | $1,000.00 | $1,021.25 | $3.79** | 0.75% |
| Class C | $1,000.00 | $1,017.50 | $7.57** | 1.50% |
| Class I | $1,000.00 | $1,022.50 | $2.53** | 0.50% |
| Class R6 | $1,000.00 | $1,022.90 | $2.12** | 0.42% |
| * | Expenses are equal to the Fund’s annualized expense ratio for the indicated Class, multiplied by the average account value over the period, multiplied by 183/366 (to reflect the one-half year period). The Example assumes that the $1,000 was invested at the net asset value per share determined at the close of business on September 30, 2023. |
| ** | Absent an allocation of certain expenses to affiliate(s), expenses would be higher. |
| Affiliated Investment Funds — 0.7% |
| Security | Shares | Value | |
| Eaton Vance Emerging Markets Local Income Fund, Class I | 2,992,039 | $ 10,232,773 | |
| Total Affiliated Investment Funds (identified cost $10,351,337) | $ 10,232,773 |
| Asset-Backed Securities — 16.7% |
| Security | Principal Amount (000's omitted) | Value | |
| Aaset Trust, Series 2019-2, Class B, 4.458%, 10/16/39(1) | $ | 3,084 | $ 1,507,514 |
| ACHV ABS Trust: | |||
| Series 2023-1PL, Class B, 6.80%, 3/18/30(1) | 1,435 | 1,437,429 | |
| Series 2023-3PL, Class B, 7.17%, 8/19/30(1) | 2,750 | 2,764,608 | |
| Series 2023-4CP, Class B, 7.24%, 11/25/30(1) | 1,200 | 1,210,413 | |
| AMSR Trust, Series 2021-SFR2, Class F1, 3.275%, 8/17/38(1) | 500 | 452,616 | |
| Avant Credit Card Master Trust, Series 2021-1A, Class A, 1.37%, 4/15/27(1) | 1,450 | 1,400,227 | |
| Avant Loans Funding Trust, Series 2021-REV1, Class D, 4.30%, 7/15/30(1) | 5,213 | 4,870,978 | |
| Battalion CLO 18 Ltd., Series 2024-25A, Class D, 9.622%, (3 mo. SOFR + 4.35%), 3/13/37(1)(2) | 3,000 | 3,007,896 | |
| Benefit Street Partners CLO XXV Ltd., Series 2021-25A, Class B, 7.276%, (3 mo. SOFR + 1.962%), 1/15/35(1)(2) | 3,000 | 3,002,346 | |
| Bridge Trust, Series 2022-SFR1, Class E2, 6.30%, 11/17/37(1) | 8,000 | 7,673,734 | |
| Brookhaven Park CLO Ltd., Series 2024-1A, Class D, (3 mo. SOFR + 3.60%), 4/19/37(1)(2)(3) | 2,500 | 2,509,817 | |
| Bryant Park Funding Ltd., Series 2024-22A, Class D, 9.613%, (3 mo. SOFR + 4.30%), 4/15/37(1)(2) | 3,000 | 3,003,504 | |
| Castlelake Aircraft Structured Trust, Series 2019-1A, Class A, 3.967%, 4/15/39(1) | 7,907 | 7,126,154 | |
| Coinstar Funding LLC, Series 2017-1A, Class A2, 5.216%, 4/25/47(1) | 3,176 | 2,850,505 | |
| Cologix Canadian Issuer LP, Series 2022-1CAN, Class C, 7.74%, 1/25/52(1)(4) | 2,800 | 1,902,772 | |
| Cologix Data Centers U.S. Issuer LLC: | |||
| Series 2021-1A, Class B, 3.79%, 12/26/51(1) | 4,300 | 3,881,585 | |
| Series 2021-1A, Class C, 5.99%, 12/26/51(1) | 2,900 | 2,589,162 | |
| Conn's Receivables Funding LLC: | |||
| Series 2021-A, Class C, 4.59%, 5/15/26(1) | 976 | 974,389 | |
| Series 2022-A, Class B, 9.52%, 12/15/26(1) | 431 | 431,902 | |
| Series 2022-A, Class C, 0.00%, 12/15/26(1) | 3,700 | 3,378,940 | |
| Series 2023-A, Class B, 10.00%, 1/17/28(1) | 3,167 | 3,195,601 | |
| Series 2024-A, Class B, 9.80%, 1/16/29(1) | 3,100 | 3,098,472 | |
| Security | Principal Amount (000's omitted) | Value | |
| Diamond Infrastructure Funding LLC, Series 2021-1A, Class C, 3.475%, 4/15/49(1) | $ | 992 | $ 889,653 |
| Diamond Issuer, Series 2021-1A, Class B, 2.701%, 11/20/51(1) | 1,000 | 854,649 | |
| Driven Brands Funding LLC: | |||
| Series 2018-1A, Class A2, 4.739%, 4/20/48(1) | 2,554 | 2,509,146 | |
| Series 2019-1A, Class A2, 4.641%, 4/20/49(1) | 1,912 | 1,855,126 | |
| Series 2019-2A, Class A2, 3.981%, 10/20/49(1) | 4,108 | 3,869,341 | |
| Dryden 77 CLO Ltd., Series 2020-77A, Class BR, 7.231%, (3 mo. SOFR + 1.912%), 5/20/34(1)(2) | 1,200 | 1,200,052 | |
| Elmwood CLO VIII Ltd., Series 2021-1A, Class DR, 9.128%, (3 mo. SOFR + 3.80%), 4/20/37(1)(2) | 2,500 | 2,504,470 | |
| Empower CLO Ltd., Series 2024-1A, Class D1, 9.061%, (3 mo. SOFR + 3.75%), 4/25/37(1)(2) | 3,000 | 3,017,679 | |
| ExteNet LLC: | |||
| Series 2019-1A, Class A2, 3.204%, 7/25/49(1) | 2,475 | 2,447,137 | |
| Series 2019-1A, Class B, 4.14%, 7/25/49(1) | 3,502 | 3,465,186 | |
| Series 2019-1A, Class C, 5.219%, 7/25/49(1) | 3,040 | 3,008,286 | |
| Falcon Aerospace Ltd.: | |||
| Series 2019-1, Class A, 3.597%, 9/15/39(1) | 1,534 | 1,403,611 | |
| Series 2019-1, Class B, 4.791%, 9/15/39(1) | 4,067 | 3,152,079 | |
| Series 2019-1, Class C, 6.656%, 9/15/39(1) | 3,280 | 1,361,266 | |
| FirstKey Homes Trust: | |||
| Series 2021-SFR1, Class F2, 3.452%, 8/17/38(1) | 3,093 | 2,767,164 | |
| Series 2021-SFR1, Class F3, 3.686%, 8/17/38(1) | 3,615 | 3,200,341 | |
| Series 2021-SFR1, Class G, 3.835%, 8/17/38(1) | 4,949 | 4,318,219 | |
| Series 2021-SFR2, Class G, 3.406%, 9/17/38(1) | 4,000 | 3,530,312 | |
| Series 2021-SFR3, Class G, 3.981%, 12/17/38(1) | 4,000 | 3,549,132 | |
| FMC GMSR Issuer Trust: | |||
| Series 2021-GT1, Class A, 3.62%, 7/25/26(1)(5) | 2,285 | 2,015,728 | |
| Series 2021-GT2, Class A, 3.85%, 10/25/26(1)(5) | 1,690 | 1,497,729 | |
| Series 2022-GT2, Class A, 7.90%, 7/25/27(1) | 6,197 | 6,271,215 | |
| FOCUS Brands Funding LLC: | |||
| Series 2017-1A, Class A2II, 5.093%, 4/30/47(1) | 2,331 | 2,263,145 | |
| Series 2022-1, Class A2, 7.206%, 7/30/52(1) | 1,970 | 1,978,083 | |
| FREED ABS Trust, Series 2022-4FP, Class B, 7.58%, 12/18/29(1) | 313 | 313,487 | |
| GAIA Aviation Ltd., Series 2019-1, Class A, 3.967%, to 15/12/26, 12/15/44(1)(6) | 641 | 598,196 | |
| Galaxy 33 CLO Ltd., Series 2024-33A, Class D1, (3 mo. SOFR + 3.55%), 4/20/37(1)(2)(3) | 1,500 | 1,505,893 | |
| Golub Capital Partners CLO 72 B Ltd., Series 2024-72A, Class D, 9.296%, (3 mo. SOFR + 4.00%), 4/25/37(1)(2) | 3,000 | 3,004,536 | |
| Hertz Vehicle Financing LLC, Series 2021-1A, Class D, 3.98%, 12/26/25(1) | 5,000 | 4,897,370 | |
| Home Partners of America Trust, Series 2021-2, Class F, 3.799%, 12/17/26(1) | 6,730 | 6,030,796 | |
| Security | Principal Amount (000's omitted) | Value | |
| Horizon Aircraft Finance II Ltd., Series 2019-1, Class A, 3.721%, 7/15/39(1) | $ | 1,571 | $ 1,420,939 |
| JPMorgan Chase Bank NA: | |||
| Series 2021-3, Class D, 1.009%, 2/26/29(1) | 248 | 240,468 | |
| Series 2021-3, Class E, 2.102%, 2/26/29(1) | 146 | 142,165 | |
| Loanpal Solar Loan Ltd.: | |||
| Series 2020-2GF, Class C, 3.50%, 7/20/47(1) | 4,994 | 3,069,291 | |
| Series 2020-3GS, Class C, 3.50%, 12/20/47(1) | 4,157 | 2,522,475 | |
| Series 2021-1GS, Class C, 3.50%, 1/20/48(1) | 1,546 | 972,001 | |
| Lunar Aircraft Ltd.: | |||
| Series 2020-1A, Class B, 4.335%, 2/15/45(1) | 505 | 435,059 | |
| Series 2020-1A, Class C, 6.413%, 2/15/45(1) | 324 | 179,000 | |
| Lunar Structured Aircraft Portfolio Notes, Series 2021-1, Class A, 2.636%, 10/15/46(1) | 5,955 | 5,290,985 | |
| Mosaic Solar Loan Trust, Series 2019-2A, Class B, 3.28%, 9/20/40(1) | 1,469 | 1,305,572 | |
| MVW LLC, Series 2020-1A, Class A, 1.74%, 10/20/37(1) | 155 | 145,164 | |
| Neighborly Issuer LLC: | |||
| Series 2021-1A, Class A2, 3.584%, 4/30/51(1) | 2,436 | 2,166,720 | |
| Series 2023-1A, Class A2, 7.308%, 1/30/53(1) | 5,084 | 5,160,926 | |
| NRZ Excess Spread-Collateralized Notes: | |||
| Series 2021-FHT1, Class A, 3.104%, 7/25/26(1) | 232 | 216,256 | |
| Series 2021-GNT1, Class A, 3.474%, 11/25/26(1) | 1,594 | 1,487,059 | |
| OCP CLO Ltd., Series 2024-32A, Class D1, (3 mo. SOFR + 3.75%), 4/23/37(1)(2)(3) | 3,000 | 3,011,778 | |
| Octane Receivables Trust, Series 2022-1, Class A2, 4.18%, 3/20/28(1) | 784 | 777,687 | |
| Oportun Issuance Trust, Series 2021-B, Class A, 1.47%, 5/8/31(1) | 6,725 | 6,380,989 | |
| Pagaya AI Debt Selection Trust: | |||
| Series 2021-2, 3.00%, 1/25/29(1) | 348 | 339,415 | |
| Series 2021-3, Class C, 3.27%, 5/15/29(1) | 2,900 | 2,525,784 | |
| Series 2021-5, Class C, 3.93%, 8/15/29(1) | 4,319 | 3,898,461 | |
| Pagaya AI Technology in Housing Trust, Series 2023-1, Class F, 3.60%, 10/25/40(1) | 1,323 | 947,809 | |
| Palmer Square CLO Ltd., Series 2018-1A, Class CR, 9.224%, (3 mo. SOFR + 3.90%), 4/18/37(1)(2) | 3,000 | 3,008,346 | |
| Planet Fitness Master Issuer LLC, Series 2019-1A, Class A2, 3.858%, 12/5/49(1) | 2,336 | 2,122,615 | |
| PMT Issuer Trust - FMSR: | |||
| Series 2021-FT1, Class A, 8.444%, (1 mo. SOFR + 3.115%), 3/25/26(1)(2) | 390 | 394,909 | |
| Series 2022-FT1, Class A, 9.511%, (30-day SOFR Average + 4.19%), 6/25/27(1)(2) | 5,455 | 5,534,784 | |
| PNMAC GMSR Issuer Trust, Series 2024-GT1, Class A, 8.529%, (1 mo. SOFR + 3.20%), 3/25/29(1)(2) | 2,800 | 2,834,360 | |
| Security | Principal Amount (000's omitted) | Value | |
| Prosper Marketplace Issuance Trust, Series 2023-1A, Class A, 7.06%, 7/16/29(1) | $ | 1,957 | $ 1,963,374 |
| Raptor Aircraft Finance I LLC, Series 2019-1, Class A, 4.213%, 8/23/44(1) | 1,272 | 1,048,789 | |
| Retained Vantage Data Centers Issuer LLC: | |||
| Series 2023-1A, Class A2B, 5.25%, 9/15/48(1) | 4,877 | 3,315,008 | |
| Series 2023-1A, Class B, 5.75%, 9/15/48(1) | 4,890 | 4,592,297 | |
| ServiceMaster Funding LLC: | |||
| Series 2020-1, Class A2I, 2.841%, 1/30/51(1) | 633 | 566,725 | |
| Series 2020-1, Class A2II, 3.337%, 1/30/51(1) | 741 | 635,127 | |
| SERVPRO Master Issuer LLC, Series 2019-1A, Class A2, 3.882%, 10/25/49(1) | 4,673 | 4,437,628 | |
| Sonic Capital LLC, Series 2020-1A, Class A2I, 3.845%, 1/20/50(1) | 3,774 | 3,577,938 | |
| Stack Infrastructure Issuer LLC, Series 2020-1A, Class A2, 1.893%, 8/25/45(1) | 1,096 | 1,033,278 | |
| STAR Trust: | |||
| Series 2021-SFR1, Class G, 8.641%, (1 mo. SOFR + 3.314%), 4/17/38(1)(2) | 2,494 | 2,389,208 | |
| Series 2021-SFR1, Class H, 9.891%, (1 mo. SOFR + 4.564%), 4/17/38(1)(2) | 1,600 | 1,473,959 | |
| Sunnova Helios II Issuer LLC: | |||
| Series 2019-AA, Class C, 5.32%, 6/20/46(1) | 952 | 746,161 | |
| Series 2021-B, Class B, 2.01%, 7/20/48(1) | 2,240 | 1,858,149 | |
| Sunnova Helios IV Issuer LLC, Series 2020-AA, Class B, 7.25%, 6/20/47(1) | 1,727 | 1,453,760 | |
| Sunnova Helios V Issuer LLC, Series 2021-A, Class B, 3.15%, 2/20/48(1) | 2,761 | 2,241,291 | |
| Sunnova Helios X Issuer LLC, Series 2022-C, Class B, 5.60%, 11/22/49(1) | 3,586 | 3,418,338 | |
| Sunnova Sol Issuer LLC, Series 2020-1A, Class B, 5.54%, 2/1/55(1) | 8,111 | 6,491,736 | |
| Theorem Funding Trust, Series 2021-1A, Class B, 1.84%, 12/15/27(1) | 426 | 424,881 | |
| Vantage Data Centers Issuer LLC, Series 2021-1A, Class A2, 2.165%, 10/15/46(1) | 3,858 | 3,522,565 | |
| Vantage Data Centers LLC, Series 2020-2A, Class A2, 1.992%, 9/15/45(1) | 3,088 | 2,723,084 | |
| VINE Trust, Series 2023-SFR1, Class E1, 4.75%, 12/17/40(1) | 5,000 | 4,453,763 | |
| Willis Engine Structured Trust V: | |||
| Series 2020-A, Class B, 4.212%, 3/15/45(1) | 1,421 | 1,204,074 | |
| Series 2020-A, Class C, 6.657%, 3/15/45(1) | 445 | 410,402 | |
| Willis Engine Structured Trust VII, Series 2023-A, Class A, 8.00%, 10/15/48(1) | 2,090 | 2,194,769 | |
| Total Asset-Backed Securities (identified cost $262,676,247) | $ 254,256,912 | ||
| Collateralized Mortgage Obligations — 5.1% |
| Security | Principal Amount (000's omitted) | Value | |
| Cascade Funding Mortgage Trust, Series 2022-HB10, Class M2, 3.25%, 11/25/35(1)(5) | $ | 2,000 | $ 1,873,253 |
| Cascade MH Asset Trust, Series 2022-MH1, Class A, 4.25% to 7/25/27, 8/25/54(1)(6) | 1,990 | 1,809,794 | |
| CFMT LLC, Series 2023-HB11, Class M2, 4.00%, 2/25/37(1)(5) | 2,500 | 2,195,882 | |
| Eagle RE Ltd., Series 2021-2, Class M1B, 7.37%, (30-day SOFR Average + 2.05%), 4/25/34(1)(2) | 1,087 | 1,090,876 | |
| Federal Home Loan Mortgage Corp.: | |||
| Series 5324, Class MZ, 6.00%, 7/25/53 | 241 | 245,213 | |
| Class BZ, 6.00% PAC CMO, 4/25/54 | 1,140 | 1,166,823 | |
| Federal Home Loan Mortgage Corp. STACR REMICS Trust: | |||
| Series 2020-HQA2, Class B1, 9.535%, (30-day SOFR Average + 4.214%), 3/25/50(1)(2) | 1,878 | 2,124,240 | |
| Series 2021-DNA2, Class B1, 8.72%, (30-day SOFR Average + 3.40%), 8/25/33(1)(2) | 2,165 | 2,386,975 | |
| Federal National Mortgage Association Connecticut Avenue Securities: | |||
| Series 2019-R01, Class 2B1, 9.785%, (30-day SOFR Average + 4.464%), 7/25/31(1)(2) | 1,390 | 1,504,697 | |
| Series 2019-R02, Class 1B1, 9.585%, (30-day SOFR Average + 4.264%), 8/25/31(1)(2) | 509 | 542,686 | |
| Series 2019-R03, Class 1B1, 9.535%, (30-day SOFR Average + 4.214%), 9/25/31(1)(2) | 1,047 | 1,115,452 | |
| Series 2019-R06, Class 2B1, 9.185%, (30-day SOFR Average + 3.864%), 9/25/39(1)(2) | 7,810 | 8,151,644 | |
| Series 2019-R07, Class 1B1, 8.835%, (30-day SOFR Average + 3.514%), 10/25/39(1)(2) | 3,026 | 3,153,100 | |
| Series 2020-R02, Class 2B1, 8.435%, (30-day SOFR Average + 3.114%), 1/25/40(1)(2) | 1,612 | 1,671,993 | |
| Series 2021-R01, Class 1B2, 11.32%, (30-day SOFR Average + 6.00%), 10/25/41(1)(2) | 1,995 | 2,126,238 | |
| Series 2021-R02, Class 2B1, 8.62%, (30-day SOFR Average + 3.30%), 11/25/41(1)(2) | 584 | 604,749 | |
| Finance of America HECM Buyout, Series 2022-HB2, Class M5, 6.00%, 8/1/32(1)(5) | 1,000 | 663,024 | |
| Government National Mortgage Association: | |||
| Series 2023-84, Class DL, 6.00%, 6/20/53 | 1,002 | 1,022,023 | |
| Series 2023-84, Class MW, 6.00%, 6/20/53 | 1,051 | 1,069,677 | |
| Series 2023-98, Class BW, 6.00% PAC CMO, 7/20/53 | 1,190 | 1,214,306 | |
| Series 2023-99, Class AL, 6.00%, 7/20/53 | 1,190 | 1,214,143 | |
| Series 2023-102, Class SG, 2.723%, (22.546% - 30-day SOFR Average x 3.727), 7/20/53(7) | 1,733 | 1,662,503 | |
| Series 2023-116, Class CY, 6.00%, 8/20/53 | 2,770 | 2,828,882 | |
| Series 2023-133, Class S, 5.642%, (21.60% - 30-day SOFR Average x 3.00), 9/20/53(7) | 3,762 | 3,819,365 | |
| Series 2023-164, Class EL, 6.00%, 11/20/53 | 1,580 | 1,621,779 | |
| Series 2023-173, Class AX, 6.00%, 11/20/53 | 2,750 | 2,815,299 | |
| Security | Principal Amount (000's omitted) | Value | |
| Government National Mortgage Association: (continued) | |||
| Series 2023-182, Class EL, 6.00%, 12/20/53 | $ | 3,000 | $ 3,057,402 |
| Series 2024-46, Class AL, 6.00% PAC CMO, 3/20/54 | 1,605 | 1,635,478 | |
| Home RE Ltd., Series 2021-2, Class B1, 9.47%, (30-day SOFR Average + 4.15%), 1/25/34(1)(2) | 3,670 | 3,719,297 | |
| JP Morgan Mortgage Trust, Series 2023-HE2, Class A1, 7.019%, (30-day SOFR Average + 1.70%), 3/25/54(1)(2) | 3,691 | 3,722,776 | |
| LHOME Mortgage Trust: | |||
| Series 2023-RTL2, Class A1, 8.00% to 1/25/26, 6/25/28(1)(6) | 1,550 | 1,578,455 | |
| Series 2023-RTL3, Class A1, 8.00% to 3/25/26, 8/25/28(1)(6) | 1,624 | 1,656,494 | |
| Series 2023-RTL4, Class A1, 7.628% to 8/25/25, 11/25/28(1)(6) | 1,585 | 1,610,558 | |
| Mello Warehouse Securitization Trust, Series 2021-3, Class E, 8.694%, (1 mo. SOFR + 3.364%), 11/25/55(1)(2) | 4,000 | 4,030,986 | |
| MFA Trust, Series 2023-NQM1, Class A2, 5.75% to 1/25/26, 11/25/67(1)(6) | 1,396 | 1,401,720 | |
| NYMT Loan Trust, Series 2024-BPL1, Class A1, 7.154% to 7/25/26, 2/25/29(1)(6) | 3,425 | 3,425,804 | |
| Oaktown Re VI Ltd., Series 2021-1A, Class M1B, 7.37%, (30-day SOFR Average + 2.05%), 10/25/33(1)(2) | 392 | 393,067 | |
| PMT Issuer Trust, 2024 Participation, 11.08%, (30-day SOFR Average + 5.75%), 12/24/24 | 1,129 | 1,138,288 | |
| RMF Buyout Issuance Trust, Series 2020-HB1, Class M5, 6.00%, 10/25/50(1) | 1,228 | 798,277 | |
| Total Collateralized Mortgage Obligations (identified cost $76,084,255) | $ 77,863,218 | ||
| Commercial Mortgage-Backed Securities — 7.8% |
| Security | Principal Amount (000's omitted) | Value | |
| BAMLL Commercial Mortgage Securities Trust: | |||
| Series 2019-BPR, Class ENM, 3.719%, 11/5/32(1)(5) | $ | 7,255 | $ 2,575,822 |
| Series 2019-BPR, Class FNM, 3.719%, 11/5/32(1)(5) | 7,215 | 1,517,996 | |
| BBCMS Mortgage Trust, Series 2017-C1, Class D, 3.54%, 2/15/50(1)(5) | 3,500 | 2,583,488 | |
| BX Commercial Mortgage Trust: | |||
| Series 2021-VOLT, Class C, 6.54%, (1 mo. SOFR + 1.214%), 9/15/36(1)(2) | 6,379 | 6,289,860 | |
| Series 2021-VOLT, Class D, 7.09%, (1 mo. SOFR + 1.764%), 9/15/36(1)(2) | 474 | 467,979 | |
| Security | Principal Amount (000's omitted) | Value | |
| CFCRE Commercial Mortgage Trust: | |||
| Series 2016-C3, Class D, 3.052%, 1/10/48(1)(5) | $ | 1,500 | $ 1,252,711 |
| Series 2016-C7, Class D, 4.367%, 12/10/54(1)(5) | 1,725 | 1,320,342 | |
| Citigroup Commercial Mortgage Trust, Series 2015-P1, Class D, 3.225%, 9/15/48(1) | 4,000 | 3,479,121 | |
| COMM Mortgage Trust: | |||
| Series 2013-CR11, Class D, 4.463%, 8/10/50(1)(5) | 3,062 | 2,777,274 | |
| Series 2013-CR13, Class C, 4.919%, 11/10/46(5) | 353 | 328,494 | |
| Series 2015-CR22, Class D, 4.066%, 3/10/48(1)(5) | 2,324 | 1,979,807 | |
| CSMC Trust: | |||
| Series 2016-NXSR, Class D, 4.425%, 12/15/49(1)(5) | 2,000 | 1,394,422 | |
| Series 2021-BPNY, Class A, 9.155%, (1 mo. SOFR + 3.829%), 8/15/26(1)(2) | 3,917 | 3,515,190 | |
| Series 2021-WEHO, Class A, 9.409%, (1 mo. SOFR + 4.083%), 4/15/26(1)(2) | 396 | 390,068 | |
| Series 2022-CNTR, Class A, 9.27%, (1 mo. SOFR + 3.944%), 1/15/25(1)(2) | 3,745 | 3,406,761 | |
| Series 2022-NWPT, Class A, 8.468%, (1 mo. SOFR + 3.143%), 9/9/24(1)(2) | 3,163 | 3,182,735 | |
| Extended Stay America Trust: | |||
| Series 2021-ESH, Class C, 7.14%, (1 mo. SOFR + 1.814%), 7/15/38(1)(2) | 2,904 | 2,903,792 | |
| Series 2021-ESH, Class D, 7.69%, (1 mo. SOFR + 2.364%), 7/15/38(1)(2) | 8,631 | 8,630,566 | |
| Federal National Mortgage Association Multifamily Connecticut Avenue Securities Trust: | |||
| Series 2019-01, Class M10, 8.685%, (30-day SOFR Average + 3.364%), 10/25/49(1)(2) | 2,795 | 2,759,605 | |
| Series 2020-01, Class M10, 9.185%, (30-day SOFR Average + 3.864%), 3/25/50(1)(2) | 7,219 | 7,160,203 | |
| FS Commercial Mortgage Trust, Series 2023-4SZN, Class A, 7.066%, 11/10/39(1) | 2,143 | 2,238,711 | |
| JPMBB Commercial Mortgage Securities Trust: | |||
| Series 2014-C22, Class D, 4.561%, 9/15/47(1)(5) | 1,250 | 747,353 | |
| Series 2014-C23, Class D, 3.98%, 9/15/47(1)(5) | 3,000 | 2,692,154 | |
| Series 2014-C25, Class D, 3.932%, 11/15/47(1)(5) | 2,600 | 1,498,072 | |
| JPMorgan Chase Commercial Mortgage Securities Trust: | |||
| Series 2013-C16, Class D, 4.884%, 12/15/46(1)(5) | 1,119 | 994,864 | |
| Series 2014-DSTY, Class B, 3.771%, 6/10/27(1) | 1,384 | 196,280 | |
| Med Trust: | |||
| Series 2021-MDLN, Class E, 8.59%, (1 mo. SOFR + 3.264%), 11/15/38(1)(2) | 4,150 | 4,144,241 | |
| Series 2021-MDLN, Class F, 9.44%, (1 mo. SOFR + 4.114%), 11/15/38(1)(2) | 3,200 | 3,203,057 | |
| Morgan Stanley Bank of America Merrill Lynch Trust: | |||
| Series 2016-C29, Class C, 4.717%, 5/15/49(5)(8) | 4,199 | 3,882,427 | |
| Series 2016-C29, Class D, 3.00%, 5/15/49(1)(8) | 3,048 | 2,491,553 | |
| Series 2016-C32, Class D, 3.396%, 12/15/49(1)(5)(8) | 5,000 | 3,250,295 | |
| Security | Principal Amount (000's omitted) | Value | |
| Morgan Stanley Capital I Trust: | |||
| Series 2019-BPR, Class B, 8.018%, (1 mo. SOFR + 2.692%), 5/15/36(1)(2)(8) | $ | 3,960 | $ 3,898,441 |
| Series 2019-BPR, Class C, 8.968%, (1 mo. SOFR + 3.642%), 5/15/36(1)(2)(8) | 2,219 | 2,162,599 | |
| Natixis Commercial Mortgage Securities Trust, Series 2018-FL1, Class C, 8.50%, (USD Prime), 6/15/35(1)(2) | 3,219 | 1,347,722 | |
| ORL Trust, Series 2023-GLKS, Class A, 7.676%, (1 mo. SOFR + 2.35%), 10/19/36(1)(2) | 2,011 | 2,026,082 | |
| Taubman Centers Commercial Mortgage Trust, Series 2022-DPM, Class A, 7.511%, (1 mo. SOFR + 2.186%), 5/15/37(1)(2) | 2,000 | 2,024,650 | |
| UBS-Barclays Commercial Mortgage Trust, Series 2013-C6, Class D, 3.906%, 4/10/46(1)(5) | 1,707 | 1,469,977 | |
| VMC Finance LLC, Series 2021-HT1, Class B, 9.941%, (1 mo. SOFR + 4.614%), 1/18/37(1)(2) | 8,477 | 8,085,527 | |
| Wells Fargo Commercial Mortgage Trust: | |||
| Series 2015-C31, Class D, 3.852%, 11/15/48 | 5,598 | 4,501,025 | |
| Series 2015-NXS1, Class C, 3.848%, 5/15/48(5) | 1,000 | 923,420 | |
| Series 2016-C35, Class D, 3.142%, 7/15/48(1) | 2,150 | 1,761,404 | |
| Series 2016-C36, Class D, 2.942%, 11/15/59(1) | 6,000 | 3,955,559 | |
| WF-RBS Commercial Mortgage Trust, Series 2014-C24, Class D, 3.692%, 11/15/47(1) | 4,150 | 2,294,424 | |
| Total Commercial Mortgage-Backed Securities (identified cost $134,358,480) | $ 117,706,073 | ||
| Convertible Bonds — 0.2% |
| Security | Principal Amount (000's omitted) | Value | |
| Biotechnology — 0.0%(9) | |||
| BioMarin Pharmaceutical, Inc., 0.599%, 8/1/24 | $ | 175 | $ 172,270 |
| $ 172,270 | |||
| Commercial Services — 0.0%(9) | |||
| Block, Inc., 0.125%, 3/1/25 | $ | 170 | $ 174,463 |
| $ 174,463 | |||
| Computers — 0.0%(9) | |||
| Rapid7, Inc., 0.25%, 3/15/27 | $ | 175 | $ 154,073 |
| $ 154,073 | |||
| Security | Principal Amount (000's omitted) | Value | |
| Diversified Financial Services — 0.0%(9) | |||
| Ford Motor Co., 0.00%, 3/15/26 | $ | 200 | $ 207,700 |
| $ 207,700 | |||
| Electric Utilities — 0.0%(9) | |||
| NRG Energy, Inc., 2.75%, 6/1/48 | $ | 200 | $ 331,400 |
| $ 331,400 | |||
| Leisure Time — 0.0%(9) | |||
| NCL Corp. Ltd., 1.125%, 2/15/27 | $ | 200 | $ 189,620 |
| $ 189,620 | |||
| Oil and Gas — 0.0%(9) | |||
| NextEra Energy Partners LP, 2.50%, 6/15/26(1) | $ | 200 | $ 180,741 |
| $ 180,741 | |||
| Pharmaceuticals — 0.1% | |||
| Dexcom, Inc., 0.25%, 11/15/25 | $ | 175 | $ 192,742 |
| Jazz Investments I Ltd., 2.00%, 6/15/26 | 200 | 199,077 | |
| $ 391,819 | |||
| Software — 0.1% | |||
| Akamai Technologies, Inc., 1.125%, 2/15/29(1) | $ | 200 | $ 206,100 |
| BILL Holdings, Inc., 0.00%, 12/1/25 | 175 | 163,800 | |
| Tyler Technologies, Inc., 0.25%, 3/15/26 | 175 | 176,663 | |
| $ 546,563 | |||
| Total Convertible Bonds (identified cost $2,254,077) | $ 2,348,649 | ||
| Corporate Bonds — 32.9% |
| Security | Principal Amount (000's omitted) | Value | |
| Aerospace & Defense — 0.5% | |||
| American Airlines, Inc./AAdvantage Loyalty IP Ltd., 5.50%, 4/20/26(1) | $ | 1,969 | $ 1,956,573 |
| BAE Systems PLC, 5.30%, 3/26/34(1) | 1,952 | 1,962,524 | |
| Continental Airlines Pass-Through Trust, Series 2012-2, Class A, 4.00%, 4/29/26 | 3,449 | 3,407,343 | |
| $ 7,326,440 | |||
| Security | Principal Amount (000's omitted) | Value | |
| Auto Manufacturers — 0.7% | |||
| Hyundai Capital America: | |||
| 5.40%, 1/8/31(1) | $ | 573 | $ 575,704 |
| 5.70%, 6/26/30(1) | 2,036 | 2,076,429 | |
| 6.20%, 9/21/30(1) | 975 | 1,017,787 | |
| Tapestry, Inc.: | |||
| 7.00%, 11/27/26 | 1,643 | 1,693,480 | |
| 7.35%, 11/27/28 | 4,579 | 4,827,623 | |
| $ 10,191,023 | |||
| Banks — 10.5% | |||
| ABN AMRO Bank NV, 6.339% to 9/18/26, 9/18/27(1)(10) | $ | 2,300 | $ 2,340,363 |
| African Export-Import Bank, 3.994%, 9/21/29(11) | 2,200 | 1,980,304 | |
| Banco do Brasil SA, 6.00%, 3/18/31(1) | 7,000 | 7,043,750 | |
| Banco Mercantil del Norte SA, 7.50% to 6/27/29(1)(10)(12) | 745 | 743,663 | |
| Banco Santander SA: | |||
| 6.35%, 3/14/34 | 5,400 | 5,407,752 | |
| 9.625% to 11/21/28(10)(12) | 3,000 | 3,209,790 | |
| Bank Hapoalim BM, 3.255% to 10/21/26, 1/21/32(1)(10)(11) | 2,600 | 2,338,193 | |
| Bank Leumi Le-Israel BM, 7.129% to 4/18/28, 7/18/33(1)(10)(11) | 2,360 | 2,333,061 | |
| Bank of America Corp., 5.468% to 1/23/34, 1/23/35(10) | 14,406 | 14,505,360 | |
| Bank of Nova Scotia, 8.00% to 1/27/29, 1/27/84(10) | 7,660 | 7,813,797 | |
| Barclays PLC: | |||
| 5.088% to 6/20/29, 6/20/30(10) | 3,250 | 3,132,627 | |
| 5.69% to 3/12/29, 3/12/30(10) | 2,900 | 2,916,060 | |
| 6.496% to 9/13/26, 9/13/27(10) | 3,596 | 3,669,360 | |
| BBVA Bancomer SA: | |||
| 5.125% to 1/18/28, 1/18/33(1)(10) | 2,270 | 2,111,077 | |
| 8.125% to 1/8/34, 1/8/39(1)(10) | 4,440 | 4,602,930 | |
| 8.45% to 6/29/33, 6/29/38(1)(10) | 2,261 | 2,389,000 | |
| BNP Paribas SA, 7.75% to 8/16/29(1)(10)(12) | 8,000 | 8,209,464 | |
| BPCE SA, 3.648% to 1/14/32, 1/14/37(1)(10) | 1,518 | 1,270,453 | |
| CaixaBank SA, 6.84% to 9/13/33, 9/13/34(1)(10) | 2,818 | 3,014,076 | |
| Credit Agricole SA, 6.251%, to 1/10/34, 1/10/35(1)(10) | 6,683 | 6,797,510 | |
| Discover Bank, 5.974% to 8/9/28(10)(12) | 3,430 | 3,415,310 | |
| HSBC Holdings PLC, 7.39% to 11/3/27, 11/3/28(10) | 3,399 | 3,617,710 | |
| Intesa Sanpaolo SpA: | |||
| 7.778% to 6/20/53, 6/20/54(1)(10) | 2,500 | 2,668,444 | |
| 8.248% to 11/21/32, 11/21/33(1)(10) | 3,183 | 3,556,933 | |
| KeyBank NA: | |||
| 4.15%, 8/8/25 | 3,055 | 2,970,601 | |
| Security | Principal Amount (000's omitted) | Value | |
| Banks (continued) | |||
| KeyBank NA: (continued) | |||
| 5.85%, 11/15/27 | $ | 3,495 | $ 3,467,903 |
| KeyCorp, 3.878% to 5/23/24, 5/23/25(10) | 1,630 | 1,622,722 | |
| Macquarie Group Ltd., 6.255%, to 12/7/33, 12/7/34(1)(10) | 2,429 | 2,543,825 | |
| Societe Generale SA: | |||
| 5.634% to 1/19/29, 1/19/30(1)(10) | 4,175 | 4,159,534 | |
| 6.066% to 1/19/34, 1/19/35(1)(10) | 3,242 | 3,263,598 | |
| 8.50% to 3/25/34(1)(10)(12) | 10,450 | 10,423,875 | |
| Synchrony Bank, 5.40%, 8/22/25 | 1,200 | 1,189,395 | |
| Synchrony Financial, 4.875%, 6/13/25 | 563 | 554,782 | |
| Synovus Bank/Columbus, GA, 5.625%, 2/15/28 | 5,334 | 5,182,874 | |
| Texas Capital Bancshares, Inc., 4.00% to 5/6/26, 5/6/31(10) | 3,393 | 2,929,735 | |
| Toronto-Dominion Bank, 8.125% to 10/31/27, 10/31/82(10) | 4,577 | 4,812,043 | |
| U.S. Bancorp, 5.678% to 1/23/34, 1/23/35(10) | 8,834 | 8,923,678 | |
| UBS Group AG: | |||
| 4.375% to 2/10/31(1)(10)(12) | 3,315 | 2,734,283 | |
| 9.25% to 11/13/28(1)(10)(12) | 4,910 | 5,332,137 | |
| $ 159,197,972 | |||
| Chemicals — 0.5% | |||
| Olympus Water U.S. Holding Corp., 9.75%, 11/15/28(1) | $ | 2,200 | $ 2,346,227 |
| Sasol Financing USA LLC, 8.75%, 5/3/29(1) | 5,000 | 5,100,940 | |
| $ 7,447,167 | |||
| Commercial Services — 0.6% | |||
| Allied Universal Holdco LLC/Allied Universal Finance Corp., 6.625%, 7/15/26(1) | $ | 957 | $ 957,175 |
| Ashtead Capital, Inc.: | |||
| 4.25%, 11/1/29(1) | 2,785 | 2,598,912 | |
| 5.95%, 10/15/33(1) | 3,750 | 3,794,098 | |
| WASH Multifamily Acquisition, Inc., 5.75%, 4/15/26(1) | 2,340 | 2,289,075 | |
| $ 9,639,260 | |||
| Computers — 1.0% | |||
| Kyndryl Holdings, Inc.: | |||
| 2.70%, 10/15/28 | $ | 4,495 | $ 3,983,007 |
| 3.15%, 10/15/31 | 6,646 | 5,595,573 | |
| 6.35%, 2/20/34 | 1,700 | 1,745,880 | |
| Seagate HDD Cayman: | |||
| 5.75%, 12/1/34 | 1,953 | 1,912,114 | |
| Security | Principal Amount (000's omitted) | Value | |
| Computers (continued) | |||
| Seagate HDD Cayman: (continued) | |||
| 9.625%, 12/1/32 | $ | 1,901 | $ 2,167,935 |
| $ 15,404,509 | |||
| Diversified Financial Services — 6.1% | |||
| Ally Financial, Inc.: | |||
| 2.20%, 11/2/28 | $ | 7,600 | $ 6,519,166 |
| Series B, 4.70% to 5/15/26(10)(12) | 8,310 | 7,150,427 | |
| Alpha Holding SA de CV, 9.00%, 2/10/25(1)(13) | 2,946 | 44,191 | |
| American AgCredit Corp., Series A, 5.25% to 6/15/26(1)(10)(12) | 1,431 | 1,359,450 | |
| Antares Holdings LP, 6.50%, 2/8/29(1) | 3,770 | 3,746,820 | |
| Apollo Debt Solutions BDC, 6.90%, 4/13/29(1) | 5,273 | 5,326,929 | |
| Aviation Capital Group LLC, 6.25%, 4/15/28(1) | 6,497 | 6,635,985 | |
| Blackstone Private Credit Fund, 6.25%, 1/25/31(1) | 5,230 | 5,257,570 | |
| Blue Owl Credit Income Corp., 6.65%, 3/15/31(1) | 5,075 | 4,957,556 | |
| CI Financial Corp.: | |||
| 3.20%, 12/17/30 | 3,912 | 3,207,542 | |
| 4.10%, 6/15/51 | 3,984 | 2,491,805 | |
| Ford Motor Credit Co. LLC: | |||
| 5.125%, 6/16/25 | 3,639 | 3,607,487 | |
| 7.122%, 11/7/33 | 5,474 | 5,893,688 | |
| 7.20%, 6/10/30 | 2,303 | 2,445,896 | |
| 7.35%, 3/6/30 | 5,097 | 5,437,497 | |
| Inversiones La Construccion SA, 4.75%, 2/7/32(11) | 2,250 | 1,923,750 | |
| LPL Holdings, Inc.: | |||
| 4.00%, 3/15/29(1) | 240 | 220,796 | |
| 6.75%, 11/17/28 | 2,380 | 2,493,776 | |
| Oaktree Strategic Credit Fund, 8.40%, 11/14/28(1) | 5,745 | 6,098,850 | |
| Radian Group, Inc., 6.20%, 5/15/29 | 3,257 | 3,307,584 | |
| Rocket Mortgage LLC/Rocket Mortgage Co.-Issuer, Inc., 3.875%, 3/1/31(1) | 2,900 | 2,529,247 | |
| TPG Operating Group II LP, 5.875%, 3/5/34 | 6,590 | 6,686,689 | |
| UniCredit SpA, 5.861% to 6/19/27, 6/19/32(1)(10) | 5,038 | 4,922,102 | |
| $ 92,264,803 | |||
| Electric Utilities — 0.4% | |||
| Cometa Energia SA de CV, 6.375%, 4/24/35(11) | $ | 1,885 | $ 1,901,221 |
| Edison International, Series B, 5.00% to 12/15/26(10)(12) | 2,996 | 2,845,908 | |
| Minejesa Capital BV, 4.625%, 8/10/30(11) | 1,953 | 1,858,033 | |
| $ 6,605,162 | |||
| Security | Principal Amount (000's omitted) | Value | |
| Electrical and Electronic Equipment — 0.2% | |||
| Vontier Corp., 2.95%, 4/1/31 | $ | 3,671 | $ 3,071,914 |
| $ 3,071,914 | |||
| Entertainment — 0.1% | |||
| WarnerMedia Holdings, Inc., 5.141%, 3/15/52 | $ | 1,800 | $ 1,495,162 |
| $ 1,495,162 | |||
| Foods — 0.3% | |||
| Smithfield Foods, Inc., 5.20%, 4/1/29(1) | $ | 4,300 | $ 4,144,046 |
| $ 4,144,046 | |||
| Health Care — 0.8% | |||
| Centene Corp.: | |||
| 2.50%, 3/1/31 | $ | 3,824 | $ 3,148,615 |
| 3.375%, 2/15/30 | 990 | 876,716 | |
| Legacy LifePoint Health LLC, 4.375%, 2/15/27(1) | 2,631 | 2,509,264 | |
| U.S. Acute Care Solutions LLC, 6.375%, 3/1/26(1) | 2,520 | 2,428,945 | |
| UnitedHealth Group, Inc., 5.375%, 4/15/54 | 3,883 | 3,952,149 | |
| $ 12,915,689 | |||
| Insurance — 2.3% | |||
| American National Group LLC, 6.144%, 6/13/32(1) | $ | 3,300 | $ 3,122,919 |
| ASR Nederland NV, 7.00% to 9/7/33, 12/7/43(10)(11) | 2,860 | 3,569,404 | |
| Athene Global Funding, 2.646%, 10/4/31(1) | 5,300 | 4,336,355 | |
| Global Atlantic Fin Co.: | |||
| 3.125%, 6/15/31(1) | 5,247 | 4,349,288 | |
| 6.75%, 3/15/54(1) | 7,800 | 8,008,630 | |
| 7.95%, 6/15/33(1) | 1,680 | 1,866,430 | |
| Liberty Mutual Group, Inc., 4.125% to 9/15/26, 12/15/51(1)(10) | 7,769 | 7,032,241 | |
| Stewart Information Services Corp., 3.60%, 11/15/31 | 4,244 | 3,471,254 | |
| $ 35,756,521 | |||
| Leisure Time — 0.7% | |||
| Brunswick Corp., 5.85%, 3/18/29 | $ | 5,278 | $ 5,338,233 |
| NCL Corp. Ltd., 5.875%, 3/15/26(1) | 2,550 | 2,518,917 | |
| Viking Cruises Ltd., 5.875%, 9/15/27(1) | 2,525 | 2,479,083 | |
| $ 10,336,233 | |||
| Mining — 0.2% | |||
| Compass Minerals International, Inc., 6.75%, 12/1/27(1) | $ | 2,870 | $ 2,777,286 |
| $ 2,777,286 | |||
| Security | Principal Amount (000's omitted) | Value | |
| Oil and Gas — 1.4% | |||
| Aethon United BR LP/Aethon United Finance Corp., 8.25%, 2/15/26(1) | $ | 2,740 | $ 2,774,110 |
| Enviva Partners LP/Enviva Partners Finance Corp., 6.50%, 1/15/26(1)(13) | 3,339 | 1,455,186 | |
| Neptune Energy Bondco PLC, 6.625%, 5/15/25(1) | 1,315 | 1,315,807 | |
| Occidental Petroleum Corp., 7.50%, 5/1/31 | 3,000 | 3,341,274 | |
| Petroleos Mexicanos, 6.84%, 1/23/30 | 8,155 | 7,197,306 | |
| Raizen Fuels Finance SA: | |||
| 6.45%, 3/5/34(1) | 1,639 | 1,682,619 | |
| 6.95%, 3/5/54(1) | 1,060 | 1,091,936 | |
| Var Energi ASA, 7.50%, 1/15/28(1) | 3,000 | 3,177,950 | |
| $ 22,036,188 | |||
| Packaging & Containers — 0.4% | |||
| Smurfit Kappa Treasury ULC, 5.777%, 4/3/54(1)(14) | $ | 3,465 | $ 3,514,752 |
| Trivium Packaging Finance BV, 5.50%, 8/15/26(1) | 2,874 | 2,836,243 | |
| $ 6,350,995 | |||
| Pharmaceuticals — 0.7% | |||
| AbbVie, Inc.: | |||
| 5.35%, 3/15/44 | $ | 453 | $ 462,206 |
| 5.50%, 3/15/64 | 3,558 | 3,662,085 | |
| Bristol-Myers Squibb Co.: | |||
| 5.55%, 2/22/54 | 2,496 | 2,569,062 | |
| 5.65%, 2/22/64 | 3,741 | 3,852,094 | |
| $ 10,545,447 | |||
| Pipelines — 0.4% | |||
| Enbridge, Inc., Series NC5, 8.25% to 10/15/28, 1/15/84(10) | $ | 5,500 | $ 5,737,034 |
| $ 5,737,034 | |||
| Real Estate Investment Trusts (REITs) — 2.3% | |||
| American Assets Trust LP, 3.375%, 2/1/31 | $ | 3,290 | $ 2,685,076 |
| COPT Defense Properties LP, 2.90%, 12/1/33 | 3,876 | 3,041,662 | |
| EPR Properties: | |||
| 3.60%, 11/15/31 | 2,705 | 2,262,649 | |
| 3.75%, 8/15/29 | 3,550 | 3,138,630 | |
| 4.95%, 4/15/28 | 3,559 | 3,390,173 | |
| HAT Holdings I LLC/HAT Holdings II LLC, 8.00%, 6/15/27(1) | 5,525 | 5,767,824 | |
| Kite Realty Group LP, 5.50%, 3/1/34 | 2,624 | 2,608,422 | |
| Newmark Group, Inc., 7.50%, 1/12/29(1) | 6,625 | 6,819,324 | |
| VICI Properties LP, 5.75%, 4/1/34 | 5,255 | 5,210,099 | |
| $ 34,923,859 | |||
| Security | Principal Amount (000's omitted) | Value | |
| Retail — 0.5% | |||
| Lithia Motors, Inc., 4.375%, 1/15/31(1) | $ | 2,811 | $ 2,520,320 |
| PetSmart, Inc./PetSmart Finance Corp., 4.75%, 2/15/28(1) | 2,400 | 2,249,305 | |
| Sonic Automotive, Inc., 4.625%, 11/15/29(1) | 2,575 | 2,311,683 | |
| $ 7,081,308 | |||
| Semiconductors — 0.2% | |||
| Foundry JV Holdco LLC, 5.875%, 1/25/34(1) | $ | 3,873 | $ 3,883,138 |
| $ 3,883,138 | |||
| Software — 0.6% | |||
| Concentrix Corp., 6.60%, 8/2/28 | $ | 8,433 | $ 8,534,368 |
| $ 8,534,368 | |||
| Telecommunications — 1.3% | |||
| Clear Channel Outdoor Holdings, Inc., 5.125%, 8/15/27(1) | $ | 2,440 | $ 2,301,848 |
| Connect Finco SARL/Connect U.S. Finco LLC, 6.75%, 10/1/26(1) | 6,135 | 6,018,159 | |
| LCPR Senior Secured Financing DAC, 6.75%, 10/15/27(1) | 2,325 | 2,184,311 | |
| SES GLOBAL Americas Holdings, Inc., 5.30%, 3/25/44(1) | 1,360 | 1,041,557 | |
| SES SA, 5.30%, 4/4/43(1) | 810 | 602,819 | |
| Sprint LLC, 7.125%, 6/15/24 | 7,960 | 7,978,610 | |
| $ 20,127,304 | |||
| Transportation — 0.2% | |||
| Seaspan Corp., 5.50%, 8/1/29(1) | $ | 2,973 | $ 2,596,638 |
| $ 2,596,638 | |||
| Total Corporate Bonds (identified cost $501,264,372) | $ 500,389,466 | ||
| Preferred Stocks — 0.3% |
| Security | Shares | Value | |
| Real Estate Management & Development — 0.2% | |||
| Brookfield Property Partners LP: | |||
| Series A, 5.75% | 187,034 | $ 2,386,554 | |
| Series A2, 6.375% | 74,772 | 1,077,464 | |
| $ 3,464,018 | |||
| Security | Shares | Value | |
| Wireless Telecommunication Services — 0.1% | |||
| U.S. Cellular Corp., 5.50% | 67,450 | $ 1,215,449 | |
| $ 1,215,449 | |||
| Total Preferred Stocks (identified cost $8,231,400) | $ 4,679,467 | ||
| Sovereign Government Bonds — 1.3% |
| Security | Principal Amount (000's omitted) | Value | |
| Dominican Republic — 0.2% | |||
| Dominican Republic International Bonds: | |||
| 11.25%, 9/15/35(11) | DOP | 166,000 | $ 3,050,922 |
| 13.625%, 2/3/33(11) | DOP | 16,600 | 342,484 |
| $ 3,393,406 | |||
| Mexico — 0.6% | |||
| Mexico Bonos, 8.00%, 9/5/24 | MXN | 85,000 | $ 5,044,388 |
| Mexico Udibonos, 4.00%, 11/30/28 | MXN | 85,155 | 4,870,224 |
| $ 9,914,612 | |||
| South Africa — 0.2% | |||
| Republic of South Africa Government International Bonds, 5.875%, 4/20/32 | USD | 3,118 | $ 2,814,182 |
| $ 2,814,182 | |||
| Uruguay — 0.3% | |||
| Uruguay Government International Bonds, 9.75%, 7/20/33 | UYU | 148,900 | $ 4,173,667 |
| $ 4,173,667 | |||
| Total Sovereign Government Bonds (identified cost $19,628,791) | $ 20,295,867 | ||
| U.S. Government Agency Mortgage-Backed Securities — 8.7% |
| Security | Principal Amount (000's omitted) | Value | |
| Federal National Mortgage Association, 2.00%, 4/1/51 | $ | 1,020 | $ 823,993 |
| Uniform Mortgage-Backed Security: | |||
| 4.00%, 30-Year, TBA(15) | 8,514 | 7,886,758 | |
| 4.50%, 30-Year, TBA(15) | 18,576 | 17,694,366 | |
| Security | Principal Amount (000's omitted) | Value | |
| Uniform Mortgage-Backed Security: (continued) | |||
| 5.00%, 30-Year, TBA(15) | $ | 108,375 | $ 105,809,558 |
| Total U.S. Government Agency Mortgage-Backed Securities (identified cost $133,041,059) | $ 132,214,675 | ||
| U.S. Treasury Obligations — 28.9% |
| Security | Principal Amount (000's omitted) | Value | |
| U.S. Treasury Bonds: | |||
| 2.375%, 2/15/42 | $ | 72,222 | $ 53,740,503 |
| 2.875%, 5/15/43 | 9,503 | 7,554,328 | |
| 2.875%, 5/15/52 | 5,803 | 4,392,599 | |
| 3.625%, 2/15/53 | 8,233 | 7,231,533 | |
| 3.625%, 5/15/53 | 8,400 | 7,382,648 | |
| 3.875%, 2/15/43 | 4,455 | 4,119,657 | |
| 3.875%, 5/15/43 | 3,760 | 3,471,391 | |
| 4.00%, 11/15/52 | 6,082 | 5,720,169 | |
| 4.25%, 2/15/54 | 7,725 | 7,598,865 | |
| 4.50%, 2/15/44 | 9,675 | 9,730,934 | |
| 4.75%, 11/15/43 | 3,380 | 3,507,278 | |
| 4.75%, 11/15/53 | 7,300 | 7,794,461 | |
| 5.375%, 2/15/31 | 9,075 | 9,745,345 | |
| 6.25%, 5/15/30 | 5,520 | 6,109,950 | |
| U.S. Treasury Notes: | |||
| 0.375%, 12/31/25 | 49,330 | 45,761,283 | |
| 0.50%, 2/28/26 | 8,180 | 7,561,707 | |
| 1.375%, 10/31/28 | 4,000 | 3,524,375 | |
| 3.50%, 1/31/28 | 7,543 | 7,323,782 | |
| 3.50%, 4/30/28 | 9,193 | 8,919,365 | |
| 3.625%, 3/31/28 | 5,750 | 5,606,362 | |
| 4.00%, 2/29/28 | 6,228 | 6,156,232 | |
| 4.00%, 1/31/29 | 66,320 | 65,646,437 | |
| 4.00%, 1/31/31 | 3,000 | 2,961,328 | |
| 4.00%, 2/15/34 | 6,252 | 6,149,428 | |
| 4.125%, 7/31/28 | 9,050 | 8,995,028 | |
| 4.125%, 3/31/29(14) | 9,420 | 9,379,891 | |
| 4.125%, 3/31/31(14) | 9,800 | 9,745,641 | |
| 4.25%, 1/31/26 | 78,680 | 78,068,386 | |
| 4.25%, 2/28/29 | 5,800 | 5,808,609 | |
| 4.50%, 3/31/26(14) | 7,150 | 7,132,404 | |
| 4.50%, 11/15/33 | 15,203 | 15,543,880 | |
| 4.625%, 9/15/26 | 7,512 | 7,529,606 | |
| Total U.S. Treasury Obligations (identified cost $443,198,937) | $ 439,913,405 | ||
| Miscellaneous — 0.0% |
| Security | Principal Amount | Value | |
| Financial Intermediaries — 0.0% | |||
| Alpha Holding SA, Escrow Certificates(16)(17) | $ 6,250,000 | $ 0 | |
| Total Miscellaneous (identified cost $0) | $ 0 | ||
| Short-Term Investments — 6.4% |
| Security | Shares | Value | |
| Morgan Stanley Institutional Liquidity Funds - Government Portfolio, Institutional Class, 5.22%(18) | 96,947,526 | $ 96,947,526 | |
| Total Short-Term Investments (identified cost $96,947,526) | $ 96,947,526 | ||
| Total Investments — 109.0% (identified cost $1,688,036,481) | $1,656,848,031 | ||
| Other Assets, Less Liabilities — (9.0)% | $ (136,591,744) | ||
| Net Assets — 100.0% | $1,520,256,287 | ||
| The percentage shown for each investment category in the Portfolio of Investments is based on net assets. | |
| (1) | Security exempt from registration under Rule 144A of the Securities Act of 1933, as amended. These securities may be sold in certain transactions in reliance on an exemption from registration (normally to qualified institutional buyers). At March 31, 2024, the aggregate value of these securities is $661,436,539 or 43.5% of the Fund's net assets. |
| (2) | Variable rate security. The stated interest rate represents the rate in effect at March 31, 2024. |
| (3) | When-issued, variable rate security whose interest rate will be determined after March 31, 2024 |
| (4) | Principal Amount is denominated in Canadian dollars. |
| (5) | Weighted average fixed-rate coupon that changes/updates monthly. Rate shown is the rate at March 31, 2024. |
| (6) | Step coupon security. Interest rate represents the rate in effect at March 31, 2024. |
| (7) | Inverse floating-rate security whose coupon varies inversely with changes in the interest rate index. The stated interest rate represents the coupon rate in effect at March 31, 2024. |
| (8) | Represents an investment in an issuer that may be deemed to be an affiliate (see Note 10). |
| (9) | Amount is less than 0.05%. |
| (10) | Security converts to variable rate after the indicated fixed-rate coupon period. |
| (11) | Security exempt from registration under Regulation S of the Securities Act of 1933, as amended, which exempts from registration securities offered and sold outside the United States. Security may not be offered or sold in the United States except pursuant to an exemption from, or in a transaction not subject to, the registration requirements of the Securities Act of 1933, as amended. At March 31, 2024, the aggregate value of these securities is $19,297,372 or 1.3% of the Fund's net assets. |
| (12) | Perpetual security with no stated maturity date but may be subject to calls by the issuer. |
| (13) | Issuer is in default with respect to interest and/or principal payments. |
| (14) | When-issued security. |
| (15) | TBA (To Be Announced) securities are purchased on a forward commitment basis with an approximate principal amount and maturity date. The actual principal amount, which is not expected to differ significantly from the commitment amount, and maturity date are determined upon settlement. |
| (16) | For fair value measurement disclosure purposes, security is categorized as Level 3 (see Note 11). |
| (17) | Non-income producing security. |
| (18) | May be deemed to be an affiliated investment company. The rate shown is the annualized seven-day yield as of March 31, 2024. |
| Country Concentration of Portfolio | ||
| Country | Percentage of Total Investments | Value |
| United States | 84.6% | $1,402,253,182 |
| France | 2.1 | 34,124,434 |
| Canada | 1.8 | 29,711,813 |
| Mexico | 1.7 | 28,904,000 |
| Cayman Islands | 1.6 | 26,227,170 |
| United Kingdom | 1.5 | 25,231,159 |
| Spain | 0.7 | 11,631,618 |
| Italy | 0.7 | 11,147,479 |
| Ireland | 0.7 | 10,990,048 |
| Brazil | 0.6 | 9,818,305 |
| Netherlands | 0.5 | 8,746,010 |
| Jersey | 0.5 | 8,526,131 |
| Switzerland | 0.5 | 8,066,420 |
| South Africa | 0.5 | 7,915,122 |
| Bermuda | 0.3 | 5,591,937 |
| Israel | 0.3 | 4,671,254 |
| Uruguay | 0.2 | 4,173,667 |
| Dominican Republic | 0.2 | 3,393,406 |
| Norway | 0.2 | 3,177,950 |
| Hong Kong | 0.2 | 2,596,638 |
| Australia | 0.2 | 2,543,825 |
| Supranational | 0.1 | 1,980,304 |
| Chile | 0.1 | 1,923,750 |
| Indonesia | 0.1 | 1,858,033 |
| Luxembourg | 0.1 | 1,644,376 |
| Total Investments | 100.0% | $1,656,848,031 |
| Forward Foreign Currency Exchange Contracts (OTC) | |||||||
| Currency Purchased | Currency Sold | Counterparty | Settlement Date | Unrealized Appreciation | Unrealized (Depreciation) | ||
| BRL | 43,473,357 | USD | 8,667,110 | Citibank, N.A. | 4/30/24 | $ — | $ (23,616) |
| JPY | 1,110,000,000 | USD | 7,564,687 | Citibank, N.A. | 4/30/24 | — | (200,763) |
| USD | 5,285,557 | CAD | 7,139,531 | State Street Bank and Trust Company | 4/30/24 | 12,546 | — |
| USD | 3,134,592 | EUR | 2,907,464 | Credit Agricole Corporate and Investment Bank | 4/30/24 | — | (5,516) |
| $12,546 | $(229,895) | ||||||
| Futures Contracts | |||||
| Description | Number of Contracts | Position | Expiration Date | Notional Amount | Value/Unrealized Appreciation (Depreciation) |
| Interest Rate Futures | |||||
| U.S. 2-Year Treasury Note | 1,418 | Long | 6/28/24 | $289,958,845 | $ (121,388) |
| U.S. 5-Year Treasury Note | 1,579 | Long | 6/28/24 | 168,977,672 | 306,412 |
| U.S. 10-Year Treasury Note | 50 | Long | 6/18/24 | 5,539,844 | 20,444 |
| U.S. Long Treasury Bond | 229 | Long | 6/18/24 | 27,580,188 | 498,064 |
| U.S. Ultra-Long Treasury Bond | 25 | Long | 6/18/24 | 3,225,000 | 56,997 |
| U.S. Ultra 10-Year Treasury Note | 33 | Long | 6/18/24 | 3,782,109 | (3,111) |
| $ 757,418 | |||||
| Abbreviations: | |
| OTC | – Over-the-counter |
| SOFR | – Secured Overnight Financing Rate |
| STACR | – Structured Agency Credit Risk |
| TBA | – To Be Announced |
| Currency Abbreviations: | |
| BRL | – Brazilian Real |
| CAD | – Canadian Dollar |
| DOP | – Dominican Peso |
| EUR | – Euro |
| JPY | – Japanese Yen |
| MXN | – Mexican Peso |
| USD | – United States Dollar |
| UYU | – Uruguayan Peso |
| March 31, 2024 | |
| Assets | |
| Unaffiliated investments, at value (identified cost $1,563,506,912) | $ 1,533,982,417 |
| Affiliated investments, at value (identified cost $124,529,569) | 122,865,614 |
| Deposits for derivatives collateral — Futures contracts | 5,081,800 |
| Foreign currency, at value (identified cost $1,729) | 1,732 |
| Interest and dividends receivable | 11,980,755 |
| Interest and dividends receivable from affiliated investments | 518,165 |
| Receivable for investments sold | 119,396,739 |
| Receivable for Fund shares sold | 4,925,716 |
| Receivable for open forward foreign currency exchange contracts | 12,546 |
| Tax reclaims receivable | 39,120 |
| Receivable from affiliates | 209,418 |
| Trustees' deferred compensation plan | 19,488 |
| Total assets | $1,799,033,510 |
| Liabilities | |
| Payable for investments purchased | $ 106,481,807 |
| Payable for when-issued securities/forward purchase commitments | 166,909,764 |
| Payable for Fund shares redeemed | 3,868,293 |
| Payable for variation margin on open futures contracts | 336,586 |
| Payable for open forward foreign currency exchange contracts | 229,895 |
| Distributions payable | 14,892 |
| Due to custodian | 7,858 |
| Payable to affiliates: | |
| Investment adviser fee | 537,769 |
| Distribution and service fees | 48,215 |
| Trustees' deferred compensation plan | 19,488 |
| Accrued expenses | 322,656 |
| Total liabilities | $ 278,777,223 |
| Net Assets | $1,520,256,287 |
| Sources of Net Assets | |
| Paid-in capital | $ 1,638,914,153 |
| Accumulated loss | (118,657,866) |
| Net Assets | $1,520,256,287 |
| Class A Shares | |
| Net Assets | $ 97,523,266 |
| Shares Outstanding | 9,477,400 |
| Net Asset Value and Redemption Price Per Share (net assets ÷ shares of beneficial interest outstanding) | $ 10.29 |
| Maximum Offering Price Per Share (100 ÷ 96.75 of net asset value per share) | $ 10.64 |
| Class C Shares | |
| Net Assets | $ 33,367,474 |
| Shares Outstanding | 3,244,443 |
| Net Asset Value and Offering Price Per Share* (net assets ÷ shares of beneficial interest outstanding) | $ 10.28 |
| Class I Shares | |
| Net Assets | $ 1,333,369,079 |
| Shares Outstanding | 129,684,406 |
| Net Asset Value, Offering Price and Redemption Price Per Share (net assets ÷ shares of beneficial interest outstanding) | $ 10.28 |
| March 31, 2024 | |
| Class R6 Shares | |
| Net Assets | $55,996,468 |
| Shares Outstanding | 5,448,776 |
| Net Asset Value, Offering Price and Redemption Price Per Share (net assets ÷ shares of beneficial interest outstanding) | $ 10.28 |
| On sales of $100,000 or more, the offering price of Class A shares is reduced. | |
| * | Redemption price per share is equal to the net asset value less any applicable contingent deferred sales charge. |
| Six Months Ended | |
| March 31, 2024 | |
| Investment Income | |
| Dividend income (net of foreign taxes withheld of $16,466) | $ 338,102 |
| Dividend income from affiliated investments | 1,820,644 |
| Interest income (net of foreign taxes withheld of $2,095) | 36,111,506 |
| Interest income from affiliated investments | 525,025 |
| Other income | 20,819 |
| Total investment income | $38,816,096 |
| Expenses | |
| Investment adviser fee | $ 2,844,995 |
| Distribution and service fees: | |
| Class A | 114,067 |
| Class C | 155,198 |
| Trustees’ fees and expenses | 21,218 |
| Custodian fee | 144,575 |
| Transfer and dividend disbursing agent fees | 468,627 |
| Legal and accounting services | 74,684 |
| Printing and postage | 49,905 |
| Registration fees | 90,333 |
| Interest expense and fees | 80,427 |
| Miscellaneous | 35,434 |
| Total expenses | $ 4,079,463 |
| Deduct: | |
| Waiver and/or reimbursement of expenses by affiliates | $ 639,566 |
| Total expense reductions | $ 639,566 |
| Net expenses | $ 3,439,897 |
| Net investment income | $35,376,199 |
| Realized and Unrealized Gain (Loss) | |
| Net realized gain (loss): | |
| Investment transactions | $ (4,834,748) |
| Futures contracts | 156,847 |
| Swap contracts | (164,309) |
| Foreign currency transactions | 37,550 |
| Forward foreign currency exchange contracts | (130,728) |
| Net realized loss | $ (4,935,388) |
| Change in unrealized appreciation (depreciation): | |
| Investments | $ 59,091,409 |
| Investments - affiliated investments | 520,351 |
| Futures contracts | 2,578,134 |
| Foreign currency | 11,355 |
| Forward foreign currency exchange contracts | (13,108) |
| Net change in unrealized appreciation (depreciation) | $62,188,141 |
| Net realized and unrealized gain | $57,252,753 |
| Net increase in net assets from operations | $92,628,952 |
| Six Months Ended March 31, 2024 (Unaudited) | Year Ended September 30, 2023 | |
| Increase (Decrease) in Net Assets | ||
| From operations: | ||
| Net investment income | $ 35,376,199 | $ 43,226,016 |
| Net realized loss | (4,935,388) | (59,601,652) |
| Net change in unrealized appreciation (depreciation) | 62,188,141 | 15,913,131 |
| Net increase (decrease) in net assets from operations | $ 92,628,952 | $ (462,505) |
| Distributions to shareholders: | ||
| Class A | $ (2,502,777) | $ (4,282,150) |
| Class C | (734,334) | (1,256,979) |
| Class I | (32,822,240) | (39,402,038) |
| Class R6 | (288,081) | (713) (1) |
| Total distributions to shareholders | $ (36,347,432) | $ (44,941,880) |
| Transactions in shares of beneficial interest: | ||
| Class A | $ 6,521,464 | $ 3,949,587 |
| Class C | 2,508,149 | 41,155 |
| Class I | 317,274,150 | 483,872,938 |
| Class R6 | 55,480,410 | 50,713 (1) |
| Net increase in net assets from Fund share transactions | $ 381,784,173 | $ 487,914,393 |
| Net increase in net assets | $ 438,065,693 | $ 442,510,008 |
| Net Assets | ||
| At beginning of period | $ 1,082,190,594 | $ 639,680,586 |
| At end of period | $1,520,256,287 | $1,082,190,594 |
| (1) | For the period from the commencement of operations, June 30, 2023, to September 30, 2023. |
| Class A | ||||||
| Six Months Ended March 31, 2024 (Unaudited) | Year Ended September 30, | |||||
| 2023 | 2022 | 2021 | 2020 | 2019 | ||
| Net asset value — Beginning of period | $ 9.830 | $10.230 | $ 12.340 | $ 11.820 | $ 11.990 | $ 11.570 |
| Income (Loss) From Operations | ||||||
| Net investment income(1) | $ 0.269 | $ 0.484 | $ 0.325 | $ 0.330 | $ 0.395 | $ 0.427 |
| Net realized and unrealized gain (loss) | 0.468 | (0.380) | (2.017) | 0.573 | (0.143) | 0.451 |
| Total income (loss) from operations | $ 0.737 | $ 0.104 | $ (1.692) | $ 0.903 | $ 0.252 | $ 0.878 |
| Less Distributions | ||||||
| From net investment income | $ (0.277) | $ (0.504) | $ (0.345) | $ (0.323) | $ (0.413) | $ (0.458) |
| From net realized gain | — | — | (0.073) | (0.060) | (0.009) | — |
| Total distributions | $ (0.277) | $ (0.504) | $ (0.418) | $ (0.383) | $ (0.422) | $ (0.458) |
| Net asset value — End of period | $10.290 | $ 9.830 | $10.230 | $ 12.340 | $ 11.820 | $ 11.990 |
| Total Return(2)(3) | 7.57% (4) | 1.03% | (14.10)% | 7.72% | 2.21% | 7.76% |
| Ratios/Supplemental Data | ||||||
| Net assets, end of period (000’s omitted) | $ 97,523 | $86,929 | $ 86,430 | $107,380 | $136,688 | $137,889 |
| Ratios (as a percentage of average daily net assets): | ||||||
| Expenses (3) | 0.75% (5)(6)(7) | 0.74% (6) | 0.74% (6) | 0.74% | 0.74% | 0.74% |
| Net investment income | 5.33% (5) | 4.73% | 2.84% | 2.70% | 3.38% | 3.62% |
| Portfolio Turnover | 141% (4)(8) | 190% (8) | 118% (8) | 85% (8) | 89% | 75% |
| (1) | Computed using average shares outstanding. |
| (2) | Returns are historical and are calculated by determining the percentage change in net asset value with all distributions reinvested and do not reflect the effect of sales charges. |
| (3) | The administrator reimbursed certain operating expenses (equal to 0.10%, 0.12%, 0.10%, 0.08%, 0.11% and 0.11% of average daily net assets for the six months ended March 31, 2024 and the years ended September 30, 2023, 2022, 2021, 2020 and 2019, respectively). Absent this reimbursement, total return would be lower. |
| (4) | Not annualized. |
| (5) | Annualized. |
| (6) | Includes a reduction by the investment adviser of a portion of its adviser fee due to the Fund’s investment in the Liquidity Fund (equal to less than 0.01% of average daily net assets for the six months ended March 31, 2024 and less than 0.005% of average daily net assets for the years ended September 30, 2023 and 2022). |
| (7) | Includes interest expense of 0.01% of average daily net assets for the six months ended March 31, 2024. |
| (8) | Includes the effect of To-Be-Announced (TBA) transactions. |
| Class C | ||||||
| Six Months Ended March 31, 2024 (Unaudited) | Year Ended September 30, | |||||
| 2023 | 2022 | 2021 | 2020 | 2019 | ||
| Net asset value — Beginning of period | $ 9.820 | $10.220 | $ 12.330 | $ 11.820 | $ 11.990 | $ 11.560 |
| Income (Loss) From Operations | ||||||
| Net investment income(1) | $ 0.231 | $ 0.407 | $ 0.236 | $ 0.238 | $ 0.307 | $ 0.344 |
| Net realized and unrealized gain (loss) | 0.468 | (0.381) | (2.014) | 0.564 | (0.142) | 0.456 |
| Total income (loss) from operations | $ 0.699 | $ 0.026 | $ (1.778) | $ 0.802 | $ 0.165 | $ 0.800 |
| Less Distributions | ||||||
| From net investment income | $ (0.239) | $ (0.426) | $ (0.259) | $ (0.232) | $ (0.326) | $ (0.370) |
| From net realized gain | — | — | (0.073) | (0.060) | (0.009) | — |
| Total distributions | $ (0.239) | $ (0.426) | $ (0.332) | $ (0.292) | $ (0.335) | $ (0.370) |
| Net asset value — End of period | $10.280 | $ 9.820 | $10.220 | $12.330 | $11.820 | $11.990 |
| Total Return(2)(3) | 7.18% (4) | 0.17% | (14.67)% | 6.83% | 1.45% | 7.05% |
| Ratios/Supplemental Data | ||||||
| Net assets, end of period (000’s omitted) | $ 33,367 | $29,457 | $ 30,639 | $ 48,423 | $ 54,189 | $ 52,001 |
| Ratios (as a percentage of average daily net assets): | ||||||
| Expenses (3) | 1.50% (5)(6)(7) | 1.49% (6) | 1.49% (6) | 1.49% | 1.49% | 1.49% |
| Net investment income | 4.58% (5) | 3.97% | 2.05% | 1.95% | 2.63% | 2.93% |
| Portfolio Turnover | 141% (4)(8) | 190% (8) | 118% (8) | 85% (8) | 89% | 75% |
| (1) | Computed using average shares outstanding. |
| (2) | Returns are historical and are calculated by determining the percentage change in net asset value with all distributions reinvested and do not reflect the effect of sales charges. |
| (3) | The administrator reimbursed certain operating expenses (equal to 0.10%, 0.12%, 0.10%, 0.08%, 0.11% and 0.11% of average daily net assets for the six months ended March 31, 2024 and the years ended September 30, 2023, 2022, 2021, 2020 and 2019, respectively). Absent this reimbursement, total return would be lower. |
| (4) | Not annualized. |
| (5) | Annualized. |
| (6) | Includes a reduction by the investment adviser of a portion of its adviser fee due to the Fund’s investment in the Liquidity Fund (equal to less than 0.01% of average daily net assets for the six months ended March 31, 2024 and less than 0.005% of average daily net assets for the years ended September 30, 2023 and 2022). |
| (7) | Includes interest expense of 0.01% of average daily net assets for the six months ended March 31, 2024. |
| (8) | Includes the effect of To-Be-Announced (TBA) transactions. |
| Class I | ||||||
| Six Months Ended March 31, 2024 (Unaudited) | Year Ended September 30, | |||||
| 2023 | 2022 | 2021 | 2020 | 2019 | ||
| Net asset value — Beginning of period | $ 9.820 | $ 10.220 | $ 12.330 | $ 11.810 | $ 11.990 | $ 11.560 |
| Income (Loss) From Operations | ||||||
| Net investment income(1) | $ 0.281 | $ 0.515 | $ 0.353 | $ 0.356 | $ 0.423 | $ 0.457 |
| Net realized and unrealized gain (loss) | 0.468 | (0.386) | (2.016) | 0.578 | (0.152) | 0.460 |
| Total income (loss) from operations | $ 0.749 | $ 0.129 | $ (1.663) | $ 0.934 | $ 0.271 | $ 0.917 |
| Less Distributions | ||||||
| From net investment income | $ (0.289) | $ (0.529) | $ (0.374) | $ (0.354) | $ (0.442) | $ (0.487) |
| From net realized gain | — | — | (0.073) | (0.060) | (0.009) | — |
| Total distributions | $ (0.289) | $ (0.529) | $ (0.447) | $ (0.414) | $ (0.451) | $ (0.487) |
| Net asset value — End of period | $ 10.280 | $ 9.820 | $ 10.220 | $ 12.330 | $ 11.810 | $ 11.990 |
| Total Return(2)(3) | 7.71% (4) | 1.28% | (13.89)% | 8.00% | 2.37% | 8.12% |
| Ratios/Supplemental Data | ||||||
| Net assets, end of period (000’s omitted) | $1,333,369 | $965,756 | $522,611 | $630,403 | $531,191 | $622,727 |
| Ratios (as a percentage of average daily net assets): | ||||||
| Expenses (3) | 0.50% (5)(6)(7) | 0.49% (6) | 0.49% (6) | 0.49% | 0.49% | 0.49% |
| Net investment income | 5.56% (5) | 5.04% | 3.07% | 2.92% | 3.62% | 3.89% |
| Portfolio Turnover | 141% (4)(8) | 190% (8) | 118% (8) | 85% (8) | 89% | 75% |
| (1) | Computed using average shares outstanding. |
| (2) | Returns are historical and are calculated by determining the percentage change in net asset value with all distributions reinvested. |
| (3) | The administrator reimbursed certain operating expenses (equal to 0.10%, 0.12%, 0.10%, 0.08%, 0.11% and 0.11% of average daily net assets for the six months ended March 31, 2024 and the years ended September 30, 2023, 2022, 2021, 2020 and 2019, respectively). Absent this reimbursement, total return would be lower. |
| (4) | Not annualized. |
| (5) | Annualized. |
| (6) | Includes a reduction by the investment adviser of a portion of its adviser fee due to the Fund’s investment in the Liquidity Fund (equal to less than 0.01% of average daily net assets for the six months ended March 31, 2024 and less than 0.005% of average daily net assets for the years ended September 30, 2023 and 2022). |
| (7) | Includes interest expense of 0.01% of average daily net assets for the six months ended March 31, 2024. |
| (8) | Includes the effect of To-Be-Announced (TBA) transactions. |
| Class R6 | ||
| Six Months Ended March 31, 2024 (Unaudited) | Period Ended September 30, 2023(1) | |
| Net asset value — Beginning of period | $ 9.820 | $10.190 |
| Income (Loss) From Operations | ||
| Net investment income(2) | $ 0.273 | $ 0.124 |
| Net realized and unrealized gain (loss) | 0.479 | (0.349) |
| Total income (loss) from operations | $ 0.752 | $ (0.225) |
| Less Distributions | ||
| From net investment income | $ (0.292) | $ (0.145) |
| Total distributions | $ (0.292) | $ (0.145) |
| Net asset value — End of period | $10.280 | $ 9.820 |
| Total Return(3)(4) | 7.74% (5) | (2.23)% (5) |
| Ratios/Supplemental Data | ||
| Net assets, end of period (000’s omitted) | $ 55,996 | $ 49 |
| Ratios (as a percentage of average daily net assets): | ||
| Expenses (4) | 0.42% (6)(7)(8) | 0.43% (6)(7) |
| Net investment income | 5.32% (7) | 4.92% (7) |
| Portfolio Turnover | 141% (5)(9) | 190% (5)(9)(10) |
| (1) | For the period from the commencement of operations, June 30, 2023, to September 30, 2023. |
| (2) | Computed using average shares outstanding. |
| (3) | Returns are historical and are calculated by determining the percentage change in net asset value with all distributions reinvested. |
| (4) | The administrator reimbursed certain operating expenses (equal to 0.15% and 0.12% of average daily net assets for the six months ended March 31, 2024 and the period ended September 30, 2023, respectively). Absent this reimbursement, total return would be lower. |
| (5) | Not annualized. |
| (6) | Includes a reduction by the investment adviser of a portion of its adviser fee due to the Fund’s investment in the Liquidity Fund (equal to 0.01% of average daily net assets for the six months ended March 31, 2024 and less than 0.005% of average daily net assets for the period ended September 30, 2023). |
| (7) | Annualized. |
| (8) | Includes interest expense of less than 0.005% of average daily net assets for the six months ended March 31, 2024. |
| (9) | Includes the effect of To-Be-Announced (TBA) transactions. |
| (10) | For the year ended September 30, 2023. |
shares are sold at net asset value and are not subject to a sales charge. Each class represents a pro rata interest in the Fund, but votes separately on class-specific matters and (as noted below) is subject to different expenses. Realized and unrealized gains and losses are allocated daily to each class of shares based on the relative net assets of each class to the total net assets of the Fund. Net investment income, other than class-specific expenses, is allocated daily to each class of shares based upon the ratio of the value of each class’s paid shares to the total value of all paid shares. Sub-accounting, recordkeeping and similar administrative fees payable to financial intermediaries, which are a component of transfer and dividend disbursing agent fees on the Statement of Operations, are not allocated to Class R6 shares. Each class of shares differs in its distribution plan and certain other class-specific expenses.
generally at the average mean of bid and ask quotations obtained from a third party pricing service.
Premiums paid for purchasing options that are exercised or closed are added to the amounts paid or offset against the proceeds on the underlying investment transaction to determine the realized gain or loss. An option on a futures contract gives the holder the right to enter into a specified futures contract. As the purchaser of an index option, the Fund has the right to receive a cash payment equal to any depreciation in the value of the index below the exercise price of the option (in the case of a put) or equal to any appreciation in the value of the index over the exercise price of the option (in the case of a call) as of the valuation date of the option. The risk associated with purchasing options is limited to the premium originally paid. Purchased options traded over-the-counter involve risk that the issuer or counterparty will fail to perform its contractual obligations.
that are treated as ordinary for tax purposes plus ordinary losses attributable to that portion of a taxable year after December 31.
| Aggregate cost | $1,690,518,866 |
| Gross unrealized appreciation | $ 22,263,926 |
| Gross unrealized depreciation | (55,394,692) |
| Net unrealized depreciation | $ (33,130,766) |
| Average Daily Net Assets | Annual Fee Rate |
| Up to $1 billion | 0.450% |
| $1 billion but less than $2.5 billion | 0.425% |
| $2.5 billion but less than $5 billion | 0.410% |
| Over $5 billion | 0.400% |
| Purchases | Sales | |
| Investments (non-U.S. Government) | $ 734,713,767 | $ 531,263,628 |
| U.S. Government and Agency Securities | 1,498,574,065 | 1,308,678,866 |
| $2,233,287,832 | $1,839,942,494 |
| Six Months Ended March 31, 2024 (Unaudited) | Year Ended September 30, 2023 | ||||
| Shares | Amount | Shares | Amount | ||
| Class A | |||||
| Sales | 1,772,949 | $ 18,039,310 | 2,335,544 | $ 23,857,818 | |
| Issued to shareholders electing to receive payments of distributions in Fund shares | 241,678 | 2,452,123 | 410,809 | 4,199,476 | |
| Redemptions | (1,379,962) | (13,969,969) | (2,356,311) | (24,107,707) | |
| Net increase | 634,665 | $ 6,521,464 | 390,042 | $ 3,949,587 | |
| Class C | |||||
| Sales | 685,426 | $ 6,959,948 | 872,744 | $ 8,980,066 | |
| Issued to shareholders electing to receive payments of distributions in Fund shares | 72,334 | 733,355 | 122,982 | 1,255,899 | |
| Redemptions | (511,529) | (5,185,154) | (995,642) | (10,194,810) | |
| Net increase | 246,231 | $ 2,508,149 | 84 | $ 41,155 | |
| Class I | |||||
| Sales | 52,598,375 | $ 531,355,054 | 72,454,658 | $ 742,501,585 | |
| Issued to shareholders electing to receive payments of distributions in Fund shares | 3,229,918 | 32,793,545 | 3,859,269 | 39,351,769 | |
| Redemptions | (24,465,766) | (246,874,449) | (29,144,875) | (297,980,416) | |
| Net increase | 31,362,527 | $ 317,274,150 | 47,169,052 | $ 483,872,938 | |
| Class R6(1) | |||||
| Sales | 5,481,147 | $ 55,859,934 | 4,907 | $ 50,000 | |
| Issued to shareholders electing to receive payments of distributions in Fund shares | 28,061 | 288,081 | 71 | 713 | |
| Redemptions | (65,410) | (667,605) | — | — | |
| Net increase | 5,443,798 | $ 55,480,410 | 4,978 | $ 50,713 | |
| (1) | For the period from the commencement of operations, June 30, 2023, to September 30, 2023. |
| Fair Value | |||
| Risk | Derivative | Asset Derivative | Liability Derivative |
| Foreign Exchange | Forward foreign currency exchange contracts | $ 12,546(1) | $ (229,895)(2) |
| Interest Rate | Futures contracts | 881,917 (3) | (124,499) (3) |
| Total | $894,463 | $(354,394) | |
| Derivatives not subject to master netting or similar agreements | $881,917 | $(124,499) | |
| Total Derivatives subject to master netting or similar agreements | $ 12,546 | $(229,895) | |
| (1) | Statement of Assets and Liabilities location: Receivable for open forward foreign currency exchange contracts. |
| (2) | Statement of Assets and Liabilities location: Payable for open forward foreign currency exchange contracts. |
| (3) | Only the current day’s variation margin on open futures contracts is reported within the Statement of Assets and Liabilities as Receivable or Payable for variation margin on open futures contracts, as applicable. |
| Counterparty | Derivative Assets Subject to Master Netting Agreement | Derivatives Available for Offset | Non-cash Collateral Received(a) | Cash Collateral Received(a) | Net Amount of Derivative Assets(b) |
| State Street Bank and Trust Company | $12,546 | $ — | $ — | $ — | $12,546 |
| Counterparty | Derivative Liabilities Subject to Master Netting Agreement | Derivatives Available for Offset | Non-cash Collateral Pledged(a) | Cash Collateral Pledged(a) | Net Amount of Derivative Liabilities(c) |
| Citibank, N.A. | $ (224,379) | $ — | $ — | $ — | $ (224,379) |
| Credit Agricole Corporate and Investment Bank | (5,516) | — | — | — | (5,516) |
| $(229,895) | $ — | $ — | $ — | $(229,895) |
| (a) | In some instances, the total collateral received and/or pledged may be more than the amount shown due to overcollateralization. |
| (b) | Net amount represents the net amount due from the counterparty in the event of default. |
| (c) | Net amount represents the net amount payable to the counterparty in the event of default. |
| Statement of Operations Caption | Credit | Foreign Exchange | Interest Rate | Total |
| Net realized gain (loss): | ||||
| Investment transactions | $ — | $ — | $ (169,514) | $ (169,514) |
| Futures contracts | — | — | 156,847 | 156,847 |
| Swap contracts | (164,309) | — | — | (164,309) |
| Forward foreign currency exchange contracts | — | (130,728) | — | (130,728) |
| Total | $(164,309) | $(130,728) | $ (12,667) | $ (307,704) |
| Change in unrealized appreciation (depreciation): | ||||
| Investments | $ — | $ — | $ (3,069) | $ (3,069) |
| Futures contracts | — | — | 2,578,134 | 2,578,134 |
| Forward foreign currency exchange contracts | — | (13,108) | — | (13,108) |
| Total | $ — | $ (13,108) | $2,575,065 | $2,561,957 |
| Futures Contracts — Long | Futures Contracts — Short | Forward Foreign Currency Exchange Contracts* | Swap Contracts |
| $409,680,000 | $896,000 | $18,482,000 | $1,571,000 |
| * | The average notional amount for forward foreign currency exchange contracts is based on the absolute value of notional amounts of currency purchased and currency sold. |
| Name | Value, beginning of period | Purchases | Sales proceeds | Net realized gain (loss) | Change in unrealized appreciation (depreciation) | Value, end of period | Interest/ Dividend income | Principal amount/ Shares, end of period |
| Affiliated Investment Funds | ||||||||
| Eaton Vance Emerging Markets Local Income Fund, Class I | $ — | $ 10,351,337 | $ — | $ — | $(118,564) | $ 10,232,773 | $ 351,337 | 2,992,039 |
| Commercial Mortgage-Backed Securities | ||||||||
| Morgan Stanley Bank of America Merrill Lynch Trust: | ||||||||
| Series 2016-C29, Class C, 4.717%, 5/15/49 | $3,633,419 | $ — | $ — | $ — | $ 249,008 | $ 3,882,427 | $ 99,601 | $ 4,198,800 |
| Series 2016-C29, Class D, 3.00%, 5/15/49 | 2,189,292 | — | — | — | 294,035 | 2,491,553 | 53,940 | 3,047,635 |
| Series 2016-C32, Class D, 3.396%, 12/15/49 | 3,303,944 | — | — | — | (69,941) | 3,250,295 | 101,193 | 5,000,000 |
| Morgan Stanley Capital I Trust: | ||||||||
| Series 2019-BPR, Class B, 8.018%, (1 mo. SOFR+2.692%), 5/15/36 | 3,787,158 | — | — | — | 105,515 | 3,898,441 | 167,282 | 3,960,000 |
| Series 2019-BPR, Class C, 8.968%, (1 mo. SOFR+3.642%), 5/15/36 | 2,100,512 | — | — | — | 60,298 | 2,162,599 | 103,009 | 2,219,000 |
| Name | Value, beginning of period | Purchases | Sales proceeds | Net realized gain (loss) | Change in unrealized appreciation (depreciation) | Value, end of period | Interest/ Dividend income | Principal amount/ Shares, end of period |
| Short-Term Investments | ||||||||
| Liquidity Fund | $7,241,977 | $498,284,134 | $(408,578,585) | $ — | $ — | $ 96,947,526 | $ 1,469,307 | 96,947,526 |
| Total | $ — | $ 520,351 | $122,865,614 | $2,345,669 | ||||
| • | Level 1 – quoted prices in active markets for identical investments |
| • | Level 2 – other significant observable inputs (including quoted prices for similar investments, interest rates, prepayment speeds, credit risk, etc.) |
| • | Level 3 – significant unobservable inputs (including a fund's own assumptions in determining the fair value of investments) |
| Asset Description | Level 1 | Level 2 | Level 3* | Total |
| Affiliated Investment Funds | $ 10,232,773 | $ — | $ — | $ 10,232,773 |
| Asset-Backed Securities | — | 254,256,912 | — | 254,256,912 |
| Collateralized Mortgage Obligations | — | 77,863,218 | — | 77,863,218 |
| Commercial Mortgage-Backed Securities | — | 117,706,073 | — | 117,706,073 |
| Convertible Bonds | — | 2,348,649 | — | 2,348,649 |
| Corporate Bonds | — | 500,389,466 | — | 500,389,466 |
| Preferred Stocks | 4,679,467 | — | — | 4,679,467 |
| Sovereign Government Bonds | — | 20,295,867 | — | 20,295,867 |
| U.S. Government Agency Mortgage-Backed Securities | — | 132,214,675 | — | 132,214,675 |
| U.S. Treasury Obligations | — | 439,913,405 | — | 439,913,405 |
| Miscellaneous | — | — | 0 | 0 |
| Short-Term Investments | 96,947,526 | — | — | 96,947,526 |
| Total Investments | $ 111,859,766 | $ 1,544,988,265 | $ 0 | $ 1,656,848,031 |
| Forward Foreign Currency Exchange Contracts | $ — | $ 12,546 | $ — | $ 12,546 |
| Futures Contracts | 881,917 | — | — | 881,917 |
| Total | $ 112,741,683 | $ 1,545,000,811 | $ 0 | $ 1,657,742,494 |
| Liability Description | ||||
| Forward Foreign Currency Exchange Contracts | $ — | $ (229,895) | $ — | $ (229,895) |
| Liability Description (continued) | Level 1 | Level 2 | Level 3 | Total |
| Futures Contracts | $ (124,499) | $ — | $ — | $ (124,499) |
| Total | $ (124,499) | $ (229,895) | $ — | $ (354,394) |
| * | None of the unobservable inputs for Level 3 assets, individually or collectively, had a material impact on the Fund. |
| Officers | |
| Kenneth A. Topping President | Nicholas S. Di Lorenzo Secretary |
| Deidre E. Walsh Vice President and Chief Legal Officer | Laura T. Donovan Chief Compliance Officer |
| James F. Kirchner Treasurer | |
| Trustees |
| George J. Gorman Chairperson | |
| Alan C. Bowser | |
| Mark R. Fetting | |
| Cynthia E. Frost | |
| Valerie A. Mosley | |
| Anchal Pachnanda* |
| Keith Quinton | |
| Marcus L. Smith | |
| Susan J. Sutherland | |
| Scott E. Wennerholm | |
| Nancy A. Wiser |
| * | Interested Trustee |
| U.S. Customer Privacy Notice | March 2024 |
| FACTS | WHAT DOES EATON VANCE DO WITH YOUR PERSONAL INFORMATION? |
| Why? | Financial companies choose how they share your personal information. Federal law gives consumers the right to limit some but not all sharing. Federal law also requires us to tell you how we collect, share, and protect your personal information. Please read this notice carefully to understand what we do. |
| What? | The types of personal information we collect and share depend on the product or service you have with us. This information can include:■ Social Security number and income ■ investment experience and risk tolerance ■ checking account information and wire transfer instructions |
| How? | All financial companies need to share customers’ personal information to run their everyday business. In the section below, we list the reasons financial companies can share their customers’ personal information; the reasons Eaton Vance chooses to share; and whether you can limit this sharing. |
| Reasons we can share your personal information | Does Eaton Vance share? | Can you limit this sharing? |
| For our everyday business purposes — such as to process your transactions, maintain your account(s), respond to court orders and legal investigations, or report to credit bureaus | Yes | No |
| For our marketing purposes — to offer our products and services to you | Yes | No |
| For joint marketing with other financial companies | No | We don’t share |
| For our affiliates’ everyday business purposes — information about your transactions and experiences | Yes | No* |
| For our affiliates’ everyday business purposes — information about your creditworthiness | Yes | Yes* |
| For our affiliates to market to you | Yes | Yes* |
| For nonaffiliates to market to you | No | We don’t share |
| To limit our sharing | Call toll-free 1-800-262-1122 or email: EVPrivacy@eatonvance.comPlease note:If you are a new customer, we can begin sharing your information 30 days from the date we sent this notice. When you are no longer our customer, we continue to share your information as described in this notice. However, you can contact us at any time to limit our sharing. |
| Questions? | Call toll-free 1-800-262-1122 or email: EVPrivacy@eatonvance.com |
| U.S. Customer Privacy Notice — continued | March 2024 |
| Who we are | |
| Who is providing this notice? | Eaton Vance Management and our investment management affiliates (“Eaton Vance”) (see Affiliates definition below.) |
| What we do | |
| How does Eaton Vance protect my personal information? | To protect your personal information from unauthorized access and use, we use security measures that comply with federal law. These measures include computer safeguards and secured files and buildings. We have policies governing the proper handling of customer information by personnel and requiring third parties that provide support to adhere to appropriate security standards with respect to such information. |
| How does Eaton Vance collect my personal information? | We collect your personal information, for example, when you■ open an account or make deposits or withdrawals from your account ■ buy securities from us or make a wire transfer ■ give us your contact informationWe also collect your personal information from others, such as credit bureaus, affiliates, or other companies. |
| Why can’t I limit all sharing? | Federal law gives you the right to limit only■ sharing for affiliates’ everyday business purposes — information about your creditworthiness ■ affiliates from using your information to market to you ■ sharing for nonaffiliates to market to youState laws and individual companies may give you additional rights to limit sharing. (See below for more on your rights under state law.) |
| What happens when I limit sharing for an account I hold jointly with someone else? | Your choices will apply to everyone on your account. |
| Definitions | |
| Affiliates | Companies related by common ownership or control. They can be financial and nonfinancial companies.■ Our affiliates include registered investment advisers such as Eaton Vance Management, Eaton Vance Advisers International Ltd., Boston Management and Research, Calvert Research and Management, Parametric Portfolio Associates LLC, Atlanta Capital Management Company LLC, Morgan Stanley Investment Management Inc., Morgan Stanley Investment Management Co.; registered broker-dealers such as Morgan Stanley Distributors Inc. and Eaton Vance Distributors, Inc. (together, the “Investment Management Affiliates”); and companies with a Morgan Stanley name and financial companies such as Morgan Stanley Smith Barney LLC and Morgan Stanley & Co. (the “Morgan Stanley Affiliates”). |
| Nonaffiliates | Companies not related by common ownership or control. They can be financial and nonfinancial companies.■ Eaton Vance does not share with nonaffiliates so they can market to you. |
| Joint marketing | A formal agreement between nonaffiliated financial companies that together market financial products or services to you.■ Eaton Vance does not jointly market. |
| U.S. Customer Privacy Notice — continued | March 2024 |
| Other important information | |
| *PLEASE NOTE: Eaton Vance does not share your creditworthiness information or your transactions and experiences information with the Morgan Stanley Affiliates, nor does Eaton Vance enable the Morgan Stanley Affiliates to market to you. Your opt outs will prevent Eaton Vance from sharing your creditworthiness information with the Investment Management Affiliates and will prevent the Investment Management Affiliates from marketing their products to you.Vermont: Except as permitted by law, we will not share personal information we collect about Vermont residents with Nonaffiliates unless you provide us with your written consent to share such information.California: Except as permitted by law, we will not share personal information we collect about California residents with Nonaffiliates and we will limit sharing such personal information with our Affiliates to comply with California privacy laws that apply to us. |
One Post Office Square
Boston, MA 02109
One Post Office Square
Boston, MA 02109
One Post Office Square
Boston, MA 02109
(617) 482-8260
One Congress Street, Suite 1
Boston, MA 02114-2016
Attn: Eaton Vance Funds
P.O. Box 534439
Pittsburgh, PA 15253-4439
(800) 262-1122
One Post Office Square
Boston, MA 02109


| % Average Annual Total Returns1,2 | Class Inception Date | Performance Inception Date | Six Months | One Year | Five Years | Ten Years |
| Class A at NAV | 01/06/1998 | 03/16/1978 | 8.88% | 3.76% | 1.01% | 2.52% |
| Class A with 3.25% Maximum Sales Charge | — | — | 5.29 | 0.43 | 0.36 | 2.18 |
| Class C at NAV | 05/02/2006 | 03/16/1978 | 8.52 | 2.86 | 0.25 | 1.90 |
| Class C with 1% Maximum Deferred Sales Charge | — | — | 7.52 | 1.86 | 0.25 | 1.90 |
| Class I at NAV | 03/16/1978 | 03/16/1978 | 9.03 | 4.01 | 1.27 | 2.78 |
| Bloomberg Municipal Bond Index | — | — | 7.48% | 3.13% | 1.59% | 2.66% |
| % Total Annual Operating Expense Ratios3 | Class A | Class C | Class I |
| 1.00% | 1.75% | 0.75% |
| % Distribution Rates/Yields4 | Class A | Class C | Class I |
| Distribution Rate | 3.48% | 2.73% | 3.74% |
| Taxable-Equivalent Distribution Rate | 5.89 | 4.61 | 6.31 |
| SEC 30-day Yield | 2.99 | 2.33 | 3.34 |
| Taxable-Equivalent SEC 30-day Yield | 5.04 | 3.94 | 5.63 |
| % Total Leverage5 | |
| Residual Interest Bond (RIB) Financing | 1.79% |
| Credit Quality (% of total investments)1,2 |

| 1 | For purposes of the Fund’s rating restrictions, ratings are based on Moody’s Investors Service, Inc. (“Moody’s”), S&P Global Ratings (“S&P”) or Fitch Ratings (“Fitch”), as applicable. If securities are rated differently by the ratings agencies, the highest rating is applied. Ratings, which are subject to change, apply to the creditworthiness of the issuers of the underlying securities and not to the Fund or its shares. Credit ratings measure the quality of a bond based on the issuer’s creditworthiness, with ratings ranging from AAA, being the highest, to D, being the lowest based on S&P’s measures. Ratings of BBB or higher by S&P or Fitch (Baa or higher by Moody’s) are considered to be investment-grade quality. Credit ratings are based largely on the ratings agency’s analysis at the time of rating. The rating assigned to any particular security is not necessarily a reflection of the issuer’s current financial condition and does not necessarily reflect its assessment of the volatility of a security’s market value or of the liquidity of an investment in the security. Holdings designated as “Not Rated” (if any) are not rated by the national ratings agencies stated above. |
| 2 | The chart includes the municipal bonds held by a trust that issues residual interest bonds, consistent with the Portfolio of Investments. |
| % Average Annual Total Returns1,2 | Class Inception Date | Performance Inception Date | Six Months | One Year | Five Years | Ten Years |
| Class A at NAV | 04/05/1994 | 12/19/1985 | 8.33% | 4.61% | 1.77% | 3.24% |
| Class A with 3.25% Maximum Sales Charge | — | — | 4.86 | 1.21 | 1.10 | 2.90 |
| Class C at NAV | 12/03/1993 | 12/19/1985 | 7.93 | 3.82 | 1.02 | 2.63 |
| Class C with 1% Maximum Deferred Sales Charge | — | — | 6.93 | 2.82 | 1.02 | 2.63 |
| Class I at NAV | 07/01/1999 | 12/19/1985 | 8.47 | 4.87 | 2.02 | 3.50 |
| Bloomberg Municipal Bond Index | — | — | 7.48% | 3.13% | 1.59% | 2.66% |
| % Total Annual Operating Expense Ratios3 | Class A | Class C | Class I |
| 0.75% | 1.50% | 0.50% |
| % Distribution Rates/Yields4 | Class A | Class C | Class I |
| Distribution Rate | 3.65% | 2.90% | 3.90% |
| Taxable-Equivalent Distribution Rate | 6.17 | 4.90 | 6.59 |
| SEC 30-day Yield | 3.29 | 2.65 | 3.65 |
| Taxable-Equivalent SEC 30-day Yield | 5.56 | 4.48 | 6.17 |
| % Total Leverage5 | |
| RIB Financing | 1.29% |
| Credit Quality (% of total investments)1,2 |

| 1 | For purposes of the Fund’s rating restrictions, ratings are based on Moody’s Investors Service, Inc. (“Moody’s”), S&P Global Ratings (“S&P”) or Fitch Ratings (“Fitch”), as applicable. If securities are rated differently by the ratings agencies, the highest rating is applied. Ratings, which are subject to change, apply to the creditworthiness of the issuers of the underlying securities and not to the Fund or its shares. Credit ratings measure the quality of a bond based on the issuer’s creditworthiness, with ratings ranging from AAA, being the highest, to D, being the lowest based on S&P’s measures. Ratings of BBB or higher by S&P or Fitch (Baa or higher by Moody’s) are considered to be investment-grade quality. Credit ratings are based largely on the ratings agency’s analysis at the time of rating. The rating assigned to any particular security is not necessarily a reflection of the issuer’s current financial condition and does not necessarily reflect its assessment of the volatility of a security’s market value or of the liquidity of an investment in the security. Holdings designated as “Not Rated” (if any) are not rated by the national ratings agencies stated above. |
| 2 | The chart includes the municipal bonds held by a trust that issues residual interest bonds, consistent with the Portfolio of Investments. |
| 1 | Bloomberg Municipal Bond Index is an unmanaged index of municipal bonds traded in the U.S. Unless otherwise stated, index returns do not reflect the effect of any applicable sales charges, commissions, expenses, taxes or leverage, as applicable. It is not possible to invest directly in an index. |
| 2 | Total Returns at NAV do not include applicable sales charges. If sales charges were deducted, the returns would be lower. Total Returns shown with maximum sales charge reflect the stated maximum sales charge. Unless otherwise stated, performance does not reflect the deduction of taxes on Fund distributions or redemptions of Fund shares.Effective November 5, 2020, Class C shares automatically convert to Class A shares eight years after purchase. The average annual total returns listed for Class C reflect conversion to Class A shares after eight years. Prior to November 5, 2020, Class C shares automatically converted to Class A shares ten years after purchase. |
| 3 | Source: Fund prospectus. The expense ratios for the current reporting period can be found in the Financial Highlights section of this report. |
| 4 | The Distribution Rate is based on the Fund’s last regular distribution per share in the period (annualized) divided by the Fund’s NAV at the end of the period. The Fund’s distributions may be comprised of amounts characterized for federal income tax purposes as tax-exempt income, qualified and non-qualified ordinary dividends, capital gains and nondividend distributions, also known as return of capital. The Fund will determine the federal income tax character of distributions paid to a shareholder after the end of the calendar year. This is reported on the IRS form 1099-DIV and provided to the shareholder shortly after each year-end. The Fund’s distributions are determined by the investment adviser based on its current assessment of the Fund’s long-term return potential. As portfolio and market conditions change, the rate of distributions paid by the Fund could change. Taxable-equivalent performance is based on the highest combined federal and state income tax rates, where applicable. Lower tax rates would result in lower tax-equivalent performance. Actual tax rates will vary depending on your income, exemptions and deductions. Rates do not include local taxes. The SEC Yield is a standardized measure based on the estimated yield to maturity of a fund’s investments over a 30-day period and is based on the maximum offer price at the date specified. The SEC Yield is not based on the distributions made by the Fund, which may differ. |
| 5 | Fund employs RIB financing. The leverage created by RIB investments provides an opportunity for increased income but, at the same time, creates special risks (including the likelihood of greater volatility of NAV). The cost of leverage rises and falls with changes in short-term interest rates. See “Floating Rate Notes Issued in Conjunction with Securities Held” in the notes to the financial statements for more information about RIB financing. RIB leverage represents the amount of Floating Rate Notes outstanding at period end as a percentage of Fund net assets plus Floating Rate Notes. |
| Fund profiles subject to change due to active management. |
| Beginning Account Value (10/1/23) | Ending Account Value (3/31/24) | Expenses Paid During Period* (10/1/23 – 3/31/24) | Annualized Expense Ratio | |
| Actual | ||||
| Class A | $1,000.00 | $1,088.80 | $4.96 | 0.95% |
| Class C | $1,000.00 | $1,085.20 | $8.86 | 1.70% |
| Class I | $1,000.00 | $1,090.30 | $3.66 | 0.70% |
| Hypothetical | ||||
| (5% return per year before expenses) | ||||
| Class A | $1,000.00 | $1,020.25 | $4.80 | 0.95% |
| Class C | $1,000.00 | $1,016.50 | $8.57 | 1.70% |
| Class I | $1,000.00 | $1,021.50 | $3.54 | 0.70% |
| * | Expenses are equal to the Fund’s annualized expense ratio for the indicated Class, multiplied by the average account value over the period, multiplied by 183/366 (to reflect the one-half year period). The Example assumes that the $1,000 was invested at the net asset value per share determined at the close of business on September 30, 2023. |
| Beginning Account Value (10/1/23) | Ending Account Value (3/31/24) | Expenses Paid During Period* (10/1/23 – 3/31/24) | Annualized Expense Ratio | |
| Actual | ||||
| Class A | $1,000.00 | $1,083.30 | $3.75 | 0.72% |
| Class C | $1,000.00 | $1,079.30 | $7.64 | 1.47% |
| Class I | $1,000.00 | $1,084.70 | $2.45 | 0.47% |
| Hypothetical | ||||
| (5% return per year before expenses) | ||||
| Class A | $1,000.00 | $1,021.40 | $3.64 | 0.72% |
| Class C | $1,000.00 | $1,017.65 | $7.41 | 1.47% |
| Class I | $1,000.00 | $1,022.65 | $2.38 | 0.47% |
| * | Expenses are equal to the Fund’s annualized expense ratio for the indicated Class, multiplied by the average account value over the period, multiplied by 183/366 (to reflect the one-half year period). The Example assumes that the $1,000 was invested at the net asset value per share determined at the close of business on September 30, 2023. |
| Tax-Exempt Mortgage-Backed Securities — 0.4% |
| Security | Principal Amount (000's omitted) | Value | |
| Housing — 0.4% | |||
| California Housing Finance Agency, Municipal Certificates, Series 2021-1, Class A, 3.50%, 11/20/35 | $ | 1,007 | $ 944,978 |
| Total Tax-Exempt Mortgage-Backed Securities (identified cost $957,037) | $ 944,978 | ||
| Tax-Exempt Municipal Obligations — 103.3% |
| Security | Principal Amount (000's omitted) | Value | |
| Education — 3.7% | |||
| District of Columbia, (KIPP DC), 4.00%, 7/1/44 | $ | 105 | $ 97,212 |
| Florida Development Finance Corp., (River City Science Academy), 4.00%, 7/1/45 | 25 | 21,628 | |
| Georgia Private Colleges and Universities Authority, (Savannah College of Art and Design): | |||
| 4.00%, 4/1/40 | 1,400 | 1,413,104 | |
| 4.00%, 4/1/44 | 1,500 | 1,470,585 | |
| Ohio Higher Educational Facility Commission, (Oberlin College), Green Bonds, 5.00%, 10/1/48 | 2,000 | 2,184,340 | |
| University of California, 5.00%, 5/15/40 | 2,500 | 2,922,750 | |
| $ 8,109,619 | |||
| Electric Utilities — 4.9% | |||
| Douglas County Public Utility District No. 1, WA, 3.00%, 9/1/52 | $ | 1,355 | $ 1,043,350 |
| Gainesville, FL, Utilities System Revenue, (SPA: Barclays Bank PLC), 3.95%, 10/1/42(1) | 600 | 600,000 | |
| Georgia Municipal Electric Power Authority, 5.00%, 1/1/39 | 2,000 | 2,000,360 | |
| Los Angeles Department of Water and Power, CA, Power System Revenue, 5.00%, 7/1/38(2) | 2,500 | 2,956,675 | |
| Seattle, WA, Municipal Light and Power Improvement Revenue, 4.00%, 7/1/47 | 2,500 | 2,444,800 | |
| Utility Debt Securitization Authority, NY, Green Bonds, 5.00%, 12/15/49 | 1,500 | 1,642,140 | |
| $ 10,687,325 | |||
| Escrowed/Prerefunded — 3.9% | |||
| New Jersey Economic Development Authority, (School Facilities Construction), Prerefunded to 12/15/28, 5.00%, 6/15/37 | $ | 3,000 | $ 3,307,560 |
| Security | Principal Amount (000's omitted) | Value | |
| Escrowed/Prerefunded (continued) | |||
| San Joaquin Hills Transportation Corridor Agency, CA, Prerefunded to 1/15/25, 5.00%, 1/15/34 | $ | 5,235 | $ 5,300,490 |
| $ 8,608,050 | |||
| General Obligations — 21.6% | |||
| California, 4.00%, 9/1/43(2) | $ | 2,950 | $ 3,016,345 |
| Chicago Board of Education, IL: | |||
| 5.00%, 12/1/42 | 390 | 389,977 | |
| 5.00%, 12/1/44 | 2,000 | 2,010,800 | |
| Chicago, IL: | |||
| 5.00%, 1/1/39 | 1,400 | 1,461,124 | |
| 5.00%, 1/1/44 | 1,490 | 1,535,222 | |
| Del Valle Independent School District, TX, (PSF Guaranteed), 4.00%, 6/15/47 | 4,000 | 3,912,560 | |
| District of Columbia, 4.00%, 2/1/46 | 3,500 | 3,462,515 | |
| Hutto Independent School District, TX, (PSF Guaranteed), 5.00%, 8/1/53 | 3,000 | 3,247,020 | |
| Illinois: | |||
| 4.00%, 11/1/40 | 1,000 | 968,730 | |
| 5.00%, 5/1/35 | 2,000 | 2,001,340 | |
| 5.50%, 5/1/39 | 205 | 225,693 | |
| 5.50%, 3/1/42 | 2,300 | 2,562,269 | |
| 5.75%, 5/1/45 | 210 | 229,891 | |
| New York, NY: | |||
| 4.00%, 9/1/46 | 2,000 | 1,952,900 | |
| 4.00%, 4/1/50 | 2,000 | 1,942,180 | |
| Northwest Independent School District, TX, (PSF Guaranteed), 4.00%, 2/15/47 | 3,000 | 2,966,760 | |
| Prosper Independent School District, TX, (PSF Guaranteed): | |||
| 4.00%, 2/15/47 | 3,500 | 3,461,220 | |
| 4.00%, 2/15/54 | 2,000 | 1,920,720 | |
| Salem-Keizer School District No. 24J, OR, 0.00%, 6/15/24 | 1,220 | 1,210,435 | |
| Spring Branch Independent School District, TX, (PSF Guaranteed), 4.50%, 2/1/47 | 8,750 | 8,950,987 | |
| $ 47,428,688 | |||
| Hospital — 8.3% | |||
| Brevard County Health Facilities Authority, FL, (Health First Obligated Group): | |||
| 5.00%, 4/1/47 | $ | 2,500 | $ 2,619,025 |
| 5.00%, 4/1/52 | 2,500 | 2,613,950 | |
| California Statewide Communities Development Authority, (Loma Linda University Medical Center), 5.25%, 12/1/34 | 3,000 | 3,030,030 | |
| Security | Principal Amount (000's omitted) | Value | |
| Hospital (continued) | |||
| Colorado Health Facilities Authority, (CommonSpirit Health), 5.25%, 11/1/52 | $ | 1,000 | $ 1,073,810 |
| Delaware Health Facilities Authority, (Beebe Medical Center): | |||
| 5.00%, 6/1/36 | 3,730 | 3,804,301 | |
| 5.00%, 6/1/37 | 1,000 | 1,014,320 | |
| Fairfax County Industrial Development Authority, VA, (Inova Health System), 4.00%, 5/15/48 | 575 | 555,456 | |
| Harris County Cultural Education Facilities Finance Corp., TX, (Methodist Hospital), 3.85%, 12/1/59(1) | 400 | 400,000 | |
| New York Dormitory Authority, (Northwell Health Obligated Group), 5.00%, 5/1/52 | 1,010 | 1,066,833 | |
| Ohio Higher Educational Facility Commission, (University Hospitals Health System, Inc.), 4.00%, 1/15/39 | 2,100 | 2,102,247 | |
| $ 18,279,972 | |||
| Housing — 2.6% | |||
| Cuyahoga Metropolitan Housing Authority, OH, Social Bonds, 2.00%, 12/1/31 | $ | 1,250 | $ 1,046,462 |
| Massachusetts Housing Finance Agency, (FHLMC), (FNMA), (GNMA), Social Bonds, 4.95%, 12/1/53 | 2,500 | 2,531,575 | |
| Phoenix Industrial Development Authority, AZ, (Downtown Phoenix Student Housing, LLC - Arizona State University): | |||
| 5.00%, 7/1/37 | 500 | 510,455 | |
| 5.00%, 7/1/42 | 1,250 | 1,257,775 | |
| Texas Student Housing Corp., (University of North Texas), 9.375%, 7/1/06(3) | 285 | 285,000 | |
| $ 5,631,267 | |||
| Insured - Education — 0.9% | |||
| Virginia College Building Authority, (Washington and Lee University), (NPFG), 5.25%, 1/1/31 | $ | 1,750 | $ 1,957,322 |
| $ 1,957,322 | |||
| Insured - Electric Utilities — 1.1% | |||
| Ohio Municipal Electric Generation Agency, (NPFG), 0.00%, 2/15/29 | $ | 2,865 | $ 2,419,779 |
| $ 2,419,779 | |||
| Insured - General Obligations — 2.2% | |||
| McCamey Independent School District, TX, (AGM), 4.00%, 2/15/53 | $ | 3,500 | $ 3,297,770 |
| Proviso Township High School District No. 209, IL, (AGM), 4.00%, 12/1/38 | 1,500 | 1,510,110 | |
| $ 4,807,880 | |||
| Security | Principal Amount (000's omitted) | Value | |
| Insured - Lease Revenue/Certificates of Participation — 3.2% | |||
| Anaheim Public Financing Authority, CA, (Anaheim Public Improvements), (AGM), 0.00%, 9/1/31 | $ | 8,680 | $ 6,961,794 |
| $ 6,961,794 | |||
| Insured - Other Revenue — 0.5% | |||
| Hudson Yards Infrastructure Corp., NY, (AGM), 4.00%, 2/15/47 | $ | 1,155 | $ 1,123,746 |
| $ 1,123,746 | |||
| Insured - Special Tax Revenue — 7.3% | |||
| Harris County-Houston Sports Authority, TX, (AGM), (NPFG), 0.00%, 11/15/34 | $ | 10,600 | $ 6,603,164 |
| Massachusetts, Dedicated Tax Revenue: | |||
| (NPFG), 5.50%, 1/1/27 | 6,000 | 6,408,240 | |
| (NPFG), 5.50%, 1/1/30 | 2,565 | 2,946,544 | |
| $ 15,957,948 | |||
| Insured - Transportation — 7.1% | |||
| E-470 Public Highway Authority, CO, (NPFG), 0.00%, 9/1/39 | $ | 7,120 | $ 3,355,514 |
| Pennsylvania Turnpike Commission, (AGM), 6.375%, 12/1/38 | 11,000 | 12,195,260 | |
| $ 15,550,774 | |||
| Insured - Water and Sewer — 0.9% | |||
| Michigan Finance Authority, (Detroit Water and Sewerage Department): | |||
| (AGM), 5.00%, 7/1/32 | $ | 655 | $ 656,683 |
| (AGM), 5.00%, 7/1/33 | 565 | 566,056 | |
| (AGM), 5.00%, 7/1/35 | 280 | 280,594 | |
| (AGM), 5.00%, 7/1/37 | 565 | 565,876 | |
| $ 2,069,209 | |||
| Lease Revenue/Certificates of Participation — 5.5% | |||
| Maryland Stadium Authority, Built to Learn Revenue, 4.00%, 6/1/52 | $ | 2,550 | $ 2,441,906 |
| New Hampshire Business Finance Authority, (Centurion BioSquare, Inc.), 5.88%, 12/15/38 | 1,000 | 1,026,230 | |
| New Jersey Economic Development Authority, (Portal North Bridge), 5.25%, 11/1/47 | 4,000 | 4,372,840 | |
| New Jersey Transportation Trust Fund Authority, (Transportation Program), 5.00%, 6/15/50 | 2,500 | 2,579,925 | |
| New Jersey Transportation Trust Fund Authority, (Transportation System), 4.00%, 6/15/36 | 1,665 | 1,728,586 | |
| $ 12,149,487 | |||
| Security | Principal Amount (000's omitted) | Value | |
| Other Revenue — 3.9% | |||
| Black Belt Energy Gas District, AL, (Liq: Royal Bank of Canada), 4.00% to 12/1/31 (Put Date), 6/1/51 | $ | 2,500 | $ 2,521,600 |
| Buckeye Tobacco Settlement Financing Authority, OH, 5.00%, 6/1/55 | 1,600 | 1,515,376 | |
| California Community Choice Financing Authority, Clean Energy Project Revenue: | |||
| Green Bonds, 5.00% to 8/1/29 (Put Date), 12/1/53 | 750 | 792,495 | |
| Green Bonds, 5.25% to 4/1/30 (Put Date), 11/1/54 | 1,660 | 1,786,741 | |
| Central Falls Detention Facility Corp., RI, 7.25%, 7/15/35(3) | 1,200 | 480,000 | |
| Main Street Natural Gas, Inc., GA, Gas Supply Revenue, 5.00% to 12/1/30 (Put Date), 5/1/54 | 1,500 | 1,577,250 | |
| $ 8,673,462 | |||
| Senior Living/Life Care — 3.5% | |||
| California Public Finance Authority, (Enso Village), Green Bonds, 2.375%, 11/15/28(4) | $ | 140 | $ 136,840 |
| Manhattan, KS, (Meadowlark Hills), 4.00%, 6/1/46 | 1,180 | 954,785 | |
| National Finance Authority, NH, (The Vista): | |||
| 5.25%, 7/1/39(4) | 265 | 249,331 | |
| 5.625%, 7/1/46(4) | 360 | 335,157 | |
| 5.75%, 7/1/54(4) | 775 | 717,611 | |
| New Hope Cultural Education Facilities Finance Corp., TX, (The Outlook at Windhaven), 6.75%, 10/1/52 | 1,000 | 938,950 | |
| Pompano Beach, FL, (John Knox Village), 4.00%, 9/1/41 | 1,270 | 1,102,017 | |
| Saint Louis County Industrial Development Authority, MO, (St. Andrew's Resources for Seniors Obligated Group), 5.00%, 12/1/35 | 1,700 | 1,651,601 | |
| Washington Housing Finance Commission, (Horizon House), 5.00%, 1/1/30(4) | 1,730 | 1,731,609 | |
| $ 7,817,901 | |||
| Special Tax Revenue — 13.2% | |||
| Connecticut, Special Tax Obligation, (Transportation Infrastructure), 5.25%, 7/1/42 | $ | 2,250 | $ 2,561,805 |
| Dallas Area Rapid Transit, TX, Sales Tax Revenue, 4.00%, 12/1/51 | 2,500 | 2,397,775 | |
| Massachusetts Bay Transportation Authority, Sales Tax Revenue, 4.00%, 7/1/51 | 1,405 | 1,371,196 | |
| Metropolitan Pier and Exposition Authority, IL, (McCormick Place Expansion), 4.00%, 6/15/50 | 5,000 | 4,593,150 | |
| New York City Transitional Finance Authority, NY, Future Tax Revenue: | |||
| 4.00%, 5/1/39 | 1,000 | 1,019,010 | |
| 4.00%, 5/1/45 | 1,380 | 1,355,684 | |
| 5.00%, 11/1/46(5) | 2,000 | 2,170,860 | |
| (SPA: JPMorgan Chase Bank, N.A.), 4.00%, 8/1/45(1) | 1,100 | 1,100,000 | |
| Security | Principal Amount (000's omitted) | Value | |
| Special Tax Revenue (continued) | |||
| New York Dormitory Authority, Personal Income Tax Revenue, 4.00%, 2/15/39 | $ | 3,000 | $ 3,056,370 |
| New York State Urban Development Corp., Personal Income Tax Revenue, Green Bonds, 4.00%, 3/15/50 | 2,485 | 2,375,635 | |
| New York Thruway Authority, Personal Income Tax Revenue, 4.00%, 3/15/44 | 1,000 | 987,430 | |
| Puerto Rico Sales Tax Financing Corp.: | |||
| 0.00%, 7/1/51 | 4,500 | 1,054,890 | |
| 5.00%, 7/1/58 | 2,817 | 2,828,522 | |
| Tampa, FL, (Central and Lower Basin Stormwater Improvements), 5.00%, 5/1/46 | 2,000 | 2,154,320 | |
| $ 29,026,647 | |||
| Transportation — 5.6% | |||
| Atlanta, GA, Airport Revenue, Green Bonds, 5.00%, 7/1/48 | $ | 2,000 | $ 2,194,880 |
| Charlotte, NC, (Charlotte Douglas International Airport), 5.00%, 7/1/48(5) | 2,000 | 2,194,880 | |
| Denver City and County, CO, Airport System Revenue, 5.25%, 11/15/53 | 2,000 | 2,205,760 | |
| Metropolitan Transportation Authority, NY, Green Bonds, 4.75%, 11/15/45 | 225 | 231,840 | |
| New Jersey Turnpike Authority, 5.25%, 1/1/52 | 1,000 | 1,095,740 | |
| New York Transportation Development Corp., (Terminal 4 John F. Kennedy International Airport), 4.00%, 12/1/42 | 2,400 | 2,295,024 | |
| South Jersey Transportation Authority, NJ, 4.625%, 11/1/47 | 1,500 | 1,536,765 | |
| Texas Transportation Commission, 0.00%, 8/1/40 | 1,000 | 465,090 | |
| $ 12,219,979 | |||
| Water and Sewer — 3.4% | |||
| New York City Municipal Water Finance Authority, NY, (Water and Sewer System): | |||
| 4.00%, 6/15/41 | $ | 4,500 | $ 4,543,605 |
| 4.00%, 6/15/51 | 2,000 | 1,944,060 | |
| 5.25%, 6/15/52(5) | 1,000 | 1,098,020 | |
| $ 7,585,685 | |||
| Total Tax-Exempt Municipal Obligations (identified cost $219,587,470) | $ 227,066,534 | ||
| Total Investments — 103.7% (identified cost $220,544,507) | $ 228,011,512 | ||
| Other Assets, Less Liabilities — (3.7)% | $ (8,078,503) | ||
| Net Assets — 100.0% | $ 219,933,009 | ||
| The percentage shown for each investment category in the Portfolio of Investments is based on net assets. | |
| (1) | Variable rate demand obligation that may be tendered at par on any day for payment the same or next business day. The stated interest rate, which generally resets daily, is determined by the remarketing agent and represents the rate in effect at March 31, 2024. |
| (2) | When-issued security. |
| (3) | Defaulted security. Issuer has defaulted on the payment of interest and/or principal or has filed for bankruptcy. |
| (4) | Security exempt from registration under Rule 144A of the Securities Act of 1933, as amended. These securities may be sold in certain transactions in reliance on an exemption from registration (normally to qualified institutional buyers). At March 31, 2024, the aggregate value of these securities is $3,170,548 or 1.4% of the Fund's net assets. |
| (5) | Security represents the municipal bond held by a trust that issues residual interest bonds (see Note 1H). |
| At March 31, 2024, the concentration of the Fund’s investments in the various states and territories, determined as a percentage of net assets, is as follows: | |
| Texas | 17.7% |
| New York | 13.6% |
| California | 12.7% |
| Others, representing less than 10% individually | 59.7% |
| The Fund invests primarily in debt securities issued by municipalities. The ability of the issuers of the debt securities to meet their obligations may be affected by economic developments in a specific industry or municipality. At March 31, 2024, 22.3% of total investments are backed by bond insurance of various financial institutions and financial guaranty assurance agencies. The aggregate percentage insured by an individual financial institution or financial guaranty assurance agency ranged from 10.4% to 14.8% of total investments. |
| Abbreviations: | |
| AGM | – Assured Guaranty Municipal Corp. |
| FHLMC | – Federal Home Loan Mortgage Corp. |
| FNMA | – Federal National Mortgage Association |
| GNMA | – Government National Mortgage Association |
| Liq | – Liquidity Provider |
| NPFG | – National Public Finance Guarantee Corp. |
| PSF | – Permanent School Fund |
| SPA | – Standby Bond Purchase Agreement |
| Corporate Bonds — 1.1% |
| Security | Principal Amount (000's omitted) | Value | |
| Education — 0.6% | |||
| Chapman University, 1.867%, 4/1/29 | $ | 5,160 | $ 4,382,724 |
| Grand Canyon University, 4.125%, 10/1/24 | 20,000 | 19,489,200 | |
| $ 23,871,924 | |||
| Hospital — 0.5% | |||
| Sutter Health, 5.164%, 8/15/33 | $ | 14,000 | $ 14,118,052 |
| UPMC, 1.803%, 4/15/26 | 7,650 | 7,118,906 | |
| $ 21,236,958 | |||
| Total Corporate Bonds (identified cost $46,116,604) | $ 45,108,882 | ||
| Tax-Exempt Municipal Obligations — 94.3% |
| Security | Principal Amount (000's omitted) | Value | |
| Bond Bank — 1.1% | |||
| Delaware Valley Regional Finance Authority, PA, (LOC: TD Bank, N.A.), 3.65%, 11/1/55(1) | $ | 22,700 | $ 22,700,000 |
| New York State Environmental Facilities Corp., (State Revolving Fund), Green Bonds, 5.00%, 9/15/47(2) | 10,000 | 10,951,200 | |
| Rickenbacker Port Authority, OH, (OASBO Expanded Asset Pooled Financing Program), 5.375%, 1/1/32 | 9,475 | 10,720,962 | |
| $ 44,372,162 | |||
| Education — 5.1% | |||
| Florida Development Finance Corp., (River City Science Academy), 4.00%, 7/1/45 | $ | 45 | $ 38,931 |
| Massachusetts Development Finance Agency, (Boston University), 5.00%, 10/1/46 | 11,855 | 12,130,984 | |
| Minnesota Higher Education Facilities Authority, (University of St. Thomas), 5.00%, 10/1/49 | 2,750 | 2,939,310 | |
| New York Dormitory Authority, (New York University), 5.00%, 7/1/49 | 14,360 | 15,203,506 | |
| Ohio State University, 5.25%, 12/1/46 | 14,315 | 16,248,813 | |
| Pennsylvania Economic Development Financing Authority, (Villanova University), 4.00%, 8/1/54(3) | 5,000 | 4,814,800 | |
| Pennsylvania Higher Educational Facilities Authority, (University of Pennsylvania), 4.00%, 2/15/43 | 5,000 | 4,981,450 | |
| Pennsylvania State University, 4.00%, 9/1/50 | 5,920 | 5,710,077 | |
| Philadelphia Authority for Industrial Development, PA, (Temple University), 5.00%, 4/1/45 | 5,000 | 5,022,000 | |
| Security | Principal Amount (000's omitted) | Value | |
| Education (continued) | |||
| Rhode Island Health and Educational Building Corp., (Bryant University), (LOC: TD Bank, N.A.), 3.65%, 6/1/35(1) | $ | 4,735 | $ 4,735,000 |
| San Antonio Education Facilities Corp., TX, (University of the Incarnate Word), 4.00%, 4/1/54 | 3,500 | 2,830,415 | |
| University of California: | |||
| 5.00%, 5/15/36 | 20,000 | 24,060,600 | |
| 5.00%, 5/15/38 | 15,000 | 17,740,650 | |
| 5.00%, 5/15/42 | 6,205 | 7,120,920 | |
| University of California Medical Center, 5.00%, 5/15/47 | 28,170 | 30,912,068 | |
| University of Massachusetts Building Authority, 5.00%, 11/1/52 | 20,000 | 21,330,200 | |
| University of Oregon: | |||
| 5.00%, 4/1/48 | 8,470 | 8,769,415 | |
| 5.00%, 4/1/50 | 12,500 | 13,205,875 | |
| University of Texas, 4.00%, 7/1/42 | 4,900 | 4,827,774 | |
| Utah Board of Higher Education, (Dixie State University), 4.00%, 6/1/44 | 6,625 | 6,683,168 | |
| Vermont Educational and Health Buildings Financing Agency, (Middlebury College), 4.00%, 11/1/50 | 5,000 | 4,905,100 | |
| $ 214,211,056 | |||
| Electric Utilities — 4.6% | |||
| Austin, TX, Electric Utility System Revenue, 5.00%, 11/15/48 | $ | 10,000 | $ 10,948,000 |
| Colorado Springs, CO, Utilities System Revenue, (SPA: TD Bank, N.A.), 3.43%, 11/1/37(1) | 19,615 | 19,615,000 | |
| Douglas County Public Utility District No. 1, WA, 3.00%, 9/1/52 | 16,020 | 12,335,400 | |
| Fayetteville, NC, Public Works Commission Revenue: | |||
| 4.50%, 3/1/49 | 15,710 | 16,263,935 | |
| 5.00%, 3/1/46 | 5,000 | 5,524,600 | |
| Long Island Power Authority, NY, Electric System Revenue, Green Bonds, 5.00%, 9/1/48 | 5,000 | 5,526,600 | |
| Los Angeles Department of Water and Power, CA, Power System Revenue: | |||
| 5.00%, 7/1/37(3) | 10,000 | 11,939,700 | |
| 5.00%, 7/1/39(3) | 13,900 | 16,311,233 | |
| (SPA: JPMorgan Chase Bank, N.A.), 4.35%, 7/1/48(4) | 18,580 | 18,580,000 | |
| New York Power Authority, Green Bonds, 4.00%, 11/15/50 | 5,000 | 4,856,900 | |
| Omaha Public Power District, NE: | |||
| 5.00%, 2/1/47 | 20,000 | 21,696,800 | |
| 5.25%, 2/1/48 | 10,000 | 11,081,600 | |
| Philadelphia, PA, Gas Works Revenue, (LOC: TD Bank, N.A.), 3.42%, 8/1/31(1) | 12,700 | 12,700,000 | |
| Security | Principal Amount (000's omitted) | Value | |
| Electric Utilities (continued) | |||
| Seattle, WA, Municipal Light and Power Improvement Revenue, 4.00%, 7/1/43 | $ | 8,210 | $ 8,281,016 |
| South Carolina Public Service Authority, 5.00%, 12/1/46 | 12,600 | 12,493,908 | |
| Utility Debt Securitization Authority, NY, 5.00%, 12/15/40 | 5,000 | 5,851,350 | |
| $ 194,006,042 | |||
| Escrowed/Prerefunded — 0.6% | |||
| Los Angeles Department of Airports, CA, (Los Angeles International Airport), (AMT), Prerefunded 11/15/31, 5.00%, 5/15/46 | $ | 65 | $ 73,295 |
| New Jersey Economic Development Authority, (School Facilities Construction): | |||
| Prerefunded to 12/15/28, 5.00%, 6/15/34 | 8,460 | 9,327,319 | |
| Prerefunded to 12/15/28, 5.00%, 6/15/35 | 13,300 | 14,663,516 | |
| $ 24,064,130 | |||
| General Obligations — 16.6% | |||
| Alamo Community College District, TX, 4.50%, 8/15/47 | $ | 4,000 | $ 4,092,360 |
| Aldine Independent School District, TX, (PSF Guaranteed), 4.00%, 2/15/54 | 3,900 | 3,694,743 | |
| Azle Independent School District, TX, (PSF Guaranteed), 4.00%, 2/15/54 | 3,870 | 3,666,322 | |
| Beaverton School District No. 48J, OR, 5.00%, 6/15/52 | 15,000 | 16,087,650 | |
| Bethel Park School District, PA, 5.25%, 8/1/42 | 5,185 | 5,855,835 | |
| California: | |||
| 5.00%, 9/1/41(3) | 7,000 | 8,012,690 | |
| 5.00%, 11/1/42 | 25,000 | 28,045,250 | |
| 5.25%, 9/1/47 | 10,500 | 11,820,585 | |
| Chicago Board of Education, IL: | |||
| 5.00%, 12/1/30 | 9,000 | 9,280,170 | |
| 5.00%, 12/1/42 | 10,405 | 10,404,376 | |
| 5.00%, 12/1/44 | 20,515 | 20,625,781 | |
| 5.875%, 12/1/47 | 6,500 | 7,188,480 | |
| Chicago, IL: | |||
| 4.00%, 1/1/35 | 2,500 | 2,549,550 | |
| 5.00%, 1/1/44 | 12,350 | 12,724,822 | |
| 5.25%, 1/1/38 | 6,750 | 7,362,563 | |
| 5.50%, 1/1/39 | 5,000 | 5,522,200 | |
| Cypress-Fairbanks Independent School District, TX, (PSF Guaranteed): | |||
| 5.00%, 2/15/43 | 5,000 | 5,544,850 | |
| 5.00%, 2/15/44 | 5,150 | 5,686,991 | |
| District of Columbia, 4.00%, 2/1/46 | 17,450 | 17,263,110 | |
| Galveston Independent School District, TX, (PSF Guaranteed), 4.00%, 2/1/47 | 16,500 | 16,153,995 | |
| Security | Principal Amount (000's omitted) | Value | |
| General Obligations (continued) | |||
| Hacienda La Puente Unified School District, CA, (Election of 2016), 5.00%, 8/1/47 | $ | 8,265 | $ 9,096,707 |
| Harris County Flood Control District, TX: | |||
| Sustainability Bonds, 4.00%, 9/15/48 | 10,000 | 9,729,000 | |
| Sustainability Bonds, 4.25%, 10/1/47 | 10,940 | 11,020,081 | |
| Hays Consolidated Independent School District, TX, (PSF Guaranteed), 5.00%, 2/15/48 | 10,855 | 11,749,343 | |
| Humble Independent School District, TX, (PSF Guaranteed): | |||
| 4.00%, 2/15/54 | 4,500 | 4,351,230 | |
| 5.00%, 2/15/47 | 10,250 | 11,083,222 | |
| Hurst-Euless-Bedford Independent School District, TX, (PSF Guaranteed), 4.00%, 8/15/50 | 14,555 | 14,086,620 | |
| Illinois: | |||
| 4.00%, 7/1/37 | 15,000 | 15,157,650 | |
| 5.00%, 11/1/24 | 11,295 | 11,388,636 | |
| 5.00%, 2/1/27 | 18,500 | 18,520,535 | |
| 5.00%, 2/1/29 | 15,000 | 15,722,100 | |
| 5.00%, 5/1/39 | 10,000 | 10,003,700 | |
| 5.50%, 5/1/39 | 870 | 957,818 | |
| 5.50%, 3/1/42 | 11,700 | 13,034,151 | |
| 5.75%, 5/1/45 | 890 | 974,301 | |
| Klein Independent School District, TX, (PSF Guaranteed), 4.00%, 8/1/48 | 7,175 | 6,985,150 | |
| Lewisville Independent School District, TX, (PSF Guaranteed), 5.00%, 8/15/44 | 10,000 | 11,193,500 | |
| Massachusetts: | |||
| 3.00%, 4/1/49 | 10,000 | 7,885,600 | |
| 5.00%, 5/1/48 | 10,000 | 10,887,500 | |
| Milpitas Unified School District, CA, (Election of 2018), 4.00%, 8/1/41 | 4,390 | 4,533,597 | |
| New York, 5.00%, 3/15/40 | 4,865 | 5,572,371 | |
| New York, NY: | |||
| 4.00%, 9/1/46 | 10,000 | 9,764,500 | |
| 4.00%, 4/1/50 | 5,000 | 4,855,450 | |
| 5.00%, 3/1/50 | 12,350 | 13,063,459 | |
| 5.25%, 5/1/42 | 3,335 | 3,746,572 | |
| 5.25%, 10/1/47 | 5,000 | 5,503,150 | |
| (SPA: Barclays Bank PLC), 4.00%, 6/1/44(4) | 6,500 | 6,500,000 | |
| (SPA: Barclays Bank PLC), 4.00%, 10/1/46(4) | 10,000 | 10,000,000 | |
| (SPA: TD Bank, N.A.), 3.95%, 9/1/49(4) | 12,500 | 12,500,000 | |
| Northwest Independent School District, TX, (PSF Guaranteed), 5.00%, 2/15/48 | 20,000 | 21,633,600 | |
| Norwalk, CT, 4.00%, 8/15/47 | 5,000 | 4,990,251 | |
| Norwood, MA, 4.00%, 9/15/47 | 11,065 | 11,121,431 | |
| Oregon City School District No. 62, OR, 5.00%, 6/15/49 | 6,500 | 6,812,585 | |
| Security | Principal Amount (000's omitted) | Value | |
| General Obligations (continued) | |||
| Pasadena Independent School District, TX, (PSF Guaranteed), 5.00%, 2/15/48 | $ | 5,000 | $ 5,426,850 |
| Pennsylvania, 4.00%, 9/1/43 | 12,000 | 12,073,680 | |
| Prosper Independent School District, TX, (PSF Guaranteed), 4.00%, 2/15/54 | 15,000 | 14,405,400 | |
| Puerto Rico: | |||
| 4.00%, 7/1/41 | 7,522 | 7,099,341 | |
| 5.625%, 7/1/29 | 10,762 | 11,789,179 | |
| 5.75%, 7/1/31 | 12,303 | 13,884,147 | |
| Royse City Independent School District, TX, (PSF Guaranteed), 5.00%, 2/15/48(2) | 12,000 | 13,113,720 | |
| San Diego Unified School District, CA, (Election of 2022), Sustainability Bonds, 4.00%, 7/1/53 | 8,500 | 8,410,325 | |
| San Luis Coastal Unified School District, CA, (Election of 2022), 4.00%, 8/1/46 | 11,230 | 11,315,011 | |
| Santa Clarita Community College District, CA, (Election of 2016), 5.25%, 8/1/48 | 10,000 | 11,068,800 | |
| Spring Branch Independent School District, TX, (PSF Guaranteed), 4.50%, 2/1/47 | 8,750 | 8,950,988 | |
| Temple Independent School District, TX, (PSF Guaranteed), 4.25%, 2/1/47 | 13,000 | 13,073,970 | |
| Waco Independent School District, TX, (PSF Guaranteed), 4.125%, 8/15/47 | 6,000 | 5,983,980 | |
| Washington: | |||
| 5.00%, 6/1/40 | 5,350 | 5,695,610 | |
| 5.00%, 6/1/41 | 5,465 | 5,793,720 | |
| 5.00%, 6/1/42 | 5,950 | 6,294,743 | |
| Wisconsin, 4.00%, 5/1/41 | 7,090 | 7,166,572 | |
| Wylie Independent School District, TX, (PSF Guaranteed), 4.25%, 2/15/54 | 5,000 | 4,945,600 | |
| Ysleta Independent School District, TX, (PSF Guaranteed): | |||
| 4.25%, 8/15/56 | 11,000 | 10,871,080 | |
| 5.00%, 8/15/56(2) | 5,000 | 5,349,400 | |
| $ 698,718,249 | |||
| Hospital — 11.1% | |||
| Brevard County Health Facilities Authority, FL, (Health First Obligated Group): | |||
| 5.00%, 4/1/47 | $ | 10,000 | $ 10,476,100 |
| 5.00%, 4/1/52 | 10,000 | 10,455,800 | |
| California Health Facilities Financing Authority, (Cedars-Sinai Health System): | |||
| 4.00%, 8/15/48 | 19,305 | 18,917,163 | |
| 5.00%, 8/15/51 | 13,845 | 14,971,706 | |
| California Health Facilities Financing Authority, (Cedars-Sinai Medical Center), 4.00%, 8/15/36 | 8,920 | 9,033,106 | |
| Security | Principal Amount (000's omitted) | Value | |
| Hospital (continued) | |||
| Colorado Health Facilities Authority, (AdventHealth Obligated Group): | |||
| 3.00%, 11/15/51 | $ | 10,000 | $ 7,497,000 |
| 4.00%, 11/15/43 | 12,145 | 11,795,345 | |
| 4.00%, 11/15/50 | 6,530 | 6,231,971 | |
| Connecticut Health and Educational Facilities Authority, (Trinity Health Corp.), 5.00%, 12/1/41 | 5,295 | 5,408,260 | |
| Fairfax County Industrial Development Authority, VA, (Inova Health System), 4.00%, 5/15/48 | 3,645 | 3,521,106 | |
| Geisinger Authority, PA, (Geisinger Health System): | |||
| 4.00%, 6/1/41 | 8,000 | 7,855,440 | |
| 4.00%, 2/15/47 | 9,105 | 8,703,470 | |
| Greenville Health System, SC, 5.00%, 5/1/39 | 2,500 | 2,501,175 | |
| Harris County Cultural Education Facilities Finance Corp., TX, (Texas Children's Hospital), 4.00%, 10/1/47 | 10,805 | 10,442,168 | |
| Illinois Finance Authority, (Northwestern Memorial HealthCare), 4.00%, 7/15/47 | 12,500 | 12,094,250 | |
| Indiana Finance Authority, (Franciscan Alliance, Inc.), 5.00%, 11/1/41 | 5,000 | 5,067,900 | |
| Lancaster County Hospital Authority, PA, (Penn State Health), 5.00%, 11/1/46 | 10,500 | 10,904,880 | |
| Lehigh County General Purpose Authority, PA, (Lehigh Valley Health Network), 4.00%, 7/1/49 | 5,000 | 4,687,750 | |
| Maricopa County Industrial Development Authority, AZ, (Banner Health): | |||
| 4.00%, 1/1/44 | 15,000 | 14,711,850 | |
| Series 2019-E, 4.00%, 1/1/45 | 9,000 | 8,727,840 | |
| Maryland Health and Higher Educational Facilities Authority, (MedStar Health), 5.00%, 8/15/42 | 11,900 | 11,964,498 | |
| Massachusetts Development Finance Agency, (Boston Children's Hospital): | |||
| 4.00%, 3/1/54 | 7,000 | 6,767,530 | |
| (LOC: TD Bank, N.A.), 3.95%, 3/1/48(4) | 5,000 | 5,000,000 | |
| Massachusetts Development Finance Agency, (Mass General Brigham, Inc.), 5.00%, 7/1/54 | 5,000 | 5,322,150 | |
| Massachusetts Development Finance Agency, (Partners HealthCare System), 4.00%, 7/1/41 | 8,500 | 8,267,015 | |
| Michigan Finance Authority, (Beaumont Health Credit Group), 5.00%, 11/1/44 | 11,000 | 11,158,400 | |
| Michigan Finance Authority, (Henry Ford Health System), 4.00%, 11/15/50 | 11,795 | 10,733,096 | |
| Michigan Finance Authority, (Trinity Health Credit Group): | |||
| 4.00%, 12/1/49 | 5,645 | 5,296,026 | |
| 5.00%, 12/1/41 | 5,395 | 5,695,771 | |
| 5.00%, 12/1/45 | 10,000 | 10,169,700 | |
| Security | Principal Amount (000's omitted) | Value | |
| Hospital (continued) | |||
| Minneapolis, MN, (Allina Health System), 4.00%, 11/15/39 | $ | 6,405 | $ 6,461,876 |
| Minnesota Agricultural and Economic Development Board, (HealthPartners Obligated Group), 4.00%, 1/1/49 | 15,600 | 14,851,356 | |
| Missouri Health and Educational Facilities Authority, (BJC Health System): | |||
| 4.00%, 1/1/45 | 5,975 | 5,794,316 | |
| 5.00%, 1/1/44 | 6,000 | 6,002,520 | |
| Missouri Health and Educational Facilities Authority, (Children's Mercy Hospital), 4.00%, 5/15/48 | 18,120 | 17,263,286 | |
| Missouri Health and Educational Facilities Authority, (CoxHealth): | |||
| 4.00%, 11/15/49 | 10,750 | 10,279,150 | |
| 5.00%, 11/15/38 | 4,340 | 4,342,561 | |
| New York Dormitory Authority, (Northwell Health Obligated Group), 5.00%, 5/1/52 | 8,090 | 8,545,224 | |
| Norfolk Economic Development Authority, VA, (Sentara Healthcare), 4.00%, 11/1/48 | 4,005 | 3,885,251 | |
| Salem Hospital Facility Authority, OR, (Salem Health), 5.00%, 5/15/44 | 11,620 | 12,079,803 | |
| South Carolina Jobs-Economic Development Authority, (Anmed Health), 4.25%, 2/1/48 | 7,240 | 7,277,938 | |
| South Carolina Jobs-Economic Development Authority, (Bon Secours Mercy Health, Inc.), 4.00%, 12/1/44 | 5,520 | 5,386,140 | |
| South Dakota Health and Educational Facilities Authority, (Sanford Health), 5.00%, 11/1/44 | 10,000 | 10,042,800 | |
| Southcentral Pennsylvania General Authority, (WellSpan Health Obligated Group), 4.00%, 6/1/49 | 5,000 | 4,639,800 | |
| Tarrant County Cultural Education Facilities Finance Corp., TX, (Baylor Scott & White Health), 5.00%, 11/15/45 | 8,000 | 8,141,520 | |
| University of Colorado Hospital Authority, (SPA: TD Bank, N.A.), 3.65%, 11/15/39(1) | 14,360 | 14,360,000 | |
| Utah County, (IHC Health Services, Inc.), 4.00%, 5/15/47 | 8,565 | 8,288,008 | |
| Virginia Commonwealth University Health System Authority, 4.00%, 7/1/54(3) | 20,000 | 18,989,600 | |
| Washington Health Care Facilities Authority, (Seattle Children's Hospital), 4.00%, 10/1/45 | 5,000 | 4,851,050 | |
| Wisconsin Health and Educational Facilities Authority, (Ascension Health Alliance Senior Credit Group), 4.00%, 11/15/43 | 4,625 | 4,467,843 | |
| Wisconsin Health and Educational Facilities Authority, (Ascension Senior Credit Group), 4.00%, 11/15/46 | 8,600 | 8,225,728 | |
| Security | Principal Amount (000's omitted) | Value | |
| Hospital (continued) | |||
| Wisconsin Health and Educational Facilities Authority, (Children's Hospital of Wisconsin, Inc.), 4.00%, 8/15/42 | $ | 11,015 | $ 10,732,245 |
| Wisconsin Health and Educational Facilities Authority, (Thedacare, Inc.), 5.00%, 12/15/44 | 5,650 | 5,662,543 | |
| $ 464,949,024 | |||
| Housing — 3.0% | |||
| California Community Housing Agency, (Summit at Sausalito Apartments), 3.00%, 2/1/57(5) | $ | 7,355 | $ 5,084,732 |
| CSCDA Community Improvement Authority, CA, (City of Orange Portfolio), Essential Housing Revenue, Social Bonds, 3.00%, 3/1/57(5) | 25,275 | 17,592,916 | |
| CSCDA Community Improvement Authority, CA, (Pasadena Portfolio), Essential Housing Revenue, Social Bonds, 3.00%, 12/1/56(5) | 9,930 | 7,060,627 | |
| Illinois Housing Development Authority, Social Bonds, (FHLMC), (FNMA), (GNMA), 4.55%, 10/1/44 | 4,000 | 4,001,440 | |
| Indiana Finance Authority, (CHF-Tippecanoe, LLC - Student Housing), 5.00%, 6/1/53 | 2,300 | 2,368,655 | |
| Maryland Economic Development Corp., (Morgan State University), Student Housing Revenue, 5.75%, 7/1/53 | 2,000 | 2,178,220 | |
| Missouri Housing Development Commission, SFMR: | |||
| (FHLMC), (FNMA), (GNMA), 3.30%, 12/1/47 | 1,342 | 1,239,777 | |
| (FHLMC), (FNMA), (GNMA), 3.40%, 11/1/46 | 2,243 | 2,098,686 | |
| (FHLMC), (FNMA), (GNMA), 4.45%, 11/1/44 | 1,250 | 1,255,088 | |
| (FHLMC), (FNMA), (GNMA), 4.60%, 11/1/49 | 1,000 | 991,800 | |
| New Mexico Mortgage Finance Authority, Single Family Mortgage Program, (FHLMC), (FNMA), (GNMA), 4.45%, 9/1/48 | 1,490 | 1,471,032 | |
| New York City Housing Development Corp., NY: | |||
| Green Bonds, 2.60%, 11/1/46 | 3,000 | 2,107,800 | |
| Green Bonds, (SPA: TD Bank, N.A.), 3.42%, 5/1/63(1) | 4,750 | 4,750,000 | |
| Sustainability Bonds, (SPA: TD Bank, N.A.), 3.42%, 5/1/50(1) | 26,750 | 26,750,000 | |
| North Carolina Housing Finance Agency, Social Bonds, (FHLMC), (FNMA), (GNMA), 4.35%, 7/1/43 | 3,995 | 3,932,678 | |
| Pennsylvania Housing Finance Agency, SFMR: | |||
| Social Bonds, 5.00%, 10/1/50 | 7,335 | 7,572,801 | |
| Sustainability Bonds, 5.45%, 4/1/51 | 5,000 | 5,295,900 | |
| Texas Student Housing Corp., (University of Northern Texas), 6.85%, 7/1/31(6) | 10,640 | 10,640,000 | |
| Utah State University, 4.00%, 4/1/48 | 10,875 | 10,543,095 | |
| Virginia Housing Development Authority: | |||
| 5.125%, 11/1/43 | 4,640 | 5,000,899 | |
| Security | Principal Amount (000's omitted) | Value | |
| Housing (continued) | |||
| Virginia Housing Development Authority: (continued) | |||
| 5.25%, 11/1/48 | $ | 2,250 | $ 2,353,568 |
| $ 124,289,714 | |||
| Industrial Development Revenue — 2.3% | |||
| Montgomery County Industrial Development Authority, PA, (Constellation Energy Generation, LLC), 4.10% to 4/3/28 (Put Date), 4/1/53 | $ | 250 | $ 256,780 |
| New York Transportation Development Corp., (Delta Air Lines, Inc. - LaGuardia Airport Terminals C&D Redevelopment): | |||
| (AMT), 4.375%, 10/1/45 | 25,000 | 24,742,000 | |
| (AMT), 5.00%, 10/1/40 | 41,585 | 43,148,180 | |
| (AMT), 6.00%, 4/1/35 | 7,360 | 8,360,960 | |
| Northampton County Industrial Development Authority, PA, (Northampton Generating), (AMT), 5.00%, 6/30/27(7) | 14,652 | 2,637,417 | |
| Pennsylvania Economic Development Financing Authority, (Republic Services, Inc.), (AMT), 4.00% to 4/15/24 (Put Date), 4/1/34 | 6,250 | 6,248,187 | |
| South Carolina Jobs-Economic Development Authority, (International Paper Co.), (AMT), 4.00% to 4/1/26 (Put Date), 4/1/33 | 10,000 | 10,032,300 | |
| $ 95,425,824 | |||
| Insured - Electric Utilities — 0.2% | |||
| Brownsville, TX, Utility System Revenue, (BAM), 5.00%, 9/1/51 | $ | 1,195 | $ 1,245,489 |
| Garland, TX, Electric Utility System Revenue, (AGM), 4.25%, 3/1/48 | 1,750 | 1,760,220 | |
| Lower Colorado River Authority, TX, (LCRA Transmission Services Corp.), (AGM), 5.00%, 5/15/49 | 3,500 | 3,777,620 | |
| $ 6,783,329 | |||
| Insured - Escrowed/Prerefunded — 0.9% | |||
| North Texas Tollway Authority, (AGC), Prerefunded to 1/1/25, 6.20%, 1/1/42 | $ | 37,070 | $ 37,772,476 |
| $ 37,772,476 | |||
| Insured - General Obligations — 0.8% | |||
| Clark County School District, NV, (AGM), 4.25%, 6/15/41 | $ | 5,000 | $ 5,123,600 |
| Lumberton Municipal Utility District, TX, (AGM), 3.00%, 8/15/52 | 5,045 | 3,609,143 | |
| Nassau County, NY, (AGM), 5.00%, 4/1/49 | 10,335 | 11,020,210 | |
| Security | Principal Amount (000's omitted) | Value | |
| Insured - General Obligations (continued) | |||
| Sienna Parks and Levee Improvement District of Fort Bend County, TX, (BAM), 3.75%, 9/1/48 | $ | 10,450 | $ 9,362,887 |
| Waller Independent School District, TX, (BAM), 4.00%, 2/15/48 | 5,835 | 5,677,805 | |
| $ 34,793,645 | |||
| Insured - Hospital — 0.5% | |||
| California Statewide Communities Development Authority, (Enloe Medical Center), (AGM), 5.25%, 8/15/52 | $ | 800 | $ 868,736 |
| Collier County Industrial Development Authority, FL, (NHC Healthcare System), (AGM), 5.00%, 10/1/49 | 2,500 | 2,674,675 | |
| Isle of Wight County Economic Development Authority, VA, (Riverside Health System), (AGM), 5.25%, 7/1/48 | 1,500 | 1,641,075 | |
| Northampton County General Purpose Authority, PA, (St. Luke's University Health Network), (AGM), 5.00%, 8/15/49(3) | 15,760 | 16,937,745 | |
| $ 22,122,231 | |||
| Insured - Housing — 0.0%(8) | |||
| Knox County Health Educational and Housing Facility Board, TN, (University of Tennessee), (BAM), 5.50%, 7/1/54 | $ | 1,250 | $ 1,372,638 |
| $ 1,372,638 | |||
| Insured - Lease Revenue/Certificates of Participation — 0.2% | |||
| Commonwealth Financing Authority, PA, Tobacco Master Settlement Payment Revenue, (AGM), 4.00%, 6/1/39 | $ | 8,000 | $ 8,047,760 |
| $ 8,047,760 | |||
| Insured - Special Tax Revenue — 1.6% | |||
| Harris County-Houston Sports Authority, TX, (AGM), (NPFG), 0.00%, 11/15/34 | $ | 58,155 | $ 36,227,076 |
| Marshall County Board of Education, AL, (BAM), 4.125%, 3/1/49(3) | 3,365 | 3,283,028 | |
| Massachusetts, Dedicated Tax Revenue: | |||
| (NPFG), 5.50%, 1/1/29 | 11,000 | 12,358,720 | |
| (NPFG), 5.50%, 1/1/30 | 3,080 | 3,538,150 | |
| Metropolitan Pier and Exposition Authority, IL, (McCormick Place), (BAM), 4.00%, 12/15/42 | 10,440 | 10,338,941 | |
| $ 65,745,915 | |||
| Insured - Transportation — 1.4% | |||
| E-470 Public Highway Authority, CO, (NPFG), 0.00%, 9/1/37 | $ | 13,335 | $ 7,003,409 |
| Security | Principal Amount (000's omitted) | Value | |
| Insured - Transportation (continued) | |||
| Houston, TX, Airport System Revenue, (AGM), (AMT), 5.25%, 7/1/53 | $ | 12,000 | $ 12,798,840 |
| Kansas City Industrial Development Authority, MO, (Kansas City International Airport Terminal Modernization), (AGM), (AMT), 5.00%, 3/1/49 | 10,000 | 10,286,700 | |
| Love Field Airport Modernization Corp., TX, (AGM), (AMT), 4.00%, 11/1/37 | 4,000 | 4,013,320 | |
| Metropolitan Transportation Authority, NY: | |||
| Green Bonds, (AGM), 4.00%, 11/15/48 | 8,900 | 8,522,640 | |
| Green Bonds, (BAM), 4.00%, 11/15/48 | 8,000 | 7,660,800 | |
| New York Transportation Development Corp., (John F. Kennedy International Airport), Sustainability Bonds, (AGM), (AMT), 5.00%, 6/30/49 | 8,650 | 9,042,104 | |
| $ 59,327,813 | |||
| Lease Revenue/Certificates of Participation — 3.1% | |||
| Battery Park City Authority, NY, Sustainability Bonds, 5.00%, 11/1/53 | $ | 12,000 | $ 13,201,320 |
| Colorado, Certificates of Participation, 6.00%, 12/15/40 | 5,045 | 6,078,317 | |
| Maryland Stadium Authority, Built to Learn Revenue: | |||
| 4.00%, 6/1/47 | 5,595 | 5,486,849 | |
| 4.00%, 6/1/52 | 6,255 | 5,989,851 | |
| New Hampshire Business Finance Authority, (Centurion BioSquare, Inc.), 5.88%, 12/15/38 | 9,185 | 9,425,922 | |
| New Jersey Economic Development Authority, (Portal North Bridge), 5.25%, 11/1/47 | 12,700 | 13,883,767 | |
| New Jersey Transportation Trust Fund Authority, (Transportation Program): | |||
| 4.25%, 6/15/44 | 3,600 | 3,640,932 | |
| 5.00%, 6/15/46 | 6,000 | 6,527,340 | |
| 5.00%, 6/15/50 | 20,500 | 21,155,385 | |
| 2019 Series AA, 5.25%, 6/15/43 | 10,000 | 10,528,000 | |
| 2019 Series BB, 4.00%, 6/15/50 | 15,000 | 14,315,400 | |
| 2020 Series AA, 4.00%, 6/15/50 | 15,000 | 14,361,000 | |
| 2022 Series CC, 5.25%, 6/15/43 | 5,750 | 6,396,070 | |
| $ 130,990,153 | |||
| Nursing Home — 0.0%(8) | |||
| Mississippi Business Finance Corp., (Magnolia Healthcare), 7.99%, 7/1/25 | $ | 2,205 | $ 2,209,432 |
| $ 2,209,432 | |||
| Other Revenue — 4.7% | |||
| Black Belt Energy Gas District, AL, 5.25% to 10/1/30 (Put Date), 1/1/54 | $ | 11,250 | $ 12,069,225 |
| Buckeye Tobacco Settlement Financing Authority, OH, 5.00%, 6/1/55 | 38,870 | 36,814,166 | |
| Security | Principal Amount (000's omitted) | Value | |
| Other Revenue (continued) | |||
| California Community Choice Financing Authority, Clean Energy Project Revenue, Green Bonds, 5.50% to 11/1/30 (Put Date), 10/1/54 | $ | 10,330 | $ 11,395,126 |
| Central Falls Detention Facility Corp., RI, 7.25%, 7/15/35(6) | 250 | 100,000 | |
| Hudson Yards Infrastructure Corp., NY: | |||
| 5.00%, 2/15/42 | 21,500 | 22,357,850 | |
| 5.00%, 2/15/45 | 30,750 | 31,843,470 | |
| Main Street Natural Gas, Inc., GA, Gas Supply Revenue: | |||
| 5.00% to 9/1/30 (Put Date), 9/1/53 | 10,000 | 10,628,100 | |
| 5.00% to 12/1/30 (Put Date), 5/1/54 | 11,750 | 12,355,125 | |
| 5.00% to 6/1/31 (Put Date), 12/1/53 | 12,500 | 13,360,000 | |
| Minnesota Municipal Gas Agency, (Liq: Royal Bank of Canada), 4.558%, (67% of SOFR + 1.00%), 12/1/52(9) | 12,500 | 12,426,750 | |
| Northern California Energy Authority, 5.00% to 8/1/30 (Put Date), 12/1/54(3) | 3,840 | 4,107,648 | |
| Patriots Energy Group Financing Agency, SC, Gas Supply Revenue, 5.25% to 8/1/31 (Put Date), 10/1/54 | 10,750 | 11,516,797 | |
| Texas Municipal Gas Acquisition and Supply Corp. I, Gas Supply Revenue, 6.25%, 12/15/26 | 10,000 | 10,380,200 | |
| Texas Municipal Gas Acquisition and Supply Corp. II, Gas Supply Revenue, 4.38%, (66% of 3 mo. SOFR + 0.86%), 9/15/27(9) | 3,850 | 3,834,254 | |
| Tobacco Settlement Financing Corp., NJ, 5.25%, 6/1/46 | 4,970 | 5,182,517 | |
| $ 198,371,228 | |||
| Senior Living/Life Care — 1.3% | |||
| California Public Finance Authority, (Enso Village): | |||
| Green Bonds, 2.125%, 11/15/27(5) | $ | 80 | $ 80,004 |
| Green Bonds, 2.375%, 11/15/28(5) | 970 | 948,107 | |
| New Hope Cultural Education Facilities Finance Corp., TX, (Longhorn Village), 5.00%, 1/1/47 | 8,000 | 7,205,680 | |
| Palm Beach County Health Facilities Authority, FL, (Green Cay Life Plan Village), 11.50%, 7/1/27(5) | 5,550 | 6,534,403 | |
| Palm Beach County Health Facilities Authority, FL, (Toby & Leon Cooperman Sinai Residences of Boca Raton), 4.25%, 6/1/56 | 4,440 | 3,500,940 | |
| Public Finance Authority, WI, (Searstone CCRC), 3.00%, 6/1/28(5) | 17,410 | 16,446,705 | |
| South Carolina Jobs-Economic Development Authority, (Seafields Kiawah Island Project), 5.25%, 11/15/28 | 10,000 | 10,068,500 | |
| Tarrant County Cultural Education Facilities Finance Corp., TX, (MRC Stevenson Oaks): | |||
| 6.625%, 11/15/41 | 730 | 702,450 | |
| 6.75%, 11/15/51 | 3,250 | 3,034,915 | |
| 6.875%, 11/15/55 | 200 | 188,370 | |
| Security | Principal Amount (000's omitted) | Value | |
| Senior Living/Life Care (continued) | |||
| Wisconsin Health and Educational Facilities Authority, (Three Pillars Senior Living Communities), 4.20%, 8/15/28(3) | $ | 4,000 | $ 4,004,560 |
| $ 52,714,634 | |||
| Special Tax Revenue — 10.1% | |||
| Central Puget Sound Regional Transit Authority, WA, Sales and Motor Vehicle Excise Tax Revenue: | |||
| Green Bonds, 4.00%, 11/1/46 | $ | 11,825 | $ 11,599,261 |
| Green Bonds, 5.00%, 11/1/41 | 13,840 | 14,267,933 | |
| Dallas Area Rapid Transit, TX, Sales Tax Revenue: | |||
| 3.00%, 12/1/47 | 7,825 | 6,046,377 | |
| 4.00%, 12/1/51 | 3,820 | 3,663,800 | |
| Hampton Roads Transportation Accountability Commission, VA, 5.00%, 7/1/48 | 10,790 | 11,213,184 | |
| Illinois, Sales Tax Revenue, 5.00%, 6/15/39 | 15,000 | 17,091,300 | |
| Massachusetts Bay Transportation Authority, Sales Tax Revenue: | |||
| 4.00%, 7/1/48 | 5,405 | 5,319,763 | |
| 4.00%, 7/1/51 | 12,705 | 12,399,318 | |
| Metropolitan Pier and Exposition Authority, IL, (McCormick Place Expansion): | |||
| 4.00%, 6/15/50 | 12,060 | 11,078,678 | |
| 5.00%, 6/15/50 | 4,465 | 4,588,680 | |
| Michigan Trunk Line Fund: | |||
| 4.00%, 11/15/45 | 9,925 | 9,954,874 | |
| 5.00%, 11/15/46 | 18,000 | 19,967,400 | |
| New River Community Development District, FL, (Capital Improvements): | |||
| 5.00%, 5/1/13(6) | 230 | 0 | |
| 5.35%, 5/1/38(6) | 80 | 0 | |
| 5.75%, 5/1/38 | 310 | 312,350 | |
| New York City Transitional Finance Authority, NY, Future Tax Revenue: | |||
| 4.00%, 11/1/38 | 5,000 | 5,068,400 | |
| 4.00%, 5/1/45 | 10,000 | 9,837,700 | |
| 4.00%, 8/1/48 | 10,000 | 9,676,000 | |
| 5.00%, 11/1/46(2) | 13,000 | 14,110,590 | |
| 5.00%, 5/1/53 | 10,000 | 10,742,000 | |
| (SPA: JPMorgan Chase Bank, N.A.), 4.00%, 8/1/39(4) | 12,000 | 12,000,000 | |
| (SPA: JPMorgan Chase Bank, N.A.), 4.00%, 8/1/45(4) | 27,000 | 27,000,000 | |
| New York Dormitory Authority, Personal Income Tax Revenue: | |||
| 4.00%, 2/15/47 | 15,220 | 14,832,499 | |
| 5.25%, 3/15/52 | 5,000 | 5,509,100 | |
| New York Dormitory Authority, Sales Tax Revenue: | |||
| 4.00%, 3/15/49 | 5,000 | 4,880,850 | |
| Security | Principal Amount (000's omitted) | Value | |
| Special Tax Revenue (continued) | |||
| New York Dormitory Authority, Sales Tax Revenue: (continued) | |||
| 5.00%, 3/15/39 | $ | 10,000 | $ 10,710,300 |
| New York State Urban Development Corp., Personal Income Tax Revenue: | |||
| 5.00%, 3/15/49 | 25,000 | 26,935,750 | |
| Green Bonds, 4.00%, 3/15/50 | 25,585 | 24,459,004 | |
| New York State Urban Development Corp., Sales Tax Revenue, 5.00%, 3/15/49 | 10,000 | 10,966,200 | |
| New York Thruway Authority, Personal Income Tax Revenue, 4.00%, 3/15/44 | 5,000 | 4,937,150 | |
| Pennsylvania Turnpike Commission, Oil Franchise Tax Revenue, 4.00%, 12/1/51 | 5,000 | 4,772,050 | |
| Puerto Rico Sales Tax Financing Corp.: | |||
| 0.00%, 7/1/46 | 19,385 | 6,213,280 | |
| 5.00%, 7/1/58 | 38,291 | 38,447,613 | |
| Southeastern Pennsylvania Transportation Authority, 5.25%, 6/1/47 | 13,000 | 14,352,390 | |
| Southern Hills Plantation I Community Development District, FL: | |||
| Series A1, 5.80%, 5/1/35 | 355 | 335,141 | |
| Series A2, 5.80%, 5/1/35(6) | 310 | 210,487 | |
| Sterling Hill Community Development District, FL, 6.20%, 5/1/35(6) | 1,532 | 719,874 | |
| Triborough Bridge and Tunnel Authority, NY: | |||
| Series 2021A, 5.00%, 5/15/51 | 6,500 | 6,886,230 | |
| Green Bonds, 5.25%, 5/15/47 | 8,065 | 8,948,521 | |
| Triborough Bridge and Tunnel Authority, NY, Sales Tax Revenue: | |||
| 4.00%, 5/15/48 | 5,000 | 4,896,750 | |
| 4.00%, 5/15/54 | 5,000 | 4,799,000 | |
| 5.00%, 5/15/54 | 5,000 | 5,413,700 | |
| 5.25%, 5/15/59 | 7,000 | 7,705,250 | |
| $ 422,868,747 | |||
| Student Loan — 0.0%(8) | |||
| New Jersey Higher Education Student Assistance Authority, Series 2015-1A, (AMT), 4.00%, 12/1/28 | $ | 1,730 | $ 1,721,437 |
| $ 1,721,437 | |||
| Transportation — 20.1% | |||
| Allegheny County Airport Authority, PA, (Pittsburgh International Airport), (AMT), 5.00%, 1/1/51 | $ | 12,775 | $ 13,203,857 |
| Atlanta, GA, Airport Revenue: | |||
| Green Bonds, 5.00%, 7/1/44 | 7,000 | 7,791,000 | |
| Green Bonds, (AMT), 5.25%, 7/1/41 | 5,820 | 6,478,300 | |
| Security | Principal Amount (000's omitted) | Value | |
| Transportation (continued) | |||
| Austin, TX, Airport System Revenue, (AMT), 5.00%, 11/15/38 | $ | 6,175 | $ 6,497,644 |
| Bay Area Toll Authority, CA, (San Francisco Bay Area), (LOC: Barclays Bank PLC), 3.80%, 4/1/55(4) | 16,500 | 16,500,000 | |
| Charlotte, NC, (Charlotte Douglas International Airport), 5.00%, 7/1/48(2) | 4,000 | 4,389,760 | |
| Chicago, IL, (Midway International Airport): | |||
| 5.00%, 1/1/41 | 6,000 | 6,094,020 | |
| (AMT), 5.00%, 1/1/39 | 4,000 | 4,349,560 | |
| (AMT), 5.00%, 1/1/40 | 4,000 | 4,321,560 | |
| (AMT), 5.00%, 1/1/41 | 9,985 | 9,985,200 | |
| Chicago, IL, (O'Hare International Airport): | |||
| 4.00%, 1/1/44 | 9,500 | 9,315,320 | |
| (AMT), 5.00%, 1/1/34 | 12,500 | 12,600,375 | |
| (AMT), 5.00%, 1/1/47 | 22,085 | 22,348,695 | |
| (AMT), 5.00%, 1/1/53 | 14,370 | 14,687,577 | |
| (AMT), 5.25%, 1/1/53 | 11,500 | 12,080,750 | |
| Dallas and Fort Worth, TX, (Dallas/Fort Worth International Airport), 4.00%, 11/1/45 | 10,000 | 9,730,200 | |
| Delaware River Port Authority of Pennsylvania and New Jersey, 5.00%, 1/1/40 | 5,000 | 5,005,500 | |
| Denver City and County, CO, Airport System Revenue: | |||
| (AMT), 4.00%, 12/1/43 | 5,000 | 4,830,300 | |
| (AMT), 5.00%, 12/1/35 | 5,000 | 5,311,250 | |
| (AMT), 5.00%, 12/1/38 | 10,000 | 10,440,000 | |
| (AMT), 5.00%, 11/15/42 | 9,575 | 10,307,296 | |
| (AMT), 5.00%, 11/15/53 | 5,835 | 6,132,176 | |
| Hawaii, Airports System Revenue: | |||
| (AMT), 5.00%, 7/1/43 | 3,900 | 4,022,070 | |
| (AMT), 5.00%, 7/1/45 | 13,705 | 13,754,612 | |
| Illinois Toll Highway Authority: | |||
| 4.00%, 1/1/46 | 10,185 | 9,892,487 | |
| 5.25%, 1/1/43 | 16,835 | 19,107,220 | |
| Indianapolis Local Public Improvement Bond Bank, IN, (Indianapolis Airport Authority), (AMT), 5.25%, 1/1/40 | 5,000 | 5,466,400 | |
| Kansas City Industrial Development Authority, MO, (Kansas City International Airport Terminal Modernization): | |||
| (AMT), 5.00%, 3/1/38 | 13,500 | 14,112,090 | |
| (AMT), 5.00%, 3/1/46 | 6,400 | 6,552,896 | |
| (AMT), 5.00%, 3/1/54 | 4,835 | 4,900,466 | |
| Lee County, FL, Airport Revenue, (AMT), 5.00%, 10/1/46 | 6,775 | 7,097,219 | |
| Los Angeles Department of Airports, CA, (Los Angeles International Airport): | |||
| (AMT), 5.00%, 5/15/46 | 19,935 | 21,094,818 | |
| Security | Principal Amount (000's omitted) | Value | |
| Transportation (continued) | |||
| Los Angeles Department of Airports, CA, (Los Angeles International Airport): (continued) | |||
| Green Bonds, (AMT), 5.00%, 5/15/47 | $ | 17,855 | $ 18,836,668 |
| Massachusetts Port Authority, (AMT), 5.00%, 7/1/43 | 8,000 | 8,125,680 | |
| Massachusetts, (Rail Enhancement and Accelerated Bidge Program), 5.00%, 6/1/47 | 18,000 | 18,658,980 | |
| Massachusetts, (Rail Enhancement Program), Sustainablility Bonds, 5.00%, 6/1/53(2) | 16,500 | 17,720,175 | |
| Metropolitan Nashville Airport Authority, TN, (AMT), 5.00%, 7/1/49 | 10,500 | 10,924,515 | |
| Metropolitan Transportation Authority, NY: | |||
| Green Bonds, 4.75%, 11/15/45 | 3,050 | 3,142,720 | |
| Green Bonds, 5.00%, 11/15/39 | 8,000 | 9,058,560 | |
| Metropolitan Washington Airports Authority, D.C., (AMT), 5.00%, 10/1/44 | 15,750 | 16,406,145 | |
| New Jersey Turnpike Authority: | |||
| 4.125%, 1/1/54(3) | 2,400 | 2,348,616 | |
| 4.50%, 1/1/48 | 8,000 | 8,253,520 | |
| 5.25%, 1/1/49(3) | 15,000 | 16,669,800 | |
| New York Thruway Authority, 4.00%, 1/1/44 | 10,000 | 9,897,900 | |
| New York Transportation Development Corp., (John F. Kennedy International Airport), Green Bonds, (AMT), 6.00%, 6/30/54 | 5,765 | 6,392,751 | |
| New York Transportation Development Corp., (LaGuardia Airport Terminal B Redevelopment), (AMT), 5.00%, 7/1/46 | 35,865 | 35,377,236 | |
| New York Transportation Development Corp., (Terminal 4 John F. Kennedy International Airport), (AMT), 5.00%, 12/1/29 | 10,000 | 10,783,300 | |
| North Texas Tollway Authority: | |||
| 4.125%, 1/1/39 | 10,215 | 10,514,504 | |
| 5.00%, 1/1/48 | 10,000 | 10,208,800 | |
| Oklahoma Turnpike Authority, 5.50%, 1/1/53 | 12,500 | 13,834,375 | |
| Oregon Department of Transportation, 4.00%, 11/15/42 | 11,730 | 11,871,112 | |
| Pennsylvania Economic Development Financing Authority, (PennDOT Major Bridges Package One): | |||
| (AMT), 5.25%, 6/30/53 | 21,630 | 23,031,624 | |
| (AMT), 5.75%, 6/30/48 | 30 | 33,489 | |
| Pennsylvania Turnpike Commission: | |||
| 4.25%, 12/1/44 | 3,000 | 3,048,420 | |
| 5.00%, 12/1/46 | 5,000 | 5,083,550 | |
| 5.00%, 12/1/48 | 10,000 | 10,825,300 | |
| (LOC: TD Bank, N.A.), 3.42%, 12/1/38(1) | 20,915 | 20,915,000 | |
| Philadelphia, PA, Airport Revenue, (AMT), 5.00%, 7/1/47 | 4,595 | 4,663,328 | |
| Phoenix Civic Improvement Corp., AZ, Airport Revenue: | |||
| (AMT), 5.00%, 7/1/42 | 6,250 | 6,414,375 | |
| Security | Principal Amount (000's omitted) | Value | |
| Transportation (continued) | |||
| Phoenix Civic Improvement Corp., AZ, Airport Revenue: (continued) | |||
| (AMT), 5.00%, 7/1/49 | $ | 10,400 | $ 10,730,616 |
| Port Authority of New York and New Jersey: | |||
| 5.00%, 9/1/38 | 6,130 | 6,707,385 | |
| (AMT), 5.00%, 12/1/44 | 4,500 | 4,837,050 | |
| Port of Portland, OR, (Portland International Airport): | |||
| (AMT), 4.00%, 7/1/50 | 5,000 | 4,672,900 | |
| (AMT), 5.00%, 7/1/44 | 8,000 | 8,319,200 | |
| (AMT), 5.00%, 7/1/45 | 12,260 | 12,833,645 | |
| Green Bonds, (AMT), 5.25%, 7/1/43 | 17,000 | 18,619,590 | |
| Port of Seattle, WA: | |||
| (AMT), 5.00%, 5/1/43 | 11,595 | 11,773,911 | |
| (AMT), 5.00%, 4/1/44 | 9,870 | 10,211,304 | |
| (AMT), 5.00%, 8/1/46 | 11,915 | 12,460,230 | |
| Salt Lake City, UT, (Salt Lake City International Airport): | |||
| (AMT), 5.00%, 7/1/42 | 17,330 | 17,738,121 | |
| (AMT), 5.00%, 7/1/43 | 3,165 | 3,256,627 | |
| (AMT), 5.00%, 7/1/46 | 15,975 | 16,752,823 | |
| (AMT), 5.00%, 7/1/47 | 6,500 | 6,606,470 | |
| (AMT), 5.25%, 7/1/48 | 16,260 | 16,799,832 | |
| San Diego County Regional Airport Authority, CA, (San Diego International Airport), (AMT), 5.00%, 7/1/48 | 15,000 | 15,978,300 | |
| San Francisco City and County Airport Commission, CA, (San Francisco International Airport): | |||
| (AMT), 5.00%, 5/1/49 | 5,000 | 5,147,700 | |
| (AMT), 5.50%, 5/1/43 | 7,200 | 8,064,144 | |
| Texas Private Activity Bond Surface Transportation Corp., (North Tarrant Express Project), (AMT), 5.50%, 12/31/58 | 9,940 | 10,874,857 | |
| Triborough Bridge and Tunnel Authority, NY, (LOC: Barclays Bank PLC), 4.00%, 1/1/32(4) | 13,630 | 13,630,000 | |
| Virginia Small Business Financing Authority, (95 Express Lanes, LLC), (AMT), 4.00%, 1/1/39 | 9,070 | 8,791,732 | |
| $ 846,247,498 | |||
| Water and Sewer — 5.0% | |||
| Austin, TX, Water and Wastewater System Revenue, 5.00%, 11/15/47 | $ | 4,000 | $ 4,338,440 |
| Charleston, SC, Waterworks and Sewer System Revenue, 5.00%, 1/1/47 | 5,000 | 5,540,500 | |
| Corpus Christi, TX, Utility System Revenue, 4.00%, 7/15/48 | 5,305 | 5,192,057 | |
| District of Columbia Water and Sewer Authority, 4.00%, 10/1/51 | 10,935 | 10,757,525 | |
| Fort Lauderdale, FL, Water & Sewer Revenue, 5.50%, 9/1/48 | 11,000 | 12,577,510 | |
| Security | Principal Amount (000's omitted) | Value | |
| Water and Sewer (continued) | |||
| Gilbert Water Resources Municipal Property Corp., AZ, Green Bonds, 4.00%, 7/15/47 | $ | 3,000 | $ 2,959,590 |
| JEA, FL, Water and Sewer System Revenue: | |||
| 5.25%, 10/1/49 | 7,800 | 8,684,832 | |
| (SPA: U.S. Bank, N.A.), 4.00%, 10/1/38(4) | 5,450 | 5,450,000 | |
| Kansas City, MO, Sanitary Sewer System Revenue, 4.00%, 1/1/48 | 4,000 | 3,936,440 | |
| Michigan Finance Authority, (Detroit Water and Sewerage Department), 5.00%, 7/1/33 | 8,095 | 8,108,114 | |
| New York City Municipal Water Finance Authority, NY, (Water and Sewer System): | |||
| 4.00%, 6/15/49 | 10,000 | 9,703,900 | |
| 5.00%, 6/15/47(2) | 8,000 | 8,705,200 | |
| 5.00%, 6/15/50 | 5,000 | 5,302,000 | |
| 5.25%, 6/15/47 | 20,000 | 22,368,000 | |
| 5.25%, 6/15/48 | 13,500 | 15,083,550 | |
| (SPA: JPMorgan Chase Bank, N.A.), 4.00%, 6/15/43(4) | 14,995 | 14,995,000 | |
| Philadelphia, PA, Water and Wastewater Revenue, 5.00%, 10/1/43 | 5,000 | 5,276,350 | |
| Phoenix Civic Improvement Corp., AZ, Wastewater System Revenue, 5.25%, 7/1/47 | 17,200 | 19,370,984 | |
| San Mateo-Foster City Public Financing Authority, CA, (Clean Water Program), 5.00%, 8/1/49 | 9,000 | 9,648,720 | |
| Sarasota County, FL, Utility System Revenue, 5.25%, 10/1/52 | 15,000 | 16,540,350 | |
| Seattle, WA, Water System Revenue, Green Bonds, 5.00%, 9/1/52 | 8,610 | 9,334,273 | |
| Tacoma, WA, Sewer Revenue, 4.00%, 12/1/48 | 5,190 | 5,064,194 | |
| $ 208,937,529 | |||
| Total Tax-Exempt Municipal Obligations (identified cost $3,827,861,633) | $3,960,062,666 | ||
| Taxable Municipal Obligations — 6.5% |
| Security | Principal Amount (000's omitted) | Value | |
| Education — 0.1% | |||
| San Antonio Education Facilities Corp., TX, (University of the Incarnate Word), 3.15%, 4/1/37 | $ | 1,750 | $ 1,313,165 |
| University of California, 5.35%, 7/1/41(1) | 5,000 | 5,000,000 | |
| $ 6,313,165 | |||
| Security | Principal Amount (000's omitted) | Value | |
| General Obligations — 0.5% | |||
| Los Angeles Community College District, CA: | |||
| 1.806%, 8/1/30 | $ | 15,000 | $ 12,987,600 |
| 2.106%, 8/1/32 | 2,650 | 2,227,033 | |
| Puerto Rico, GO Contingent Value Instrument, 0.00%, 11/1/43 | 6,667 | 3,862,071 | |
| $ 19,076,704 | |||
| Hospital — 0.9% | |||
| California Statewide Communities Development Authority, (Loma Linda University Medical Center), 6.00%, 12/1/24 | $ | 34,250 | $ 34,090,395 |
| New Mexico Hospital Equipment Loan Council, (Presbyterian Healthcare Services), (SPA: JPMorgan Chase Bank, N.A.), 5.30%, 8/1/42(4) | 5,000 | 5,000,000 | |
| $ 39,090,395 | |||
| Housing — 1.4% | |||
| Maine Housing Authority: | |||
| (SPA: Barclays Bank PLC), 5.37%, 11/15/52(1) | $ | 27,310 | $ 27,310,000 |
| (SPA: TD Bank, N.A.), 5.35%, 11/15/50(1) | 7,140 | 7,140,000 | |
| North Dakota Housing Finance Agency, (SPA: TD Bank, N.A.), 5.35%, 1/1/47(1) | 22,420 | 22,420,000 | |
| $ 56,870,000 | |||
| Industrial Development Revenue — 0.0%(8) | |||
| Northampton County Industrial Development Authority, PA, (Northampton Generating), 5.00%, 6/30/27(7) | $ | 8,071 | $ 1,452,794 |
| $ 1,452,794 | |||
| Insured - Transportation — 1.0% | |||
| Alameda Corridor Transportation Authority, CA: | |||
| (AGM), 0.00%, 10/1/43 | $ | 14,295 | $ 4,446,888 |
| (AMBAC), 0.00%, 10/1/26 | 14,395 | 12,601,239 | |
| (AMBAC), 0.00%, 10/1/27 | 22,355 | 18,609,867 | |
| (AMBAC), Escrowed to Maturity, 0.00%, 10/1/26 | 8,105 | 7,153,473 | |
| $ 42,811,467 | |||
| Lease Revenue/Certificates of Participation — 0.3% | |||
| New Hampshire Business Finance Authority, (Centurion BioSquare, Inc.), 9.58%, 12/15/38 | $ | 615 | $ 610,775 |
| New Hampshire Business Finance Authority, (Centurion Foundation), 11.00%, 12/15/38 | 300 | 298,092 | |
| New York City Transitional Finance Authority, NY, (Building Aid), 3.23%, 7/15/24 | 10,000 | 9,934,200 | |
| $ 10,843,067 | |||
| Security | Principal Amount (000's omitted) | Value | |
| Other Revenue — 0.5% | |||
| Golden State Tobacco Securitization Corp., CA, 3.714%, 6/1/41 | $ | 28,000 | $ 22,026,200 |
| $ 22,026,200 | |||
| Special Tax Revenue — 0.3% | |||
| JobsOhio Beverage System, OH, 4.433%, 1/1/33 | $ | 12,575 | $ 12,461,322 |
| $ 12,461,322 | |||
| Transportation — 0.4% | |||
| Foothill/Eastern Transportation Corridor Agency, CA, 4.094%, 1/15/49 | $ | 20,856 | $ 17,594,747 |
| $ 17,594,747 | |||
| Water and Sewer — 1.1% | |||
| Metropolitan Water District of Southern California: | |||
| (SPA: PNC Bank, N.A.), 5.32%, 7/1/46(1) | $ | 10,000 | $ 10,000,000 |
| (SPA: TD Bank, N.A.), 5.33%, 7/1/37(1) | 36,250 | 36,250,000 | |
| $ 46,250,000 | |||
| Total Taxable Municipal Obligations (identified cost $286,060,886) | $ 274,789,861 | ||
| Total Investments — 101.9% (identified cost $4,160,039,123) | $4,279,961,409 | ||
| Other Assets, Less Liabilities — (1.9)% | $ (79,592,120) | ||
| Net Assets — 100.0% | $4,200,369,289 | ||
| The percentage shown for each investment category in the Portfolio of Investments is based on net assets. | |
| (1) | Variable rate demand obligation that may be tendered at par on any day for payment the lesser of 5 business days or 7 calendar days. The stated interest rate, which generally resets weekly, is determined by the remarketing agent and represents the rate in effect at March 31, 2024. |
| (2) | Security represents the municipal bond held by a trust that issues residual interest bonds (see Note 1H). |
| (3) | When-issued security. |
| (4) | Variable rate demand obligation that may be tendered at par on any day for payment the same or next business day. The stated interest rate, which generally resets daily, is determined by the remarketing agent and represents the rate in effect at March 31, 2024. |
| (5) | Security exempt from registration under Rule 144A of the Securities Act of 1933, as amended. These securities may be sold in certain transactions in reliance on an exemption from registration (normally to qualified institutional buyers). At March 31, 2024, the aggregate value of these securities is $53,747,494 or 1.3% of the Fund's net assets. |
| (6) | Defaulted security. Issuer has defaulted on the payment of interest and/or principal or has filed for bankruptcy. |
| (7) | Represents a payment-in-kind security which may pay interest in additional principal at the issuer’s discretion. |
| (8) | Amount is less than 0.05%. |
| (9) | Floating rate security. The stated interest rate represents the rate in effect at March 31, 2024. |
| At March 31, 2024, the concentration of the Fund’s investments in the various states and territories, determined as a percentage of net assets, is as follows: | |
| New York | 17.9% |
| California | 14.0% |
| Texas | 11.4% |
| Others, representing less than 10% individually | 57.5% |
| The Fund invests primarily in debt securities issued by municipalities. The ability of the issuers of the debt securities to meet their obligations may be affected by economic developments in a specific industry or municipality. At March 31, 2024, 6.5% of total investments are backed by bond insurance of various financial institutions and financial guaranty assurance agencies. The aggregate percentage insured by an individual financial institution or financial guaranty assurance agency ranged from 0.9% to 3.3% of total investments. |
| Abbreviations: | |
| AGC | – Assured Guaranty Corp. |
| AGM | – Assured Guaranty Municipal Corp. |
| AMBAC | – AMBAC Financial Group, Inc. |
| AMT | – Interest earned from these securities may be considered a tax preference item for purposes of the Federal Alternative Minimum Tax. |
| BAM | – Build America Mutual Assurance Co. |
| FHLMC | – Federal Home Loan Mortgage Corp. |
| FNMA | – Federal National Mortgage Association |
| GNMA | – Government National Mortgage Association |
| Liq | – Liquidity Provider |
| LOC | – Letter of Credit |
| NPFG | – National Public Finance Guarantee Corp. |
| PSF | – Permanent School Fund |
| SFMR | – Single Family Mortgage Revenue |
| SOFR | – Secured Overnight Financing Rate |
| SPA | – Standby Bond Purchase Agreement |
| March 31, 2024 | ||
| AMT-Free Fund | National Fund | |
| Assets | ||
| Investments: | ||
| Identified cost | $ 220,544,507 | $ 4,160,039,123 |
| Unrealized appreciation | 7,467,005 | 119,922,286 |
| Investments, at value | $228,011,512 | $4,279,961,409 |
| Cash | $ 41,794 | $ 239,378 |
| Interest receivable | 2,620,685 | 49,679,948 |
| Receivable for investments sold | — | 46,365,869 |
| Receivable for Fund shares sold | 110,333 | 8,746,885 |
| Trustees' deferred compensation plan | 101,324 | 383,114 |
| Total assets | $230,885,648 | $4,385,376,603 |
| Liabilities | ||
| Payable for floating rate notes issued | $ 4,007,324 | $ 54,916,341 |
| Payable for when-issued securities | 5,962,608 | 115,545,217 |
| Payable for Fund shares redeemed | 507,422 | 8,989,398 |
| Distributions payable | 113,339 | 2,252,572 |
| Payable to affiliates: | ||
| Investment adviser fee | 80,818 | 1,132,247 |
| Distribution and service fees | 25,212 | 290,579 |
| Trustees' deferred compensation plan | 101,324 | 383,114 |
| Interest expense and fees payable | 50,584 | 524,398 |
| Accrued expenses | 104,008 | 973,448 |
| Total liabilities | $ 10,952,639 | $ 185,007,314 |
| Net Assets | $219,933,009 | $4,200,369,289 |
| Sources of Net Assets | ||
| Paid-in capital | $ 262,035,760 | $ 4,524,193,086 |
| Accumulated loss | (42,102,751) | (323,823,797) |
| Net Assets | $219,933,009 | $4,200,369,289 |
| Class A Shares | ||
| Net Assets | $ 105,133,787 | $ 1,191,678,107 |
| Shares Outstanding | 12,897,118 | 128,168,326 |
| Net Asset Value and Redemption Price Per Share (net assets ÷ shares of beneficial interest outstanding) | $ 8.15 | $ 9.30 |
| Maximum Offering Price Per Share (100 ÷ 96.75 of net asset value per share) | $ 8.42 | $ 9.61 |
| Class C Shares | ||
| Net Assets | $ 2,981,014 | $ 44,876,792 |
| Shares Outstanding | 367,856 | 4,827,192 |
| Net Asset Value and Offering Price Per Share* (net assets ÷ shares of beneficial interest outstanding) | $ 8.10 | $ 9.30 |
| Class I Shares | ||
| Net Assets | $ 111,818,208 | $ 2,963,814,390 |
| Shares Outstanding | 12,561,978 | 318,815,888 |
| Net Asset Value, Offering Price and Redemption Price Per Share (net assets ÷ shares of beneficial interest outstanding) | $ 8.90 | $ 9.30 |
| On sales of $100,000 or more, the offering price of Class A shares is reduced. | |
| * | Redemption price per share is equal to the net asset value less any applicable contingent deferred sales charge. |
| Six Months Ended March 31, 2024 | ||
| AMT-Free Fund | National Fund | |
| Investment Income | ||
| Interest income | $ 5,077,764 | $ 88,616,009 |
| Total investment income | $ 5,077,764 | $ 88,616,009 |
| Expenses | ||
| Investment adviser fee | $ 481,998 | $ 6,399,231 |
| Distribution and service fees: | ||
| Class A | 130,520 | 1,451,765 |
| Class C | 16,587 | 225,449 |
| Trustees’ fees and expenses | 7,633 | 54,250 |
| Custodian fee | 32,593 | 338,830 |
| Transfer and dividend disbursing agent fees | 41,129 | 832,550 |
| Legal and accounting services | 45,604 | 156,662 |
| Printing and postage | 4,095 | 49,748 |
| Registration fees | 32,838 | 127,653 |
| Interest expense and fees | 111,945 | 1,101,887 |
| Miscellaneous | 21,827 | 117,799 |
| Total expenses | $ 926,769 | $ 10,855,824 |
| Net investment income | $ 4,150,995 | $ 77,760,185 |
| Realized and Unrealized Gain (Loss) | ||
| Net realized gain (loss): | ||
| Investment transactions | $ 170,430 | $ (16,449,356) |
| Futures contracts | — | 1,196,126 |
| Net realized gain (loss) | $ 170,430 | $ (15,253,230) |
| Change in unrealized appreciation (depreciation): | ||
| Investments | $ 14,468,805 | $ 243,906,637 |
| Futures contracts | — | (4,363,160) |
| Net change in unrealized appreciation (depreciation) | $14,468,805 | $239,543,477 |
| Net realized and unrealized gain | $14,639,235 | $224,290,247 |
| Net increase in net assets from operations | $18,790,230 | $302,050,432 |
| Six Months Ended March 31, 2024 (Unaudited) | ||
| AMT-Free Fund | National Fund | |
| Increase (Decrease) in Net Assets | ||
| From operations: | ||
| Net investment income | $ 4,150,995 | $ 77,760,185 |
| Net realized gain (loss) | 170,430 | (15,253,230) |
| Net change in unrealized appreciation (depreciation) | 14,468,805 | 239,543,477 |
| Net increase in net assets from operations | $ 18,790,230 | $ 302,050,432 |
| Distributions to shareholders: | ||
| Class A | $ (1,869,946) | $ (22,268,581) |
| Class C | (47,005) | (695,423) |
| Class I | (2,193,074) | (54,782,288) |
| Total distributions to shareholders | $ (4,110,025) | $ (77,746,292) |
| Transactions in shares of beneficial interest: | ||
| Class A | $ (2,494,005) | $ (3,758,232) |
| Class C | (491,049) | (3,468,383) |
| Class I | (12,202,937) | 300,160,979 |
| Net increase (decrease) in net assets from Fund share transactions | $ (15,187,991) | $ 292,934,364 |
| Net increase (decrease) in net assets | $ (507,786) | $ 517,238,504 |
| Net Assets | ||
| At beginning of period | $ 220,440,795 | $ 3,683,130,785 |
| At end of period | $219,933,009 | $4,200,369,289 |
| Year Ended September 30, 2023 | ||
| AMT-Free Fund | National Fund | |
| Increase (Decrease) in Net Assets | ||
| From operations: | ||
| Net investment income | $ 8,754,263 | $ 133,637,938 |
| Net realized loss | (5,868,207) | (49,314,855) |
| Net change in unrealized appreciation (depreciation) | 1,277,150 | 4,443,142 |
| Net increase in net assets from operations | $ 4,163,206 | $ 88,766,225 |
| Distributions to shareholders: | ||
| Class A | $ (3,899,645) | $ (43,200,549) |
| Class C | (114,999) | (1,519,512) |
| Class I | (4,682,937) | (86,466,621) |
| Total distributions to shareholders | $ (8,697,581) | $ (131,186,682) |
| Transactions in shares of beneficial interest: | ||
| Class A | $ (11,277,440) | $ (49,788,169) |
| Class C | (1,635,102) | (10,052,301) |
| Class I | (418,520) | 658,700,475 |
| Net increase (decrease) in net assets from Fund share transactions | $ (13,331,062) | $ 598,860,005 |
| Net increase (decrease) in net assets | $ (17,865,437) | $ 556,439,548 |
| Net Assets | ||
| At beginning of year | $ 238,306,232 | $ 3,126,691,237 |
| At end of year | $220,440,795 | $3,683,130,785 |
| AMT-Free Fund — Class A | ||||||
| Six Months Ended March 31, 2024 (Unaudited) | Year Ended September 30, | |||||
| 2023 | 2022 | 2021 | 2020 | 2019 | ||
| Net asset value — Beginning of period | $ 7.620 | $ 7.790 | $ 9.290 | $ 9.250 | $ 9.250 | $ 8.870 |
| Income (Loss) From Operations | ||||||
| Net investment income(1) | $ 0.145 | $ 0.280 | $ 0.227 | $ 0.236 | $ 0.274 | $ 0.317 |
| Net realized and unrealized gain (loss) | 0.528 | (0.171) | (1.495) | 0.053 | 0.011 (2) | 0.381 |
| Total income (loss) from operations | $ 0.673 | $ 0.109 | $ (1.268) | $ 0.289 | $ 0.285 | $ 0.698 |
| Less Distributions | ||||||
| From net investment income | $ (0.143) | $ (0.279) | $ (0.232) | $ (0.249) | $ (0.285) | $ (0.318) |
| Total distributions | $ (0.143) | $ (0.279) | $ (0.232) | $ (0.249) | $ (0.285) | $ (0.318) |
| Net asset value — End of period | $ 8.150 | $ 7.620 | $ 7.790 | $ 9.290 | $ 9.250 | $ 9.250 |
| Total Return(3) | 8.88% (4) | 1.29% | (13.85)% | 3.14% | 3.12% | 8.02% |
| Ratios/Supplemental Data | ||||||
| Net assets, end of period (000’s omitted) | $105,134 | $100,835 | $113,933 | $157,981 | $158,729 | $150,853 |
| Ratios (as a percentage of average daily net assets): | ||||||
| Expenses excluding interest and fees | 0.85% (5) | 0.83% | 0.79% | 0.76% | 0.78% | 0.81% |
| Interest and fee expense(6) | 0.10% (5) | 0.17% | 0.07% | 0.04% | 0.14% | 0.23% |
| Total expenses | 0.95% (5) | 1.00% | 0.86% | 0.80% | 0.92% | 1.04% |
| Net investment income | 3.62% (5) | 3.50% | 2.61% | 2.53% | 2.97% | 3.51% |
| Portfolio Turnover | 25% (4) | 53% | 60% | 32% | 58% | 33% |
| (1) | Computed using average shares outstanding. |
| (2) | The per share amount is not in accord with the net realized and unrealized gain (loss) for the period because of the timing of Fund share transactions and the amount of the per share realized and unrealized gains and losses at such time. |
| (3) | Returns are historical and are calculated by determining the percentage change in net asset value with all distributions reinvested and do not reflect the effect of sales charges. |
| (4) | Not annualized. |
| (5) | Annualized. |
| (6) | Interest and fee expense relates to the liability for floating rate notes issued in conjunction with residual interest bond transactions (see Note 1H). |
| AMT-Free Fund — Class C | ||||||
| Six Months Ended March 31, 2024 (Unaudited) | Year Ended September 30, | |||||
| 2023 | 2022 | 2021 | 2020 | 2019 | ||
| Net asset value — Beginning of period | $ 7.580 | $ 7.740 | $ 9.240 | $ 9.200 | $ 9.200 | $ 8.820 |
| Income (Loss) From Operations | ||||||
| Net investment income(1) | $ 0.114 | $ 0.219 | $ 0.159 | $ 0.167 | $ 0.204 | $ 0.249 |
| Net realized and unrealized gain (loss) | 0.519 | (0.162) | (1.493) | 0.051 | 0.011 (2) | 0.380 |
| Total income (loss) from operations | $ 0.633 | $ 0.057 | $(1.334) | $ 0.218 | $ 0.215 | $ 0.629 |
| Less Distributions | ||||||
| From net investment income | $ (0.113) | $ (0.217) | $ (0.166) | $ (0.178) | $ (0.215) | $ (0.249) |
| Total distributions | $(0.113) | $(0.217) | $(0.166) | $(0.178) | $ (0.215) | $ (0.249) |
| Net asset value — End of period | $ 8.100 | $ 7.580 | $ 7.740 | $ 9.240 | $ 9.200 | $ 9.200 |
| Total Return(3) | 8.52% (4) | 0.51% | (14.59)% | 2.38% | 2.36% | 7.24% |
| Ratios/Supplemental Data | ||||||
| Net assets, end of period (000’s omitted) | $ 2,981 | $ 3,258 | $ 4,906 | $ 9,017 | $15,094 | $19,715 |
| Ratios (as a percentage of average daily net assets): | ||||||
| Expenses excluding interest and fees | 1.60% (5) | 1.58% | 1.54% | 1.51% | 1.53% | 1.56% |
| Interest and fee expense(6) | 0.10% (5) | 0.17% | 0.07% | 0.04% | 0.14% | 0.23% |
| Total expenses | 1.70% (5) | 1.75% | 1.61% | 1.55% | 1.67% | 1.79% |
| Net investment income | 2.87% (5) | 2.74% | 1.83% | 1.80% | 2.23% | 2.78% |
| Portfolio Turnover | 25% (4) | 53% | 60% | 32% | 58% | 33% |
| (1) | Computed using average shares outstanding. |
| (2) | The per share amount is not in accord with the net realized and unrealized gain (loss) for the period because of the timing of Fund share transactions and the amount of the per share realized and unrealized gains and losses at such time. |
| (3) | Returns are historical and are calculated by determining the percentage change in net asset value with all distributions reinvested and do not reflect the effect of sales charges. |
| (4) | Not annualized. |
| (5) | Annualized. |
| (6) | Interest and fee expense relates to the liability for floating rate notes issued in conjunction with residual interest bond transactions (see Note 1H). |
| AMT-Free Fund — Class I | ||||||
| Six Months Ended March 31, 2024 (Unaudited) | Year Ended September 30, | |||||
| 2023 | 2022 | 2021 | 2020 | 2019 | ||
| Net asset value — Beginning of period | $ 8.320 | $ 8.500 | $ 10.150 | $ 10.110 | $ 10.100 | $ 9.680 |
| Income (Loss) From Operations | ||||||
| Net investment income(1) | $ 0.169 | $ 0.328 | $ 0.271 | $ 0.283 | $ 0.323 | $ 0.370 |
| Net realized and unrealized gain (loss) | 0.579 | (0.182) | (1.644) | 0.055 | 0.023 (2) | 0.422 |
| Total income (loss) from operations | $ 0.748 | $ 0.146 | $ (1.373) | $ 0.338 | $ 0.346 | $ 0.792 |
| Less Distributions | ||||||
| From net investment income | $ (0.168) | $ (0.326) | $ (0.277) | $ (0.298) | $ (0.336) | $ (0.372) |
| Total distributions | $ (0.168) | $ (0.326) | $ (0.277) | $ (0.298) | $ (0.336) | $ (0.372) |
| Net asset value — End of period | $ 8.900 | $ 8.320 | $ 8.500 | $ 10.150 | $ 10.110 | $ 10.100 |
| Total Return(3) | 9.03% (4) | 1.49% | (13.64)% | 3.36% | 3.48% | 8.34% |
| Ratios/Supplemental Data | ||||||
| Net assets, end of period (000’s omitted) | $111,818 | $116,348 | $119,467 | $184,002 | $168,113 | $145,788 |
| Ratios (as a percentage of average daily net assets): | ||||||
| Expenses excluding interest and fees | 0.60% (5) | 0.58% | 0.54% | 0.51% | 0.53% | 0.56% |
| Interest and fee expense(6) | 0.10% (5) | 0.17% | 0.07% | 0.04% | 0.14% | 0.23% |
| Total expenses | 0.70% (5) | 0.75% | 0.61% | 0.55% | 0.67% | 0.79% |
| Net investment income | 3.87% (5) | 3.75% | 2.84% | 2.77% | 3.21% | 3.76% |
| Portfolio Turnover | 25% (4) | 53% | 60% | 32% | 58% | 33% |
| (1) | Computed using average shares outstanding. |
| (2) | The per share amount is not in accord with the net realized and unrealized gain (loss) for the period because of the timing of Fund share transactions and the amount of the per share realized and unrealized gains and losses at such time. |
| (3) | Returns are historical and are calculated by determining the percentage change in net asset value with all distributions reinvested. |
| (4) | Not annualized. |
| (5) | Annualized. |
| (6) | Interest and fee expense relates to the liability for floating rate notes issued in conjunction with residual interest bond transactions (see Note 1H). |
| National Fund — Class A | ||||||
| Six Months Ended March 31, 2024 (Unaudited) | Year Ended September 30, | |||||
| 2023 | 2022 | 2021 | 2020 | 2019 | ||
| Net asset value — Beginning of period | $ 8.750 | $ 8.780 | $ 10.310 | $ 10.240 | $ 10.140 | $ 9.650 |
| Income (Loss) From Operations | ||||||
| Net investment income(1) | $ 0.175 | $ 0.340 | $ 0.224 | $ 0.223 | $ 0.265 | $ 0.322 |
| Net realized and unrealized gain (loss) | 0.550 | (0.037) | (1.507) | 0.082 | 0.119 | 0.491 |
| Total income (loss) from operations | $ 0.725 | $ 0.303 | $ (1.283) | $ 0.305 | $ 0.384 | $ 0.813 |
| Less Distributions | ||||||
| From net investment income | $ (0.175) | $ (0.333) | $ (0.247) | $ (0.235) | $ (0.284) | $ (0.323) |
| Total distributions | $ (0.175) | $ (0.333) | $ (0.247) | $ (0.235) | $ (0.284) | $ (0.323) |
| Net asset value — End of period | $ 9.300 | $ 8.750 | $ 8.780 | $ 10.310 | $ 10.240 | $ 10.140 |
| Total Return(2) | 8.33% (3) | 3.38% | (12.62)% | 2.99% | 3.84% | 8.57% |
| Ratios/Supplemental Data | ||||||
| Net assets, end of period (000’s omitted) | $1,191,678 | $1,126,345 | $1,179,909 | $1,558,418 | $1,620,505 | $1,605,407 |
| Ratios (as a percentage of average daily net assets): | ||||||
| Expenses excluding interest and fees | 0.66% (4) | 0.67% | 0.64% | 0.61% | 0.64% | 0.68% |
| Interest and fee expense(5) | 0.06% (4) | 0.08% | 0.03% | 0.02% | 0.05% | 0.12% |
| Total expenses | 0.72% (4) | 0.75% | 0.67% | 0.63% | 0.69% | 0.80% |
| Net investment income | 3.83% (4) | 3.73% | 2.30% | 2.15% | 2.61% | 3.26% |
| Portfolio Turnover | 38% (3) | 86% | 151% | 56% | 105% | 89% |
| (1) | Computed using average shares outstanding. |
| (2) | Returns are historical and are calculated by determining the percentage change in net asset value with all distributions reinvested and do not reflect the effect of sales charges. |
| (3) | Not annualized. |
| (4) | Annualized. |
| (5) | Interest and fee expense relates to the liability for floating rate notes issued in conjunction with residual interest bond transactions (see Note 1H). |
| National Fund — Class C | ||||||
| Six Months Ended March 31, 2024 (Unaudited) | Year Ended September 30, | |||||
| 2023 | 2022 | 2021 | 2020 | 2019 | ||
| Net asset value — Beginning of period | $ 8.750 | $ 8.780 | $10.310 | $ 10.240 | $ 10.140 | $ 9.650 |
| Income (Loss) From Operations | ||||||
| Net investment income(1) | $ 0.141 | $ 0.271 | $ 0.148 | $ 0.146 | $ 0.190 | $ 0.252 |
| Net realized and unrealized gain (loss) | 0.550 | (0.036) | (1.504) | 0.081 | 0.119 | 0.488 |
| Total income (loss) from operations | $ 0.691 | $ 0.235 | $ (1.356) | $ 0.227 | $ 0.309 | $ 0.740 |
| Less Distributions | ||||||
| From net investment income | $ (0.141) | $ (0.265) | $ (0.174) | $ (0.157) | $ (0.209) | $ (0.250) |
| Total distributions | $ (0.141) | $ (0.265) | $ (0.174) | $ (0.157) | $ (0.209) | $ (0.250) |
| Net asset value — End of period | $ 9.300 | $ 8.750 | $ 8.780 | $10.310 | $ 10.240 | $ 10.140 |
| Total Return(2) | 7.93% (3) | 2.60% | (13.28)% | 2.22% | 3.08% | 7.77% |
| Ratios/Supplemental Data | ||||||
| Net assets, end of period (000’s omitted) | $44,877 | $45,670 | $55,558 | $ 94,851 | $131,330 | $172,417 |
| Ratios (as a percentage of average daily net assets): | ||||||
| Expenses excluding interest and fees | 1.41% (4) | 1.42% | 1.39% | 1.36% | 1.39% | 1.43% |
| Interest and fee expense(5) | 0.06% (4) | 0.08% | 0.03% | 0.02% | 0.05% | 0.12% |
| Total expenses | 1.47% (4) | 1.50% | 1.42% | 1.38% | 1.44% | 1.55% |
| Net investment income | 3.08% (4) | 2.98% | 1.52% | 1.41% | 1.87% | 2.57% |
| Portfolio Turnover | 38% (3) | 86% | 151% | 56% | 105% | 89% |
| (1) | Computed using average shares outstanding. |
| (2) | Returns are historical and are calculated by determining the percentage change in net asset value with all distributions reinvested and do not reflect the effect of sales charges. |
| (3) | Not annualized. |
| (4) | Annualized. |
| (5) | Interest and fee expense relates to the liability for floating rate notes issued in conjunction with residual interest bond transactions (see Note 1H). |
| National Fund — Class I | ||||||
| Six Months Ended March 31, 2024 (Unaudited) | Year Ended September 30, | |||||
| 2023 | 2022 | 2021 | 2020 | 2019 | ||
| Net asset value — Beginning of period | $ 8.750 | $ 8.780 | $ 10.310 | $ 10.240 | $ 10.140 | $ 9.650 |
| Income (Loss) From Operations | ||||||
| Net investment income(1) | $ 0.186 | $ 0.363 | $ 0.248 | $ 0.248 | $ 0.289 | $ 0.341 |
| Net realized and unrealized gain (loss) | 0.551 | (0.037) | (1.507) | 0.082 | 0.120 | 0.495 |
| Total income (loss) from operations | $ 0.737 | $ 0.326 | $ (1.259) | $ 0.330 | $ 0.409 | $ 0.836 |
| Less Distributions | ||||||
| From net investment income | $ (0.187) | $ (0.356) | $ (0.271) | $ (0.260) | $ (0.309) | $ (0.346) |
| Total distributions | $ (0.187) | $ (0.356) | $ (0.271) | $ (0.260) | $ (0.309) | $ (0.346) |
| Net asset value — End of period | $ 9.300 | $ 8.750 | $ 8.780 | $ 10.310 | $ 10.240 | $ 10.140 |
| Total Return(2) | 8.47% (3) | 3.64% | (12.40)% | 3.24% | 4.10% | 8.83% |
| Ratios/Supplemental Data | ||||||
| Net assets, end of period (000’s omitted) | $2,963,814 | $2,511,115 | $1,891,224 | $2,347,177 | $1,797,038 | $1,348,563 |
| Ratios (as a percentage of average daily net assets): | ||||||
| Expenses excluding interest and fees | 0.41% (4) | 0.42% | 0.39% | 0.36% | 0.39% | 0.43% |
| Interest and fee expense(5) | 0.06% (4) | 0.08% | 0.03% | 0.02% | 0.05% | 0.12% |
| Total expenses | 0.47% (4) | 0.50% | 0.42% | 0.38% | 0.44% | 0.55% |
| Net investment income | 4.08% (4) | 3.98% | 2.55% | 2.39% | 2.85% | 3.45% |
| Portfolio Turnover | 38% (3) | 86% | 151% | 56% | 105% | 89% |
| (1) | Computed using average shares outstanding. |
| (2) | Returns are historical and are calculated by determining the percentage change in net asset value with all distributions reinvested. |
| (3) | Not annualized. |
| (4) | Annualized. |
| (5) | Interest and fee expense relates to the liability for floating rate notes issued in conjunction with residual interest bond transactions (see Note 1H). |
| AMT-Free Fund | National Fund | |
| Floating Rate Notes Outstanding | $4,007,324 | $54,916,341 |
| Interest Rate or Range of Interest Rates (%) | 3.67 | 3.64 - 3.68 |
| Collateral for Floating Rate Notes Outstanding | $5,463,760 | $74,340,045 |
| AMT-Free Fund | National Fund | |
| Average Floating Rate Notes Outstanding | $5,372,951 | $54,800,000 |
| Average Interest Rate | 4.17% | 4.02% |
| AMT-Free Fund | National Fund | |
| Deferred capital losses: | ||
| Short-term | $26,756,879 | $294,364,229 |
| Long-term | $23,706,355 | $123,914,103 |
| AMT-Free Fund | National Fund | |
| Aggregate cost | $216,455,126 | $4,111,634,189 |
| Gross unrealized appreciation | $ 9,823,938 | $ 148,576,399 |
| Gross unrealized depreciation | (2,274,876) | (35,165,520) |
| Net unrealized appreciation | $ 7,549,062 | $ 113,410,879 |
| Total Daily Net Assets | Annual Asset Rate | Daily Income Rate |
| Up to $500 million | 0.300% | 3.000% |
| $500 million but less than $1 billion | 0.275% | 2.750% |
| $1 billion but less than $1.5 billion | 0.250% | 2.500% |
| $1.5 billion but less than $2 billion | 0.225% | 2.250% |
| $2 billion but less than $3 billion | 0.200% | 2.000% |
| $3 billion and over | 0.175% | 1.750% |
| AMT-Free Fund | National Fund | |
| Investment Adviser Fee | $481,998 | $6,399,231 |
| Effective Annual Rate | 0.43% | 0.33% |
| AMT-Free Fund | National Fund | |
| EVM's Sub-Transfer Agent Fees | $5,388 | $82,380 |
| EVD's Class A Sales Charges | $ 812 | $18,616 |
| Morgan Stanley affiliated broker-dealers’ Class A Sales Charges | $ — | $ 6,534 |
| AMT-Free Fund | National Fund | |
| Class A Distribution and Service Fees | $130,520 | $1,451,765 |
| AMT-Free Fund | National Fund | |
| Class C Distribution Fees | $12,440 | $169,087 |
| AMT-Free Fund | National Fund | |
| Class C Service Fees | $4,147 | $56,362 |
| AMT-Free Fund | National Fund | |
| Class A | $ — (1) | $ 125 |
| Class C | $ — | $1,071 |
| (1) | Amount is less than $100. |
| AMT-Free Fund | National Fund | |
| Purchases | $56,332,530 | $1,812,659,295 |
| Sales | $65,958,512 | $1,503,298,186 |
| AMT-Free Fund | ||||||
| Six Months Ended March 31, 2024 (Unaudited) | Year Ended September 30, 2023 | |||||
| Shares | Amount | Shares | Amount | |||
| Class A | ||||||
| Sales | 1,071,119 | $ 8,651,609 | 1,888,917 | $ 14,993,570 | ||
| Issued to shareholders electing to receive payments of distributions in Fund shares | 191,793 | 1,540,989 | 412,323 | 3,293,503 | ||
| Redemptions | (1,596,485) | (12,686,603) | (3,699,939) | (29,564,513) | ||
| Net decrease | (333,573) | $ (2,494,005) | (1,398,699) | $(11,277,440) | ||
| Class C | ||||||
| Sales | 64,629 | $ 519,768 | 132,801 | $ 1,060,779 | ||
| Issued to shareholders electing to receive payments of distributions in Fund shares | 5,575 | 44,572 | 13,573 | 107,806 | ||
| Redemptions | (132,299) | (1,055,389) | (350,028) | (2,803,687) | ||
| Net decrease | (62,095) | $ (491,049) | (203,654) | $ (1,635,102) | ||
| AMT-Free Fund (continued) | ||||||
| Six Months Ended March 31, 2024 (Unaudited) | Year Ended September 30, 2023 | |||||
| Shares | Amount | Shares | Amount | |||
| Class I | ||||||
| Sales | 1,497,106 | $ 13,093,521 | 7,686,554 | $ 67,351,799 | ||
| Issued to shareholders electing to receive payments of distributions in Fund shares | 213,721 | 1,874,811 | 462,122 | 4,032,283 | ||
| Redemptions | (3,129,392) | (27,171,269) | (8,214,826) | (71,802,602) | ||
| Net decrease | (1,418,565) | $(12,202,937) | (66,150) | $ (418,520) | ||
| National Fund | ||||||
| Six Months Ended March 31, 2024 (Unaudited) | Year Ended September 30, 2023 | |||||
| Shares | Amount | Shares | Amount | |||
| Class A | ||||||
| Sales | 10,320,050 | $ 94,607,356 | 17,509,254 | $ 159,744,009 | ||
| Issued to shareholders electing to receive payments of distributions in Fund shares | 2,088,244 | 19,147,473 | 4,046,834 | 36,759,694 | ||
| Redemptions | (12,986,017) | (117,513,061) | (27,121,465) | (246,291,872) | ||
| Net decrease | (577,723) | $ (3,758,232) | (5,565,377) | $ (49,788,169) | ||
| Class C | ||||||
| Sales | 748,307 | $ 6,874,141 | 1,180,431 | $ 10,743,048 | ||
| Issued to shareholders electing to receive payments of distributions in Fund shares | 68,398 | 626,714 | 151,181 | 1,373,270 | ||
| Redemptions | (1,210,304) | (10,969,238) | (2,435,564) | (22,168,619) | ||
| Net decrease | (393,599) | $ (3,468,383) | (1,103,952) | $ (10,052,301) | ||
| Class I | ||||||
| Sales | 93,138,790 | $ 848,493,465 | 195,677,015 | $ 1,778,704,708 | ||
| Issued to shareholders electing to receive payments of distributions in Fund shares | 4,883,772 | 44,799,199 | 7,485,180 | 67,982,627 | ||
| Redemptions | (66,286,888) | (593,131,685) | (131,390,441) | (1,187,986,860) | ||
| Net increase | 31,735,674 | $ 300,160,979 | 71,771,754 | $ 658,700,475 | ||
| National Fund | |
| Realized Gain (Loss) on Derivatives Recognized in Income | $ 1,196,126(1) |
| Change in Unrealized Appreciation (Depreciation) on Derivatives Recognized in Income | $(4,363,160) (2) |
| (1) | Statement of Operations location: Net realized gain (loss): Futures contracts. |
| (2) | Statement of Operations location: Change in unrealized appreciation (depreciation): Futures contracts. |
| National Fund | |
| Average Notional Cost: | |
| Futures Contracts — Short | $31,317,000 |
| • | Level 1 – quoted prices in active markets for identical investments |
| • | Level 2 – other significant observable inputs (including quoted prices for similar investments, interest rates, prepayment speeds, credit risk, etc.) |
| • | Level 3 – significant unobservable inputs (including a fund's own assumptions in determining the fair value of investments) |
| AMT-Free Fund | ||||
| Asset Description | Level 1 | Level 2 | Level 3 | Total |
| Tax-Exempt Mortgage-Backed Securities | $ — | $ 944,978 | $ — | $ 944,978 |
| Tax-Exempt Municipal Obligations | — | 227,066,534 | — | 227,066,534 |
| Total Investments | $ — | $ 228,011,512 | $ — | $ 228,011,512 |
| National Fund | ||||
| Asset Description | Level 1 | Level 2 | Level 3 | Total |
| Corporate Bonds | $ — | $ 45,108,882 | $ — | $ 45,108,882 |
| Tax-Exempt Municipal Obligations | — | 3,960,062,666 | — | 3,960,062,666 |
| Taxable Municipal Obligations | — | 274,789,861 | — | 274,789,861 |
| Total Investments | $ — | $4,279,961,409 | $ — | $4,279,961,409 |
| Officers | |
| Kenneth A. Topping President | Nicholas S. Di Lorenzo Secretary |
| Deidre E. Walsh Vice President and Chief Legal Officer | Laura T. Donovan Chief Compliance Officer |
| James F. Kirchner Treasurer | |
| Trustees |
| George J. Gorman Chairperson | |
| Alan C. Bowser | |
| Mark R. Fetting | |
| Cynthia E. Frost | |
| Valerie A. Mosley | |
| Anchal Pachnanda* |
| Keith Quinton | |
| Marcus L. Smith | |
| Susan J. Sutherland | |
| Scott E. Wennerholm | |
| Nancy A. Wiser |
| * | Interested Trustee |
| U.S. Customer Privacy Notice | March 2024 |
| FACTS | WHAT DOES EATON VANCE DO WITH YOUR PERSONAL INFORMATION? |
| Why? | Financial companies choose how they share your personal information. Federal law gives consumers the right to limit some but not all sharing. Federal law also requires us to tell you how we collect, share, and protect your personal information. Please read this notice carefully to understand what we do. |
| What? | The types of personal information we collect and share depend on the product or service you have with us. This information can include:■ Social Security number and income ■ investment experience and risk tolerance ■ checking account information and wire transfer instructions |
| How? | All financial companies need to share customers’ personal information to run their everyday business. In the section below, we list the reasons financial companies can share their customers’ personal information; the reasons Eaton Vance chooses to share; and whether you can limit this sharing. |
| Reasons we can share your personal information | Does Eaton Vance share? | Can you limit this sharing? |
| For our everyday business purposes — such as to process your transactions, maintain your account(s), respond to court orders and legal investigations, or report to credit bureaus | Yes | No |
| For our marketing purposes — to offer our products and services to you | Yes | No |
| For joint marketing with other financial companies | No | We don’t share |
| For our affiliates’ everyday business purposes — information about your transactions and experiences | Yes | No* |
| For our affiliates’ everyday business purposes — information about your creditworthiness | Yes | Yes* |
| For our affiliates to market to you | Yes | Yes* |
| For nonaffiliates to market to you | No | We don’t share |
| To limit our sharing | Call toll-free 1-800-262-1122 or email: EVPrivacy@eatonvance.comPlease note:If you are a new customer, we can begin sharing your information 30 days from the date we sent this notice. When you are no longer our customer, we continue to share your information as described in this notice. However, you can contact us at any time to limit our sharing. |
| Questions? | Call toll-free 1-800-262-1122 or email: EVPrivacy@eatonvance.com |
| U.S. Customer Privacy Notice — continued | March 2024 |
| Who we are | |
| Who is providing this notice? | Eaton Vance Management and our investment management affiliates (“Eaton Vance”) (see Affiliates definition below.) |
| What we do | |
| How does Eaton Vance protect my personal information? | To protect your personal information from unauthorized access and use, we use security measures that comply with federal law. These measures include computer safeguards and secured files and buildings. We have policies governing the proper handling of customer information by personnel and requiring third parties that provide support to adhere to appropriate security standards with respect to such information. |
| How does Eaton Vance collect my personal information? | We collect your personal information, for example, when you■ open an account or make deposits or withdrawals from your account ■ buy securities from us or make a wire transfer ■ give us your contact informationWe also collect your personal information from others, such as credit bureaus, affiliates, or other companies. |
| Why can’t I limit all sharing? | Federal law gives you the right to limit only■ sharing for affiliates’ everyday business purposes — information about your creditworthiness ■ affiliates from using your information to market to you ■ sharing for nonaffiliates to market to youState laws and individual companies may give you additional rights to limit sharing. (See below for more on your rights under state law.) |
| What happens when I limit sharing for an account I hold jointly with someone else? | Your choices will apply to everyone on your account. |
| Definitions | |
| Affiliates | Companies related by common ownership or control. They can be financial and nonfinancial companies.■ Our affiliates include registered investment advisers such as Eaton Vance Management, Eaton Vance Advisers International Ltd., Boston Management and Research, Calvert Research and Management, Parametric Portfolio Associates LLC, Atlanta Capital Management Company LLC, Morgan Stanley Investment Management Inc., Morgan Stanley Investment Management Co.; registered broker-dealers such as Morgan Stanley Distributors Inc. and Eaton Vance Distributors, Inc. (together, the “Investment Management Affiliates”); and companies with a Morgan Stanley name and financial companies such as Morgan Stanley Smith Barney LLC and Morgan Stanley & Co. (the “Morgan Stanley Affiliates”). |
| Nonaffiliates | Companies not related by common ownership or control. They can be financial and nonfinancial companies.■ Eaton Vance does not share with nonaffiliates so they can market to you. |
| Joint marketing | A formal agreement between nonaffiliated financial companies that together market financial products or services to you.■ Eaton Vance does not jointly market. |
| U.S. Customer Privacy Notice — continued | March 2024 |
| Other important information | |
| *PLEASE NOTE: Eaton Vance does not share your creditworthiness information or your transactions and experiences information with the Morgan Stanley Affiliates, nor does Eaton Vance enable the Morgan Stanley Affiliates to market to you. Your opt outs will prevent Eaton Vance from sharing your creditworthiness information with the Investment Management Affiliates and will prevent the Investment Management Affiliates from marketing their products to you.Vermont: Except as permitted by law, we will not share personal information we collect about Vermont residents with Nonaffiliates unless you provide us with your written consent to share such information.California: Except as permitted by law, we will not share personal information we collect about California residents with Nonaffiliates and we will limit sharing such personal information with our Affiliates to comply with California privacy laws that apply to us. |
Eaton Vance Management
One Post Office Square
Boston, MA 02109
Boston Management and Research
One Post Office Square
Boston, MA 02109
One Post Office Square
Boston, MA 02109
One Post Office Square
Boston, MA 02109
(617) 482-8260
One Congress Street, Suite 1
Boston, MA 02114-2016
Attn: Eaton Vance Funds
P.O. Box 534439
Pittsburgh, PA 15253-4439
(800) 262-1122
One Post Office Square
Boston, MA 02109
Item 2. Code of Ethics
Not required in this filing.
Item 3. Audit Committee Financial Expert
Not required in this filing.
Item 4. Principal Accountant Fees and Services
Not required in this filing.
Item 5. Audit Committee of Listed Registrants
Not applicable.
Item 6. Schedule of Investments
Please see schedule of investments contained in the Report to Stockholders included under Item 1 of this Form N-CSR.
Item 7. Disclosure of Proxy Voting Policies and Procedures for Closed-End Management Investment Companies
Not applicable.
Item 8. Portfolio Managers of Closed-End Management Investment Companies
Not applicable.
Item 9. Purchases of Equity Securities by Closed-End Management Investment Company and Affiliated Purchasers
Not applicable.
Item 10. Submission of Matters to a Vote of Security Holders
No material changes.
Item 11. Controls and Procedures
(a) It is the conclusion of the registrant’s principal executive officer and principal financial officer that the effectiveness of the registrant’s current disclosure controls and procedures (such disclosure controls and procedures having been evaluated within 90 days of the date of this filing) provide reasonable assurance that the information required to be disclosed by the registrant has been recorded, processed, summarized and reported within the time period specified in the Commission’s rules and forms and that the information required to be disclosed by the registrant has been accumulated and communicated to the registrant’s principal executive officer and principal financial officer in order to allow timely decisions regarding required disclosure.
(b) There have been no changes in the registrant’s internal controls over financial reporting during the second fiscal quarter of the period covered by this report that has materially affected, or is reasonably likely to materially affect, the registrant’s internal control over financial reporting.
Item 12. Disclosure of Securities Lending Activities for Closed-End Management Investment Companies
Not applicable.
Item 13. Exhibits
| (a)(1) | Registrant’s Code of Ethics – Not applicable (please see Item 2). | |
| (a)(2)(i) | Principal Financial Officer’s Section 302 certification. | |
| (a)(2)(ii) | Principal Executive Officer’s Section 302 certification. | |
| (b) | Combined Section 906 certification. | |
Signatures
Pursuant to the requirements of the Securities Exchange Act of 1934 and the Investment Company Act of 1940, the registrant has duly caused this report to be signed on its behalf by the undersigned, thereunto duly authorized.
Eaton Vance Mutual Funds Trust | ||
| By: | /s/ Kenneth A. Topping | |
Kenneth A. Topping | ||
Principal Executive Officer | ||
Date: May 17, 2024
Pursuant to the requirements of the Securities Exchange Act of 1934 and the Investment Company Act of 1940, this report has been signed below by the following persons on behalf of the registrant and in the capacities and on the dates indicated.
| By: | /s/ James F. Kirchner | |
James F. Kirchner | ||
Principal Financial Officer | ||
| Date: May 17, 2024 | ||
| By: | /s/ Kenneth A. Topping | |
Kenneth A. Topping | ||
Principal Executive Officer | ||
| Date: May 17, 2024 | ||