0000745463eatonvance:C000014488Membereatonvance:SectorCommunicationServicesSectorMember2024-12-31
UNITED STATES
SECURITIES AND EXCHANGE COMMISSION
Washington, D.C. 20549
Form N-CSR
CERTIFIED SHAREHOLDER REPORT OF REGISTERED
MANAGEMENT INVESTMENT COMPANIES
Investment Company Act File Number: 811-04015
Eaton Vance Mutual Funds Trust
(Exact Name of Registrant as Specified in Charter)
One Post Office Square, Boston, Massachusetts 02109
(Address of Principal Executive Offices)
Deidre E. Walsh
One Post Office Square, Boston, Massachusetts 02109
(Name and Address of Agent for Services)
(617) 482-8260
(Registrant’s Telephone Number)
December 31
Date of Fiscal Year End
December 31, 2024
Date of Reporting Period
| Item 1. | Reports to Stockholders |
Parametric Commodity Strategy Fund
Annual Shareholder Report December 31, 2024
This annual shareholder report contains important information about the Parametric Commodity Strategy Fund for the period of January 1, 2024 to December 31, 2024. You can find additional information about the Fund at www.eatonvance.com/parametric-fund-documents.php. You can also request this information by contacting us at 1-800-260-0761.
What were the Fund costs for the last year?
(based on a hypothetical $10,000 investment)
| Class Name | Costs of a $10,000 investment | Costs paid as a percentage of a $10,000 investment |
|---|
| Class A | $95 | 0.91% |
|---|
How did the Fund perform last year and what affected its performance?
Key contributors to (↑) and detractors from (↓) performance, relative to the Bloomberg Commodity Index Total Return (the Index):
↑ The Fund’s exposure to cocoa helped Index-relative returns amid adverse weather conditions in the Ivory Coast and Ghana that sent commodity prices soaring during the period
↑ The Fund’s exposure to Robusta coffee contributed to Index-relative performance, as poor weather conditions in key growing regions generated crop shortages
↑ Contract selections in natural gas contributed to Fund performance relative to the Index ― primarily the result of a significant drop in natural gas spot prices during the first quarter of 2024
↓ The Fund’s underweight exposure to gold detracted from Index-relative returns, as the U.S. Federal Reserve’s easing monetary policy helped lift gold prices
↓ An underweight exposure to crude oil hurt Index-relative returns, as oil prices increased due, in part, to escalating geopolitical tensions in the Middle East
↓ The Fund’s exposure to palladium hampered Index-relative returns, partially due to the market’s expectation of a 2025 inventory surplus of the precious metal
Comparison of the change in value of a $10,000 investment for the period indicated.
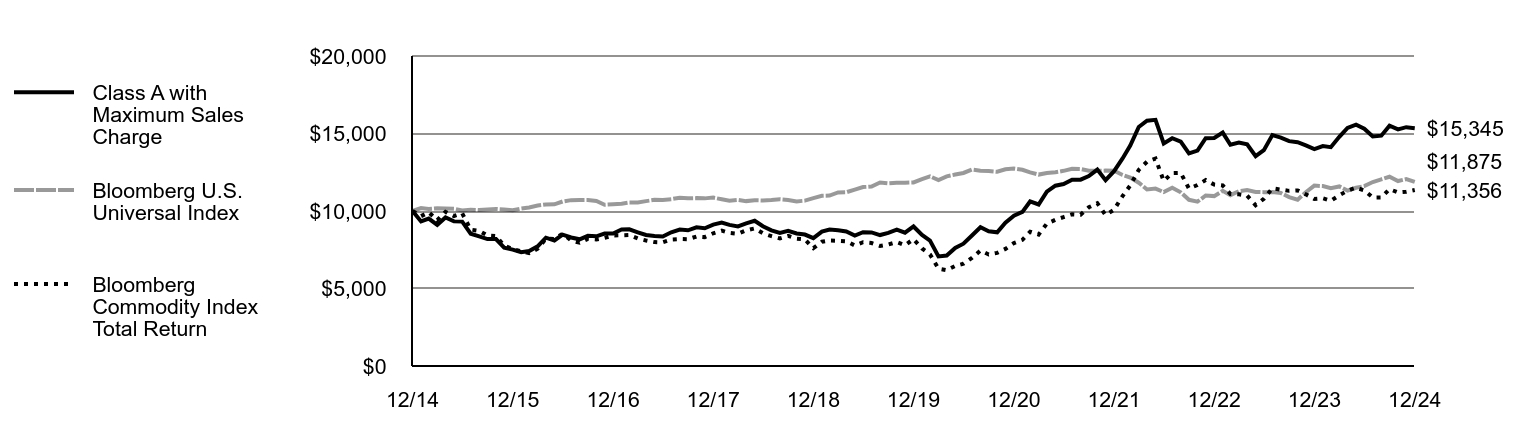
| Class A with Maximum Sales Charge | Bloomberg U.S. Universal Index | Bloomberg Commodity Index Total Return |
|---|
| 12/14 | $10,000 | $10,000 | $10,000 |
|---|
| 1/15 | $9,329 | $10,190 | $9,666 |
|---|
| 2/15 | $9,510 | $10,131 | $9,915 |
|---|
| 3/15 | $9,104 | $10,173 | $9,406 |
|---|
| 4/15 | $9,585 | $10,161 | $9,945 |
|---|
| 5/15 | $9,330 | $10,143 | $9,677 |
|---|
| 6/15 | $9,315 | $10,030 | $9,844 |
|---|
| 7/15 | $8,533 | $10,088 | $8,799 |
|---|
| 8/15 | $8,368 | $10,059 | $8,718 |
|---|
| 9/15 | $8,188 | $10,098 | $8,420 |
|---|
| 10/15 | $8,188 | $10,130 | $8,382 |
|---|
| 11/15 | $7,632 | $10,093 | $7,774 |
|---|
| 12/15 | $7,512 | $10,043 | $7,534 |
|---|
| 1/16 | $7,346 | $10,154 | $7,408 |
|---|
| 2/16 | $7,422 | $10,226 | $7,287 |
|---|
| 3/16 | $7,722 | $10,351 | $7,566 |
|---|
| 4/16 | $8,278 | $10,422 | $8,210 |
|---|
| 5/16 | $8,098 | $10,430 | $8,194 |
|---|
| 6/16 | $8,473 | $10,614 | $8,533 |
|---|
| 7/16 | $8,293 | $10,701 | $8,096 |
|---|
| 8/16 | $8,173 | $10,713 | $7,954 |
|---|
| 9/16 | $8,398 | $10,715 | $8,203 |
|---|
| 10/16 | $8,368 | $10,644 | $8,163 |
|---|
| 11/16 | $8,548 | $10,405 | $8,272 |
|---|
| 12/16 | $8,547 | $10,436 | $8,421 |
|---|
| 1/17 | $8,803 | $10,473 | $8,432 |
|---|
| 2/17 | $8,819 | $10,553 | $8,450 |
|---|
| 3/17 | $8,627 | $10,550 | $8,225 |
|---|
| 4/17 | $8,451 | $10,637 | $8,101 |
|---|
| 5/17 | $8,387 | $10,719 | $7,994 |
|---|
| 6/17 | $8,355 | $10,710 | $7,978 |
|---|
| 7/17 | $8,627 | $10,764 | $8,159 |
|---|
| 8/17 | $8,803 | $10,856 | $8,191 |
|---|
| 9/17 | $8,755 | $10,818 | $8,179 |
|---|
| 10/17 | $8,947 | $10,831 | $8,355 |
|---|
| 11/17 | $8,883 | $10,815 | $8,316 |
|---|
| 12/17 | $9,120 | $10,863 | $8,564 |
|---|
| 1/18 | $9,254 | $10,758 | $8,734 |
|---|
| 2/18 | $9,103 | $10,656 | $8,583 |
|---|
| 3/18 | $9,002 | $10,710 | $8,530 |
|---|
| 4/18 | $9,204 | $10,638 | $8,750 |
|---|
| 5/18 | $9,372 | $10,696 | $8,874 |
|---|
| 6/18 | $9,019 | $10,681 | $8,564 |
|---|
| 7/18 | $8,750 | $10,703 | $8,381 |
|---|
| 8/18 | $8,581 | $10,756 | $8,233 |
|---|
| 9/18 | $8,716 | $10,710 | $8,391 |
|---|
| 10/18 | $8,548 | $10,620 | $8,210 |
|---|
| 11/18 | $8,480 | $10,668 | $8,164 |
|---|
| 12/18 | $8,245 | $10,835 | $7,601 |
|---|
| 1/19 | $8,667 | $10,984 | $8,015 |
|---|
| 2/19 | $8,802 | $10,996 | $8,096 |
|---|
| 3/19 | $8,752 | $11,195 | $8,082 |
|---|
| 4/19 | $8,684 | $11,210 | $8,048 |
|---|
| 5/19 | $8,414 | $11,382 | $7,777 |
|---|
| 6/19 | $8,633 | $11,543 | $7,986 |
|---|
| 7/19 | $8,616 | $11,578 | $7,932 |
|---|
| 8/19 | $8,448 | $11,840 | $7,748 |
|---|
| 9/19 | $8,583 | $11,788 | $7,839 |
|---|
| 10/19 | $8,802 | $11,826 | $7,998 |
|---|
| 11/19 | $8,600 | $11,824 | $7,793 |
|---|
| 12/19 | $9,002 | $11,842 | $8,186 |
|---|
| 1/20 | $8,455 | $12,054 | $7,584 |
|---|
| 2/20 | $8,097 | $12,235 | $7,201 |
|---|
| 3/20 | $7,072 | $11,996 | $6,279 |
|---|
| 4/20 | $7,123 | $12,236 | $6,182 |
|---|
| 5/20 | $7,618 | $12,350 | $6,451 |
|---|
| 6/20 | $7,892 | $12,453 | $6,598 |
|---|
| 7/20 | $8,421 | $12,672 | $6,974 |
|---|
| 8/20 | $8,951 | $12,599 | $7,446 |
|---|
| 9/20 | $8,694 | $12,576 | $7,197 |
|---|
| 10/20 | $8,626 | $12,531 | $7,298 |
|---|
| 11/20 | $9,241 | $12,695 | $7,554 |
|---|
| 12/20 | $9,698 | $12,739 | $7,930 |
|---|
| 1/21 | $9,945 | $12,659 | $8,138 |
|---|
| 2/21 | $10,614 | $12,495 | $8,665 |
|---|
| 3/21 | $10,420 | $12,350 | $8,479 |
|---|
| 4/21 | $11,247 | $12,454 | $9,182 |
|---|
| 5/21 | $11,634 | $12,501 | $9,432 |
|---|
| 6/21 | $11,740 | $12,592 | $9,607 |
|---|
| 7/21 | $12,022 | $12,719 | $9,784 |
|---|
| 8/21 | $12,022 | $12,710 | $9,755 |
|---|
| 9/21 | $12,250 | $12,602 | $10,240 |
|---|
| 10/21 | $12,673 | $12,591 | $10,505 |
|---|
| 11/21 | $11,986 | $12,607 | $9,737 |
|---|
| 12/21 | $12,569 | $12,598 | $10,080 |
|---|
| 1/22 | $13,392 | $12,322 | $10,965 |
|---|
| 2/22 | $14,216 | $12,154 | $11,648 |
|---|
| 3/22 | $15,420 | $11,828 | $12,655 |
|---|
| 4/22 | $15,822 | $11,387 | $13,179 |
|---|
| 5/22 | $15,882 | $11,449 | $13,380 |
|---|
| 6/22 | $14,356 | $11,221 | $11,938 |
|---|
| 7/22 | $14,698 | $11,503 | $12,447 |
|---|
| 8/22 | $14,477 | $11,204 | $12,458 |
|---|
| 9/22 | $13,714 | $10,721 | $11,448 |
|---|
| 10/22 | $13,894 | $10,603 | $11,676 |
|---|
| 11/22 | $14,698 | $10,999 | $11,996 |
|---|
| 12/22 | $14,713 | $10,961 | $11,702 |
|---|
| 1/23 | $15,059 | $11,301 | $11,645 |
|---|
| 2/23 | $14,274 | $11,024 | $11,098 |
|---|
| 3/23 | $14,413 | $11,282 | $11,075 |
|---|
| 4/23 | $14,297 | $11,351 | $10,991 |
|---|
| 5/23 | $13,535 | $11,233 | $10,372 |
|---|
| 6/23 | $13,928 | $11,216 | $10,791 |
|---|
| 7/23 | $14,898 | $11,227 | $11,466 |
|---|
| 8/23 | $14,736 | $11,160 | $11,378 |
|---|
| 9/23 | $14,505 | $10,893 | $11,299 |
|---|
| 10/23 | $14,436 | $10,730 | $11,329 |
|---|
| 11/23 | $14,228 | $11,213 | $11,074 |
|---|
| 12/23 | $13,998 | $11,638 | $10,776 |
|---|
| 1/24 | $14,189 | $11,610 | $10,819 |
|---|
| 2/24 | $14,117 | $11,471 | $10,660 |
|---|
| 3/24 | $14,786 | $11,584 | $11,013 |
|---|
| 4/24 | $15,359 | $11,313 | $11,309 |
|---|
| 5/24 | $15,574 | $11,500 | $11,507 |
|---|
| 6/24 | $15,311 | $11,606 | $11,330 |
|---|
| 7/24 | $14,810 | $11,869 | $10,873 |
|---|
| 8/24 | $14,858 | $12,044 | $10,878 |
|---|
| 9/24 | $15,502 | $12,209 | $11,407 |
|---|
| 10/24 | $15,264 | $11,932 | $11,196 |
|---|
| 11/24 | $15,407 | $12,057 | $11,241 |
|---|
| 12/24 | $15,345 | $11,875 | $11,356 |
|---|
Average Annual Total Returns (%)Footnote Reference1
| Fund | 1 Year | 5 Years | 10 Years |
|---|
| Class A | 9.69% | 11.26% | 4.72% |
|---|
| Class A with 3.25% Maximum Sales Charge | 6.07% | 10.51% | 4.37% |
|---|
| Bloomberg U.S. Universal Index | 2.04% | 0.06% | 1.73% |
|---|
| Bloomberg Commodity Index Total Return | 5.38% | 6.76% | 1.28% |
|---|
| Footnote | Description |
Footnote1 | In accordance with regulatory changes requiring the Fund's primary benchmark to represent the overall applicable market, the Fund's primary prospectus benchmark changed to the Bloomberg U.S. Universal Index effective May 1, 2024. |
Performance does not reflect the deduction of taxes that a shareholder would pay on Fund distributions or redemption of Fund shares. Performance assumes that all dividends and distributions, if any, were reinvested. For more recent performance information, visit www.eatonvance.com/performance.php.
THE FUND'S PAST PERFORMANCE IS NO GUARANTEE OF FUTURE RESULTS.
| Total Net Assets | $1,430,233,441 |
|---|
| # of Portfolio Holdings (including derivatives) | 88 |
|---|
| Portfolio Turnover Rate | 0% |
|---|
| Total Advisory Fees Paid | $7,020,256 |
|---|
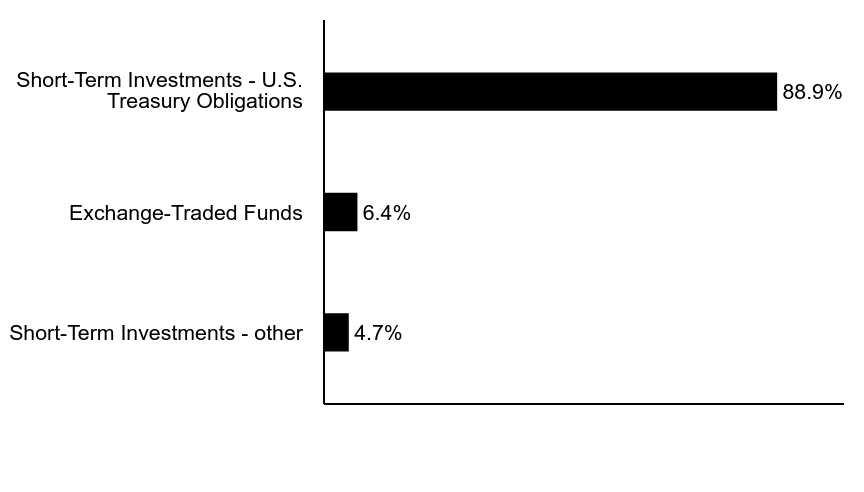
What did the Fund invest in?
The following tables reflect what the Fund invested in as of the report date.
Asset Allocation (% of total investments)
| Value | Value |
|---|
| Short-Term Investments - other | 4.7% |
| Exchange-Traded Funds | 6.4% |
| Short-Term Investments - U.S. Treasury Obligations | 88.9% |
Commodity Exposure (% of net assets)
| Agriculture | 26.6% |
| Energy | 25.7% |
| Industrial Metals | 23.8% |
| Precious Metals | 17.5% |
| Livestock | 6.3% |
If you wish to view additional information about the Fund, including the prospectus, statement of additional information, financial statements and holdings, please scan the QR code or visit www.eatonvance.com/parametric-fund-documents.php. For proxy information, please visit www.eatonvance.com/proxyvoting.
The Funds may deliver a single copy of certain required shareholder documents (including prospectuses, shareholder reports, and proxy materials) to investors with the same last name and the same address. Your participation will continue indefinitely unless you instruct otherwise by calling 1-800-260-0761 or by contacting your financial intermediary. Your instruction will typically be effective within 30 days of receipt.
Not FDIC Insured | May Lose Value | No Bank Guarantee
Annual Shareholder Report December 31, 2024
Parametric Commodity Strategy Fund
Annual Shareholder Report December 31, 2024
This annual shareholder report contains important information about the Parametric Commodity Strategy Fund for the period of January 1, 2024 to December 31, 2024. You can find additional information about the Fund at www.eatonvance.com/parametric-fund-documents.php. You can also request this information by contacting us at 1-800-260-0761.
What were the Fund costs for the last year?
(based on a hypothetical $10,000 investment)
| Class Name | Costs of a $10,000 investment | Costs paid as a percentage of a $10,000 investment |
|---|
| Class I | $69 | 0.66% |
|---|
How did the Fund perform last year and what affected its performance?
Key contributors to (↑) and detractors from (↓) performance, relative to the Bloomberg Commodity Index Total Return (the Index):
↑ The Fund’s exposure to cocoa helped Index-relative returns amid adverse weather conditions in the Ivory Coast and Ghana that sent commodity prices soaring during the period
↑ The Fund’s exposure to Robusta coffee contributed to Index-relative performance, as poor weather conditions in key growing regions generated crop shortages
↑ Contract selections in natural gas contributed to Fund performance relative to the Index ― primarily the result of a significant drop in natural gas spot prices during the first quarter of 2024
↓ The Fund’s underweight exposure to gold detracted from Index-relative returns, as the U.S. Federal Reserve’s easing monetary policy helped lift gold prices
↓ An underweight exposure to crude oil hurt Index-relative returns, as oil prices increased due, in part, to escalating geopolitical tensions in the Middle East
↓ The Fund’s exposure to palladium hampered Index-relative returns, partially due to the market’s expectation of a 2025 inventory surplus of the precious metal
Comparison of the change in value of a $1,000,000 investment for the period indicated.
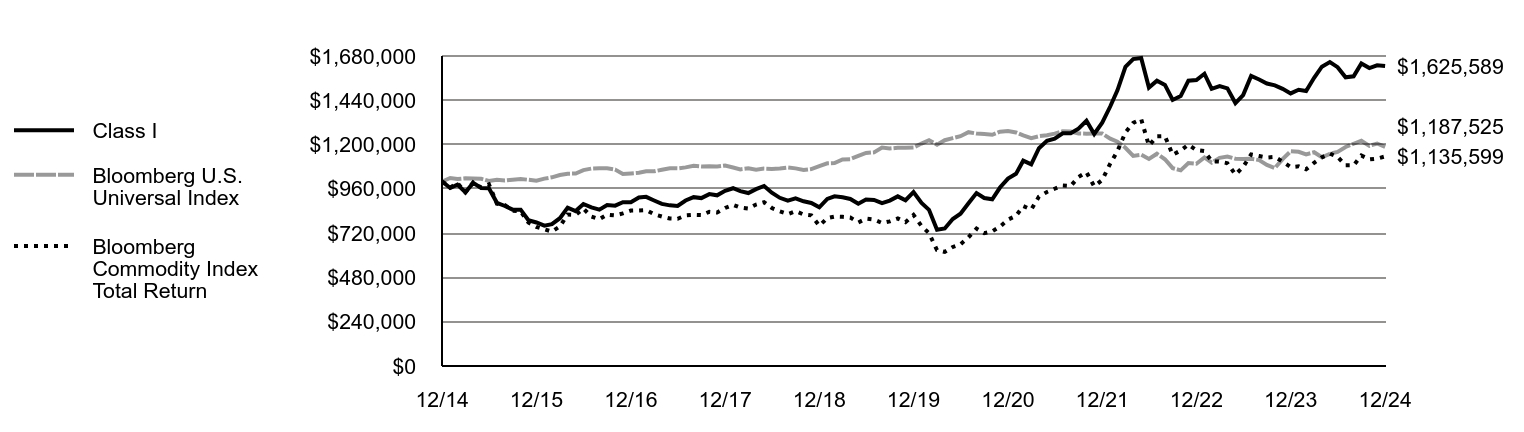
| Class I | Bloomberg U.S. Universal Index | Bloomberg Commodity Index Total Return |
|---|
| 12/14 | $1,000,000 | $1,000,000 | $1,000,000 |
|---|
| 1/15 | $964,506 | $1,019,035 | $966,598 |
|---|
| 2/15 | $983,025 | $1,013,096 | $991,500 |
|---|
| 3/15 | $941,359 | $1,017,278 | $940,574 |
|---|
| 4/15 | $992,282 | $1,016,097 | $994,505 |
|---|
| 5/15 | $964,505 | $1,014,320 | $967,672 |
|---|
| 6/15 | $962,961 | $1,002,999 | $984,387 |
|---|
| 7/15 | $884,256 | $1,008,840 | $879,855 |
|---|
| 8/15 | $867,280 | $1,005,867 | $871,771 |
|---|
| 9/15 | $847,219 | $1,009,805 | $841,981 |
|---|
| 10/15 | $847,217 | $1,013,032 | $838,224 |
|---|
| 11/15 | $790,117 | $1,009,338 | $777,417 |
|---|
| 12/15 | $777,773 | $1,004,296 | $753,428 |
|---|
| 1/16 | $760,799 | $1,015,382 | $740,766 |
|---|
| 2/16 | $768,516 | $1,022,595 | $728,717 |
|---|
| 3/16 | $800,923 | $1,035,127 | $756,566 |
|---|
| 4/16 | $858,020 | $1,042,180 | $820,966 |
|---|
| 5/16 | $839,501 | $1,042,994 | $819,415 |
|---|
| 6/16 | $878,084 | $1,061,356 | $853,263 |
|---|
| 7/16 | $859,565 | $1,070,102 | $809,649 |
|---|
| 8/16 | $847,219 | $1,071,256 | $795,382 |
|---|
| 9/16 | $871,908 | $1,071,510 | $820,293 |
|---|
| 10/16 | $868,821 | $1,064,402 | $816,286 |
|---|
| 11/16 | $887,340 | $1,040,477 | $827,172 |
|---|
| 12/16 | $886,978 | $1,043,568 | $842,081 |
|---|
| 1/17 | $913,309 | $1,047,250 | $843,222 |
|---|
| 2/17 | $916,599 | $1,055,330 | $844,983 |
|---|
| 3/17 | $896,851 | $1,054,976 | $822,494 |
|---|
| 4/17 | $878,748 | $1,063,730 | $810,110 |
|---|
| 5/17 | $870,520 | $1,071,937 | $799,350 |
|---|
| 6/17 | $867,229 | $1,071,028 | $797,813 |
|---|
| 7/17 | $896,849 | $1,076,363 | $815,853 |
|---|
| 8/17 | $914,949 | $1,085,649 | $819,141 |
|---|
| 9/17 | $910,012 | $1,081,828 | $817,920 |
|---|
| 10/17 | $931,405 | $1,083,127 | $835,459 |
|---|
| 11/17 | $924,821 | $1,081,488 | $831,605 |
|---|
| 12/17 | $949,589 | $1,086,256 | $856,433 |
|---|
| 1/18 | $963,453 | $1,075,803 | $873,441 |
|---|
| 2/18 | $947,857 | $1,065,602 | $858,335 |
|---|
| 3/18 | $937,458 | $1,070,977 | $853,000 |
|---|
| 4/18 | $958,253 | $1,063,831 | $875,046 |
|---|
| 5/18 | $975,582 | $1,069,632 | $887,442 |
|---|
| 6/18 | $939,193 | $1,068,081 | $856,417 |
|---|
| 7/18 | $911,469 | $1,070,316 | $838,139 |
|---|
| 8/18 | $895,873 | $1,075,589 | $823,299 |
|---|
| 9/18 | $908,005 | $1,070,981 | $839,087 |
|---|
| 10/18 | $892,410 | $1,062,021 | $820,973 |
|---|
| 11/18 | $883,747 | $1,066,798 | $816,350 |
|---|
| 12/18 | $859,929 | $1,083,488 | $760,123 |
|---|
| 1/19 | $905,372 | $1,098,427 | $801,523 |
|---|
| 2/19 | $919,354 | $1,099,625 | $809,637 |
|---|
| 3/19 | $914,110 | $1,119,481 | $808,192 |
|---|
| 4/19 | $905,373 | $1,121,048 | $804,785 |
|---|
| 5/19 | $879,154 | $1,138,221 | $777,708 |
|---|
| 6/19 | $901,875 | $1,154,320 | $798,593 |
|---|
| 7/19 | $900,125 | $1,157,756 | $793,222 |
|---|
| 8/19 | $882,648 | $1,183,953 | $774,823 |
|---|
| 9/19 | $896,632 | $1,178,824 | $783,924 |
|---|
| 10/19 | $919,355 | $1,182,633 | $799,775 |
|---|
| 11/19 | $898,380 | $1,182,396 | $779,296 |
|---|
| 12/19 | $942,321 | $1,184,158 | $818,583 |
|---|
| 1/20 | $883,759 | $1,205,411 | $758,361 |
|---|
| 2/20 | $846,491 | $1,223,460 | $720,138 |
|---|
| 3/20 | $738,241 | $1,199,562 | $627,895 |
|---|
| 4/20 | $745,341 | $1,223,591 | $618,235 |
|---|
| 5/20 | $796,804 | $1,235,019 | $645,069 |
|---|
| 6/20 | $825,197 | $1,245,324 | $659,792 |
|---|
| 7/20 | $881,986 | $1,267,199 | $697,449 |
|---|
| 8/20 | $936,998 | $1,259,892 | $744,619 |
|---|
| 9/20 | $910,379 | $1,257,621 | $719,664 |
|---|
| 10/20 | $903,282 | $1,253,126 | $729,802 |
|---|
| 11/20 | $967,170 | $1,269,479 | $755,436 |
|---|
| 12/20 | $1,015,753 | $1,273,862 | $793,012 |
|---|
| 1/21 | $1,041,374 | $1,265,856 | $813,834 |
|---|
| 2/21 | $1,112,752 | $1,249,522 | $866,493 |
|---|
| 3/21 | $1,092,622 | $1,234,981 | $847,890 |
|---|
| 4/21 | $1,180,470 | $1,245,366 | $918,186 |
|---|
| 5/21 | $1,220,736 | $1,250,116 | $943,237 |
|---|
| 6/21 | $1,231,716 | $1,259,230 | $960,699 |
|---|
| 7/21 | $1,260,996 | $1,271,874 | $978,362 |
|---|
| 8/21 | $1,260,996 | $1,271,025 | $975,469 |
|---|
| 9/21 | $1,286,618 | $1,260,171 | $1,024,001 |
|---|
| 10/21 | $1,328,713 | $1,259,141 | $1,050,462 |
|---|
| 11/21 | $1,257,336 | $1,260,662 | $973,667 |
|---|
| 12/21 | $1,318,492 | $1,259,812 | $1,007,991 |
|---|
| 1/22 | $1,406,252 | $1,232,192 | $1,096,480 |
|---|
| 2/22 | $1,494,012 | $1,215,392 | $1,164,788 |
|---|
| 3/22 | $1,621,474 | $1,182,784 | $1,265,507 |
|---|
| 4/22 | $1,663,264 | $1,138,670 | $1,317,908 |
|---|
| 5/22 | $1,669,533 | $1,144,935 | $1,338,005 |
|---|
| 6/22 | $1,508,639 | $1,122,056 | $1,193,841 |
|---|
| 7/22 | $1,546,251 | $1,150,267 | $1,244,729 |
|---|
| 8/22 | $1,523,266 | $1,120,364 | $1,245,825 |
|---|
| 9/22 | $1,441,774 | $1,072,095 | $1,144,808 |
|---|
| 10/22 | $1,462,670 | $1,060,331 | $1,167,603 |
|---|
| 11/22 | $1,546,251 | $1,099,867 | $1,199,573 |
|---|
| 12/22 | $1,550,055 | $1,096,132 | $1,170,209 |
|---|
| 1/23 | $1,583,752 | $1,130,134 | $1,164,475 |
|---|
| 2/23 | $1,501,917 | $1,102,365 | $1,109,757 |
|---|
| 3/23 | $1,516,359 | $1,128,225 | $1,107,471 |
|---|
| 4/23 | $1,504,324 | $1,135,118 | $1,099,149 |
|---|
| 5/23 | $1,424,896 | $1,123,349 | $1,037,198 |
|---|
| 6/23 | $1,468,220 | $1,121,603 | $1,079,093 |
|---|
| 7/23 | $1,571,718 | $1,122,718 | $1,146,605 |
|---|
| 8/23 | $1,552,462 | $1,115,957 | $1,137,820 |
|---|
| 9/23 | $1,530,800 | $1,089,347 | $1,129,920 |
|---|
| 10/23 | $1,521,172 | $1,072,965 | $1,132,921 |
|---|
| 11/23 | $1,501,917 | $1,121,254 | $1,107,400 |
|---|
| 12/23 | $1,477,358 | $1,163,799 | $1,077,615 |
|---|
| 1/24 | $1,497,322 | $1,161,014 | $1,081,903 |
|---|
| 2/24 | $1,489,835 | $1,147,094 | $1,065,988 |
|---|
| 3/24 | $1,562,206 | $1,158,357 | $1,101,253 |
|---|
| 4/24 | $1,622,099 | $1,131,288 | $1,130,887 |
|---|
| 5/24 | $1,647,054 | $1,150,040 | $1,150,741 |
|---|
| 6/24 | $1,619,603 | $1,160,553 | $1,133,042 |
|---|
| 7/24 | $1,564,701 | $1,186,895 | $1,087,312 |
|---|
| 8/24 | $1,569,693 | $1,204,368 | $1,087,841 |
|---|
| 9/24 | $1,639,568 | $1,220,886 | $1,140,727 |
|---|
| 10/24 | $1,614,612 | $1,193,156 | $1,119,587 |
|---|
| 11/24 | $1,629,585 | $1,205,735 | $1,124,141 |
|---|
| 12/24 | $1,625,589 | $1,187,525 | $1,135,599 |
|---|
Average Annual Total Returns (%)Footnote Reference1
| Fund | 1 Year | 5 Years | 10 Years |
|---|
| Class I | 10.03% | 11.51% | 4.97% |
|---|
| Bloomberg U.S. Universal Index | 2.04% | 0.06% | 1.73% |
|---|
| Bloomberg Commodity Index Total Return | 5.38% | 6.76% | 1.28% |
|---|
| Footnote | Description |
Footnote1 | In accordance with regulatory changes requiring the Fund's primary benchmark to represent the overall applicable market, the Fund's primary prospectus benchmark changed to the Bloomberg U.S. Universal Index effective May 1, 2024. |
Performance does not reflect the deduction of taxes that a shareholder would pay on Fund distributions or redemption of Fund shares. Performance assumes that all dividends and distributions, if any, were reinvested. For more recent performance information, visit www.eatonvance.com/performance.php.
THE FUND'S PAST PERFORMANCE IS NO GUARANTEE OF FUTURE RESULTS.
| Total Net Assets | $1,430,233,441 |
|---|
| # of Portfolio Holdings (including derivatives) | 88 |
|---|
| Portfolio Turnover Rate | 0% |
|---|
| Total Advisory Fees Paid | $7,020,256 |
|---|
What did the Fund invest in?
The following tables reflect what the Fund invested in as of the report date.
Asset Allocation (% of total investments)
| Value | Value |
|---|
| Short-Term Investments - other | 4.7% |
| Exchange-Traded Funds | 6.4% |
| Short-Term Investments - U.S. Treasury Obligations | 88.9% |
Commodity Exposure (% of net assets)
| Agriculture | 26.6% |
| Energy | 25.7% |
| Industrial Metals | 23.8% |
| Precious Metals | 17.5% |
| Livestock | 6.3% |
If you wish to view additional information about the Fund, including the prospectus, statement of additional information, financial statements and holdings, please scan the QR code or visit www.eatonvance.com/parametric-fund-documents.php. For proxy information, please visit www.eatonvance.com/proxyvoting.
The Funds may deliver a single copy of certain required shareholder documents (including prospectuses, shareholder reports, and proxy materials) to investors with the same last name and the same address. Your participation will continue indefinitely unless you instruct otherwise by calling 1-800-260-0761 or by contacting your financial intermediary. Your instruction will typically be effective within 30 days of receipt.
Not FDIC Insured | May Lose Value | No Bank Guarantee
Annual Shareholder Report December 31, 2024
Annual Shareholder Report December 31, 2024
This annual shareholder report contains important information about the Eaton Vance Stock Fund for the period of January 1, 2024 to December 31, 2024. You can find additional information about the Fund at www.eatonvance.com/open-end-mutual-fund-documents.php. You can also request this information by contacting us at 1-800-262-1122.
What were the Fund costs for the last year?Footnote Reference*
(based on a hypothetical $10,000 investment)
| Class Name | Costs of a $10,000 investment | Costs paid as a percentage of a $10,000 investment |
|---|
| Class A | $113 | 0.98% |
|---|
| Footnote | Description |
Footnote* | Expenses in the table reflect the expenses of both the Fund and Stock Portfolio, the Portfolio in which it invests. |
How did the Fund perform last year and what affected its performance?
Key contributors to (↑) and detractors from (↓) performance, relative to the S&P 500® Index (the Index):
↑ An overweight position in NVIDIA Corp., a major microchip supplier for artificial intelligence (AI) applications, helped returns as NVIDIA’s stock price soared
↑ An overweight position in Broadcom, Inc. aided relative returns as its stock price doubled on AI-driven demand for its semiconductor and software products
↑ An overweight position in global retail and grocery giant Walmart, Inc. rose in value as its core U.S. retail business gained market share during the period
↑ Among sectors, stock selections and underweight exposures to health care and consumer staples, and stock selections in information technology, helped returns
↓ An overweight position in energy exploration and production firm ConocoPhillips fell in value as global energy demand and oil prices weakened during the period
↓ An overweight position in managed care company Elevance Health, Inc. — sold during the period — hurt returns as rising Medicaid costs depressed its stock price
↓ An underweight position in electric car maker Tesla Inc. hurt relative returns as its stock rose on optimism over the potential launch of an autonomous vehicle
↓ Among sectors, stock selections in energy and real estate detracted from Fund performance relative to the Index during the period
Comparison of the change in value of a $10,000 investment for the period indicated.

| Class A with Maximum Sales Charge | S&P 500® Index |
|---|
| 12/14 | $10,000 | $10,000 |
|---|
| 1/15 | $9,342 | $9,700 |
|---|
| 2/15 | $9,868 | $10,257 |
|---|
| 3/15 | $9,832 | $10,095 |
|---|
| 4/15 | $9,868 | $10,192 |
|---|
| 5/15 | $10,071 | $10,323 |
|---|
| 6/15 | $9,922 | $10,123 |
|---|
| 7/15 | $10,133 | $10,335 |
|---|
| 8/15 | $9,582 | $9,712 |
|---|
| 9/15 | $9,247 | $9,471 |
|---|
| 10/15 | $10,021 | $10,270 |
|---|
| 11/15 | $10,052 | $10,301 |
|---|
| 12/15 | $9,902 | $10,138 |
|---|
| 1/16 | $9,465 | $9,635 |
|---|
| 2/16 | $9,354 | $9,622 |
|---|
| 3/16 | $9,968 | $10,275 |
|---|
| 4/16 | $9,929 | $10,315 |
|---|
| 5/16 | $10,098 | $10,500 |
|---|
| 6/16 | $10,132 | $10,527 |
|---|
| 7/16 | $10,447 | $10,915 |
|---|
| 8/16 | $10,401 | $10,931 |
|---|
| 9/16 | $10,355 | $10,933 |
|---|
| 10/16 | $10,152 | $10,733 |
|---|
| 11/16 | $10,375 | $11,131 |
|---|
| 12/16 | $10,575 | $11,351 |
|---|
| 1/17 | $10,703 | $11,566 |
|---|
| 2/17 | $11,086 | $12,025 |
|---|
| 3/17 | $11,079 | $12,039 |
|---|
| 4/17 | $11,180 | $12,163 |
|---|
| 5/17 | $11,395 | $12,334 |
|---|
| 6/17 | $11,529 | $12,411 |
|---|
| 7/17 | $11,726 | $12,667 |
|---|
| 8/17 | $11,733 | $12,705 |
|---|
| 9/17 | $11,918 | $12,967 |
|---|
| 10/17 | $12,191 | $13,270 |
|---|
| 11/17 | $12,472 | $13,677 |
|---|
| 12/17 | $12,680 | $13,829 |
|---|
| 1/18 | $13,275 | $14,621 |
|---|
| 2/18 | $12,818 | $14,082 |
|---|
| 3/18 | $12,550 | $13,724 |
|---|
| 4/18 | $12,673 | $13,777 |
|---|
| 5/18 | $12,963 | $14,108 |
|---|
| 6/18 | $12,999 | $14,195 |
|---|
| 7/18 | $13,499 | $14,724 |
|---|
| 8/18 | $13,846 | $15,203 |
|---|
| 9/18 | $13,890 | $15,290 |
|---|
| 10/18 | $12,985 | $14,245 |
|---|
| 11/18 | $13,211 | $14,535 |
|---|
| 12/18 | $11,933 | $13,223 |
|---|
| 1/19 | $12,930 | $14,282 |
|---|
| 2/19 | $13,384 | $14,741 |
|---|
| 3/19 | $13,749 | $15,027 |
|---|
| 4/19 | $14,349 | $15,636 |
|---|
| 5/19 | $13,757 | $14,642 |
|---|
| 6/19 | $14,600 | $15,674 |
|---|
| 7/19 | $14,925 | $15,899 |
|---|
| 8/19 | $14,852 | $15,648 |
|---|
| 9/19 | $14,908 | $15,940 |
|---|
| 10/19 | $15,143 | $16,286 |
|---|
| 11/19 | $15,638 | $16,877 |
|---|
| 12/19 | $16,110 | $17,386 |
|---|
| 1/20 | $16,178 | $17,379 |
|---|
| 2/20 | $14,837 | $15,949 |
|---|
| 3/20 | $12,974 | $13,979 |
|---|
| 4/20 | $14,753 | $15,771 |
|---|
| 5/20 | $15,470 | $16,522 |
|---|
| 6/20 | $15,798 | $16,850 |
|---|
| 7/20 | $16,827 | $17,801 |
|---|
| 8/20 | $17,985 | $19,080 |
|---|
| 9/20 | $17,237 | $18,355 |
|---|
| 10/20 | $16,807 | $17,867 |
|---|
| 11/20 | $18,329 | $19,823 |
|---|
| 12/20 | $19,045 | $20,585 |
|---|
| 1/21 | $18,692 | $20,377 |
|---|
| 2/21 | $19,312 | $20,939 |
|---|
| 3/21 | $19,820 | $21,856 |
|---|
| 4/21 | $21,111 | $23,022 |
|---|
| 5/21 | $21,086 | $23,183 |
|---|
| 6/21 | $21,602 | $23,724 |
|---|
| 7/21 | $22,024 | $24,288 |
|---|
| 8/21 | $22,558 | $25,026 |
|---|
| 9/21 | $21,335 | $23,863 |
|---|
| 10/21 | $22,704 | $25,534 |
|---|
| 11/21 | $22,412 | $25,357 |
|---|
| 12/21 | $23,384 | $26,494 |
|---|
| 1/22 | $21,765 | $25,123 |
|---|
| 2/22 | $21,542 | $24,371 |
|---|
| 3/22 | $22,288 | $25,276 |
|---|
| 4/22 | $20,456 | $23,071 |
|---|
| 5/22 | $20,311 | $23,114 |
|---|
| 6/22 | $18,973 | $21,206 |
|---|
| 7/22 | $20,514 | $23,161 |
|---|
| 8/22 | $19,748 | $22,217 |
|---|
| 9/22 | $18,197 | $20,170 |
|---|
| 10/22 | $19,467 | $21,804 |
|---|
| 11/22 | $20,553 | $23,022 |
|---|
| 12/22 | $19,460 | $21,696 |
|---|
| 1/23 | $20,326 | $23,059 |
|---|
| 2/23 | $19,637 | $22,496 |
|---|
| 3/23 | $20,570 | $23,322 |
|---|
| 4/23 | $20,859 | $23,686 |
|---|
| 5/23 | $20,848 | $23,789 |
|---|
| 6/23 | $22,114 | $25,361 |
|---|
| 7/23 | $22,792 | $26,176 |
|---|
| 8/23 | $22,714 | $25,759 |
|---|
| 9/23 | $21,526 | $24,531 |
|---|
| 10/23 | $21,159 | $24,015 |
|---|
| 11/23 | $23,158 | $26,208 |
|---|
| 12/23 | $24,133 | $27,399 |
|---|
| 1/24 | $24,981 | $27,859 |
|---|
| 2/24 | $26,638 | $29,347 |
|---|
| 3/24 | $27,303 | $30,291 |
|---|
| 4/24 | $26,116 | $29,054 |
|---|
| 5/24 | $27,773 | $30,494 |
|---|
| 6/24 | $29,130 | $31,589 |
|---|
| 7/24 | $29,208 | $31,973 |
|---|
| 8/24 | $30,278 | $32,749 |
|---|
| 9/24 | $30,773 | $33,448 |
|---|
| 10/24 | $30,643 | $33,145 |
|---|
| 11/24 | $32,117 | $35,090 |
|---|
| 12/24 | $31,503 | $34,254 |
|---|
Average Annual Total Returns (%)
| Fund | 1 Year | 5 Years | 10 Years |
|---|
| Class A | 30.54% | 14.34% | 12.76% |
|---|
| Class A with 5.25% Maximum Sales Charge | 23.65% | 13.11% | 12.15% |
|---|
S&P 500® Index | 25.02% | 14.51% | 13.09% |
|---|
Performance does not reflect the deduction of taxes that a shareholder would pay on Fund distributions or redemption of Fund shares. Performance assumes that all dividends and distributions, if any, were reinvested. For more recent performance information, visit www.eatonvance.com/performance.php.
THE FUND'S PAST PERFORMANCE IS NO GUARANTEE OF FUTURE RESULTS.
| Total Net Assets | $98,539,271 |
|---|
| # of Portfolio Holdings (for Stock Portfolio) | 56 |
|---|
| Portfolio Turnover Rate (for Stock Portfolio) | 44% |
|---|
| Total Advisory Fees Paid | $464,616 |
|---|
What did the Fund invest in?
The following tables reflect what the Fund invested in as of the report date.
References to the Fund's investments are to the Fund's pro rata share of the investments of Stock Portfolio, an affiliated investment company in which the Fund invests substantially all of its assets.
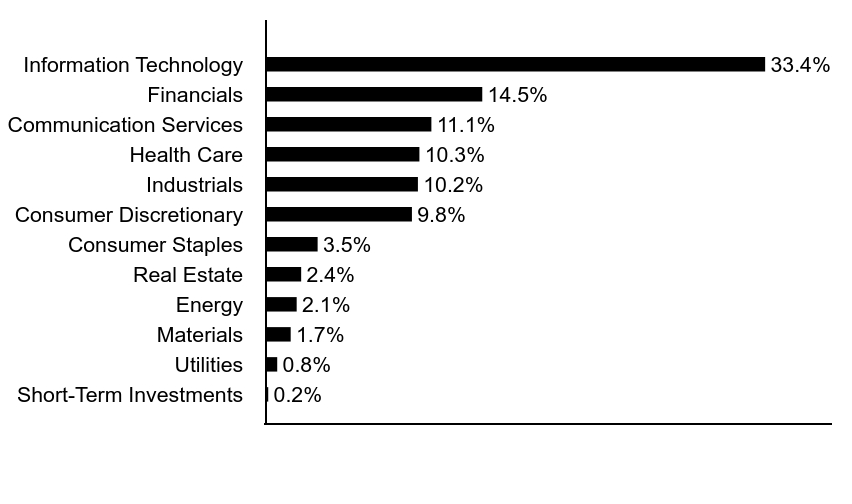
Sector Allocation (% of total investments)
| Value | Value |
|---|
| Short-Term Investments | 0.2% |
| Utilities | 0.8% |
| Materials | 1.7% |
| Energy | 2.1% |
| Real Estate | 2.4% |
| Consumer Staples | 3.5% |
| Consumer Discretionary | 9.8% |
| Industrials | 10.2% |
| Health Care | 10.3% |
| Communication Services | 11.1% |
| Financials | 14.5% |
| Information Technology | 33.4% |
Top Ten Holdings (% of total investments)Footnote Referencea
| Apple, Inc. | 7.7% |
| Microsoft Corp. | 7.6% |
| NVIDIA Corp. | 7.4% |
| Amazon.com, Inc. | 5.4% |
| Alphabet, Inc., Class C | 4.5% |
| Broadcom, Inc. | 3.6% |
| Meta Platforms, Inc., Class A | 3.1% |
| Eli Lilly & Co. | 2.3% |
| Visa, Inc., Class A | 2.2% |
| ConocoPhillips | 2.1% |
| Total | 45.9% |
| Footnote | Description |
Footnotea | Excluding cash equivalents |
If you wish to view additional information about the Fund, including the prospectus, statement of additional information, financial statements and holdings, please scan the QR code or visit www.eatonvance.com/open-end-mutual-fund-documents.php. For proxy information, please visit www.eatonvance.com/proxyvoting.
The Funds may deliver a single copy of certain required shareholder documents (including prospectuses, shareholder reports, and proxy materials) to investors with the same last name and the same address. Your participation will continue indefinitely unless you instruct otherwise by calling 1-800-262-1122 or by contacting your financial intermediary. Your instruction will typically be effective within 30 days of receipt.
Not FDIC Insured | May Lose Value | No Bank Guarantee
Annual Shareholder Report December 31, 2024
Annual Shareholder Report December 31, 2024
This annual shareholder report contains important information about the Eaton Vance Stock Fund for the period of January 1, 2024 to December 31, 2024. You can find additional information about the Fund at www.eatonvance.com/open-end-mutual-fund-documents.php. You can also request this information by contacting us at 1-800-262-1122.
What were the Fund costs for the last year?Footnote Reference*
(based on a hypothetical $10,000 investment)
| Class Name | Costs of a $10,000 investment | Costs paid as a percentage of a $10,000 investment |
|---|
| Class C | $199 | 1.73% |
|---|
| Footnote | Description |
Footnote* | Expenses in the table reflect the expenses of both the Fund and Stock Portfolio, the Portfolio in which it invests. |
How did the Fund perform last year and what affected its performance?
Key contributors to (↑) and detractors from (↓) performance, relative to the S&P 500® Index (the Index):
↑ An overweight position in NVIDIA Corp., a major microchip supplier for artificial intelligence (AI) applications, helped returns as NVIDIA’s stock price soared
↑ An overweight position in Broadcom, Inc. aided relative returns as its stock price doubled on AI-driven demand for its semiconductor and software products
↑ An overweight position in global retail and grocery giant Walmart, Inc. rose in value as its core U.S. retail business gained market share during the period
↑ Among sectors, stock selections and underweight exposures to health care and consumer staples, and stock selections in information technology, helped returns
↓ An overweight position in energy exploration and production firm ConocoPhillips fell in value as global energy demand and oil prices weakened during the period
↓ An overweight position in managed care company Elevance Health, Inc. — sold during the period — hurt returns as rising Medicaid costs depressed its stock price
↓ An underweight position in electric car maker Tesla Inc. hurt relative returns as its stock rose on optimism over the potential launch of an autonomous vehicle
↓ Among sectors, stock selections in energy and real estate detracted from Fund performance relative to the Index during the period
Comparison of the change in value of a $10,000 investment for the period indicated.

| Class C | S&P 500® Index |
|---|
| 12/14 | $10,000 | $10,000 |
|---|
| 1/15 | $9,857 | $9,700 |
|---|
| 2/15 | $10,402 | $10,257 |
|---|
| 3/15 | $10,357 | $10,095 |
|---|
| 4/15 | $10,389 | $10,192 |
|---|
| 5/15 | $10,597 | $10,323 |
|---|
| 6/15 | $10,437 | $10,123 |
|---|
| 7/15 | $10,650 | $10,335 |
|---|
| 8/15 | $10,065 | $9,712 |
|---|
| 9/15 | $9,706 | $9,471 |
|---|
| 10/15 | $10,517 | $10,270 |
|---|
| 11/15 | $10,544 | $10,301 |
|---|
| 12/15 | $10,377 | $10,138 |
|---|
| 1/16 | $9,916 | $9,635 |
|---|
| 2/16 | $9,790 | $9,622 |
|---|
| 3/16 | $10,425 | $10,275 |
|---|
| 4/16 | $10,377 | $10,315 |
|---|
| 5/16 | $10,551 | $10,500 |
|---|
| 6/16 | $10,576 | $10,527 |
|---|
| 7/16 | $10,899 | $10,915 |
|---|
| 8/16 | $10,843 | $10,931 |
|---|
| 9/16 | $10,794 | $10,933 |
|---|
| 10/16 | $10,576 | $10,733 |
|---|
| 11/16 | $10,794 | $11,131 |
|---|
| 12/16 | $10,999 | $11,351 |
|---|
| 1/17 | $11,128 | $11,566 |
|---|
| 2/17 | $11,513 | $12,025 |
|---|
| 3/17 | $11,499 | $12,039 |
|---|
| 4/17 | $11,599 | $12,163 |
|---|
| 5/17 | $11,813 | $12,334 |
|---|
| 6/17 | $11,941 | $12,411 |
|---|
| 7/17 | $12,146 | $12,667 |
|---|
| 8/17 | $12,146 | $12,705 |
|---|
| 9/17 | $12,320 | $12,967 |
|---|
| 10/17 | $12,596 | $13,270 |
|---|
| 11/17 | $12,887 | $13,677 |
|---|
| 12/17 | $13,083 | $13,829 |
|---|
| 1/18 | $13,695 | $14,621 |
|---|
| 2/18 | $13,213 | $14,082 |
|---|
| 3/18 | $12,930 | $13,724 |
|---|
| 4/18 | $13,045 | $13,777 |
|---|
| 5/18 | $13,336 | $14,108 |
|---|
| 6/18 | $13,366 | $14,195 |
|---|
| 7/18 | $13,871 | $14,724 |
|---|
| 8/18 | $14,221 | $15,203 |
|---|
| 9/18 | $14,260 | $15,290 |
|---|
| 10/18 | $13,321 | $14,245 |
|---|
| 11/18 | $13,544 | $14,535 |
|---|
| 12/18 | $12,220 | $13,223 |
|---|
| 1/19 | $13,240 | $14,282 |
|---|
| 2/19 | $13,698 | $14,741 |
|---|
| 3/19 | $14,064 | $15,027 |
|---|
| 4/19 | $14,667 | $15,636 |
|---|
| 5/19 | $14,055 | $14,642 |
|---|
| 6/19 | $14,896 | $15,674 |
|---|
| 7/19 | $15,219 | $15,899 |
|---|
| 8/19 | $15,143 | $15,648 |
|---|
| 9/19 | $15,185 | $15,940 |
|---|
| 10/19 | $15,415 | $16,286 |
|---|
| 11/19 | $15,908 | $16,877 |
|---|
| 12/19 | $16,380 | $17,386 |
|---|
| 1/20 | $16,442 | $17,379 |
|---|
| 2/20 | $15,069 | $15,949 |
|---|
| 3/20 | $13,167 | $13,979 |
|---|
| 4/20 | $14,963 | $15,771 |
|---|
| 5/20 | $15,685 | $16,522 |
|---|
| 6/20 | $16,002 | $16,850 |
|---|
| 7/20 | $17,041 | $17,801 |
|---|
| 8/20 | $18,197 | $19,080 |
|---|
| 9/20 | $17,433 | $18,355 |
|---|
| 10/20 | $16,984 | $17,867 |
|---|
| 11/20 | $18,511 | $19,823 |
|---|
| 12/20 | $19,224 | $20,585 |
|---|
| 1/21 | $18,856 | $20,377 |
|---|
| 2/21 | $19,467 | $20,939 |
|---|
| 3/21 | $19,961 | $21,856 |
|---|
| 4/21 | $21,255 | $23,022 |
|---|
| 5/21 | $21,219 | $23,183 |
|---|
| 6/21 | $21,722 | $23,724 |
|---|
| 7/21 | $22,135 | $24,288 |
|---|
| 8/21 | $22,656 | $25,026 |
|---|
| 9/21 | $21,416 | $23,863 |
|---|
| 10/21 | $22,773 | $25,534 |
|---|
| 11/21 | $22,467 | $25,357 |
|---|
| 12/21 | $23,430 | $26,494 |
|---|
| 1/22 | $21,786 | $25,123 |
|---|
| 2/22 | $21,554 | $24,371 |
|---|
| 3/22 | $22,280 | $25,276 |
|---|
| 4/22 | $20,444 | $23,071 |
|---|
| 5/22 | $20,283 | $23,114 |
|---|
| 6/22 | $18,931 | $21,206 |
|---|
| 7/22 | $20,454 | $23,161 |
|---|
| 8/22 | $19,678 | $22,217 |
|---|
| 9/22 | $18,124 | $20,170 |
|---|
| 10/22 | $19,385 | $21,804 |
|---|
| 11/22 | $20,454 | $23,022 |
|---|
| 12/22 | $19,339 | $21,696 |
|---|
| 1/23 | $20,191 | $23,059 |
|---|
| 2/23 | $19,500 | $22,496 |
|---|
| 3/23 | $20,410 | $23,322 |
|---|
| 4/23 | $20,687 | $23,686 |
|---|
| 5/23 | $20,664 | $23,789 |
|---|
| 6/23 | $21,896 | $25,361 |
|---|
| 7/23 | $22,564 | $26,176 |
|---|
| 8/23 | $22,472 | $25,759 |
|---|
| 9/23 | $21,286 | $24,531 |
|---|
| 10/23 | $20,905 | $24,015 |
|---|
| 11/23 | $22,864 | $26,208 |
|---|
| 12/23 | $23,811 | $27,399 |
|---|
| 1/24 | $24,642 | $27,859 |
|---|
| 2/24 | $26,248 | $29,347 |
|---|
| 3/24 | $26,888 | $30,291 |
|---|
| 4/24 | $25,704 | $29,054 |
|---|
| 5/24 | $27,324 | $30,494 |
|---|
| 6/24 | $28,631 | $31,589 |
|---|
| 7/24 | $28,699 | $31,973 |
|---|
| 8/24 | $29,720 | $32,749 |
|---|
| 9/24 | $30,196 | $33,448 |
|---|
| 10/24 | $30,047 | $33,145 |
|---|
| 11/24 | $31,476 | $35,090 |
|---|
| 12/24 | $31,308 | $34,254 |
|---|
Average Annual Total Returns (%)
| Fund | 1 Year | 5 Years | 10 Years |
|---|
| Class C, with conversion to Class A after 8 years | 29.61% | 13.49% | 12.08% |
|---|
| Class C, with 1% Maximum Deferred Sales Charge and conversion to Class A after 8 years | 28.61% | 13.49% | 12.08% |
|---|
S&P 500® Index | 25.02% | 14.51% | 13.09% |
|---|
Performance does not reflect the deduction of taxes that a shareholder would pay on Fund distributions or redemption of Fund shares. Performance assumes that all dividends and distributions, if any, were reinvested. For more recent performance information, visit www.eatonvance.com/performance.php.
THE FUND'S PAST PERFORMANCE IS NO GUARANTEE OF FUTURE RESULTS.
| Total Net Assets | $98,539,271 |
|---|
| # of Portfolio Holdings (for Stock Portfolio) | 56 |
|---|
| Portfolio Turnover Rate (for Stock Portfolio) | 44% |
|---|
| Total Advisory Fees Paid | $464,616 |
|---|
What did the Fund invest in?
The following tables reflect what the Fund invested in as of the report date.
References to the Fund's investments are to the Fund's pro rata share of the investments of Stock Portfolio, an affiliated investment company in which the Fund invests substantially all of its assets.
Sector Allocation (% of total investments)
| Value | Value |
|---|
| Short-Term Investments | 0.2% |
| Utilities | 0.8% |
| Materials | 1.7% |
| Energy | 2.1% |
| Real Estate | 2.4% |
| Consumer Staples | 3.5% |
| Consumer Discretionary | 9.8% |
| Industrials | 10.2% |
| Health Care | 10.3% |
| Communication Services | 11.1% |
| Financials | 14.5% |
| Information Technology | 33.4% |
Top Ten Holdings (% of total investments)Footnote Referencea
| Apple, Inc. | 7.7% |
| Microsoft Corp. | 7.6% |
| NVIDIA Corp. | 7.4% |
| Amazon.com, Inc. | 5.4% |
| Alphabet, Inc., Class C | 4.5% |
| Broadcom, Inc. | 3.6% |
| Meta Platforms, Inc., Class A | 3.1% |
| Eli Lilly & Co. | 2.3% |
| Visa, Inc., Class A | 2.2% |
| ConocoPhillips | 2.1% |
| Total | 45.9% |
| Footnote | Description |
Footnotea | Excluding cash equivalents |
If you wish to view additional information about the Fund, including the prospectus, statement of additional information, financial statements and holdings, please scan the QR code or visit www.eatonvance.com/open-end-mutual-fund-documents.php. For proxy information, please visit www.eatonvance.com/proxyvoting.
The Funds may deliver a single copy of certain required shareholder documents (including prospectuses, shareholder reports, and proxy materials) to investors with the same last name and the same address. Your participation will continue indefinitely unless you instruct otherwise by calling 1-800-262-1122 or by contacting your financial intermediary. Your instruction will typically be effective within 30 days of receipt.
Not FDIC Insured | May Lose Value | No Bank Guarantee
Annual Shareholder Report December 31, 2024
Annual Shareholder Report December 31, 2024
This annual shareholder report contains important information about the Eaton Vance Stock Fund for the period of January 1, 2024 to December 31, 2024. You can find additional information about the Fund at www.eatonvance.com/open-end-mutual-fund-documents.php. You can also request this information by contacting us at 1-800-262-1122.
What were the Fund costs for the last year?Footnote Reference*
(based on a hypothetical $10,000 investment)
| Class Name | Costs of a $10,000 investment | Costs paid as a percentage of a $10,000 investment |
|---|
| Class I | $84 | 0.73% |
|---|
| Footnote | Description |
Footnote* | Expenses in the table reflect the expenses of both the Fund and Stock Portfolio, the Portfolio in which it invests. |
How did the Fund perform last year and what affected its performance?
Key contributors to (↑) and detractors from (↓) performance, relative to the S&P 500® Index (the Index):
↑ An overweight position in NVIDIA Corp., a major microchip supplier for artificial intelligence (AI) applications, helped returns as NVIDIA’s stock price soared
↑ An overweight position in Broadcom, Inc. aided relative returns as its stock price doubled on AI-driven demand for its semiconductor and software products
↑ An overweight position in global retail and grocery giant Walmart, Inc. rose in value as its core U.S. retail business gained market share during the period
↑ Among sectors, stock selections and underweight exposures to health care and consumer staples, and stock selections in information technology, helped returns
↓ An overweight position in energy exploration and production firm ConocoPhillips fell in value as global energy demand and oil prices weakened during the period
↓ An overweight position in managed care company Elevance Health, Inc. — sold during the period — hurt returns as rising Medicaid costs depressed its stock price
↓ An underweight position in electric car maker Tesla Inc. hurt relative returns as its stock rose on optimism over the potential launch of an autonomous vehicle
↓ Among sectors, stock selections in energy and real estate detracted from Fund performance relative to the Index during the period
Comparison of the change in value of a $1,000,000 investment for the period indicated.
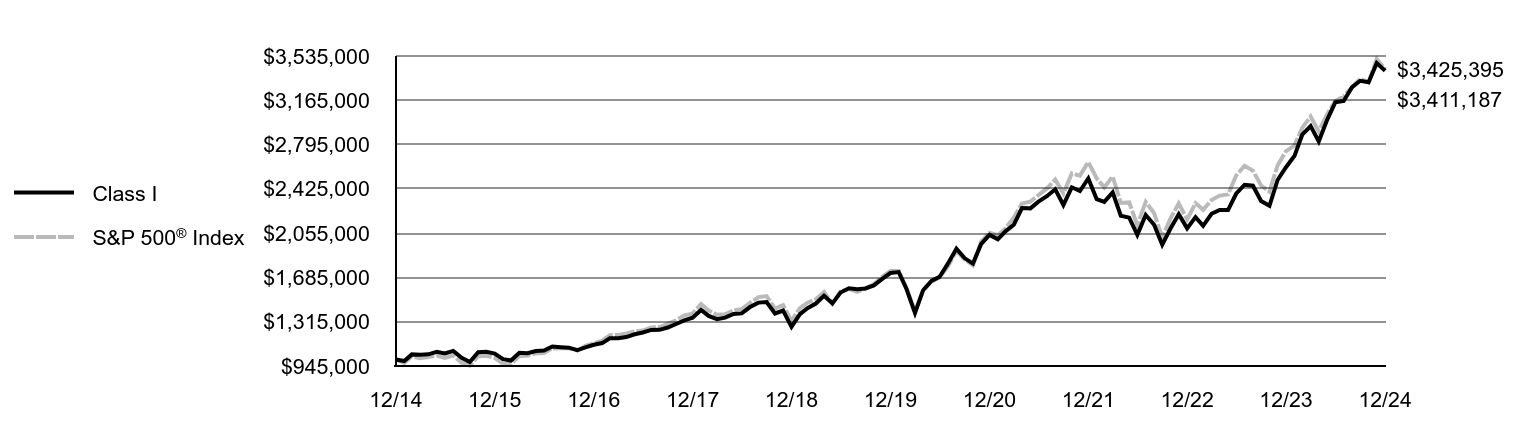
| Class I | S&P 500® Index |
|---|
| 12/14 | $1,000,000 | $1,000,000 |
|---|
| 1/15 | $986,615 | $969,981 |
|---|
| 2/15 | $1,042,096 | $1,025,727 |
|---|
| 3/15 | $1,038,278 | $1,009,506 |
|---|
| 4/15 | $1,042,741 | $1,019,190 |
|---|
| 5/15 | $1,064,265 | $1,032,296 |
|---|
| 6/15 | $1,049,229 | $1,012,313 |
|---|
| 7/15 | $1,071,450 | $1,033,522 |
|---|
| 8/15 | $1,013,926 | $971,166 |
|---|
| 9/15 | $977,978 | $947,136 |
|---|
| 10/15 | $1,060,349 | $1,027,030 |
|---|
| 11/15 | $1,064,267 | $1,030,085 |
|---|
| 12/15 | $1,048,290 | $1,013,838 |
|---|
| 1/16 | $1,001,997 | $963,527 |
|---|
| 2/16 | $990,257 | $962,227 |
|---|
| 3/16 | $1,055,910 | $1,027,503 |
|---|
| 4/16 | $1,051,764 | $1,031,487 |
|---|
| 5/16 | $1,069,730 | $1,050,010 |
|---|
| 6/16 | $1,074,128 | $1,052,731 |
|---|
| 7/16 | $1,107,452 | $1,091,544 |
|---|
| 8/16 | $1,102,593 | $1,093,076 |
|---|
| 9/16 | $1,098,422 | $1,093,283 |
|---|
| 10/16 | $1,076,896 | $1,073,340 |
|---|
| 11/16 | $1,100,511 | $1,113,091 |
|---|
| 12/16 | $1,122,228 | $1,135,093 |
|---|
| 1/17 | $1,136,477 | $1,156,621 |
|---|
| 2/17 | $1,176,380 | $1,202,546 |
|---|
| 3/17 | $1,176,373 | $1,203,949 |
|---|
| 4/17 | $1,187,054 | $1,216,313 |
|---|
| 5/17 | $1,209,855 | $1,233,430 |
|---|
| 6/17 | $1,224,821 | $1,241,129 |
|---|
| 7/17 | $1,246,659 | $1,266,650 |
|---|
| 8/17 | $1,247,380 | $1,270,527 |
|---|
| 9/17 | $1,266,239 | $1,296,736 |
|---|
| 10/17 | $1,295,999 | $1,326,995 |
|---|
| 11/17 | $1,326,475 | $1,367,694 |
|---|
| 12/17 | $1,348,248 | $1,382,901 |
|---|
| 1/18 | $1,413,012 | $1,462,078 |
|---|
| 2/18 | $1,363,667 | $1,408,190 |
|---|
| 3/18 | $1,335,913 | $1,372,403 |
|---|
| 4/18 | $1,349,008 | $1,377,669 |
|---|
| 5/18 | $1,379,846 | $1,410,846 |
|---|
| 6/18 | $1,384,474 | $1,419,530 |
|---|
| 7/18 | $1,437,656 | $1,472,355 |
|---|
| 8/18 | $1,474,482 | $1,520,333 |
|---|
| 9/18 | $1,479,902 | $1,528,986 |
|---|
| 10/18 | $1,383,762 | $1,424,480 |
|---|
| 11/18 | $1,408,559 | $1,453,508 |
|---|
| 12/18 | $1,272,362 | $1,322,270 |
|---|
| 1/19 | $1,378,685 | $1,428,231 |
|---|
| 2/19 | $1,427,956 | $1,474,089 |
|---|
| 3/19 | $1,466,861 | $1,502,733 |
|---|
| 4/19 | $1,531,702 | $1,563,578 |
|---|
| 5/19 | $1,468,591 | $1,464,216 |
|---|
| 6/19 | $1,558,483 | $1,567,408 |
|---|
| 7/19 | $1,593,919 | $1,589,935 |
|---|
| 8/19 | $1,587,006 | $1,564,750 |
|---|
| 9/19 | $1,593,050 | $1,594,027 |
|---|
| 10/19 | $1,618,106 | $1,628,553 |
|---|
| 11/19 | $1,670,839 | $1,687,668 |
|---|
| 12/19 | $1,721,683 | $1,738,605 |
|---|
| 1/20 | $1,729,804 | $1,737,924 |
|---|
| 2/20 | $1,586,545 | $1,594,859 |
|---|
| 3/20 | $1,387,440 | $1,397,874 |
|---|
| 4/20 | $1,578,437 | $1,577,072 |
|---|
| 5/20 | $1,655,928 | $1,652,185 |
|---|
| 6/20 | $1,691,066 | $1,685,042 |
|---|
| 7/20 | $1,801,898 | $1,780,054 |
|---|
| 8/20 | $1,925,704 | $1,908,005 |
|---|
| 9/20 | $1,846,694 | $1,835,507 |
|---|
| 10/20 | $1,800,748 | $1,786,694 |
|---|
| 11/20 | $1,963,351 | $1,982,273 |
|---|
| 12/20 | $2,040,667 | $2,058,487 |
|---|
| 1/21 | $2,003,803 | $2,037,705 |
|---|
| 2/21 | $2,070,182 | $2,093,895 |
|---|
| 3/21 | $2,125,489 | $2,185,598 |
|---|
| 4/21 | $2,264,732 | $2,302,241 |
|---|
| 5/21 | $2,261,987 | $2,318,321 |
|---|
| 6/21 | $2,318,214 | $2,372,442 |
|---|
| 7/21 | $2,363,383 | $2,428,799 |
|---|
| 8/21 | $2,421,477 | $2,502,648 |
|---|
| 9/21 | $2,290,536 | $2,386,250 |
|---|
| 10/21 | $2,438,075 | $2,553,435 |
|---|
| 11/21 | $2,406,723 | $2,535,743 |
|---|
| 12/21 | $2,512,397 | $2,649,385 |
|---|
| 1/22 | $2,338,590 | $2,512,287 |
|---|
| 2/22 | $2,315,693 | $2,437,066 |
|---|
| 3/22 | $2,395,831 | $2,527,553 |
|---|
| 4/22 | $2,200,168 | $2,307,145 |
|---|
| 5/22 | $2,184,557 | $2,311,378 |
|---|
| 6/22 | $2,040,932 | $2,120,588 |
|---|
| 7/22 | $2,207,454 | $2,316,116 |
|---|
| 8/22 | $2,125,234 | $2,221,660 |
|---|
| 9/22 | $1,958,712 | $2,017,049 |
|---|
| 10/22 | $2,096,092 | $2,180,352 |
|---|
| 11/22 | $2,213,698 | $2,302,198 |
|---|
| 12/22 | $2,094,783 | $2,169,558 |
|---|
| 1/23 | $2,189,239 | $2,305,880 |
|---|
| 2/23 | $2,116,305 | $2,249,619 |
|---|
| 3/23 | $2,216,739 | $2,332,212 |
|---|
| 4/23 | $2,249,022 | $2,368,614 |
|---|
| 5/23 | $2,247,826 | $2,378,910 |
|---|
| 6/23 | $2,384,131 | $2,536,097 |
|---|
| 7/23 | $2,459,457 | $2,617,569 |
|---|
| 8/23 | $2,451,087 | $2,575,893 |
|---|
| 9/23 | $2,323,152 | $2,453,080 |
|---|
| 10/23 | $2,283,696 | $2,401,500 |
|---|
| 11/23 | $2,498,913 | $2,620,818 |
|---|
| 12/23 | $2,606,015 | $2,739,884 |
|---|
| 1/24 | $2,698,886 | $2,785,925 |
|---|
| 2/24 | $2,877,593 | $2,934,682 |
|---|
| 3/24 | $2,949,356 | $3,029,104 |
|---|
| 4/24 | $2,821,307 | $2,905,381 |
|---|
| 5/24 | $3,001,420 | $3,049,444 |
|---|
| 6/24 | $3,147,763 | $3,158,864 |
|---|
| 7/24 | $3,159,020 | $3,197,315 |
|---|
| 8/24 | $3,274,405 | $3,274,872 |
|---|
| 9/24 | $3,327,876 | $3,344,813 |
|---|
| 10/24 | $3,315,212 | $3,314,481 |
|---|
| 11/24 | $3,475,625 | $3,509,044 |
|---|
| 12/24 | $3,411,187 | $3,425,395 |
|---|
Average Annual Total Returns (%)
| Fund | 1 Year | 5 Years | 10 Years |
|---|
| Class I | 30.89% | 14.64% | 13.04% |
|---|
S&P 500® Index | 25.02% | 14.51% | 13.09% |
|---|
Performance does not reflect the deduction of taxes that a shareholder would pay on Fund distributions or redemption of Fund shares. Performance assumes that all dividends and distributions, if any, were reinvested. For more recent performance information, visit www.eatonvance.com/performance.php.
THE FUND'S PAST PERFORMANCE IS NO GUARANTEE OF FUTURE RESULTS.
| Total Net Assets | $98,539,271 |
|---|
| # of Portfolio Holdings (for Stock Portfolio) | 56 |
|---|
| Portfolio Turnover Rate (for Stock Portfolio) | 44% |
|---|
| Total Advisory Fees Paid | $464,616 |
|---|
What did the Fund invest in?
The following tables reflect what the Fund invested in as of the report date.
References to the Fund's investments are to the Fund's pro rata share of the investments of Stock Portfolio, an affiliated investment company in which the Fund invests substantially all of its assets.
Sector Allocation (% of total investments)
| Value | Value |
|---|
| Short-Term Investments | 0.2% |
| Utilities | 0.8% |
| Materials | 1.7% |
| Energy | 2.1% |
| Real Estate | 2.4% |
| Consumer Staples | 3.5% |
| Consumer Discretionary | 9.8% |
| Industrials | 10.2% |
| Health Care | 10.3% |
| Communication Services | 11.1% |
| Financials | 14.5% |
| Information Technology | 33.4% |
Top Ten Holdings (% of total investments)Footnote Referencea
| Apple, Inc. | 7.7% |
| Microsoft Corp. | 7.6% |
| NVIDIA Corp. | 7.4% |
| Amazon.com, Inc. | 5.4% |
| Alphabet, Inc., Class C | 4.5% |
| Broadcom, Inc. | 3.6% |
| Meta Platforms, Inc., Class A | 3.1% |
| Eli Lilly & Co. | 2.3% |
| Visa, Inc., Class A | 2.2% |
| ConocoPhillips | 2.1% |
| Total | 45.9% |
| Footnote | Description |
Footnotea | Excluding cash equivalents |
If you wish to view additional information about the Fund, including the prospectus, statement of additional information, financial statements and holdings, please scan the QR code or visit www.eatonvance.com/open-end-mutual-fund-documents.php. For proxy information, please visit www.eatonvance.com/proxyvoting.
The Funds may deliver a single copy of certain required shareholder documents (including prospectuses, shareholder reports, and proxy materials) to investors with the same last name and the same address. Your participation will continue indefinitely unless you instruct otherwise by calling 1-800-262-1122 or by contacting your financial intermediary. Your instruction will typically be effective within 30 days of receipt.
Not FDIC Insured | May Lose Value | No Bank Guarantee
Annual Shareholder Report December 31, 2024
Eaton Vance Tax-Managed Growth Fund 1.1
Annual Shareholder Report December 31, 2024
This annual shareholder report contains important information about the Eaton Vance Tax-Managed Growth Fund 1.1 for the period of January 1, 2024 to December 31, 2024. You can find additional information about the Fund at www.eatonvance.com/open-end-mutual-fund-documents.php. You can also request this information by contacting us at 1-800-262-1122.
What were the Fund costs for the last year?Footnote Reference*
(based on a hypothetical $10,000 investment)
| Class Name | Costs of a $10,000 investment | Costs paid as a percentage of a $10,000 investment |
|---|
| Class A | $81 | 0.72% |
|---|
| Footnote | Description |
Footnote* | Expenses in the table reflect the expenses of both the Fund and the Tax-Managed Growth Portfolio, the Portfolio in which it invests. |
How did the Fund perform last year and what affected its performance?
Key contributors to (↑) and detractors from (↓) performance, relative to the S&P 500® Index (the Index):
↑ An overweight position in online streaming service Netflix Inc. rose in value, driven by better-than-expected subscriber and revenue growth, and higher profits ↑ An overweight position in Meta Platforms Inc. — parent of Facebook and Instagram — grew in value as artificial intelligence (AI) investments drove revenue growth ↑ An overweight position in cloud-networking firm Arista Networks Inc. rose in value as data centers raised spending to meet computing demand from AI applications ↑ Among sectors, stock selections and an overweight exposure to communication services, and stock selections in health care and consumer staples helped returns ↓ An underweight position in electric car maker Tesla Inc. — sold by period-end — hurt returns as its stock price rose over optimism about autonomous vehicles ↓ An underweight position in Broadcom Inc. detracted from returns as its stock price doubled on AI-driven demand for its semiconductor and software products ↓ An overweight position in athletic apparel giant Nike Inc. lost value as the firm had trouble with increased competition and its shift to more wholesale sales ↓ Among sectors, stock selections in industrials, consumer discretionary, and information technology hurt Fund returns relative to the Index during the period
Comparison of the change in value of a $10,000 investment for the period indicated.
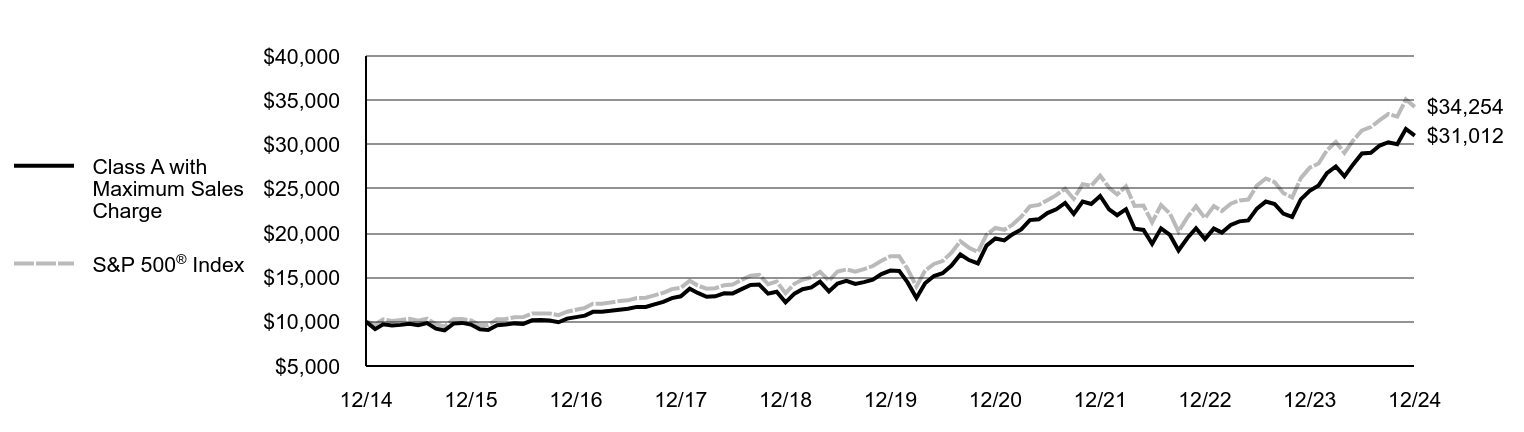
| Class A with Maximum Sales Charge | S&P 500® Index |
|---|
| 12/14 | $10,000 | $10,000 |
|---|
| 1/15 | $9,163 | $9,700 |
|---|
| 2/15 | $9,714 | $10,257 |
|---|
| 3/15 | $9,582 | $10,095 |
|---|
| 4/15 | $9,643 | $10,192 |
|---|
| 5/15 | $9,772 | $10,323 |
|---|
| 6/15 | $9,616 | $10,123 |
|---|
| 7/15 | $9,845 | $10,335 |
|---|
| 8/15 | $9,222 | $9,712 |
|---|
| 9/15 | $9,020 | $9,471 |
|---|
| 10/15 | $9,789 | $10,270 |
|---|
| 11/15 | $9,867 | $10,301 |
|---|
| 12/15 | $9,679 | $10,138 |
|---|
| 1/16 | $9,145 | $9,635 |
|---|
| 2/16 | $9,064 | $9,622 |
|---|
| 3/16 | $9,613 | $10,275 |
|---|
| 4/16 | $9,687 | $10,315 |
|---|
| 5/16 | $9,812 | $10,500 |
|---|
| 6/16 | $9,758 | $10,527 |
|---|
| 7/16 | $10,160 | $10,915 |
|---|
| 8/16 | $10,184 | $10,931 |
|---|
| 9/16 | $10,145 | $10,933 |
|---|
| 10/16 | $9,941 | $10,733 |
|---|
| 11/16 | $10,347 | $11,131 |
|---|
| 12/16 | $10,520 | $11,351 |
|---|
| 1/17 | $10,687 | $11,566 |
|---|
| 2/17 | $11,114 | $12,025 |
|---|
| 3/17 | $11,132 | $12,039 |
|---|
| 4/17 | $11,233 | $12,163 |
|---|
| 5/17 | $11,363 | $12,334 |
|---|
| 6/17 | $11,465 | $12,411 |
|---|
| 7/17 | $11,674 | $12,667 |
|---|
| 8/17 | $11,674 | $12,705 |
|---|
| 9/17 | $11,965 | $12,967 |
|---|
| 10/17 | $12,246 | $13,270 |
|---|
| 11/17 | $12,662 | $13,677 |
|---|
| 12/17 | $12,872 | $13,829 |
|---|
| 1/18 | $13,723 | $14,621 |
|---|
| 2/18 | $13,251 | $14,082 |
|---|
| 3/18 | $12,810 | $13,724 |
|---|
| 4/18 | $12,868 | $13,777 |
|---|
| 5/18 | $13,202 | $14,108 |
|---|
| 6/18 | $13,194 | $14,195 |
|---|
| 7/18 | $13,674 | $14,724 |
|---|
| 8/18 | $14,156 | $15,203 |
|---|
| 9/18 | $14,188 | $15,290 |
|---|
| 10/18 | $13,172 | $14,245 |
|---|
| 11/18 | $13,388 | $14,535 |
|---|
| 12/18 | $12,183 | $13,223 |
|---|
| 1/19 | $13,171 | $14,282 |
|---|
| 2/19 | $13,670 | $14,741 |
|---|
| 3/19 | $13,876 | $15,027 |
|---|
| 4/19 | $14,524 | $15,636 |
|---|
| 5/19 | $13,415 | $14,642 |
|---|
| 6/19 | $14,317 | $15,674 |
|---|
| 7/19 | $14,608 | $15,899 |
|---|
| 8/19 | $14,263 | $15,648 |
|---|
| 9/19 | $14,466 | $15,940 |
|---|
| 10/19 | $14,735 | $16,286 |
|---|
| 11/19 | $15,373 | $16,877 |
|---|
| 12/19 | $15,771 | $17,386 |
|---|
| 1/20 | $15,738 | $17,379 |
|---|
| 2/20 | $14,437 | $15,949 |
|---|
| 3/20 | $12,665 | $13,979 |
|---|
| 4/20 | $14,335 | $15,771 |
|---|
| 5/20 | $15,160 | $16,522 |
|---|
| 6/20 | $15,479 | $16,850 |
|---|
| 7/20 | $16,342 | $17,801 |
|---|
| 8/20 | $17,593 | $19,080 |
|---|
| 9/20 | $16,960 | $18,355 |
|---|
| 10/20 | $16,582 | $17,867 |
|---|
| 11/20 | $18,594 | $19,823 |
|---|
| 12/20 | $19,404 | $20,585 |
|---|
| 1/21 | $19,183 | $20,377 |
|---|
| 2/21 | $19,854 | $20,939 |
|---|
| 3/21 | $20,416 | $21,856 |
|---|
| 4/21 | $21,470 | $23,022 |
|---|
| 5/21 | $21,561 | $23,183 |
|---|
| 6/21 | $22,262 | $23,724 |
|---|
| 7/21 | $22,696 | $24,288 |
|---|
| 8/21 | $23,405 | $25,026 |
|---|
| 9/21 | $22,164 | $23,863 |
|---|
| 10/21 | $23,559 | $25,534 |
|---|
| 11/21 | $23,287 | $25,357 |
|---|
| 12/21 | $24,193 | $26,494 |
|---|
| 1/22 | $22,695 | $25,123 |
|---|
| 2/22 | $22,024 | $24,371 |
|---|
| 3/22 | $22,705 | $25,276 |
|---|
| 4/22 | $20,503 | $23,071 |
|---|
| 5/22 | $20,361 | $23,114 |
|---|
| 6/22 | $18,788 | $21,206 |
|---|
| 7/22 | $20,544 | $23,161 |
|---|
| 8/22 | $19,799 | $22,217 |
|---|
| 9/22 | $18,037 | $20,170 |
|---|
| 10/22 | $19,448 | $21,804 |
|---|
| 11/22 | $20,554 | $23,022 |
|---|
| 12/22 | $19,327 | $21,696 |
|---|
| 1/23 | $20,513 | $23,059 |
|---|
| 2/23 | $20,069 | $22,496 |
|---|
| 3/23 | $20,920 | $23,322 |
|---|
| 4/23 | $21,333 | $23,686 |
|---|
| 5/23 | $21,434 | $23,789 |
|---|
| 6/23 | $22,769 | $25,361 |
|---|
| 7/23 | $23,565 | $26,176 |
|---|
| 8/23 | $23,282 | $25,759 |
|---|
| 9/23 | $22,216 | $24,531 |
|---|
| 10/23 | $21,837 | $24,015 |
|---|
| 11/23 | $23,812 | $26,208 |
|---|
| 12/23 | $24,785 | $27,399 |
|---|
| 1/24 | $25,388 | $27,859 |
|---|
| 2/24 | $26,766 | $29,347 |
|---|
| 3/24 | $27,534 | $30,291 |
|---|
| 4/24 | $26,406 | $29,054 |
|---|
| 5/24 | $27,789 | $30,494 |
|---|
| 6/24 | $29,003 | $31,589 |
|---|
| 7/24 | $29,074 | $31,973 |
|---|
| 8/24 | $29,894 | $32,749 |
|---|
| 9/24 | $30,264 | $33,448 |
|---|
| 10/24 | $30,042 | $33,145 |
|---|
| 11/24 | $31,757 | $35,090 |
|---|
| 12/24 | $31,012 | $34,254 |
|---|
Average Annual Total Returns (%)
| Fund | 1 Year | 5 Years | 10 Years |
|---|
| Class A | 25.16% | 14.47% | 12.58% |
|---|
| Class A with 5.25% Maximum Sales Charge | 18.59% | 13.25% | 11.97% |
|---|
S&P 500® Index | 25.02% | 14.51% | 13.09% |
|---|
Performance does not reflect the deduction of taxes that a shareholder would pay on Fund distributions or redemption of Fund shares. Performance assumes that all dividends and distributions, if any, were reinvested. For more recent performance information, visit www.eatonvance.com/performance.php.
THE FUND'S PAST PERFORMANCE IS NO GUARANTEE OF FUTURE RESULTS.
| Total Net Assets | $2,683,337,864 |
|---|
| # of Portfolio Holdings (for Tax-Managed Growth Portfolio) | 143 |
|---|
| Portfolio Turnover Rate (for Tax-Managed Growth Portfolio) | 7% |
|---|
| Total Advisory Fees Paid | $10,204,484 |
|---|
What did the Fund invest in?
The following tables reflect what the Fund invested in as of the report date.
References to the Fund's investments are to the Fund's pro rata share of Tax-Managed Growth Portfolio, an affiliated investment company in which the Fund invests substantially all of its assests.
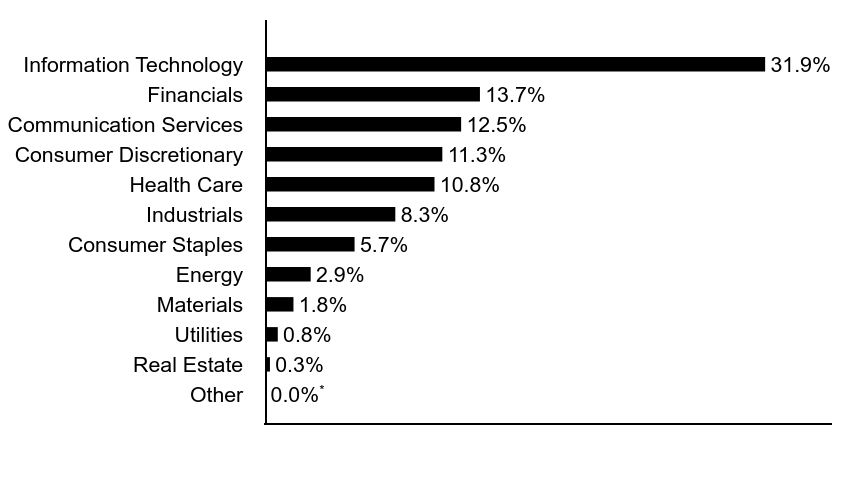
Sector Allocation (% of total investments)
| Value | Value |
|---|
| Other | 0.0%Footnote Reference* |
| Real Estate | 0.3% |
| Utilities | 0.8% |
| Materials | 1.8% |
| Energy | 2.9% |
| Consumer Staples | 5.7% |
| Industrials | 8.3% |
| Health Care | 10.8% |
| Consumer Discretionary | 11.3% |
| Communication Services | 12.5% |
| Financials | 13.7% |
| Information Technology | 31.9% |
| Footnote | Description |
Footnote* | Amount is less than 0.05%. |
Top Ten Holdings (% of total investments)Footnote Referencea
| Apple, Inc. | 8.3% |
| NVIDIA Corp. | 6.4% |
| Microsoft Corp. | 6.4% |
| Amazon.com, Inc. | 5.5% |
| Meta Platforms, Inc., Class A | 3.8% |
| Alphabet, Inc., Class A | 2.8% |
| Alphabet, Inc., Class C | 2.8% |
| JPMorgan Chase & Co. | 2.1% |
| Netflix, Inc. | 1.7% |
| Berkshire Hathaway, Inc., Class B | 1.7% |
| Total | 41.5% |
| Footnote | Description |
Footnotea | Excluding cash equivalents |
If you wish to view additional information about the Fund, including the prospectus, statement of additional information, financial statements and holdings, please scan the QR code or visit www.eatonvance.com/open-end-mutual-fund-documents.php. For proxy information, please visit www.eatonvance.com/proxyvoting.
The Funds may deliver a single copy of certain required shareholder documents (including prospectuses, shareholder reports, and proxy materials) to investors with the same last name and the same address. Your participation will continue indefinitely unless you instruct otherwise by calling 1-800-262-1122 or by contacting your financial intermediary. Your instruction will typically be effective within 30 days of receipt.
Not FDIC Insured | May Lose Value | No Bank Guarantee
Annual Shareholder Report December 31, 2024
Eaton Vance Tax-Managed Growth Fund 1.1
Annual Shareholder Report December 31, 2024
This annual shareholder report contains important information about the Eaton Vance Tax-Managed Growth Fund 1.1 for the period of January 1, 2024 to December 31, 2024. You can find additional information about the Fund at www.eatonvance.com/open-end-mutual-fund-documents.php. You can also request this information by contacting us at 1-800-262-1122.
What were the Fund costs for the last year?Footnote Reference*
(based on a hypothetical $10,000 investment)
| Class Name | Costs of a $10,000 investment | Costs paid as a percentage of a $10,000 investment |
|---|
| Class C | $165 | 1.47% |
|---|
| Footnote | Description |
Footnote* | Expenses in the table reflect the expenses of both the Fund and the Tax-Managed Growth Portfolio, the Portfolio in which it invests. |
How did the Fund perform last year and what affected its performance?
Key contributors to (↑) and detractors from (↓) performance, relative to the S&P 500® Index (the Index):
↓ An underweight position in electric car maker Tesla Inc. — sold by period-end — hurt returns as its stock price rose over optimism about autonomous vehicles ↓ An underweight position in Broadcom Inc. detracted from returns as its stock price doubled on AI-driven demand for its semiconductor and software products ↓ An overweight position in athletic apparel giant Nike Inc. lost value as the firm had trouble with increased competition and its shift to more wholesale sales ↓ Among sectors, stock selections in industrials, consumer discretionary, and information technology hurt Fund returns relative to the Index during the period ↑ An overweight position in online streaming service Netflix Inc. rose in value, driven by better-than-expected subscriber and revenue growth, and higher profits ↑ An overweight position in Meta Platforms Inc. — parent of Facebook and Instagram — grew in value as artificial intelligence (AI) investments drove revenue growth ↑ An overweight position in cloud-networking firm Arista Networks Inc. rose in value as data centers raised spending to meet computing demand from AI applications ↑ Among sectors, stock selections and an overweight exposure to communication services, and stock selections in health care and consumer staples helped returns
Comparison of the change in value of a $10,000 investment for the period indicated.
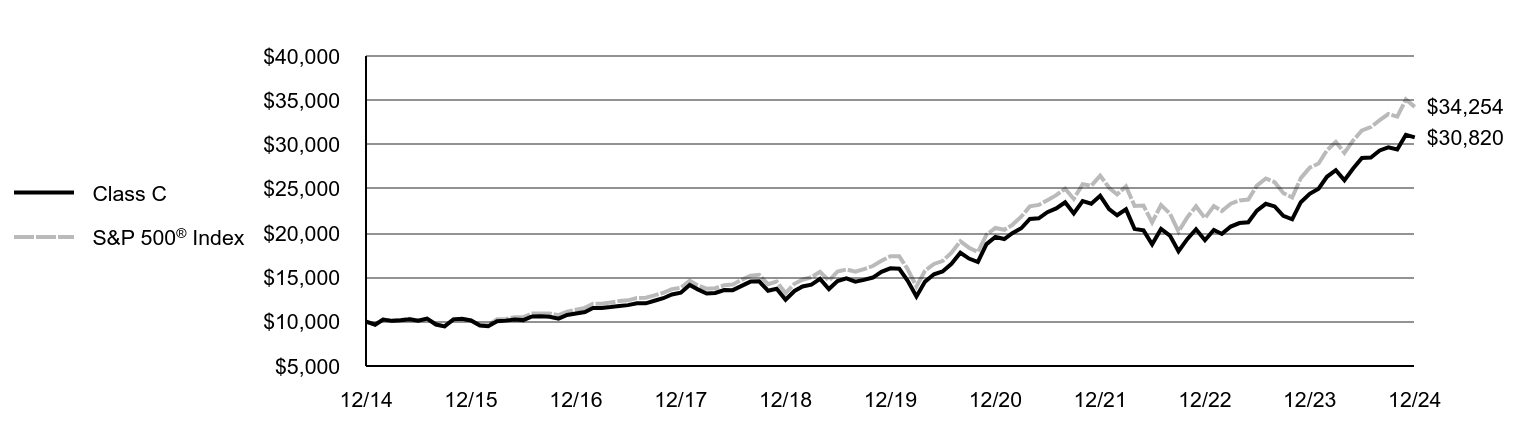
| Class C | S&P 500® Index |
|---|
| 12/14 | $10,000 | $10,000 |
|---|
| 1/15 | $9,664 | $9,700 |
|---|
| 2/15 | $10,242 | $10,257 |
|---|
| 3/15 | $10,097 | $10,095 |
|---|
| 4/15 | $10,154 | $10,192 |
|---|
| 5/15 | $10,282 | $10,323 |
|---|
| 6/15 | $10,114 | $10,123 |
|---|
| 7/15 | $10,348 | $10,335 |
|---|
| 8/15 | $9,684 | $9,712 |
|---|
| 9/15 | $9,467 | $9,471 |
|---|
| 10/15 | $10,267 | $10,270 |
|---|
| 11/15 | $10,342 | $10,301 |
|---|
| 12/15 | $10,139 | $10,138 |
|---|
| 1/16 | $9,573 | $9,635 |
|---|
| 2/16 | $9,484 | $9,622 |
|---|
| 3/16 | $10,051 | $10,275 |
|---|
| 4/16 | $10,122 | $10,315 |
|---|
| 5/16 | $10,246 | $10,500 |
|---|
| 6/16 | $10,182 | $10,527 |
|---|
| 7/16 | $10,595 | $10,915 |
|---|
| 8/16 | $10,615 | $10,931 |
|---|
| 9/16 | $10,566 | $10,933 |
|---|
| 10/16 | $10,348 | $10,733 |
|---|
| 11/16 | $10,763 | $11,131 |
|---|
| 12/16 | $10,935 | $11,351 |
|---|
| 1/17 | $11,102 | $11,566 |
|---|
| 2/17 | $11,542 | $12,025 |
|---|
| 3/17 | $11,551 | $12,039 |
|---|
| 4/17 | $11,651 | $12,163 |
|---|
| 5/17 | $11,778 | $12,334 |
|---|
| 6/17 | $11,872 | $12,411 |
|---|
| 7/17 | $12,082 | $12,667 |
|---|
| 8/17 | $12,077 | $12,705 |
|---|
| 9/17 | $12,367 | $12,967 |
|---|
| 10/17 | $12,652 | $13,270 |
|---|
| 11/17 | $13,071 | $13,677 |
|---|
| 12/17 | $13,282 | $13,829 |
|---|
| 1/18 | $14,149 | $14,621 |
|---|
| 2/18 | $13,653 | $14,082 |
|---|
| 3/18 | $13,189 | $13,724 |
|---|
| 4/18 | $13,241 | $13,777 |
|---|
| 5/18 | $13,575 | $14,108 |
|---|
| 6/18 | $13,561 | $14,195 |
|---|
| 7/18 | $14,045 | $14,724 |
|---|
| 8/18 | $14,529 | $15,203 |
|---|
| 9/18 | $14,554 | $15,290 |
|---|
| 10/18 | $13,503 | $14,245 |
|---|
| 11/18 | $13,716 | $14,535 |
|---|
| 12/18 | $12,486 | $13,223 |
|---|
| 1/19 | $13,473 | $14,282 |
|---|
| 2/19 | $13,978 | $14,741 |
|---|
| 3/19 | $14,177 | $15,027 |
|---|
| 4/19 | $14,832 | $15,636 |
|---|
| 5/19 | $13,686 | $14,642 |
|---|
| 6/19 | $14,598 | $15,674 |
|---|
| 7/19 | $14,887 | $15,899 |
|---|
| 8/19 | $14,527 | $15,648 |
|---|
| 9/19 | $14,726 | $15,940 |
|---|
| 10/19 | $14,985 | $16,286 |
|---|
| 11/19 | $15,629 | $16,877 |
|---|
| 12/19 | $16,025 | $17,386 |
|---|
| 1/20 | $15,978 | $17,379 |
|---|
| 2/20 | $14,650 | $15,949 |
|---|
| 3/20 | $12,841 | $13,979 |
|---|
| 4/20 | $14,530 | $15,771 |
|---|
| 5/20 | $15,355 | $16,522 |
|---|
| 6/20 | $15,669 | $16,850 |
|---|
| 7/20 | $16,532 | $17,801 |
|---|
| 8/20 | $17,784 | $19,080 |
|---|
| 9/20 | $17,132 | $18,355 |
|---|
| 10/20 | $16,743 | $17,867 |
|---|
| 11/20 | $18,762 | $19,823 |
|---|
| 12/20 | $19,568 | $20,585 |
|---|
| 1/21 | $19,331 | $20,377 |
|---|
| 2/21 | $19,998 | $20,939 |
|---|
| 3/21 | $20,552 | $21,856 |
|---|
| 4/21 | $21,597 | $23,022 |
|---|
| 5/21 | $21,675 | $23,183 |
|---|
| 6/21 | $22,368 | $23,724 |
|---|
| 7/21 | $22,790 | $24,288 |
|---|
| 8/21 | $23,488 | $25,026 |
|---|
| 9/21 | $22,227 | $23,863 |
|---|
| 10/21 | $23,612 | $25,534 |
|---|
| 11/21 | $23,324 | $25,357 |
|---|
| 12/21 | $24,218 | $26,494 |
|---|
| 1/22 | $22,703 | $25,123 |
|---|
| 2/22 | $22,019 | $24,371 |
|---|
| 3/22 | $22,686 | $25,276 |
|---|
| 4/22 | $20,473 | $23,071 |
|---|
| 5/22 | $20,317 | $23,114 |
|---|
| 6/22 | $18,738 | $21,206 |
|---|
| 7/22 | $20,475 | $23,161 |
|---|
| 8/22 | $19,719 | $22,217 |
|---|
| 9/22 | $17,956 | $20,170 |
|---|
| 10/22 | $19,347 | $21,804 |
|---|
| 11/22 | $20,435 | $23,022 |
|---|
| 12/22 | $19,203 | $21,696 |
|---|
| 1/23 | $20,369 | $23,059 |
|---|
| 2/23 | $19,913 | $22,496 |
|---|
| 3/23 | $20,747 | $23,322 |
|---|
| 4/23 | $21,142 | $23,686 |
|---|
| 5/23 | $21,229 | $23,789 |
|---|
| 6/23 | $22,539 | $25,361 |
|---|
| 7/23 | $23,312 | $26,176 |
|---|
| 8/23 | $23,018 | $25,759 |
|---|
| 9/23 | $21,950 | $24,531 |
|---|
| 10/23 | $21,561 | $24,015 |
|---|
| 11/23 | $23,497 | $26,208 |
|---|
| 12/23 | $24,441 | $27,399 |
|---|
| 1/24 | $25,021 | $27,859 |
|---|
| 2/24 | $26,363 | $29,347 |
|---|
| 3/24 | $27,101 | $30,291 |
|---|
| 4/24 | $25,976 | $29,054 |
|---|
| 5/24 | $27,318 | $30,494 |
|---|
| 6/24 | $28,495 | $31,589 |
|---|
| 7/24 | $28,544 | $31,973 |
|---|
| 8/24 | $29,332 | $32,749 |
|---|
| 9/24 | $29,679 | $33,448 |
|---|
| 10/24 | $29,442 | $33,145 |
|---|
| 11/24 | $31,101 | $35,090 |
|---|
| 12/24 | $30,820 | $34,254 |
|---|
Average Annual Total Returns (%)
| Fund | 1 Year | 5 Years | 10 Years |
|---|
| Class C, with conversion to Class A after 8 years | 24.23% | 13.62% | 11.90% |
|---|
| Class C, with 1% Maximum Deferred Sales Charge and conversion to Class A after 8 years | 23.23% | 13.62% | 11.90% |
|---|
S&P 500® Index | 25.02% | 14.51% | 13.09% |
|---|
Performance does not reflect the deduction of taxes that a shareholder would pay on Fund distributions or redemption of Fund shares. Performance assumes that all dividends and distributions, if any, were reinvested. For more recent performance information, visit www.eatonvance.com/performance.php.
THE FUND'S PAST PERFORMANCE IS NO GUARANTEE OF FUTURE RESULTS.
| Total Net Assets | $2,683,337,864 |
|---|
| # of Portfolio Holdings (for Tax-Managed Growth Portfolio) | 143 |
|---|
| Portfolio Turnover Rate (for Tax-Managed Growth Portfolio) | 7% |
|---|
| Total Advisory Fees Paid | $10,204,484 |
|---|
What did the Fund invest in?
The following tables reflect what the Fund invested in as of the report date.
References to the Fund's investments are to the Fund's pro rata share of Tax-Managed Growth Portfolio, an affiliated investment company in which the Fund invests substantially all of its assests.
Sector Allocation (% of total investments)
| Value | Value |
|---|
| Other | 0.0%Footnote Reference* |
| Real Estate | 0.3% |
| Utilities | 0.8% |
| Materials | 1.8% |
| Energy | 2.9% |
| Consumer Staples | 5.7% |
| Industrials | 8.3% |
| Health Care | 10.8% |
| Consumer Discretionary | 11.3% |
| Communication Services | 12.5% |
| Financials | 13.7% |
| Information Technology | 31.9% |
| Footnote | Description |
Footnote* | Amount is less than 0.05%. |
Top Ten Holdings (% of total investments)Footnote Referencea
| Apple, Inc. | 8.3% |
| NVIDIA Corp. | 6.4% |
| Microsoft Corp. | 6.4% |
| Amazon.com, Inc. | 5.5% |
| Meta Platforms, Inc., Class A | 3.8% |
| Alphabet, Inc., Class A | 2.8% |
| Alphabet, Inc., Class C | 2.8% |
| JPMorgan Chase & Co. | 2.1% |
| Netflix, Inc. | 1.7% |
| Berkshire Hathaway, Inc., Class B | 1.7% |
| Total | 41.5% |
| Footnote | Description |
Footnotea | Excluding cash equivalents |
If you wish to view additional information about the Fund, including the prospectus, statement of additional information, financial statements and holdings, please scan the QR code or visit www.eatonvance.com/open-end-mutual-fund-documents.php. For proxy information, please visit www.eatonvance.com/proxyvoting.
The Funds may deliver a single copy of certain required shareholder documents (including prospectuses, shareholder reports, and proxy materials) to investors with the same last name and the same address. Your participation will continue indefinitely unless you instruct otherwise by calling 1-800-262-1122 or by contacting your financial intermediary. Your instruction will typically be effective within 30 days of receipt.
Not FDIC Insured | May Lose Value | No Bank Guarantee
Annual Shareholder Report December 31, 2024
Eaton Vance Tax-Managed Growth Fund 1.1
Annual Shareholder Report December 31, 2024
This annual shareholder report contains important information about the Eaton Vance Tax-Managed Growth Fund 1.1 for the period of January 1, 2024 to December 31, 2024. You can find additional information about the Fund at www.eatonvance.com/open-end-mutual-fund-documents.php. You can also request this information by contacting us at 1-800-262-1122.
What were the Fund costs for the last year?Footnote Reference*
(based on a hypothetical $10,000 investment)
| Class Name | Costs of a $10,000 investment | Costs paid as a percentage of a $10,000 investment |
|---|
| Class I | $52 | 0.46% |
|---|
| Footnote | Description |
Footnote* | Expenses in the table reflect the expenses of both the Fund and the Tax-Managed Growth Portfolio, the Portfolio in which it invests. |
How did the Fund perform last year and what affected its performance?
Key contributors to (↑) and detractors from (↓) performance, relative to the S&P 500® Index (the Index):
↑ An overweight position in online streaming service Netflix Inc. rose in value, driven by better-than-expected subscriber and revenue growth, and higher profits ↑ An overweight position in Meta Platforms Inc. — parent of Facebook and Instagram — grew in value as artificial intelligence (AI) investments drove revenue growth ↑ An overweight position in cloud-networking firm Arista Networks Inc. rose in value as data centers raised spending to meet computing demand from AI applications ↑ Among sectors, stock selections and an overweight exposure to communication services, and stock selections in health care and consumer staples helped returns ↓ An underweight position in electric car maker Tesla Inc. — sold by period-end — hurt returns as its stock price rose over optimism about autonomous vehicles ↓ An underweight position in Broadcom Inc. detracted from returns as its stock price doubled on AI-driven demand for its semiconductor and software products ↓ An overweight position in athletic apparel giant Nike Inc. lost value as the firm had trouble with increased competition and its shift to more wholesale sales ↓ Among sectors, stock selections in industrials, consumer discretionary, and information technology hurt Fund returns relative to the Index during the period
Comparison of the change in value of a $1,000,000 investment for the period indicated.
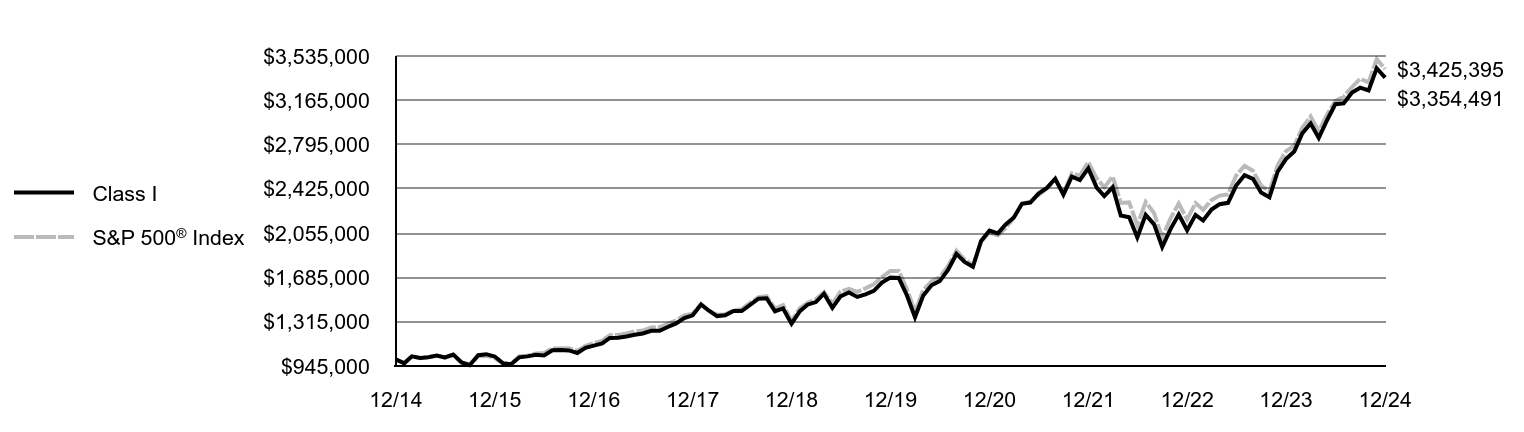
| Class I | S&P 500® Index |
|---|
| 12/14 | $1,000,000 | $1,000,000 |
|---|
| 1/15 | $967,338 | $969,981 |
|---|
| 2/15 | $1,025,538 | $1,025,727 |
|---|
| 3/15 | $1,011,828 | $1,009,506 |
|---|
| 4/15 | $1,018,703 | $1,019,190 |
|---|
| 5/15 | $1,032,431 | $1,032,296 |
|---|
| 6/15 | $1,016,248 | $1,012,313 |
|---|
| 7/15 | $1,040,663 | $1,033,522 |
|---|
| 8/15 | $974,771 | $971,166 |
|---|
| 9/15 | $953,631 | $947,136 |
|---|
| 10/15 | $1,035,150 | $1,027,030 |
|---|
| 11/15 | $1,043,653 | $1,030,085 |
|---|
| 12/15 | $1,024,098 | $1,013,838 |
|---|
| 1/16 | $967,580 | $963,527 |
|---|
| 2/16 | $959,239 | $962,227 |
|---|
| 3/16 | $1,017,411 | $1,027,503 |
|---|
| 4/16 | $1,025,492 | $1,031,487 |
|---|
| 5/16 | $1,038,838 | $1,050,010 |
|---|
| 6/16 | $1,033,538 | $1,052,731 |
|---|
| 7/16 | $1,076,111 | $1,091,544 |
|---|
| 8/16 | $1,079,192 | $1,093,076 |
|---|
| 9/16 | $1,075,011 | $1,093,283 |
|---|
| 10/16 | $1,053,843 | $1,073,340 |
|---|
| 11/16 | $1,096,983 | $1,113,091 |
|---|
| 12/16 | $1,115,489 | $1,135,093 |
|---|
| 1/17 | $1,133,538 | $1,156,621 |
|---|
| 2/17 | $1,178,961 | $1,202,546 |
|---|
| 3/17 | $1,181,223 | $1,203,949 |
|---|
| 4/17 | $1,192,221 | $1,216,313 |
|---|
| 5/17 | $1,206,066 | $1,233,430 |
|---|
| 6/17 | $1,217,057 | $1,241,129 |
|---|
| 7/17 | $1,239,646 | $1,266,650 |
|---|
| 8/17 | $1,239,902 | $1,270,527 |
|---|
| 9/17 | $1,270,925 | $1,296,736 |
|---|
| 10/17 | $1,301,089 | $1,326,995 |
|---|
| 11/17 | $1,345,655 | $1,367,694 |
|---|
| 12/17 | $1,368,346 | $1,382,901 |
|---|
| 1/18 | $1,458,857 | $1,462,078 |
|---|
| 2/18 | $1,408,865 | $1,408,190 |
|---|
| 3/18 | $1,362,067 | $1,372,403 |
|---|
| 4/18 | $1,368,611 | $1,377,669 |
|---|
| 5/18 | $1,404,321 | $1,410,846 |
|---|
| 6/18 | $1,404,003 | $1,419,530 |
|---|
| 7/18 | $1,455,428 | $1,472,355 |
|---|
| 8/18 | $1,506,797 | $1,520,333 |
|---|
| 9/18 | $1,510,782 | $1,528,986 |
|---|
| 10/18 | $1,402,561 | $1,424,480 |
|---|
| 11/18 | $1,425,954 | $1,453,508 |
|---|
| 12/18 | $1,298,304 | $1,322,270 |
|---|
| 1/19 | $1,403,625 | $1,428,231 |
|---|
| 2/19 | $1,457,140 | $1,474,089 |
|---|
| 3/19 | $1,479,119 | $1,502,733 |
|---|
| 4/19 | $1,548,838 | $1,563,578 |
|---|
| 5/19 | $1,430,548 | $1,464,216 |
|---|
| 6/19 | $1,527,138 | $1,567,408 |
|---|
| 7/19 | $1,558,672 | $1,589,935 |
|---|
| 8/19 | $1,522,241 | $1,564,750 |
|---|
| 9/19 | $1,543,923 | $1,594,027 |
|---|
| 10/19 | $1,572,842 | $1,628,553 |
|---|
| 11/19 | $1,641,358 | $1,687,668 |
|---|
| 12/19 | $1,684,338 | $1,738,605 |
|---|
| 1/20 | $1,680,519 | $1,737,924 |
|---|
| 2/20 | $1,542,092 | $1,594,859 |
|---|
| 3/20 | $1,352,824 | $1,397,874 |
|---|
| 4/20 | $1,531,853 | $1,577,072 |
|---|
| 5/20 | $1,619,952 | $1,652,185 |
|---|
| 6/20 | $1,654,446 | $1,685,042 |
|---|
| 7/20 | $1,747,142 | $1,780,054 |
|---|
| 8/20 | $1,881,154 | $1,908,005 |
|---|
| 9/20 | $1,813,854 | $1,835,507 |
|---|
| 10/20 | $1,774,063 | $1,786,694 |
|---|
| 11/20 | $1,989,705 | $1,982,273 |
|---|
| 12/20 | $2,076,820 | $2,058,487 |
|---|
| 1/21 | $2,053,550 | $2,037,705 |
|---|
| 2/21 | $2,125,868 | $2,093,895 |
|---|
| 3/21 | $2,186,394 | $2,185,598 |
|---|
| 4/21 | $2,299,832 | $2,302,241 |
|---|
| 5/21 | $2,310,170 | $2,318,321 |
|---|
| 6/21 | $2,385,833 | $2,372,442 |
|---|
| 7/21 | $2,432,833 | $2,428,799 |
|---|
| 8/21 | $2,509,598 | $2,502,648 |
|---|
| 9/21 | $2,377,032 | $2,386,250 |
|---|
| 10/21 | $2,527,312 | $2,553,435 |
|---|
| 11/21 | $2,498,378 | $2,535,743 |
|---|
| 12/21 | $2,596,368 | $2,649,385 |
|---|
| 1/22 | $2,435,914 | $2,512,287 |
|---|
| 2/22 | $2,364,305 | $2,437,066 |
|---|
| 3/22 | $2,438,292 | $2,527,553 |
|---|
| 4/22 | $2,202,069 | $2,307,145 |
|---|
| 5/22 | $2,187,212 | $2,311,378 |
|---|
| 6/22 | $2,018,737 | $2,120,588 |
|---|
| 7/22 | $2,207,715 | $2,316,116 |
|---|
| 8/22 | $2,128,380 | $2,221,660 |
|---|
| 9/22 | $1,939,402 | $2,017,049 |
|---|
| 10/22 | $2,091,238 | $2,180,352 |
|---|
| 11/22 | $2,210,983 | $2,302,198 |
|---|
| 12/22 | $2,079,259 | $2,169,558 |
|---|
| 1/23 | $2,207,394 | $2,305,880 |
|---|
| 2/23 | $2,159,981 | $2,249,619 |
|---|
| 3/23 | $2,252,106 | $2,332,212 |
|---|
| 4/23 | $2,297,118 | $2,368,614 |
|---|
| 5/23 | $2,308,221 | $2,378,910 |
|---|
| 6/23 | $2,452,560 | $2,536,097 |
|---|
| 7/23 | $2,538,983 | $2,617,569 |
|---|
| 8/23 | $2,508,975 | $2,575,893 |
|---|
| 9/23 | $2,394,644 | $2,453,080 |
|---|
| 10/23 | $2,354,133 | $2,401,500 |
|---|
| 11/23 | $2,567,791 | $2,620,818 |
|---|
| 12/23 | $2,673,115 | $2,739,884 |
|---|
| 1/24 | $2,738,800 | $2,785,925 |
|---|
| 2/24 | $2,888,029 | $2,934,682 |
|---|
| 3/24 | $2,971,271 | $3,029,104 |
|---|
| 4/24 | $2,850,495 | $2,905,381 |
|---|
| 5/24 | $3,000,330 | $3,049,444 |
|---|
| 6/24 | $3,132,003 | $3,158,864 |
|---|
| 7/24 | $3,140,176 | $3,197,315 |
|---|
| 8/24 | $3,229,471 | $3,274,872 |
|---|
| 9/24 | $3,270,335 | $3,344,813 |
|---|
| 10/24 | $3,247,028 | $3,314,481 |
|---|
| 11/24 | $3,432,883 | $3,509,044 |
|---|
| 12/24 | $3,354,491 | $3,425,395 |
|---|
Average Annual Total Returns (%)
| Fund | 1 Year | 5 Years | 10 Years |
|---|
| Class I | 25.48% | 14.75% | 12.85% |
|---|
S&P 500® Index | 25.02% | 14.51% | 13.09% |
|---|
Performance does not reflect the deduction of taxes that a shareholder would pay on Fund distributions or redemption of Fund shares. Performance assumes that all dividends and distributions, if any, were reinvested. For more recent performance information, visit www.eatonvance.com/performance.php.
THE FUND'S PAST PERFORMANCE IS NO GUARANTEE OF FUTURE RESULTS.
| Total Net Assets | $2,683,337,864 |
|---|
| # of Portfolio Holdings (for Tax-Managed Growth Portfolio) | 143 |
|---|
| Portfolio Turnover Rate (for Tax-Managed Growth Portfolio) | 7% |
|---|
| Total Advisory Fees Paid | $10,204,484 |
|---|
What did the Fund invest in?
The following tables reflect what the Fund invested in as of the report date.
References to the Fund's investments are to the Fund's pro rata share of Tax-Managed Growth Portfolio, an affiliated investment company in which the Fund invests substantially all of its assests.
Sector Allocation (% of total investments)
| Value | Value |
|---|
| Other | 0.0%Footnote Reference* |
| Real Estate | 0.3% |
| Utilities | 0.8% |
| Materials | 1.8% |
| Energy | 2.9% |
| Consumer Staples | 5.7% |
| Industrials | 8.3% |
| Health Care | 10.8% |
| Consumer Discretionary | 11.3% |
| Communication Services | 12.5% |
| Financials | 13.7% |
| Information Technology | 31.9% |
| Footnote | Description |
Footnote* | Amount is less than 0.05%. |
Top Ten Holdings (% of total investments)Footnote Referencea
| Apple, Inc. | 8.3% |
| NVIDIA Corp. | 6.4% |
| Microsoft Corp. | 6.4% |
| Amazon.com, Inc. | 5.5% |
| Meta Platforms, Inc., Class A | 3.8% |
| Alphabet, Inc., Class A | 2.8% |
| Alphabet, Inc., Class C | 2.8% |
| JPMorgan Chase & Co. | 2.1% |
| Netflix, Inc. | 1.7% |
| Berkshire Hathaway, Inc., Class B | 1.7% |
| Total | 41.5% |
| Footnote | Description |
Footnotea | Excluding cash equivalents |
If you wish to view additional information about the Fund, including the prospectus, statement of additional information, financial statements and holdings, please scan the QR code or visit www.eatonvance.com/open-end-mutual-fund-documents.php. For proxy information, please visit www.eatonvance.com/proxyvoting.
The Funds may deliver a single copy of certain required shareholder documents (including prospectuses, shareholder reports, and proxy materials) to investors with the same last name and the same address. Your participation will continue indefinitely unless you instruct otherwise by calling 1-800-262-1122 or by contacting your financial intermediary. Your instruction will typically be effective within 30 days of receipt.
Not FDIC Insured | May Lose Value | No Bank Guarantee
Annual Shareholder Report December 31, 2024
Eaton Vance Tax-Managed Growth Fund 1.2
Annual Shareholder Report December 31, 2024
This annual shareholder report contains important information about the Eaton Vance Tax-Managed Growth Fund 1.2 for the period of January 1, 2024 to December 31, 2024. You can find additional information about the Fund at www.eatonvance.com/open-end-mutual-fund-documents.php. You can also request this information by contacting us at 1-800-262-1122.
What were the Fund costs for the last year?Footnote Reference*
(based on a hypothetical $10,000 investment)
| Class Name | Costs of a $10,000 investment | Costs paid as a percentage of a $10,000 investment |
|---|
| Class A | $98 | 0.87% |
|---|
| Footnote | Description |
Footnote* | Expenses in the table reflect the expenses of both the Fund and the Tax-Managed Growth Portfolio, the Portfolio in which it invests. |
How did the Fund perform last year and what affected its performance?
Key contributors to (↑) and detractors from (↓) performance, relative to the S&P 500® Index (the Index):
↓ An underweight position in electric car maker Tesla Inc. — sold by period-end — hurt returns as its stock price rose over optimism about autonomous vehicles ↓ An underweight position in Broadcom Inc. detracted from returns as its stock price doubled on AI-driven demand for its semiconductor and software products ↓ An overweight position in athletic apparel giant Nike Inc. lost value as the firm had trouble with increased competition and its shift to more wholesale sales ↓ Among sectors, stock selections in industrials, consumer discretionary, and information technology hurt Fund returns relative to the Index during the period ↑ An overweight position in online streaming service Netflix Inc. rose in value, driven by better-than-expected subscriber and revenue growth, and higher profits ↑ An overweight position in Meta Platforms Inc. — parent of Facebook and Instagram — grew in value as artificial intelligence (AI) investments drove revenue growth ↑ An overweight position in cloud-networking firm Arista Networks Inc. rose in value as data centers raised spending to meet computing demand from AI applications ↑ Among sectors, stock selections and an overweight exposure to communication services, and stock selections in health care and consumer staples helped returns
Comparison of the change in value of a $10,000 investment for the period indicated.
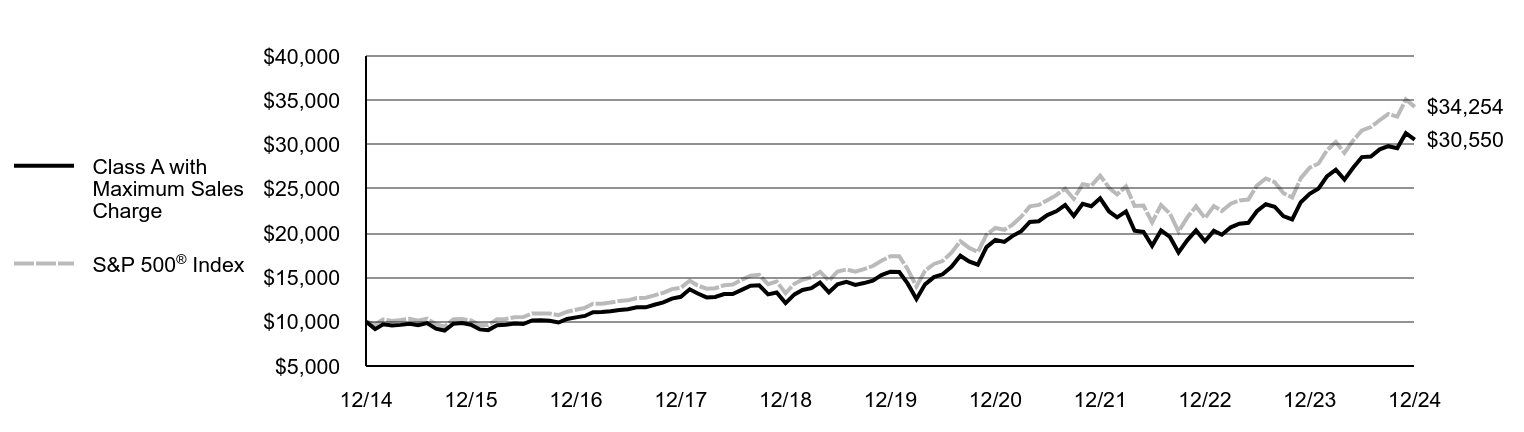
| Class A with Maximum Sales Charge | S&P 500® Index |
|---|
| 12/14 | $10,000 | $10,000 |
|---|
| 1/15 | $9,161 | $9,700 |
|---|
| 2/15 | $9,713 | $10,257 |
|---|
| 3/15 | $9,578 | $10,095 |
|---|
| 4/15 | $9,643 | $10,192 |
|---|
| 5/15 | $9,767 | $10,323 |
|---|
| 6/15 | $9,610 | $10,123 |
|---|
| 7/15 | $9,838 | $10,335 |
|---|
| 8/15 | $9,215 | $9,712 |
|---|
| 9/15 | $9,009 | $9,471 |
|---|
| 10/15 | $9,778 | $10,270 |
|---|
| 11/15 | $9,854 | $10,301 |
|---|
| 12/15 | $9,667 | $10,138 |
|---|
| 1/16 | $9,132 | $9,635 |
|---|
| 2/16 | $9,050 | $9,622 |
|---|
| 3/16 | $9,596 | $10,275 |
|---|
| 4/16 | $9,667 | $10,315 |
|---|
| 5/16 | $9,793 | $10,500 |
|---|
| 6/16 | $9,738 | $10,527 |
|---|
| 7/16 | $10,137 | $10,915 |
|---|
| 8/16 | $10,159 | $10,931 |
|---|
| 9/16 | $10,115 | $10,933 |
|---|
| 10/16 | $9,913 | $10,733 |
|---|
| 11/16 | $10,317 | $11,131 |
|---|
| 12/16 | $10,487 | $11,351 |
|---|
| 1/17 | $10,652 | $11,566 |
|---|
| 2/17 | $11,077 | $12,025 |
|---|
| 3/17 | $11,093 | $12,039 |
|---|
| 4/17 | $11,193 | $12,163 |
|---|
| 5/17 | $11,325 | $12,334 |
|---|
| 6/17 | $11,419 | $12,411 |
|---|
| 7/17 | $11,628 | $12,667 |
|---|
| 8/17 | $11,628 | $12,705 |
|---|
| 9/17 | $11,915 | $12,967 |
|---|
| 10/17 | $12,191 | $13,270 |
|---|
| 11/17 | $12,604 | $13,677 |
|---|
| 12/17 | $12,810 | $13,829 |
|---|
| 1/18 | $13,655 | $14,621 |
|---|
| 2/18 | $13,182 | $14,082 |
|---|
| 3/18 | $12,744 | $13,724 |
|---|
| 4/18 | $12,799 | $13,777 |
|---|
| 5/18 | $13,127 | $14,108 |
|---|
| 6/18 | $13,121 | $14,195 |
|---|
| 7/18 | $13,594 | $14,724 |
|---|
| 8/18 | $14,071 | $15,203 |
|---|
| 9/18 | $14,105 | $15,290 |
|---|
| 10/18 | $13,088 | $14,245 |
|---|
| 11/18 | $13,305 | $14,535 |
|---|
| 12/18 | $12,106 | $13,223 |
|---|
| 1/19 | $13,086 | $14,282 |
|---|
| 2/19 | $13,579 | $14,741 |
|---|
| 3/19 | $13,780 | $15,027 |
|---|
| 4/19 | $14,424 | $15,636 |
|---|
| 5/19 | $13,321 | $14,642 |
|---|
| 6/19 | $14,217 | $15,674 |
|---|
| 7/19 | $14,502 | $15,899 |
|---|
| 8/19 | $14,161 | $15,648 |
|---|
| 9/19 | $14,362 | $15,940 |
|---|
| 10/19 | $14,625 | $16,286 |
|---|
| 11/19 | $15,258 | $16,877 |
|---|
| 12/19 | $15,652 | $17,386 |
|---|
| 1/20 | $15,612 | $17,379 |
|---|
| 2/20 | $14,321 | $15,949 |
|---|
| 3/20 | $12,563 | $13,979 |
|---|
| 4/20 | $14,220 | $15,771 |
|---|
| 5/20 | $15,032 | $16,522 |
|---|
| 6/20 | $15,353 | $16,850 |
|---|
| 7/20 | $16,204 | $17,801 |
|---|
| 8/20 | $17,444 | $19,080 |
|---|
| 9/20 | $16,813 | $18,355 |
|---|
| 10/20 | $16,435 | $17,867 |
|---|
| 11/20 | $18,425 | $19,823 |
|---|
| 12/20 | $19,227 | $20,585 |
|---|
| 1/21 | $19,006 | $20,377 |
|---|
| 2/21 | $19,669 | $20,939 |
|---|
| 3/21 | $20,224 | $21,856 |
|---|
| 4/21 | $21,260 | $23,022 |
|---|
| 5/21 | $21,345 | $23,183 |
|---|
| 6/21 | $22,041 | $23,724 |
|---|
| 7/21 | $22,466 | $24,288 |
|---|
| 8/21 | $23,168 | $25,026 |
|---|
| 9/21 | $21,934 | $23,863 |
|---|
| 10/21 | $23,316 | $25,534 |
|---|
| 11/21 | $23,038 | $25,357 |
|---|
| 12/21 | $23,933 | $26,494 |
|---|
| 1/22 | $22,447 | $25,123 |
|---|
| 2/22 | $21,783 | $24,371 |
|---|
| 3/22 | $22,458 | $25,276 |
|---|
| 4/22 | $20,274 | $23,071 |
|---|
| 5/22 | $20,132 | $23,114 |
|---|
| 6/22 | $18,572 | $21,206 |
|---|
| 7/22 | $20,308 | $23,161 |
|---|
| 8/22 | $19,571 | $22,217 |
|---|
| 9/22 | $17,824 | $20,170 |
|---|
| 10/22 | $19,219 | $21,804 |
|---|
| 11/22 | $20,308 | $23,022 |
|---|
| 12/22 | $19,092 | $21,696 |
|---|
| 1/23 | $20,261 | $23,059 |
|---|
| 2/23 | $19,822 | $22,496 |
|---|
| 3/23 | $20,660 | $23,322 |
|---|
| 4/23 | $21,064 | $23,686 |
|---|
| 5/23 | $21,161 | $23,789 |
|---|
| 6/23 | $22,478 | $25,361 |
|---|
| 7/23 | $23,259 | $26,176 |
|---|
| 8/23 | $22,979 | $25,759 |
|---|
| 9/23 | $21,925 | $24,531 |
|---|
| 10/23 | $21,549 | $24,015 |
|---|
| 11/23 | $23,492 | $26,208 |
|---|
| 12/23 | $24,448 | $27,399 |
|---|
| 1/24 | $25,044 | $27,859 |
|---|
| 2/24 | $26,400 | $29,347 |
|---|
| 3/24 | $27,156 | $30,291 |
|---|
| 4/24 | $26,040 | $29,054 |
|---|
| 5/24 | $27,402 | $30,494 |
|---|
| 6/24 | $28,587 | $31,589 |
|---|
| 7/24 | $28,656 | $31,973 |
|---|
| 8/24 | $29,457 | $32,749 |
|---|
| 9/24 | $29,818 | $33,448 |
|---|
| 10/24 | $29,600 | $33,145 |
|---|
| 11/24 | $31,283 | $35,090 |
|---|
| 12/24 | $30,550 | $34,254 |
|---|
Average Annual Total Returns (%)
| Fund | 1 Year | 5 Years | 10 Years |
|---|
| Class A | 24.96% | 14.30% | 12.41% |
|---|
| Class A with 5.25% Maximum Sales Charge | 18.39% | 13.07% | 11.81% |
|---|
S&P 500® Index | 25.02% | 14.51% | 13.09% |
|---|
Performance does not reflect the deduction of taxes that a shareholder would pay on Fund distributions or redemption of Fund shares. Performance assumes that all dividends and distributions, if any, were reinvested. For more recent performance information, visit www.eatonvance.com/performance.php.
THE FUND'S PAST PERFORMANCE IS NO GUARANTEE OF FUTURE RESULTS.
| Total Net Assets | $1,519,803,404 |
|---|
| # of Portfolio Holdings (for Tax-Managed Growth Portfolio) | 143 |
|---|
| Portfolio Turnover Rate (for Tax-Managed Growth Portfolio) | 7% |
|---|
| Total Advisory Fees Paid | $5,697,365 |
|---|
What did the Fund invest in?
The following tables reflect what the Fund invested in as of the report date.
References to the Fund's investments are to the Fund's pro rata share of Tax-Managed Growth Portfolio, an affiliated investment company in which the Fund invests substantially all of its assests.
Sector Allocation (% of total investments)
| Value | Value |
|---|
| Other | 0.0%Footnote Reference* |
| Real Estate | 0.3% |
| Utilities | 0.8% |
| Materials | 1.8% |
| Energy | 2.9% |
| Consumer Staples | 5.7% |
| Industrials | 8.3% |
| Health Care | 10.8% |
| Consumer Discretionary | 11.3% |
| Communication Services | 12.5% |
| Financials | 13.7% |
| Information Technology | 31.9% |
| Footnote | Description |
Footnote* | Amount is less than 0.05%. |
Top Ten Holdings (% of total investments)Footnote Referencea
| Apple, Inc. | 8.3% |
| NVIDIA Corp. | 6.4% |
| Microsoft Corp. | 6.4% |
| Amazon.com, Inc. | 5.5% |
| Meta Platforms, Inc., Class A | 3.8% |
| Alphabet, Inc., Class A | 2.8% |
| Alphabet, Inc., Class C | 2.8% |
| JPMorgan Chase & Co. | 2.1% |
| Netflix, Inc. | 1.7% |
| Berkshire Hathaway, Inc., Class B | 1.7% |
| Total | 41.5% |
| Footnote | Description |
Footnotea | Excluding cash equivalents |
If you wish to view additional information about the Fund, including the prospectus, statement of additional information, financial statements and holdings, please scan the QR code or visit www.eatonvance.com/open-end-mutual-fund-documents.php. For proxy information, please visit www.eatonvance.com/proxyvoting.
The Funds may deliver a single copy of certain required shareholder documents (including prospectuses, shareholder reports, and proxy materials) to investors with the same last name and the same address. Your participation will continue indefinitely unless you instruct otherwise by calling 1-800-262-1122 or by contacting your financial intermediary. Your instruction will typically be effective within 30 days of receipt.
Not FDIC Insured | May Lose Value | No Bank Guarantee
Annual Shareholder Report December 31, 2024
Eaton Vance Tax-Managed Growth Fund 1.2
Annual Shareholder Report December 31, 2024
This annual shareholder report contains important information about the Eaton Vance Tax-Managed Growth Fund 1.2 for the period of January 1, 2024 to December 31, 2024. You can find additional information about the Fund at www.eatonvance.com/open-end-mutual-fund-documents.php. You can also request this information by contacting us at 1-800-262-1122.
What were the Fund costs for the last year?Footnote Reference*
(based on a hypothetical $10,000 investment)
| Class Name | Costs of a $10,000 investment | Costs paid as a percentage of a $10,000 investment |
|---|
| Class C | $181 | 1.62% |
|---|
| Footnote | Description |
Footnote* | Expenses in the table reflect the expenses of both the Fund and the Tax-Managed Growth Portfolio, the Portfolio in which it invests. |
How did the Fund perform last year and what affected its performance?
Key contributors to (↑) and detractors from (↓) performance, relative to the S&P 500® Index (the Index):
↓ An underweight position in electric car maker Tesla Inc. — sold by period-end — hurt returns as its stock price rose over optimism about autonomous vehicles ↓ An underweight position in Broadcom Inc. detracted from returns as its stock price doubled on AI-driven demand for its semiconductor and software products ↓ An overweight position in athletic apparel giant Nike Inc. lost value as the firm had trouble with increased competition and its shift to more wholesale sales ↓ Among sectors, stock selections in industrials, consumer discretionary, and information technology hurt Fund returns relative to the Index during the period ↑ An overweight position in online streaming service Netflix Inc. rose in value, driven by better-than-expected subscriber and revenue growth, and higher profits ↑ An overweight position in Meta Platforms Inc. — parent of Facebook and Instagram — grew in value as artificial intelligence (AI) investments drove revenue growth ↑ An overweight position in cloud-networking firm Arista Networks Inc. rose in value as data centers raised spending to meet computing demand from AI applications ↑ Among sectors, stock selections and an overweight exposure to communication services, and stock selections in health care and consumer staples helped returns
Comparison of the change in value of a $10,000 investment for the period indicated.
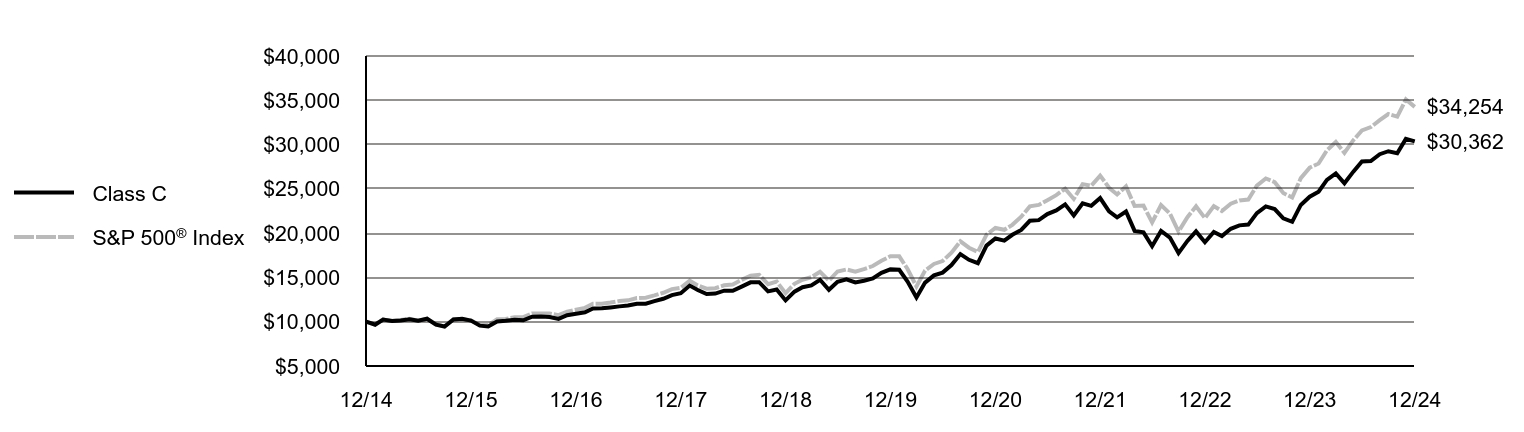
| Class C | S&P 500® Index |
|---|
| 12/14 | $10,000 | $10,000 |
|---|
| 1/15 | $9,660 | $9,700 |
|---|
| 2/15 | $10,234 | $10,257 |
|---|
| 3/15 | $10,088 | $10,095 |
|---|
| 4/15 | $10,146 | $10,192 |
|---|
| 5/15 | $10,275 | $10,323 |
|---|
| 6/15 | $10,106 | $10,123 |
|---|
| 7/15 | $10,334 | $10,335 |
|---|
| 8/15 | $9,672 | $9,712 |
|---|
| 9/15 | $9,455 | $9,471 |
|---|
| 10/15 | $10,252 | $10,270 |
|---|
| 11/15 | $10,328 | $10,301 |
|---|
| 12/15 | $10,123 | $10,138 |
|---|
| 1/16 | $9,559 | $9,635 |
|---|
| 2/16 | $9,465 | $9,622 |
|---|
| 3/16 | $10,029 | $10,275 |
|---|
| 4/16 | $10,099 | $10,315 |
|---|
| 5/16 | $10,223 | $10,500 |
|---|
| 6/16 | $10,158 | $10,527 |
|---|
| 7/16 | $10,569 | $10,915 |
|---|
| 8/16 | $10,587 | $10,931 |
|---|
| 9/16 | $10,534 | $10,933 |
|---|
| 10/16 | $10,316 | $10,733 |
|---|
| 11/16 | $10,727 | $11,131 |
|---|
| 12/16 | $10,904 | $11,351 |
|---|
| 1/17 | $11,069 | $11,566 |
|---|
| 2/17 | $11,504 | $12,025 |
|---|
| 3/17 | $11,510 | $12,039 |
|---|
| 4/17 | $11,610 | $12,163 |
|---|
| 5/17 | $11,733 | $12,334 |
|---|
| 6/17 | $11,827 | $12,411 |
|---|
| 7/17 | $12,033 | $12,667 |
|---|
| 8/17 | $12,028 | $12,705 |
|---|
| 9/17 | $12,316 | $12,967 |
|---|
| 10/17 | $12,592 | $13,270 |
|---|
| 11/17 | $13,010 | $13,677 |
|---|
| 12/17 | $13,219 | $13,829 |
|---|
| 1/18 | $14,078 | $14,621 |
|---|
| 2/18 | $13,584 | $14,082 |
|---|
| 3/18 | $13,119 | $13,724 |
|---|
| 4/18 | $13,172 | $13,777 |
|---|
| 5/18 | $13,502 | $14,108 |
|---|
| 6/18 | $13,484 | $14,195 |
|---|
| 7/18 | $13,966 | $14,724 |
|---|
| 8/18 | $14,443 | $15,203 |
|---|
| 9/18 | $14,467 | $15,290 |
|---|
| 10/18 | $13,419 | $14,245 |
|---|
| 11/18 | $13,631 | $14,535 |
|---|
| 12/18 | $12,407 | $13,223 |
|---|
| 1/19 | $13,390 | $14,282 |
|---|
| 2/19 | $13,890 | $14,741 |
|---|
| 3/19 | $14,090 | $15,027 |
|---|
| 4/19 | $14,737 | $15,636 |
|---|
| 5/19 | $13,602 | $14,642 |
|---|
| 6/19 | $14,502 | $15,674 |
|---|
| 7/19 | $14,790 | $15,899 |
|---|
| 8/19 | $14,431 | $15,648 |
|---|
| 9/19 | $14,625 | $15,940 |
|---|
| 10/19 | $14,884 | $16,286 |
|---|
| 11/19 | $15,514 | $16,877 |
|---|
| 12/19 | $15,908 | $17,386 |
|---|
| 1/20 | $15,861 | $17,379 |
|---|
| 2/20 | $14,543 | $15,949 |
|---|
| 3/20 | $12,742 | $13,979 |
|---|
| 4/20 | $14,419 | $15,771 |
|---|
| 5/20 | $15,231 | $16,522 |
|---|
| 6/20 | $15,543 | $16,850 |
|---|
| 7/20 | $16,396 | $17,801 |
|---|
| 8/20 | $17,638 | $19,080 |
|---|
| 9/20 | $16,991 | $18,355 |
|---|
| 10/20 | $16,602 | $17,867 |
|---|
| 11/20 | $18,597 | $19,823 |
|---|
| 12/20 | $19,398 | $20,585 |
|---|
| 1/21 | $19,157 | $20,377 |
|---|
| 2/21 | $19,816 | $20,939 |
|---|
| 3/21 | $20,363 | $21,856 |
|---|
| 4/21 | $21,393 | $23,022 |
|---|
| 5/21 | $21,469 | $23,183 |
|---|
| 6/21 | $22,152 | $23,724 |
|---|
| 7/21 | $22,563 | $24,288 |
|---|
| 8/21 | $23,252 | $25,026 |
|---|
| 9/21 | $22,004 | $23,863 |
|---|
| 10/21 | $23,376 | $25,534 |
|---|
| 11/21 | $23,087 | $25,357 |
|---|
| 12/21 | $23,964 | $26,494 |
|---|
| 1/22 | $22,463 | $25,123 |
|---|
| 2/22 | $21,787 | $24,371 |
|---|
| 3/22 | $22,440 | $25,276 |
|---|
| 4/22 | $20,251 | $23,071 |
|---|
| 5/22 | $20,092 | $23,114 |
|---|
| 6/22 | $18,526 | $21,206 |
|---|
| 7/22 | $20,245 | $23,161 |
|---|
| 8/22 | $19,497 | $22,217 |
|---|
| 9/22 | $17,749 | $20,170 |
|---|
| 10/22 | $19,121 | $21,804 |
|---|
| 11/22 | $20,198 | $23,022 |
|---|
| 12/22 | $18,974 | $21,696 |
|---|
| 1/23 | $20,127 | $23,059 |
|---|
| 2/23 | $19,674 | $22,496 |
|---|
| 3/23 | $20,492 | $23,322 |
|---|
| 4/23 | $20,880 | $23,686 |
|---|
| 5/23 | $20,963 | $23,789 |
|---|
| 6/23 | $22,257 | $25,361 |
|---|
| 7/23 | $23,017 | $26,176 |
|---|
| 8/23 | $22,722 | $25,759 |
|---|
| 9/23 | $21,663 | $24,531 |
|---|
| 10/23 | $21,280 | $24,015 |
|---|
| 11/23 | $23,187 | $26,208 |
|---|
| 12/23 | $24,117 | $27,399 |
|---|
| 1/24 | $24,688 | $27,859 |
|---|
| 2/24 | $26,006 | $29,347 |
|---|
| 3/24 | $26,736 | $30,291 |
|---|
| 4/24 | $25,624 | $29,054 |
|---|
| 5/24 | $26,942 | $30,494 |
|---|
| 6/24 | $28,095 | $31,589 |
|---|
| 7/24 | $28,142 | $31,973 |
|---|
| 8/24 | $28,913 | $32,749 |
|---|
| 9/24 | $29,249 | $33,448 |
|---|
| 10/24 | $29,013 | $33,145 |
|---|
| 11/24 | $30,644 | $35,090 |
|---|
| 12/24 | $30,362 | $34,254 |
|---|
Average Annual Total Returns (%)
| Fund | 1 Year | 5 Years | 10 Years |
|---|
| Class C, with conversion to Class A after 8 years | 24.01% | 13.44% | 11.74% |
|---|
| Class C, with 1% Maximum Deferred Sales Charge and conversion to Class A after 8 years | 23.01% | 13.44% | 11.74% |
|---|
S&P 500® Index | 25.02% | 14.51% | 13.09% |
|---|
Performance does not reflect the deduction of taxes that a shareholder would pay on Fund distributions or redemption of Fund shares. Performance assumes that all dividends and distributions, if any, were reinvested. For more recent performance information, visit www.eatonvance.com/performance.php.
THE FUND'S PAST PERFORMANCE IS NO GUARANTEE OF FUTURE RESULTS.
| Total Net Assets | $1,519,803,404 |
|---|
| # of Portfolio Holdings (for Tax-Managed Growth Portfolio) | 143 |
|---|
| Portfolio Turnover Rate (for Tax-Managed Growth Portfolio) | 7% |
|---|
| Total Advisory Fees Paid | $5,697,365 |
|---|
What did the Fund invest in?
The following tables reflect what the Fund invested in as of the report date.
References to the Fund's investments are to the Fund's pro rata share of Tax-Managed Growth Portfolio, an affiliated investment company in which the Fund invests substantially all of its assests.
Sector Allocation (% of total investments)
| Value | Value |
|---|
| Other | 0.0%Footnote Reference* |
| Real Estate | 0.3% |
| Utilities | 0.8% |
| Materials | 1.8% |
| Energy | 2.9% |
| Consumer Staples | 5.7% |
| Industrials | 8.3% |
| Health Care | 10.8% |
| Consumer Discretionary | 11.3% |
| Communication Services | 12.5% |
| Financials | 13.7% |
| Information Technology | 31.9% |
| Footnote | Description |
Footnote* | Amount is less than 0.05%. |
Top Ten Holdings (% of total investments)Footnote Referencea
| Apple, Inc. | 8.3% |
| NVIDIA Corp. | 6.4% |
| Microsoft Corp. | 6.4% |
| Amazon.com, Inc. | 5.5% |
| Meta Platforms, Inc., Class A | 3.8% |
| Alphabet, Inc., Class A | 2.8% |
| Alphabet, Inc., Class C | 2.8% |
| JPMorgan Chase & Co. | 2.1% |
| Netflix, Inc. | 1.7% |
| Berkshire Hathaway, Inc., Class B | 1.7% |
| Total | 41.5% |
| Footnote | Description |
Footnotea | Excluding cash equivalents |
If you wish to view additional information about the Fund, including the prospectus, statement of additional information, financial statements and holdings, please scan the QR code or visit www.eatonvance.com/open-end-mutual-fund-documents.php. For proxy information, please visit www.eatonvance.com/proxyvoting.
The Funds may deliver a single copy of certain required shareholder documents (including prospectuses, shareholder reports, and proxy materials) to investors with the same last name and the same address. Your participation will continue indefinitely unless you instruct otherwise by calling 1-800-262-1122 or by contacting your financial intermediary. Your instruction will typically be effective within 30 days of receipt.
Not FDIC Insured | May Lose Value | No Bank Guarantee
Annual Shareholder Report December 31, 2024
Eaton Vance Tax-Managed Growth Fund 1.2
Annual Shareholder Report December 31, 2024
This annual shareholder report contains important information about the Eaton Vance Tax-Managed Growth Fund 1.2 for the period of January 1, 2024 to December 31, 2024. You can find additional information about the Fund at www.eatonvance.com/open-end-mutual-fund-documents.php. You can also request this information by contacting us at 1-800-262-1122.
What were the Fund costs for the last year?Footnote Reference*
(based on a hypothetical $10,000 investment)
| Class Name | Costs of a $10,000 investment | Costs paid as a percentage of a $10,000 investment |
|---|
| Class I | $70 | 0.62% |
|---|
| Footnote | Description |
Footnote* | Expenses in the table reflect the expenses of both the Fund and the Tax-Managed Growth Portfolio, the Portfolio in which it invests. |
How did the Fund perform last year and what affected its performance?
Key contributors to (↑) and detractors from (↓) performance, relative to the S&P 500® Index (the Index):
↑ An overweight position in online streaming service Netflix Inc. rose in value, driven by better-than-expected subscriber and revenue growth, and higher profits ↑ An overweight position in Meta Platforms Inc. — parent of Facebook and Instagram — grew in value as artificial intelligence (AI) investments drove revenue growth ↑ An overweight position in cloud-networking firm Arista Networks Inc. rose in value as data centers raised spending to meet computing demand from AI applications ↑ Among sectors, stock selections and an overweight exposure to communication services, and stock selections in health care and consumer staples helped returns ↓ An underweight position in electric car maker Tesla Inc. — sold by period-end — hurt returns as its stock price rose over optimism about autonomous vehicles ↓ An underweight position in Broadcom Inc. detracted from returns as its stock price doubled on AI-driven demand for its semiconductor and software products ↓ An overweight position in athletic apparel giant Nike Inc. lost value as the firm had trouble with increased competition and its shift to more wholesale sales ↓ Among sectors, stock selections in industrials, consumer discretionary, and information technology hurt Fund returns relative to the Index during the period
Comparison of the change in value of a $1,000,000 investment for the period indicated.
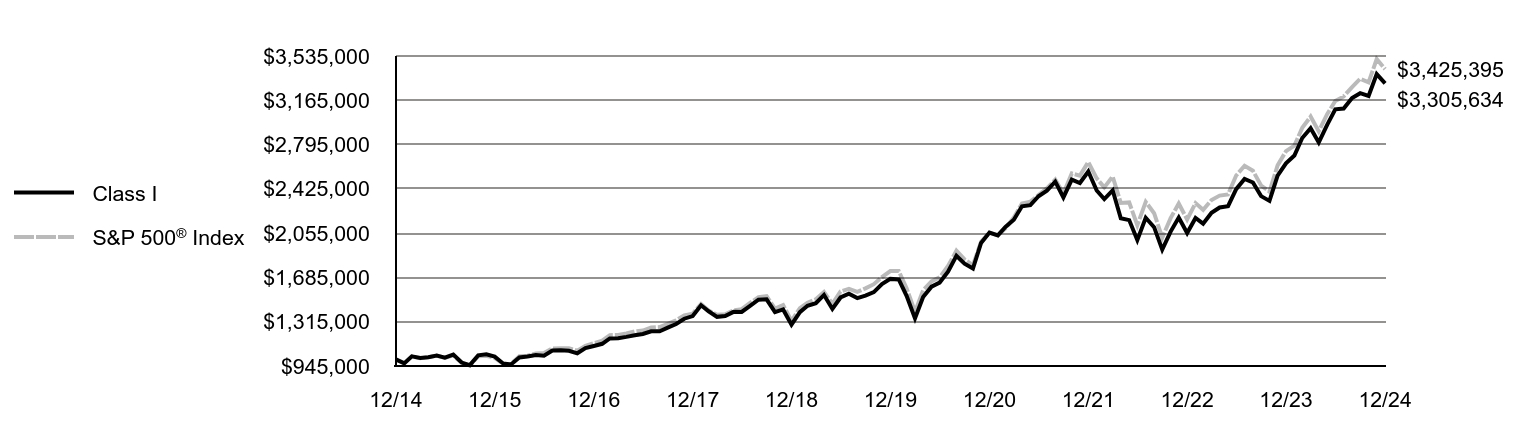
| Class I | S&P 500® Index |
|---|
| 12/14 | $1,000,000 | $1,000,000 |
|---|
| 1/15 | $966,913 | $969,981 |
|---|
| 2/15 | $1,025,668 | $1,025,727 |
|---|
| 3/15 | $1,011,401 | $1,009,506 |
|---|
| 4/15 | $1,018,254 | $1,019,190 |
|---|
| 5/15 | $1,031,937 | $1,032,296 |
|---|
| 6/15 | $1,015,391 | $1,012,313 |
|---|
| 7/15 | $1,039,924 | $1,033,522 |
|---|
| 8/15 | $973,759 | $971,166 |
|---|
| 9/15 | $952,647 | $947,136 |
|---|
| 10/15 | $1,034,217 | $1,027,030 |
|---|
| 11/15 | $1,042,200 | $1,030,085 |
|---|
| 12/15 | $1,022,782 | $1,013,838 |
|---|
| 1/16 | $966,211 | $963,527 |
|---|
| 2/16 | $957,550 | $962,227 |
|---|
| 3/16 | $1,015,841 | $1,027,503 |
|---|
| 4/16 | $1,023,919 | $1,031,487 |
|---|
| 5/16 | $1,037,198 | $1,050,010 |
|---|
| 6/16 | $1,031,420 | $1,052,731 |
|---|
| 7/16 | $1,074,137 | $1,091,544 |
|---|
| 8/16 | $1,076,455 | $1,093,076 |
|---|
| 9/16 | $1,072,409 | $1,093,283 |
|---|
| 10/16 | $1,051,047 | $1,073,340 |
|---|
| 11/16 | $1,094,338 | $1,113,091 |
|---|
| 12/16 | $1,112,507 | $1,135,093 |
|---|
| 1/17 | $1,130,604 | $1,156,621 |
|---|
| 2/17 | $1,175,542 | $1,202,546 |
|---|
| 3/17 | $1,177,283 | $1,203,949 |
|---|
| 4/17 | $1,188,383 | $1,216,313 |
|---|
| 5/17 | $1,202,394 | $1,233,430 |
|---|
| 6/17 | $1,212,908 | $1,241,129 |
|---|
| 7/17 | $1,235,083 | $1,266,650 |
|---|
| 8/17 | $1,235,084 | $1,270,527 |
|---|
| 9/17 | $1,266,020 | $1,296,736 |
|---|
| 10/17 | $1,295,782 | $1,326,995 |
|---|
| 11/17 | $1,340,141 | $1,367,694 |
|---|
| 12/17 | $1,362,151 | $1,382,901 |
|---|
| 1/18 | $1,452,322 | $1,462,078 |
|---|
| 2/18 | $1,402,208 | $1,408,190 |
|---|
| 3/18 | $1,355,629 | $1,372,403 |
|---|
| 4/18 | $1,362,104 | $1,377,669 |
|---|
| 5/18 | $1,397,458 | $1,410,846 |
|---|
| 6/18 | $1,396,859 | $1,419,530 |
|---|
| 7/18 | $1,447,544 | $1,472,355 |
|---|
| 8/18 | $1,498,835 | $1,520,333 |
|---|
| 9/18 | $1,502,385 | $1,528,986 |
|---|
| 10/18 | $1,394,522 | $1,424,480 |
|---|
| 11/18 | $1,417,495 | $1,453,508 |
|---|
| 12/18 | $1,290,518 | $1,322,270 |
|---|
| 1/19 | $1,394,744 | $1,428,231 |
|---|
| 2/19 | $1,448,357 | $1,474,089 |
|---|
| 3/19 | $1,469,782 | $1,502,733 |
|---|
| 4/19 | $1,538,877 | $1,563,578 |
|---|
| 5/19 | $1,421,567 | $1,464,216 |
|---|
| 6/19 | $1,517,465 | $1,567,408 |
|---|
| 7/19 | $1,548,415 | $1,589,935 |
|---|
| 8/19 | $1,512,105 | $1,564,750 |
|---|
| 9/19 | $1,533,561 | $1,594,027 |
|---|
| 10/19 | $1,562,150 | $1,628,553 |
|---|
| 11/19 | $1,630,031 | $1,687,668 |
|---|
| 12/19 | $1,672,744 | $1,738,605 |
|---|
| 1/20 | $1,668,515 | $1,737,924 |
|---|
| 2/20 | $1,530,873 | $1,594,859 |
|---|
| 3/20 | $1,342,748 | $1,397,874 |
|---|
| 4/20 | $1,520,668 | $1,577,072 |
|---|
| 5/20 | $1,607,833 | $1,652,185 |
|---|
| 6/20 | $1,642,086 | $1,685,042 |
|---|
| 7/20 | $1,733,436 | $1,780,054 |
|---|
| 8/20 | $1,866,265 | $1,908,005 |
|---|
| 9/20 | $1,799,542 | $1,835,507 |
|---|
| 10/20 | $1,759,264 | $1,786,694 |
|---|
| 11/20 | $1,973,256 | $1,982,273 |
|---|
| 12/20 | $2,059,622 | $2,058,487 |
|---|
| 1/21 | $2,036,029 | $2,037,705 |
|---|
| 2/21 | $2,107,482 | $2,093,895 |
|---|
| 3/21 | $2,167,392 | $2,185,598 |
|---|
| 4/21 | $2,279,349 | $2,302,241 |
|---|
| 5/21 | $2,289,001 | $2,318,321 |
|---|
| 6/21 | $2,363,442 | $2,372,442 |
|---|
| 7/21 | $2,410,027 | $2,428,799 |
|---|
| 8/21 | $2,485,681 | $2,502,648 |
|---|
| 9/21 | $2,353,740 | $2,386,250 |
|---|
| 10/21 | $2,502,627 | $2,553,435 |
|---|
| 11/21 | $2,473,576 | $2,535,743 |
|---|
| 12/21 | $2,569,732 | $2,649,385 |
|---|
| 1/22 | $2,411,137 | $2,512,287 |
|---|
| 2/22 | $2,340,042 | $2,437,066 |
|---|
| 3/22 | $2,412,959 | $2,527,553 |
|---|
| 4/22 | $2,179,016 | $2,307,145 |
|---|
| 5/22 | $2,163,825 | $2,311,378 |
|---|
| 6/22 | $1,996,722 | $2,120,588 |
|---|
| 7/22 | $2,183,877 | $2,316,116 |
|---|
| 8/22 | $2,104,883 | $2,221,660 |
|---|
| 9/22 | $1,917,729 | $2,017,049 |
|---|
| 10/22 | $2,067,817 | $2,180,352 |
|---|
| 11/22 | $2,185,700 | $2,302,198 |
|---|
| 12/22 | $2,055,609 | $2,169,558 |
|---|
| 1/23 | $2,181,712 | $2,305,880 |
|---|
| 2/23 | $2,134,576 | $2,249,619 |
|---|
| 3/23 | $2,225,175 | $2,332,212 |
|---|
| 4/23 | $2,269,250 | $2,368,614 |
|---|
| 5/23 | $2,280,269 | $2,378,910 |
|---|
| 6/23 | $2,422,900 | $2,536,097 |
|---|
| 7/23 | $2,507,377 | $2,617,569 |
|---|
| 8/23 | $2,477,994 | $2,575,893 |
|---|
| 9/23 | $2,364,133 | $2,453,080 |
|---|
| 10/23 | $2,324,344 | $2,401,500 |
|---|
| 11/23 | $2,534,924 | $2,620,818 |
|---|
| 12/23 | $2,638,723 | $2,739,884 |
|---|
| 1/24 | $2,703,427 | $2,785,925 |
|---|
| 2/24 | $2,850,092 | $2,934,682 |
|---|
| 3/24 | $2,932,051 | $3,029,104 |
|---|
| 4/24 | $2,812,501 | $2,905,381 |
|---|
| 5/24 | $2,959,782 | $3,049,444 |
|---|
| 6/24 | $3,089,191 | $3,158,864 |
|---|
| 7/24 | $3,096,586 | $3,197,315 |
|---|
| 8/24 | $3,184,092 | $3,274,872 |
|---|
| 9/24 | $3,224,147 | $3,344,813 |
|---|
| 10/24 | $3,200,730 | $3,314,481 |
|---|
| 11/24 | $3,383,752 | $3,509,044 |
|---|
| 12/24 | $3,305,634 | $3,425,395 |
|---|
Average Annual Total Returns (%)
| Fund | 1 Year | 5 Years | 10 Years |
|---|
| Class I | 25.27% | 14.58% | 12.69% |
|---|
S&P 500® Index | 25.02% | 14.51% | 13.09% |
|---|
Performance does not reflect the deduction of taxes that a shareholder would pay on Fund distributions or redemption of Fund shares. Performance assumes that all dividends and distributions, if any, were reinvested. For more recent performance information, visit www.eatonvance.com/performance.php.
THE FUND'S PAST PERFORMANCE IS NO GUARANTEE OF FUTURE RESULTS.
| Total Net Assets | $1,519,803,404 |
|---|
| # of Portfolio Holdings (for Tax-Managed Growth Portfolio) | 143 |
|---|
| Portfolio Turnover Rate (for Tax-Managed Growth Portfolio) | 7% |
|---|
| Total Advisory Fees Paid | $5,697,365 |
|---|
What did the Fund invest in?
The following tables reflect what the Fund invested in as of the report date.
References to the Fund's investments are to the Fund's pro rata share of Tax-Managed Growth Portfolio, an affiliated investment company in which the Fund invests substantially all of its assests.
Sector Allocation (% of total investments)
| Value | Value |
|---|
| Other | 0.0%Footnote Reference* |
| Real Estate | 0.3% |
| Utilities | 0.8% |
| Materials | 1.8% |
| Energy | 2.9% |
| Consumer Staples | 5.7% |
| Industrials | 8.3% |
| Health Care | 10.8% |
| Consumer Discretionary | 11.3% |
| Communication Services | 12.5% |
| Financials | 13.7% |
| Information Technology | 31.9% |
| Footnote | Description |
Footnote* | Amount is less than 0.05%. |
Top Ten Holdings (% of total investments)Footnote Referencea
| Apple, Inc. | 8.3% |
| NVIDIA Corp. | 6.4% |
| Microsoft Corp. | 6.4% |
| Amazon.com, Inc. | 5.5% |
| Meta Platforms, Inc., Class A | 3.8% |
| Alphabet, Inc., Class A | 2.8% |
| Alphabet, Inc., Class C | 2.8% |
| JPMorgan Chase & Co. | 2.1% |
| Netflix, Inc. | 1.7% |
| Berkshire Hathaway, Inc., Class B | 1.7% |
| Total | 41.5% |
| Footnote | Description |
Footnotea | Excluding cash equivalents |
If you wish to view additional information about the Fund, including the prospectus, statement of additional information, financial statements and holdings, please scan the QR code or visit www.eatonvance.com/open-end-mutual-fund-documents.php. For proxy information, please visit www.eatonvance.com/proxyvoting.
The Funds may deliver a single copy of certain required shareholder documents (including prospectuses, shareholder reports, and proxy materials) to investors with the same last name and the same address. Your participation will continue indefinitely unless you instruct otherwise by calling 1-800-262-1122 or by contacting your financial intermediary. Your instruction will typically be effective within 30 days of receipt.
Not FDIC Insured | May Lose Value | No Bank Guarantee
Annual Shareholder Report December 31, 2024
The registrant (sometimes referred to as the “Fund”) has adopted a code of ethics applicable to its Principal Executive Officer, Principal Financial Officer and Principal Accounting Officer. The registrant undertakes to provide a copy of such code of ethics to any person upon request, without charge, by calling 1-800-262-1122. The registrant has not amended the code of ethics as described in Form N-CSR during the period covered by this report. The registrant has not granted any waiver, including an implicit waiver, from a provision of the code of ethics as described in Form N-CSR during the period covered by this report.
| Item 3. | Audit Committee Financial Expert |
The registrant’s Board of Trustees (the “Board”) has designated George J. Gorman and Scott E. Wennerholm, each an independent trustee, as audit committee financial experts. Mr. Gorman is a certified public accountant who is the Principal at George J. Gorman LLC (a consulting firm). Previously, Mr. Gorman served in various capacities at Ernst & Young LLP (a registered public accounting firm), including as Senior Partner. Mr. Gorman also has experience serving as an independent trustee and audit committee financial expert of other mutual fund complexes. Mr. Wennerholm is a private investor. Previously, Mr. Wennerholm served as a Trustee at Wheelock College (postsecondary institution), as a Consultant at GF Parish Group (executive recruiting firm), Chief Operating Officer and Executive Vice President at BNY Mellon Asset Management (investment management firm), Chief Operating Officer and Chief Financial Officer at Natixis Global Asset Management (investment management firm), and Vice President at Fidelity Investments Institutional Services (investment management firm).
| Item 4. | Principal Accountant Fees and Services |
Parametric Commodity Strategy Fund, Eaton Vance Stock Fund, Eaton Vance Tax-Managed Growth Fund 1.1 and Eaton Vance Tax-Managed Growth Fund 1.2 (the “Fund(s)”) are series of Eaton Vance Mutual Funds Trust (the “Trust”), a Massachusetts business trust, which, including the Funds, contains a total of 30 series (the “Series”). The Trust is registered under the Investment Company Act of 1940 as an open-end management investment company. This Form N-CSR relates to the Funds’ annual reports.
(a)-(d)
The following tables present the aggregate fees billed to each Fund for each Fund’s fiscal years ended December 31, 2023 and December 31, 2024 by the registrant’s principal accountant, Deloitte & Touche LLP (“D&T”), for professional services rendered for the audit of the Funds’ annual financial statements and fees billed for other services rendered by D&T during those periods.
Parametric Commodity Strategy Fund
| | | | | | | | |
Fiscal Years Ended | | 12/31/23 | | | 12/31/24 | |
Audit Fees | | $ | 79,100 | | | $ | 75,900 | |
Audit-Related Fees(1) | | $ | 0 | | | $ | 0 | |
Tax Fees(2) | | $ | 0 | | | $ | 0 | |
All Other Fees(3) | | $ | 0 | | | $ | 0 | |
| | | | | | | | |
Total | | $ | 79,100 | | | $ | 75,900 | |
| | | | | | | | |
Eaton Vance Stock Fund
| | | | | | | | |
Fiscal Years Ended | | 12/31/23 | | | 12/31/24 | |
Audit Fees | | $ | 19,100 | | | $ | 23,700 | |
Audit-Related Fees(1) | | $ | 0 | | | $ | 0 | |
Tax Fees(2) | | $ | 0 | | | $ | 0 | |
All Other Fees(3) | | $ | 0 | | | $ | 0 | |
| | | | | | | | |
Total | | $ | 19,100 | | | $ | 23,700 | |
| | | | | | | | |
Eaton Vance Tax-Managed Growth Fund 1.1
| | | | | | | | |
Fiscal Years Ended | | 12/31/23 | | | 12/31/24 | |
Audit Fees | | $ | 22,100 | | | $ | 25,800 | |
Audit-Related Fees(1) | | $ | 0 | | | $ | 0 | |
Tax Fees(2) | | $ | 0 | | | $ | 0 | |
All Other Fees(3) | | $ | 0 | | | $ | 0 | |
| | | | | | | | |
Total | | $ | 22,100 | | | $ | 25,800 | |
| | | | | | | | |
Eaton Vance Tax-Managed Growth Fund 1.2
| | | | | | | | |
Fiscal Years Ended | | 12/31/23 | | | 12/31/24 | |
Audit Fees | | $ | 22,100 | | | $ | 25,800 | |
Audit-Related Fees(1) | | $ | 0 | | | $ | 0 | |
Tax Fees(2) | | $ | 0 | | | $ | 0 | |
All Other Fees(3) | | $ | 0 | | | $ | 0 | |
| | | | | | | | |
Total | | $ | 22,100 | | | $ | 25,800 | |
| | | | | | | | |
| (1) | Audit-related fees consist of the aggregate fees billed for assurance and related services that are reasonably related to the performance of the audit of the registrant’s financial statements and are not reported under the category of audit fees. |
| (2) | Tax fees consist of the aggregate fees billed for professional services rendered by the principal accountant relating to tax compliance, tax advice, and tax planning and specifically include fees for tax return preparation and other related tax compliance/planning matters. |
| (3) | All other fees consist of the aggregate fees billed for products and services provided by the principal accountant other than audit, audit-related, and tax services. |
The various Series comprising the Trust have varying fiscal year ends (January 31, February 28/29, September 30, October 31, or December 31). The following table presents the aggregate audit, audit-related, tax, and other fees billed to all of the Series in the Trust by D&T for the last two fiscal years of each Series.
| | | | | | | | | | | | | | | | | | | | | | | | | | | | | | | | | | | | | | | | |
Fiscal Years Ended | | 1/31/23 | | | 2/28/23 | | | 9/30/23 | | | 10/31/23 | | | 12/31/23 | | | 1/31/24 | | | 2/29/24 | | | 9/30/24 | | | 10/31/24 | | | 12/31/24 | |
Audit Fees | | $ | 172,250 | | | $ | 27,150 | | | $ | 117,600 | | | $ | 828,300 | | | $ | 142,400 | | | $ | 166,600 | | | $ | 27,600 | | | $ | 131,767 | | | $ | 854,800 | | | $ | 151,200 | |
Audit-Related Fees(1) | | $ | 0 | | | $ | 0 | | | $ | 0 | | | $ | 0 | | | $ | 0 | | | $ | 0 | | | $ | 0 | | | $ | 0 | | | $ | 0 | | | $ | 0 | |
Tax Fees(2) | | $ | 14,695 | | | $ | 1,650 | | | $ | 0 | | | $ | 0 | | | $ | 0 | | | $ | 0 | | | $ | 0 | | | $ | 0 | | | $ | 0 | | | $ | 0 | |
All Other Fees(3) | | $ | 0 | | | $ | 0 | | | $ | 0 | | | $ | 5,566 | | | $ | 0 | | | $ | 0 | | | $ | 0 | | | $ | 0 | | | $ | 0 | | | $ | 0 | |
| | | | | | | | | | | | | | | | | | | | | | | | | | | | | | | | | | | | | | | | |
Total | | $ | 186,945 | | | $ | 28,800 | | | $ | 117,600 | | | $ | 833,866 | | | $ | 142,400 | | | $ | 166,600 | | | $ | 27,600 | | | $ | 131,767 | | | $ | 854,800 | | | $ | 151,200 | |
| | | | | | | | | | | | | | | | | | | | | | | | | | | | | | | | | | | | | | | | |
| (1) | Audit-related fees consist of the aggregate fees billed for assurance and related services that are reasonably related to the performance of the audit of the registrant’s financial statements and are not reported under the category of audit fees. |
| (2) | Tax fees consist of the aggregate fees billed for professional services rendered by the principal accountant relating to tax compliance, tax advice, and tax planning and specifically include fees for tax return preparation and other related tax compliance/planning matters. |
| (3) | All other fees consist of the aggregate fees billed for products and services provided by the principal accountant other than audit, audit-related, and tax services. |
(e)(1) The registrant’s audit committee has adopted policies and procedures relating to the pre-approval of services provided by the registrant’s principal accountant (the “Pre-Approval Policies”). The Pre-Approval Policies establish a framework intended to assist the audit committee in the proper discharge of its pre-approval responsibilities. As a general matter, the Pre-Approval Policies (i) specify certain types of audit, audit-related, tax, and other services determined to be pre-approved by the audit committee; and (ii) delineate specific procedures governing the mechanics of the pre-approval process, including the approval and monitoring of audit and non-audit service fees. Unless a service is specifically pre-approved under the Pre-Approval Policies, it must be separately pre-approved by the audit committee.
The Pre-Approval Policies and the types of audit and non-audit services pre-approved therein must be reviewed and ratified by the registrant’s audit committee at least annually. The registrant’s audit committee maintains full responsibility for the appointment, compensation, and oversight of the work of the registrant’s principal accountant.
(e)(2) No services described in paragraphs (b)-(d) above were approved by the registrant’s audit committee pursuant to the “de minimis exception” set forth in Rule 2-01(c)(7)(i)(C) of Regulation S-X.
(f) Not applicable.
(g) The following table presents (i) the aggregate non-audit fees (i.e., fees for audit-related, tax, and other services) billed for services rendered to all of the Series in the Trust by D&T for the last two fiscal years of each Series; and (ii) the aggregate non-audit fees (i.e., fees for audit-related, tax, and other services) billed for services rendered to the Eaton Vance organization by D&T for the last 2 fiscal years of each Series.
| | | | | | | | | | | | | | | | | | | | | | | | | | | | | | | | | | | | | | | | |
Fiscal Years Ended | | 1/31/23 | | | 2/28/23 | | | 9/30/23 | | | 10/31/23 | | | 12/31/23 | | | 1/31/24 | | | 2/29/24 | | | 9/30/24 | | | 10/31/24 | | | 12/31/24 | |
Registrant(1) | | $ | 14,695 | | | $ | 1,650 | | | $ | 0 | | | $ | 5,566 | | | $ | 0 | | | $ | 0 | | | $ | 0 | | | $ | 0 | | | $ | 0 | | | $ | 0 | |
Eaton Vance(2) | | $ | 52,836 | | | $ | 52,836 | | | $ | 52,836 | | | $ | 52,836 | | | $ | 52,836 | | | $ | 52,836 | | | $ | 52,836 | | | $ | 18,490 | | | $ | 18,490 | | | $ | 18,490 | |
| (1) | Includes all of the Series of the Trust. During the fiscal years reported above, certain of the Funds were “feeder” funds in a “master-feeder” fund structure or funds of funds. |
| (2) | Various subsidiaries of Morgan Stanley act in either an investment advisory and/or service provider capacity with respect to the Series and/or their respective “master” funds (if applicable). |
(h) The registrant’s audit committee has considered whether the provision by the registrant’s principal accountant of non-audit services to the registrant’s investment adviser and any entity controlling, controlled by, or under common control with the adviser that provides ongoing services to the registrant that were not pre-approved pursuant to Rule 2-01(c)(7)(ii) of Regulation S-X is compatible with maintaining the principal accountant’s independence.
(i) Not applicable.
(j) Not applicable.
| Item 5. | Audit Committee of Listed Registrants |
Not applicable.
| Item 6. | Schedule of Investments |
| (a) | Please see schedule of investments contained in the Financial Statements and Financial Highlights included under Item 7 of this Form N-CSR. |
| Item 7. | Financial Statements and Financial Highlights for Open-End Management Investment Companies |
Eaton Vance
Stock Fund
Annual Financial Statements and
Additional Information
December 31, 2024
This report must be preceded or accompanied by a current summary prospectus or prospectus. Before investing, investors should consider carefully the investment objective, risks, and charges and expenses of a mutual fund. This and other important information is contained in the prospectus and/or statement of additional information, which can be obtained by calling 1-800-262-1122 or from a financial intermediary. Prospective investors should read the prospectus carefully before investing.
Annual Financial Statements and Additional Information December 31, 2024
Eaton Vance
Stock Fund
Items 8, 9 and 11 of Form N-CSR are Not Applicable. For Item 10 of Form N-CSR, see Item 7.
Eaton Vance
Stock Fund
December 31, 2024
Statement of Assets and Liabilities
| | December 31, 2024 |
| Assets | |
| Investment in Stock Portfolio, at value (identified cost $43,346,552) | $98,552,832 |
| Receivable for Fund shares sold | 87,553 |
| Receivable from affiliates | 16,448 |
| Total assets | $98,656,833 |
| Liabilities | |
| Payable for Fund shares redeemed | $36,308 |
| Payable to affiliates: | |
| Distribution and service fees | 18,252 |
| Trustees' fees | 125 |
| Payable for custodian fee | 10,538 |
| Payable for transfer and dividend disbursing agent fees | 12,125 |
| Payable for legal and accounting services | 31,866 |
| Payable for printing and postage | 7,559 |
| Accrued expenses | 789 |
| Total liabilities | $117,562 |
| Net Assets | $98,539,271 |
| Sources of Net Assets | |
| Paid-in capital | $62,712,558 |
| Distributable earnings | 35,826,713 |
| Net Assets | $98,539,271 |
| Class A Shares | |
| Net Assets | $67,593,791 |
| Shares Outstanding | 3,210,480 |
Net Asset Value and Redemption Price Per Share
(net assets ÷ shares of beneficial interest outstanding) | $21.05 |
Maximum Offering Price Per Share
(100 ÷ 94.75 of net asset value per share) | $22.22 |
| Class C Shares | |
| Net Assets | $4,237,330 |
| Shares Outstanding | 216,514 |
Net Asset Value and Offering Price Per Share*
(net assets ÷ shares of beneficial interest outstanding) | $19.57 |
| Class I Shares | |
| Net Assets | $26,708,150 |
| Shares Outstanding | 1,263,593 |
Net Asset Value, Offering Price and Redemption Price Per Share
(net assets ÷ shares of beneficial interest outstanding) | $21.14 |
| On sales of $50,000 or more, the offering price of Class A shares is reduced. |
| * | Redemption price per share is equal to the net asset value less any applicable contingent deferred sales charge. |
1
See Notes to Financial Statements.
Eaton Vance
Stock Fund
December 31, 2024
| | Year Ended |
| | December 31, 2024 |
| Investment Income | |
| Dividend income allocated from Portfolio (net of foreign taxes withheld of $4,045) | $839,054 |
| Expenses allocated from Portfolio | (600,519) |
| Total investment income from Portfolio | $238,535 |
| Expenses | |
| Distribution and service fees: | |
| Class A | $156,158 |
| Class C | 44,098 |
| Trustees’ fees and expenses | 500 |
| Custodian fee | 18,034 |
| Transfer and dividend disbursing agent fees | 51,662 |
| Legal and accounting services | 38,538 |
| Printing and postage | 10,284 |
| Registration fees | 57,580 |
| Miscellaneous | 11,546 |
| Total expenses | $388,400 |
| Deduct: | |
| Waiver and/or reimbursement of expenses by affiliates | $97,178 |
| Total expense reductions | $97,178 |
| Net expenses | $291,222 |
| Net investment loss | $(52,687) |
| Realized and Unrealized Gain (Loss) from Portfolio | |
| Net realized gain (loss): | |
| Investment transactions | $9,334,194 |
| Foreign currency transactions | (6) |
| Net realized gain | $9,334,188 |
| Change in unrealized appreciation (depreciation): | |
| Investments | $15,162,608 |
| Foreign currency | (19) |
| Net change in unrealized appreciation (depreciation) | $15,162,589 |
| Net realized and unrealized gain | $24,496,777 |
| Net increase in net assets from operations | $24,444,090 |
2
See Notes to Financial Statements.
Eaton Vance
Stock Fund
December 31, 2024
Statements of Changes in Net Assets
| | Year Ended December 31, |
| | 2024 | 2023 |
| Increase (Decrease) in Net Assets | | |
| From operations: | | |
| Net investment income (loss) | $(52,687) | $210,063 |
| Net realized gain | 9,334,188 | 6,121,054 |
| Net change in unrealized appreciation (depreciation) | 15,162,589 | 10,129,030 |
| Net increase in net assets from operations | $24,444,090 | $16,460,147 |
| Distributions to shareholders: | | |
| Class A | $(8,836,063) | $(8,061,895) |
| Class C | (557,293) | (777,005) |
| Class I | (3,460,762) | (3,368,037) |
| Total distributions to shareholders | $(12,854,118) | $(12,206,937) |
| Transactions in shares of beneficial interest: | | |
| Class A | $8,093,276 | $3,221,556 |
| Class C | (1,405,403) | (878,150) |
| Class I | 777,609 | (1,183,453) |
| Net increase in net assets from Fund share transactions | $7,465,482 | $1,159,953 |
| Net increase in net assets | $19,055,454 | $5,413,163 |
| Net Assets | | |
| At beginning of year | $79,483,817 | $74,070,654 |
| At end of year | $98,539,271 | $79,483,817 |
3
See Notes to Financial Statements.
Eaton Vance
Stock Fund
December 31, 2024
| | Class A |
| | Year Ended December 31, |
| | 2024 | 2023 | 2022 | 2021 | 2020 |
| Net asset value — Beginning of year | $18.50 | $17.51 | $24.12 | $22.12 | $19.11 |
| Income (Loss) From Operations | | | | | |
| Net investment income (loss)(1) | $(0.02) | $0.05 | $0.10 | $0.05 | $0.10 |
| Net realized and unrealized gain (loss) | 5.66 | 4.14 | (4.17) | 4.96 | 3.34 |
| Total income (loss) from operations | $5.64 | $4.19 | $(4.07) | $5.01 | $3.44 |
| Less Distributions | | | | | |
| From net investment income | $— | $(0.04) | $(0.12) | $(0.10) | $(0.04) |
| From net realized gain | (3.09) | (3.16) | (2.42) | (2.91) | (0.39) |
| Total distributions | $(3.09) | $(3.20) | $(2.54) | $(3.01) | $(0.43) |
| Portfolio transaction fee, net(1) | $— | $— | $0.00(2) | $0.00(2) | $(0.00)(2) |
| Net asset value — End of year | $21.05 | $18.50 | $17.51 | $24.12 | $22.12 |
| Total Return(3) | 30.54% | 24.02% | (16.78)% | 22.78% | 18.22% |
| Ratios/Supplemental Data | | | | | |
| Net assets, end of year (000’s omitted) | $67,594 | $52,274 | $46,464 | $61,304 | $60,148 |
| Ratios (as a percentage of average daily net assets):(4)(5) | | | | | |
| Total expenses | 1.08% | 1.11% | 1.11% | 1.05% | 1.08% |
| Net expenses | 0.98%(6) | 0.98%(6) | 0.98%(6) | 0.98% | 0.98% |
| Net investment income (loss) | (0.09)% | 0.26% | 0.49% | 0.20% | 0.51% |
| Portfolio Turnover of the Portfolio | 44% | 44% | 52% | 44% | 70% |
| (1) | Computed using average shares outstanding. |
| (2) | Amount is less than $0.005 or $(0.005), as applicable. |
| (3) | Returns are historical and are calculated by determining the percentage change in net asset value with all distributions reinvested and do not reflect the effect of sales charges. |
| (4) | Total expenses do not reflect amounts reimbursed and/or waived by the adviser and administrator and certain of its affiliates, if applicable. Net expenses are net of all reductions and represent the net expenses paid by the Fund. |
| (5) | Includes the Fund’s share of the Portfolio’s allocated expenses. |
| (6) | Includes a reduction by the investment adviser of a portion of the Portfolio’s adviser fee due to the Portfolio’s investment in the Liquidity Fund (equal to less than 0.005% of average daily net assets for the years ended December 31, 2024, 2023 and 2022). |
4
See Notes to Financial Statements.
Eaton Vance
Stock Fund
December 31, 2024
Financial Highlights — continued
| | Class C |
| | Year Ended December 31, |
| | 2024 | 2023 | 2022 | 2021 | 2020 |
| Net asset value — Beginning of year | $17.49 | $16.79 | $23.23 | $21.40 | $18.61 |
| Income (Loss) From Operations | | | | | |
| Net investment loss(1) | $(0.17) | $(0.09) | $(0.05) | $(0.13) | $(0.04) |
| Net realized and unrealized gain (loss) | 5.34 | 3.95 | (4.01) | 4.79 | 3.23 |
| Total income (loss) from operations | $5.17 | $3.86 | $(4.06) | $4.66 | $3.19 |
| Less Distributions | | | | | |
| From net investment income | $— | $— | $— | $— | $(0.01) |
| From net realized gain | (3.09) | (3.16) | (2.38) | (2.83) | (0.39) |
| Total distributions | $(3.09) | $(3.16) | $(2.38) | $(2.83) | $(0.40) |
| Portfolio transaction fee, net(1) | $— | $— | $0.00(2) | $0.00(2) | $(0.00)(2) |
| Net asset value — End of year | $19.57 | $17.49 | $16.79 | $23.23 | $21.40 |
| Total Return(3) | 29.61% | 23.13% | (17.46)% | 21.88% | 17.36% |
| Ratios/Supplemental Data | | | | | |
| Net assets, end of year (000’s omitted) | $4,237 | $5,027 | $5,579 | $7,418 | $6,728 |
| Ratios (as a percentage of average daily net assets):(4)(5) | | | | | |
| Total expenses | 1.83% | 1.86% | 1.86% | 1.80% | 1.83% |
| Net expenses | 1.73%(6) | 1.73%(6) | 1.73%(6) | 1.73% | 1.73% |
| Net investment loss | (0.85)% | (0.49)% | (0.27)% | (0.55)% | (0.22)% |
| Portfolio Turnover of the Portfolio | 44% | 44% | 52% | 44% | 70% |
| (1) | Computed using average shares outstanding. |
| (2) | Amount is less than $0.005 or $(0.005), as applicable. |
| (3) | Returns are historical and are calculated by determining the percentage change in net asset value with all distributions reinvested and do not reflect the effect of sales charges. |
| (4) | Total expenses do not reflect amounts reimbursed and/or waived by the adviser and administrator and certain of its affiliates, if applicable. Net expenses are net of all reductions and represent the net expenses paid by the Fund. |
| (5) | Includes the Fund’s share of the Portfolio’s allocated expenses. |
| (6) | Includes a reduction by the investment adviser of a portion of the Portfolio’s adviser fee due to the Portfolio’s investment in the Liquidity Fund (equal to less than 0.005% of average daily net assets for the years ended December 31, 2024, 2023 and 2022). |
5
See Notes to Financial Statements.
Eaton Vance
Stock Fund
December 31, 2024
Financial Highlights — continued
| | Class I |
| | Year Ended December 31, |
| | 2024 | 2023 | 2022 | 2021 | 2020 |
| Net asset value — Beginning of year | $18.52 | $17.52 | $24.14 | $22.13 | $19.11 |
| Income (Loss) From Operations | | | | | |
| Net investment income(1) | $0.03 | $0.10 | $0.15 | $0.11 | $0.15 |
| Net realized and unrealized gain (loss) | 5.68 | 4.15 | (4.18) | 4.97 | 3.35 |
| Total income (loss) from operations | $5.71 | $4.25 | $(4.03) | $5.08 | $3.50 |
| Less Distributions | | | | | |
| From net investment income | $— | $(0.09) | $(0.17) | $(0.16) | $(0.09) |
| From net realized gain | (3.09) | (3.16) | (2.42) | (2.91) | (0.39) |
| Total distributions | $(3.09) | $(3.25) | $(2.59) | $(3.07) | $(0.48) |
| Portfolio transaction fee, net(1) | $— | $— | $0.00(2) | $0.00(2) | $(0.00)(2) |
| Net asset value — End of year | $21.14 | $18.52 | $17.52 | $24.14 | $22.13 |
| Total Return(3) | 30.89% | 24.41% | (16.62)% | 23.12% | 18.52% |
| Ratios/Supplemental Data | | | | | |
| Net assets, end of year (000’s omitted) | $26,708 | $22,182 | $22,027 | $32,558 | $40,943 |
| Ratios (as a percentage of average daily net assets):(4)(5) | | | | | |
| Total expenses | 0.83% | 0.86% | 0.86% | 0.80% | 0.83% |
| Net expenses | 0.73%(6) | 0.73%(6) | 0.73%(6) | 0.73% | 0.73% |
| Net investment income | 0.15% | 0.51% | 0.73% | 0.45% | 0.76% |
| Portfolio Turnover of the Portfolio | 44% | 44% | 52% | 44% | 70% |
| (1) | Computed using average shares outstanding. |
| (2) | Amount is less than $0.005 or $(0.005), as applicable. |
| (3) | Returns are historical and are calculated by determining the percentage change in net asset value with all distributions reinvested. |
| (4) | Total expenses do not reflect amounts reimbursed and/or waived by the adviser and administrator and certain of its affiliates, if applicable. Net expenses are net of all reductions and represent the net expenses paid by the Fund. |
| (5) | Includes the Fund’s share of the Portfolio’s allocated expenses. |
| (6) | Includes a reduction by the investment adviser of a portion of the Portfolio’s adviser fee due to the Portfolio’s investment in the Liquidity Fund (equal to less than 0.005% of average daily net assets for the years ended December 31, 2024, 2023 and 2022). |
6
See Notes to Financial Statements.
Eaton Vance
Stock Fund
December 31, 2024
Notes to Financial Statements
1 Significant Accounting Policies
Eaton Vance Stock Fund (the Fund) is a diversified series of Eaton Vance Mutual Funds Trust (the Trust). The Trust is a Massachusetts business trust registered under the Investment Company Act of 1940, as amended (the 1940 Act), as an open-end management investment company. The Fund offers three classes of shares. Class A shares are generally sold subject to a sales charge imposed at time of purchase. Class C shares are sold at net asset value and are generally subject to a contingent deferred sales charge (see Note 5). Effective November 5, 2020, Class C shares automatically convert to Class A shares eight years after their purchase as described in the Fund’s prospectus. Class I shares are sold at net asset value and are not subject to a sales charge. Each class represents a pro rata interest in the Fund, but votes separately on class-specific matters and (as noted below) is subject to different expenses. Realized and unrealized gains and losses and net investment income and losses, other than class-specific expenses, are allocated daily to each class of shares based on the relative net assets of each class to the total net assets of the Fund. Each class of shares differs in its distribution plan and certain other class-specific expenses. The Fund invests all of its investable assets in interests in Stock Portfolio (the Portfolio), a Massachusetts business trust, having the same investment objective and policies as the Fund. The value of the Fund’s investment in the Portfolio reflects the Fund’s proportionate interest in the net assets of the Portfolio (13.2% at December 31, 2024). The performance of the Fund is directly affected by the performance of the Portfolio. The financial statements of the Portfolio, including the portfolio of investments, are included elsewhere in this report and should be read in conjunction with the Fund’s financial statements.
The following is a summary of significant accounting policies of the Fund. The policies are in conformity with accounting principles generally accepted in the United States of America (U.S. GAAP). The Fund is an investment company and follows accounting and reporting guidance in the Financial Accounting Standards Board (FASB) Accounting Standards Codification Topic 946.
A Investment Valuation—Valuation of securities by the Portfolio is discussed in Note 1A of the Portfolio's Notes to Financial Statements, which are included elsewhere in this report.
B Income—The Fund's net investment income or loss consists of the Fund's pro rata share of the net investment income or loss of the Portfolio, less all actual and accrued expenses of the Fund.
C Federal Taxes—The Fund’s policy is to comply with the provisions of the Internal Revenue Code applicable to regulated investment companies and to distribute to shareholders each year substantially all of its net investment income, and all or substantially all of its net realized capital gains. Accordingly, no provision for federal income or excise tax is necessary.
As of December 31, 2024, the Fund had no uncertain tax positions that would require financial statement recognition, de-recognition, or disclosure. The Fund files a U.S. federal income tax return annually after its fiscal year-end, which is subject to examination by the Internal Revenue Service for a period of three years from the date of filing.
D Expenses—The majority of expenses of the Trust are directly identifiable to an individual fund. Expenses which are not readily identifiable to a specific fund are allocated taking into consideration, among other things, the nature and type of expense and the relative size of the funds.
E Use of Estimates—The preparation of the financial statements in conformity with U.S. GAAP requires management to make estimates and assumptions that affect the reported amounts of assets and liabilities at the date of the financial statements and the reported amounts of income and expense during the reporting period. Actual results could differ from those estimates.
F Indemnifications—Under the Trust’s organizational documents, its officers and Trustees may be indemnified against certain liabilities and expenses arising out of the performance of their duties to the Fund. Under Massachusetts law, if certain conditions prevail, shareholders of a Massachusetts business trust (such as the Trust) could be deemed to have personal liability for the obligations of the Trust. However, the Trust’s Declaration of Trust contains an express disclaimer of liability on the part of Fund shareholders and the By-laws provide that the Trust shall assume, upon request by the shareholder, the defense on behalf of any Fund shareholders. Moreover, the By-laws also provide for indemnification out of Fund property of any shareholder held personally liable solely by reason of being or having been a shareholder for all loss or expense arising from such liability. Additionally, in the normal course of business, the Fund enters into agreements with service providers that may contain indemnification clauses. The Fund's maximum exposure under these arrangements is unknown as this would involve future claims that may be made against the Fund that have not yet occurred.
G Other—Investment transactions are accounted for on a trade date basis.
H Segment Reporting—During the year ended December 31, 2024, the Fund adopted FASB Accounting Standards Update No. 2023-07, Segment Reporting (Topic 280): Improvements to Reportable Segment Disclosures, (ASU 2023-07), which requires incremental disclosures related to a public entity’s reportable segments. The Fund operates as a single reportable segment, an investment company whose investment objective is included in Note 1. In connection with the adoption of ASU 2023-07, the Fund’s President has been designated as the Fund’s Chief Operating Decision Maker (CODM), who is responsible for assessing the performance of the Fund’s single segment and deciding how to allocate the segment’s resources. To perform this function, the CODM reviews the information in the Fund’s Financial Statements.
Eaton Vance
Stock Fund
December 31, 2024
Notes to Financial Statements — continued
2 Distributions to Shareholders and Income Tax Information
It is the present policy of the Fund to make at least one distribution annually (normally in December) of all or substantially all of its net investment income and to distribute annually all or substantially all of its net realized capital gains. Distributions to shareholders are recorded on the ex-dividend date. Distributions are declared separately for each class of shares. Shareholders may reinvest income and capital gain distributions in additional shares of the same class of the Fund at the net asset value as of the ex-dividend date or, at the election of the shareholder, receive distributions in cash. Distributions to shareholders are determined in accordance with income tax regulations, which may differ from U.S. GAAP. As required by U.S. GAAP, only distributions in excess of tax basis earnings and profits are reported in the financial statements as a return of capital. Permanent differences between book and tax accounting relating to distributions are reclassified to paid-in capital. For tax purposes, distributions from short-term capital gains are considered to be from ordinary income.
The tax character of distributions declared for the years ended December 31, 2024 and December 31, 2023 was as follows:
| | Year Ended December 31, |
| | 2024 | 2023 |
| Ordinary income | $172,009 | $200,302 |
| Long-term capital gains | $12,682,109 | $12,006,635 |
During the year ended December 31, 2024, distributable earnings was decreased by $2,536,994 and paid-in capital was increased by $2,536,994 due to the Fund’s use of equalization accounting. Tax equalization accounting allows the Fund to treat as a distribution that portion of redemption proceeds representing a redeeming shareholder’s portion of undistributed taxable income and net capital gains. These reclassifications had no effect on the net assets or net asset value per share of the Fund.
As of December 31, 2024, the components of distributable earnings (accumulated loss) on a tax basis were as follows:
| Undistributed ordinary income | $ 142,012 |
| Undistributed long-term capital gains | 2,761,656 |
| Net unrealized appreciation | 32,923,045 |
| Distributable earnings | $35,826,713 |
3 Investment Adviser Fee and Other Transactions with Affiliates
The investment adviser fee is earned by Eaton Vance Management (EVM), an indirect, wholly-owned subsidiary of Morgan Stanley, as compensation for investment advisory services rendered to the Fund. The investment adviser fee is computed at an annual rate as a percentage of the Fund’s average daily net assets that are not invested in other investment companies for which EVM or its affiliates serve as investment adviser and receive an advisory fee as follows and is payable monthly:
| Average Daily Net Assets | Annual Fee Rate |
| Up to $500 million | 0.600% |
| $500 million but less than $1 billion | 0.575% |
| $1 billion but less than $2.5 billion | 0.550% |
| $2.5 billion but less than $5 billion | 0.530% |
| $5 billion and over | 0.515% |
For the year ended December 31, 2024, the Fund incurred no investment adviser fee on such assets. To the extent that the Fund’s assets are invested in the Portfolio, the Fund is allocated its share of the Portfolio’s investment adviser fee. The Portfolio has engaged Boston Management and Research (BMR) to render investment advisory services. See Note 2 of the Portfolio’s Notes to Financial Statements which are included elsewhere in this report. EVM also serves as the administrator of the Fund, but receives no compensation.
Eaton Vance
Stock Fund
December 31, 2024
Notes to Financial Statements — continued
EVM has agreed to reimburse the Fund’s expenses to the extent that total annual operating expenses (relating to ordinary operating expenses only and excluding such expenses as brokerage commissions, acquired fund fees and expenses of unaffiliated funds, borrowing costs, taxes or litigation expenses) exceed 0.98%, 1.73% and 0.73% of the Fund’s average daily net assets for Class A, Class C and Class I, respectively. This agreement may be changed or terminated after May 1, 2025. Pursuant to this agreement, EVM waived and/or reimbursed $97,178 of the Fund’s operating expenses for the year ended December 31, 2024.
EVM provides sub-transfer agency and related services to the Fund pursuant to a Sub-Transfer Agency Support Services Agreement. For the year ended December 31, 2024, EVM earned $11,131 from the Fund pursuant to such agreement, which is included in transfer and dividend disbursing agent fees on the Statement of Operations. The Fund was informed that Eaton Vance Distributors, Inc. (EVD), an affiliate of EVM and the Fund’s principal underwriter, received $5,469 as its portion of the sales charge on sales of Class A shares for the year ended December 31, 2024. EVD also received distribution and service fees from Class A and Class C shares (see Note 4) and contingent deferred sales charges (see Note 5).
Trustees and officers of the Fund who are members of EVM’s or BMR’s organizations receive remuneration for their services to the Fund out of the investment adviser fee. Certain officers and Trustees of the Fund and the Portfolio are officers of the above organizations.
4 Distribution Plans
The Fund has in effect a distribution plan for Class A shares (Class A Plan) pursuant to Rule 12b-1 under the 1940 Act. Pursuant to the Class A Plan, the Fund pays EVD a distribution and service fee of 0.25% per annum of its average daily net assets attributable to Class A shares for distribution services and facilities provided to the Fund by EVD, as well as for personal services and/or the maintenance of shareholder accounts. Distribution and service fees paid or accrued to EVD for the year ended December 31, 2024 amounted to $156,158 for Class A shares.
The Fund also has in effect a distribution plan for Class C shares (Class C Plan) pursuant to Rule 12b-1 under the 1940 Act. Pursuant to the Class C Plan, the Fund pays EVD amounts equal to 0.75% per annum of its average daily net assets attributable to Class C shares for providing ongoing distribution services and facilities to the Fund. For the year ended December 31, 2024, the Fund paid or accrued to EVD $33,074 for Class C shares.
Pursuant to the Class C Plan, the Fund also makes payments of service fees to EVD, financial intermediaries and other persons in amounts equal to 0.25% per annum of its average daily net assets attributable to that class. Service fees paid or accrued are for personal services and/or the maintenance of shareholder accounts. They are separate and distinct from the sales commissions and distribution fees payable to EVD. Service fees paid or accrued for the year ended December 31, 2024 amounted to $11,024 for Class C shares.
Distribution and service fees are subject to the limitations contained in the Financial Industry Regulatory Authority Rule 2341(d).
5 Contingent Deferred Sales Charges
A contingent deferred sales charge (CDSC) of 1% generally is imposed on redemptions of Class C shares made within 12 months of purchase. Class A shares may be subject to a 1% CDSC if redeemed within 12 months of purchase (depending on the circumstances of purchase). Generally, the CDSC is based upon the lower of the net asset value at date of redemption or date of purchase. No charge is levied on shares acquired by reinvestment of dividends or capital gain distributions. For the year ended December 31, 2024, the Fund was informed that EVD received less than $100 and $187 of CDSCs paid by Class A and Class C shareholders, respectively.
6 Investment Transactions
For the year ended December 31, 2024, increases and decreases in the Fund's investment in the Portfolio aggregated $21,042,877 and $26,784,842, respectively.
Eaton Vance
Stock Fund
December 31, 2024
Notes to Financial Statements — continued
7 Shares of Beneficial Interest
The Fund’s Declaration of Trust permits the Trustees to issue an unlimited number of full and fractional shares of beneficial interest (without par value). Such shares may be issued in a number of different series (such as the Fund) and classes. Transactions in Fund shares, including direct exchanges pursuant to share class conversions, were as follows:
| | Year Ended
December 31, 2024 | | Year Ended
December 31, 2023 |
| | Shares | Amount | | Shares | Amount |
| Class A | | | | | |
| Sales | 525,050 | $11,477,192 | | 241,532 | $4,759,148 |
| Issued to shareholders electing to receive payments of distributions in Fund shares | 408,679 | 8,586,342 | | 426,500 | 7,830,540 |
| Redemptions | (548,995) | (11,970,258) | | (495,112) | (9,368,132) |
| Net increase | 384,734 | $ 8,093,276 | | 172,920 | $3,221,556 |
| Class C | | | | | |
| Sales | 44,845 | $ 924,343 | | 19,000 | $ 359,148 |
| Issued to shareholders electing to receive payments of distributions in Fund shares | 28,448 | 555,867 | | 44,733 | 777,005 |
| Redemptions | (144,179) | (2,885,613) | | (108,565) | (2,014,303) |
| Net decrease | (70,886) | $(1,405,403) | | (44,832) | $ (878,150) |
| Class I | | | | | |
| Sales | 821,099 | $17,979,098 | | 93,175 | $1,865,470 |
| Issued to shareholders electing to receive payments of distributions in Fund shares | 164,095 | 3,460,762 | | 183,245 | 3,368,037 |
| Redemptions | (919,523) | (20,662,251) | | (335,433) | (6,416,960) |
| Net increase (decrease) | 65,671 | $ 777,609 | | (59,013) | $(1,183,453) |
8 Line of Credit
Effective October 22, 2024, the Fund participates with other portfolios and funds managed by EVM and its affiliates in a $650 million unsecured revolving line of credit agreement with a group of banks, which is in effect through October 21, 2025. Borrowings are made by the Fund solely for temporary purposes related to redemptions and other short-term cash needs. Interest is charged to the Fund based on its borrowings generally at an amount above either the Secured Overnight Financing Rate (SOFR) or Federal Funds rate. In addition, a fee computed at an annual rate of 0.15% on the daily unused portion of the line of credit is allocated among the participating portfolios and funds at the end of each quarter. In connection with the renewal of the agreement in October 2024, an arrangement fee of $150,000 was incurred that was allocated to the participating portfolios and funds. Because the line of credit is not available exclusively to the Fund, it may be unable to borrow some or all of its requested amounts at any particular time. The Fund did not have any borrowings during the year ended December 31, 2024.
Eaton Vance
Stock Fund
December 31, 2024
Report of Independent Registered Public Accounting Firm
To the Trustees of Eaton Vance Mutual Funds Trust and Shareholders of Eaton Vance Stock Fund:
Opinion on the Financial Statements and Financial Highlights
We have audited the accompanying statement of assets and liabilities of Eaton Vance Stock Fund (the “Fund”) (one of the funds constituting Eaton Vance Mutual Funds Trust), as of December 31, 2024, the related statement of operations for the year then ended, the statements of changes in net assets for each of the two years in the period then ended, the financial highlights for each of the five years in the period then ended, and the related notes. In our opinion, the financial statements and financial highlights present fairly, in all material respects, the financial position of the Fund as of December 31, 2024, and the results of its operations for the year then ended, the changes in its net assets for each of the two years in the period then ended, and the financial highlights for each of the five years in the period then ended, in conformity with accounting principles generally accepted in the United States of America.
Basis for Opinion
These financial statements and financial highlights are the responsibility of the Fund's management. Our responsibility is to express an opinion on the Fund's financial statements and financial highlights based on our audits. We are a public accounting firm registered with the Public Company Accounting Oversight Board (United States) (PCAOB) and are required to be independent with respect to the Fund in accordance with the U.S. federal securities laws and the applicable rules and regulations of the Securities and Exchange Commission and the PCAOB.
We conducted our audits in accordance with the standards of the PCAOB. Those standards require that we plan and perform the audit to obtain reasonable assurance about whether the financial statements and financial highlights are free of material misstatement, whether due to error or fraud. The Fund is not required to have, nor were we engaged to perform, an audit of its internal control over financial reporting. As part of our audits, we are required to obtain an understanding of internal control over financial reporting but not for the purpose of expressing an opinion on the effectiveness of the Fund’s internal control over financial reporting. Accordingly, we express no such opinion.
Our audits included performing procedures to assess the risks of material misstatement of the financial statements and financial highlights, whether due to error or fraud, and performing procedures that respond to those risks. Such procedures included examining, on a test basis, evidence regarding the amounts and disclosures in the financial statements and financial highlights. Our audits also included evaluating the accounting principles used and significant estimates made by management, as well as evaluating the overall presentation of the financial statements and financial highlights. We believe that our audits provide a reasonable basis for our opinion.
/s/ Deloitte & Touche LLP
Boston, Massachusetts
February 21, 2025
We have served as the auditor of one or more Eaton Vance investment companies since 1959.
Eaton Vance
Stock Fund
December 31, 2024
Federal Tax Information (Unaudited)
The Form 1099-DIV you received in February 2025 showed the tax status of all distributions paid to your account in calendar year 2024. Shareholders are advised to consult their own tax adviser with respect to the tax consequences of their investment in the Fund. As required by the Internal Revenue Code and/or regulations, shareholders must be notified regarding the status of qualified dividend income for individuals, the dividends received deduction for corporations and capital gains dividends.
Qualified Dividend Income. For the fiscal year ended December 31, 2024, the Fund designates approximately $792,042, or up to the maximum amount of such dividends allowable pursuant to the Internal Revenue Code, as qualified dividend income eligible for the reduced tax rate of 15%.
Dividends Received Deduction. Corporate shareholders are generally entitled to take the dividends received deduction on the portion of the Fund’s dividend distribution that qualifies under tax law. For the Fund’s fiscal 2024 ordinary income dividends, 100% qualifies for the corporate dividends received deduction.
Capital Gains Dividends. The Fund hereby designates as a capital gain dividend with respect to the taxable year ended December 31, 2024, $12,833,088 or, if subsequently determined to be different, the net capital gain of such year.
Stock Portfolio
December 31, 2024
| Security | Shares | Value |
| Aerospace & Defense — 1.0% |
| HEICO Corp. | | 30,352 | $ 7,215,885 |
| | | | $ 7,215,885 |
| Automobiles — 0.5% |
| Tesla, Inc.(1) | | 9,359 | $ 3,779,539 |
| | | | $ 3,779,539 |
| Biotechnology — 1.7% |
| AbbVie, Inc. | | 71,817 | $ 12,761,881 |
| | | | $ 12,761,881 |
| Broadline Retail — 5.4% |
| Amazon.com, Inc.(1) | | 183,542 | $ 40,267,279 |
| | | | $ 40,267,279 |
| Building Products — 1.1% |
| Carrier Global Corp. | | 118,240 | $ 8,071,062 |
| | | | $ 8,071,062 |
| Capital Markets — 6.9% |
| Blue Owl Capital, Inc. | | 491,862 | $ 11,440,710 |
| Intercontinental Exchange, Inc. | | 63,466 | 9,457,069 |
| S&P Global, Inc. | | 21,712 | 10,813,228 |
| Stifel Financial Corp. | | 75,529 | 8,012,116 |
| Tradeweb Markets, Inc., Class A | | 91,859 | 12,026,180 |
| | | | $ 51,749,303 |
| Chemicals — 0.7% |
| Linde PLC | | 12,694 | $ 5,314,597 |
| | | | $ 5,314,597 |
| Commercial Services & Supplies — 1.1% |
| Waste Connections, Inc. | | 46,679 | $ 8,009,183 |
| | | | $ 8,009,183 |
| Communications Equipment — 0.6% |
| Arista Networks, Inc.(1) | | 38,144 | $ 4,216,056 |
| | | | $ 4,216,056 |
| Consumer Staples Distribution & Retail — 3.5% |
| BJ's Wholesale Club Holdings, Inc.(1) | | 140,026 | $ 12,511,323 |
| Security | Shares | Value |
| Consumer Staples Distribution & Retail (continued) |
| Walmart, Inc. | | 154,606 | $ 13,968,652 |
| | | | $ 26,479,975 |
| Containers & Packaging — 1.0% |
| AptarGroup, Inc. | | 45,687 | $ 7,177,428 |
| | | | $ 7,177,428 |
| Electrical Equipment — 1.5% |
| AMETEK, Inc. | | 62,095 | $ 11,193,245 |
| | | | $ 11,193,245 |
| Entertainment — 3.0% |
| Liberty Media Corp.-Liberty Formula One, Class C(1) | | 62,454 | $ 5,786,987 |
| Netflix, Inc.(1) | | 15,928 | 14,196,945 |
| Spotify Technology SA(1) | | 6,223 | 2,784,046 |
| | | | $ 22,767,978 |
| Financial Services — 4.2% |
| Mr. Cooper Group, Inc.(1) | | 48,914 | $ 4,696,233 |
| Shift4 Payments, Inc., Class A(1) | | 99,311 | 10,306,496 |
| Visa, Inc., Class A | | 51,136 | 16,161,021 |
| | | | $ 31,163,750 |
| Ground Transportation — 1.3% |
| Uber Technologies, Inc.(1) | | 160,369 | $ 9,673,458 |
| | | | $ 9,673,458 |
| Health Care Equipment & Supplies — 3.3% |
| Abbott Laboratories | | 65,340 | $ 7,390,607 |
| Edwards Lifesciences Corp.(1) | | 109,041 | 8,072,305 |
| Intuitive Surgical, Inc.(1) | | 17,537 | 9,153,613 |
| | | | $ 24,616,525 |
| Health Care Providers & Services — 1.8% |
| UnitedHealth Group, Inc. | | 26,786 | $ 13,549,966 |
| | | | $ 13,549,966 |
| Hotels, Restaurants & Leisure — 1.2% |
| Marriott International, Inc., Class A | | 32,568 | $ 9,084,518 |
| | | | $ 9,084,518 |
| Insurance — 3.3% |
| Allstate Corp. | | 78,799 | $ 15,191,659 |
| Arthur J. Gallagher & Co. | | 34,670 | 9,841,080 |
| | | | $ 25,032,739 |
13
See Notes to Financial Statements.
Stock Portfolio
December 31, 2024
Portfolio of Investments — continued
| Security | Shares | Value |
| Interactive Media & Services — 7.6% |
| Alphabet, Inc., Class C | | 176,101 | $ 33,536,674 |
| Meta Platforms, Inc., Class A | | 40,084 | 23,469,583 |
| | | | $ 57,006,257 |
| IT Services — 1.2% |
| Gartner, Inc.(1) | | 19,207 | $ 9,305,215 |
| | | | $ 9,305,215 |
| Life Sciences Tools & Services — 1.2% |
| Thermo Fisher Scientific, Inc. | | 16,954 | $ 8,819,979 |
| | | | $ 8,819,979 |
| Machinery — 0.9% |
| Parker-Hannifin Corp. | | 10,852 | $ 6,902,198 |
| | | | $ 6,902,198 |
| Media — 0.4% |
| Trade Desk, Inc., Class A(1) | | 28,793 | $ 3,384,041 |
| | | | $ 3,384,041 |
| Multi-Utilities — 0.8% |
| Sempra | | 66,143 | $ 5,802,064 |
| | | | $ 5,802,064 |
| Oil, Gas & Consumable Fuels — 2.1% |
| ConocoPhillips | | 155,432 | $ 15,414,191 |
| | | | $ 15,414,191 |
| Pharmaceuticals — 2.3% |
| Eli Lilly & Co. | | 22,594 | $ 17,442,568 |
| | | | $ 17,442,568 |
| Professional Services — 3.4% |
| Automatic Data Processing, Inc. | | 25,227 | $ 7,384,700 |
| Booz Allen Hamilton Holding Corp. | | 27,589 | 3,550,704 |
| TransUnion | | 156,526 | 14,511,525 |
| | | | $ 25,446,929 |
| Real Estate Management & Development — 2.4% |
| CoStar Group, Inc.(1) | | 103,889 | $ 7,437,414 |
| FirstService Corp. | | 58,700 | 10,625,874 |
| | | | $ 18,063,288 |
| Semiconductors & Semiconductor Equipment — 13.9% |
| Analog Devices, Inc. | | 43,602 | $ 9,263,681 |
| Security | Shares | Value |
| Semiconductors & Semiconductor Equipment (continued) |
| Broadcom, Inc. | | 117,401 | $ 27,218,248 |
| Lam Research Corp. | | 166,180 | 12,003,181 |
| NVIDIA Corp. | | 410,903 | 55,180,164 |
| | | | $103,665,274 |
| Software — 10.1% |
| Fair Isaac Corp.(1) | | 4,810 | $ 9,576,373 |
| Microsoft Corp. | | 134,763 | 56,802,605 |
| Palo Alto Networks, Inc.(1) | | 48,906 | 8,898,936 |
| | | | $ 75,277,914 |
| Specialty Retail — 2.7% |
| Burlington Stores, Inc.(1) | | 36,378 | $ 10,369,913 |
| TJX Cos., Inc. | | 78,543 | 9,488,780 |
| | | | $ 19,858,693 |
| Technology Hardware, Storage & Peripherals — 7.7% |
| Apple, Inc. | | 229,015 | $ 57,349,936 |
| | | | $ 57,349,936 |
Total Common Stocks
(identified cost $406,750,876) | | | $745,862,914 |
| Short-Term Investments — 0.2% |
| Security | Shares | Value |
| Morgan Stanley Institutional Liquidity Funds - Government Portfolio, Institutional Class, 4.43%(2) | | 1,361,413 | $ 1,361,413 |
Total Short-Term Investments
(identified cost $1,361,413) | | | $ 1,361,413 |
Total Investments — 100.0%
(identified cost $408,112,289) | | | $747,224,327 |
| Other Assets, Less Liabilities — (0.0)%(3) | | | $ (273,385) |
| Net Assets — 100.0% | | | $746,950,942 |
| The percentage shown for each investment category in the Portfolio of Investments is based on net assets. |
| (1) | Non-income producing security. |
| (2) | May be deemed to be an affiliated investment company (see Note 6). The rate shown is the annualized seven-day yield as of December 31, 2024. |
| (3) | Amount is less than (0.05)%. |
14
See Notes to Financial Statements.
Stock Portfolio
December 31, 2024
Statement of Assets and Liabilities
| | December 31, 2024 |
| Assets | |
| Unaffiliated investments, at value (identified cost $406,750,876) | $745,862,914 |
| Affiliated investments, at value (identified cost $1,361,413) | 1,361,413 |
| Dividends receivable | 269,739 |
| Dividends receivable from affiliated investments | 6,573 |
| Tax reclaims receivable | 20,182 |
| Trustees' deferred compensation plan | 67,529 |
| Total assets | $747,588,350 |
| Liabilities | |
| Payable to affiliates: | |
| Investment adviser fee | $384,054 |
| Trustees' fees | 10,961 |
| Trustees' deferred compensation plan | 67,529 |
| Payable for custodian fee | 104,486 |
| Payable for legal and accounting services | 48,311 |
| Accrued expenses | 22,067 |
| Total liabilities | $637,408 |
| Net Assets applicable to investors' interest in Portfolio | $746,950,942 |
15
See Notes to Financial Statements.
Stock Portfolio
December 31, 2024
| | Year Ended |
| | December 31, 2024 |
| Investment Income | |
| Dividend income (net of foreign taxes withheld of $29,617) | $5,907,690 |
| Dividend income from affiliated investments | 266,103 |
| Total investment income | $6,173,793 |
| Expenses | |
| Investment adviser fee | $4,134,015 |
| Trustees’ fees and expenses | 52,015 |
| Custodian fee | 169,665 |
| Legal and accounting services | 41,423 |
| Miscellaneous | 21,240 |
| Total expenses | $4,418,358 |
| Deduct: | |
| Waiver and/or reimbursement of expenses by affiliates | $7,458 |
| Total expense reductions | $7,458 |
| Net expenses | $4,410,900 |
| Net investment income | $1,762,893 |
| Realized and Unrealized Gain (Loss) | |
| Net realized gain (loss): | |
| Investment transactions | $68,213,188 |
| Foreign currency transactions | (47) |
| Net realized gain | $68,213,141 |
| Change in unrealized appreciation (depreciation): | |
| Investments | $112,518,034 |
| Foreign currency | (138) |
| Net change in unrealized appreciation (depreciation) | $112,517,896 |
| Net realized and unrealized gain | $180,731,037 |
| Net increase in net assets from operations | $182,493,930 |
16
See Notes to Financial Statements.
Stock Portfolio
December 31, 2024
Statements of Changes in Net Assets
| | Year Ended December 31, |
| | 2024 | 2023 |
| Increase (Decrease) in Net Assets | | |
| From operations: | | |
| Net investment income | $1,762,893 | $3,395,003 |
| Net realized gain | 68,213,141 | 45,840,944 |
| Net change in unrealized appreciation (depreciation) | 112,517,896 | 74,502,318 |
| Net increase in net assets from operations | $182,493,930 | $123,738,265 |
| Capital transactions: | | |
| Contributions | $33,145,342 | $11,099,572 |
| Withdrawals | (63,170,365) | (90,392,247) |
| Net decrease in net assets from capital transactions | $(30,025,023) | $(79,292,675) |
| Net increase in net assets | $152,468,907 | $44,445,590 |
| Net Assets | | |
| At beginning of year | $594,482,035 | $550,036,445 |
| At end of year | $746,950,942 | $594,482,035 |
17
See Notes to Financial Statements.
Stock Portfolio
December 31, 2024
| | Year Ended December 31, |
| Ratios/Supplemental Data | 2024 | 2023 | 2022 | 2021 | 2020 |
| Ratios (as a percentage of average daily net assets):(1) | | | | | |
| Total expenses | 0.63% | 0.64% | 0.64% | 0.63% | 0.64% |
| Net expenses | 0.63%(2) | 0.64%(2) | 0.64%(2) | 0.63% | 0.64% |
| Net investment income | 0.25% | 0.60% | 0.82% | 0.55% | 0.84% |
| Portfolio Turnover | 44% | 44% | 52% | 44% | 70% |
| Total Return | 30.99% | 24.43% | (16.49)% | 23.21% | 18.61% |
| Net assets, end of year (000’s omitted) | $746,951 | $594,482 | $550,036 | $871,310 | $804,446 |
| (1) | Total expenses do not reflect amounts reimbursed and/or waived by the adviser and certain of its affiliates, if applicable. Net expenses are net of all reductions and represent the net expenses paid by the Portfolio. |
| (2) | Includes a reduction by the investment adviser of a portion of its adviser fee due to the Portfolio’s investment in the Liquidity Fund (equal to less than 0.005% of average daily net assets for the years ended December 31, 2024, 2023 and 2022). |
18
See Notes to Financial Statements.
Stock Portfolio
December 31, 2024
Notes to Financial Statements
1 Significant Accounting Policies
Stock Portfolio (the Portfolio) is a Massachusetts business trust registered under the Investment Company Act of 1940, as amended (the 1940 Act), as a diversified, open-end management investment company. The Portfolio's investment objective is to achieve long-term capital appreciation by investing in a diversified portfolio of equity securities. The Declaration of Trust permits the Trustees to issue interests in the Portfolio. At December 31, 2024, Eaton Vance Stock Fund and Eaton Vance Balanced Fund held an interest of 13.2% and 86.8%, respectively, in the Portfolio.
The following is a summary of significant accounting policies of the Portfolio. The policies are in conformity with accounting principles generally accepted in the United States of America (U.S. GAAP). The Portfolio is an investment company and follows accounting and reporting guidance in the Financial Accounting Standards Board (FASB) Accounting Standards Codification Topic 946.
A Investment Valuation—The following methodologies are used to determine the market value or fair value of investments.
Equity Securities. Equity securities listed on a U.S. securities exchange generally are valued at the last sale or closing price on the day of valuation or, if no sales took place on such date, at the mean between the closing bid and ask prices on the exchange where such securities are principally traded. Equity securities listed on the NASDAQ National Market System are valued at the NASDAQ official closing price. Unlisted or listed securities for which closing sales prices or closing quotations are not available are valued at the mean between the latest available bid and ask prices.
Foreign Currencies. Foreign currencies are valued in U.S. dollars, based on foreign currency exchange rate quotations supplied by a third party pricing service. The pricing service uses a proprietary model to determine the exchange rate. Inputs to the model include reported trades and implied bid/ask spreads.
Other. Investments in management investment companies (including money market funds) that do not trade on an exchange are valued at the net asset value as of the close of each business day.
Fair Valuation. In connection with Rule 2a-5 of the 1940 Act, the Trustees have designated the Portfolio’s investment adviser as its valuation designee. Investments for which valuations or market quotations are not readily available or are deemed unreliable are valued by the investment adviser, as valuation designee, at fair value using methods that most fairly reflect the security’s “fair value”, which is the amount that the Portfolio might reasonably expect to receive for the security upon its current sale in the ordinary course. Each such determination is based on a consideration of relevant factors, which are likely to vary from one pricing context to another. These factors may include, but are not limited to, the type of security, the existence of any contractual restrictions on the security’s disposition, the price and extent of public trading in similar securities of the issuer or of comparable companies or entities, quotations or relevant information obtained from broker/dealers or other market participants, information obtained from the issuer, analysts, and/or the appropriate stock exchange (for exchange-traded securities), an analysis of the company’s or entity’s financial statements, and an evaluation of the forces that influence the issuer and the market(s) in which the security is purchased and sold.
B Investment Transactions—Investment transactions for financial statement purposes are accounted for on a trade date basis. Realized gains and losses on investments sold are determined on the basis of identified cost.
C Income—Dividend income is recorded on the ex-dividend date for dividends received in cash and/or securities. However, if the ex-dividend date has passed, certain dividends from foreign securities are recorded as the Portfolio is informed of the ex-dividend date. Withholding taxes on foreign dividends and capital gains have been provided for in accordance with the Portfolio’s understanding of the applicable countries’ tax rules and rates.
D Federal Taxes—The Portfolio has elected to be treated as a partnership for federal tax purposes. No provision is made by the Portfolio for federal or state taxes on any taxable income of the Portfolio because each investor in the Portfolio is ultimately responsible for the payment of any taxes on its share of taxable income. Since at least one of the Portfolio's investors is a regulated investment company that invests all or substantially all of its assets in the Portfolio, the Portfolio normally must satisfy the applicable source of income and diversification requirements (under the Internal Revenue Code) in order for its investors to satisfy them. The Portfolio will allocate, at least annually among its investors, each investor's distributive share of the Portfolio's net investment income, net realized capital gains and losses and any other items of income, gain, loss, deduction or credit.
As of December 31, 2024, the Portfolio had no uncertain tax positions that would require financial statement recognition, de-recognition, or disclosure. The Portfolio files a U.S. federal income tax return annually after its fiscal year-end, which is subject to examination by the Internal Revenue Service for a period of three years from the date of filing.
E Foreign Currency Translation—Other assets and liabilities initially expressed in foreign currencies are translated each business day into U.S. dollars based upon current exchange rates. Income and expenses denominated in foreign currencies are translated into U.S. dollars based upon currency exchange rates in effect on the respective dates of such transactions.
F Use of Estimates—The preparation of the financial statements in conformity with U.S. GAAP requires management to make estimates and assumptions that affect the reported amounts of assets and liabilities at the date of the financial statements and the reported amounts of income and expense during the reporting period. Actual results could differ from those estimates.
Stock Portfolio
December 31, 2024
Notes to Financial Statements — continued
G Indemnifications—Under the Portfolio’s organizational documents, its officers and Trustees may be indemnified against certain liabilities and expenses arising out of the performance of their duties to the Portfolio. Under Massachusetts law, if certain conditions prevail, interestholders in the Portfolio could be deemed to have personal liability for the obligations of the Portfolio. However, the Portfolio’s Declaration of Trust contains an express disclaimer of liability on the part of Portfolio interestholders. Additionally, in the normal course of business, the Portfolio enters into agreements with service providers that may contain indemnification clauses. The Portfolio’s maximum exposure under these arrangements is unknown as this would involve future claims that may be made against the Portfolio that have not yet occurred.
H Segment Reporting—During the year ended December 31, 2024, the Portfolio adopted FASB Accounting Standards Update No. 2023-07, Segment Reporting (Topic 280): Improvements to Reportable Segment Disclosures, (ASU 2023-07), which requires incremental disclosures related to a public entity’s reportable segments. The Portfolio operates as a single reportable segment, an investment company whose investment objective is included in Note 1. In connection with the adoption of ASU 2023-07, the Portfolio’s President has been designated as the Portfolio’s Chief Operating Decision Maker (CODM), who is responsible for assessing the performance of the Portfolio’s single segment and deciding how to allocate the segment’s resources. To perform this function, the CODM reviews the information in the Portfolio’s Financial Statements.
2 Investment Adviser Fee and Other Transactions with Affiliates
The investment adviser fee is earned by Boston Management and Research (BMR), an indirect, wholly-owned subsidiary of Morgan Stanley, as compensation for investment advisory services rendered to the Portfolio. The fee is computed at an annual rate as a percentage of the Portfolio’s average daily net assets as follows and is payable monthly:
| Average Daily Net Assets | Annual Fee Rate |
| Up to $500 million | 0.600% |
| $500 million but less than $1 billion | 0.575% |
| $1 billion but less than $2.5 billion | 0.550% |
| $2.5 billion but less than $5 billion | 0.530% |
| $5 billion and over | 0.515% |
For the year ended December 31, 2024, the Portfolio's investment adviser fee amounted to $4,134,015 or 0.59% of the Portfolio’s average daily net assets.
The Portfolio may invest in a money market fund, the Institutional Class of the Morgan Stanley Institutional Liquidity Funds - Government Portfolio (the “Liquidity Fund”), an open-end management investment company managed by Morgan Stanley Investment Management Inc., a wholly-owned subsidiary of Morgan Stanley. The investment adviser fee paid by the Portfolio is reduced by an amount equal to its pro rata share of the advisory and administration fees paid by the Portfolio due to its investment in the Liquidity Fund. For the year ended December 31, 2024, the investment adviser fee paid was reduced by $7,458 relating to the Portfolio's investment in the Liquidity Fund.
Trustees and officers of the Portfolio who are members of BMR’s organization receive remuneration for their services to the Portfolio out of the investment adviser fee. Trustees of the Portfolio who are not affiliated with the investment adviser may elect to defer receipt of all or a percentage of their annual fees in accordance with the terms of the Trustees Deferred Compensation Plan. Certain officers and Trustees of the Portfolio are officers of the above organization.
3 Purchases and Sales of Investments
Purchases and sales of investments, other than short-term obligations, aggregated $301,702,360 and $328,789,003, respectively, for the year ended December 31, 2024.
Stock Portfolio
December 31, 2024
Notes to Financial Statements — continued
4 Federal Income Tax Basis of Investments
The cost and unrealized appreciation (depreciation) of investments of the Portfolio at December 31, 2024, as determined on a federal income tax basis, were as follows:
| Aggregate cost | $413,064,757 |
| Gross unrealized appreciation | $338,878,697 |
| Gross unrealized depreciation | (4,719,127) |
| Net unrealized appreciation | $334,159,570 |
5 Line of Credit
The Portfolio participates with other portfolios and funds managed by BMR and its affiliates in a $650 million unsecured revolving line of credit agreement with a group of banks, which is in effect through October 21, 2025. Borrowings are made by the Portfolio solely for temporary purposes related to redemptions and other short-term cash needs. Interest is charged to the Portfolio based on its borrowings generally at an amount above either the Secured Overnight Financing Rate (SOFR) or Federal Funds rate. In addition, a fee computed at an annual rate of 0.15% on the daily unused portion of the line of credit is allocated among the participating portfolios and funds at the end of each quarter. In connection with the renewal of the agreement in October 2024, an arrangement fee of $150,000 was incurred that was allocated to the participating portfolios and funds. Because the line of credit is not available exclusively to the Portfolio, it may be unable to borrow some or all of its requested amounts at any particular time. The Portfolio did not have any significant borrowings or allocated fees during the year ended December 31, 2024.
6 Affiliated Investments
At December 31, 2024, the value of the Portfolio's investment in funds that may be deemed to be affiliated was $1,361,413, which represents 0.2% of the Portfolio's net assets. Transactions in such investments by the Portfolio for the year ended December 31, 2024 were as follows:
| Name | Value,
beginning
of period | Purchases | Sales
proceeds | Net realized
gain (loss) | Change in
unrealized
appreciation
(depreciation) | Value, end
of period | Dividend
income | Shares,
end of period |
| Short-Term Investments |
| Liquidity Fund | $2,428,547 | $115,605,406 | $(116,672,540) | $ — | $ — | $1,361,413 | $266,103 | 1,361,413 |
7 Fair Value Measurements
Under generally accepted accounting principles for fair value measurements, a three-tier hierarchy to prioritize the assumptions, referred to as inputs, is used in valuation techniques to measure fair value. The three-tier hierarchy of inputs is summarized in the three broad levels listed below.
| • | Level 1 – quoted prices in active markets for identical investments |
| • | Level 2 – other significant observable inputs (including quoted prices for similar investments, interest rates, prepayment speeds, credit risk, etc.) |
| • | Level 3 – significant unobservable inputs (including a fund's own assumptions in determining the fair value of investments) |
In cases where the inputs used to measure fair value fall in different levels of the fair value hierarchy, the level disclosed is determined based on the lowest level input that is significant to the fair value measurement in its entirety. The inputs or methodology used for valuing securities are not necessarily an indication of the risk associated with investing in those securities.
Stock Portfolio
December 31, 2024
Notes to Financial Statements — continued
At December 31, 2024, the hierarchy of inputs used in valuing the Portfolio's investments, which are carried at fair value, were as follows:
| Asset Description | Level 1 | Level 2 | Level 3 | Total |
| Common Stocks | $745,862,914* | $ — | $ — | $745,862,914 |
| Short-Term Investments | 1,361,413 | — | — | 1,361,413 |
| Total Investments | $ 747,224,327 | $ — | $ — | $747,224,327 |
| * | The level classification by major category of investments is the same as the category presentation in the Portfolio of Investments. |
Stock Portfolio
December 31, 2024
Report of Independent Registered Public Accounting Firm
To the Trustees and Investors of Stock Portfolio:
Opinion on the Financial Statements and Financial Highlights
We have audited the accompanying statement of assets and liabilities of Stock Portfolio (the “Portfolio”), including the portfolio of investments, as of December 31, 2024, the related statement of operations for the year then ended, the statements of changes in net assets for each of the two years in the period then ended, the financial highlights for each of the five years in the period then ended, and the related notes. In our opinion, the financial statements and financial highlights present fairly, in all material respects, the financial position of the Portfolio as of December 31, 2024, and the results of its operations for the year then ended, the changes in its net assets for each of the two years in the period then ended, and the financial highlights for each of the five years in the period then ended, in conformity with accounting principles generally accepted in the United States of America.
Basis for Opinion
These financial statements and financial highlights are the responsibility of the Portfolio's management. Our responsibility is to express an opinion on the Portfolio's financial statements and financial highlights based on our audits. We are a public accounting firm registered with the Public Company Accounting Oversight Board (United States) (PCAOB) and are required to be independent with respect to the Portfolio in accordance with the U.S. federal securities laws and the applicable rules and regulations of the Securities and Exchange Commission and the PCAOB.
We conducted our audits in accordance with the standards of the PCAOB. Those standards require that we plan and perform the audit to obtain reasonable assurance about whether the financial statements and financial highlights are free of material misstatement, whether due to error or fraud. The Portfolio is not required to have, nor were we engaged to perform, an audit of its internal control over financial reporting. As part of our audits, we are required to obtain an understanding of internal control over financial reporting but not for the purpose of expressing an opinion on the effectiveness of the Portfolio’s internal control over financial reporting. Accordingly, we express no such opinion.
Our audits included performing procedures to assess the risks of material misstatement of the financial statements and financial highlights, whether due to error or fraud, and performing procedures that respond to those risks. Such procedures included examining, on a test basis, evidence regarding the amounts and disclosures in the financial statements and financial highlights. Our audits also included evaluating the accounting principles used and significant estimates made by management, as well as evaluating the overall presentation of the financial statements and financial highlights. Our procedures included confirmation of securities owned as of December 31, 2024, by correspondence with the custodian and brokers; when replies were not received from brokers, we performed other auditing procedures. We believe that our audits provide a reasonable basis for our opinion.
/s/ Deloitte & Touche LLP
Boston, Massachusetts
February 21, 2025
We have served as the auditor of one or more Eaton Vance investment companies since 1959.
This Page Intentionally Left Blank
Eaton Vance
Tax-Managed Growth Funds 1.1 and 1.2
Annual Financial Statements and
Additional Information
December 31, 2024
This report must be preceded or accompanied by a current summary prospectus or prospectus. Before investing, investors should consider carefully the investment objective, risks, and charges and expenses of a mutual fund. This and other important information is contained in the prospectus and/or statement of additional information, which can be obtained by calling 1-800-262-1122 or from a financial intermediary. Prospective investors should read the prospectus carefully before investing.
Annual Financial Statements and Additional Information December 31, 2024
Eaton Vance
Tax-Managed Growth Funds 1.1 and 1.2
Items 8, 9 and 11 of Form N-CSR are Not Applicable. For Item 10 of Form N-CSR, see Item 7.
Eaton Vance
Tax-Managed Growth Funds 1.1 and 1.2
December 31, 2024
Statements of Assets and Liabilities
| | December 31, 2024 |
| | Tax-Managed
Growth Fund 1.1 | Tax-Managed
Growth Fund 1.2 |
| Assets | | |
| Investment in Tax-Managed Growth Portfolio, at value | $2,685,556,756 | $1,522,259,505 |
| Receivable for Fund shares sold | 143,277 | 164,406 |
| Total assets | $2,685,700,033 | $1,522,423,911 |
| Liabilities | | |
| Payable for Fund shares redeemed | $1,577,034 | $1,968,022 |
| Payable to affiliates: | | |
| Administration fee | — | 198,157 |
| Distribution and service fees | 494,584 | 273,343 |
| Trustees' fees | 125 | 125 |
| Payable for transfer and dividend disbursing agent fees | 167,359 | 76,365 |
| Accrued expenses | 123,067 | 104,495 |
| Total liabilities | $2,362,169 | $2,620,507 |
| Net Assets | $2,683,337,864 | $1,519,803,404 |
| Sources of Net Assets | | |
| Paid-in capital | $1,132,087,599 | $818,199,947 |
| Distributable earnings | 1,551,250,265 | 701,603,457 |
| Net Assets | $2,683,337,864 | $1,519,803,404 |
| Class A Shares | | |
| Net Assets | $2,252,700,272 | $1,040,208,004 |
| Shares Outstanding | 19,357,918 | 19,785,304 |
Net Asset Value and Redemption Price Per Share
(net assets ÷ shares of beneficial interest outstanding) | $116.37 | $52.57 |
Maximum Offering Price Per Share
(100 ÷ 94.75 of net asset value per share) | $122.82 | $55.48 |
| Class C Shares | | |
| Net Assets | $5,237,196 | $53,953,022 |
| Shares Outstanding | 50,770 | 1,076,374 |
Net Asset Value and Offering Price Per Share*
(net assets ÷ shares of beneficial interest outstanding) | $103.16 | $50.12 |
| Class I Shares | | |
| Net Assets | $425,400,396 | $425,642,378 |
| Shares Outstanding | 3,936,090 | 8,073,763 |
Net Asset Value, Offering Price and Redemption Price Per Share
(net assets ÷ shares of beneficial interest outstanding) | $108.08 | $52.72 |
| On sales of $50,000 or more, the offering price of Class A shares is reduced. |
| * | Redemption price per share is equal to the net asset value less any applicable contingent deferred sales charge. |
1
See Notes to Financial Statements.
Eaton Vance
Tax-Managed Growth Funds 1.1 and 1.2
December 31, 2024
| | Year Ended December 31, 2024 |
| | Tax-Managed
Growth Fund 1.1 | Tax-Managed
Growth Fund 1.2 |
| Investment Income | | |
| Dividend income allocated from Portfolio (net of foreign taxes, $147,176 and $81,835, respectively) | $27,949,239 | $15,600,769 |
| Expenses allocated from Portfolio | (10,854,265) | (6,059,625) |
| Total investment income from Portfolio | $17,094,974 | $9,541,144 |
| Expenses | | |
| Administration fee | $— | $2,121,642 |
| Distribution and service fees: | | |
| Class A | 5,348,658 | 2,425,669 |
| Class C | 56,601 | 522,483 |
| Trustees’ fees and expenses | 500 | 500 |
| Custodian fee | 62,658 | 62,486 |
| Transfer and dividend disbursing agent fees | 536,822 | 341,069 |
| Professional fees | 105,072 | 73,976 |
| Printing and postage | 67,327 | 37,066 |
| Registration fees | 58,398 | 37,633 |
| Miscellaneous | 121,008 | 55,239 |
| Total expenses | $6,357,044 | $5,677,763 |
| Net investment income | $10,737,930 | $3,863,381 |
| Realized and Unrealized Gain (Loss) from Portfolio | | |
| Net realized gain (loss): | | |
| Investment transactions | $126,164,756 | $70,295,096 |
| Foreign currency transactions | (1,960) | (1,095) |
| Net realized gain | $126,162,796 | $70,294,001 |
| Change in unrealized appreciation (depreciation): | | |
| Investments | $420,025,167 | $233,393,716 |
| Foreign currency | (10,531) | (5,871) |
| Net change in unrealized appreciation (depreciation) | $420,014,636 | $233,387,845 |
| Net realized and unrealized gain | $546,177,432 | $303,681,846 |
| Net increase in net assets from operations | $556,915,362 | $307,545,227 |
2
See Notes to Financial Statements.
Eaton Vance
Tax-Managed Growth Funds 1.1 and 1.2
December 31, 2024
Statements of Changes in Net Assets
| | Tax-Managed Growth Fund 1.1 |
| | Year Ended
December 31, 2024 | Year Ended
December 31, 2023 |
| Increase (Decrease) in Net Assets | | |
| From operations: | | |
| Net investment income | $10,737,930 | $13,986,190 |
| Net realized gain | 126,162,796 | 35,155,123 |
| Net change in unrealized appreciation (depreciation) | 420,014,636 | 461,206,558 |
| Net increase in net assets from operations | $556,915,362 | $510,347,871 |
| Distributions to shareholders: | | |
| Class A | $(46,800,135) | $(11,070,935) |
| Class C | (103,506) | — |
| Class I | (10,607,440) | (2,836,689) |
| Total distributions to shareholders | $(57,511,081) | $(13,907,624) |
| Transactions in shares of beneficial interest: | | |
| Class A | $(92,952,497) | $(104,263,620) |
| Class C | (1,850,039) | (1,141,693) |
| Class I | 19,901,132 | 23,238,891 |
| Net decrease in net assets from Fund share transactions | $(74,901,404) | $(82,166,422) |
| Net increase in net assets | $424,502,877 | $414,273,825 |
| Net Assets | | |
| At beginning of year | $2,258,834,987 | $1,844,561,162 |
| At end of year | $2,683,337,864 | $2,258,834,987 |
3
See Notes to Financial Statements.
Eaton Vance
Tax-Managed Growth Funds 1.1 and 1.2
December 31, 2024
Statements of Changes in Net Assets — continued
| | Tax-Managed Growth Fund 1.2 |
| | Year Ended
December 31, 2024 | Year Ended
December 31, 2023 |
| Increase (Decrease) in Net Assets | | |
| From operations: | | |
| Net investment income | $3,863,381 | $6,013,868 |
| Net realized gain | 70,294,001 | 19,114,493 |
| Net change in unrealized appreciation (depreciation) | 233,387,845 | 250,077,347 |
| Net increase in net assets from operations | $307,545,227 | $275,205,708 |
| Distributions to shareholders: | | |
| Class A | $(15,648,923) | $(3,752,755) |
| Class C | (761,860) | — |
| Class I | (7,343,428) | (2,219,213) |
| Total distributions to shareholders | $(23,754,211) | $(5,971,968) |
| Transactions in shares of beneficial interest: | | |
| Class A | $(9,018,886) | $(22,436,758) |
| Class C | (4,331,176) | (6,578,837) |
| Class I | 10,085,850 | 4,515,887 |
| Net decrease in net assets from Fund share transactions | $(3,264,212) | $(24,499,708) |
| Net increase in net assets | $280,526,804 | $244,734,032 |
| Net Assets | | |
| At beginning of year | $1,239,276,600 | $994,542,568 |
| At end of year | $1,519,803,404 | $1,239,276,600 |
4
See Notes to Financial Statements.
Eaton Vance
Tax-Managed Growth Funds 1.1 and 1.2
December 31, 2024
| | Tax-Managed Growth Fund 1.1 — Class A |
| | Year Ended December 31, |
| | 2024 | 2023 | 2022 | 2021 | 2020 |
| Net asset value — Beginning of year | $94.95 | $74.46 | $93.81 | $75.51 | $61.75 |
| Income (Loss) From Operations | | | | | |
| Net investment income(1) | $0.42 | $0.55 | $0.49 | $0.34 | $0.48 |
| Net realized and unrealized gain (loss) | 23.46 | 20.49 | (19.36) | 18.29 | 13.75 |
| Total income (loss) from operations | $23.88 | $21.04 | $(18.87) | $18.63 | $14.23 |
| Less Distributions | | | | | |
| From net investment income | $(0.41) | $(0.55) | $(0.48) | $(0.33) | $(0.47) |
| From net realized gain | (2.05) | — | — | — | — |
| Total distributions | $(2.46) | $(0.55) | $(0.48) | $(0.33) | $(0.47) |
| Net asset value — End of year | $116.37 | $94.95 | $74.46 | $93.81 | $75.51 |
| Total Return(2) | 25.16% | 28.24% | (20.11)% | 24.68% | 23.05% |
| Ratios/Supplemental Data | | | | | |
| Net assets, end of year (000’s omitted) | $2,252,700 | $1,921,882 | $1,598,685 | $2,108,253 | $1,784,383 |
| Ratios (as a percentage of average daily net assets):(3)(4) | | | | | |
| Total expenses | 0.72% | 0.74% | 0.74% | 0.73% | 0.76% |
| Net expenses | 0.72%(5) | 0.74%(5) | 0.74%(5) | 0.73% | 0.76% |
| Net investment income | 0.39% | 0.65% | 0.62% | 0.40% | 0.77% |
| Portfolio Turnover of the Portfolio(6) | 7% | 7% | 3% | 1% | 1% |
| (1) | Computed using average shares outstanding. |
| (2) | Returns are historical and are calculated by determining the percentage change in net asset value with all distributions reinvested and do not reflect the effect of sales charges. |
| (3) | Total expenses do not reflect amounts reimbursed and/or waived by the adviser and certain of its affiliates, if applicable. Net expenses are net of all reductions and represent the net expenses paid by the Fund. |
| (4) | Includes the Fund’s share of the Portfolio’s allocated expenses. |
| (5) | Includes a reduction by the investment adviser of a portion of the Portfolio’s adviser fee due to the Portfolio’s investment in the Liquidity Fund (equal to less than 0.005% of average daily net assets for the years ended December 31, 2024, 2023 and 2022). |
| (6) | Excludes the value of portfolio securities contributed or distributed as a result of in-kind shareholder transactions. |
5
See Notes to Financial Statements.
Eaton Vance
Tax-Managed Growth Funds 1.1 and 1.2
December 31, 2024
Financial Highlights — continued
| | Tax-Managed Growth Fund 1.1 — Class C |
| | Year Ended December 31, |
| | 2024 | 2023 | 2022 | 2021 | 2020 |
| Net asset value — Beginning of year | $84.70 | $66.54 | $83.92 | $67.81 | $55.53 |
| Income (Loss) From Operations | | | | | |
| Net investment income (loss)(1) | $(0.35) | $(0.07) | $(0.10) | $(0.27) | $0.02 |
| Net realized and unrealized gain (loss) | 20.86 | 18.23 | (17.28) | 16.38 | 12.26 |
| Total income (loss) from operations | $20.51 | $18.16 | $(17.38) | $16.11 | $12.28 |
| Less Distributions | | | | | |
| From net realized gain | $(2.05) | $— | $— | $— | $— |
| Total distributions | $(2.05) | $— | $— | $— | $— |
| Net asset value — End of year | $103.16 | $84.70 | $66.54 | $83.92 | $67.81 |
| Total Return(2) | 24.23% | 27.28% | (20.71)% | 23.76% | 22.11% |
| Ratios/Supplemental Data | | | | | |
| Net assets, end of year (000’s omitted) | $5,237 | $5,935 | $5,665 | $8,801 | $9,517 |
| Ratios (as a percentage of average daily net assets):(3)(4) | | | | | |
| Total expenses | 1.47% | 1.49% | 1.49% | 1.48% | 1.51% |
| Net expenses | 1.47%(5) | 1.49%(5) | 1.49%(5) | 1.48% | 1.51% |
| Net investment income (loss) | (0.36)% | (0.10)% | (0.14)% | (0.35)% | 0.03% |
| Portfolio Turnover of the Portfolio(6) | 7% | 7% | 3% | 1% | 1% |
| (1) | Computed using average shares outstanding. |
| (2) | Returns are historical and are calculated by determining the percentage change in net asset value with all distributions reinvested and do not reflect the effect of sales charges. |
| (3) | Total expenses do not reflect amounts reimbursed and/or waived by the adviser and certain of its affiliates, if applicable. Net expenses are net of all reductions and represent the net expenses paid by the Fund. |
| (4) | Includes the Fund’s share of the Portfolio’s allocated expenses. |
| (5) | Includes a reduction by the investment adviser of a portion of the Portfolio’s adviser fee due to the Portfolio’s investment in the Liquidity Fund (equal to less than 0.005% of average daily net assets for the years ended December 31, 2024, 2023 and 2022). |
| (6) | Excludes the value of portfolio securities contributed or distributed as a result of in-kind shareholder transactions. |
6
See Notes to Financial Statements.
Eaton Vance
Tax-Managed Growth Funds 1.1 and 1.2
December 31, 2024
Financial Highlights — continued
| | Tax-Managed Growth Fund 1.1 — Class I |
| | Year Ended December 31, |
| | 2024 | 2023 | 2022 | 2021 | 2020 |
| Net asset value — Beginning of year | $88.32 | $69.29 | $87.38 | $70.35 | $57.57 |
| Income (Loss) From Operations | | | | | |
| Net investment income(1) | $0.65 | $0.71 | $0.64 | $0.51 | $0.59 |
| Net realized and unrealized gain (loss) | 21.84 | 19.09 | (18.05) | 17.07 | 12.82 |
| Total income (loss) from operations | $22.49 | $19.80 | $(17.41) | $17.58 | $13.41 |
| Less Distributions | | | | | |
| From net investment income | $(0.68) | $(0.77) | $(0.68) | $(0.55) | $(0.63) |
| From net realized gain | (2.05) | — | — | — | — |
| Total distributions | $(2.73) | $(0.77) | $(0.68) | $(0.55) | $(0.63) |
| Net asset value — End of year | $108.08 | $88.32 | $69.29 | $87.38 | $70.35 |
| Total Return(2) | 25.48% | 28.56% | (19.92)% | 25.00% | 23.31% |
| Ratios/Supplemental Data | | | | | |
| Net assets, end of year (000’s omitted) | $425,400 | $331,018 | $240,211 | $297,628 | $227,801 |
| Ratios (as a percentage of average daily net assets):(3)(4) | | | | | |
| Total expenses | 0.46% | 0.50% | 0.49% | 0.48% | 0.51% |
| Net expenses | 0.46%(5) | 0.50%(5) | 0.49%(5) | 0.48% | 0.51% |
| Net investment income | 0.64% | 0.90% | 0.87% | 0.64% | 1.01% |
| Portfolio Turnover of the Portfolio(6) | 7% | 7% | 3% | 1% | 1% |
| (1) | Computed using average shares outstanding. |
| (2) | Returns are historical and are calculated by determining the percentage change in net asset value with all distributions reinvested. |
| (3) | Total expenses do not reflect amounts reimbursed and/or waived by the adviser and certain of its affiliates, if applicable. Net expenses are net of all reductions and represent the net expenses paid by the Fund. |
| (4) | Includes the Fund’s share of the Portfolio’s allocated expenses. |
| (5) | Includes a reduction by the investment adviser of a portion of the Portfolio’s adviser fee due to the Portfolio’s investment in the Liquidity Fund (equal to less than 0.005% of average daily net assets for the years ended December 31, 2024, 2023 and 2022). |
| (6) | Excludes the value of portfolio securities contributed or distributed as a result of in-kind shareholder transactions. |
7
See Notes to Financial Statements.
Eaton Vance
Tax-Managed Growth Funds 1.1 and 1.2
December 31, 2024
Financial Highlights — continued
| | Tax-Managed Growth Fund 1.2 — Class A |
| | Year Ended December 31, |
| | 2024 | 2023 | 2022 | 2021 | 2020 |
| Net asset value — Beginning of year | $42.72 | $33.50 | $42.19 | $33.95 | $27.77 |
| Income (Loss) From Operations | | | | | |
| Net investment income(1) | $0.11 | $0.19 | $0.17 | $0.09 | $0.17 |
| Net realized and unrealized gain (loss) | 10.54 | 9.22 | (8.70) | 8.22 | 6.17 |
| Total income (loss) from operations | $10.65 | $9.41 | $(8.53) | $8.31 | $6.34 |
| Less Distributions | | | | | |
| From net investment income | $(0.10) | $(0.19) | $(0.16) | $(0.07) | $(0.16) |
| From net realized gain | (0.70) | — | — | — | — |
| Total distributions | $(0.80) | $(0.19) | $(0.16) | $(0.07) | $(0.16) |
| Net asset value — End of year | $52.57 | $42.72 | $33.50 | $42.19 | $33.95 |
| Total Return(2) | 24.96% | 28.05% | (20.23)% | 24.48% | 22.84% |
| Ratios/Supplemental Data | | | | | |
| Net assets, end of year (000’s omitted) | $1,040,208 | $854,181 | $689,946 | $894,809 | $736,814 |
| Ratios (as a percentage of average daily net assets):(3)(4) | | | | | |
| Total expenses | 0.87% | 0.89% | 0.89% | 0.88% | 0.92% |
| Net expenses | 0.87%(5) | 0.89%(5) | 0.89%(5) | 0.88% | 0.92% |
| Net investment income | 0.23% | 0.51% | 0.46% | 0.24% | 0.61% |
| Portfolio Turnover of the Portfolio(6) | 7% | 7% | 3% | 1% | 1% |
| (1) | Computed using average shares outstanding. |
| (2) | Returns are historical and are calculated by determining the percentage change in net asset value with all distributions reinvested and do not reflect the effect of sales charges. |
| (3) | Total expenses do not reflect amounts reimbursed and/or waived by the adviser and certain of its affiliates, if applicable. Net expenses are net of all reductions and represent the net expenses paid by the Fund. |
| (4) | Includes the Fund’s share of the Portfolio’s allocated expenses. |
| (5) | Includes a reduction by the investment adviser of a portion of the Portfolio’s adviser fee due to the Portfolio’s investment in the Liquidity Fund (equal to less than 0.005% of average daily net assets for the years ended December 31, 2024, 2023 and 2022). |
| (6) | Excludes the value of portfolio securities contributed or distributed as a result of in-kind shareholder transactions. |
8
See Notes to Financial Statements.
Eaton Vance
Tax-Managed Growth Funds 1.1 and 1.2
December 31, 2024
Financial Highlights — continued
| | Tax-Managed Growth Fund 1.2 — Class C |
| | Year Ended December 31, |
| | 2024 | 2023 | 2022 | 2021 | 2020 |
| Net asset value — Beginning of year | $40.98 | $32.24 | $40.72 | $32.96 | $27.03 |
| Income (Loss) From Operations | | | | | |
| Net investment loss(1) | $(0.24) | $(0.09) | $(0.10) | $(0.19) | $(0.04) |
| Net realized and unrealized gain (loss) | 10.08 | 8.83 | (8.38) | 7.95 | 5.97 |
| Total income (loss) from operations | $9.84 | $8.74 | $(8.48) | $7.76 | $5.93 |
| Less Distributions | | | | | |
| From net realized gain | $(0.70) | $— | $— | $— | $— |
| Total distributions | $(0.70) | $— | $— | $— | $— |
| Net asset value — End of year | $50.12 | $40.98 | $32.24 | $40.72 | $32.96 |
| Total Return(2) | 24.01% | 27.11% | (20.83)% | 23.54% | 21.94% |
| Ratios/Supplemental Data | | | | | |
| Net assets, end of year (000’s omitted) | $53,953 | $47,967 | $43,673 | $61,484 | $54,119 |
| Ratios (as a percentage of average daily net assets):(3)(4) | | | | | |
| Total expenses | 1.62% | 1.64% | 1.65% | 1.63% | 1.67% |
| Net expenses | 1.62%(5) | 1.64%(5) | 1.65%(5) | 1.63% | 1.67% |
| Net investment loss | (0.52)% | (0.24)% | (0.29)% | (0.51)% | (0.14)% |
| Portfolio Turnover of the Portfolio(6) | 7% | 7% | 3% | 1% | 1% |
| (1) | Computed using average shares outstanding. |
| (2) | Returns are historical and are calculated by determining the percentage change in net asset value with all distributions reinvested and do not reflect the effect of sales charges. |
| (3) | Total expenses do not reflect amounts reimbursed and/or waived by the adviser and certain of its affiliates, if applicable. Net expenses are net of all reductions and represent the net expenses paid by the Fund. |
| (4) | Includes the Fund’s share of the Portfolio’s allocated expenses. |
| (5) | Includes a reduction by the investment adviser of a portion of the Portfolio’s adviser fee due to the Portfolio’s investment in the Liquidity Fund (equal to less than 0.005% of average daily net assets for the years ended December 31, 2024, 2023 and 2022). |
| (6) | Excludes the value of portfolio securities contributed or distributed as a result of in-kind shareholder transactions. |
9
See Notes to Financial Statements.
Eaton Vance
Tax-Managed Growth Funds 1.1 and 1.2
December 31, 2024
Financial Highlights — continued
| | Tax-Managed Growth Fund 1.2 — Class I |
| | Year Ended December 31, |
| | 2024 | 2023 | 2022 | 2021 | 2020 |
| Net asset value — Beginning of year | $42.82 | $33.58 | $42.29 | $34.03 | $27.83 |
| Income (Loss) From Operations | | | | | |
| Net investment income(1) | $0.24 | $0.29 | $0.26 | $0.19 | $0.24 |
| Net realized and unrealized gain (loss) | 10.58 | 9.24 | (8.72) | 8.24 | 6.19 |
| Total income (loss) from operations | $10.82 | $9.53 | $(8.46) | $8.43 | $6.43 |
| Less Distributions | | | | | |
| From net investment income | $(0.22) | $(0.29) | $(0.25) | $(0.17) | $(0.23) |
| From net realized gain | (0.70) | — | — | — | — |
| Total distributions | $(0.92) | $(0.29) | $(0.25) | $(0.17) | $(0.23) |
| Net asset value — End of year | $52.72 | $42.82 | $33.58 | $42.29 | $34.03 |
| Total Return(2) | 25.27% | 28.37% | (20.01)% | 24.77% | 23.13% |
| Ratios/Supplemental Data | | | | | |
| Net assets, end of year (000’s omitted) | $425,642 | $337,129 | $260,923 | $326,586 | $256,802 |
| Ratios (as a percentage of average daily net assets):(3)(4) | | | | | |
| Total expenses | 0.62% | 0.64% | 0.64% | 0.63% | 0.67% |
| Net expenses | 0.62%(5) | 0.64%(5) | 0.64%(5) | 0.63% | 0.67% |
| Net investment income | 0.48% | 0.75% | 0.72% | 0.49% | 0.85% |
| Portfolio Turnover of the Portfolio(6) | 7% | 7% | 3% | 1% | 1% |
| (1) | Computed using average shares outstanding. |
| (2) | Returns are historical and are calculated by determining the percentage change in net asset value with all distributions reinvested. |
| (3) | Total expenses do not reflect amounts reimbursed and/or waived by the adviser and certain of its affiliates, if applicable. Net expenses are net of all reductions and represent the net expenses paid by the Fund. |
| (4) | Includes the Fund’s share of the Portfolio’s allocated expenses. |
| (5) | Includes a reduction by the investment adviser of a portion of the Portfolio’s adviser fee due to the Portfolio’s investment in the Liquidity Fund (equal to less than 0.005% of average daily net assets for the years ended December 31, 2024, 2023 and 2022). |
| (6) | Excludes the value of portfolio securities contributed or distributed as a result of in-kind shareholder transactions. |
10
See Notes to Financial Statements.
Eaton Vance
Tax-Managed Growth Funds 1.1 and 1.2
December 31, 2024
Notes to Financial Statements
1 Significant Accounting Policies
Eaton Vance Tax-Managed Growth Fund 1.1 (Tax-Managed Growth Fund 1.1) and Eaton Vance Tax-Managed Growth Fund 1.2 (Tax-Managed Growth Fund 1.2) (each a Fund, and collectively the Funds) are diversified series of the Eaton Vance Mutual Funds Trust (the Trust). The Trust is a Massachusetts business trust registered under the Investment Company Act of 1940, as amended (the 1940 Act), as an open-end management investment company. Each Fund currently offers Class A, Class C and Class I shares. Class A shares are generally sold subject to a sales charge imposed at time of purchase. Class C shares are sold at net asset value and are generally subject to a contingent deferred sales charge (see Note 5). Effective November 5, 2020, Class C shares automatically convert to Class A shares eight years after their purchase as described in the Fund’s prospectus. Class I shares are sold at net asset value and are not subject to a sales charge. Tax-Managed Growth Fund 1.1 is closed to new investors. Each class represents a pro rata interest in each Fund, but votes separately on class-specific matters and (as noted below) is subject to different expenses. Realized and unrealized gains and losses and net investment income and losses, other than class-specific expenses, are allocated daily to each class of shares based on the relative net assets of each class to the total net assets of each Fund. Each class of shares differs in its distribution plan and certain other class-specific expenses. Each Fund typically invests its assets in interests in Tax-Managed Growth Portfolio (the Portfolio), a Massachusetts business trust, having the same investment objective and policies as the Funds. The value of each Fund’s investment in the Portfolio reflects the Fund’s proportionate interest in the net assets of the Portfolio (45.0% and 25.5% for Tax-Managed Growth Fund 1.1 and Tax-Managed Growth Fund 1.2, respectively, at December 31, 2024). The performance of each Fund is directly affected by the performance of the Portfolio. The financial statements of the Portfolio, including the portfolio of investments, are included elsewhere in this report and should be read in conjunction with the Funds’ financial statements.
The following is a summary of significant accounting policies of the Funds. The policies are in conformity with accounting principles generally accepted in the United States of America (U.S. GAAP). Each Fund is an investment company and follows accounting and reporting guidance in the Financial Accounting Standards Board (FASB) Accounting Standards Codification Topic 946 “Financial Services-Investment Companies.”
A Investment Valuation—Valuation of securities by the Portfolio is discussed in Note 1A of the Portfolio's Notes to Financial Statements, which are included elsewhere in this report.
B Income—Each Fund's net investment income or loss consists of the Fund's pro rata share of the net investment income or loss of the Portfolio, less all actual and accrued expenses of each Fund.
C Federal Taxes—Each Fund's policy is to comply with the provisions of the Internal Revenue Code applicable to regulated investment companies and to distribute to shareholders each year substantially all of its net investment income, and all or substantially all of its net realized capital gains. Accordingly, no provision for federal income or excise tax is necessary.
As of December 31, 2024, the Funds had no uncertain tax positions that would require financial statement recognition, de-recognition, or disclosure. Each Fund files a U.S. federal income tax return annually after its fiscal year-end, which is subject to examination by the Internal Revenue Service for a period of three years from the date of filing.
D Expenses—The majority of expenses of the Trust are directly identifiable to an individual fund. Expenses which are not readily identifiable to a specific fund are allocated taking into consideration, among other things, the nature and type of expense and the relative size of the funds.
E Use of Estimates—The preparation of the financial statements in conformity with U.S. GAAP requires management to make estimates and assumptions that affect the reported amounts of assets and liabilities at the date of the financial statements and the reported amounts of income and expense during the reporting period. Actual results could differ from those estimates.
F Indemnifications—Under the Trust’s organizational documents, its officers and Trustees may be indemnified against certain liabilities and expenses arising out of the performance of their duties to each Fund. Under Massachusetts law, if certain conditions prevail, shareholders of a Massachusetts business trust (such as the Trust) could be deemed to have personal liability for the obligations of the Trust. However, the Trust’s Declaration of Trust contains an express disclaimer of liability on the part of Fund shareholders and the By-laws provide that the Trust shall assume, upon request by the shareholder, the defense on behalf of any Fund shareholders. Moreover, the By-laws also provide for indemnification out of Fund property of any shareholder held personally liable solely by reason of being or having been a shareholder for all loss or expense arising from such liability. Additionally, in the normal course of business, each Fund enters into agreements with service providers that may contain indemnification clauses. Each Fund’s maximum exposure under these arrangements is unknown as this would involve future claims that may be made against each Fund that have not yet occurred.
G Other—Investment transactions are accounted for on a trade date basis.
H Segment Reporting—During the year ended December 31, 2024, each Fund adopted FASB Accounting Standards Update No. 2023-07, Segment Reporting (Topic 280): Improvements to Reportable Segment Disclosures, (ASU 2023-07), which requires incremental disclosures related to a public entity’s reportable segments. Each Fund operates as a single reportable segment, an investment company whose investment objective is included in Note 1. In connection with the adoption of ASU 2023-07, the Funds’ President has been designated as each Fund’s Chief Operating Decision Maker (CODM), who is responsible for assessing the performance of each Fund’s single segment and deciding how to allocate the segment’s resources. To perform this function, the CODM reviews the information in the Funds’ Financial Statements.
Eaton Vance
Tax-Managed Growth Funds 1.1 and 1.2
December 31, 2024
Notes to Financial Statements — continued
2 Distributions to Shareholders and Income Tax Information
It is the present policy of each Fund to make at least one distribution annually (normally in December) of all or substantially all of its net investment income and to distribute annually all or substantially all of its net realized capital gains (reduced by available capital loss carryforwards from prior years). Distributions to shareholders are recorded on the ex-dividend date. Distributions are declared separately for each class of shares. Shareholders may reinvest income and capital gain distributions in additional shares of the same class of a Fund at the net asset value as of the ex-dividend date or, at the election of the shareholder, receive distributions in cash. Distributions to shareholders are determined in accordance with income tax regulations, which may differ from U.S. GAAP. As required by U.S. GAAP, only distributions in excess of tax basis earnings and profits are reported in the financial statements as a return of capital. Permanent differences between book and tax accounting relating to distributions are reclassified to paid-in capital. For tax purposes, distributions from short-term capital gains are considered to be from ordinary income.
The tax character of distributions declared for the years ended December 31, 2024 and December 31, 2023 was as follows:
| | Year Ended December 31, 2024 |
| | Tax-Managed
Growth Fund 1.1 | Tax-Managed
Growth Fund 1.2 |
| Distributions declared from: | | |
| Ordinary income | $10,387,649 | $3,690,327 |
| Long-term capital gains | $47,123,432 | $20,063,884 |
| | Year Ended December 31, 2023 |
| | Tax-Managed
Growth Fund 1.1 | Tax-Managed
Growth Fund 1.2 |
| Distributions declared from: | | |
| Ordinary income | $13,907,624 | $5,971,968 |
During the year ended December 31, 2024, the following amounts were reclassified due to the Fund's use of equalization accounting and differences between book and tax accounting for the Fund's investment in the Portfolio. Tax equalization accounting allows the Funds to treat as a distribution that portion of redemption proceeds representing a redeeming shareholder’s portion of undistributed taxable income and net capital gains.
| | Tax-Managed
Growth Fund 1.1 | Tax-Managed
Growth Fund 1.2 |
| Change in: | | |
| Paid-in capital | $61,347,405 | $13,269,479 |
| Distributable earnings | $(61,347,405) | $(13,269,479) |
These reclassifications had no effect on the net assets or net asset value per share of the Funds.
As of December 31, 2024, the components of distributable earnings (accumulated loss) and unrealized appreciation (depreciation) on a tax basis were as follows:
| | Tax-Managed
Growth Fund 1.1 | Tax-Managed
Growth Fund 1.2 |
| Undistributed ordinary income | $ 279,389 | $ 154,336 |
| Undistributed long-term capital gains | 10,173,143 | 5,311,387 |
| Net unrealized appreciation | 1,540,797,733 | 696,137,734 |
| Distributable earnings | $1,551,250,265 | $701,603,457 |
Eaton Vance
Tax-Managed Growth Funds 1.1 and 1.2
December 31, 2024
Notes to Financial Statements — continued
3 Investment Adviser and Administration Fee and Other Transactions with Affiliates
The investment adviser and administration fee is earned by Eaton Vance Management (EVM), an indirect, wholly-owned subsidiary of Morgan Stanley, as compensation for investment advisory and administrative services rendered to each Fund. The fee is computed at an annual rate as a percentage of average daily net assets as follows and is payable monthly:
| Average Daily Net Assets | Annual Fee Rate |
| Up to $500 million | 0.5575% |
| $500 million but less than $1 billion | 0.4950% |
| $1 billion but less than $1.5 billion | 0.4325% |
| $1.5 billion but less than $7 billion | 0.3700% |
| $7 billion but less than $10 billion | 0.3575% |
| $10 billion but less than $15 billion | 0.3450% |
| $15 billion but less than $20 billion | 0.3325% |
| $20 billion but less than $25 billion | 0.3225% |
| $25 billion but less than $30 billion | 0.3125% |
| $30 billion but less than $35 billion | 0.3020% |
| $35 billion but less than $45 billion | 0.2970% |
| $45 billion and over | 0.2920% |
For the year ended December 31, 2024, the Funds incurred no investment adviser fee on such assets. To the extent each Fund’s assets are invested in the Portfolio, each Fund is allocated its pro rata share of the Portfolio’s investment adviser fee. The Portfolio has engaged Boston Management and Research (BMR) to render investment advisory services. See Note 2 of the Portfolio’s Notes to Financial Statements which are included elsewhere in this report. EVM serves as the administrator of the Funds. EVM receives no compensation from Tax-Managed Growth Fund 1.1 for such services and an administration fee computed at an annual rate of 0.15% of average daily net assets from Tax-Managed Growth Fund 1.2 for such services. For the year ended December 31, 2024, the administration fee for Tax-Managed Growth Fund 1.2 amounted to $2,121,642.
EVM provides sub-transfer agency and related services to the Funds pursuant to a Sub-Transfer Agency Support Services Agreement. Eaton Vance Distributors, Inc. (EVD), an affiliate of EVM and the Funds' principal underwriter, received a portion of the sales charge on sales of Class A shares of the Funds. Morgan Stanley affiliated broker-dealers, which may be deemed to be affiliates of BMR, EVM and EVD, also received a portion of the sales charge on sales of Class A shares. EVD also received distribution and service fees from Class A and Class C shares (see Note 4) and contingent deferred sales charges (see Note 5). Sub-transfer agent fees earned by EVM, which are included in transfer and dividend disbursing agent fees on the Statements of Operations, and Class A sales charges that the Funds were informed were received by EVD and Morgan Stanley affiliated broker-dealers for year ended December 31, 2024 were as follows:
| | Tax-Managed
Growth Fund 1.1 | Tax-Managed
Growth Fund 1.2 |
| EVM's Sub-Transfer Agent Fees | $175,994 | $63,457 |
| EVD's Class A Sales Charges | $10,264 | $55,679 |
| Morgan Stanley affiliated broker-dealers’ Class A Sales Charges | $2,744 | $4,305 |
Trustees and officers of the Funds who are members of EVM’s or BMR's organizations receive remuneration for their services to the Funds out of the investment adviser fee. Certain officers and Trustees of the Funds and the Portfolio are officers of the above organizations.
Eaton Vance
Tax-Managed Growth Funds 1.1 and 1.2
December 31, 2024
Notes to Financial Statements — continued
4 Distribution Plans
Each Fund has in effect a distribution plan for Class A shares (Class A Plan) pursuant to Rule 12b-1 under the 1940 Act. Pursuant to the Class A Plan, each Fund pays EVD a distribution and service fee of 0.25% per annum of its average daily net assets attributable to Class A shares for distribution services and facilities provided to each Fund by EVD, as well as for personal services and/or the maintenance of shareholder accounts. Distribution and service fees paid or accrued to EVD for the year ended December 31, 2024 for Class A shares amounted to the following:
| | Tax-Managed
Growth Fund 1.1 | Tax-Managed
Growth Fund 1.2 |
| Class A Distribution and Service Fees | $5,348,658 | $2,425,669 |
Each Fund also has in effect a distribution plan for Class C shares (Class C Plan) pursuant to Rule 12b-1 under the 1940 Act. Pursuant to the Class C Plan each Fund pays EVD amounts equal to 0.75% per annum of its average daily net assets attributable to Class C shares for providing ongoing distribution services and facilities to the respective Funds. For the year ended December 31, 2024, the Funds paid or accrued to EVD the following distribution fees for Class C shares:
| | Tax-Managed
Growth Fund 1.1 | Tax-Managed
Growth Fund 1.2 |
| Class C Distribution Fees | $42,451 | $391,862 |
Pursuant to the Class C Plan, each Fund also make payments of service fees to EVD, financial intermediaries and other persons in amounts equal to 0.25% per annum of the average daily net assets attributable to that class. Service fees paid or accrued are for personal services and/or the maintenance of shareholder accounts. They are separate and distinct from the sales commissions and distribution fees payable to EVD. Service fees paid or accrued for the year ended December 31, 2024 amounted to the following for Class C shares:
| | Tax-Managed
Growth Fund 1.1 | Tax-Managed
Growth Fund 1.2 |
| Class C Service Fees | $14,150 | $130,621 |
Distribution and service fees are subject to the limitations contained in the Financial Industry Regulatory Authority Rule 2341(d).
5 Contingent Deferred Sales Charges
A contingent deferred sales charge (CDSC) of 1% generally is imposed on redemptions of Class C shares made within 12 months of purchase. Class A shares may be subject to a 1% CDSC if redeemed within 12 months of purchase (depending on the circumstances of purchase). Generally, the CDSC is based upon the lower of the net asset value at date of redemption or date of purchase. No charge is levied on shares acquired by reinvestment of dividends or capital gain distributions. For the year ended December 31, 2024, the Funds were informed that EVD received the following amounts of CDSCs paid by Class A and Class C shareholders:
| | Tax-Managed
Growth Fund 1.1 | Tax-Managed
Growth Fund 1.2 |
| Class A | $ — | $ —(1) |
| Class C | $ —(1) | $1,046 |
| (1) | Amount is less than $100. |
Eaton Vance
Tax-Managed Growth Funds 1.1 and 1.2
December 31, 2024
Notes to Financial Statements — continued
6 Investment Transactions
For the year ended December 31, 2024, increases and decreases in each Fund's investments in the Portfolio aggregated, as follows:
| Fund | Increases | Decreases |
| Tax-Managed Growth Fund 1.1 | $597,776 | $138,937,714 |
| Tax-Managed Growth Fund 1.2 | $13,561,192 | $43,000,986 |
Decreases in each Fund's investment in the Portfolio include distributions of securities as the result of redemptions in-kind, as follows:
| Fund | Redemptions in-kind |
| Tax-Managed Growth Fund 1.1 | $72,688,505 |
| Tax-Managed Growth Fund 1.2 | $18,822,411 |
7 Shares of Beneficial Interest
Each Fund’s Declaration of Trust permits the Trustees to issue an unlimited number of full and fractional shares of beneficial interest (without par value). Such shares may be issued in a number of different series (such as the Funds) and classes. Sales and redemptions of Class I shares include shares purchased and redeemed in connection with the ReFlow liquidity program, a program designed to provide an alternative liquidity source for mutual funds experiencing net redemptions of their shares. Transactions in Fund shares, including direct exchanges pursuant to share class conversions for all periods presented, were as follows:
| Tax-Managed Growth Fund 1.1 | | | |
| | | Year Ended
December 31, 2024 | | Year Ended
December 31, 2023 |
| | | Shares | Amount | Shares | Amount |
| Class A | | | | | |
| Sales | | 136,481 | $ 15,040,488 | 87,027 | $ 7,401,737 |
| Issued to shareholders electing to receive payments of distributions in Fund shares | | 345,190 | 40,111,048 | 99,334 | 9,452,625 |
| Redemptions | | (1,365,466) | (148,104,033) | (1,415,112) | (121,117,982) |
| Net decrease | | (883,795) | $(92,952,497) | (1,228,751) | $(104,263,620) |
| Class C | | | | | |
| Sales | | 1,938 | $ 185,299 | 3,003 | $ 221,476 |
| Issued to shareholders electing to receive payments of distributions in Fund shares | | 731 | 75,323 | — | — |
| Redemptions | | (21,977) | (2,110,661) | (18,066) | (1,363,169) |
| Net decrease | | (19,308) | $ (1,850,039) | (15,063) | $ (1,141,693) |
| Class I | | | | | |
| Sales | | 1,150,527 | $115,169,386 | 1,466,176 | $116,507,251 |
| Issued to shareholders electing to receive payments of distributions in Fund shares | | 85,916 | 9,271,208 | 27,698 | 2,451,513 |
| Redemptions | | (1,048,434) | (104,539,462) | (1,212,568) | (95,719,873) |
| Net increase | | 188,009 | $ 19,901,132 | 281,306 | $ 23,238,891 |
Eaton Vance
Tax-Managed Growth Funds 1.1 and 1.2
December 31, 2024
Notes to Financial Statements — continued
| Tax-Managed Growth Fund 1.2 | | | |
| | | Year Ended
December 31, 2024 | | Year Ended
December 31, 2023 |
| | | Shares | Amount | Shares | Amount |
| Class A | | | | | |
| Sales | | 762,875 | $37,742,555 | 712,652 | $27,465,299 |
| Issued to shareholders electing to receive payments of distributions in Fund shares | | 268,409 | 14,091,465 | 78,737 | 3,370,736 |
| Redemptions | | (1,242,447) | (60,852,906) | (1,389,390) | (53,272,793) |
| Net decrease | | (211,163) | $(9,018,886) | (598,001) | $(22,436,758) |
| Class C | | | | | |
| Sales | | 155,808 | $ 7,387,394 | 152,687 | $ 5,662,028 |
| Issued to shareholders electing to receive payments of distributions in Fund shares | | 14,228 | 712,255 | — | — |
| Redemptions | | (264,095) | (12,430,825) | (336,827) | (12,240,865) |
| Net decrease | | (94,059) | $(4,331,176) | (184,140) | $(6,578,837) |
| Class I | | | | | |
| Sales | | 1,173,021 | $57,289,344 | 1,623,779 | $62,042,021 |
| Issued to shareholders electing to receive payments of distributions in Fund shares | | 130,559 | 6,872,642 | 48,137 | 2,066,034 |
| Redemptions | | (1,102,679) | (54,076,136) | (1,570,170) | (59,592,168) |
| Net increase | | 200,901 | $10,085,850 | 101,746 | $ 4,515,887 |
Eaton Vance
Tax-Managed Growth Funds 1.1 and 1.2
December 31, 2024
Report of Independent Registered Public Accounting Firm
To the Trustees of Eaton Vance Mutual Funds Trust and Shareholders of Eaton Vance Tax-Managed Growth Fund 1.1 and Eaton Vance Tax-Managed Growth Fund 1.2:
Opinion on the Financial Statements and Financial Highlights
We have audited the accompanying statements of assets and liabilities of Eaton Vance Tax-Managed Growth Fund 1.1 and Eaton Vance Tax-Managed Growth Fund 1.2 (collectively the “Funds”) (each a fund constituting Eaton Vance Mutual Funds Trust), as of December 31, 2024, the related statements of operations for the year then ended, the statements of changes in net assets for each of the two years in the period then ended, the financial highlights for each of the five years in the period then ended, and the related notes. In our opinion, the financial statements and financial highlights present fairly, in all material respects, the financial position of the Funds as of December 31, 2024, and the results of their operations for the year then ended, the changes in their net assets for each of the two years in the period then ended, and the financial highlights for each of the five years in the period then ended, in conformity with accounting principles generally accepted in the United States of America.
Basis for Opinion
These financial statements and financial highlights are the responsibility of the Funds’ management. Our responsibility is to express an opinion on the Funds' financial statements and financial highlights based on our audits. We are a public accounting firm registered with the Public Company Accounting Oversight Board (United States) (PCAOB) and are required to be independent with respect to the Funds in accordance with the U.S. federal securities laws and the applicable rules and regulations of the Securities and Exchange Commission and the PCAOB.
We conducted our audits in accordance with the standards of the PCAOB. Those standards require that we plan and perform the audits to obtain reasonable assurance about whether the financial statements and financial highlights are free of material misstatement, whether due to error or fraud. The Funds are not required to have, nor were we engaged to perform, an audit of their internal control over financial reporting. As part of our audits, we are required to obtain an understanding of internal control over financial reporting but not for the purpose of expressing an opinion on the effectiveness of the Funds’ internal control over financial reporting. Accordingly, we express no such opinion.
Our audits included performing procedures to assess the risks of material misstatement of the financial statements and financial highlights, whether due to error or fraud, and performing procedures that respond to those risks. Such procedures included examining, on a test basis, evidence regarding the amounts and disclosures in the financial statements and financial highlights. Our audits also included evaluating the accounting principles used and significant estimates made by management, as well as evaluating the overall presentation of the financial statements and financial highlights. We believe that our audits provide a reasonable basis for our opinion.
/s/ Deloitte & Touche LLP
Boston, Massachusetts
February 21, 2025
We have served as the auditor of one or more Eaton Vance investment companies since 1959.
Eaton Vance
Tax-Managed Growth Funds 1.1 and 1.2
December 31, 2024
Federal Tax Information (Unaudited)
The Form 1099-DIV you received in February 2025 showed the tax status of all distributions paid to your account in calendar year 2024. Shareholders are advised to consult their own tax adviser with respect to the tax consequences of their investment in the Fund. As required by the Internal Revenue Code and/or regulations, shareholders must be notified regarding the status of qualified dividend income for individuals, the dividends received deduction for corporations and capital gains dividends.
Qualified Dividend Income. For the fiscal year ended December 31, 2024, the Funds designate approximately the following amounts, or up to the maximum amount of such dividends allowable pursuant to the Internal Revenue Code, as qualified dividend income eligible for the reduced tax rate of 15%.
| Tax-Managed Growth Fund 1.1 | $27,118,376 |
| Tax-Managed Growth Fund 1.2 | $15,136,793 |
Dividends Received Deduction. Corporate shareholders are generally entitled to take the dividends received deduction on the portion of the Funds’ dividend distribution that qualifies under tax law. For the Funds’ fiscal 2024 ordinary income dividends, the following amounts qualify for the corporate dividends received deduction:
| Tax-Managed Growth Fund 1.1 | 100.00% |
| Tax-Managed Growth Fund 1.2 | 100.00% |
Capital Gains Dividends. The Funds hereby designate as a capital gain dividend with respect to the taxable year ended December 31, 2024, the following amounts or, if subsequently determined to be different, the net capital gain of such year:
| Tax-Managed Growth Fund 1.1 | $59,325,901 |
| Tax-Managed Growth Fund 1.2 | $26,120,242 |
Tax-Managed Growth Portfolio
December 31, 2024
| Security | Shares | Value |
| Aerospace & Defense — 1.6% |
| Boeing Co.(1) | | 142,446 | $ 25,212,942 |
| General Dynamics Corp. | | 37,550 | 9,894,050 |
| General Electric Co. | | 163,119 | 27,206,618 |
| Lockheed Martin Corp. | | 18,733 | 9,103,114 |
| Northrop Grumman Corp. | | 16,117 | 7,563,547 |
| RTX Corp. | | 156,984 | 18,166,188 |
| | | | $ 97,146,459 |
| Air Freight & Logistics — 0.7% |
| C.H. Robinson Worldwide, Inc. | | 70,510 | $ 7,285,093 |
| FedEx Corp. | | 76,229 | 21,445,504 |
| United Parcel Service, Inc., Class B | | 100,397 | 12,660,062 |
| | | | $ 41,390,659 |
| Banks — 3.7% |
| Bank of America Corp. | | 478,599 | $ 21,034,426 |
| Fifth Third Bancorp | | 491,355 | 20,774,489 |
| JPMorgan Chase & Co. | | 514,622 | 123,360,040 |
| Regions Financial Corp. | | 261,997 | 6,162,170 |
| Truist Financial Corp. | | 311,559 | 13,515,429 |
| U.S. Bancorp | | 38,613 | 1,846,860 |
| Wells Fargo & Co. | | 446,596 | 31,368,903 |
| | | | $ 218,062,317 |
| Beverages — 1.0% |
| Monster Beverage Corp.(1) | | 527,992 | $ 27,751,260 |
| PepsiCo, Inc. | | 228,875 | 34,802,732 |
| | | | $ 62,553,992 |
| Biotechnology — 2.0% |
| AbbVie, Inc. | | 193,103 | $ 34,314,403 |
| Amgen, Inc. | | 97,100 | 25,308,144 |
| Argenx SE ADR(1) | | 41,279 | 25,386,585 |
| Gilead Sciences, Inc. | | 32,862 | 3,035,463 |
| Vertex Pharmaceuticals, Inc.(1) | | 83,684 | 33,699,547 |
| | | | $ 121,744,142 |
| Broadline Retail — 5.5% |
| Amazon.com, Inc.(1) | | 1,484,500 | $ 325,684,455 |
| | | | $ 325,684,455 |
| Security | Shares | Value |
| Building Products — 0.2% |
| Carrier Global Corp. | | 189,214 | $ 12,915,748 |
| | | | $ 12,915,748 |
| Capital Markets — 3.3% |
| Bank of New York Mellon Corp. | | 127,633 | $ 9,806,043 |
| Blackrock, Inc. | | 7,289 | 7,472,027 |
| Cboe Global Markets, Inc. | | 75,857 | 14,822,458 |
| Charles Schwab Corp. | | 371,381 | 27,485,908 |
| CME Group, Inc. | | 36,417 | 8,457,120 |
| Goldman Sachs Group, Inc. | | 123,352 | 70,633,822 |
| Intercontinental Exchange, Inc. | | 60,970 | 9,085,140 |
| Moody's Corp. | | 66,944 | 31,689,281 |
| S&P Global, Inc. | | 32,008 | 15,940,944 |
| | | | $ 195,392,743 |
| Chemicals — 1.6% |
| DuPont de Nemours, Inc. | | 142,744 | $ 10,884,230 |
| Ecolab, Inc. | | 110,020 | 25,779,886 |
| Linde PLC | | 72,347 | 30,289,519 |
| PPG Industries, Inc. | | 89,144 | 10,648,251 |
| Sherwin-Williams Co. | | 61,482 | 20,899,576 |
| | | | $ 98,501,462 |
| Commercial Services & Supplies — 0.5% |
| Waste Connections, Inc. | | 57,850 | $ 9,925,903 |
| Waste Management, Inc. | | 108,692 | 21,932,959 |
| | | | $ 31,858,862 |
| Communications Equipment — 1.4% |
| Arista Networks, Inc.(1) | | 482,544 | $ 53,335,588 |
| Cisco Systems, Inc. | | 517,461 | 30,633,691 |
| | | | $ 83,969,279 |
| Consumer Finance — 1.0% |
| American Express Co. | | 120,073 | $ 35,636,466 |
| Discover Financial Services | | 144,856 | 25,093,405 |
| | | | $ 60,729,871 |
| Consumer Staples Distribution & Retail — 2.8% |
| Costco Wholesale Corp. | | 81,331 | $ 74,521,155 |
| Walmart, Inc. | | 1,029,000 | 92,970,150 |
| | | | $ 167,491,305 |
19
See Notes to Financial Statements.
Tax-Managed Growth Portfolio
December 31, 2024
Portfolio of Investments — continued
| Security | Shares | Value |
| Electric Utilities — 0.8% |
| Duke Energy Corp. | | 423,733 | $ 45,652,993 |
| | | | $ 45,652,993 |
| Electrical Equipment — 1.0% |
| AMETEK, Inc. | | 54,862 | $ 9,889,424 |
| Emerson Electric Co. | | 269,079 | 33,346,961 |
| Rockwell Automation, Inc. | | 50,722 | 14,495,840 |
| | | | $ 57,732,225 |
| Energy Equipment & Services — 0.1% |
| Schlumberger NV | | 205,631 | $ 7,883,893 |
| | | | $ 7,883,893 |
| Entertainment — 3.0% |
| Netflix, Inc.(1) | | 115,984 | $ 103,378,859 |
| Spotify Technology SA(1) | | 14,600 | 6,531,748 |
| Walt Disney Co. | | 634,448 | 70,645,785 |
| | | | $ 180,556,392 |
| Financial Services — 4.1% |
| Berkshire Hathaway, Inc., Class A(1) | | 84 | $ 57,197,280 |
| Berkshire Hathaway, Inc., Class B(1) | | 224,230 | 101,638,975 |
| Mastercard, Inc., Class A | | 36,635 | 19,290,892 |
| Visa, Inc., Class A | | 212,810 | 67,256,472 |
| | | | $ 245,383,619 |
| Food Products — 0.1% |
| McCormick & Co., Inc., Non Voting Shares | | 96,258 | $ 7,338,710 |
| | | | $ 7,338,710 |
| Ground Transportation — 1.7% |
| Norfolk Southern Corp. | | 65,062 | $ 15,270,052 |
| Uber Technologies, Inc.(1) | | 846,498 | 51,060,759 |
| Union Pacific Corp. | | 148,572 | 33,880,359 |
| | | | $ 100,211,170 |
| Health Care Equipment & Supplies — 2.7% |
| Abbott Laboratories | | 322,303 | $ 36,455,692 |
| Boston Scientific Corp.(1) | | 289,826 | 25,887,258 |
| GE HealthCare Technologies, Inc. | | 135,517 | 10,594,719 |
| Intuitive Surgical, Inc.(1) | | 101,205 | 52,824,962 |
| Stryker Corp. | | 72,313 | 26,036,296 |
| Zimmer Biomet Holdings, Inc. | | 77,057 | 8,139,531 |
| | | | $ 159,938,458 |
| Security | Shares | Value |
| Health Care Providers & Services — 1.5% |
| HCA Healthcare, Inc. | | 64,083 | $ 19,234,513 |
| UnitedHealth Group, Inc. | | 137,254 | 69,431,308 |
| | | | $ 88,665,821 |
| Hotels, Restaurants & Leisure — 2.5% |
| Booking Holdings, Inc. | | 15,827 | $ 78,635,183 |
| Marriott International, Inc., Class A | | 105,779 | 29,505,994 |
| Starbucks Corp. | | 361,156 | 32,955,485 |
| Yum! Brands, Inc. | | 77,693 | 10,423,293 |
| | | | $ 151,519,955 |
| Household Products — 1.2% |
| Colgate-Palmolive Co. | | 397,371 | $ 36,124,998 |
| Procter & Gamble Co. | | 220,699 | 37,000,187 |
| | | | $ 73,125,185 |
| Insurance — 1.7% |
| Aflac, Inc. | | 154,400 | $ 15,971,136 |
| Aon PLC, Class A | | 27,135 | 9,745,806 |
| Arthur J. Gallagher & Co. | | 47,054 | 13,356,278 |
| Markel Group, Inc.(1) | | 6,362 | 10,982,275 |
| Marsh & McLennan Cos., Inc. | | 46,353 | 9,845,841 |
| Progressive Corp. | | 151,029 | 36,188,059 |
| Travelers Cos., Inc. | | 20,353 | 4,902,834 |
| | | | $ 100,992,229 |
| Interactive Media & Services — 9.5% |
| Alphabet, Inc., Class A | | 893,872 | $ 169,209,970 |
| Alphabet, Inc., Class C | | 874,031 | 166,450,464 |
| Meta Platforms, Inc., Class A | | 390,389 | 228,576,663 |
| | | | $ 564,237,097 |
| IT Services — 0.9% |
| Accenture PLC, Class A | | 147,397 | $ 51,852,791 |
| | | | $ 51,852,791 |
| Life Sciences Tools & Services — 1.2% |
| Agilent Technologies, Inc. | | 176,400 | $ 23,697,576 |
| Danaher Corp. | | 216,007 | 49,584,407 |
| | | | $ 73,281,983 |
| Machinery — 1.9% |
| Caterpillar, Inc. | | 55,050 | $ 19,969,938 |
| Deere & Co. | | 32,269 | 13,672,375 |
| Donaldson Co., Inc. | | 69,321 | 4,668,770 |
20
See Notes to Financial Statements.
Tax-Managed Growth Portfolio
December 31, 2024
Portfolio of Investments — continued
| Security | Shares | Value |
| Machinery (continued) |
| Dover Corp. | | 91,335 | $ 17,134,446 |
| Illinois Tool Works, Inc. | | 143,086 | 36,280,886 |
| Otis Worldwide Corp. | | 34,284 | 3,175,041 |
| Parker-Hannifin Corp. | | 31,857 | 20,262,008 |
| | | | $ 115,163,464 |
| Metals & Mining — 0.2% |
| Alcoa Corp. | | 240,000 | $ 9,067,200 |
| | | | $ 9,067,200 |
| Oil, Gas & Consumable Fuels — 2.8% |
| Antero Resources Corp.(1) | | 328,489 | $ 11,513,539 |
| Cheniere Energy, Inc. | | 149,498 | 32,122,635 |
| ConocoPhillips | | 206,715 | 20,499,927 |
| EOG Resources, Inc. | | 13,193 | 1,617,198 |
| Exxon Mobil Corp. | | 789,802 | 84,959,001 |
| Marathon Petroleum Corp. | | 69,217 | 9,655,772 |
| Phillips 66 | | 51,867 | 5,909,207 |
| | | | $ 166,277,279 |
| Pharmaceuticals — 3.4% |
| Bristol-Myers Squibb Co. | | 446,371 | $ 25,246,744 |
| Eli Lilly & Co. | | 125,982 | 97,258,104 |
| Johnson & Johnson | | 267,485 | 38,683,680 |
| Merck & Co., Inc. | | 207,913 | 20,683,185 |
| Zoetis, Inc. | | 120,003 | 19,552,089 |
| | | | $ 201,423,802 |
| Professional Services — 0.7% |
| Automatic Data Processing, Inc. | | 68,245 | $ 19,977,359 |
| Jacobs Solutions, Inc. | | 52,789 | 7,053,666 |
| Verisk Analytics, Inc. | | 46,792 | 12,887,921 |
| | | | $ 39,918,946 |
| Residential REITs — 0.3% |
| Invitation Homes, Inc. | | 522,000 | $ 16,688,340 |
| | | | $ 16,688,340 |
| Semiconductors & Semiconductor Equipment — 9.9% |
| Analog Devices, Inc. | | 133,698 | $ 28,405,477 |
| Applied Materials, Inc. | | 203,182 | 33,043,489 |
| Broadcom, Inc. | | 249,660 | 57,881,174 |
| Lam Research Corp. | | 250,000 | 18,057,500 |
| NVIDIA Corp. | | 2,854,055 | 383,271,046 |
| Security | Shares | Value |
| Semiconductors & Semiconductor Equipment (continued) |
| QUALCOMM, Inc. | | 281,935 | $ 43,310,855 |
| Texas Instruments, Inc. | | 158,452 | 29,711,334 |
| | | | $ 593,680,875 |
| Software — 11.4% |
| Adobe, Inc.(1) | | 80,383 | $ 35,744,712 |
| Cadence Design Systems, Inc.(1) | | 83,984 | 25,233,833 |
| Fortinet, Inc.(1) | | 100,000 | 9,448,000 |
| Intuit, Inc. | | 37,210 | 23,386,485 |
| Microsoft Corp. | | 909,092 | 383,182,278 |
| Nutanix, Inc., Class A(1) | | 378,000 | 23,126,040 |
| Oracle Corp. | | 66,516 | 11,084,226 |
| Palo Alto Networks, Inc.(1) | | 337,264 | 61,368,557 |
| Salesforce, Inc. | | 112,456 | 37,597,415 |
| ServiceNow, Inc.(1) | | 57,283 | 60,726,854 |
| Workday, Inc., Class A(1) | | 34,397 | 8,875,458 |
| | | | $ 679,773,858 |
| Specialty Retail — 2.7% |
| Lowe's Cos., Inc. | | 212,443 | $ 52,430,932 |
| O'Reilly Automotive, Inc.(1) | | 35,400 | 41,977,320 |
| Ross Stores, Inc. | | 139,505 | 21,102,921 |
| TJX Cos., Inc. | | 219,657 | 26,536,762 |
| Tractor Supply Co. | | 250,785 | 13,306,652 |
| Ulta Beauty, Inc.(1) | | 16,851 | 7,329,006 |
| | | | $ 162,683,593 |
| Technology Hardware, Storage & Peripherals — 8.3% |
| Apple, Inc. | | 1,970,119 | $ 493,357,200 |
| | | | $ 493,357,200 |
| Textiles, Apparel & Luxury Goods — 0.5% |
| NIKE, Inc., Class B | | 418,717 | $ 31,684,315 |
| | | | $ 31,684,315 |
| Tobacco — 0.5% |
| Altria Group, Inc. | | 151,295 | $ 7,911,216 |
| Philip Morris International, Inc. | | 162,661 | 19,576,251 |
| | | | $ 27,487,467 |
Total Common Stocks
(identified cost $1,646,423,092) | | | $5,963,020,154 |
21
See Notes to Financial Statements.
Tax-Managed Growth Portfolio
December 31, 2024
Portfolio of Investments — continued
| Short-Term Investments — 0.0%(2) |
| Security | Shares | Value |
| Morgan Stanley Institutional Liquidity Funds - Government Portfolio, Institutional Class, 4.43%(3) | | 2,531,254 | $ 2,531,254 |
Total Short-Term Investments
(identified cost $2,531,254) | | | $ 2,531,254 |
Total Investments — 99.9%
(identified cost $1,648,954,346) | | | $5,965,551,408 |
| Other Assets, Less Liabilities — 0.1% | | | $ 3,450,258 |
| Net Assets — 100.0% | | | $5,969,001,666 |
| The percentage shown for each investment category in the Portfolio of Investments is based on net assets. |
| (1) | Non-income producing security. |
| (2) | Amount is less than 0.05%. |
| (3) | May be deemed to be an affiliated investment company (see Note 6). The rate shown is the annualized seven-day yield as of December 31, 2024. |
| Abbreviations: |
| ADR | – American Depositary Receipt |
| REITs | – Real Estate Investment Trusts |
22
See Notes to Financial Statements.
Tax-Managed Growth Portfolio
December 31, 2024
Statement of Assets and Liabilities
| | December 31, 2024 |
| Assets | |
| Unaffiliated investments, at value (identified cost $1,646,423,092) | $5,963,020,154 |
| Affiliated investments, at value (identified cost $2,531,254) | 2,531,254 |
| Dividends receivable | 3,245,368 |
| Dividends receivable from affiliated investments | 26,187 |
| Receivable for investments sold | 3,039,364 |
| Tax reclaims receivable | 379,031 |
| Trustees' deferred compensation plan | 305,179 |
| Total assets | $5,972,546,537 |
| Liabilities | |
| Payable to affiliates: | |
| Investment adviser fee | $2,082,496 |
| Trustees' fees | 27,125 |
| Trustees' deferred compensation plan | 305,179 |
| Other | 25,022 |
| Payable for custodian fee | 544,825 |
| Accrued expenses | 560,224 |
| Total liabilities | $3,544,871 |
| Net Assets applicable to investors' interest in Portfolio | $5,969,001,666 |
23
See Notes to Financial Statements.
Tax-Managed Growth Portfolio
December 31, 2024
| | Year Ended |
| | December 31, 2024 |
| Investment Income | |
| Dividend income (net of foreign taxes withheld of $327,159) | $61,600,172 |
| Dividend income from affiliated investments | 535,756 |
| Total investment income | $62,135,928 |
| Expenses | |
| Investment adviser fee | $22,726,124 |
| Trustees’ fees and expenses | 108,500 |
| Custodian fee | 913,800 |
| Professional fees | 163,226 |
| Miscellaneous | 259,174 |
| Total expenses | $24,170,824 |
| Deduct: | |
| Waiver and/or reimbursement of expenses by affiliates | $42,990 |
| Total expense reductions | $42,990 |
| Net expenses | $24,127,834 |
| Net investment income | $38,008,094 |
| Realized and Unrealized Gain (Loss) | |
| Net realized gain (loss): | |
| Investment transactions(1) | $280,828,656 |
| Foreign currency transactions | (4,358) |
| Net realized gain | $280,824,298 |
| Change in unrealized appreciation (depreciation): | |
| Investments | $934,545,874 |
| Foreign currency | (23,521) |
| Net change in unrealized appreciation (depreciation) | $934,522,353 |
| Net realized and unrealized gain | $1,215,346,651 |
| Net increase in net assets from operations | $1,253,354,745 |
| (1) | Aggregate amount includes $146,547,127 of net realized gains from redemptions in-kind. |
24
See Notes to Financial Statements.
Tax-Managed Growth Portfolio
December 31, 2024
Statements of Changes in Net Assets
| | Year Ended December 31, |
| | 2024 | 2023 |
| Increase (Decrease) in Net Assets | | |
| From operations: | | |
| Net investment income | $38,008,094 | $52,994,979 |
| Net realized gain | 280,824,298 | 59,644,550 |
| Net change in unrealized appreciation (depreciation) | 934,522,353 | 2,155,004,517 |
| Net increase in net assets from operations | $1,253,354,745 | $2,267,644,046 |
| Capital transactions: | | |
| Contributions | $17,933,624 | $90,713,310 |
| Withdrawals | (337,158,088) | (27,916,548,380) |
| Net decrease in net assets from capital transactions | $(319,224,464) | $(27,825,835,070) |
| Net increase (decrease) in net assets | $934,130,281 | $(25,558,191,024) |
| Net Assets | | |
| At beginning of year | $5,034,871,385 | $30,593,062,409 |
| At end of year | $5,969,001,666 | $5,034,871,385 |
25
See Notes to Financial Statements.
Tax-Managed Growth Portfolio
December 31, 2024
| | Year Ended December 31, |
| Ratios/Supplemental Data | 2024 | 2023 | 2022 | 2021 | 2020 |
| Ratios (as a percentage of average daily net assets):(1) | | | | | |
| Total expenses | 0.43% | 0.43% | 0.43% | 0.43% | 0.44% |
| Net expenses | 0.43%(2) | 0.43%(2) | 0.43%(2) | 0.43% | 0.44% |
| Net investment income | 0.67% | 0.95% | 0.93% | 0.69% | 1.07% |
| Portfolio Turnover(3) | 7% | 7% | 3% | 1% | 1% |
| Total Return | 25.51% | 28.67% | (19.86)% | 25.05% | 23.42% |
| Net assets, end of year (000’s omitted) | $5,969,002 | $5,034,871 | $30,593,062 | $37,312,610 | $27,986,714 |
| (1) | Total expenses do not reflect amounts reimbursed and/or waived by the adviser and certain of its affiliates, if applicable. Net expenses are net of all reductions and represent the net expenses paid by the Portfolio. |
| (2) | Includes a reduction by the investment adviser of a portion of its adviser fee due to the Portfolio’s investment in the Liquidity Fund (equal to less than 0.005% of average daily net assets for the years ended December 31, 2024, 2023 and 2022). |
| (3) | Excludes the value of portfolio securities contributed or distributed as a result of in-kind shareholder transactions. |
26
See Notes to Financial Statements.
Tax-Managed Growth Portfolio
December 31, 2024
Notes to Financial Statements
1 Significant Accounting Policies
Tax-Managed Growth Portfolio (the Portfolio) is a Massachusetts business trust registered under the Investment Company Act of 1940, as amended (the 1940 Act), as a diversified, open-end management investment company. The Portfolio’s investment objective is to achieve long-term, after-tax returns for interestholders through investing in a diversified portfolio of equity securities. The Declaration of Trust permits the Trustees to issue interests in the Portfolio. At December 31, 2024, Eaton Vance Tax-Managed Growth Fund 1.0, Eaton Vance Tax-Managed Growth Fund 1.1, Eaton Vance Tax-Managed Growth Fund 1.2 and Eaton Vance Tax-Managed Equity Asset Allocation Fund held an interest of 24.3%, 45.0%, 25.5%, and 5.2% respectively, in the Portfolio.
The following is a summary of significant accounting policies of the Portfolio. The policies are in conformity with accounting principles generally accepted in the United States of America (U.S. GAAP). The Portfolio is an investment company and follows accounting and reporting guidance in the Financial Accounting Standards Board (FASB) Accounting Standards Codification Topic 946 “Financial Services — Investment Companies.”
A Investment Valuation—The following methodologies are used to determine the market value or fair value of investments.
Equity Securities. Equity securities listed on a U.S. securities exchange generally are valued at the last sale or closing price on the day of valuation or, if no sales took place on such date, at the mean between the closing bid and ask prices on the exchange where such securities are principally traded. Equity securities listed on the NASDAQ National Market System are valued at the NASDAQ official closing price. Unlisted or listed securities for which closing sales prices or closing quotations are not available are valued at the mean between the latest available bid and ask prices.
Foreign Securities and Currencies. Foreign securities and currencies are valued in U.S. dollars, based on foreign currency exchange rate quotations supplied by a third party pricing service. The pricing service uses a proprietary model to determine the exchange rate. Inputs to the model include reported trades and implied bid/ask spreads. The daily valuation of exchange-traded foreign securities generally is determined as of the close of trading on the principal exchange on which such securities trade. Events occurring after the close of trading on foreign exchanges may result in adjustments to the valuation of foreign securities to more accurately reflect their fair value as of the close of regular trading on the New York Stock Exchange. When valuing foreign equity securities that meet certain criteria, the Portfolio's Trustees have approved the use of a fair value service that values such securities to reflect market trading that occurs after the close of the applicable foreign markets of comparable securities or other instruments that have a strong correlation to the fair-valued securities.
Other. Investments in management investment companies (including money market funds) that do not trade on an exchange are valued at the net asset value as of the close of each business day.
Fair Valuation. In connection with Rule 2a-5 of the 1940 Act, the Trustees have designated the Portfolio’s investment adviser as its valuation designee. Investments for which valuations or market quotations are not readily available or are deemed unreliable are valued by the investment adviser, as valuation designee, at fair value using methods that most fairly reflect the security’s “fair value”, which is the amount that the Portfolio might reasonably expect to receive for the security upon its current sale in the ordinary course. Each such determination is based on a consideration of relevant factors, which are likely to vary from one pricing context to another. These factors may include, but are not limited to, the type of security, the existence of any contractual restrictions on the security’s disposition, the price and extent of public trading in similar securities of the issuer or of comparable companies or entities, quotations or relevant information obtained from broker/dealers or other market participants, information obtained from the issuer, analysts, and/or the appropriate stock exchange (for exchange-traded securities), an analysis of the company’s or entity’s financial statements, and an evaluation of the forces that influence the issuer and the market(s) in which the security is purchased and sold.
B Investment Transactions—Investment transactions for financial statement purposes are accounted for on a trade date basis. Realized gains and losses on investments sold are determined on the basis of identified cost.
C Income—Dividend income is recorded on the ex-dividend date for dividends received in cash and/or securities. However, if the ex-dividend date has passed, certain dividends from foreign securities are recorded as the Portfolio is informed of the ex-dividend date. Withholding taxes on foreign dividends and capital gains have been provided for in accordance with the Portfolio's understanding of the applicable countries’ tax rules and rates. In consideration of recent decisions rendered by European courts, the Portfolio has filed additional tax reclaims for previously withheld taxes on dividends earned in certain European Union countries (the “EU reclaims”). These filings are subject to various administrative and judicial proceedings within these countries. Due to the uncertainty as to the ultimate resolution of these proceedings, the likelihood of receipt of these EU reclaims, and the potential timing of payment, the EU reclaims are recorded as income only when the likelihood of their receipt becomes certain.
D Federal Taxes—The Portfolio has elected to be treated as a partnership for federal tax purposes. No provision is made by the Portfolio for federal or state taxes on any taxable income of the Portfolio because each investor in the Portfolio is ultimately responsible for the payment of any taxes on its share of taxable income. Since at least one of the Portfolio's investors is a regulated investment company that invests all or substantially all of its assets in the Portfolio, the Portfolio normally must satisfy the applicable source of income and diversification requirements (under the Internal Revenue Code) in order for its investors to satisfy them. The Portfolio will allocate, at least annually among its investors, each investor's distributive share of the Portfolio's net investment income, net realized capital gains and losses and any other items of income, gain, loss, deduction or credit.
Tax-Managed Growth Portfolio
December 31, 2024
Notes to Financial Statements — continued
As of December 31, 2024, the Portfolio had no uncertain tax positions that would require financial statement recognition, de-recognition, or disclosure. The Portfolio files a U.S. federal income tax return annually after its fiscal year-end, which is subject to examination by the Internal Revenue Service for a period of three years from the date of filing.
E Foreign Currency Translation—Investment valuations, other assets, and liabilities initially expressed in foreign currencies are translated each business day into U.S. dollars based upon current exchange rates. Purchases and sales of foreign investment securities and income and expenses denominated in foreign currencies are translated into U.S. dollars based upon currency exchange rates in effect on the respective dates of such transactions. Recognized gains or losses on investment transactions attributable to changes in foreign currency exchange rates are recorded for financial statement purposes as net realized gains and losses on investments. That portion of unrealized gains and losses on investments that results from fluctuations in foreign currency exchange rates is not separately disclosed.
F Use of Estimates—The preparation of the financial statements in conformity with U.S. GAAP requires management to make estimates and assumptions that affect the reported amounts of assets and liabilities at the date of the financial statements and the reported amounts of income and expense during the reporting period. Actual results could differ from those estimates.
G Indemnifications—Under the Portfolio’s organizational documents, its officers and Trustees may be indemnified against certain liabilities and expenses arising out of the performance of their duties to the Portfolio. Under Massachusetts law, if certain conditions prevail, interestholders in the Portfolio could be deemed to have personal liability for the obligations of the Portfolio. However, the Portfolio’s Declaration of Trust contains an express disclaimer of liability on the part of Portfolio interestholders. Additionally, in the normal course of business, the Portfolio enters into agreements with service providers that may contain indemnification clauses. The Portfolio’s maximum exposure under these arrangements is unknown as this would involve future claims that may be made against the Portfolio that have not yet occurred.
H Segment Reporting—During the year ended December 31, 2024, the Portfolio adopted FASB Accounting Standards Update No. 2023-07, Segment Reporting (Topic 280): Improvements to Reportable Segment Disclosures, (ASU 2023-07), which requires incremental disclosures related to a public entity’s reportable segments. The Portfolio operates as a single reportable segment, an investment company whose investment objective is included in Note 1. In connection with the adoption of ASU 2023-07, the Portfolio’s President has been designated as the Portfolio’s Chief Operating Decision Maker (CODM), who is responsible for assessing the performance of the Portfolio’s single segment and deciding how to allocate the segment’s resources. To perform this function, the CODM reviews the information in the Portfolio’s Financial Statements.
2 Investment Adviser Fee and Other Transactions with Affiliates
The investment adviser fee is earned by Boston Management and Research (BMR) an indirect, wholly-owned subsidiary of Morgan Stanley, as compensation for investment advisory services rendered to the Portfolio. The investment adviser fee is based upon an annual rate of the Portfolio's average daily net assets as follows and is payable monthly:
| Average Daily Net Assets | Annual Fee Rate |
| Up to $500 million | 0.5575% |
| $500 million but less than $1 billion | 0.4950% |
| $1 billion but less than $1.5 billion | 0.4325% |
| $1.5 billion but less than $7 billion | 0.3700% |
| $7 billion but less than $10 billion | 0.3575% |
| $10 billion but less than $15 billion | 0.3450% |
| $15 billion but less than $20 billion | 0.3325% |
| $20 billion but less than $25 billion | 0.3225% |
| $25 billion but less than $30 billion | 0.3125% |
| $30 billion but less than $35 billion | 0.3020% |
| $35 billion but less than $45 billion | 0.2970% |
| $45 billion and over | 0.2920% |
For the year ended December 31, 2024, the Portfolio's investment adviser fee amounted to $22,726,124 or 0.40% of the Portfolio's average daily net assets. The Portfolio may invest in a money market fund, the Institutional Class of the Morgan Stanley Institutional Liquidity Funds - Government Portfolio (the “Liquidity Fund”), an open-end management investment company managed by Morgan Stanley Investment Management Inc., a wholly-owned subsidiary of Morgan Stanley. The investment adviser fee paid by the Portfolio is reduced by an amount equal to its pro rata share of the advisory and administration fees paid by the Portfolio due to its investment in the Liquidity Fund. For the year ended December 31, 2024, the investment adviser fee paid was reduced by $14,941 relating to the Portfolio’s investment in the Liquidity Fund.
Tax-Managed Growth Portfolio
December 31, 2024
Notes to Financial Statements — continued
BMR has agreed to waive its advisory fee and/or reimburse the Portfolio's operating expenses to the extent that total annual operating expenses (excluding expenses such as brokerage commissions, borrowing costs, taxes or litigation expenses, indemnification expenses, and other expenses not incurred in the ordinary course of the Portfolio's business) exceed 0.43% of Portfolio's average daily net assets. The expense reimbursement agreement with BMR may be changed or terminated after January 13, 2026. For the year ended December 31, 2024, BMR waived or reimbursed expenses of $28,049.
Officers and Trustees of the Portfolio who are members of EVM’s or BMR’s organizations receive remuneration for their services to the Portfolio out of the investment adviser fee. Trustees of the Portfolio who are not affiliated with the investment adviser may elect to defer receipt of all or a percentage of their annual fees in accordance with the terms of the Trustees Deferred Compensation Plan. Certain officers and Trustees of the Portfolio are officers of the above organizations.
3 Purchases and Sales of Investments
Purchases and sales of investments, other than short-term obligations, aggregated $418,678,037 and $486,217,675, respectively, for the year ended December 31, 2024. In addition, investments having an aggregate market value of $212,755,039 were distributed in payment for capital withdrawals during the year ended December 31, 2024.
4 Federal Income Tax Basis of Investments
The cost and unrealized appreciation (depreciation) of investments of the Portfolio at December 31, 2024, as determined on a federal income tax basis, were as follows:
| Aggregate cost | $1,836,247,057 |
| Gross unrealized appreciation | $4,130,252,358 |
| Gross unrealized depreciation | (948,007) |
| Net unrealized appreciation | $4,129,304,351 |
5 Line of Credit
The Portfolio participates with other portfolios and funds managed by EVM and its affiliates in a $650 million unsecured revolving line of credit agreement with a group of banks, which is in effect through October 21, 2025. Borrowings are made by the Portfolio solely for temporary purposes related to redemptions and other short-term cash needs. Interest is charged to the Portfolio based on its borrowings generally at an amount above either the Secured Overnight Financing Rate (SOFR) or Federal Funds rate. In addition, a fee computed at an annual rate of 0.15% on the daily unused portion of the line of credit is allocated among the participating portfolios and funds at the end of each quarter. In connection with the renewal of the agreement in October 2024, an arrangement fee totaling $150,000 was incurred that was allocated to the participating portfolios and funds. Because the line of credit is not available exclusively to the Portfolio, it may be unable to borrow some or all of its requested amounts at any particular time. The Portfolio did not have any significant borrowings or allocated fees during the year ended December 31, 2024.
6 Affiliated Investments
At December 31, 2024, the value of the Portfolio's investments in funds that may be deemed to be affiliated was $2,531,254, which represents less than 0.05% of the Portfolio's net assets. Transactions in such investments by the Portfolio for the year ended December 31, 2024 were as follows:
| Name | Value,
beginning
of period | Purchases | Sales
proceeds | Net realized
gain (loss) | Change in
unrealized
appreciation
(depreciation) | Value, end
of period | Dividend
income | Shares,
end of period |
| Short-Term Investments |
| Liquidity Fund | $2,564,731 | $190,770,695 | $(190,804,172) | $ — | $ — | $2,531,254 | $535,756 | 2,531,254 |
Tax-Managed Growth Portfolio
December 31, 2024
Notes to Financial Statements — continued
7 Fair Value Measurements
Under generally accepted accounting principles for fair value measurements, a three-tier hierarchy to prioritize the assumptions, referred to as inputs, is used in valuation techniques to measure fair value. The three-tier hierarchy of inputs is summarized in the three broad levels listed below.
| • | Level 1 – quoted prices in active markets for identical investments |
| • | Level 2 – other significant observable inputs (including quoted prices for similar investments, interest rates, prepayment speeds, credit risk, etc.) |
| • | Level 3 – significant unobservable inputs (including a fund's own assumptions in determining the fair value of investments) |
In cases where the inputs used to measure fair value fall in different levels of the fair value hierarchy, the level disclosed is determined based on the lowest level input that is significant to the fair value measurement in its entirety. The inputs or methodology used for valuing securities are not necessarily an indication of the risk associated with investing in those securities.
At December 31, 2024, the hierarchy of inputs used in valuing the Portfolio's investments, which are carried at fair value, were as follows:
| Asset Description | Level 1 | Level 2 | Level 3 | Total |
| Common Stocks | $5,963,020,154* | $ — | $ — | $5,963,020,154 |
| Short-Term Investments | 2,531,254 | — | — | 2,531,254 |
| Total Investments | $ 5,965,551,408 | $ — | $ — | $5,965,551,408 |
| * | The level classification by major category of investments is the same as the category presentation in the Portfolio of Investments. |
Tax-Managed Growth Portfolio
December 31, 2024
Report of Independent Registered Public Accounting Firm
To the Trustees and Investors of Tax-Managed Growth Portfolio:
Opinion on the Financial Statements and Financial Highlights
We have audited the accompanying statement of assets and liabilities of Tax-Managed Growth Portfolio (the “Portfolio"), including the portfolio of investments, as of December 31, 2024, the related statement of operations for the year then ended, the statements of changes in net assets for each of the two years in the period then ended, the financial highlights for each of the five years in the period then ended, and the related notes. In our opinion, the financial statements and financial highlights present fairly, in all material respects, the financial position of the Portfolio as of December 31, 2024, and the results of its operations for the year then ended, the changes in its net assets for each of the two years in the period then ended, and the financial highlights for each of the five years in the period then ended in conformity with accounting principles generally accepted in the United States of America.
Basis for Opinion
These financial statements and financial highlights are the responsibility of the Portfolio’s management. Our responsibility is to express an opinion on the Portfolio’s financial statements and financial highlights based on our audits. We are a public accounting firm registered with the Public Company Accounting Oversight Board (United States) (PCAOB) and are required to be independent with respect to the Portfolio in accordance with the U.S. federal securities laws and the applicable rules and regulations of the Securities and Exchange Commission and the PCAOB.
We conducted our audits in accordance with the standards of the PCAOB. Those standards require that we plan and perform the audit to obtain reasonable assurance about whether the financial statements and financial highlights are free of material misstatement, whether due to error or fraud. The Portfolio is not required to have, nor were we engaged to perform, an audit of its internal control over financial reporting. As part of our audits, we are required to obtain an understanding of internal control over financial reporting but not for the purpose of expressing an opinion on the effectiveness of the Portfolio’s internal control over financial reporting. Accordingly, we express no such opinion.
Our audits included performing procedures to assess the risks of material misstatement of the financial statements and financial highlights, whether due to error or fraud, and performing procedures that respond to those risks. Such procedures included examining, on a test basis, evidence regarding the amounts and disclosures in the financial statements and financial highlights. Our audits also included evaluating the accounting principles used and significant estimates made by management, as well as evaluating the overall presentation of the financial statements and financial highlights. Our procedures included confirmation of securities owned as of December 31, 2024, by correspondence with the custodian and brokers; when replies were not received from brokers, we performed other auditing procedures. We believe that our audits provide a reasonable basis for our opinion.
/s/ Deloitte & Touche LLP
Boston, Massachusetts
February 21, 2025
We have served as the auditor of one or more Eaton Vance investment companies since 1959.
Parametric
Commodity Strategy Fund
Annual Financial Statements and
Additional Information
December 31, 2024
This report must be preceded or accompanied by a current summary prospectus or prospectus. Before investing, investors should consider carefully the investment objective, risks, and charges and expenses of a mutual fund. This and other important information is contained in the prospectus and/or statement of additional information, which can be obtained by calling 1-800-260-0761 or from a financial intermediary. Prospective investors should read the prospectus carefully before investing.
Annual Financial Statements and Additional Information December 31, 2024
Parametric
Commodity Strategy Fund
Items 8, 9 and 11 of Form N-CSR are Not Applicable. For Item 10 of Form N-CSR, see Item 7.
Parametric
Commodity Strategy Fund
December 31, 2024
Consolidated Portfolio of Investments
| Exchange-Traded Funds — 5.7% |
| Security | Shares | Value |
| Commodity Funds — 5.7% |
| SPDR Gold MiniShares Trust(1) | | 1,577,000 | $ 81,988,230 |
Total Exchange-Traded Funds
(identified cost $54,345,417) | | | $ 81,988,230 |
| Short-Term Investments — 83.5% |
| Security | Shares | Value |
| Morgan Stanley Institutional Liquidity Funds - Government Portfolio, Institutional Class, 4.43%(2) | | 60,222,366 | $ 60,222,366 |
Total Affiliated Fund
(identified cost $60,222,366) | | | $ 60,222,366 |
| U.S. Treasury Obligations — 79.3% |
| Security | Principal
Amount
(000's omitted) | Value |
| U.S. Treasury Bills: | | | |
| 0.00%, 1/23/25 | $ | 60,367 | $ 60,217,699 |
| 0.00%, 2/20/25 | | 30,720 | 30,546,072 |
| 0.00%, 3/20/25 | | 52,127 | 51,663,574 |
| 0.00%, 4/17/25 | | 20,947 | 20,694,340 |
| 0.00%, 5/15/25 | | 70,947 | 69,865,728 |
| 0.00%, 9/4/25 | | 57,085 | 55,510,629 |
| 0.00%, 10/2/25 | | 45,850 | 44,452,337 |
| 0.00%, 11/28/25 | | 8,020 | 7,729,431 |
| U.S. Treasury Bonds, 7.625%, 2/15/25 | | 20,947 | 21,028,629 |
| U.S. Treasury Inflation-Indexed Bonds, 2.375%, 1/15/25(3) | | 90,427 | 90,374,396 |
| U.S. Treasury Inflation-Indexed Notes:(3) | | | |
| 0.125%, 4/15/25 | | 61,102 | 60,725,163 |
| 0.375%, 7/15/25 | | 51,246 | 50,938,938 |
| U.S. Treasury Notes: | | | |
| 0.25%, 5/31/25 | | 50,000 | 49,193,657 |
| 0.25%, 7/31/25 | | 100,000 | 97,731,078 |
| Security | Principal
Amount
(000's omitted) | Value |
| U.S. Treasury Notes: (continued) | | | |
| 0.25%, 8/31/25 | $ | 10,715 | $ 10,436,287 |
| 0.25%, 10/31/25 | | 23,400 | 22,647,672 |
| 0.375%, 4/30/25 | | 20,947 | 20,682,756 |
| 1.125%, 1/15/25 | | 23,830 | 23,802,909 |
| 1.375%, 1/31/25 | | 23,830 | 23,774,340 |
| 1.50%, 2/15/25 | | 20,947 | 20,874,236 |
| 1.75%, 3/15/25 | | 36,537 | 36,356,558 |
| 2.00%, 8/15/25 | | 32,145 | 31,700,644 |
| 2.75%, 5/15/25 | | 20,947 | 20,833,703 |
| 2.75%, 6/30/25 | | 50,000 | 49,643,818 |
| 3.125%, 8/15/25 | | 21,430 | 21,282,610 |
| 3.875%, 3/31/25 | | 15,590 | 15,574,995 |
| 4.25%, 5/31/25 | | 50,000 | 49,992,389 |
| 5.00%, 8/31/25 | | 10,715 | 10,767,426 |
| 5.00%, 9/30/25 | | 40,000 | 40,211,743 |
| 5.00%, 10/31/25 | | 24,030 | 24,170,623 |
Total U.S. Treasury Obligations
(identified cost $1,131,641,493) | | | $1,133,424,380 |
Total Short-Term Investments
(identified cost $1,191,863,859) | | | $1,193,646,746 |
Total Investments — 89.2%
(identified cost $1,246,209,276) | | | $1,275,634,976 |
| Other Assets, Less Liabilities — 10.8% | | | $ 154,598,465 |
| Net Assets — 100.0% | | | $1,430,233,441 |
| The percentage shown for each investment category in the Consolidated Portfolio of Investments is based on net assets. |
| (1) | Non-income producing security. |
| (2) | May be deemed to be an affiliated investment company (see Note 10). The rate shown is the annualized seven-day yield as of December 31, 2024. |
| (3) | Inflation-linked security whose principal is adjusted for inflation based on changes in the U.S. Consumer Price Index. Interest is calculated based on the inflation-adjusted principal. |
1
See Notes to Consolidated Financial Statements.
Parametric
Commodity Strategy Fund
December 31, 2024
Consolidated Portfolio of Investments — continued
| Futures Contracts |
| Description | Number of
Contracts | Position | Expiration
Date | Notional
Amount | Value/Unrealized
Appreciation
(Depreciation) |
| Commodity Futures | | | | | |
| Brent Crude Oil | 349 | Long | 2/28/25 | $ 25,909,760 | $ 899,534 |
| Cocoa | 234 | Long | 3/14/25 | 27,319,500 | 11,606,282 |
| Coffee | 423 | Long | 3/19/25 | 50,720,344 | 10,983,317 |
| Copper | 492 | Long | 3/27/25 | 49,525,950 | (6,456,640) |
| Corn | 2,323 | Long | 3/14/25 | 53,254,775 | 1,546,218 |
| Cotton No. 2 | 748 | Long | 3/7/25 | 25,581,600 | (2,229,687) |
| Feeder Cattle | 106 | Long | 3/27/25 | 13,937,675 | 1,192,950 |
| Gold | 75 | Long | 4/28/25 | 19,995,000 | (227,960) |
| Kansas Wheat | 473 | Long | 3/14/25 | 13,226,262 | (1,359,787) |
| Lean Hogs | 721 | Long | 4/14/25 | 24,968,230 | (1,260,769) |
| Live Cattle | 670 | Long | 4/30/25 | 52,065,700 | 1,011,427 |
| LME Copper | 204 | Long | 1/13/25 | 44,233,473 | (6,186,198) |
| LME Copper | 221 | Long | 2/17/25 | 48,172,033 | (5,552,764) |
| LME Copper | 224 | Long | 3/17/25 | 49,023,520 | (1,956,136) |
| LME Lead | 477 | Long | 1/13/25 | 23,047,328 | (2,607,878) |
| LME Lead | 501 | Long | 2/17/25 | 24,305,138 | (1,180,231) |
| LME Lead | 519 | Long | 3/17/25 | 25,277,117 | (1,813,775) |
| LME Nickel | 518 | Long | 1/13/25 | 47,055,338 | (7,382,279) |
| LME Nickel | 531 | Long | 2/17/25 | 48,526,635 | (2,957,723) |
| LME Nickel | 561 | Long | 3/17/25 | 51,511,042 | (2,725,489) |
| LME Primary Aluminum | 1,538 | Long | 1/13/25 | 97,527,656 | (3,728,497) |
| LME Primary Aluminum | 1,621 | Long | 2/17/25 | 103,209,881 | (4,621,080) |
| LME Primary Aluminum | 1,600 | Long | 3/17/25 | 102,198,801 | (3,931,029) |
| LME Tin | 76 | Long | 1/13/25 | 10,966,040 | (1,856,680) |
| LME Tin | 79 | Long | 2/17/25 | 11,440,385 | (1,359,590) |
| LME Tin | 89 | Long | 3/17/25 | 12,926,360 | (20,025) |
| LME Zinc | 649 | Long | 1/13/25 | 48,033,139 | (2,782,425) |
| LME Zinc | 673 | Long | 2/17/25 | 50,044,112 | (2,233,014) |
| LME Zinc | 678 | Long | 3/17/25 | 50,516,763 | (2,092,779) |
| Low Sulphur Gasoil | 770 | Long | 3/12/25 | 52,976,000 | 1,971,913 |
| Natural Gas | 2,263 | Long | 12/29/25 | 105,365,280 | 6,573,184 |
| NY Harbor ULSD | 553 | Long | 2/28/25 | 53,289,734 | 2,905,892 |
| Palladium | 269 | Long | 3/27/25 | 24,473,620 | (4,326,338) |
| Platinum | 558 | Long | 4/28/25 | 25,402,950 | (1,476,256) |
| RBOB Gasoline | 1,227 | Long | 2/28/25 | 104,567,639 | 3,175,845 |
| Robusta Coffee | 278 | Long | 3/25/25 | 13,552,500 | 342,549 |
| Silver | 674 | Long | 3/27/25 | 98,545,540 | (11,734,768) |
| Soybean Meal | 864 | Long | 3/14/25 | 27,380,160 | 1,201,490 |
| Soybean Oil | 2,147 | Long | 3/14/25 | 51,991,752 | (5,620,049) |
| Soybeans | 1,071 | Long | 3/14/25 | 54,112,275 | (76,087) |
| Sugar No. 11 | 1,175 | Long | 2/28/25 | 25,346,160 | 1,068,669 |
| Wheat | 962 | Long | 3/14/25 | 26,527,150 | (3,016,649) |
| White Sugar | 490 | Long | 2/13/25 | 12,421,500 | (1,857,799) |
2
See Notes to Consolidated Financial Statements.
Parametric
Commodity Strategy Fund
December 31, 2024
Consolidated Portfolio of Investments — continued
| Futures Contracts (continued) |
| Description | Number of
Contracts | Position | Expiration
Date | Notional
Amount | Value/Unrealized
Appreciation
(Depreciation) |
| Commodity Futures (continued) | | | | | |
| WTI Crude Oil | 365 | Long | 2/20/25 | $ 26,006,250 | $ 1,201,797 |
| LME Copper | (204) | Short | 1/13/25 | (44,233,473) | 5,297,421 |
| LME Copper | (221) | Short | 2/17/25 | (48,172,033) | 1,939,441 |
| LME Lead | (477) | Short | 1/13/25 | (23,047,328) | 1,027,458 |
| LME Lead | (501) | Short | 2/17/25 | (24,305,138) | 1,844,557 |
| LME Nickel | (518) | Short | 1/13/25 | (47,055,338) | 2,877,013 |
| LME Nickel | (531) | Short | 2/17/25 | (48,526,635) | 2,710,617 |
| LME Primary Aluminum | (1,538) | Short | 1/13/25 | (97,527,656) | 4,528,641 |
| LME Primary Aluminum | (1,621) | Short | 2/17/25 | (103,209,881) | 3,965,442 |
| LME Tin | (76) | Short | 1/13/25 | (10,966,040) | 1,318,980 |
| LME Tin | (79) | Short | 2/17/25 | (11,440,385) | 22,515 |
| LME Zinc | (649) | Short | 1/13/25 | (48,033,139) | 2,287,076 |
| LME Zinc | (673) | Short | 2/17/25 | (50,044,112) | 2,107,500 |
| | | | | | $(19,022,653) |
| Abbreviations: |
| LME | – London Metal Exchange |
| RBOB | – Reformulated Blendstock for Oxygenate Blending |
| ULSD | – Ultra-Low Sulfur Diesel |
| WTI | – West Texas Intermediate |
3
See Notes to Consolidated Financial Statements.
Parametric
Commodity Strategy Fund
December 31, 2024
Consolidated Statement of Assets and Liabilities
| | December 31, 2024 |
| Assets | |
| Unaffiliated investments, at value (identified cost $1,185,986,910) | $1,215,412,610 |
| Affiliated investments, at value (identified cost $60,222,366) | 60,222,366 |
| Deposits for derivatives collateral — futures contracts | 176,084,000 |
| Interest receivable | 4,233,487 |
| Dividends receivable from affiliated investments | 239,951 |
| Receivable for Fund shares sold | 1,358,754 |
| Trustees' deferred compensation plan | 24,555 |
| Total assets | $1,457,575,723 |
| Liabilities | |
| Payable for Fund shares redeemed | $3,732,647 |
| Payable for variation margin on open futures contracts | 22,252,385 |
| Payable to affiliates: | |
| Investment adviser and administration fee | 644,377 |
| Distribution and service fees | 22,606 |
| Trustees' fees | 21,357 |
| Trustees' deferred compensation plan | 24,555 |
| Accrued expenses | 644,355 |
| Total liabilities | $27,342,282 |
| Net Assets | $1,430,233,441 |
| Sources of Net Assets | |
| Paid-in capital | $1,969,109,319 |
| Accumulated loss | (538,875,878) |
| Net Assets | $1,430,233,441 |
| Class A Shares | |
| Net Assets | $113,708,779 |
| Shares Outstanding | 18,657,030 |
Net Asset Value and Redemption Price Per Share
(net assets ÷ shares of beneficial interest outstanding) | $6.09 |
Maximum Offering Price Per Share
(100 ÷ 96.75 of net asset value per share) | $6.29 |
| Class I Shares | |
| Net Assets | $1,316,524,662 |
| Shares Outstanding | 213,761,666 |
Net Asset Value, Offering Price and Redemption Price Per Share
(net assets ÷ shares of beneficial interest outstanding) | $6.16 |
| On sales of $100,000 or more, the offering price of Class A shares is reduced. |
4
See Notes to Consolidated Financial Statements.
Parametric
Commodity Strategy Fund
December 31, 2024
Consolidated Statement of Operations
| | Year Ended |
| | December 31, 2024 |
| Investment Income | |
| Dividend income from affiliated investments | $7,614,026 |
| Interest income | 56,258,844 |
| Total investment income | $63,872,870 |
| Expenses | |
| Investment adviser and administration fee | $7,237,271 |
| Distribution and service fees: | |
| Class A | 262,176 |
| Trustees’ fees and expenses | 75,445 |
| Custodian fee | 357,445 |
| Transfer and dividend disbursing agent fees | 990,779 |
| Legal and accounting services | 121,399 |
| Printing and postage | 143,703 |
| Registration fees | 67,839 |
| Miscellaneous | 70,740 |
| Total expenses | $9,326,797 |
| Deduct: | |
| Waiver and/or reimbursement of expenses by affiliates | $217,015 |
| Total expense reductions | $217,015 |
| Net expenses | $9,109,782 |
| Net investment income | $54,763,088 |
| Realized and Unrealized Gain (Loss) | |
| Net realized gain (loss): | |
| Futures contracts | $73,963,436 |
| Net realized gain | $73,963,436 |
| Change in unrealized appreciation (depreciation): | |
| Investments | $19,928,503 |
| Futures contracts | (31,523,994) |
| Net change in unrealized appreciation (depreciation) | $(11,595,491) |
| Net realized and unrealized gain | $62,367,945 |
| Net increase in net assets from operations | $117,131,033 |
5
See Notes to Consolidated Financial Statements.
Parametric
Commodity Strategy Fund
December 31, 2024
Consolidated Statements of Changes in Net Assets
| | Year Ended December 31, |
| | 2024 | 2023 |
| Increase (Decrease) in Net Assets | | |
| From operations: | | |
| Net investment income | $54,763,088 | $53,954,917 |
| Net realized gain (loss) | 73,963,436 | (94,127,427) |
| Net change in unrealized appreciation (depreciation) | (11,595,491) | (38,275,579) |
| Net increase (decrease) in net assets from operations | $117,131,033 | $(78,448,089) |
| Distributions to shareholders: | | |
| Class A | $(5,553,726) | $(3,611,212) |
| Class I | (71,170,731) | (40,103,075) |
| Total distributions to shareholders | $(76,724,457) | $(43,714,287) |
| Transactions in shares of beneficial interest: | | |
| Class A | $5,590,785 | $(29,164,244) |
| Class I | 182,480,159 | (416,072,596) |
| Net increase (decrease) in net assets from Fund share transactions | $188,070,944 | $(445,236,840) |
| Net increase (decrease) in net assets | $228,477,520 | $(567,399,216) |
| Net Assets | | |
| At beginning of year | $1,201,755,921 | $1,769,155,137 |
| At end of year | $1,430,233,441 | $1,201,755,921 |
6
See Notes to Consolidated Financial Statements.
Parametric
Commodity Strategy Fund
December 31, 2024
Consolidated Financial Highlights
| | Class A |
| | Year Ended December 31, |
| | 2024 | 2023 | 2022 | 2021 | 2020 |
| Net asset value — Beginning of year | $5.86 | $6.37 | $6.26 | $5.51 | $5.27 |
| Income (Loss) From Operations | | | | | |
| Net investment income (loss)(1) | $0.24 | $0.21 | $0.06 | $(0.05) | $(0.00)(2) |
| Net realized and unrealized gain (loss) | 0.32 | (0.52) | 0.99 | 1.66 | 0.41 |
| Total income (loss) from operations | $0.56 | $(0.31) | $1.05 | $1.61 | $0.41 |
| Less Distributions | | | | | |
| From net investment income | $(0.33) | $(0.20) | $(0.94) | $(0.86) | $(0.16) |
| From net realized gain | — | — | — | — | (0.01) |
| Total distributions | $(0.33) | $(0.20) | $(0.94) | $(0.86) | $(0.17) |
| Net asset value — End of year | $6.09 | $5.86 | $6.37 | $6.26 | $5.51 |
| Total Return(3) | 9.69% | (4.86)% | 17.05% | 29.60% | 7.73% |
| Ratios/Supplemental Data | | | | | |
| Net assets, end of year (000's omitted) | $113,709 | $104,222 | $143,687 | $92,413 | $27,473 |
| Ratios (as a percentage of average daily net assets):(4) | | | | | |
| Total expenses | 0.93% | 0.92% | 0.90% | 0.91% | 0.94% |
| Net expenses | 0.91%(5) | 0.92%(5) | 0.90%(5) | 0.91% | 0.93% |
| Net investment income (loss) | 3.88% | 3.38% | 0.81% | (0.71)% | (0.03)% |
| Portfolio Turnover | 0% | 0% | 20% | 0% | 0% |
| (1) | Computed using average shares outstanding. |
| (2) | Amount is less than $(0.005). |
| (3) | Returns are historical and are calculated by determining the percentage change in net asset value with all distributions reinvested and do not reflect the effect of sales charges, if any. |
| (4) | Total expenses do not reflect amounts reimbursed and/or waived by the adviser and certain of its affiliates, if applicable. Net expenses are net of all reductions and represent the net expenses paid by the Fund. |
| (5) | Includes a reduction by the investment adviser of a portion of its adviser and administration fee due to the Fund’s investment in the Liquidity Fund (equal to 0.02%, less than 0.01% and less than 0.005% of average daily net assets for the years ended December 31, 2024, 2023 and 2022, respectively). |
7
See Notes to Consolidated Financial Statements.
Parametric
Commodity Strategy Fund
December 31, 2024
Consolidated Financial Highlights — continued
| | Class I |
| | Year Ended December 31, |
| | 2024 | 2023 | 2022 | 2021 | 2020 |
| Net asset value — Beginning of year | $5.92 | $6.44 | $6.31 | $5.55 | $5.31 |
| Income (Loss) From Operations | | | | | |
| Net investment income (loss)(1) | $0.26 | $0.23 | $0.08 | $(0.03) | $0.02 |
| Net realized and unrealized gain (loss) | 0.33 | (0.53) | 1.01 | 1.66 | 0.39 |
| Total income (loss) from operations | $0.59 | $(0.30) | $1.09 | $1.63 | $0.41 |
| Less Distributions | | | | | |
| From net investment income | $(0.35) | $(0.22) | $(0.96) | $(0.87) | $(0.16) |
| From net realized gain | — | — | — | — | (0.01) |
| Total distributions | $(0.35) | $(0.22) | $(0.96) | $(0.87) | $(0.17) |
| Net asset value — End of year | $6.16 | $5.92 | $6.44 | $6.31 | $5.55 |
| Total Return(2) | 10.03% | (4.69)% | 17.56% | 29.80% | 7.79% |
| Ratios/Supplemental Data | | | | | |
| Net assets, end of year (000’s omitted) | $1,316,525 | $1,097,534 | $1,625,468 | $1,360,085 | $410,539 |
| Ratios (as a percentage of average daily net assets):(3) | | | | | |
| Total expenses | 0.68% | 0.67% | 0.65% | 0.66% | 0.69% |
| Net expenses | 0.66%(4) | 0.67%(4) | 0.65%(4) | 0.66% | 0.68% |
| Net investment income (loss) | 4.12% | 3.63% | 1.02% | (0.46)% | 0.37% |
| Portfolio Turnover | 0% | 0% | 20% | 0% | 0% |
| (1) | Computed using average shares outstanding. |
| (2) | Returns are historical and are calculated by determining the percentage change in net asset value with all distributions reinvested. |
| (3) | Total expenses do not reflect amounts reimbursed and/or waived by the adviser and certain of its affiliates, if applicable. Net expenses are net of all reductions and represent the net expenses paid by the Fund. |
| (4) | Includes a reduction by the investment adviser of a portion of its adviser and administration fee due to the Fund’s investment in the Liquidity Fund (equal to 0.02%, less than 0.01% and less than 0.005% of average daily net assets for the years ended December 31, 2024, 2023 and 2022, respectively). |
8
See Notes to Consolidated Financial Statements.
Parametric
Commodity Strategy Fund
December 31, 2024
Notes to Consolidated Financial Statements
1 Significant Accounting Policies
Parametric Commodity Strategy Fund (the Fund) is a diversified series of Eaton Vance Mutual Funds Trust (the Trust). The Trust is a Massachusetts business trust registered under the Investment Company Act of 1940, as amended (the 1940 Act), as an open-end management investment company. The Fund’s investment objective is to seek total return. The Fund offers two classes of shares. Class A shares are generally sold subject to a sales charge imposed at time of purchase. Class A shares are offered at net asset value to shareholders who owned Investor Class shares, which were redesignated as Class A shares on April 29, 2022, and only for such shareholders’ accounts established prior to such date. Class I shares are sold at net asset value and are not subject to a sales charge. Each class represents a pro rata interest in the Fund, but votes separately on class-specific matters and (as noted below) is subject to different expenses. Realized and unrealized gains and losses and net investment income and losses, other than class-specific expenses, are allocated daily to each class of shares based on the relative net assets of each class to the total net assets of the Fund. Each class of shares differs in its distribution plan and certain other class-specific expenses.
The Fund seeks to gain exposure to the commodity markets, in whole or in part, through investments in PSC Commodity Subsidiary, Ltd. (the Subsidiary), a wholly-owned subsidiary of the Fund organized under the laws of the Cayman Islands with the same objective and investment policies and restrictions as the Fund. The Fund may invest up to 25% of its total assets in the Subsidiary. The net assets of the Subsidiary at December 31, 2024 were $270,541,845 or 18.9% of the Fund’s consolidated net assets. The accompanying consolidated financial statements include the accounts of the Subsidiary. Intercompany balances and transactions have been eliminated in consolidation.
The following is a summary of significant accounting policies of the Fund. The policies are in conformity with accounting principles generally accepted in the United States of America (U.S. GAAP). The Fund is an investment company and follows accounting and reporting guidance in the Financial Accounting Standards Board (FASB) Accounting Standards Codification Topic 946.
A Investment Valuation—The following methodologies are used to determine the market value or fair value of investments.
Debt Obligations. Debt obligations are generally valued on the basis of valuations provided by third party pricing services, as derived from such services’ pricing models. Inputs to the models may include, but are not limited to, reported trades, executable bid and ask prices, broker/dealer quotations, prices or yields of securities with similar characteristics, interest rates, anticipated prepayments, benchmark curves or information pertaining to the issuer, as well as industry and economic events. The pricing services may use a matrix approach, which considers information regarding securities with similar characteristics to determine the valuation for a security. Short-term debt obligations purchased with a remaining maturity of sixty days or less for which a valuation from a third party pricing service is not readily available may be valued at amortized cost, which approximates fair value.
Equity Securities. Equity securities (exchange-traded funds) listed on a U.S. securities exchange generally are valued at the last sale or closing price on the day of valuation or, if no sales took place on such date, at the mean between the closing bid and ask prices on the exchange where such securities are principally traded. Equity securities listed on the NASDAQ National Market System are valued at the NASDAQ official closing price. Unlisted or listed securities for which closing sales prices or closing quotations are not available are valued at the mean between the latest available bid and ask prices.
Derivatives. Futures contracts are valued at the closing settlement price established by the board of trade or exchange on which they are traded.
Other. Investments in management investment companies (including money market funds) that do not trade on an exchange are valued at the net asset value as of the close of each business day.
Fair Valuation. In connection with Rule 2a-5 of the 1940 Act, the Trustees have designated the Fund’s investment adviser as its valuation designee. Investments for which valuations or market quotations are not readily available or are deemed unreliable are valued by the investment adviser, as valuation designee, at fair value using methods that most fairly reflect the security’s “fair value”, which is the amount that the Fund might reasonably expect to receive for the security upon its current sale in the ordinary course. Each such determination is based on a consideration of relevant factors, which are likely to vary from one pricing context to another. These factors may include, but are not limited to, the type of security, the existence of any contractual restrictions on the security’s disposition, the price and extent of public trading in similar securities of the issuer or of comparable companies or entities, quotations or relevant information obtained from broker/dealers or other market participants, information obtained from the issuer, analysts, and/or the appropriate stock exchange (for exchange-traded securities), an analysis of the company’s or entity’s financial statements, and an evaluation of the forces that influence the issuer and the market(s) in which the security is purchased and sold.
B Investment Transactions—Investment transactions for financial statement purposes are accounted for on a trade date basis. Realized gains and losses on investments sold are determined on the basis of identified cost.
C Income—Interest income is recorded on the basis of interest accrued, adjusted for amortization of premium or accretion of discount. Inflation adjustments to the principal amount of inflation-adjusted bonds and notes are reflected as interest income. Deflation adjustments to the principal amount of an inflation-adjusted bond or note are reflected as reductions to interest income to the extent of interest income previously recorded on such bond or note. Dividend income is recorded on the ex-dividend date for dividends received in cash and/or securities.
D Federal Taxes—The Fund’s policy is to comply with the provisions of the Internal Revenue Code applicable to regulated investment companies and to distribute to shareholders each year substantially all of its net investment income, and all or substantially all of its net realized capital gains. Accordingly, no provision for federal income or excise tax is necessary.
Parametric
Commodity Strategy Fund
December 31, 2024
Notes to Consolidated Financial Statements — continued
The Subsidiary is treated as a controlled foreign corporation under the Internal Revenue Code and is not expected to be subject to U.S. federal income tax. The Fund is treated as a U.S. shareholder of the Subsidiary. As a result, the Fund is required to include in gross income for U.S. federal tax purposes all of the Subsidiary's income, whether or not such income is distributed by the Subsidiary. If a net loss is realized by the Subsidiary, such loss is not generally available to offset the income earned by the Fund.
As of December 31, 2024, the Fund had no uncertain tax positions that would require financial statement recognition, de-recognition, or disclosure. The Fund files a U.S. federal income tax return annually after its fiscal year-end, which is subject to examination by the Internal Revenue Service for a period of three years from the date of filing.
E Expenses—The majority of expenses of the Trust are directly identifiable to an individual fund. Expenses which are not readily identifiable to a specific fund are allocated taking into consideration, among other things, the nature and type of expense and the relative size of the funds.
F Use of Estimates—The preparation of the consolidated financial statements in conformity with U.S. GAAP requires management to make estimates and assumptions that affect the reported amounts of assets and liabilities at the date of the consolidated financial statements and the reported amounts of income and expense during the reporting period. Actual results could differ from those estimates.
G Indemnifications — Under the Trust’s organizational documents, its officers and Trustees may be indemnified against certain liabilities and expenses arising out of the performance of their duties to the Fund. Under Massachusetts law, if certain conditions prevail, shareholders of a Massachusetts business trust (such as the Trust) could be deemed to have personal liability for the obligations of the Trust. However, the Trust’s Declaration of Trust contains an express disclaimer of liability on the part of Fund shareholders and the By-laws provide that the Trust shall assume, upon request by the shareholder, the defense on behalf of any Fund shareholders. Moreover, the By-laws also provide for indemnification out of Fund property of any shareholder held personally liable solely by reason of being or having been a shareholder for all loss or expense arising from such liability. Additionally, in the normal course of business, the Fund enters into agreements with service providers that may contain indemnification clauses. The Fund’s maximum exposure under these arrangements is unknown as this would involve future claims that may be made against the Fund that have not yet occurred.
H Futures Contracts—Upon entering into a futures contract, the Fund is required to deposit with the broker, either in cash or securities, an amount equal to a certain percentage of the contract amount (initial margin). Subsequent payments, known as variation margin, are made or received by the Fund each business day (except for futures contracts traded on the London Metal Exchange, which make payments at contract expiration), depending on the daily fluctuations in the value of the underlying security, commodity or currency, and are recorded as unrealized gains or losses by the Fund. Gains (losses) are realized upon the expiration or closing of the futures contracts. Should market conditions change unexpectedly, the Fund may not achieve the anticipated benefits of the futures contracts and may realize a loss. Futures contracts have minimal counterparty risk as they are exchange traded and the clearinghouse for the exchange is substituted as the counterparty, guaranteeing counterparty performance.
I Segment Reporting—During the year ended December 31, 2024, the Fund adopted FASB Accounting Standards Update No. 2023-07, Segment Reporting (Topic 280): Improvements to Reportable Segment Disclosures, (ASU 2023-07), which requires incremental disclosures related to a public entity’s reportable segments. The Fund operates as a single reportable segment, an investment company whose investment objective is included in Note 1. In connection with the adoption of ASU 2023-07, the Fund’s President has been designated as the Fund’s Chief Operating Decision Maker (CODM), who is responsible for assessing the performance of the Fund’s single segment and deciding how to allocate the segment’s resources. To perform this function, the CODM reviews the information in the Fund’s Financial Statements.
2 Distributions to Shareholders and Income Tax Information
It is the present policy of the Fund to make at least one distribution annually (normally in December) of all or substantially all of its net investment income and to distribute annually all or substantially all of its net realized capital gains. Distributions to shareholders are recorded on the ex-dividend date. Distributions are declared separately for each class of shares. Shareholders may reinvest income and capital gain distributions in additional shares of the same class of the Fund at the net asset value as of the ex-dividend date or, at the election of the shareholder, receive distributions in cash. Distributions to shareholders are determined in accordance with income tax regulations, which may differ from U.S. GAAP. As required by U.S. GAAP, only distributions in excess of tax basis earnings and profits are reported in the financial statements as a return of capital. Permanent differences between book and tax accounting relating to distributions are reclassified to paid-in capital. For tax purposes, distributions from short-term capital gains are considered to be from ordinary income.
The tax character of distributions declared for the years ended December 31, 2024 and December 31, 2023 was as follows:
| | Year Ended December 31, |
| | 2024 | 2023 |
| Ordinary income | $76,724,457 | $43,714,287 |
Parametric
Commodity Strategy Fund
December 31, 2024
Notes to Consolidated Financial Statements — continued
During the year ended December 31, 2024, accumulated loss was increased by $86,406,241 and paid-in capital was increased by $86,406,241 due to the Fund’s use of equalization accounting and differences between book and tax accounting for the Fund’s investment in the Subsidiary. Tax equalization accounting allows the Fund to treat as a distribution that portion of redemption proceeds representing a redeeming shareholder’s portion of undistributed taxable income and net capital gains. These reclassifications had no effect on the net assets or net asset value per share of the Fund.
As of December 31, 2024, the components of distributable earnings (accumulated loss) on a tax basis were as follows:
| Deferred capital losses | $(36,302,192) |
| Net unrealized depreciation | (502,573,686) |
| Accumulated loss | $(538,875,878) |
At December 31, 2024, the Fund, for federal income tax purposes, had deferred capital losses of $36,302,192 which would reduce its taxable income arising from future net realized gains on investment transactions, if any, to the extent permitted by the Internal Revenue Code, and thus would reduce the amount of distributions to shareholders, which would otherwise be necessary to relieve the Fund of any liability for federal income or excise tax. The deferred capital losses are treated as arising on the first day of the Fund's next taxable year and retain the same short-term or long-term character as when originally deferred. Of the deferred capital losses at December 31, 2024, $36,302,192 are short-term.
The cost and unrealized appreciation (depreciation) of investments of the Fund, including open derivative contracts and the Fund's investment in the Subsidiary, at December 31, 2024, as determined on a federal income tax basis, were as follows:
| Aggregate cost | $1,554,525,751 |
| Gross unrealized appreciation | $387,850,945 |
| Gross unrealized depreciation | (512,937,187) |
| Net unrealized depreciation | $(125,086,242) |
3 Investment Adviser and Administration Fee and Other Transactions with Affiliates
The investment adviser and administration fee is earned by Eaton Vance Management (EVM), an indirect, wholly-owned subsidiary of Morgan Stanley, as compensation for investment advisory and administrative services rendered to the Fund and the Subsidiary. The investment adviser and adminstration fee is computed at an annual rate as a percentage of the Fund’s consolidated average daily net assets as follows and is payable monthly:
| Consolidated Average Daily Net Assets | Annual Fee Rate |
| Up to $1 billion | 0.550% |
| $1 billion but less than $2.5 billion | 0.525% |
| $2.5 billion but less than $5 billion | 0.505% |
| $5 billion and over | 0.490% |
For the year ended December 31, 2024, the investment adviser and administration fee amounted to $7,237,271 or 0.54% of the Fund’s consolidated average daily net assets. Pursuant to an investment sub-advisory agreement, EVM has delegated the investment management of the Fund to Parametric Portfolio Associates LLC (Parametric), an affiliate of EVM and an indirect, wholly-owned subsidiary of Morgan Stanley. EVM pays Parametric a portion of its investment adviser and administration fee for sub-advisory services provided to the Fund.
The Fund may invest in a money market fund, the Institutional Class of the Morgan Stanley Institutional Liquidity Funds - Government Portfolio (the “Liquidity Fund”), an open-end management investment company managed by Morgan Stanley Investment Management Inc., a wholly-owned subsidiary of Morgan Stanley. The investment adviser fee paid by the Fund is reduced by an amount equal to its pro rata share of the advisory and administration fees paid by the Fund due to its investment in the Liquidity Fund. For the year ended December 31, 2024, the investment adviser and administration fee paid was reduced by $217,015 relating to the Fund’s investment in the Liquidity Fund.
EVM provides sub-transfer agency and related services to the Fund pursuant to a Sub-Transfer Agency Support Services Agreement. For the year ended December 31, 2024, EVM earned $22,620 from the Fund pursuant to such agreement, which is included in transfer and dividend disbursing agent fees on the Consolidated Statement of Operations. The Fund was informed that Eaton Vance Distributors, Inc. (EVD), an affiliate of EVM and the Fund's
Parametric
Commodity Strategy Fund
December 31, 2024
Notes to Consolidated Financial Statements — continued
principal underwriter, received $2,920 as its portion of the sales charge on sales of Class A shares for the year ended December 31, 2024. EVD also received distribution and service fees from Class A shares (see Note 4).
Trustees and officers of the Fund who are members of EVM’s organization receive remuneration for their services to the Fund out of the investment adviser and administration fee. Trustees of the Fund who are not affiliated with EVM may elect to defer receipt of all or a percentage of their annual fees in accordance with the terms of the Trustees Deferred Compensation Plan. Certain officers and Trustees of the Fund are officers of the above organizations.
4 Distribution Plan
The Fund has in effect a distribution plan for Class A shares (Class A Plan) pursuant to Rule 12b-1 under the 1940 Act. Pursuant to the Class A Plan, the Fund pays EVD a distribution and service fee of 0.25% per annum of its average daily net assets attributable to Class A shares for distribution services and facilities provided to the Fund by EVD, as well as for personal services and/or the maintenance of shareholder accounts. Distribution and service fees paid or accrued to EVD for the year ended December 31, 2024 amounted to $262,176 for Class A shares.
Distribution and service fees are subject to the limitations contained in the Financial Industry Regulatory Authority Rule 2341(d).
5 Contingent Deferred Sales Charges
Class A shares may be subject to a 0.75% contingent deferred sales charge (CDSC) if redeemed within 12 months of purchase (depending on the circumstances of purchase). Redemptions of Class A shares by former Investor Class shareholders are not subject to a CDSC. Generally, the CDSC is based upon the lower of the net asset value at date of redemption or date of purchase. No charge is levied on shares acquired by reinvestment of dividends or capital gain distributions. For the year ended December 31, 2024, the Fund was informed that EVD received no CDSCs paid by Class A shareholders.
6 Purchases and Sales of Investments
There were no purchases and sales of investments, other than short-term obligations, for the year ended December 31, 2024.
7 Shares of Beneficial Interest
The Fund’s Declaration of Trust permits the Trustees to issue an unlimited number of full and fractional shares of beneficial interest (without par value). Such shares may be issued in a number of different series (such as the Fund) and classes. Transactions in Fund shares were as follows:
| | Year Ended
December 31, 2024 | | Year Ended
December 31, 2023 |
| | Shares | Amount | | Shares | Amount |
| Class A | | | | | |
| Sales | 7,263,005 | $ 45,214,131 | | 5,893,400 | $ 36,774,602 |
| Issued to shareholders electing to receive payments of distributions in Fund shares | 910,471 | 5,462,829 | | 605,339 | 3,559,393 |
| Redemptions | (7,287,860) | (45,086,175) | | (11,269,576) | (69,498,239) |
| Net increase (decrease) | 885,616 | $ 5,590,785 | | (4,770,837) | $ (29,164,244) |
| Class I | | | | | |
| Sales | 84,987,814 | $538,279,756 | | 87,143,649 | $ 547,778,007 |
| Issued to shareholders electing to receive payments of distributions in Fund shares | 11,414,673 | 69,172,916 | | 6,566,252 | 39,003,536 |
| Redemptions | (67,939,231) | (424,972,513) | | (160,884,990) | (1,002,854,139) |
| Net increase (decrease) | 28,463,256 | $182,480,159 | | (67,175,089) | $ (416,072,596) |
8 Financial Instruments
The Fund may trade in financial instruments with off-balance sheet risk in the normal course of its investing activities. These financial instruments may
Parametric
Commodity Strategy Fund
December 31, 2024
Notes to Consolidated Financial Statements — continued
include futures contracts and may involve, to a varying degree, elements of risk in excess of the amounts recognized for financial statement purposes. The notional or contractual amounts of these instruments represent the investment the Fund has in particular classes of financial instruments and do not necessarily represent the amounts potentially subject to risk. The measurement of the risks associated with these instruments is meaningful only when all related and offsetting transactions are considered. A summary of obligations under these financial instruments at December 31, 2024 is included in the Consolidated Portfolio of Investments. At December 31, 2024, the Fund had sufficient cash and/or securities to cover commitments under these contracts.
The Fund is subject to commodity risk in the normal course of pursuing its investment objective. Commodity risk is the risk that the value of a commodity or commodity index will fluctuate based on increases or decreases in the commodities market and factors specific to a particular industry or commodity. The Fund invests primarily in commodities-linked derivative investments, including commodity futures contracts, and in commodity exchange-traded funds that provide exposure to the investment returns of the commodities markets, without investing directly in physical commodities.
The fair value of open derivative instruments (not considered to be hedging instruments for accounting disclosure purposes) and whose primary underlying risk exposure is commodity risk at December 31, 2024 was as follows:
| | Fair Value |
| Derivative | Asset Derivative | Liability Derivative |
| Futures contracts | $75,607,728(1) | $(94,630,381)(1) |
| (1) | Amount represents cumulative unrealized appreciation or (depreciation) on futures contracts. Only the variation margin on open futures contracts is reported within the Consolidated Statement of Assets and Liabilities as Receivable or Payable for variation margin on open futures contracts, as applicable. |
The effect of derivative instruments (not considered to be hedging instruments for accounting disclosure purposes) on the Consolidated Statement of Operations and whose primary underlying risk exposure is commodity risk for the year ended December 31, 2024 was as follows:
| Derivative | Realized Gain (Loss)
on Derivatives Recognized
in Income | Change in Unrealized
Appreciation (Depreciation) on
Derivatives Recognized in Income |
| Futures contracts | $73,963,436(1) | $(31,523,994)(2) |
| (1) | Consolidated Statement of Operations location: Net realized gain (loss) - Futures contracts. |
| (2) | Consolidated Statement of Operations location: Change in unrealized appreciation (depreciation) - Futures contracts. |
The average notional cost of futures contracts outstanding during the year ended December 31, 2024, which is indicative of the volume of this derivative type, was approximately as follows:
Futures
Contracts — Long | Futures
Contracts — Short |
| $1,812,912,000 | $556,171,000 |
9 Line of Credit
The Fund participates with other portfolios and funds managed by EVM and its affiliates in a $650 million unsecured revolving line of credit agreement with a group of banks, which is in effect through October 21, 2025. Borrowings are made by the Fund solely for temporary purposes related to redemptions and other short-term cash needs. Interest is charged to the Fund based on its borrowings generally at an amount above either the Secured Overnight Financing Rate (SOFR) or Federal Funds rate. In addition, a fee computed at an annual rate of 0.15% on the daily unused portion of the line of credit is allocated among the participating portfolios and funds at the end of each quarter. In connection with the renewal of the agreement in October 2024, an arrangement fee totaling $150,000 was incurred that was allocated to the participating portfolios and funds. Because the line of credit is not available exclusively to the Fund, it may be unable to borrow some or all of its requested amounts at any particular time. The Fund did not have any significant borrowings or allocated fees during the year ended December 31, 2024.
Parametric
Commodity Strategy Fund
December 31, 2024
Notes to Consolidated Financial Statements — continued
10 Affiliated Investments
At December 31, 2024, the value of the Fund's investment in funds that may be deemed to be affiliated was $60,222,366, which represents 4.2% of the Fund's net assets. Transactions in such investments by the Fund for the year ended December 31, 2024 were as follows:
| Name | Value,
beginning
of period | Purchases | Sales
proceeds | Net realized
gain (loss) | Change in
unrealized
appreciation
(depreciation) | Value, end
of period | Dividend
income | Shares,
end of period |
| Short-Term Investments |
| Liquidity Fund | $66,269,993 | $2,508,705,576 | $(2,514,753,203) | $ — | $ — | $60,222,366 | $7,614,026 | 60,222,366 |
11 Fair Value Measurements
Under generally accepted accounting principles for fair value measurements, a three-tier hierarchy to prioritize the assumptions, referred to as inputs, is used in valuation techniques to measure fair value. The three-tier hierarchy of inputs is summarized in the three broad levels listed below.
| • | Level 1 – quoted prices in active markets for identical investments |
| • | Level 2 – other significant observable inputs (including quoted prices for similar investments, interest rates, prepayment speeds, credit risk, etc.) |
| • | Level 3 – significant unobservable inputs (including a fund's own assumptions in determining the fair value of investments) |
In cases where the inputs used to measure fair value fall in different levels of the fair value hierarchy, the level disclosed is determined based on the lowest level input that is significant to the fair value measurement in its entirety. The inputs or methodology used for valuing securities are not necessarily an indication of the risk associated with investing in those securities.
At December 31, 2024, the hierarchy of inputs used in valuing the Fund’s investments and open derivative instruments, which are carried at fair value, were as follows:
| Asset Description | Level 1 | Level 2 | Level 3 | Total |
| Exchange-Traded Funds | $ 81,988,230 | $ — | $ — | $ 81,988,230 |
| Short-Term Investments: | | | | |
| Affiliated Fund | 60,222,366 | — | — | 60,222,366 |
| U.S. Treasury Obligations | — | 1,133,424,380 | — | 1,133,424,380 |
| Total Investments | $142,210,596 | $1,133,424,380 | $ — | $1,275,634,976 |
| Futures Contracts | $ 75,607,728 | $ — | $ — | $ 75,607,728 |
| Total | $217,818,324 | $1,133,424,380 | $ — | $1,351,242,704 |
| Liability Description | | | | |
| Futures Contracts | $(94,630,381) | $ — | $ — | $ (94,630,381) |
| Total | $(94,630,381) | $ — | $ — | $ (94,630,381) |
Parametric
Commodity Strategy Fund
December 31, 2024
Notes to Consolidated Financial Statements — continued
12 Risks and Uncertainties
Risks Associated with Commodities
The commodities which underlie commodity-linked derivatives in which the Fund invests may be subject to additional economic and non-economic variables, such as drought, floods, weather, livestock disease, embargoes, tariffs, and international economic, political and regulatory developments. These factors may have a larger impact on commodity prices and commodity-linked instruments than on traditional securities. Certain commodities are also subject to limited pricing flexibility because of supply and demand factors. Others are subject to broad price fluctuations as a result of the volatility of the prices for certain raw materials and the instability of supplies of other materials. These additional variables may create additional investment risks which subject the Fund’s investments to greater volatility than investments in traditional securities.
Parametric
Commodity Strategy Fund
December 31, 2024
Report of Independent Registered Public Accounting Firm
To the Trustees of Eaton Vance Mutual Funds Trust and Shareholders of Parametric Commodity Strategy Fund:
Opinion on the Financial Statements and Financial Highlights
We have audited the accompanying consolidated statement of assets and liabilities of Parametric Commodity Strategy Fund and subsidiary (the “Fund”) (one of the funds constituting Eaton Vance Mutual Funds Trust), including the consolidated portfolio of investments, as of December 31, 2024, the related consolidated statement of operations for the year then ended, the consolidated statements of changes in net assets for each of the two years in the period then ended, the consolidated financial highlights for each of the five years in the period then ended, and the related notes (collectively referred to as the “financial statements and financial highlights”). In our opinion, the financial statements and financial highlights present fairly, in all material respects, the financial position of the Fund as of December 31, 2024, and the results of its operations for the year then ended, the changes in its net assets for each of the two years in the period then ended, and the financial highlights for each of the five years in the period then ended, in conformity with accounting principles generally accepted in the United States of America.
Basis for Opinion
These financial statements and financial highlights are the responsibility of the Fund's management. Our responsibility is to express an opinion on the Fund's financial statements and financial highlights based on our audits. We are a public accounting firm registered with the Public Company Accounting Oversight Board (United States) (PCAOB) and are required to be independent with respect to the Fund in accordance with the U.S. federal securities laws and the applicable rules and regulations of the Securities and Exchange Commission and the PCAOB.
We conducted our audits in accordance with the standards of the PCAOB. Those standards require that we plan and perform the audit to obtain reasonable assurance about whether the financial statements and financial highlights are free of material misstatement, whether due to error or fraud. The Fund is not required to have, nor were we engaged to perform, an audit of its internal control over financial reporting. As part of our audits, we are required to obtain an understanding of internal control over financial reporting but not for the purpose of expressing an opinion on the effectiveness of the Fund’s internal control over financial reporting. Accordingly, we express no such opinion.
Our audits included performing procedures to assess the risks of material misstatement of the financial statements and financial highlights, whether due to error or fraud, and performing procedures that respond to those risks. Such procedures included examining, on a test basis, evidence regarding the amounts and disclosures in the financial statements and financial highlights. Our audits also included evaluating the accounting principles used and significant estimates made by management, as well as evaluating the overall presentation of the financial statements and financial highlights. Our procedures included confirmation of securities owned as of December 31, 2024, by correspondence with the custodian and brokers; when replies were not received from brokers, we performed other auditing procedures. We believe that our audits provide a reasonable basis for our opinion.
/s/ Deloitte & Touche LLP
Boston, Massachusetts
February 21, 2025
We have served as the auditor of one or more Eaton Vance investment companies since 1959.
Parametric
Commodity Strategy Fund
December 31, 2024
Federal Tax Information (Unaudited)
The Form 1099-DIV you received in February 2025 showed the tax status of all distributions paid to your account in calendar year 2024. Shareholders are advised to consult their own tax adviser with respect to the tax consequences of their investment in the Fund.
This Page Intentionally Left Blank
This Page Intentionally Left Blank
This Page Intentionally Left Blank
| Item 8. | Changes in and Disagreements with Accountants for Open-End Management Investment Companies |
Not applicable.
| Item 9. | Proxy Disclosures for Open-End Management Investment Companies |
Not applicable.
| Item 10. | Remuneration Paid to Directors, Officers, and Others of Open-End Management Investment Companies |
The information is disclosed as part of the Financial Statements included in Item 7 of this Form N-CSR.
| Item 11. | Statement Regarding Basis for Approval of Investment Advisory Contract |
Not applicable.
| Item 12. | Disclosure of Proxy Voting Policies and Procedures for Closed-End Management Investment Companies |
Not applicable.
| Item 13. | Portfolio Managers of Closed-End Management Investment Companies |
Not applicable.
| Item 14. | Purchases of Equity Securities by Closed-End Management Investment Company and Affiliated Purchasers |
Not applicable.
| Item 15. | Submission of Matters to a Vote of Security Holders |
There have been no material changes to the procedures by which shareholders may recommend nominee to the Fund’s Board of Trustees since the Fund last provided disclosure in response to this item.
| Item 16. | Controls and Procedures |
| (a) | It is the conclusion of the registrant’s principal executive officer and principal financial officer that the effectiveness of the registrant’s current disclosure controls and procedures (such disclosure controls and procedures having been evaluated within 90 days of the date of this filing) provide reasonable assurance that the information required to be disclosed by the registrant has been recorded, processed, summarized and reported within the time period specified in the Commission’s rules and forms and that the information required to be disclosed by the registrant has been accumulated and communicated to the registrant’s principal executive officer and principal financial officer in order to allow timely decisions regarding required disclosure. |
| (b) | There have been no changes in the registrant’s internal control over financial reporting during the period covered by this report that has materially affected, or is reasonably likely to materially affect, the registrant’s internal control over financial reporting. |
| Item 17. | Disclosure of Securities Lending Activities for Closed-End Management Investment Companies |
Not applicable.
| Item 18. | Recovery of Erroneously Awarded Compensation |
Not applicable.
Signatures
Pursuant to the requirements of the Securities Exchange Act of 1934 and the Investment Company Act of 1940, the registrant has duly caused this report to be signed on its behalf by the undersigned, thereunto duly authorized.
| | |
| Eaton Vance Mutual Funds Trust |
| |
| By: | | /s/ Kenneth A. Topping |
| | Kenneth A. Topping |
| | Principal Executive Officer |
| |
| Date: | | February 26, 2025 |
Pursuant to the requirements of the Securities Exchange Act of 1934 and the Investment Company Act of 1940, this report has been signed below by the following persons on behalf of the registrant and in the capacities and on the dates indicated.
| | |
| By: | | /s/ James F. Kirchner |
| | James F. Kirchner |
| | Principal Financial Officer |
| |
| Date: | | February 26, 2025 |
| |
| By: | | /s/ Kenneth A. Topping |
| | Kenneth A. Topping |
| | Principal Executive Officer |
| |
| Date: | | February 26, 2025 |