United States
Securities and Exchange Commission
Washington, D.C. 20549
Form N-CSR
Certified Shareholder Report of Registered Management Investment Companies
811-4018
(Investment Company Act File Number)
Federated Hermes High Yield Trust
_______________________________________________________________
(Exact Name of Registrant as Specified in Charter)
Federated Hermes Funds
4000 Ericsson Drive
Warrendale, Pennsylvania 15086-7561
(Address of Principal Executive Offices)
(412) 288-1900
(Registrant's Telephone Number)
Peter J. Germain, Esquire
1001 Liberty Avenue
Pittsburgh, Pennsylvania 15222-3779
(Name and Address of Agent for Service)
(Notices should be sent to the Agent for Service)
Date of Fiscal Year End: 02/28/22
Date of Reporting Period: 02/28/22
| Item 1. | Reports to Stockholders |

Share Class | Ticker | A | FHYAX | C | FHYCX | Institutional | FHTIX |
Service | FHYTX | R6 | FHYLX |
Federated Hermes Opportunistic High Yield Bond Fund
A Portfolio of Federated Hermes High Yield Trust

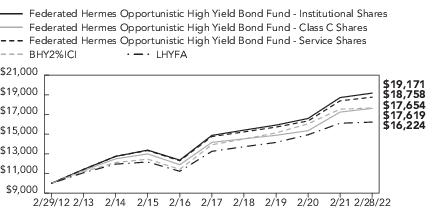
1 Year | 5 Years | 10 Years | |
Class A Shares4 | -2.44% | 3.94% | 5.97% |
Class C Shares4 | 0.38% | 4.13% | 5.83% |
Institutional Shares4 | 2.43% | 5.21% | 6.72% |
Service Shares | 2.03% | 4.92% | 6.49% |
Class R6 Shares4 | 2.44% | 5.21% | 6.64% |
BHY2%ICI | 0.64% | 4.87% | 5.85% |
LHYFA | 0.80% | 4.16% | 4.93% |
Index Classification | Percentage of Total Net Assets2 |
Media Entertainment | 8.7% |
Cable Satellite | 8.1% |
Technology | 7.5% |
Health Care | 6.9% |
Midstream | 6.3% |
Automotive | 5.9% |
Independent Energy | 5.5% |
Insurance - P&C | 4.9% |
Packaging | 4.7% |
Pharmaceuticals | 3.6% |
Gaming | 3.6% |
Other3 | 30.9% |
Bank Loan Core Fund | 1.1% |
Cash Equivalents4 | 0.9% |
Other Assets and Liabilities - Net5 | 1.4% |
Total | 100% |
1 | Index classifications are based upon, and individual portfolio securities are assigned to, the classifications and sub-classifications of the Bloomberg U.S. Corporate High Yield 2% Issuer Capped Index (BHY2%ICI). Individual portfolio securities that are not included in the BHY2%ICI are assigned to an index classification by the Fund’s Adviser. |
2 | As of the date specified above, the Fund owned shares of one or more affiliated investment companies. For purposes of this table, affiliated investment companies (other than an affiliated money market mutual fund) in which the Fund invested less than 10% of its net assets, are listed individually in the table. |
3 | For purposes of this table, index classifications which constitute less than 3.5% of the Fund’s total net assets have been aggregated under the designation “Other.” |
4 | Cash Equivalents include any investments in money market mutual funds and/or overnight repurchase agreements. |
5 | Assets, other than investments in securities, less liabilities. See Statement of Assets and Liabilities. |
Principal Amount or Shares | Value | ||
CORPORATE BONDS— 86.5% | |||
Aerospace/Defense— 1.4% | |||
$2,725,000 | TransDigm, Inc., Sec. Fac. Bond, 144A, 6.250%, 3/15/2026 | $ 2,807,254 | |
1,575,000 | TransDigm, Inc., Sr. Sub. Note, 6.375%, 6/15/2026 | 1,607,516 | |
800,000 | TransDigm, Inc., Sr. Sub. Note, Series WI, 4.625%, 1/15/2029 | 755,944 | |
1,800,000 | TransDigm, Inc., Sr. Sub. Note, Series WI, 4.875%, 5/1/2029 | 1,712,340 | |
675,000 | TransDigm, Inc., Sr. Sub., 6.875%, 5/15/2026 | 697,896 | |
1,275,000 | TransDigm, Inc., Sr. Sub., Series WI, 5.500%, 11/15/2027 | 1,271,347 | |
850,000 | TransDigm, Inc., Sr. Sub., Series WI, 7.500%, 3/15/2027 | 879,538 | |
TOTAL | 9,731,835 | ||
Airlines— 0.4% | |||
2,025,000 | American Airlines, Inc./AAdvantage Loyalty IP Ltd., 144A, 5.500%, 4/20/2026 | 2,075,625 | |
975,000 | American Airlines, Inc./AAdvantage Loyalty IP Ltd., 144A, 5.750%, 4/20/2029 | 998,468 | |
TOTAL | 3,074,093 | ||
Automotive— 5.3% | |||
2,775,000 | Adient Global Holdings Ltd., Sr. Unsecd. Note, 144A, 4.875%, 8/15/2026 | 2,782,534 | |
525,000 | Dana Financing Lux Sarl, Sr. Unsecd. Note, 144A, 5.750%, 4/15/2025 | 532,237 | |
125,000 | Dana, Inc., Sr. Unsecd. Note, 4.250%, 9/1/2030 | 119,372 | |
550,000 | Dana, Inc., Sr. Unsecd. Note, 4.500%, 2/15/2032 | 517,179 | |
2,825,000 | Dornoch Debt Merger Sub, Inc., Sr. Unsecd. Note, 144A, 6.625%, 10/15/2029 | 2,623,719 | |
2,050,000 | Ford Motor Credit Co. LLC, Sr. Unsecd. Note, 3.375%, 11/13/2025 | 2,021,587 | |
1,650,000 | Ford Motor Credit Co. LLC, Sr. Unsecd. Note, 4.000%, 11/13/2030 | 1,639,572 | |
825,000 | Ford Motor Credit Co. LLC, Sr. Unsecd. Note, 4.063%, 11/1/2024 | 838,289 | |
1,250,000 | Ford Motor Credit Co. LLC, Sr. Unsecd. Note, 4.125%, 8/17/2027 | 1,261,062 | |
1,175,000 | Ford Motor Credit Co. LLC, Sr. Unsecd. Note, 4.140%, 2/15/2023 | 1,189,588 | |
1,225,000 | Ford Motor Credit Co. LLC, Sr. Unsecd. Note, 4.271%, 1/9/2027 | 1,236,270 | |
2,600,000 | Ford Motor Credit Co. LLC, Sr. Unsecd. Note, 5.113%, 5/3/2029 | 2,745,197 | |
1,875,000 | Ford Motor Credit Co. LLC, Sr. Unsecd. Note, 5.125%, 6/16/2025 | 1,963,331 | |
1,150,000 | Ford Motor Credit Co. LLC, Sr. Unsecd. Note, Series GMTN, 4.389%, 1/8/2026 | 1,174,529 | |
825,000 | IHO Verwaltungs GmbH, Sec. Fac. Bond, 144A, 6.000%, 5/15/2027 | 840,527 | |
700,000 | IHO Verwaltungs GmbH, Sec. Fac. Bond, 144A, 6.375%, 5/15/2029 | 727,465 | |
1,800,000 | J.B. Poindexter & Co., Inc., Sr. Unsecd. Note, 144A, 7.125%, 4/15/2026 | 1,870,200 | |
1,875,000 | KAR Auction Services, Inc., Sr. Unsecd. Note, 144A, 5.125%, 6/1/2025 | 1,900,894 | |
5,925,000 | Panther BF Aggregator 2 LP, Sr. Unsecd. Note, 144A, 8.500%, 5/15/2027 | 6,182,737 | |
4,125,000 | Real Hero Merger Sub 2, Inc., Sr. Unsecd. Note, 144A, 6.250%, 2/1/2029 | 3,892,866 |
Principal Amount or Shares | Value | ||
CORPORATE BONDS— continued | |||
Automotive— continued | |||
$1,600,000 | Schaeffler Verwaltung Zw, 144A, 4.750%, 9/15/2026 | $ 1,614,864 | |
TOTAL | 37,674,019 | ||
Building Materials— 2.7% | |||
200,000 | Abc Supply Co., Inc., Sr. Unsecd. Note, 144A, 3.875%, 11/15/2029 | 188,313 | |
975,000 | American Builders & Contractors Supply Co., Inc., 144A, 4.000%, 1/15/2028 | 954,701 | |
600,000 | Cornerstone Building Brands, Sr. Unsecd. Note, 144A, 6.125%, 1/15/2029 | 575,199 | |
2,875,000 | Cp Atlas Buyer, Inc., Sr. Unsecd. Note, 144A, 7.000%, 12/1/2028 | 2,595,694 | |
2,300,000 | Foundation Building Materials, Inc., Sr. Unsecd. Note, 144A, 6.000%, 3/1/2029 | 2,141,771 | |
975,000 | Gyp Holdings III Corp., Sr. Unsecd. Note, 144A, 4.625%, 5/1/2029 | 910,733 | |
650,000 | Interface, Inc., Sr. Unsecd. Note, 144A, 5.500%, 12/1/2028 | 655,694 | |
300,000 | MIWD Holdco II LLC/ MIWD Finance Corp., Sr. Unsecd. Note, 144A, 5.500%, 2/1/2030 | 286,442 | |
2,025,000 | Srs Distribution, Inc., Sr. Unsecd. Note, 144A, 6.000%, 12/1/2029 | 1,916,257 | |
675,000 | Srs Distribution, Inc., Sr. Unsecd. Note, 144A, 6.125%, 7/1/2029 | 645,779 | |
1,475,000 | Standard Industries, Inc., Sr. Unsecd. Note, 144A, 3.375%, 1/15/2031 | 1,307,315 | |
1,125,000 | Standard Industries, Inc., Sr. Unsecd. Note, 144A, 4.375%, 7/15/2030 | 1,066,888 | |
500,000 | Standard Industries, Inc., Sr. Unsecd. Note, 144A, 4.750%, 1/15/2028 | 491,470 | |
2,675,000 | Standard Industries, Inc., Sr. Unsecd. Note, 144A, 5.000%, 2/15/2027 | 2,695,129 | |
1,400,000 | White Cap Buyer LLC, Sr. Unsecd. Note, 144A, 6.875%, 10/15/2028 | 1,394,722 | |
1,600,000 | White Cap Parent LLC, Sr. Sub. Secd. Note, 144A, 8.250%, 3/15/2026 | 1,614,720 | |
TOTAL | 19,440,827 | ||
Cable Satellite— 7.8% | |||
300,000 | CCO Holdings LLC/Cap Corp., Sr. Sub. Secd. Note, 144A, 5.500%, 5/1/2026 | 306,372 | |
1,475,000 | CCO Holdings LLC/Cap Corp., Sr. Unsecd. Note, 4.500%, 5/1/2032 | 1,403,691 | |
1,150,000 | CCO Holdings LLC/Cap Corp., Sr. Unsecd. Note, 144A, 4.250%, 2/1/2031 | 1,079,413 | |
2,300,000 | CCO Holdings LLC/Cap Corp., Sr. Unsecd. Note, 144A, 4.500%, 8/15/2030 | 2,218,971 | |
1,375,000 | CCO Holdings LLC/Cap Corp., Sr. Unsecd. Note, 144A, 4.500%, 6/1/2033 | 1,291,091 | |
2,125,000 | CCO Holdings LLC/Cap Corp., Sr. Unsecd. Note, 144A, 4.750%, 3/1/2030 | 2,090,469 | |
450,000 | CCO Holdings LLC/Cap Corp., Sr. Unsecd. Note, 144A, 4.750%, 2/1/2032 | 438,397 | |
1,900,000 | CCO Holdings LLC/Cap Corp., Sr. Unsecd. Note, 144A, 5.000%, 2/1/2028 | 1,913,813 | |
2,750,000 | CCO Holdings LLC/Cap Corp., Sr. Unsecd. Note, 144A, 5.125%, 5/1/2027 | 2,780,690 | |
1,000,000 | CCO Holdings LLC/Cap Corp., Sr. Unsecd. Note, 144A, 5.375%, 6/1/2029 | 1,017,340 | |
500,000 | CSC Holdings LLC, Sr. Unsecd. Note, 144A, 3.375%, 2/15/2031 | 426,626 | |
1,200,000 | CSC Holdings LLC, Sr. Unsecd. Note, 144A, 4.500%, 11/15/2031 | 1,093,680 | |
1,825,000 | CSC Holdings LLC, Sr. Unsecd. Note, 144A, 4.625%, 12/1/2030 | 1,522,940 | |
1,300,000 | CSC Holdings LLC, Sr. Unsecd. Note, 144A, 5.000%, 11/15/2031 | 1,083,784 | |
4,000,000 | CSC Holdings LLC, Sr. Unsecd. Note, 144A, 5.500%, 4/15/2027 | 3,994,840 |
Principal Amount or Shares | Value | ||
CORPORATE BONDS— continued | |||
Cable Satellite— continued | |||
$2,300,000 | CSC Holdings LLC, Sr. Unsecd. Note, 144A, 5.750%, 1/15/2030 | $ 2,037,846 | |
2,350,000 | CSC Holdings LLC, Sr. Unsecd. Note, 144A, 7.500%, 4/1/2028 | 2,349,459 | |
1,575,000 | DIRECTV Holdings LLC, Sec. Fac. Bond, 144A, 5.875%, 8/15/2027 | 1,576,969 | |
725,000 | DISH DBS Corp., Sec. Fac. Bond, 144A, 5.750%, 12/1/2028 | 694,641 | |
200,000 | DISH DBS Corp., Sr. Unsecd. Note, 5.875%, 11/15/2024 | 200,200 | |
750,000 | DISH DBS Corp., Sr. Unsecd. Note, 7.375%, 7/1/2028 | 711,525 | |
1,325,000 | DISH DBS Corp., Sr. Unsecd. Note, 7.750%, 7/1/2026 | 1,343,345 | |
2,075,000 | DISH DBS Corp., Sr. Unsecd. Note, Series WI, 5.125%, 6/1/2029 | 1,754,495 | |
1,600,000 | Doyla Holdco 18 Designated Activity Co., Sr. Unsecd. Note, 144A, 5.000%, 7/15/2028 | 1,526,880 | |
1,400,000 | 1,2,3 | Intelsat Jackson Holdings S.A., Sr. Unsecd. Note, 5.500%, 8/1/2023 | 0 |
325,000 | 1,2,3 | Intelsat Jackson Holdings S.A., Sr. Unsecd. Note, 144A, 8.500%, 10/15/2024 | 0 |
475,000 | 1,2,3 | Intelsat Jackson Holdings S.A., Sr. Unsecd. Note, 144A, 9.750%, 7/15/2025 | 0 |
675,000 | Sirius XM Radio, Inc., Sr. Unsecd. Note, 144A, 3.125%, 9/1/2026 | 645,543 | |
2,300,000 | Sirius XM Radio, Inc., Sr. Unsecd. Note, 144A, 3.875%, 9/1/2031 | 2,122,520 | |
1,025,000 | Sirius XM Radio, Inc., Sr. Unsecd. Note, 144A, 4.000%, 7/15/2028 | 987,178 | |
1,625,000 | Sirius XM Radio, Inc., Sr. Unsecd. Note, 144A, 4.125%, 7/1/2030 | 1,538,509 | |
975,000 | Sirius XM Radio, Inc., Sr. Unsecd. Note, 144A, 5.500%, 7/1/2029 | 998,619 | |
3,400,000 | Telenet Finance Luxembourg, Sec. Fac. Bond, 144A, 5.500%, 3/1/2028 | 3,400,000 | |
3,125,000 | UPC Broadband Finco BV, Sr. Note, 144A, 4.875%, 7/15/2031 | 2,989,094 | |
1,550,000 | Virgin Media Finance PLC, Sr. Unsecd. Note, 144A, 5.000%, 7/15/2030 | 1,468,075 | |
525,000 | Virgin Media Secured Finance PLC, Sec. Fac. Bond, 144A, 4.500%, 8/15/2030 | 497,175 | |
500,000 | Vmed O2 UK Financing I PLC, Sec. Fac. Bond, 144A, 4.250%, 1/31/2031 | 460,745 | |
2,200,000 | Vmed O2 UK Financing I PLC, Sr. Note, 144A, 4.750%, 7/15/2031 | 2,112,220 | |
1,725,000 | VZ Secured Financing B.V., Sec. Fac. Bond, 144A, 5.000%, 1/15/2032 | 1,637,016 | |
1,550,000 | Ziggo Finance BV, Sr. Unsecd. Note, 144A, 6.000%, 1/15/2027 | 1,571,010 | |
TOTAL | 55,285,181 | ||
Chemicals— 2.4% | |||
300,000 | Axalta Coat/Dutch Holding BV, Sr. Unsecd. Note, 144A, 4.750%, 6/15/2027 | 301,133 | |
425,000 | Axalta Coating Systems LLC, Sr. Unsecd. Note, 144A, 3.375%, 2/15/2029 | 388,425 | |
2,125,000 | Compass Minerals International, Inc., Sr. Unsecd. Note, 144A, 4.875%, 7/15/2024 | 2,137,750 | |
450,000 | Compass Minerals International, Inc., Sr. Unsecd. Note, 144A, 6.750%, 12/1/2027 | 467,744 | |
975,000 | Element Solutions, Inc., Sr. Unsecd. Note, 144A, 3.875%, 9/1/2028 | 926,260 | |
375,000 | H.B. Fuller Co., Sr. Unsecd. Note, 4.250%, 10/15/2028 | 357,602 | |
2,125,000 | Herens Holdco S.a.r.l., Sec. Fac. Bond, 144A, 4.750%, 5/15/2028 | 1,989,021 | |
1,775,000 | Hexion, Inc., Sr. Unsecd. Note, 144A, 7.875%, 7/15/2027 | 1,870,965 |
Principal Amount or Shares | Value | ||
CORPORATE BONDS— continued | |||
Chemicals— continued | |||
$ 225,000 | Illuminate Buyer LLC/Illuminate Holdings IV, Inc., Sr. Unsecd. Note, 144A, 9.000%, 7/1/2028 | $ 238,266 | |
3,250,000 | Koppers, Inc., Sr. Unsecd. Note, 144A, 6.000%, 2/15/2025 | 3,265,372 | |
975,000 | Olympus Water US Holding Corp., Sec. Fac. Bond, 144A, 4.250%, 10/1/2028 | 910,455 | |
1,450,000 | Olympus Water US Holding Corp., Sr. Unsecd. Note, 144A, 6.250%, 10/1/2029 | 1,332,057 | |
1,750,000 | Polar US Borrower LLC, Sr. Unsecd. Note, 144A, 6.750%, 5/15/2026 | 1,595,396 | |
200,000 | SPCM SA, 144A, 3.125%, 3/15/2027 | 189,717 | |
325,000 | SPCM SA, Sr. Unsecd. Note, 144A, 3.375%, 3/15/2030 | 294,718 | |
925,000 | WR Grace Holdings LLC, Sr. Unsecd. Note, 144A, 5.625%, 8/15/2029 | 888,000 | |
TOTAL | 17,152,881 | ||
Construction Machinery— 0.7% | |||
2,325,000 | H&E Equipment Services, Inc., Sr. Unsecd. Note, 144A, 3.875%, 12/15/2028 | 2,178,723 | |
350,000 | United Rentals North America, Inc., Sr. Unsecd. Note, 3.750%, 1/15/2032 | 333,888 | |
925,000 | United Rentals North America, Inc., Sr. Unsecd. Note, 4.000%, 7/15/2030 | 912,281 | |
775,000 | United Rentals North America, Inc., Sr. Unsecd. Note, 4.875%, 1/15/2028 | 791,903 | |
725,000 | United Rentals, Inc., Sr. Unsecd. Note, 3.875%, 2/15/2031 | 701,593 | |
TOTAL | 4,918,388 | ||
Consumer Cyclical Services— 2.3% | |||
2,050,000 | Allied Universal Holdco LLC, Sr. Unsecd. Note, 144A, 6.000%, 6/1/2029 | 1,909,042 | |
4,650,000 | Allied Universal Holdco LLC, Sr. Unsecd. Note, 144A, 9.750%, 7/15/2027 | 4,863,900 | |
375,000 | Atlas Luxco 4 S.a.r.l. / Allied Universal Holdings Co. LLC / Allied Universal Finance Corp., Sec. Fac. Bond, 144A, 4.625%, 6/1/2028 | 351,397 | |
900,000 | Garda World Security Corp., Sec. Fac. Bond, 144A, 4.625%, 2/15/2027 | 873,306 | |
1,625,000 | Garda World Security Corp., Sr. Unsecd. Note, 144A, 6.000%, 6/1/2029 | 1,476,597 | |
800,000 | Go Daddy Operating Co. LLC / GD Finance Co., Inc., Sr. Unsecd. Note, 144A, 5.250%, 12/1/2027 | 815,060 | |
4,528,000 | GW B-CR Security Corp., Sr. Unsecd. Note, 144A, 9.500%, 11/1/2027 | 4,677,039 | |
1,725,000 | Signal Parent, Inc., Sr. Unsecd. Note, 144A, 6.125%, 4/1/2029 | 1,438,978 | |
TOTAL | 16,405,319 | ||
Consumer Products— 1.3% | |||
3,025,000 | BCPE Empire Holdings, Inc., Sr. Unsecd. Note, 144A, 7.625%, 5/1/2027 | 2,880,662 | |
1,675,000 | Diamond BC BV, Sr. Unsecd. Note, 144A, 4.625%, 10/1/2029 | 1,526,503 | |
1,075,000 | Edgewell Personal Care Co., Sr. Unsecd. Note, 144A, 4.125%, 4/1/2029 | 1,011,322 | |
1,200,000 | Energizer Holdings, Inc., Sr. Unsecd. Note, 144A, 4.375%, 3/31/2029 | 1,082,982 | |
1,475,000 | Energizer Holdings, Inc., Sr. Unsecd. Note, 144A, 4.750%, 6/15/2028 | 1,395,461 | |
425,000 | Prestige Brands, Inc., Sr. Unsecd. Note, 144A, 3.750%, 4/1/2031 | 392,190 | |
650,000 | Prestige Brands, Inc., Sr. Unsecd. Note, 144A, 5.125%, 1/15/2028 | 651,641 | |
TOTAL | 8,940,761 |
Principal Amount or Shares | Value | ||
CORPORATE BONDS— continued | |||
Diversified Manufacturing— 0.8% | |||
$3,725,000 | Gates Global LLC, Sr. Unsecd. Note, 144A, 6.250%, 1/15/2026 | $ 3,813,618 | |
950,000 | WESCO Distribution, Inc., Sr. Unsecd. Note, 144A, 7.125%, 6/15/2025 | 996,042 | |
1,050,000 | WESCO Distribution, Inc., Sr. Unsecd. Note, 144A, 7.250%, 6/15/2028 | 1,128,634 | |
TOTAL | 5,938,294 | ||
Finance Companies— 1.7% | |||
1,275,000 | Ld Holdings Group LLC, Sr. Unsecd. Note, 144A, 6.125%, 4/1/2028 | 1,139,417 | |
275,000 | Navient Corp., Sr. Unsecd. Note, 5.000%, 3/15/2027 | 265,800 | |
2,275,000 | Navient Corp., Sr. Unsecd. Note, 5.500%, 3/15/2029 | 2,153,913 | |
550,000 | Navient Corp., Sr. Unsecd. Note, 6.750%, 6/15/2026 | 571,315 | |
825,000 | Quicken Loans LLC / Quicken Loans Co-Issuer, Inc., Sr. Unsecd. Note, 144A, 3.625%, 3/1/2029 | 774,007 | |
2,250,000 | Quicken Loans LLC / Quicken Loans Co-Issuer, Inc., Sr. Unsecd. Note, 144A, 3.875%, 3/1/2031 | 2,110,072 | |
550,000 | Rocket Mortgage Co-Issuer, Inc., Sr. Unsecd. Note, 144A, 2.875%, 10/15/2026 | 517,638 | |
425,000 | Rocket Mortgage Co-Issuer, Inc., Sr. Unsecd. Note, 144A, 4.000%, 10/15/2033 | 396,274 | |
2,050,000 | United Shore Financial Services, Sr. Unsecd. Note, 144A, 5.500%, 11/15/2025 | 1,975,882 | |
1,700,000 | United Wholesale Mortgage, LLC, Sr. Unsecd. Note, 144A, 5.500%, 4/15/2029 | 1,558,433 | |
875,000 | United Wholesale Mortgage, LLC, Sr. Unsecd. Note, 144A, 5.750%, 6/15/2027 | 837,611 | |
TOTAL | 12,300,362 | ||
Food & Beverage— 2.4% | |||
1,050,000 | Aramark Services, Inc., Sr. Unsecd. Note, 144A, 5.000%, 2/1/2028 | 1,053,035 | |
1,300,000 | Aramark Services, Inc., Sr. Unsecd. Note, 144A, 6.375%, 5/1/2025 | 1,347,898 | |
1,475,000 | Kraft Heinz Foods Co., Sr. Unsecd. Note, 4.375%, 6/1/2046 | 1,513,719 | |
3,075,000 | Kraft Heinz Foods Co., Sr. Unsecd. Note, 5.200%, 7/15/2045 | 3,484,990 | |
1,100,000 | Performance Food Group, Inc., Sr. Unsecd. Note, 144A, 4.250%, 8/1/2029 | 1,050,830 | |
925,000 | Post Holdings, Inc., Sr. Unsecd. Note, 144A, 4.500%, 9/15/2031 | 857,808 | |
775,000 | Post Holdings, Inc., Sr. Unsecd. Note, 144A, 4.625%, 4/15/2030 | 730,519 | |
250,000 | Post Holdings, Inc., Sr. Unsecd. Note, 144A, 5.500%, 12/15/2029 | 252,425 | |
2,050,000 | Post Holdings, Inc., Sr. Unsecd. Note, 144A, 5.625%, 1/15/2028 | 2,059,891 | |
2,625,000 | Post Holdings, Inc., Sr. Unsecd. Note, 144A, 5.750%, 3/1/2027 | 2,655,187 | |
575,000 | US Foods, Inc., Sr. Unsecd. Note, 144A, 4.625%, 6/1/2030 | 559,837 | |
1,625,000 | US Foods, Inc., Sr. Unsecd. Note, 144A, 4.750%, 2/15/2029 | 1,609,506 | |
TOTAL | 17,175,645 | ||
Gaming— 3.1% | |||
1,925,000 | Affinity Gaming LLC, 144A, 6.875%, 12/15/2027 | 1,898,579 | |
750,000 | Boyd Gaming Corp., Sr. Unsecd. Note, 4.750%, 12/1/2027 | 753,975 |
Principal Amount or Shares | Value | ||
CORPORATE BONDS— continued | |||
Gaming— continued | |||
$ 425,000 | Boyd Gaming Corp., Sr. Unsecd. Note, 144A, 4.750%, 6/15/2031 | $ 418,217 | |
600,000 | Caesars Entertainment Corp., Sr. Unsecd. Note, 144A, 4.625%, 10/15/2029 | 570,093 | |
200,000 | CCM Merger, Inc., Sr. Unsecd. Note, 144A, 6.375%, 5/1/2026 | 204,783 | |
550,000 | Colt Merger Sub, Inc., Sr. Secd. Note, 144A, 5.750%, 7/1/2025 | 564,603 | |
1,150,000 | Colt Merger Sub, Inc., Sr. Secd. Note, 144A, 6.250%, 7/1/2025 | 1,193,683 | |
1,550,000 | Colt Merger Sub, Inc., Sr. Unsecd. Note, 144A, 8.125%, 7/1/2027 | 1,672,527 | |
950,000 | MGM Growth Properties LLC, Sr. Unsecd. Note, 5.625%, 5/1/2024 | 987,357 | |
175,000 | MGM Growth Properties LLC, Sr. Unsecd. Note, 144A, 3.875%, 2/15/2029 | 176,190 | |
458,000 | MGM Resorts International, Sr. Unsecd. Note, 5.500%, 4/15/2027 | 473,533 | |
725,000 | Midwest Gaming Borrower LLC, 144A, 4.875%, 5/1/2029 | 707,781 | |
3,700,000 | Mohegan Tribal Gaming Authority, 144A, 8.000%, 2/1/2026 | 3,741,440 | |
450,000 | Penn National Gaming, Inc., Sr. Unsecd. Note, 144A, 4.125%, 7/1/2029 | 416,736 | |
200,000 | Penn National Gaming, Inc., Sr. Unsecd. Note, 144A, 5.625%, 1/15/2027 | 202,996 | |
150,000 | Raptor Acquisition Corp. / Raptor Co-Issuer LLC, Sec. Fac. Bond, 144A, 4.875%, 11/1/2026 | 145,080 | |
1,000,000 | Scientific Games Holdings Corp., Sr. Unsecd. Note, 144A, 6.625%, 3/1/2030 | 994,750 | |
1,250,000 | Scientific Games International, Inc., 144A, 8.625%, 7/1/2025 | 1,326,250 | |
550,000 | Scientific Games International, Inc., Sr. Unsecd. Note, 144A, 7.250%, 11/15/2029 | 584,925 | |
1,525,000 | Scientific Games International, Inc., Sr. Unsecd. Note, 144A, 8.250%, 3/15/2026 | 1,594,433 | |
650,000 | Station Casinos, Inc., Sr. Unsecd. Note, 144A, 4.500%, 2/15/2028 | 625,625 | |
950,000 | Station Casinos, Inc., Sr. Unsecd. Note, 144A, 4.625%, 12/1/2031 | 896,496 | |
100,000 | VICI Properties LP/ VICI Note Co., Inc., Sr. Unsecd. Note, 144A, 3.500%, 2/15/2025 | 100,358 | |
825,000 | VICI Properties LP/ VICI Note Co., Inc., Sr. Unsecd. Note, 144A, 4.250%, 12/1/2026 | 834,178 | |
650,000 | VICI Properties LP/ VICI Note Co., Inc., Sr. Unsecd. Note, 144A, 4.625%, 12/1/2029 | 664,063 | |
TOTAL | 21,748,651 | ||
Health Care— 6.9% | |||
125,000 | Acadia Healthcare Co., Inc., Sr. Unsecd. Note, 144A, 5.000%, 4/15/2029 | 123,596 | |
125,000 | Acadia Healthcare Co., Inc., Sr. Unsecd. Note, 144A, 5.500%, 7/1/2028 | 125,438 | |
1,300,000 | AdaptHealth LLC, Sr. Unsecd. Note, 144A, 4.625%, 8/1/2029 | 1,174,290 | |
1,150,000 | AdaptHealth LLC, Sr. Unsecd. Note, 144A, 5.125%, 3/1/2030 | 1,062,347 | |
800,000 | Ardent Health Services, Sr. Unsecd. Note, 144A, 5.750%, 7/15/2029 | 757,276 | |
2,075,000 | Avantor Funding, Inc., Sec. Fac. Bond, 144A, 4.625%, 7/15/2028 | 2,108,615 | |
1,825,000 | Avantor Funding, Inc., Sr. Unsecd. Note, 144A, 3.875%, 11/1/2029 | 1,759,017 | |
400,000 | Charles River Laboratories International, Inc., Sr. Unsecd. Note, 144A, 3.750%, 3/15/2029 | 385,076 |
Principal Amount or Shares | Value | ||
CORPORATE BONDS— continued | |||
Health Care— continued | |||
$ 425,000 | Charles River Laboratories International, Inc., Sr. Unsecd. Note, 144A, 4.000%, 3/15/2031 | $ 407,522 | |
1,100,000 | CHS/Community Health Systems, Inc., 144A, 6.125%, 4/1/2030 | 1,024,364 | |
300,000 | CHS/Community Health Systems, Inc., 1st Lien, 144A, 8.000%, 12/15/2027 | 316,791 | |
2,150,000 | CHS/Community Health Systems, Inc., 2nd Lien, 144A, 6.875%, 4/15/2029 | 2,087,284 | |
675,000 | CHS/Community Health Systems, Inc., Sec. Fac. Bond, 144A, 5.625%, 3/15/2027 | 681,254 | |
225,000 | CHS/Community Health Systems, Inc., Sec. Fac. Bond, 144A, 6.000%, 1/15/2029 | 225,663 | |
850,000 | CHS/Community Health Systems, Inc., Sec. Fac. Bond, 144A, 8.000%, 3/15/2026 | 883,082 | |
850,000 | CHS/Community Health Systems, Inc., Sr. Note, 144A, 5.250%, 5/15/2030 | 824,653 | |
1,050,000 | Davita, Inc., Sr. Unsecd. Note, 144A, 4.625%, 6/1/2030 | 1,008,415 | |
425,000 | Embecta Corp., Sec. Fac. Bond, 144A, 5.000%, 2/15/2030 | 419,866 | |
2,875,000 | Global Medical Response, Inc., Sec. Fac. Bond, 144A, 6.500%, 10/1/2025 | 2,823,926 | |
725,000 | HCA, Inc., Sr. Unsecd. Note, 3.500%, 9/1/2030 | 718,838 | |
1,075,000 | HCA, Inc., Sr. Unsecd. Note, 5.375%, 2/1/2025 | 1,139,640 | |
900,000 | HCA, Inc., Sr. Unsecd. Note, 5.625%, 9/1/2028 | 998,671 | |
2,100,000 | HCA, Inc., Sr. Unsecd. Note, 5.875%, 2/15/2026 | 2,272,044 | |
925,000 | IMS Health, Inc., Sr. Unsecd. Note, 144A, 5.000%, 10/15/2026 | 945,202 | |
575,000 | Iqvia, Inc., Sr. Unsecd. Note, 144A, 5.000%, 5/15/2027 | 588,829 | |
450,000 | LifePoint Health, Inc., 144A, 6.750%, 4/15/2025 | 466,412 | |
600,000 | LifePoint Health, Inc., Sec. Fac. Bond, 144A, 4.375%, 2/15/2027 | 569,283 | |
800,000 | LifePoint Health, Inc., Sr. Unsecd. Note, 144A, 5.375%, 1/15/2029 | 752,996 | |
2,475,000 | LifePoint Health, Inc., Sr. Unsecd. Note, 144A, 9.750%, 12/1/2026 | 2,598,502 | |
925,000 | MEDNAX, Inc., Sr. Unsecd. Note, 144A, 5.375%, 2/15/2030 | 921,961 | |
1,325,000 | Mozart Debt Merger Sub, Inc., Sec. Fac. Bond, 144A, 3.875%, 4/1/2029 | 1,259,147 | |
3,900,000 | Mozart Debt Merger Sub, Inc., Sr. Unsecd. Note, 144A, 5.250%, 10/1/2029 | 3,729,960 | |
775,000 | MPH Acquisition Holdings LLC, Sr. Note, 144A, 5.500%, 9/1/2028 | 753,118 | |
3,900,000 | MPH Acquisition Holdings LLC, Sr. Unsecd. Note, 144A, 5.750%, 11/1/2028 | 3,524,079 | |
1,500,000 | Team Health Holdings, Inc., Sr. Unsecd. Note, 144A, 6.375%, 2/1/2025 | 1,363,035 | |
1,150,000 | Tenet Healthcare Corp., 144A, 4.250%, 6/1/2029 | 1,111,538 | |
75,000 | Tenet Healthcare Corp., 144A, 4.625%, 6/15/2028 | 73,601 | |
525,000 | Tenet Healthcare Corp., 144A, 4.875%, 1/1/2026 | 529,274 | |
1,050,000 | Tenet Healthcare Corp., 144A, 5.125%, 11/1/2027 | 1,071,472 | |
875,000 | Tenet Healthcare Corp., 144A, 6.250%, 2/1/2027 | 900,847 | |
401,000 | Tenet Healthcare Corp., Sr. Secd. Note, 4.625%, 7/15/2024 | 402,684 | |
1,550,000 | Tenet Healthcare Corp., Sr. Unsecd. Note, 6.750%, 6/15/2023 | 1,613,658 | |
1,825,000 | Tenet Healthcare Corp., Sr. Unsecd. Note, 144A, 6.125%, 10/1/2028 | 1,850,632 |
Principal Amount or Shares | Value | ||
CORPORATE BONDS— continued | |||
Health Care— continued | |||
$ 400,000 | Vizient, Inc., Sr. Unsecd. Note, 144A, 6.250%, 5/15/2027 | $ 414,982 | |
TOTAL | 48,768,880 | ||
Health Insurance— 0.8% | |||
575,000 | Centene Corp., Sr. Unsecd. Note, 2.450%, 7/15/2028 | 542,524 | |
1,500,000 | Centene Corp., Sr. Unsecd. Note, 2.625%, 8/1/2031 | 1,385,295 | |
1,225,000 | Centene Corp., Sr. Unsecd. Note, Series WI, 3.375%, 2/15/2030 | 1,177,207 | |
1,000,000 | Centene Corp., Sr. Unsecd. Note, Series WI, 4.250%, 12/15/2027 | 1,024,875 | |
1,725,000 | Centene Corp., Sr. Unsecd. Note, Series WI, 4.625%, 12/15/2029 | 1,779,605 | |
TOTAL | 5,909,506 | ||
Independent Energy— 4.8% | |||
975,000 | Antero Resources Corp., Sr. Unsecd. Note, 144A, 5.375%, 3/1/2030 | 995,026 | |
209,000 | Antero Resources Corp., Sr. Unsecd. Note, 144A, 7.625%, 2/1/2029 | 226,507 | |
276,000 | Antero Resources Corp., Sr. Unsecd. Note, 144A, 8.375%, 7/15/2026 | 303,234 | |
550,000 | Apache Corp., Sr. Unsecd. Note, 4.875%, 11/15/2027 | 566,022 | |
425,000 | Ascent Resources Utica Holdings LLC/ ARU Finance Corp., Sr. Unsecd. Note, 144A, 5.875%, 6/30/2029 | 404,813 | |
1,825,000 | Ascent Resources Utica Holdings LLC/ ARU Finance Corp., Sr. Unsecd. Note, 144A, 7.000%, 11/1/2026 | 1,805,290 | |
500,000 | Ascent Resources Utica Holdings LLC/ ARU Finance Corp., Sr. Unsecd. Note, 144A, 8.250%, 12/31/2028 | 513,860 | |
106,000 | Ascent Resources Utica Holdings LLC/ ARU Finance Corp., Sr. Unsecd. Note, 144A, 9.000%, 11/1/2027 | 137,656 | |
725,000 | Berry Petroleum Co., Sr. Unsecd. Note, 144A, 7.000%, 2/15/2026 | 714,944 | |
550,000 | Callon Petroleum Corp., Sr. Unsecd. Note, Series WI, 6.375%, 7/1/2026 | 534,056 | |
175,000 | Carrizo Oil & Gas, Inc., Sr. Unsecd. Note, 8.250%, 7/15/2025 | 172,820 | |
25,000 | Centennial Resource Production, LLC, Sr. Unsecd. Note, 144A, 5.375%, 1/15/2026 | 24,150 | |
1,425,000 | Centennial Resource Production, LLC, Sr. Unsecd. Note, 144A, 6.875%, 4/1/2027 | 1,421,480 | |
1,275,000 | Chesapeake Energy Corp., Sr. Unsecd. Note, 7.000%, 10/1/2024 | 22,313 | |
175,000 | Chesapeake Energy Corp., Sr. Unsecd. Note, 144A, 5.875%, 2/1/2029 | 181,358 | |
475,000 | Comstock Resources, Inc., Sr. Unsecd. Note, 144A, 5.875%, 1/15/2030 | 460,133 | |
2,000,000 | Comstock Resources, Inc., Sr. Unsecd. Note, 144A, 6.750%, 3/1/2029 | 2,037,550 | |
825,000 | Continental Resources, Inc., Sr. Unsecd. Note, 144A, 5.750%, 1/15/2031 | 921,381 | |
250,000 | Crownrock LP/ Crownrock F, Sr. Unsecd. Note, 144A, 5.000%, 5/1/2029 | 254,741 | |
2,225,000 | Crownrock LP/ Crownrock F, Sr. Unsecd. Note, 144A, 5.625%, 10/15/2025 | 2,252,957 | |
775,000 | Endeavor Energy Resources LP, Sr. Unsecd. Note, 144A, 5.750%, 1/30/2028 | 803,652 | |
400,000 | Endeavor Energy Resources LP, Sr. Unsecd. Note, 144A, 6.625%, 7/15/2025 | 418,518 | |
275,000 | EQT Corp., Sr. Unsecd. Note, 5.000%, 1/15/2029 | 290,580 | |
725,000 | EQT Corp., Sr. Unsecd. Note, 144A, 3.125%, 5/15/2026 | 713,907 | |
550,000 | EQT Corp., Sr. Unsecd. Note, 144A, 3.625%, 5/15/2031 | 535,711 |
Principal Amount or Shares | Value | ||
CORPORATE BONDS— continued | |||
Independent Energy— continued | |||
$ 225,000 | Oasis Petroleum, Inc., Sr. Unsecd. Note, 144A, 6.375%, 6/1/2026 | $ 229,188 | |
500,000 | Occidental Petroleum Corp., Sr. Unsecd. Note, 4.100%, 2/15/2047 | 463,303 | |
1,350,000 | Occidental Petroleum Corp., Sr. Unsecd. Note, 4.300%, 8/15/2039 | 1,277,977 | |
800,000 | Occidental Petroleum Corp., Sr. Unsecd. Note, 4.400%, 8/15/2049 | 761,152 | |
975,000 | Occidental Petroleum Corp., Sr. Unsecd. Note, 5.875%, 9/1/2025 | 1,046,994 | |
450,000 | Occidental Petroleum Corp., Sr. Unsecd. Note, 6.125%, 1/1/2031 | 512,384 | |
1,100,000 | Occidental Petroleum Corp., Sr. Unsecd. Note, 6.450%, 9/15/2036 | 1,296,971 | |
1,100,000 | Occidental Petroleum Corp., Sr. Unsecd. Note, 6.625%, 9/1/2030 | 1,281,753 | |
625,000 | Occidental Petroleum Corp., Sr. Unsecd. Note, 8.000%, 7/15/2025 | 707,906 | |
1,375,000 | Occidental Petroleum Corp., Sr. Unsecd. Note, 8.875%, 7/15/2030 | 1,780,082 | |
200,000 | PDC Energy, Inc., Sr. Unsecd. Note, 6.125%, 9/15/2024 | 201,763 | |
1,100,000 | PDC Energy, Inc., Sr. Unsecd. Note, Series WI, 5.750%, 5/15/2026 | 1,117,919 | |
492,000 | Range Resources Corp., Sr. Unsecd. Note, 4.875%, 5/15/2025 | 500,042 | |
113,000 | Range Resources Corp., Sr. Unsecd. Note, 5.000%, 3/15/2023 | 114,401 | |
650,000 | Range Resources Corp., Sr. Unsecd. Note, 8.250%, 1/15/2029 | 713,102 | |
350,000 | Range Resources Corp., Sr. Unsecd. Note, 144A, 4.750%, 2/15/2030 | 343,070 | |
775,000 | Rockcliff Energy II LLC, Sr. Unsecd. Note, 144A, 5.500%, 10/15/2029 | 769,354 | |
275,000 | SM Energy Co., Sr. Unsecd. Note, 6.500%, 7/15/2028 | 282,209 | |
150,000 | SM Energy Co., Sr. Unsecd. Note, 6.625%, 1/15/2027 | 152,444 | |
1,000,000 | SM Energy Co., Sr. Unsecd. Note, 6.750%, 9/15/2026 | 1,011,270 | |
600,000 | Southwestern Energy Co., Sr. Unsecd. Note, 4.750%, 2/1/2032 | 597,576 | |
300,000 | Southwestern Energy Co., Sr. Unsecd. Note, 5.375%, 3/15/2030 | 310,284 | |
825,000 | Southwestern Energy Co., Sr. Unsecd. Note, 8.375%, 9/15/2028 | 902,962 | |
1,075,000 | Tap Rock Resources LLC, Sr. Unsecd. Note, 144A, 7.000%, 10/1/2026 | 1,082,821 | |
TOTAL | 34,169,586 | ||
Industrial - Other— 1.0% | |||
275,000 | Booz Allen Hamilton, Inc., Sr. Unsecd. Note, 144A, 3.875%, 9/1/2028 | 269,649 | |
225,000 | Booz Allen Hamilton, Inc., Sr. Unsecd. Note, 144A, 4.000%, 7/1/2029 | 222,381 | |
200,000 | Madison Iaq LLC, Sec. Fac. Bond, 144A, 4.125%, 6/30/2028 | 189,460 | |
3,575,000 | Madison Iaq LLC, Sr. Unsecd. Note, 144A, 5.875%, 6/30/2029 | 3,248,871 | |
1,099,000 | Vertical Holdco GmbH, Sr. Unsecd. Note, 144A, 7.625%, 7/15/2028 | 1,119,331 | |
1,750,000 | Vertical U.S. Newco, Inc., Sr. Unsecd. Note, 144A, 5.250%, 7/15/2027 | 1,734,626 | |
TOTAL | 6,784,318 | ||
Insurance - P&C— 4.9% | |||
1,825,000 | Alliant Holdings Intermediate LLC / Alliant Holdings Co-Issuer, Sr. Unsecd. Note, 144A, 6.750%, 10/15/2027 | 1,786,000 | |
2,075,000 | AmWINS Group, Inc., Sr. Unsecd. Note, 144A, 4.875%, 6/30/2029 | 1,979,042 | |
1,774,572 | Ardonagh Midco 2 PLC, Sr. Unsecd. Note, 144A, 11.500% / 12.750% PIK, 1/15/2027 | 1,916,538 | |
1,825,000 | AssuredPartners, Inc., Sr. Unsecd. Note, 144A, 5.625%, 1/15/2029 | 1,680,706 |
Principal Amount or Shares | Value | ||
CORPORATE BONDS— continued | |||
Insurance - P&C— continued | |||
$2,725,000 | AssuredPartners, Inc., Sr. Unsecd. Note, 144A, 7.000%, 8/15/2025 | $ 2,700,475 | |
3,875,000 | Broadstreet Partners, Inc., Sr. Unsecd. Note, 144A, 5.875%, 4/15/2029 | 3,608,923 | |
825,000 | GTCR AP Finance, Inc., Sr. Unsecd. Note, 144A, 8.000%, 5/15/2027 | 825,825 | |
2,650,000 | Hub International Ltd., Sr. Unsecd. Note, 144A, 5.625%, 12/1/2029 | 2,520,812 | |
7,725,000 | Hub International Ltd., Sr. Unsecd. Note, 144A, 7.000%, 5/1/2026 | 7,784,482 | |
500,000 | NFP Corp., Sec. Fac. Bond, 144A, 4.875%, 8/15/2028 | 482,990 | |
5,525,000 | NFP Corp., Sr. Unsecd. Note, 144A, 6.875%, 8/15/2028 | 5,145,571 | |
350,000 | Ryan Specialty Group, Sec. Fac. Bond, 144A, 4.375%, 2/1/2030 | 337,155 | |
4,075,000 | USIS Merger Subsidiary, Inc., Sr. Unsecd. Note, 144A, 6.875%, 5/1/2025 | 4,096,679 | |
TOTAL | 34,865,198 | ||
Leisure— 0.5% | |||
1,800,000 | SeaWorld Parks & Entertainment, Inc., Sr. Unsecd. Note, 144A, 5.250%, 8/15/2029 | 1,753,290 | |
1,800,000 | Six Flags Entertainment Corp., Sr. Unsecd. Note, 144A, 5.500%, 4/15/2027 | 1,817,442 | |
TOTAL | 3,570,732 | ||
Lodging— 0.2% | |||
950,000 | Hilton Domestic Operating Company, Inc., Sr. Unsecd. Note, 144A, 3.625%, 2/15/2032 | 904,286 | |
200,000 | Hilton Domestic Operating Company, Inc., Sr. Unsecd. Note, 144A, 5.750%, 5/1/2028 | 209,241 | |
525,000 | Hilton Domestic Operating Company, Inc., Sr. Unsecd. Note, Series WI, 4.875%, 1/15/2030 | 541,015 | |
TOTAL | 1,654,542 | ||
Media Entertainment— 6.7% | |||
850,000 | AMC Networks, Inc., Sec. Fac. Bond, 4.250%, 2/15/2029 | 797,143 | |
1,030,000 | AMC Networks, Inc., Sr. Unsecd. Note, 5.000%, 4/1/2024 | 1,030,124 | |
1,425,000 | Audacy Capital Corp., 144A, 6.500%, 5/1/2027 | 1,355,517 | |
1,350,000 | Audacy Capital Corp., 144A, 6.750%, 3/31/2029 | 1,281,555 | |
959,000 | Cumulus Media News Holdings, Inc., 144A, 6.750%, 7/1/2026 | 976,751 | |
475,000 | Diamond Sports Group LLC / Diamond Sports Finance Co., Sec. Fac. Bond, 144A, 5.375%, 8/15/2026 | 195,567 | |
1,575,000 | Diamond Sports Group LLC / Diamond Sports Finance Co., Sec. Fac. Bond, 144A, 6.625%, 8/15/2027 | 381,938 | |
1,375,000 | Gray Escrow II, Inc., Sr. Unsecd. Note, 144A, 5.375%, 11/15/2031 | 1,325,569 | |
1,050,000 | Gray Television, Inc., Sr. Unsecd. Note, 144A, 4.750%, 10/15/2030 | 986,003 | |
2,100,000 | Gray Television, Inc., Sr. Unsecd. Note, 144A, 5.875%, 7/15/2026 | 2,149,948 | |
146,192 | iHeartCommunications, Inc., 6.375%, 5/1/2026 | 150,936 | |
375,000 | iHeartCommunications, Inc., 144A, 4.750%, 1/15/2028 | 363,242 | |
325,000 | iHeartCommunications, Inc., 144A, 5.250%, 8/15/2027 | 324,123 | |
3,914,973 | iHeartCommunications, Inc., Sr. Unsecd. Note, 8.375%, 5/1/2027 | 4,082,221 | |
675,000 | Lamar Media Corp., Sr. Unsecd. Note, 4.875%, 1/15/2029 | 677,541 |
Principal Amount or Shares | Value | ||
CORPORATE BONDS— continued | |||
Media Entertainment— continued | |||
$ 350,000 | Lamar Media Corp., Sr. Unsecd. Note, Series WI, 3.625%, 1/15/2031 | $ 329,096 | |
700,000 | Match Group Holdings II LLC, Sr. Unsecd. Note, 144A, 3.625%, 10/1/2031 | 653,814 | |
1,625,000 | Match Group, Inc., Sr. Unsecd. Note, 144A, 4.125%, 8/1/2030 | 1,575,624 | |
550,000 | Match Group, Inc., Sr. Unsecd. Note, 144A, 4.625%, 6/1/2028 | 552,602 | |
350,000 | Match Group, Inc., Sr. Unsecd. Note, 144A, 5.000%, 12/15/2027 | 350,431 | |
2,950,000 | Midas Opco Holdings, LLC, Sr. Unsecd. Note, 144A, 5.625%, 8/15/2029 | 2,894,717 | |
175,000 | News Corp., Sr. Unsecd. Note, 144A, 5.125%, 2/15/2032 | 179,219 | |
1,175,000 | Nexstar Broadcasting, Inc., Sr. Unsecd. Note, 144A, 4.750%, 11/1/2028 | 1,141,183 | |
2,025,000 | Nexstar Escrow Corp., Sr. Unsecd. Note, 144A, 5.625%, 7/15/2027 | 2,072,780 | |
325,000 | Nielsen Finance LLC/Nielsen Finance Co., Sr. Unsecd. Note, 144A, 4.500%, 7/15/2029 | 292,598 | |
325,000 | Nielsen Finance LLC/Nielsen Finance Co., Sr. Unsecd. Note, 144A, 4.750%, 7/15/2031 | 289,807 | |
900,000 | Nielsen Finance LLC/Nielsen Finance Co., Sr. Unsecd. Note, 144A, 5.000%, 2/1/2025 | 904,887 | |
600,000 | Nielsen Finance LLC/Nielsen Finance Co., Sr. Unsecd. Note, 144A, 5.625%, 10/1/2028 | 580,866 | |
1,225,000 | Nielsen Finance LLC/Nielsen Finance Co., Sr. Unsecd. Note, 144A, 5.875%, 10/1/2030 | 1,188,617 | |
375,000 | Outfront Media Capital LLC / Outfront Media Capital Corp., Sr. Unsecd. Note, 144A, 4.250%, 1/15/2029 | 358,138 | |
1,075,000 | ROBLOX Corp., Sr. Unsecd. Note, 144A, 3.875%, 5/1/2030 | 1,023,723 | |
350,000 | Scripps Escrow II, Inc., Sr. Unsecd. Note, 144A, 3.875%, 1/15/2029 | 328,584 | |
1,550,000 | Scripps Escrow II, Inc., Sr. Unsecd. Note, 144A, 5.375%, 1/15/2031 | 1,475,615 | |
1,375,000 | Scripps Escrow, Inc., Sr. Unsecd. Note, 144A, 5.875%, 7/15/2027 | 1,373,900 | |
1,750,000 | Sinclair Television Group, Sr. Unsecd. Note, 144A, 5.125%, 2/15/2027 | 1,594,495 | |
1,425,000 | Sinclair Television Group, Sr. Unsecd. Note, 144A, 5.500%, 3/1/2030 | 1,252,112 | |
1,575,000 | Sinclair Television Group, Sr. Unsecd. Note, 144A, 5.875%, 3/15/2026 | 1,564,762 | |
1,050,000 | Tegna, Inc., Sr. Unsecd. Note, 144A, 4.625%, 3/15/2028 | 1,050,614 | |
1,450,000 | Tegna, Inc., Sr. Unsecd. Note, 144A, 5.000%, 9/15/2029 | 1,448,448 | |
3,950,000 | Terrier Media Buyer, Inc., Sr. Unsecd. Note, 144A, 8.875%, 12/15/2027 | 4,053,213 | |
1,000,000 | Univision Communications, Inc., Sec. Fac. Bond, 144A, 4.500%, 5/1/2029 | 958,490 | |
1,000,000 | Urban One, Inc., Sec. Fac. Bond, 144A, 7.375%, 2/1/2028 | 996,215 | |
800,000 | WMG Acquisition Corp., Sec. Fac. Bond, 144A, 3.750%, 12/1/2029 | 765,392 | |
TOTAL | 47,328,120 | ||
Metals & Mining— 0.8% | |||
1,400,000 | Cleveland-Cliffs, Inc., Sr. Unsecd. Note, 144A, 4.625%, 3/1/2029 | 1,353,303 | |
1,875,000 | Cleveland-Cliffs, Inc., Sr. Unsecd. Note, 144A, 4.875%, 3/1/2031 | 1,833,582 | |
1,375,000 | Coeur Mining, Inc., Sr. Unsecd. Note, 144A, 5.125%, 2/15/2029 | 1,214,723 | |
550,000 | Freeport-McMoRan, Inc., Sr. Unsecd. Note, 4.625%, 8/1/2030 | 568,631 |
Principal Amount or Shares | Value | ||
CORPORATE BONDS— continued | |||
Metals & Mining— continued | |||
$ 925,000 | Freeport-McMoRan, Inc., Sr. Unsecd. Note, 5.250%, 9/1/2029 | $ 966,597 | |
TOTAL | 5,936,836 | ||
Midstream— 6.0% | |||
1,275,000 | AmeriGas Partners LP, Sr. Unsecd. Note, 5.750%, 5/20/2027 | 1,290,211 | |
1,350,000 | AmeriGas Partners LP, Sr. Unsecd. Note, 5.875%, 8/20/2026 | 1,379,606 | |
2,250,000 | Antero Midstream Partners LP, Sr. Unsecd. Note, 144A, 5.375%, 6/15/2029 | 2,264,141 | |
1,950,000 | Antero Midstream Partners LP, Sr. Unsecd. Note, 144A, 5.750%, 3/1/2027 | 1,988,844 | |
2,100,000 | Antero Midstream Partners LP, Sr. Unsecd. Note, 144A, 5.750%, 1/15/2028 | 2,134,209 | |
575,000 | Antero Midstream Partners LP, Sr. Unsecd. Note, 144A, 7.875%, 5/15/2026 | 618,858 | |
1,675,000 | Cheniere Energy Partners, LP, Sr. Unsecd. Note, 4.000%, 3/1/2031 | 1,652,413 | |
475,000 | Cheniere Energy Partners, LP, Sr. Unsecd. Note, 144A, 3.250%, 1/31/2032 | 447,317 | |
550,000 | Cheniere Energy Partners, LP, Sr. Unsecd. Note, Series WI, 4.500%, 10/1/2029 | 561,457 | |
750,000 | Cheniere Energy, Inc., Sec. Fac. Bond, Series WI, 4.625%, 10/15/2028 | 767,100 | |
1,000,000 | CNX Midstream Partners LP, Sr. Unsecd. Note, 144A, 4.750%, 4/15/2030 | 968,040 | |
725,000 | DT Midstream, Inc., Sr. Unsecd. Note, 144A, 4.375%, 6/15/2031 | 709,409 | |
875,000 | EQM Midstream Partners, LP, Sr. Unsecd. Note, 144A, 4.500%, 1/15/2029 | 818,536 | |
1,025,000 | EQM Midstream Partners, LP, Sr. Unsecd. Note, 144A, 4.750%, 1/15/2031 | 962,352 | |
1,850,000 | EQM Midstream Partners, LP, Sr. Unsecd. Note, 144A, 6.500%, 7/1/2027 | 1,937,782 | |
1,200,000 | EQT Midstream Partners LP, Sr. Unsecd. Note, 5.500%, 7/15/2028 | 1,180,020 | |
1,475,000 | EQT Midstream Partners LP, Sr. Unsecd. Note, 6.500%, 7/15/2048 | 1,440,492 | |
675,000 | EQT Midstream Partners LP, Sr. Unsecd. Note, 144A, 6.000%, 7/1/2025 | 689,388 | |
500,000 | Hess Midstream Operations LP, Sr. Unsecd. Note, 144A, 4.250%, 2/15/2030 | 483,475 | |
1,100,000 | Hess Midstream Partners LP, Sr. Unsecd. Note, 144A, 5.125%, 6/15/2028 | 1,124,860 | |
800,000 | Holly Energy Partners LP, Sr. Unsecd. Note, 144A, 5.000%, 2/1/2028 | 765,284 | |
950,000 | NuStar Logistics LP, Sr. Unsecd. Note, 5.625%, 4/28/2027 | 952,413 | |
900,000 | Oasis Midstream Partners, Sr. Unsecd. Note, 144A, 8.000%, 4/1/2029 | 958,770 | |
650,000 | Rattler Midstream Partners LP, Sr. Unsecd. Note, 144A, 5.625%, 7/15/2025 | 662,194 | |
325,000 | Solaris Midstream Holdings LLC, Sr. Unsecd. Note, 144A, 7.625%, 4/1/2026 | 333,504 | |
900,000 | Suburban Propane Partners LP, Sr. Unsecd. Note, 5.875%, 3/1/2027 | 920,187 | |
650,000 | Suburban Propane Partners LP, Sr. Unsecd. Note, 144A, 5.000%, 6/1/2031 | 618,270 | |
1,175,000 | Summit Midstream Holdings LLC, Sr. Unsecd. Note, 5.750%, 4/15/2025 | 1,000,659 | |
500,000 | Targa Resources Partners LP / Targa Resources Partners Finance Corp., Sr. Unsecd. Note, 4.875%, 2/1/2031 | 514,815 | |
1,200,000 | Targa Resources Partners LP / Targa Resources Partners Finance Corp., Sr. Unsecd. Note, 5.000%, 1/15/2028 | 1,238,694 | |
1,500,000 | Targa Resources Partners LP / Targa Resources Partners Finance Corp., Sr. Unsecd. Note, 5.375%, 2/1/2027 | 1,544,947 | |
1,875,000 | Targa Resources Partners LP / Targa Resources Partners Finance Corp., Sr. Unsecd. Note, 5.875%, 4/15/2026 | 1,938,047 |
Principal Amount or Shares | Value | ||
CORPORATE BONDS— continued | |||
Midstream— continued | |||
$ 250,000 | Targa Resources Partners LP / Targa Resources Partners Finance Corp., Sr. Unsecd. Note, 6.500%, 7/15/2027 | $ 265,333 | |
1,900,000 | Targa Resources Partners LP / Targa Resources Partners Finance Corp., Sr. Unsecd. Note, 144A, 5.500%, 3/1/2030 | 2,014,000 | |
775,000 | TransMontaigne Partners LP/TLP Finance Corp., Sr. Unsecd. Note, 6.125%, 2/15/2026 | 755,811 | |
475,000 | Western Gas Partners LP, Sr. Unsecd. Note, 4.000%, 7/1/2022 | 475,534 | |
825,000 | Western Gas Partners LP, Sr. Unsecd. Note, 4.500%, 3/1/2028 | 858,231 | |
175,000 | Western Gas Partners LP, Sr. Unsecd. Note, 4.650%, 7/1/2026 | 181,538 | |
2,425,000 | Western Gas Partners LP, Sr. Unsecd. Note, 5.300%, 3/1/2048 | 2,501,630 | |
550,000 | Western Gas Partners LP, Sr. Unsecd. Note, 5.450%, 4/1/2044 | 564,633 | |
225,000 | Western Gas Partners LP, Sr. Unsecd. Note, 5.500%, 8/15/2048 | 231,075 | |
TOTAL | 42,714,079 | ||
Oil Field Services— 1.8% | |||
1,450,000 | Archrock Partners LP / Archrock Partners Finance Corp., Sr. Unsecd. Note, 144A, 6.250%, 4/1/2028 | 1,451,682 | |
2,875,000 | Archrock Partners LP / Archrock Partners Finance Corp., Sr. Unsecd. Note, 144A, 6.875%, 4/1/2027 | 2,954,408 | |
1,025,000 | Nabors Industries Ltd., Sr. Unsecd. Note, 144A, 7.250%, 1/15/2026 | 1,001,051 | |
1,000,000 | Nabors Industries Ltd., Sr. Unsecd. Note, 144A, 7.500%, 1/15/2028 | 956,610 | |
175,000 | Nabors Industries, Inc., Sr. Unsecd. Note, 144A, 7.375%, 5/15/2027 | 180,907 | |
725,000 | Precision Drilling Corp., Sr. Unsecd. Note, 144A, 6.875%, 1/15/2029 | 728,665 | |
600,000 | Precision Drilling Corp., Sr. Unsecd. Note, 144A, 7.125%, 1/15/2026 | 607,917 | |
800,000 | Shelf Drilling Holdings Ltd., Sr. Unsecd. Note, 144A, 8.250%, 2/15/2025 | 617,368 | |
2,325,000 | USA Compression Partners LP, Sr. Unsecd. Note, 6.875%, 9/1/2027 | 2,330,487 | |
2,075,000 | USA Compression Partners LP, Sr. Unsecd. Note, Series WI, 6.875%, 4/1/2026 | 2,086,651 | |
TOTAL | 12,915,746 | ||
Packaging— 4.1% | |||
2,843,920 | ARD Finance SA, Sec. Fac. Bond, 144A, 6.500%, 6/30/2027 | 2,726,722 | |
1,550,000 | Ardagh Metal Packaging, Sr. Unsecd. Note, 144A, 4.000%, 9/1/2029 | 1,455,745 | |
2,500,000 | Ardagh Packaging Finance PLC/Ardagh Holdings, Sec. Fac. Bond, 144A, 5.250%, 8/15/2027 | 2,379,195 | |
1,300,000 | Ardagh Packaging Finance PLC/Ardagh Holdings, Sr. Unsecd. Note, 144A, 5.250%, 8/15/2027 | 1,237,182 | |
875,000 | Ball Corp., Sr. Unsecd. Note, 2.875%, 8/15/2030 | 800,953 | |
975,000 | Berry Global Escrow Corp., 144A, 5.625%, 7/15/2027 | 1,000,238 | |
925,000 | Bway Holding Co., Sec. Fac. Bond, 144A, 5.500%, 4/15/2024 | 921,300 | |
2,100,000 | Bway Holding Co., Sr. Unsecd. Note, 144A, 7.250%, 4/15/2025 | 2,066,998 | |
700,000 | Crown Americas LLC / Crown Americas Capital Corp. VI, Sr. Unsecd. Note, 4.750%, 2/1/2026 | 712,835 |
Principal Amount or Shares | Value | ||
CORPORATE BONDS— continued | |||
Packaging— continued | |||
$4,250,000 | Flex Acquisition Co., Inc., Sr. Unsecd. Note, 144A, 6.875%, 1/15/2025 | $ 4,263,982 | |
2,450,000 | Flex Acquisition Co., Inc., Sr. Unsecd. Note, 144A, 7.875%, 7/15/2026 | 2,529,012 | |
575,000 | OI European Group BV, Sr. Unsecd. Note, 144A, 4.750%, 2/15/2030 | 551,278 | |
1,025,000 | Owens-Brockway Glass Container, Inc., Sr. Unsecd. Note, 144A, 5.375%, 1/15/2025 | 1,045,418 | |
400,000 | Owens-Brockway Glass Container, Inc., Sr. Unsecd. Note, 144A, 6.375%, 8/15/2025 | 421,404 | |
244,000 | Owens-Brockway Glass Container, Inc., Sr. Unsecd. Note, 144A, 6.625%, 5/13/2027 | 253,409 | |
2,250,000 | Trident Merger Subsidiary, Inc., Sr. Unsecd. Note, 144A, 6.625%, 11/1/2025 | 2,229,671 | |
1,050,000 | Trident Merger Subsidiary, Inc., Sr. Unsecd. Note, 144A, 9.250%, 8/1/2024 | 1,079,495 | |
475,000 | Trivium Packaging Finance BV, Sec. Fac. Bond, 144A, 5.500%, 8/15/2026 | 479,888 | |
2,650,000 | Trivium Packaging Finance BV, Sr. Unsecd. Note, 144A, 8.500%, 8/15/2027 | 2,720,861 | |
TOTAL | 28,875,586 | ||
Paper— 0.3% | |||
2,250,000 | Clearwater Paper Corp., Sr. Unsecd. Note, 144A, 5.375%, 2/1/2025 | 2,329,527 | |
125,000 | Graphic Packaging International, LLC, Sr. Unsecd. Note, 144A, 3.750%, 2/1/2030 | 119,286 | |
TOTAL | 2,448,813 | ||
Pharmaceuticals— 3.3% | |||
675,000 | Bausch Health Cos, Inc., Sec. Fac. Bond, 144A, 4.875%, 6/1/2028 | 649,505 | |
875,000 | Bausch Health Cos, Inc., Sec. Fac. Bond, 144A, 5.500%, 11/1/2025 | 879,174 | |
700,000 | Bausch Health Cos, Inc., Sec. Fac. Bond, 144A, 5.750%, 8/15/2027 | 696,423 | |
200,000 | Bausch Health Cos, Inc., Sec. Fac. Bond, 144A, 6.125%, 2/1/2027 | 201,909 | |
175,000 | Bausch Health Cos, Inc., Sr. Unsecd. Note, 144A, 5.000%, 1/30/2028 | 146,861 | |
1,850,000 | Bausch Health Cos, Inc., Sr. Unsecd. Note, 144A, 5.000%, 2/15/2029 | 1,500,720 | |
1,575,000 | Bausch Health Cos, Inc., Sr. Unsecd. Note, 144A, 5.250%, 1/30/2030 | 1,272,490 | |
1,100,000 | Bausch Health Cos, Inc., Sr. Unsecd. Note, 144A, 5.250%, 2/15/2031 | 876,299 | |
3,934,000 | Bausch Health Cos, Inc., Sr. Unsecd. Note, 144A, 6.125%, 4/15/2025 | 3,956,129 | |
600,000 | Bausch Health Cos, Inc., Sr. Unsecd. Note, 144A, 6.250%, 2/15/2029 | 512,595 | |
1,100,000 | Bausch Health Cos, Inc., Sr. Unsecd. Note, 144A, 7.250%, 5/30/2029 | 964,529 | |
2,475,000 | Bausch Health Cos, Inc., Sr. Unsecd. Note, 144A, 8.500%, 1/31/2027 | 2,509,650 | |
600,000 | Bausch Health Cos, Inc., Sr. Unsecd. Note, 144A, 9.000%, 12/15/2025 | 619,431 | |
125,000 | Bausch Health Cos, Inc., Sr. Unsecd. Note, 144A, 9.250%, 4/1/2026 | 129,466 | |
550,000 | Catalent Pharma Solutions, Inc., Sr. Unsecd. Note, 144A, 3.500%, 4/1/2030 | 512,718 | |
989,000 | Endo Dac / Endo Finance LLC / Endo Finco, Inc., Sr. Unsecd. Note, 144A, 6.000%, 6/30/2028 | 656,028 | |
400,000 | Grifols Escrow Issuer SA, 144A, 4.750%, 10/15/2028 | 378,490 | |
1,325,000 | Jazz Securities Designated Activity Co., 144A, 4.375%, 1/15/2029 | 1,314,771 | |
3,050,000 | 1,3 | Mallinckrodt International Finance SA/Mallinckrodt CB LLC, Sr. Unsecd. Note, 144A, 5.500%, 4/15/2025 | 1,520,471 |
Principal Amount or Shares | Value | ||
CORPORATE BONDS— continued | |||
Pharmaceuticals— continued | |||
$3,475,000 | 1,3 | Mallinckrodt International Finance SA/Mallinckrodt CB LLC, Sr. Unsecd. Note, 144A, 5.625%, 10/15/2023 | $ 1,742,660 |
325,000 | Organon Finance 1 LLC, Sec. Fac. Bond, 144A, 4.125%, 4/30/2028 | 320,223 | |
1,325,000 | Organon Finance 1 LLC, Sr. Unsecd. Note, 144A, 5.125%, 4/30/2031 | 1,324,708 | |
775,000 | Syneos Health, Inc., Sr. Unsecd. Note, 144A, 3.625%, 1/15/2029 | 733,026 | |
TOTAL | 23,418,276 | ||
Restaurant— 1.3% | |||
475,000 | 1011778 BC Unltd. Liability Co./New Red Finance, Inc., 144A, 3.875%, 1/15/2028 | 462,698 | |
575,000 | 1011778 BC Unltd. Liability Co./New Red Finance, Inc., 144A, 4.375%, 1/15/2028 | 564,969 | |
275,000 | 1011778 BC Unltd. Liability Co./New Red Finance, Inc., 1st Lien, 144A, 3.500%, 2/15/2029 | 259,695 | |
6,150,000 | 1011778 BC Unltd. Liability Co./New Red Finance, Inc., 2nd Lien, 144A, 4.000%, 10/15/2030 | 5,689,273 | |
1,375,000 | Yum! Brands, Inc., Sr. Unsecd. Note, 4.625%, 1/31/2032 | 1,349,631 | |
650,000 | Yum! Brands, Inc., Sr. Unsecd. Note, 144A, 4.750%, 1/15/2030 | 660,926 | |
TOTAL | 8,987,192 | ||
Retailers— 0.6% | |||
600,000 | Academy Ltd., Sec. Fac. Bond, 144A, 6.000%, 11/15/2027 | 625,515 | |
375,000 | Asbury Automotive Group, Inc., Sr. Unsecd. Note, 144A, 4.625%, 11/15/2029 | 366,320 | |
375,000 | Asbury Automotive Group, Inc., Sr. Unsecd. Note, 144A, 5.000%, 2/15/2032 | 364,582 | |
250,000 | Gap (The), Inc., Sr. Unsecd. Note, 144A, 3.625%, 10/1/2029 | 226,875 | |
525,000 | Gap (The), Inc., Sr. Unsecd. Note, 144A, 3.875%, 10/1/2031 | 471,403 | |
375,000 | Kontoor Brands, Inc., Sr. Unsecd. Note, 144A, 4.125%, 11/15/2029 | 354,079 | |
975,000 | NMG Holding Co., Inc., 144A, 7.125%, 4/1/2026 | 1,005,225 | |
275,000 | William Carter Co., Sr. Unsecd. Note, 144A, 5.500%, 5/15/2025 | 282,879 | |
200,000 | William Carter Co., Sr. Unsecd. Note, 144A, 5.625%, 3/15/2027 | 204,007 | |
TOTAL | 3,900,885 | ||
Supermarkets— 0.5% | |||
2,950,000 | Albertsons Cos. LLC/SAFEW, Sr. Unsecd. Note, 144A, 3.500%, 3/15/2029 | 2,748,633 | |
450,000 | Albertsons Cos. LLC/SAFEW, Sr. Unsecd. Note, 144A, 5.875%, 2/15/2028 | 465,808 | |
375,000 | Albertsons Cos. LLC/SAFEW, Sr. Unsecd. Note, 144A, 7.500%, 3/15/2026 | 397,956 | |
TOTAL | 3,612,397 | ||
Technology— 6.4% | |||
675,000 | Black Knight InfoServ LLC, Sr. Unsecd. Note, 144A, 3.625%, 9/1/2028 | 640,113 | |
575,000 | Boxer Parent Co., Inc., 144A, 9.125%, 3/1/2026 | 597,138 | |
1,450,000 | Cars.com, Inc., Sr. Unsecd. Note, 144A, 6.375%, 11/1/2028 | 1,466,515 | |
1,025,000 | Centerfield Media Parent, Sr. Note, 144A, 6.625%, 8/1/2026 | 992,917 |
Principal Amount or Shares | Value | ||
CORPORATE BONDS— continued | |||
Technology— continued | |||
$ 275,000 | Ciena Corp., Sr. Unsecd. Note, 144A, 4.000%, 1/31/2030 | $ 271,194 | |
275,000 | Clarivate Science Holdings Corp., 144A, 3.875%, 7/1/2028 | 260,281 | |
1,300,000 | Clarivate Science Holdings Corp., Sr. Unsecd. Note, 144A, 4.875%, 7/1/2029 | 1,225,718 | |
725,000 | Consensus Cloud Solutions, Inc., Sr. Unsecd. Note, 144A, 6.000%, 10/15/2026 | 724,188 | |
1,000,000 | Consensus Cloud Solutions, Inc., Sr. Unsecd. Note, 144A, 6.500%, 10/15/2028 | 1,008,600 | |
425,000 | Diebold Nixdorf, Inc., Sr. Secd. Note, 144A, 9.375%, 7/15/2025 | 440,517 | |
375,000 | Dun & Bradstreet Corp., Sr. Unsecd. Note, 144A, 5.000%, 12/15/2029 | 360,503 | |
1,550,000 | Elastic N.V., Sr. Unsecd. Note, 144A, 4.125%, 7/15/2029 | 1,423,799 | |
500,000 | Fair Isaac & Co., Inc., Sr. Unsecd. Note, 144A, 4.000%, 6/15/2028 | 491,440 | |
300,000 | Gartner, Inc., Sr. Unsecd. Note, 144A, 3.750%, 10/1/2030 | 292,304 | |
400,000 | Gartner, Inc., Sr. Unsecd. Note, 144A, 4.500%, 7/1/2028 | 405,696 | |
1,350,000 | HealthEquity, Inc., Sr. Unsecd. Note, 144A, 4.500%, 10/1/2029 | 1,286,685 | |
1,075,000 | Helios Software Holdings, Sec. Fac. Bond, 144A, 4.625%, 5/1/2028 | 1,011,822 | |
950,000 | II-VI, Inc., Sr. Unsecd. Note, 144A, 5.000%, 12/15/2029 | 950,674 | |
2,450,000 | Logan Merger Sub, Inc., Sr. Secd. Note, 144A, 5.500%, 9/1/2027 | 2,333,221 | |
3,500,000 | McAfee Corp., Sr. Unsecd. Note, 144A, 7.375%, 2/15/2030 | 3,369,380 | |
3,900,000 | Minerva Merger Sub, Inc., Sr. Unsecd. Note, 144A, 6.500%, 2/15/2030 | 3,760,146 | |
1,525,000 | NCR Corp., 144A, 5.125%, 4/15/2029 | 1,509,910 | |
925,000 | NCR Corp., Sr. Unsecd. Note, 144A, 5.000%, 10/1/2028 | 910,061 | |
500,000 | NCR Corp., Sr. Unsecd. Note, 144A, 5.250%, 10/1/2030 | 485,180 | |
825,000 | NCR Corp., Sr. Unsecd. Note, 144A, 5.750%, 9/1/2027 | 838,221 | |
450,000 | Open Text Holdings, Inc. / Open Text Corp., Sr. Unsecd. Note, 144A, 3.875%, 12/1/2029 | 425,385 | |
1,025,000 | Open Text Holdings, Inc. / Open Text Corp., Sr. Unsecd. Note, 144A, 4.125%, 12/1/2031 | 975,200 | |
1,725,000 | Rackspace Technology, Inc., 144A, 3.500%, 2/15/2028 | 1,567,300 | |
2,225,000 | Rackspace Technology, Inc., Sr. Unsecd. Note, 144A, 5.375%, 12/1/2028 | 1,999,263 | |
2,500,000 | Rocket Software, Inc., Sr. Unsecd. Note, 144A, 6.500%, 2/15/2029 | 2,322,750 | |
250,000 | Science Applications International Corp., Sr. Unsecd. Note, 144A, 4.875%, 4/1/2028 | 244,300 | |
1,500,000 | Seagate HDD Cayman, Sr. Unsecd. Note, 3.125%, 7/15/2029 | 1,368,765 | |
900,000 | Seagate HDD Cayman, Sr. Unsecd. Note, 3.375%, 7/15/2031 | 821,250 | |
200,000 | Sensata Technologies B.V., Sr. Unsecd. Note, 144A, 4.000%, 4/15/2029 | 192,351 | |
475,000 | Sensata Technologies B.V., Sr. Unsecd. Note, 144A, 4.375%, 2/15/2030 | 462,738 | |
325,000 | Sensata Technologies, Inc., Sr. Unsecd. Note, 144A, 3.750%, 2/15/2031 | 302,773 | |
2,600,000 | SS&C Technologies, Inc., Sr. Unsecd. Note, 144A, 5.500%, 9/30/2027 | 2,675,088 | |
425,000 | Synaptics, Inc., Sr. Unsecd. Note, 144A, 4.000%, 6/15/2029 | 410,446 | |
800,000 | TTM Technologies, Inc., Sr. Unsecd. Note, 144A, 4.000%, 3/1/2029 | 739,356 |
Principal Amount or Shares | Value | ||
CORPORATE BONDS— continued | |||
Technology— continued | |||
$ 875,000 | Twitter, Inc., Sr. Unsecd. Note, 144A, 5.000%, 3/1/2030 | $ 881,037 | |
2,325,000 | Veritas US, Inc./Veritas Bermuda, Ltd., Sr. Secd. Note, 144A, 7.500%, 9/1/2025 | 2,302,447 | |
275,000 | Viavi Solutions, Inc., Sr. Unsecd. Note, 144A, 3.750%, 10/1/2029 | 261,121 | |
375,000 | ZipRecruiter, Inc., Sr. Unsecd. Note, 144A, 5.000%, 1/15/2030 | 369,773 | |
TOTAL | 45,377,566 | ||
Transportation Services— 0.4% | |||
1,100,000 | Stena International S.A., Sec. Fac. Bond, 144A, 6.125%, 2/1/2025 | 1,118,816 | |
1,575,000 | Watco Cos LLC/Finance Co., Sr. Unsecd. Note, 144A, 6.500%, 6/15/2027 | 1,592,388 | |
TOTAL | 2,711,204 | ||
Utility - Electric— 2.0% | |||
700,000 | Calpine Corp., 144A, 4.500%, 2/15/2028 | 684,260 | |
232,000 | Calpine Corp., 144A, 5.250%, 6/1/2026 | 234,593 | |
1,425,000 | Calpine Corp., Sr. Secd. Note, 144A, 3.750%, 3/1/2031 | 1,299,108 | |
450,000 | Calpine Corp., Sr. Unsecd. Note, 144A, 4.625%, 2/1/2029 | 418,028 | |
450,000 | Calpine Corp., Sr. Unsecd. Note, 144A, 5.000%, 2/1/2031 | 417,285 | |
700,000 | Calpine Corp., Sr. Unsecd. Note, 144A, 5.125%, 3/15/2028 | 675,500 | |
2,900,000 | Enviva Partners LP/Enviva Partners Finance Corp., Sr. Unsecd. Note, 144A, 6.500%, 1/15/2026 | 2,993,800 | |
411,000 | NRG Energy, Inc., Sr. Unsecd. Note, 6.625%, 1/15/2027 | 425,385 | |
125,000 | NRG Energy, Inc., Sr. Unsecd. Note, 144A, 3.625%, 2/15/2031 | 115,138 | |
1,600,000 | NRG Energy, Inc., Sr. Unsecd. Note, 144A, 3.875%, 2/15/2032 | 1,486,184 | |
475,000 | NRG Energy, Inc., Sr. Unsecd. Note, Series WI, 5.750%, 1/15/2028 | 486,277 | |
1,650,000 | TerraForm Power Operating LLC, Sr. Unsecd. Note, 144A, 4.750%, 1/15/2030 | 1,622,189 | |
1,325,000 | TerraForm Power Operating LLC, Sr. Unsecd. Note, 144A, 5.000%, 1/31/2028 | 1,330,697 | |
525,000 | Vistra Operations Co., LLC, Sr. Unsecd. Note, 144A, 5.000%, 7/31/2027 | 529,510 | |
375,000 | Vistra Operations Co., LLC, Sr. Unsecd. Note, 144A, 5.500%, 9/1/2026 | 382,148 | |
1,375,000 | Vistra Operations Co., LLC, Sr. Unsecd. Note, 144A, 5.625%, 2/15/2027 | 1,409,609 | |
TOTAL | 14,509,711 | ||
Wireless Communications— 0.9% | |||
1,375,000 | Sprint Corp., Sr. Unsecd. Note, 7.125%, 6/15/2024 | 1,488,437 | |
500,000 | T-Mobile USA, Inc., Sr. Unsecd. Note, 2.250%, 2/15/2026 | 483,073 | |
1,000,000 | T-Mobile USA, Inc., Sr. Unsecd. Note, 2.625%, 2/15/2029 | 939,545 | |
300,000 | T-Mobile USA, Inc., Sr. Unsecd. Note, 2.875%, 2/15/2031 | 281,931 | |
1,250,000 | T-Mobile USA, Inc., Sr. Unsecd. Note, 4.750%, 2/1/2028 | 1,291,844 | |
725,000 | T-Mobile USA, Inc., Sr. Unsecd. Note, 144A, 2.250%, 2/15/2026 | 700,455 |
Principal Amount or Shares | Value | ||
CORPORATE BONDS— continued | |||
Wireless Communications— continued | |||
$1,225,000 | T-Mobile USA, Inc., Sr. Unsecd. Note, 144A, 3.375%, 4/15/2029 | $ 1,200,794 | |
TOTAL | 6,386,079 | ||
TOTAL CORPORATE BONDS (IDENTIFIED COST $630,604,585) | 614,631,508 | ||
COMMON STOCKS— 10.0% | |||
Automotive— 0.6% | |||
122,038 | 3 | American Axle & Manufacturing Holdings, Inc. | 1,130,072 |
61,710 | 3 | Goodyear Tire & Rubber Co. | 955,888 |
53,015 | 3 | KAR Auction Services, Inc. | 978,657 |
6,765 | Lear Corp. | 1,064,405 | |
TOTAL | 4,129,022 | ||
Building Materials— 0.3% | |||
37,845 | 3 | GMS, Inc. | 2,053,091 |
Cable Satellite— 0.3% | |||
100,375 | 3 | Altice USA, Inc. | 1,160,335 |
2,171 | 2,3 | Intelsat Jackson Holdings S.A. | 0 |
2,172 | 2,3 | Intelsat Jackson Holdings S.A. | 0 |
20,745 | 2,3 | Intelsat Jackson Holdings S.A. | 694,952 |
TOTAL | 1,855,287 | ||
Chemicals— 0.5% | |||
19,340 | Compass Minerals International, Inc. | 1,133,711 | |
16,205 | 3 | Hexion Holdings Corp. | 480,964 |
68,210 | Koppers Holdings, Inc. | 1,952,852 | |
TOTAL | 3,567,527 | ||
Consumer Cyclical Services— 0.3% | |||
28,950 | Brinks Co. (The) | 2,028,237 | |
Consumer Products— 0.2% | |||
52,190 | Energizer Holdings, Inc. | 1,742,624 | |
Food & Beverage— 0.3% | |||
59,090 | 3 | US Foods Holding Corp. | 2,309,828 |
Gaming— 0.5% | |||
20,830 | Boyd Gaming Corp. | 1,477,680 | |
41,975 | Red Rock Resorts, Inc. | 2,110,503 | |
TOTAL | 3,588,183 | ||
Independent Energy— 0.6% | |||
139 | Chesapeake Energy Corp. | 10,738 | |
38,950 | Devon Energy Corp. | 2,319,473 | |
9,464 | Pioneer Natural Resources, Inc. | 2,267,574 |
Principal Amount or Shares | Value | ||
COMMON STOCKS— continued | |||
Independent Energy— continued | |||
833 | 2,3 | Ultra Resources, Inc. | $ 0 |
TOTAL | 4,597,785 | ||
Media Entertainment— 2.0% | |||
405,888 | 3 | Cumulus Media, Inc. | 4,651,476 |
116,249 | 3 | iHeartMedia, Inc. | 2,493,541 |
421,185 | 3 | Stagwell, Inc. | 3,192,582 |
198,655 | 3 | Townsquare Media, Inc. | 2,266,654 |
292,430 | 3 | Urban One, Inc. | 1,315,935 |
TOTAL | 13,920,188 | ||
Metals & Mining— 0.3% | |||
65,240 | Teck Resources Ltd. | 2,345,378 | |
Midstream— 0.3% | |||
123,676 | Suburban Propane Partners LP | 1,846,483 | |
Oil Field Services— 0.3% | |||
49,730 | 2,3 | Superior Energy Services, Inc. | 2,287,580 |
Packaging— 0.6% | |||
307,645 | 3 | Ardagh Metal Packaging | 2,556,530 |
150,460 | 3 | O-I Glass, Inc. | 1,922,879 |
TOTAL | 4,479,409 | ||
Paper— 0.6% | |||
114,176 | Graphic Packaging Holding Co. | 2,349,742 | |
42,559 | WestRock Co. | 1,926,646 | |
TOTAL | 4,276,388 | ||
Pharmaceuticals— 0.3% | |||
83,885 | 3 | Bausch Health Cos, Inc. | 2,018,273 |
Technology— 1.1% | |||
29,795 | Dell Technologies, Inc. | 1,518,353 | |
243,830 | 3 | Diebold Nixdorf, Inc. | 2,121,321 |
23,465 | 3 | Lumentum Holdings, Inc. | 2,319,750 |
22,420 | Science Applications International Corp. | 1,966,010 | |
TOTAL | 7,925,434 | ||
Utility - Electric— 0.9% | |||
33,295 | Enviva, Inc. | 2,320,661 | |
48,295 | NRG Energy, Inc. | 1,827,483 | |
86,525 | Vistra Corp. | 1,974,501 | |
TOTAL | 6,122,645 | ||
TOTAL COMMON STOCKS (IDENTIFIED COST $67,507,284) | 71,093,362 |
Principal Amount or Shares | Value | ||
WARRANTS— 0.1% | |||
Independent Energy— 0.1% | |||
263 | 3 | Chesapeake Energy Corp., Warrants, Expiration Date 2/9/2026 | $ 11,440 |
6,793 | 3 | Chesapeake Energy Corp., Warrants, Expiration Date 2/9/2026 | 351,470 |
TOTAL WARRANTS (IDENTIFIED COST $752,119) | 362,910 | ||
INVESTMENT COMPANIES— 2.0% | |||
841,313 | Bank Loan Core Fund | 8,009,302 | |
6,202,872 | Federated Hermes Institutional Prime Value Obligations Fund, Institutional Shares, 0.07%4 | 6,201,631 | |
TOTAL INVESTMENT COMPANIES (IDENTIFIED COST $14,591,857) | 14,210,933 | ||
TOTAL INVESTMENT IN SECURITIES—98.6% (IDENTIFIED COST $713,455,845)5 | 700,298,713 | ||
OTHER ASSETS AND LIABILITIES - NET—1.4%6 | 10,149,197 | ||
TOTAL NET ASSETS—100% | $710,447,910 |
Bank Loan Core Fund | Federated Hermes Institutional Prime Value Obligations Fund, Institutional Shares | Total of Affiliated Transactions | |
Value as of 2/28/2021 | $16,757,202 | $12,532,060 | $29,289,262 |
Purchases at Cost | $8,986,445 | $182,655,609 | $191,642,054 |
Proceeds from Sales | $(17,500,000) | $(188,980,230) | $(206,480,230) |
Change in Unrealized Appreciation/ Depreciation | $207,258 | $(1,428) | $205,830 |
Net Realized Gain/(Loss) | $(441,603) | $(4,380) | $(445,983) |
Value as of 2/28/2022 | $8,009,302 | $6,201,631 | $14,210,933 |
Shares Held as of 2/28/2022 | 841,313 | 6,202,872 | 7,044,185 |
Dividend Income | $986,445 | $4,817 | $991,262 |
Gain Distributions Received | $— | $1,764 | $1,764 |
1 | Issuer in default. |
2 | Market quotations and price evaluations may not be available. Fair value determined using significant unobservable inputs in accordance with procedures established by and under the general supervision of the Fund’s Board of Trustees (the “Trustees”). |
3 | Non-income-producing security. |
4 | 7-day net yield. |
5 | The cost of investments for federal tax purposes amounts to $713,761,120. |
6 | Assets, other than investments in securities, less liabilities. See Statement of Assets and Liabilities. |
The following is a summary of the inputs used, as of February 28, 2022, in valuing the Fund’s assets carried at fair value:
Valuation Inputs | ||||
Level 1— Quoted Prices | Level 2— Other Significant Observable Inputs | Level 3— Significant Unobservable Inputs | Total | |
Debt Securities: | ||||
Corporate Bonds | $— | $614,631,508 | $0 | $614,631,508 |
Warrants | — | 362,910 | — | 362,910 |
Equity Securities: | ||||
Common Stocks | ||||
Domestic | 61,190,649 | — | 2,982,532 | 64,173,181 |
International | 6,920,181 | — | — | 6,920,181 |
Investment Companies | 14,210,933 | — | — | 14,210,933 |
TOTAL SECURITIES | $82,321,763 | $614,994,418 | $2,982,532 | $700,298,713 |
The following acronym(s) are used throughout this portfolio: | ||
GMTN | —Global Medium Term Note | |
PIK | —Payment in Kind | |
Year Ended February 28 or 29, | |||||
2022 | 2021 | 2020 | 2019 | 2018 | |
Net Asset Value, Beginning of Period | $6.98 | $6.51 | $6.59 | $6.80 | $6.91 |
Income From Investment Operations: | |||||
Net investment income (loss) | 0.28 | 0.29 | 0.34 | 0.36 | 0.33 |
Net realized and unrealized gain (loss) | (0.12) | 0.48 | (0.08) | (0.15) | (0.11) |
Total From Investment Operations | 0.16 | 0.77 | 0.26 | 0.21 | 0.22 |
Less Distributions: | |||||
Distributions from net investment income | (0.29) | (0.30) | (0.33) | (0.37) | (0.33) |
Distributions from net realized gain | (0.02) | — | (0.01) | (0.05) | — |
Total Distributions | (0.31) | (0.30) | (0.34) | (0.42) | (0.33) |
Redemption fees | — | — | 0.001 | 0.001 | 0.001 |
Net Asset Value, End of Period | $6.83 | $6.98 | $6.51 | $6.59 | $6.80 |
Total Return2 | 2.18% | 12.33% | 3.98% | 3.23% | 3.20% |
Ratios to Average Net Assets: | |||||
Net expenses3 | 0.97% | 0.97% | 0.97% | 0.97% | 0.98% |
Net investment income | 4.01% | 4.45% | 4.83% | 4.91% | 4.73% |
Expense waiver/reimbursement4 | 0.11% | 0.13% | 0.11% | 0.15% | 0.20% |
Supplemental Data: | |||||
Net assets, end of period (000 omitted) | $25,842 | $23,000 | $25,430 | $28,642 | $108,607 |
Portfolio turnover5 | 34% | 41% | 31% | 20% | 30% |
1 | Represents less than $0.01. |
2 | Based on net asset value, which does not reflect the sales charge, redemption fee or contingent deferred sales charge, if applicable. |
3 | Amount does not reflect net expenses incurred by investment companies in which the Fund may invest. |
4 | This expense decrease is reflected in both the net expense and the net investment income ratios shown above. Amount does not reflect expense waiver/reimbursement recorded by investment companies in which the Fund may invest. |
5 | Securities that mature are considered sales for purposes of this calculation. |
Year Ended February 28 or 29, | |||||
2022 | 2021 | 2020 | 2019 | 2018 | |
Net Asset Value, Beginning of Period | $6.98 | $6.51 | $6.59 | $6.80 | $6.90 |
Income From Investment Operations: | |||||
Net investment income (loss) | 0.23 | 0.23 | 0.28 | 0.29 | 0.28 |
Net realized and unrealized gain (loss) | (0.13) | 0.49 | (0.07) | (0.13) | (0.10) |
Total From Investment Operations | 0.10 | 0.72 | 0.21 | 0.16 | 0.18 |
Less Distributions: | |||||
Distributions from net investment income | (0.23) | (0.25) | (0.28) | (0.32) | (0.28) |
Distributions from net realized gain | (0.02) | — | (0.01) | (0.05) | — |
Total Distributions | (0.25) | (0.25) | (0.29) | (0.37) | (0.28) |
Redemption fees | — | — | 0.001 | 0.001 | 0.001 |
Net Asset Value, End of Period | $6.83 | $6.98 | $6.51 | $6.59 | $6.80 |
Total Return2 | 1.36% | 11.42% | 3.14% | 2.46% | 2.58% |
Ratios to Average Net Assets: | |||||
Net expenses3 | 1.78% | 1.79% | 1.78% | 1.72% | 1.72% |
Net investment income | 3.19% | 3.62% | 4.03% | 4.30% | 3.99% |
Expense waiver/reimbursement4 | 0.05% | 0.05% | 0.06% | 0.10% | 0.09% |
Supplemental Data: | |||||
Net assets, end of period (000 omitted) | $28,570 | $28,292 | $30,266 | $34,253 | $45,466 |
Portfolio turnover5 | 34% | 41% | 31% | 20% | 30% |
1 | Represents less than $0.01. |
2 | Based on net asset value, which does not reflect the sales charge, redemption fee or contingent deferred sales charge, if applicable. |
3 | Amount does not reflect net expenses incurred by investment companies in which the Fund may invest. |
4 | This expense decrease is reflected in both the net expense and the net investment income ratios shown above. Amount does not reflect expense waiver/reimbursement recorded by investment companies in which the Fund may invest. |
5 | Securities that mature are considered sales for purposes of this calculation. |
Year Ended February 28 or 29, | |||||
2022 | 2021 | 2020 | 2019 | 2018 | |
Net Asset Value, Beginning of Period | $6.96 | $6.48 | $6.56 | $6.78 | $6.88 |
Income From Investment Operations: | |||||
Net investment income (loss) | 0.30 | 0.30 | 0.35 | 0.35 | 0.34 |
Net realized and unrealized gain (loss) | (0.12) | 0.49 | (0.07) | (0.14) | (0.09) |
Total From Investment Operations | 0.18 | 0.79 | 0.28 | 0.21 | 0.25 |
Less Distributions: | |||||
Distributions from net investment income | (0.31) | (0.31) | (0.35) | (0.38) | (0.35) |
Distributions from net realized gain | (0.02) | — | (0.01) | (0.05) | — |
Total Distributions | (0.33) | (0.31) | (0.36) | (0.43) | (0.35) |
Redemption fees | — | — | 0.001 | 0.001 | 0.001 |
Net Asset Value, End of Period | $6.81 | $6.96 | $6.48 | $6.56 | $6.78 |
Total Return2 | 2.43% | 12.80% | 4.23% | 3.32% | 3.60% |
Ratios to Average Net Assets: | |||||
Net expenses3 | 0.72% | 0.72% | 0.72% | 0.72% | 0.72% |
Net investment income | 4.26% | 4.68% | 5.08% | 5.31% | 5.00% |
Expense waiver/reimbursement4 | 0.13% | 0.14% | 0.13% | 0.13% | 0.10% |
Supplemental Data: | |||||
Net assets, end of period (000 omitted) | $351,491 | $312,067 | $323,629 | $326,429 | $364,521 |
Portfolio turnover5 | 34% | 41% | 31% | 20% | 30% |
1 | Represents less than $0.01. |
2 | Based on net asset value, which does not reflect the sales charge, redemption fee or contingent deferred sales charge, if applicable. |
3 | Amount does not reflect net expenses incurred by investment companies in which the Fund may invest. |
4 | This expense decrease is reflected in both the net expense and the net investment income ratios shown above. Amount does not reflect expense waiver/reimbursement recorded by investment companies in which the Fund may invest. |
5 | Securities that mature are considered sales for purposes of this calculation. |
Year Ended February 28 or 29, | |||||
2022 | 2021 | 2020 | 2019 | 2018 | |
Net Asset Value, Beginning of Period | $6.97 | $6.49 | $6.57 | $6.78 | $6.89 |
Income From Investment Operations: | |||||
Net investment income (loss) | 0.28 | 0.28 | 0.34 | 0.34 | 0.33 |
Net realized and unrealized gain (loss) | (0.13) | 0.50 | (0.08) | (0.13) | (0.11) |
Total From Investment Operations | 0.15 | 0.78 | 0.26 | 0.21 | 0.22 |
Less Distributions: | |||||
Distributions from net investment income | (0.29) | (0.30) | (0.33) | (0.37) | (0.33) |
Distributions from net realized gain | (0.02) | — | (0.01) | (0.05) | — |
Total Distributions | (0.31) | (0.30) | (0.34) | (0.42) | (0.33) |
Redemption fees | — | — | 0.001 | 0.001 | 0.001 |
Net Asset Value, End of Period | $6.81 | $6.97 | $6.49 | $6.57 | $6.78 |
Total Return2 | 2.03% | 12.51% | 3.97% | 3.22% | 3.20% |
Ratios to Average Net Assets: | |||||
Net expenses3 | 0.97% | 0.97% | 0.97% | 0.97% | 0.97% |
Net investment income | 4.00% | 4.42% | 4.83% | 5.04% | 4.73% |
Expense waiver/reimbursement4 | 0.13% | 0.13% | 0.12% | 0.11% | 0.11% |
Supplemental Data: | |||||
Net assets, end of period (000 omitted) | $292,433 | $323,462 | $330,089 | $373,153 | $470,870 |
Portfolio turnover5 | 34% | 41% | 31% | 20% | 30% |
1 | Represents less than $0.01. |
2 | Based on net asset value, which does not reflect the sales charge, redemption fee or contingent deferred sales charge, if applicable. |
3 | Amount does not reflect net expenses incurred by investment companies in which the Fund may invest. |
4 | This expense decrease is reflected in both the net expense and the net investment income ratios shown above. Amount does not reflect expense waiver/reimbursement recorded by investment companies in which the Fund may invest. |
5 | Securities that mature are considered sales for purposes of this calculation. |
Year Ended February 28 or 29, | Period Ended 2/28/20181 | ||||
2022 | 2021 | 2020 | 2019 | ||
Net Asset Value, Beginning of Period | $6.97 | $6.49 | $6.57 | $6.78 | $6.87 |
Income From Investment Operations: | |||||
Net investment income (loss) | 0.30 | 0.30 | 0.35 | 0.36 | 0.30 |
Net realized and unrealized gain (loss) | (0.12) | 0.49 | (0.07) | (0.13) | (0.10) |
Total From Investment Operations | 0.18 | 0.79 | 0.28 | 0.23 | 0.20 |
Less Distributions: | |||||
Distributions from net investment income | (0.31) | (0.31) | (0.35) | (0.39) | (0.29) |
Distributions from net realized gain | (0.02) | — | (0.01) | (0.05) | — |
Total Distributions | (0.33) | (0.31) | (0.36) | (0.44) | (0.29) |
Redemption fees | — | — | 0.002 | 0.002 | 0.002 |
Net Asset Value, End of Period | $6.82 | $6.97 | $6.49 | $6.57 | $6.78 |
Total Return3 | 2.44% | 12.80% | 4.24% | 3.49% | 2.98% |
Ratios to Average Net Assets: | |||||
Net expenses4 | 0.71% | 0.71% | 0.71% | 0.71% | 0.71%5 |
Net investment income | 4.33% | 4.86% | 5.08% | 5.41% | 5.11%5 |
Expense waiver/reimbursement6 | 0.05% | 0.05% | 0.05% | 0.04% | 0.02%5 |
Supplemental Data: | |||||
Net assets, end of period (000 omitted) | $12,111 | $4,651 | $9,387 | $5,412 | $2,175 |
Portfolio turnover7 | 34% | 41% | 31% | 20% | 30%8 |
1 | Reflects operations for the period from April 27, 2017 (commencement of operations) to February 28, 2018. Certain ratios included above in Ratios to Average Net Assets and per share amounts may be inflated or deflated as compared to the fee structure for each respective share class as a result of daily systematic allocations being rounded to the nearest penny for fund level income, expense and realized/unrealized gain/loss amounts. Such differences are immaterial. |
2 | Represents less than $0.01. |
3 | Based on net asset value, which does not reflect the sales charge, redemption fee or contingent deferred sales charge, if applicable. Total returns for periods of less than one year are not annualized. |
4 | Amount does not reflect net expenses incurred by investment companies in which the Fund may invest. |
5 | Computed on an annualized basis. |
6 | This expense decrease is reflected in both the net expense and the net investment income ratios shown above. Amount does not reflect expense waiver/reimbursement recorded by investment companies in which the Fund may invest. |
7 | Securities that mature are considered sales for purposes of this calculation. |
8 | Portfolio turnover is calculated at the Fund level. Percentage indicated was calculated for the year ended February 28, 2018. |
February 28, 2022
Assets: | |
Investment in securities, at value including $14,210,933 of investment in affiliated holdings* (identified cost $713,455,845) | $700,298,713 |
Cash | 56,197 |
Income receivable | 8,899,824 |
Income receivable from affiliated holdings | 59,014 |
Receivable for investments sold | 2,175,869 |
Receivable for shares sold | 624,026 |
Total Assets | 712,113,643 |
Liabilities: | |
Payable for investments purchased | 298,293 |
Payable for shares redeemed | 1,049,295 |
Income distribution payable | 17,376 |
Payable for investment adviser fee (Note 5) | 10,606 |
Payable for administrative fee (Note 5) | 1,518 |
Payable for Directors’/Trustees’ fees (Note 5) | 747 |
Payable for portfolio accounting fees | 67,875 |
Payable for transfer agent fees (Note 2) | 77,352 |
Payable for distribution services fee (Note 5) | 16,992 |
Payable for other service fees (Notes 2 and 5) | 67,567 |
Accrued expenses (Note 5) | 58,112 |
Total Liabilities | 1,665,733 |
Net assets for 104,278,098 shares outstanding | $710,447,910 |
Net Assets Consist of: | |
Paid-in capital | $720,764,964 |
Total distributable earnings (loss) | (10,317,054) |
Total Net Assets | $710,447,910 |
Net Asset Value, Offering Price and Redemption Proceeds Per Share: | |
Class A Shares: | |
Net asset value per share ($25,841,927 ÷ 3,782,128 shares outstanding), no par value, unlimited shares authorized | $6.83 |
Offering price per share (100/95.50 of $6.83) | $7.15 |
Redemption proceeds per share | $6.83 |
Class C Shares: | |
Net asset value per share ($28,570,052 ÷ 4,182,407 shares outstanding), no par value, unlimited shares authorized | $6.83 |
Offering price per share | $6.83 |
Redemption proceeds per share (99.00/100 of $6.83) | $6.76 |
Institutional Shares: | |
Net asset value per share ($351,491,325 ÷ 51,624,683 shares outstanding), no par value, unlimited shares authorized | $6.81 |
Offering price per share | $6.81 |
Redemption proceeds per share | $6.81 |
Service Shares: | |
Net asset value per share ($292,433,182 ÷ 42,911,999 shares outstanding), no par value, unlimited shares authorized | $6.81 |
Offering price per share | $6.81 |
Redemption proceeds per share | $6.81 |
Class R6 Shares: | |
Net asset value per share ($12,111,424 ÷ 1,776,881 shares outstanding), no par value, unlimited shares authorized | $6.82 |
Offering price per share | $6.82 |
Redemption proceeds per share | $6.82 |
* | See information listed after the Fund’s Portfolio of Investments. |
Year Ended February 28, 2022
Investment Income: | |
Interest | $33,219,353 |
Dividends (including $991,262 received from affiliated holdings* and net of foreign taxes withheld of $2,612) | 3,239,928 |
TOTAL INCOME | 36,459,281 |
Expenses: | |
Investment adviser fee (Note 5) | 4,394,198 |
Administrative fee (Note 5) | 583,161 |
Custodian fees | 40,647 |
Transfer agent fees (Note 2) | 778,295 |
Directors’/Trustees’ fees (Note 5) | 11,675 |
Auditing fees | 32,900 |
Legal fees | 7,139 |
Portfolio accounting fees | 202,056 |
Distribution services fee (Note 5) | 236,024 |
Other service fees (Notes 2 and 5) | 936,340 |
Share registration costs | 121,407 |
Printing and postage | 41,448 |
Miscellaneous (Note 5) | 41,357 |
TOTAL EXPENSES | 7,426,647 |
Waiver and Reimbursements: | |
Waiver/reimbursement of investment adviser fee (Note 5) | (332,105) |
Reimbursement of other operating expenses (Notes 2 and 5) | (589,485) |
TOTAL WAIVER AND REIMBURSEMENTS | (921,590) |
Net expenses | 6,505,057 |
Net investment income | 29,954,224 |
Realized and Unrealized Gain (Loss) on Investments: | |
Net realized gain on investments (including net realized loss of $(445,983) on sales of investments in affiliated holdings*) | 16,158,646 |
Realized gain distribution from affiliated investment company shares | 1,764 |
Net change in unrealized appreciation of investments (including net change in unrealized depreciation of $205,830 on investments in affiliated holdings*) | (30,524,271) |
Net realized and unrealized gain (loss) on investments | (14,363,861) |
Change in net assets resulting from operations | $15,590,363 |
* | See information listed after the Fund’s Portfolio of Investments. |
Year Ended February 28 | 2022 | 2021 |
Increase (Decrease) in Net Assets | ||
Operations: | ||
Net investment income | $29,954,224 | $28,660,269 |
Net realized gain (loss) | 16,160,410 | (7,811,476) |
Net change in unrealized appreciation/depreciation | (30,524,271) | 47,186,053 |
CHANGE IN NET ASSETS RESULTING FROM OPERATIONS | 15,590,363 | 68,034,846 |
Distributions to Shareholders: | ||
Class A Shares | (1,082,112) | (1,025,739) |
Class C Shares | (1,116,102) | (1,055,996) |
Institutional Shares | (16,017,178) | (13,988,733) |
Service Shares | (13,895,900) | (13,730,263) |
Class R6 Shares | (311,755) | (253,083) |
CHANGE IN NET ASSETS RESULTING FROM DISTRIBUTIONS TO SHAREHOLDERS | (32,423,047) | (30,053,814) |
Share Transactions: | ||
Proceeds from sale of shares | 255,573,790 | 175,878,656 |
Net asset value of shares issued to shareholders in payment of distributions declared | 31,741,601 | 29,332,888 |
Cost of shares redeemed | (251,508,087) | (270,520,158) |
CHANGE IN NET ASSETS RESULTING FROM SHARE TRANSACTIONS | 35,807,304 | (65,308,614) |
Change in net assets | 18,974,620 | (27,327,582) |
Net Assets: | ||
Beginning of period | 691,473,290 | 718,800,872 |
End of period | $710,447,910 | $691,473,290 |
Transfer Agent Fees Incurred | Transfer Agent Fees Reimbursed | |
Class A Shares | $21,878 | $(16,305) |
Class C Shares | 26,399 | — |
Institutional Shares | 379,751 | (300,801) |
Service Shares | 349,424 | (272,379) |
Class R6 Shares | 843 | — |
TOTAL | $778,295 | $(589,485) |
Other Service Fees Incurred | |
Class A Shares | $62,221 |
Class C Shares | 77,664 |
Service Shares | 796,455 |
TOTAL | $936,340 |
Year Ended 2/28/2022 | Year Ended 2/28/2021 | |||
Class A Shares: | Shares | Amount | Shares | Amount |
Shares sold | 956,763 | $6,771,394 | 501,898 | $3,223,296 |
Shares issued to shareholders in payment of distributions declared | 152,134 | 1,077,122 | 160,321 | 1,022,915 |
Shares redeemed | (619,733) | (4,375,310) | (1,277,325) | (7,981,359) |
NET CHANGE RESULTING FROM CLASS A SHARE TRANSACTIONS | 489,164 | $3,473,206 | (615,106) | $(3,735,148) |
Year Ended 2/28/2022 | Year Ended 2/28/2021 | |||
Class C Shares: | Shares | Amount | Shares | Amount |
Shares sold | 1,130,105 | $7,999,761 | 560,584 | $3,590,948 |
Shares issued to shareholders in payment of distributions declared | 156,205 | 1,106,869 | 164,031 | 1,046,719 |
Shares redeemed | (1,155,615) | (8,102,772) | (1,324,995) | (8,378,031) |
NET CHANGE RESULTING FROM CLASS C SHARE TRANSACTIONS | 130,695 | $1,003,858 | (600,380) | $(3,740,364) |
Year Ended 2/28/2022 | Year Ended 2/28/2021 | |||
Institutional Shares: | Shares | Amount | Shares | Amount |
Shares sold | 23,793,005 | $167,331,264 | 15,914,533 | $101,514,559 |
Shares issued to shareholders in payment of distributions declared | 2,252,084 | 15,887,954 | 2,169,181 | 13,829,970 |
Shares redeemed | (19,257,181) | (135,435,068) | (23,153,409) | (143,727,667) |
NET CHANGE RESULTING FROM INSTITUTIONAL SHARE TRANSACTIONS | 6,787,908 | $47,784,150 | (5,069,695) | $(28,383,138) |
Year Ended 2/28/2022 | Year Ended 2/28/2021 | |||
Service Shares: | Shares | Amount | Shares | Amount |
Shares sold | 8,864,915 | $62,685,087 | 10,200,008 | $66,145,393 |
Shares issued to shareholders in payment of distributions declared | 1,892,535 | 13,369,213 | 2,066,209 | 13,185,332 |
Shares redeemed | (14,276,279) | (100,382,282) | (16,690,223) | (104,110,313) |
NET CHANGE RESULTING FROM SERVICE SHARE TRANSACTIONS | (3,518,829) | $(24,327,982) | (4,424,006) | $(24,779,588) |
Year Ended 2/28/2022 | Year Ended 2/28/2021 | |||
Class R6 Shares: | Shares | Amount | Shares | Amount |
Shares sold | 1,522,387 | $10,786,284 | 211,846 | $1,404,460 |
Shares issued to shareholders in payment of distributions declared | 42,715 | 300,443 | 39,542 | 247,952 |
Shares redeemed | (455,672) | (3,212,655) | (1,029,659) | (6,322,788) |
NET CHANGE RESULTING FROM CLASS R6 SHARE TRANSACTIONS | 1,109,430 | $7,874,072 | (778,271) | $(4,670,376) |
NET CHANGE RESULTING FROM TOTAL FUND SHARE TRANSACTIONS | 4,998,368 | $35,807,304 | (11,487,458) | $(65,308,614) |
Increase (Decrease) | |
Paid-In Capital | Total Distributable Earnings (Loss) |
$(6,386) | $6,386 |
2022 | 2021 | |
Ordinary income1 | $32,423,047 | $30,053,814 |
1 | For tax purposes, short-term capital gain distributions are considered ordinary income distributions. |
Undistributed ordinary income | $3,145,353 |
Net unrealized depreciation | $(13,462,407) |
Administrative Fee | Average Daily Net Assets of the Investment Complex |
0.100% | on assets up to $50 billion |
0.075% | on assets over $50 billion |
Percentage of Average Daily Net Assets of Class | |
Class A Shares | 0.05% |
Class C Shares | 0.75% |
Distribution Services Fees Incurred | |
Class C Shares | $236,024 |
Purchases | $270,860,518 |
Sales | $242,979,426 |
April 22, 2022
Beginning Account Value 9/1/2021 | Ending Account Value 2/28/2022 | Expenses Paid During Period1 | |
Actual: | |||
Class A Shares | $1,000 | $972.60 | $4.74 |
Class C Shares | $1,000 | $968.70 | $8.69 |
Institutional Shares | $1,000 | $975.10 | $3.53 |
Service Shares | $1,000 | $972.50 | $4.74 |
Class R6 Shares | $1,000 | $975.20 | $3.48 |
Hypothetical (assuming a 5% return before expenses): | |||
Class A Shares | $1,000 | $1,019.98 | $4.86 |
Class C Shares | $1,000 | $1,015.97 | $8.90 |
Institutional Shares | $1,000 | $1,021.22 | $3.61 |
Service Shares | $1,000 | $1,019.98 | $4.86 |
Class R6 Shares | $1,000 | $1,021.27 | $3.56 |
1 | Expenses are equal to the Fund’s annualized net expense ratios, multiplied by the average account value over the period, multiplied by 181/365 (to reflect the one-half-year period). The annualized net expense ratios are as follows: |
Class A Shares | 0.97% |
Class C Shares | 1.78% |
Institutional Shares | 0.72% |
Service Shares | 0.97% |
Class R6 Shares | 0.71% |
Name Birth Date Positions Held with Fund Date Service Began | Principal Occupation(s) for Past Five Years, Other Directorships Held and Previous Position(s) |
J. Christopher Donahue* Birth Date: April 11, 1949 President and Trustee Indefinite Term Began serving: April 1999 | Principal Occupations: Principal Executive Officer and President of certain of the Funds in the Federated Hermes Fund Family; Director or Trustee of the Funds in the Federated Hermes Fund Family; President, Chief Executive Officer and Director, Federated Hermes, Inc.; Chairman and Trustee, Federated Investment Management Company; Trustee, Federated Investment Counseling; Chairman and Director, Federated Global Investment Management Corp.; Chairman and Trustee, Federated Equity Management Company of Pennsylvania; Trustee, Federated Shareholder Services Company; Director, Federated Services Company. Previous Positions: President, Federated Investment Counseling; President and Chief Executive Officer, Federated Investment Management Company, Federated Global Investment Management Corp. and Passport Research, Ltd; Chairman, Passport Research, Ltd. |
Name Birth Date Positions Held with Fund Date Service Began | Principal Occupation(s) for Past Five Years, Other Directorships Held and Previous Position(s) |
John B. Fisher* Birth Date: May 16, 1956 Trustee Indefinite Term Began serving: May 2016 | Principal Occupations: Principal Executive Officer and President of certain of the Funds in the Federated Hermes Fund Family; Director or Trustee of certain of the Funds in the Federated Hermes Fund Family; Vice President, Federated Hermes, Inc.; President, Director/Trustee and CEO, Federated Advisory Services Company, Federated Equity Management Company of Pennsylvania, Federated Global Investment Management Corp., Federated Investment Counseling, Federated Investment Management Company; President of some of the Funds in the Federated Hermes Fund Family and Director, Federated Investors Trust Company. Previous Positions: President and Director of the Institutional Sales Division of Federated Securities Corp.; President and Director of Federated Investment Counseling; President and CEO of Passport Research, Ltd.; Director, Edgewood Securities Corp.; Director, Federated Services Company; Director, Federated Hermes, Inc.; Chairman and Director, Southpointe Distribution Services, Inc. and President, Technology, Federated Services Company. |
Name Birth Date Positions Held with Fund Date Service Began | Principal Occupation(s) for Past Five Years, Other Directorships Held, Previous Position(s) and Qualifications |
John T. Collins Birth Date: January 24, 1947 Trustee Indefinite Term Began serving: October 2013 | Principal Occupations: Director or Trustee, and Chair of the Board of Directors or Trustees, of the Federated Hermes Fund Family; formerly, Chairman and CEO, The Collins Group, Inc. (a private equity firm) (Retired). Other Directorships Held: Director, KLX Energy Services Holdings, Inc. (oilfield services); former Director of KLX Corp. (aerospace). Qualifications: Mr. Collins has served in several business and financial management roles and directorship positions throughout his career. Mr. Collins previously served as Chairman and CEO of The Collins Group, Inc. (a private equity firm) and as a Director of KLX Corp. Mr. Collins serves as Chairman Emeriti, Bentley University. Mr. Collins previously served as Director and Audit Committee Member, Bank of America Corp.; Director, FleetBoston Financial Corp.; and Director, Beth Israel Deaconess Medical Center (Harvard University Affiliate Hospital). |
Name Birth Date Positions Held with Fund Date Service Began | Principal Occupation(s) for Past Five Years, Other Directorships Held, Previous Position(s) and Qualifications |
G. Thomas Hough Birth Date: February 28, 1955 Trustee Indefinite Term Began serving: August 2015 | Principal Occupations: Director or Trustee, Chair of the Audit Committee of the Federated Hermes Fund Family; formerly, Vice Chair, Ernst & Young LLP (public accounting firm) (Retired). Other Directorships Held: Director, Chair of the Audit Committee, Equifax, Inc.; Lead Director, Member of the Audit and Nominating and Corporate Governance Committees, Haverty Furniture Companies, Inc.; formerly, Director, Member of Governance and Compensation Committees, Publix Super Markets, Inc. Qualifications: Mr. Hough has served in accounting, business management and directorship positions throughout his career. Mr. Hough most recently held the position of Americas Vice Chair of Assurance with Ernst & Young LLP (public accounting firm). Mr. Hough serves on the President’s Cabinet and Business School Board of Visitors for the University of Alabama. Mr. Hough previously served on the Business School Board of Visitors for Wake Forest University, and he previously served as an Executive Committee member of the United States Golf Association. |
Maureen Lally-Green Birth Date: July 5, 1949 Trustee Indefinite Term Began serving: August 2009 | Principal Occupations: Director or Trustee of the Federated Hermes Fund Family; Adjunct Professor Emerita of Law, Duquesne University School of Law; formerly, Dean of the Duquesne University School of Law and Professor of Law and Interim Dean of the Duquesne University School of Law; formerly, Associate General Secretary and Director, Office of Church Relations, Diocese of Pittsburgh. Other Directorships Held: Director, CNX Resources Corporation (formerly known as CONSOL Energy Inc.). Qualifications: Judge Lally-Green has served in various legal and business roles and directorship positions throughout her career. Judge Lally-Green previously held the position of Dean of the School of Law of Duquesne University (as well as Interim Dean). Judge Lally-Green previously served as a member of the Superior Court of Pennsylvania and as a Professor of Law, Duquesne University School of Law. Judge Lally-Green was appointed by the Supreme Court of Pennsylvania to serve on the Supreme Court’s Board of Continuing Judicial Education and the Supreme Court’s Appellate Court Procedural Rules Committee. Judge Lally-Green also currently holds the positions on not for profit or for profit boards of directors as follows: Director and Chair, UPMC Mercy Hospital; Regent, Saint Vincent Seminary; Member, Pennsylvania State Board of Education (public); Director, Catholic Charities, Pittsburgh; and Director CNX Resources Corporation (formerly known as CONSOL Energy Inc.). Judge Lally-Green has held the positions of: Director, Auberle; Director, Epilepsy Foundation of Western and Central Pennsylvania; Director, Ireland Institute of Pittsburgh; Director, Saint Thomas More Society; Director and Chair, Catholic High Schools of the Diocese of Pittsburgh, Inc.; Director, Pennsylvania Bar Institute; Director, St. Vincent College; Director and Chair, North Catholic High School, Inc.; Director and Vice Chair, Our Campaign for the Church Alive!, Inc.; and Director, Saint Francis University. |
Name Birth Date Positions Held with Fund Date Service Began | Principal Occupation(s) for Past Five Years, Other Directorships Held, Previous Position(s) and Qualifications |
Thomas M. O’Neill Birth Date: June 14, 1951 Trustee Indefinite Term Began serving: August 2006 | Principal Occupations: Director or Trustee of the Federated Hermes Fund Family; Sole Proprietor, Navigator Management Company (investment and strategic consulting). Other Directorships Held: None. Qualifications: Mr. O’Neill has served in several business, mutual fund and financial management roles and directorship positions throughout his career. Mr. O’Neill serves as Director, Medicines for Humanity. Mr. O’Neill previously served as Chief Executive Officer and President, Managing Director and Chief Investment Officer, Fleet Investment Advisors; President and Chief Executive Officer, Aeltus Investment Management, Inc.; General Partner, Hellman, Jordan Management Co., Boston, MA; Chief Investment Officer, The Putnam Companies, Boston, MA; Credit Analyst and Lending Officer, Fleet Bank; Director and Consultant, EZE Castle Software (investment order management software); Director, The Golisano Children’s Museum of Naples, Florida; and Director, Midway Pacific (lumber). |
Madelyn A. Reilly Birth Date: February 2, 1956 Trustee Indefinite Term Began serving: November 2020 | Principal Occupations: Director or Trustee of the Federated Hermes Fund Family; formerly, Senior Vice President for Legal Affairs, General Counsel and Secretary to the Board of Directors, Duquesne University. Other Directorships Held: None. Qualifications: Ms. Reilly has served in various business and legal management roles throughout her career. Ms. Reilly previously served as Senior Vice President for Legal Affairs, General Counsel and Secretary to the Board of Directors and Assistant General Counsel and Director of Risk Management, Duquesne University. Prior to her work at Duquesne University, Ms. Reilly served as Assistant General Counsel of Compliance and Enterprise Risk as well as Senior Counsel of Environment, Health and Safety, PPG Industries. |
P. Jerome Richey Birth Date: February 23, 1949 Trustee Indefinite Term Began serving: October 2013 | Principal Occupations: Director or Trustee of the Federated Hermes Fund Family; Management Consultant; Retired; formerly, Senior Vice Chancellor and Chief Legal Officer, University of Pittsburgh and Executive Vice President and Chief Legal Officer, CONSOL Energy Inc. (now split into two separate publicly traded companies known as CONSOL Energy Inc. and CNX Resources Corp.). Other Directorships Held: None. Qualifications: Mr. Richey has served in several business and legal management roles and directorship positions throughout his career. Mr. Richey most recently held the positions of Senior Vice Chancellor and Chief Legal Officer, University of Pittsburgh. Mr. Richey previously served as Chairman of the Board, Epilepsy Foundation of Western Pennsylvania and Chairman of the Board, World Affairs Council of Pittsburgh. Mr. Richey previously served as Chief Legal Officer and Executive Vice President, CONSOL Energy Inc. and CNX Gas Company; and Board Member, Ethics Counsel and Shareholder, Buchanan Ingersoll & Rooney PC (a law firm). |
Name Birth Date Positions Held with Fund Date Service Began | Principal Occupation(s) for Past Five Years, Other Directorships Held, Previous Position(s) and Qualifications |
John S. Walsh Birth Date: November 28, 1957 Trustee Indefinite Term Began serving: April 1999 | Principal Occupations: Director or Trustee of the Federated Hermes Fund Family; President and Director, Heat Wagon, Inc. (manufacturer of construction temporary heaters); President and Director, Manufacturers Products, Inc. (distributor of portable construction heaters); President, Portable Heater Parts, a division of Manufacturers Products, Inc. Other Directorships Held: None. Qualifications: Mr. Walsh has served in several business management roles and directorship positions throughout his career. Mr. Walsh previously served as Vice President, Walsh & Kelly, Inc. (paving contractors). |
Name Birth Date Positions Held with Fund Date Service Began | Principal Occupation(s) for Past Five Years and Previous Position(s) |
Lori A. Hensler Birth Date: January 6, 1967 TREASURER Officer since: April 2013 | Principal Occupations: Principal Financial Officer and Treasurer of the Federated Hermes Fund Family; Senior Vice President, Federated Administrative Services; Financial and Operations Principal for Federated Securities Corp.; and Assistant Treasurer, Federated Investors Trust Company. Ms. Hensler has received the Certified Public Accountant designation. Previous Positions: Controller of Federated Hermes, Inc.; Senior Vice President and Assistant Treasurer, Federated Investors Management Company; Treasurer, Federated Investors Trust Company; Assistant Treasurer, Federated Administrative Services, Federated Administrative Services, Inc., Federated Securities Corp., Edgewood Services, Inc., Federated Advisory Services Company, Federated Equity Management Company of Pennsylvania, Federated Global Investment Management Corp., Federated Investment Counseling, Federated Investment Management Company, Passport Research, Ltd., and Federated MDTA, LLC; Financial and Operations Principal for Federated Securities Corp., Edgewood Services, Inc. and Southpointe Distribution Services, Inc. |
Name Birth Date Positions Held with Fund Date Service Began | Principal Occupation(s) for Past Five Years and Previous Position(s) |
Peter J. Germain Birth Date: September 3, 1959 CHIEF LEGAL OFFICER, SECRETARY and EXECUTIVE VICE PRESIDENT Officer since: January 2005 | Principal Occupations: Mr. Germain is Chief Legal Officer, Secretary and Executive Vice President of the Federated Hermes Fund Family. He is General Counsel, Chief Legal Officer, Secretary and Executive Vice President, Federated Hermes, Inc.; Trustee and Senior Vice President, Federated Investors Management Company; Trustee and President, Federated Administrative Services; Director and President, Federated Administrative Services, Inc.; Director and Vice President, Federated Securities Corp.; Director and Secretary, Federated Private Asset Management, Inc.; Secretary, Federated Shareholder Services Company; and Secretary, Retirement Plan Service Company of America. Mr. Germain joined Federated Hermes, Inc. in 1984 and is a member of the Pennsylvania Bar Association. Previous Positions: Deputy General Counsel, Special Counsel, Managing Director of Mutual Fund Services, Federated Hermes, Inc.; Senior Vice President, Federated Services Company; and Senior Corporate Counsel, Federated Hermes, Inc. |
Stephen Van Meter Birth Date: June 5, 1975 CHIEF COMPLIANCE OFFICER AND SENIOR VICE PRESIDENT Officer since: July 2015 | Principal Occupations: Senior Vice President and Chief Compliance Officer of the Federated Hermes Fund Family; Vice President and Chief Compliance Officer of Federated Hermes, Inc. and Chief Compliance Officer of certain of its subsidiaries. Mr. Van Meter joined Federated Hermes, Inc. in October 2011. He holds FINRA licenses under Series 3, 7, 24 and 66. Previous Positions: Mr. Van Meter previously held the position of Compliance Operating Officer, Federated Hermes, Inc. Prior to joining Federated Hermes, Inc., Mr. Van Meter served at the United States Securities and Exchange Commission in the positions of Senior Counsel, Office of Chief Counsel, Division of Investment Management and Senior Counsel, Division of Enforcement. |
Robert J. Ostrowski Birth Date: April 26, 1963 Chief Investment Officer Officer since: May 2004 | Principal Occupations: Robert J. Ostrowski joined Federated Hermes, Inc. in 1987 as an Investment Analyst and became a Portfolio Manager in 1990. He was named Chief Investment Officer of Federated Hermes’ taxable fixed-income products in 2004 and also serves as a Senior Portfolio Manager. Mr. Ostrowski became an Executive Vice President of the Fund’s Adviser in 2009 and served as a Senior Vice President of the Fund’s Adviser from 1997 to 2009. Mr. Ostrowski has received the Chartered Financial Analyst designation. He received his M.S. in Industrial Administration from Carnegie Mellon University. |
Annual Evaluation of Adequacy and Effectiveness


Federated Hermes Funds
4000 Ericsson Drive
Warrendale, PA 15086-7561
or call 1-800-341-7400.
CUSIP 314197401
CUSIP 314197203
CUSIP 314197104
CUSIP 314197807

| Item 2. | Code of Ethics |
(a) As of the end of the period covered by this report, the registrant has adopted a code of ethics (the "Section 406 Standards for Investment Companies - Ethical Standards for Principal Executive and Financial Officers") that applies to the registrant's Principal Executive Officer and Principal Financial Officer; the registrant's Principal Financial Officer also serves as the Principal Accounting Officer.
(c) There was no amendment to the registrant’s code of ethics described in Item 2(a) above during the period covered by the report.
(d) There was no waiver granted, either actual or implicit, from a provision to the registrant’s code of ethics described in Item 2(a) above during the period covered by the report.
(e) Not Applicable
(f)(3) The registrant hereby undertakes to provide any person, without charge, upon request, a copy of the code of ethics. To request a copy of the code of ethics, contact the registrant at 1-800-341-7400, and ask for a copy of the Section 406 Standards for Investment Companies - Ethical Standards for Principal Executive and Financial Officers.
Item 3. Audit Committee Financial Expert
The registrant's Board has determined that each of the following members of the Board's Audit Committee is an “audit committee financial expert,” and is "independent," for purposes of this Item: G. Thomas Hough and Thomas M. O'Neill.
| Item 4. | Principal Accountant Fees and Services |
(a) Audit Fees billed to the registrant for the two most recent fiscal years:
Fiscal year ended 2022 – $32,900
Fiscal year ended 2021 - $29,900
(b) Audit-Related Fees billed to the registrant for the two most recent fiscal years:
Fiscal year ended 2022 - $0
Fiscal year ended 2021 - $0
Amount requiring approval of the registrant’s Audit Committee pursuant to paragraph (c)(7)(ii) of Rule 2-01 of Regulation S-X, $0 and $0 respectively.
(c) Tax Fees billed to the registrant for the two most recent fiscal years:
Fiscal year ended 2022 - $0
Fiscal year ended 2021 - $0
Amount requiring approval of the registrant’s Audit Committee pursuant to paragraph (c)(7)(ii) of Rule 2-01 of Regulation S-X, $0 and $0 respectively.
(d) All Other Fees billed to the registrant for the two most recent fiscal years:
Fiscal year ended 2022 - $0
Fiscal year ended 2021 - $0
Amount requiring approval of the registrant’s Audit Committee pursuant to paragraph (c)(7)(ii) of Rule 2-01 of Regulation S-X, $59,592 and $42,488 respectively. Fiscal year ended 2022- Service fees for analysis of potential Passive Foreign Investment Company holdings. Fiscal year ended 2021- Service fees for analysis of potential Passive Foreign Investment Company holdings.
(e)(1) Audit Committee Policies regarding Pre-approval of Services.
The Audit Committee is required to pre-approve audit and non-audit services performed by the independent auditor in order to assure that the provision of such services do not impair the auditor’s independence. Unless a type of service to be provided by the independent auditor has received general pre-approval, it will require specific pre-approval by the Audit Committee. Any proposed services exceeding pre-approved cost levels will require specific pre-approval by the Audit Committee.
Certain services have the general pre-approval of the Audit Committee. The term of the general pre-approval is 12 months from the date of pre-approval, unless the Audit Committee specifically provides for a different period. The Audit Committee will annually review the services that may be provided by the independent auditor without obtaining specific pre-approval from the Audit Committee and may grant general pre-approval for such services. The Audit Committee will revise the list of general pre-approved services from time to time, based on subsequent determinations. The Audit Committee will not delegate to management its responsibilities to pre-approve services performed by the independent auditor.
The Audit Committee has delegated pre-approval authority to its chairman (the “Chairman”) for services that do not exceed a specified dollar threshold. The Chairman or Chief Audit Executive will report any such pre-approval decisions to the Audit Committee at its next scheduled meeting. The Committee will designate another member with such pre-approval authority when the Chairman is unavailable.
AUDIT SERVICES
The annual audit services engagement terms and fees will be subject to the specific pre-approval of the Audit Committee. The Audit Committee will approve, if necessary, any changes in terms, conditions and fees resulting from changes in audit scope, registered investment company (RIC) structure or other matters.
In addition to the annual audit services engagement specifically approved by the Audit Committee, the Audit Committee may grant general pre-approval for other audit services, which are those services that only the independent auditor reasonably can provide. The Audit Committee has pre-approved certain audit services; with limited exception, all other audit services must be specifically pre-approved by the Audit Committee.
AUDIT-RELATED SERVICES
Audit-related services are assurance and related services that are reasonably related to the performance of the audit or review of the RIC’s financial statements or that are traditionally performed by the independent auditor. The Audit Committee believes that the provision of audit-related services does not impair the independence of the auditor, and has pre-approved certain audit-related services; all other audit-related services must be specifically pre-approved by the Audit Committee.
TAX SERVICES
The Audit Committee believes that the independent auditor can provide tax services to the RIC such as tax compliance, tax planning and tax advice without impairing the auditor’s independence. However, the Audit Committee will not permit the retention of the independent auditor in connection with a transaction initially recommended by the independent auditor, the purpose of which may be tax avoidance and the tax treatment of which may not be supported in the Internal Revenue Code and related regulations. The Audit Committee has pre-approved certain tax services; with limited exception, all tax services involving large and complex transactions must be specifically pre-approved by the Audit Committee.
ALL OTHER SERVICES
With respect to the provision of permissible services other than audit, review or attest services the pre-approval requirement is waived if:
| (1) | With respect to such services rendered to the Funds, the aggregate amount of all such services provided constitutes no more than five percent of the total amount of revenues paid by the audit client to its accountant during the fiscal year in which the services are provided; and, |
| (2) | With respect to such services rendered to the Fund’s investment adviser ( the “Adviser”)and any entity controlling, controlled by to under common control with the Adviser such as affiliated non-U.S. and U.S. funds not under the Audit Committee’s purview and which do not fall within a category of service which has been determined by the Audit Committee not to have a direct impact on the operations or financial reporting of the RIC, the aggregate amount of all services provided constitutes no more than five percent of the total amount of revenues paid to the RIC’s auditor by the RIC, its Adviser and any entity controlling, controlled by, or under common control with the Adviser during the fiscal year in which the services are provided; and |
| (3) | Such services were not recognized by the issuer or RIC at the time of the engagement to be non-audit services; and |
| (4) | Such services are promptly brought to the attention of the Audit Committee and approved prior to the completion of the audit by the Audit Committee or by one or more members of the Audit Committee who are members of the Board of Directors to whom authority to grant such approvals has been delegated by the Audit Committee. |
The Audit Committee may grant general pre-approval to those permissible non-audit services which qualify for pre-approval and which it believes are routine and recurring services, and would not impair the independence of the auditor.
The Securities and Exchange Commission’s (the “SEC”) rules and relevant guidance should be consulted to determine the precise definitions of these services and applicability of exceptions to certain of the prohibitions.
PRE-APPROVAL FEE LEVELS
Pre-approval fee levels for all services to be provided by the independent auditor will be established annually by the Audit Committee. Any proposed services exceeding these levels will require specific pre-approval by the Audit Committee.
PROCEDURES
Requests or applications to provide services that require specific approval by the Audit Committee will be submitted to the Audit Committee by the Fund’s Principal Accounting Officer and/or the Chief Audit Executive of Federated Hermes, Inc., only after those individuals have determined that the request or application is consistent with the SEC’s rules on auditor independence.
(e)(2) Percentage of services identified in items 4(b) through 4(d) that were approved by the registrant’s Audit Committee pursuant to paragraph (c)(7)(i)(C) of Rule 2-01 of Regulation S-X:
4(b)
Fiscal year ended 2022 – 0%
Fiscal year ended 2021 - 0%
Percentage of services provided to the registrant’s Adviser and any entity controlling, controlled by, or under common control with the Adviser that provides ongoing services to the registrant that were approved by the registrant’s Audit Committee pursuant to paragraph (c)(7)(i)(C) of Rule 2-01 of Regulation S-X, 0% and 0% respectively.
4(c)
Fiscal year ended 2022 – 0%
Fiscal year ended 2021 – 0%
Percentage of services provided to the registrant’s Adviser and any entity controlling, controlled by, or under common control with the Adviser that provides ongoing services to the registrant that were approved by the registrant’s Audit Committee pursuant to paragraph (c)(7)(i)(C) of Rule 2-01 of Regulation S-X, 0% and 0% respectively.
4(d)
Fiscal year ended 2022 – 0%
Fiscal year ended 2021 – 0%
Percentage of services provided to the registrant’s Adviser and any entity controlling, controlled by, or under common control with the Adviser that provides ongoing services to the registrant that were approved by the registrant’s Audit Committee pursuant to paragraph (c)(7)(i)(C) of Rule 2-01 of Regulation S-X, 0% and 0% respectively.
| (f) | NA |
| (g) | Non-Audit Fees billed to the registrant, the registrant’s Adviser, and certain entities controlling, controlled by or under common control with the Adviser: |
Fiscal year ended 2022 - $139,694
Fiscal year ended 2021 - $62,038
| (h) | The registrant’s Audit Committee has considered that the provision of non-audit services that were rendered to the registrant’s Adviser (not including any sub-adviser whose role is primarily portfolio management and is subcontracted with or overseen by another investment adviser), and any entity controlling, controlled by, or under common control with the Adviser that provides ongoing services to the registrant that were not pre-approved pursuant to paragraph (c)(7)(ii) of Rule 2-01 of Regulation S-X is compatible with maintaining the principal accountant’s independence. |
| Item 5. | Audit Committee of Listed Registrants |
Not Applicable
| Item 6. | Schedule of Investments |
(a) The registrant’s Schedule of Investments is included as part of the Report to Stockholders filed under Item 1 of this form.
(b) Not Applicable; Fund had no divestments during the reporting period covered since the previous Form N-CSR filing.
| Item 7. | Disclosure of Proxy Voting Policies and Procedures for Closed-End Management Investment Companies |
Not Applicable
| Item 8. | Portfolio Managers of Closed-End Management Investment Companies |
Not Applicable
| Item 9. | Purchases of Equity Securities by Closed-End Management Investment Company and Affiliated Purchasers |
Not Applicable
| Item 10. | Submission of Matters to a Vote of Security Holders |
No Changes to Report
| Item 11. | Controls and Procedures |
(a) The registrant’s President and Treasurer have concluded that the
registrant’s disclosure controls and procedures (as defined in rule 30a-3(c) under the Act) are effective in design and operation and are sufficient to form the basis of the certifications required by Rule 30a-(2) under the Act, based on their evaluation of these disclosure controls and procedures within 90 days of the filing date of this report on Form N-CSR.
(b) There were no changes in the registrant’s internal control over financial reporting (as defined in rule 30a-3(d) under the Act) during the period covered by this report that have materially affected, or are reasonably likely to materially affect, the registrant’s internal control over financial reporting.
| Item 12. | Disclosure of Securities Lending Activities for Closed-End Management Investment Companies |
Not Applicable
| Item 13. | Exhibits |
(a)(1) Code of Ethics- Not Applicable to this Report.
(a)(2) Certifications of Principal Executive Officer and Principal Financial Officer.
(a)(3) Not Applicable.
(b) Certifications pursuant to 18 U.S.C. Section 1350.
SIGNATURES
Pursuant to the requirements of the Securities Exchange Act of 1934 and the Investment Company Act of 1940, the registrant has duly caused this report to be signed on its behalf by the undersigned, thereunto duly authorized.
Registrant Federated Hermes High Yield Trust
By /S/ Lori A. Hensler
Lori A. Hensler, Principal Financial Officer
Date April 22, 2022
Pursuant to the requirements of the Securities Exchange Act of 1934 and the Investment Company Act of 1940, this report has been signed below by the following persons on behalf of the registrant and in the capacities and on the dates indicated.
By /S/ J. Christopher Donahue
J. Christopher Donahue, Principal Executive Officer
Date April 22, 2022
By /S/ Lori A. Hensler
Lori A. Hensler, Principal Financial Officer
Date April 22, 2022