                             United States
                       Securities and Exchange Commission
                             Washington, D.C. 20549

                                   Form N-CSR
                         Certified Shareholder Report of
                 Registered Management Investment Companies


                                    811-4017

                      (Investment Company Act File Number)


                             Federated Equity Funds
       ---------------------------------------------------------------

             (Exact Name of Registrant as Specified in Charter)


                            Federated Investors Funds
                              5800 Corporate Drive
                       Pittsburgh, Pennsylvania 15237-7000


                                 (412) 288-1900
                         (Registrant's Telephone Number)


                           John W. McGonigle, Esquire
                            Federated Investors Tower
                               1001 Liberty Avenue
                       Pittsburgh, Pennsylvania 15222-3779
                   (Name and Address of Agent for Service)
              (Notices should be sent to the Agent for Service)


                        Date of Fiscal Year End: 10/31/05


            Date of Reporting Period: Fiscal year ended 10/31/05


Item 1.     Reports to Stockholders
Federated
World-Class Investment Manager
Federated Capital Appreciation Fund
Established 1977
A Portfolio of Federated Equity Funds
29TH ANNUAL SHAREHOLDER REPORT
October 31, 2005
Class A Shares
Class B Shares
Class C Shares
Class K Shares
FINANCIAL HIGHLIGHTS
SHAREHOLDER EXPENSE EXAMPLE
MANAGEMENT'S DISCUSSION OF FUND PERFORMANCE
PORTFOLIO OF INVESTMENTS SUMMARY TABLE
PORTFOLIO OF INVESTMENTS
STATEMENT OF ASSETS AND LIABILITIES
STATEMENT OF OPERATIONS
STATEMENT OF CHANGES IN NET ASSETS
NOTES TO FINANCIAL STATEMENTS
REPORT OF INDEPENDENT REGISTERED
PUBLIC ACCOUNTING FIRM
BOARD OF TRUSTEES AND TRUST OFFICERS
BOARD REVIEW OF ADVISORY CONTRACT
VOTING PROXIES ON FUND PORTFOLIO SECURITIES
QUARTERLY PORTFOLIO SCHEDULE
Not FDIC Insured * May Lose Value * No Bank Guarantee
Financial Highlights-Class A Shares
(For a Share Outstanding Throughout Each Period)
Year Ended October 31
|
| 2005
|
|
| 2004
|
|
| 2003
|
|
| 2002
|
|
| 2001
|
|
Net Asset Value, Beginning of Period
| | $24.04 | | | $22.58 | | | $19.40 | | | $22.48 | | | $29.05 | |
Income From Investment Operations:
| | | | | | | | | | | | | | | |
Net investment income
| | 0.26 | | | 0.11 | 1 | | 0.09 | | | 0.13 | 2 | | 0.17 | |
Net realized and unrealized gain (loss) on investments, futures contracts and options
|
| 0.99
|
|
| 1.46
|
|
| 3.17
|
|
| (3.04
| ) 2
|
| (4.97
| )
|
TOTAL FROM INVESTMENT OPERATIONS
|
| 1.25
|
|
| 1.57
|
|
| 3.26
|
|
| (2.91
| )
|
| (4.80
| )
|
Less Distributions:
| | | | | | | | | | | | | | | |
Distributions from net investment income
| | (0.21 | ) | | (0.11 | ) | | (0.08 | ) | | (0.17 | ) | | (0.08 | ) |
Distributions from net realized gain on investments
|
| (0.02
| )
|
| - --
|
|
| - --
|
|
| - --
|
|
| (1.69
| )
|
TOTAL DISTRIBUTIONS
|
| (0.23
| )
|
| (0.11
| )
|
| (0.08
| )
|
| (0.17
| )
|
| (1.77
| )
|
Net Asset Value, End of Period
|
| $25.06
|
|
| $24.04
|
|
| $22.58
|
|
| $19.40
|
|
| $22.48
|
|
Total Return 3
|
| 5.22
| % 4,5
|
| 6.97
| % 4
|
| 16.89
| %
|
| (13.10
| )%
|
| (17.25
| )%
|
| | | | | | | | | | | | | | | |
Ratios to Average Net Assets:
|
|
|
|
|
|
|
|
|
|
|
|
|
|
|
|
Net expenses
|
| 1.22
| % 6
|
| 1.25
| % 6
|
| 1.27
| % 6
|
| 1.23
| % 6
|
| 1.23
| %
|
Net investment income
|
| 0.98
| %
|
| 0.46
| %
|
| 0.62
| %
|
| 0.76
| % 2
|
| 0.80
| %
|
Expense waiver/reimbursement 7
|
| 0.02
| %
|
| 0.00
| % 8
|
| 0.00
| % 8
|
| 0.00
| % 8
|
| 0.00
| % 8
|
Supplemental Data:
|
|
|
|
|
|
|
|
|
|
|
|
|
|
|
|
Net assets, end of period (000 omitted)
|
| $2,225,781
|
| $2,605,203
|
| $2,179,111
|
| $1,337,564
|
| $699,510
|
|
Portfolio turnover
|
| 43
| %
|
| 45
| %
|
| 40
| %
|
| 71
| %
|
| 61
| %
|
1 Based on average shares outstanding.
2 Effective November 1, 2001, the Fund adopted the provisions of the American Institute of Certified Public Accountants (AICPA) Audit and Accounting Guide for Investment Companies and began accreting discount/amortizing premium on long-term debt securities. For the year ended October 31, 2002, this change had no effect on the net investment income per share, the net realized and unrealized gain /loss on investments per share or the ratio of net investment income to average net assets. Per share, ratios and supplemental data for periods prior to November 1, 2001 have not been restated to reflect this change in presentation.
3 Based on net asset value, which does not reflect the sales charge, redemption fee, or contingent deferred sales charge, if applicable. Total returns for periods of less than one year are not annualized.
4 During the year ended October 31, 2005, and the year ended October 31, 2004, the Fund was reimbursed by the Adviser, which had an impact of less than 0.01% on the total return. (See Notes to Financial Statements, Note 5.)
5 During the year ended October 31, 2005, the Fund's Class A Shares were reimbursed by the shareholder services provider, which had an impact of less than 0.01% on the total return. (See Note to Financial Statements, Note 5.)
6 The net expense ratio is calculated without reduction for fees paid indirectly for directed brokerage arrangements. The impact to the net expense ratio was 0.01% for the year ended October 31, 2005, and less than 0.01% for the years ended October 31, 2004, October 31, 2003, and October 31, 2002, respectively, after taking into account these expense reductions.
7 This expense decrease is reflected in both the net expense and the net investment income ratios shown above.
8 Represents less than 0.01%.
See Notes which are an integral part of the Financial Statements
Financial Highlights-Class B Shares
(For a Share Outstanding Throughout Each Period)
Year Ended October 31
|
| 2005
|
|
| 2004
|
|
| 2003
|
|
| 2002
|
|
| 2001
|
|
Net Asset Value, Beginning of Period
| | $23.34 | | | $21.98 | | | $18.95 | | | $21.99 | | | $28.58 | |
Income From Investment Operations:
| | | | | | | | | | | | | | | |
Net investment income (loss)
| | 0.02 | | | (0.06 | ) 1 | | (0.02 | ) | | 0.03 | 2 | | 0.04 | |
Net realized and unrealized gain (loss) on investments, futures contracts and options
|
| 1.00
|
|
| 1.42
|
|
| 3.05
|
|
| (3.05
| ) 2
|
| (4.94
| )
|
TOTAL FROM INVESTMENT OPERATIONS
|
| 1.02
|
|
| 1.36
|
|
| 3.03
|
|
| (3.02
| )
|
| (4.90
| )
|
Less Distributions:
| | | | | | | | | | | | | | | |
Distributions from net investment income
| | (0.04 | ) | | - -- | | | - -- | | | (0.02 | ) | | - -- | |
Distributions from net realized gain on investments
|
| (0.02
| )
|
| - --
|
|
| - --
|
|
| - --
|
|
| (1.69
| )
|
TOTAL DISTRIBUTIONS
|
| (0.06
| )
|
| - --
|
|
| - --
|
|
| (0.02
| )
|
| (1.69
| )
|
Net Asset Value, End of Period
|
| $24.30
|
|
| $23.34
|
|
| $21.98
|
|
| $18.95
|
|
| $21.99
|
|
Total Return 3
|
| 4.37
| % 4
|
| 6.19
| % 4
|
| 15.99
| %
|
| (13.76
| )%
|
| (17.88
| )%
|
| | | | | | | | | | | | | | | |
Ratios to Average Net Assets:
|
|
|
|
|
|
|
|
|
|
|
|
|
|
|
|
Net expenses
|
| 2.01
| % 5
|
| 1.98
| % 5
|
| 2.02
| % 5
|
| 1.98
| % 5
|
| 1.98
| %
|
Net investment income (loss)
|
| 0.19
| %
|
| (0.27)
| %
|
| (0.14)
| %
|
| 0.01
| % 2
|
| 0.06
| %
|
Expense waiver/reimbursement 6
|
| 0.00
| % 7
|
| 0.00
| % 7
|
| 0.00
| % 7
|
| 0.00
| % 7
|
| 0.00
| % 7
|
Supplemental Data:
|
|
|
|
|
|
|
|
|
|
|
|
|
|
|
|
Net assets, end of period (000 omitted)
|
| $507,271
|
| $569,518
|
| $528,029
|
| $378,336
|
| $299,814
|
|
Portfolio turnover
|
| 43
| %
|
| 45
| %
|
| 40
| %
|
| 71
| %
|
| 61
| %
|
1 Based on average shares outstanding.
2 Effective November 1, 2001, the Fund adopted the provisions of the AICPA Audit and Accounting Guide for Investment Companies and began accreting discount/amortizing premium on long-term debt securities. For the year ended October 31, 2002, this change had no effect on the net investment income per share, the net realized and unrealized gain/loss on investments per share or the ratio of net investment income to average net assets. Per share, ratios and supplemental data for periods prior to November 1, 2001 have not been restated to reflect this change in presentation.
3 Based on net asset value, which does not reflect the sales charge, redemption fee, or contingent deferred sales charge, if applicable. Total returns for periods of less than one year are not annualized.
4 During the year ended October 31, 2005, and the year ended October 31, 2004, the Fund was reimbursed by the Adviser, which had an impact of less than 0.01% on the total return. (See Notes to Financial Statements, Note 5.)
5 The net expense ratio is calculated without reduction for fees paid indirectly for directed brokerage arrangements. The impact to the net expense ratio was 0.01% for the year ended October 31, 2005, and less than 0.01% for the years ended October 31, 2004, October 31, 2003, and October 31, 2002, respectively, after taking into account these expense reductions.
6 This expense decrease is reflected in both the net expense and the net investment income (loss) ratios shown above.
7 Represents less than 0.01%.
See Notes which are an integral part of the Financial Statements
Financial Highlights-Class C Shares
(For a Share Outstanding Throughout Each Period)
Year Ended October 31
|
| 2005
|
|
| 2004
|
|
| 2003
|
|
| 2002
|
|
| 2001
|
|
Net Asset Value, Beginning of Period
| | $23.32 | | | $21.96 | | | $18.94 | | | $21.98 | | | $28.55 | |
Income From Investment Operations:
| | | | | | | | | | | | | | | |
Net investment income (loss)
| | 0.02 | | | (0.08 | ) 1 | | (0.02 | ) | | 0.04 | 2 | | 0.04 | |
Net realized and unrealized gain (loss) on investments, futures contracts and options
|
| 0.99
|
|
| 1.44
|
|
| 3.04
|
|
| (3.05
| ) 2
|
| (4.92
| )
|
TOTAL FROM INVESTMENT OPERATIONS
|
| 1.01
|
|
| 1.36
|
|
| 3.02
|
|
| (3.01
| )
|
| (4.88
| )
|
Less Distributions:
| | | | | | | | | | | | | | | |
Distributions from net investment income
| | (0.03 | ) | | - -- | | | - -- | | | (0.03 | ) | | - -- | |
Distributions from net realized gain on investments
|
| (0.02
| )
|
| - --
|
|
| - --
|
|
| - --
|
|
| (1.69
| )
|
TOTAL DISTRIBUTIONS
|
| (0.05
| )
|
| - --
|
|
| - --
|
|
| (0.03
| )
|
| (1.69
| )
|
Net Asset Value, End of Period
|
| $24.28
|
|
| $23.32
|
|
| $21.96
|
|
| $18.94
|
|
| $21.98
|
|
Total Return 3
|
| 4.35
| % 4
|
| 6.19
| % 4
|
| 15.95
| %
|
| (13.73
| )%
|
| (17.83
| )%
|
| | | | | | | | | | | | | | | |
Ratios to Average Net Assets:
|
|
|
|
|
|
|
|
|
|
|
|
|
|
|
|
Net expenses
|
| 2.02
| % 5
|
| 2.02
| % 5
|
| 2.02
| % 5
|
| 1.98
| % 5
|
| 1.98
| %
|
Net investment income (loss)
|
| 0.18
| %
|
| (0.31
| )%
|
| (0.13
| )%
|
| 0.01
| % 2
|
| 0.05
| %
|
Expense waiver/reimbursement 6
|
| 0.00
| % 7
|
| 0.00
| % 7
|
| 0.00
| % 7
|
| 0.00
| % 7
|
| 0.00
| % 7
|
Supplemental Data:
|
|
|
|
|
|
|
|
|
|
|
|
|
|
|
|
Net assets, end of period (000 omitted)
|
| $185,175
|
| $215,206
|
| $176,633
|
| $100,576
|
| $51,497
|
|
Portfolio turnover
|
| 43
| %
|
| 45
| %
|
| 40
| %
|
| 71
| %
|
| 61
| %
|
1 Based on average shares outstanding.
2 Effective November 1, 2001, the Fund adopted the provisions of the AICPA Audit and Accounting Guide for Investment Companies and began accreting discount/amortizing premium on long-term debt securities. For the year ended October 31, 2002, this change had no effect on the net investment income per share, the net realized and unrealized gain/loss on investments per share or the ratio of net investment income to average net assets. Per share, ratios and supplemental data for periods prior to November 1, 2001 have not been restated to reflect this change in presentation.
3 Based on net asset value, which does not reflect the sales charge, redemption fee, or contingent deferred sales charge, if applicable. Total returns for periods of less than one year are not annualized.
4 During the year ended October 31, 2005, and the year ended October 31, 2004, the Fund was reimbursed by the Adviser, which had an impact of less than 0.01% and 0.04%, respectively, on the total return. (See Notes to Financial Statements, Note 5.)
5 The net expense ratio is calculated without reduction for fees paid indirectly for directed brokerage arrangements. The impact to the net expense ratio was 0.01% for the year ended October 31, 2005, and less than 0.01% for the years ended October 31, 2004, October 31, 2003, and October 31, 2002, respectively, after taking into account these expense reductions.
6 This expense decrease is reflected in both the net expense and the net investment income (loss) ratios shown above.
7 Represents less than 0.01%.
See Notes which are an integral part of the Financial Statements
Financial Highlights-Class K Shares
(For a Share Outstanding Throughout Each Period)
Year Ended October 31
|
| 2005
|
|
| 2004
|
|
| 2003
| 1
|
Net Asset Value, Beginning of Period
| | $23.87 | | | $22.54 | | | $19.13 | |
Income From Investment Operations:
| | | | | | | | | |
Net investment income
| | 0.09 | | | 0.01 | 2 | | 0.03 | |
Net realized and unrealized gain on investments, futures contracts and options
|
| 1.04
|
|
| 1.45
|
|
| 3.38
|
|
TOTAL FROM INVESTMENT OPERATIONS
|
| 1.13
|
|
| 1.46
|
|
| 3.41
|
|
Less Distributions:
| | | | | | | | | |
Distributions from net investment income
| | (0.04 | ) | | (0.13 | ) | | - -- | |
Distributions from net realized gain on investments
|
| (0.02
| )
|
| - --
|
|
| - --
|
|
TOTAL DISTRIBUTIONS
|
| (0.06
| )
|
| (0.13
| )
|
| - --
|
|
Net Asset Value, End of Period
|
| $24.94
|
|
| $23.87
|
|
| $22.54
|
|
Total Return 3
|
| 4.73
| % 4
|
| 6.49
| % 4
|
| 17.83
| %
|
| | | | | | | | | |
Ratios to Average Net Assets:
|
|
|
|
|
|
|
|
|
|
Net expenses
|
| 1.67
| % 5
|
| 1.69
| % 5
|
| 1.74
| % 5,6
|
Net investment income
|
| 0.46
| %
|
| 0.03
| %
|
| 0.15
| % 6
|
Expense waiver/reimbursement 7
|
| 0.00
| % 8
|
| 0.00
| % 8
|
| 0.00
| % 6,8
|
Supplemental Data:
|
|
|
|
|
|
|
|
|
|
Net assets, end of period (000 omitted)
|
| $7,389
|
| $9,345
|
| $15,533
|
|
Portfolio turnover
|
| 43
| %
|
| 45
| %
|
| 40
| % 9
|
1 Reflects operations for the period from April 8, 2003 (date of initial public investment) to October 31, 2003.
2 Based on average shares outstanding.
3 Based on net asset value, which does not reflect the sales charge, redemption fee or contingent deferred sales charge, if applicable. Total returns for periods of less than one year are not annualized.
4 During the year ended October 31, 2005, and the year ended October 31, 2004, the Fund was reimbursed by the Adviser, which had an impact of less than 0.01% on the total return. (See Notes to Financial Statements, Note 5.)
5 The net expense ratio is calculated without reduction for fees paid indirectly for directed brokerage arrangements. The impact to the net expense ratio was 0.01% for the year ended October 31, 2005, and less than 0.01% for the year ended October 31, 2004 and the period ended October 31, 2003, respectively, after taking into account these expense reductions.
6 Computed on an annualized basis.
7 This expense decrease is reflected in both the net expense and net investment income ratios shown above.
8 Represents less than 0.01%.
9 Portfolio turnover is calculated at the Fund level. Percentage indicated was calculated for the entire fiscal year ended October 31, 2003.
See Notes which are an integral part of the Financial Statements
Shareholder Expense Example
As a shareholder of the Fund, you incur two types of costs: (1) transaction costs, including sales charges (loads) on purchase or redemption payments; and (2) ongoing costs, including management fees; to the extent applicable, distribution (12b-1) fees and/or shareholder services fees; and other Fund expenses. This Example is intended to help you to understand your ongoing costs (in dollars) of investing in the Fund and to compare these costs with the ongoing costs of investing in other mutual funds. It is based on an investment of $1,000 invested at the beginning of the period and held for the entire period from May 1, 2005 to October 31, 2005.
ACTUAL EXPENSES
The first section of the table below provides information about actual account values and actual expenses. You may use the information in this section, together with the amount you invested, to estimate the expenses that you incurred over the period. Simply divide your account value by $1,000 (for example, an $8,600 account value divided by $1,000 = 8.6), then multiply the result by the number in the first section under the heading entitled "Expenses Paid During Period" to estimate the expenses attributable to your investment during this period.
HYPOTHETICAL EXAMPLE FOR COMPARISON PURPOSES
The second section of the table below provides information about hypothetical account values and hypothetical expenses based on the Fund's actual expense ratio and an assumed rate of return of 5% per year before expenses, which is not the Fund's actual return. Thus, you should not use the hypothetical account values and expenses to estimate the actual ending account balance or your expenses for the period. Rather, these figures are provided to enable you to compare the ongoing costs of investing in the Fund and other funds. To do so, compare this 5% hypothetical example with the 5% hypothetical examples that appear in the shareholder reports of the other funds.
Please note that the expenses shown in the table are meant to highlight your ongoing costs only and do not reflect any transaction costs, such as sales charges (loads) on purchase or redemption payments. Therefore, the second section of the table is useful in comparing ongoing costs only, and will not help you determine the relative total costs of owning different funds. In addition, if these transaction costs were included, your costs would have been higher.
|
| Beginning
Account Value
5/1/2005
|
| Ending
Account Value
10/31/2005
|
| Expenses Paid
During Period 1
|
Actual:
|
|
|
|
|
|
|
Class A Shares
|
| $1,000
|
| $1,031.70
|
| $ 6.15
|
Class B Shares
|
| $1,000
|
| $1,027.50
|
| $10.37
|
Class C Shares
|
| $1,000
|
| $1,027.50
|
| $10.37
|
Class K Shares
|
| $1,000
|
| $1,029.30
|
| $ 8.49
|
Hypothetical (assuming a 5% return before expenses):
|
|
|
|
|
|
|
Class A Shares
|
| $1,000
|
| $1,019.16
|
| $ 6.11
|
Class B Shares
|
| $1,000
|
| $1,014.97
|
| $10.31
|
Class C Shares
|
| $1,000
|
| $1,014.97
|
| $10.31
|
Class K Shares
|
| $1,000
|
| $1,016.84
|
| $ 8.44
|
1 Expenses are equal to the Fund's annualized net expense ratios, multiplied by the average account value over the period, multiplied by 184/365 (to reflect the one-half year period). The annualized net expense ratios are as follows:
Class A Shares
|
| 1.20%
|
Class B Shares
|
| 2.03%
|
Class C Shares
|
| 2.03%
|
Class K Shares
|
| 1.66%
|
Management's Discussion of Fund Performance
This report covers Federated Capital Appreciation Fund's fiscal year performance period from November 1, 2004 through October 31, 2005. During this period, the fund produced total returns of 5.22%, 4.37%, 4.35% and 4.73% for Class A, Class B, Class C and Class K shares, respectively, based on net asset value (NAV). The fund's total return for the most recently completed fiscal year reflected actual cash flows, transaction costs and other expenses which were not reflected in the total return of the fund's benchmark, the Standard & Poor's 500 Index. 1
The fund underperformed its benchmark, S&P 500 Index, which returned 8.72% during the same period. The fund also trailed its peer group as measured by the Lipper Large Cap Core Funds Average category, which produced an average total return of 8.35% for the same period. 2
The past 12 months generated positive returns for most domestic and global equity market benchmarks. These gains were essentially generated in the first two months of the period, followed by the market trading in a fairly tight range (approximately 100 points) through the remainder of the period. In general, small and mid cap investment strategies outperformed large cap strategies during the period. This negatively influenced the fund's relative performance, as it had a larger market cap bias as compared to the index. Value-based strategies generally outperformed growth-based strategies. This positively influenced the fund's performance as it had a slight value tilt during most of the year.
1 The S&P 500 Index is an unmanaged capitalization-weighted index of 500 stocks designed to measure performance of the broad domestic economy through changes in the aggregate market value of 500 stocks representing all major industries. Investments cannot be made in an index.
2 Lipper figures represent the average total returns reported by all mutual funds designated by Lipper, Inc. as falling into the category indicated. They do not reflect sales charges. Investments cannot be made in an average.
The following discussion will focus on the performance of the fund's Class A Shares. Stock selection was the primary contributor to our negative relative performance, although, sector allocation was also a negative contributing factor. On a stock selection basis, the fund's return was hindered by stock performance within the Health Care, Materials, and Energy sectors. The fund benefited from stock performance within the Consumer Staples and Consumer Discretionary sectors. From a sector positioning standpoint, the fund's returns were aided by being underweight relative to the fund's benchmark in the Financials sector early in the year followed by a move to overweight later in the year. The fund also benefited from being underweight in the Industrials and Materials sectors. The fund's returns were limited by its cash position in a rising market. The fund also was negatively impacted by being underweight in the Utilities and Health Care sectors.
Top contributors during the year were: Altria Group ; Exxon Mobil ; Gillette ; Transocean ; and ConocoPhillips .. Bottom contributors during the year were: Pfizer, Inc. ; Fannie Mae ; Tyco International ; Wal-Mart Stores ; and Verizon Communications ..
GROWTH OF A $10,000 INVESTMENT - CLASS A SHARES
The graph below illustrates the hypothetical investment of $10,000 1 in Federated Capital Appreciation Fund (Class A Shares) (the "Fund") from October 31, 1995 to October 31, 2005, compared to the Standard & Poor's 500 Index (S&P 500), 2 and the Lipper Large-Cap Core Fund Average (LLCCFA). 2
Average Annual Total Returns 3 for the Periods Ended 10/31/2005
|
|
|
1 Year
|
| (0.57)%
|
5 Years
|
| (2.22)%
|
10 Years
|
| 9.89%
|

Performance data quoted represents past performance which is no guarantee of future results. Investment return and principal value will fluctuate so that an investor's shares, when redeemed, may be worth more or less than their original cost. Mutual fund performance changes over time and current performance may be lower or higher than what is stated. For current to the most recent month-end performance and after-tax returns, visit FederatedInvestors.com or call 1-800-341-7400. Returns shown do not reflect the deduction of taxes that a shareholder would pay on Fund distributions or the redemption of Fund shares. Mutual funds are not obligations of or guaranteed by any bank and are not federally insured. Total returns shown include the maximum sales charge of 5.50%.
1 Represents a hypothetical investment of $10,000 in the Fund after deducting the maximum sales charge of 5.50% ($10,000 investment minus $550 sales charge=$9,450). Effective January 1, 1996, the fiscal year end of this Fund was changed from December 31 to October 31. The Fund's performance assumes the reinvestment of all dividends and distributions. The S&P 500 and LLCCFA have been adjusted to reflect reinvestment of dividends on securities in the index and the average.
2 The S&P 500 is not adjusted to reflect sales loads, expenses, or other fees that the Securities and Exchange Commission (SEC) requires to be reflected in the Fund's performance. The LLCCFA represents the average of the total returns reported by all of the mutual funds designated by Lipper, Inc. as falling into the category indicated, and is not adjusted to reflect any sales charges. However, these total returns are reported net of expenses or other fees that the SEC requires to be reflected in a fund's performance. The S&P 500 index is unmanaged and, unlike the Fund, is not affected by cashflows. It is not possible to invest in an index or average.
3 Total returns quoted reflect all applicable sales charges.
GROWTH OF A $10,000 INVESTMENT - CLASS B SHARES
The graph below illustrates the hypothetical investment of $10,000 1 in Federated Capital Appreciation Fund (Class B Shares) (the "Fund") from January 4, 1996 (start of performance) to October 31, 2005, compared to the Standard & Poor's 500 Index (S&P 500), 2 and the Lipper Large-Cap Core Fund Average (LLCCFA). 2
Average Annual Total Returns 3 for the Periods Ended 10/31/2005
|
|
|
1 Year
|
| (1.13)%
|
5 Years
|
| (2.23)%
|
Start of Performance (1/4/1996)
|
| 9.32%
|
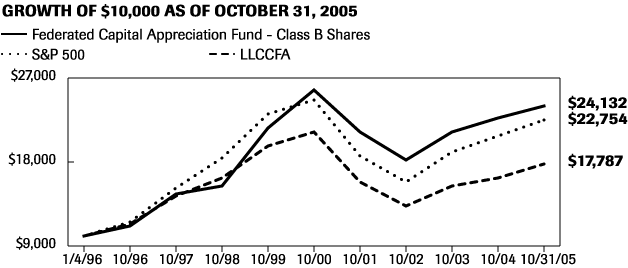
Performance data quoted represents past performance which is no guarantee of future results. Investment return and principal value will fluctuate so that an investor's shares, when redeemed, may be worth more or less than their original cost. Mutual fund performance changes over time and current performance may be lower or higher than what is stated. For current to the most recent month-end performance and after-tax returns, visit FederatedInvestors.com or call 1-800-341-7400. Returns shown do not reflect the deduction of taxes that a shareholder would pay on Fund distributions or the redemption of Fund shares. Mutual funds are not obligations of or guaranteed by any bank and are not federally insured. Total returns shown include the maximum contingent deferred sales charge of 5.50%, as applicable.
1 Represents a hypothetical investment of $10,000 in the Fund. The ending value of the Fund does not reflect a contingent deferred sales charge on any redemption over eight years from the purchase date. The maximum contingent deferred sales charge is 5.50% on any redemption less than one year from the purchase date. The Fund's performance assumes the reinvestment of all dividends and distributions. The S&P 500 and LLCCFA have been adjusted to reflect reinvestment of dividends on securities in the index and average.
2 The S&P 500 is not adjusted to reflect sales loads, expenses, or other fees that the SEC requires to be reflected in the Fund's performance. The LLCCFA represents the average of the total returns reported by all of the mutual funds designated by Lipper, Inc. as falling into the category indicated, and is not adjusted to reflect any sales charges. However, these total returns are reported net of expenses or other fees that the SEC requires to be reflected in a fund's performance. The S&P 500 index is unmanaged and, unlike the Fund, is not affected by cashflows. It is not possible to invest in an index or average.
3 Total returns quoted reflect all applicable contingent deferred sales charges.
GROWTH OF A $10,000 INVESTMENT - CLASS C SHARES
The graph below illustrates the hypothetical investment of $10,000 1 in Federated Capital Appreciation Fund (Class C Shares) (the "Fund") from January 4, 1996 (start of performance) to October 31, 2005, compared to the Standard & Poor's 500 Index (S&P 500), 2 and the Lipper Large-Cap Core Fund Average (LLCCFA). 2
Average Annual Total Returns 3 for the Periods Ended 10/31/2005
|
|
|
1 Year
|
| 2.29%
|
5 Years
|
| (2.05)%
|
Start of performance (1/4/1996)
|
| 9.05%
|

Performance data quoted represents past performance which is no guarantee of future results. Investment return and principal value will fluctuate so that an investor's shares, when redeemed, may be worth more or less than their original cost. Mutual fund performance changes over time and current performance may be lower or higher than what is stated. For current to the most recent month-end performance and after-tax returns, visit FederatedInvestors.com or call 1-800-341-7400. Returns shown do not reflect the deduction of taxes that a shareholder would pay on Fund distributions or the redemption of Fund shares. Mutual funds are not obligations of or guaranteed by any bank and are not federally insured. Total returns shown include the maximum sales charge of 1.00%, and the maximum contingent deferred sales charge of 1.00%, as applicable.
1 Represents a hypothetical investment of $10,000 in the Fund after deducting the maximum sales charge of 1.00% ($10,000 investment minus $100 sales charge=$9,900). A 1.00% contingent deferred sales charge would be imposed on any redemption less than one year from the purchase date. The Fund's performance assumes the reinvestment of all dividends and distributions. The S&P 500 and LLCCFA have been adjusted to reflect reinvestment of dividends on securities in the index or average.
2 The S&P 500 is not adjusted to reflect sales loads, expenses, or other fees that the SEC requires to be reflected in the Fund's performance. The LLCCFA represents the average of the total returns reported by all of the mutual funds designated by Lipper, Inc. as falling into the category indicated, and is not adjusted to reflect any sales charges. However, these total returns are reported net of expenses or other fees that the SEC requires to be reflected in a fund's performance. The S&P 500 index is unmanaged and, unlike the Fund, are not affected by cashflows. It is not possible to invest in an index or average.
3 Total returns quoted reflect all applicable sales charges and contingent deferred sales charges.
GROWTH OF A $10,000 INVESTMENT - CLASS K SHARES
The Fund's Class K Shares commenced operations on April 8, 2003. The Fund offers three other classes of shares; Class A Shares, Class B Shares and Class C Shares. For the period prior to the commencement of operations of the Class K Shares, the performance information shown is for the Fund's Class A Shares, adjusted to reflect the expenses of Class K Shares. The graph below illustrates the hypothetical investment of $10,000 1 in Federated Capital Appreciation Fund (Class K Shares) (the "Fund") from October 31, 1995 to October 31, 2005, compared to the Standard & Poor's 500 Index (S&P 500), 2 and the Lipper Large-Cap Core Fund Average (LLCCFA). 2
Average Annual Total Returns for the Periods Ended 10/31/2005
|
|
|
1 Year
|
| 4.73%
|
5 Years
|
| (1.55)%
|
10 Years
|
| 10.01%
|
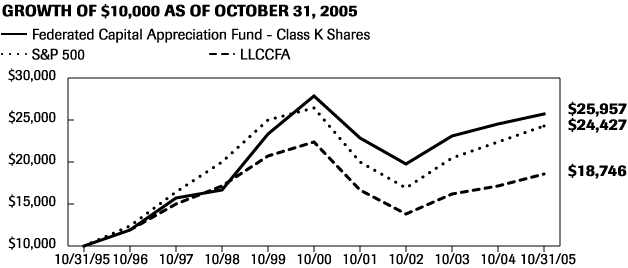
Performance data quoted represents past performance which is no guarantee of future results. Investment return and principal value will fluctuate so that an investor's shares, when redeemed, may be worth more or less than their original cost. Mutual fund performance changes over time and current performance may be lower or higher than what is stated. For current to the most recent month-end performance and after-tax returns, visit FederatedInvestors.com or call 1-800-341-7400. Returns shown do not reflect the deduction of taxes that a shareholder would pay on Fund distributions or the redemption of Fund shares. Mutual funds are not obligations of or guaranteed by any bank and are not federally insured.
1 Represents a hypothetical investment of $10,000 in the Fund with no sales load. The Fund's performance assumes the reinvestment of all dividends and distributions. The S&P 500 and LLCCFA have been adjusted to reflect reinvestment of dividends on securities in the index and the average.
2 The S&P 500 is not adjusted to reflect sales loads, expenses, or other fees that the SEC requires to be reflected in the Fund's performance. The LLCCFA represents the average of the total returns reported by all of the mutual funds designated by Lipper, Inc. as falling into the category indicated, and is not adjusted to reflect any sales charges. However, these total returns are reported net of expenses or other fees that the SEC requires to be reflected in a fund's performance. The S&P 500 index is unmanaged and unlike the Fund, is not affected by cashflows. It is not possible to invest in an index or average.
Performance data quoted represents past performance which is no guarantee of future results. Investment return and principal value will fluctuate so that an investor's shares, when redeemed, may be worth more or less than their original cost. Mutual fund performance changes over time and current performance may be lower or higher than what is stated. For current to the most recent month-end performance, visit FederatedInvestors.com or call 1-800-341-7400.
Portfolio of Investments Summary Table
At October 31, 2005, the Fund's sector composition 1 was as follows:
Sector
|
| Percentage of
Total Net Assets
|
Financials
|
| 22.9%
|
Information Technology
|
| 15.4%
|
Health Care
|
| 14.0%
|
Energy
|
| 12.5%
|
Consumer Discretionary
|
| 11.9%
|
Industrials
|
| 8.7%
|
Consumer Staples
|
| 7.6%
|
Telecommunication Services
|
| 5.0%
|
Materials
|
| 0.8%
|
Securities Lending Collateral 2
|
| 0.0%
|
Cash Equivalents 3
|
| 0.8%
|
Other Assets and Liabilities--Net 4
|
| 0.4%
|
TOTAL
|
| 100.0%
|
1 Except for Securities Lending Collateral, Cash Equivalents and Other Assets and Liabilities, sector classifications are based upon, and individual portfolio securities are assigned to, the classifications of the Global Industry Classification Standard (GICS) except that the adviser assigns a classification to securities not classified by the GICS and to securities for which the adviser does not have access to the classification made by the GICS.
2 Cash collateral received from lending portfolio securities which is invested in short term investments such as repurchase agreements or money market funds.
3 Cash Equivalents includes any investments in money market mutual funds and/or overnight repurchase agreements, other than those representing securities lending collateral.
4 See Statement of Assets and Liabilities.
Portfolio of Investments
October 31, 2005
Shares
|
|
|
|
| Value
|
| | | COMMON STOCKS--98.8% | | | |
| | | Consumer Discretionary--11.9% | | | |
| 1,083,100 | | Gap (The), Inc.
| | $ | 18,715,968 |
| 1,461,497 | | Home Depot, Inc.
| | | 59,979,837 |
| 2,520,100 | 1 | Interpublic Group Cos., Inc.
| | | 26,032,633 |
| 1,156,300 | | Mattel, Inc.
| | | 17,055,425 |
| 1,677,890 | | McDonald's Corp.
| | | 53,021,324 |
| 438,888 | | Nike, Inc., Class B
| | | 36,888,536 |
| 860,039 | | Target Corp.
| | | 47,895,572 |
| 2,522,400 | | Time Warner, Inc.
| | | 44,974,392 |
| 1,411,174 | | Viacom, Inc., Class B
|
|
| 43,704,059
|
| | | TOTAL
|
|
| 348,267,746
|
| | | Consumer Staples--7.6% | | | |
| 820,150 | | Altria Group, Inc.
| | | 61,552,258 |
| 1,388,750 | | Coca-Cola Co.
| | | 59,410,725 |
| 1,137,309 | 1,2 | Kroger Co.
| | | 22,632,449 |
| 542,342 | | PepsiCo, Inc.
| | | 32,041,565 |
| 543,217 | | Procter & Gamble Co.
| | | 30,414,720 |
| 367,490 | | Wal-Mart Stores, Inc.
|
|
| 17,385,952
|
| | | TOTAL
|
|
| 223,437,669
|
| | | Energy--12.5% | | | |
| 243,000 | | Apache Corp.
| | | 15,510,690 |
| 1,593,316 | | Chevron Corp.
| | | 90,930,544 |
| 473,500 | | ConocoPhillips
| | | 30,957,430 |
| 215,400 | 1 | Cooper Cameron Corp.
| | | 15,881,442 |
| 2,390,397 | | Exxon Mobil Corp.
| | | 134,196,888 |
| 339,100 | | GlobalSantaFe Corp.
| | | 15,106,905 |
| 250,100 | | Halliburton Co.
| | | 14,780,910 |
| 848,700 | 1 | Transocean Sedco Forex, Inc.
|
|
| 48,791,763
|
| | | TOTAL
|
|
| 366,156,572
|
| | | Financials--22.9% | | | |
| 1,067,400 | | Ace Ltd.
| | | 55,611,540 |
| 799,340 | | Allstate Corp.
| | | 42,197,158 |
| 861,649 | | American International Group, Inc.
| | | 55,834,855 |
| 982,836 | | Bank of America Corp.
| | | 42,989,247 |
Shares
|
|
|
|
| Value
|
| | | COMMON STOCKS--continued | | | |
| | | Financials--continued | | | |
| 1,410,450 | | Citigroup, Inc.
| | $ | 64,570,401 |
| 711,800 | | Federal Home Loan Mortgage Corp.
| | | 43,668,930 |
| 814,822 | | Federal National Mortgage Association
| | | 38,720,341 |
| 198,400 | | Franklin Resources, Inc.
| | | 17,532,608 |
| 256,600 | | Goldman Sachs Group, Inc.
| | | 32,426,542 |
| 1,012,705 | | J.P. Morgan Chase & Co.
| | | 37,085,257 |
| 1,680,700 | | MBNA Corp.
| | | 42,975,499 |
| 1,101,300 | | Merrill Lynch & Co., Inc.
| | | 71,298,162 |
| 1,202,182 | | Morgan Stanley
| | | 65,410,723 |
| 979,800 | | Wells Fargo & Co.
|
|
| 58,983,960
|
| | | TOTAL
|
|
| 669,305,223
|
| | | Health Care--14.0% | | | |
| 1,137,103 | | Abbott Laboratories
| | | 48,952,284 |
| 1,007,902 | | Baxter International, Inc.
| | | 38,532,093 |
| 1,212,360 | | Johnson & Johnson
| | | 75,917,983 |
| 509,700 | | McKesson HBOC, Inc.
| | | 23,155,671 |
| 967,816 | | Medtronic, Inc.
| | | 54,836,455 |
| 653,783 | | Merck & Co., Inc.
| | | 18,449,756 |
| 3,047,208 | | Pfizer, Inc.
| | | 66,246,302 |
| 1,185,700 | | Schering Plough Corp.
| | | 24,117,138 |
| 1,308,376 | | Wyeth
|
|
| 58,301,235
|
| | | TOTAL
|
|
| 408,508,917
|
| | | Industrials--8.7% | | | |
| 319,400 | | Deere & Co.
| | | 19,381,192 |
| 2,955,005 | | General Electric Co.
| | | 100,204,220 |
| 632,500 | | Northrop Grumman Corp.
| | | 33,933,625 |
| 1,718,138 | | Tyco International Ltd.
| | | 45,341,662 |
| 775,700 | | United Parcel Service, Inc.
|
|
| 56,579,558
|
| | | TOTAL
|
|
| 255,440,257
|
| | | Information Technology--15.4% | | | |
| 2,277,800 | | Applied Materials, Inc.
| | | 37,310,364 |
| 1,729,733 | 1 | Cisco Systems, Inc.
| | | 30,183,841 |
| 1,001,225 | 1 | Dell, Inc.
| | | 31,919,053 |
| 3,019,600 | 1 | EMC Corp. Mass
| | | 42,153,616 |
| 48,800 | 1 | Google Inc.
| | | 18,160,432 |
| 526,768 | | IBM Corp.
| | | 43,131,764 |
Shares or
Principal
Amount
|
|
|
|
| Value
|
| | | COMMON STOCKS--continued | | | |
| | | Information Technology--continued | | | |
| 1,740,546 | | Intel Corp.
| | $ | 40,902,831 |
| 386,662 | | KLA-Tencor Corp.
| | | 17,898,584 |
| 4,215,779 | | Microsoft Corp.
| | | 108,345,520 |
| 3,618,641 | 1 | Oracle Corp.
| | | 45,884,368 |
| 561,600 | | Paychex, Inc.
| | | 21,767,616 |
| 1,339,800 | | Siebel Systems, Inc.
|
|
| 13,866,930
|
| | | TOTAL
|
|
| 451,524,919
|
| | | Materials--0.8% | | | |
| 971,242 | | Alcoa, Inc.
|
|
| 23,591,468
|
| | | Telecommunication Services--5.0% | | | |
| 1,724,900 | | BellSouth Corp.
| | | 44,881,898 |
| 2,312,424 | | SBC Communications, Inc.
| | | 55,151,312 |
| 1,449,191 | | Verizon Communications
|
|
| 45,664,008
|
| | | TOTAL
|
|
| 145,697,218
|
| | | TOTAL COMMON STOCKS (IDENTIFIED COST $2,514,924,572)
|
|
| 2,891,929,989
|
| | | REPURCHASE AGREEMENTS--0.8% | | | |
| $ | 22,501,000 | | Interest in $3,500,000,000 joint repurchase agreement 4.04%, dated 10/31/2005, under which Bank of America N.A. will repurchase a U.S. Government Agency security with a maturity of 7/1/2035 for $3,500,392,778 on 11/1/2005. The market value of the underlying security at the end of the period was $3,570,000,001
|
|
| 22,501,000 |
| 5,000 | | Interest in $1,000,000,000 joint repurchase agreement 4.04%, dated 10/31/2005 under which Deutsche Bank Securities, Inc., will repurchase U.S. Government Agency securities with various maturities to 11/1/2035 for $1,000,112,222 on 11/1/2005. The market value of the underlying securities at the end of the period was $1,022,185,524 (held as collateral for securities lending)
|
|
| 5,000
|
| | | TOTAL REPURCHASE AGREEMENTS
(AT AMORTIZED COST)
|
|
| 22,506,000
|
| | | TOTAL INVESTMENTS--99.6%
(IDENTIFIED COST $2,537,430,572) 3
|
|
| 2,914,435,989
|
| | | OTHER ASSETS AND LIABILITIES - NET--0.4%
|
|
| 11,181,216
|
| | | TOTAL NET ASSETS--100%
|
| $
| 2,925,617,205
|
1 Non-income producing security.
2 All or a portion of these securities are temporarily on loan to unaffiliated broker/dealers.
3 The cost of investments for federal tax purposes amounts to $2,552,877,949.
Note: The categories of investments are shown as a percentage of total net assets at October 31, 2005.
See Notes which are an integral part of the Financial Statements
Statement of Assets and Liabilities
October 31, 2005
Assets:
| | | | | | |
Total investments in securities, at value including $1,990 of securities loaned (identified cost $2,537,430,572)
| | | | | $ | 2,914,435,989 |
Cash
| | | | | | 12,715 |
Income receivable
| | | | | | 3,104,535 |
Receivable for investments sold
| | | | | | 18,526,768 |
Receivable for shares sold
|
|
|
|
|
| 2,177,962
|
TOTAL ASSETS
|
|
|
|
|
| 2,938,257,969
|
Liabilities:
| | | | | | |
Payable for shares redeemed
| | $ | 10,112,306 | | | |
Payable for transfer and dividend disbursing agent fees and expenses
| | | 1,333,437 | | | |
Payable for collateral due to broker
| | | 5,000 | | | |
Payable for distribution services fee (Note 5)
| | | 445,111 | | | |
Payable for shareholder services fee (Note 5)
| | | 626,069 | | | |
Accrued expenses
|
|
| 118,841
|
|
|
|
TOTAL LIABILITIES
|
|
|
|
|
| 12,640,764
|
Net assets for 117,612,365 shares outstanding
|
|
|
|
| $
| 2,925,617,205
|
Net Assets Consist of:
| | | | | | |
Paid-in capital
| | | | | $ | 2,511,485,289 |
Net unrealized appreciation of investments
| | | | | | 377,005,417 |
Accumulated net realized gain on investments and futures contracts
| | | | | | 27,705,665 |
Undistributed net investment income
|
|
|
|
|
| 9,420,834
|
TOTAL NET ASSETS
|
|
|
|
| $
| 2,925,617,205
|
Net Asset Value, Offering Price and Redemption Proceeds Per Share
| | | | | | |
Class A Shares:
| | | | | | |
Net asset value per share ($2,225,781,397 ÷ 88,817,041 shares outstanding), no par value, unlimited shares authorized
|
|
|
|
|
| $25.06
|
Offering price per share (100/94.50 of $25.06) 1
|
|
|
|
|
| $26.52
|
Redemption proceeds per share
|
|
|
|
|
| $25.06
|
Class B Shares:
| | | | | | |
Net asset value per share ($507,271,391 ÷ 20,872,519 shares outstanding), no par value, unlimited shares authorized
|
|
|
|
|
| $24.30
|
Offering price per share
|
|
|
|
|
| $24.30
|
Redemption proceeds per share (94.50/100 of $24.30) 1
|
|
|
|
|
| $22.96
|
1 See "What Do Shares Cost?" in the Prospectus.
Statement of Assets and Liabilities-continued
October 31, 2005
Class C Shares:
| | | | | | |
Net asset value per share ($185,175,484 ÷ 7,626,567 shares outstanding), no par value, unlimited shares authorized
|
|
|
|
|
| $24.28
|
Offering price per share (100/99.00 of $24.28) 1
|
|
|
|
|
| $24.53
|
Redemption proceeds per share (99.00/100 of $24.28) 1
|
|
|
|
|
| $24.04
|
Class K Shares:
| | | | | | |
Net asset value per share ($7,388,933 ÷ 296,238 shares outstanding), no par value, unlimited shares authorized
|
|
|
|
|
| $24.94
|
Offering price per share
|
|
|
|
|
| $24.94
|
Redemption proceeds per share
|
|
|
|
|
| $24.94
|
See Notes which are an integral part of the Financial Statements
Statement of Operations
Year Ended October 31, 2005
Investment Income:
| | | | | | | | | | | |
Dividends (including $76,434 received from affiliated issuer (Note 5))
| | | | | | | | | | $ | 71,398,120 |
Interest (including income on securities loaned of $10,506)
|
|
|
|
|
|
|
|
|
|
| 1,111,037
|
TOTAL INCOME
|
|
|
|
|
|
|
|
|
|
| 72,509,157
|
Expenses:
| | | | | | | | | | | |
Investment adviser fee (Note 5)
| | | | | | $ | 24,763,953 | | | | |
Administrative personnel and services fee (Note 5)
| | | | | | | 2,645,902 | | | | |
Custodian fees
| | | | | | | 141,532 | | | | |
Transfer and dividend disbursing agent fees and expenses--Class A Shares
| | | | | | | 3,449,579 | | | | |
Transfer and dividend disbursing agent fees and expenses--Class B Shares
| | | | | | | 885,276 | | | | |
Transfer and dividend disbursing agent fees and expenses--Class C Shares
| | | | | | | 349,651 | | | | |
Transfer and dividend disbursing agent fees and expenses--Class K Shares
| | | | | | | 37,115 | | | | |
Directors'/Trustees' fees
| | | | | | | 31,411 | | | | |
Auditing fees
| | | | | | | 23,506 | | | | |
Legal fees
| | | | | | | 9,981 | | | | |
Portfolio accounting fees
| | | | | | | 201,195 | | | | |
Distribution services fee--Class B Shares (Note 5)
| | | | | | | 4,193,491 | | | | |
Distribution services fee--Class C Shares (Note 5)
| | | | | | | 1,575,263 | | | | |
Distribution services fee--Class K Shares (Note 5)
| | | | | | | 58,501 | | | | |
Shareholder services fee--Class A Shares (Note 5)
| | | | | | | 6,165,970 | | | | |
Shareholder services fee--Class B Shares (Note 5)
| | | | | | | 1,397,830 | | | | |
Shareholder services fee--Class C Shares (Note 5)
| | | | | | | 523,882 | | | | |
Share registration costs
| | | | | | | 92,391 | | | | |
Printing and postage
| | | | | | | 261,358 | | | | |
Insurance premiums
| | | | | | | 31,110 | | | | |
Interest
| | | | | | | 4,278 | | | | |
Miscellaneous
|
|
|
|
|
|
| 19,145
|
|
|
|
|
TOTAL EXPENSES
|
|
|
|
|
|
| 46,862,320
|
|
|
|
|
Statement of Operations-continued
Year Ended October 31, 2005
Reimbursements, Waivers and Expense Reduction:
| | | | | | | | | | | |
Reimbursement of investment adviser fee
| | $ | (357 | ) | | | | | | | |
Waiver of administrative personnel and services fee (Note 5)
| | | (129,885 | ) | | | | | | | |
Reimbursement of shareholder services fee- Class A Shares (Note 5)
| | | (392,196 | ) | | | | | | | |
Fees paid indirectly from directed brokerage arrangements
|
|
| (147,007
| )
|
|
|
|
|
|
|
|
TOTAL REIMBURSEMENTS, WAIVERS AND EXPENSE REDUCTION
|
|
|
|
|
| $
| (669,445
| )
|
|
|
|
Net expenses
|
|
|
|
|
|
|
|
|
| $
| 46,192,875
|
Net investment income
|
|
|
|
|
|
|
|
|
|
| 26,316,282
|
Realized and Unrealized Gain (Loss) on Investments:
| | | | | | | | | | | |
Net realized gain on investments
| | | | | | | | | | | 87,297,085 |
Net change in unrealized appreciation of investments
| | | | | | | | | | | 52,607,446 |
Net increase due to reimbursement from Adviser (Note 5)
|
|
|
|
|
|
|
|
|
|
| 186,934
|
Net realized and unrealized gain on investments
|
|
|
|
|
|
|
|
|
|
| 140,091,465
|
Change in net assets resulting from operations
|
|
|
|
|
|
|
|
|
| $
| 166,407,747
|
See Notes which are an integral part of the Financial Statements
Statement of Changes in Net Assets
Year Ended October 31
|
|
| 2005
|
|
|
| 2004
|
|
Increase (Decrease) in Net Assets
| | | | | | | | |
Operations:
| | | | | | | | |
Net investment income
| | $ | 26,316,282 | | | $ | 9,235,297 | |
Net realized gain on investments and futures contracts
| | | 87,297,085 | | | | 201,932,728 | |
Net increase due to reimbursement from Adviser (Note 5)
| | | 186,934 | | | | 204,416 | |
Net change in unrealized appreciation/depreciation of investments
|
|
| 52,607,446
|
|
|
| (14,393,003
| )
|
CHANGE IN NET ASSETS RESULTING FROM OPERATIONS
|
|
| 166,407,747
|
|
|
| 196,979,438
|
|
Distributions to Shareholders:
| | | | | | | | |
Distributions from net investment income
| | | | | | | | |
Class A Shares
| | | (22,529,357 | ) | | | (10,877,223 | ) |
Class B Shares
| | | (936,830 | ) | | | - -- | |
Class C Shares
| | | (292,405 | ) | | | - -- | |
Class K Shares
| | | (15,263 | ) | | | (100,746 | ) |
Distributions from net realized gains
| | | | | | | | |
Class A Shares
| | | (2,379,876 | ) | | | - -- | |
Class B Shares
| | | (537,605 | ) | | | - -- | |
Class C Shares
| | | (202,959 | ) | | | - -- | |
Class K Shares
|
|
| (8,799
| )
|
|
| - --
|
|
CHANGE IN NET ASSETS RESULTING FROM DISTRIBUTIONS TO SHAREHOLDERS
|
|
| (26,903,094
| )
|
|
| (10,977,969
| )
|
Statement of Changes in Net Assets-continued
Share Transactions:
| | | | | | | | |
Proceeds from sale of shares
| | $ | 493,332,211 | | | $ | 910,902,360 | |
Proceeds from shares issued in connection with the tax-free transfer of assets from United Common Trust Fund Common Stock A
| | | - -- | | | | 10,456,170 | |
Proceeds from shares issued in connection with the tax-free transfer of assets from United Common Trust Fund Common Stock B
| | | - -- | | | | 34,385,127 | |
Proceeds from shares issued in connection with the taxable transfer of assets from United Common Trust Fund Common Stock EB
| | | - -- | | | | 8,573,111 | |
Proceeds from shares issued in connection with the tax-free transfer of assets from BankNorth Large Cap Core Fund
| | | - -- | | | | 91,455,256 | |
Proceeds from shares issued in connection with the tax-free transfer of assets from UB Discretionary Common Trust Fund
| | | - -- | | | | 13,974,679 | |
Proceeds from shares issued in connection with the taxable transfer of assets from UB Common Trust Fund B
| | | - -- | | | | 3,551,531 | |
Proceeds from shares issued in connection with the tax-free transfer of assets from Vintage Equity Fund S
| | | 68,264,263 | | | | - -- | |
Proceeds from shares issued in connection with the tax-free transfer of assets from Vintage Equity Fund T
| | | 26,613,622 | | | | - -- | |
Proceeds from shares issued in connection with the tax-free transfer of assets from Vintage Growth Fund
| | | 28,440,218 | | | | - -- | |
Net asset value of shares issued to shareholders in payment of distributions declared
| | | 21,865,920 | | | | 8,868,906 | |
Cost of shares redeemed
|
|
| (1,251,676,124
| )
|
|
| (768,201,509
| )
|
CHANGE IN NET ASSETS RESULTING FROM SHARE TRANSACTIONS
|
|
| (613,159,890
| )
|
|
| 313,965,631
|
|
Change in net assets
|
|
| (473,655,237
| )
|
|
| 499,967,100
|
|
Net Assets:
| | | | | | | | |
Beginning of period
|
|
| 3,399,272,442
|
|
|
| 2,899,305,342
|
|
End of period (including undistributed net investment income of $9,420,834 and $7,005,964, respectively)
|
| $
| 2,925,617,205
|
|
| $
| 3,399,272,442
|
|
See Notes which are an integral part of the Financial Statements
Notes to Financial Statements
October 31, 2005
1. ORGANIZATION
Federated Equity Funds (the "Trust") is registered under the Investment Company Act of 1940, as amended (the "Act"), as an open-end management investment company. The Trust consists of eight portfolios. The financial statements included herein are only those of Federated Capital Appreciation Fund (the "Fund"), a diversified portfolio. The financial statements of the other portfolios are presented separately. The assets of each portfolio are segregated and a shareholder's interest is limited to the portfolio in which shares are held. The Fund offers four classes of shares: Class A Shares, Class B Shares, Class C Shares, and Class K Shares. All shares of the Fund have equal rights with respect to voting, except on class-specific matters. The investment objective of the Fund is to provide capital appreciation.
On March 5, 2004, the Fund received a tax-free transfer of assets from the United Common Trust Fund for Common Stock A and Common Stock B and a taxable transfer for Common Stock EB of assets from the Founder Common Trust Equity Income Fund Retirement Trust, as follows:
|
| Class A
Shares
of the
Fund
Issued
|
| United
Common
Trust Funds
Net Assets
Received
|
| Unrealized
Appreciation 1
|
| Net Assets of
Fund Prior to
Combination
|
| Net Assets
of United
Common
Trust Funds
Immediately
Prior to
Combination
|
| Net Assets
of the Fund
Immediately
After
Combination
|
United Common Trust Fund Common Stock A
|
| 419,758
|
| $10,456,170
|
| $ 2,653,012
|
| - --
|
| $10,456,170
|
| --
|
United Common Trust Fund Common Stock B
|
| 1,380,374
|
| 34,385,127
|
| 8,626,456
|
| - --
|
| 34,385,127
|
| - --
|
United Common Trust Fund Common Stock EB
|
| 344,163
|
| 8,573,111
|
| - --
|
| - --
|
| 8,573,111
|
| - --
|
TOTAL
|
| 2,144,295
|
| $53,414,408
|
| $11,279,468
|
| $3,361,167,066
|
| $53,414,408
|
| $3,414,581,474
|
1 Unrealized Appreciation is included in the United Common Trust Fund Common Stock A and Common Stock B Net Assets Received amount shown above.
On August 27, 2004, the Fund received a tax-free transfer of assets from the BankNorth Large Cap Core Fund, as follows:
|
| Class A
Shares of
the Fund
Issued
|
| BankNorth
Large Cap
Core Fund
Net Assets
Received
|
| Unrealized
Appreciation 2
|
| Net Assets
of Fund
Prior to
Combination
|
| Net Assets
of BankNorth
Large Cap
Core Fund
Immediately
Prior to
Combination
|
| Net Assets
of the Fund
Immediately
After
Combination
|
BankNorth Large Cap Core Fund
|
| 3,880,155
|
| $91,455,256
|
| $19,955,209
|
| $3,262,041,532
|
| $91,455,256
|
| $3,353,496,788
|
2 Unrealized Appreciation is included in the BankNorth Large Cap Core Fund Net Assets Received amount shown above.
On October 22, 2004, the Fund received a tax-free transfer of assets from the UB Discretionary Common Trust Fund and a taxable transfer of assets from UB Common Trust Fund B, as follows:
|
| Class A
Shares of
the Fund
Issued
|
| UB Common
Trust Funds'
Net Assets
Received
|
| Unrealized
Appreciation 3
|
| Net Assets
of Fund
Prior to
Combination
|
| Net Assets of
UB Common
Trust Funds
Immediately
Prior to
Combination
|
| Net Assets
of the Fund
Immediately
After
Combination
|
UB Discretionary Common Trust Fund
|
| 599,772
|
| $13,974,679
|
| $4,558,438
|
| - --
|
| $13,974,679
|
| - --
|
UB Common Trust Fund B
|
| 152,426
|
| 3,551,531
|
| - --
|
| - --
|
| 3,551,531
|
| - --
|
TOTAL
|
| 752,198
|
| $17,526,210
|
| $4,558,438
|
| $3,287,207,991
|
| $17,526,210
|
| $3,304,734,201
|
3 Unrealized Appreciation is included in the UB Discretionary Common Trust Fund Net Assets Received amount shown above.
On September 18, 2005, the Fund received a tax-free transfer of assets from the Vintage Mutual Funds, as follows:
|
| Class A
Shares
of the
Fund
Issued
|
| Vintage
Mutual
Funds Net
Assets
Received
|
| Unrealized
Appreciation 4
|
| Net Assets
of Fund
Prior to
Combination
|
| Net Assets
of Vintage
Mutual Funds
Immediately
Prior to
Combination
|
| Net Assets
of the Fund
Immediately
After
Combination
|
Vintage Equity Fund S
|
| 2,662,412
|
| $ 68,264,263
|
| $22,924,212
|
| - --
|
| $ 68,264,263
|
| - --
|
Vintage Equity Fund T
|
| 1,037,973
|
| 26,613,622
|
| 8,937,186
|
| - --
|
| 26,613,622
|
| - --
|
Vintage Growth Fund
|
| 1,109,213
|
| 28,440,218
|
| 3,288,127
|
| - --
|
| 28,440,218
|
| - --
|
TOTAL
|
| 4,809,598
|
| $123,318,103
|
| $35,149,525
|
| $3,099,486,870
|
| $123,318,103
|
| $3,222,804,973
|
4 Unrealized Appreciation is included in the Vintage Mutual Funds Net Assets Received amount shown above.
2. SIGNIFICANT ACCOUNTING POLICIES
The following is a summary of significant accounting policies consistently followed by the Fund in the preparation of its financial statements. These policies are in conformity with generally accepted accounting principles (GAAP) in the United States of America.
Investment Valuation
Listed equity securities are valued at the last sale price or official closing price reported on a national securities exchange. If unavailable, the security is generally valued at the mean between the last closing bid and asked prices. The Fund generally values short-term securities according to prices furnished by an independent pricing service, except that short-term securities with remaining maturities of less than 60 days at the time of purchase may be valued at amortized cost. Prices furnished by an independent pricing service are intended to be indicative of the mean between the bid and asked prices currently offered to institutional investors for the securities. Investment in other open-end regulated investment companies are valued at net asset value. Securities for which no quotations are readily available are valued at fair value as determined in accordance with procedures established by and under general supervision of the Board of Trustees (the "Trustees").
Repurchase Agreements
It is the policy of the Fund to require the custodian bank to take possession, to have legally segregated in the Federal Reserve Book Entry System, or to have segregated within the custodian bank's vault, all securities held as collateral under repurchase agreement transactions. Additionally, procedures have been established by the Fund to monitor, on a daily basis, the market value of each repurchase agreement's collateral to ensure that the value of the collateral at least equals the repurchase price to be paid under the repurchase agreement.
The Fund will only enter into repurchase agreements with banks and other recognized financial institutions, such as broker/dealers, which are deemed by the Fund's adviser to be creditworthy pursuant to the guidelines and/or standards reviewed or established by the Trustees. Risks may arise from the potential inability of counterparties to honor the terms of the repurchase agreement. The Fund, along with other affiliated investment companies, may utilize a joint trading account for the purpose of entering into one or more repurchase agreements.
Investment Income, Gains and Losses, Expenses and Distributions
Interest income and expenses are accrued daily. Dividend income and distributions to shareholders are recorded on the ex-dividend date. Distributions of net investment income are declared and paid quarterly. Non-cash dividends included in dividend income, if any, are recorded at fair value. Investment income, realized and unrealized gains and losses, and certain fund-level expenses are allocated to each class based on relative average daily net assets, except that each class bears certain expenses unique to that class such as transfer and dividend disbursing agent, distribution and shareholder services fees. Dividends are declared separately for each class. No class has preferential dividend rights; differences in per share dividend rates are generally due to differences in separate class expenses.
Premium and Discount Amortization
All premiums and discounts on fixed income securities are amortized/accreted for financial statement purposes.
Federal Taxes
It is the Fund's policy to comply with the Subchapter M provision of the Internal Revenue Code (the "Code") and to distribute to shareholders each year substantially all of its income. Accordingly, no provision for federal income tax is necessary.
When-Issued and Delayed Delivery Transactions
The Fund may engage in when-issued or delayed delivery transactions. The Fund records when-issued securities on the trade date and maintains security positions such that sufficient liquid assets will be available to make payment for the securities purchased. Securities purchased on a when-issued or delayed delivery basis are marked to market daily and begin earning interest on the settlement date. Losses may occur on these transactions due to changes in market conditions or the failure of counterparties to perform under the contract.
Securities Lending
The Fund participates in a securities lending program providing for the lending of corporate bonds, equity and government securities to qualified brokers. The Fund normally receives cash collateral for securities loaned that is invested in short-term securities, including repurchase agreements, or an affiliated money market fund. Collateral is maintained at a minimum level of 102% of the market value of investments loaned, plus interest, if applicable. Earnings on collateral are allocated between the securities lending agent, as a fee for its services under the program, and the Fund, according to agreed-upon rates.
As of October 31, 2005, securities subject to this type of arrangement and related collateral were as follows:
Market Value of
Securities Loaned
|
| Market Value
of Collateral
|
$1,990
|
| $5,000
|
Use of Estimates
The preparation of financial statements in conformity with GAAP requires management to make estimates and assumptions that affect the amounts of assets, liabilities, expenses and revenues reported in the financial statements. Actual results could differ from those estimated.
Other
Investment transactions are accounted for on a trade date basis. Realized gains and losses from investment transactions are recorded on an identified cost basis.
3. SHARES OF BENEFICIAL INTEREST
The following tables summarize share activity:
Year Ended October 31
|
| 2005
|
|
| 2004
|
Class A Shares:
|
| Shares
|
|
|
| Amount
|
|
| Shares
|
|
|
| Amount
|
|
Shares sold
| | 16,082,880 | | | $ | 403,158,196 | | | 30,160,790 | | | $ | 717,970,584 | |
Shares issued in connection with tax- free transfer of assets from United Common Trust Fund Common Stock A
| | - -- | | | | - -- | | | 419,758 | | | | 10,456,170 | |
Shares issued in connection with tax- free transfer of assets from United Common Trust Fund Common Stock B
| | - -- | | | | - -- | | | 1,380,374 | | | | 34,385,127 | |
Shares issued in connection with taxable transfer of assets from United Common Trust Fund Common Stock EB
| | - -- | | | | - -- | | | 344,163 | | | | 8,573,111 | |
Shares issued in connection with tax- free transfer of assets from BankNorth Large Cap Core Fund
| | - -- | | | | - -- | | | 3,880,155 | | | | 91,455,256 | |
Shares issued in connection with tax- free transfer of assets from UB Discretionary Common Trust Fund
| | - -- | | | | - -- | | | 599,772 | | | | 13,974,679 | |
Shares issued in connection with taxable transfer of assets from UB Common Trust Fund B
| | - -- | | | | - -- | | | 152,426 | | | | 3,551,531 | |
Shares issued in connection with tax-free transfer of assets from Vintage Equity Fund S
| | 2,662,412 | | | | 68,264,263 | | | - -- | | | | - -- | |
Shares issued in connection with tax-free transfer of assets from Vintage Equity Fund T
| | 1,037,973 | | | | 26,613,622 | | | - -- | | | | - -- | |
Shares issued in connection with tax-free transfer of assets from Vintage Growth Fund
| | 1,109,213 | | | | 28,440,218 | | | - -- | | | | - -- | |
Shares issued to shareholders in payment of distributions declared
|
|
800,574 |
|
| |
20,151,422 |
|
|
368,260 |
|
| |
8,768,269 |
|
Shares redeemed
|
| (41,239,454
| )
|
|
| (1,032,140,350
| )
|
| (25,464,352
| )
|
|
| (604,312,640
| )
|
NET CHANGE RESULTING FROM CLASS A SHARE TRANSACTIONS
|
| (19,546,402
| )
|
| $
| (485,512,629
| )
|
| 11,841,346
|
|
| $
| 284,822,087
|
|
| | | | | | | | | | | | | | |
Year Ended October 31
|
| 2005
|
| 2004
|
Class B Shares:
|
| Shares
|
|
|
| Amount
|
|
| Shares
|
|
|
| Amount
|
|
Shares sold
| | 1,898,496 | | | $ | 46,275,052 | | | 4,736,005 | | | $ | 109,697,850 | |
Shares issued to shareholders in payment of distributions declared
| |
53,809 |
|
|
|
1,315,656 |
|
| - -- |
|
|
| - -- |
|
Shares redeemed
|
| (5,478,005
| )
|
|
| (133,667,069
| )
|
| (4,363,148
| )
|
|
| (100,855,178
| )
|
NET CHANGE RESULTING FROM CLASS B SHARE TRANSACTIONS
|
| (3,525,700
| )
|
| $
| (86,076,361
| )
|
| 372,857
|
|
| $
| 8,842,672
|
|
| | | | | | | | | | | | | | |
Year Ended October 31
|
| 2005
|
| 2004
|
Class C Shares:
|
| Shares
|
|
|
| Amount
|
|
| Shares
|
|
|
| Amount
|
|
Shares sold
| | 1,524,426 | | | $ | 37,110,431 | | | 3,222,553 | | | $ | 74,540,329 | |
Shares issued to shareholders in payment of distributions declared
| |
15,360 |
|
|
| 374,890 |
|
| - -- |
|
|
| - -- |
|
Shares redeemed
|
| (3,143,270
| )
|
|
| (76,480,519
| )
|
| (2,034,854
| )
|
|
| (46,966,376
| )
|
NET CHANGE RESULTING FROM CLASS C SHARE TRANSACTIONS
|
| (1,603,484
| )
|
| $
| (38,995,198
| )
|
| 1,187,699
|
|
| $
| 27,573,953
|
|
| | | | | | | | | | | | | | |
Year Ended October 31
|
| 2005
|
| 2004
|
Class K Shares:
|
| Shares
|
|
|
| Amount
|
|
| Shares
|
|
|
| Amount
|
|
Shares sold
| | 280,524 | | | $ | 6,975,466 | | | 369,470 | | | $ | 8,693,597 | |
Shares issued to shareholders in payment of distributions declared
| |
958 |
| |
|
23,952 |
| |
4,241 |
|
|
|
100,637 |
|
Shares redeemed
|
| (376,707
| )
|
|
| (9,388,186
| )
|
| (671,497
| )
|
|
| (16,067,315
| )
|
NET CHANGE RESULTING FROM CLASS K SHARE TRANSACTIONS
|
| (95,225
| )
|
| $
| (2,388,768
| )
|
| (297,786
| )
|
| $
| (7,273,081
| )
|
NET CHANGE RESULTING FROM SHARE TRANSACTIONS
|
| (24,770,811
| )
|
| $
| (612,972,956
| )
|
| 13,104,116
|
|
| $
| 313,965,631
|
|
4. FEDERAL TAX INFORMATION
The timing and character of income and capital gain distributions are determined in accordance with income tax regulations, which may differ from GAAP. These differences are due in part to differing treatments for capital loss carryforward limitations.
For the year ended October 31, 2005, permanent differences identified and reclassified among the components of net assets were as follows:
Increase (Decrease)
|
Paid-In Capital
|
| Undistributed Net
Investment
Income (Loss)
|
| Accumulated Net
Realized Gains
|
$9,846,373
|
| $(127,557)
|
| $(9,718,816)
|
Net investment income (loss), net realized gains (losses), and net assets were not affected by this reclassification.
The tax character of distributions as reported on the Statement of Changes in Net Assets for the years ended October 31, 2005 and 2004, was as follows:
|
| 2005
|
| 2004
|
Ordinary income 1
|
| $23,773,855
|
| $10,977,969
|
Long Term Capital Gains
|
| $ 3,129,239
|
| - --
|
1 For tax purposes short-term capital gain distributions are considered ordinary income distributions.
As of October 31, 2005, the components of distributable earnings on a tax basis were as follows:
Undistributed ordinary income
|
| $
| 9,420,834
|
|
Undistributed long-term capital gains
|
| $
| 65,271,941
|
|
Net unrealized appreciation
|
| $
| 361,558,040
|
|
Capital loss carryforward
|
| $
| (22,118,899
| )
|
At October 31, 2005, the cost of investments for federal tax purposes was $2,552,877,949. The net unrealized appreciation of investments for federal tax purposes was $361,558,040. This consists of net unrealized appreciation from investments for those securities having an excess of value over cost of $429,442,025 and net unrealized depreciation from investments for those securities having an excess of cost over value of $67,883,985.
At October 31, 2005, the Fund had a capital loss carryforward of $(22,118,899) which will reduce the Fund's taxable income arising from future net realized gains on investments, if any, to the extent permitted by the Code and thus will reduce the amount of distributions to shareholders which would otherwise be necessary to relieve the Fund of any liability for federal tax. Pursuant to the Code, such capital loss carryforward will expire as follows:
Expiration Year
|
| Expiration Amount
|
2008
|
| $ (4,077,171)
|
2009
|
| $ (8,544,806)
|
2010
|
| $ (7,211,658)
|
2011
|
| $ (978,641)
|
2012
|
| $ (1,306,623)
|
As a result of the tax-free transfer of assets from Riggs Stock Fund, Rightime Mid Cap Fund, Federated New Economy Fund, First Merit Equity Fund, Vintage Equity Fund, and Vintage Growth Fund, certain capital loss carryforwards listed above may be limited.
The Fund used capital loss carryforward of $21,256,061 to offset taxable capital gains realized during the year ended October 31, 2005.
5. INVESTMENT ADVISER FEE AND OTHER TRANSACTIONS WITH AFFILIATES
Investment Adviser Fee
Federated Equity Management Company of Pennsylvania, the Fund's investment adviser (the "Adviser"), receives for its services an annual investment adviser fee equal to 0.75% of the Fund's average daily net assets. The Adviser may voluntarily choose to waive any portion of its fee. The Adviser can modify or terminate this voluntary waiver at any time at its sole discretion.
Pursuant to an Exemptive Order issued by the Securities and Exchange Commission, the Fund may invest in Prime Value Obligations Fund which is managed by the Adviser or an affiliate of the Adviser. The Adviser has agreed to reimburse the Fund for certain investment adviser fees as a result of these transactions. Income distributions earned from investments in this fund are recorded as income in the accompanying financial statements and totaled $76,434 for the period.
Administrative Fee
Federated Administrative Services (FAS), under the Administrative Services Agreement, provides the Fund with administrative personnel and services. The fee paid to FAS is based on the average aggregate daily net assets of all Federated funds as specified below:
Maximum
Administrative Fee
|
| Average Aggregate Daily Net Assets
of the Federated Funds
|
0.150%
|
| on the first $5 billion
|
0.125%
|
| on the next $5 billion
|
0.100%
|
| on the next $10 billion
|
0.075%
|
| on assets in excess of $20 billion
|
The administrative fee received during any fiscal year shall be at least $150,000 per portfolio and $40,000 per each additional class of Shares. FAS may voluntarily choose to waive any portion of its fee. FAS can modify or terminate this voluntary waiver at any time at its sole discretion. For the year ended October 31, 2005, the net fee paid to FAS was 0.076% of average aggregate daily net assets of the Fund.
Distribution Services Fee
The Fund has adopted a Distribution Plan (the "Plan") pursuant to Rule 12b-1 under the Act. Under the terms of the Plan, the Fund will compensate Federated Securities Corp. (FSC), the principal distributor, from the daily net assets of the Fund's Class A Shares, Class B Shares, Class C Shares, and Class K Shares to finance activities intended to result in the sale of these shares. The Plan provides that the Fund may incur distribution expenses according to the following schedule annually, to compensate FSC:
Share Class Name
|
| Percentage of Average Daily
Net Assets of Class
|
Class A Shares
|
| 0.25%
|
Class B Shares
|
| 0.75%
|
Class C Shares
|
| 0.75%
|
Class K Shares
|
| 0.50%
|
FSC may voluntarily choose to waive any portion of its fee. FSC can modify or terminate this voluntary waiver at any time at its sole discretion. Rather than paying financial intermediaries directly, the Fund may pay fees to FSC and FSC will use the fees to compensate financial intermediaries. For the year ended October 31, 2005, FSC retained $325,346 of fees paid by the Fund.
For the year ended October 31, 2005, Class A Shares did not incur a distribution services fee.
Sales Charges
For the year ended October 31, 2005, FSC retained $307,336 in sales charges from the sale of Class A Shares. FSC also retained $5,473 of contingent deferred sales charges relating to redemptions of Class A Shares and $13,572 relating to redemptions of Class C Shares. See "What Do Shares Cost?" in the Prospectus.
Shareholder Services Fee
The Fund may pay fees (Services Fees) up to 0.25% of the average daily net assets of the Fund's Class A Shares, Class B Shares, and Class C Shares to financial intermediaries or to Federated Shareholder Services Company (FSSC), a subsidiary of Federated Investors, Inc., for providing services to shareholders and maintaining shareholder accounts. Under certain agreements, rather than paying financial intermediaries directly, the Fund may pay Service Fees to FSSC and FSSC will use the fees to compensate financial intermediaries. FSSC or these financial intermediaries may voluntarily choose to waive any portion of their fee. This voluntary waiver can be modified or terminated at any time. For the year ended October 31, 2005, FSSC retained $229,943 of fees paid by the Fund.
Commencing on August 1, 2005, and continuing through November 29, 2005, FSSC is reimbursing daily a portion of the shareholder services fee. This reimbursement resulted from an administrative delay in the implementation of contractual terms of shareholder service fee agreements. The reimbursement amounted to $392,196 for the year ended October 31, 2005.
Expense Reduction
The Fund directs portfolio trades to a broker that in turn pays a portion of the Fund's operating expenses. For the year ended October 31, 2005, the Fund's expenses were reduced by $147,007 under these arrangements.
Other
Federated retained an outside law firm to perform an internal review of past mutual fund trading practices and report to a special investigative committee of Federated's Board. In conjunction with this review, the Independent Trustees of the Fund retained a financial expert to assess the impact of these trading practices. In accordance with the findings of the financial expert, the Fund's Adviser contributed $204,416 to the Fund during fiscal year 2004, which relates to a contribution to Paid-in Capital for detrimental impact to the Fund from frequent activity and detrimental impact on those Funds that may have resulted from orders incorrectly accepted by Federated employees after the Fund's closing times.
During the fiscal year 2005, the Fund's adviser made a voluntary contribution to the Fund of $186,934 for losses on investments inadvertently sold due to a systems error.
General
Certain of the Officers and Trustees of the Fund are Officers and Directors or Trustees of the above companies.
6. INVESTMENT TRANSACTIONS
Purchases and sales of investments, excluding long-term U.S. government securities and short-term obligations, for the year ended October 31, 2005, were as follows:
Purchases
|
| $
| 1,472,721,946
|
Sales
|
| $
| 2,035,979,682
|
7. LEGAL PROCEEDINGS
Beginning in October 2003, Federated Investors, Inc. and various subsidiaries thereof (including the advisers and distributor for various investment companies, collectively, "Federated"), along with various investment companies sponsored by Federated ("Funds") were named as defendants in several class action lawsuits now pending in the United States District Court for the District of Maryland. The lawsuits were purportedly filed on behalf of people who purchased, owned and/or redeemed shares of Federated-sponsored mutual funds during specified periods beginning November 1, 1998. The suits are generally similar in alleging that Federated engaged in illegal and improper trading practices including market timing and late trading in concert with certain institutional traders, which allegedly caused financial injury to the mutual fund shareholders. These lawsuits began to be filed shortly after Federated's first public announcement that it had received requests for information on shareholder trading activities in the Funds from the Securities and Exchange Commission ("SEC"), the Office of the New York State Attorney General ("NYAG"), and other authorities. In that regard, on November 28, 2005, Federated announced that it had reached final settlements with the SEC and the NYAG with respect to those matters. As Federated previously reported in 2004, it has already paid approximately $8.0 million to certain funds as determined by an independent consultant. As part of these settlements, Federated agreed to pay for the benefit of fund shareholders additional disgorgement and a civil money penalty in the aggregate amount of an additional $72 million. Federated and various Funds have also been named as defendants in several additional lawsuits, the majority of which are now pending in the United States District Court for the Western District of Pennsylvania, alleging, among other things, excessive advisory and rule 12b-1 fees. The Board of the Funds has retained the law firm of Dickstein Shapiro Morin & Oshinsky LLP to represent the Funds in these lawsuits. Federated and the Funds, and their respective counsel, are reviewing the allegations and will respond appropriately. Additional lawsuits based upon similar allegations may be filed in the future. The potential impact of these lawsuits, all of which seek unquantified damages, attorneys' fees and expenses, and future potential similar suits is uncertain. Although we do not believe that these lawsuits will have a material adverse effect on the Funds, there can be no assurance that these suits, the ongoing adverse publicity and/or other developments resulting from the regulatory investigations will not result in increased Fund redemptions, reduced sales of Fund shares, or other adverse consequences for the Funds.
8. FEDERAL TAX INFORMATION (UNAUDITED)
For the year ended October 31, 2005, the amount of long-term capital gains designated by the Fund was $3,129,239.
For the fiscal year ended October 31, 2005, 100.0% of total income (including short-term capital gain) distributions made by the Fund are qualifying dividends which may be subject to a maximum tax rate of 15%, as provided for by the Jobs and Growth Tax Relief Act of 2003. Complete information is reported in conjunction with the reporting of your distributions on Form 1099-DIV.
Of the ordinary income (including short-term capital gain) distributions made by the Fund during the year ended October 31, 2005, 100.0% qualify for the dividend received deduction available to corporate shareholders.
Report of Independent Registered Public Accounting Firm
TO THE BOARD OF TRUSTEES OF FEDERATED EQUITY FUNDS AND THE SHAREHOLDERS OF FEDERATED CAPITAL APPRECIATION FUND:
We have audited the accompanying statement of assets and liabilities, including the portfolio of investments, of Federated Capital Appreciation Fund (the "Fund"), a portfolio of Federated Equity Funds, as of October 31, 2005, and the related statement of operations for the year then ended, the statements of changes in net assets for each of the two years in the period then ended, and the financial highlights for each of the five years in the period then ended. These financial statements and financial highlights are the responsibility of the Fund's management. Our responsibility is to express an opinion on these financial statements and financial highlights based on our audits.
We conducted our audits in accordance with the standards of the Public Company Accounting Oversight Board (United States). Those standards require that we plan and perform the audit to obtain reasonable assurance about whether the financial statements and financial highlights are free of material misstatement. The Fund is not required to have, nor were we engaged to perform, an audit of its internal control over financial reporting. Our audits included consideration of internal control over financial reporting as a basis for designing audit procedures that are appropriate in the circumstances, but not for the purpose of expressing an opinion on the effectiveness of the Fund's internal control over financial reporting. Accordingly, we express no such opinion. An audit also includes examining, on a test basis, evidence supporting the amounts and disclosures in the financial statements, assessing the accounting principles used and significant estimates made by management, as well as evaluating the overall financial statement presentation. Our procedures included confirmation of securities owned as of October 31, 2005, by correspondence with the custodian and brokers; where replies were not received from brokers, we performed other auditing procedures. We believe that our audits provide a reasonable basis for our opinion.
In our opinion, such financial statements and financial highlights present fairly, in all material respects, the financial position of the Fund as of October 31, 2005, the results of its operations for the year then ended, the changes in its net assets, and its financial highlights for the respective stated periods, in conformity with accounting principles generally accepted in the United States of America.
Deloitte & Touche LLP
Boston, Massachusetts
December 20, 2005
Board of Trustees and Trust Officers
The Board is responsible for managing the Trust's business affairs and for exercising all the Trust's powers except those reserved for the shareholders. The following tables give information about each Board member and the senior officers of the Fund. Where required, the tables separately list Board members who are "interested persons" of the Fund (i.e., "Interested" Board members) and those who are not (i.e., "Independent" Board members). Unless otherwise noted, the address of each person listed is Federated Investors Tower, 1001 Liberty Avenue, Pittsburgh, PA. As of December 31, 2004, the Trust comprised eight portfolios, and the Federated Fund Complex consisted of 44 investment companies (comprising 133 portfolios). Unless otherwise noted, each Officer is elected annually. Unless otherwise noted, each Board member oversees all portfolios in the Federated Fund Complex and serves for an indefinite term. The Fund's Statement of Additional Information includes additional information about Trust Trustees and is available, without charge and upon request, by calling 1-800-341-7400.
INTERESTED TRUSTEES BACKGROUND
|
|
|
Name
Birth Date
Address
Positions Held with Trust
Date Service Began
|
| Principal Occupation(s) for Past Five Years,
Other Directorships Held and Previous Position(s)
|
John F. Donahue*
Birth Date: July 28, 1924
CHAIRMAN AND TRUSTEE
Began serving: April 1984 | | Principal Occupations : Chairman and Director or Trustee of the Federated Fund Complex; Chairman and Director, Federated Investors, Inc.
Previous Positions : Trustee, Federated Investment Management Company and Chairman and Director, Federated Investment Counseling. |
|
|
|
J. Christopher Donahue*
Birth Date: April 11, 1949
PRESIDENT AND TRUSTEE
Began serving: January 2000 | | Principal Occupations : Principal Executive Officer and President of the Federated Fund Complex; Director or Trustee of some of the Funds in the Federated Fund Complex; President, Chief Executive Officer and Director, Federated Investors, Inc.; Chairman and Trustee, Federated Investment Management Company; Trustee, Federated Investment Counseling; Chairman and Director, Federated Global Investment Management Corp.; Chairman, Passport Research, Ltd.; Trustee, Federated Shareholder Services Company; Director, Federated Services Company.
Previous Positions : President, Federated Investment Counseling; President and Chief Executive Officer, Federated Investment Management Company, Federated Global Investment Management Corp. and Passport Research, Ltd. |
|
|
|
|
|
|
Name
Birth Date
Address
Positions Held with Trust
Date Service Began
|
| Principal Occupation(s) for Past Five Years,
Other Directorships Held and Previous Position(s)
|
Lawrence D. Ellis, M.D.*
Birth Date: October 11, 1932
3471 Fifth Avenue
Suite 1111
Pittsburgh, PA
TRUSTEE
Began serving: August 1987 | | Principal Occupations : Director or Trustee of the Federated Fund Complex; Professor of Medicine, University of Pittsburgh; Medical Director, University of Pittsburgh Medical Center Downtown; Hematologist, Oncologist and Internist, University of Pittsburgh Medical Center.
Other Directorships Held : Member, National Board of Trustees, Leukemia Society of America.
Previous Positions : Trustee, University of Pittsburgh; Director, University of Pittsburgh Medical Center. |
|
|
|
* Family relationships and reasons for "interested" status: John F. Donahue is the father of J. Christopher Donahue; both are "interested" due to the positions they hold with Federated Investors, Inc. and its subsidiaries. Lawrence D. Ellis, M.D. is "interested" because his son-in-law is employed by the Fund's principal underwriter, Federated Securities Corp.
INDEPENDENT TRUSTEES BACKGROUND
|
|
|
Name
Birth Date
Address
Positions Held with Trust
Date Service Began
|
| Principal Occupation(s) for Past Five Years,
Other Directorships Held and Previous Position(s)
|
Thomas G. Bigley
Birth Date: February 3, 1934
15 Old Timber Trail
Pittsburgh, PA
TRUSTEE
Began serving: October 1995 | | Principal Occupation : Director or Trustee of the Federated Fund Complex.
Other Directorships Held : Director, Member of Executive Committee, Children's Hospital of Pittsburgh; Director, University of Pittsburgh.
Previous Position : Senior Partner, Ernst & Young LLP. |
|
|
|
John T. Conroy, Jr.
Birth Date: June 23, 1937
Investment Properties Corporation
3838 North Tamiami Trail
Suite 402
Naples, FL
TRUSTEE
Began serving: November 1991 | | Principal Occupations : Director or Trustee of the Federated Fund Complex; Chairman of the Board, Investment Properties Corporation; Partner or Trustee in private real estate ventures in Southwest Florida.
Previous Positions : President, Investment Properties Corporation; Senior Vice President, John R. Wood and Associates, Inc., Realtors; President, Naples Property Management, Inc. and Northgate Village Development Corporation. |
|
|
|
|
|
|
Name
Birth Date
Address
Positions Held with Trust
Date Service Began
|
| Principal Occupation(s) for Past Five Years,
Other Directorships Held and Previous Position(s)
|
Nicholas P. Constantakis
Birth Date: September 3, 1939
175 Woodshire Drive
Pittsburgh, PA
TRUSTEE
Began serving: February 1998 | | Principal Occupations : Director or Trustee of the Federated Fund Complex.
Other Directorships Held : Director and Member of the Audit Committee, Michael Baker Corporation (engineering and energy services worldwide).
Previous Position : Partner, Andersen Worldwide SC. |
|
|
|
John F. Cunningham
Birth Date: March 5, 1943
353 El Brillo Way
Palm Beach, FL
TRUSTEE
Began serving: January 1999 | | Principal Occupation : Director or Trustee of the Federated Fund Complex.
Other Directorships Held : Chairman, President and Chief Executive Officer, Cunningham & Co., Inc. (strategic business consulting); Trustee Associate, Boston College.
Previous Positions : Director, Redgate Communications and EMC Corporation (computer storage systems); Chairman of the Board and Chief Executive Officer, Computer Consoles, Inc.; President and Chief Operating Officer, Wang Laboratories; Director, First National Bank of Boston; Director, Apollo Computer, Inc. |
|
|
|
Peter E. Madden
Birth Date: March 16, 1942
One Royal Palm Way
100 Royal Palm Way
Palm Beach, FL
TRUSTEE
Began serving: November 1991 | | Principal Occupation : Director or Trustee of the Federated Fund Complex.
Other Directorships Held : Board of Overseers, Babson College.
Previous Positions : Representative, Commonwealth of Massachusetts General Court; President, State Street Bank and Trust Company and State Street Corporation (retired); Director, VISA USA and VISA International; Chairman and Director, Massachusetts Bankers Association; Director, Depository Trust Corporation; Director, The Boston Stock Exchange. |
|
|
|
Charles F. Mansfield, Jr.
Birth Date: April 10, 1945
80 South Road
Westhampton Beach, NY
TRUSTEE
Began serving: January 1999 | | Principal Occupations : Director or Trustee of the Federated Fund Complex; Management Consultant; Executive Vice President, DVC Group, Inc. (marketing communications and technology) (prior to 9/1/00).
Previous Positions : Chief Executive Officer, PBTC International Bank; Partner, Arthur Young & Company (now Ernst & Young LLP); Chief Financial Officer of Retail Banking Sector, Chase Manhattan Bank; Senior Vice President, HSBC Bank USA (formerly, Marine Midland Bank); Vice President, Citibank; Assistant Professor of Banking and Finance, Frank G. Zarb School of Business, Hofstra University. |
|
|
|
|
|
|
Name
Birth Date
Address
Positions Held with Trust
Date Service Began
|
| Principal Occupation(s) for Past Five Years,
Other Directorships Held and Previous Position(s)
|
John E. Murray, Jr., J.D., S.J.D.
Birth Date: December 20, 1932
Chancellor, Duquesne University
Pittsburgh, PA
TRUSTEE
Began serving: February 1995 | | Principal Occupations : Director or Trustee of the Federated Fund Complex; Chancellor and Law Professor, Duquesne University; Partner, Murray, Hogue and Lannis.
Other Directorships Held : Director, Michael Baker Corp. (engineering, construction, operations and technical services).
Previous Positions : President, Duquesne University; Dean and Professor of Law, University of Pittsburgh School of Law; Dean and Professor of Law, Villanova University School of Law. |
|
|
|
Marjorie P. Smuts
Birth Date: June 21, 1935
4905 Bayard Street
Pittsburgh, PA
TRUSTEE
Began serving: April 1984 | | Principal Occupations : Director or Trustee of the Federated Fund Complex; Public Relations/Marketing Consultant/Conference Coordinator.
Previous Positions : National Spokesperson, Aluminum Company of America; television producer; President, Marj Palmer Assoc.; Owner, Scandia Bord. |
|
|
|
John S. Walsh
Birth Date: November 28, 1957
2604 William Drive
Valparaiso, IN
TRUSTEE
Began serving: January 1999 | | Principal Occupations : Director or Trustee of the Federated Fund Complex; President and Director, Heat Wagon, Inc. (manufacturer of construction temporary heaters); President and Director, Manufacturers Products, Inc. (distributor of portable construction heaters); President, Portable Heater Parts, a division of Manufacturers Products, Inc.
Previous Position : Vice President, Walsh & Kelly, Inc. |
|
|
|
OFFICERS
|
|
|
Name
Birth Date
Positions Held with Trust
Date Service Began
|
| Principal Occupation(s) for Past Five Years and Previous Position(s)
|
John W. McGonigle
Birth Date: October 26, 1938
EXECUTIVE VICE PRESIDENT
AND SECRETARY
Began serving: April 1984 | | Principal Occupations: Executive Vice President and Secretary of the Federated Fund Complex; Vice Chairman, Executive Vice President, Secretary and Director, Federated Investors, Inc.
Previous Positions: Trustee, Federated Investment Management Company and Federated Investment Counseling; Director, Federated Global Investment Management Corp., Federated Services Company and Federated Securities Corp. |
|
|
|
Richard J. Thomas
Birth Date: June 17, 1954
TREASURER
Began serving: November 1998 | | Principal Occupations : Principal Financial Officer and Treasurer of the Federated Fund Complex; Senior Vice President, Federated Administrative Services.
Previous Positions : Vice President, Federated Administrative Services; held various management positions within Funds Financial Services Division of Federated Investors, Inc. |
|
|
|
Richard B. Fisher
Birth Date: May 17, 1923
VICE PRESIDENT
Began serving: April 1984 | | Principal Occupations : Vice Chairman or Vice President of some of the Funds in the Federated Fund Complex; Vice Chairman, Federated Investors, Inc.; Chairman, Federated Securities Corp.
Previous Positions : President and Director or Trustee of some of the Funds in the Federated Fund Complex; Executive Vice President, Federated Investors, Inc. and Director and Chief Executive Officer, Federated Securities Corp. |
|
|
|
Stephen F. Auth
Birth Date: September 3, 1956
CHIEF INVESTMENT OFFICER
Began serving: November 2002 | | Principal Occupations : Chief Investment Officer of this Fund and various other Funds in the Federated Fund Complex; Executive Vice President, Federated Investment Counseling, Federated Global Investment Management Corp., Federated Equity Management Company of Pennsylvania and Passport Research II, Ltd.
Previous Positions : Executive Vice President, Federated Investment Management Company, and Passport Research, Ltd.; Senior Vice President, Global Portfolio Management Services Division; Senior Vice President, Federated Investment Management Company and Passport Research, Ltd.; Senior Managing Director and Portfolio Manager, Prudential Investments. |
|
|
|
|
|
|
Name
Birth Date
Positions Held with Trust
Date Service Began
|
| Principal Occupation(s) for Past Five Years and Previous Position(s)
|
Lawrence Auriana
Birth Date: January 8, 1944
VICE PRESIDENT
Began serving: November 2001 | | Lawrence Auriana has been the Fund's Portfolio Manager since February 1986. He is Vice President of the Trust. Mr. Auriana joined Federated in April 2001 as Co-Head of Investments/Federated Kaufmann. From August 1984 to April 2001, Mr. Auriana was President and Treasurer of Edgemont Asset Management Corp., and Chairman of the Board and Portfolio Manager to The Kaufmann Fund, Inc. (predecessor to the Federated Kaufmann Fund). Mr. Auriana earned a B.S. in economics from Fordham University and has been engaged in the securities business since 1965. |
|
|
|
James E. Grefenstette
Birth Date: November 7, 1962
VICE PRESIDENT
Began serving: November 1998 | | James E. Grefenstette is Vice President of the Trust. Mr. Grefenstette joined Federated in 1992 and has been a Portfolio Manager since 1994. Mr. Grefenstette became a Senior Vice President of the Fund's Adviser in January 2000. He served as a Vice President of the Fund's Adviser from 1996 through 1999 and was an Assistant Vice President of the Fund's Adviser from 1994 until 1996. Mr. Grefenstette is a Chartered Financial Analyst; he received his M.S. in Industrial Administration from Carnegie Mellon University. |
|
|
|
Hans P. Utsch
Birth Date: July 3, 1936
VICE PRESIDENT
Began serving: November 2001 | | Hans P. Utsch has been the Fund's Portfolio Manager since February 1986. He is Vice President of the Trust. Mr. Utsch joined Federated in April 2001 as Co-Head of Investments/Federated Kaufmann. From August 1984 to April 2001, Mr. Utsch was Chairman of the Board and Secretary of Edgemont Asset Management Corp., and President and Portfolio Manager to The Kaufmann Fund, Inc. (predecessor to the Federated Kaufmann Fund). Mr. Utsch graduated from Amherst College and holds an M.B.A. from Columbia University. He has been engaged in the securities business since 1962. |
|
|
|
Board Review of Advisory Contract
As required by the Act, the Fund's Board has reviewed the Fund's investment advisory contract. The Board's decision to approve the contract reflects the exercise of its business judgment on whether to continue the existing arrangements. During its review of the contract, the Board considers many factors, among the most material of which are: the Fund's investment objectives; the Adviser's management philosophy, personnel, processes, and investment and operating strategies; long term performance; the preferences and expectations of Fund shareholders and their relative sophistication; the continuing state of competition in the mutual fund industry; the range of comparable fees for similar funds in the mutual fund industry; the range and quality of services provided to the Fund and its shareholders by the Federated organization in addition to investment advisory services; and the Fund's relationship to the Federated family of funds which include a comprehensive array of funds with different investment objectives, policies and strategies which are available for exchange without the incurrence of additional sales charge.
In its decision to appoint or renew the Adviser, the Board is mindful of the potential disruptions of the Fund's operations and various risks, uncertainties and other effects that could occur as a result of a decision to terminate or not renew an advisory contract. In particular, the Board recognizes that most shareholders have invested in the Fund on the strength of the Adviser's industry standing and reputation and in the expectation that the Adviser will have a continuing role in providing advisory services to the Fund. Thus, the Board's "selection" or approval of the Adviser must reflect the fact that it is the shareholders who have effectively selected the Adviser by virtue of having invested in the Fund. The Board also considers the compensation and benefits received by the Adviser. This includes fees received for services provided to the Fund by other entities in the Federated organization and research services received by the Adviser from brokers that execute fund trades, as well as advisory fees. In this regard, the Board is aware that various courts have interpreted provisions of the Act and have indicated in their decisions that the following factors may be relevant to an Adviser's fiduciary duty with respect to its receipt of compensation from a fund: the nature and quality of the services provided by the Adviser, including the performance of the Fund; the Adviser's cost of providing the services; the extent to which the Adviser may realize "economies of scale" as the Fund grows larger; any indirect benefits that may accrue to the Adviser and its affiliates as a result of the Adviser's relationship with the Fund; performance and expenses of comparable funds; and the extent to which the independent Board members are fully informed about all facts bearing on the Adviser's service and fee. The Fund's Board is aware of these factors and is guided by them in its review of the Fund's advisory contract to the extent they are appropriate and relevant, as discussed further below.
The Board considers and weighs these circumstances in light of its substantial accumulated experience in governing the Fund and working with Federated on matters relating to the Federated funds, and is assisted in its deliberations by the advice of independent legal counsel. In this regard, the Board requests and receives substantial and detailed information about the Fund and the Federated organization. Federated provides much of this information at each regular meeting of the Board, and furnishes additional reports in connection with the particular meeting at which the Board's formal review of the advisory contract occurs. In between regularly scheduled meetings, the Board may receive information on particular matters as the need arises. Thus, the Board's evaluation of an advisory contract is informed by reports covering such matters as: the Adviser's investment philosophy, personnel, and processes; operating strategies; the Fund's short- and long-term performance (in absolute terms, both on a gross basis and net of expenses, as well as in relationship to its particular investment program and certain competitor or "peer group" funds and/or other benchmarks, as appropriate), and comments on the reasons for performance; the Fund's expenses (including the advisory fee itself and the overall expense structure of the Fund, both in absolute terms and relative to similar and/or competing funds, with due regard for contractual or voluntary expense limitations); the use and allocation of brokerage commissions derived from trading the Fund's portfolio securities (if any); the nature and extent of the advisory and other services provided to the Fund by the Adviser and its affiliates; compliance and audit reports concerning the Federated funds and the Federated companies that service them (including communications from regulatory agencies), as well as Federated's responses to any issues raised therein; and relevant developments in the mutual fund industry and how the Federated funds and/or Federated are responding to them. The evaluation process is evolutionary, reflecting continually developing considerations. The criteria considered and the emphasis placed on relevant criteria change in recognition of changing circumstances in the mutual fund marketplace. For the past year, the Board concluded that the nature, quality and scope of services provided the fund by the Adviser and its affiliates was satisfactory.
With respect to the Fund's performance and expenses in particular, the Board has found the use of comparisons to other mutual funds with comparable investment programs to be particularly useful, given the high degree of competition in the mutual fund business. The Board focuses on comparisons with other similar mutual funds (rather than non-mutual fund products or services) because, simply put, they are more relevant. For example, other mutual funds are the products most like the Fund, they are readily available to Fund shareholders as alternative investment vehicles, and they are the type of investment vehicle in fact chosen and maintained by the Fund's investors. The range of their fees and expenses therefore appears to be a generally reliable indication of what consumers have found to be reasonable in the precise marketplace in which the Fund competes. The Fund's ability to deliver competitive performance when compared to its peer group may be a useful indicator of how the Adviser is executing on the Fund's investment program, which would in turn assist the Board in reaching a conclusion that the nature, extent, and quality of the Adviser's investment management services are such as to warrant continuation of the advisory contract. The Fund's performance fell below the median of the relevant peer group for both the one and three year periods ending December 31, 2004. The Board discussed the Fund's performance with the Adviser and recognized the efforts being undertaken by the Adviser. The Board will continue to monitor these efforts and the performance of the Fund. During the year ending December 31, 2004, the Fund's investment advisory fee after waivers and expense reimbursements, if any, was above the median of the relevant peer group. The Board reviewed the fees and other expenses of the Fund with the Adviser and was satisfied that the overall expense structure of the Fund nevertheless remained competitive. The Board will continue to monitor advisory fees and other expenses borne by the Fund.
The Board also receives financial information about Federated, including reports on the compensation and benefits Federated derives from its relationships with the Federated funds. These reports cover not only the fees under the advisory contracts, but also fees received by Federated's subsidiaries for providing other services to the Federated funds under separate contracts (e.g., for serving as the Federated funds' administrator). The reports also discuss any indirect benefit Federated may derive from its receipt of research services from brokers who execute Federated fund trades as well as waivers of fees and/or reimbursements of expenses. In order for a fund to be competitive in the marketplace, Federated and its affiliates frequently waive fees and/or reimburse expenses. Although the Board considers the costs incurred and the profitability of the Federated organization as a whole, it does not evaluate, on a fund-by-fund basis, Federated's "profitability" and/or "costs" (which would include an assessment as to whether "economies of scale" would be realized if the fund were to grow to some sufficient size). In the Board's view, the cost of performing advisory services on a fund-specific basis is both difficult to estimate satisfactorily and a relatively minor consideration in its overall evaluation. Analyzing isolated funds would require constructed allocations of the costs of shared resources and operations based on artificial assumptions that are inconsistent with the existing relationships within a large and diversified family of funds that receive advisory and other services from the same organization. In addition, the availability of the exchange privilege among funds in the Federated family makes consideration of the overall cost and profitability of Federated more relevant than that of individual funds. Based upon this review, the Board is satisfied that the costs incurred in, as well as the profitability realized from, managing the Fund and the other Federated Funds are appropriate. Although the Board is always interested in discovering any genuine "economies of scale," its experience has been that such "economies" are likely to arise only when a fund grows dramatically, and becomes and remains very large in size. Even in these instances, purchase and redemption activity, as well as the presence of expense limitations (if any), may offset any perceived economies. As suggested above, the Board considers the information it receives about the Fund's performance and expenses as compared to an appropriate set of similar competing funds to be more relevant.
The Board bases its decision to approve an advisory contract on the totality of the circumstances and relevant factors and with a view to past and future long-term considerations. Not all of the factors and considerations identified above are relevant to every Federated fund, nor does the Board consider any one of them to be determinative. With respect to the factors that are relevant, the Board's decision to approve the contract reflects its determination that Federated's performance and actions provide a satisfactory basis to support the decision to continue the existing arrangements.
Voting Proxies on Fund Portfolio Securities
A description of the policies and procedures that the Fund uses to determine how to vote proxies, if any, relating to securities held in the Fund's portfolio is available, without charge and upon request, by calling 1-800-341-7400. A report on "Form N-PX" of how the Fund voted any such proxies during the most recent 12-month period ended June 30 is available through Federated's website. Go to FederatedInvestors.com, select "Products," select the "Prospectuses and Regulatory Reports" link, then select the Fund to access the link to Form N-PX. This information is also available from the EDGAR database on the SEC's website at www.sec.gov.
Quarterly Portfolio Schedule
The Fund files with the SEC a complete schedule of its portfolio holdings, as of the close of the first and third quarters of its fiscal year, on "Form N-Q." These filings are available on the SEC's website at www.sec.gov and may be reviewed and copied at the SEC's Public Reference Room in Washington, DC. (Call 1-800-SEC-0330 for information on the operation of the Public Reference Room.) You may also access this information from the "Products" section of the Federated Investors website at FederatedInvestors.com by clicking on "Portfolio Holdings" and selecting the name of the Fund, or by selecting the name of the Fund and clicking on "Portfolio Holdings." You must register on the website the first time you wish to access this information.
Mutual funds are not bank deposits or obligations, are not guaranteed by any bank, and are not insured or guaranteed by the U.S. government, the Federal Deposit Insurance Corporation, the Federal Reserve Board, or any other government agency. Investment in mutual funds involves investment risk, including the possible loss of principal. This report is authorized for distribution to prospective investors only when preceded or accompanied by the Fund's prospectus, which contains facts concerning its objective and policies, management fees, expenses, and other information.
Federated
World-Class Investment Manager
Federated Capital Appreciation Fund
Federated Investors Funds
5800 Corporate Drive
Pittsburgh, PA 15237-7000
Contact us at FederatedInvestors.com
or call 1-800-341-7400.
Federated Securities Corp., Distributor
Cusip 314172701
Cusip 314172800
Cusip 314172883
Cusip 314172594
G01649-04 (12/05)
Federated is a registered mark of Federated Investors, Inc. 2005 (c)Federated Investors, Inc.
Federated
World-Class Investment Manager
Federated Kaufmann Fund
Established 2001
A Portfolio of Federated Equity Funds
5TH ANNUAL SHAREHOLDER REPORT
October 31, 2005
Class K Shares
FINANCIAL HIGHLIGHTS
SHAREHOLDER EXPENSE EXAMPLE
MANAGEMENT'S DISCUSSION OF FUND PERFORMANCE
PORTFOLIO OF INVESTMENTS SUMMARY TABLE
PORTFOLIO OF INVESTMENTS
STATEMENT OF ASSETS AND LIABILITIES
STATEMENT OF OPERATIONS
STATEMENT OF CHANGES IN NET ASSETS
NOTES TO FINANCIAL STATEMENTS
REPORT OF INDEPENDENT REGISTERED PUBLIC ACCOUNTING FIRM
BOARD OF TRUSTEES AND TRUST OFFICERS
BOARD REVIEW OF ADVISORY CONTRACT
VOTING PROXIES ON FUND PORTFOLIO SECURITIES
QUARTERLY PORTFOLIO SCHEDULE
Not FDIC Insured * May Lose Value * No Bank Guarantee
Financial Highlights-Class K Shares
(For a Share Outstanding Throughout Each Period)
|
| Year Ended
10/31/2005
|
Net Asset Value, Beginning of Period
| | $5.11 | |
Income From Investment Operations:
| | | |
Net investment income (loss)
| | (0.05 | ) 4 |
Net realized and unrealized gain (loss) on investments, options and foreign currency transactions
|
| 0.75
|
|
TOTAL FROM INVESTMENT OPERATIONS
|
| 0.70
|
|
Less Distributions:
| | | |
Distributions from net realized gain on investments, options and foreign currency transactions
|
| (0.29
| )
|
Net Asset Value, End of Period
|
| $5.52
|
|
Total Return 6
|
| 14.25
| %
|
| | | |
Ratios to Average Net Assets:
|
|
|
|
Net expenses
|
| 1.95
| %
|
Net investment income (loss)
|
| (1.01
| )%
|
Expense waiver/reimbursement 9
|
| 0.45
| %
|
Supplemental Data:
|
|
|
|
Net assets, end of period (000 omitted)
|
| $3,856,427
|
|
Portfolio turnover
|
| 71
| %
|
Redemption fees consisted of the following per share amounts 10
|
| $0.00
| 11
|
1 Effective January 1, 2004, Federated Equity Management Company of Pennsylvania became the Fund's investment adviser.
2 The Fund changed its fiscal year end from December 31 to October 31. Effective April 23, 2001, Federated Investment Management Company served as the Fund's investment adviser. Prior to April 23, 2001, Edgemont Asset Management Corporation served as the Fund's investment adviser.
3 Beginning with the period ended October 31, 2001, the Fund was audited by Ernst & Young LLP. Each of the previous years was audited by another Independent Registered Public Accounting Firm.
4 Per share numbers have been calculated using the average shares method, which more appropriately represents the per share data for the period since the use of the undistributed income method did not accord with results of operations.
5 Effective November 1, 2001, the Fund adopted the provisions of the American Institute of Certified Public Accountants (AICPA) Audit and Accounting Guide for Investment Companies and began accreting discount/amortizing premium on long-term debt securities. For the year ended October 31, 2002, this change had no effect on the net investment income (loss) per share, the net realized and unrealized gain (loss) on investments per share, or the ratio of net investment income (loss) to average net assets. Per share, ratios and supplemental data for periods prior to November 1, 2001 have not been restated to reflect this change in presentation.
6 Based on net asset value, which does not reflect the sales charge, redemption fee, or contingent deferred sales charge, if applicable. Total returns for periods of less than one year are not annualized.
7 During the period, the Fund was reimbursed by the Adviser, which had an impact of 0.21% on total returns. (See Notes to Financial Statements, Note 5.)
8 Computed on an annualized basis.
9 This expense decrease is reflected in both the net expense and the net investment income (loss) ratios shown above.
10 Effective November 1, 2001, the Fund adopted the provisions of the revised AICPA Audit and Accounting Guide for Investment Companies which requires the disclosure of the per share effect of redemption fees. Periods prior to October 31, 2001 have not been restated to reflect this change.
11 Represents less than $0.01.
See Notes which are an integral part of the Financial Statements
| Year Ended October 31,
|
| Period Ended | | | Year Ended | |
| 2004
| 1
|
| 2003
|
|
| 2002
|
| 10/31/2001
| 2,3
|
| 12/31/2000
|
|
| $4.90 | | | $3.54 | | | $4.23 | | $4.43 | | | $5.95 | |
| | | | | | | | | | | | | |
| (0.06 | ) 4 | | (0.06 | ) 4 | | (0.05 | ) 4,5 | (0.03 | ) 4 | | (0.05 | ) |
|
0.31
|
|
| 1.42
|
|
| (0.28
| ) 5
| (0.17
| )
|
| 0.76
|
|
| 0.25
|
|
| 1.36
|
|
| (0.33
| )
| (0.20
| )
|
| 0.71
|
|
| | | | | | | | | | | | | |
|
(0.04
| )
|
| - --
|
|
| (0.36
| )
| - --
|
|
| (2.23
| )
|
| $5.11
|
|
| $4.90
|
|
| $3.54
|
| $4.23
|
|
| $4.43
|
|
| 5.24
| % 7
|
| 38.42
| %
|
| (8.92
| )%
| (4.51
| )%
|
| 10.86
| %
|
| | | | | | | | | | | | | |
|
|
|
|
|
|
|
|
|
|
|
|
|
|
| 1.95
| %
|
| 1.95
| %
|
| 1.95
| %
| 1.95
| % 8
|
| 1.89
| %
|
| (1.29
| )%
|
| (1.46
| )%
|
| (1.25
| )% 5
| (0.48
| )% 8
|
| (0.80
| )%
|
| 0.47
| %
|
| 0.52
| %
|
| 0.45
| %
| 0.30
| % 8
|
| 0.12
| %
|
|
|
|
|
|
|
|
|
|
|
|
|
|
|
| $3,534,720
|
|
| $3,494,765
|
|
| $2,603,263
|
| $3,018,540
|
|
| $3,367,994
|
|
| 73
| %
|
| 72
| %
|
| 65
| %
| 74
| %
|
| 78
| %
|
| $0.00
| 11
|
| $0.00
| 11
|
| $0.00
| 11
| $0.00
| 11
|
| - --
|
|
Shareholder Expense Example
As a shareholder of the Fund, you incur two types of costs: (1) transactions costs, including sales charges (loads) on purchase or redemption payments; and redemption/exchange fees; and (2) ongoing costs, including management fees; to the extent applicable, distribution (12b-1) fees and/or shareholder services fees; and other Fund expenses. This Example is intended to help you to understand your ongoing costs (in dollars) of investing in the Fund and to compare these costs with the ongoing costs of investing in other mutual funds. It is based on an investment of $1,000 invested at the beginning of the period and held for the entire period from May 1, 2005 to October 31, 2005.
ACTUAL EXPENSES
The first section of the table below provides information about actual account values and actual expenses. You may use the information in this section, together with the amount you invested, to estimate the expenses that you incurred over the period. Simply divide your account value by $1,000 (for example, an $8,600 account value divided by $1,000 = 8.6), then multiply the result by the number in the first section under the heading entitled "Expenses Paid During Period" to estimate the expenses attributable to your investment during this period.
HYPOTHETICAL EXAMPLE FOR COMPARISON PURPOSES
The second section of the table below provides information about hypothetical account values and hypothetical expenses based on the Fund's actual expense ratio and an assumed rate of return of 5% per year before expenses, which is not the Fund's actual return. Thus, you should not use the hypothetical account values and expenses to estimate the actual ending account balance or your expenses for the period. Rather, these figures are provided to enable you to compare the ongoing costs of investing in the Fund and other funds. To do so, compare this 5% hypothetical example with the 5% hypothetical examples that appear in the shareholder reports of the other funds.
Please note that the expenses shown in the table are meant to highlight your ongoing costs only and do not reflect any transaction costs, such as sales charges (loads) on purchase or redemption payments, or redemption/exchange fees. Therefore, the second section of the table is useful in comparing ongoing costs only, and will not help you determine the relative total costs of owning different funds. In addition, if these transaction costs were included, your costs would have been higher.
|
| Beginning
Account Value
5/1/2005
|
| Ending
Account Value
10/31/2005
|
| Expenses Paid
During Period 1
|
Actual
|
| $1,000
|
| $1,124.20
|
| $10.39
|
Hypothetical (assuming a 5% return before expenses)
|
| $1,000
|
| $1,015.43
|
| $ 9.86
|
1 Expenses are equal to the Fund's annualized net expense ratio of 1.94%, multiplied by the average account value over the period, multiplied by 184/365 (to reflect the one-half year period).
Management's Discussion of Fund Performance
The Federated Kaufmann Fund's Class K Shares produced a total return of 14.25% based on net asset value for the reporting period ended October 31, 2005. The fund's benchmark, the Russell Mid-Cap Growth Index 1 had a total return of 15.91% for the reporting period. The Lipper Mid-Cap Growth Index 2 and the Lipper Mid-Cap Growth Funds Average 3 had total returns of 14.19% and 14.07%, respectively.
Economic growth remained modest during the reporting period and was somewhat effected by higher energy prices and an active hurricane season. Generally mid- and small-cap growth companies continued to deliver double-digit earnings growth. Stock selection contributed to the performance of the fund. Two of our largest holdings, Advance Auto Parts and CB Richard Ellis Services , each returned over 40% during the reporting period contributing strongly to performance. Four Healthcare sector holdings, INAMED Corp , United Surgical Partners International, Inc., Cubist Pharmaceuticals, Inc. , and Kyphon, Inc. each returned over 30% during the reporting period contributing positively to performance. Two Technology sector holdings, MEMC Electronic Materials and M-Systems Flash Disk Pioneer, Ltd. , each returned over 85% during the reporting period contributing strongly to performance. Weakness in two significant pet supply retailers, PETsMart, Inc. (26)% and PETCO Animal Supplies, Inc. (46)%, hurt performance during the reporting period.
The fund's performance was also negatively impacted by the fund's relatively light exposure to the Energy and Utility sectors, which were strong performers in the benchmark index and in many of the best-performing funds in the category. At Federated Kaufmann Fund, we generally prefer companies that are growing profitably as a result of some proprietary product or service or way of doing business, whereas many Energy-related companies have been growing more as a result of commodity pricing and the regulatory environment.
1 Russell Midcap Growth Index measures the performance of those Russell Midcap companies with higher price-to-book ratios and higher forecasted growth values. The stocks are also members of the Russell 1000 Growth Index. The index is unmanaged, and unlike the fund, is not affected by cashflows. Investments cannot be made in an index.
2 Lipper Mid-Cap Growth Index is the composite performance of the largest mid-cap- growth mutual funds, as categorized by Lipper, Inc. The index is unmanaged, and unlike the fund, is not affected by cashflows. Investments cannot be made in an index.
3 Lipper figures represent the average of the total returns reported by all the mutual funds designated by Lipper, Inc. as falling into the category indicated. They do not reflect sales charges.
The following tables show the Fund's rankings and total returns as compared with its Lipper peer group and benchmark as of October 31, 2005.
Lipper Ranking Based on Total Returns 2
|
| 1-Year
|
| 2-Year
|
| 3-Year
|
| 5-Year
|
| 10-Year
|
| 15-Year
|
Federated Kaufmann Fund--Class K Shares
|
| 271
|
| 242
|
| 99
|
| 21
|
| 13
|
| 1
|
Total Number of Mid-Cap Growth Funds
|
| 542
|
| 499
|
| 445
|
| 325
|
| 121
|
| 44
|
Average Annual Total Returns for the Period Ended 10/31/2005
|
| 6-Month
(Cumulative)
|
| 1-Year
|
| 3-Year
|
| 5-Year
|
| 10-Year
|
| 15-Year
|
Federated Kaufmann Fund--Class K Shares 3
|
| 12.20%
|
| 14.02%
|
| 18.42%
|
| 6.51%
|
| 11.23%
|
| 17.66%
|
RMGI 4
|
| 11.37%
|
| 15.91%
|
| 20.65%
|
| (3.71)%
|
| 9.05%
|
| 12.86%
|
LMCGI 4
|
| 13.00%
|
| 14.19%
|
| 16.73%
|
| (5.25)%
|
| 6.96%
|
| 12.54%
|
Performance data quoted represents past performance which is no guarantee of future results. Investment return and principal value will fluctuate so that an investor's shares, when redeemed, may be worth more or less than their original cost. Mutual fund performance changes over time and current performance may be lower or higher than what is stated. For current to the most recent month-end performance and after-tax returns, visit FederatedInvestors.com or call 1-800-341-7400. Returns shown do not reflect the deduction of taxes that a shareholder would pay on Fund distributions or the redemption of Fund shares. Mutual funds are not obligations of or guaranteed by any bank and are not federally insured.
1 Represents a hypothetical investment of $10,000 in the Fund. The ending value of the Fund reflects a 0.20% redemption fee. The Fund's performance assumes the reinvestment of all dividends and distributions. The Russell Midcap Growth Index (RMGI) and the Lipper Mid-Cap Growth Index (LMCGI) have been adjusted to reflect reinvestment of all dividends on securities in the indexes.
2 Lipper rankings are based on total return and do not take sales charges into account.
3 Total returns reflect the 0.20% redemption fee.
4 The RMGI and the LMCGI are not adjusted to reflect sales charges, expenses, or other fees that the SEC requires to be reflected in the Fund's performance. The RMGI measures the performance of those Russell mid-cap companies with higher price-to-book ratios and higher forecasted growth values. The stocks are also members of the Russell 1000 Growth Index. The LMCGI is an equal dollar-weighted index of the largest mutual funds within the mid-cap growth classification, as defined by Lipper, Inc. The index is adjusted for the reinvestment of capital gains and income dividends. The indexes are unmanaged, and, unlike the Fund, are not affected by cashflows. Investments cannot be made in an index.
Performance data quoted represents past performance which is no guarantee of future results. Investment return and principal value will fluctuate so that an investor's shares, when redeemed, may be worth more or less than their original cost. Mutual fund performance changes over time and current performance may be lower or higher than what is stated. For current to the most recent month-end performance, visit FederatedInvestors.com or call 1-800-341-7400.
Portfolio of Investments Summary Table
At October 31, 2005, the Fund's sector composition 1 was as follows:
Sector
|
| Percentage of
Total Net Assets
|
Healthcare
|
| 20.7
| %
|
Information Technology
|
| 17.7
| %
|
Consumer Discretionary
|
| 16.2
| %
|
Financials
|
| 15.5
| %
|
Industrials
|
| 13.8
| %
|
Energy
|
| 3.4
| %
|
Telecommunication Services
|
| 2.3
| %
|
Consumer Staples
|
| 1.8
| %
|
Materials
|
| 0.9
| %
|
Utilities
|
| 0.2
| %
|
Options 2
|
| 0.0
| %
|
Securities Lending Collateral 3
|
| 5.3
| %
|
Cash Equivalents 4
|
| 7.2
| %
|
Other Assets and Liabilities--Net 5
|
| (5.0
| )%
|
TOTAL
|
| 100.0
| %
|
1 Except for Securities Lending Collateral, Options, Cash Equivalents and Other Assets and Liabilities, sector classifications are based upon, and individual portfolio securities are assigned to, the classifications of the Global Industry Classification Standard (GICS) except that the adviser assigns a classification to securities not classified by the GICS and to securities for which the adviser does not have access to the classification made by the GICS.
2 Represent less than 0.01%.
3 Cash collateral received from lending portfolio securities which is invested in short term investments such as repurchase agreements or money market funds.
4 Cash Equivalents includes any investments in money market mutual funds and/or overnight repurchase agreements other than those representing securities lending collateral.
5 See Statement of Assets and Liabilities.
Portfolio of Investments
October 31, 2005
Shares or
Units Held
|
|
|
|
| Value
|
|
| | | COMMON STOCKS--90.8% | | | | |
| | | Consumer Discretionary--16.0% | | | | |
| 750,000 | 1 | 1-800-FLOWERS.COM, Inc.
| | $ | 5,092,500 | |
| 8,491,800 | 1,2 | Advance Auto Parts, Inc.
| | | 318,442,500 | |
| 923,600 | 1 | Bed Bath & Beyond, Inc.
| | | 37,424,272 | |
| 1,778,895 | | Bharat Forge Ltd.
| | | 12,711,186 | |
| 784,700 | 1,2,3 | Brillian Corp.
| | | 5,147,632 | |
| 200,000 | 3 | Carnival Corp.
| | | 9,934,000 | |
| 600,000 | | Centex Corp.
| | | 38,610,000 | |
| 2,000,000 | 1,2,3 | Central European Media Enterprises Ltd., Class A
| | | 92,980,000 | |
| 2,938,500 | 1,3 | Clear Media Ltd.
| | | 2,468,693 | |
| 300,000 | 1,2,3 | Concorde Career Colleges, Inc.
| | | 4,500,000 | |
| 200,000 | | D. R. Horton, Inc.
| | | 6,138,000 | |
| 370,600 | 3 | DSW, Inc., Class A
| | | 7,715,892 | |
| 161,400 | 1,3 | Dick's Sporting Goods, Inc.
| | | 4,830,702 | |
| 500,000 | 3 | Domino's Pizza, Inc.
| | | 11,960,000 | |
| 1,659,300 | 1,3 | Earle M. Jorgensen Co.
| | | 14,070,864 | |
| 1,000,000 | 1 | Educate, Inc.
| | | 11,780,000 | |
| 475,000 | 1,3 | Expedia, Inc.
| | | 8,925,250 | |
| 582,500 | 1,3 | Garmin Ltd.
| | | 33,452,975 | |
| 350,000 | 1,3 | Getty Images, Inc.
| | | 29,053,500 | |
| 101,156 | 1 | Hollywood Media Corp., Warrants 5/22/2007
| | | 247,949 | |
| 475,000 | 1,3 | IAC Interactive Corp.
| | | 12,160,000 | |
| 10,000,000 | 2 | J.D. Wetherspoon PLC
| | | 52,274,343 | |
| 1,000,000 | 1 | Kohl's Corp.
| | | 48,130,000 | |
| 1,000,000 | 1,3 | Lamar Advertising Co.
| | | 44,620,000 | |
| 215,500 | 1 | Liberty Global, Inc., Class A
| | | 5,337,935 | |
| 215,500 | 1 | Liberty Global, Inc., Class C
| | | 5,111,660 | |
| 700,000 | 1,3 | Lodgenet Entertainment
| | | 9,100,000 | |
| 435,900 | 1 | Maidenform Brands, Inc.
| | | 5,487,981 | |
| 1,000,000 | 3 | Orient-Express Hotel Ltd.
| | | 28,200,000 | |
Shares or
Units Held
|
|
|
|
| Value
|
|
| | | COMMON STOCKS--continued | | | | |
| | | Consumer Discretionary--continued | | | | |
| 459,200 | 1,3 | PETCO Animal Supplies, Inc.
| | $ | 8,729,392 | |
| 9,040,100 | 2 | PETsMART, Inc.
| | | 212,442,350 | |
| 188,400 | 1 | Pantaloon Retail India Ltd.
| | | 6,311,319 | |
| 32,396 | | SKY Perfect Communications, Inc.
| | | 23,272,235 | |
| 300,000 | | Speedway Motorsports, Inc.
| | | 10,638,000 | |
| 375,000 | 1,3 | Stamps.com, Inc.
| | | 7,560,000 | |
| 500,000 | 1,4,5 | Submarino SA
| | | 13,140,000 | |
| 600,000 | 1 | Texas Roadhouse, Inc.
| | | 9,444,000 | |
| 249,200 | 1,3 | TomTom NV
| | | 9,595,746 | |
| 664,100 | 3 | USS Co. Ltd.
| | | 45,500,728 | |
| 10,000 | | Washington Post Co., Class B
| | | 7,450,000 | |
| 900,000 | 1,3 | Williams-Sonoma, Inc.
| | | 35,199,000 | |
| 59,800 | | Winnebago Industries, Inc.
|
|
| 1,753,336
|
|
| | | TOTAL
|
|
| 1,256,943,940
|
|
| | | Consumer Staples--1.8% | | | | |
| 1,800,000 | 1,3 | Dean Foods Co.
| | | 65,070,000 | |
| 300,000 | 1 | Shoppers Drug Mart Corp.
| | | 9,979,680 | |
| 850,000 | 1,4,5 | Shoppers Drug Mart Corp.
| | | 28,340,530 | |
| 400,000 | 1,3 | TreeHouse Foods, Inc.
| | | 10,336,000 | |
| 190,000 | | Whole Foods Market, Inc.
|
|
| 27,384,700
|
|
| | | TOTAL
|
|
| 141,110,910
|
|
| | | Energy--3.4% | | | | |
| 351,600 | 3 | Arch Coal, Inc.
| | | 27,097,812 | |
| 400,000 | 3 | ENSCO International, Inc.
| | | 18,236,000 | |
| 500,000 | 3 | Kinder Morgan, Inc.
| | | 45,450,000 | |
| 715,900 | 1,3 | Nabors Industries Ltd.
| | | 49,132,217 | |
| 200,000 | 3 | Noble Corp.
| | | 12,876,000 | |
| 200,000 | 1 | Oceaneering International, Inc.
| | | 9,624,000 | |
| 100,000 | 1 | Oil States International, Inc.
| | | 3,310,000 | |
| 550,300 | 3 | Peabody Energy Corp.
| | | 43,011,448 | |
| 794,600 | 1 | The Houston Exploration Co.
| | | 40,961,630 | |
| 200,000 | 1,3 | Transocean Sedco Forex, Inc.
| | | 11,498,000 | |
| 130,300 | 1 | Trico Marine Services, Inc.
|
|
| 3,321,347
|
|
| | | TOTAL
|
|
| 264,518,454
|
|
Shares or
Units Held
|
|
|
|
| Value
|
|
| | | COMMON STOCKS--continued | | | | |
| | | Financials--15.4% | | | | |
| 2,903,235 | | 3i Group
| | $ | 38,951,526 | |
| 2,490,300 | 3 | Advance America Cash Advance, Inc.
| | | 30,257,145 | |
| 1 | 4,5 | Apollo Investment Fund V
| | | 6,406,743 | |
| 510,000 | 1 | Assurant, Inc.
| | | 19,482,000 | |
| 2,000,000 | | Axis Capital Holdings Ltd.
| | | 51,860,000 | |
| 4,000,000 | 1,2 | CB Richard Ellis Services
| | | 195,400,000 | |
| 705,000 | | Calamos Asset Management, Inc.
| | | 17,124,450 | |
| 745,000 | | Capital One Financial Corp.
| | | 56,880,750 | |
| 114,293,000 | 1 | China Construction Bank
| | | 34,647,199 | |
| 1 | 4,5 | Denovo Ventures I LP
| | | 4,180,000 | |
| 1,440,600 | | Endurance Specialty Holdings Ltd.
| | | 47,770,296 | |
| 1 | 1,4,5 | FA Private Equity Fund IV LP
| | | 394,673 | |
| 842,400 | 1,3 | First Marblehead Corp.
| | | 24,926,616 | |
| 200,000 | | Global Signal, Inc.
| | | 8,290,000 | |
| 1 | 4,5 | Greenfield Technology Venture Fund
| | | 14,642 | |
| 885,000 | | ICICI Bank Ltd.
| | | 9,778,788 | |
| 563,000 | | IPC Holdings LTD
| | | 14,823,790 | |
| 1 | 4,5 | Incuvest LLC
| | | 0 | |
| 1 | 1,4,5 | Infrastructure Fund
| | | 130,214 | |
| 1 | 4,5 | Internet.com Corp.
| | | 0 | |
| 541,600 | 1 | James River Group, Inc.
| | | 10,236,240 | |
| 655,500 | | Korea Investment Holdings Co. Ltd.
| | | 17,134,660 | |
| 2,850,000 | 1,3 | Labranche & Co. Inc.
| | | 27,189,000 | |
| 1 | 4,5 | Latin Healthcare Fund
| | | 11,007,388 | |
| 121,800 | 1 | Markel Corp.
| | | 38,732,400 | |
| 2,900,000 | 3 | Nuveen Investments, Class A
| | | 117,363,000 | |
| 1 | 4,5 | Peachtree/CB Partners
| | | 0 | |
| 1 | 4,5 | Peachtree Leadscope LLC
| | | 68,340 | |
| 1 | 1,4,5 | Peachtree Leadscope LLC
| | | 300,000 | |
| 1 | 4,5 | Peachtree Open Networks
| | | 132,750 | |
| 1 | 4,5 | Peachtree Velquest
| | | 4,775 | |
| 855,000 | 1,3 | Philadelphia Consolidated Holding Corp.
| | | 82,302,300 | |
| 418,700 | 1,4,5 | RHJ International
| | | 9,784,926 | |
| 1 | 4,5 | Rocket Ventures II
| | | 0 | |
Shares or
Units Held
|
|
|
|
| Value
|
|
| | | COMMON STOCKS--continued | | | | |
| | | Financials--continued | | | | |
| 212,790 | 3 | SFCG Co. Ltd.
| | $ | 51,075,086 | |
| 14,072,500 | 3 | Shinsei Bank Ltd.
| | | 82,037,360 | |
| 735,000 | | St. Joe Co.
| | | 48,473,250 | |
| 350,000 | 3 | U-Store-It Trust
| | | 7,301,000 | |
| 116,000 | 3 | White Mountains Insurance Group, Inc.
| | | 70,168,400 | |
| 1,935,000 | 3 | Willis Group Holdings Ltd.
|
|
| 71,865,900
|
|
| | | TOTAL
|
|
| 1,206,495,607
|
|
| | | Healthcare--20.2% | | | | |
| 500,000 | 1 | ATS Medical, Inc.
| | | 1,494,750 | |
| 1,640,200 | 1 | AVANIR Pharmaceuticals, Class A
| | | 5,068,218 | |
| 700,000 | 1,3 | Abiomed, Inc.
| | | 6,041,000 | |
| 91,400 | 1 | Adeza Biomedical Corp.
| | | 1,558,370 | |
| 1,069,200 | 1,3 | Alexion Pharmaceuticals, Inc.
| | | 29,285,388 | |
| 2,539,800 | 1,3 | Alkermes, Inc.
| | | 41,373,342 | |
| 900,000 | 3 | Allergan, Inc.
| | | 80,370,000 | |
| 850,000 | 1,3 | Amylin Pharmaceuticals, Inc.
| | | 28,560,000 | |
| 1,000,000 | 1,2 | Anika Therapeutics, Inc.
| | | 12,340,000 | |
| 650,000 | 1,4,5 | Aradigm Corp., Warrants 12/17/2006
| | | 6,737 | |
| 434,259 | 1 | Ardais Corp., Warrants 1/1/2005
| | | 0 | |
| 434,259 | 1,4 | Ardais Corp., Warrants 4/14/2009
| | | 0 | |
| 802,300 | 1,3 | Arena Pharmaceuticals, Inc.
| | | 8,343,920 | |
| 360,300 | 1,3 | Arthrocare Corp.
| | | 13,233,819 | |
| 806,900 | 1,3 | Aspect Medical Systems, Inc.
| | | 26,321,078 | |
| 649,000 | 1 | Auxilium Pharmaceutical, Inc.
| | | 2,531,100 | |
| 3,000,000 | 1,2,3 | Avigen, Inc.
| | | 8,100,000 | |
| 1,387,600 | 1,3 | BioMarin Pharmaceutical, Inc.
| | | 11,655,840 | |
| 1,000,000 | 1,3 | Bioenvision, Inc.
| | | 6,130,000 | |
| 100,000 | 1,3 | Biosite Diagnostics, Inc.
| | | 5,523,000 | |
| 100,000 | | Cardinal Health, Inc.
| | | 6,251,000 | |
| 950,000 | 1 | Caremark Rx, Inc.
| | | 49,780,000 | |
| 800,000 | 1,3 | Charles River Laboratories International, Inc.
| | | 35,008,000 | |
| 555,000 | 1,2 | Chindex International, Inc.
| | | 2,042,400 | |
| 111,000 | 1,2 | Chindex International, Inc., Warrants 3/31/2009
| | | 158,401 | |
| 347,492 | 4,5 | CompBenefits Corp.
| | | 304,055 | |
Shares or
Units Held
|
|
|
|
| Value
|
|
| | | COMMON STOCKS--continued | | | | |
| | | Healthcare--continued | | | | |
| 3,634,700 | 1,2,3 | Conceptus, Inc.
| | $ | 37,328,369 | |
| 625,000 | 4,5 | Conceptus, Inc.
| | | 5,776,875 | |
| 714,286 | 2,4,5 | Conceptus, Inc.
| | | 7,335,717 | |
| 600,000 | 1,2,4,5 | Conceptus, Inc.
| | | 6,162,000 | |
| 500,000 | 1,4,5 | Cortek, Inc.
| | | 200,000 | |
| 3,000,000 | 1,2,3 | Cubist Pharmaceuticals, Inc.
| | | 60,630,000 | |
| 4,451,300 | 1,3 | Cytyc Corp.
| | | 112,840,455 | |
| 837,100 | 1 | Dexcom, Inc.
| | | 10,890,671 | |
| 500,000 | 1,3 | Digene Corp.
| | | 15,100,000 | |
| 4,587,300 | 1,2 | Dyax Corp.
| | | 19,496,025 | |
| 5,204,200 | 1,2,3 | Dynavax Technologies Corp.
| | | 30,756,822 | |
| 868,800 | 1 | Endo Pharmaceuticals Holdings, Inc.
| | | 23,388,096 | |
| 3,555,556 | 1 | Endologix, Inc.
| | | 16,782,224 | |
| 2,312,250 | 1,2,4,5 | Endologix, Inc.
| | | 10,913,820 | |
| 600,000 | 1 | Endologix, Inc.
| | | 2,832,000 | |
| 1,250,000 | 1,4,5 | Endologix, Inc.
| | | 5,900,000 | |
| 494,200 | 1,3 | Eyetech Pharmaceuticals, Inc.
| | | 8,717,688 | |
| 1,979,000 | 1,2,3 | GTX, Inc.
| | | 17,415,200 | |
| 159,000 | 3 | GlaxoSmithKline PLC, ADR
| | | 8,266,410 | |
| 500,000 | | Guidant Corp.
| | | 31,500,000 | |
| 1,744,100 | 1 | INAMED Corp.
| | | 124,005,510 | |
| 2,478,200 | 1,2,3 | Illumina, Inc.
| | | 38,585,574 | |
| 860,000 | 1,3 | Immunicon Corp.
| | | 3,318,740 | |
| 1,200,000 | 1,3 | Incyte Genomics, Inc.
| | | 5,988,000 | |
| 4,000,000 | 1,2,3 | Isis Pharmaceuticals, Inc.
| | | 17,360,000 | |
| 4,705,882 | 1,4,5 | Isis Pharmaceuticals, Inc.
| | | 18,381,175 | |
| 1,176,470 | 1 | Isis Pharmaceuticals, Inc., Warrants 8/23/2010
| | | 2,581,934 | |
| 1,000,000 | 1 | Kinetic Concepts, Inc.
| | | 35,900,000 | |
| 1,193,800 | 1 | Kosan Biosciences, Inc.
| | | 8,464,042 | |
| 1,183,100 | 1,3 | Kyphon, Inc.
| | | 47,430,479 | |
| 200,000 | 1,3 | Medicines Co.
| | | 3,428,000 | |
| 99,200 | | Meridian Bioscience, Inc.
| | | 2,077,248 | |
| 2,559,000 | 1,2 | Metabasis Therapeutics, Inc.
| | | 12,180,840 | |
| 895,650 | 1,4,5 | Metabasis Therapeutics, Inc., Warrants 9/30/2010
| | | 2,940,852 | |
Shares or
Units Held
|
|
|
|
| Value
|
|
| | | COMMON STOCKS--continued | | | | |
| | | Healthcare--continued | | | | |
| 94,451 | 1 | Migenix, Inc.
| | $ | 30,388 | |
| 768,100 | 1,3 | Momenta Pharmaceuticals, Inc.
| | | 16,537,193 | |
| 1,109,000 | 1,2 | NMT Medical, Inc.
| | | 12,975,300 | |
| 1,743,700 | 1 | Nektar Therapeutics
| | | 26,260,122 | |
| 723,800 | 1,3 | Neurochem, Inc.
| | | 11,037,950 | |
| 500,000 | 1,3 | Neurocrine Biosciences, Inc.
| | | 26,410,000 | |
| 64,600 | 1,3 | Neurometrix, Inc.
| | | 2,405,058 | |
| 1,476,635 | 1,3 | Nicox
| | | 6,884,925 | |
| 849,500 | 1,3 | Northfield Laboratories, Inc.
| | | 10,567,780 | |
| 310,200 | | Novartis AG, ADR
| | | 16,694,964 | |
| 1,735,300 | 1,2 | NxStage Medical, Inc.
| | | 19,695,655 | |
| 106,500 | 1,3 | OSI Pharmaceuticals, Inc.
| | | 2,481,450 | |
| 200,000 | 1,3 | Onyx Pharmaceuticals, Inc.
| | | 5,138,000 | |
| 2,556,800 | 1,2,3 | Pharmacyclics, Inc.
| | | 18,920,320 | |
| 516,896 | 1 | Point Therapeutics, Inc.
| | | 1,897,008 | |
| 805,300 | 1,3 | Progenics Pharmaceuticals, Inc.
| | | 18,956,762 | |
| 168,300 | 1 | Psychiatric Solutions, Inc.
| | | 9,206,010 | |
| 436,687 | 1,3 | Rita Medical Systems, Inc.
| | | 1,458,535 | |
| 458,965 | 1 | Sanarus Medical, Inc., Warrants
| | | 0 | |
| 100,000 | 1 | Sangamo BioSciences, Inc.
| | | 463,000 | |
| 5,607,353 | 1,2,3 | Santarus, Inc.
| | | 34,485,221 | |
| 401,000 | 1,3 | Sepracor, Inc.
| | | 22,556,250 | |
| 200,000 | 1 | Symbion, Inc.
| | | 4,526,000 | |
| 1,731,600 | 1,3 | Threshold Pharmaceuticals, Inc., Class THL
| | | 19,116,864 | |
| 500,000 | | UnitedHealth Group, Inc.
| | | 28,945,000 | |
| 3,000,000 | 1,2,3 | United Surgical Partners International, Inc.
| | | 107,550,000 | |
| 344,900 | 1,3 | VCA Antech, Inc.
| | | 8,898,420 | |
| 1,000,000 | 1,3 | Vasogen, Inc.
| | | 2,670,000 | |
| 1,858,600 | 1,2 | Vical, Inc.
| | | 9,497,446 | |
| 171,300 | 1,3 | WebMD Health Corp., Class A
| | | 4,474,356 | |
| 1,410,138 | 1,2 | World Heart Corp., Warrants 9/22/2008
|
|
| 646,058
|
|
| | | TOTAL
|
|
| 1,587,741,219
|
|
Shares or
Units Held
|
|
|
|
| Value
|
|
| | | COMMON STOCKS--continued | | | | |
| | | Industrials--13.8% | | | | |
| 2,636,800 | 1,3 | ABX Air, Inc.
| | $ | 21,068,032 | |
| 505,400 | | Bharat Heavy Electricals Ltd.
| | | 12,916,228 | |
| 1,800,000 | | CNF Transportation, Inc.
| | | 101,286,000 | |
| 3,000,000 | | Cendant Corp.
| | | 52,260,000 | |
| 2,400,000 | | Chicago Bridge & Iron Co., N.V.
| | | 53,520,000 | |
| 744,500 | 1,3 | CoStar Group, Inc.
| | | 35,698,775 | |
| 111,100 | 1,3 | Commercial Vehicle Group, Inc.
| | | 2,168,672 | |
| 100,000 | 1 | Copart, Inc.
| | | 2,339,000 | |
| 1,600,000 | 3 | Cummins, Inc.
| | | 136,592,000 | |
| 500,000 | 3 | DRS Technologies, Inc.
| | | 24,630,000 | |
| 1,200,000 | | Expeditors International Washington, Inc.
| | | 72,804,000 | |
| 1,000,000 | | FedEx Corp.
| | | 91,930,000 | |
| 200,000 | | Fluor Corp.
| | | 12,720,000 | |
| 902,600 | | Forward Air Corp.
| | | 31,997,170 | |
| 495,700 | 1 | Genco Shipping & Trading Ltd.
| | | 8,144,351 | |
| 108,700 | 1 | Global Cash Access LLC
| | | 1,523,974 | |
| 1,995,000 | 1,2,3 | Interline Brands, Inc.
| | | 38,962,350 | |
| 283,100 | 1,3 | K&F Industries Holdings, Inc.
| | | 4,427,684 | |
| 400,000 | 1,3 | Kansas City Southern Industries, Inc.
| | | 8,864,000 | |
| 274,209 | | Kuehne & Nagel International AG
| | | 64,178,480 | |
| 462,600 | 1 | Landstar System, Inc.
| | | 17,819,352 | |
| 105,800 | | Larsen & Toubro Ltd.
| | | 3,315,082 | |
| 1,265,600 | 1,2,3 | NuCo2, Inc.
| | | 28,982,240 | |
| 80,300 | 1 | RBC Bearings, Inc.
| | | 1,254,286 | |
| 2,190,000 | | Rinker Group Ltd.
| | | 24,844,273 | |
| 750,000 | 1,3 | Ryanair Holdings PLC, ADR
| | | 37,177,500 | |
| 2,164,200 | 1,2 | Seaspan Corp.
| | | 40,600,392 | |
| 1,042,500 | 3 | Simpson Manufacturing Co., Inc.
| | | 41,137,050 | |
| 62,100 | 1 | Suzlon Energy Ltd.
| | | 990,334 | |
| 1,000,000 | | TNT NV
| | | 23,605,271 | |
| 1,000,000 | | United Parcel Service, Inc.
| | | 72,940,000 | |
| 709,900 | 3 | Vicor Corp.
|
|
| 11,961,815
|
|
| | | TOTAL
|
|
| 1,082,658,311
|
|
Shares or
Units Held
|
|
|
|
| Value
|
|
| | | COMMON STOCKS--continued | | | | |
| | | Information Technology--17.2% | | | | |
| 400,000 | 1 | ATI Technologies, Inc.
| | | 5,757,345 | |
| 1,445,000 | | Adtran, Inc.
| | | 43,711,250 | |
| 156,700 | 1,3 | Advanced Analogic Technologies, Inc.
| | | 1,708,030 | |
| 1,200,000 | 1,3 | Affiliated Computer Services, Inc., Class A
| | | 64,932,000 | |
| 74,400 | 1,3 | Altiris, Inc.
| | | 1,257,360 | |
| 800,000 | 1,3 | Amdocs Ltd.
| | | 21,176,000 | |
| 1,000,000 | 1,3 | Autodesk, Inc.
| | | 45,130,000 | |
| 803,900 | 1,3 | Blackboard Inc.
| | | 22,589,590 | |
| 150,000 | 1 | Broadcom Corp.
| | | 6,369,000 | |
| 3,138,200 | 1 | CSR PLC
| | | 39,976,301 | |
| 1,250,000 | 1,3 | Check Point Software Technologies Ltd.
| | | 27,950,000 | |
| 2,000,000 | 1,3 | Cirrus Logic, Inc.
| | | 13,120,000 | |
| 500,000 | 1,3 | Cogent, Inc.
| | | 13,275,000 | |
| 375,000 | 1,3 | Cognos, Inc.
| | | 14,073,750 | |
| 1,000,000 | 1 | Comverse Technology, Inc.
| | | 25,100,000 | |
| 308,100 | 1 | DST Systems, Inc.
| | | 17,290,572 | |
| 352,323 | 1,4,5 | Decision Management International, Inc.
| | | 0 | |
| 1,500,000 | 1,2,3 | eCollege.com
| | | 23,865,000 | |
| 1,000,000 | 1,3 | Entegris, Inc.
| | | 9,760,000 | |
| 1,059,322 | 4,5 | Expand Networks Ltd.
| | | 199,153 | |
| 787,500 | 1 | Filenet Corp.
| | | 22,168,125 | |
| 155,100 | 1 | Google Inc.
| | | 57,718,914 | |
| 250,000 | 1,3 | Greenfield Online, Inc.
| | | 1,255,000 | |
| 500,000 | 1 | Hewitt Associates, Inc.
| | | 13,345,000 | |
| 1,500,000 | 1 | Homestore.com, Inc.
| | | 5,445,000 | |
| 932,700 | 1 | Hyperion Solutions Corp.
| | | 45,105,372 | |
| 1,133,900 | 1,2,3 | Infocrossing, Inc.
| | | 7,835,249 | |
| 356,234 | 1,2 | Infocrossing, Inc., Warrants 10/21/2008
| | | 560,859 | |
| 1,000,000 | | Infosys Technologies Ltd.
| | | 56,171,969 | |
| 539,400 | 1,3 | Intrado, Inc.
| | | 10,431,996 | |
| 287,500 | 1,3 | Iron Mountain, Inc.
| | | 11,212,500 | |
| 1,300,000 | 1,3 | Komag, Inc.
| | | 34,866,000 | |
| 1,000,000 | 1,3 | LG Philips LCD Co. Ltd., ADR
| | | 19,010,000 | |
Shares or
Units Held
|
|
|
|
| Value
|
|
| | | COMMON STOCKS--continued | | | | |
| | | Information Technology--continued | | | | |
| 198,500 | 1 | LeCroy Corp.
| | $ | 3,048,960 | |
| 1,450,000 | 1 | M-Systems Flash Disk Pioneers Ltd.
| | | 45,950,500 | |
| 4,500,000 | 1,3 | MEMC Electronic Materials
| | | 80,730,000 | |
| 300,000 | 1 | Macromedia, Inc.
| | | 13,176,000 | |
| 4,680,000 | 1,2,3 | Magma Design Automation
| | | 40,622,400 | |
| 1,600,000 | 3 | Microsemi Corp.
| | | 37,072,000 | |
| 3,000,000 | | Microsoft Corp.
| | | 77,100,000 | |
| 900,000 | 1,3 | Mobility Electronics, Inc.
| | | 8,127,000 | |
| 2,192,800 | 1,3 | NAVTEQ Corp.
| | | 85,782,336 | |
| 3,075,000 | 1,2 | NIC, Inc.
| | | 18,603,750 | |
| 900,000 | 1,3 | NetIQ Corp.
| | | 10,791,000 | |
| 1,787,500 | 1,2 | Online Resources Corp.
| | | 21,450,000 | |
| 530,000 | 1,2,4,5 | Online Resources Corp.
| | | 6,360,000 | |
| 3,000,000 | 1 | Oracle Corp.
| | | 38,040,000 | |
| 915,000 | 1,3 | Portalplayer, Inc.
| | | 18,473,850 | |
| 1,191,600 | 1,2,3 | PowerDsine Ltd.
| | | 11,367,864 | |
| 1,550,000 | 1 | Quest Software, Inc.
| | | 21,560,500 | |
| 1,500,000 | 1 | S1 Corp.
| | | 6,585,000 | |
| 220,000 | 1,3 | SI International, Inc.
| | | 6,351,400 | |
| 880,100 | 1 | SSA Global Technologies, Inc.
| | | 13,773,565 | |
| 9,400 | | Samsung Electronics Co.
| | | 5,011,755 | |
| 170,000 | 1,3 | Sandisk Corp.
| | | 10,011,300 | |
| 495,900 | | Satyam Computer Services Ltd., ADR
| | | 16,949,862 | |
| 92,400 | 1 | Seagate Technology Holdings
| | | 1,338,876 | |
| 1 | 4,5 | Sensable Technologies, Inc.
| | | 200,559 | |
| 3,751,199 | 4,5 | Sensable Technologies, Inc.
| | | 0 | |
| 1,001,900 | 1,3 | Sigmatel Inc.
| | | 13,635,859 | |
| 1,100,000 | 1 | TNS, Inc.
| | | 19,338,000 | |
| 495,100 | 1,3 | TRX, Inc.
| | | 4,238,056 | |
| 63,542 | 1 | Tidel Technologies, Inc.
| | | 16,521 | |
| 903,900 | 1,3 | Ultratech Stepper, Inc.
| | | 12,455,742 | |
| 400,000 | 1,3 | ValueClick, Inc.
| | | 7,000,000 | |
| 837,500 | 1 | Visual Networks, Inc.
| | | 1,046,875 | |
| 570,600 | 1 | Xyratex Ltd.
|
|
| 7,725,924
|
|
| | | TOTAL
|
|
| 1,346,301,789
|
|
Shares or
Units Held
|
|
|
|
| Value
|
|
| | | COMMON STOCKS--continued | | | | |
| | | Materials--0.9% | | | | |
| 379,780 | | Cemex S.A. de C.V., ADR
| | $ | 19,775,144 | |
| 19,910,000 | | China Metal International Ho
| | | 5,714,548 | |
| 305,100 | 1 | Frutarom
| | | 2,416,331 | |
| 694,900 | | Frutarom, GDR
| | | 5,503,469 | |
| 24,292,000 | 1 | Lee & Man Paper Manufacturing Ltd.
| | | 22,796,338 | |
| 380,000 | 3 | Newmont Mining Corp.
|
|
| 16,188,000
|
|
| | | TOTAL
|
|
| 72,393,830
|
|
| | | Telecommunication Services--2.0% | | | | |
| 322,376 | | Alltel Corp.
| | | 19,942,179 | |
| 6,000,000 | 1 | Bharti Televentures
| | | 43,177,202 | |
| 695,700 | 1 | Consolidated Communications Holdings, Inc.
| | | 9,224,982 | |
| 348,800 | 1,3 | NeuStar, Inc., Class A
| | | 10,673,280 | |
| 20,000 | 3 | PT Telekomunikasi Indonesia, Class CS, ADR
| | | 407,200 | |
| 15,055,000 | 3 | Singapore Telecom Ltd.
| | | 20,710,347 | |
| 1,237,800 | 1 | Syniverse Holdings, Inc.
| | | 22,404,180 | |
| 4,000,000 | 1,2,3 | Time Warner Telecom, Inc.
|
|
| 33,520,000
|
|
| | | TOTAL
|
|
| 160,059,370
|
|
| | | Utilities--0.1% | | | | |
| 200,000 | 3 | Consolidated Water Co.
| | | 3,688,000 | |
| 10,000 | | Electricity Generating PLC
| | | 18,140 | |
| 1,480,000 | 1 | National Thermal Power Corp. Ltd.
|
|
| 3,195,119
|
|
| | | TOTAL
|
|
| 6,901,259
|
|
| | | TOTAL COMMON STOCKS (IDENTIFIED COST $5,191,375,905)
|
|
| 7,125,124,689
|
|
| | | PREFERRED STOCKS--1.0% | | | | |
| | | Financials--0.1% | | | | |
| 297,600 | | Merrill Lynch & Co., Inc., Conv. Pfd., Series JNC
|
|
| 11,348,976
|
|
| | | Healthcare--0.5% | | | | |
| 686,009 | 1,4,5 | Acadia Pharmaceuticals, Inc., Conv. Pfd.
| | | 7,203,094 | |
| 1,694,915 | 4,5 | Ardais Corp., Conv. Pfd.
| | | 16,949 | |
| 790,960 | 4,5 | Ardais Corp., Conv. Pfd., Series C
| | | 7,909 | |
| 3,985 | 4,5 | CompBenefits Corp., Pfd.
| | | 2,105,742 | |
| 4,761,904 | 4,5 | Converge Medical, Inc., Pfd., Series C
| | | 0 | |
| 446,816 | 4,5 | Cortek, Inc., Conv. Pfd., Series D2
| | | 178,726 | |
| 1,515,152 | 4,5 | Cortex, Inc., Pfd., Series D
| | | 606,061 | |
| 126,065 | 4,5 | Dexcom, Inc., Pfd.
| | | 1,476,095 | |
Shares,
Units Held
or Principal
Amount
|
|
|
|
| Value
|
|
| | | PREFERRED STOCKS--continued | | | | |
| | | Healthcare--continued | | | | |
| 1,041,666 | 4,5 | Dexcom, Inc., Pfd., Series B
| | $ | 13,552,075 | |
| 217,391 | 4,5 | Dexcom, Inc., Pfd., Series C
| | | 2,828,257 | |
| 645,161 | 4,5 | Dia Dexus, Pfd., Series C
| | | 0 | |
| 70,838 | 4,5 | Migenix, Inc., Conv. Pfd.
| | | 18,233 | |
| 70,838 | 1 | Migenix, Inc., Conv. Pfd.
| | | 22,791 | |
| 1,058,043 | 4,5 | Sanarus Medical, Inc., Pfd., Series A
| | | 1,150,093 | |
| 1,448,436 | 4,5 | Sanarus Medical, Inc., Pfd., Series B
| | | 1,733,778 | |
| 4,456,271 | 4,5 | Sanarus Medical, Inc., Pfd., Series C
| | | 3,030,264 | |
| 3,555,987 | | Sanarus Medical, Inc., Pfd., Series D
|
|
| 2,837,678
|
|
| | | TOTAL
|
|
| 36,767,745
|
|
| | | Information Technology--0.1% | | | | |
| 20,000 | 3 | Marchex, Inc., Conv. Pfd.
| | | 3,700,000 | |
| 679,348 | 4,5 | Multiplex, Inc., Pfd., Series C
| | | 108,696 | |
| 2,000,000 | 4,5 | Ryan Hankin Kent, Inc., Pfd., Series B
| | | 0 | |
| 1,333,334 | 4,5 | Sensable Technologies, Inc., Pfd., Series B
| | | 0 | |
| 443,979 | 4,5 | Sensable Technologies, Inc., Pfd., Series C
|
|
| 0
|
|
| | | TOTAL
|
|
| 3,808,696
|
|
| | | Telecommunication Services--0.3% | | | | |
| 500,000 | | Crown Castle International Corp., Conv. Pfd., $3.13, Annual Dividend
|
|
| 25,912,500
|
|
| | | TOTAL PREFERRED STOCKS (IDENTIFIED COST $84,896,469)
|
|
| 77,837,917
|
|
| | | CORPORATE BONDS--0.7% | | | | |
| | | Consumer Discretionary--0.2% | | | | |
| $ | 16,500,000 | 4,5 | Citadel Broadcasting Corp., Conv. Bond, 1.875%, 2/15/2011
|
|
| 12,930,555
|
|
| | | Consumer Staples--0.0% | | | | |
| 3,500,000 | | B&G Foods Holdings Corp., Sr. Note, 8.00%, 10/1/2011
|
|
| 3,548,125
|
|
| | | Healthcare--0.0% | | | | |
| 1 | | Ardais Corp., Conv. Bond, 8.00%, 12/31/2005
|
|
| 21,712
|
|
| | | Industrials--0.0% | | | | |
| 1,000,000 | | Roper Industries, Inc., Conv. Bond, 1.4813%, 1/15/2034
|
|
| 534,340
|
|
| | | Information Technology--0.4% | | | | |
| 25,000,000 | 4,5 | BearingPoint, Inc., Conv. Bond, 5.00%, 4/15/2025
|
|
| 32,337,750
|
|
| | | Telecommunication Services--0.0% | | | | |
| 2,000,000 | | American Tower Systems Corp., Sr. Note, 7.125%, 10/15/2012
|
|
| 2,080,000
|
|
| | | Utilities--0.1% | | | | |
| 5,000,000 | 3 | Calpine Corp., Sr. Note, 10.50%, 5/15/2006
|
|
| 4,325,000
|
|
| | | TOTAL CORPORATE BONDS (IDENTIFIED COST $52,827,997)
|
|
| 55,777,482
|
|
Shares or
Principal
Amount
|
|
|
|
| Value
|
|
| | | CORPORATE NOTES--0.0% | | | | |
| | | Healthcare--0.0% | | | | |
| 1 | 4,5 | Ardais Corp., Conv. Bond, 12/31/2005 (IDENTIFIED COST $434,259)
|
| $
| 21,712
|
|
| | | PURCHASED PUT OPTIONS--0.0% | | | | |
| 26,000,000 | | Bank of New York EURO PUT/USD CALL, Expiration Date, 1/11/2006
| | | 143,910 | |
| 27,000,000 | | Bank of New York CHF PUT/USD CALL, Expiration Date, 1/13/2006
| | | 151,200 | |
| 5,000,000 | | State Street Bank & Trust Co, N.A. CHF PUT/USD CALL, Expiration Date, 1/13/2006
|
|
| 35,800
|
|
| | | TOTAL PURCHASED PUT OPTIONS (IDENTIFIED COST $411,740)
|
|
| 330,910
|
|
| | | REPURCHASE AGREEMENTS--7.2% | | | | |
| $ | 70,380,000 | | Interest in $3,500,000,000 joint repurchase agreement 4.04%, dated 10/31/2005 under which Bank of America N.A. will repurchase a U.S. Government Agency security with a maturity of 7/1/2035 for $3,500,392,778 on 11/1/2005. The market value of the underlying security at the end of the period was $3,570,000,001
| | | 70,380,000 | |
| 500,000,000 | | Interest in $1,500,000,000 joint repurchase agreement 4.04%, dated 10/31/2005 under which Barclays Capital Inc. will repurchase U.S. Government Agency securities with various maturities to 9/29/2025 for $1,500,168,333 on 11/1/2005. The market value of the underlying securities at the end of the period was $1,530,172,587
|
|
| 500,000,000
|
|
| | | TOTAL REPURCHASE AGREEMENTS (AT AMORTIZED COST)
|
|
| 570,380,000
|
|
| | | MUTUAL FUND--5.3% | | | | |
| 417,080,237 | 2 | Prime Value Obligations Fund, IS Shares (at net asset value) (held as collateral for securities lending)
|
|
| 417,080,237
|
|
| | | TOTAL INVESTMENTS--105.0%
(IDENTIFIED COST $6,317,406,607) 6
|
|
| 8,246,552,947
|
|
| | | OTHER ASSETS AND LIABILITIES - NET--(5.0)%
|
|
| (397,057,885
| )
|
| | | TOTAL NET ASSETS--100%
|
| $
| 7,849,495,062
|
|
1 Non-income producing security.
2 Affiliated company. At October 31, 2005, these securities amounted to $2,055,572,334 which represents 26.3% of total net assets.
3 All or a portion of these securities are temporarily on loan to unaffiliated broker/dealers.
4 Denotes a restricted security, including securities purchased under Rule 144A of the Securities Act of 1933. These securities, unless registered under the Act or exempted from registration, may only be sold to qualified institutional investors. At October 31, 2005, these securities amounted to $217,891,913 which represents 2.8% of total net assets.
5 Denotes a restricted security, including securities purchased under Rule 144A that have been deemed liquid by criteria approved by the Fund's Board of Trustees. At October 31, 2005, these securities amounted to $217,891,913 which represents 2.8% of total net assets.
6 The cost of investments for federal tax purposes amounts to $6,328,948,566.
Note: The categories of investments are shown as a percentage of total net assets at October 31, 2005.
The following acronyms are used throughout this portfolio:
| ADR | - --American Depositary Receipt |
| CHF | - --Swiss Franc |
| EURO | - --Euro Dollar |
| GDR | - --Global Depository Receipt |
| USD | - --United States Dollar |
See Notes which are an integral part of the Financial Statements
Statement of Assets and Liabilities
October 31, 2005
Assets:
| | | | | | | |
Total investments in securities, at value including $2,055,572,334 of investments in affiliated issuers and $409,187,838 of securities loaned (identified cost $6,317,406,607)
| | | | | $ | 8,246,552,947 | |
Cash
| | | | | | 4,312,335 | |
Cash denominated in foreign currencies (identified cost $4,167,851)
| | | | | | 4,169,679 | |
Income receivable
| | | | | | 613,284 | |
Receivable for investments sold
| | | | | | 133,882,747 | |
Receivable for shares sold
|
|
|
|
|
| 10,886,238
|
|
TOTAL ASSETS
|
|
|
|
|
| 8,400,417,230
|
|
Liabilities:
| | | | | | | |
Payable for investments purchased
| | $ | 114,819,755 | | | | |
Payable for shares redeemed
| | | 11,972,074 | | | | |
Payable for collateral due to broker
| | | 417,080,237 | | | | |
Option written, at value (premium received $411,740)
| | | 406,750 | | | | |
Payable for distribution services fee (Note 5)
| | | 1,978,331 | | | | |
Payable to shareholder services fee (Note 5)
| | | 1,600,016 | | | | |
Accrued expenses
|
|
| 3,065,005
|
|
|
|
|
TOTAL LIABILITIES
|
|
|
|
|
| 550,922,168
|
|
Net assets for 1,431,421,120 shares outstanding
|
|
|
|
|
| $7,849,495,062
|
|
Net Assets Consist of:
| | | | | | | |
Paid-in capital
| | | | | | $5,491,956,510 | |
Net unrealized appreciation of investments, options and translation of assets and liabilities in foreign currency
| | | | | | 1,929,145,885 | |
Accumulated net realized gain on investments, options and foreign currency transactions
| | | | | | 446,434,079 | |
Accumulated net investment income (loss)
|
|
|
|
|
| (18,041,412
| )
|
TOTAL NET ASSETS
|
|
|
|
| $
| 7,849,495,062
|
|
Statement of Assets and Liabilities-continued
October 31, 2005
Net Asset Value, Offering Price and Redemption Proceeds Per Share
| | | | | | | |
Class A Shares:
| | | | | | | |
Net asset value per share ($2,166,467,619 ÷ 392,948,729 share outstanding), no par value, unlimited shares authorized
|
|
|
|
|
| $5.51
|
|
Offering price per share (100/94.50 of $5.51) 1
|
|
|
|
|
| $5.83
|
|
Redemption proceeds per share
|
|
|
|
|
| $5.51
|
|
Class B Shares:
| | | | | | | |
Net asset value per share ($1,102,132,555 ÷ 204,764,141 shares outstanding), no par value, unlimited shares authorized
|
|
|
|
|
| $5.38
|
|
Offering price per share
|
|
|
|
|
| $5.38
|
|
Redemption proceeds per share (94.50/100 of $5.38) 1
|
|
|
|
|
| $5.08
|
|
Class C Shares:
| | | | | | | |
Net asset value per share ($724,467,612 ÷ 134,572,208 shares outstanding), no par value, unlimited shares authorized
|
|
|
|
|
| $5.38
|
|
Offering price per share (100/99.00 of $5.38) 1
|
|
|
|
|
| $5.43
|
|
Redemption proceeds per share (99/100 of $5.38) 1
|
|
|
|
|
| $5.33
|
|
Class K Shares:
| | | | | | | |
Net asset value per share ($3,856,427,276 ÷ 699,136,042 shares outstanding), no par value, unlimited shares authorized
|
|
|
|
|
| $5.52
|
|
Offering price per share
|
|
|
|
|
| $5.52
|
|
Redemption proceeds per share (99.80/100 of $5.52) 1
|
|
|
|
|
| $5.51
|
|
1 See "What Do Shares Cost?" in the Prospectus.
See Notes which are an integral part of the Financial Statements
Statement of Operations
Year Ended October 31, 2005
Investment Income:
| | | | | | | | | | | | |
Dividends (including $2,303,050 received from affiliated issuers (Note 5) and net of foreign taxes withheld of $1,533,465)
| | | | | | | | | | $ | 49,269,773 | |
Interest (including income on securities loaned of $2,322,164)
|
|
|
|
|
|
|
|
|
|
| 21,512,124
|
|
TOTAL INCOME
|
|
|
|
|
|
|
|
|
|
| 70,781,897
|
|
Expenses:
| | | | | | | | | | | | |
Investment adviser fee (Note 5)
| | | | | | $ | 107,666,544 | | | | | |
Administrative personnel and services fee (Note 5)
| | | | | | | 6,052,999 | | | | | |
Custodian fees
| | | | | | | 811,460 | | | | | |
Transfer and dividend disbursing agent fees and expenses--Class A
| | | | | | | 2,412,340 | | | | | |
Transfer and dividend disbursing agent fees and expenses--Class B
| | | | | | | 1,294,745 | | | | | |
Transfer and dividend disbursing agent fees and expenses--Class C
| | | | | | | 790,584 | | | | | |
Transfer and dividend disbursing agent fees and expenses--Class K
| | | | | | | 5,215,257 | | | | | |
Directors'/Trustees' fees
| | | | | | | 61,175 | | | | | |
Auditing fees
| | | | | | | 37,916 | | | | | |
Legal fees
| | | | | | | 12,686 | | | | | |
Portfolio accounting fees
| | | | | | | 224,929 | | | | | |
Distribution services fee--Class A Shares (Note 5)
| | | | | | | 5,038,605 | | | | | |
Distribution services fee--Class B Shares (Note 5)
| | | | | | | 8,138,814 | | | | | |
Distribution services fee--Class C Shares (Note 5)
| | | | | | | 4,951,431 | | | | | |
Distribution services fee--Class K Shares (Note 5)
| | | | | | | 18,973,695 | | | | | |
Shareholder services fee--Class A Shares (Note 5)
| | | | | | | 4,951,345 | | | | | |
Shareholder services fee--Class B Shares (Note 5)
| | | | | | | 2,712,938 | | | | | |
Shareholder services fee--Class C Shares (Note 5)
| | | | | | | 1,649,028 | | | | | |
Shareholder services fee--Class K Shares (Note 5)
| | | | | | | 8,831,008 | | | | | |
Share registration costs
| | | | | | | 174,705 | | | | | |
Printing and postage
| | | | | | | 507,990 | | | | | |
Insurance premiums
| | | | | | | 68,279 | | | | | |
Miscellaneous
|
|
|
|
|
|
| 8,674
|
|
|
|
|
|
TOTAL EXPENSES
|
|
|
|
|
|
| 180,587,147
|
|
|
|
|
|
Statement of Operations-continued
Year Ended October 31, 2005
Waivers and Reimbursements (Note 5):
| | | | | | | | | | | | |
Waiver/reimbursement of investment adviser fee
| | $ | (11,321,667 | ) | | | | | | | | |
Waiver of administrative personnel and services fee
| | | (295,672 | ) | | | | | | | | |
Waiver of distribution services fee--Class A Shares
| | | (720,630 | ) | | | | | | | | |
Waiver of distribution services fee--Class C Shares
| | | (22,954 | ) | | | | | | | | |
Waiver of distribution services fee--Class K Shares
| | | (11,270,149 | ) | | | | | | | | |
Waiver of shareholder services fee--Class A Shares
| | | (38,505) | | | | | | | | | |
Reimbursement of shareholder services fee--Class A Shares
| | | (410,872 | ) | | | | | | | | |
Reimbursement of shareholder services fee--Class B Shares
|
|
| (35,298
| )
|
|
|
|
|
|
|
|
|
TOTAL WAIVERS AND REIMBURSEMENTS
|
|
|
|
|
| $
| (24,115,747
| )
|
|
|
|
|
Net expenses
|
|
|
|
|
|
|
|
|
| $
| 156,471,400
|
|
Net investment income (loss)
|
|
|
|
|
|
|
|
|
|
| (85,689,503
| )
|
Realized and Unrealized Gain on Investments, Options and Foreign Currency Transactions:
| | | | | | | | | | | | |
Net realized gain on investments, options and foreign currency transactions (including realized gain of $103,252,145 on sale of investments in affiliated issuers (Note 5) and foreign taxes withheld of $2,651,906)
| | | | | | | | | | | 546,532,246 | |
Net change in unrealized appreciation of investments, options and translation of assets and liabilities in foreign currency
|
|
|
|
|
|
|
|
|
|
| 506,520,030
|
|
Net realized and unrealized gain on investments, options, and foreign currency transactions
|
|
|
|
|
|
|
|
|
|
| 1,053,052,276
|
|
Change in net assets resulting from operations
|
|
|
|
|
|
|
|
|
| $
| 967,362,773
|
|
See Notes which are an integral part of the Financial Statements
Statement of Changes in Net Assets
Year Ended October 31
|
|
| 2005
|
|
|
| 2004
|
|
Increase (Decrease) in Net Assets
| | | | | | | | |
Operations:
| | | | | | | | |
Net investment income (loss)
| | $ | (85,689,503 | ) | | $ | (91,016,407 | ) |
Net realized gain on investments, options and foreign currency transactions
| | | 546,532,246 | | | | 496,744,523 | |
Net increase due to reimbursement from Adviser (Note 5)
| | | - -- | | | | 1,302,668 | |
Net change in unrealized appreciation/depreciation of investments, options and translation of assets and liabilities in foreign currency
|
|
| 506,520,030
|
|
|
| (105,953,336
| )
|
CHANGE IN NET ASSETS RESULTING FROM OPERATIONS
|
|
| 967,362,773
|
|
|
| 301,077,448
|
|
Distributions to Shareholders:
| | | | | | | | |
Distributions from net realized gains on investments and foreign currency transactions
| | | | | | | | |
Class A Shares
| | | (103,255,249 | ) | | | (11,551,661 | ) |
Class B Shares
| | | (58,193,906 | ) | | | (7,430,141 | ) |
Class C Shares
| | | (32,903,118 | ) | | | (3,378,416 | ) |
Class K Shares
|
|
| (202,750,926
| )
|
|
| (31,244,311
| )
|
CHANGE IN NET ASSETS RESULTING FROM DISTRIBUTIONS TO SHAREHOLDERS
|
|
| (397,103,199
| )
|
|
| (53,604,529
| )
|
Share Transactions:
| | | | | | | | |
Proceeds from sale of shares
| | | 1,433,931,546 | | | | 1,836,299,869 | |
Proceeds from shares issued in connection with the tax-free transfer of assets from BankNorth Small/Mid Cap Core Fund
| | | - -- | | | | 13,145,214 | |
Net asset value of shares issued to shareholders in payment of distributions declared
| | | 363,051,287 | | | | 49,666,110 | |
Cost of shares redeemed
|
|
| (1,373,123,729
| )
|
|
| (1,097,024,967
| )
|
CHANGE IN NET ASSETS RESULTING FROM SHARE TRANSACTIONS
|
|
| 423,859,104
|
|
|
| 802,086,226
|
|
Change in net assets
|
|
| 994,118,678
|
|
|
| 1,049,559,145
|
|
Net Assets:
| | | | | | | | |
Beginning of period
|
|
| 6,855,376,384
|
|
|
| 5,805,817,239
|
|
End of period (including accumulated net investment income (loss) of $(18,041,412) and $0, respectively)
|
| $
| 7,849,495,062
|
|
| $
| 6,855,376,384
|
|
See Notes which are an integral part of the Financial Statements
Notes to Financial Statements
October 31, 2005
1. ORGANIZATION
Federated Equity Funds (the "Trust") is registered under the Investment Company Act of 1940, as amended (the "Act"), as an open-end management investment company. The Trust consists of eight portfolios. The financial statements included herein are only those of Federated Kaufmann Fund (the "Fund"), a diversified portfolio. The financial statements of the other portfolios are presented separately. The assets of each portfolio are segregated and a shareholder's interest is limited to the portfolio in which shares are held. The Fund offers four classes of shares: Class A Shares, Class B Shares, Class C Shares and Class K Shares. All shares of the Fund have equal rights with respect to voting, except on class-specific matters. The financial highlights of the Class A Shares, Class B Shares and Class C Shares are presented separately. The investment objective of the Fund is to provide capital appreciation.
On August 30, 2004, the Fund received a tax-free transfer of assets from the BankNorth Small/Mid Cap Core Fund, as follows:
Class A
Shares of
the Fund
Issued
|
| BankNorth
Small/Mid Cap
Core Fund
Net Assets
Received
|
| Unrealized
Appreciation 1
|
| Net Assets
of Fund
Prior to
Combination
|
| Net Assets
of BankNorth
Small/Mid Cap
Core Fund
Immediately
Prior to
Combination
|
| Net Assets
of the Fund
Immediately
After
Combination
|
2,715,953
|
| $13,145,214
|
| $3,413,749
|
| $6,435,704,175
|
| $13,145,214
|
| $6,448,849,389
|
1 Unrealized Appreciation is included in the BankNorth Small/Mid Cap Core Fund Net Assets Received amount shown above.
2. SIGNIFICANT ACCOUNTING POLICIES
The following is a summary of significant accounting policies consistently followed by the Fund in the preparation of its financial statements. These policies are in conformity with generally accepted accounting principles (GAAP) in the United States of America.
Investment Valuation
Domestic and foreign equity securities are valued at the last sale price or official closing price reported in the market in which they are primarily traded (either a national securities exchange or the over-the-counter market), if available. If unavailable, the security is generally valued at the mean between the last closing bid and asked prices. With respect to valuation of foreign securities, trading in foreign cities may be completed at times which vary from the closing of the New York Stock Exchange (NYSE). Therefore, foreign securities are valued at the latest closing price on the exchange on which they are traded immediately prior to the closing of the NYSE. Foreign securities quoted in foreign currencies are translated in U.S. dollars at the foreign exchange rate in effect at 4:00 p.m., Eastern Time, on the day the value of the foreign security is determined. The Fund generally values fixed income and short-term securities according to prices furnished by an independent pricing service, except that securities with remaining maturities of less than 60 days at the time of purchase may be valued at amortized cost. For other fixed income securities, prices furnished by an independent pricing service are intended to be indicative of the mean between the bid and asked prices currently offered to institutional investors for the securities. Investments in other open-end regulated investment companies are valued at net asset value. Securities for which no quotations are readily available or whose values have been affected by a significant event occurring between the close of their primary markets and the closing of the NYSE are valued at fair value as determined in accordance with procedures established by and under general supervision of the Board of Trustees (the "Trustees").
Repurchase Agreements
It is the policy of the Fund to require the custodian bank to take possession, to have legally segregated in the Federal Reserve Book Entry System, or to have segregated within the custodian bank's vault, all securities held as collateral under repurchase agreement transactions. Additionally, procedures have been established by the Fund to monitor, on a daily basis, the market value of each repurchase agreement's collateral to ensure that the value of the collateral at least equals the repurchase price to be paid under the repurchase agreement.
The Fund will only enter into repurchase agreements with banks and other recognized financial institutions, such as broker/dealers, which are deemed by the Fund's adviser to be creditworthy pursuant to the guidelines and/or standards reviewed or established by the Trustees. Risks may arise from the potential inability of counterparties to honor the terms of the repurchase agreement. The Fund, along with other affiliated investment companies, may utilize a joint trading account for the purpose of entering into one or more repurchase agreements.
Investment Income, Gains and Losses, Expenses and Distributions
Interest income and expenses are accrued daily. Dividend income and distributions to shareholders are recorded on the ex-dividend date. Distributions of net investment income are declared and paid annually. Non-cash dividends included in dividend income, if any, are recorded at fair value. Investment income, realized and unrealized gains and losses, and certain fund-level expenses are allocated to each class based on relative average daily net assets, except that each class bears certain expenses unique to that class such as transfer and dividend disbursing agent, distribution and shareholder services fees. Dividends are declared separately for each class. No class has preferential dividend rights; differences in per share dividend rates are generally due to differences in separate class expenses.
Premium and Discount Amortization
All premiums and discounts on fixed-income securities are amortized/accreted for financial statement purposes.
Federal Taxes
It is the Fund's policy to comply with the Subchapter M provision of the Internal Revenue Code (the "Code") and to distribute to shareholders each year substantially all of its income. Accordingly, no provision for federal income tax is necessary.
Withholding taxes, and where appropriate, deferred withholding taxes, on foreign interest, dividends and capital gains have been provided for in accordance with the applicable country's tax rules and rates.
When-Issued and Delayed Delivery Transactions
The Fund may engage in when-issued or delayed delivery transactions. The Fund records when-issued securities on the trade date and maintains security positions such that sufficient liquid assets will be available to make payment for the securities purchased. Securities purchased on a when-issued or delayed delivery basis are marked to market daily and begin earning interest on the settlement date. Losses may occur on these transactions due to changes in market conditions or the failure of counterparties to perform under the contract.
Foreign Exchange Contracts
The Fund may enter into foreign currency commitments for the delayed delivery of securities or foreign currency exchange transactions. The Fund may enter into foreign currency contract transactions to protect assets against adverse changes in foreign currency exchange rates or exchange control regulations. Purchased contracts are used to acquire exposure to foreign currencies; whereas, contracts to sell are used to hedge the Fund's securities against currency fluctuations. Risks may arise upon entering these transactions from the potential inability of counterparties to meet the terms of their commitments and from unanticipated movements in security prices or foreign exchange rates. The foreign currency transactions are adjusted by the daily exchange rate of the underlying currency and any gains or losses are recorded for financial statement purposes as unrealized until the settlement date.
At October 31, 2005, the Fund had no outstanding foreign currency commitments.
Written Options Contracts
The Fund may write option contracts. The writer of the option receives a payment, or premium, from the buyer, which the writer keeps regardless of whether the buyer uses (or exercises) the option. A call option gives the holder (buyer) the right to buy the underlying asset from the seller (writer) of the option. A put option gives the holder the right to sell the underlying asset to the writer of the option. The value of the option contract is recorded as a liability and unrealized gain or loss is measured by the difference between the current value and the premium received. For the year ended October 31, 2005, the Fund had a realized gain of $3,829,005 on written options.
The following is a summary of the Fund's written option activity:
Contracts
|
| Number of
Contracts
|
|
| Premium
|
|
Outstanding at 10/31/2004
|
| - --
|
|
| $ --
|
|
Options written
|
| 433,000,000
|
|
| 3,081,510
|
|
Options expired
|
| (81,000,000
| )
|
| (641,370
| )
|
Options bought to close
|
| (258,000,000
| )
|
| (1,796,200
| )
|
Options assigned
|
| (36,000,000
| )
|
| (232,200
| )
|
Outstanding at 10/31/2005
|
| 58,000,000
|
|
| 411,740
|
|
Foreign Currency Translation
The accounting records of the Fund are maintained in U.S. dollars. All assets and liabilities denominated in foreign currencies (FCs) are translated into U.S. dollars based on the rates of exchange of such currencies against U.S. dollars on the date of valuation. Purchases and sales of securities, income and expenses are translated at the rate of exchange quoted on the respective date that such transactions are recorded. The Fund does not isolate that portion of the results of operations resulting from changes in foreign exchange rates on investments from the fluctuations arising from changes in market prices of securities held. Such fluctuations are included with the net realized and unrealized gain or loss from investments.
Reported net realized foreign exchange gains or losses arise from sales of portfolio securities, sales and maturities of short-term securities, sales of FCs, currency gains or losses realized between the trade and settlement dates on securities transactions, the difference between the amounts of dividends, interest and foreign withholding taxes recorded on the Fund's books, and the U.S. dollar equivalent of the amounts actually received or paid. Net unrealized foreign exchange gains and losses arise from changes in the value of assets and liabilities other than investments in securities at fiscal year end, resulting from changes in the exchange rate.
Securities Lending
The Fund participates in a securities lending program providing for the lending of corporate bonds, equity and government securities to qualified brokers. The Fund normally receives cash collateral for securities loaned that is invested in an affiliated money market fund. Collateral is maintained at a minimum level of 102% of the market value of investments loaned, plus interest, if applicable. Earnings on collateral are allocated between the securities lending agent, as a fee for its services under the program, and the Fund, according to agreed-upon rates.
As of October 31, 2005, securities subject to this type of arrangement and related collateral were as follows:
Market Value of
Securities Loaned
|
| Market Value
of Collateral 1
|
$409,187,838
|
| $417,080,237
|
1 Does not include mark to market proceeds held as cash of $4,998,950.
Short Sales
The Fund may sell a security it does not own in anticipation of a decline in the fair value of the security. When the Fund sells a security short, it must borrow the security sold short and deliver it to the broker-dealer through which it made the short sale. A gain, limited to the price at which the Fund sold the security short, or a loss, unlimited in size, will be recognized upon the termination of a short sale.
Restricted Securities
Restricted securities are securities that may only be resold upon registration under federal securities laws or in transactions exempt from such registration. In some cases, the issuer of restricted securities has agreed to register such securities for resale, at the issuer's expense either upon demand by the Fund or in connection with another registered offering of the securities. Many restricted securities may be resold in the secondary market in transactions exempt from registration. Such restricted securities may be determined to be liquid under criteria established by the Trustees. The Fund will not incur any registration costs upon such resales. The Fund's restricted securities are valued at the price provided by dealers in the secondary market or, if no market prices are available, at the fair value as determined in accordance with procedures established by and under general supervision of the Trustees.
Additional information on restricted securities, excluding securities purchased under Rule 144A that have been deemed liquid by the Trustees held at October 31, 2005, is as follows:
Security
|
| Acquisition Date
|
| Acquisition Cost
|
Apollo Investment Fund V
|
| 5/18/2001
|
| $ 843,199
|
Aradigm Corp., Warrants 12/17/2006
|
| 12/17/2001
|
| - --
|
Ardais Corp., Conv. Bond, 8.00%, 12/31/2005
|
| 4/14/2004
|
| 434,259
|
Ardais Corp., Conv. Pfd.
|
| 3/2/2001-3/8/2001
|
| 9,999,999
|
Ardais Corp., Conv. Pfd., Series C
|
| 12/18/2002
|
| 4,666,664
|
Ardais Corp. Warrants 4/14/2009
|
| 4/15/2004
|
| - --
|
BearingPoint, Inc., Conv. Sub. Deb., 5.00%, 4/15/2025
|
| 4/21/2005
|
| 25,000,000
|
CompBenefits, Corp.
|
| 4/21/1997-7/12/2000
|
| 140,678
|
CompBenefits, Corp., Pfd.
|
| 4/21/1997-7/12/2000
|
| 3,256,223
|
Conceptus, Inc.
|
| 8/11/2005
|
| 4,500,000
|
Conceptus, Inc.
|
| 4/10/2001
|
| 5,000,000
|
Converge Medical, Inc., Pfd. Series C
|
| 10/25/2001
|
| 3,000,000
|
Cortek, Inc.
|
| 2/29/2000
|
| 1,000,000
|
Cortek, Inc., Conv. Pfd., Series D2
|
| 3/31/2003
|
| 589,797
|
Cortex, Inc., Pfd., Series D
|
| 6/18/2001
|
| 2,000,000
|
Decision Management International, Inc.
|
| 7/11/2005
|
| - --
|
Denovo Ventures I LP
|
| 3/9/2000
|
| 4,704,785
|
DexCom, Inc., Pfd.
|
| 12/30/2004
|
| 678,910
|
DexCom, Inc., Pfd., Series B
|
| 12/01/2000
|
| 3,000,000
|
DexCom, Inc., Pfd., Series C
|
| 5/17/2002
|
| 1,000,000
|
Dia Dexus, Pfd., Series C
|
| 4/4/2000
|
| 4,999,998
|
Endologix, Inc.
|
| 7/7/2005
|
| 5,000,000
|
Endologix, Inc.
|
| 12/8/2003-3/23/2005
|
| 12,248,120
|
Security
|
| Acquisition Date
|
| Acquisition Cost
|
Expand Networks Ltd.
|
| 9/22/2000
|
| $ 2,500,000
|
FA Private Equity Fund IV LP
|
| 3/4/2002
|
| 421,984
|
Greenfield Technology Venture Fund
|
| 6/15/1998
|
| 88,344
|
Incuvest LLC, Pfd.
|
| 1/6/2000
|
| 5,000,000
|
Infrastructure Fund
|
| 8/11/2000
|
| 484,175
|
Internet.com Venture Fund III
|
| 5/17/2000-7/28/2000
|
| 557,793
|
Isis Pharmaceuticals, Inc
|
| 8/23/2005
|
| 19,882,351
|
Latin Healthcare Fund
|
| 11/28/2000
|
| 8,573,040
|
Metabasis Therapeutics, Inc., Warrants 9/30/2010
|
| 10/3/2005
|
| 111,956
|
Migenix, Inc., Conv. Pfd.
|
| 10/27/2004
|
| 1,200,006
|
Multiplex, Inc., Pfd., Series C
|
| 2/22/2001
|
| 5,000,001
|
Peachtree Leadscope LLC
|
| 4/30/2002
|
| 3,000,000
|
Peachtree Leadscope LLC
|
| 6/30/2000
|
| 712,054
|
Peachtree Open Networks
|
| 10/5/2000
|
| 990,753
|
Peachtree Velquest
|
| 9/14/2000
|
| 494,382
|
Peachtree/CB Partners
|
| 3/8/2000
|
| 3,503,863
|
Rocket Ventures II
|
| 7/20/1999
|
| 7,515,342
|
Ryan Hankin Kent, Inc., Pfd., Series B
|
| 6/5/2000
|
| 2,000,000
|
Sanarus Medical, Inc., Pfd., Series A
|
| 11/16/1999-11/12/2004
|
| 1,561,804
|
Sanarus Medical, Inc., Pfd., Series B
|
| 7/16/2001
|
| 2,495,648
|
Sanarus Medical, Inc., Pfd., Series C
|
| 10/23/2003
|
| 3,004,288
|
Sensable Technologies, Inc.
|
| 10/15/2004
|
| 0
|
Sensable Technologies, Inc.
|
| 12/16/2003
|
| 401,118
|
Sensable Technologies, Inc., Pfd., Series B
|
| 12/23/1997
|
| 2,064,237
|
Sensable Technologies, Inc., Pfd., Series C
|
| 4/5/2000
|
| 1,474,010
|
Use of Estimates
The preparation of financial statements in conformity with GAAP requires management to make estimates and assumptions that affect the amounts of assets, liabilities, expenses and revenues reported in the financial statements. Actual results could differ from those estimated.
Other
Investment transactions are accounted for on a trade date basis. Realized gains and losses from investment transactions are recorded on an identified cost basis.
3. SHARES OF BENEFICIAL INTEREST
The following tables summarize share activity:
Year Ended October 31
|
| 2005
|
| 2004
|
Class A Shares:
|
| Shares
|
|
|
| Amount
|
|
| Shares
|
|
|
| Amount
|
|
Shares sold
| | 150,599,079 | | | $ | 797,198,894 | | | 199,104,620 | | | $ | 998,975,256 | |
Shares issued in connection with tax-free transfer of assets from BankNorth Small/Mid Cap Core Fund
| | - -- | | | | - -- | | | 2,715,953 | | | | 13,145,214 | |
Shares issued to shareholders in payment of distributions declared
|
| 17,504,760 | | | | 89,099,685 |
|
|
2,070,151 |
|
| |
9,957,448 |
|
Shares redeemed
|
| (122,304,301
| )
|
|
| (647,088,392
| )
|
| (99,878,026
| )
|
|
| (496,795,631
| )
|
NET CHANGE RESULTING FROM CLASS A SHARE TRANSACTIONS
|
| 45,799,538 45,799,538
|
|
| $
| 239,210,187 239,210,187
|
|
|
104,012,698
|
|
|
$
|
525,282,287
|
|
| | | | | | | | | | | | | | |
Year Ended October 31
|
| 2005
|
| 2004
|
Class B Shares:
|
| Shares
|
|
|
| Amount
|
|
| Shares
|
|
|
| Amount
|
|
Shares sold
| | 33,657,206 | | | $ | 174,081,420 | | | 62,567,155 | | | $ | 309,410,152 | |
Shares issued to shareholders in payment of distributions declared
|
| 10,430,358 | |
|
| 52,151,884 | |
|
1,407,063 |
|
|
|
6,683,565 |
|
Shares redeemed
|
| (37,327,135
| )
|
|
| (194,340,651
| )
|
| (27,540,244
| )
|
|
| (135,576,086
| )
|
NET CHANGE RESULTING FROM CLASS B SHARE TRANSACTIONS
|
| 6,760,429
|
|
|
$
| 31,892,653
|
|
|
36,433,974
|
|
|
$
|
180,517,631
|
|
| | | | | | | | | | | | | | |
Year Ended October 31
|
| 2005
|
| 2004
|
Class C Shares:
|
| Shares
|
|
|
| Amount
|
|
| Shares
|
|
|
| Amount
|
|
Shares sold
| | 42,578,747 | | | $ | 220,727,895 | | | 55,134,068 | | | $ | 272,597,197 | |
Shares issued to shareholders in payment of distributions declared
|
| 4,843,556 | |
|
| 24,219,297 | |
|
525,730 |
|
| |
2,502,486 |
|
Shares redeemed
|
| (23,397,117
| )
|
|
| (121,440,701
| )
|
| (14,872,665
| )
|
|
| (73,100,606
| )
|
NET CHANGE RESULTING FROM CLASS C SHARE TRANSACTIONS
|
| 24,025,186
|
|
|
$
| 123,506,491
|
|
|
40,787,133
|
|
|
$
|
201,999,077
|
|
| | | | | | | | | | | | | | |
Year Ended October 31
|
| 2005
|
| 2004
|
Class K Shares:
|
| Shares
|
|
|
| Amount
|
|
| Shares
|
|
|
| Amount
|
|
Shares sold
| | 45,765,706 | | | $ | 241,923,337 | | | 50,862,351 | | | $ | 255,317,264 | |
Shares issued to shareholders in payment of distributions declared
|
| 38,741,249 | |
|
| 197,580,421 | |
|
6,332,430 |
|
|
|
30,522,611 |
|
Shares redeemed
|
| (77,226,078
| )
|
|
| (410,253,985
| )
|
| (78,282,545
| )
|
|
| (391,552,644
| )
|
NET CHANGE RESULTING FROM CLASS K SHARE TRANSACTIONS
|
| 7,280,877
|
|
|
$
| 29,249,773
|
|
|
(21,087,764
| )
|
|
$
|
(105,712,769
| )
|
NET CHANGE RESULTING FROM SHARE TRANSACTIONS
|
| 83,866,030
|
|
|
$
| 423,859,104
|
|
|
160,146,041
|
|
|
$
|
802,086,226
|
|
4. FEDERAL TAX INFORMATION
The timing and character of income and capital gain distributions are determined in accordance with income tax regulations, which may differ from GAAP. These differences are due in part to differing treatments for foreign currency transactions, partnership adjustments, net operating loss, reclass foreign cap gains tax and discount accretion/premium amortization on debt securities.
For the year ended October 31, 2005, permanent differences identified and reclassified among the components of net assets were as follows:
Increase (Decrease)
|
Paid-In Capital
|
| Accumulated
Net Investment
Income (Loss)
|
| Accumulated
Net Realized
Gains
|
$(72,821)
|
| $67,648,091
|
| $(67,575,270)
|
Net investment income (loss), net realized gains (losses), and net assets were not affected by this reclassification.
The tax character of distributions as reported on the Statement of Changes in Net Assets for the years ended October 31, 2005, and 2004, was as follows:
|
| 2005
|
| 2004
|
Ordinary income 1
|
| $8,730
|
| - --
|
Long-term capital gains
|
| $397,094,469
|
| $53,604,529
|
1 For tax purposes short-term capital gain distributions are considered ordinary income distributions.
As of October 31, 2005, the components of distributable earnings on a tax basis were as follows:
Undistributed ordinary income
|
| $
| 167,806
|
|
Undistributed long-term capital gain
|
| $
| 473,219,964
|
|
Net unrealized appreciation
|
| $
| 1,917,603,926
|
|
Capital loss carry forward
|
| $
| (31,114,260
| )
|
The difference between book-basis and tax-basis net unrealized appreciation/depreciation is attributable in part to differing treatments for the deferral of losses on wash sales, partnership investments, discount accretion/premium amortization on debt securities and the realization for tax purposes of unrealized gains on investments in passive foreign investment companies.
At October 31, 2005, the cost of investments for federal tax purposes excluding any unrealized appreciation resulting from changes in foreign currency exchange rates and any unrealized depreciation from written options was $6,328,948,566. The net unrealized appreciation of investments for federal tax purposes was $1,917,604,381. This consists of net unrealized appreciation from investments for those securities having an excess of value over cost of $2,181,375,724 and net unrealized depreciation from investments for those securities having an excess of cost over value of $263,771,343.
At October 31, 2005, the Fund had a capital loss carryforward of $(31,114,260) which will reduce the Fund's taxable income arising from future net realized gains on investments, if any, to the extent permitted by the Code and thus will reduce the amount of distributions to shareholders which would otherwise be necessary to relieve the Fund of any liability for federal tax. Pursuant to the Code, such capital loss carryforward will expire in 2009.
The Fund used capital loss carryforwards of $7,778,565 to offset taxable capital gains realized during the year ended October 31, 2005.
5. INVESTMENT ADVISER FEE AND OTHER TRANSACTIONS WITH AFFILIATES
Investment Adviser Fee
Federated Equity Management Company of Pennsylvania, the Fund's investment adviser (the "Adviser"), receives for its services an annual investment adviser fee equal to 1.425% of the Fund's average daily net assets. The Adviser may voluntarily choose to waive any portion of its fee. The Adviser can modify or terminate this voluntary waiver at any time at its sole discretion. For the year ended October 31, 2005, the Adviser voluntarily waived $11,321,667 of its fee.
Pursuant to an Exemptive Order issued by the Securities and Exchange Commission, the Fund may invest in Prime Value Obligations Fund which is managed by the Adviser or an affiliate of the Adviser. The Adviser has agreed to reimburse the Fund for certain investment adviser fees as a result of these transactions. Income distributions earned from investments in this fund are recorded as income in the accompanying financial statements and totaled $405,859 for the period.
Certain of the Fund's assets are managed by Federated Global Investment Management Corp. (the "Sub-Adviser"). Under the terms of a sub-adviser agreement between the Adviser and the Sub-Adviser, the Sub-Adviser receives an allocable portion of the Fund's adviser fee. The fee is paid by the Adviser out of its resources and is not an incremental Fund expense. For the year ended October 31, 2005, the Sub-Adviser earned a sub-adviser fee of $88,777,677.
Administrative Fee
Federated Administrative Services (FAS), under the Administrative Services Agreement, provides the Fund with administrative personnel and services. The fee paid to FAS is based on the average aggregate daily net assets of all Federated funds as specified below:
Maximum
Administrative Fee
|
| Average Aggregate Daily Net Assets
of the Federated Funds
|
0.150%
|
| on the first $5 billion
|
0.125%
|
| on the next $5 billion
|
0.100%
|
| on the next $10 billion
|
0.075%
|
| on assets in excess of $20 billion
|
The administrative fee received during any fiscal year shall be at least $150,000 per portfolio and $40,000 per each additional class of Shares. FAS may voluntarily choose to waive any portion of its fee. FAS can modify or terminate this voluntary waiver at any time at its sole discretion. For the year ended October 31, 2005, the net fee paid to FAS was 0.076% of average aggregate daily net assets of the Fund.
Distribution Services Fee
The Fund has adopted a Distribution Plan (the "Plan") pursuant to Rule 12b-1 under the Act. Under the terms of the Plan, the Fund will compensate Federated Securities Corp. (FSC), the principal distributor, from the daily net assets of the Fund's Class A Shares, Class B Shares, Class C Shares and Class K Shares to finance activities intended to result in the sale of these shares. The Plan provides that the Fund may incur distribution expenses according to the following schedule annually, to compensate FSC:
Share Class Name
|
| Percentage of Average Daily
Net Assets of Class
|
Class A Shares
|
| 0.25%
|
Class B Shares
|
| 0.75%
|
Class C Shares
|
| 0.75%
|
Class K Shares
|
| 0.50%
|
FSC may voluntarily choose to waive any portion of its fee. FSC can modify or terminate this voluntary waiver at any time at its sole discretion. For the year ended October 31, 2005, FSC voluntarily waived 12,013,733 of its fee. Rather than paying financial intermediaries directly, the Fund may pay fees to FSC and FSC will use the fees to compensate financial intermediaries. For the year ended October 31, 2005, FSC retained $10,947,274 of fees paid by the Fund.
Sales Charges
For the year ended October 31, 2005, FSC retained $988,861 in sales charges from the sale of Class A Shares. FSC also retained $1,680 of contingent deferred sales charges relating to redemptions of Class A Shares and $38,640 relating to redemptions of Class C Shares. See "What Do Shares Cost?" in the Prospectus.
Redemption Fees
The Fund's Class K Shares imposes a redemption fee of 0.20% on the redemption price of the Fund's Class K Shares capital stock shares redeemed, if such shares were purchased after February 1, 1985. The redemption fee is applied to the Fund's Class K Shares expenses for providing redemption services, including, but not limited to: transfer agent fees; postage; printing; telephone and related employment costs. Any excess fee proceeds are added to the Fund's assets. Shares acquired through employer-sponsored retirement plans will not be subject to the redemption fee. However, if shares are purchased for a retirement plan account through a broker, financial institution or other intermediary maintaining an omnibus account for the shares, the waiver may not apply. In addition, this waiver does not apply to individual retirement accounts, such as Traditional, Roth and SEP-IRAs. For the year ended October 31, 2005, redemption fees of $668,755 were allocated to cover the cost of redemptions.
Shareholder Services Fee
The Fund may pay fees (Services Fees) up to 0.25% of the average daily net assets of the Fund's Class A Shares, Class B Shares, Class C Shares and Class K Shares to financial intermediaries or to Federated Shareholder Services Company (FSSC), a subsidiary of Federated Investors, Inc., for providing services to shareholders and maintaining shareholder accounts. Under certain agreements, rather than paying financial intermediaries directly, the Fund may pay Service Fees to FSSC and FSSC will use the fees to compensate financial intermediaries. FSSC or these financial intermediaries may voluntarily choose to waive any portion of their fee. This voluntary waiver can be modified or terminated at any time. For the year ended October 31, 2005, FSSC voluntarily waived $38,505 of its fee. For the year ended October 31, 2005, FSSC retained $8,757,502 of fees paid by the Fund.
Commitments and Contingencies
In the course of pursuing its investment philosophy, the Fund sometimes invests in limited partnerships and limited liability companies. These entities often require the Fund to commit to a total dollar amount to be invested. The actual investments are usually made in installments over a period of time. At October 31, 2005, the Fund had total commitments to limited partnerships and limited liability companies of $46,642,200; of this amount $38,131,354 was actually invested by the Fund leaving the Fund contingently liable for additional investments of $8,510,846.
Other
Federated retained an outside law firm to perform an internal review of past mutual fund trading practices and report to a special investigative committee of Federated's Board. In conjunction with this review, the Independent Trustees of the Fund have retained a financial expert to assess the impact of these trading practices. In accordance with the findings of the financial expert, the Fund's Adviser contributed $1,302,668 to the Fund during fiscal year 2004 which relates to a contribution to Paid-in Capital for detrimental impact to the Fund from frequent trading activity and detrimental impact on those Funds that may have resulted from orders incorrectly accepted by Federated employees after the Funds' closing times.
General
Certain of the Officers and Trustees of the Fund are Officers and Directors or Trustees of the above companies.
Transactions with Affiliated Companies
An affiliated company is a company in which the Fund has ownership of at least 5% of the voting shares. Transactions with affiliated companies (excluding $417,080,237 invested in Prime Value Obligations Fund) during the year ended October 31, 2005, are as follows:
| Affiliates
|
| Purchase
Cost
|
| Sales
Proceeds
|
| Dividend
Income
|
| Value
|
1
| Advance Auto Parts, Inc.
|
| $37,364,754
|
| $109,191,899
|
| $ --
|
| $318,442,500
|
1
| Anika Therapeutics, Inc.
|
| - -
|
| 4,333,742
|
| - --
|
| 12,340,000
|
1
| Avigen, Inc.
|
| - --
|
| - --
|
| - --
|
| 8,100,000
|
1
| Brillian Corp.
|
| - --
|
| - --
|
| - --
|
| 5,147,632
|
1
| CB Richard Ellis Services
|
| 56,131,600
|
| 62,428,759
|
| - --
|
| 195,400,000
|
1
| Central European Media Enterprises Ltd., Class A
|
| 8,434,205
|
| - --
|
| - --
|
| 92,980,000
|
1
| Chindex International, Inc.
|
| - --
|
| - --
|
| - --
|
| 2,042,400
|
1
| Chindex International, Inc., Warrants 3/31/2009
|
| - --
|
| - --
|
| - --
|
| 158,401
|
1
| Conceptus, Inc.
|
| 347,614
|
| 28,439
|
| - --
|
| 37,328,369
|
2
| Conceptus, Inc.
|
| - --
|
| - --
|
| - --
|
| 7,335,717
|
1,2
| Conceptus, Inc.
|
| - --
|
| - --
|
| - --
|
| 6,162,000
|
1
| Concorde Career Colleges, Inc.
|
| - --
|
| - --
|
| - --
|
| 4,500,000
|
1
| Cubist Pharmaceuticals, Inc
|
| 12,860,524
|
| 610,933
|
| - --
|
| 60,630,000
|
1
| Dyax Corp.
|
| 7,022,446
|
| 728,273
|
| - --
|
| 19,496,025
|
1
| Dynavax Technologies Corp.
|
| 30,343,183
|
| - --
|
| - --
|
| 30,756,822
|
1
| eCollege.com
|
| 3,383,896
|
| - --
|
| - --
|
| 23,865,000
|
1,2
| Endologix, Inc.
|
| 6,217,040
|
| - --
|
| - --
|
| 10,913,820
|
1
| GTX, Inc
|
| 15,436,200
|
| - --
|
| - --
|
| 17,415,200
|
1
| 1 Illumina, Inc.
|
| - --
|
| 6,278,476
|
| - --
|
| 38,585,574
|
1
| Infocrossing, Inc.
|
| 1,370,144
|
| - --
|
| - --
|
| 7,835,249
|
1
| Infocrossing, Inc., Warrants 10/21/2008
|
| - --
|
| - --
|
| - --
|
| 560,859
|
1
| Interline Brands, Inc
|
| 33,654,219
|
| - --
|
| - --
|
| 38,962,350
|
| Affiliates
|
| Purchase
Cost
|
| Sales
Proceeds
|
| Dividend
Income
|
| Value
|
1
| Isis Pharmaceuticals, Inc.
|
| $ --
|
| $ --
|
| $ --
|
| $ 17,360,000
|
| J.D. Wetherspoon PLC
|
| - --
|
| 53,377,480
|
| 902,385
|
| 52,274,343
|
1
| Magma Design Automation
|
| 10,426,970
|
| 2,348,777
|
| - --
|
| 40,622,400
|
1
| Metabasis Therapeutics, Inc
|
| 14,995,740
|
| - --
|
| - --
|
| 12,180,840
|
1
| NIC, Inc.
|
| 342,000
|
| 943,675
|
| - --
|
| 18,603,750
|
1
| NMT Medical, Inc.
|
| - --
|
| - --
|
| - --
|
| 12,975,300
|
1
| NuCo2, Inc.
|
| 14,377,031
|
| - --
|
| - --
|
| 28,982,240
|
1
| NxStage Medical, Inc
|
| 17,353,000
|
| - --
|
| - --
|
| 19,695,655
|
1
| Online Resources Corp.
|
| 2,443,750
|
| - --
|
| - --
|
| 21,450,000
|
1,2
| Online Resources Corp.
|
| - --
|
| - --
|
| - --
|
| 6,360,000
|
| PetSmart, Inc.
|
| 23,484,556
|
| 68,977,610
|
| 994,806
|
| 212,442,350
|
1
| Pharmacyclics, Inc.
|
| - --
|
| 162,260
|
| - --
|
| 18,920,320
|
1
| PowerDsine Ltd.
|
| - --
|
| - --
|
| - --
|
| 11,367,864
|
1
| Santarus, Inc.
|
| 24,134,434
|
| - --
|
| - --
|
| 34,485,221
|
1
| Seaspan Corp.
|
| 44,704,702
|
| - --
|
| - --
|
| 40,600,392
|
1
| Time Warner Telecom, Inc.
|
| - --
|
| 2,194,830
|
| - --
|
| 33,520,000
|
1
| United Surgical Partners International, Inc.
|
| - --
|
| 21,106,548
|
| - --
|
| 107,550,000
|
1
| Vical, Inc.
|
| 2,921,280
|
| - --
|
| - --
|
| 9,497,446
|
1
| World Heart Corp., Warrants 9/22/2008
|
| - --
|
| - --
|
| - --
|
| 646,058
|
| TOTAL OF AFFILIATED TRANSACTIONS
|
| $367,749,288
|
| $332,711,701
|
| $1,897,191
|
| $1,638,492,097
|
1 Non-income producing security.
2 Restricted security.
6. INVESTMENT TRANSACTIONS
Purchases and sales of investments, excluding long-term U.S. government securities and short-term obligations, for the year ended October 31, 2005, were as follows:
Purchases
|
| $
| 4,893,372,053
|
Sales
|
| $
| 5,035,225,659
|
7. CONCENTRATION OF CREDIT RISK
The Fund invests in securities of non-U.S. issuers. The political or economic developments within a particular country or region may have an adverse effect on the ability of domiciled issuers to meet their obligations. Additionally, political or economic developments may have an effect on the liquidity and volatility of portfolio securities and currency holdings.
At October 31, 2005, the diversification of countries was as follows:
Country
|
| Percentage of
Net Assets
|
United States
|
| 73.9%
|
Bermuda
|
| 4.5%
|
Japan
|
| 2.6%
|
India
|
| 2.1%
|
United Kingdom
|
| 2.0%
|
Israel
|
| 1.2%
|
Netherlands
|
| 1.1%
|
Switzerland
|
| 1.0%
|
Canada
|
| 0.9%
|
Republic of Korea
|
| 0.5%
|
China
|
| 0.5%
|
Ireland
|
| 0.5%
|
Cayman Islands
|
| 0.4%
|
Australia
|
| 0.3%
|
Singapore
|
| 0.3%
|
Mexico
|
| 0.3%
|
Brazil
|
| 0.2%
|
Belgium
|
| 0.1%
|
France
|
| 0.1%
|
Hong Kong
|
| 0.0% 1
|
Indonesia
|
| 0.0% 1
|
Thailand
|
| 0.0% 1
|
1 Represents less than 0.1%.
8. LEGAL PROCEEDINGS
Beginning in October 2003, Federated Investors, Inc. and various subsidiaries thereof (including the advisers and distributor for various investment companies, collectively, "Federated"), along with various investment companies sponsored by Federated ("Funds") were named as defendants in several class action lawsuits now pending in the United States District Court for the District of Maryland. The lawsuits were purportedly filed on behalf of people who purchased, owned and/or redeemed shares of Federated-sponsored mutual funds during specified periods beginning November 1, 1998. The suits are generally similar in alleging that Federated engaged in illegal and improper trading practices including market timing and late trading in concert with certain institutional traders, which allegedly caused financial injury to the mutual fund shareholders. These lawsuits began to be filed shortly after Federated's first public announcement that it had received requests for information on shareholder trading activities in the Funds from the Securities and Exchange Commission ("SEC"), the Office of the New York State Attorney General ("NYAG"), and other authorities. In that regard, on November 28, 2005, Federated announced that it had reached final settlements with the SEC and the NYAG with respect to those matters. As Federated previously reported in 2004, it has already paid approximately $8.0 million to certain funds as determined by an independent consultant. As part of these settlements, Federated agreed to pay for the benefit of fund shareholders additional disgorgement and a civil money penalty in the aggregate amount of an additional $72 million. Federated and various Funds have also been named as defendants in several additional lawsuits, the majority of which are now pending in the United States District Court for the Western District of Pennsylvania, alleging, among other things, excessive advisory and rule 12b-1 fees. The Board of the Funds has retained the law firm of Dickstein Shapiro Morin & Oshinsky LLP to represent the Funds in these lawsuits. Federated and the Funds, and their respective counsel, are reviewing the allegations and will respond appropriately. Additional lawsuits based upon similar allegations may be filed in the future. The potential impact of these lawsuits, all of which seek unquantified damages, attorneys' fees and expenses, and future potential similar suits is uncertain. Although we do not believe that these lawsuits will have a material adverse effect on the Funds, there can be no assurance that these suits, the ongoing adverse publicity and/or other developments resulting from the regulatory investigations will not result in increased Fund redemptions, reduced sales of Fund shares, or other adverse consequences for the Funds.
9. FEDERAL TAX INFORMATION (UNAUDITED)
For the year ended October 31, 2005, the amount of long-term capital gain designated by the Fund was $397,094,469.
Report of Independent Registered Public Accounting Firm
TO THE BOARD OF TRUSTEES OF FEDERATED EQUITY FUNDS AND SHAREHOLDERS OF FEDERATED KAUFMANN FUND:
We have audited the accompanying statement of assets and liabilities, including the portfolio of investments, of Federated Kaufmann Fund (one of the portfolios constituting Federated Equity Funds), (the "Fund"), as of October 31, 2005, and the related statement of operations for the year then ended, the statement of changes in net assets for each of the two years in the period then ended and the financial highlights for each of the four years ended and for the period ended October 31, 2001. These financial statements and financial highlights are the responsibility of the Fund's management. Our responsibility is to express an opinion on these financial statements and financial highlights based on our audits. The financial highlights for the period ended December 31, 2000, were audited by other independent registered public accounting firm whose report, dated February 1, 2001, expressed an unqualified opinion on those financial highlights.
We conducted our audits in accordance with the standards of the Public Company Accounting Oversight Board (United States). Those standards require that we plan and perform the audit to obtain reasonable assurance about whether the financial statements and financial highlights are free of material misstatement. We were not engaged to perform an audit of the Fund's internal control over financial reporting. Our audits included consideration of internal control over financial reporting as a basis for designing audit procedures that are appropriate in the circumstances, but not for the purpose of expressing an opinion on the effectiveness of the Fund's internal control over financial reporting. Accordingly, we express no such opinion. An audit also includes examining, on a test basis, evidence supporting the amounts and disclosures in the financial statements and financial highlights, assessing the accounting principles used and significant estimates made by management, and evaluating the overall financial statement presentation. Our procedures included confirmation of securities owned as of October 31, 2005, by correspondence with the custodian and brokers, or by other appropriate auditing procedures where replies from brokers were not received. We believe that our audits provide a reasonable basis for our opinion.
In our opinion, the financial statements and financial highlights referred to above present fairly, in all material respects, the financial position of the Federated Kaufmann Fund, a portfolio of Federated Equity Funds at October 31, 2005, the results of its operations for the year then ended, the changes in its net assets for each of the two years in the period then ended and the financial highlights for each of the four years ended and for the period ended October 31, 2001, in conformity with U.S. generally accepted accounting principles.
Ernst & Young LLP
Boston, Massachusetts
December 12, 2005
Board of Trustees and Trust Officers
The Board is responsible for managing the Trust's business affairs and for exercising all the Trust's powers except those reserved for the shareholders. The following tables give information about each Board member and the senior officers of the Fund. Where required, the tables separately list Board members who are "interested persons" of the Fund (i.e., "Interested" Board members) and those who are not (i.e., "Independent" Board members). Unless otherwise noted, the address of each person listed is Federated Investors Tower, 1001 Liberty Avenue, Pittsburgh, PA. As of December 31, 2004, the Trust comprised eight portfolios, and the Federated Fund Complex consisted of 44 investment companies (comprising 133 portfolios). Unless otherwise noted, each Officer is elected annually. Unless otherwise noted, each Board member oversees all portfolios in the Federated Fund Complex and serves for an indefinite term. The Fund's Statement of Additional Information includes additional information about Trust Trustees and is available, without charge and upon request, by calling 1-800-341-7400.
INTERESTED TRUSTEES BACKGROUND
|
|
|
Name
Birth Date
Address
Positions Held with Trust
Date Service Began
|
| Principal Occupation(s) for Past Five Years,
Other Directorships Held and Previous Position(s)
|
John F. Donahue*
Birth Date: July 28, 1924
CHAIRMAN AND TRUSTEE
Began serving: April 1984 | | Principal Occupations : Chairman and Director or Trustee of the Federated Fund Complex; Chairman and Director, Federated Investors, Inc.
Previous Positions : Trustee, Federated Investment Management Company and Chairman and Director, Federated Investment Counseling. |
|
|
|
J. Christopher Donahue*
Birth Date: April 11, 1949
PRESIDENT AND TRUSTEE
Began serving: January 2000 | | Principal Occupations : Principal Executive Officer and President of the Federated Fund Complex; Director or Trustee of some of the Funds in the Federated Fund Complex; President, Chief Executive Officer and Director, Federated Investors, Inc.; Chairman and Trustee, Federated Investment Management Company; Trustee, Federated Investment Counseling; Chairman and Director, Federated Global Investment Management Corp.; Chairman, Passport Research, Ltd.; Trustee, Federated Shareholder Services Company; Director, Federated Services Company.
Previous Positions : President, Federated Investment Counseling; President and Chief Executive Officer, Federated Investment Management Company, Federated Global Investment Management Corp. and Passport Research, Ltd. |
|
|
|
|
|
|
Name
Birth Date
Address
Positions Held with Trust
Date Service Began
|
| Principal Occupation(s) for Past Five Years,
Other Directorships Held and Previous Position(s)
|
Lawrence D. Ellis, M.D.*
Birth Date: October 11, 1932
3471 Fifth Avenue
Suite 1111
Pittsburgh, PA
TRUSTEE
Began serving: August 1987 | | Principal Occupations : Director or Trustee of the Federated Fund Complex; Professor of Medicine, University of Pittsburgh; Medical Director, University of Pittsburgh Medical Center Downtown; Hematologist, Oncologist and Internist, University of Pittsburgh Medical Center.
Other Directorships Held : Member, National Board of Trustees, Leukemia Society of America.
Previous Positions : Trustee, University of Pittsburgh; Director, University of Pittsburgh Medical Center. |
|
|
|
* Family relationships and reasons for "interested" status: John F. Donahue is the father of J. Christopher Donahue; both are "interested" due to the positions they hold with Federated Investors, Inc. and its subsidiaries. Lawrence D. Ellis, M.D. is "interested" because his son-in-law is employed by the Fund's principal underwriter, Federated Securities Corp.
INDEPENDENT TRUSTEES BACKGROUND
|
|
|
Name
Birth Date
Address
Positions Held with Trust
Date Service Began
|
| Principal Occupation(s) for Past Five Years,
Other Directorships Held and Previous Position(s)
|
Thomas G. Bigley
Birth Date: February 3, 1934
15 Old Timber Trail
Pittsburgh, PA
TRUSTEE
Began serving: October 1995 | | Principal Occupation : Director or Trustee of the Federated Fund Complex.
Other Directorships Held : Director, Member of Executive Committee, Children's Hospital of Pittsburgh; Director, University of Pittsburgh.
Previous Position : Senior Partner, Ernst & Young LLP. |
|
|
|
John T. Conroy, Jr.
Birth Date: June 23, 1937
Investment Properties Corporation
3838 North Tamiami Trail
Suite 402
Naples, FL
TRUSTEE
Began serving: November 1991 | | Principal Occupations : Director or Trustee of the Federated Fund Complex; Chairman of the Board, Investment Properties Corporation; Partner or Trustee in private real estate ventures in Southwest Florida.
Previous Positions : President, Investment Properties Corporation; Senior Vice President, John R. Wood and Associates, Inc., Realtors; President, Naples Property Management, Inc. and Northgate Village Development Corporation. |
|
|
|
|
|
|
Name
Birth Date
Address
Positions Held with Trust
Date Service Began
|
| Principal Occupation(s) for Past Five Years,
Other Directorships Held and Previous Position(s)
|
Nicholas P. Constantakis
Birth Date: September 3, 1939
175 Woodshire Drive
Pittsburgh, PA
TRUSTEE
Began serving: February 1998 | | Principal Occupations : Director or Trustee of the Federated Fund Complex.
Other Directorships Held : Director and Member of the Audit Committee, Michael Baker Corporation (engineering and energy services worldwide).
Previous Position : Partner, Andersen Worldwide SC. |
|
|
|
John F. Cunningham
Birth Date: March 5, 1943
353 El Brillo Way
Palm Beach, FL
TRUSTEE
Began serving: January 1999 | | Principal Occupation : Director or Trustee of the Federated Fund Complex.
Other Directorships Held : Chairman, President and Chief Executive Officer, Cunningham & Co., Inc. (strategic business consulting); Trustee Associate, Boston College.
Previous Positions : Director, Redgate Communications and EMC Corporation (computer storage systems); Chairman of the Board and Chief Executive Officer, Computer Consoles, Inc.; President and Chief Operating Officer, Wang Laboratories; Director, First National Bank of Boston; Director, Apollo Computer, Inc. |
|
|
|
Peter E. Madden
Birth Date: March 16, 1942
One Royal Palm Way
100 Royal Palm Way
Palm Beach, FL
TRUSTEE
Began serving: November 1991 | | Principal Occupation : Director or Trustee of the Federated Fund Complex.
Other Directorships Held : Board of Overseers, Babson College.
Previous Positions : Representative, Commonwealth of Massachusetts General Court; President, State Street Bank and Trust Company and State Street Corporation (retired); Director, VISA USA and VISA International; Chairman and Director, Massachusetts Bankers Association; Director, Depository Trust Corporation; Director, The Boston Stock Exchange. |
|
|
|
Charles F. Mansfield, Jr.
Birth Date: April 10, 1945
80 South Road
Westhampton Beach, NY
TRUSTEE
Began serving: January 1999 | | Principal Occupations : Director or Trustee of the Federated Fund Complex; Management Consultant; Executive Vice President, DVC Group, Inc. (marketing communications and technology) (prior to 9/1/00).
Previous Positions : Chief Executive Officer, PBTC International Bank; Partner, Arthur Young & Company (now Ernst & Young LLP); Chief Financial Officer of Retail Banking Sector, Chase Manhattan Bank; Senior Vice President, HSBC Bank USA (formerly, Marine Midland Bank); Vice President, Citibank; Assistant Professor of Banking and Finance, Frank G. Zarb School of Business, Hofstra University. |
|
|
|
|
|
|
Name
Birth Date
Address
Positions Held with Trust
Date Service Began
|
| Principal Occupation(s) for Past Five Years,
Other Directorships Held and Previous Position(s)
|
John E. Murray, Jr., J.D., S.J.D.
Birth Date: December 20, 1932
Chancellor, Duquesne University
Pittsburgh, PA
TRUSTEE
Began serving: February 1995 | | Principal Occupations : Director or Trustee of the Federated Fund Complex; Chancellor and Law Professor, Duquesne University; Partner, Murray, Hogue and Lannis.
Other Directorships Held : Director, Michael Baker Corp. (engineering, construction, operations and technical services).
Previous Positions : President, Duquesne University; Dean and Professor of Law, University of Pittsburgh School of Law; Dean and Professor of Law, Villanova University School of Law. |
|
|
|
Marjorie P. Smuts
Birth Date: June 21, 1935
4905 Bayard Street
Pittsburgh, PA
TRUSTEE
Began serving: April 1984 | | Principal Occupations : Director or Trustee of the Federated Fund Complex; Public Relations/Marketing Consultant/Conference Coordinator.
Previous Positions : National Spokesperson, Aluminum Company of America; television producer; President, Marj Palmer Assoc.; Owner, Scandia Bord. |
|
|
|
John S. Walsh
Birth Date: November 28, 1957
2604 William Drive
Valparaiso, IN
TRUSTEE
Began serving: January 1999 | | Principal Occupations : Director or Trustee of the Federated Fund Complex; President and Director, Heat Wagon, Inc. (manufacturer of construction temporary heaters); President and Director, Manufacturers Products, Inc. (distributor of portable construction heaters); President, Portable Heater Parts, a division of Manufacturers Products, Inc.
Previous Position : Vice President, Walsh & Kelly, Inc. |
|
|
|
OFFICERS
|
|
|
Name
Birth Date
Positions Held with Trust
Date Service Began
|
| Principal Occupation(s) for Past Five Years and Previous Position(s)
|
John W. McGonigle
Birth Date: October 26, 1938
EXECUTIVE VICE PRESIDENT
AND SECRETARY
Began serving: April 1984 | | Principal Occupations: Executive Vice President and Secretary of the Federated Fund Complex; Vice Chairman, Executive Vice President, Secretary and Director, Federated Investors, Inc.
Previous Positions: Trustee, Federated Investment Management Company and Federated Investment Counseling; Director, Federated Global Investment Management Corp., Federated Services Company and Federated Securities Corp. |
|
|
|
Richard J. Thomas
Birth Date: June 17, 1954
TREASURER
Began serving: November 1998 | | Principal Occupations : Principal Financial Officer and Treasurer of the Federated Fund Complex; Senior Vice President, Federated Administrative Services.
Previous Positions : Vice President, Federated Administrative Services; held various management positions within Funds Financial Services Division of Federated Investors, Inc. |
|
|
|
Richard B. Fisher
Birth Date: May 17, 1923
VICE PRESIDENT
Began serving: April 1984 | | Principal Occupations : Vice Chairman or Vice President of some of the Funds in the Federated Fund Complex; Vice Chairman, Federated Investors, Inc.; Chairman, Federated Securities Corp.
Previous Positions : President and Director or Trustee of some of the Funds in the Federated Fund Complex; Executive Vice President, Federated Investors, Inc. and Director and Chief Executive Officer, Federated Securities Corp. |
|
|
|
Stephen F. Auth
Birth Date: September 3, 1956
CHIEF INVESTMENT OFFICER
Began serving: November 2002 | | Principal Occupations : Chief Investment Officer of this Fund and various other Funds in the Federated Fund Complex; Executive Vice President, Federated Investment Counseling, Federated Global Investment Management Corp., Federated Equity Management Company of Pennsylvania and Passport Research II, Ltd.
Previous Positions : Executive Vice President, Federated Investment Management Company, and Passport Research, Ltd.; Senior Vice President, Global Portfolio Management Services Division; Senior Vice President, Federated Investment Management Company and Passport Research, Ltd.; Senior Managing Director and Portfolio Manager, Prudential Investments. |
|
|
|
|
|
|
Name
Birth Date
Positions Held with Trust
Date Service Began
|
| Principal Occupation(s) for Past Five Years and Previous Position(s)
|
Lawrence Auriana
Birth Date: January 8, 1944
VICE PRESIDENT
Began serving: November 2001 | | Lawrence Auriana has been the Fund's Portfolio Manager since February 1986. He is Vice President of the Trust. Mr. Auriana joined Federated in April 2001 as Co-Head of Investments/Federated Kaufmann. From August 1984 to April 2001, Mr. Auriana was President and Treasurer of Edgemont Asset Management Corp., and Chairman of the Board and Portfolio Manager to The Kaufmann Fund, Inc. (predecessor to the Federated Kaufmann Fund). Mr. Auriana earned a B.S. in economics from Fordham University and has been engaged in the securities business since 1965. |
|
|
|
James E. Grefenstette
Birth Date: November 7, 1962
VICE PRESIDENT
Began serving: November 1998 | | James E. Grefenstette is Vice President of the Trust. Mr. Grefenstette joined Federated in 1992 and has been a Portfolio Manager since 1994. Mr. Grefenstette became a Senior Vice President of the Fund's Adviser in January 2000. He served as a Vice President of the Fund's Adviser from 1996 through 1999 and was an Assistant Vice President of the Fund's Adviser from 1994 until 1996. Mr. Grefenstette is a Chartered Financial Analyst; he received his M.S. in Industrial Administration from Carnegie Mellon University. |
|
|
|
Hans P. Utsch
Birth Date: July 3, 1936
VICE PRESIDENT
Began serving: November 2001 | | Hans P. Utsch has been the Fund's Portfolio Manager since February 1986. He is Vice President of the Trust. Mr. Utsch joined Federated in April 2001 as Co-Head of Investments/Federated Kaufmann. From August 1984 to April 2001, Mr. Utsch was Chairman of the Board and Secretary of Edgemont Asset Management Corp., and President and Portfolio Manager to The Kaufmann Fund, Inc. (predecessor to the Federated Kaufmann Fund). Mr. Utsch graduated from Amherst College and holds an M.B.A. from Columbia University. He has been engaged in the securities business since 1962. |
|
|
|
Board Review of Advisory Contract
As required by the Act, the Fund's Board has reviewed the Fund's investment advisory contract and subadvisory contracts. The Board's decision to approve these contracts reflects the exercise of its business judgment on whether to continue the existing arrangements. During its review of the contract these contracts, the Board considers many factors, among the most material of which are: the Fund's investment objectives; the Adviser's and subadviser's management philosophy, personnel, processes, and investment and operating strategies; long-term performance; the preferences and expectations of Fund shareholders and their relative sophistication; the continuing state of competition in the mutual fund industry; the range of comparable fees for similar funds in the mutual fund industry; the range and quality of services provided to the Fund and its shareholders by the Federated organization in addition to investment advisory services; and the Fund's relationship to the Federated family of funds which include a comprehensive array of funds with different investment objectives, policies and strategies which are available for exchange without the incurrence of additional sales charge.
In its decision to appoint or renew an Adviser, the Board is mindful of the potential disruptions of the Fund's operations and various risks, uncertainties and other effects that could occur as a result of a decision to terminate or not renew an advisory contract. In particular, the Board recognizes that most shareholders have invested in the Fund on the strength of the Adviser's industry standing and reputation and in the expectation that the Adviser will have a continuing role in providing advisory services to the Fund. Thus, the Board's "selection" or approval of the Adviser must reflect the fact that it is the shareholders who have effectively selected the Adviser by virtue of having invested in the Fund. The Board also considers the compensation and benefits received by the Adviser and subadviser. This includes fees received for services provided to the Fund by other entities in the Federated organization and research services received by the Adviser from brokers that execute fund trades, as well as advisory fees. In this regard, the Board is aware that various courts have interpreted provisions of the Act and have indicated in their decisions that the following factors may be relevant to an Adviser's fiduciary duty with respect to its receipt of compensation from a fund: the nature and quality of the services provided by the Adviser, including the performance of the Fund; the Adviser's cost of providing the services; the extent to which the Adviser may realize "economies of scale" as the Fund grows larger; any indirect benefits that may accrue to the Adviser and its affiliates as a result of the Adviser's relationship with the Fund; performance and expenses of comparable funds; and the extent to which the independent Board members are fully informed about all facts bearing on the Adviser's service and fee. The Fund's Board is aware of these factors and is guided by them in its review of the Fund's advisory contract to the extent they are appropriate and relevant, as discussed further below.
The Board considers and weighs these circumstances in light of its substantial accumulated experience in governing the Fund and working with Federated on matters relating to the Federated funds, and is assisted in its deliberations by the advice of independent legal counsel. In this regard, the Board requests and receives substantial and detailed information about the Fund and the Federated organization. Federated provides much of this information at each regular meeting of the Board, and furnishes additional reports in connection with the particular meeting at which the Board's formal review of the advisory contract occurs. In between regularly scheduled meetings, the Board may receive information on particular matters as the need arises. Thus, the Board's evaluation of an advisory contract is informed by reports covering such matters as: the Adviser's investment philosophy, personnel, and processes; operating strategies; the Fund's short- and long-term performance (in absolute terms, both on a gross basis and net of expenses, as well as in relationship to its particular investment program and certain competitor or "peer group" funds and/or other benchmarks, as appropriate), and comments on the reasons for performance; the Fund's expenses (including the advisory fee itself and the overall expense structure of the Fund, both in absolute terms and relative to similar and/or competing funds, with due regard for contractual or voluntary expense limitations); the use and allocation of brokerage commissions derived from trading the Fund's portfolio securities (if any); the nature and extent of the advisory and other services provided to the Fund by the Adviser and its affiliates; compliance and audit reports concerning the Federated funds and the Federated companies that service them (including communications from regulatory agencies), as well as Federated's responses to any issues raised therein; and relevant developments in the mutual fund industry and how the Federated funds and/or Federated are responding to them. The evaluation process is evolutionary, reflecting continually developing considerations. The criteria considered and the emphasis placed on relevant criteria change in recognition of changing circumstances in the mutual fund marketplace. For the past year, the Board concluded that the nature, quality and scope of services provided the fund by the Adviser and its affiliates was satisfactory.
With respect to the Fund's performance and expenses in particular, the Board has found the use of comparisons to other mutual funds with comparable investment programs to be particularly useful, given the high degree of competition in the mutual fund business. The Board focuses on comparisons with other similar mutual funds (rather than non-mutual fund products or services) because, simply put, they are more relevant. For example, other mutual funds are the products most like the Fund, they are readily available to Fund shareholders as alternative investment vehicles, and they are the type of investment vehicle in fact chosen and maintained by the Fund's investors. The range of their fees and expenses therefore appears to be a generally reliable indication of what consumers have found to be reasonable in the precise marketplace in which the Fund competes. The Fund's ability to deliver competitive performance when compared to its peer group may be a useful indicator of how the Adviser is executing on the Fund's investment program, which would in turn assist the Board in reaching a conclusion that the nature, extent, and quality of the Adviser's investment management services are such as to warrant continuation of the advisory contract. During the year ending December 31, 2004, the Fund's performance for both the one and three year periods were above the median of the relevant peer group. During the year ending December 31, 2004, the Fund's investment advisory fee after waivers and expense reimbursements, was above the median of the relevant peer group. The Board reviewed the fees and other expenses of the Fund with the Adviser and was satisfied that the overall expense structure of the Fund nevertheless remained competitive. The Board will continue to monitor advisory fees and other expenses borne by the Fund.
The Board also receives financial information about Federated, including reports on the compensation and benefits Federated derives from its relationships with the Federated funds. These reports cover not only the fees under the advisory contracts, but also fees received by Federated's subsidiaries for providing other services to the Federated funds under separate contracts (e.g., for serving as the Federated funds' administrator). The reports also discuss any indirect benefit Federated may derive from its receipt of research services from brokers who execute Federated fund trades as well as waivers of fees and/or reimbursements of expenses. In order for a fund to be competitive in the marketplace, Federated and its affiliates frequently waive fees and/or reimburse expenses. Although the Board considers the costs incurred and the profitability of the Federated organization as a whole, it does not evaluate, on a fund-by-fund basis, Federated's "profitability" and/or "costs" (which would include an assessment as to whether "economies of scale" would be realized if the fund were to grow to some sufficient size). In the Board's view, the cost of performing advisory services on a fund-specific basis is both difficult to estimate satisfactorily and a relatively minor consideration in its overall evaluation. Analyzing isolated funds would require constructed allocations of the costs of shared resources and operations based on artificial assumptions that are inconsistent with the existing relationships within a large and diversified family of funds that receive advisory and other services from the same organization. In addition, the availability of the exchange privilege among funds in the Federated family makes consideration of the overall cost and profitability of Federated more relevant than that of individual funds. Based upon this review, the Board is satisfied that the costs incurred in, as well as the profitability realized from, managing the Fund and the other Federated Funds are appropriate. Although the Board is always interested in discovering any genuine "economies of scale," its experience has been that such "economies" are likely to arise only when a fund grows dramatically, and becomes and remains very large in size. Even in these instances, purchase and redemption activity, as well as the presence of expense limitations (if any), may offset any perceived economies. As suggested above, the Board considers the information it receives about the Fund's performance and expenses as compared to an appropriate set of similar competing funds to be more relevant.
The Board bases its decision to approve an advisory contract on the totality of the circumstances and relevant factors and with a view to past and future long-term considerations. Not all of the factors and considerations identified above are relevant to every Federated fund, nor does the Board consider any one of them to be determinative. With respect to the factors that are relevant, the Board's decision to approve the contract reflects its determination that Federated's performance and actions provide a satisfactory basis to support the decision to continue the existing arrangements.
Voting Proxies on Fund Portfolio Securities
A description of the policies and procedures that the Fund uses to determine how to vote proxies, if any, relating to securities held in the Fund's portfolio is available, without charge and upon request, by calling 1-800-341-7400. A report on "Form N-PX" of how the Fund voted any such proxies during the most recent 12-month period ended June 30 is available through Federated's website. Go to FederatedInvestors.com, select "Products," select the "Prospectuses and Regulatory Reports" link, then select the Fund to access the link to Form N-PX. This information is also available from the EDGAR database on the SEC's website at www.sec.gov.
Quarterly Portfolio Schedule
The Fund files with the SEC a complete schedule of its portfolio holdings, as of the close of the first and third quarters of its fiscal year, on "Form N-Q." These filings are available on the SEC's website at www.sec.gov and may be reviewed and copied at the SEC's Public Reference Room in Washington, DC. (Call 1-800-SEC-0330 for information on the operation of the Public Reference Room.) You may also access this information from the "Products" section of the Federated Investors website at FederatedInvestors.com by clicking on "Portfolio Holdings" and selecting the name of the Fund, or by selecting the name of the Fund and clicking on "Portfolio Holdings." You must register on the website the first time you wish to access this information.
Mutual funds are not bank deposits or obligations, are not guaranteed by any bank, and are not insured or guaranteed by the U.S. government, the Federal Deposit Insurance Corporation, the Federal Reserve Board, or any other government agency. Investment in mutual funds involves investment risk, including the possible loss of principal.
This report is authorized for distribution to prospective investors only when preceded or accompanied by the Fund's prospectus, which contains facts concerning its objective and policies, management fees, expenses, and other information.
Federated
World-Class Investment Manager
Federated Kaufmann Fund
Federated Investors Funds
5800 Corporate Drive
Pittsburgh, PA 15237-7000
Contact us at FederatedInvestors.com
or call 1-800-341-7400.
Federated Securities Corp., Distributor
Cusip 314172644
26851 (12/05)
Federated is a registered mark of Federated Investors, Inc. 2005 (c)Federated Investors, Inc.
Federated
World-Class Investment Manager
Federated Kaufmann Fund
Established 2001
A Portfolio of Federated Equity Funds
5TH ANNUAL SHAREHOLDER REPORT
October 31, 2005
Class A Shares
Class B Shares
Class C Shares
FINANCIAL HIGHLIGHTS
SHAREHOLDER EXPENSE EXAMPLE
MANAGEMENT'S DISCUSSION OF FUND PERFORMANCE
PORTFOLIO OF INVESTMENTS SUMMARY TABLE
PORTFOLIO OF INVESTMENTS
STATEMENT OF ASSETS AND LIABILITIES
STATEMENT OF OPERATIONS
STATEMENT OF CHANGES IN NET ASSETS
NOTES TO FINANCIAL STATEMENTS
REPORT OF INDEPENDENT REGISTERED PUBLIC ACCOUNTING FIRM
BOARD OF TRUSTEES AND TRUST OFFICERS
BOARD REVIEW OF ADVISORY CONTRACT
VOTING PROXIES ON FUND PORTFOLIO SECURITIES
QUARTERLY PORTFOLIO SCHEDULE
Not FDIC Insured * May Lose Value * No Bank Guarantee
Financial Highlights - Class A Shares
(For a Share Outstanding Throughout Each Period)
Year Ended October 31
|
| 2005
|
|
| 2004
|
|
| 2003
|
|
| 2002
|
|
| Period
Ended
10/31/2001
| 1
|
Net Asset Value, Beginning of Period
| | $5.11 | | | $4.90 | | | $3.54 | | | $4.23 | | | $4.33 | |
Income From Investment Operations:
| | | | | | | | | | | | | | | |
Net investment income (loss)
| | (0.05 | )2 | | (0.06 | )2 | | (0.06 | )2 | | (0.05 | )2,3 | | (0.02 | )2 |
Net realized and unrealized gain (loss) on investments, options and foreign currency transactions
|
| 0.74
|
|
| 0.31
|
|
| 1.42
|
|
| (0.28
| )3
|
| (0.08
| )
|
TOTAL FROM INVESTMENT OPERATIONS
|
| 0.69
|
|
| 0.25
|
|
| 1.36
|
|
| (0.33
| )
|
| (0.10
| )
|
Less Distributions:
| | | | | | | | | | | | | | | |
Distributions from net realized gain on investments, options and foreign currency transactions
|
| (0.29
| )
|
| (0.04
| )
|
| - --
|
|
| (0.36
| )
|
| - --
|
|
Net Asset Value, End of Period
|
| $5.51
|
|
| $5.11
|
|
| $4.90
|
|
| $3.54
|
|
| $4.23
|
|
Total Return4
|
| 14.05
| %
|
| 5.24
| %5
|
| 38.42
| %
|
| (8.90
| )%
|
| (2.31
| )%
|
| | | | | | | | | | | | | | | |
Ratios to Average Net Assets:
|
|
|
|
|
|
|
|
|
|
|
|
|
|
|
|
Net expenses
|
| 1.93
| %
|
| 1.95
| %
|
| 1.95
| %
|
| 1.95
| %
|
| 1.95
| %6
|
Net investment income (loss)
|
| (1.00
| )%
|
| (1.29
| )%
|
| (1.45
| )%
|
| (1.25
| )%3
|
| (0.93
| )%6
|
Expense waiver/reimbursement7
|
| 0.21
| %
|
| 0.21
| %
|
| 0.24
| %
|
| 0.18
| %
|
| 0.17
| %6
|
Supplemental Data:
|
|
|
|
|
|
|
|
|
|
|
|
|
|
|
|
Net assets, end of period (000 omitted)
|
| $2,166,468
|
| $1,172,380
|
| $1,191,117
|
| $435,500
|
|
| $85,169
|
|
Portfolio turnover
|
| 71
| %
|
| 73
| %
|
| 72
| %
|
| 65
| %
|
| 74
| %
|
1 Reflects operations for the period from April 23, 2001 (date of initial public investment) to October 31, 2001.
2 Per share numbers have been calculated using the average shares method, which more appropriately represents the per share data for the period since the use of the undistributed income method did not accord with results of operations.
3 Effective November 1, 2001, the Fund adopted the provisions of the American Institute of Certified Public Accountants (AICPA) Audit and Accounting Guide for Investment Companies and began accreting discount/ amortizing premium on long-term debt securities. For the year ended October 31, 2002, this change had no effect on the net investment income (loss) per share, the net realized and unrealized gain (loss) on investments per share, or the ratio of net investment income (loss) to average net assets. Per share, ratios and supplemental data for periods prior to November 1, 2001 have not been restated to reflect this change in presentation.
4 Based on net asset value, which does not reflect the sales charge, redemption fee, or contingent deferred sales charge, if applicable. Total returns for periods of less than one year are not annualized.
5 During the period, the Fund was reimbursed by the Adviser, which had an impact of less than 0.01% on total returns. (See Notes to Financial Statements, Note 5.)
6 Computed on an annualized basis.
7 This expense decrease is reflected in both the net expense and the net investment income (loss) ratios shown above.
See Notes which are an integral part of the Financial Statements
Financial Highlights - Class B Shares
(For a Share Outstanding Throughout Each Period)
Year Ended October 31
|
| 2005
|
|
| 2004
|
|
| 2003
|
|
| 2002
|
|
| Period
Ended
10/31/2001
| 1
|
Net Asset Value, Beginning of Period
| | $5.02 | | | $4.84 | | | $3.52 | | | $4.22 | | | $4.33 | |
Income From Investment Operations:
| | | | | | | | | | | | | | | |
Net investment income (loss)
| | (0.08 | )2 | | (0.09 | )2 | | (0.08 | )2 | | (0.07 | )2,3 | | (0.03 | )2 |
Net realized and unrealized gain (loss) on investments, options and foreign currency transactions
|
| 0.73
|
|
| 0.31
|
|
| 1.40
|
|
| (0.27
| )3
|
| (0.08
| )
|
TOTAL FROM INVESTMENT OPERATIONS
|
| 0.65
|
|
| 0.22
|
|
| 1.32
|
|
| (0.34
| )
|
| (0.11
| )
|
Less Distributions:
| | | | | | | | | | | | | | | |
Distributions from net realized gain on investments, options and foreign currency transactions
|
| (0.29
| )
|
| (0.04
| )
|
| - --
|
|
| (0.36
| )
|
| - --
|
|
Net Asset Value, End of Period
|
| $5.38
|
|
| $5.02
|
|
| $4.84
|
|
| $3.52
|
|
| $4.22
|
|
Total Return4
|
| 13.47
| %
|
| 4.68
| %5
|
| 37.50
| %
|
| (9.20
| )%
|
| (2.54
| )%
|
| | | | | | | | | | | | | | | |
Ratios to Average Net Assets:
|
|
|
|
|
|
|
|
|
|
|
|
|
|
|
|
Net expenses
|
| 2.49
| %
|
| 2.50
| %
|
| 2.50
| %
|
| 2.47
| %
|
| 2.47
| %6
|
Net investment income (loss)
|
| (1.56
| )%
|
| (1.84
| )%
|
| (2.01
| )%
|
| (1.77
| )%3
|
| (1.45
| )%6
|
Expense waiver/reimbursement7
|
| 0.16
| %
|
| 0.16
| %
|
| 0.19
| %
|
| 0.16
| %
|
| 0.15
| %6
|
Supplemental Data:
|
|
|
|
|
|
|
|
|
|
|
|
|
|
|
|
Net assets, end of period (000 omitted)
|
| $1,102,133
|
| $993,477
|
| $782,171
|
| $427,175
|
|
| $68,902
|
|
Portfolio turnover
|
| 71
| %
|
| 73
| %
|
| 72
| %
|
| 65
| %
|
| 74
| %
|
1 Reflects operations for the period from April 23, 2001 (date of initial public investment) to October 31, 2001.
2 Per share numbers have been calculated using the average shares method, which more appropriately represents the per share data for the period since the use of the undistributed income method did not accord with results of operations.
3 Effective November 1, 2001, the Fund adopted the provisions of the AICPA Audit and Accounting Guide for Investment Companies and began accreting discount/amortizing premium on long-term debt securities. For the year ended October 31, 2002, this change had no effect on the net investment income (loss) per share, the net realized and unrealized gain (loss) on investments per share, or the ratio of net investment income (loss) to average net assets. Per share, ratios and supplemental data for periods prior to November 1, 2001 have not been restated to reflect this change in presentation.
4 Based on net asset value, which does not reflect the sales charge, redemption fee, or contingent deferred sales charge, if applicable. Total returns for periods of less than one year are not annualized.
5 During the period, the Fund was reimbursed by the Adviser, which had an impact of less than 0.01% on total returns. (See Notes to Financial Statements, Note 5.)
6 Computed on an annualized basis.
7 This expense decrease is reflected in both the net expense and the net investment income (loss) ratios shown above.
See Notes which are an integral part of the Financial Statements
Financial Highlights - Class C Shares
(For a Share Outstanding Throughout Each Period)
Year Ended October 31
|
| 2005
|
|
| 2004
|
|
| 2003
|
|
| 2002
|
|
| Period
Ended
10/31/2001
| 1
|
Net Asset Value, Beginning of Period
| | $5.02 | | | $4.84 | | | $3.52 | | | $4.22 | | | $4.33 | |
Income From Investment Operations:
| | | | | | | | | | | | | | | |
Net investment income (loss)
| | (0.08 | )2 | | (0.09 | )2 | | (0.08 | )2 | | (0.07 | )2,3 | | (0.03 | )2 |
Net realized and unrealized gain (loss) on investments, options and foreign currency transactions
|
| 0.73
|
|
| 0.31
|
|
| 1.40
|
|
| (0.27
| )3
|
| (0.08
| )
|
TOTAL FROM INVESTMENT OPERATIONS
|
| 0.65
|
|
| 0.22
|
|
| 1.32
|
|
| (0.34
| )
|
| (0.11
| )
|
Less Distributions:
| | | | | | | | | | | | | | | |
Distributions from net realized gain on investments, options and foreign currency transactions
|
| (0.29
| )
|
| (0.04
| )
|
| - --
|
|
| (0.36
| )
|
| - --
|
|
Net Asset Value, End of Period
|
| $5.38
|
|
| $5.02
|
|
| $4.84
|
|
| $3.52
|
|
| $4.22
|
|
Total Return4
|
| 13.47
| %
|
| 4.68
| %5
|
| 37.50
| %
|
| (9.20
| )%
|
| (2.54
| )%
|
| | | | | | | | | | | | | | | |
Ratios to Average Net Assets:
|
|
|
|
|
|
|
|
|
|
|
|
|
|
|
|
Net expenses
|
| 2.49
| %
|
| 2.50
| %
|
| 2.50
| %
|
| 2.47
| %
|
| 2.47
| %6
|
Net investment income (loss)
|
| (1.56
| )%
|
| (1.84
| )%
|
| (2.00
| )%
|
| (1.77
| )%3
|
| (1.45
| )%6
|
Expense waiver/reimbursement7
|
| 0.16
| %
|
| 0.16
| %
|
| 0.19
| %
|
| 0.16
| %
|
| 0.15
| %6
|
Supplemental Data:
|
|
|
|
|
|
|
|
|
|
|
|
|
|
|
|
Net assets, end of period (000 omitted)
|
| $724,468
|
|
| $554,799
|
|
| $337,765
|
|
| $127,714
|
|
| $16,234
|
|
Portfolio turnover
|
| 71
| %
|
| 73
| %
|
| 72
| %
|
| 65
| %
|
| 74
| %
|
1 Reflects operations for the period from April 23, 2001 (date of initial public investment) to October 31, 2001.
2 Per share numbers have been calculated using the average shares method, which more appropriately represents the per share data for the period since the use of the undistributed income method did not accord with results of operations.
3 Effective November 1, 2001, the Fund adopted the provisions of the AICPA Audit and Accounting Guide for Investment Companies and began accreting discount/amortizing premium on long-term debt securities. For the year ended October 31, 2002, this change had no effect on the net investment income (loss) per share, the net realized and unrealized gain (loss) on investments per share, or the ratio of net investment income (loss) to average net assets. Per share, ratios and supplemental data for periods prior to November 1, 2001 have not been restated to reflect this change in presentation.
4 Based on net asset value, which does not reflect the sales charge, redemption fee, or contingent deferred sales charge, if applicable. Total returns for periods of less than one year are not annualized.
5 During the period, the Fund was reimbursed by the Adviser, which had an impact of less than 0.01% on total returns. (See Notes to Financial Statements, Note 5.)
6 Computed on an annualized basis.
7 This expense decrease is reflected in both the net expense and the net investment income (loss) ratios shown above.
See Notes which are an integral part of the Financial Statements
Shareholder Expense Example
As a shareholder of the Fund, you incur two types of costs: (1) transactions costs, including sales charges (loads) on purchase or redemption payments; and (2) ongoing costs, including management fees; to the extent applicable, distribution (12b-1) fees and/or shareholder services fees; and other Fund expenses. This Example is intended to help you to understand your ongoing costs (in dollars) of investing in the Fund and to compare these costs with the ongoing costs of investing in other mutual funds. It is based on an investment of $1,000 invested at the beginning of the period and held for the entire period from May 1, 2005 to October 31, 2005.
ACTUAL EXPENSES
The first section of the table below provides information about actual account values and actual expenses. You may use the information in this section, together with the amount you invested, to estimate the expenses that you incurred over the period. Simply divide your account value by $1,000 (for example, an $8,600 account value divided by $1,000 = 8.6), then multiply the result by the number in the first section under the heading entitled "Expenses Paid During Period" to estimate the expenses attributable to your investment during this period.
HYPOTHETICAL EXAMPLE FOR COMPARISON PURPOSES
The second section of the table below provides information about hypothetical account values and hypothetical expenses based on the Fund's actual expense ratio and an assumed rate of return of 5% per year before expenses, which is not the Fund's actual return. Thus, you should not use the hypothetical account values and expenses to estimate the actual ending account balance or your expenses for the period. Rather, these figures are provided to enable you to compare the ongoing costs of investing in the Fund and other funds. To do so, compare this 5% hypothetical example with the 5% hypothetical examples that appear in the shareholder reports of the other funds.
Please note that the expenses shown in the table are meant to highlight your ongoing costs only and do not reflect any transaction costs, such as sales charges (loads) on purchase or redemption payments. Therefore, the second section of the table is useful in comparing ongoing costs only, and will not help you determine the relative total costs of owning different funds. In addition, if these transaction costs were included, your costs would have been higher.
|
| Beginning
Account Value
5/1/2005
|
| Ending
Account Value
10/31/2005
|
| Expenses Paid
During Period1
|
Actual:
|
|
|
|
|
|
|
Class A Shares
|
| $1,000
|
| $1,122.20
|
| $10.27
|
Class B Shares
|
| $1,000
|
| $1,118.50
|
| $13.35
|
Class C Shares
|
| $1,000
|
| $1,118.50
|
| $13.35
|
Hypothetical (assuming a 5% return before expenses):
|
|
|
|
|
|
|
Class A Shares
|
| $1,000
|
| $1,015.53
|
| $ 9.75
|
Class B Shares
|
| $1,000
|
| $1,012.60
|
| $12.68
|
Class C Shares
|
| $1,000
|
| $1,012.60
|
| $12.68
|
1 Expenses are equal to the Fund's annualized net expense ratios, multiplied by the average account value over the period, multiplied by 184/365 (to reflect the one-half year period). The annualized expense net ratios are as follows:
Class A Shares
|
| 1.92%
|
Class B Shares
|
| 2.50%
|
Class C Shares
|
| 2.50%
|
Management's Discussion of Fund Performance
The Federated Kaufmann Fund's Class A Shares, Class B Shares and Class C Shares produced total returns of 14.05%, 13.47% and 13.47%, respectively, based on net asset value for the reporting period ended October 31, 2005. The fund's benchmark, the Russell Mid-Cap Growth Index1 had a total return of 15.91% for the reporting period and the Lipper Mid-Cap Growth Index2 and the Lipper Mid-Cap Growth Funds Average3 had total returns of 14.19% and 14.07%, respectively.
Economic growth remained modest during the reporting period and was somewhat effected by higher energy prices and an active hurricane season. Generally mid and small cap growth companies continued to deliver double-digit earnings growth. Stock selection contributed to the performance of the fund. Two of our largest holdings, Advance Auto Parts and CB Richard Ellis Services, each returned over 40% during the reporting period contributing strongly to performance. Four Healthcare sector holdings, INAMED Corp., United Surgical Partners International, Inc., Cubist Pharmaceuticals, Inc., and Kyphon, Inc. each returned over 30% during the reporting period contributing positively to performance. Two Technology sector holdings, MEMC Electronic Materials and M-Systems Flash Disk Pioneer, Ltd., each returned over 85% during the reporting period contributing strongly to performance. Weakness in two significant pet supply retailers, PETsMart, Inc. (26%) and PETCO Animal Supplies, Inc. (46%), hurt performance during the reporting period.
1 Russell Midcap Growth Index measures the performance of those Russell Midcap companies with higher price-to-book ratios and higher forecasted growth values. The stocks are also members of the Russell 1000 Growth Index. The index is unmanaged, and unlike the fund, is not affected by cashflows. Investments cannot be made in an index.
2 Lipper Mid-Cap Growth Index is the composite performance of the largest mid-cap growth mutual funds, as categorized by Lipper, Inc. The index is unmanaged, and unlike the fund, is not affected by cashflows. Investments cannot be made in an index.
3 Lipper figures represent the average of the total returns reported by all the mutual funds designated by Lipper, Inc. as falling into the category indicated. They do not reflect sales charges.
The fund's performance was also negatively impacted by the fund's relatively light exposure to the Energy and Utility sectors, which were strong performers in the benchmark index and in many of the best-performing funds in the category. At Federated Kaufmann Fund, we generally prefer companies that are growing profitably as a result of some proprietary product or service or way of doing business, whereas many Energy-related companies have been growing more as a result of commodity pricing and the regulatory environment.
FEDERATED KAUFMANN FUND-CLASS A SHARES
Average Annual Total Returns for the Period Ended 10/31/2005
|
| 6-Month
(Cumulative)
|
| 1-Year
|
| 3-Years
|
| 5-Years
|
| 10-Years
|
| 15-Years
|
Federated Kaufmann Fund - Class A Shares2
|
| 6.05%
|
| 7.78%
|
| 16.22%
|
| 5.30%
|
| 10.44%
|
| 16.99%
|
Russell Midcap Growth Index3
|
| 11.37%
|
| 15.91%
|
| 20.65%
|
| (3.71)%
|
| 9.05%
|
| 12.86%
|
Lipper Mid-Cap Growth Index3
|
| 13.00%
|
| 14.19%
|
| 16.73%
|
| (5.25)%
|
| 6.96%
|
| 12.54%
|
Performance data quoted represents past performance which is no guarantee of future results. Investment return and principal value will fluctuate so that an investor's shares, when redeemed, may be worth more or less than their original cost. Mutual fund performance changes over time and current performance may be lower or higher than what is stated. For current to the most recent month-end performance and after-tax returns, visit FederatedInvestors.com or call 1-800-341-7400. Returns shown do not reflect the deduction of taxes that a shareholder would pay on Fund distributions or the redemption of Fund shares. Mutual funds are not obligations of or guaranteed by any bank and are not federally insured. Total returns shown include the maximum sales charge of 5.50%.
1 Represents a hypothetical investment of $10,000 in the Fund after deducting the maximum sales charge of 5.50% ($10,000 investment minus $550 sales charge = $9,450). The Fund's performance assumes the reinvestment of all dividends and distributions. The Russell Midcap Growth Index (RMGI) and the Lipper Mid-Cap Growth Index (LMCGI) have been adjusted to reflect reinvestment of all dividends on securities in the indexes. The Fund is a successor to the Kaufmann Fund, Inc. (Kaufmann Fund) pursuant to a reorganization that took place on April 23, 2001. Prior to that date, the Fund had no investment operations. Accordingly, the performance information provided is historical information of the Kaufmann Fund, but has been adjusted to reflect the expenses applicable to the Fund's Class A Shares.
2 Total returns quoted reflect all applicable sales charges.
3 The RMGI and the LMCGI are not adjusted to reflect sales charges, expenses, or other fees that the Securities and Exchange Commission (SEC) requires to be reflected in the Fund's performance. The RMGI measures the performance of those Russell Midcap companies with higher price-to-book ratios and higher forecasted growth values. The stocks are also members of the Russell 1000 Growth Index. The LMCGI is an equal dollar-weighted index of the largest mutual funds within the mid-cap growth classification, as defined by Lipper, Inc. The index is adjusted for the reinvestment of capital gains and income dividends. The indexes are unmanaged, and, unlike the Fund, are not affected by cashflows. Investments cannot be made in an index.
FEDERATED KAUFMANN FUND-CLASS B SHARES
Average Annual Total Returns for the Period Ended 10/31/2005
|
| 6-Month
(Cumulative)
|
| 1-Year
|
| 3-Years
|
| 5-Years
|
| 10-Years
|
| 15-Years
|
Federated Kaufmann Fund - Class B Shares2
|
| 6.35%
|
| 7.97%
|
| 16.79%
|
| 5.71%
|
| 10.63%
|
| 17.12%
|
Russell Midcap Growth Index3
|
| 11.37%
|
| 15.91%
|
| 20.65%
|
| (3.71)%
|
| 9.05%
|
| 12.86%
|
Lipper Mid-Cap Growth Index3
|
| 13.00%
|
| 14.19%
|
| 16.73%
|
| (5.25)%
|
| 6.96%
|
| 12.54%
|
Performance data quoted represents past performance which is no guarantee of future results. Investment return and principal value will fluctuate so that an investor's shares, when redeemed, may be worth more or less than their original cost. Mutual fund performance changes over time and current performance may be lower or higher than what is stated. For current to the most recent month-end performance and after-tax returns, visit FederatedInvestors.com or call 1-800-341-7400. Returns shown do not reflect the deduction of taxes that a shareholder would pay on Fund distributions or the redemption of Fund shares. Mutual funds are not obligations of or guaranteed by any bank and are not federally insured. Total returns shown include the maximum contingent deferred sales charge of 5.50% as applicable.
1 Represents a hypothetical investment of $10,000 in the Fund. The ending value of the Fund does not reflect a contingent deferred sales charge on any redemption over seven years from the purchase date. The maximum contingent deferred sales charge is 5.50% on any redemption less than one year from the purchase date. The Fund's performance assumes the reinvestment of all dividends and distributions. The Russell Midcap Growth Index (RMGI) and the Lipper Mid-Cap Growth Index (LMCGI) have been adjusted to reflect reinvestment of all dividends on securities in the indexes. The Fund is a successor to the Kaufmann Fund, Inc. (Kaufmann Fund) pursuant to a reorganization that took place on April 23, 2001. Prior to that date, the Fund had no investment operations. Accordingly, the performance information provided is historical information of the Kaufmann Fund, but has been adjusted to reflect the expenses applicable to the Fund's Class B Shares.
2 Total returns quoted reflect all applicable contingent deferred sales charges.
3 The RMGI and the LMCGI are not adjusted to reflect sales charges, expenses, or other fees that the SEC requires to be reflected in the Fund's performance. The RMGI measures the performance of those Russell mid-cap companies with higher price-to-book ratios and higher forecasted growth values. The stocks are also members of the Russell 1000 Growth Index. The LMCGI is an equal dollar-weighted index of the largest mutual funds within the mid-cap growth fund classification, as defined by Lipper, Inc. The index is adjusted for the reinvestment of capital gains and income dividends. The indexes are unmanaged, and, unlike the Fund, are not affected by cashflows. Investments cannot be made in an index.
FEDERATED KAUFMANN FUND-CLASS C SHARES
Average Annual Total Returns for the Period Ended 10/31/2005
|
| 6-Month
(Cumulative)
|
| 1-Year
|
| 3-Years
|
| 5-Years
|
| 10-Years
|
| 15-Years
|
Federated Kaufmann Fund - Class C Shares2
|
| 9.74%
|
| 11.34%
|
| 17.37%
|
| 5.75%
|
| 10.40%
|
| 16.77%
|
Russell Midcap Growth Index3
|
| 11.37%
|
| 15.91%
|
| 20.65%
|
| (3.71)%
|
| 9.05%
|
| 12.86%
|
Lipper Mid-Cap Growth Index3
|
| 13.00%
|
| 14.19%
|
| 16.73%
|
| (5.25)%
|
| 6.96%
|
| 12.54%
|
Performance data quoted represents past performance which is no guarantee of future results. Investment return and principal value will fluctuate so that an investor's shares, when redeemed, may be worth more or less than their original cost. Mutual fund performance changes over time and current performance may be lower or higher than what is stated. For current to the most recent month-end performance and after-tax returns, visit FederatedInvestors.com or call 1-800-341-7400. Returns shown do not reflect the deduction of taxes that a shareholder would pay on Fund distributions or the redemption of Fund shares. Mutual funds are not obligations of or guaranteed by any bank and are not federally insured. Total returns shown include the maximum sales charge of 1.00% and the 1.00% contingent deferred sales charge as applicable.
1 Represents a hypothetical investment of $10,000 in the Fund. A 1.00% contingent deferred sales charge would be applied on any redemption less than one year from the purchase date. Effective April 1, 2003, the Fund began to charge a maximum sales charge of 1.00%. The Fund's performance assumes the reinvestment of all dividends and distributions. The Russell Midcap Growth Index (RMGI) and the Lipper Mid-Cap Growth Index (LMCGI) have been adjusted to reflect reinvestment of all dividends on securities in the indexes. The Fund is a successor to the Kaufmann Fund, Inc. (Kaufmann Fund) pursuant to a reorganization that took place on April 23, 2001. Prior to that date, the Fund had no investment operations. Accordingly, the performance information provided is historical information of the Kaufmann Fund, but has been adjusted to reflect the expenses applicable to the Fund's Class C Shares.
2 Total returns quoted reflect all applicable sales charges and contingent deferred sales charges.
3 The RMGI and the LMCGI are not adjusted to reflect sales charges, expenses, or other fees that the SEC requires to be reflected in the Fund's performance. The RMGI measures the performance of those Russell mid-cap companies with higher price-to-book ratios and higher forecasted growth values. The stocks are also members of the Russell 1000 Growth Index. The LMCGI is an equal dollar-weighted index of the largest mutual funds within the mid-cap growth classification, as defined by Lipper, Inc. The index is adjusted for the reinvestment of capital gains and income dividends. The indexes are unmanaged, and, unlike the Fund, are not affected by cashflows. Investments cannot be made in an index.
Performance data quoted represents past performance which is no guarantee of future results. Investment return and principal value will fluctuate so that an investor's shares, when redeemed, may be worth more or less than their original cost. Mutual fund performance changes over time and current performance may be lower or higher than what is stated. For current to the most recent month-end performance, visit FederatedInvestors.com or call 1-800-341-7400.
Portfolio of Investments Summary Table
At October 31, 2005, the Fund's sector composition1 was as follows:
Sector
|
| Percentage of
Total Net Assets
|
Healthcare
|
| 20.7
| %
|
Information Technology
|
| 17.7
| %
|
Consumer Discretionary
|
| 16.2
| %
|
Financials
|
| 15.5
| %
|
Industrials
|
| 13.8
| %
|
Energy
|
| 3.4
| %
|
Telecommunication Services
|
| 2.3
| %
|
Consumer Staples
|
| 1.8
| %
|
Materials
|
| 0.9
| %
|
Utilities
|
| 0.2
| %
|
Options2
|
| 0.0
| %
|
Securities Lending Collateral3
|
| 5.3
| %
|
Cash Equivalents4
|
| 7.2
| %
|
Other Assets and Liabilities--Net5
|
| (5.0
| )%
|
TOTAL
|
| 100.0
| %
|
1 Except for Securities Lending Collateral, Options, Cash Equivalents and Other Assets and Liabilities, sector classifications are based upon, and individual portfolio securities are assigned to, the classifications of the Global Industry Classification Standard (GICS) except that the adviser assigns a classification to securities not classified by the GICS and to securities for which the adviser does not have access to the classification made by the GICS.
2 Represent less than 0.01%.
3 Cash collateral received from lending portfolio securities which is invested in short term investments such as repurchase agreements or money market funds.
4 Cash Equivalents includes any investments in money market mutual funds and/or overnight repurchase agreements other than those representing securities lending collateral.
5 See Statement of Assets and Liabilities.
Portfolio of Investments
October 31, 2005
Shares or
Units Held
|
|
|
|
| Value
|
|
| | | COMMON STOCKS--90.8% | | | | |
| | | Consumer Discretionary--16.0% | | | | |
| 750,000 | 1 | 1-800-FLOWERS.COM, Inc.
| | $ | 5,092,500 | |
| 8,491,800 | 1,2 | Advance Auto Parts, Inc.
| | | 318,442,500 | |
| 923,600 | 1 | Bed Bath & Beyond, Inc.
| | | 37,424,272 | |
| 1,778,895 | | Bharat Forge Ltd.
| | | 12,711,186 | |
| 784,700 | 1,2,3 | Brillian Corp.
| | | 5,147,632 | |
| 200,000 | 3 | Carnival Corp.
| | | 9,934,000 | |
| 600,000 | | Centex Corp.
| | | 38,610,000 | |
| 2,000,000 | 1,2,3 | Central European Media Enterprises Ltd., Class A
| | | 92,980,000 | |
| 2,938,500 | 1,3 | Clear Media Ltd.
| | | 2,468,693 | |
| 300,000 | 1,2,3 | Concorde Career Colleges, Inc.
| | | 4,500,000 | |
| 200,000 | | D. R. Horton, Inc.
| | | 6,138,000 | |
| 370,600 | 3 | DSW, Inc., Class A
| | | 7,715,892 | |
| 161,400 | 1,3 | Dick's Sporting Goods, Inc.
| | | 4,830,702 | |
| 500,000 | 3 | Domino's Pizza, Inc.
| | | 11,960,000 | |
| 1,659,300 | 1,3 | Earle M. Jorgensen Co.
| | | 14,070,864 | |
| 1,000,000 | 1 | Educate, Inc.
| | | 11,780,000 | |
| 475,000 | 1,3 | Expedia, Inc.
| | | 8,925,250 | |
| 582,500 | 1,3 | Garmin Ltd.
| | | 33,452,975 | |
| 350,000 | 1,3 | Getty Images, Inc.
| | | 29,053,500 | |
| 101,156 | 1 | Hollywood Media Corp., Warrants 5/22/2007
| | | 247,949 | |
| 475,000 | 1,3 | IAC Interactive Corp.
| | | 12,160,000 | |
| 10,000,000 | 2 | J.D. Wetherspoon PLC
| | | 52,274,343 | |
| 1,000,000 | 1 | Kohl's Corp.
| | | 48,130,000 | |
| 1,000,000 | 1,3 | Lamar Advertising Co.
| | | 44,620,000 | |
| 215,500 | 1 | Liberty Global, Inc., Class A
| | | 5,337,935 | |
| 215,500 | 1 | Liberty Global, Inc., Class C
| | | 5,111,660 | |
| 700,000 | 1,3 | Lodgenet Entertainment
| | | 9,100,000 | |
| 435,900 | 1 | Maidenform Brands, Inc.
| | | 5,487,981 | |
| 1,000,000 | 3 | Orient-Express Hotel Ltd.
| | | 28,200,000 | |
| 459,200 | 1,3 | PETCO Animal Supplies, Inc.
| | | 8,729,392 | |
Shares or
Units Held
|
|
|
|
| Value
|
|
| | | COMMON STOCKS--continued | | | | |
| | | Consumer Discretionary--continued | | | | |
| 9,040,100 | 2 | PETsMART, Inc.
| | $ | 212,442,350 | |
| 188,400 | 1 | Pantaloon Retail India Ltd.
| | | 6,311,319 | |
| 32,396 | | SKY Perfect Communications, Inc.
| | | 23,272,235 | |
| 300,000 | | Speedway Motorsports, Inc.
| | | 10,638,000 | |
| 375,000 | 1,3 | Stamps.com, Inc.
| | | 7,560,000 | |
| 500,000 | 1,4,5 | Submarino SA
| | | 13,140,000 | |
| 600,000 | 1 | Texas Roadhouse, Inc.
| | | 9,444,000 | |
| 249,200 | 1,3 | TomTom NV
| | | 9,595,746 | |
| 664,100 | 3 | USS Co. Ltd.
| | | 45,500,728 | |
| 10,000 | | Washington Post Co., Class B
| | | 7,450,000 | |
| 900,000 | 1,3 | Williams-Sonoma, Inc.
| | | 35,199,000 | |
| 59,800 | | Winnebago Industries, Inc.
|
|
| 1,753,336
|
|
| | | TOTAL
|
|
| 1,256,943,940
|
|
| | | Consumer Staples--1.8% | | | | |
| 1,800,000 | 1,3 | Dean Foods Co.
| | | 65,070,000 | |
| 300,000 | 1 | Shoppers Drug Mart Corp.
| | | 9,979,680 | |
| 850,000 | 1,4,5 | Shoppers Drug Mart Corp.
| | | 28,340,530 | |
| 400,000 | 1,3 | TreeHouse Foods, Inc.
| | | 10,336,000 | |
| 190,000 | | Whole Foods Market, Inc.
|
|
| 27,384,700
|
|
| | | TOTAL
|
|
| 141,110,910
|
|
| | | Energy--3.4% | | | | |
| 351,600 | 3 | Arch Coal, Inc.
| | | 27,097,812 | |
| 400,000 | 3 | ENSCO International, Inc.
| | | 18,236,000 | |
| 500,000 | 3 | Kinder Morgan, Inc.
| | | 45,450,000 | |
| 715,900 | 1,3 | Nabors Industries Ltd.
| | | 49,132,217 | |
| 200,000 | 3 | Noble Corp.
| | | 12,876,000 | |
| 200,000 | 1 | Oceaneering International, Inc.
| | | 9,624,000 | |
| 100,000 | 1 | Oil States International, Inc.
| | | 3,310,000 | |
| 550,300 | 3 | Peabody Energy Corp.
| | | 43,011,448 | |
| 794,600 | 1 | The Houston Exploration Co.
| | | 40,961,630 | |
| 200,000 | 1,3 | Transocean Sedco Forex, Inc.
| | | 11,498,000 | |
| 130,300 | 1 | Trico Marine Services, Inc.
|
|
| 3,321,347
|
|
| | | TOTAL
|
|
| 264,518,454
|
|
Shares or
Units Held
|
|
|
|
| Value
|
|
| | | COMMON STOCKS--continued | | | | |
| | | Financials--15.4% | | | | |
| 2,903,235 | | 3i Group
| | $ | 38,951,526 | |
| 2,490,300 | 3 | Advance America Cash Advance, Inc.
| | | 30,257,145 | |
| 1 | 4,5 | Apollo Investment Fund V
| | | 6,406,743 | |
| 510,000 | 1 | Assurant, Inc.
| | | 19,482,000 | |
| 2,000,000 | | Axis Capital Holdings Ltd.
| | | 51,860,000 | |
| 4,000,000 | 1,2 | CB Richard Ellis Services
| | | 195,400,000 | |
| 705,000 | | Calamos Asset Management, Inc.
| | | 17,124,450 | |
| 745,000 | | Capital One Financial Corp.
| | | 56,880,750 | |
| 114,293,000 | 1 | China Construction Bank
| | | 34,647,199 | |
| 1 | 4,5 | Denovo Ventures I LP
| | | 4,180,000 | |
| 1,440,600 | | Endurance Specialty Holdings Ltd.
| | | 47,770,296 | |
| 1 | 1,4,5 | FA Private Equity Fund IV LP
| | | 394,673 | |
| 842,400 | 1,3 | First Marblehead Corp.
| | | 24,926,616 | |
| 200,000 | | Global Signal, Inc.
| | | 8,290,000 | |
| 1 | 4,5 | Greenfield Technology Venture Fund
| | | 14,642 | |
| 885,000 | | ICICI Bank Ltd.
| | | 9,778,788 | |
| 563,000 | | IPC Holdings LTD
| | | 14,823,790 | |
| 1 | 4,5 | Incuvest LLC
| | | 0 | |
| 1 | 1,4,5 | Infrastructure Fund
| | | 130,214 | |
| 1 | 4,5 | Internet.com Corp.
| | | 0 | |
| 541,600 | 1 | James River Group, Inc.
| | | 10,236,240 | |
| 655,500 | | Korea Investment Holdings Co. Ltd.
| | | 17,134,660 | |
| 2,850,000 | 1,3 | Labranche & Co. Inc.
| | | 27,189,000 | |
| 1 | 4,5 | Latin Healthcare Fund
| | | 11,007,388 | |
| 121,800 | 1 | Markel Corp.
| | | 38,732,400 | |
| 2,900,000 | 3 | Nuveen Investments, Class A
| | | 117,363,000 | |
| 1 | 4,5 | Peachtree/CB Partners
| | | 0 | |
| 1 | 4,5 | Peachtree Leadscope LLC
| | | 68,340 | |
| 1 | 1,4,5 | Peachtree Leadscope LLC
| | | 300,000 | |
| 1 | 4,5 | Peachtree Open Networks
| | | 132,750 | |
| 1 | 4,5 | Peachtree Velquest
| | | 4,775 | |
| 855,000 | 1,3 | Philadelphia Consolidated Holding Corp.
| | | 82,302,300 | |
| 418,700 | 1,4,5 | RHJ International
| | | 9,784,926 | |
| 1 | 4,5 | Rocket Ventures II
| | | 0 | |
Shares or
Units Held
|
|
|
|
| Value
|
|
| | | COMMON STOCKS--continued | | | | |
| | | Financials--continued | | | | |
| 212,790 | 3 | SFCG Co. Ltd.
| | $ | 51,075,086 | |
| 14,072,500 | 3 | Shinsei Bank Ltd.
| | | 82,037,360 | |
| 735,000 | | St. Joe Co.
| | | 48,473,250 | |
| 350,000 | 3 | U-Store-It Trust
| | | 7,301,000 | |
| 116,000 | 3 | White Mountains Insurance Group, Inc.
| | | 70,168,400 | |
| 1,935,000 | 3 | Willis Group Holdings Ltd.
|
|
| 71,865,900
|
|
| | | TOTAL
|
|
| 1,206,495,607
|
|
| | | Healthcare--20.2% | | | | |
| 500,000 | 1 | ATS Medical, Inc.
| | | 1,494,750 | |
| 1,640,200 | 1 | AVANIR Pharmaceuticals, Class A
| | | 5,068,218 | |
| 700,000 | 1,3 | Abiomed, Inc.
| | | 6,041,000 | |
| 91,400 | 1 | Adeza Biomedical Corp.
| | | 1,558,370 | |
| 1,069,200 | 1,3 | Alexion Pharmaceuticals, Inc.
| | | 29,285,388 | |
| 2,539,800 | 1,3 | Alkermes, Inc.
| | | 41,373,342 | |
| 900,000 | 3 | Allergan, Inc.
| | | 80,370,000 | |
| 850,000 | 1,3 | Amylin Pharmaceuticals, Inc.
| | | 28,560,000 | |
| 1,000,000 | 1,2 | Anika Therapeutics, Inc.
| | | 12,340,000 | |
| 650,000 | 1,4,5 | Aradigm Corp., Warrants 12/17/2006
| | | 6,737 | |
| 434,259 | 1 | Ardais Corp., Warrants 1/1/2005
| | | 0 | |
| 434,259 | 1,4 | Ardais Corp., Warrants 4/14/2009
| | | 0 | |
| 802,300 | 1,3 | Arena Pharmaceuticals, Inc.
| | | 8,343,920 | |
| 360,300 | 1,3 | Arthrocare Corp.
| | | 13,233,819 | |
| 806,900 | 1,3 | Aspect Medical Systems, Inc.
| | | 26,321,078 | |
| 649,000 | 1 | Auxilium Pharmaceutical, Inc.
| | | 2,531,100 | |
| 3,000,000 | 1,2,3 | Avigen, Inc.
| | | 8,100,000 | |
| 1,387,600 | 1,3 | BioMarin Pharmaceutical, Inc.
| | | 11,655,840 | |
| 1,000,000 | 1,3 | Bioenvision, Inc.
| | | 6,130,000 | |
| 100,000 | 1,3 | Biosite Diagnostics, Inc.
| | | 5,523,000 | |
| 100,000 | | Cardinal Health, Inc.
| | | 6,251,000 | |
| 950,000 | 1 | Caremark Rx, Inc.
| | | 49,780,000 | |
| 800,000 | 1,3 | Charles River Laboratories International, Inc.
| | | 35,008,000 | |
| 555,000 | 1,2 | Chindex International, Inc.
| | | 2,042,400 | |
| 111,000 | 1,2 | Chindex International, Inc., Warrants 3/31/2009
| | | 158,401 | |
| 347,492 | 4,5 | CompBenefits Corp.
| | | 304,055 | |
Shares or
Units Held
|
|
|
|
| Value
|
|
| | | COMMON STOCKS--continued | | | | |
| | | Healthcare--continued | | | | |
| 3,634,700 | 1,2,3 | Conceptus, Inc.
| | $ | 37,328,369 | |
| 625,000 | 4,5 | Conceptus, Inc.
| | | 5,776,875 | |
| 714,286 | 2,4,5 | Conceptus, Inc.
| | | 7,335,717 | |
| 600,000 | 1,2,4,5 | Conceptus, Inc.
| | | 6,162,000 | |
| 500,000 | 1,4,5 | Cortek, Inc.
| | | 200,000 | |
| 3,000,000 | 1,2,3 | Cubist Pharmaceuticals, Inc.
| | | 60,630,000 | |
| 4,451,300 | 1,3 | Cytyc Corp.
| | | 112,840,455 | |
| 837,100 | 1 | Dexcom, Inc.
| | | 10,890,671 | |
| 500,000 | 1,3 | Digene Corp.
| | | 15,100,000 | |
| 4,587,300 | 1,2 | Dyax Corp.
| | | 19,496,025 | |
| 5,204,200 | 1,2,3 | Dynavax Technologies Corp.
| | | 30,756,822 | |
| 868,800 | 1 | Endo Pharmaceuticals Holdings, Inc.
| | | 23,388,096 | |
| 3,555,556 | 1 | Endologix, Inc.
| | | 16,782,224 | |
| 2,312,250 | 1,2,4,5 | Endologix, Inc.
| | | 10,913,820 | |
| 600,000 | 1 | Endologix, Inc.
| | | 2,832,000 | |
| 1,250,000 | 1,4,5 | Endologix, Inc.
| | | 5,900,000 | |
| 494,200 | 1,3 | Eyetech Pharmaceuticals, Inc.
| | | 8,717,688 | |
| 1,979,000 | 1,2,3 | GTX, Inc.
| | | 17,415,200 | |
| 159,000 | 3 | GlaxoSmithKline PLC, ADR
| | | 8,266,410 | |
| 500,000 | | Guidant Corp.
| | | 31,500,000 | |
| 1,744,100 | 1 | INAMED Corp.
| | | 124,005,510 | |
| 2,478,200 | 1,2,3 | Illumina, Inc.
| | | 38,585,574 | |
| 860,000 | 1,3 | Immunicon Corp.
| | | 3,318,740 | |
| 1,200,000 | 1,3 | Incyte Genomics, Inc.
| | | 5,988,000 | |
| 4,000,000 | 1,2,3 | Isis Pharmaceuticals, Inc.
| | | 17,360,000 | |
| 4,705,882 | 1,4,5 | Isis Pharmaceuticals, Inc.
| | | 18,381,175 | |
| 1,176,470 | 1 | Isis Pharmaceuticals, Inc., Warrants 8/23/2010
| | | 2,581,934 | |
| 1,000,000 | 1 | Kinetic Concepts, Inc.
| | | 35,900,000 | |
| 1,193,800 | 1 | Kosan Biosciences, Inc.
| | | 8,464,042 | |
| 1,183,100 | 1,3 | Kyphon, Inc.
| | | 47,430,479 | |
| 200,000 | 1,3 | Medicines Co.
| | | 3,428,000 | |
| 99,200 | | Meridian Bioscience, Inc.
| | | 2,077,248 | |
Shares or
Units Held
|
|
|
|
| Value
|
|
| | | COMMON STOCKS--continued | | | | |
| | | Healthcare--continued | | | | |
| 2,559,000 | 1,2 | Metabasis Therapeutics, Inc.
| | $ | 12,180,840 | |
| 895,650 | 1,4,5 | Metabasis Therapeutics, Inc., Warrants 9/30/2010
| | | 2,940,852 | |
| 94,451 | 1 | Migenix, Inc.
| | | 30,388 | |
| 768,100 | 1,3 | Momenta Pharmaceuticals, Inc.
| | | 16,537,193 | |
| 1,109,000 | 1,2 | NMT Medical, Inc.
| | | 12,975,300 | |
| 1,743,700 | 1 | Nektar Therapeutics
| | | 26,260,122 | |
| 723,800 | 1,3 | Neurochem, Inc.
| | | 11,037,950 | |
| 500,000 | 1,3 | Neurocrine Biosciences, Inc.
| | | 26,410,000 | |
| 64,600 | 1,3 | Neurometrix, Inc.
| | | 2,405,058 | |
| 1,476,635 | 1,3 | Nicox
| | | 6,884,925 | |
| 849,500 | 1,3 | Northfield Laboratories, Inc.
| | | 10,567,780 | |
| 310,200 | | Novartis AG, ADR
| | | 16,694,964 | |
| 1,735,300 | 1,2 | NxStage Medical, Inc.
| | | 19,695,655 | |
| 106,500 | 1,3 | OSI Pharmaceuticals, Inc.
| | | 2,481,450 | |
| 200,000 | 1,3 | Onyx Pharmaceuticals, Inc.
| | | 5,138,000 | |
| 2,556,800 | 1,2,3 | Pharmacyclics, Inc.
| | | 18,920,320 | |
| 516,896 | 1 | Point Therapeutics, Inc.
| | | 1,897,008 | |
| 805,300 | 1,3 | Progenics Pharmaceuticals, Inc.
| | | 18,956,762 | |
| 168,300 | 1 | Psychiatric Solutions, Inc.
| | | 9,206,010 | |
| 436,687 | 1,3 | Rita Medical Systems, Inc.
| | | 1,458,535 | |
| 458,965 | 1 | Sanarus Medical, Inc., Warrants
| | | 0 | |
| 100,000 | 1 | Sangamo BioSciences, Inc.
| | | 463,000 | |
| 5,607,353 | 1,2,3 | Santarus, Inc.
| | | 34,485,221 | |
| 401,000 | 1,3 | Sepracor, Inc.
| | | 22,556,250 | |
| 200,000 | 1 | Symbion, Inc.
| | | 4,526,000 | |
| 1,731,600 | 1,3 | Threshold Pharmaceuticals, Inc., Class THL
| | | 19,116,864 | |
| 500,000 | | UnitedHealth Group, Inc.
| | | 28,945,000 | |
| 3,000,000 | 1,2,3 | United Surgical Partners International, Inc.
| | | 107,550,000 | |
| 344,900 | 1,3 | VCA Antech, Inc.
| | | 8,898,420 | |
| 1,000,000 | 1,3 | Vasogen, Inc.
| | | 2,670,000 | |
| 1,858,600 | 1,2 | Vical, Inc.
| | | 9,497,446 | |
| 171,300 | 1,3 | WebMD Health Corp., Class A
| | | 4,474,356 | |
| 1,410,138 | 1,2 | World Heart Corp., Warrants 9/22/2008
|
|
| 646,058
|
|
| | | TOTAL
|
|
| 1,587,741,219
|
|
Shares or
Units Held
|
|
|
|
| Value
|
|
| | | COMMON STOCKS--continued | | | | |
| | | Industrials--13.8% | | | | |
| 2,636,800 | 1,3 | ABX Air, Inc.
| | $ | 21,068,032 | |
| 505,400 | | Bharat Heavy Electricals Ltd.
| | | 12,916,228 | |
| 1,800,000 | | CNF Transportation, Inc.
| | | 101,286,000 | |
| 3,000,000 | | Cendant Corp.
| | | 52,260,000 | |
| 2,400,000 | | Chicago Bridge & Iron Co., N.V.
| | | 53,520,000 | |
| 744,500 | 1,3 | CoStar Group, Inc.
| | | 35,698,775 | |
| 111,100 | 1,3 | Commercial Vehicle Group, Inc.
| | | 2,168,672 | |
| 100,000 | 1 | Copart, Inc.
| | | 2,339,000 | |
| 1,600,000 | 3 | Cummins, Inc.
| | | 136,592,000 | |
| 500,000 | 3 | DRS Technologies, Inc.
| | | 24,630,000 | |
| 1,200,000 | | Expeditors International Washington, Inc.
| | | 72,804,000 | |
| 1,000,000 | | FedEx Corp.
| | | 91,930,000 | |
| 200,000 | | Fluor Corp.
| | | 12,720,000 | |
| 902,600 | | Forward Air Corp.
| | | 31,997,170 | |
| 495,700 | 1 | Genco Shipping & Trading Ltd.
| | | 8,144,351 | |
| 108,700 | 1 | Global Cash Access LLC
| | | 1,523,974 | |
| 1,995,000 | 1,2,3 | Interline Brands, Inc.
| | | 38,962,350 | |
| 283,100 | 1,3 | K&F Industries Holdings, Inc.
| | | 4,427,684 | |
| 400,000 | 1,3 | Kansas City Southern Industries, Inc.
| | | 8,864,000 | |
| 274,209 | | Kuehne & Nagel International AG
| | | 64,178,480 | |
| 462,600 | 1 | Landstar System, Inc.
| | | 17,819,352 | |
| 105,800 | | Larsen & Toubro Ltd.
| | | 3,315,082 | |
| 1,265,600 | 1,2,3 | NuCo2, Inc.
| | | 28,982,240 | |
| 80,300 | 1 | RBC Bearings, Inc.
| | | 1,254,286 | |
| 2,190,000 | | Rinker Group Ltd.
| | | 24,844,273 | |
| 750,000 | 1,3 | Ryanair Holdings PLC, ADR
| | | 37,177,500 | |
| 2,164,200 | 1,2 | Seaspan Corp.
| | | 40,600,392 | |
| 1,042,500 | 3 | Simpson Manufacturing Co., Inc.
| | | 41,137,050 | |
| 62,100 | 1 | Suzlon Energy Ltd.
| | | 990,334 | |
| 1,000,000 | | TNT NV
| | | 23,605,271 | |
| 1,000,000 | | United Parcel Service, Inc.
| | | 72,940,000 | |
| 709,900 | 3 | Vicor Corp.
|
|
| 11,961,815
|
|
| | | TOTAL
|
|
| 1,082,658,311
|
|
Shares or
Units Held
|
|
|
|
| Value
|
|
| | | COMMON STOCKS--continued | | | | |
| | | Information Technology--17.2% | | | | |
| 400,000 | 1 | ATI Technologies, Inc.
| | $ | 5,757,345 | |
| 1,445,000 | | Adtran, Inc.
| | | 43,711,250 | |
| 156,700 | 1,3 | Advanced Analogic Technologies, Inc.
| | | 1,708,030 | |
| 1,200,000 | 1,3 | Affiliated Computer Services, Inc., Class A
| | | 64,932,000 | |
| 74,400 | 1,3 | Altiris, Inc.
| | | 1,257,360 | |
| 800,000 | 1,3 | Amdocs Ltd.
| | | 21,176,000 | |
| 1,000,000 | 1,3 | Autodesk, Inc.
| | | 45,130,000 | |
| 803,900 | 1,3 | Blackboard Inc.
| | | 22,589,590 | |
| 150,000 | 1 | Broadcom Corp.
| | | 6,369,000 | |
| 3,138,200 | 1 | CSR PLC
| | | 39,976,301 | |
| 1,250,000 | 1,3 | Check Point Software Technologies Ltd.
| | | 27,950,000 | |
| 2,000,000 | 1,3 | Cirrus Logic, Inc.
| | | 13,120,000 | |
| 500,000 | 1,3 | Cogent, Inc.
| | | 13,275,000 | |
| 375,000 | 1,3 | Cognos, Inc.
| | | 14,073,750 | |
| 1,000,000 | 1 | Comverse Technology, Inc.
| | | 25,100,000 | |
| 308,100 | 1 | DST Systems, Inc.
| | | 17,290,572 | |
| 352,323 | 1,4,5 | Decision Management International, Inc.
| | | 0 | |
| 1,500,000 | 1,2,3 | eCollege.com
| | | 23,865,000 | |
| 1,000,000 | 1,3 | Entegris, Inc.
| | | 9,760,000 | |
| 1,059,322 | 4,5 | Expand Networks Ltd.
| | | 199,153 | |
| 787,500 | 1 | Filenet Corp.
| | | 22,168,125 | |
| 155,100 | 1 | Google Inc.
| | | 57,718,914 | |
| 250,000 | 1,3 | Greenfield Online, Inc.
| | | 1,255,000 | |
| 500,000 | 1 | Hewitt Associates, Inc.
| | | 13,345,000 | |
| 1,500,000 | 1 | Homestore.com, Inc.
| | | 5,445,000 | |
| 932,700 | 1 | Hyperion Solutions Corp.
| | | 45,105,372 | |
| 1,133,900 | 1,2,3 | Infocrossing, Inc.
| | | 7,835,249 | |
| 356,234 | 1,2 | Infocrossing, Inc., Warrants 10/21/2008
| | | 560,859 | |
| 1,000,000 | | Infosys Technologies Ltd.
| | | 56,171,969 | |
| 539,400 | 1,3 | Intrado, Inc.
| | | 10,431,996 | |
| 287,500 | 1,3 | Iron Mountain, Inc.
| | | 11,212,500 | |
Shares or
Units Held
|
|
|
|
| Value
|
|
| | | COMMON STOCKS--continued | | | | |
| | | Information Technology--continued | | | | |
| 1,300,000 | 1,3 | Komag, Inc.
| $ | | 34,866,000 | |
| 1,000,000 | 1,3 | LG Philips LCD Co. Ltd., ADR
| | | 19,010,000 | |
| 198,500 | 1 | LeCroy Corp.
| | | 3,048,960 | |
| 1,450,000 | 1 | M-Systems Flash Disk Pioneers Ltd.
| | | 45,950,500 | |
| 4,500,000 | 1,3 | MEMC Electronic Materials
| | | 80,730,000 | |
| 300,000 | 1 | Macromedia, Inc.
| | | 13,176,000 | |
| 4,680,000 | 1,2,3 | Magma Design Automation
| | | 40,622,400 | |
| 1,600,000 | 3 | Microsemi Corp.
| | | 37,072,000 | |
| 3,000,000 | | Microsoft Corp.
| | | 77,100,000 | |
| 900,000 | 1,3 | Mobility Electronics, Inc.
| | | 8,127,000 | |
| 2,192,800 | 1,3 | NAVTEQ Corp.
| | | 85,782,336 | |
| 3,075,000 | 1,2 | NIC, Inc.
| | | 18,603,750 | |
| 900,000 | 1,3 | NetIQ Corp.
| | | 10,791,000 | |
| 1,787,500 | 1,2 | Online Resources Corp.
| | | 21,450,000 | |
| 530,000 | 1,2,4,5 | Online Resources Corp.
| | | 6,360,000 | |
| 3,000,000 | 1 | Oracle Corp.
| | | 38,040,000 | |
| 915,000 | 1,3 | Portalplayer, Inc.
| | | 18,473,850 | |
| 1,191,600 | 1,2,3 | PowerDsine Ltd.
| | | 11,367,864 | |
| 1,550,000 | 1 | Quest Software, Inc.
| | | 21,560,500 | |
| 1,500,000 | 1 | S1 Corp.
| | | 6,585,000 | |
| 220,000 | 1,3 | SI International, Inc.
| | | 6,351,400 | |
| 880,100 | 1 | SSA Global Technologies, Inc.
| | | 13,773,565 | |
| 9,400 | | Samsung Electronics Co.
| | | 5,011,755 | |
| 170,000 | 1,3 | Sandisk Corp.
| | | 10,011,300 | |
| 495,900 | | Satyam Computer Services Ltd., ADR
| | | 16,949,862 | |
| 92,400 | 1 | Seagate Technology Holdings
| | | 1,338,876 | |
| 1 | 4,5 | Sensable Technologies, Inc.
| | | 200,559 | |
| 3,751,199 | 4,5 | Sensable Technologies, Inc.
| | | 0 | |
| 1,001,900 | 1,3 | Sigmatel Inc.
| | | 13,635,859 | |
| 1,100,000 | 1 | TNS, Inc.
| | | 19,338,000 | |
Shares or
Units Held
|
|
|
|
| Value
|
|
| | | COMMON STOCKS--continued | | | | |
| | | Information Technology--continued | | | | |
| 495,100 | 1,3 | TRX, Inc.
| | $ | 4,238,056 | |
| 63,542 | 1 | Tidel Technologies, Inc.
| | | 16,521 | |
| 903,900 | 1,3 | Ultratech Stepper, Inc.
| | | 12,455,742 | |
| 400,000 | 1,3 | ValueClick, Inc.
| | | 7,000,000 | |
| 837,500 | 1 | Visual Networks, Inc.
| | | 1,046,875 | |
| 570,600 | 1 | Xyratex Ltd.
|
|
| 7,725,924
|
|
| | | TOTAL
|
|
| 1,346,301,789
|
|
| | | Materials--0.9% | | | | |
| 379,780 | | Cemex S.A. de C.V., ADR
| | | 19,775,144 | |
| 19,910,000 | | China Metal International Ho
| | | 5,714,548 | |
| 305,100 | 1 | Frutarom
| | | 2,416,331 | |
| 694,900 | | Frutarom, GDR
| | | 5,503,469 | |
| 24,292,000 | 1 | Lee & Man Paper Manufacturing Ltd.
| | | 22,796,338 | |
| 380,000 | 3 | Newmont Mining Corp.
|
|
| 16,188,000
|
|
| | | TOTAL
|
|
| 72,393,830
|
|
| | | Telecommunication Services--2.0% | | | | |
| 322,376 | | Alltel Corp.
| | | 19,942,179 | |
| 6,000,000 | 1 | Bharti Televentures
| | | 43,177,202 | |
| 695,700 | 1 | Consolidated Communications Holdings, Inc.
| | | 9,224,982 | |
| 348,800 | 1,3 | NeuStar, Inc., Class A
| | | 10,673,280 | |
| 20,000 | 3 | PT Telekomunikasi Indonesia, Class CS, ADR
| | | 407,200 | |
| 15,055,000 | 3 | Singapore Telecom Ltd.
| | | 20,710,347 | |
| 1,237,800 | 1 | Syniverse Holdings, Inc.
| | | 22,404,180 | |
| 4,000,000 | 1,2,3 | Time Warner Telecom, Inc.
|
|
| 33,520,000
|
|
| | | TOTAL
|
|
| 160,059,370
|
|
| | | Utilities--0.1% | | | | |
| 200,000 | 3 | Consolidated Water Co.
| | | 3,688,000 | |
| 10,000 | | Electricity Generating PLC
| | | 18,140 | |
| 1,480,000 | 1 | National Thermal Power Corp. Ltd.
|
|
| 3,195,119
|
|
| | | TOTAL
|
|
| 6,901,259
|
|
| | | TOTAL COMMON STOCKS (IDENTIFIED COST $5,191,375,905)
|
|
| 7,125,124,689
|
|
Shares or
Units Held
|
|
|
|
| Value
|
|
| | | PREFERRED STOCKS--1.0% | | | | |
| | | Financials--0.1% | | | | |
| 297,600 | | Merrill Lynch & Co., Inc., Conv. Pfd., Series JNC
|
| $
| 11,348,976
|
|
| | | Healthcare--0.5% | | | | |
| 686,009 | 1,4,5 | Acadia Pharmaceuticals, Inc., Conv. Pfd.
| | | 7,203,094 | |
| 1,694,915 | 4,5 | Ardais Corp., Conv. Pfd.
| | | 16,949 | |
| 790,960 | 4,5 | Ardais Corp., Conv. Pfd., Series C
| | | 7,909 | |
| 3,985 | 4,5 | CompBenefits Corp., Pfd.
| | | 2,105,742 | |
| 4,761,904 | 4,5 | Converge Medical, Inc., Pfd., Series C
| | | 0 | |
| 446,816 | 4,5 | Cortek, Inc., Conv. Pfd., Series D2
| | | 178,726 | |
| 1,515,152 | 4,5 | Cortex, Inc., Pfd., Series D
| | | 606,061 | |
| 126,065 | 4,5 | Dexcom, Inc., Pfd.
| | | 1,476,095 | |
| 1,041,666 | 4,5 | Dexcom, Inc., Pfd., Series B
| | | 13,552,075 | |
| 217,391 | 4,5 | Dexcom, Inc., Pfd., Series C
| | | 2,828,257 | |
| 645,161 | 4,5 | Dia Dexus, Pfd., Series C
| | | 0 | |
| 70,838 | 4,5 | Migenix, Inc., Conv. Pfd.
| | | 18,233 | |
| 70,838 | 1 | Migenix, Inc., Conv. Pfd.
| | | 22,791 | |
| 1,058,043 | 4,5 | Sanarus Medical, Inc., Pfd., Series A
| | | 1,150,093 | |
| 1,448,436 | 4,5 | Sanarus Medical, Inc., Pfd., Series B
| | | 1,733,778 | |
| 4,456,271 | 4,5 | Sanarus Medical, Inc., Pfd., Series C
| | | 3,030,264 | |
| 3,555,987 | | Sanarus Medical, Inc., Pfd., Series D
|
|
| 2,837,678
|
|
| | | TOTAL
|
|
| 36,767,745
|
|
| | | Information Technology--0.1% | | | | |
| 20,000 | 3 | Marchex, Inc., Conv. Pfd.
| | | 3,700,000 | |
| 679,348 | 4,5 | Multiplex, Inc., Pfd., Series C
| | | 108,696 | |
| 2,000,000 | 4,5 | Ryan Hankin Kent, Inc., Pfd., Series B
| | | 0 | |
| 1,333,334 | 4,5 | Sensable Technologies, Inc., Pfd., Series B
| | | 0 | |
| 443,979 | 4,5 | Sensable Technologies, Inc., Pfd., Series C
|
|
| 0
|
|
| | | TOTAL
|
|
| 3,808,696
|
|
Shares,
Units Held
or Principal
Amount
|
|
|
|
| Value
|
|
| | | PREFERRED STOCKS--continued | | | | |
| | | Telecommunication Services--0.3% | | | | |
| 500,000 | | Crown Castle International Corp., Conv. Pfd., $3.13, Annual Dividend
|
| $
| 25,912,500
|
|
| | | TOTAL PREFERRED STOCKS (IDENTIFIED COST $84,896,469)
|
|
| 77,837,917
|
|
| | | CORPORATE BONDS--0.7% | | | | |
| | | Consumer Discretionary--0.2% | | | | |
| $ | 16,500,000 | 4,5 | Citadel Broadcasting Corp., Conv. Bond, 1.875%, 2/15/2011
|
|
| 12,930,555
|
|
| | | Consumer Staples--0.0% | | | | |
| 3,500,000 | | B&G Foods Holdings Corp., Sr. Note, 8.00%, 10/1/2011
|
|
| 3,548,125
|
|
| | | Healthcare--0.0% | | | | |
| 1 | | Ardais Corp., Conv. Bond, 8.00%, 12/31/2005
|
|
| 21,712
|
|
| | | Industrials--0.0% | | | | |
| 1,000,000 | | Roper Industries, Inc., Conv. Bond, 1.4813%, 1/15/2034
|
|
| 534,340
|
|
| | | Information Technology--0.4% | | | | |
| 25,000,000 | 4,5 | BearingPoint, Inc., Conv. Bond, 5.00%, 4/15/2025
|
|
| 32,337,750
|
|
| | | Telecommunication Services--0.0% | | | | |
| 2,000,000 | | American Tower Systems Corp., Sr. Note, 7.125%, 10/15/2012
|
|
| 2,080,000
|
|
| | | Utilities--0.1% | | | | |
| 5,000,000 | 3 | Calpine Corp., Sr. Note, 10.50%, 5/15/2006
|
|
| 4,325,000
|
|
| | | TOTAL CORPORATE BONDS (IDENTIFIED COST $52,827,997)
|
|
| 55,777,482
|
|
| | | CORPORATE NOTES--0.0% | | | | |
| | | Healthcare--0.0% | | | | |
| 1 | 4,5 | Ardais Corp., Conv. Bond, 12/31/2005 (IDENTIFIED COST $434,259)
|
|
| 21,712
|
|
| | | PURCHASED PUT OPTIONS--0.0% | | | | |
| 26,000,000 | | Bank of New York EURO PUT/USD CALL, Expiration Date, 1/11/2006
| | | 143,910 | |
| 27,000,000 | | Bank of New York CHF PUT/USD CALL, Expiration Date, 1/13/2006
| | | 151,200 | |
| 5,000,000 | | State Street Bank & Trust Co, N.A. CHF PUT/USD CALL, Expiration Date, 1/13/2006
|
|
| 35,800
|
|
| | | TOTAL PURCHASED PUT OPTIONS (IDENTIFIED COST $411,740)
|
|
| 330,910
|
|
Principal
Amount
or Shares
|
|
|
|
| Value
|
|
| | | REPURCHASE AGREEMENTS--7.2% | | | | |
| $ | 70,380,000 | | Interest in $3,500,000,000 joint repurchase agreement 4.04%, dated 10/31/2005 under which Bank of America N.A. will repurchase a U.S. Government Agency security with a maturity of 7/1/2035 for $3,500,392,778 on 11/1/2005. The market value of the underlying security at the end of the period was $3,570,000,001
| | $ | 70,380,000 | |
| 500,000,000 | | Interest in $1,500,000,000 joint repurchase agreement 4.04%, dated 10/31/2005 under which Barclays Capital Inc. will repurchase U.S. Government Agency securities with various maturities to 9/29/2025 for $1,500,168,333 on 11/1/2005. The market value of the underlying securities at the end of the period was $1,530,172,587
|
|
| 500,000,000
|
|
| | | TOTAL REPURCHASE AGREEMENTS (AT AMORTIZED COST)
|
|
| 570,380,000
|
|
| | | MUTUAL FUND--5.3% | | | | |
| 417,080,237 | 2 | Prime Value Obligations Fund, IS Shares (at net asset value) (held as collateral for securities lending)
|
|
| 417,080,237
|
|
| | | TOTAL INVESTMENTS--105.0%
(IDENTIFIED COST $6,317,406,607)6
|
|
| 8,246,552,947
|
|
| | | OTHER ASSETS AND LIABILITIES - NET--(5.0)%
|
|
| (397,057,885
| )
|
| | | TOTAL NET ASSETS--100%
|
| $
| 7,849,495,062
|
|
1 Non-income producing security.
2 Affiliated company. At October 31, 2005, these securities amounted to $2,055,572,334 which represents 26.3% of total net assets.
3 All or a portion of these securities are temporarily on loan to unaffiliated broker/dealers.
4 Denotes a restricted security, including securities purchased under Rule 144A of the Securities Act of 1933. These securities, unless registered under the Act or exempted from registration, may only be sold to qualified institutional investors. At October 31, 2005, these securities amounted to $217,891,913 which represents 2.8% of total net assets.
5 Denotes a restricted security, including securities purchased under Rule 144A that have been deemed liquid by criteria approved by the Fund's Board of Trustees. At October 31, 2005, these securities amounted to $217,891,913 which represents 2.8% of total net assets.
6 The cost of investments for federal tax purposes amounts to $6,328,948,566.
Note: The categories of investments are shown as a percentage of total net assets at October 31, 2005.
The following acronyms are used throughout this portfolio:
| ADR | - --American Depositary Receipt |
| CHF | - --Swiss Franc |
| EURO | - --Euro Dollar |
| GDR | - --Global Depository Receipt |
| USD | - --United States Dollar |
See Notes which are an integral part of the Financial Statements
Statement of Assets and Liabilities
October 31, 2005
Assets:
| | | | | | | |
Total investments in securities, at value including $2,055,572,334 of investments in affiliated issuers and $409,187,838 of securities loaned (identified cost $6,317,406,607)
| | | | | $ | 8,246,552,947 | |
Cash
| | | | | | 4,312,335 | |
Cash denominated in foreign currencies (identified cost $4,167,851)
| | | | | | 4,169,679 | |
Income receivable
| | | | | | 613,284 | |
Receivable for investments sold
| | | | | | 133,882,747 | |
Receivable for shares sold
|
|
|
|
|
| 10,886,238
|
|
TOTAL ASSETS
|
|
|
|
|
| 8,400,417,230
|
|
Liabilities:
| | | | | | | |
Payable for investments purchased
| | $ | 114,819,755 | | | | |
Payable for shares redeemed
| | | 11,972,074 | | | | |
Payable for collateral due to broker
| | | 417,080,237 | | | | |
Option written, at value (premium received $411,740)
| | | 406,750 | | | | |
Payable for distribution services fee (Note 5)
| | | 1,978,331 | | | | |
Payable to shareholder services fee (Note 5)
| | | 1,600,016 | | | | |
Accrued expenses
|
|
| 3,065,005
|
|
|
|
|
TOTAL LIABILITIES
|
|
|
|
|
| 550,922,168
|
|
Net assets for 1,431,421,120 shares outstanding
|
|
|
|
|
| $7,849,495,062
|
|
Net Assets Consist of:
| | | | | | | |
Paid-in capital
| | | | | | $5,491,956,510 | |
Net unrealized appreciation of investments, options and translation of assets and liabilities in foreign currency
| | | | | | 1,929,145,885 | |
Accumulated net realized gain on investments, options and foreign currency transactions
| | | | | | 446,434,079 | |
Accumulated net investment income (loss)
|
|
|
|
|
| (18,041,412
| )
|
TOTAL NET ASSETS
|
|
|
|
| $
| 7,849,495,062
|
|
Statement of Assets and Liabilities-continued
Net Asset Value, Offering Price and Redemption Proceeds Per Share
| | | | | | | |
Class A Shares:
| | | | | | | |
Net asset value per share ($2,166,467,619 ÷ 392,948,729 share outstanding), no par value, unlimited shares authorized
|
|
|
|
|
| $5.51
|
|
Offering price per share (100/94.50 of $5.51) 1
|
|
|
|
|
| $5.83
|
|
Redemption proceeds per share
|
|
|
|
|
| $5.51
|
|
Class B Shares:
| | | | | | | |
Net asset value per share ($1,102,132,555 ÷ 204,764,141 shares outstanding), no par value, unlimited shares authorized
|
|
|
|
|
| $5.38
|
|
Offering price per share
|
|
|
|
|
| $5.38
|
|
Redemption proceeds per share (94.50/100 of $5.38) 1
|
|
|
|
|
| $5.08
|
|
Class C Shares:
| | | | | | | |
Net asset value per share ($724,467,612 ÷ 134,572,208 shares outstanding), no par value, unlimited shares authorized
|
|
|
|
|
| $5.38
|
|
Offering price per share (100/99.00 of $5.38) 1
|
|
|
|
|
| $5.43
|
|
Redemption proceeds per share (99/100 of $5.38) 1
|
|
|
|
|
| $5.33
|
|
Class K Shares:
| | | | | | | |
Net asset value per share ($3,856,427,276 ÷ 699,136,042 shares outstanding), no par value, unlimited shares authorized
|
|
|
|
|
| $5.52
|
|
Offering price per share
|
|
|
|
|
| $5.52
|
|
Redemption proceeds per share (99.80/100 of $5.52) 1
|
|
|
|
|
| $5.51
|
|
1 See "What Do Shares Cost?" in the Prospectus.
See Notes which are an integral part of the Financial Statements
Statement of Operations
Year Ended October 31, 2005
Investment Income:
| | | | | | | | | | | | |
Dividends (including $2,303,050 received from affiliated issuers (Note 5) and net of foreign taxes withheld of $1,533,465)
| | | | | | | | | | $ | 49,269,773 | |
Interest (including income on securities loaned of $2,322,164)
|
|
|
|
|
|
|
|
|
|
| 21,512,124
|
|
TOTAL INCOME
|
|
|
|
|
|
|
|
|
|
| 70,781,897
|
|
Expenses:
| | | | | | | | | | | | |
Investment adviser fee (Note 5)
| | | | | | $ | 107,666,544 | | | | | |
Administrative personnel and services fee (Note 5)
| | | | | | | 6,052,999 | | | | | |
Custodian fees
| | | | | | | 811,460 | | | | | |
Transfer and dividend disbursing agent fees and expenses--Class A
| | | | | | | 2,412,340 | | | | | |
Transfer and dividend disbursing agent fees and expenses--Class B
| | | | | | | 1,294,745 | | | | | |
Transfer and dividend disbursing agent fees and expenses--Class C
| | | | | | | 790,584 | | | | | |
Transfer and dividend disbursing agent fees and expenses--Class K
| | | | | | | 5,215,257 | | | | | |
Directors'/Trustees' fees
| | | | | | | 61,175 | | | | | |
Auditing fees
| | | | | | | 37,916 | | | | | |
Legal fees
| | | | | | | 12,686 | | | | | |
Portfolio accounting fees
| | | | | | | 224,929 | | | | | |
Distribution services fee--Class A Shares (Note 5)
| | | | | | | 5,038,605 | | | | | |
Distribution services fee--Class B Shares (Note 5)
| | | | | | | 8,138,814 | | | | | |
Distribution services fee--Class C Shares (Note 5)
| | | | | | | 4,951,431 | | | | | |
Distribution services fee--Class K Shares (Note 5)
| | | | | | | 18,973,695 | | | | | |
Shareholder services fee--Class A Shares (Note 5)
| | | | | | | 4,951,345 | | | | | |
Shareholder services fee--Class B Shares (Note 5)
| | | | | | | 2,712,938 | | | | | |
Shareholder services fee--Class C Shares (Note 5)
| | | | | | | 1,649,028 | | | | | |
Shareholder services fee--Class K Shares (Note 5)
| | | | | | | 8,831,008 | | | | | |
Share registration costs
| | | | | | | 174,705 | | | | | |
Printing and postage
| | | | | | | 507,990 | | | | | |
Insurance premiums
| | | | | | | 68,279 | | | | | |
Miscellaneous
|
|
|
|
|
|
| 8,674
|
|
|
|
|
|
TOTAL EXPENSES
|
|
|
|
|
|
| 180,587,147
|
|
|
|
|
|
Statement of Operations-continued
Waivers and Reimbursements (Note 5):
| | | | | | | | | | | | |
Waiver/reimbursement of investment adviser fee
| | $ | (11,321,667 | ) | | | | | | | | |
Waiver of administrative personnel and services fee
| | | (295,672 | ) | | | | | | | | |
Waiver of distribution services fee--Class A Shares
| | | (720,630 | ) | | | | | | | | |
Waiver of distribution services fee--Class C Shares
| | | (22,954 | ) | | | | | | | | |
Waiver of distribution services fee--Class K Shares
| | | (11,270,149 | ) | | | | | | | | |
Waiver of shareholder services fee--Class A Shares
| | | (38,505) | | | | | | | | | |
Reimbursement of shareholder services fee--Class A Shares
| | | (410,872 | ) | | | | | | | | |
Reimbursement of shareholder services fee--Class B Shares
|
|
| (35,298
| )
|
|
|
|
|
|
|
|
|
TOTAL WAIVERS AND REIMBURSEMENTS
|
|
|
|
|
| $
| (24,115,747
| )
|
|
|
|
|
Net expenses
|
|
|
|
|
|
|
|
|
| $
| 156,471,400
|
|
Net investment income (loss)
|
|
|
|
|
|
|
|
|
|
| (85,689,503
| )
|
Realized and Unrealized Gain on Investments, Options and Foreign Currency Transactions:
| | | | | | | | | | | | |
Net realized gain on investments, options and foreign currency transactions (including realized gain of $103,252,145 on sale of investments in affiliated issuers (Note 5) and foreign taxes withheld of $2,651,906)
| | | | | | | | | | | 546,532,246 | |
Net change in unrealized appreciation of investments, options and translation of assets and liabilities in foreign currency
|
|
|
|
|
|
|
|
|
|
| 506,520,030
|
|
Net realized and unrealized gain on investments, options, and foreign currency transactions
|
|
|
|
|
|
|
|
|
|
| 1,053,052,276
|
|
Change in net assets resulting from operations
|
|
|
|
|
|
|
|
|
| $
| 967,362,773
|
|
See Notes which are an integral part of the Financial Statements
Statement of Changes in Net Assets
Year Ended October 31
|
|
| 2005
|
|
|
| 2004
|
|
Increase (Decrease) in Net Assets
| | | | | | | | |
Operations:
| | | | | | | | |
Net investment income (loss)
| | $ | (85,689,503 | ) | | $ | (91,016,407 | ) |
Net realized gain on investments, options and foreign currency transactions
| | | 546,532,246 | | | | 496,744,523 | |
Net increase due to reimbursement from Adviser (Note 5)
| | | - -- | | | | 1,302,668 | |
Net change in unrealized appreciation/depreciation of investments, options and translation of assets and liabilities in foreign currency
|
|
| 506,520,030
|
|
|
| (105,953,336
| )
|
CHANGE IN NET ASSETS RESULTING FROM OPERATIONS
|
|
| 967,362,773
|
|
|
| 301,077,448
|
|
Distributions to Shareholders:
| | | | | | | | |
Distributions from net realized gains on investments and foreign currency transactions
| | | | | | | | |
Class A Shares
| | | (103,255,249 | ) | | | (11,551,661 | ) |
Class B Shares
| | | (58,193,906 | ) | | | (7,430,141 | ) |
Class C Shares
| | | (32,903,118 | ) | | | (3,378,416 | ) |
Class K Shares
|
|
| (202,750,926
| )
|
|
| (31,244,311
| )
|
CHANGE IN NET ASSETS RESULTING FROM DISTRIBUTIONS TO SHAREHOLDERS
|
|
| (397,103,199
| )
|
|
| (53,604,529
| )
|
Share Transactions:
| | | | | | | | |
Proceeds from sale of shares
| | | 1,433,931,546 | | | | 1,836,299,869 | |
Proceeds from shares issued in connection with the tax-free transfer of assets from BankNorth Small/Mid Cap Core Fund
| | | - -- | | | | 13,145,214 | |
Net asset value of shares issued to shareholders in payment of distributions declared
| | | 363,051,287 | | | | 49,666,110 | |
Cost of shares redeemed
|
|
| (1,373,123,729
| )
|
|
| (1,097,024,967
| )
|
CHANGE IN NET ASSETS RESULTING FROM SHARE TRANSACTIONS
|
|
| 423,859,104
|
|
|
| 802,086,226
|
|
Change in net assets
|
|
| 994,118,678
|
|
|
| 1,049,559,145
|
|
Net Assets:
| | | | | | | | |
Beginning of period
|
|
| 6,855,376,384
|
|
|
| 5,805,817,239
|
|
End of period (including accumulated net investment income (loss) of $(18,041,412) and $0, respectively)
|
| $
| 7,849,495,062
|
|
| $
| 6,855,376,384
|
|
See Notes which are an integral part of the Financial Statements
Notes to Financial Statements
October 31, 2005
1. ORGANIZATION
Federated Equity Funds (the "Trust") is registered under the Investment Company Act of 1940, as amended (the "Act"), as an open-end management investment company. The Trust consists of eight portfolios. The financial statements included herein are only those of Federated Kaufmann Fund (the "Fund"), a diversified portfolio. The financial statements of the other portfolios are presented separately. The assets of each portfolio are segregated and a shareholder's interest is limited to the portfolio in which shares are held. The Fund offers four classes of shares: Class A Shares, Class B Shares, Class C Shares and Class K Shares. All shares of the Fund have equal rights with respect to voting, except on class-specific matters. The financial highlights of the Class K Shares are presented separately. The investment objective of the Fund is to provide capital appreciation.
On August 30, 2004, the Fund received a tax-free transfer of assets from the BankNorth Small/Mid Cap Core Fund, as follows:
Class A
Shares of
the Fund
Issued
|
| BankNorth
Small/Mid Cap
Core Fund
Net Assets
Received
|
| Unrealized
Appreciation1
|
| Net Assets
of Fund
Prior to
Combination
|
| Net Assets
of BankNorth
Small/Mid Cap
Core Fund
Immediately
Prior to
Combination
|
| Net Assets
of the Fund
Immediately
After
Combination
|
2,715,953
|
| $13,145,214
|
| $3,413,749
|
| $6,435,704,175
|
| $13,145,214
|
| $6,448,849,389
|
1 Unrealized Appreciation is included in the BankNorth Small/Mid Cap Core Fund Net Assets Received amount shown above.
2. SIGNIFICANT ACCOUNTING POLICIES
The following is a summary of significant accounting policies consistently followed by the Fund in the preparation of its financial statements. These policies are in conformity with generally accepted accounting principles (GAAP) in the United States of America.
Investment Valuation
Domestic and foreign equity securities are valued at the last sale price or official closing price reported in the market in which they are primarily traded (either a national securities exchange or the over-the-counter market), if available. If unavailable, the security is generally valued at the mean between the last closing bid and asked prices. With respect to valuation of foreign securities, trading in foreign cities may be completed at times which vary from the closing of the New York Stock Exchange (NYSE). Therefore, foreign securities are valued at the latest closing price on the exchange on which they are traded immediately prior to the closing of the NYSE. Foreign securities quoted in foreign currencies are translated in U.S. dollars at the foreign exchange rate in effect at 4:00 p.m., Eastern Time, on the day the value of the foreign security is determined. The Fund generally values fixed income and short-term securities according to prices furnished by an independent pricing service, except that securities with remaining maturities of less than 60 days at the time of purchase may be valued at amortized cost. For other fixed income securities, prices furnished by an independent pricing service are intended to be indicative of the mean between the bid and asked prices currently offered to institutional investors for the securities. Investments in other open-end regulated investment companies are valued at net asset value. Securities for which no quotations are readily available or whose values have been affected by a significant event occurring between the close of their primary markets and the closing of the NYSE are valued at fair value as determined in accordance with procedures established by and under general supervision of the Board of Trustees (the "Trustees").
Repurchase Agreements
It is the policy of the Fund to require the custodian bank to take possession, to have legally segregated in the Federal Reserve Book Entry System, or to have segregated within the custodian bank's vault, all securities held as collateral under repurchase agreement transactions. Additionally, procedures have been established by the Fund to monitor, on a daily basis, the market value of each repurchase agreement's collateral to ensure that the value of the collateral at least equals the repurchase price to be paid under the repurchase agreement.
The Fund will only enter into repurchase agreements with banks and other recognized financial institutions, such as broker/dealers, which are deemed by the Fund's adviser to be creditworthy pursuant to the guidelines and/or standards reviewed or established by the Trustees. Risks may arise from the potential inability of counterparties to honor the terms of the repurchase agreement. The Fund, along with other affiliated investment companies, may utilize a joint trading account for the purpose of entering into one or more repurchase agreements.
Investment Income, Gains and Losses, Expenses and Distributions
Interest income and expenses are accrued daily. Dividend income and distributions to shareholders are recorded on the ex-dividend date. Distributions of net investment income are declared and paid annually. Non-cash dividends included in dividend income, if any, are recorded at fair value. Investment income, realized and unrealized gains and losses, and certain fund-level expenses are allocated to each class based on relative average daily net assets, except that each class bears certain expenses unique to that class such as transfer and dividend disbursing agent, distribution and shareholder services fees. Dividends are declared separately for each class. No class has preferential dividend rights; differences in per share dividend rates are generally due to differences in separate class expenses.
Premium and Discount Amortization
All premiums and discounts on fixed-income securities are amortized/accreted for financial statement purposes.
Federal Taxes
It is the Fund's policy to comply with the Subchapter M provision of the Internal Revenue Code (the "Code") and to distribute to shareholders each year substantially all of its income. Accordingly, no provision for federal income tax is necessary.
Withholding taxes, and where appropriate, deferred withholding taxes, on foreign interest, dividends and capital gains have been provided for in accordance with the applicable country's tax rules and rates.
When-Issued and Delayed Delivery Transactions
The Fund may engage in when-issued or delayed delivery transactions. The Fund records when-issued securities on the trade date and maintains security positions such that sufficient liquid assets will be available to make payment for the securities purchased. Securities purchased on a when-issued or delayed delivery basis are marked to market daily and begin earning interest on the settlement date. Losses may occur on these transactions due to changes in market conditions or the failure of counterparties to perform under the contract.
Foreign Exchange Contracts
The Fund may enter into foreign currency commitments for the delayed delivery of securities or foreign currency exchange transactions. The Fund may enter into foreign currency contract transactions to protect assets against adverse changes in foreign currency exchange rates or exchange control regulations. Purchased contracts are used to acquire exposure to foreign currencies; whereas, contracts to sell are used to hedge the Fund's securities against currency fluctuations. Risks may arise upon entering these transactions from the potential inability of counterparties to meet the terms of their commitments and from unanticipated movements in security prices or foreign exchange rates. The foreign currency transactions are adjusted by the daily exchange rate of the underlying currency and any gains or losses are recorded for financial statement purposes as unrealized until the settlement date.
At October 31, 2005, the Fund had no outstanding foreign currency commitments.
Written Options Contracts
The Fund may write option contracts. The writer of the option receives a payment, or premium, from the buyer, which the writer keeps regardless of whether the buyer uses (or exercises) the option. A call option gives the holder (buyer) the right to buy the underlying asset from the seller (writer) of the option. A put option gives the holder the right to sell the underlying asset to the writer of the option. The value of the option contract is recorded as a liability and unrealized gain or loss is measured by the difference between the current value and the premium received. For the year ended October 31, 2005, the Fund had a realized gain of $3,829,005 on written options.
The following is a summary of the Fund's written option activity:
Contracts
|
| Number of
Contracts
|
|
| Premium
|
|
Outstanding at 10/31/2004
|
| - --
|
|
| $ --
|
|
Options written
|
| 433,000,000
|
|
| 3,081,510
|
|
Options expired
|
| (81,000,000
| )
|
| (641,370
| )
|
Options bought to close
|
| (258,000,000
| )
|
| (1,796,200
| )
|
Options assigned
|
| (36,000,000
| )
|
| (232,200
| )
|
Outstanding at 10/31/2005
|
| 58,000,000
|
|
| 411,740
|
|
Foreign Currency Translation
The accounting records of the Fund are maintained in U.S. dollars. All assets and liabilities denominated in foreign currencies (FCs) are translated into U.S. dollars based on the rates of exchange of such currencies against U.S. dollars on the date of valuation. Purchases and sales of securities, income and expenses are translated at the rate of exchange quoted on the respective date that such transactions are recorded. The Fund does not isolate that portion of the results of operations resulting from changes in foreign exchange rates on investments from the fluctuations arising from changes in market prices of securities held. Such fluctuations are included with the net realized and unrealized gain or loss from investments.
Reported net realized foreign exchange gains or losses arise from sales of portfolio securities, sales and maturities of short-term securities, sales of FCs, currency gains or losses realized between the trade and settlement dates on securities transactions, the difference between the amounts of dividends, interest and foreign withholding taxes recorded on the Fund's books, and the U.S. dollar equivalent of the amounts actually received or paid. Net unrealized foreign exchange gains and losses arise from changes in the value of assets and liabilities other than investments in securities at fiscal year end, resulting from changes in the exchange rate.
Securities Lending
The Fund participates in a securities lending program providing for the lending of corporate bonds, equity and government securities to qualified brokers. The Fund normally receives cash collateral for securities loaned that is invested in an affiliated money market fund. Collateral is maintained at a minimum level of 102% of the market value of investments loaned, plus interest, if applicable. Earnings on collateral are allocated between the securities lending agent, as a fee for its services under the program, and the Fund, according to agreed-upon rates.
As of October 31, 2005, securities subject to this type of arrangement and related collateral were as follows:
Market Value of
Securities Loaned
|
| Market Value
of Collateral1
|
$409,187,838
|
| $417,080,237
|
1 Does not include mark to market proceeds held as cash of $4,998,950.
Short Sales
The Fund may sell a security it does not own in anticipation of a decline in the fair value of the security. When the Fund sells a security short, it must borrow the security sold short and deliver it to the broker-dealer through which it made the short sale. A gain, limited to the price at which the Fund sold the security short, or a loss, unlimited in size, will be recognized upon the termination of a short sale.
Restricted Securities
Restricted securities are securities that may only be resold upon registration under federal securities laws or in transactions exempt from such registration. In some cases, the issuer of restricted securities has agreed to register such securities for resale, at the issuer's expense either upon demand by the Fund or in connection with another registered offering of the securities. Many restricted securities may be resold in the secondary market in transactions exempt from registration. Such restricted securities may be determined to be liquid under criteria established by the Trustees. The Fund will not incur any registration costs upon such resales. The Fund's restricted securities are valued at the price provided by dealers in the secondary market or, if no market prices are available, at the fair value as determined in accordance with procedures established by and under general supervision of the Trustees.
Additional information on restricted securities, excluding securities purchased under Rule 144A that have been deemed liquid by the Trustees held at October 31, 2005, is as follows:
Security
|
| Acquisition Date
|
| Acquisition Cost
|
Apollo Investment Fund V
|
| 5/18/2001
|
| $ 843,199
|
Aradigm Corp., Warrants 12/17/2006
|
| 12/17/2001
|
| - --
|
Ardais Corp., Conv. Bond, 8.00%, 12/31/2005
|
| 4/14/2004
|
| 434,259
|
Ardais Corp., Conv. Pfd.
|
| 3/2/2001-3/8/2001
|
| 9,999,999
|
Ardais Corp., Conv. Pfd., Series C
|
| 12/18/2002
|
| 4,666,664
|
Ardais Corp. Warrants 4/14/2009
|
| 4/15/2004
|
| - --
|
BearingPoint, Inc., Conv. Sub. Deb., 5.00%, 4/15/2025
|
| 4/21/2005
|
| 25,000,000
|
CompBenefits, Corp.
|
| 4/21/1997-7/12/2000
|
| 140,678
|
CompBenefits, Corp., Pfd.
|
| 4/21/1997-7/12/2000
|
| 3,256,223
|
Conceptus, Inc.
|
| 8/11/2005
|
| 4,500,000
|
Conceptus, Inc.
|
| 4/10/2001
|
| 5,000,000
|
Converge Medical, Inc., Pfd. Series C
|
| 10/25/2001
|
| 3,000,000
|
Cortek, Inc.
|
| 2/29/2000
|
| 1,000,000
|
Cortek, Inc., Conv. Pfd., Series D2
|
| 3/31/2003
|
| 589,797
|
Cortex, Inc., Pfd., Series D
|
| 6/18/2001
|
| 2,000,000
|
Decision Management International, Inc.
|
| 7/11/2005
|
| - --
|
Denovo Ventures I LP
|
| 3/9/2000
|
| 4,704,785
|
DexCom, Inc., Pfd.
|
| 12/30/2004
|
| 678,910
|
DexCom, Inc., Pfd., Series B
|
| 12/01/2000
|
| 3,000,000
|
DexCom, Inc., Pfd., Series C
|
| 5/17/2002
|
| 1,000,000
|
Dia Dexus, Pfd., Series C
|
| 4/4/2000
|
| 4,999,998
|
Endologix, Inc.
|
| 7/7/2005
|
| 5,000,000
|
Endologix, Inc.
|
| 12/8/2003-3/23/2005
|
| 12,248,120
|
Expand Networks Ltd.
|
| 9/22/2000
|
| 2,500,000
|
FA Private Equity Fund IV LP
|
| 3/4/2002
|
| 421,984
|
Greenfield Technology Venture Fund
|
| 6/15/1998
|
| 88,344
|
Security
|
| Acquisition Date
|
| Acquisition Cost
|
Incuvest LLC, Pfd.
|
| 1/6/2000
|
| $ 5,000,000
|
Infrastructure Fund
|
| 8/11/2000
|
| 484,175
|
Internet.com Venture Fund III
|
| 5/17/2000-7/28/2000
|
| 557,793
|
Isis Pharmaceuticals, Inc
|
| 8/23/2005
|
| 19,882,351
|
Latin Healthcare Fund
|
| 11/28/2000
|
| 8,573,040
|
Metabasis Therapeutics, Inc., Warrants 9/30/2010
|
| 10/3/2005
|
| 111,956
|
Migenix, Inc., Conv. Pfd.
|
| 10/27/2004
|
| 1,200,006
|
Multiplex, Inc., Pfd., Series C
|
| 2/22/2001
|
| 5,000,001
|
Peachtree Leadscope LLC
|
| 4/30/2002
|
| 3,000,000
|
Peachtree Leadscope LLC
|
| 6/30/2000
|
| 712,054
|
Peachtree Open Networks
|
| 10/5/2000
|
| 990,753
|
Peachtree Velquest
|
| 9/14/2000
|
| 494,382
|
Peachtree/CB Partners
|
| 3/8/2000
|
| 3,503,863
|
Rocket Ventures II
|
| 7/20/1999
|
| 7,515,342
|
Ryan Hankin Kent, Inc., Pfd., Series B
|
| 6/5/2000
|
| 2,000,000
|
Sanarus Medical, Inc., Pfd., Series A
|
| 11/16/1999-11/12/2004
|
| 1,561,804
|
Sanarus Medical, Inc., Pfd., Series B
|
| 7/16/2001
|
| 2,495,648
|
Sanarus Medical, Inc., Pfd., Series C
|
| 10/23/2003
|
| 3,004,288
|
Sensable Technologies, Inc.
|
| 10/15/2004
|
| 0
|
Sensable Technologies, Inc.
|
| 12/16/2003
|
| 401,118
|
Sensable Technologies, Inc., Pfd., Series B
|
| 12/23/1997
|
| 2,064,237
|
Sensable Technologies, Inc., Pfd., Series C
|
| 4/5/2000
|
| 1,474,010
|
Use of Estimates
The preparation of financial statements in conformity with GAAP requires management to make estimates and assumptions that affect the amounts of assets, liabilities, expenses and revenues reported in the financial statements. Actual results could differ from those estimated.
Other
Investment transactions are accounted for on a trade date basis. Realized gains and losses from investment transactions are recorded on an identified cost basis.
3. SHARES OF BENEFICIAL INTEREST
The following tables summarize share activity:
Year Ended October 31
|
| 2005
|
| 2004
|
Class A Shares:
|
| Shares
|
|
|
| Amount
|
|
| Shares
|
|
|
| Amount
|
|
Shares sold
| | 150,599,079 | | | $ | 797,198,894 | | | 199,104,620 | | | $ | 998,975,256 | |
Shares issued in connection with tax-free transfer of assets from BankNorth Small/Mid Cap Core Fund
| | - -- | | | | - -- | | | 2,715,953 | | | | 13,145,214 | |
Shares issued to shareholders in payment of distributions declared
|
| 17,504,760 | | | | 89,099,685 |
|
|
2,070,151 |
|
| |
9,957,448 |
|
Shares redeemed
|
| (122,304,301
| )
|
|
| (647,088,392
| )
|
| (99,878,026
| )
|
|
| (496,795,631
| )
|
NET CHANGE RESULTING FROM CLASS A SHARE TRANSACTIONS
|
| 45,799,538
|
|
| $
| 239,210,187
|
|
|
104,012,698
|
|
|
$
|
525,282,287
|
|
| | | | | | | | | | | | | | |
Year Ended October 31
|
| 2005
|
| 2004
|
Class B Shares:
|
| Shares
|
|
|
| Amount
|
|
| Shares
|
|
|
| Amount
|
|
Shares sold
| | 33,657,206 | | | $ | 174,081,420 | | | 62,567,155 | | | $ | 309,410,152 | |
Shares issued to shareholders in payment of distributions declared
|
| 10,430,358 | |
|
| 52,151,884 | |
|
1,407,063 |
|
|
|
6,683,565 |
|
Shares redeemed
|
| (37,327,135
| )
|
|
| (194,340,651
| )
|
| (27,540,244
| )
|
|
| (135,576,086
| )
|
NET CHANGE RESULTING FROM CLASS B SHARE TRANSACTIONS
|
| 6,760,429
|
|
|
$
| 31,892,653
|
|
|
36,433,974
|
|
|
$
|
180,517,631
|
|
| | | | | | | | | | | | | | |
Year Ended October 31
|
| 2005
|
| 2004
|
Class C Shares:
|
| Shares
|
|
|
| Amount
|
|
| Shares
|
|
|
| Amount
|
|
Shares sold
| | 42,578,747 | | | $ | 220,727,895 | | | 55,134,068 | | | $ | 272,597,197 | |
Shares issued to shareholders in payment of distributions declared
|
| 4,843,556 | |
|
| 24,219,297 | |
|
525,730 |
|
| |
2,502,486 |
|
Shares redeemed
|
| (23,397,117
| )
|
|
| (121,440,701
| )
|
| (14,872,665
| )
|
|
| (73,100,606
| )
|
NET CHANGE RESULTING FROM CLASS C SHARE TRANSACTIONS
|
| 24,025,186
|
|
|
$
| 123,506,491
|
|
|
40,787,133
|
|
|
$
|
201,999,077
|
|
| | | | | | | | | | | | | | |
Year Ended October 31
|
| 2005
|
| 2004
|
Class K Shares:
|
| Shares
|
|
|
| Amount
|
|
| Shares
|
|
|
| Amount
|
|
Shares sold
| | 45,765,706 | | | $ | 241,923,337 | | | 50,862,351 | | | $ | 255,317,264 | |
Shares issued to shareholders in payment of distributions declared
|
| 38,741,249 | |
|
| 197,580,421 | |
|
6,332,430 |
|
|
|
30,522,611 |
|
Shares redeemed
|
| (77,226,078
| )
|
|
| (410,253,985
| )
|
| (78,282,545
| )
|
|
| (391,552,644
| )
|
NET CHANGE RESULTING FROM CLASS K SHARE TRANSACTIONS
|
| 7,280,877
|
|
|
$
| 29,249,773
|
|
|
(21,087,764
| )
|
|
$
|
(105,712,769
| )
|
NET CHANGE RESULTING FROM SHARE TRANSACTIONS
|
| 83,866,030
|
|
|
$
| 423,859,104
|
|
|
160,146,041
|
|
|
$
|
802,086,226
|
|
4. FEDERAL TAX INFORMATION
The timing and character of income and capital gain distributions are determined in accordance with income tax regulations, which may differ from GAAP. These differences are due in part to differing treatments for foreign currency transactions, partnership adjustments, net operating loss, reclass foreign cap gains tax and discount accretion/premium amortization on debt securities.
For the year ended October 31, 2005, permanent differences identified and reclassified among the components of net assets were as follows:
Increase (Decrease)
|
Paid-In Capital
|
| Accumulated
Net Investment
Income (Loss)
|
| Accumulated
Net Realized
Gains
|
$(72,821)
|
| $67,648,091
|
| $(67,575,270)
|
Net investment income (loss), net realized gains (losses), and net assets were not affected by this reclassification.
The tax character of distributions as reported on the Statement of Changes in Net Assets for the years ended October 31, 2005, and 2004, was as follows:
|
| 2005
|
| 2004
|
Ordinary income1
|
| $ 8,730
|
| - --
|
Long-term capital gains
|
| $397,094,469
|
| $53,604,529
|
1 For tax purposes short-term capital gain distributions are considered ordinary income distributions.
As of October 31, 2005, the components of distributable earnings on a tax basis were as follows:
Undistributed ordinary income
|
| $
| 167,806
|
|
Undistributed long-term capital gain
|
| $
| 473,219,964
|
|
Net unrealized appreciation
|
| $
| 1,917,603,926
|
|
Capital loss carryforward
|
| $
| (31,114,260
| )
|
The difference between book-basis and tax-basis net unrealized appreciation/depreciation is attributable in part to differing treatments for the deferral of losses on wash sales, partnership investments, discount accretion/premium amortization on debt securities and the realization for tax purposes of unrealized gains on investments in passive foreign investment companies.
At October 31, 2005, the cost of investments for federal tax purposes excluding any unrealized appreciation resulting from changes in foreign currency exchange rates and any unrealized depreciation from written options was $6,328,948,566. The net unrealized appreciation of investments for federal tax purposes was $1,917,604,381. This consists of net unrealized appreciation from investments for those securities having an excess of value over cost of $2,181,375,724 and net unrealized depreciation from investments for those securities having an excess of cost over value of $263,771,343.
At October 31, 2005, the Fund had a capital loss carryforward of $(31,114,260) which will reduce the Fund's taxable income arising from future net realized gains on investments, if any, to the extent permitted by the Code and thus will reduce the amount of distributions to shareholders which would otherwise be necessary to relieve the Fund of any liability for federal tax. Pursuant to the Code, such capital loss carryforward will expire in 2009.
The Fund used capital loss carryforwards of $7,778,565 to offset taxable capital gains realized during the year ended October 31, 2005.
5. INVESTMENT ADVISER FEE AND OTHER TRANSACTIONS WITH AFFILIATES
Investment Adviser Fee
Federated Equity Management Company of Pennsylvania, the Fund's investment adviser (the "Adviser"), receives for its services an annual investment adviser fee equal to 1.425% of the Fund's average daily net assets. The Adviser may voluntarily choose to waive any portion of its fee. The Adviser can modify or terminate this voluntary waiver at any time at its sole discretion. For the year ended October 31, 2005, the Adviser voluntarily waived $11,321,667 of its fee.
Pursuant to an Exemptive Order issued by the Securities and Exchange Commission, the Fund may invest in Prime Value Obligations Fund which is managed by the Adviser or an affiliate of the Adviser. The Adviser has agreed to reimburse the Fund for certain investment adviser fees as a result of these transactions. Income distributions earned from investments in this fund are recorded as income in the accompanying financial statements and totaled $405,859 for the period.
Certain of the Fund's assets are managed by Federated Global Investment Management Corp. (the "Sub-Adviser"). Under the terms of a sub-adviser agreement between the Adviser and the Sub-Adviser, the Sub-Adviser receives an allocable portion of the Fund's adviser fee. The fee is paid by the Adviser out of its resources and is not an incremental Fund expense. For the year ended October 31, 2005, the Sub-Adviser earned a sub-adviser fee of $88,777,677.
Administrative Fee
Federated Administrative Services (FAS), under the Administrative Services Agreement, provides the Fund with administrative personnel and services. The fee paid to FAS is based on the average aggregate daily net assets of all Federated funds as specified below:
Maximum
Administrative Fee
|
| Average Aggregate Daily Net Assets
of the Federated Funds
|
0.150%
|
| on the first $5 billion
|
0.125%
|
| on the next $5 billion
|
0.100%
|
| on the next $10 billion
|
0.075%
|
| on assets in excess of $20 billion
|
The administrative fee received during any fiscal year shall be at least $150,000 per portfolio and $40,000 per each additional class of Shares. FAS may voluntarily choose to waive any portion of its fee. FAS can modify or terminate this voluntary waiver at any time at its sole discretion. For the year ended October 31, 2005, the net fee paid to FAS was 0.076% of average aggregate daily net assets of the Fund.
Distribution Services Fee
The Fund has adopted a Distribution Plan (the "Plan") pursuant to Rule 12b-1 under the Act. Under the terms of the Plan, the Fund will compensate Federated Securities Corp. (FSC), the principal distributor, from the daily net assets of the Fund's Class A Shares, Class B Shares, Class C Shares and Class K Shares to finance activities intended to result in the sale of these shares. The Plan provides that the Fund may incur distribution expenses according to the following schedule annually, to compensate FSC:
Share Class Name
|
| Percentage of Average Daily
Net Assets of Class
|
Class A Shares
|
| 0.25%
|
Class B Shares
|
| 0.75%
|
Class C Shares
|
| 0.75%
|
Class K Shares
|
| 0.50%
|
FSC may voluntarily choose to waive any portion of its fee. FSC can modify or terminate this voluntary waiver at any time at its sole discretion. For the year ended October 31, 2005, FSC voluntarily waived 12,013,733 of its fee. Rather than paying financial intermediaries directly, the Fund may pay fees to FSC and FSC will use the fees to compensate financial intermediaries. For the year ended October 31, 2005, FSC retained $10,947,274 of fees paid by the Fund.
Sales Charges
For the year ended October 31, 2005, FSC retained $988,861 in sales charges from the sale of Class A Shares. FSC also retained $1,680 of contingent deferred sales charges relating to redemptions of Class A Shares and $38,640 relating to redemptions of Class C Shares. See "What Do Shares Cost?" in the Prospectus.
Redemption Fees
The Fund's Class K Shares imposes a redemption fee of 0.20% on the redemption price of the Fund's Class K Shares capital stock shares redeemed, if such shares were purchased after February 1, 1985. The redemption fee is applied to the Fund's Class K Shares expenses for providing redemption services, including, but not limited to: transfer agent fees; postage; printing; telephone and related employment costs. Any excess fee proceeds are added to the Fund's assets. Shares acquired through employer-sponsored retirement plans will not be subject to the redemption fee. However, if shares are purchased for a retirement plan account through a broker, financial institution or other intermediary maintaining an omnibus account for the shares, the waiver may not apply. In addition, this waiver does not apply to individual retirement accounts, such as Traditional, Roth and SEP-IRAs. For the year ended October 31, 2005, redemption fees of $668,755 were allocated to cover the cost of redemptions.
Shareholder Services Fee
The Fund may pay fees (Services Fees) up to 0.25% of the average daily net assets of the Fund's Class A Shares, Class B Shares, Class C Shares and Class K Shares to financial intermediaries or to Federated Shareholder Services Company (FSSC), a subsidiary of Federated Investors, Inc., for providing services to shareholders and maintaining shareholder accounts. Under certain agreements, rather than paying financial intermediaries directly, the Fund may pay Service Fees to FSSC and FSSC will use the fees to compensate financial intermediaries. FSSC or these financial intermediaries may voluntarily choose to waive any portion of their fee. This voluntary waiver can be modified or terminated at any time. For the year ended October 31, 2005, FSSC voluntarily waived $38,505 of its fee. For the year ended October 31, 2005, FSSC retained $8,757,502 of fees paid by the Fund.
Commitments and Contingencies
In the course of pursuing its investment philosophy, the Fund sometimes invests in limited partnerships and limited liability companies. These entities often require the Fund to commit to a total dollar amount to be invested. The actual investments are usually made in installments over a period of time. At October 31, 2005, the Fund had total commitments to limited partnerships and limited liability companies of $46,642,200; of this amount $38,131,354 was actually invested by the Fund leaving the Fund contingently liable for additional investments of $8,510,846.
Other
Federated retained an outside law firm to perform an internal review of past mutual fund trading practices and report to a special investigative committee of Federated's Board. In conjunction with this review, the Independent Trustees of the Fund have retained a financial expert to assess the impact of these trading practices. In accordance with the findings of the financial expert, the Fund's Adviser contributed $1,302,668 to the Fund during fiscal year 2004 which relates to a contribution to Paid-in Capital for detrimental impact to the Fund from frequent trading activity and detrimental impact on those Funds that may have resulted from orders incorrectly accepted by Federated employees after the Funds' closing times.
General
Certain of the Officers and Trustees of the Fund are Officers and Directors or Trustees of the above companies.
Transactions with Affiliated Companies
An affiliated company is a company in which the Fund has ownership of at least 5% of the voting shares. Transactions with affiliated companies (excluding $417,080,237 invested in Prime Value Obligations Fund) during the year ended October 31, 2005, are as follows:
| Affiliates
|
| Purchase
Cost
|
| Sales
Proceeds
|
| Dividend
Income
|
| Value
|
1
| Advance Auto Parts, Inc.
|
| $37,364,754
|
| $109,191,899
|
| $ --
|
| $318,442,500
|
1
| Anika Therapeutics, Inc.
|
| - -
|
| 4,333,742
|
| - --
|
| 12,340,000
|
1
| Avigen, Inc.
|
| - --
|
| - --
|
| - --
|
| 8,100,000
|
1
| Brillian Corp.
|
| - --
|
| - --
|
| - --
|
| 5,147,632
|
1
| CB Richard Ellis Services
|
| 56,131,600
|
| 62,428,759
|
| - --
|
| 195,400,000
|
1
| Central European Media Enterprises Ltd., Class A
|
| 8,434,205
|
| - --
|
| - --
|
| 92,980,000
|
1
| Chindex International, Inc.
|
| - --
|
| - --
|
| - --
|
| 2,042,400
|
1
| Chindex International, Inc., Warrants 3/31/2009
|
| - --
|
| - --
|
| - --
|
| 158,401
|
1
| Conceptus, Inc.
|
| 347,614
|
| 28,439
|
| - --
|
| 37,328,369
|
2
| Conceptus, Inc.
|
| - --
|
| - --
|
| - --
|
| 7,335,717
|
1,2
| Conceptus, Inc.
|
| - --
|
| - --
|
| - --
|
| 6,162,000
|
1
| Concorde Career Colleges, Inc.
|
| - --
|
| - --
|
| - --
|
| 4,500,000
|
1
| Cubist Pharmaceuticals, Inc
|
| 12,860,524
|
| 610,933
|
| - --
|
| 60,630,000
|
1
| Dyax Corp.
|
| 7,022,446
|
| 728,273
|
| - --
|
| 19,496,025
|
1
| Dynavax Technologies Corp.
|
| 30,343,183
|
| - --
|
| - --
|
| 30,756,822
|
1
| eCollege.com
|
| 3,383,896
|
| - --
|
| - --
|
| 23,865,000
|
| Affiliates
|
| Purchase
Cost
|
| Sales
Proceeds
|
| Dividend
Income
|
| Value
|
1,2
| Endologix, Inc.
|
| $ 6,217,040
|
| $ --
|
| $ --
|
| $ 10,913,820
|
1
| GTX, Inc
|
| 15,436,200
|
| - --
|
| - --
|
| 17,415,200
|
1
| 1Illumina, Inc.
|
| - --
|
| 6,278,476
|
| - --
|
| 38,585,574
|
1
| Infocrossing, Inc.
|
| 1,370,144
|
| - --
|
| - --
|
| 7,835,249
|
1
| Infocrossing, Inc., Warrants 10/21/2008
|
| - --
|
| - --
|
| - --
|
| 560,859
|
1
| Interline Brands, Inc
|
| 33,654,219
|
| - --
|
| - --
|
| 38,962,350
|
1
| Isis Pharmaceuticals, Inc.
|
| - --
|
| - --
|
| - --
|
| 17,360,000
|
| J.D. Wetherspoon PLC
|
| - --
|
| 53,377,480
|
| 902,385
|
| 52,274,343
|
1
| Magma Design Automation
|
| 10,426,970
|
| 2,348,777
|
| - --
|
| 40,622,400
|
1
| Metabasis Therapeutics, Inc
|
| 14,995,740
|
| - --
|
| - --
|
| 12,180,840
|
1
| NIC, Inc.
|
| 342,000
|
| 943,675
|
| - --
|
| 18,603,750
|
1
| NMT Medical, Inc.
|
| - --
|
| - --
|
| - --
|
| 12,975,300
|
1
| NuCo2, Inc.
|
| 14,377,031
|
| - --
|
| - --
|
| 28,982,240
|
1
| NxStage Medical, Inc
|
| 17,353,000
|
| - --
|
| - --
|
| 19,695,655
|
1
| Online Resources Corp.
|
| 2,443,750
|
| - --
|
| - --
|
| 21,450,000
|
1,2
| Online Resources Corp.
|
| - --
|
| - --
|
| - --
|
| 6,360,000
|
| PetSmart, Inc.
|
| 23,484,556
|
| 68,977,610
|
| 994,806
|
| 212,442,350
|
1
| Pharmacyclics, Inc.
|
| - --
|
| 162,260
|
| - --
|
| 18,920,320
|
1
| PowerDsine Ltd.
|
| - --
|
| - --
|
| - --
|
| 11,367,864
|
1
| Santarus, Inc.
|
| 24,134,434
|
| - --
|
| - --
|
| 34,485,221
|
1
| Seaspan Corp.
|
| 44,704,702
|
| - --
|
| - --
|
| 40,600,392
|
1
| Time Warner Telecom, Inc.
|
| - --
|
| 2,194,830
|
| - --
|
| 33,520,000
|
1
| United Surgical Partners International, Inc.
|
| - --
|
| 21,106,548
|
| - --
|
| 107,550,000
|
1
| Vical, Inc.
|
| 2,921,280
|
| - --
|
| - --
|
| 9,497,446
|
1
| World Heart Corp., Warrants 9/22/2008
|
| - --
|
| - --
|
| - --
|
| 646,058
|
| TOTAL OF AFFILIATED TRANSACTIONS
|
| $367,749,288
|
| $332,711,701
|
| $1,897,191
|
| $1,638,492,097
|
1 Non-income producing security.
2 Restricted security.
6. INVESTMENT TRANSACTIONS
Purchases and sales of investments, excluding long-term U.S. government securities and short-term obligations, for the year ended October 31, 2005, were as follows:
Purchases
|
| $
| 4,893,372,053
|
Sales
|
| $
| 5,035,225,659
|
7. CONCENTRATION OF CREDIT RISK
The Fund invests in securities of non-U.S. issuers. The political or economic developments within a particular country or region may have an adverse effect on the ability of domiciled issuers to meet their obligations. Additionally, political or economic developments may have an effect on the liquidity and volatility of portfolio securities and currency holdings.
At October 31, 2005, the diversification of countries was as follows:
Country
|
| Percentage of
Net Assets
|
United States
|
| 73.9%
|
Bermuda
|
| 4.5%
|
Japan
|
| 2.6%
|
India
|
| 2.1%
|
United Kingdom
|
| 2.0%
|
Israel
|
| 1.2%
|
Netherlands
|
| 1.1%
|
Switzerland
|
| 1.0%
|
Canada
|
| 0.9%
|
Republic of Korea
|
| 0.5%
|
China
|
| 0.5%
|
Ireland
|
| 0.5%
|
Cayman Islands
|
| 0.4%
|
Australia
|
| 0.3%
|
Singapore
|
| 0.3%
|
Mexico
|
| 0.3%
|
Brazil
|
| 0.2%
|
Belgium
|
| 0.1%
|
France
|
| 0.1%
|
Hong Kong
|
| 0.0%1
|
Indonesia
|
| 0.0%1
|
Thailand
|
| 0.0%1
|
1 Represents less than 0.1%.
8. LEGAL PROCEEDINGS
Beginning in October 2003, Federated Investors, Inc. and various subsidiaries thereof (including the advisers and distributor for various investment companies, collectively, "Federated"), along with various investment companies sponsored by Federated ("Funds") were named as defendants in several class action lawsuits now pending in the United States District Court for the District of Maryland. The lawsuits were purportedly filed on behalf of people who purchased, owned and/or redeemed shares of Federated-sponsored mutual funds during specified periods beginning November 1, 1998. The suits are generally similar in alleging that Federated engaged in illegal and improper trading practices including market timing and late trading in concert with certain institutional traders, which allegedly caused financial injury to the mutual fund shareholders. These lawsuits began to be filed shortly after Federated's first public announcement that it had received requests for information on shareholder trading activities in the Funds from the Securities and Exchange Commission ("SEC"), the Office of the New York State Attorney General ("NYAG"), and other authorities. In that regard, on November 28, 2005, Federated announced that it had reached final settlements with the SEC and the NYAG with respect to those matters. As Federated previously reported in 2004, it has already paid approximately $8.0 million to certain funds as determined by an independent consultant. As part of these settlements, Federated agreed to pay for the benefit of fund shareholders additional disgorgement and a civil money penalty in the aggregate amount of an additional $72 million. Federated and various Funds have also been named as defendants in several additional lawsuits, the majority of which are now pending in the United States District Court for the Western District of Pennsylvania, alleging, among other things, excessive advisory and rule 12b-1 fees. The Board of the Funds has retained the law firm of Dickstein Shapiro Morin & Oshinsky LLP to represent the Funds in these lawsuits. Federated and the Funds, and their respective counsel, are reviewing the allegations and will respond appropriately. Additional lawsuits based upon similar allegations may be filed in the future. The potential impact of these lawsuits, all of which seek unquantified damages, attorneys' fees and expenses, and future potential similar suits is uncertain. Although we do not believe that these lawsuits will have a material adverse effect on the Funds, there can be no assurance that these suits, the ongoing adverse publicity and/or other developments resulting from the regulatory investigations will not result in increased Fund redemptions, reduced sales of Fund shares, or other adverse consequences for the Funds.
9. FEDERAL TAX INFORMATION (UNAUDITED)
For the year ended October 31, 2005, the amount of long-term capital gain designated by the Fund was $397,094,469.
Report of Independent Registered Public Accounting Firm
TO THE BOARD OF TRUSTEES OF FEDERATED EQUITY FUNDS AND SHAREHOLDERS OF FEDERATED KAUFMANN FUND:
We have audited the accompanying statement of assets and liabilities, including the portfolio of investments, of Federated Kaufmann Fund (one of the portfolios constituting Federated Equity Funds), (the "Fund"), as of October 31, 2005, and the related statement of operations for the year then ended, the statement of changes in net assets for each of the two years in the period then ended and the financial highlights for each of the periods indicated therein. These financial statements and financial highlights are the responsibility of the Fund's management. Our responsibility is to express an opinion on these financial statements and financial highlights based on our audits.
We conducted our audits in accordance with the standards of the Public Company Accounting Oversight Board (United States). Those standards require that we plan and perform the audit to obtain reasonable assurance about whether the financial statements and financial highlights are free of material misstatement. We were not engaged to perform an audit of the Fund's internal control over financial reporting. Our audits included consideration of internal control over financial reporting as a basis for designing audit procedures that are appropriate in the circumstances, but not for the purpose of expressing an opinion on the effectiveness of the Fund's internal control over financial reporting. Accordingly, we express no such opinion. An audit also includes examining, on a test basis, evidence supporting the amounts and disclosures in the financial statements and financial highlights, assessing the accounting principles used and significant estimates made by management, and evaluating the overall financial statement presentation. Our procedures included confirmation of securities owned as of October 31, 2005, by correspondence with the custodian and brokers, or by other appropriate auditing procedures where replies from brokers were not received. We believe that our audits provide a reasonable basis for our opinion.
In our opinion, the financial statements and financial highlights referred to above present fairly, in all material respects, the financial position of the Federated Kaufmann Fund, a portfolio of Federated Equity Funds at October 31, 2005, the results of its operations for the year then ended, the changes in its net assets for each of the two years in the period then ended and the financial highlights for each of the periods indicated therein, in conformity with U.S. generally accepted accounting principles.
Ernst & Young LLP
Boston, Massachusetts
December 12, 2005
Board of Trustees and Trust Officers
The Board is responsible for managing the Trust's business affairs and for exercising all the Trust's powers except those reserved for the shareholders. The following tables give information about each Board member and the senior officers of the Fund. Where required, the tables separately list Board members who are "interested persons" of the Fund (i.e., "Interested" Board members) and those who are not (i.e., "Independent" Board members). Unless otherwise noted, the address of each person listed is Federated Investors Tower, 1001 Liberty Avenue, Pittsburgh, PA. As of December 31, 2004, the Trust comprised eight portfolios, and the Federated Fund Complex consisted of 44 investment companies (comprising 133 portfolios). Unless otherwise noted, each Officer is elected annually. Unless otherwise noted, each Board member oversees all portfolios in the Federated Fund Complex and serves for an indefinite term. The Fund's Statement of Additional Information includes additional information about Trust Trustees and is available, without charge and upon request, by calling 1-800-341-7400.
INTERESTED TRUSTEES BACKGROUND
|
|
|
Name
Birth Date
Address
Positions Held with Trust
Date Service Began
|
| Principal Occupation(s) for Past Five Years,
Other Directorships Held and Previous Position(s)
|
John F. Donahue*
Birth Date: July 28, 1924
CHAIRMAN AND TRUSTEE
Began serving: April 1984 | | Principal Occupations: Chairman and Director or Trustee of the Federated Fund Complex; Chairman and Director, Federated Investors, Inc.
Previous Positions: Trustee, Federated Investment Management Company and Chairman and Director, Federated Investment Counseling. |
|
|
|
J. Christopher Donahue*
Birth Date: April 11, 1949
PRESIDENT AND TRUSTEE
Began serving: January 2000 | | Principal Occupations: Principal Executive Officer and President of the Federated Fund Complex; Director or Trustee of some of the Funds in the Federated Fund Complex; President, Chief Executive Officer and Director, Federated Investors, Inc.; Chairman and Trustee, Federated Investment Management Company; Trustee, Federated Investment Counseling; Chairman and Director, Federated Global Investment Management Corp.; Chairman, Passport Research, Ltd.; Trustee, Federated Shareholder Services Company; Director, Federated Services Company.
Previous Positions: President, Federated Investment Counseling; President and Chief Executive Officer, Federated Investment Management Company, Federated Global Investment Management Corp. and Passport Research, Ltd. |
|
|
|
|
|
|
Name
Birth Date
Address
Positions Held with Trust
Date Service Began
|
| Principal Occupation(s) for Past Five Years,
Other Directorships Held and Previous Position(s)
|
Lawrence D. Ellis, M.D.*
Birth Date: October 11, 1932
3471 Fifth Avenue
Suite 1111
Pittsburgh, PA
TRUSTEE
Began serving: August 1987 | | Principal Occupations: Director or Trustee of the Federated Fund Complex; Professor of Medicine, University of Pittsburgh; Medical Director, University of Pittsburgh Medical Center Downtown; Hematologist, Oncologist and Internist, University of Pittsburgh Medical Center.
Other Directorships Held: Member, National Board of Trustees, Leukemia Society of America.
Previous Positions: Trustee, University of Pittsburgh; Director, University of Pittsburgh Medical Center. |
|
|
|
* Family relationships and reasons for "interested" status: John F. Donahue is the father of J. Christopher Donahue; both are "interested" due to the positions they hold with Federated Investors, Inc. and its subsidiaries. Lawrence D. Ellis, M.D. is "interested" because his son-in-law is employed by the Fund's principal underwriter, Federated Securities Corp.
INDEPENDENT TRUSTEES BACKGROUND
|
|
|
Name
Birth Date
Address
Positions Held with Trust
Date Service Began
|
| Principal Occupation(s) for Past Five Years,
Other Directorships Held and Previous Position(s)
|
Thomas G. Bigley
Birth Date: February 3, 1934
15 Old Timber Trail
Pittsburgh, PA
TRUSTEE
Began serving: October 1995 | | Principal Occupation : Director or Trustee of the Federated Fund Complex.
Other Directorships Held: Director, Member of Executive Committee, Children's Hospital of Pittsburgh; Director, University of Pittsburgh.
Previous Position: Senior Partner, Ernst & Young LLP. |
|
|
|
John T. Conroy, Jr.
Birth Date: June 23, 1937
Investment Properties Corporation
3838 North Tamiami Trail
Suite 402
Naples, FL
TRUSTEE
Began serving: November 1991 | | Principal Occupations: Director or Trustee of the Federated Fund Complex; Chairman of the Board, Investment Properties Corporation; Partner or Trustee in private real estate ventures in Southwest Florida.
Previous Positions: President, Investment Properties Corporation; Senior Vice President, John R. Wood and Associates, Inc., Realtors; President, Naples Property Management, Inc. and Northgate Village Development Corporation. |
|
|
|
|
|
|
Name
Birth Date
Address
Positions Held with Trust
Date Service Began
|
| Principal Occupation(s) for Past Five Years,
Other Directorships Held and Previous Position(s)
|
Nicholas P. Constantakis
Birth Date: September 3, 1939
175 Woodshire Drive
Pittsburgh, PA
TRUSTEE
Began serving: February 1998 | | Principal Occupations : Director or Trustee of the Federated Fund Complex.
Other Directorships Held : Director and Member of the Audit Committee, Michael Baker Corporation (engineering and energy services worldwide).
Previous Position: Partner, Andersen Worldwide SC. |
|
|
|
John F. Cunningham
Birth Date: March 5, 1943
353 El Brillo Way
Palm Beach, FL
TRUSTEE
Began serving: January 1999 | | Principal Occupation : Director or Trustee of the Federated Fund Complex.
Other Directorships Held: Chairman, President and Chief Executive Officer, Cunningham & Co., Inc. (strategic business consulting); Trustee Associate, Boston College.
Previous Positions: Director, Redgate Communications and EMC Corporation (computer storage systems); Chairman of the Board and Chief Executive Officer, Computer Consoles, Inc.; President and Chief Operating Officer, Wang Laboratories; Director, First National Bank of Boston; Director, Apollo Computer, Inc. |
|
|
|
Peter E. Madden
Birth Date: March 16, 1942
One Royal Palm Way
100 Royal Palm Way
Palm Beach, FL
TRUSTEE
Began serving: November 1991 | | Principal Occupation : Director or Trustee of the Federated Fund Complex.
Other Directorships Held: Board of Overseers, Babson College.
Previous Positions: Representative, Commonwealth of Massachusetts General Court; President, State Street Bank and Trust Company and State Street Corporation (retired); Director, VISA USA and VISA International; Chairman and Director, Massachusetts Bankers Association; Director, Depository Trust Corporation; Director, The Boston Stock Exchange. |
|
|
|
Charles F. Mansfield, Jr.
Birth Date: April 10, 1945
80 South Road
Westhampton Beach, NY
TRUSTEE
Began serving: January 1999 | | Principal Occupations: Director or Trustee of the Federated Fund Complex; Management Consultant; Executive Vice President, DVC Group, Inc. (marketing communications and technology) (prior to 9/1/00).
Previous Positions: Chief Executive Officer, PBTC International Bank; Partner, Arthur Young & Company (now Ernst & Young LLP); Chief Financial Officer of Retail Banking Sector, Chase Manhattan Bank; Senior Vice President, HSBC Bank USA (formerly, Marine Midland Bank); Vice President, Citibank; Assistant Professor of Banking and Finance, Frank G. Zarb School of Business, Hofstra University. |
|
|
|
|
|
|
Name
Birth Date
Address
Positions Held with Trust
Date Service Began
|
| Principal Occupation(s) for Past Five Years,
Other Directorships Held and Previous Position(s)
|
John E. Murray, Jr., J.D., S.J.D.
Birth Date: December 20, 1932
Chancellor, Duquesne University
Pittsburgh, PA
TRUSTEE
Began serving: February 1995 | | Principal Occupations: Director or Trustee of the Federated Fund Complex; Chancellor and Law Professor, Duquesne University; Partner, Murray, Hogue and Lannis.
Other Directorships Held: Director, Michael Baker Corp. (engineering, construction, operations and technical services).
Previous Positions: President, Duquesne University; Dean and Professor of Law, University of Pittsburgh School of Law; Dean and Professor of Law, Villanova University School of Law. |
|
|
|
Marjorie P. Smuts
Birth Date: June 21, 1935
4905 Bayard Street
Pittsburgh, PA
TRUSTEE
Began serving: April 1984 | | Principal Occupations : Director or Trustee of the Federated Fund Complex; Public Relations/Marketing Consultant/Conference Coordinator.
Previous Positions: National Spokesperson, Aluminum Company of America; television producer; President, Marj Palmer Assoc.; Owner, Scandia Bord. |
|
|
|
John S. Walsh
Birth Date: November 28, 1957
2604 William Drive
Valparaiso, IN
TRUSTEE
Began serving: January 1999 | | Principal Occupations: Director or Trustee of the Federated Fund Complex; President and Director, Heat Wagon, Inc. (manufacturer of construction temporary heaters); President and Director, Manufacturers Products, Inc. (distributor of portable construction heaters); President, Portable Heater Parts, a division of Manufacturers Products, Inc.
Previous Position: Vice President, Walsh & Kelly, Inc. |
|
|
|
OFFICERS
|
|
|
Name
Birth Date
Positions Held with Trust
Date Service Began
|
| Principal Occupation(s) for Past Five Years and Previous Position(s)
|
John W. McGonigle
Birth Date: October 26, 1938
EXECUTIVE VICE PRESIDENT
AND SECRETARY
Began serving: April 1984 | | Principal Occupations: Executive Vice President and Secretary of the Federated Fund Complex; Vice Chairman, Executive Vice President, Secretary and Director, Federated Investors, Inc.
Previous Positions: Trustee, Federated Investment Management Company and Federated Investment Counseling; Director, Federated Global Investment Management Corp., Federated Services Company and Federated Securities Corp. |
|
|
|
Richard J. Thomas
Birth Date: June 17, 1954
TREASURER
Began serving: November 1998 | | Principal Occupations : Principal Financial Officer and Treasurer of the Federated Fund Complex; Senior Vice President, Federated Administrative Services.
Previous Positions: Vice President, Federated Administrative Services; held various management positions within Funds Financial Services Division of Federated Investors, Inc. |
|
|
|
Richard B. Fisher
Birth Date: May 17, 1923
VICE PRESIDENT
Began serving: April 1984 | | Principal Occupations: Vice Chairman or Vice President of some of the Funds in the Federated Fund Complex; Vice Chairman, Federated Investors, Inc.; Chairman, Federated Securities Corp.
Previous Positions: President and Director or Trustee of some of the Funds in the Federated Fund Complex; Executive Vice President, Federated Investors, Inc. and Director and Chief Executive Officer, Federated Securities Corp. |
|
|
|
Stephen F. Auth
Birth Date: September 3, 1956
CHIEF INVESTMENT OFFICER
Began serving: November 2002 | | Principal Occupations: Chief Investment Officer of this Fund and various other Funds in the Federated Fund Complex; Executive Vice President, Federated Investment Counseling, Federated Global Investment Management Corp., Federated Equity Management Company of Pennsylvania and Passport Research II, Ltd.
Previous Positions: Executive Vice President, Federated Investment Management Company, and Passport Research, Ltd.; Senior Vice President, Global Portfolio Management Services Division; Senior Vice President, Federated Investment Management Company and Passport Research, Ltd.; Senior Managing Director and Portfolio Manager, Prudential Investments. |
|
|
|
|
|
|
Name
Birth Date
Positions Held with Trust
Date Service Began
|
| Principal Occupation(s) for Past Five Years and Previous Position(s)
|
Lawrence Auriana
Birth Date: January 8, 1944
VICE PRESIDENT
Began serving: November 2001 | | Lawrence Auriana has been the Fund's Portfolio Manager since February 1986. He is Vice President of the Trust. Mr. Auriana joined Federated in April 2001 as Co-Head of Investments/Federated Kaufmann. From August 1984 to April 2001, Mr. Auriana was President and Treasurer of Edgemont Asset Management Corp., and Chairman of the Board and Portfolio Manager to The Kaufmann Fund, Inc. (predecessor to the Federated Kaufmann Fund). Mr. Auriana earned a B.S. in economics from Fordham University and has been engaged in the securities business since 1965. |
|
|
|
James E. Grefenstette
Birth Date: November 7, 1962
VICE PRESIDENT
Began serving: November 1998 | | James E. Grefenstette is Vice President of the Trust. Mr. Grefenstette joined Federated in 1992 and has been a Portfolio Manager since 1994. Mr. Grefenstette became a Senior Vice President of the Fund's Adviser in January 2000. He served as a Vice President of the Fund's Adviser from 1996 through 1999 and was an Assistant Vice President of the Fund's Adviser from 1994 until 1996. Mr. Grefenstette is a Chartered Financial Analyst; he received his M.S. in Industrial Administration from Carnegie Mellon University. |
|
|
|
Hans P. Utsch
Birth Date: July 3, 1936
VICE PRESIDENT
Began serving: November 2001 | | Hans P. Utsch has been the Fund's Portfolio Manager since February 1986. He is Vice President of the Trust. Mr. Utsch joined Federated in April 2001 as Co-Head of Investments/Federated Kaufmann. From August 1984 to April 2001, Mr. Utsch was Chairman of the Board and Secretary of Edgemont Asset Management Corp., and President and Portfolio Manager to The Kaufmann Fund, Inc. (predecessor to the Federated Kaufmann Fund). Mr. Utsch graduated from Amherst College and holds an M.B.A. from Columbia University. He has been engaged in the securities business since 1962. |
|
|
|
Board Review of Advisory Contract
As required by the Act, the Fund's Board has reviewed the Fund's investment advisory contract and subadvisory contracts. The Board's decision to approve these contracts reflects the exercise of its business judgment on whether to continue the existing arrangements. During its review of the contract these contracts, the Board considers many factors, among the most material of which are: the Fund's investment objectives; the Adviser's and subadviser's management philosophy, personnel, processes, and investment and operating strategies; long-term performance; the preferences and expectations of Fund shareholders and their relative sophistication; the continuing state of competition in the mutual fund industry; the range of comparable fees for similar funds in the mutual fund industry; the range and quality of services provided to the Fund and its shareholders by the Federated organization in addition to investment advisory services; and the Fund's relationship to the Federated family of funds which include a comprehensive array of funds with different investment objectives, policies and strategies which are available for exchange without the incurrence of additional sales charge.
In its decision to appoint or renew an Adviser, the Board is mindful of the potential disruptions of the Fund's operations and various risks, uncertainties and other effects that could occur as a result of a decision to terminate or not renew an advisory contract. In particular, the Board recognizes that most shareholders have invested in the Fund on the strength of the Adviser's industry standing and reputation and in the expectation that the Adviser will have a continuing role in providing advisory services to the Fund. Thus, the Board's "selection" or approval of the Adviser must reflect the fact that it is the shareholders who have effectively selected the Adviser by virtue of having invested in the Fund. The Board also considers the compensation and benefits received by the Adviser and subadviser. This includes fees received for services provided to the Fund by other entities in the Federated organization and research services received by the Adviser from brokers that execute fund trades, as well as advisory fees. In this regard, the Board is aware that various courts have interpreted provisions of the Act and have indicated in their decisions that the following factors may be relevant to an Adviser's fiduciary duty with respect to its receipt of compensation from a fund: the nature and quality of the services provided by the Adviser, including the performance of the Fund; the Adviser's cost of providing the services; the extent to which the Adviser may realize "economies of scale" as the Fund grows larger; any indirect benefits that may accrue to the Adviser and its affiliates as a result of the Adviser's relationship with the Fund; performance and expenses of comparable funds; and the extent to which the independent Board members are fully informed about all facts bearing on the Adviser's service and fee. The Fund's Board is aware of these factors and is guided by them in its review of the Fund's advisory contract to the extent they are appropriate and relevant, as discussed further below.
The Board considers and weighs these circumstances in light of its substantial accumulated experience in governing the Fund and working with Federated on matters relating to the Federated funds, and is assisted in its deliberations by the advice of independent legal counsel. In this regard, the Board requests and receives substantial and detailed information about the Fund and the Federated organization. Federated provides much of this information at each regular meeting of the Board, and furnishes additional reports in connection with the particular meeting at which the Board's formal review of the advisory contract occurs. In between regularly scheduled meetings, the Board may receive information on particular matters as the need arises. Thus, the Board's evaluation of an advisory contract is informed by reports covering such matters as: the Adviser's investment philosophy, personnel, and processes; operating strategies; the Fund's short- and long-term performance (in absolute terms, both on a gross basis and net of expenses, as well as in relationship to its particular investment program and certain competitor or "peer group" funds and/or other benchmarks, as appropriate), and comments on the reasons for performance; the Fund's expenses (including the advisory fee itself and the overall expense structure of the Fund, both in absolute terms and relative to similar and/or competing funds, with due regard for contractual or voluntary expense limitations); the use and allocation of brokerage commissions derived from trading the Fund's portfolio securities (if any); the nature and extent of the advisory and other services provided to the Fund by the Adviser and its affiliates; compliance and audit reports concerning the Federated funds and the Federated companies that service them (including communications from regulatory agencies), as well as Federated's responses to any issues raised therein; and relevant developments in the mutual fund industry and how the Federated funds and/or Federated are responding to them. The evaluation process is evolutionary, reflecting continually developing considerations. The criteria considered and the emphasis placed on relevant criteria change in recognition of changing circumstances in the mutual fund marketplace. For the past year, the Board concluded that the nature, quality and scope of services provided the fund by the Adviser and its affiliates was satisfactory.
With respect to the Fund's performance and expenses in particular, the Board has found the use of comparisons to other mutual funds with comparable investment programs to be particularly useful, given the high degree of competition in the mutual fund business. The Board focuses on comparisons with other similar mutual funds (rather than non-mutual fund products or services) because, simply put, they are more relevant. For example, other mutual funds are the products most like the Fund, they are readily available to Fund shareholders as alternative investment vehicles, and they are the type of investment vehicle in fact chosen and maintained by the Fund's investors. The range of their fees and expenses therefore appears to be a generally reliable indication of what consumers have found to be reasonable in the precise marketplace in which the Fund competes. The Fund's ability to deliver competitive performance when compared to its peer group may be a useful indicator of how the Adviser is executing on the Fund's investment program, which would in turn assist the Board in reaching a conclusion that the nature, extent, and quality of the Adviser's investment management services are such as to warrant continuation of the advisory contract. During the year ending December 31, 2004, the Fund's performance for both the one and three year periods were above the median of the relevant peer group. During the year ending December 31, 2004, the Fund's investment advisory fee after waivers and expense reimbursements, was above the median of the relevant peer group. The Board reviewed the fees and other expenses of the Fund with the Adviser and was satisfied that the overall expense structure of the Fund nevertheless remained competitive. The Board will continue to monitor advisory fees and other expenses borne by the Fund.
The Board also receives financial information about Federated, including reports on the compensation and benefits Federated derives from its relationships with the Federated funds. These reports cover not only the fees under the advisory contracts, but also fees received by Federated's subsidiaries for providing other services to the Federated funds under separate contracts (e.g., for serving as the Federated funds' administrator). The reports also discuss any indirect benefit Federated may derive from its receipt of research services from brokers who execute Federated fund trades as well as waivers of fees and/or reimbursements of expenses. In order for a fund to be competitive in the marketplace, Federated and its affiliates frequently waive fees and/or reimburse expenses. Although the Board considers the costs incurred and the profitability of the Federated organization as a whole, it does not evaluate, on a fund-by-fund basis, Federated's "profitability" and/or "costs" (which would include an assessment as to whether "economies of scale" would be realized if the fund were to grow to some sufficient size). In the Board's view, the cost of performing advisory services on a fund-specific basis is both difficult to estimate satisfactorily and a relatively minor consideration in its overall evaluation. Analyzing isolated funds would require constructed allocations of the costs of shared resources and operations based on artificial assumptions that are inconsistent with the existing relationships within a large and diversified family of funds that receive advisory and other services from the same organization. In addition, the availability of the exchange privilege among funds in the Federated family makes consideration of the overall cost and profitability of Federated more relevant than that of individual funds. Based upon this review, the Board is satisfied that the costs incurred in, as well as the profitability realized from, managing the Fund and the other Federated Funds are appropriate. Although the Board is always interested in discovering any genuine "economies of scale," its experience has been that such "economies" are likely to arise only when a fund grows dramatically, and becomes and remains very large in size. Even in these instances, purchase and redemption activity, as well as the presence of expense limitations (if any), may offset any perceived economies. As suggested above, the Board considers the information it receives about the Fund's performance and expenses as compared to an appropriate set of similar competing funds to be more relevant.
The Board bases its decision to approve an advisory contract on the totality of the circumstances and relevant factors and with a view to past and future long-term considerations. Not all of the factors and considerations identified above are relevant to every Federated fund, nor does the Board consider any one of them to be determinative. With respect to the factors that are relevant, the Board's decision to approve the contract reflects its determination that Federated's performance and actions provide a satisfactory basis to support the decision to continue the existing arrangements.
Voting Proxies on Fund Portfolio Securities
A description of the policies and procedures that the Fund uses to determine how to vote proxies, if any, relating to securities held in the Fund's portfolio is available, without charge and upon request, by calling 1-800-341-7400. A report on "Form N-PX" of how the Fund voted any such proxies during the most recent 12-month period ended June 30 is available through Federated's website. Go to FederatedInvestors.com, select "Products," select the "Prospectuses and Regulatory Reports" link, then select the Fund to access the link to Form N-PX. This information is also available from the EDGAR database on the SEC's website at www.sec.gov.
Quarterly Portfolio Schedule
The Fund files with the SEC a complete schedule of its portfolio holdings, as of the close of the first and third quarters of its fiscal year, on "Form N-Q." These filings are available on the SEC's website at www.sec.gov and may be reviewed and copied at the SEC's Public Reference Room in Washington, DC. (Call 1-800-SEC-0330 for information on the operation of the Public Reference Room.) You may also access this information from the "Products" section of the Federated Investors website at FederatedInvestors.com by clicking on "Portfolio Holdings" and selecting the name of the Fund, or by selecting the name of the Fund and clicking on "Portfolio Holdings." You must register on the website the first time you wish to access this information.
Mutual funds are not bank deposits or obligations, are not guaranteed by any bank, and are not insured or guaranteed by the U.S. government, the Federal Deposit Insurance Corporation, the Federal Reserve Board, or any other government agency. Investment in mutual funds involves investment risk, including the possible loss of principal.
This report is authorized for distribution to prospective investors only when preceded or accompanied by the Fund's prospectus, which contains facts concerning its objective and policies, management fees, expenses, and other information.
Federated
World-Class Investment Manager
Federated Kaufmann Fund
Federated Investors Funds
5800 Corporate Drive
Pittsburgh, PA 15237-7000
Contact us at FederatedInvestors.com
or call 1-800-341-7400.
Federated Securities Corp., Distributor
Cusip 314172677
Cusip 314172669
Cusip 314172651
26396 (12/05)
Federated is a registered mark of Federated Investors, Inc. 2005 (c)Federated Investors, Inc.
Federated
World-Class Investment Manager
Federated Kaufmann Small Cap Fund
Established 2002
A Portfolio of Federated Equity Funds
3RD ANNUAL SHAREHOLDER REPORT
October 31, 2005
Class A Shares
Class B Shares
Class C Shares
FINANCIAL HIGHLIGHTS
SHAREHOLDER EXPENSE EXAMPLE
MANAGEMENT'S DISCUSSION OF FUND PERFORMANCE
PORTFOLIO OF INVESTMENTS SUMMARY TABLE
PORTFOLIO OF INVESTMENTS
STATEMENT OF ASSETS AND LIABILITIES
STATEMENT OF OPERATIONS
STATEMENT OF CHANGES IN NET ASSETS
NOTES TO FINANCIAL STATEMENTS
REPORT OF INDEPENDENT REGISTERED PUBLIC ACCOUNTING FIRM
BOARD OF TRUSTEES AND TRUST OFFICERS
BOARD REVIEW OF ADVISORY CONTRACT
VOTING PROXIES ON FUND PORTFOLIO SECURITIES
QUARTERLY PORTFOLIO SCHEDULE
Not FDIC Insured * May Lose Value * No Bank Guarantee
Financial Highlights - Class A Shares
(For a Share Outstanding Throughout Each Period)
| | Year Ended October 31,
| | Period Ended | |
|
| 2005
|
| 2004
|
|
| 10/31/2003
| 1
|
Net Asset Value, Beginning of Period
| | $19.30 | | $17.07 | | | $10.00 | |
Income From Investment Operations:
| | | | | | | | |
Net investment income (loss)
| | (0.35 | ) 2 | (0.31 | ) 2 | | (0.21 | ) 2 |
Net realized and unrealized gain on investments and foreign currency transactions
|
| 2.76
|
| 2.79
|
|
|
7.28
|
|
TOTAL FROM INVESTMENT OPERATIONS
|
| 2.41
|
| 2.48
|
|
| 7.07
|
|
Less Distributions:
| | | | | | | | |
Distributions from net realized gain on investments
|
| (1.11
| )
| (0.25
| )
|
| - --
|
|
Net Asset Value, End of Period
|
| $20.60
|
| $19.30
|
|
| $17.07
|
|
Total Return 3
|
| 12.79
| %
| 14.72
| %
|
| 70.70
| %
|
| | | | | | | | |
Ratios to Average Net Assets:
|
|
|
|
|
|
|
|
|
Net expenses
|
| 1.95
| %
| 1.95
| %
|
| 1.95
| % 4
|
Net investment income (loss)
|
| (1.73
| )%
| (1.72
| )%
|
| (1.67
| )% 4
|
Expense waiver/reimbursement 5
|
| 0.28
| %
| 0.31
| %
|
| 0.85
| % 4
|
Supplemental Data:
|
|
|
|
|
|
|
|
|
Net assets, end of period (000 omitted)
|
| $371,092
|
| $216,310
|
|
| $121,125
|
|
Portfolio turnover
|
| 42
| %
| 68
| %
|
| 70
| %
|
1 Reflects operations for the period from December 18, 2002 (date of initial public investment) to October 31, 2003.
2 Per share numbers have been calculated using the average shares method, which more appropriately represents the per share data for the period since the use of the undistributed income method did not accord with results of operations.
3 Based on net asset value, which does not reflect the sales charge, redemption fee or contingent deferred sales charge, if applicable. Total returns for periods of less than one year are not annualized.
4 Computed on an annualized basis.
5 This expense decrease is reflected in both the net expense and the net investment income (loss) ratios shown above.
See Notes which are an integral part of the Financial Statements
Financial Highlights - Class B Shares
(For a Share Outstanding Throughout Each Period)
| | Year Ended October 31,
| | Period Ended | |
|
| 2005
|
| 2004
|
|
| 10/31/2003
| 1
|
Net Asset Value, Beginning of Period
| | $19.16 | | $17.04 | | | $10.00 | |
Income From Investment Operations:
| | | | | | | | |
Net investment income (loss)
| | (0.46 | ) 2 | (0.41 | ) 2 | | (0.29 | ) 2 |
Net realized and unrealized gain on investments and foreign currency transactions
|
| 2.74
|
| 2.78
|
|
|
7.33
|
|
TOTAL FROM INVESTMENT OPERATIONS
|
| 2.28
|
| 2.37
|
|
| 7.04
|
|
Less Distributions:
| | | | | | | | |
Distributions from net realized gain on investments
|
| (1.11
| )
| (0.25
| )
|
| - --
|
|
Net Asset Value, End of Period
|
| $20.33
|
| $19.16
|
|
| $17.04
|
|
Total Return 3
|
| 12.17
| %
| 14.09
| %
|
| 70.40
| %
|
| | | | | | | | |
Ratios to Average Net Assets:
|
|
|
|
|
|
|
|
|
Net expenses
|
| 2.50
| %
| 2.50
| %
|
| 2.50
| % 4
|
Net investment income (loss)
|
| (2.28
| )%
| (2.27
| )%
|
| (2.22
| )% 4
|
Expense waiver/reimbursement 5
|
| 0.23
| %
| 0.26
| %
|
| 0.80
| % 4
|
Supplemental Data:
|
|
|
|
|
|
|
|
|
Net assets, end of period (000 omitted)
|
| $117,744
|
| $87,938
|
|
| $43,390
|
|
Portfolio turnover
|
| 42
| %
| 68
| %
|
| 70
| %
|
1 Reflects operations for the period from December 18, 2002 (date of initial public investment) to October 31, 2003.
2 Per share numbers have been calculated using the average shares method, which more appropriately represents the per share data for the period since the use of the undistributed income method did not accord with results of operations.
3 Based on net asset value, which does not reflect the sales charge, redemption fee or contingent deferred sales charge, if applicable. Total returns for periods of less than one year are not annualized.
4 Computed on an annualized basis.
5 This expense decrease is reflected in both the net expense and the net investment income (loss) ratios shown above.
See Notes which are an integral part of the Financial Statements
Financial Highlights - Class C Shares
(For a Share Outstanding Throughout Each Period)
| | Year Ended October 31,
| | Period Ended | |
|
| 2005
|
| 2004
|
|
| 10/31/2003
| 1
|
Net Asset Value, Beginning of Period
| | $19.16 | | $17.04 | | | $10.00 | |
Income From Investment Operations:
| | | | | | | | |
Net investment income (loss)
| | (0.46 | ) 2 | (0.41) | 2 | | (0.29 | ) 2 |
Net realized and unrealized gain on investments and foreign currency transactions
|
| 2.74
|
| 2.78
|
|
|
7.33
|
|
TOTAL FROM INVESTMENT OPERATIONS
|
| 2.28
|
| 2.37
|
|
| 7.04
|
|
Less Distributions:
| | | | | | | | |
Distributions from net realized gain on investments
|
| (1.11
| )
| (0.25
| )
|
| - --
|
|
Net Asset Value, End of Period
|
| $20.33
|
| $19.16
|
|
| $17.04
|
|
Total Return 3
|
| 12.17
| %
| 14.09
| %
|
| 70.40
| %
|
| | | | | | | | |
Ratios to Average Net Assets:
|
|
|
|
|
|
|
|
|
Net expenses
|
| 2.50
| %
| 2.50
| %
|
| 2.50
| % 4
|
Net investment income (loss)
|
| (2.28
| )%
| (2.27
| )%
|
| (2.22
| )% 4
|
Expense waiver/reimbursement 5
|
| 0.23
| %
| 0.26
| %
|
| 0.80
| % 4
|
Supplemental Data:
|
|
|
|
|
|
|
|
|
Net assets, end of period (000 omitted)
|
| $152,232
|
| $100,873
|
|
| $47,696
|
|
Portfolio turnover
|
| 42
| %
| 68
| %
|
| 70
| %
|
1 Reflects operations for the period from December 18, 2002 (date of initial public investment) to October 31, 2003.
2 Per share numbers have been calculated using the average shares method, which more appropriately represents the per share data for the period since the use of the undistributed income method did not accord with results of operations.
3 Based on net asset value, which does not reflect the sales charge, redemption fee or contingent deferred sales charge, if applicable. Total returns for periods of less than one year are not annualized.
4 Computed on an annualized basis.
5 This expense decrease is reflected in both the net expense and the net investment income (loss) ratios shown above.
See Notes which are an integral part of the Financial Statements
Shareholder Expense Example
As a shareholder of the Fund, you incur two types of costs: (1) transaction costs, including sales charges (loads) on purchase or redemption payments; and (2) ongoing costs, including management fees; to the extent applicable, distribution (12b-1) fees and/or shareholder services fees; and other Fund expenses. This Example is intended to help you to understand your ongoing costs (in dollars) of investing in the Fund and to compare these costs with the ongoing costs of investing in other mutual funds. It is based on an investment of $1,000 invested at the beginning of the period and held for the entire period from May 1, 2005 to October 31, 2005.
ACTUAL EXPENSES
The first section of the table below provides information about actual account values and actual expenses. You may use the information in this section, together with the amount you invested, to estimate the expenses that you incurred over the period. Simply divide your account value by $1,000 (for example, an $8,600 account value divided by $1,000 = 8.6), then multiply the result by the number in the first section under the heading entitled "Expenses Paid During Period" to estimate the expenses attributable to your investment during this period.
HYPOTHETICAL EXAMPLE FOR COMPARISON PURPOSES
The second section of the table below provides information about hypothetical account values and hypothetical expenses based on the Fund's actual expense ratio and an assumed rate of return of 5% per year before expenses, which is not the Fund's actual return. Thus, you should not use the hypothetical account values and expenses to estimate the actual ending account balance or your expenses for the period. Rather, these figures are provided to enable you to compare the ongoing costs of investing in the Fund and other funds. To do so, compare this 5% hypothetical example with the 5% hypothetical examples that appear in the shareholder reports of the other funds.
Please note that the expenses shown in the table are meant to highlight your ongoing costs only and do not reflect any transaction costs, such as sales charges (loads) on purchase or redemption payments. Therefore, the second section of the table is useful in comparing ongoing costs only, and will not help you determine the relative total costs of owning different funds. In addition, if these transaction costs were included, your costs would have been higher.
|
| Beginning
Account Value
5/1/2005
|
| Ending
Account Value
10/31/2005
|
| Expenses Paid
During Period 1
|
Actual:
|
|
|
|
|
|
|
Class A Shares
|
| $1,000
|
| $1,104.60
|
| $10.34
|
Class B Shares
|
| $1,000
|
| $1,101.30
|
| $13.24
|
Class C Shares
|
| $1,000
|
| $1,101.90
|
| $13.24
|
Hypothetical (assuming a 5% return before expenses):
|
|
|
|
|
|
|
Class A Shares
|
| $1,000
|
| $1,015.38
|
| $ 9.91
|
Class B Shares
|
| $1,000
|
| $1,012.60
|
| $12.68
|
Class C Shares
|
| $1,000
|
| $1,012.60
|
| $12.68
|
1 Expenses are equal to the Fund's annualized net expense ratio multiplied by the average account value over the period, multiplied by 184/365 (to reflect the one-half year period). The annualized net expense ratios are as follows:
Class A Shares
|
| 1.95%
|
Class B Shares
|
| 2.50%
|
Class C Shares
|
| 2.50%
|
Management's Discussion of Fund Performance
For the 12-month reporting period ended October 31, 2005, the Federated Kaufmann Small Cap Fund Class A, B, and C Shares, based on net asset value, generated total returns of 12.79%, 12.17%, and 12.17% respectively, while its benchmark, the Russell 2000 Growth Index 1 returned 10.91%, and the Lipper Small Cap Growth Funds Average 2 returned 11.79%. The performance of the fund's Class A Shares from December 31, 2002 (the next available ranking date following the fund's inception on December 17, 2002) to October 31, 2005, ranks it among the top 1% (4 of 447) in the Lipper Small Cap Growth Funds Category based on total return. The fund was ranked 196 of 515 funds for the one-year period ended October 31, 2005. 2
Economic growth remained modest during the reporting period. Economic growth was somewhat effected by higher energy prices and an active hurricane season. Small-cap companies, as a whole, continued to deliver double-digit earnings growth. During the reporting period, stock selection accounted for the outperformance of the fund versus the benchmark. Two of our largest positions, Advance Auto Parts and Central European Media , each returned over 30% during the reporting period, contributing strongly to performance. Exposure to transportation industry companies Forward Air , EGL Inc. , Overnite Corp. , ABX Air , and Quality Distribution all contributed positively to performance. Two information technology companies, CSR PLC and MEMC Electronic Materials, performed extremely well, each returned over 85% during the reporting period contributing positively to returns.
Energy was the best performing sector in the benchmark index for the prior 12-month period. The fund's lack of Energy holdings negatively impacted performance, relative to the fund's benchmark. Exposure to retailer PETCO Animal Supplies also hurt performance, as the company experienced operating difficulty during the period. Finally fundamental weakness in retailer Movie Gallery also hurt performance, and note that this holding was sold from the fund's portfolio.
1 Russell 2000 Growth Index is an unmanaged index that measures the performance of those Russell 2000 companies with higher price-to-book ratios and higher forecasted growth values. Investments cannot be made in an index.
2 Lipper figures represent the average of the total returns reported by all the mutual funds designated by Lipper, Inc. as falling into the respective categories indicated. Lipper figures do not reflect sales chares. Rankings for other classes will vary.
GROWTH OF A $10,000 INVESTMENT - CLASS A SHARES
The graph below illustrates the hypothetical investment of $10,000 1 in Federated Kaufmann Small Cap Fund (Class A Shares) (the "Fund") from December 18, 2002 (start of performance) to October 31, 2005, compared to the Russell 2000 Growth Index (R2000G) 2 and the Lipper Small Cap Growth Funds Average (LSCGFA) 2 ..
Average Annual Total Return 3 for the Period Ended 10/31/2005
|
|
|
1 Year
|
| 6.60%
|
Start of Performance (12/18/2002)
|
| 29.22%
|
Performance data quoted represents past performance which is no guarantee of future results. Investment return and principal value will fluctuate so that an investor's shares, when redeemed, may be worth more or less than their original cost. Mutual fund performance changes over time and current performance may be lower or higher than what is stated. For current to the most recent month-end performance and after-tax returns, visit FederatedInvestors.com or call 1-800-341-7400. Returns shown do not reflect the deduction of taxes that a shareholder would pay on Fund distributions or the redemption of Fund shares. Mutual funds are not obligations of or guaranteed by any bank and are not federally insured. Total returns shown include the maximum sales charge of 5.50%.
1 Represents a hypothetical investment of $10,000 in the Fund after deducting the maximum sales charge of 5.50% ($10,000 investment minus $550 sales charge = $9,450). The Fund's performance assumes the reinvestment of all dividends and distributions. The R2000G and the LSCGFA have been adjusted to reflect reinvestment of dividends on securities in the index and the average.
2 The R2000G and the LSCGFA are not adjusted to reflect sales charges, expenses or other fees that the Securities and Exchange Commission ("SEC") requires to be reflected in the Fund's performance. The LSCGFA represents the average of the total returns reported by all of the mutual funds designated by Lipper, Inc. as falling in the category indicated, and not adjusted to reflect any sales charges. However, these total returns are reported net of expenses or other fees that the SEC requires to be reflected in a fund's performance. The index is unmanaged, and, unlike the Fund, is not affected by cashflows. It is not possible to invest directly in an index.
3 Total returns quoted reflect all applicable sales charges.
GROWTH OF A $10,000 INVESTMENT - CLASS B SHARES
The graph below illustrates the hypothetical investment of $10,000 1 in Federated Kaufmann Small Cap Fund (Class B Shares) (the "Fund") from December 18, 2002 (start of performance) to October 31, 2005, compared to the Russell 2000 Growth Index (R2000G) 2 and the Lipper Small Cap Growth Funds Average (LSCGFA) 2 ..
Average Annual Total Return 3 for the Period Ended 10/31/2005
|
|
|
1 Year
|
| 6.67%
|
Start of Performance (12/18/2002)
|
| 30.35%
|
Performance data quoted represents past performance which is no guarantee of future results. Investment return and principal value will fluctuate so that an investor's shares, when redeemed, may be worth more or less than their original cost. Mutual fund performance changes over time and current performance may be lower or higher than what is stated. For current to the most recent month-end performance and after-tax returns, visit FederatedInvestors.com or call 1-800-341-7400. Returns shown do not reflect the deduction of taxes that a shareholder would pay on Fund distributions or the redemption of Fund shares. Mutual funds are not obligations of or guaranteed by any bank and are not federally insured. Total returns shown include the maximum contingent deferred sales charge of 5.50% as applicable.
1 Represents a hypothetical investment of $10,000 in the Fund. The maximum contingent deferred sales charge is 5.50% on any redemption less than one year from the purchase date. The Fund's performance assumes the reinvestment of all dividends and distributions. The R2000G and the LSCGFA have been adjusted to reflect reinvestment of dividends on securities in the index and average.
2 The R2000G and the LSCGFA are not adjusted to reflect sales charges, expenses, or other fees that the SEC requires to be reflected in the Fund's performance. The LSCGFA represents the average of the total returns reported by all of the mutual funds designated by Lipper, Inc. as falling in the category indicated, and is not adjusted to reflect any sales charges. However, these total returns are reported net of expenses or other fees that the SEC requires to be reflected in a fund's performance. The index is unmanaged, and, unlike the Fund, is not affected by cashflows. It is not possible to invest directly in an index.
3 Total returns quoted reflect all applicable contingent deferred sales charges.
GROWTH OF A $10,000 INVESTMENT - CLASS C SHARES
The graph below illustrates the hypothetical investment of $10,000 1 in Federated Kaufmann Small Cap Fund (Class C Shares) (the "Fund") from December 18, 2002 (start of performance) to October 31, 2005, compared to the Russell 2000 Growth Index (R2000G) 2 and the Lipper Small Cap Growth Funds Average (LSCGFA) 2 ..
Average Annual Total Return 3 for the Period Ended 10/31/2005
|
|
|
1 Year
|
| 10.08%
|
Start of Performance (12/18/2002)
|
| 30.74%
|
Performance data quoted represents past performance which is no guarantee of future results. Investment return and principal value will fluctuate so that an investor's shares, when redeemed, may be worth more or less than their original cost. Mutual fund performance changes over time and current performance may be lower or higher than what is stated. For current to the most recent month-end performance and after-tax returns, visit FederatedInvestors.com or call 1-800-341-7400. Returns shown do not reflect the deduction of taxes that a shareholder would pay on Fund distributions or the redemption of Fund shares. Mutual funds are not obligations of or guaranteed by any bank and are not federally insured. Total returns shown include the maximum sales charge of 1.00% and the 1.00% contingent deferred sales charge as applicable.
1 Represents a hypothetical investment of $10,000 in the Fund after deducting the maximum sales charge of 1.00% ($10,000 investment minus $100 sales charge = $9,900). A 1.00% contingent deferred sales charge would be applied to any redemption less than one year from the purchase date . The Fund's performance assumes the reinvestment of all dividends and distributions. The R2000G and the LSCGFA have been adjusted to reflect reinvestment of dividends on securities in the index and average.
2 The R2000G and the LSCGFA are not adjusted to reflect sales charges, expenses, or other fees that the SEC requires to be reflected in the Fund's performance. The LSCGFA represents the average of the total returns reported by all of the mutual funds designated by Lipper, Inc. as falling in the category indicated, and is not adjusted to reflect any sales charges. However, these total returns are reported net of expenses or other fees that the SEC requires to be reflected in a fund's performance. The index is unmanaged, and, unlike the Fund, is not affected by cashflows. It is not possible to invest directly in an index.
3 Total returns quoted reflect all applicable sales charges and contingent deferred sales charges.
Performance data quoted represents past performance which is no guarantee of future results. Investment return and principal value will fluctuate so that an investor's shares, when redeemed, may be worth more or less than their original cost. Mutual fund performance changes over time and current performance may be lower or higher than what is stated. For current to the most recent month-end performance, visit FederatedInvestors.com or call 1-800-341-7400.
Portfolio of Investments Summary Table
At October 31, 2005, the Fund's sector composition 1 was as follows:
Sector
|
| Percentage of
Total Net Assets
|
Consumer Discretionary
|
| 26.9
| %
|
Healthcare
|
| 23.5
| %
|
Industrials
|
| 22.4
| %
|
Information Technology
|
| 22.2
| %
|
Financials
|
| 3.4
| %
|
Telecommunication Services
|
| 0.7
| %
|
Utilities
|
| 0.1
| %
|
Energy
|
| 0.0
| %
|
Cash Equivalents 2
|
| 1.7
| %
|
Other Assets and Liabilities--Net 3
|
| (0.9
| )%
|
TOTAL
|
| 100.0
| %
|
1 Except for Cash Equivalents and Other Assets and Liabilities, sector classifications are based upon, and individual portfolio securities are assigned to, the classifications of the Global Industry Classification Standard (GICS) except that the adviser assigns a classification to securities not classified by the GICS and to securities for which the adviser does not have access to the classification made by the GICS.
2 Cash Equivalents includes any investments in money market mutual funds and/or overnight repurchase agreements.
3 See Statement of Assets and Liabilities.
Portfolio of Investments
October 31, 2005
Shares
|
|
|
|
| Value
|
|
| | | COMMON STOCKS--99.2% | | | | |
| | | Consumer Discretionary--26.9% | | | | |
| 325,290 | 1 | 1-800-FLOWERS.COM, Inc.
| | $ | 2,208,719 | |
| 210,396 | 1 | A.C. Moore Arts & Crafts, Inc.
| | | 2,895,049 | |
| 1,020,900 | 1 | Advance Auto Parts, Inc.
| | | 38,283,750 | |
| 66,050 | | Applebee's International, Inc.
| | | 1,447,156 | |
| 24,200 | | Arbitron, Inc.
| | | 905,322 | |
| 6,000 | 1 | Blue Nile, Inc.
| | | 215,220 | |
| 154,000 | 1 | Buffalo Wild Wings, Inc.
| | | 4,225,760 | |
| 60,000 | 1 | Cabela's, Inc., Class A
| | | 984,000 | |
| 100,000 | 1 | Carter's, Inc.
| | | 6,315,000 | |
| 162,894 | 1 | Celebrate Express, Inc.
| | | 2,218,616 | |
| 766,100 | 1 | Central European Media Enterprises Ltd., Class A
| | | 35,615,989 | |
| 63,216 | 1 | Citi Trends, Inc.
| | | 1,809,874 | |
| 73,740 | 1 | Concorde Career Colleges, Inc.
| | | 1,106,100 | |
| 89,745 | 1 | Cost Plus, Inc.
| | | 1,378,483 | |
| 57,600 | 1 | Ctrip.com International Ltd., ADR
| | | 3,313,728 | |
| 37,600 | 1 | DSW, Inc., Class A
| | | 782,832 | |
| 38,400 | 1 | Design Within Reach, Inc.
| | | 309,888 | |
| 315,318 | 1 | Dick's Sporting Goods, Inc.
| | | 9,437,468 | |
| 166,217 | 1 | eCost.com, Inc.
| | | 272,596 | |
| 101,000 | 1 | Educate, Inc.
| | | 1,189,780 | |
| 616,520 | | J.D. Wetherspoon PLC
| | | 3,222,818 | |
| 440,800 | 1 | Knology, Inc.
| | | 837,520 | |
| 53,150 | 1 | Lamar Advertising Co.
| | | 2,371,553 | |
| 129,000 | 1 | Lodgenet Entertainment
| | | 1,677,000 | |
| 35,600 | 1 | Maidenform Brands, Inc.
| | | 448,204 | |
| 308,498 | 1 | Monro Muffler Brake, Inc.
| | | 9,239,515 | |
| 203,500 | 1 | New York & Company
| | | 2,747,250 | |
| 76,506 | | Orient-Express Hotel Ltd.
| | | 2,157,469 | |
| 137,700 | 1 | PC Mall, Inc.
| | | 772,497 | |
| 701,800 | 1 | PETCO Animal Supplies, Inc.
| | | 13,341,218 | |
| 4,400 | | PETsMART, Inc.
| | | 103,400 | |
| 133,400 | 1 | Provide Commerce, Inc.
| | | 3,245,622 | |
Shares
|
|
|
|
| Value
|
|
| | | COMMON STOCKS--continued | | | | |
| | | Consumer Discretionary--continued | | | | |
| 1,699 | | SKY Perfect Communications, Inc.
| | $ | 1,220,506 | |
| 153,200 | | Speedway Motorsports, Inc.
| | | 5,432,472 | |
| 38,300 | 1,2 | Submarino SA
| | | 1,006,524 | |
| 324,600 | 1 | Texas Roadhouse, Inc.
| | | 5,109,204 | |
| 50,000 | 1 | Volcom, Inc.
| | | 1,529,000 | |
| 67,400 | | Winnebago Industries, Inc.
| | | 1,976,168 | |
| 35,000 | 1 | Zumiez Inc.
|
|
| 1,194,900
|
|
| | | TOTAL
|
|
| 172,548,170
|
|
| | | Energy--0.0% | | | | |
| 10,600 | 1 | Trico Marine Services, Inc.
|
|
| 270,194
|
|
| | | Financials--3.4% | | | | |
| 140,000 | | Advance America Cash Advance, Inc.
| | | 1,701,000 | |
| 23,958 | 1 | Affiliated Managers Group
| | | 1,838,777 | |
| 23,400 | | Endurance Specialty Holdings Ltd.
| | | 775,944 | |
| 91,600 | | First Potomac Realty Trust
| | | 2,321,144 | |
| 21,500 | | Global Signal, Inc.
| | | 891,175 | |
| 1,279,410 | 1 | Infrastructure Development Finance Co. Ltd.
| | | 1,857,941 | |
| 46,600 | | IPC Holdings Ltd.
| | | 1,226,978 | |
| 16,300 | | Mercury General Corp.
| | | 985,335 | |
| 29,100 | 1 | Philadelphia Consolidated Holding Corp.
| | | 2,801,166 | |
| 32,300 | 1,2 | RHJ International
| | | 754,844 | |
| 6,820 | | SFCG Co. Ltd.
| | | 1,636,976 | |
| 380,300 | 1 | QC Holdings, Inc.
| | | 4,613,039 | |
| 28,300 | | U-Store-It Trust
|
|
| 590,338
|
|
| | | TOTAL
|
|
| 21,994,657
|
|
| | | Healthcare--23.5% | | | | |
| 622,600 | 1 | Abgenix, Inc.
| | | 6,475,040 | |
| 34,200 | 1 | Acadia Pharmaceuticals, Inc.
| | | 359,100 | |
| 690,900 | 1 | Acusphere, Inc.
| | | 3,509,772 | |
| 59,000 | 1,2 | Adaltis, Inc.
| | | 149,860 | |
| 253,000 | 1,2 | Adaltis, Inc.
| | | 642,621 | |
| 24,300 | 1 | Adeza Biomedical Corp.
| | | 414,315 | |
| 359,878 | 1 | Alexion Pharmaceuticals, Inc.
| | | 9,857,058 | |
| 44,200 | 1 | Arthrocare Corp.
| | | 1,623,466 | |
| 279,600 | 1 | Auxilium Pharmaceutical, Inc.
| | | 1,090,440 | |
Shares
|
|
|
|
| Value
|
|
| | | COMMON STOCKS--continued | | | | |
| | | Healthcare--continued | | | | |
| 132,700 | 1 | AVANIR Pharmaceuticals, Class A
| | $ | 410,043 | |
| 46,600 | 1 | Avigen, Inc.
| | | 125,820 | |
| 251,200 | 1 | Bioenvision, Inc.
| | | 1,539,856 | |
| 185,300 | 1 | Biovail Corp.
| | | 4,037,687 | |
| 73,700 | 1 | CV Therapeutics, Inc.
| | | 1,846,922 | |
| 693,800 | 1 | Cambridge Heart, Inc.
| | | 187,326 | |
| 766,100 | 1 | Ciphergen Biosystems, Inc.
| | | 1,493,895 | |
| 1,200 | 1 | Conceptus, Inc.
| | | 12,324 | |
| 219,200 | 1 | Cubist Pharmaceuticals, Inc.
| | | 4,430,032 | |
| 187,180 | 1 | Cytyc Corp.
| | | 4,745,013 | |
| 56,600 | 1 | Digene Corp.
| | | 1,709,320 | |
| 387,500 | 1 | Discovery Partners International
| | | 1,116,000 | |
| 350,000 | 1 | Dyax Corp.
| | | 1,487,500 | |
| 777,100 | 1 | Dynavax Technologies Corp.
| | | 4,592,661 | |
| 70,200 | 1 | Endo Pharmaceuticals Holdings, Inc.
| | | 1,889,784 | |
| 119,200 | 1 | Endologix, Inc.
| | | 562,624 | |
| 124,700 | 1 | Eyetech Pharmaceuticals, Inc.
| | | 2,199,708 | |
| 415,800 | 1 | Genaera Corp.
| | | 644,490 | |
| 253,300 | 1 | Human Genome Sciences, Inc.
| | | 2,115,055 | |
| 67,100 | 1 | ICOS Corp.
| | | 1,810,358 | |
| 188,594 | 1 | INAMED Corp.
| | | 13,409,033 | |
| 150,572 | 1 | Illumina, Inc.
| | | 2,344,406 | |
| 392,800 | 1 | Incyte Genomics, Inc.
| | | 1,960,072 | |
| 67,900 | 1 | Inhibitex, Inc.
| | | 659,988 | |
| 81,900 | 1 | Kinetic Concepts, Inc.
| | | 2,940,210 | |
| 319,300 | 1 | Kosan Biosciences, Inc.
| | | 2,263,837 | |
| 105,934 | 1 | Kyphon, Inc.
| | | 4,246,894 | |
| 41,100 | 1 | MWI Veterinary Supply, Inc.
| | | 921,462 | |
| 92,100 | 1 | Magellan Health Services, Inc.
| | | 2,738,133 | |
| 170,100 | 1 | Medicines Co.
| | | 2,915,514 | |
| 215,600 | 1 | Nektar Therapeutics
| | | 3,246,936 | |
| 318,100 | 1 | Neurochem, Inc.
| | | 4,851,025 | |
| 41,000 | 1 | Neurocrine Biosciences, Inc.
| | | 2,165,620 | |
| 5,145 | 1 | Neurometrix, Inc.
| | | 191,548 | |
| 63,200 | 1 | Northfield Laboratories, Inc.
| | | 786,208 | |
Shares
|
|
|
|
| Value
|
|
| | | COMMON STOCKS--continued | | | | |
| | | Healthcare--continued | | | | |
| 142,200 | 1 | NxStage Medical, Inc.
| | $ | 1,613,970 | |
| 255,981 | 1 | Orthofix International NV
| | | 9,645,364 | |
| 133,100 | 1 | OSI Pharmaceuticals, Inc.
| | | 3,101,230 | |
| 264,700 | 1 | Penwest Pharmaceuticals Co.
| | | 4,198,142 | |
| 975,000 | 1 | Point Therapeutics, Inc.
| | | 3,578,250 | |
| 147,300 | 1 | Progenics Pharmaceuticals, Inc.
| | | 3,467,442 | |
| 38,400 | 1 | Psychiatric Solutions, Inc.
| | | 2,100,480 | |
| 192,500 | 1 | Regeneron Pharmaceuticals, Inc.
| | | 2,408,175 | |
| 58,600 | 1 | Sepracor, Inc.
| | | 3,296,250 | |
| 309,400 | 1 | Spectrum Pharmaceuticals, Inc.
| | | 1,339,702 | |
| 155,300 | 1 | Threshold Pharmaceuticals, Inc., Class THL
| | | 1,714,512 | |
| 113,490 | 1 | United Surgical Partners International, Inc.
| | | 4,068,617 | |
| 467,300 | 1 | Vical, Inc.
| | | 2,387,903 | |
| 7,300 | 1 | WebMD Health Corp., Class A
| | | 190,676 | |
| 170,100 | 1 | YM Biosciences, Inc.
| | | 496,863 | |
| 6,500 | 1 | Zoll Medical Corp.
|
|
| 161,330
|
|
| | | TOTAL
|
|
| 150,487,882
|
|
| | | Industrials--22.4% | | | | |
| 2,435,200 | 1 | ABX Air, Inc.
| | | 19,457,248 | |
| 199,200 | | CNF Transportation, Inc.
| | | 11,208,984 | |
| 65,182 | 1 | CoStar Group, Inc.
| | | 3,125,477 | |
| 111,100 | 1 | Commercial Vehicle Group, Inc.
| | | 2,168,672 | |
| 118,040 | | DRS Technologies, Inc.
| | | 5,814,650 | |
| 612,700 | 1 | EGL, Inc.
| | | 17,173,981 | |
| 107,204 | | Expeditors International Washington, Inc.
| | | 6,504,067 | |
| 38,612 | 1 | Exponent, Inc.
| | | 1,112,798 | |
| 500,840 | | Forward Air Corp.
| | | 17,754,778 | |
| 8,800 | 1 | Global Cash Access LLC
| | | 123,376 | |
| 675,000 | 1 | Innovative Solutions and Support, Inc.
| | | 9,645,750 | |
| 85,400 | 1 | Interline Brands, Inc.
| | | 1,667,862 | |
| 23,000 | 1 | K&F Industries Holdings, Inc.
| | | 359,720 | |
| 266,400 | 1 | Kenexa Corp.
| | | 4,456,872 | |
| 16,200 | | Kuehne & Nagel International AG
| | | 3,791,602 | |
| 200,000 | 1 | Landstar System, Inc.
| | | 7,704,000 | |
| 70,426 | 1 | Monster Worldwide, Inc.
| | | 2,310,677 | |
Shares
|
|
|
|
| Value
|
|
| | | COMMON STOCKS--continued | | | | |
| | | Industrials--continued | | | | |
| 235,800 | 1 | NuCo2, Inc.
| | $ | 5,399,820 | |
| 667,900 | 1 | Quality Distribution, Inc.
| | | 5,089,398 | |
| 32,800 | | Roper Industries, Inc.
| | | 1,236,560 | |
| 238,800 | | Ryder Systems, Inc.
| | | 9,473,196 | |
| 66,700 | | Simpson Manufacturing Co., Inc.
| | | 2,631,982 | |
| 144,400 | 1 | Taleo Corp., Class A
| | | 1,667,820 | |
| 208,288 | | Vicor Corp.
|
|
| 3,509,653
|
|
| | | TOTAL
|
|
| 143,388,943
|
|
| | | Information Technology--22.2% | | | | |
| 203,800 | | ARM Holdings PLC, ADR
| | | 1,171,850 | |
| 171,300 | | Adtran, Inc.
| | | 5,181,825 | |
| 12,900 | 1 | Advanced Analogic Technologies, Inc.
| | | 140,610 | |
| 64,600 | 1 | Blackboard Inc.
| | | 1,815,260 | |
| 72,000 | 1 | Business Objects SA, ADR
| | | 2,467,440 | |
| 1,322,100 | 1 | CSR PLC
| | | 16,841,714 | |
| 93,660 | 1 | Cabot Microelectronics Corp.
| | | 2,753,604 | |
| 360,000 | 1 | Cirrus Logic, Inc.
| | | 2,361,600 | |
| 87,252 | 1 | Cognos, Inc.
| | | 3,274,567 | |
| 130,400 | 1 | Dolby Laboratories, Class A
| | | 2,099,440 | |
| 144,449 | 1 | eCollege.com
| | | 2,298,183 | |
| 681,200 | 1 | EMCORE Corp.
| | | 3,773,848 | |
| 243,000 | 1 | Entegris, Inc.
| | | 2,371,680 | |
| 486,600 | 1 | Epicor Software Corp.
| | | 5,975,448 | |
| 105,552 | 1 | Filenet Corp.
| | | 2,971,289 | |
| 53,072 | 1 | Foundry Networks, Inc.
| | | 633,149 | |
| 119,000 | 1 | Fundtech Ltd.
| | | 1,192,380 | |
| 227,400 | 1 | Greenfield Online, Inc.
| | | 1,141,548 | |
| 54,000 | 1 | Hummingbird Communications Ltd.
| | | 1,195,560 | |
| 124,600 | 1 | Hyperion Solutions Corp.
| | | 6,025,656 | |
| 298,333 | 1 | Infocrossing, Inc.
| | | 2,061,481 | |
| 89,059 | 1 | Infocrossing, Inc., Warrants
| | | 140,216 | |
| 6,375 | 1 | Intrado, Inc.
| | | 123,293 | |
| 145,000 | 1 | Jamdat Mobile, Inc.
| | | 2,670,900 | |
| 199,900 | 1 | Jupitermedia Corp.
| | | 3,398,300 | |
| 161,500 | 1 | Komag, Inc.
| | | 4,331,430 | |
Shares
|
|
|
|
| Value
|
|
| | | COMMON STOCKS--continued | | | | |
| | | Information Technology--continued | | | | |
| 77,700 | 1 | M-Systems Flash Disk Pioneers Ltd.
| | $ | 2,462,313 | |
| 447,100 | 1 | MEMC Electronic Materials
| | | 8,020,974 | |
| 77,400 | 1 | MKS Instruments, Inc.
| | | 1,460,538 | |
| 260,802 | 1 | Magma Design Automation
| | | 2,263,761 | |
| 1,167,100 | 1 | Maxtor Corp.
| | | 4,084,850 | |
| 210,000 | 1 | Microsemi Corp.
| | | 4,865,700 | |
| 186,500 | 1 | Mobility Electronics, Inc.
| | | 1,684,095 | |
| 174,800 | 1 | Motive, Inc.
| | | 636,272 | |
| 68,000 | 1 | NAVTEQ Corp.
| | | 2,660,160 | |
| 57,800 | 1 | NCI, Inc.
| | | 699,380 | |
| 298,142 | 1 | NIC, Inc.
| | | 1,803,759 | |
| 114,500 | 1 | NetIQ Corp.
| | | 1,372,855 | |
| 399,659 | 1 | Online Resources Corp.
| | | 4,795,908 | |
| 45,000 | 1,2 | Online Resources Corp.
| | | 540,000 | |
| 286,800 | 1 | Onvia.com, Inc.
| | | 1,520,040 | |
| 266,880 | 1 | Pervasive Software, Inc.
| | | 1,120,896 | |
| 352,400 | 1 | PowerDsine Ltd.
| | | 3,361,896 | |
| 185,200 | 1 | Quest Software, Inc.
| | | 2,576,132 | |
| 181,100 | 1 | S1 Corp.
| | | 795,029 | |
| 9,602,000 | 1 | SIM Technology Group Ltd.
| | | 1,684,540 | |
| 67,800 | 1 | SSA Global Technologies, Inc.
| | | 1,061,070 | |
| 69,100 | | SS&C Technologies, Inc.
| | | 2,476,544 | |
| 81,712 | 1 | Sigmatel Inc.
| | | 1,112,100 | |
| 120,400 | 1 | Support.com, Inc.
| | | 482,804 | |
| 64,600 | 1 | TNS, Inc.
| | | 1,135,668 | |
| 313,700 | 1 | Ultratech Stepper, Inc.
| | | 4,322,786 | |
| 144,228 | 1 | ValueClick, Inc.
| | | 2,523,990 | |
| 613,650 | 1 | Visual Networks, Inc.
| | | 767,063 | |
| 70,500 | 1 | WebSideStory, Inc.
| | | 1,225,995 | |
| 20,800 | 1 | Xyratex Ltd.
|
|
| 281,632
|
|
| | | TOTAL
|
|
| 142,211,021
|
|
Shares or
Principal
Amount
|
|
|
|
| Value
|
|
| | | COMMON STOCKS--continued | | | | |
| | | Telecommunication Services--0.7% | | | | |
| 28,400 | 1 | NeuStar, Inc., Class A
| | $ | 869,040 | |
| 415,100 | 1 | Time Warner Telecom, Inc.
|
|
| 3,478,538
|
|
| | | TOTAL
|
|
| 4,347,578
|
|
| | | Utilities--0.1% | | | | |
| 39,400 | | Consolidated Water Co.
|
|
| 726,536
|
|
| | | TOTAL COMMON STOCKS (IDENTIFIED COST $544,513,084)
|
|
| 635,974,981
|
|
| | | PREFERRED STOCKS--0.0% | | | | |
| | | Consumer Discretionary--0.0% | | | | |
| 23,626 | | Knology, Inc. (IDENTIFIED COST $236,260)
|
|
| 224,447
|
|
| | | REPURCHASE AGREEMENT--1.7% | | | | |
| $ | 11,114,000 | | Interest in $3,500,000,000 joint repurchase agreement 4.04%, dated 10/31/2005 under which Bank of America N.A. will repurchase a U.S. Government Agency security with a maturity of 7/1/2035 for $3,500,392,778 on 11/1/2005. The market value of the underlying security at the end of the period was $3,570,000,001.
(AT AMORTIZED COST)
|
|
| 11,114,000
|
|
| | | TOTAL INVESTMENTS--100.9%
(IDENTIFIED COST $555,863,344) 3
|
|
| 647,313,428
|
|
| | | OTHER ASSETS AND LIABILITIES - NET--(0.9)%
|
|
| (6,245,467
| )
|
| | | TOTAL NET ASSETS--100%
|
| $
| 641,067,961
|
|
1 Non-income producing security.
2 Denotes a restricted security, including securities purchased under Rule 144A of the Securities Act of 1933. These securities, all of which have been deemed liquid by criteria approved by the Fund's Board of Trustees, unless registered under the Act or exempted from registration, may only be sold to qualified institutional investors. At October 31, 2005, these securities amounted to $3,093,849 which represents 0.5% of total net assets.
3 The cost of investments for federal tax purposes amounts to $557,804,656.
Note: The categories of investments are shown as a percentage of total net assets at October 31, 2005.
The following acronym is used throughout this portfolio:
| ADR | - --American Depositary Receipt |
See Notes which are an integral part of the Financial Statements
Statement of Assets and Liabilities
October 31, 2005
Assets:
| | | | | | | |
Total investments in securities, at value (identified cost $555,863,344)
| | | | | $ | 647,313,428 | |
Cash
| | | | | | 22,855 | |
Cash denominated in foreign currencies (identified cost $11,017)
| | | | | | 10,947 | |
Income receivable
| | | | | | 54,994 | |
Receivable for investments sold
| | | | | | 4,529,943 | |
Receivable for shares sold
|
|
|
|
|
| 2,460,442
|
|
TOTAL ASSETS
|
|
|
|
|
| 654,392,609
|
|
Liabilities:
| | | | | | | |
Payable for investments purchased
| | $ | 11,682,362 | | | | |
Payable for shares redeemed
| | | 835,765 | | | | |
Payable for distribution services fee (Note 5)
| | | 234,521 | | | | |
Payable for shareholder services fee (Note 5)
| | | 133,802 | | | | |
Accrued expenses
|
|
| 438,198
|
|
|
|
|
TOTAL LIABILITIES
|
|
|
|
|
| 13,324,648
|
|
Net assets for 31,292,825 shares outstanding
|
|
|
|
| $
| 641,067,961
|
|
Net Assets Consist of:
| | | | | | | |
Paid-in capital
| | | | | $ | 541,406,111 | |
Net unrealized appreciation of investments and translation of assets and
liabilities in foreign currency
| |
| | | | 91,449,581 | |
Accumulated net realized gain on investments and foreign currency transactions
| | | | | | 9,280,890 | |
Accumulated net investment income (loss)
|
|
|
|
|
| (1,068,621
| )
|
TOTAL NET ASSETS
|
|
|
|
| $
| 641,067,961
|
|
Net Asset Value, Offering Price and Redemption Proceeds Per Share
| | | | | | | |
Class A Shares:
| | | | | | | |
Net asset value per share ($371,091,883 ÷ 18,013,276 shares outstanding), no par value, unlimited shares authorized
|
|
|
|
|
| $20.60
|
|
Offering price per share (100/94.50 of $20.60) 1
|
|
|
|
|
| $21.80
|
|
Redemption proceeds per share
|
|
|
|
|
| $20.60
|
|
Class B Shares:
| | | | | | | |
Net asset value per share ($117,743,749 ÷ 5,790,940 shares outstanding), no par value, unlimited shares authorized
|
|
|
|
|
| $20.33
|
|
Offering price per share
|
|
|
|
|
| $20.33
|
|
Redemption proceeds per share (94.50/100 of $20.33) 1
|
|
|
|
|
| $19.21
|
|
Class C Shares:
| | | | | | | |
Net asset value per share ($152,232,329 ÷ 7,488,609 shares outstanding), no par value, unlimited shares authorized
|
|
|
|
|
| $20.33
|
|
Offering price per share (100/99.00 of $20.33) 1
|
|
|
|
|
| $20.54
|
|
Redemption proceeds per share (99.00/100 of $20.33) 1
|
|
|
|
|
| $20.13
|
|
1 See "What Do Shares Cost?" in the Prospectus.
See Notes which are an integral part of the Financial Statements
Statement of Operations
Year Ended October 31, 2005
Investment Income:
| | | | | | | | ' | | | | |
Dividends (including $2,808 received from affiliated issuers (Note 5) and net of foreign taxes withheld of $7,729)
| | | | | | | | | | $ | 795,895 | |
Interest
|
|
|
|
|
|
|
|
|
|
| 503,621
|
|
TOTAL INCOME
|
|
|
|
|
|
|
|
|
|
| 1,299,516
|
|
Expenses:
| | | | | | | | | | | | |
Investment adviser fee (Note 5)
| | | | | | $ | 8,192,334 | | | | | |
Administrative personnel and services fee (Note 5)
| | | | | | | 460,490 | | | | | |
Custodian fees
| | | | | | | 32,996 | | | | | |
Transfer and dividend disbursing agent fees and expenses
| | | | | | | 921,900 | | | | | |
Directors'/Trustees' fees
| | | | | | | 4,995 | | | | | |
Auditing fees
| | | | | | | 51,471 | | | | | |
Legal fees
| | | | | | | 10,154 | | | | | |
Portfolio accounting fees
| | | | | | | 127,875 | | | | | |
Distribution services fee--Class A Shares (Note 5)
| | | | | | | 821,914 | | | | | |
Distribution services fee--Class B Shares (Note 5)
| | | | | | | 837,671 | | | | | |
Distribution services fee--Class C Shares (Note 5)
| | | | | | | 1,008,342 | | | | | |
Shareholder services fee--Class A Shares (Note 5)
| | | | | | | 817,292 | | | | | |
Shareholder services fee--Class B Shares (Note 5)
| | | | | | | 279,224 | | | | | |
Shareholder services fee--Class C Shares (Note 5)
| | | | | | | 335,715 | | | | | |
Share registration costs
| | | | | | | 111,791 | | | | | |
Printing and postage
| | | | | | | 53,530 | | | | | |
Insurance premiums
| | | | | | | 10,442 | | | | | |
Interest Expense
| | | | | | | 8,071 | | | | | |
Miscellaneous
|
|
|
|
|
|
| 3,536
|
|
|
|
|
|
TOTAL EXPENSES
|
|
|
|
|
|
| 14,089,743
|
|
|
|
|
|
Waivers and Reimbursements (Note 5):
| | | | | | | | | | | | |
Waiver/reimbursement of investment adviser fee
| | $ | (1,307,420 | ) | | | | | | | | |
Waiver of administrative personnel and services fee
| | | (22,416 | ) | | | | | | | | |
Waiver of distribution services fee--Class A Shares
| | | (158,039 | ) | | | | | | | | |
Waiver of shareholder services fee--Class A Shares
| | | (3,764 | ) | | | | | | | | |
Reimbursement of shareholder services fee--Class A Shares
|
|
| (8,464
| )
|
|
|
|
|
|
|
|
|
TOTAL WAIVERS AND REIMBURSEMENTS
|
|
|
|
|
|
| (1,500,103
| )
|
|
|
|
|
Net expenses
|
|
|
|
|
|
|
|
|
|
| 12,589,640
|
|
Net investment income (loss)
|
|
|
|
|
|
|
|
|
|
| (11,290,124
| )
|
Realized and Unrealized Gain on Investments and Foreign Currency Transactions:
| | | | | | | | | | | | |
Net realized gain on investments and foreign currency transactions (net of foreign taxes withheld of $88,355)
| | | | | | | | | | | 20,447,430 | |
Net change in unrealized appreciation of investments and translation of assets and liabilities in foreign currency
|
|
|
|
|
|
|
|
|
|
| 46,403,478
|
|
Net realized and unrealized gain on investments and foreign currency transactions
|
|
|
|
|
|
|
|
|
|
| 66,850,908
|
|
Change in net assets resulting from operations
|
|
|
|
|
|
|
|
|
| $
| 55,560,784
|
|
See Notes which are an integral part of the Financial Statements
Statement of Changes in Net Assets
Year Ended October 31
|
|
| 2005
|
|
|
| 2004
|
|
Increase (Decrease) in Net Assets
| | | | | | | | |
Operations:
| | | | | | | | |
Net investment income (loss)
| | $ | (11,290,124 | ) | | $ | (6,460,798 | ) |
Net realized gain on investments and foreign currency transactions
| | | 20,447,430 | | | | 29,801,195 | |
Net change in unrealized appreciation/depreciation of investments and translation of assets and liabilities in foreign currency
|
|
| 46,403,478
|
|
|
| 14,366,268
|
|
CHANGE IN NET ASSETS RESULTING FROM OPERATIONS
|
|
| 55,560,784
|
|
|
| 37,706,665
|
|
Distributions to Shareholders:
| | | | | | | | |
Distributions from net realized gains on investments and foreign currency transactions
| | | | | | | | |
Class A Shares
| | | (13,099,914 | ) | | | (1,808,137 | ) |
Class B Shares
| | | (5,217,982 | ) | | | (675,185 | ) |
Class C Shares
|
|
| (5,922,027
| )
|
|
| (775,015
| )
|
CHANGE IN NET ASSETS RESULTING FROM DISTRIBUTIONS TO SHAREHOLDERS
|
|
| (24,239,923
| )
|
|
| (3,258,337
| )
|
Share Transactions:
| | | | | | | | |
Proceeds from sale of shares
| | | 358,564,556 | | | | 302,826,615 | |
Net asset value of shares issued to shareholders in payment of distributions declared
| | | 20,393,809 | | | | 2,672,605 | |
Cost of shares redeemed
|
|
| (174,331,644
| )
|
|
| (147,038,105
| )
|
CHANGE IN NET ASSETS RESULTING FROM SHARE TRANSACTIONS
|
|
| 204,626,721
|
|
|
| 158,461,115
|
|
Change in net assets
|
|
| 235,947,582
|
|
|
| 192,909,443
|
|
Net Assets:
| | | | | | | | |
Beginning of period
|
|
| 405,120,379
|
|
|
| 212,210,936
|
|
End of period (including accumulated net investment income (loss) of $(1,068,621) and $(6,626), respectively)
|
| $
| 641,067,961
|
|
| $
| 405,120,379
|
|
See Notes which are an integral part of the Financial Statements
Notes to Financial Statements
October 31, 2005
1. ORGANIZATION
Federated Equity Funds (the "Trust") is registered under the Investment Company Act of 1940, as amended (the "Act"), as an open-end management investment company. The Trust consists of eight portfolios. The financial statements included herein are only those of Federated Kaufmann Small Cap Fund (the "Fund") a diversified portfolio. The financial statements of the other portfolios are presented separately. The assets of each portfolio are segregated and a shareholder's interest is limited to the portfolio in which shares are held. The Fund offers three classes of shares: Class A Shares, Class B Shares and Class C Shares. All shares of the Fund have equal rights with respect to voting, except on class-specific matters. The primary investment objective of the Fund is appreciation of capital.
2. SIGNIFICANT ACCOUNTING POLICIES
The following is a summary of significant accounting policies consistently followed by the Fund in the preparation of its financial statements. These policies are in conformity with generally accepted accounting principles (GAAP) in the United States of America.
Investment Valuation
Domestic and foreign equity securities are valued at the last sale price or official closing price reported in the market in which they are primarily traded (either a national securities exchange or the over-the-counter market), if available. If unavailable, the security is generally valued at the mean between the last closing bid and asked prices. With respect to valuation of foreign securities, trading in foreign cities may be completed at times which vary from the closing of the New York Stock Exchange (NYSE). Therefore, foreign securities are valued at the latest closing price on the exchange on which they are traded immediately prior to the closing of the NYSE. Foreign securities quoted in foreign currencies are translated in U.S. dollars at the foreign exchange rate in effect at 4:00 p.m., Eastern Time, on the day the value of the foreign security is determined. The Fund generally values fixed income and short-term securities according to prices furnished by an independent pricing service, except that short-term securities with remaining maturities of less than 60 days at the time of purchase may be valued at amortized cost. For other fixed-income securities, prices furnished by an independent pricing service are intended to be indicative of the mean between the bid and asked prices currently offered to institutional investors for the securities. Prices furnished by an independent pricing service are intended to be indicative of the mean between the bid and asked prices currently offered to institutional investors for the securities. Investments in other open-end regulated investment companies are valued at net asset value. Securities for which no quotations are readily available or whose values have been affected by a significant event occurring between the close of their primary markets and the closing of the NYSE are valued at fair value as determined in accordance with procedures established by and under general supervision of the Board of Trustees (the "Trustees").
Repurchase Agreements
It is the policy of the Fund to require the custodian bank to take possession, to have legally segregated in the Federal Reserve Book Entry System, or to have segregated within the custodian bank's vault, all securities held as collateral under repurchase agreement transactions. Additionally, procedures have been established by the Fund to monitor, on a daily basis, the market value of each repurchase agreement's collateral to ensure that the value of the collateral at least equals the repurchase price to be paid under the repurchase agreement.
The Fund will only enter into repurchase agreements with banks and other recognized financial institutions, such as broker/dealers, which are deemed by the Fund's adviser to be creditworthy pursuant to the guidelines and/or standards reviewed or established by the Trustees. Risks may arise from the potential inability of counterparties to honor the terms of the repurchase agreement. The Fund, along with other affiliated investment companies, may utilize a joint trading account for the purpose of entering into one or more repurchase agreements.
Investment Income, Gains and Losses, Expenses and Distributions
Interest income and expenses are accrued daily. Dividend income and distributions to shareholders are recorded on the ex-dividend date. Distributions of net investment income are declared and paid annually. Non-cash dividends included in dividend income, if any, are recorded at fair value. Investment income, realized and unrealized gains and losses, and certain fund-level expenses are allocated to each class based on relative average daily net assets, except that each class bears certain expenses unique to that class such as distribution and shareholder services fees. Dividends are declared separately for each class. No class has preferential dividend rights; differences in per share dividend rates are generally due to differences in separate class expenses.
Premium and Discount Amortization
All premiums and discounts on fixed-income securities are amortized/accreted.
Federal Taxes
It is the Fund's policy to comply with the Subchapter M provision of the Internal Revenue Code (the "Code") and to distribute to shareholders each year substantially all of its income. Accordingly, no provision for federal income tax is necessary.
Withholding taxes, and where appropriate, deferred withholding taxes, on foreign interest, dividends and capital gains have been provided for in accordance with the applicable country's tax rules and rates.
When-Issued and Delayed Delivery Transactions
The Fund may engage in when-issued or delayed delivery transactions. The Fund records when-issued securities on the trade date and maintains security positions such that sufficient liquid assets will be available to make payment for the securities purchased. Securities purchased on a when-issued or delayed delivery basis are marked to market daily and begin earning interest on the settlement date. Losses may occur on these transactions due to changes in market conditions or the failure of counterparties to perform under the contract.
Foreign Exchange Contracts
The Fund may enter into foreign currency commitments for the delayed delivery of securities or foreign currency exchange transactions. The Fund may enter into foreign currency contract transactions to protect assets against adverse changes in foreign currency exchange rates or exchange control regulations. Purchased contracts are used to acquire exposure to foreign currencies; whereas, contracts to sell are used to hedge the Fund's securities against currency fluctuations. Risks may arise upon entering these transactions from the potential inability of counterparties to meet the terms of their commitments and from unanticipated movements in security prices or foreign exchange rates. The foreign currency transactions are adjusted by the daily exchange rate of the underlying currency and any gains or losses are recorded for financial statement purposes as unrealized until the settlement date.
At October 31, 2005, the Fund had no outstanding foreign currency commitments.
Foreign Currency Translation
The accounting records of the Fund are maintained in U.S. dollars. All assets and liabilities denominated in foreign currencies (FCs) are translated into U.S. dollars based on the rates of exchange of such currencies against U.S. dollars on the date of valuation. Purchases and sales of securities, income and expenses are translated at the rate of exchange quoted on the respective date that such transactions are recorded. The Fund does not isolate that portion of the results of operations resulting from changes in foreign exchange rates on investments from the fluctuations arising from changes in market prices of securities held. Such fluctuations are included with the net realized and unrealized gain or loss from investments.
Reported net realized foreign exchange gains or losses arise from sales of portfolio securities, sales and maturities of short-term securities, sales of FCs, currency gains or losses realized between the trade and settlement dates on securities transactions, the difference between the amounts of dividends, interest and foreign withholding taxes recorded on the Fund's books, and the U.S. dollar equivalent of the amounts actually received or paid. Net unrealized foreign exchange gains and losses arise from changes in the value of assets and liabilities other than investments in securities at fiscal year end, resulting from changes in the exchange rate.
Restricted Securities
Restricted securities are securities that may only be resold upon registration under federal securities laws or in transactions exempt from such registration. In some cases, the issuer of restricted securities has agreed to register such securities for resale, at the issuer's expense either upon demand by the Fund or in connection with another registered offering of the securities. Many restricted securities may be resold in the secondary market in transactions exempt from registration. Such restricted securities may be determined to be liquid under criteria established by the Trustees. The Fund will not incur any registration costs upon such resales. The Fund's restricted securities are valued at the price provided by dealers in the secondary market or, if no market prices are available, at the fair value as determined in accordance with procedures established by and under general supervision of the Trustees.
Use of Estimates
The preparation of financial statements in conformity with GAAP requires management to make estimates and assumptions that affect the amounts of assets, liabilities, expenses and revenues reported in the financial statements. Actual results could differ from those estimated.
Other
Investment transactions are accounted for on a trade date basis. Realized gains and losses from investment transactions are recorded on an identified cost basis.
3. SHARES OF BENEFICIAL INTEREST
The following tables summarize share activity:
Year Ended October 31
|
| 2005
|
| 2004
|
Class A Shares:
|
| Shares
|
|
|
| Amount
|
|
| Shares
|
|
|
| Amount
|
|
Shares sold
| | 12,576,253 | | | $ | 252,717,292 | | | 10,018,883 | | | $ | 183,214,693 | |
Shares issued to shareholders in payment of distributions declared
|
| 558,182 | |
| | 10,901,287 |
|
|
84,607 |
|
| |
1,437,466 |
|
Shares redeemed
|
| (6,328,729
| )
|
|
| (127,488,883
| )
|
| (5,990,616
| )
|
|
| (108,147,571
| )
|
NET CHANGE RESULTING FROM CLASS A SHARE TRANSACTIONS
|
| 6,805,706
|
|
|
$
| 136,129,696
|
|
|
4,112,874
|
|
|
$
|
76,504,588
|
|
| | | | | | | | | | | | | | |
Year Ended October 31
|
| 2005
|
| 2004
|
Class B Shares:
|
| Shares
|
|
|
| Amount
|
|
| Shares
|
|
|
| Amount
|
|
Shares sold
| | 2,039,514 | | | $ | 40,864,120 | | | 2,969,353 | | | $ | 54,192,213 | |
Shares issued to shareholders in payment of distributions declared
|
| 235,510 | |
|
| 4,561,837 | |
|
34,604 |
|
|
|
586,541 |
|
Shares redeemed
|
| (1,073,199
| )
|
|
| (21,629,015
| )
|
| (961,187
| )
|
|
| (17,500,463
| )
|
NET CHANGE RESULTING FROM CLASS B SHARE TRANSACTIONS
|
| 1,201,825
|
|
|
$
| 23,796,942
|
|
|
2,042,770
|
|
|
$
|
37,278,291
|
|
| | | | | | | | | | | | | | |
Year Ended October 31
|
| 2005
|
| 2004
|
Class C Shares:
|
| Shares
|
|
|
| Amount
|
|
| Shares
|
|
|
| Amount
|
|
Shares sold
| | 3,226,561 | | | $ | 64,983,144 | | | 3,599,810 | | | $ | 65,419,709 | |
Shares issued to shareholders in payment of distributions declared
|
| 254,553 | |
|
| 4,930,685 | |
|
38,265 |
|
| |
648,598 |
|
Shares redeemed
|
| (1,258,382
| )
|
|
| (25,213,746
| )
|
| (1,171,866
| )
|
|
| (21,390,071
| )
|
NET CHANGE RESULTING FROM CLASS C SHARE TRANSACTIONS
|
| 2,222,732
|
|
|
$
| 44,700,083
|
|
|
2,466,209
|
|
|
$
|
44,678,236
|
|
NET CHANGE RESULTING FROM SHARE TRANSACTIONS
|
| 10,230,263
|
|
|
$
| 204,626,721
|
|
|
8,621,853
|
|
|
$
|
158,461,115
|
|
4. FEDERAL TAX INFORMATION
The timing and character of income and capital gain distributions are determined in accordance with income tax regulations, which may differ from GAAP. These differences are due in part to differing treatments for foreign currency transactions and net operating losses.
For the year ended October 31, 2005, permanent differences identified and reclassified among the components of net assets were as follows:
Increase (Decrease)
|
Undistributed
Net Investment
Income (Loss)
|
| Accumulated
Net Realized
Gains (Losses)
|
$10,228,129
|
| $(10,228,129)
|
Net investment income (loss), net realized gains (losses), and net assets were not affected by this reclassification.
The tax character of distributions as reported on the Statement of Changes in Net Assets for the years ended October 31, 2005, and 2004 was as follows:
|
| 2005
|
| 2004
|
Ordinary income 1
|
| $19,125,482
|
| $3,258,337
|
Long-term capital gains
|
| $ 5,114,441
|
| $--
|
1 For tax purposes short-term capital gain distributions are considered ordinary income distributions.
As of October 31, 2005, the components of distributable earnings on a tax basis were as follows:
Undistributed ordinary income
|
| $
| 5,216,344
|
Undistributed long-term capital gains
|
| $
| 5,025,585
|
Net unrealized appreciation
|
| $
| 89,508,269
|
The difference between book-basis and tax-basis net unrealized appreciation/depreciation is attributable in part to differing treatments for the deferral of losses on wash sales and the realization for tax purposes of unrealized gains on investments in passive foreign investment companies.
At October 31, 2005, the cost of investments for federal tax purposes was $557,804,656. The net unrealized appreciation of investments for federal tax purposes excluding any unrealized depreciation resulting from changes in foreign currency exchange rates was $89,508,772. This consists of net unrealized appreciation from investments for those securities having an excess of value over cost of $146,771,889 and net unrealized depreciation from investments for those securities having an excess of cost over value of $57,263,117.
5. INVESTMENT ADVISER FEE AND OTHER TRANSACTIONS WITH AFFILIATES
Investment Adviser Fee
Federated Equity Management Company of Pennsylvania, the Fund's investment adviser (the "Adviser"), receives for its services an annual investment adviser fee equal to 1.425% of the Fund's average daily net assets. The Adviser may voluntarily choose to waive any portion of its fee. The Adviser can modify or terminate this voluntary waiver at any time at its sole discretion. For the year ended October 31, 2005, the Adviser voluntarily waived $1,307,420 of its fee.
Pursuant to an Exemptive Order issued by the Securities and Exchange Commission, the Fund may invest in other funds which are managed by the Adviser or an affiliate of the Adviser. The Adviser has agreed to reimburse the Fund for certain investment adviser fees as a result of these transactions. Income distributions earned from investments in these funds are recorded as income in the accompanying financial statements and totaled $2,808 for the period.
Certain of the Fund's assets are managed by Federated Global Investment Management Corp. (the "Sub-Adviser"). Under the terms of a sub-adviser agreement between the Adviser and the Sub-Adviser, the Sub-Adviser receives an allocable portion of the Fund's adviser fee. The fee is paid by the Adviser out of its resources and is not an incremental Fund expense. For the year ended October 31, 2005, the Sub-Adviser earned a sub-adviser fee of $6,755,082.
Administrative Fee
Federated Administrative Services (FAS), under the Administrative Services Agreement, provides the Fund with administrative personnel and services. The fee paid to FAS is based on the average aggregate daily net assets of all Federated funds as specified below:
Maximum
Administrative Fee
|
| Average Aggregate Daily Net Assets
of the Federated Funds
|
0.150%
|
| on the first $5 billion
|
0.125%
|
| on the next $5 billion
|
0.100%
|
| on the next $10 billion
|
0.075%
|
| on assets in excess of $20 billion
|
The administrative fee received during any fiscal year shall be at least $150,000 per portfolio and $40,000 per each additional class of Shares. FAS may voluntarily choose to waive any portion of its fee. FAS can modify or terminate this voluntary waiver at any time at its sole discretion. For the year ended October 31, 2005, the net fee paid to FAS was 0.076% of average aggregate daily net assets of the Fund.
Distribution Services Fee
The Fund has adopted a Distribution Plan (the "Plan") pursuant to Rule 12b-1 under the Act. Under the terms of the Plan, the Fund will compensate Federated Securities Corp. (FSC), the principal distributor, from the daily net assets of the Fund's Class A Shares, Class B Shares and Class C Shares to finance activities intended to result in the sale of these shares. The Plan provides that the Fund may incur distribution expenses according to the following schedule annually, to compensate FSC:
Share Class Name
|
| Percentage of Average Daily
Net Assets of Class
|
Class A Shares
|
| 0.25%
|
Class B Shares
|
| 0.75%
|
Class C Shares
|
| 0.75%
|
FSC may voluntarily choose to waive any portion of its fee. FSC can modify or terminate this voluntary waiver at any time at its sole discretion. For the year ended October 31, 2005, FSC voluntarily waived $158,039 of its fee. Rather than paying financial intermediaries directly, the Fund may pay fees to FSC and FSC will use the fees to compensate financial intermediaries. For the year ended October 31, 2005, FSC retained $1,109,596 of fees paid by the Fund.
Sales Charges
For the year ended October 31, 2005, FSC retained $209,868 in sales charges from the sale of Class A Shares. FSC also retained $1,798 of contingent deferred sales charges relating to redemptions of Class A Shares and $11,308 relating to redemptions of Class C Shares. See "What Do Shares Cost?" in the Prospectus.
Shareholder Services Fee
The Fund may pay fees (Services Fees) up to 0.25% of the average daily net assets of the Fund's Class A Shares, Class B Shares, and Class C Shares to financial intermediaries or to Federated Shareholder Services Company (FSSC), a subsidiary of Federated Investors, Inc., for providing services to shareholders and maintaining shareholder accounts. Under certain agreements, rather than paying financial intermediaries directly, the Fund may pay Service Fees to FSSC and FSSC will use the fees to compensate financial intermediaries. FSSC or these financial intermediaries may voluntarily choose to waive any portion of their fee. This voluntary waiver can be modified or terminated at any time. For the year ended October 31, 2005, FSSC voluntarily waived $3,764 of its fee. For the year ended October 31, 2005, FSSC retained $33,252 of fees paid by the Fund.
General
Certain of the Officers and Trustees of the Trust are Officers and Directors or Trustees of the above companies.
6. INVESTMENT TRANSACTIONS
Purchases and sales of investments, excluding long-term U.S. government securities and short-term obligations, for the year ended October 31, 2005, were as follows:
Purchases
|
| $
| 410,411,904
|
Sales
|
| $
| 234,377,722
|
7. CONCENTRATION OF CREDIT RISK
The Fund may invest a portion of its assets in securities of companies that are deemed by the Fund's management to be classified in similar business sectors. The economic developments within a particular sector may have an adverse effect on the ability of issuers to meet their obligations. Additionally, economic developments may have an effect on the liquidity and volatility of the portfolio securities.
8. LEGAL PROCEEDINGS
Beginning in October 2003, Federated Investors, Inc. and various subsidiaries thereof (including the advisers and distributor for various investment companies, collectively, "Federated"), along with various investment companies sponsored by Federated ("Funds") were named as defendants in several class action lawsuits now pending in the United States District Court for the District of Maryland. The lawsuits were purportedly filed on behalf of people who purchased, owned and/or redeemed shares of Federated-sponsored mutual funds during specified periods beginning November 1, 1998. The suits are generally similar in alleging that Federated engaged in illegal and improper trading practices including market timing and late trading in concert with certain institutional traders, which allegedly caused financial injury to the mutual fund shareholders. These lawsuits began to be filed shortly after Federated's first public announcement that it had received requests for information on shareholder trading activities in the Funds from the Securities and Exchange Commission ("SEC"), the Office of the New York State Attorney General ("NYAG"), and other authorities. In that regard, on November 28, 2005, Federated announced that it had reached final settlements with the SEC and the NYAG with respect to those matters. As Federated previously reported in 2004, it has already paid approximately $8.0 million to certain funds as determined by an independent consultant. As part of these settlements, Federated agreed to pay for the benefit of fund shareholders additional disgorgement and a civil money penalty in the aggregate amount of an additional $72 million. Federated and various Funds have also been named as defendants in several additional lawsuits, the majority of which are now pending in the United States District Court for the Western District of Pennsylvania, alleging, among other things, excessive advisory and rule 12b-1 fees. The Board of the Funds has retained the law firm of Dickstein Shapiro Morin & Oshinsky LLP to represent the Funds in these lawsuits. Federated and the Funds, and their respective counsel, are reviewing the allegations and will respond appropriately. Additional lawsuits based upon similar allegations may be filed in the future. The potential impact of these lawsuits, all of which seek unquantified damages, attorneys' fees and expenses, and future potential similar suits is uncertain. Although we do not believe that these lawsuits will have a material adverse effect on the Funds, there can be no assurance that these suits, the ongoing adverse publicity and/or other developments resulting from the regulatory investigations will not result in increased Fund redemptions, reduced sales of Fund shares, or other adverse consequences for the Funds.
9. FEDERAL TAX INFORMATION (UNAUDITED)
For the year ended October 31, 2005, the amount of long-term capital gains designated by the Fund was $5,114,441.
For the fiscal year ended October 31, 2005, 27.33% of total ordinary income (including short-term capital gain) distributions made by the Fund are qualifying dividends which may be subject to a maximum tax rate of 15% as provided for by the Jobs and Growth Tax Relief Act of 2003. Complete information is reported in conjunction with the reporting of year distributions of form 1099-DIV.
10. SUBSEQUENT EVENT
On November 1, 2005, Class K Shares of the fund were declared effective by the Securities and Exchange Commission.
Report of Independent Registered Public Accounting Firm
TO THE BOARD OF TRUSTEES OF FEDERATED EQUITY FUNDS AND SHAREHOLDERS OF FEDERATED KAUFMANN SMALL CAP FUND:
We have audited the accompanying statement of assets and liabilities, including the portfolio of investments, of Federated Kaufmann Small Cap Fund (one of the portfolios constituting Federated Equity Funds), (the "Fund"), as of October 31, 2005, and the related statement of operations for the year then ended, the statement of changes in net assets for each of the two years in the period then ended and the financial highlights for each of the periods indicated therein. These financial statements and financial highlights are the responsibility of the Fund's management. Our responsibility is to express an opinion on these financial statements and financial highlights based on our audits.
We conducted our audits in accordance with the standards of the Public Company Accounting Oversight Board (United States). Those standards require that we plan and perform the audit to obtain reasonable assurance about whether the financial statements and financial highlights are free of material misstatement. We were not engaged to perform an audit of the Fund's internal control over financial reporting. Our audits included consideration of internal control over financial reporting as a basis for designing audit procedures that are appropriate in the circumstances, but not for the purpose of expressing an opinion on the effectiveness of the Fund's internal control over financial reporting. Accordingly, we express no such opinion. An audit also includes examining, on a test basis, evidence supporting the amounts and disclosures in the financial statements and financial highlights, assessing the accounting principles used and significant estimates made by management, and evaluating the overall financial statement presentation. Our procedures included confirmation of securities owned as of October 31, 2005, by correspondence with the custodian and brokers, or by other appropriate auditing procedures where replies from brokers were not received. We believe that our audits provide a reasonable basis for our opinion.
In our opinion, the financial statements and financial highlights referred to above present fairly, in all material respects, the financial position of the Federated Kaufmann Small Cap Fund, a portfolio of Federated Equity Funds at October 31, 2005, the results of its operations for the year then ended, the changes in its net assets for each of the two years in the period then ended and the financial highlights for each of the periods indicated therein, in conformity with U.S. generally accepted accounting principles.
Ernst & Young LLP
Boston, Massachusetts
December 12, 2005
Board of Trustees and Trust Officers
The Board is responsible for managing the Trust's business affairs and for exercising all the Trust's powers except those reserved for the shareholders. The following tables give information about each Board member and the senior officers of the Fund. Where required, the tables separately list Board members who are "interested persons" of the Fund (i.e., "Interested" Board members) and those who are not (i.e., "Independent" Board members). Unless otherwise noted, the address of each person listed is Federated Investors Tower, 1001 Liberty Avenue, Pittsburgh, PA. As of December 31, 2004, the Trust comprised eight portfolios, and the Federated Fund Complex consisted of 44 investment companies (comprising 133 portfolios). Unless otherwise noted, each Officer is elected annually. Unless otherwise noted, each Board member oversees all portfolios in the Federated Fund Complex and serves for an indefinite term. The Fund's Statement of Additional Information includes additional information about Trust Trustees and is available, without charge and upon request, by calling 1-800-341-7400.
INTERESTED TRUSTEES BACKGROUND
|
|
|
Name
Birth Date
Address
Positions Held with Trust
Date Service Began
|
| Principal Occupation(s) for Past Five Years,
Other Directorships Held and Previous Position(s)
|
John F. Donahue*
Birth Date: July 28, 1924
CHAIRMAN AND TRUSTEE
Began serving: April 1984 | | Principal Occupations : Chairman and Director or Trustee of the Federated Fund Complex; Chairman and Director, Federated Investors, Inc.
Previous Positions : Trustee, Federated Investment Management Company and Chairman and Director, Federated Investment Counseling. |
|
|
|
J. Christopher Donahue*
Birth Date: April 11, 1949
PRESIDENT AND TRUSTEE
Began serving: January 2000 | | Principal Occupations : Principal Executive Officer and President of the Federated Fund Complex; Director or Trustee of some of the Funds in the Federated Fund Complex; President, Chief Executive Officer and Director, Federated Investors, Inc.; Chairman and Trustee, Federated Investment Management Company; Trustee, Federated Investment Counseling; Chairman and Director, Federated Global Investment Management Corp.; Chairman, Passport Research, Ltd.; Trustee, Federated Shareholder Services Company; Director, Federated Services Company.
Previous Positions : President, Federated Investment Counseling; President and Chief Executive Officer, Federated Investment Management Company, Federated Global Investment Management Corp. and Passport Research, Ltd. |
|
|
|
|
|
|
Name
Birth Date
Address
Positions Held with Trust
Date Service Began
|
| Principal Occupation(s) for Past Five Years,
Other Directorships Held and Previous Position(s)
|
Lawrence D. Ellis, M.D.*
Birth Date: October 11, 1932
3471 Fifth Avenue
Suite 1111
Pittsburgh, PA
TRUSTEE
Began serving: August 1987 | | Principal Occupations : Director or Trustee of the Federated Fund Complex; Professor of Medicine, University of Pittsburgh; Medical Director, University of Pittsburgh Medical Center Downtown; Hematologist, Oncologist and Internist, University of Pittsburgh Medical Center.
Other Directorships Held : Member, National Board of Trustees, Leukemia Society of America.
Previous Positions : Trustee, University of Pittsburgh; Director, University of Pittsburgh Medical Center. |
|
|
|
* Family relationships and reasons for "interested" status: John F. Donahue is the father of J. Christopher Donahue; both are "interested" due to the positions they hold with Federated Investors, Inc. and its subsidiaries. Lawrence D. Ellis, M.D. is "interested" because his son-in-law is employed by the Fund's principal underwriter, Federated Securities Corp.
INDEPENDENT TRUSTEES BACKGROUND
|
|
|
Name
Birth Date
Address
Positions Held with Trust
Date Service Began
|
| Principal Occupation(s) for Past Five Years,
Other Directorships Held and Previous Position(s)
|
Thomas G. Bigley
Birth Date: February 3, 1934
15 Old Timber Trail
Pittsburgh, PA
TRUSTEE
Began serving: October 1995 | | Principal Occupation : Director or Trustee of the Federated Fund Complex.
Other Directorships Held : Director, Member of Executive Committee, Children's Hospital of Pittsburgh; Director, University of Pittsburgh.
Previous Position : Senior Partner, Ernst & Young LLP. |
|
|
|
John T. Conroy, Jr.
Birth Date: June 23, 1937
Investment Properties Corporation
3838 North Tamiami Trail
Suite 402
Naples, FL
TRUSTEE
Began serving: November 1991 | | Principal Occupations : Director or Trustee of the Federated Fund Complex; Chairman of the Board, Investment Properties Corporation; Partner or Trustee in private real estate ventures in Southwest Florida.
Previous Positions : President, Investment Properties Corporation; Senior Vice President, John R. Wood and Associates, Inc., Realtors; President, Naples Property Management, Inc. and Northgate Village Development Corporation. |
|
|
|
Nicholas P. Constantakis
Birth Date: September 3, 1939
175 Woodshire Drive
Pittsburgh, PA
TRUSTEE
Began serving: February 1998 | | Principal Occupations : Director or Trustee of the Federated Fund Complex.
Other Directorships Held : Director and Member of the Audit Committee, Michael Baker Corporation (engineering and energy services worldwide).
Previous Position : Partner, Andersen Worldwide SC. |
|
|
|
|
|
|
Name
Birth Date
Address
Positions Held with Trust
Date Service Began
|
| Principal Occupation(s) for Past Five Years,
Other Directorships Held and Previous Position(s)
|
John F. Cunningham
Birth Date: March 5, 1943
353 El Brillo Way
Palm Beach, FL
TRUSTEE
Began serving: January 1999 | | Principal Occupation : Director or Trustee of the Federated Fund Complex.
Other Directorships Held : Chairman, President and Chief Executive Officer, Cunningham & Co., Inc. (strategic business consulting); Trustee Associate, Boston College.
Previous Positions : Director, Redgate Communications and EMC Corporation (computer storage systems); Chairman of the Board and Chief Executive Officer, Computer Consoles, Inc.; President and Chief Operating Officer, Wang Laboratories; Director, First National Bank of Boston; Director, Apollo Computer, Inc. |
|
|
|
Peter E. Madden
Birth Date: March 16, 1942
One Royal Palm Way
100 Royal Palm Way
Palm Beach, FL
TRUSTEE
Began serving: November 1991 | | Principal Occupation : Director or Trustee of the Federated Fund Complex.
Other Directorships Held : Board of Overseers, Babson College.
Previous Positions : Representative, Commonwealth of Massachusetts General Court; President, State Street Bank and Trust Company and State Street Corporation (retired); Director, VISA USA and VISA International; Chairman and Director, Massachusetts Bankers Association; Director, Depository Trust Corporation; Director, The Boston Stock Exchange. |
|
|
|
Charles F. Mansfield, Jr.
Birth Date: April 10, 1945
80 South Road
Westhampton Beach, NY
TRUSTEE
Began serving: January 1999 | | Principal Occupations : Director or Trustee of the Federated Fund Complex; Management Consultant; Executive Vice President, DVC Group, Inc. (marketing communications and technology) (prior to 9/1/00).
Previous Positions : Chief Executive Officer, PBTC International Bank; Partner, Arthur Young & Company (now Ernst & Young LLP); Chief Financial Officer of Retail Banking Sector, Chase Manhattan Bank; Senior Vice President, HSBC Bank USA (formerly, Marine Midland Bank); Vice President, Citibank; Assistant Professor of Banking and Finance, Frank G. Zarb School of Business, Hofstra University. |
|
|
|
John E. Murray, Jr., J.D., S.J.D.
Birth Date: December 20, 1932
Chancellor, Duquesne University
Pittsburgh, PA
TRUSTEE
Began serving: February 1995 | | Principal Occupations : Director or Trustee of the Federated Fund Complex; Chancellor and Law Professor, Duquesne University; Partner, Murray, Hogue and Lannis.
Other Directorships Held : Director, Michael Baker Corp. (engineering, construction, operations and technical services).
Previous Positions : President, Duquesne University; Dean and Professor of Law, University of Pittsburgh School of Law; Dean and Professor of Law, Villanova University School of Law. |
|
|
|
|
|
|
Name
Birth Date
Address
Positions Held with Trust
Date Service Began
|
| Principal Occupation(s) for Past Five Years,
Other Directorships Held and Previous Position(s)
|
Marjorie P. Smuts
Birth Date: June 21, 1935
4905 Bayard Street
Pittsburgh, PA
TRUSTEE
Began serving: April 1984 | | Principal Occupations : Director or Trustee of the Federated Fund Complex; Public Relations/Marketing Consultant/Conference Coordinator.
Previous Positions : National Spokesperson, Aluminum Company of America; television producer; President, Marj Palmer Assoc.; Owner, Scandia Bord. |
|
|
|
John S. Walsh
Birth Date: November 28, 1957
2604 William Drive
Valparaiso, IN
TRUSTEE
Began serving: January 1999 | | Principal Occupations : Director or Trustee of the Federated Fund Complex; President and Director, Heat Wagon, Inc. (manufacturer of construction temporary heaters); President and Director, Manufacturers Products, Inc. (distributor of portable construction heaters); President, Portable Heater Parts, a division of Manufacturers Products, Inc.
Previous Position : Vice President, Walsh & Kelly, Inc. |
|
|
|
OFFICERS
|
|
|
Name
Birth Date
Positions Held with Trust
Date Service Began
|
| Principal Occupation(s) for Past Five Years and Previous Position(s)
|
John W. McGonigle
Birth Date: October 26, 1938
EXECUTIVE VICE PRESIDENT
AND SECRETARY
Began serving: April 1984 | | Principal Occupations : Executive Vice President and Secretary of the Federated Fund Complex; Vice Chairman, Executive Vice President, Secretary and Director, Federated Investors, Inc.
Previous Positions : Trustee, Federated Investment Management Company and Federated Investment Counseling; Director, Federated Global Investment Management Corp., Federated Services Company and Federated Securities Corp. |
|
|
|
Richard J. Thomas
Birth Date: June 17, 1954
TREASURER
Began serving: November 1998 | | Principal Occupations : Principal Financial Officer and Treasurer of the Federated Fund Complex; Senior Vice President, Federated Administrative Services.
Previous Positions : Vice President, Federated Administrative Services; held various management positions within Funds Financial Services Division of Federated Investors, Inc. |
|
|
|
Richard B. Fisher
Birth Date: May 17, 1923
VICE PRESIDENT
Began serving: April 1984 | | Principal Occupations : Vice Chairman or Vice President of some of the Funds in the Federated Fund Complex; Vice Chairman, Federated Investors, Inc.; Chairman, Federated Securities Corp.
Previous Positions : President and Director or Trustee of some of the Funds in the Federated Fund Complex; Executive Vice President, Federated Investors, Inc. and Director and Chief Executive Officer, Federated Securities Corp. |
|
|
|
|
|
|
Name
Birth Date
Positions Held with Trust
Date Service Began
|
| Principal Occupation(s) for Past Five Years and Previous Position(s)
|
Stephen F. Auth
Birth Date: September 3, 1956
CHIEF INVESTMENT OFFICER
Began serving: November 2002 | | Principal Occupations : Chief Investment Officer of this Fund and various other Funds in the Federated Fund Complex; Executive Vice President, Federated Investment Counseling, Federated Global Investment Management Corp., Federated Equity Management Company of Pennsylvania and Passport Research II, Ltd.
Previous Positions : Executive Vice President, Federated Investment Management Company, and Passport Research, Ltd.; Senior Vice President, Global Portfolio Management Services Division; Senior Vice President, Federated Investment Management Company and Passport Research, Ltd.; Senior Managing Director and Portfolio Manager, Prudential Investments. |
|
|
|
Lawrence Auriana
Birth Date: January 8, 1944
VICE PRESIDENT
Began serving: November 2001 | | Lawrence Auriana has been the Fund's Portfolio Manager since December 2002. He is Vice President of the Trust. Mr. Auriana joined Federated in April 2001 as Co-Head of Investments/Federated Kaufmann. From August 1984 to April 2001, Mr. Auriana was President and Treasurer of Edgemont Asset Management Corp., and Chairman of the Board and Portfolio Manager to The Kaufmann Fund, Inc. (predecessor to the Federated Kaufmann Fund). Mr. Auriana earned a B.S. in economics from Fordham University and has been engaged in the securities business since 1965. |
|
|
|
James E. Grefenstette
Birth Date: November 7, 1962
VICE PRESIDENT
Began serving: November 1998 | | James E. Grefenstette is Vice President of the Trust. Mr. Grefenstette joined Federated in 1992 and has been a Portfolio Manager since 1994. Mr. Grefenstette became a Senior Vice President of the Fund's Adviser in January 2000. He served as a Vice President of the Fund's Adviser from 1996 through 1999 and was an Assistant Vice President of the Fund's Adviser from 1994 until 1996. Mr. Grefenstette is a Chartered Financial Analyst; he received his M.S. in Industrial Administration from Carnegie Mellon University. |
|
|
|
Hans P. Utsch
Birth Date: July 3, 1936
VICE PRESIDENT
Began serving: November 2001 | | Hans P. Utsch has been the Fund's Portfolio Manager since December 2002. He is Vice President of the Trust. Mr. Utsch joined Federated in April 2001 as Co-Head of Investments/Federated Kaufmann. From August 1984 to April 2001, Mr. Utsch was Chairman of the Board and Secretary of Edgemont Asset Management Corp., and President and Portfolio Manager to The Kaufmann Fund, Inc. (predecessor to the Federated Kaufmann Fund). Mr. Utsch graduated from Amherst College and holds an M.B.A. from Columbia University. He has been engaged in the securities business since 1962. |
|
|
|
Board Review of Advisory Contract
As required by the Act, the Fund's Board has reviewed the Fund's investment advisory contract and subadvisory contracts. The Board's decision to approve these contracts reflects the exercise of its business judgment on whether to continue the existing arrangements. During its review of these contracts, the Board considers many factors, among the most material of which are: the Fund's investment objectives; the Adviser's and subadviser's management philosophy, personnel, processes, and investment and operating strategies; long-term performance; the preferences and expectations of Fund shareholders and their relative sophistication; the continuing state of competition in the mutual fund industry; the range of comparable fees for similar funds in the mutual fund industry; the range and quality of services provided to the Fund and its shareholders by the Federated organization in addition to investment advisory services; and the Fund's relationship to the Federated family of funds which include a comprehensive array of funds with different investment objectives, policies and strategies which are available for exchange without the incurrence of additional sales charge.
In its decision to appoint or renew an Adviser, the Board is mindful of the potential disruptions of the Fund's operations and various risks, uncertainties and other effects that could occur as a result of a decision to terminate or not renew an advisory contract. In particular, the Board recognizes that most shareholders have invested in the Fund on the strength of the Adviser's industry standing and reputation and in the expectation that the Adviser will have a continuing role in providing advisory services to the Fund. Thus, the Board's "selection" or approval of the Adviser must reflect the fact that it is the shareholders who have effectively selected the Adviser by virtue of having invested in the Fund. The Board also considers the compensation and benefits received by the Adviser and subadviser. This includes fees received for services provided to the Fund by other entities in the Federated organization and research services received by the Adviser from brokers that execute fund trades, as well as advisory fees. In this regard, the Board is aware that various courts have interpreted provisions of the Act and have indicated in their decisions that the following factors may be relevant to an Adviser's fiduciary duty with respect to its receipt of compensation from a fund: the nature and quality of the services provided by the Adviser, including the performance of the Fund; the Adviser's cost of providing the services; the extent to which the Adviser may realize "economies of scale" as the Fund grows larger; any indirect benefits that may accrue to the Adviser and its affiliates as a result of the Adviser's relationship with the Fund; performance and expenses of comparable funds; and the extent to which the independent Board members are fully informed about all facts bearing on the Adviser's service and fee. The Fund's Board is aware of these factors and is guided by them in its review of the Fund's advisory contract to the extent they are appropriate and relevant, as discussed further below.
The Board considers and weighs these circumstances in light of its substantial accumulated experience in governing the Fund and working with Federated on matters relating to the Federated funds, and is assisted in its deliberations by the advice of independent legal counsel. In this regard, the Board requests and receives substantial and detailed information about the Fund and the Federated organization. Federated provides much of this information at each regular meeting of the Board, and furnishes additional reports in connection with the particular meeting at which the Board's formal review of the advisory contract occurs. In between regularly scheduled meetings, the Board may receive information on particular matters as the need arises. Thus, the Board's evaluation of an advisory contract is informed by reports covering such matters as: the Adviser's investment philosophy, personnel, and processes; operating strategies; the Fund's short- and long-term performance (in absolute terms, both on a gross basis and net of expenses, as well as in relationship to its particular investment program and certain competitor or "peer group" funds and/or other benchmarks, as appropriate), and comments on the reasons for performance; the Fund's expenses (including the advisory fee itself and the overall expense structure of the Fund, both in absolute terms and relative to similar and/or competing funds, with due regard for contractual or voluntary expense limitations); the use and allocation of brokerage commissions derived from trading the Fund's portfolio securities (if any); the nature and extent of the advisory and other services provided to the Fund by the Adviser and its affiliates; compliance and audit reports concerning the Federated funds and the Federated companies that service them (including communications from regulatory agencies), as well as Federated's responses to any issues raised therein; and relevant developments in the mutual fund industry and how the Federated funds and/or Federated are responding to them. The evaluation process is evolutionary, reflecting continually developing considerations. The criteria considered and the emphasis placed on relevant criteria change in recognition of changing circumstances in the mutual fund marketplace. For the past year, the Board concluded that the nature, quality and scope of services provided the fund by the Adviser and its affiliates was satisfactory.
With respect to the Fund's performance and expenses in particular, the Board has found the use of comparisons to other mutual funds with comparable investment programs to be particularly useful, given the high degree of competition in the mutual fund business. The Board focuses on comparisons with other similar mutual funds (rather than non-mutual fund products or services) because, simply put, they are more relevant. For example, other mutual funds are the products most like the Fund, they are readily available to Fund shareholders as alternative investment vehicles, and they are the type of investment vehicle in fact chosen and maintained by the Fund's investors. The range of their fees and expenses therefore appears to be a generally reliable indication of what consumers have found to be reasonable in the precise marketplace in which the Fund competes. The Fund's ability to deliver competitive performance when compared to its peer group may be a useful indicator of how the Adviser is executing on the Fund's investment program, which would in turn assist the Board in reaching a conclusion that the nature, extent, and quality of the Adviser's investment management services are such as to warrant continuation of the advisory contract. During the year ending December 31, 2004, the Fund's performance for the one year period was above the median of the relevant peer group. During the year ending December 31, 2004, the Fund's investment advisory fee after waivers and expense reimbursements, if any, was above the median of the relevant peer group. The Board reviewed the fees and other expenses of the Fund with the Adviser and was satisfied that the overall expense structure of the Fund nevertheless remained competitive. The Board will continue to monitor advisory fees and other expenses borne by the Fund.
The Board also receives financial information about Federated, including reports on the compensation and benefits Federated derives from its relationships with the Federated funds. These reports cover not only the fees under the advisory contracts, but also fees received by Federated's subsidiaries for providing other services to the Federated funds under separate contracts (e.g., for serving as the Federated funds' administrator). The reports also discuss any indirect benefit Federated may derive from its receipt of research services from brokers who execute Federated fund trades as well as waivers of fees and/or reimbursements of expenses. In order for a fund to be competitive in the marketplace, Federated and its affiliates frequently waive fees and/or reimburse expenses. Although the Board considers the costs incurred and the profitability of the Federated organization as a whole, it does not evaluate, on a fund-by-fund basis, Federated's "profitability" and/or "costs" (which would include an assessment as to whether "economies of scale" would be realized if the fund were to grow to some sufficient size). In the Board's view, the cost of performing advisory services on a fund-specific basis is both difficult to estimate satisfactorily and a relatively minor consideration in its overall evaluation. Analyzing isolated funds would require constructed allocations of the costs of shared resources and operations based on artificial assumptions that are inconsistent with the existing relationships within a large and diversified family of funds that receive advisory and other services from the same organization. In addition, the availability of the exchange privilege among funds in the Federated family makes consideration of the overall cost and profitability of Federated more relevant than that of individual funds. Based upon this review, the Board is satisfied that the costs incurred in, as well as the profitability realized from, managing the Fund and the other Federated Funds are appropriate. Although the Board is always interested in discovering any genuine "economies of scale," its experience has been that such "economies" are likely to arise only when a fund grows dramatically, and becomes and remains very large in size. Even in these instances, purchase and redemption activity, as well as the presence of expense limitations (if any), may offset any perceived economies. As suggested above, the Board considers the information it receives about the Fund's performance and expenses as compared to an appropriate set of similar competing funds to be more relevant.
The Board bases its decision to approve an advisory contract on the totality of the circumstances and relevant factors and with a view to past and future long-term considerations. Not all of the factors and considerations identified above are relevant to every Federated fund, nor does the Board consider any one of them to be determinative. With respect to the factors that are relevant, the Board's decision to approve the contract reflects its determination that Federated's performance and actions provide a satisfactory basis to support the decision to continue the existing arrangements.
Voting Proxies of Fund Portfolio Securities
A description of the policies and procedures that the Fund uses to determine how to vote proxies, if any, relating to securities held in the Fund's portfolio is available, without charge and upon request, by calling 1-800-341-7400. A report on "Form N-PX" of how the Fund voted any such proxies during the most recent 12-month period ended June 30 is available through Federated's website. Go to FederatedInvestors.com, select "Products," select the "Prospectuses and Regulatory Reports" link, then select the Fund to access the link to Form N-PX. This information is also available from the EDGAR database on the SEC's website at www.sec.gov.
Quarterly Portfolio Schedule
The Fund files with the SEC a complete schedule of its portfolio holdings, as of the close of the first and third quarters of its fiscal year, on "Form N-Q." These filings are available on the SEC's website at www.sec.gov and may be reviewed and copied at the SEC's Public Reference Room in Washington, DC. (Call 1-800-SEC-0330 for information on the operation of the Public Reference Room.) You may also access this information from the "Products" section of Federated's website at FederatedInvestors.com by clicking on "Portfolio Holdings" and selecting the name of the Fund, or by selecting the name of the Fund and clicking on "Portfolio Holdings." You must register on the website the first time you wish to access this information.
Mutual funds are not bank deposits or obligations, are not guaranteed by any bank, and are not insured or guaranteed by the U.S. government, the Federal Deposit Insurance Corporation, the Federal Reserve Board, or any other government agency. Investment in mutual funds involves investment risk, including the possible loss of principal.
This report is authorized for distribution to prospective investors only when preceded or accompanied by the Fund's prospectus, which contains facts concerning its objective and policies, management fees, expenses, and other information.
Federated
World-Class Investment Manager
Federated Kaufmann Small Cap Fund
Federated Investors Funds
5800 Corporate Drive
Pittsburgh, PA 15237-7000
Contact us at FederatedInvestors.com
or call 1-800-341-7400.
Federated Securities Corp., Distributor
Cusip 314172636
Cusip 314172628
Cusip 314172610
29503 (12/05)
Federated is a registered mark of Federated Investors, Inc. 2005 (c)Federated Investors, Inc.
Federated
World-Class Investment Manager
Federated Large Cap Growth Fund
Established 1998
A Portfolio of Federated Equity Funds
7TH ANNUAL SHAREHOLDER REPORT
October 31, 2005
Class A Shares
Class B Shares
Class C Shares
FINANCIAL HIGHLIGHTS
SHAREHOLDER EXPENSE EXAMPLE
MANAGEMENT'S DISCUSSION OF FUND PERFORMANCE
PORTFOLIO OF INVESTMENTS SUMMARY TABLE
PORTFOLIO OF INVESTMENTS
STATEMENT OF ASSETS AND LIABILITIES
STATEMENT OF OPERATIONS
STATEMENT OF CHANGES IN NET ASSETS
NOTES TO FINANCIAL STATEMENTS
REPORT OF INDEPENDENT REGISTERED PUBLIC ACCOUNTING FIRM
BOARD OF TRUSTEES AND TRUST OFFICERS
BOARD REVIEW OF ADVISORY CONTRACT
VOTING PROXIES ON FUND PORTFOLIO SECURITIES
QUARTERLY PORTFOLIO SCHEDULE
Not FDIC Insured * May Lose Value * No Bank Guarantee
Financial Highlights - Class A Shares
(For a Share Outstanding Throughout Each Period)
Year Ended October 31
|
| 2005
|
|
| 2004
|
|
| 2003
|
|
| 2002
|
|
| 2001
|
|
Net Asset Value, Beginning of Period
| | $7.56 | | | $7.37 | | | $6.47 | | | $7.95 | | | $13.37 | |
Income From Investment Operations:
| | | | | | | | | | | | | | | |
Net investment income (loss)
| | 0.01 | 1 | | (0.02 | ) 1 | | (0.03 | ) 1 | | (0.04 | ) 1 | | (0.06 | ) |
Net realized and unrealized gain
(loss) on investments
|
| 0.56
|
|
| 0.21
|
|
| 0.93
|
|
| (1.44
| )
|
| (5.36
| )
|
TOTAL FROM INVESTMENT OPERATIONS
|
| 0.57
|
|
| 0.19
|
|
| 0.90
|
|
| (1.48
| )
|
| (5.42
| )
|
Net Asset Value, End of Period
|
| $8.13
|
|
| $7.56
|
|
| $7.37
|
|
| $6.47
|
|
| $7.95
|
|
Total Return 2
|
| 7.54
| %
|
| 2.58
| %
|
| 13.91
| %
|
| (18.62
| )%
|
| (40.54
| )%
|
| | | | | | | | | | | | | | | |
Ratios to Average Net Assets:
|
|
|
|
|
|
|
|
|
|
|
|
|
|
|
|
Net expenses
|
| 1.45
| % 3
|
| 1.44
| % 3
|
| 1.56
| % 3
|
| 1.46
| % 3
|
| 1.37
| %
|
Net investment income (loss)
|
| 0.07
| %
|
| (0.31
| )%
|
| (0.44
| )%
|
| (0.47
| )%
|
| (0.60
| )%
|
Expense waiver/reimbursement 4
|
| 0.02
| %
|
| 0.01
| %
|
| 0.00
| % 5
|
| 0.00
| % 5
|
| 0.00
| % 5
|
Supplemental Data:
|
|
|
|
|
|
|
|
|
|
|
|
|
|
|
|
Net assets, end of period (000 omitted)
|
| $104,837
|
|
| $144,921
|
|
| $148,090
|
|
| $144,499
|
|
| $228,433
|
|
Portfolio turnover
|
| 128
| %
|
| 103
| %
|
| 126
| %
|
| 233
| %
|
| 221
| %
|
1 Per share numbers have been calculated using the average shares method.
2 Based on net asset value, which does not reflect the sales charge, redemption fee or contingent deferred sales charge, if applicable. Total returns for periods of less than one year are not annualized.
3 The expense ratio is calculated without reduction for fees paid indirectly for directed brokerage arrangements. The expense ratios are 1.45%, 1.43%, 1.54%, and 1.44% after taking into account these expense reductions for the years ended October 31, 2005, 2004, 2003 and 2002, respectively.
4 This expense decrease is reflected in both the net expense and the net investment income (loss) ratios shown above.
5 Represents less than 0.01%.
See Notes which are an integral part of the Financial Statements
Financial Highlights - Class B Shares
(For a Share Outstanding Throughout Each Period)
Year Ended October 31
|
| 2005
|
|
| 2004
|
|
| 2003
|
|
| 2002
|
|
| 2001
|
|
Net Asset Value, Beginning of Period
| | $7.26 | | | $7.13 | | | $6.31 | | | $7.82 | | | $13.24 | |
Income From Investment Operations:
| | | | | | | | | | | | | | | |
Net investment income (loss)
| | (0.05 | ) 1 | | (0.08 | ) 1 | | (0.08 | ) 1 | | (0.09 | ) 1 | | (0.16 | ) |
Net realized and unrealized gain
(loss) on investments
|
| 0.55
|
|
| 0.21
|
|
| 0.90
|
|
| (1.42
| )
|
| (5.26
| )
|
TOTAL FROM INVESTMENT OPERATIONS
|
| 0.50
|
|
| 0.13
|
|
| 0.82
|
|
| (1.51
| )
|
| (5.42
| )
|
Net Asset Value, End of Period
|
| $7.76
|
|
| $7.26
|
|
| $7.13
|
|
| $6.31
|
|
| $7.82
|
|
Total Return 2
|
| 6.89
| %
|
| 1.82
| %
|
| 13.00
| %
|
| (19.31
| )%
|
| (40.94
| )%
|
| | | | | | | | | | | | | | | |
Ratios to Average Net Assets:
|
|
|
|
|
|
|
|
|
|
|
|
|
|
|
|
Net expenses
|
| 2.20
| % 3
|
| 2.19
| % 3
|
| 2.31
| % 3
|
| 2.21
| % 3
|
| 2.12
| %
|
Net investment income (loss)
|
| (0.69
| )%
|
| (1.06
| )%
|
| (1.19
| )%
|
| (1.22
| )%
|
| (1.35
| )%
|
Expense waiver/reimbursement 4
|
| 0.02
| %
|
| 0.01
| %
|
| 0.00
| % 5
|
| 0.00
| % 5
|
| 0.00
| % 5
|
Supplemental Data:
|
|
|
|
|
|
|
|
|
|
|
|
|
|
|
|
Net assets, end of period (000 omitted)
|
| $78,152
|
|
| $95,901
|
|
| $116,166
|
|
| $121,572
|
|
| $205,699
|
|
Portfolio turnover
|
| 128
| %
|
| 103
| %
|
| 126
| %
|
| 233
| %
|
| 221
| %
|
1 Per share numbers have been calculated using the average shares method.
2 Based on net asset value, which does not reflect the sales charge, redemption fee or contingent deferred sales charge, if applicable. Total returns for periods of less than one year are not annualized.
3 The expense ratio is calculated without reduction for fees paid indirectly for directed brokerage arrangements. The expense ratios are 2.19%, 2.18%, 2.29%, and 2.19% after taking into account these expense reductions for the years ended October 31, 2005, 2004, 2003 and 2002, respectively.
4 This expense decrease is reflected in both the net expense and the net investment income (loss) ratios shown above.
5 Represents less than 0.01%.
See Notes which are an integral part of the Financial Statements
Financial Highlights - Class C Shares
(For a Share Outstanding Throughout Each Period)
Year Ended October 31
|
| 2005
|
|
| 2004
|
|
| 2003
|
|
| 2002
|
|
| 2001
|
|
Net Asset Value, Beginning of Period
| | $7.26 | | | $7.13 | | | $6.31 | | | $7.82 | | | $13.23 | |
Income From Investment Operations:
| | | | | | | | | | | | | | | |
Net investment income (loss)
| | (0.05 | ) 1 | | (0.08 | ) 1 | | (0.08 | ) 1 | | (0.09 | ) 1 | | (0.15 | ) |
Net realized and unrealized gain
(loss) on investments
|
| 0.55
|
|
| 0.21
|
|
| 0.90
|
|
| (1.42
| )
|
| (5.26
| )
|
TOTAL FROM INVESTMENT OPERATIONS
|
| 0.50
|
|
| 0.13
|
|
| 0.82
|
|
| (1.51
| )
|
| (5.41
| )
|
Net Asset Value, End of Period
|
| $7.76
|
|
| $7.26
|
|
| $7.13
|
|
| $6.31
|
|
| $7.82
|
|
Total Return 2
|
| 6.89
| %
|
| 1.82
| %
|
| 13.00
| %
|
| (19.31
| )%
|
| (40.89
| )%
|
| | | | | | | | | | | | | | | |
Ratios to Average Net Assets:
|
|
|
|
|
|
|
|
|
|
|
|
|
|
|
|
Net expenses
|
| 2.20
| % 3
|
| 2.19
| % 3
|
| 2.31
| % 3
|
| 2.21
| % 3
|
| 2.12
| %
|
Net investment income (loss)
|
| (0.69
| )%
|
| (1.06
| )%
|
| (1.19
| )%
|
| (1.22
| )%
|
| (1.35
| )%
|
Expense waiver/reimbursement 4
|
| 0.02
| %
|
| 0.01
| %
|
| 0.00
| % 5
|
| 0.00
| % 5
|
| 0.00
| % 5
|
Supplemental Data:
|
|
|
|
|
|
|
|
|
|
|
|
|
|
|
|
Net assets, end of period (000 omitted)
|
| $12,007
|
|
| $13,866
|
|
| $15,444
|
|
| $16,067
|
|
| $30,148
|
|
Portfolio turnover
|
| 128
| %
|
| 103
| %
|
| 126
| %
|
| 233
| %
|
| 221
| %
|
1 Per share numbers have been calculated using the average shares method.
2 Based on net asset value, which does not reflect the sales charge, redemption fee or contingent deferred sales charge, if applicable. Total returns for periods of less than one year are not annualized.
3 The expense ratio is calculated without reduction for fees paid indirectly for directed brokerage arrangements. The expense ratios are 2.19%, 2.18%, 2.29%, and 2.19% after taking into account these expense reductions for the years ended October 31, 2005, 2004, 2003 and 2002, respectively.
4 This expense decrease is reflected in both the net expense and the net investment income (loss) ratios shown above.
5 Represents less than 0.01%.
See Notes which are an integral part of the Financial Statements
Shareholder Expense Example
As a shareholder of the Fund, you incur two types of costs: (1) transaction costs, including sales charges (loads) on purchase or redemption payments; and (2) ongoing costs, including management fees; to the extent applicable, distribution (12b-1) fees and/or shareholder services fees; and other Fund expenses. This Example is intended to help you to understand your ongoing costs (in dollars) of investing in the Fund and to compare these costs with the ongoing costs of investing in other mutual funds. It is based on an investment of $1,000 invested at the beginning of the period and held for the entire period from May 1, 2005 to October 31, 2005.
ACTUAL EXPENSES
The first section of the table below provides information about actual account values and actual expenses. You may use the information in this section, together with the amount you invested, to estimate the expenses that you incurred over the period. Simply divide your account value by $1,000 (for example, an $8,600 account value divided by $1,000 = 8.6), then multiply the result by the number in the first section under the heading entitled "Expenses Paid During Period" to estimate the expenses attributable to your investment during this period.
HYPOTHETICAL EXAMPLE FOR COMPARISON PURPOSES
The second section of the table below provides information about hypothetical account values and hypothetical expenses based on the Fund's actual expense ratio and an assumed rate of return of 5% per year before expenses, which is not the Fund's actual return. Thus, you should not use the hypothetical account values and expenses to estimate the actual ending account balance or your expenses for the period. Rather, these figures are provided to enable you to compare the ongoing costs of investing in the Fund and other funds. To do so, compare this 5% hypothetical example with the 5% hypothetical examples that appear in the shareholder reports of the other funds.
Please note that the expenses shown in the table are meant to highlight your ongoing costs only and do not reflect any transaction costs, such as sales charge (loads) on purchase or redemption payments. Therefore, the second section of the table is useful in comparing ongoing costs only, and will not help you determine the relative total costs of owning different funds. In addition, if these transaction costs were included, your costs would have been higher.
|
| Beginning
Account Value
5/1/2005
|
| Ending
Account Value
10/31/2005
|
| Expenses Paid
During Period 1
|
Actual:
|
|
|
|
|
|
|
Class A Shares
|
| $1,000
|
| $1,061.40
|
| $ 7.27
|
Class B Shares
|
| $1,000
|
| $1,057.20
|
| $11.10
|
Class C Shares
|
| $1,000
|
| $1,057.20
|
| $11.10
|
Hypothetical (assuming a 5% return before expenses):
|
|
|
|
|
|
|
Class A Shares
|
| $1,000
|
| $1,018.15
|
| $ 7.12
|
Class B Shares
|
| $1,000
|
| $1,014.42
|
| $10.87
|
Class C Shares
|
| $1,000
|
| $1,014.42
|
| $10.87
|
1 Expenses are equal to the Fund's annualized net expense ratios, multiplied by the average account value over the period, multiplied by 184/365 (to reflect the one-half year period). The annualized net expense ratios are as follows:
Class A Shares
|
| 1.40%
|
Class B Shares
|
| 2.14%
|
Class C Shares
|
| 2.14%
|
Management Discussion of Fund Performance
For the 12-month period from November 1, 2004 through October 31, 2005, Class A Shares of the Federated Large Cap Growth Fund appreciated by 7.54% on a total return basis (based on net asset value), under performing its benchmark -- the Russell 1000 Growth Index 1 , which gained 9.24%. The total return for Class B Shares and Class C Shares was 6.89%.
The equity market experienced a see-saw pattern during the past year, failing to sustain the positive momentum it enjoyed during November and December 2004. The market drifted lower during the first four months of calendar 2005, witnessed a summer rally, and then retrenched during the final three months of the reporting period, as investors rotated out of high-quality, large-cap stocks, and into lower quality, mid- and small-cap stocks. This final shift did not benefit the fund's positioning, as it cost the fund more than 150 basis points in relative performance during September and October alone.
Investors focused their concerns during the reporting period on the potential for slowing economic growth due to rising energy prices, higher interest rates from the Fed, and the economic impact from damaging hurricanes Katrina, Rita and Wilma. As inflationary pressures began to build during the year, the market began to grow increasingly concerned about stagflation, the unwholesome combination of slowing economic growth and rising inflation.
On the positive side, the fund's overweighted position in the strongly performing Energy sector resulted in a relative performance advantage of 130 basis points over the Russell 1000 Growth Index, with Transocean Inc. and Schlumberger Ltd. among our stellar performers. Good stock selection in Health Care helped to add 78 basis points of positive performance, with notable standouts such as Genentech and United Health Group .. Similarly, favorable stock selection in Consumer Staples sector added 50 basis points of positive performance, with Altria Group leading the charge. Finally, our overweight position and favorable security selection in Consumer Discretionary sector added 23 basis points of positive performance, with a variety of retail stocks such as Nordstrom Inc. pitching in with good performance.
1 Russell 1000 Growth Index measures the performance of those Russell 1000 companies with higher price-to-book ratios and higher forecasted growth values. The index is not adjusted to reflect sales loads, expenses of other fees that the Securities and Exchange Commission requires to be reflected in the fund's performance. The index is unmanaged, and unlike the fund, is not affected by cashflows. Investments cannot be made in an index.
On the negative side, despite an underweight position, poor stock selection in the Financials sector cost the fund 99 basis points in relative performance. The bulk of the damage (71 basis points) was sustained by Doral Financial Corp. , a bank whose previously strong performance was derailed in short order by some operational, legal and compliance missteps by management. Similarly, despite an underweight position, poor stock selection in Industrials sector cost the fund 49 basis points in relative performance. Most of this loss (39 basis points) was attributed to a collapse in 3M Co. after their highly regarded Chief Executive Officer unexpectedly resigned to join Boeing Co. Finally, an overweight position and poor stock selection in the Materials sector cost the fund 30 basis points in relative performance, although virtually all of this weakness (29 basis points) was due to poor performance at Placer Dome Inc. , in conjunction with a sharp decline in the price of gold.
GROWTH OF A $10,000 INVESTMENT - CLASS A SHARES
The graph below illustrates the hypothetical investment of $10,000 1 in Federated Large Cap Growth Fund (Class A Shares) (the "Fund") from December 29, 1998 (start of performance) to October 31, 2005, compared to the Russell 1000 Growth Index (R1000G) 2 and the Lipper Large Cap Growth Funds Index (LLCGF) 3 ..
Average Annual Total Return 4 for the Period Ended 10/31/2005
|
|
|
|
1 Year
|
| 1.63
| %
|
5 Years
|
| (10.49
| )%
|
Start of Performance (12/29/1998)
|
| (3.78
| )%
|
Performance data quoted represents past performance which is no guarantee of future results. Investment return and principal value will fluctuate so that an investor's shares, when redeemed, may be worth more or less than their original cost. Mutual fund performance changes over time and current performance may be lower or higher than what is stated. For current to the most recent month-end performance and after-tax returns, visit FederatedInvestors.com or call 1-800-341-7400. Returns shown do not reflect the deduction of taxes that a shareholder would pay on Fund distributions or the redemption of Fund shares. Mutual funds are not obligations of or guaranteed by any bank and are not federally insured. Total returns shown include the maximum sales charge of 5.50%.
1 Represents a hypothetical investment of $10,000 in the Fund after deducting the maximum sales charge of 5.50% ($10,000 investment minus $550 sales charge = $9,450). The Fund's performance assumes the reinvestment of all dividends and distributions. The R1000G and the LLCGF have been adjusted to reflect reinvestment of all dividends on securities in the indexes.
2 The R1000G is not adjusted to reflect sales charges, expenses or other fees that the Securities and Exchange Commission (SEC) requires to be reflected in the Fund's performance. The index is unmanaged and unlike the Fund, is not affected by cashflows. It is not possible to invest directly in an index.
3 The LLCGF measures the performance of the 30 largest funds in the large cap growth category as tracked by Lipper, Inc. The index is unmanaged and unlike the fund, is not affected by cashflows. It is not possible to invest directly in an index. The LLCGF is not adjusted to reflect sales charges. However, these total returns are reported net of expenses or other fees that the SEC requires to be reflected in a mutual fund's performance.
4 Total returns quoted reflect all applicable sales charges.
GROWTH OF A $10,000 INVESTMENT - CLASS B SHARES
The graph below illustrates the hypothetical investment of $10,000 1 in Federated Large Cap Growth Fund (Class B Shares) (the "Fund") from December 29, 1998 (start of performance) to October 31, 2005, compared to the Russell 1000 Growth Index (R1000G) 2 and the Lipper Large Cap Growth Funds Index (LLCGF) 3 ..
Average Annual Total Return 4 for the Period Ended 10/31/2005
|
|
|
|
1 Year
|
| 1.39
| %
|
5 Years
|
| (10.50
| )%
|
Start of Performance (12/29/1998)
|
| (3.64
| )%
|
Performance data quoted represents past performance which is no guarantee of future results. Investment return and principal value will fluctuate so that an investor's shares, when redeemed, may be worth more or less than their original cost. Mutual fund performance changes over time and current performance may be lower or higher than what is stated. For current to the most recent month-end performance and after-tax returns, visit FederatedInvestors.com or call 1-800-341-7400. Returns shown do not reflect the deduction of taxes that a shareholder would pay on Fund distributions or the redemption of Fund shares. Mutual funds are not obligations of or guaranteed by any bank and are not federally insured. Total returns shown include the maximum contingent deferred sales charge of 5.50% as applicable.
1 Represents a hypothetical investment of $10,000 in the Fund. The ending value of the Fund doesn't reflect a contingent deferred sales charge on any redemption over seven years from the purchase date. The maximum contingent deferred sales charge is 5.50% on any redemption less than one year from the purchase date. The Fund's performance assumes the reinvestment of all dividends and distributions. The R1000G and the LLCGF have been adjusted to reflect reinvestment of all dividends on securities in the indexes.
2 The R1000G is not adjusted to reflect sales charges, expenses or other fees that the SEC requires to be reflected in the Fund's performance. The index is unmanaged and unlike the Fund, is not affected by cashflows. It is not possible to invest directly in an index.
3 The LLCGF measures the performance of the 30 largest funds in the large cap growth category as tracked by Lipper, Inc. The index is unmanaged and unlike the fund, is not affected by cashflows. It is not possible to invest directly in an index. The LLCGF is not adjusted to reflect sales charges. However, these total returns are reported net of expenses or other fees that the SEC requires to be reflected in a mutual fund's performance.
4 Total returns quoted reflect all applicable contingent deferred sales charges
GROWTH OF A $10,000 INVESTMENT - CLASS C SHARES
The graph below illustrates the hypothetical investment of $10,000 1 in Federated Large Cap Growth Fund (Class C Shares) (the "Fund") from December 29, 1998 (start of performance) to October 31, 2005, compared to the Russell 1000 Growth Index (R1000G) 2 and the Lipper Large Cap Growth Funds Index (LLCGF) 3 ..
Average Annual Total Return 4 for the Period Ended 10/31/2005
|
|
|
|
1 Year
|
| 4.88
| %
|
5 Years
|
| (10.30
| )%
|
Start of Performance (12/29/1998)
|
| (3.78
| )%
|

Performance data quoted represents past performance which is no guarantee of future results. Investment return and principal value will fluctuate so that an investor's shares, when redeemed, may be worth more or less than their original cost. Mutual fund performance changes over time and current performance may be lower or higher than what is stated. For current to the most recent month-end performance and after-tax returns, visit FederatedInvestors.com or call 1-800-341-7400. Returns shown do not reflect the deduction of taxes that a shareholder would pay on Fund distributions or the redemption of Fund shares. Mutual funds are not obligations of or guaranteed by any bank and are not federally insured. Total returns shown include the maximum sales charge of 1.00% and the 1.00% contingent deferred sales charge as applicable.
1 Represents a hypothetical investment of $10,000 in the Fund after deducting the maximum sales charge of 1.00% ($10,000 invested minus $100 sales charge = $9,900). A 1.00% contingent deferred sales charge would be applied to any redemption less than one year from the purchase date. The Fund's performance assumes the reinvestment of all dividends and distributions. The R1000G and the LLCGF have been adjusted to reflect reinvestment of all dividends on securities in the indexes.
2 The R1000G is not adjusted to reflect sales charges, expenses or other fees that the SEC requires to be reflected in the Fund's performance. The index is unmanaged and unlike the Fund, is not affected by cashflows. It is not possible to invest directly in an index.
3 The LLCGF measures the performance of the 30 largest funds in the large cap growth category as tracked by Lipper, Inc. The index is unmanaged and unlike the fund, is not affected by cashflows. It is not possible to invest directly in an index. The LLCGF is not adjusted to reflect sales charges. However, these total returns are reported net of expenses or other fees that the SEC requires to be reflected in a mutual fund's performance.
4 Total returns quoted reflect all applicable sales charges and contingent deferred sales charges.
Performance data quoted represents past performance which is no guarantee of future results. Investment return and principal value will fluctuate so that an investor's shares, when redeemed, may be worth more or less than their original cost. Mutual fund performance changes over time and current performance may be lower or higher than what is stated. For current to the most recent month-end performance, visit FederatedInvestors.com or call 1-800-341-7400.
Portfolio of Investments Summary Table
At October 31, 2005, the Fund's sector composition 1 was as follows:
Sector
|
| Percentage of
Total Net Assets
|
Information Technology
|
| 27.2%
|
Healthcare
|
| 21.3%
|
Consumer Discretionary
|
| 19.4%
|
Energy
|
| 9.0%
|
Industrials
|
| 8.4%
|
Financials
|
| 6.0%
|
Consumer Staples
|
| 5.0%
|
Materials
|
| 3.1%
|
Securities Lending Collateral 2
|
| 0.1%
|
Other Assets and Liabilities-Net 3
|
| 0.5%
|
TOTAL
|
| 100.0%
|
1 Except for Securities Lending Collateral and other Assets and Liabilities, sector classifications are based upon, and individual portfolio securities are assigned to, the classifications of the Global Industry Classification Standard (GICS) except that the adviser assigns a classification to securities not classified by the GICS and to securities for which the adviser does not have access to the classification made by the GICS.
2 Cash collateral received from lending portfolio securities which is invested in short term investments such as repurchase agreements or money market funds.
3 See Statement of Assets and Liabilities.
Portfolio of Investments
October 31, 2005
Shares
|
|
|
|
| Value
|
| | COMMON STOCKS--99.4% | | | |
| | Consumer Discretionary--19.4% | | | |
| 55,000 | 1 | Bed Bath & Beyond, Inc.
| | $ | 2,228,600 |
| 45,000 | | Best Buy Co., Inc.
| | | 1,991,700 |
| 22,000 | | Carnival Corp.
| | | 1,092,740 |
| 20,000 | | Centex Corp.
| | | 1,287,000 |
| 65,000 | 1 | Coach, Inc.
| | | 2,091,700 |
| 80,000 | 1 | eBay, Inc.
| | | 3,168,000 |
| 100,000 | | Hasbro, Inc.
| | | 1,884,000 |
| 90,000 | | Home Depot, Inc.
| | | 3,693,600 |
| 20,000 | | Lennar Corp., Class A
| | | 1,111,600 |
| 35,200 | | Lowe's Cos., Inc.
| | | 2,139,104 |
| 26,400 | 2 | MGM Mirage
| | | 986,568 |
| 18,400 | | Marriott International, Inc., Class A
| | | 1,097,008 |
| 100,000 | | McDonald's Corp.
| | | 3,160,000 |
| 30,000 | | Nike, Inc., Class B
| | | 2,521,500 |
| 30,000 | | Nordstrom, Inc.
| | | 1,039,500 |
| 17,600 | | Station Casinos, Inc.
| | | 1,128,160 |
| 60,000 | | Target Corp.
| | | 3,341,400 |
| 66,000 | | Viacom, Inc., Class B
| | | 2,044,020 |
| 60,000 | 1,2 | XM Satellite Radio Holdings, Inc., Class A
|
|
| 1,729,800
|
| | TOTAL
|
|
| 37,736,000
|
| | Consumer Staples--5.0% | | | |
| 34,300 | | Altria Group, Inc.
| | | 2,574,215 |
| 40,000 | | CVS Corp.
| | | 976,400 |
| 46,000 | | Coca-Cola Co.
| | | 1,967,880 |
| 35,200 | | PepsiCo, Inc.
| | | 2,079,616 |
| 40,000 | | Procter & Gamble Co.
|
|
| 2,239,600
|
| | TOTAL
|
|
| 9,837,711
|
| | Energy--9.0% | | | |
| 17,600 | | Apache Corp.
| | | 1,123,408 |
| 33,000 | | Devon Energy Corp.
| | | 1,992,540 |
Shares
|
|
|
|
| Value
|
| | COMMON STOCKS--continued | | | |
| | Energy--continued | | | |
| 39,600 | | Exxon Mobil Corp.
| | $ | 2,223,144 |
| 52,800 | | Halliburton Co.
| | | 3,120,480 |
| 15,000 | | Peabody Energy Corp.
| | | 1,172,400 |
| 35,200 | | Schlumberger Ltd.
| | | 3,195,104 |
| 44,000 | 1 | Transocean Sedco Forex, Inc.
| | | 2,529,560 |
| 20,000 | | Valero Energy Corp.
|
|
| 2,104,800
|
| | TOTAL
|
|
| 17,461,436
|
| | Financials--6.0% | | | |
| 40,000 | | Bank of America Corp.
| | | 1,749,600 |
| 55,000 | | Capital One Financial Corp.
| | | 4,199,250 |
| 35,000 | | Commerce Bancorp, Inc.
| | | 1,066,450 |
| 20,000 | | Merrill Lynch & Co., Inc.
| | | 1,294,800 |
| 61,600 | | Morgan Stanley
|
|
| 3,351,656
|
| | TOTAL
|
|
| 11,661,756
|
| | Healthcare--21.3% | | | |
| 40,000 | 1 | Amgen, Inc.
| | | 3,030,400 |
| 51,050 | 1 | Caremark Rx, Inc.
| | | 2,675,020 |
| 52,800 | 1 | Genentech, Inc.
| | | 4,783,680 |
| 25,000 | 1 | Gilead Sciences, Inc.
| | | 1,181,250 |
| 40,000 | | HCA, Inc.
| | | 1,927,600 |
| 133,000 | | Johnson & Johnson
| | | 8,328,460 |
| 40,000 | | McKesson HBOC, Inc.
| | | 1,817,200 |
| 83,000 | 1 | Medimmune, Inc.
| | | 2,903,340 |
| 66,000 | | Medtronic, Inc.
| | | 3,739,560 |
| 160,000 | | Pfizer, Inc.
| | | 3,478,400 |
| 55,600 | | UnitedHealth Group, Inc.
| | | 3,218,684 |
| 57,200 | | Wyeth
| | | 2,548,832 |
| 30,000 | 1 | Zimmer Holdings, Inc.
|
|
| 1,913,100
|
| | TOTAL
|
|
| 41,545,526
|
| | Industrials--8.4% | | | |
| 30,000 | | Deere & Co.
| | | 1,820,400 |
| 310,000 | | General Electric Co.
| | | 10,512,100 |
| 44,000 | | United Parcel Service, Inc.
| | | 3,209,360 |
| 17,600 | | United Technologies Corp.
|
|
| 902,528
|
| | TOTAL
|
|
| 16,444,388
|
Shares
|
|
|
|
| Value
|
| | COMMON STOCKS--continued | | | |
| | Information Technology--27.2% | | | |
| 150,000 | | Adobe Systems, Inc.
| | $ | 4,837,500 |
| 55,000 | 1 | Amdocs Ltd.
| | | 1,455,850 |
| 120,000 | | Applied Materials, Inc.
| | | 1,965,600 |
| 50,000 | 1 | Check Point Software Technologies Ltd.
| | | 1,118,000 |
| 277,200 | 1 | Cisco Systems, Inc.
| | | 4,837,140 |
| 90,000 | 1 | Dell, Inc.
| | | 2,869,200 |
| 176,000 | 1 | EMC Corp. Mass
| | | 2,456,960 |
| 14,000 | 1 | Google Inc.
| | | 5,209,960 |
| 55,000 | | IBM Corp.
| | | 4,503,400 |
| 200,000 | | Intel Corp.
| | | 4,700,000 |
| 20,000 | | KLA-Tencor Corp.
| | | 925,800 |
| 30,000 | | Linear Technology Corp.
| | | 996,300 |
| 350,000 | | Microsoft Corp.
| | | 8,995,000 |
| 90,000 | | Motorola, Inc.
| | | 1,994,400 |
| 330,000 | 1 | Oracle Corp.
| | | 4,184,400 |
| 85,000 | | Xilinx, Inc.
|
|
| 2,035,750
|
| | TOTAL
|
|
| 53,085,260
|
| | Materials--3.1% | | | |
| 70,000 | | Georgia-Pacific Corp.
| | | 2,277,100 |
| 45,000 | | Newmont Mining Corp.
| | | 1,917,000 |
| 50,000 | | United States Steel Corp.
|
|
| 1,826,500
|
| | TOTAL
|
|
| 6,020,600
|
| | TOTAL COMMON STOCKS (IDENTIFIED COST $168,094,515)
|
|
| 193,792,677
|
| | MUTUAL FUND--0.1% | | | |
| 283,211 | 3 | Prime Value Obligations Fund, IS Shares (at net asset value) (held as collateral for securities lending)
|
|
| 283,211
|
| | TOTAL INVESTMENTS-99.5%
(IDENTIFIED COST $168,377,726) 4
|
|
| 194,075,888
|
| | OTHER ASSETS AND LIABILITIES - NET--0.5%
|
|
| 920,379
|
| | TOTAL NET ASSETS-100%
|
| $
| 194,996,267
|
1 Non-income producing security.
2 All or a portion of these securities are temporarily on loan to unaffiliated broker/dealers.
3 Affiliated company.
4 The cost of investments for federal tax purposes amounts to $170,383,680.
Note: The categories of investments are shown as a percentage of total net assets at October 31, 2005.
See Notes which are an integral part of the Financial Statements
Statement of Assets and Liabilities
October 31, 2005
Assets:
| | | | | | | | |
Total investments in securities, at value including $283,211 of investments in affiliated issuers (Note 5) and $276,779 of securities loaned
(identified cost $168,377,726)
| | | | | | $ | 194,075,888 | |
Income receivable
| | | | | | | 44,653 | |
Receivable for investments sold
| | | | | | | 2,416,764 | |
Receivable for shares sold
|
|
|
|
|
|
| 257,964
|
|
TOTAL ASSETS
|
|
|
|
|
|
| 196,795,269
|
|
Liabilities:
| | | | | | | | |
Payable for shares redeemed
| | $ | 868,056 | | | | | |
Payable to bank
| | | 285,382 | | | | | |
Payable for distribution services fee (Note 5)
| | | 80,071 | | | | | |
Payable for shareholder services fee (Note 5)
| | | 19,159 | | | | | |
Payable for collateral due to broker
| | | 283,211 | | | | | |
Payable for transfer and dividend disbursing agent fees and expenses
| | | 191,578 | | | | | |
Accrued expenses
|
|
| 71,545
|
|
|
|
|
|
TOTAL LIABILITIES
|
|
|
|
|
|
| 1,799,002
|
|
Net assets for 24,515,664 shares outstanding
|
|
|
|
|
| $
| 194,996,267
|
|
Net Assets Consist of:
| | | | | | | | |
Paid-in capital
| | | | | | $ | 595,361,496 | |
Net unrealized appreciation of investments
| | | | | | | 25,698,162 | |
Accumulated net realized loss on investments
| | | | | | | (426,062,227 | ) |
Accumulated net investment income (loss)
|
|
|
|
|
|
| (1,164
| )
|
TOTAL NET ASSETS
|
|
|
|
|
| $
| 194,996,267
|
|
Statement of Assets and Liabilities - continued
October 31, 2005
Net Asset Value, Offering Price and Redemption Proceeds Per Share
| | | | | | | | |
Class A Shares:
| | | | | | | | |
Net asset value per share ($104,837,205 ÷ 12,892,740 shares outstanding), no par value, unlimited shares authorized
|
|
|
|
|
|
| $8.13
|
|
Offering price per share (100/94.50 of $8.13) 1
|
|
|
|
|
|
| $8.60
|
|
Redemption proceeds per share
|
|
|
|
|
|
| $8.13
|
|
Class B Shares:
| | | | | | | | |
Net asset value per share ($78,151,745 ÷ 10,074,859 shares outstanding), no par value, unlimited shares authorized
|
|
|
|
|
|
| $7.76
|
|
Offering price per share
|
|
|
|
|
|
| $7.76
|
|
Redemption proceeds per share (94.50/100 of $7.76) 1
|
|
|
|
|
|
| $7.33
|
|
Class C Shares:
| | | | | | | | |
Net asset value per share ($12,007,317 ÷ 1,548,065 shares outstanding), no par value, unlimited shares authorized
|
|
|
|
|
|
| $7.76
|
|
Offering price per share (100/99.00 of $7.76) 1
|
|
|
|
|
|
| $7.84
|
|
Redemption proceeds per share (99.00/100 of $7.76) 1
|
|
|
|
|
|
| $7.68
|
|
1 See "What Do Shares Cost?" in the Prospectus.
See Notes which are an integral part of the Financial Statements
Statement of Operations
Year Ended October 31, 2005
Investment Income:
| | | | | | | | | | | | |
Dividends (including $2,405 received from affiliated issuers (Note 5) and net of foreign taxes withheld of $7,023)
| | | | | | | | | | $ | 3,553,219 | |
Interest (including income on securities loaned of $15,689)
|
|
|
|
|
|
|
|
|
|
| 67,911
|
|
TOTAL INCOME
|
|
|
|
|
|
|
|
|
|
| 3,621,130
|
|
Expenses:
| | | | | | | | | | | | |
Investment adviser fee (Note 5)
| | | | | | $ | 1,789,817 | | | | | |
Administrative personnel and services fee (Note 5)
| | | | | | | 230,000 | | | | | |
Custodian fees
| | | | | | | 14,053 | | | | | |
Transfer and dividend disbursing agent fees and expenses
| | | | | | | 658,754 | | | | | |
Directors'/Trustees' fees
| | | | | | | 3,638 | | | | | |
Auditing fees
| | | | | | | 25,216 | | | | | |
Legal fees
| | | | | | | 8,905 | | | | | |
Portfolio accounting fees
| | | | | | | 87,693 | | | | | |
Distribution services fee--Class A Shares (Note 5)
| | | | | | | 338,500 | | | | | |
Distribution services fee--Class B Shares (Note 5)
| | | | | | | 672,733 | | | | | |
Distribution services fee--Class C Shares (Note 5)
| | | | | | | 101,585 | | | | | |
Shareholder services fee--Class B Shares (Note 5)
| | | | | | | 224,244 | | | | | |
Shareholder services fee--Class C Shares (Note 5)
| | | | | | | 33,523 | | | | | |
Share registration costs
| | | | | | | 53,942 | | | | | |
Printing and postage
| | | | | | | 44,972 | | | | | |
Insurance premiums
| | | | | | | 9,709 | | | | | |
Miscellaneous
|
|
|
|
|
|
| 3,572
|
|
|
|
|
|
TOTAL EXPENSES
|
|
|
|
|
|
| 4,300,856
|
|
|
|
|
|
Waiver, Reimbursement and Expense Reduction:
| | | | | | | | | | | | |
Reimbursement of investment adviser fee (Note 5)
| | $ | (4,719 | ) | | | | | | | | |
Waiver of administrative personnel and services fee (Note 5)
| | | (48,155 | ) | | | | | | | | |
Fees paid indirectly from directed brokerage arrangements
|
|
| (18,475
| )
|
|
|
|
|
|
|
|
|
TOTAL WAIVER, REIMBURSEMENT AND EXPENSE REDUCTION
|
|
|
|
|
|
| (71,349
| )
|
|
|
|
|
Net expenses
|
|
|
|
|
|
|
|
|
|
| 4,229,507
|
|
Net investment income (loss)
|
|
|
|
|
|
|
|
|
|
| (608,377
| )
|
Realized and Unrealized Gain on Investments:
| | | | | | | | | | | | |
Net realized gain on investments
| | | | | | | | | | | 16,328,739 | |
Net change in unrealized appreciation of investments
|
|
|
|
|
|
|
|
|
|
| 2,254,705
|
|
Net realized and unrealized gain on investments
|
|
|
|
|
|
|
|
|
|
| 18,583,444
|
|
Change in net assets resulting from operations
|
|
|
|
|
|
|
|
|
| $
| 17,975,067
|
|
See Notes which are an integral part of the Financial Statements
Statement of Changes in Net Assets
Year Ended October 31
|
|
| 2005
|
|
|
| 2004
| |
Increase (Decrease) in Net Assets
| | | | | | | | |
Operations:
| | | | | | | | |
Net investment income (loss)
| | $ | (608,377 | ) | | $ | (1,801,281 | ) |
Net realized gain on investments
| | | 16,328,739 | | | | 31,352,618 | |
Net change in unrealized appreciation/depreciation of investments
|
|
| 2,254,705
|
|
|
| (23,768,805
| )
|
CHANGE IN NET ASSETS RESULTING FROM OPERATIONS
|
|
| 17,975,067
|
|
|
| 5,782,532
|
|
Share Transactions:
| | | | | | | | |
Proceeds from sale of shares
| | | 39,930,819 | | | | 59,715,920 | |
Cost of shares redeemed
|
|
| (117,597,335
| )
|
|
| (90,510,454
| )
|
CHANGE IN NET ASSETS RESULTING FROM SHARE TRANSACTIONS
|
|
| (77,666,516
| )
|
|
| (30,794,534
| )
|
Change in net assets
|
|
| (59,691,449
| )
|
|
| (25,012,002
| )
|
Net Assets:
| | | | | | | | |
Beginning of period
|
|
| 254,687,716
|
|
|
| 279,699,718
|
|
End of period (including accumulated net investment income (loss) of $(1,164) and $0, respectively)
|
| $
| 194,996,267
|
|
| $
| 254,687,716
|
|
See Notes which are an integral part of the Financial Statements
Notes to Financial Statements
October 31, 2005
1. ORGANIZATION
Federated Equity Funds (the "Trust") is registered under the Investment Company Act of 1940, as amended (the "Act"), as an open-end management investment company. The Trust consists of eight portfolios. The financial statements included herein are only those of Federated Large Cap Growth Fund (the "Fund"), a diversified portfolio. The financial statements of the other portfolios are presented separately. The assets of each portfolio are segregated and a shareholder's interest is limited to the portfolio in which shares are held. The Fund offers three classes of shares: Class A Shares, Class B Shares, and Class C Shares. All shares of the Fund have equal rights with respect to voting, except on class-specific matters. The primary investment objective of the Fund is to provide appreciation of capital.
2. SIGNIFICANT ACCOUNTING POLICIES
The following is a summary of significant accounting policies consistently followed by the Fund in the preparation of its financial statements. These policies are in conformity with generally accepted accounting principles (GAAP) in the United States of America.
Investment Valuation
Listed equity securities are valued at the last sale price or official closing price reported on a national securities exchange. If unavailable, the security is generally valued at the mean between the last closing bid and asked prices. The Fund generally values short-term securities according to prices furnished by an independent pricing service, except that short-term securities with remaining maturities of less than 60 days at the time of purchase may be valued at amortized cost. Prices furnished by an independent pricing service are intended to be indicative of the mean between the bid and asked prices currently offered to institutional investors for the securities. Investments in other open-end regulated investment companies are valued at net asset value. Securities for which no quotations are readily available or whose values have been affected by a significant event occurring between the close of their primary markets and the closing of the NYSE are valued at fair value as determined in accordance with procedures established by and under general supervision of the Board of Trustees (the "Trustees").
Repurchase Agreements
It is the policy of the Fund to require the custodian bank to take possession, to have legally segregated in the Federal Reserve Book Entry System, or to have segregated within the custodian bank's vault, all securities held as collateral under repurchase agreement transactions. Additionally, procedures have been established by the Fund to monitor, on a daily basis, the market value of each repurchase agreement's collateral to ensure that the value of the collateral at least equals the repurchase price to be paid under the repurchase agreement.
The Fund will only enter into repurchase agreements with banks and other recognized financial institutions, such as broker/dealers, which are deemed by the Fund's adviser to be creditworthy pursuant to the guidelines and/or standards reviewed or established by the Trustees. Risks may arise from the potential inability of counterparties to honor the terms of the repurchase agreement. The Fund, along with other affiliated investment companies, may utilize a joint trading account for the purpose of entering into one or more repurchase agreements.
Investment Income, Gains and Losses, Expenses and Distributions
Interest income and expenses are accrued daily. Dividend income and distributions to shareholders are recorded on the ex-dividend date. Distributions of net investment income are declared and paid annually. Non-cash dividends included in dividend income, if any, are recorded at fair value. Investment income, realized and unrealized gains and losses, and certain fund-level expenses are allocated to each class based on relative average daily net assets, except that each class bears certain expenses unique to that class such as distribution and shareholder services fees. Dividends are declared separately for each class. No class has preferential dividend rights; differences in per share dividend rates are generally due to differences in separate class expenses.
Premium and Discount Amortization
All premiums and discounts on fixed income securities are amortized/accreted for financial statement purposes.
Federal Taxes
It is the Fund's policy to comply with the Subchapter M provision of the Internal Revenue Code (the "Code") and to distribute to shareholders each year substantially all of its income. Accordingly, no provision for federal income tax is necessary.
Withholding taxes, and where appropriate, deferred withholding taxes, on foreign interest, dividends and capital gains have been provided for in accordance with the applicable country's tax rules and rates.
When-Issued and Delayed Delivery Transactions
The Fund may engage in when-issued or delayed delivery transactions. The Fund records when-issued securities on the trade date and maintains security positions such that sufficient liquid assets will be available to make payment for the securities purchased. Securities purchased on a when-issued or delayed delivery basis are marked to market daily and begin earning interest on the settlement date. Losses may occur on these transactions due to changes in market conditions or the failure of counterparties to perform under the contract.
Securities Lending
The Fund participates in a securities lending program providing for the lending of corporate bonds, equity and government securities to qualified brokers. The Fund normally receives cash collateral for securities loaned that is invested in an affiliated money market fund. Collateral is maintained at a minimum level of 102% of the market value of investments loaned, plus interest, if applicable. Earnings on collateral are allocated between the securities lending agent, as a fee for its services under the program, and the Fund, according to agreed-upon rates.
As of October 31, 2005, securities subject to this type of arrangement and related collateral were as follows:
Market Value of
Securities Loaned
|
| Market Value
of Collateral
|
$276,779
|
| $283,211
|
Use of Estimates
The preparation of financial statements in conformity with GAAP requires management to make estimates and assumptions that affect the amounts of assets, liabilities, expenses and revenues reported in the financial statements. Actual results could differ from those estimated.
Other
Investment transactions are accounted for on a trade date basis. Realized gains and losses from investment transactions are recorded on an identified cost basis.
3. SHARES OF BENEFICIAL INTEREST
The following tables summarize share activity:
Year Ended October 31
|
| 2005
|
|
| 2004
|
|
Class A Shares:
|
| Shares
|
|
|
| Amount
|
|
| Shares
|
|
|
| Amount
|
|
Shares sold
| | 4,045,776 | | | $ | 32,488,458 | | | 6,029,655 | | | $ | 46,409,335 | |
Shares redeemed
|
| (10,331,242
| )
|
|
| (83,289,957
| )
|
| (6,951,396
| )
|
|
| (52,887,279
| )
|
NET CHANGE RESULTING FROM CLASS A SHARE TRANSACTIONS
|
|
(6,285,466
| )
|
|
$
|
(50,801,499
| )
|
|
(921,741
|
)
|
|
$
|
(6,477,944
|
)
|
| | | | | | | | | | | | | | |
Year Ended October 31
|
| 2005
|
|
| 2004
|
|
Class B Shares:
|
| Shares
|
|
|
| Amount
|
|
| Shares
|
|
|
| Amount
|
|
Shares sold
| | 648,423 | | | $ | 4,995,635 | | | 1,236,738 | | | $ | 9,202,313 | |
Shares redeemed
|
| (3,778,874
| )
|
|
| (29,100,067
| )
|
| (4,313,960
| )
|
|
| (31,661,850
| )
|
NET CHANGE RESULTING FROM CLASS B SHARE TRANSACTIONS
|
|
(3,130,451
| )
|
|
$
|
(24,104,432
| )
|
|
(3,077,222
| )
|
|
$
|
(22,459,537
| )
|
| | | | | | | | | | | | | | |
Year Ended October 31
|
| 2005
|
|
| 2004
|
|
Class C Shares:
|
| Shares
|
|
|
| Amount
|
|
| Shares
|
|
|
| Amount
|
|
Shares sold
| | 319,358 | | | $ | 2,446,726 | | | 555,356 | | | $ | 4,104,272 | |
Shares redeemed
|
| (680,783
| )
|
|
| (5,207,311
| )
|
| (810,747
| )
|
|
| (5,961,325
| )
|
NET CHANGE RESULTING FROM CLASS C SHARE TRANSACTIONS
|
|
(361,425
| )
|
|
$
|
(2,760,585
| )
|
|
(255,391
| )
|
|
$
|
(1,857,053
| )
|
NET CHANGE RESULTING FROM SHARE TRANSACTIONS
|
|
(9,777,342
| )
|
|
$
|
(77,666,516
| )
|
|
(4,254,354
| )
|
|
$
|
(30,794,534
| )
|
4. FEDERAL TAX INFORMATION
The timing and character of income and capital gain distributions are determined in accordance with income tax regulations, which may differ from GAAP. These differences are due to differing treatments for net operating loss.
For the year ended October 31, 2005, permanent differences identified and reclassified among the components of net assets were as follows:
Increase (Decrease)
|
Paid-In Capital
|
| Undistributed
Net Investment
Income (Loss)
|
$(607,213)
|
| $607,213
|
Net investment income (loss), net realized gains (losses), and net assets were not affected by this reclassification.
As of October 31, 2005, the components of distributable earnings on a tax basis were as follows:
Net unrealized appreciation
|
| $
| 23,692,208
|
|
Capital loss carryforward
|
| $
| (424,057,437
| )
|
The difference between book-basis and tax-basis net unrealized appreciation/depreciation is attributable to differing treatments for the tax deferral of losses on wash sales.
At October 31, 2005, the cost of investments for federal tax purposes was $170,383,680. The net unrealized appreciation of investments for federal tax purposes was $23,692,208. This consists of net unrealized appreciation from investments for those securities having an excess of value over cost of $26,475,105 and net unrealized depreciation from investments for those securities having an excess of cost over value of $2,782,897.
At October 31, 2005, the Fund had a capital loss carryforward of $(424,057,437) which will reduce the Fund's taxable income arising from future net realized gains on investments, if any, to the extent permitted by the Code and thus will reduce the amount of distributions to shareholders which would otherwise be necessary to relieve the Fund of any liability for federal tax. Pursuant to the Code, such capital loss carryforward will expire as follows:
Expiration Year
|
| Expiration Amount
|
2008
|
| $ (31,243,882
| )
|
2009
|
| $(294,478,872
| )
|
2010
|
| $ (76,646,626
| )
|
2011
|
| $ (21,688,057
| )
|
The Fund used capital loss carryforwards of $15,191,185 to offset taxable gains realized during the year ended October 31, 2005.
5. INVESTMENT ADVISER FEE AND OTHER TRANSACTIONS WITH AFFILIATES
Investment Adviser Fee
Federated Global Investment Management Corp. (FGIMC), the Fund's investment adviser (the "Adviser"), receives for its services an annual investment adviser fee equal to 0.75% of the Fund's average daily net assets. FGIMC may voluntarily choose to waive any portion of its fee. FGIMC can modify or terminate this voluntary waiver at any time at its sole discretion.
Pursuant to an Exemptive Order issued by the Securities and Exchange Commission, the Fund may invest in Prime Value Obligations Fund which is managed by the Adviser or an affiliate of the Adviser. The Adviser has agreed to reimburse the Fund for certain investment adviser fees as a result of these transactions. Income distributions earned from investments in this fund are recorded as income in the accompanying financial statements and totaled $2,405 for the period.
Administrative Fee
Federated Administrative Services (FAS), under the Administrative Services Agreement, provides the Fund with administrative personnel and services. The fee paid to FAS is based on the average aggregate daily net assets of all Federated funds as specified below:
Maximum
Administrative Fee
|
| Average Aggregate Daily Net Assets
of the Federated Funds
|
0.150%
|
| on the first $5 billion
|
0.125%
|
| on the next $5 billion
|
0.100%
|
| on the next $10 billion
|
0.075%
|
| on assets in excess of $20 billion
|
The administrative fee received during any fiscal year shall be at least $150,000 per portfolio and $40,000 per each additional class of Shares. FAS may voluntarily choose to waive any portion of its fee. FAS can modify or terminate this voluntary waiver at any time at its sole discretion. For the year ended October 31, 2005, the net fee paid to FAS was 0.076% of average aggregate daily net assets of the Fund.
Distribution Services Fee
The Fund has adopted a Distribution Plan (the "Plan") pursuant to Rule 12b-1 under the Act. Under the terms of the Plan, the Fund will compensate Federated Securities Corp. (FSC), the principal distributor, from the daily net assets of the Fund's Class A Shares, Class B Shares and Class C Shares to finance activities intended to result in the sale of these shares. The Plan provides that the Fund may incur distribution expenses according to the following schedule annually, to compensate FSC:
Share Class Name
|
| Percentage of Average Daily
Net Assets of Class
|
Class A Shares
|
| 0.25%
|
Class B Shares
|
| 0.75%
|
Class C Shares
|
| 0.75%
|
FSC may voluntarily choose to waive any portion of its fee. FSC can modify or terminate this voluntary waiver at any time at its sole discretion. Rather than paying financial intermediaries directly, the Fund may pay fees to FSC and FSC will use the fees to compensate financial intermediaries. For the year ended October 31, 2005, FSC retained $360,777 of fees paid by the Fund.
Sales Charges
For the year ended October 31, 2005, FSC retained $19,500 in sales charges from the sale of Class A Shares. FSC also retained $232 of contingent deferred sales charges relating to redemptions of Class C Shares. See "What Do Shares Cost?" in the Prospectus.
Shareholder Services Fee
The Fund may pay fees (Services Fees) up to 0.25% of the average daily net assets of the Fund's Class A Shares, Class B Shares, and Class C Shares to financial intermediaries or to Federated Shareholder Services Company (FSSC), a subsidiary of Federated Investors, Inc., for providing services to shareholders and maintaining shareholder accounts. Under certain agreements, rather than paying financial intermediaries directly, the Fund may pay Service Fees to FSSC and FSSC will use the fees to compensate financial intermediaries. FSSC or these financial intermediaries may voluntarily choose to waive any portion of their fee. This voluntary waiver can be modified or terminated at any time. For the year ended October 31, 2005, FSSC did not retain any fees paid by the Fund.
Expense Reduction
The Fund directs portfolio trades to a broker that in turn pays a portion of the Fund's operating expenses. For the year ended October 31, 2005, the Fund's expenses were reduced by $18,475 under these arrangements.
General
Certain of the Officers and Trustees of the Fund are Officers and Directors or Trustees of the above companies.
6. INVESTMENT TRANSACTIONS
Purchases and sales of investments, excluding long-term U.S. government securities and short-term obligations, for the year ended October 31, 2005, were as follows:
Purchases
|
| $
| 299,373,461
|
Sales
|
| $
| 377,041,168
|
7. CONCENTRATION OF CREDIT RISK
The Fund may invest a portion of its assets in securities of companies that are deemed by the Fund's management to be classified in similar business sectors. The economic developments within a particular sector may have an adverse effect on the ability of issuers to meet their obligations. Additionally, economic developments may have an effect on the liquidity and volatility of the portfolio securities.
8. LEGAL PROCEEDINGS
Beginning in October 2003, Federated Investors, Inc. and various subsidiaries thereof (including the advisers and distributor for various investment companies, collectively, "Federated"), along with various investment companies sponsored by Federated ("Funds") were named as defendants in several class action lawsuits now pending in the United States District Court for the District of Maryland. The lawsuits were purportedly filed on behalf of people who purchased, owned and/or redeemed shares of Federated-sponsored mutual funds during specified periods beginning November 1, 1998. The suits are generally similar in alleging that Federated engaged in illegal and improper trading practices including market timing and late trading in concert with certain institutional traders, which allegedly caused financial injury to the mutual fund shareholders. These lawsuits began to be filed shortly after Federated's first public announcement that it had received requests for information on shareholder trading activities in the Funds from the Securities and Exchange Commission ("SEC"), the Office of the New York State Attorney General ("NYAG"), and other authorities. In that regard, on November 28, 2005, Federated announced that it had reached final settlements with the SEC and the NYAG with respect to those matters. As Federated previously reported in 2004, it has already paid approximately $8.0 million to certain funds as determined by an independent consultant. As part of these settlements, Federated agreed to pay for the benefit of fund shareholders additional disgorgement and a civil money penalty in the aggregate amount of an additional $72 million. Federated and various Funds have also been named as defendants in several additional lawsuits, the majority of which are now pending in the United States District Court for the Western District of Pennsylvania, alleging, among other things, excessive advisory and rule 12b-1 fees. The Board of the Funds has retained the law firm of Dickstein Shapiro Morin & Oshinsky LLP to represent the Funds in these lawsuits. Federated and the Funds, and their respective counsel, are reviewing the allegations and will respond appropriately. Additional lawsuits based upon similar allegations may be filed in the future. The potential impact of these lawsuits, all of which seek unquantified damages, attorneys' fees and expenses, and future potential similar suits is uncertain. Although we do not believe that these lawsuits will have a material adverse effect on the Funds, there can be no assurance that these suits, the ongoing adverse publicity and/or other developments resulting from the regulatory investigations will not result in increased Fund redemptions, reduced sales of Fund shares, or other adverse consequences for the Funds.
Report of Independent Registered Public Accounting Firm
TO THE BOARD OF TRUSTEES OF FEDERATED EQUITY FUNDS AND THE SHAREHOLDERS OF FEDERATED LARGE CAP GROWTH FUND:
We have audited the accompanying statement of assets and liabilities, including the portfolio of investments, of Federated Large Cap Growth Fund (the "Fund"), a portfolio of Federated Equity Funds, as of October 31, 2005, and the related statement of operations for the year then ended, the statements of changes in net assets for each of the two years in the period then ended, and the financial highlights for each of the five years in the period then ended. These financial statements and financial highlights are the responsibility of the Fund's management. Our responsibility is to express an opinion on these financial statements and financial highlights based on our audits.
We conducted our audits in accordance with the standards of the Public Company Accounting Oversight Board (United States). Those standards require that we plan and perform the audit to obtain reasonable assurance about whether the financial statements and financial highlights are free of material misstatement. The Fund is not required to have, nor were we engaged to perform, an audit of its internal control over financial reporting. Our audits included consideration of internal control over financial reporting as a basis for designing audit procedures that are appropriate in the circumstances, but not for the purpose of expressing an opinion on the effectiveness of the Fund's internal control over financial reporting. Accordingly, we express no such opinion. An audit also includes examining, on a test basis, evidence supporting the amounts and disclosures in the financial statements, assessing the accounting principles used and significant estimates made by management, as well as evaluating the overall financial statement presentation. Our procedures included confirmation of securities owned as of October 31, 2005, by correspondence with the custodian and brokers; where replies were not received from brokers, we performed other auditing procedures. We believe that our audits provide a reasonable basis for our opinion.
In our opinion, such financial statements and financial highlights present fairly, in all material respects, the financial position of the Fund as of October 31, 2005, and the results of its operations, the changes in its net assets, and its financial highlights for the respective stated periods, in conformity with accounting principles generally accepted in the United States of America.
Deloitte & Touche LLP
Boston, Massachusetts
December 20, 2005
Board of Trustees and Trust Officers
The Board is responsible for managing the Trust's business affairs and for exercising all the Trust's powers except those reserved for the shareholders. The following tables give information about each Board member and the senior officers of the Fund. Where required, the tables separately list Board members who are "interested persons" of the Fund (i.e., "Interested" Board members) and those who are not (i.e., "Independent" Board members). Unless otherwise noted, the address of each person listed is Federated Investors Tower, 1001 Liberty Avenue, Pittsburgh, PA. As of December 31, 2004, the Trust comprised eight portfolios, and the Federated Fund Complex consisted of 44 investment companies (comprising 133 portfolios). Unless otherwise noted, each Officer is elected annually. Unless otherwise noted, each Board member oversees all portfolios in the Federated Fund Complex and serves for an indefinite term. The Fund's Statement of Additional Information includes additional information about Trust Trustees and is available, without charge and upon request, by calling 1-800-341-7400.
INTERESTED TRUSTEES BACKGROUND
|
|
|
Name
Birth Date
Address
Positions Held with Trust
Date Service Began
|
| Principal Occupation(s) for Past Five Years,
Other Directorships Held and Previous Position(s)
|
John F. Donahue*
Birth Date: July 28, 1924
CHAIRMAN AND TRUSTEE
Began serving: April 1984 | | Principal Occupations : Chairman and Director or Trustee of the Federated Fund Complex; Chairman and Director, Federated Investors, Inc.
Previous Positions : Trustee, Federated Investment Management Company and Chairman and Director, Federated Investment Counseling. |
|
|
|
J. Christopher Donahue*
Birth Date: April 11, 1949
PRESIDENT AND TRUSTEE
Began serving: January 2000 | | Principal Occupations : Principal Executive Officer and President of the Federated Fund Complex; Director or Trustee of some of the Funds in the Federated Fund Complex; President, Chief Executive Officer and Director, Federated Investors, Inc.; Chairman and Trustee, Federated Investment Management Company; Trustee, Federated Investment Counseling; Chairman and Director, Federated Global Investment Management Corp.; Chairman, Passport Research, Ltd.; Trustee, Federated Shareholder Services Company; Director, Federated Services Company.
Previous Positions : President, Federated Investment Counseling; President and Chief Executive Officer, Federated Investment Management Company, Federated Global Investment Management Corp. and Passport Research, Ltd. |
|
|
|
|
|
|
Name
Birth Date
Address
Positions Held with Trust
Date Service Began
|
| Principal Occupation(s) for Past Five Years,
Other Directorships Held and Previous Position(s)
|
Lawrence D. Ellis, M.D.*
Birth Date: October 11, 1932
3471 Fifth Avenue
Suite 1111
Pittsburgh, PA
TRUSTEE
Began serving: August 1987 | | Principal Occupations : Director or Trustee of the Federated Fund Complex; Professor of Medicine, University of Pittsburgh; Medical Director, University of Pittsburgh Medical Center Downtown; Hematologist, Oncologist and Internist, University of Pittsburgh Medical Center.
Other Directorships Held : Member, National Board of Trustees, Leukemia Society of America.
Previous Positions : Trustee, University of Pittsburgh; Director, University of Pittsburgh Medical Center. |
|
|
|
* Family relationships and reasons for "interested" status: John F. Donahue is the father of J. Christopher Donahue; both are "interested" due to the positions they hold with Federated Investors, Inc. and its subsidiaries. Lawrence D. Ellis, M.D. is "interested" because his son-in-law is employed by the Fund's principal underwriter, Federated Securities Corp.
INDEPENDENT TRUSTEES BACKGROUND
|
|
|
Name
Birth Date
Address
Positions Held with Trust
Date Service Began
|
| Principal Occupation(s) for Past Five Years,
Other Directorships Held and Previous Position(s)
|
Thomas G. Bigley
Birth Date: February 3, 1934
15 Old Timber Trail
Pittsburgh, PA
TRUSTEE
Began serving: October 1995 | | Principal Occupation : Director or Trustee of the Federated Fund Complex.
Other Directorships Held : Director, Member of Executive Committee, Children's Hospital of Pittsburgh; Director, University of Pittsburgh.
Previous Position : Senior Partner, Ernst & Young LLP. |
|
|
|
John T. Conroy, Jr.
Birth Date: June 23, 1937
Investment Properties Corporation
3838 North Tamiami Trail
Suite 402
Naples, FL
TRUSTEE
Began serving: November 1991 | | Principal Occupations : Director or Trustee of the Federated Fund Complex; Chairman of the Board, Investment Properties Corporation; Partner or Trustee in private real estate ventures in Southwest Florida.
Previous Positions : President, Investment Properties Corporation; Senior Vice President, John R. Wood and Associates, Inc., Realtors; President, Naples Property Management, Inc. and Northgate Village Development Corporation. |
|
|
|
|
|
|
Name
Birth Date
Address
Positions Held with Trust
Date Service Began
|
| Principal Occupation(s) for Past Five Years,
Other Directorships Held and Previous Position(s)
|
Nicholas P. Constantakis
Birth Date: September 3, 1939
175 Woodshire Drive
Pittsburgh, PA
TRUSTEE
Began serving: February 1998 | | Principal Occupations : Director or Trustee of the Federated Fund Complex.
Other Directorships Held : Director and Member of the Audit Committee, Michael Baker Corporation (engineering and energy services worldwide).
Previous Position : Partner, Andersen Worldwide SC. |
|
|
|
John F. Cunningham
Birth Date: March 5, 1943
353 El Brillo Way
Palm Beach, FL
TRUSTEE
Began serving: January 1999 | | Principal Occupation : Director or Trustee of the Federated Fund Complex.
Other Directorships Held : Chairman, President and Chief Executive Officer, Cunningham & Co., Inc. (strategic business consulting); Trustee Associate, Boston College.
Previous Positions : Director, Redgate Communications and EMC Corporation (computer storage systems); Chairman of the Board and Chief Executive Officer, Computer Consoles, Inc.; President and Chief Operating Officer, Wang Laboratories; Director, First National Bank of Boston; Director, Apollo Computer, Inc. |
|
|
|
Peter E. Madden
Birth Date: March 16, 1942
One Royal Palm Way
100 Royal Palm Way
Palm Beach, FL
TRUSTEE
Began serving: November 1991 | | Principal Occupation : Director or Trustee of the Federated Fund Complex.
Other Directorships Held : Board of Overseers, Babson College.
Previous Positions : Representative, Commonwealth of Massachusetts General Court; President, State Street Bank and Trust Company and State Street Corporation (retired); Director, VISA USA and VISA International; Chairman and Director, Massachusetts Bankers Association; Director, Depository Trust Corporation; Director, The Boston Stock Exchange. |
|
|
|
Charles F. Mansfield, Jr.
Birth Date: April 10, 1945
80 South Road
Westhampton Beach, NY
TRUSTEE
Began serving: January 1999 | | Principal Occupations : Director or Trustee of the Federated Fund Complex; Management Consultant; Executive Vice President, DVC Group, Inc. (marketing communications and technology) (prior to 9/1/00).
Previous Positions : Chief Executive Officer, PBTC International Bank; Partner, Arthur Young & Company (now Ernst & Young LLP); Chief Financial Officer of Retail Banking Sector, Chase Manhattan Bank; Senior Vice President, HSBC Bank USA (formerly, Marine Midland Bank); Vice President, Citibank; Assistant Professor of Banking and Finance, Frank G. Zarb School of Business, Hofstra University. |
|
|
|
|
|
|
Name
Birth Date
Address
Positions Held with Trust
Date Service Began
|
| Principal Occupation(s) for Past Five Years,
Other Directorships Held and Previous Position(s)
|
John E. Murray, Jr., J.D., S.J.D.
Birth Date: December 20, 1932
Chancellor, Duquesne University
Pittsburgh, PA
TRUSTEE
Began serving: February 1995 | | Principal Occupations : Director or Trustee of the Federated Fund Complex; Chancellor and Law Professor, Duquesne University; Partner, Murray, Hogue and Lannis.
Other Directorships Held : Director, Michael Baker Corp. (engineering, construction, operations and technical services).
Previous Positions : President, Duquesne University; Dean and Professor of Law, University of Pittsburgh School of Law; Dean and Professor of Law, Villanova University School of Law. |
|
|
|
Marjorie P. Smuts
Birth Date: June 21, 1935
4905 Bayard Street
Pittsburgh, PA
TRUSTEE
Began serving: April 1984 | | Principal Occupations : Director or Trustee of the Federated Fund Complex; Public Relations/Marketing Consultant/Conference Coordinator.
Previous Positions : National Spokesperson, Aluminum Company of America; television producer; President, Marj Palmer Assoc.; Owner, Scandia Bord. |
|
|
|
John S. Walsh
Birth Date: November 28, 1957
2604 William Drive
Valparaiso, IN
TRUSTEE
Began serving: January 1999 | | Principal Occupations : Director or Trustee of the Federated Fund Complex; President and Director, Heat Wagon, Inc. (manufacturer of construction temporary heaters); President and Director, Manufacturers Products, Inc. (distributor of portable construction heaters); President, Portable Heater Parts, a division of Manufacturers Products, Inc.
Previous Position : Vice President, Walsh & Kelly, Inc. |
|
|
|
OFFICERS
|
|
|
Name
Birth Date
Positions Held with Trust
Date Service Began
|
| Principal Occupation(s) for Past Five Years and Previous Position(s)
|
John W. McGonigle
Birth Date: October 26, 1938
EXECUTIVE VICE PRESIDENT
AND SECRETARY
Began serving: April 1984 | | Principal Occupations: Executive Vice President and Secretary of the Federated Fund Complex; Vice Chairman, Executive Vice President, Secretary and Director, Federated Investors, Inc.
Previous Positions: Trustee, Federated Investment Management Company and Federated Investment Counseling; Director, Federated Global Investment Management Corp., Federated Services Company and Federated Securities Corp. |
|
|
|
Richard J. Thomas
Birth Date: June 17, 1954
TREASURER
Began serving: November 1998 | | Principal Occupations : Principal Financial Officer and Treasurer of the Federated Fund Complex; Senior Vice President, Federated Administrative Services.
Previous Positions : Vice President, Federated Administrative Services; held various management positions within Funds Financial Services Division of Federated Investors, Inc. |
|
|
|
Richard B. Fisher
Birth Date: May 17, 1923
VICE PRESIDENT
Began serving: April 1984 | | Principal Occupations : Vice Chairman or Vice President of some of the Funds in the Federated Fund Complex; Vice Chairman, Federated Investors, Inc.; Chairman, Federated Securities Corp.
Previous Positions : President and Director or Trustee of some of the Funds in the Federated Fund Complex; Executive Vice President, Federated Investors, Inc. and Director and Chief Executive Officer, Federated Securities Corp. |
|
|
|
Stephen F. Auth
Birth Date: September 3, 1956
CHIEF INVESTMENT OFFICER
Began serving: November 2002 | | Principal Occupations : Chief Investment Officer of this Fund and various other Funds in the Federated Fund Complex; Executive Vice President, Federated Investment Counseling, Federated Global Investment Management Corp., Federated Equity Management Company of Pennsylvania and Passport Research II, Ltd.
Previous Positions : Executive Vice President, Federated Investment Management Company, and Passport Research, Ltd.; Senior Vice President, Global Portfolio Management Services Division; Senior Vice President, Federated Investment Management Company and Passport Research, Ltd.; Senior Managing Director and Portfolio Manager, Prudential Investments. |
|
|
|
|
|
|
Name
Birth Date
Positions Held with Trust
Date Service Began
|
| Principal Occupation(s) for Past Five Years and Previous Position(s)
|
Lawrence Auriana
Birth Date: January 8, 1944
VICE PRESIDENT
Began serving: November 2001 | | Lawrence Auriana has been the Fund's Portfolio Manager since February 1986. He is Vice President of the Trust. Mr. Auriana joined Federated in April 2001 as Co-Head of Investments/Federated Kaufmann. From August 1984 to April 2001, Mr. Auriana was President and Treasurer of Edgemont Asset Management Corp., and Chairman of the Board and Portfolio Manager to The Kaufmann Fund, Inc. (predecessor to the Federated Kaufmann Fund). Mr. Auriana earned a B.S. in economics from Fordham University and has been engaged in the securities business since 1965. |
|
|
|
James E. Grefenstette
Birth Date: November 7, 1962
VICE PRESIDENT
Began serving: November 1998 | | James E. Grefenstette is Vice President of the Trust. Mr. Grefenstette joined Federated in 1992 and has been a Portfolio Manager since 1994. Mr. Grefenstette became a Senior Vice President of the Fund's Adviser in January 2000. He served as a Vice President of the Fund's Adviser from 1996 through 1999 and was an Assistant Vice President of the Fund's Adviser from 1994 until 1996. Mr. Grefenstette is a Chartered Financial Analyst; he received his M.S. in Industrial Administration from Carnegie Mellon University. |
|
|
|
Hans P. Utsch
Birth Date: July 3, 1936
VICE PRESIDENT
Began serving: November 2001 | | Hans P. Utsch has been the Fund's Portfolio Manager since February 1986. He is Vice President of the Trust. Mr. Utsch joined Federated in April 2001 as Co-Head of Investments/Federated Kaufmann. From August 1984 to April 2001, Mr. Utsch was Chairman of the Board and Secretary of Edgemont Asset Management Corp., and President and Portfolio Manager to The Kaufmann Fund, Inc. (predecessor to the Federated Kaufmann Fund). Mr. Utsch graduated from Amherst College and holds an M.B.A. from Columbia University. He has been engaged in the securities business since 1962. |
|
|
|
Board Review of Advisory Contract
As required by the Act, the Fund's Board has reviewed the Fund's investment advisory contract. The Board's decision to approve the contract reflects the exercise of its business judgment on whether to continue the existing arrangements. During its review of the contract, the Board considers many factors, among the most material of which are: the Fund's investment objectives; the Adviser's management philosophy, personnel, processes, and investment and operating strategies; long-term performance; the preferences and expectations of Fund shareholders and their relative sophistication; the continuing state of competition in the mutual fund industry; the range of comparable fees for similar funds in the mutual fund industry; the range and quality of services provided to the Fund and its shareholders by the Federated organization in addition to investment advisory services; and the Fund's relationship to the Federated family of funds which include a comprehensive array of funds with different investment objectives, policies and strategies which are available for exchange without the incurrence of additional sales charge.
In its decision to appoint or renew the Adviser, the Board is mindful of the potential disruptions of the Fund's operations and various risks, uncertainties and other effects that could occur as a result of a decision to terminate or not renew an advisory contract. In particular, the Board recognizes that most shareholders have invested in the Fund on the strength of the Adviser's industry standing and reputation and in the expectation that the Adviser will have a continuing role in providing advisory services to the Fund. Thus, the Board's "selection" or approval of the Adviser must reflect the fact that it is the shareholders who have effectively selected the Adviser by virtue of having invested in the Fund. The Board also considers the compensation and benefits received by the Adviser. This includes fees received for services provided to the Fund by other entities in the Federated organization and research services received by the Adviser from brokers that execute fund trades, as well as advisory fees. In this regard, the Board is aware that various courts have interpreted provisions of the Act and have indicated in their decisions that the following factors may be relevant to an Adviser's fiduciary duty with respect to its receipt of compensation from a fund: the nature and quality of the services provided by the Adviser, including the performance of the Fund; the Adviser's cost of providing the services; the extent to which the Adviser may realize "economies of scale" as the Fund grows larger; any indirect benefits that may accrue to the Adviser and its affiliates as a result of the Adviser's relationship with the Fund; performance and expenses of comparable funds; and the extent to which the independent Board members are fully informed about all facts bearing on the Adviser's service and fee. The Fund's Board is aware of these factors and is guided by them in its review of the Fund's advisory contract to the extent they are appropriate and relevant, as discussed further below.
The Board considers and weighs these circumstances in light of its substantial accumulated experience in governing the Fund and working with Federated on matters relating to the Federated funds, and is assisted in its deliberations by the advice of independent legal counsel. In this regard, the Board requests and receives substantial and detailed information about the Fund and the Federated organization. Federated provides much of this information at each regular meeting of the Board, and furnishes additional reports in connection with the particular meeting at which the Board's formal review of the advisory contract occurs. In between regularly scheduled meetings, the Board may receive information on particular matters as the need arises. Thus, the Board's evaluation of an advisory contract is informed by reports covering such matters as: the Adviser's investment philosophy, personnel, and processes; operating strategies; the Fund's short- and long-term performance (in absolute terms, both on a gross basis and net of expenses, as well as in relationship to its particular investment program and certain competitor or "peer group" funds and/or other benchmarks, as appropriate), and comments on the reasons for performance; the Fund's expenses (including the advisory fee itself and the overall expense structure of the Fund, both in absolute terms and relative to similar and/or competing funds, with due regard for contractual or voluntary expense limitations); the use and allocation of brokerage commissions derived from trading the Fund's portfolio securities (if any); the nature and extent of the advisory and other services provided to the Fund by the Adviser and its affiliates; compliance and audit reports concerning the Federated funds and the Federated companies that service them (including communications from regulatory agencies), as well as Federated's responses to any issues raised therein; and relevant developments in the mutual fund industry and how the Federated funds and/or Federated are responding to them. The evaluation process is evolutionary, reflecting continually developing considerations. The criteria considered and the emphasis placed on relevant criteria change in recognition of changing circumstances in the mutual fund marketplace. For the past year, the Board concluded that the nature, quality and scope of services provided the fund by the Adviser and its affiliates was satisfactory.
With respect to the Fund's performance and expenses in particular, the Board has found the use of comparisons to other mutual funds with comparable investment programs to be particularly useful, given the high degree of competition in the mutual fund business. The Board focuses on comparisons with other similar mutual funds (rather than non-mutual fund products or services) because, simply put, they are more relevant. For example, other mutual funds are the products most like the Fund, they are readily available to Fund shareholders as alternative investment vehicles, and they are the type of investment vehicle in fact chosen and maintained by the Fund's investors. The range of their fees and expenses therefore appears to be a generally reliable indication of what consumers have found to be reasonable in the precise marketplace in which the Fund competes. The Fund's ability to deliver competitive performance when compared to its peer group may be a useful indicator of how the Adviser is executing on the Fund's investment program, which would in turn assist the Board in reaching a conclusion that the nature, extent, and quality of the Adviser's investment management services are such as to warrant continuation of the advisory contract. The Fund's performance fell below the median of the relevant peer group for both the one and three year periods ending December 31, 2004. The Board discussed the Fund's performance with the Adviser and recognized the efforts being undertaken by the Adviser. The Board will continue to monitor these efforts and the performance of the Fund. During the year ending December 31, 2004, the Fund's investment advisory fee after waivers and expense reimbursements, if any, was above the median of the relevant peer group. The Board reviewed the fees and other expenses of the Fund with the Adviser and was satisfied that the overall expense structure of the Fund nevertheless remained competitive. The Board will continue to monitor advisory fees and other expenses borne by the Fund.
The Board also receives financial information about Federated, including reports on the compensation and benefits Federated derives from its relationships with the Federated funds. These reports cover not only the fees under the advisory contracts, but also fees received by Federated's subsidiaries for providing other services to the Federated funds under separate contracts (e.g., for serving as the Federated funds' administrator). The reports also discuss any indirect benefit Federated may derive from its receipt of research services from brokers who execute Federated fund trades as well as waivers of fees and/or reimbursements of expenses. In order for a fund to be competitive in the marketplace, Federated and its affiliates frequently waive fees and/or reimburse expenses. Although the Board considers the costs incurred and the profitability of the Federated organization as a whole, it does not evaluate, on a fund-by-fund basis, Federated's "profitability" and/or "costs" (which would include an assessment as to whether "economies of scale" would be realized if the fund were to grow to some sufficient size). In the Board's view, the cost of performing advisory services on a fund-specific basis is both difficult to estimate satisfactorily and a relatively minor consideration in its overall evaluation. Analyzing isolated funds would require constructed allocations of the costs of shared resources and operations based on artificial assumptions that are inconsistent with the existing relationships within a large and diversified family of funds that receive advisory and other services from the same organization. In addition, the availability of the exchange privilege among funds in the Federated family makes consideration of the overall cost and profitability of Federated more relevant than that of individual funds. Based upon this review, the Board is satisfied that the costs incurred in, as well as the profitability realized from, managing the Fund and the other Federated Funds are appropriate. Although the Board is always interested in discovering any genuine "economies of scale," its experience has been that such "economies" are likely to arise only when a fund grows dramatically, and becomes and remains very large in size. Even in these instances, purchase and redemption activity, as well as the presence of expense limitations (if any), may offset any perceived economies. As suggested above, the Board considers the information it receives about the Fund's performance and expenses as compared to an appropriate set of similar competing funds to be more relevant.
The Board bases its decision to approve an advisory contract on the totality of the circumstances and relevant factors and with a view to past and future long-term considerations. Not all of the factors and considerations identified above are relevant to every Federated fund, nor does the Board consider any one of them to be determinative. With respect to the factors that are relevant, the Board's decision to approve the contract reflects its determination that Federated's performance and actions provide a satisfactory basis to support the decision to continue the existing arrangements.
Voting Proxies On Fund Portfolio Securities
A description of the policies and procedures that the Fund uses to determine how to vote proxies, if any, relating to securities held in the Fund's portfolio is available, without charge and upon request, by calling 1-800-341-7400. A report on "Form N-PX" of how the Fund voted any such proxies during the most recent 12-month period ended June 30 is available through Federated's website. Go to FederatedInvestors.com, select "Products," select the "Prospectuses and Regulatory Reports" link, then select the Fund to access the link to Form N-PX. This information is also available from the EDGAR database on the SEC's website at www.sec.gov.
Quarterly Portfolio Schedule
The Fund files with the SEC a complete schedule of its portfolio holdings, as of the close of the first and third quarters of its fiscal year, on "Form N-Q." These filings are available on the SEC's website at www.sec.gov and may be reviewed and copied at the SEC's Public Reference Room in Washington, DC. (Call 1-800-SEC-0330 for information on the operation of the Public Reference Room.) You may also access this information from the "Products" section of Federated's website at FederatedInvestors.com by clicking on "Portfolio Holdings" and selecting the name of the Fund, or by selecting the name of the Fund and clicking on "Portfolio Holdings." You must register on the website the first time you wish to access this information.
Mutual funds are not bank deposits or obligations, are not guaranteed by any bank, and are not insured or guaranteed by the U.S. government, the Federal Deposit Insurance Corporation, the Federal Reserve Board, or any other government agency. Investment in mutual funds involves investment risk, including the possible loss of principal.
This report is authorized for distribution to prospective investors only when preceded or accompanied by the Fund's prospectus, which contains facts concerning its objective and policies, management fees, expenses, and other information.
Federated
World-Class Investment Manager
Federated Large Cap Growth Fund
Federated Investors Funds
5800 Corporate Drive
Pittsburgh, PA 15237-7000
Contact us at FederatedInvestors.com
or call 1-800-341-7400.
Federated Securities Corp., Distributor
Cusip 314172842
Cusip 314172834
Cusip 314172826
G02516-01 (12/05)
Federated is a registered mark of Federated Investors, Inc. 2005 (c)Federated Investors, Inc.
Federated
World-Class Investment Manager
Federated Market Opportunity Fund
Established 2000
A Portfolio of Federated Equity Funds
5TH ANNUAL SHAREHOLDER REPORT
October 31, 2005
Class A Shares
Class B Shares
Class C Shares
FINANCIAL HIGHLIGHTS
SHAREHOLDER EXPENSE EXAMPLE
MANAGEMENT'S DISCUSSION OF FUND PERFORMANCE
PORTFOLIO OF INVESTMENTS SUMMARY TABLE
PORTFOLIO OF INVESTMENTS
STATEMENT OF ASSETS AND LIABILITIES
STATEMENT OF OPERATIONS
STATEMENT OF CHANGES IN NET ASSETS
NOTES TO FINANCIAL STATEMENTS
REPORT OF INDEPENDENT REGISTERED PUBLIC ACCOUNTING FIRM
BOARD OF TRUSTEES AND TRUST OFFICERS
BOARD REVIEW OF ADVISORY CONTRACT
VOTING PROXIES ON FUND PORTFOLIO SECURITIES
QUARTERLY PORTFOLIO SCHEDULE
Not FDIC Insured * May Lose Value * No Bank Guarantee
Financial Highlights - Class A Shares
(For a Share Outstanding Throughout Each Period)
| | Year Ended October 31,
| | Period
Ended | |
|
| 2005
|
|
| 2004
|
|
| 2003
|
|
| 2002
|
|
| 10/31/2001
| 1
|
Net Asset Value, Beginning of Period
| | $13.48 | | | $12.32 | | | $10.77 | | | $11.14 | | | $10.00 | |
Income From Investment Operations:
| | | | | | | | | | | | | | | |
Net investment income
| | 0.20 | | | 0.24 | 2 | | 0.44 | | | 0.39 | 3 | | 0.42 | |
Net realized and unrealized gain (loss) on investments, options and foreign currency transactions
|
| 0.31
|
|
| 1.26
|
|
| 1.57
|
|
| (0.30
| )3
|
| 1.13
|
|
TOTAL FROM INVESTMENT OPERATIONS
|
| 0.51
|
|
| 1.50
|
|
| 2.01
|
|
| 0.09
|
|
| 1.55
|
|
Less Distributions:
| | | | | | | | | | | | | | | |
Distributions from net investment income
| | (0.32 | ) | | (0.34 | ) | | (0.40 | ) | | (0.42 | ) | | (0.41 | ) |
Distributions from net realized gain on investments, options and foreign currency transactions
|
| (0.19
| )
|
| - --
|
|
| (0.06
| )
|
| (0.04
| )
|
| - --
|
|
TOTAL DISTRIBUTIONS
|
| (0.51
| )
|
| (0.34
| )
|
| (0.46
| )
|
| (0.46
| )
|
| (0.41
| )
|
Net Asset Value, End of Period
|
| $13.48
|
|
| $13.48
|
|
| $12.32
|
|
| $10.77
|
|
| $11.14
|
|
Total Return4
|
| 3.89
| %
|
| 12.29
| %
|
| 19.09
| %
|
| 0.56
| %
|
| 15.67
| %
|
| | | | | | | | | | | | | | | |
Ratios to Average Net Assets:
|
|
|
|
|
|
|
|
|
|
|
|
|
|
|
|
Net expenses
|
| 1.24
| %5
|
| 1.23
| %5
|
| 1.29
| %5
|
| 1.31
| %5
|
| 1.28
| %6
|
Net investment income
|
| 1.64
| %
|
| 1.83
| %
|
| 3.90
| %
|
| 3.90
| %3
|
| 4.63
| %6
|
Expense waiver/reimbursement7
|
| 0.01
| %
|
| 0.01
| %
|
| 0.00
| %8
|
| 0.00
| %8
|
| 0.99
| %6
|
Supplemental Data:
|
|
|
|
|
|
|
|
|
|
|
|
|
|
|
|
Net assets, end of period (000 omitted)
|
| $1,377,618
|
| $997,231
|
| $480,376
|
| $189,611
|
| $36,774
|
|
Portfolio turnover
|
| 61
| %
|
| 85
| %
|
| 115
| %
|
| 105
| %
|
| 60
| %
|
1 Reflects operations for the period from December 4, 2000 (start of performance) to October 31, 2001.
2 Based on average shares outstanding.
3 Effective November 1, 2001, the Fund adopted the provisions of the American Institute of Certified Public Accountants (AICPA) Audit and Accounting Guide for Investment Companies and began accreting discount/amortizing premium on long-term debt securities. The effect of this change for the year ended October 31, 2002 was to increase net investment income per share by $0.01, decrease net realized and unrealized gain/loss per share by $0.01, and increase the ratio of net investment income to average net assets from 3.75% to 3.90%. Per share, ratios and supplemental data for periods prior to November 1, 2001 have not been restated to reflect this change in presentation.
4 Based on net asset value, which does not reflect the sales charge, redemption fee, or contingent deferred sales charge, if applicable. Total returns for periods of less than one year are not annualized.
5 The net expense ratio is calculated without reduction for fees paid indirectly for directed brokerage arrangements. The net expense ratios are 1.24%, 1.23%, 1.28% and 1.31% after taking into account these expense reductions for the years ended October 31, 2005, 2004, 2003 and 2002, respectively.
6 Computed on an annualized basis.
7 This expense decrease is reflected in both the net expense and net investment income ratios shown above.
8 Represents less than 0.01%.
See Notes which are an integral part of the Financial Statements
Financial Highlights - Class B Shares
(For a Share Outstanding Throughout Each Period)
| | Year Ended October 31,
| | Period
Ended | |
|
| 2005
|
|
| 2004
|
|
| 2003
|
|
| 2002
|
|
| 10/31/2001
| 1
|
Net Asset Value, Beginning of Period
| | $13.42 | | | $12.27 | | | $10.74 | | | $11.12 | | | $10.00 | |
Income From Investment Operations:
| | | | | | | | | | | | | | | |
Net investment income
| | 0.10 | | | 0.14 | 2 | | 0.34 | | | 0.35 | 3 | | 0.38 | |
Net realized and unrealized gain (loss) on investments, options and foreign currency transactions
|
| 0.31
|
|
| 1.25
|
|
| 1.57
|
|
| (0.35
| )3
|
| 1.10
|
|
TOTAL FROM INVESTMENT OPERATIONS
|
| 0.41
|
|
| 1.39
|
|
| 1.91
|
|
| 0.00
|
|
| 1.48
|
|
Less Distributions:
| | | | | | | | | | | | | | | |
Distributions from net investment income
| | (0.22 | ) | | (0.24 | ) | | (0.32 | ) | | (0.34 | ) | | (0.36 | ) |
Distributions from net realized gain on investments, options and foreign currency transactions
|
| (0.19
| )
|
| - --
|
|
| (0.06
| )
|
| (0.04
| )
|
| - --
|
|
TOTAL DISTRIBUTIONS
|
| (0.41
| )
|
| (0.24
| )
|
| (0.38
| )
|
| (0.38
| )
|
| (0.36
| )
|
Net Asset Value, End of Period
|
| $13.42
|
|
| $13.42
|
|
| $12.27
|
|
| $10.74
|
|
| $11.12
|
|
Total Return4
|
| 3.15
| %
|
| 11.46
| %
|
| 18.16
| %
|
| (0.19
| )%
|
| 15.00
| %
|
| | | | | | | | | | | | | | | |
Ratios to Average Net Assets:
|
|
|
|
|
|
|
|
|
|
|
|
|
|
|
|
Net expenses
|
| 1.99
| %5
|
| 1.98
| %5
|
| 2.04
| %5
|
| 2.06
| %5
|
| 2.03
| %6
|
Net investment income
|
| 0.89
| %
|
| 1.08
| %
|
| 3.14
| %
|
| 3.30
| %3
|
| 3.81
| %6
|
Expense waiver/reimbursement7
|
| 0.00
| %8
|
| 0.01
| %
|
| 0.00
| %8
|
| 0.00
| %8
|
| 0.99
| %6
|
Supplemental Data:
|
|
|
|
|
|
|
|
|
|
|
|
|
|
|
|
Net assets, end of period (000 omitted)
|
| $459,181
|
| $391,890
|
| $248,695
|
| $115,531
|
| $33,481
|
|
Portfolio turnover
|
| 61
| %
|
| 85
| %
|
| 115
| %
|
| 105
| %
|
| 60
| %
|
1 Reflects operations for the period from December 4, 2000 (start of performance) to October 31, 2001.
2 Based on average shares outstanding.
3 Effective November 1, 2001, the Fund adopted the provisions of the AICPA Audit and Accounting Guide for Investment Companies and began accreting discount/amortizing premium on long-term debt securities. The effect of this change for the year ended October 31, 2002 was to increase net investment income per share by $0.01, decrease net realized and unrealized gain/loss per share by $0.01, and increase the ratio of net investment income to average net assets from 3.16% to 3.30%. Per share, ratios and supplemental data for periods prior to November 1, 2001 have not been restated to reflect this change in presentation.
4 Based on net asset value, which does not reflect the sales charge, redemption fee, or contingent deferred sales charge, if applicable. Total returns for periods of less than one year are not annualized.
5 The net expense ratio is calculated without reduction for fees paid indirectly for directed brokerage arrangements. The net expense ratios are 1.99%, 1.98%, 2.03% and 2.06% after taking into account these expense reductions for the years ended October 31, 2005, 2004, 2003 and 2002, respectively.
6 Computed on an annualized basis.
7 This expense decrease is reflected in both the net expense and net investment income ratios shown above.
8 Represents less than 0.01%.
See Notes which are an integral part of the Financial Statements
Financial Highlights - Class C Shares
(For a Share Outstanding Throughout Each Period)
| | Year Ended October 31,
| | Period
Ended | |
|
| 2005
|
|
| 2004
|
|
| 2003
|
|
| 2002
|
|
| 10/31/2001
| 1
|
Net Asset Value, Beginning of Period
| | $13.40 | | | $12.25 | | | $10.73 | | | $11.11 | | | $10.00 | |
Income From Investment Operations:
| | | | | | | | | | | | | | | |
Net investment income
| | 0.12 | | | 0.14 | 2 | | 0.32 | | | 0.36 | 3 | | 0.37 | |
Net realized and unrealized gain (loss) on investments, options and foreign currency transactions
|
| 0.29
|
|
| 1.26
|
|
| 1.58
|
|
| (0.36
| )3
|
| 1.10
|
|
TOTAL FROM INVESTMENT OPERATIONS
|
| 0.41
|
|
| 1.40
|
|
| 1.90
|
|
| 0.00
|
|
| 1.47
|
|
Less Distributions:
| | | | | | | | | | | | | | | |
Distributions from net investment income
| | (0.23 | ) | | (0.25 | ) | | (0.32 | ) | | (0.34 | ) | | (0.36 | ) |
Distributions from net realized gain on investments, options and foreign currency transactions
|
| (0.19
| )
|
| - --
|
|
| (0.06
| )
|
| (0.04
| )
|
| - --
|
|
TOTAL DISTRIBUTIONS
|
| (0.42
| )
|
| (0.25
| )
|
| (0.38
| )
|
| (0.38
| )
|
| (0.36
| )
|
Net Asset Value, End of Period
|
| $13.39
|
|
| $13.40
|
|
| $12.25
|
|
| $10.73
|
|
| $11.11
|
|
Total Return4
|
| 3.10
| %
|
| 11.54
| %
|
| 18.11
| %
|
| (0.20
| )%
|
| 14.90
| %
|
| | | | | | | | | | | | | | | |
Ratios to Average Net Assets:
|
|
|
|
|
|
|
|
|
|
|
|
|
|
|
|
Net expenses
|
| 1.99
| %5
|
| 1.98
| %5
|
| 2.04
| %5
|
| 2.06
| %5
|
| 2.03
| %6
|
Net investment income
|
| 0.89
| %
|
| 1.07
| %
|
| 3.04
| %
|
| 3.29
| %3
|
| 3.80
| %6
|
Expense waiver/reimbursement7
|
| 0.00
| %8
|
| 0.01
| %
|
| 0.00
| %8
|
| 0.00
| %8
|
| 0.99
| %6
|
Supplemental Data:
|
|
|
|
|
|
|
|
|
|
|
|
|
|
|
|
Net assets, end of period (000 omitted)
|
| $879,348
|
| $554,661
|
| $189,539
|
| $56,586
|
| $17,845
|
|
Portfolio turnover
|
| 61
| %
|
| 85
| %
|
| 115
| %
|
| 105
| %
|
| 60
| %
|
1 Reflects operations for the period from December 4, 2000 (start of performance) to October 31, 2001.
2 Based on average shares outstanding.
3 Effective November 1, 2001, the Fund adopted the provisions of the (AICPA) Audit and Accounting Guide for Investment Companies and began accreting discount/amortizing premium on long-term debt securities. The effect of this change for the year ended October 31, 2002 was to increase net investment income per share by $0.01, decrease net realized and unrealized gain/loss per share by $0.01, and increase the ratio of net investment income to average net assets from 3.15% to 3.29%. Per share, ratios and supplemental data for periods prior to November 1, 2001 have not been restated to reflect this change in presentation.
4 Based on net asset value, which does not reflect the sales charge, redemption fee, or contingent deferred sales charge, if applicable. Total returns for periods of less than one year are not annualized.
5 The net expense ratio is calculated without reduction for fees paid indirectly for directed brokerage arrangements. The net expense ratios are 1.99%, 1.99%, 2.03% and 2.06% after taking into account these expense reductions for the years ended October 31, 2005, 2004, 2003 and 2002, respectively.
6 Computed on an annualized basis.
7 This expense decrease is reflected in both the net expense and net investment income ratios shown above.
8 Represents less than 0.01%.
See Notes which are an integral part of the Financial Statements
Shareholder Expense Example
As a shareholder of the Fund, you incur two types of costs: (1) transaction costs, including sales charges (loads) on purchase or redemption payments; and (2) ongoing costs, including management fees; to the extent applicable, distribution (12b-1) fees and/or shareholder services fees; and other Fund expenses. This Example is intended to help you to understand your ongoing costs (in dollars) of investing in the Fund and to compare these costs with the ongoing costs of investing in other mutual funds. It is based on an investment of $1,000 invested at the beginning of the period and held for the entire period from May 1, 2005 to October 31, 2005.
ACTUAL EXPENSES
The first section of the table below provides information about actual account values and actual expenses. You may use the information in this section, together with the amount you invested, to estimate the expenses that you incurred over the period. Simply divide your account value by $1,000 (for example, an $8,600 account value divided by $1,000 = 8.6), then multiply the result by the number in the first section under the heading entitled "Expenses Paid During Period" to estimate the expenses attributable to your investment during this period.
HYPOTHETICAL EXAMPLE FOR COMPARISON PURPOSES
The second section of the table below provides information about hypothetical account values and hypothetical expenses based on the Fund's actual expense ratio and an assumed rate of return of 5% per year before expenses, which is not the Fund's actual return. Thus, you should not use the hypothetical account values and expenses to estimate the actual ending account balance or your expenses for the period. Rather, these figures are provided to enable you to compare the ongoing costs of investing in the Fund and other funds. To do so, compare this 5% hypothetical example with the 5% hypothetical examples that appear in the shareholder reports of the other funds.
Please note that the expenses shown in the table are meant to highlight your ongoing costs only and do not reflect any transaction costs, such as sales charges (loads) on purchase or redemption payments. Therefore, the second section of the table is useful in comparing ongoing costs only, and will not help you determine the relative total costs of owning different funds. In addition, if these transaction costs were included, your costs would have been higher.
|
| Beginning
Account Value
5/1/2005
|
| Ending
Account Value
10/31/2005
|
| Expenses Paid
During Period1
|
Actual:
|
|
|
|
|
|
|
Class A Shares
|
| $1,000
|
| $1,035.00
|
| $ 6.51
|
Class B Shares
|
| $1,000
|
| $1,031.40
|
| $10.34
|
Class C Shares
|
| $1,000
|
| $1,031.50
|
| $10.34
|
Hypothetical (assuming a 5% return before expenses):
|
|
|
|
|
|
|
Class A Shares
|
| $1,000
|
| $1,018.80
|
| $ 6.46
|
Class B Shares
|
| $1,000
|
| $1,015.02
|
| $10.26
|
Class C Shares
|
| $1,000
|
| $1,015.02
|
| $10.26
|
1 Expenses are equal to the Fund's annualized net expense ratios, multiplied by the average account value over the period, multiplied by 184/365 (to reflect the one-half year period). The annualized net expense ratios are as follows:
Class A Shares
|
| 1.27%
|
Class B Shares
|
| 2.02%
|
Class C Shares
|
| 2.02%
|
Management Discussion of Fund Performance
The fund's total return, based on net asset value, for the fiscal year ended October 31, 2005 was 3.89% for Class A Shares, 3.15% for Class B Shares, and 3.10% for Class C Shares. The total return for the 70% Russell 3000 Value Index/30% Merrill Lynch 91 Day Treasury Bill Index was 9.30% for the same period.1 The fund's total return for the fiscal year reflected actual cash flows, transaction costs, and other expenses which were not reflected in the total return of the Index. The Lipper Flexible Fund average return for the period was 8.23%.2
MARKET OVERVIEW
The U.S. stock market produced almost its entire gain over the reporting period in the last two months of 2004. The U.S. dollar continued its declining trend in the last two months of 2004 but reversed and moved sharply higher through the first ten months of 2005.
FUND PERFORMANCE
The fund's strategy is an unconventional one that includes holding cash and using put options to emphasize capital preservation when valuations and market risks seem high. This will cause the fund's returns to lag those of market benchmarks and peers during periods of rising stock prices. In addition, the fund tends to have substantial non-U.S. investments that are generally not hedged against changes in currency values. Periods of rising values of the U.S. dollar in foreign exchange markets will cause currency losses on the fund's non-U.S. investments as foreign market prices become worth less when converted into (more expensive) U.S. dollars.
1 The 70% Russell 3000 Value Index/30% Merrill Lynch 91 Day Treasury Bill Index measures the performance of those Russell 3000 Index companies with lower price-to-book ratios and lower forecasted growth values. The stocks in this index are also members of either the Russell 1000 Value or the Russell 2000 Value indexes. Merrill Lynch 91 Day Treasury Bill Index measures the return on U.S. Treasury Bills maturing in 90 days. Indexes are unmanaged. Individuals cannot invest in an index.
2 Lipper figures represent the average of the total returns by all of the mutual designated by Lipper, Inc. as falling into the category indicated. Figures do not reflect sales charges.
Both of these market conditions occurred during the fund's latest fiscal year. First, the U.S. stock market rose sharply in the last two months of 2004, and the fund's put options on the U.S. market fell sharply in price. The fund also had large holdings of cash equivalents and short-term government bonds, which resulted in lagging returns in a sharply rising stock market. The fund later offset most of the losses on put options with gains on put options so far in 2005. Second, the U.S. dollar has rebounded sharply in 2005, resulting in currency losses on the fund's non-U.S. holdings. For example, the Japanese yen declined 13% and the Swedish krona fell 20% in 2005 through October. These currency declines reduced the value of the fund's investments in Japanese equities and Japanese and Swedish government instruments. The Canadian dollar held its value much better, as it gained a bit more than 1% against the U.S. dollar so far in 2005.
Among individual holdings, energy stocks contributed the most to the fund's return, led by Husky Energy, Petro-Canada, Statoil, OMV, and Santos. Gold stocks, particularly Placer Dome and AngloGold Ashanti, had the next best contribution. Japanese stocks, particularly Kirin Brewery, Takeda Pharmaceutical, and NTT Urban Development, were next. Put options on Dell Computer and Best Buy also made significant positive contributions. Aside from losses on foreign currency and put options, the fund was negatively impacted by Daiichi Sankyo stock and put options on SanDisk.
GROWTH OF A $10,000 INVESTMENT - CLASS A SHARES
The graph below illustrates the hypothetical investment of $10,0001 in Federated Market Opportunity Fund (Class A Shares) (the "Fund") from December 4, 2000 (start of performance) to October 31, 2005, compared to the Russell Mid-Cap Value Index (RMCV)2,3, the Russell 3000 Value Index (R3000V)2,3 and the 70% Russell 3000 Value Index/30% Merrill Lynch 91 Day Treasury Bill Index (70%R3000V/30%ML91DTB)2.
Average Annual Total Return4 for the Period Ended 10/31/2005
|
|
|
|
1 Year
|
| (1.79
| )%
|
Start of Performance (12/4/2000)
|
| 9.01
| %
|

Performance data quoted represents past performance which is no guarantee of future results. Investment return and principal value will fluctuate so that an investor's shares, when redeemed, may be worth more or less than their original cost. Mutual fund performance changes over time and current performance may be lower or higher than what is stated. For current to the most recent month-end performance and after-tax returns, visit FederatedInvestors.com or call 1-800-341-7400. Returns shown do not reflect the deduction of taxes that a shareholder would pay on Fund distributions or the redemption of Fund shares. Mutual funds are not obligations of or guaranteed by any bank and are not federally insured. Total returns shown include the maximum sales charge of 5.50%.
1 Represents a hypothetical investment of $10,000 in the Fund after deducting the maximum sales charge of 5.50% ($10,000 investment minus $550 sales charge = $9,450). The Fund's performance assumes the reinvestment of all dividends and distributions. The RMCV, the R3000V and the 70%R3000V/30%ML91DTB have been adjusted to reflect reinvestment of dividends on securities in the indexes.
2 The RMCV, the R3000V and the 70%RMCV/30%ML91DTB are not adjusted to reflect sales charges, expenses, or other fees that the Securities and Exchange Commission (SEC) requires to be reflected in the Fund's performance. The indexes are unmanaged and, unlike the Fund, are not affected by cashflows. It is not possible to invest in an index.
3 The Fund's Adviser has elected to change the benchmark index from the RMCV to the R3000V because the R3000V is more reflective of the securities in which the Fund invests.
4 Total returns quoted reflect all applicable sales charges.
GROWTH OF A $10,000 INVESTMENT - CLASS B SHARES
The graph below illustrates the hypothetical investment of $10,0001 in Federated Market Opportunity Fund (Class B Shares) (the "Fund") from December 4, 2000 (start of performance) to October 31, 2005, compared to the Russell Mid-Cap Value Index (RMCV)2,3, the Russell 3000 Value Index (R3000V)2,3 and the 70% Russell 3000 Value Index/30% Merrill Lynch 91 Day Treasury Bill Index (70%R3000V/30%ML91DTB).2
Average Annual Total Return4 for the Period Ended 10/31/2005
|
|
|
|
1 Year
|
| (2.35
| )%
|
Start of Performance (12/4/2000)
|
| 9.19
| %
|
Performance data quoted represents past performance which is no guarantee of future results. Investment return and principal value will fluctuate so that an investor's shares, when redeemed, may be worth more or less than their original cost. Mutual fund performance changes over time and current performance may be lower or higher than what is stated. For current to the most recent month-end performance and after-tax returns, visit FederatedInvestors.com or call 1-800-341-7400. Returns shown do not reflect the deduction of taxes that a shareholder would pay on Fund distributions or the redemption of Fund shares. Mutual funds are not obligations of or guaranteed by any bank and are not federally insured. Total returns shown include the maximum contingent deferred sales charge of 5.50% as applicable.
1 Represents a hypothetical investment of $10,000 in the Fund. The maximum contingent deferred sales charge is 5.50% on any redemption less than one year from the purchase date. The Fund's performance assumes the reinvestment of all dividends and distributions. The RMCV, the R3000V and the 70%R3000V/30%ML91DTB have been adjusted to reflect reinvestment of dividends on securities in the indexes.
2 The RMCV, the R3000V and the 70%R3000V/30%ML91DTB are not adjusted to reflect sales charges, expenses, or other fees that the SEC requires to be reflected in the Fund's performance. The indexes are unmanaged and, unlike the Fund, are not affected by cashflows. It is not possible to invest in an index.
3 The Fund's Adviser has elected to change the benchmark index from the RMCV to the R3000V because the R3000V is more reflective of the securities in which the Fund invests.
4 Total returns quoted reflect all applicable contingent deferred sales charges.
GROWTH OF A $10,000 INVESTMENT - CLASS C SHARES
The graph below illustrates the hypothetical investment of $10,0001 in Federated Market Opportunity Fund (Class C Shares) (the "Fund") from December 4, 2000 (start of performance) to October 31, 2005, compared to the Russell Mid-Cap Value Index (RMCV)2,3, the Russell 3000 Value Index (R3000V)2,3 and the 70% Russell 3000 Value Index/30% Merrill Lynch 91 Day Treasury Bill Index (70%R3000V/30%ML91DTB)2.
Average Annual Total Return4 for the Period Ended 10/31/2005
|
|
|
1 Year
|
| 1.04%
|
Start of Performance (12/4/2000)
|
| 9.23%
|
Performance data quoted represents past performance which is no guarantee of future results. Investment return and principal value will fluctuate so that an investor's shares, when redeemed, may be worth more or less than their original cost. Mutual fund performance changes over time and current performance may be lower or higher than what is stated. For current to the most recent month-end performance and after-tax returns, visit FederatedInvestors.com or call 1-800-341-7400. Returns shown do not reflect the deduction of taxes that a shareholder would pay on Fund distributions or the redemption of Fund shares. Mutual funds are not obligations of or guaranteed by any bank and are not federally insured. Total returns shown include the maximum sales charge of 1.00% and the 1.00% contingent deferred sales charge as applicable.
1 Represents a hypothetical investment of $10,000 in the Fund after deducting the maximum sales charge of 1.00% ($10,000 investment minus $100 sales charge = $9,900). A 1.00% contingent deferred sales charge would be applied to any redemption less than one year from the purchase date. The Fund's performance assumes the reinvestment of all dividends and distributions. The RMCV, the R3000V and the 70%R3000V/30%ML91DTB have been adjusted to reflect reinvestment of dividends on securities in the indexes.
2 The RMCV, the R3000V and the 70%R3000V/30%ML91DTB are not adjusted to reflect sales charges, expenses, or other fees that the SEC requires to be reflected in the Fund's performance. The indexes are unmanaged and, unlike the Fund, are not affected by cashflows. It is not possible to invest in an index.
3 The Fund's Adviser has elected to change the benchmark index from the RMCV to the R3000V because the R3000V is more reflective of the securities in which the Fund invests.
4 Total return quoted reflects all applicable sales charges and contingent deferred sales charges.
Performance data quoted represents past performance which is no guarantee of future results. Investment return and principal value will fluctuate so that an investor's shares, when redeemed, may be worth more or less than their original cost. Mutual fund performance changes over time and current performance may be lower or higher than what is stated. For current to the most recent month-end performance, visit FederatedInvestors.com or call 1-800-341-7400.
Portfolio of Investments Summary Table
At October 31, 2005, the Fund's portfolio composition1 by asset class was as follows:
|
| Percentage of
Total Net Assets
|
U.S. Fixed Income Securities
|
| 44.7%
|
International Fixed-Income Securities
|
| 13.5%
|
International Equity Securities2
|
| 12.7%
|
U.S. Equity Securities2
|
| 2.9%
|
Options
|
| 1.4%
|
Cash Equivalents3
|
| 23.8%
|
Other Assets and Liabilities4--Net
|
| 1.0%
|
TOTAL
|
| 100.0%
|
1 See the Fund's Prospectus for a description of the principal types of securities in which the Fund invests.
2 Equity securities include securities convertible into equity securities.
3 Cash Equivalents includes investments in money market mutual funds and/or overnight repurchase agreements.
4 See Statement of Asset and Liabilities.
Portfolio of Investments
October 31, 2005
Shares
|
|
|
|
| Value
|
| | | COMMON STOCKS--13.1% | | | |
| | | Beverages--1.0% | | | |
| 2,397,000 | | Kirin Brewery Co. Ltd.
|
| $
| 26,543,515
|
| | | Containers & Packaging--0.3% | | | |
| 259,582 | | Mayr-Melnhof Karton AG, ADR
|
|
| 8,892,916
|
| | | Diversified Telecommunication Services--0.4% | | | |
| 3,614,100 | | Telstra Corp. Ltd.
|
|
| 11,368,882
|
| | | Food & Staples Retailing--0.3% | | | |
| 350,800 | | Boots Group PLC, ADR
|
|
| 7,717,600
|
| | | Leisure Equipment & Products--0.3% | | | |
| 252,900 | | Fuji Photo Film Co., ADR
|
|
| 8,105,445
|
| | | Metals & Mining--2.7% | | | |
| 420,500 | | Anglo American PLC
| | | 12,422,432 |
| 834,800 | | Harmony Gold Mining Co. Ltd., ADR
| | | 8,723,660 |
| 233,600 | | Newmont Mining Corp.
| | | 9,951,360 |
| 2,068,100 | | Placer Dome, Inc.
|
|
| 41,258,595
|
| | | TOTAL
|
|
| 72,356,047
|
| | | Oil & Gas--1.8% | | | |
| 137,400 | | OMV AG, ADR
| | | 7,405,681 |
| 360,400 | | Petro-Canada
| | | 12,559,533 |
| 329,600 | | Royal Dutch Shell PLC, Class A, ADR
| | | 20,448,384 |
| 240,700 | | Santos Ltd., ADR
|
|
| 7,878,111
|
| | | TOTAL
|
|
| 48,291,709
|
| | | Pharmaceuticals--4.9% | | | |
| 1,182,500 | | Astellas Pharma, Inc.
| | | 42,283,437 |
| 2,423,600 | | Daiichi Sankyo Co. Ltd.
| | | 43,929,181 |
| 279,400 | | Ono Pharmaceutical Co. Ltd.
| | | 12,450,540 |
| 516,000 | | Taisho Pharmaceutical Co.
| | | 9,268,523 |
| 280,400 | | Takeda Pharmaceutical Co. Ltd.
| | | 15,418,565 |
| 1,028,000 | | Tanabe Seiyaku Co. Ltd.
|
|
| 9,910,355
|
| | | TOTAL
|
|
| 133,260,601
|
Shares or
Principal
Amount
|
|
|
|
| Value
|
| | | COMMON STOCKS--continued | | | |
| | | Real Estate--1.4% | | | |
| 6,188,600 | | Investa Property Group
| | $ | 9,035,977 |
| 5,139,700 | | Mirvac Group
| | | 14,712,368 |
| 2,500 | | NTT Urban Development
|
|
| 14,560,605
|
| | | TOTAL
|
|
| 38,308,950
|
| | | TOTAL COMMON STOCKS (IDENTIFIED COST $300,536,385)
|
|
| 354,845,665
|
| | | CORPORATE BONDS--0.6% | | | |
| | | Healthcare Providers & Services--0.6% | | | |
| $ | 18,500,000 | | Tenet Healthcare Corp., 6.50%, 6/1/2012 (IDENTIFIED COST $16,596,250)
|
|
| 16,187,500
|
| | | GOVERNMENTS/AGENCIES--13.9% | | | |
| 27,630,000 | | Bundesobligation, 3.25%, 4/9/2010
| | | 33,551,928 |
| 29,600,000 | | Bundesschatzanweisungen, Note, 2.50%, 3/23/2007
| | | 35,420,914 |
| 1,180,000,000 | | European Investment Bank, 2.125%, 9/20/2007
| | | 10,522,790 |
| 4,600,000,000 | | Japan, Government of, 1/20/2006
| | | 39,515,159 |
| 3,250,000,000 | | Japan, Government of, Bond,.10%, 10/20/2006
| | | 27,920,350 |
| 3,250,000,000 | | Japan, Government of, Bond,.10%, 12/20/2006
| | | 27,910,747 |
| 467,500,000 | | Sweden, Government of, 9/20/2006
| | | 57,739,432 |
| 240,000,000 | | Sweden, Government of, Bond, 4.00%, 12/1/2009
| | | 31,538,052 |
| 301,000,000 | | Sweden, Government of, Bond, 5.00%, 1/28/2009
| | | 40,521,673 |
| 18,850,000 | | U.K. Treasury, Bond, 4.75%, 6/7/2010
| | | 33,944,360 |
| 21,800,000 | | U.K. Treasury, Gilt, 4.50%, 3/7/2007
|
|
| 38,721,034
|
| | | TOTAL GOVERNMENT/AGENCIES (IDENTIFIED COST $401,927,891)
|
|
| 377,306,439
|
| | | PREFERRED STOCKS--2.5% | | | |
| | | Metals & Mining--2.6% | | | |
| 734,272 | 2 | Morgan Stanley & Co., Inc., PERCS
| | | 29,969,312 |
| 508,000 | 2 | Morgan Stanley & Co., Inc., PERCS
| | | 12,209,780 |
| 1,585,000 | 2 | Morgan Stanley & Co., Inc., PERCS
|
|
| 27,238,225
|
| | | TOTAL PREFERRED STOCKS (IDENTIFIED COST $62,498,999)
|
|
| 69,417,317
|
| | | U.S. TREASURY--43.7% | | | |
| 60,000,000 | | United States Treasury Note, 1.50%, 3/31/2006
| | | 59,360,154 |
| 60,000,000 | | United States Treasury Note, 1.875%, 11/30/2005
| | | 59,906,250 |
| 65,000,000 | | United States Treasury Note, 1.875%, 12/31/2005
| | | 64,774,021 |
Principal
Amount
or Shares
|
|
|
|
| Value
|
| | | U.S. TREASURY--continued | | | |
| $ | 60,000,000 | | United States Treasury Note, 2.25%, 4/30/2006
| | $ | 59,423,436 |
| 60,000,000 | | United States Treasury Note, 2.375%, 8/15/2006
| | | 59,098,398 |
| 40,000,000 | | United States Treasury Note, 2.50%, 5/31/2006
| | | 39,606,248 |
| 65,000,000 | | United States Treasury Note, 2.75%, 6/30/2006
| | | 64,355,356 |
| 55,500,000 | | United States Treasury Note, 3.00%, 11/15/2007
| | | 54,019,260 |
| 65,000,000 | | United States Treasury Note, 3.00%, 12/31/2006
| | | 63,973,774 |
| 57,000,000 | | United States Treasury Note, 3.375%, 2/15/2008
| | | 55,726,723 |
| 75,000,000 | | United States Treasury Note, 3.50%, 5/31/2007
| | | 73,995,938 |
| 56,200,000 | | United States Treasury Note, 3.625%, 1/15/2010
| | | 54,394,137 |
| 75,000,000 | | United States Treasury Note, 3.625%, 4/30/2007
| | | 74,163,555 |
| 59,000,000 | | United States Treasury Note, 4.00%, 2/15/2015
| | | 56,422,703 |
| 57,000,000 | | United States Treasury Note, 4.00%, 3/15/2010
| | | 55,956,968 |
| 80,000,000 | | United States Treasury Note, 4.00%, 9/30/2007
| | | 79,431,536 |
| 80,000,000 | | United States Treasury Note, 4.125%, 8/15/2008
| | | 79,412,496 |
| 80,000,000 | | United States Treasury Note, 4.25%, 10/31/2007
| | | 79,793,752 |
| 55,500,000 | | United States Treasury Note, 4.25%, 11/15/2014
|
|
| 54,148,236
|
| | | TOTAL U.S. TREASURY (IDENTIFIED COST $1,194,793,968)
|
|
| 1,187,962,941
|
| | | PURCHASE PUT OPTIONS--1.4% | | | |
| | | Communications Equipment--0.2% | | | |
| 6,000 | 1 | Qualcomm, Inc., Expiration Date 1/16/2006
|
|
| 5,880,000
|
| | | Computers & Peripherals--0.1% | | | |
| 5,500 | 1 | Apple Computer, Inc., Expiration Date 1/21/2006
| | | 2,365,000 |
| 6,000 | 1 | Sandisk Corp., Expiration Date 1/21/2006
|
|
| 1,650,000
|
| | | TOTAL
|
|
| 4,015,000
|
| | | Internet & Catalog Retail--0.3% | | | |
| 5,500 | 1 | Amazon.com, Inc., Expiration Date 1/24/2006
|
|
| 8,305,000
|
| | | Internet Software & Services--0.1% | | | |
| 800 | 1 | Google Inc., Expiration Date 1/21/2006
|
|
| 1,368,000
|
| | | Semiconductor Equipment & Products--0.5% | | | |
| 5,000 | 1 | KLA-Tencor Corp., Expiration Date 12/16/2005
| | | 4,400,000 |
| 12,000 | 1 | National Semiconductor Corp., Expiration Date 1/21/2006
| | | 6,120,000 |
| 10,000 | 1 | Texas Instruments, Inc., Expiration Date 1/23/2006
|
|
| 2,450,000
|
| | | TOTAL
|
|
| 12,970,000
|
Shares or
Principal
Amount
|
|
|
|
| Value
|
| | | PURCHASE PUT OPTIONS--continued | | | |
| | | Specialty Retail--0.1% | | | |
| 4,000 | 1 | Best Buy Co., Inc., 1/23/2006, Expiration Date 1/21/2006
|
| $
| 3,960,000
|
| | | TOTAL PURCHASE PUT OPTIONS (IDENTIFIED COST $39,228,922)
|
|
| 36,498,000
|
| | | REPURCHASE AGREEMENTS--23.8% | | | |
| $ | 146,053,000 | | Interest in $3,500,000,000 joint repurchase agreement 4.04%, dated 10/31/2005, under which Bank of America N.A. will repurchase a U.S. Government Agency security with a maturity of 7/1/2035 for $3,500,392,778 on 11/1/2005. The market value of the underlying security at the end of the period was $3,570,000,001.
| | | 146,053,000 |
| 500,000,000 | | Interest in $1,500,000,000 joint repurchase agreement 4.04%, dated 10/31/2005, under which Barclays Capital, Inc. will repurchase U.S. Government Agency securities with various maturities to 9/29/2025 for $1,500,168,333 on 11/1/2005. The market value of the underlying securities at the end of the period was $1,530,172,587.
|
|
| 500,000,000
|
| | | TOTAL REPURCHASE AGREEMENTS (AT AMORTIZED COST)
|
|
| 646,053,000
|
| | | TOTAL INVESTMENTS--99.0%
(IDENTIFIED COST $2,661,635,415)3
|
|
| 2,688,270,862
|
| | | OTHER ASSETS AND LIABILITIES - NET--1.0%
|
|
| 27,875,838
|
| | | TOTAL NET ASSETS--100%
|
| $
| 2,716,146,700
|
1 Non-income producing security.
2 Denotes a restricted security, including securities purchased under Rule 144A of the Securities Act of 1933. These securities, all of which have been deemed liquid by criteria approved by the Fund's Board of Trustees, unless registered under the Act or exempted from registration, may only be sold to qualified institutional investors. At October 31, 2005, these securities amounted to $69,417,317 which represents 2.6% of total net assets.
3 The cost of investments for federal tax purposes amounts to $2,660,686,114.
Note: The categories of investments are shown as a percentage of total net assets at October 31, 2005.
The following acronyms are used throughout this portfolio:
| ADR | - --American Depositary Receipt |
| PERCS | - --Preferred Equity Redemption Cumulative Stock |
See Notes which are an integral part of the Financial Statements
Statement of Assets and Liabilities
October 31, 2005
Assets:
| | | | | | |
Investments in securities
| | $ | 2,042,217,862 | | | |
Investments in repurchase agreements
|
|
| 646,053,000
|
|
|
|
Total investments in securities, (identified cost $2,661,635,415)
| | | | | $ | 2,688,270,862 |
Cash
| | | | | | 11,575 |
Cash denominated in foreign currencies (identified cost $5,567,610)
| | | | | | 5,466,050 |
Income receivable
| | | | | | 15,020,993 |
Receivable for shares sold
|
|
|
|
|
| 14,103,679
|
TOTAL ASSETS
|
|
|
|
|
| 2,722,873,159
|
Liabilities:
| | | | | | |
Payable for shares redeemed
| | | 4,424,620 | | | |
Payable for transfer and dividend disbursing agent fees and expenses
| | | 684,709 | | | |
Payable for distribution services fee (Note 5)
| | | 844,797 | | | |
Payable for shareholder services fee (Note 5)
| | | 571,308 | | | |
Accrued expenses
|
|
| 201,025
|
|
|
|
TOTAL LIABILITIES
|
|
|
|
|
| 6,726,459
|
Net assets for 202,026,673 shares outstanding
|
|
|
|
| $
| 2,716,146,700
|
Net Assets Consist of:
| | | | | | |
Paid-in capital
| | | | | $ | 2,524,282,977 |
Net unrealized appreciation of investments and translation of assets and liabilities in foreign currency
| |
| | | | 26,331,761 |
Accumulated net realized gain on investments, options and foreign currency transactions
| | | | | | 163,640,165 |
Undistributed net investment income
|
|
|
|
|
| 1,891,797
|
TOTAL NET ASSETS
|
|
|
|
| $
| 2,716,146,700
|
Net Asset Value, Offering Price and Redemption Proceeds Per Share
| | | | | | |
Class A Shares:
| | | | | | |
Net asset value per share ($1,377,617,546 ÷ 102,159,481 shares outstanding), no par value, unlimited shares authorized
|
|
|
|
|
| $13.48
|
Offering price per share (100/94.50 of $13.48)1
|
|
|
|
|
| $14.26
|
Redemption proceeds per share
|
|
|
|
|
| $13.48
|
Class B Shares:
| | | | | | |
Net asset value per share ($459,181,328 ÷ 34,212,579 shares outstanding), no par value, unlimited shares authorized
|
|
|
|
|
| $13.42
|
Offering price per share
|
|
|
|
|
| $13.42
|
Redemption proceeds per share (94.50/100 of $13.42)1
|
|
|
|
|
| $12.68
|
Class C Shares:
| | | | | | |
Net asset value per share ($879,347,826 ÷ 65,654,613 shares outstanding), no par value, unlimited shares authorized
|
|
|
|
|
| $13.39
|
Offering price per share (100/99.00 of $13.39)1
|
|
|
|
|
| $13.53
|
Redemption proceeds per share (99.00/100 of $13.39)1
|
|
|
|
|
| $13.26
|
1 See "What Do Shares Cost?" in the Prospectus.
See Notes which are an integral part of the Financial Statements
Statement of Operations
Year Ended October 31, 2005
Investment Income:
| | | | | | | | | | | | |
Dividends (including $461,331 received from affiliated issuers (Note 5) and net of foreign taxes withheld of $1,183,409)
| | | | | | | | | | $ | 16,428,587 | |
Interest
|
|
|
|
|
|
|
|
|
|
| 51,564,328
|
|
TOTAL INCOME
|
|
|
|
|
|
|
|
|
|
| 67,992,915
|
|
Expenses:
| | | | | | | | | | | | |
Investment adviser fee (Note 5)
| | | | | | $ | 17,676,620 | | | | | |
Administrative personnel and services fee (Note 5)
| | | | | | | 1,887,888 | | | | | |
Custodian fees
| | | | | | | 276,959 | | | | | |
Transfer and dividend disbursing agent fees and expenses
| | | | | | | 2,909,689 | | | | | |
Directors'/Trustees' fees
| | | | | | | 19,314 | | | | | |
Auditing fees
| | | | | | | 42,258 | | | | | |
Legal fees
| | | | | | | 8,438 | | | | | |
Portfolio accounting fees
| | | | | | | 215,653 | | | | | |
Distribution services fee--Class B Shares (Note 5)
| | | | | | | 3,243,574 | | | | | |
Distribution services fee--Class C Shares (Note 5)
| | | | | | | 5,451,099 | | | | | |
Shareholder services fee--Class A Shares (Note 5)
| | | | | | | 2,973,700 | | | | | |
Shareholder services fee--Class B Shares (Note 5)
| | | | | | | 1,081,191 | | | | | |
Shareholder services fee--Class C Shares (Note 5)
| | | | | | | 1,816,393 | | | | | |
Share registration costs
| | | | | | | 183,825 | | | | | |
Printing and postage
| | | | | | | 238,989 | | | | | |
Insurance premiums
| | | | | | | 19,932 | | | | | |
Miscellaneous
|
|
|
|
|
|
| 9,677
|
|
|
|
|
|
TOTAL EXPENSES
|
|
|
|
|
|
| 38,055,199
|
|
|
|
|
|
Waivers, Reimbursement and Expense Reduction:
| | | | | | | | | | | | |
Reimbursement of investment adviser fee (Note 5)
| | $ | (2,048 | ) | | | | | | | | |
Waiver of administrative personnel and services fee (Note 5)
| | | (91,944 | ) | | | | | | | | |
Reimbursement of shareholder services fee--Class A Shares
| | | (44,225 | ) | | | | | | | | |
Fees paid indirectly from directed brokerage arrangements
|
|
| (17,603
| )
|
|
|
|
|
|
|
|
|
TOTAL WAIVERS, REIMBURSEMENT AND EXPENSE REDUCTION
|
|
|
|
|
|
| (155,820
| )
|
|
|
|
|
Net expenses
|
|
|
|
|
|
|
|
|
|
| 37,899,379
|
|
Net investment income
|
|
|
|
|
|
|
|
|
|
| 30,093,536
|
|
Realized and Unrealized Gain (Loss) on Investments, Options and Foreign Currency Transactions:
| | | | | | | | | | | | |
Net realized gain on investments, options and foreign currency transactions (including realized gain of $2,969,394 on sales of investments in affiliated issuers) (Note 5)
| | | | | | | | | | | 162,740,379 | |
Net change in unrealized appreciation of investments and translation of assets and liabilities in foreign currency
|
|
|
|
|
|
|
|
|
|
|
(101,787,161
| )
|
Net realized and unrealized gain on investments, options and foreign currency transactions
|
|
|
|
|
|
|
|
|
|
| 60,953,218
|
|
Change in net assets resulting from operations
|
|
|
|
|
|
|
|
|
|
| $91,046,754
|
|
See Notes which are an integral part of the Financial Statements
Statement of Changes in Net Assets
Year Ended October 31
|
|
| 2005
|
|
|
| 2004
|
|
Increase (Decrease) in Net Assets
| | | | | | | | |
Operations:
| | | | | | | | |
Net investment income
| | $ | 30,093,536 | | | $ | 20,493,511 | |
Net realized gain on investments, options and foreign currency transactions
| | | 162,740,379 | | | | 58,511,444 | |
Net change in unrealized appreciation/depreciation of investments, options and translation of assets and liabilities in foreign currency
|
|
| (101,787,161
| )
|
|
| 73,503,123
|
|
CHANGE IN NET ASSETS RESULTING FROM OPERATIONS
|
|
| 91,046,754
|
|
|
| 152,508,078
|
|
Distributions to Shareholders:
| | | | | | | | |
Distributions from net investment income
| | | | | | | | |
Class A Shares
| | | (27,869,225 | ) | | | (18,097,240 | ) |
Class B Shares
| | | (7,160,148 | ) | | | (5,759,543 | ) |
Class C Shares
| | | (11,675,931 | ) | | | (6,502,821 | ) |
Distributions from net realized gains on investments and foreign currency transactions
| | | | | | | | |
Class A Shares
| | | (13,822,945 | ) | | | - -- | |
Class B Shares
| | | (5,496,489 | ) | | | - -- | |
Class C Shares
|
|
| (7,925,043
| )
|
|
| - --
|
|
CHANGE IN NET ASSETS RESULTING FROM DISTRIBUTIONS TO SHAREHOLDERS
|
|
| (73,949,781
| )
|
|
| (30,359,604
| )
|
Share Transactions:
| | | | | | | | |
Proceeds from sale of shares
| | | 1,264,081,387 | | | | 1,158,412,999 | |
Net asset value of shares issued to shareholders in payment of distributions declared
| | | 58,793,620 | | | | 24,661,580 | |
Cost of shares redeemed
|
|
| (567,608,024
| )
|
|
| (280,050,314
| )
|
CHANGE IN NET ASSETS RESULTING FROM SHARE TRANSACTIONS
|
|
| 755,266,983
|
|
|
| 903,024,265
|
|
Change in net assets
|
|
| 772,363,956
|
|
|
| 1,025,172,739
|
|
Net Assets:
| | | | | | | | |
Beginning of period
|
|
| 1,943,782,744
|
|
|
| 918,610,005
|
|
End of period (including undistributed net investment income of $1,891,797 and $18,610,223, respectively)
|
|
| $2,716,146,700
|
|
|
| $1,943,782,744
|
|
See Notes which are an integral part of the Financial Statements
Notes to Financial Statements
October 31, 2005
1. ORGANIZATION
Federated Equity Funds (the "Trust") is registered under the Investment Company Act of 1940, as amended (the "Act"), as an open-end management investment company. The Trust consists of eight diversified portfolios. The financial statements included herein are only those of Federated Market Opportunity Fund (the "Fund"). The financial statements of the other portfolios are presented separately. The assets of each portfolio are segregated and a shareholder's interest is limited to the portfolio in which shares are held. The Fund offers three classes of shares: Class A Shares; Class B Shares; and Class C Shares. All shares of the Fund have equal rights with respect to voting, except on class-specific matters. The primary investment objective of the Fund is to provide moderate capital appreciation and high current income.
2. SIGNIFICANT ACCOUNTING POLICIES
The following is a summary of significant accounting policies consistently followed by the Fund in the preparation of its financial statements. These policies are in conformity with generally accepted accounting principles (GAAP) in the United States of America.
Investment Valuation
Domestic and foreign equity securities are valued at the last sale price or official closing price reported in the market in which they are primarily traded (either a national securities exchange or the over-the-counter market), if available. If unavailable, the security is generally valued at the mean between the last closing bid and asked prices. With respect to valuation of foreign securities, trading in foreign cities may be completed at times which vary from the closing of the New York Stock Exchange ("NYSE"). Therefore, foreign securities are valued at the latest closing price on the exchange on which they are traded immediately prior to the closing of the NYSE. Foreign securities quoted in foreign currencies are translated in U.S. dollars at the foreign exchange rate in effect at 4:00 p.m., Eastern Time, on the day the value of the foreign security is determined. The Fund generally values fixed-income and short-term securities according to prices furnished by an independent pricing service, except that securities with remaining maturities of less than 60 days at the time of purchase may be valued at amortized cost. Prices furnished by an independent pricing service are intended to be indicative of the mean between the bid and asked prices currently offered to institutional investors for the securities. Investments in other open-end regulated investment companies are valued at net asset value. Securities for which no quotations are readily available or whose values have been affected by a significant event occurring between the close of their primary markets and the closing of the NYSE are valued at fair value as determined in accordance with procedures established by and under general supervision of the Board of Trustees (the "Trustees").
Repurchase Agreements
It is the policy of the Fund to require the custodian bank to take possession, to have legally segregated in the Federal Reserve Book Entry System, or to have segregated within the custodian bank's vault, all securities held as collateral under repurchase agreement transactions. Additionally, procedures have been established by the Fund to monitor, on a daily basis, the market value of each repurchase agreement's collateral to ensure that the value of the collateral at least equals the repurchase price to be paid under the repurchase agreement.
The Fund will only enter into repurchase agreements with banks and other recognized financial institutions, such as broker/dealers, which are deemed by the Fund's adviser to be creditworthy pursuant to the guidelines and/or standards reviewed or established by the Trustees. Risks may arise from the potential inability of counterparties to honor the terms of the repurchase agreement. The Fund, along with other affiliated investment companies, may utilize a joint trading account for the purpose of entering into one or more repurchase agreements.
Investment Income, Gains and Losses, Expenses and Distributions
Interest income and expenses are accrued daily. Dividend income and distributions to shareholders are recorded on the ex-dividend date. Distributions of net investment income are declared and paid quarterly. Non-cash dividends included in dividend income, if any, are recorded at fair value. Investment income, realized and unrealized gains and losses, and certain fund-level expenses are allocated to each class based on relative average daily net assets, except that each class bears certain expenses unique to that class such as distribution and shareholder services fees. Dividends are declared separately for each class. No class has preferential dividend rights; differences in per share dividend rates are generally due to differences in separate class expenses.
Premium and Discount Amortization
All premiums and discounts on fixed-income securities are amortized/accreted for financial statement purposes.
Federal Taxes
It is the Fund's policy to comply with the Subchapter M provision of the Internal Revenue Code (the "Code") and to distribute to shareholders each year substantially all of its income. Accordingly, no provision for federal income tax is necessary.
Withholding taxes, and where appropriate, deferred withholding taxes, on foreign interest, dividends and capital gains have been provided for in accordance with the applicable country's tax rules and rates.
When-Issued and Delayed Delivery Transactions
The Fund may engage in when-issued or delayed delivery transactions. The Fund records when-issued securities on the trade date and maintains security positions such that sufficient liquid assets will be available to make payment for the securities purchased. Securities purchased on a when-issued or delayed delivery basis are marked to market daily and begin earning interest on the settlement date. Losses may occur on these transactions due to changes in market conditions or the failure of counterparties to perform under the contract.
Written Options Contracts
The Fund may write option contracts. The writer of the option receives a payment, or premium, from the buyer, which the writer keeps regardless of whether the buyer uses (or exercises) the option. A call option gives the holder (buyer) the right to buy the underlying asset from the seller (writer) of the option. A put option gives the holder the right to sell the underlying asset to the writer of the option. The value of the option contract is recorded as a liability and unrealized gain or loss is measured by the difference between the current value and the premium received. For the year ended October 31, 2005, the Fund had no realized gain/loss on written options.
Foreign Exchange Contracts
The Fund may enter into foreign currency commitments for the delayed delivery of securities or foreign currency exchange transactions. The Fund may enter into foreign currency contract transactions to protect assets against adverse changes in foreign currency exchange rates or exchange control regulations. Purchased contracts are used to acquire exposure to foreign currencies; whereas, contracts to sell are used to hedge the Fund's securities against currency fluctuations. Risks may arise upon entering these transactions from the potential inability of counterparties to meet the terms of their commitments and from unanticipated movements in security prices or foreign exchange rates. The foreign currency transactions are adjusted by the daily exchange rate of the underlying currency and any gains or losses are recorded for financial statement purposes as unrealized until the settlement date. At October 31, 2005, the Fund had no outstanding foreign currency commitments.
Foreign Currency Translation
The accounting records of the Fund are maintained in U.S. dollars. All assets and liabilities denominated in foreign currencies (FCs) are translated into U.S. dollars based on the rates of exchange of such currencies against U.S. dollars on the date of valuation. Purchases and sales of securities, income and expenses are translated at the rate of exchange quoted on the respective date that such transactions are recorded. The Fund does not isolate that portion of the results of operations resulting from changes in foreign exchange rates on investments from the fluctuations arising from changes in market prices of securities held. Such fluctuations are included with the net realized and unrealized gain or loss from investments.
Reported net realized foreign exchange gains or losses arise from sales of portfolio securities, sales and maturities of short-term securities, sales of FCs, currency gains or losses realized between the trade and settlement dates on securities transactions, the difference between the amounts of dividends, interest and foreign withholding taxes recorded on the Fund's books, and the U.S. dollar equivalent of the amounts actually received or paid. Net unrealized foreign exchange gains and losses arise from changes in the value of assets and liabilities other than investments in securities at fiscal year end, resulting from changes in the exchange rate.
Restricted Securities
Restricted securities are securities that may only be resold upon registration under federal securities laws or in transactions exempt from such registration. In some cases, the issuer of restricted securities has agreed to register such securities for resale, at the issuer's expense either upon demand by the Fund or in connection with another registered offering of the securities. Many restricted securities may be resold in the secondary market in transactions exempt from registration. Such restricted securities may be determined to be liquid under criteria established by the Trustees. The Fund will not incur any registration costs upon such resales. The Fund's restricted securities are valued at the price provided by dealers in the secondary market or, if no market prices are available, at the fair value as determined in accordance with procedures established by and under general supervision of the Trustees.
Use of Estimates
The preparation of financial statements in conformity with GAAP requires management to make estimates and assumptions that affect the amounts of assets, liabilities, expenses and revenues reported in the financial statements. Actual results could differ from those estimated.
Other
Investment transactions are accounted for on a trade date basis. Realized gains and losses from investment transactions are recorded on an identified cost basis.
3. SHARES OF BENEFICIAL INTEREST
The following tables summarize share activity:
Year Ended October 31
|
| 2005
|
| 2004
|
Class A Shares:
|
| Shares
|
|
|
| Amount
|
|
| Shares
|
|
|
| Amount
|
|
Shares sold
| | 53,895,455 | | | $ | 712,296,668 | | | 49,190,394 | | | $ | 636,690,852 | |
Shares issued to shareholders in payment of distributions declared
|
|
2,604,349 |
|
| |
34,355,446 |
|
|
1,192,468 |
|
| |
15,426,228 |
|
Shares redeemed
|
| (28,338,514
| )
|
|
| (375,315,081
| )
|
| (15,379,856
| )
|
|
| (197,952,246
| )
|
NET CHANGE RESULTING FROM CLASS A SHARE TRANSACTIONS
|
|
28,161,290
|
|
|
$
|
371,337,033
|
|
|
35,003,006
|
|
|
$
|
454,164,834
|
|
| | | | | | | | | | | | | | |
Year Ended October 31
|
| 2005
|
| 2004
|
Class B Shares:
|
| Shares
|
|
|
| Amount
|
|
| Shares
|
|
|
| Amount
|
|
Shares sold
| | 10,099,974 | | | $ | 132,791,459 | | | 12,390,247 | | | $ | 159,360,310 | |
Shares issued to shareholders in payment of distributions declared
|
|
778,261 |
|
|
|
10,208,955 |
|
|
354,646 |
|
|
|
4,566,715 |
|
Shares redeemed
|
| (5,868,696
| )
|
|
| (77,317,103
| )
|
| (3,812,936
| )
|
|
| (48,920,042
| )
|
NET CHANGE RESULTING FROM CLASS B SHARE TRANSACTIONS
|
|
5,009,539
|
|
|
$
|
65,683,311
|
|
|
8,931,957
|
|
|
$
|
115,006,983
|
|
| | | | | | | | | | | | | | |
Year Ended October 31
|
| 2005
|
| 2004
|
Class C Shares:
|
| Shares
|
|
|
| Amount
|
|
| Shares
|
|
|
| Amount
|
|
Shares sold
| | 31,910,917 | | | $ | 418,993,260 | | | 28,158,850 | | | $ | 362,361,837 | |
Shares issued to shareholders in payment of distributions declared
|
|
1,086,077 |
|
|
|
14,229,219 |
|
|
362,878 |
|
| |
4,668,637 |
|
Shares redeemed
|
| (8,749,614
| )
|
|
| (114,975,840
| )
|
| (2,583,489
| )
|
|
| (33,178,026
| )
|
NET CHANGE RESULTING FROM CLASS C SHARE TRANSACTIONS
|
|
24,247,380
|
|
|
$
|
318,246,639
|
|
|
25,938,239
|
|
|
$
|
333,852,448
|
|
NET CHANGE RESULTING FROM SHARE TRANSACTIONS
|
|
57,418,209
|
|
|
$
|
755,266,983
|
|
|
69,873,202
|
|
|
$
|
903,024,265
|
|
4. FEDERAL TAX INFORMATION
The timing and character of income and capital gain distributions are determined in accordance with income tax regulations, which may differ from GAAP. These differences are due in part to differing treatments for foreign currency transactions, dividends earned on REIT's and discount accretion/premium amortization on debt securities.
For the year ended October 31, 2005, permanent differences identified and reclassified among the components of net assets were as follows:
Increase (Decrease)
|
Undistributed
Net Investment
Income
|
| Accumulated
Net Realized
Gains (Losses)
|
$(106,658)
|
| $106,658
|
Net investment income (loss), net realized gains (losses), and net assets were not affected by this reclassification.
The tax character of distributions as reported on the Statement of Changes in Net Assets for the years ended October 31, 2005 and 2004, was as follows:
|
| 2005
|
| 2004
|
Ordinary income1
|
| $46,705,304
|
| $30,359,604
|
Long-term capital gains
|
| $27,244,477
|
| $--
|
1 For tax purposes short-term capital gain distributions are considered ordinary income distributions.
As of October 31, 2005, the components of distributable earnings on a tax basis were as follows:
Undistributed ordinary income
|
| $
| 43,220,108
|
Undistributed long-term capital gain
|
| $
| 121,362,553
|
Net unrealized appreciation/depreciation
|
| $
| 27,584,748
|
At October 31, 2005, the cost of investments for federal tax purposes was $2,660,686,114. The net unrealized appreciation of investments for federal tax purposes excluding any unrealized appreciation resulting from changes in foreign currency exchange rates was $27,584,748. This consists of net unrealized appreciation from investments for those securities having an excess of value over cost of $76,379,299 and net unrealized depreciation from investments for those securities having an excess of cost over value of $48,794,551.
The difference between book-basis and tax-basis net unrealized appreciation/depreciation is due to differing treatments for discount accretion/premium amortization on debt securities and the realization for tax purposes of unrealized gains on investments in passive foreign investment companies.
5. INVESTMENT ADVISER FEE AND OTHER TRANSACTIONS WITH AFFILIATES
Investment Adviser Fee
Federated Equity Management Company of Pennsylvania, the Fund's investment adviser (the "Adviser"), receives for its services an annual investment adviser fee equal to 0.75% of the Fund's average daily net assets. The Adviser may voluntarily choose to waive any portion of its fee. The Adviser can modify or terminate this voluntary waiver at any time at its sole discretion. For the year ended October 31, 2005, the Adviser voluntarily waived $2,048 of its fee.
Pursuant to an Exemptive Order issued by the Securities and Exchange Commission, the Fund may invest in other funds which are managed by the Adviser or an affiliate of the Adviser. The Adviser has agreed to reimburse the Fund for certain investment adviser fees as a result of these transactions. Income distributions earned from investments in these funds are recorded as income in the accompanying financial statements and totaled $461,331 for the period.
Administrative Fee
Federated Administrative Services (FAS), under the Administrative Services Agreement, provides the Fund with administrative personnel and services. The fee paid to FAS is based on the average aggregate daily net assets of all Federated funds as specified below:
Maximum
Administrative Fee
|
| Average Aggregate Daily Net Assets
of the Federated Funds
|
0.150%
|
| on the first $5 billion
|
0.125%
|
| on the next $5 billion
|
0.100%
|
| on the next $10 billion
|
0.075%
|
| on assets in excess of $20 billion
|
The administrative fee received during any fiscal year shall be at least $150,000 per portfolio and $40,000 per each additional class of Shares. FAS may voluntarily choose to waive any portion of its fee. FAS can modify or terminate this voluntary waiver at any time at its sole discretion. For the year ended October 31, 2005, the net fee paid to FAS was 0.076% of average aggregate daily net assets of the Fund.
Distribution Services Fee
The Fund has adopted a Distribution Plan (the "Plan") pursuant to Rule 12b-1 under the Act. Under the terms of the Plan, the Fund will compensate Federated Securities Corp. (FSC), the principal distributor, from the daily net assets of the Fund's Class A Shares, Class B Shares and Class C Shares to finance activities intended to result in the sale of these shares. The Plan provides that the Fund may incur distribution expenses according to the following schedule annually, to compensate FSC:
Share Class Name
|
| Percentage of Average Daily
Net Assets of Class
|
Class A Shares
|
| 0.25%
|
Class B Shares
|
| 0.75%
|
Class C Shares
|
| 0.75%
|
FSC may voluntarily choose to waive any portion of its fee. FSC can modify or terminate this voluntary waiver at any time at its sole discretion. Rather than paying financial intermediaries directly, the Fund may pay fees to FSC and FSC will use the fees to compensate financial intermediaries. For the year ended October 31, 2005, FSC retained $2,898,934 of fees paid by the Fund.
For the year ended October 31, 2005, Class A Shares did not incur a distribution services fee.
Sales Charges
For the year ended October 31, 2005, FSC retained $933,623 in sales charges from the sale of Class A Shares. FSC also retained $11,900 of contingent deferred sales charges relating to redemptions of Class A Shares and $81,799 relating to redemptions of Class C Shares. See "What Do Shares Cost?" in the Prospectus.
Shareholder Services Fee
The Fund may pay fees (Services Fees) up to 0.25% of the average daily net assets of the Fund's Class A Shares, Class B Shares and Class C Shares to financial intermediaries or to Federated Shareholder Services Company (FSSC), a subsidiary of Federated Investors, Inc., for providing services to shareholders and maintaining shareholder accounts. Under certain agreements, rather than paying financial intermediaries directly, the Fund may pay Service Fees to FSSC and FSSC will use the fees to compensate financial intermediaries. FSSC or these financial intermediaries may voluntarily choose to waive any portion of their fee. This voluntary waiver can be modified or terminated at any time. For the year ended October 31, 2005, FSSC did not retain any fees paid by the Fund.
Expense Reduction
The Fund directs portfolio trades to a broker that in turn pays a portion of the Fund's operating expenses. For the year ended October 31, 2005, the Fund's expenses were reduced by $17,603 under these arrangements.
General
Certain of the Officers and Directors of the Fund are Officers and Directors or Trustees of the above companies.
6. INVESTMENT TRANSACTIONS
Purchases and sales of investments, excluding long-term U.S. government securities and short-term obligations, for the year ended October 31, 2005, were as follows:
Purchases
|
| $
| 735,900,389
|
Sales
|
| $
| 881,104,683
|
7. LEGAL PROCEEDINGS
Beginning in October 2003, Federated Investors, Inc. and various subsidiaries thereof (including the advisers and distributor for various investment companies, collectively, "Federated"), along with various investment companies sponsored by Federated ("Funds") were named as defendants in several class action lawsuits now pending in the United States District Court for the District of Maryland. The lawsuits were purportedly filed on behalf of people who purchased, owned and/or redeemed shares of Federated-sponsored mutual funds during specified periods beginning November 1, 1998. The suits are generally similar in alleging that Federated engaged in illegal and improper trading practices including market timing and late trading in concert with certain institutional traders, which allegedly caused financial injury to the mutual fund shareholders. These lawsuits began to be filed shortly after Federated's first public announcement that it had received requests for information on shareholder trading activities in the Funds from the Securities and Exchange Commission ("SEC"), the Office of the New York State Attorney General ("NYAG"), and other authorities. In that regard, on November 28, 2005, Federated announced that it had reached final settlements with the SEC and the NYAG with respect to those matters. As Federated previously reported in 2004, it has already paid approximately $8.0 million to certain funds as determined by an independent consultant. As part of these settlements, Federated agreed to pay for the benefit of fund shareholders additional disgorgement and a civil money penalty in the aggregate amount of an additional $72 million. Federated and various Funds have also been named as defendants in several additional lawsuits, the majority of which are now pending in the United States District Court for the Western District of Pennsylvania, alleging, among other things, excessive advisory and rule 12b-1 fees. The Board of the Funds has retained the law firm of Dickstein Shapiro Morin & Oshinsky LLP to represent the Funds in these lawsuits. Federated and the Funds, and their respective counsel, are reviewing the allegations and will respond appropriately. Additional lawsuits based upon similar allegations may be filed in the future. The potential impact of these lawsuits, all of which seek unquantified damages, attorneys' fees and expenses, and future potential similar suits is uncertain. Although we do not believe that these lawsuits will have a material adverse effect on the Funds, there can be no assurance that these suits, the ongoing adverse publicity and/or other developments resulting from the regulatory investigations will not result in increased Fund redemptions, reduced sales of Fund shares, or other adverse consequences for the Funds.
8. FEDERAL TAX INFORMATION (UNAUDITED)
For the year ended October 31, 2005, the amount of long-term capital gains designated by the Fund was $27,244,477.
For the fiscal year ended October 31, 2005, 45.6% of total ordinary dividends paid by the Fund are qualifying dividends which may be subject to a maximum tax rate of 15%, as provided for by the Jobs and Growth Tax Relief Act of 2003. Complete information is reported in conjunction with the reporting of your distributions on Form 1099-DIV.
Of the ordinary income (including short-term capital gain) distributions made by the Fund during the year ended October 31, 2005, 12.0% qualify for the dividend received deduction available to corporate shareholders.
Report of Independent Registered Public Accounting Firm
TO THE BOARD OF TRUSTEES OF FEDERATED EQUITY FUNDS AND THE SHAREHOLDERS OF FEDERATED MARKET OPPORTUNITY FUND:
We have audited the accompanying statement of assets and liabilities, including the portfolio of investments, of Federated Market Opportunity Fund (the "Fund"), a portfolio of Federated Equity Funds, as of October 31, 2005, and the related statement of operations for the year then ended, the statements of changes in net assets for each of the two years in the period then ended, and the financial highlights for each of the four years in the period then ended and from December 4, 2000 (start of performance) to October 31, 2001. These financial statements and financial highlights are the responsibility of the Fund's management. Our responsibility is to express an opinion on these financial statements and financial highlights based on our audits.
We conducted our audits in accordance with the standards of the Public Company Accounting Oversight Board (United States). Those standards require that we plan and perform the audit to obtain reasonable assurance about whether the financial statements and financial highlights are free of material misstatement. The Fund is not required to have, nor were we engaged to perform, an audit of its internal control over financial reporting. Our audits included consideration of internal control over financial reporting as a basis for designing audit procedures that are appropriate in the circumstances, but not for the purpose of expressing an opinion on the effectiveness of the Fund's internal control over financial reporting. Accordingly, we express no such opinion. An audit also includes examining, on a test basis, evidence supporting the amounts and disclosures in the financial statements, assessing the accounting principles used and significant estimates made by management, as well as evaluating the overall financial statement presentation. Our procedures included confirmation of securities owned as of October 31, 2005, by correspondence with the custodian and brokers. We believe that our audits provide a reasonable basis for our opinion.
In our opinion, such financial statements and financial highlights present fairly, in all material respects, the financial position of the Fund as of October 31, 2005, and the results of its operations, the changes in its net assets, and its financial highlights for the respective stated periods, in conformity with accounting principles generally accepted in the United States of America.
Deloitte & Touche LLP
Boston, Massachusetts
December 20, 2005
Board of Trustees and Trust Officers
The Board is responsible for managing the Trust's business affairs and for exercising all the Trust's powers except those reserved for the shareholders. The following tables give information about each Board member and the senior officers of the Fund. Where required, the tables separately list Board members who are "interested persons" of the Fund (i.e., "Interested" Board members) and those who are not (i.e., "Independent" Board members). Unless otherwise noted, the address of each person listed is Federated Investors Tower, 1001 Liberty Avenue, Pittsburgh, PA. As of December 31, 2004, the Trust comprised eight portfolios, and the Federated Fund Complex consisted of 44 investment companies (comprising 133 portfolios). Unless otherwise noted, each Officer is elected annually. Unless otherwise noted, each Board member oversees all portfolios in the Federated Fund Complex and serves for an indefinite term. The Fund's Statement of Additional Information includes additional information about Trust Trustees and is available, without charge and upon request, by calling 1-800-341-7400.
INTERESTED TRUSTEES BACKGROUND
|
|
|
Name
Birth Date
Address
Positions Held with Trust
Date Service Began
|
| Principal Occupation(s) for Past Five Years,
Other Directorships Held and Previous Position(s)
|
John F. Donahue*
Birth Date: July 28, 1924
CHAIRMAN AND TRUSTEE
Began serving: April 1984 | | Principal Occupations: Chairman and Director or Trustee of the Federated Fund Complex; Chairman and Director, Federated Investors, Inc.
Previous Positions: Trustee, Federated Investment Management Company and Chairman and Director, Federated Investment Counseling. |
|
|
|
J. Christopher Donahue*
Birth Date: April 11, 1949
PRESIDENT AND TRUSTEE
Began serving: January 2000 | | Principal Occupations: Principal Executive Officer and President of the Federated Fund Complex; Director or Trustee of some of the Funds in the Federated Fund Complex; President, Chief Executive Officer and Director, Federated Investors, Inc.; Chairman and Trustee, Federated Investment Management Company; Trustee, Federated Investment Counseling; Chairman and Director, Federated Global Investment Management Corp.; Chairman, Passport Research, Ltd.; Trustee, Federated Shareholder Services Company; Director, Federated Services Company.
Previous Positions: President, Federated Investment Counseling; President and Chief Executive Officer, Federated Investment Management Company, Federated Global Investment Management Corp. and Passport Research, Ltd. |
|
|
|
|
|
|
Name
Birth Date
Address
Positions Held with Trust
Date Service Began
|
| Principal Occupation(s) for Past Five Years,
Other Directorships Held and Previous Position(s)
|
Lawrence D. Ellis, M.D.*
Birth Date: October 11, 1932
3471 Fifth Avenue
Suite 1111
Pittsburgh, PA
TRUSTEE
Began serving: August 1987 | | Principal Occupations: Director or Trustee of the Federated Fund Complex; Professor of Medicine, University of Pittsburgh; Medical Director, University of Pittsburgh Medical Center Downtown; Hematologist, Oncologist and Internist, University of Pittsburgh Medical Center.
Other Directorships Held: Member, National Board of Trustees, Leukemia Society of America.
Previous Positions: Trustee, University of Pittsburgh; Director, University of Pittsburgh Medical Center. |
|
|
|
* Family relationships and reasons for "interested" status: John F. Donahue is the father of J. Christopher Donahue; both are "interested" due to the positions they hold with Federated Investors, Inc. and its subsidiaries. Lawrence D. Ellis, M.D. is "interested" because his son-in-law is employed by the Fund's principal underwriter, Federated Securities Corp.
INDEPENDENT TRUSTEES BACKGROUND
|
|
|
Name
Birth Date
Address
Positions Held with Trust
Date Service Began
|
| Principal Occupation(s) for Past Five Years, Other Directorships Held and Previous Position(s)
|
Thomas G. Bigley
Birth Date: February 3, 1934
15 Old Timber Trail
Pittsburgh, PA
TRUSTEE
Began serving: October 1995 | | Principal Occupation: Director or Trustee of the Federated Fund Complex.
Other Directorships Held: Director, Member of Executive Committee, Children's Hospital of Pittsburgh; Director, University of Pittsburgh.
Previous Position: Senior Partner, Ernst & Young LLP. |
|
|
|
John T. Conroy, Jr.
Birth Date: June 23, 1937
Investment Properties Corporation
3838 North Tamiami Trail
Suite 402
Naples, FL
TRUSTEE
Began serving: November 1991 | | Principal Occupations: Director or Trustee of the Federated Fund Complex; Chairman of the Board, Investment Properties Corporation; Partner or Trustee in private real estate ventures in Southwest Florida.
Previous Positions: President, Investment Properties Corporation; Senior Vice President, John R. Wood and Associates, Inc., Realtors; President, Naples Property Management, Inc. and Northgate Village Development Corporation. |
|
|
|
Nicholas P. Constantakis
Birth Date: September 3, 1939
175 Woodshire Drive
Pittsburgh, PA
TRUSTEE
Began serving: February 1998 | | Principal Occupations: Director or Trustee of the Federated Fund Complex.
Other Directorships Held: Director and Member of the Audit Committee, Michael Baker Corporation (engineering and energy services worldwide).
Previous Position: Partner, Andersen Worldwide SC. |
|
|
|
|
|
|
Name
Birth Date
Address
Positions Held with Trust
Date Service Began
|
| Principal Occupation(s) for Past Five Years,
Other Directorships Held and Previous Position(s)
|
John F. Cunningham
Birth Date: March 5, 1943
353 El Brillo Way
Palm Beach, FL
TRUSTEE
Began serving: January 1999 | | Principal Occupation: Director or Trustee of the Federated Fund Complex.
Other Directorships Held: Chairman, President and Chief Executive Officer, Cunningham & Co., Inc. (strategic business consulting); Trustee Associate, Boston College.
Previous Positions: Director, Redgate Communications and EMC Corporation (computer storage systems); Chairman of the Board and Chief Executive Officer, Computer Consoles, Inc.; President and Chief Operating Officer, Wang Laboratories; Director, First National Bank of Boston; Director, Apollo Computer, Inc. |
|
|
|
Peter E. Madden
Birth Date: March 16, 1942
One Royal Palm Way
100 Royal Palm Way
Palm Beach, FL
TRUSTEE
Began serving: November 1991 | | Principal Occupation: Director or Trustee of the Federated Fund Complex.
Other Directorships Held: Board of Overseers, Babson College.
Previous Positions: Representative, Commonwealth of Massachusetts General Court; President, State Street Bank and Trust Company and State Street Corporation (retired); Director, VISA USA and VISA International; Chairman and Director, Massachusetts Bankers Association; Director, Depository Trust Corporation; Director, The Boston Stock Exchange. |
|
|
|
Charles F. Mansfield, Jr.
Birth Date: April 10, 1945
80 South Road
Westhampton Beach, NY
TRUSTEE
Began serving: January 1999 | | Principal Occupations: Director or Trustee of the Federated Fund Complex; Management Consultant; Executive Vice President, DVC Group, Inc. (marketing communications and technology) (prior to 9/1/00).
Previous Positions: Chief Executive Officer, PBTC International Bank; Partner, Arthur Young & Company (now Ernst & Young LLP); Chief Financial Officer of Retail Banking Sector, Chase Manhattan Bank; Senior Vice President, HSBC Bank USA (formerly, Marine Midland Bank); Vice President, Citibank; Assistant Professor of Banking and Finance, Frank G. Zarb School of Business, Hofstra University. |
|
|
|
John E. Murray, Jr., J.D., S.J.D.
Birth Date: December 20, 1932
Chancellor, Duquesne University
Pittsburgh, PA
TRUSTEE
Began serving: February 1995 | | Principal Occupations: Director or Trustee of the Federated Fund Complex; Chancellor and Law Professor, Duquesne University; Partner, Murray, Hogue and Lannis.
Other Directorships Held: Director, Michael Baker Corp. (engineering, construction, operations and technical services).
Previous Positions: President, Duquesne University; Dean and Professor of Law, University of Pittsburgh School of Law; Dean and Professor of Law, Villanova University School of Law. |
|
|
|
|
|
|
Name
Birth Date
Address
Positions Held with Trust
Date Service Began
|
| Principal Occupation(s) for Past Five Years,
Other Directorships Held and Previous Position(s)
|
Marjorie P. Smuts
Birth Date: June 21, 1935
4905 Bayard Street
Pittsburgh, PA
TRUSTEE
Began serving: April 1984 | | Principal Occupations: Director or Trustee of the Federated Fund Complex; Public Relations/Marketing Consultant/ Conference Coordinator.
Previous Positions: National Spokesperson, Aluminum Company of America; television producer; President, Marj Palmer Assoc.; Owner, Scandia Bord. |
|
|
|
John S. Walsh
Birth Date: November 28, 1957
2604 William Drive
Valparaiso, IN
TRUSTEE
Began serving: January 1999 | | Principal Occupations: Director or Trustee of the Federated Fund Complex; President and Director, Heat Wagon, Inc. (manufacturer of construction temporary heaters); President and Director, Manufacturers Products, Inc. (distributor of portable construction heaters); President, Portable Heater Parts, a division of Manufacturers Products, Inc.
Previous Position: Vice President, Walsh & Kelly, Inc. |
|
|
|
OFFICERS
|
|
|
Name
Birth Date
Positions Held with Trust
Date Service Began
|
| Principal Occupation(s) for Past Five Years
and Previous Position(s)
|
John W. McGonigle
Birth Date: October 26, 1938
EXECUTIVE VICE PRESIDENT
AND SECRETARY
Began serving: April 1984 | | Principal Occupations: Executive Vice President and Secretary of the Federated Fund Complex; Vice Chairman, Executive Vice President, Secretary and Director, Federated Investors, Inc.
Previous Positions: Trustee, Federated Investment Management Company and Federated Investment Counseling; Director, Federated Global Investment Management Corp., Federated Services Company and Federated Securities Corp. |
|
|
|
Richard J. Thomas
Birth Date: June 17, 1954
TREASURER
Began serving: November 1998 | | Principal Occupations: Principal Financial Officer and Treasurer of the Federated Fund Complex; Senior Vice President, Federated Administrative Services.
Previous Positions: Vice President, Federated Administrative Services; held various management positions within Funds Financial Services Division of Federated Investors, Inc. |
|
|
|
Richard B. Fisher
Birth Date: May 17, 1923
VICE PRESIDENT
Began serving: April 1984 | | Principal Occupations: Vice Chairman or Vice President of some of the Funds in the Federated Fund Complex; Vice Chairman, Federated Investors, Inc.; Chairman, Federated Securities Corp.
Previous Positions: President and Director or Trustee of some of the Funds in the Federated Fund Complex; Executive Vice President, Federated Investors, Inc. and Director and Chief Executive Officer, Federated Securities Corp. |
|
|
|
|
|
|
Name
Birth Date
Positions Held with Trust
Date Service Began
|
| Principal Occupation(s) for Past Five Years
and Previous Position(s)
|
Stephen F. Auth
Birth Date: September 3, 1956
CHIEF INVESTMENT OFFICER
Began serving: November 2002 | | Principal Occupations: Chief Investment Officer of this Fund and various other Funds in the Federated Fund Complex; Executive Vice President, Federated Investment Counseling, Federated Global Investment Management Corp., Federated Equity Management Company of Pennsylvania and Passport Research II, Ltd.
Previous Positions: Executive Vice President, Federated Investment Management Company, and Passport Research, Ltd.; Senior Vice President, Global Portfolio Management Services Division; Senior Vice President, Federated Investment Management Company and Passport Research, Ltd.; Senior Managing Director and Portfolio Manager, Prudential Investments. |
|
|
|
Lawrence Auriana
Birth Date: January 8, 1944
VICE PRESIDENT
Began serving: November 2001 | | Lawrence Auriana has been the Fund's Portfolio Manager since February 1986. He is Vice President of the Trust. Mr. Auriana joined Federated in April 2001 as Co-Head of Investments/Federated Kaufmann. From August 1984 to April 2001, Mr. Auriana was President and Treasurer of Edgemont Asset Management Corp., and Chairman of the Board and Portfolio Manager to The Kaufmann Fund, Inc. (predecessor to the Federated Kaufmann Fund). Mr. Auriana earned a B.S. in economics from Fordham University and has been engaged in the securities business since 1965. |
|
|
|
James E. Grefenstette
Birth Date: November 7, 1962
VICE PRESIDENT
Began serving: November 1998 | | James E. Grefenstette is Vice President of the Trust. Mr. Grefenstette joined Federated in 1992 and has been a Portfolio Manager since 1994. Mr. Grefenstette became a Senior Vice President of the Fund's Adviser in January 2000. He served as a Vice President of the Fund's Adviser from 1996 through 1999 and was an Assistant Vice President of the Fund's Adviser from 1994 until 1996. Mr. Grefenstette is a Chartered Financial Analyst; he received his M.S. in Industrial Administration from Carnegie Mellon University. |
|
|
|
Hans P. Utsch
Birth Date: July 3, 1936
VICE PRESIDENT
Began serving: November 2001 | | Hans P. Utsch has been the Fund's Portfolio Manager since February 1986. He is Vice President of the Trust. Mr. Utsch joined Federated in April 2001 as Co-Head of Investments/Federated Kaufmann. From August 1984 to April 2001, Mr. Utsch was Chairman of the Board and Secretary of Edgemont Asset Management Corp., and President and Portfolio Manager to The Kaufmann Fund, Inc. (predecessor to the Federated Kaufmann Fund). Mr. Utsch graduated from Amherst College and holds an M.B.A. from Columbia University. He has been engaged in the securities business since 1962. |
|
|
|
Board Review of Advisory Contract
As required by the Act, the Fund's Board has reviewed the Fund's investment advisory contract and subadvisory contracts. The Board's decision to approve the contract these contracts reflects the exercise of its business judgment on whether to continue the existing arrangements. During its review of the contract these contracts, the Board considers many factors, among the most material of which are: the Fund's investment objectives; the Adviser's and subadviser's management philosophy, personnel, processes, and investment and operating strategies; long term performance; the preferences and expectations of Fund shareholders and their relative sophistication; the continuing state of competition in the mutual fund industry; the range of comparable fees for similar funds in the mutual fund industry; the range and quality of services provided to the Fund and its shareholders by the Federated organization in addition to investment advisory services; and the Fund's relationship to the Federated family of funds which include a comprehensive array of funds with different investment objectives, policies and strategies which are available for exchange without the incurrence of additional sales charge.
In its decision to appoint or renew the Adviser, the Board is mindful of the potential disruptions of the Fund's operations and various risks, uncertainties and other effects that could occur as a result of a decision to terminate or not renew an advisory contract. In particular, the Board recognizes that most shareholders have invested in the Fund on the strength of the Adviser's industry standing and reputation and in the expectation that the Adviser will have a continuing role in providing advisory services to the Fund. Thus, the Board's "selection" or approval of the Adviser must reflect the fact that it is the shareholders who have effectively selected the Adviser by virtue of having invested in the Fund. The Board also considers the compensation and benefits received by the Adviser and subadviser. This includes fees received for services provided to the Fund by other entities in the Federated organization and research services received by the Adviser from brokers that execute fund trades, as well as advisory fees. In this regard, the Board is aware that various courts have interpreted provisions of the Act and have indicated in their decisions that the following factors may be relevant to an Adviser's fiduciary duty with respect to its receipt of compensation from a fund: the nature and quality of the services provided by the Adviser, including the performance of the Fund; the Adviser's cost of providing the services; the extent to which the Adviser may realize "economies of scale" as the Fund grows larger; any indirect benefits that may accrue to the Adviser and its affiliates as a result of the Adviser's relationship with the Fund; performance and expenses of comparable funds; and the extent to which the independent Board members are fully informed about all facts bearing on the Adviser's service and fee. The Fund's Board is aware of these factors and is guided by them in its review of the Fund's advisory contract to the extent they are appropriate and relevant, as discussed further below.
The Board considers and weighs these circumstances in light of its substantial accumulated experience in governing the Fund and working with Federated on matters relating to the Federated funds, and is assisted in its deliberations by the advice of independent legal counsel. In this regard, the Board requests and receives substantial and detailed information about the Fund and the Federated organization. Federated provides much of this information at each regular meeting of the Board, and furnishes additional reports in connection with the particular meeting at which the Board's formal review of the advisory contract occurs. In between regularly scheduled meetings, the Board may receive information on particular matters as the need arises. Thus, the Board's evaluation of an advisory contract is informed by reports covering such matters as: the Adviser's investment philosophy, personnel, and processes; operating strategies; the Fund's short- and long-term performance (in absolute terms, both on a gross basis and net of expenses, as well as in relationship to its particular investment program and certain competitor or "peer group" funds and/or other benchmarks, as appropriate), and comments on the reasons for performance; the Fund's expenses (including the advisory fee itself and the overall expense structure of the Fund, both in absolute terms and relative to similar and/or competing funds, with due regard for contractual or voluntary expense limitations); the use and allocation of brokerage commissions derived from trading the Fund's portfolio securities (if any); the nature and extent of the advisory and other services provided to the Fund by the Adviser and its affiliates; compliance and audit reports concerning the Federated funds and the Federated companies that service them (including communications from regulatory agencies), as well as Federated's responses to any issues raised therein; and relevant developments in the mutual fund industry and how the Federated funds and/or Federated are responding to them. The evaluation process is evolutionary, reflecting continually developing considerations. The criteria considered and the emphasis placed on relevant criteria change in recognition of changing circumstances in the mutual fund marketplace. For the past year, the Board concluded that the nature, quality and scope of services provided the fund by the Adviser and its affiliates was satisfactory.
With respect to the Fund's performance and expenses in particular, the Board has found the use of comparisons to other mutual funds with comparable investment programs to be particularly useful, given the high degree of competition in the mutual fund business. The Board focuses on comparisons with other similar mutual funds (rather than non-mutual fund products or services) because, simply put, they are more relevant. For example, other mutual funds are the products most like the Fund, they are readily available to Fund shareholders as alternative investment vehicles, and they are the type of investment vehicle in fact chosen and maintained by the Fund's investors. The range of their fees and expenses therefore appears to be a generally reliable indication of what consumers have found to be reasonable in the precise marketplace in which the Fund competes. The Fund's ability to deliver competitive performance when compared to its peer group may be a useful indicator of how the Adviser is executing on the Fund's investment program, which would in turn assist the Board in reaching a conclusion that the nature, extent, and quality of the Adviser's investment management services are such as to warrant continuation of the advisory contract. For the periods ending December 31, 2004, the Fund's performance for the three year period was above the median of the relevant peer group, and the Fund's performance fell below the median of the relevant peer group for the one year period. The Board discussed the Fund's performance with the Adviser and recognized the efforts being undertaken by the Adviser. The Board will continue to monitor these efforts and the performance of the Fund. During the year ending December 31, 2004, the Fund's investment advisory fee after waivers and expense reimbursements, if any, was above the median of the relevant peer group. The Board reviewed the fees and other expenses of the Fund with the Adviser and was satisfied that the overall expense structure of the Fund nevertheless remained competitive. The Board will continue to monitor advisory fees and other expenses borne by the Fund.
The Board also receives financial information about Federated, including reports on the compensation and benefits Federated derives from its relationships with the Federated funds. These reports cover not only the fees under the advisory contracts, but also fees received by Federated's subsidiaries for providing other services to the Federated funds under separate contracts (e.g., for serving as the Federated funds' administrator). The reports also discuss any indirect benefit Federated may derive from its receipt of research services from brokers who execute Federated fund trades as well as waivers of fees and/or reimbursements of expenses. In order for a fund to be competitive in the marketplace, Federated and its affiliates frequently waive fees and/or reimburse expenses. Although the Board considers the costs incurred and the profitability of the Federated organization as a whole, it does not evaluate, on a fund-by-fund basis, Federated's "profitability" and/or "costs" (which would include an assessment as to whether "economies of scale" would be realized if the fund were to grow to some sufficient size). In the Board's view, the cost of performing advisory services on a fund-specific basis is both difficult to estimate satisfactorily and a relatively minor consideration in its overall evaluation. Analyzing isolated funds would require constructed allocations of the costs of shared resources and operations based on artificial assumptions that are inconsistent with the existing relationships within a large and diversified family of funds that receive advisory and other services from the same organization. In addition, the availability of the exchange privilege among funds in the Federated family makes consideration of the overall cost and profitability of Federated more relevant than that of individual funds. Based upon this review, the Board is satisfied that the costs incurred in, as well as the profitability realized from, managing the Fund and the other Federated Funds are appropriate. Although the Board is always interested in discovering any genuine "economies of scale," its experience has been that such "economies" are likely to arise only when a fund grows dramatically, and becomes and remains very large in size. Even in these instances, purchase and redemption activity, as well as the presence of expense limitations (if any), may offset any perceived economies. As suggested above, the Board considers the information it receives about the Fund's performance and expenses as compared to an appropriate set of similar competing funds to be more relevant.
The Board bases its decision to approve an advisory contract on the totality of the circumstances and relevant factors and with a view to past and future long-term considerations. Not all of the factors and considerations identified above are relevant to every Federated fund, nor does the Board consider any one of them to be determinative. With respect to the factors that are relevant, the Board's decision to approve the contract reflects its determination that Federated's performance and actions provide a satisfactory basis to support the decision to continue the existing arrangements.
Voting Proxies on Fund Portfolio Securities
A description of the policies and procedures that the Fund uses to determine how to vote proxies, if any, relating to securities held in the Fund's portfolio is available, without charge and upon request, by calling 1-800-341-7400. A report on "Form N-PX" of how the Fund voted any such proxies during the most recent 12-month period ended June 30 is available through Federated's website. Go to FederatedInvestors.com, select "Products," select the "Prospectuses and Regulatory Reports" link, then select the Fund to access the link to Form N-PX. This information is also available from the EDGAR database on the SEC's website at www.sec.gov.
Quarterly Portfolio Schedule
The Fund files with the SEC a complete schedule of its portfolio holdings, as of the close of the first and third quarters of its fiscal year, on "Form N-Q." These filings are available on the SEC's website at www.sec.gov and may be reviewed and copied at the SEC's Public Reference Room in Washington, DC. (Call 1-800-SEC-0330 for information on the operation of the Public Reference Room.) You may also access this information from the "Products" section of the Federated's website at FederatedInvestors.com by clicking on "Portfolio Holdings" and selecting the name of the Fund, or by selecting the name of the Fund and clicking on "Portfolio Holdings." You must register on the website the first time you wish to access this information.
Mutual funds are not bank deposits or obligations, are not guaranteed by any bank, and are not insured or guaranteed by the U.S. government, the Federal Deposit Insurance Corporation, the Federal Reserve Board, or any other government agency. Investment in mutual funds involves investment risk, including the possible loss of principal.
This report is authorized for distribution to prospective investors only when preceded or accompanied by the Fund's prospectus, which contains facts concerning its objective and policies, management fees, expenses, and other information.
Federated
World-Class Investment Manager
Federated Market Opportunity Fund
Federated Investors Funds
5800 Corporate Drive
Pittsburgh, PA 15237-7000
Contact us at FederatedInvestors.com
or call 1-800-341-7400.
Federated Securities Corp., Distributor
Cusip 314172743
Cusip 314172735
Cusip 314172727
26852 (12/05)
Federated is a registered mark of Federated Investors, Inc. 2005 (c)Federated Investors, Inc.
Federated
World-Class Investment Manager
Federated Mid Cap Growth Strategies Fund
Established 1984
A Portfolio of Federated Equity Funds
21ST ANNUAL SHAREHOLDER REPORT
October 31, 2005
Class A Shares
Class B Shares
Class C Shares
FINANCIAL HIGHLIGHTS
SHAREHOLDER EXPENSE EXAMPLE
MANAGEMENT'S DISCUSSION OF FUND PERFORMANCE
PORTFOLIO OF INVESTMENTS SUMMARY TABLE
PORTFOLIO OF INVESTMENTS
STATEMENT OF ASSETS AND LIABILITIES
STATEMENT OF OPERATIONS
STATEMENT OF CHANGES IN NET ASSETS
NOTES TO FINANCIAL STATEMENTS
REPORT OF INDEPENDENT REGISTERED PUBLIC ACCOUNTING FIRM
BOARD OF TRUSTEES AND TRUST OFFICERS
BOARD REVIEW OF ADVISORY CONTRACT
VOTING PROXIES ON FUND PORTFOLIO SECURITIES
QUARTERLY PORTFOLIO SCHEDULE
Not FDIC Insured * May Lose Value * No Bank Guarantee
Financial Highlights - Class A Shares
(For a Share Outstanding Throughout Each Period)
Year Ended October 31
|
| 2005
|
|
| 2004
|
|
| 2003
|
|
| 2002
|
|
| 2001
|
|
Net Asset Value, Beginning of Period
| | $27.44 | | | $25.14 | | | $19.02 | | | $23.34 | | | $40.66 | |
Income From Investment Operations:
| | | | | | | | | | | | | | | |
Net investment income (loss)
| | (0.10 | ) 1 | | (0.21 | ) 1 | | (0.18 | ) 1 | | (0.13 | ) 1 | | (0.15 | ) 1 |
Net realized and unrealized gain (loss) on investments and foreign currency transactions
|
| 4.51
|
|
| 2.51
|
|
| 6.30
|
|
| (4.19
| )
|
| (14.48
| )
|
TOTAL FROM INVESTMENT OPERATIONS
|
| 4.41
|
|
| 2.30
|
|
| 6.12
|
|
| (4.32
| )
|
| (14.63
| )
|
Less Distributions:
| | | | | | | | | | | | | | | |
Distributions from net realized gain on investments
|
| - --
|
|
| - --
|
|
| - --
|
|
| - --
|
|
| (2.69
| )
|
Net Asset Value, End of Period
|
| $31.85
|
|
| $27.44
|
|
| $25.14
|
|
| $19.02
|
|
| $23.34
|
|
Total Return 2
|
| 16.07
| % 3
|
| 9.15
| % 4
|
| 32.18
| %
|
| (18.51
| )%
|
| (38.31
| )%
|
| | | | | | | | | | | | | | | |
Ratios to Average Net Assets:
|
|
|
|
|
|
|
|
|
|
|
|
|
|
|
|
Net expenses 5
|
| 1.21
| % 6
|
| 1.32
| % 6
|
| 1.39
| % 6
|
| 1.34
| % 6
|
| 1.27
| %
|
Net investment income (loss)
|
| (0.32
| )%
|
| (0.81
| )%
|
| (0.86
| )%
|
| (0.56
| )%
|
| (0.51
| )%
|
Expense waiver/reimbursement 7
|
| 0.06
| %
|
| 0.00
| % 8
|
| - --
|
|
| - --
|
|
| - --
|
|
Supplemental Data:
|
|
|
|
|
|
|
|
|
|
|
|
|
|
|
|
Net assets, end of period (000 omitted)
|
| $537,322
|
|
| $486,643
|
|
| $504,998
|
|
| $439,072
|
|
| $665,021
|
|
Portfolio turnover
|
| 139
| %
|
| 144
| %
|
| 181
| %
|
| 207
| %
|
| 211
| %
|
1 Per share numbers have been calculated using the average shares method.
2 Based on net asset value, which does not reflect the sales charge, redemption fee or contingent deferred sales charge, if applicable. Total returns for periods of less than one year are not annualized.
3 During the period, the Fund was reimbursed by the shareholder services provider, which had an impact of 0.07% on the total return. See Notes to Financial Statements (Note 5).
4 During the period, the Fund was reimbursed by the adviser, which had an impact of 0.04% on total return. See Notes to Financial Statements (Note 5).
5 Pursuant to a settlement with the New York Attorney General, the Adviser has agreed to waive management fees in compliance with an Assurance of Discontinuance dated November 17, 2005. The net management fee will be reduced to 0.4975% effective January 1, 2006 and may not be increased until after December 31, 2010.
6 The expense ratio is calculated without reduction for fees paid indirectly for directed brokerage arrangements. The expense ratios are 1.19%, 1.31%, 1.36% and 1.32% after taking into account these expense reductions for the years ended October 31, 2005, 2004, 2003 and 2002, respectively.
7 This expense decrease is reflected in both the net expense and the net investment income (loss) ratios shown above.
8 Represents less than 0.01%.
See Notes which are an integral part of the Financial Statements
Financial Highlights - Class B Shares
(For a Share Outstanding Throughout Each Period)
Year Ended October 31
|
| 2005
|
|
| 2004
|
|
| 2003
|
|
| 2002
|
|
| 2001
|
|
Net Asset Value, Beginning of Period
| | $25.31 | | | $23.36 | | | $17.80 | | | $22.02 | | | $38.79 | |
Income From Investment Operations:
| | | | | | | | | | | | | | | |
Net investment income (loss)
| | (0.32 | ) 1 | | (0.38 | ) 1 | | (0.31 | ) 1 | | (0.28 | ) 1 | | (0.35 | ) 1 |
Net realized and unrealized gain (loss) on investments and foreign currency transactions
|
| 4.14
|
|
| 2.33
|
|
| 5.87
|
|
| (3.94
| )
|
| (13.73
| )
|
TOTAL FROM INVESTMENT OPERATIONS
|
| 3.82
|
|
| 1.95
|
|
| 5.56
|
|
| (4.22
| )
|
| (14.08
| )
|
Less Distributions:
| | | | | | | | | | | | | | | |
Distributions from net realized gain on investments
|
| - --
|
|
| - --
|
|
| - --
|
|
| - --
|
|
| (2.69
| )
|
Net Asset Value, End of Period
|
| $29.13
|
|
| $25.31
|
|
| $23.36
|
|
| $17.80
|
|
| $22.02
|
|
Total Return 2
|
| 15.09
| %
|
| 8.35
| % 3
|
| 31.24
| %
|
| (19.16
| )%
|
| (38.77
| )%
|
| | | | | | | | | | | | | | | |
Ratios to Average Net Assets:
|
|
|
|
|
|
|
|
|
|
|
|
|
|
|
|
Net expenses 4
|
| 2.04
| % 5
|
| 2.07
| % 5
|
| 2.14
| % 5
|
| 2.09
| % 5
|
| 2.02
| %
|
Net investment income (loss)
|
| (1.13
| )%
|
| (1.56
| )%
|
| (1.61
| )%
|
| (1.31
| )%
|
| (1.26
| )%
|
Expense waiver/reimbursement 6
|
| 0.00
| % 7
|
| 0.00
| % 7
|
| - --
|
|
| - --
|
|
| - --
|
|
Supplemental Data:
|
|
|
|
|
|
|
|
|
|
|
|
|
|
|
|
Net assets, end of period (000 omitted)
|
| $129,155
|
|
| $144,819
|
|
| $162,097
|
|
| $147,013
|
|
| $237,630
|
|
Portfolio turnover
|
| 139
| %
|
| 144
| %
|
| 181
| %
|
| 207
| %
|
| 211
| %
|
1 Per share numbers have been calculated using the average shares method.
2 Based on net asset value, which does not reflect the sales charge, redemption fee or contingent deferred sales charge, if applicable. Total returns for periods of less than one year are not annualized.
3 During the period, the Fund was reimbursed by the adviser, which had an impact of 0.09% on total return. See Notes to Financial Statements (Note 5).
4 Pursuant to a settlement with the New York Attorney General, the Adviser has agreed to waive management fees in compliance with an Assurance of Discontinuance dated November 17, 2005. The net management fee will be reduced to 0.4975% effective January 1, 2006 and may not be increased until after December 31, 2010.
5 The expense ratio is calculated without reduction for fees paid indirectly for directed brokerage arrangements. The expense ratios are 2.02%, 2.06%, 2.11% and 2.07% after taking into account these expense reductions for the years ended October 31, 2005, 2004, 2003 and 2002, respectively.
6 This expense decrease is reflected in both the net expense and the net investment income (loss) ratios shown above.
7 Represents less than 0.01%.
See Notes which are an integral part of the Financial Statements
Financial Highlights - Class C Shares
(For a Share Outstanding Throughout Each Period)
Year Ended October 31
|
| 2005
|
|
| 2004
|
|
| 2003
|
|
| 2002
|
|
| 2001
|
|
Net Asset Value, Beginning of Period
| | $25.56 | | | $23.59 | | | $17.98 | | | $22.23 | | | $39.14 | |
Income From Investment Operations:
| | | | | | | | | | | | | | | |
Net investment income (loss)
| | (0.33 | ) 1 | | (0.39 | ) 1 | | (0.31 | ) 1 | | (0.28 | ) 1 | | (0.35 | ) 1 |
Net realized and unrealized gain (loss) on investments and foreign currency transactions
|
| 4.18
|
|
| 2.36
|
|
| 5.92
|
|
| (3.97
| )
|
| (13.87
| )
|
TOTAL FROM INVESTMENT OPERATIONS
|
| 3.85
|
|
| 1.97
|
|
| 5.61
|
|
| (4.25
| )
|
| (14.22
| )
|
Less Distributions:
| | | | | | | | | | | | | | | |
Distributions from net realized gain on investments
|
| - --
|
|
| - --
|
|
| - --
|
|
| - --
|
|
| (2.69
| )
|
Net Asset Value, End of Period
|
| $29.41
|
|
| $25.56
|
|
| $23.59
|
|
| $17.98
|
|
| $22.23
|
|
Total Return 2
|
| 15.06
| %
|
| 8.35
| % 3
|
| 31.20
| %
|
| (19.12
| )%
|
| (38.78
| )%
|
| | | | | | | | | | | | | | | |
Ratios to Average Net Assets:
|
|
|
|
|
|
|
|
|
|
|
|
|
|
|
|
Net expenses 4
|
| 2.04
| % 5
|
| 2.07
| % 5
|
| 2.14
| % 5
|
| 2.09
| % 5
|
| 2.02
| %
|
Net investment income (loss)
|
| (1.13
| )%
|
| (1.56
| )%
|
| (1.61
| )%
|
| (1.31
| )%
|
| (1.26
| )%
|
Expense waiver/reimbursement 6
|
| 0.00
| % 7
|
| 0.00
| % 7
|
| - --
|
|
| - --
|
|
| 0.00
| % 7
|
Supplemental Data:
|
|
|
|
|
|
|
|
|
|
|
|
|
|
|
|
Net assets, end of period (000 omitted)
|
| $30,903
|
|
| $33,015
|
|
| $35,472
|
|
| $30,194
|
|
| $46,173
|
|
Portfolio turnover
|
| 139
| %
|
| 144
| %
|
| 181
| %
|
| 207
| %
|
| 211
| %
|
1 Per share numbers have been calculated using the average shares method.
2 Based on net asset value, which does not reflect the sales charge, redemption fee or contingent deferred sales charge, if applicable. Total returns for periods of less than one year are not annualized.
3 During the period, the Fund was reimbursed by the adviser, which had an impact of 0.08% on total return. See Notes to Financial Statements (Note 5).
4 Pursuant to a settlement with the New York Attorney General, the Adviser has agreed to waive management fees in compliance with an Assurance of Discontinuance dated November 17, 2005. The net management fee will be reduced to 0.4975% effective January 1, 2006 and may not be increased until after December 31, 2010.
5 The expense ratio is calculated without reduction for fees paid indirectly for directed brokerage arrangements. The expense ratios are 2.02%, 2.06%, 2.11% and 2.07% after taking into account these expense reductions for the years ended October 31, 2005, 2004, 2003 and 2002, respectively.
6 This expense decrease is reflected in both the net expense and the net investment income (loss) ratios shown above.
7 Represents less than 0.01%.
See Notes which are an integral part of the Financial Statements
Shareholder Expense Example
As a shareholder of the Fund, you incur two types of costs: (1) transaction costs, including sales charges (loads) on purchase or redemption payments; and (2) ongoing costs, including management fees; to the extent applicable, distribution (12b-1) fees and/or shareholder services fees; and other Fund expenses. This Example is intended to help you to understand your ongoing costs (in dollars) of investing in the Fund and to compare these costs with the ongoing costs of investing in other mutual funds. It is based on an investment of $1,000 invested at the beginning of the period and held for the entire period from May 1, 2005 to October 31, 2005.
ACTUAL EXPENSES
The first section of the table below provides information about actual account values and actual expenses. You may use the information in this section, together with the amount you invested, to estimate the expenses that you incurred over the period. Simply divide your account value by $1,000 (for example, an $8,600 account value divided by $1,000 = 8.6), then multiply the result by the number in the first section under the heading entitled "Expenses Paid During Period" to estimate the expenses attributable to your investment during this period.
HYPOTHETICAL EXAMPLE FOR COMPARISON PURPOSES
The second section of the table below provides information about hypothetical account values and hypothetical expenses based on the Fund's actual expense ratio and an assumed rate of return of 5% per year before expenses, which is not the Fund's actual return. Thus, you should not use the hypothetical account values and expenses to estimate the actual ending account balance or your expenses for the period. Rather, these figures are provided to enable you to compare the ongoing costs of investing in the Fund and other funds. To do so, compare this 5% hypothetical example with the 5% hypothetical examples that appear in the shareholder reports of the other funds.
Please note that the expenses shown in the table are meant to highlight your ongoing costs only and do not reflect any transaction costs, such as sales charges (loads) on purchase or redemption payments. Therefore, the second section of the table is useful in comparing ongoing costs only, and will not help you determine the relative total costs of owning different funds. In addition, if these transaction costs were included, your costs would have been higher.
|
| Beginning
Account Value
5/1/2005
|
| Ending
Account Value
10/31/2005
|
| Expenses Paid
During Period 1
|
Actual:
|
|
|
|
|
|
|
Class A Shares
|
| $1,000
|
| $1,111.30
|
| $ 6.01
|
Class B Shares
|
| $1,000
|
| $1,107.20
|
| $10.68
|
Class C Shares
|
| $1,000
|
| $1,106.90
|
| $10.67
|
Hypothetical (assuming a 5% return before expenses):
|
|
|
|
|
|
|
Class A Shares
|
| $1,000
|
| $1,019.51
|
| $ 5.75
|
Class B Shares
|
| $1,000
|
| $1,015.07
|
| $10.21
|
Class C Shares
|
| $1,000
|
| $1,015.07
|
| $10.21
|
1 Expenses are equal to the Fund's annualized expense ratio, multiplied by the average account value over the period, multiplied by 184/365 (to reflect the one-half year period). The annualized expense ratios are as follows:
Class A Shares
|
| 1.13%
|
Class B Shares
|
| 2.01%
|
Class C Shares
|
| 2.01%
|
Management's Discussion of Fund Performance
The fund's total return, based on net asset value, for the fiscal year ended October 31, 2005 was 16.07% for Class A Shares, 15.09% for Class B Shares, and 15.06% for Class C Shares. The total return of the Russell Midcap Growth Index ("RMG Index") was 15.91% for the same period. 1 The fund's total return for the fiscal year reflected actual cash flows, transaction costs and other expenses which were not reflected in the total return of the RMG Index.
The following discussion will focus on the performance of the fund's Class A Shares.
MARKET OVERVIEW
Mid cap growth stocks, as measured by the RMG Index, were reasonably strong for most of the fund's fiscal year and especially so in the last six months of the fiscal year. Mid cap growth stocks also substantially outperformed both large cap and small cap growth stocks over the fund's twelve month reporting period.
The biggest issue over the past year was the rise in energy prices and the impact it is expected to have on economic growth and inflation.
FUND PERFORMANCE
The fund's performance, compared to the RMG Index, was aided by its overweight in the Telecommunication Services and Energy sectors relative to the RMG Index and stock selection in those sectors. Additionally, the fund's strong returns in its Consumer Discretionary stocks overcame its being underweight in that sector relative to the RMG Index and positively contributed to the fund's performance during the reporting period.
1 The RMG Index measures the performance of those Russell mid-cap companies with higher price-to-book ratios and higher forecasted growth values. The stocks are also members of the Russell 1000 Growth Index. The index is unmanaged. Investments cannot be made in an index.
Individual stocks contributing to the fund's performance cut across a variety of sectors and included: Joy Global (averaged 1.1% of net assets), a leading manufacturer of coal mining equipment, which gained 106% during the reporting period; NII Holdings (1.0% of net assets), a U.S.-based provider of wireless telecommunication services to Latin and South American markets, which rose 97% during the reporting period; and Peabody Energy (0.7% of net assets), a miner of predominantly low sulfur coal, which gained 147% during the reporting period.
The fund's relative performance was hurt by the fund's stock selection in Information Technology and Materials, as well as its modest holding of cash. Specific fund holdings that detracted from performance included: RSA Security (averaged 0.4% of net assets), a provider of security systems for information networks; Elan (0.4% of net assets), an Irish pharmaceuticals manufacturer; and AK Steel (0.3% of net assets), a maker of flat rolled carbon steel.
GROWTH OF A $10,000 INVESTMENT - CLASS A SHARES
The graph below illustrates the hypothetical investment of $10,000 1 in Federated Mid Cap Growth Strategies Fund (Class A Shares) (the "Fund") from October 31, 1995 to October 31, 2005, compared to the Russell Midcap Growth Index (RMCGI), 2 and the Lipper Mid-Cap Growth Fund Average (LMCGFA). 2
Average Annual Total Returns 3 for the Period Ended 10/31/2005
|
|
|
|
1 Year
|
| 9.68
| %
|
5 Years
|
| (4.47
| )%
|
10 Years
|
| 9.24
| %
|

Performance data quoted represents past performance which is no guarantee of future results. Investment return and principal value will fluctuate so that an investor's shares, when redeemed, may be worth more or less than their original cost. Mutual fund performance changes over time and current performance may be lower or higher than what is stated. For current to the most recent month-end performance and after-tax returns, visit FederatedInvestors.com or call 1-800-341-7400. Returns shown do not reflect the deduction of taxes that a shareholder would pay on Fund distributions or the redemption of Fund shares. Mutual funds are not obligations of or guaranteed by any bank and are not federally insured. Total returns shown include the maximum sales charge of 5.50%.
1 Represents a hypothetical investment of $10,000 in the Fund after deducting the maximum sales charge of 5.50% ($10,000 investment minus $550 sales charge = $9,450). The Fund's performance assumes the reinvestment of all dividends and distributions. The RMCGI has been adjusted to reflect reinvestment of dividends on securities in the index.
2 The RMCGI is not adjusted to reflect sales loads, expenses, or other fees that the Securities and Exchange Commission (SEC) requires to be reflected in the Fund's performance. The index is unmanaged and, unlike the Fund, is not affected by cashflows. It is not possible to invest directly in an index. The LMCGFA represents the average of the total returns reported by all the mutual funds designated by Lipper, Inc. as falling into the category, and is not adjusted to reflect any sales charges. However, these total returns are reported net of expenses or other fees that the SEC requires to be reflected in a fund's performance.
3 Total return quoted reflects all applicable sales charges.
GROWTH OF A $10,000 INVESTMENT - CLASS B SHARES
The graph below illustrates the hypothetical investment of $10,000 1 in Federated Mid Cap Growth Strategies Fund (Class B Shares) (the "Fund") from October 31, 1995 to October 31, 2005, compared to the Russell Midcap Growth Index (RMCGI), 2 and the Lipper Mid-Cap Growth Fund Average (LMCGFA). 2
Average Annual Total Returns 3 for the Period Ended 10/31/2005
|
|
|
|
1 Year
|
| 9.59
| %
|
5 Years
|
| (4.48
| )%
|
10 Years
|
| 9.18
| %
|
Performance data quoted represents past performance which is no guarantee of future results. Investment return and principal value will fluctuate so that an investor's shares, when redeemed, may be worth more or less than their original cost. Mutual fund performance changes over time and current performance may be lower or higher than what is stated. For current to the most recent month-end performance and after-tax returns, visit FederatedInvestors.com or call 1-800-341-7400. Returns shown do not reflect the deduction of taxes that a shareholder would pay on Fund distributions or the redemption of Fund shares. Mutual funds are not obligations of or guaranteed by any bank and are not federally insured. Total returns shown include the maximum contingent deferred sales charge of 5.50%, as applicable.
1 Represents a hypothetical investment of $10,000 in the Fund. The ending value of the Fund does not reflect a contingent deferred sales charge on any redemption over seven years from the purchase date. The maximum contingent deferred sales charge is 5.50% on any redemption less than one year from the purchase date. The Fund's performance assumes the reinvestment of all dividends and distributions. The RMCGI has been adjusted to reflect reinvestment of dividends on securities in the index.
2 The RMCGI is not adjusted to reflect sales loads, expenses, or other fees that the SEC requires to be reflected in the Fund's performance. The index is unmanaged and, unlike the Fund, is not affected by cashflows. It is not possible to invest directly in an index. The LMCGFA represents the average of the total returns reported by all the mutual funds designated by Lipper, Inc. as falling into the category, and is not adjusted to reflect any sales charges. However, these total returns are reported net of expenses or other fees that the SEC requires to be reflected in a fund's performance.
3 Total return quoted reflects all applicable contingent deferred sales charges.
GROWTH OF A $10,000 INVESTMENT - CLASS C SHARES
The graph below illustrates the hypothetical investment of $10,000 1 in Federated Mid Cap Growth Strategies Fund (Class C Shares) (the "Fund") from October 31, 1995 to October 31, 2005, compared to the Russell Midcap Growth Index (RMCGI), 2 and the Lipper Mid-Cap Growth Fund Average (LMCGFA). 2
Average Annual Total Returns 3 for the Period Ended 10/31/2005
|
|
|
|
1 Year
|
| 12.91
| %
|
5 Years
|
| (4.32
| )%
|
10 Years
|
| 8.97
| %
|
Performance data quoted represents past performance which is no guarantee of future results. Investment return and principal value will fluctuate so that an investor's shares, when redeemed, may be worth more or less than their original cost. Mutual fund performance changes over time and current performance may be lower or higher than what is stated. For current to the most recent month-end performance and after-tax returns, visit FederatedInvestors.com or call 1-800-341-7400. Returns shown do not reflect the deduction of taxes that a shareholder would pay on Fund distributions or the redemption of Fund shares. Mutual funds are not obligations of or guaranteed by any bank and are not federally insured. Total returns shown include the maximum sales charge of 1.00%, and the maximum contingent deferred sales charge of 1.00%, as applicable.
1 Represents a hypothetical investment of $10,000 in the Fund after deducting the maximum sales charge of 1.00% ($10,000 investment minus $100 sales charge = $9,900). A 1.00% contingent deferred sales charge would be applied to any redemption less than one year from purchase date. The Fund's performance assumes the reinvestment of all dividends and distributions. The RMCGI has been adjusted to reflect reinvestment of dividends on securities in the index.
2 The RMCGI is not adjusted to reflect sales loads, expenses, or other fees that the SEC requires to be reflected in the Fund's performance. The index is unmanaged and, unlike the Fund, is not affected by cashflows. It is not possible to invest directly in an index. The LMCGFA represents the average of the total returns reported by all the mutual funds designated by Lipper, Inc. as falling into the category, and is not adjusted to reflect any sales charges. However, these total returns are reported net of expenses or other fees that the SEC requires to be reflected in a fund's performance.
3 Total return quoted reflects all applicable sales charges and contingent deferred sales charges.
Performance data quoted represents past performance which is no guarantee of future results. Investment return and principal value will fluctuate so that an investor's shares, when redeemed, may be worth more or less than their original cost. Mutual fund performance changes over time and current performance may be lower or higher than what is stated. For current to the most recent month-end performance, visit FederatedInvestors.com or call 1-800-341-7400.
Portfolio of Investments Summary Table
At October 31, 2005, the Fund's sector composition 1 was as follows:
Sector
|
| Percentage of
Total Net Assets
|
Healthcare
|
| 18.8
| %
|
Information Technology
|
| 18.5
| %
|
Consumer Discretionary
|
| 14.4
| %
|
Industrials
|
| 12.5
| %
|
Energy
|
| 10.3
| %
|
Financials
|
| 9.1
| %
|
Telecommunication Services
|
| 4.4
| %
|
Materials
|
| 3.7
| %
|
Consumer Staples
|
| 2.6
| %
|
Utilities
|
| 1.6
| %
|
Securities Lending Collateral 2
|
| 17.2
| %
|
Cash Equivalents 3
|
| 4.0
| %
|
Other Assets and Liabilities--Net 4
|
| (17.1
| )%
|
TOTAL
|
| 100.0
| %
|
1 Except for Securities Lending Collateral, Cash Equivalents and Other Assets and Liabilities, sector classifications are based upon, and individual portfolio securities are assigned to, the classifications of the Global Industry Classification Standard (GICS) except that the adviser assigns a classification to securities not classified by the GICS and to securities for which the adviser does not have access to the classification made by the GICS.
2 Cash collateral received from lending portfolio securities which is invested in short term investments such as repurchase agreements or money market funds.
3 Cash Equivalents includes any investments in money market mutual funds and/or overnight repurchase agreements, other than those representing securities lending collateral.
4 See Statement of Assets and Liabilities.
Portfolio of Investments
October 31, 2005
Shares
|
|
|
|
| Value
|
|
| | | COMMON STOCKS--95.9% | | | | |
| | | Consumer Discretionary--14.4% | | | | |
| 180,600 | 1,2 | Advance Auto Parts, Inc.
| | $ | 6,772,500 | |
| 74,400 | | Boyd Gaming Corp.
| | | 3,069,000 | |
| 154,200 | 1,2 | Chicos Fas, Inc.
| | | 6,097,068 | |
| 147,800 | 2 | Choice Hotels International, Inc.
| | | 4,890,702 | |
| 127,400 | 1 | Coach, Inc.
| | | 4,099,732 | |
| 88,733 | | D. R. Horton, Inc.
| | | 2,723,216 | |
| 59,100 | 1,2 | Getty Images, Inc.
| | | 4,905,891 | |
| 81,900 | 2 | Harrah's Entertainment, Inc.
| | | 4,953,312 | |
| 161,400 | | Hilton Hotels Corp.
| | | 3,139,230 | |
| 43,400 | 2 | KB HOME
| | | 2,836,190 | |
| 51,100 | 2 | Lennar Corp., Class A
| | | 2,840,138 | |
| 136,200 | 2 | MGM Mirage
| | | 5,089,794 | |
| 51,900 | 2 | Marriott International, Inc., Class A
| | | 3,094,278 | |
| 3,700 | 1,2 | NVR, Inc.
| | | 2,536,350 | |
| 207,800 | | Nordstrom, Inc.
| | | 7,200,270 | |
| 130,600 | 1,2 | O'Reilly Automotive, Inc.
| | | 3,682,920 | |
| 156,000 | 1 | Office Depot, Inc.
| | | 4,294,680 | |
| 715,400 | 1,2 | Sirius Satellite Radio, Inc.
| | | 4,464,096 | |
| 83,000 | 2 | Starwood Hotels & Resorts Worldwide, Inc.
| | | 4,849,690 | |
| 81,100 | | Station Casinos, Inc.
| | | 5,198,510 | |
| 199,200 | 1,2 | Urban Outfitters, Inc.
| | | 5,643,336 | |
| 268,500 | 1,2 | XM Satellite Radio Holdings, Inc., Class A
|
|
| 7,740,855
|
|
| | | TOTAL
|
|
| 100,121,758
|
|
| | | Consumer Staples--2.6% | | | | |
| 66,800 | | Brown-Forman Corp., Class B
| | | 4,231,112 | |
| 91,000 | 2 | Bunge Ltd.
| | | 4,726,540 | |
| 118,100 | | Kellogg Co.
| | | 5,216,477 | |
| 45,300 | 2 | Reynolds American, Inc.
|
|
| 3,850,500
|
|
| | | TOTAL
|
|
| 18,024,629
|
|
Shares
|
|
|
|
| Value
|
|
| | | COMMON STOCKS--continued | | | | |
| | | Energy--10.3% | | | | |
| 70,400 | | Baker Hughes, Inc.
| | $ | 3,869,184 | |
| 63,300 | | CONSOL Energy, Inc.
| | | 3,854,970 | |
| 64,200 | | Cameco Corp.
| | | 3,068,760 | |
| 177,600 | 1 | Cheniere Energy, Inc.
| | | 6,612,048 | |
| 136,700 | | Chesapeake Energy Corp.
| | | 4,388,070 | |
| 105,000 | 1,2 | Denbury Resources, Inc.
| | | 4,581,150 | |
| 91,100 | | ENSCO International, Inc.
| | | 4,153,249 | |
| 53,400 | 2 | EOG Resources, Inc.
| | | 3,619,452 | |
| 108,400 | 1 | Grant Prideco, Inc.
| | | 4,215,676 | |
| 83,000 | 2 | Helmerich & Payne, Inc.
| | | 4,598,200 | |
| 97,500 | | Noble Energy, Inc.
| | | 3,904,875 | |
| 141,800 | 2 | Patterson-UTI Energy, Inc.
| | | 4,839,634 | |
| 52,400 | | Peabody Energy Corp.
| | | 4,095,584 | |
| 88,949 | 1,2 | Quicksilver Resources, Inc.
| | | 3,444,995 | |
| 31,000 | 1 | Southwestern Energy Co.
| | | 2,248,740 | |
| 93,600 | | Tesoro Petroleum Corp.
| | | 5,723,640 | |
| 98,100 | | XTO Energy, Inc.
|
|
| 4,263,426
|
|
| | | TOTAL
|
|
| 71,481,653
|
|
| | | Financials--9.1% | | | | |
| 80,500 | 2 | Ace Ltd.
| | | 4,194,050 | |
| 86,800 | 1,2 | Affiliated Managers Group
| | | 6,661,900 | |
| 102,300 | 1 | CB Richard Ellis Services
| | | 4,997,355 | |
| 89,300 | | CBL & Associates Properties, Inc.
| | | 3,335,355 | |
| 14,800 | 2 | Chicago Mercantile Exchange Holdings, Inc.
| | | 5,404,220 | |
| 67,900 | 2 | Chubb Corp.
| | | 6,312,663 | |
| 101,600 | | HCC Insurance Holdings, Inc.
| | | 3,048,000 | |
| 71,450 | | Legg Mason, Inc.
| | | 7,667,300 | |
| 46,400 | | Mercantile Bankshares Corp.
| | | 2,615,104 | |
| 140,900 | 2 | Moody's Corp.
| | | 7,504,334 | |
| 90,200 | | Principal Financial Group
| | | 4,476,626 | |
| 66,700 | | Regency Centers Corp.
| | | 3,713,189 | |
| 53,600 | | T. Rowe Price Group, Inc.
|
|
| 3,511,872
|
|
| | | TOTAL
|
|
| 63,441,968
|
|
Shares
|
|
|
|
| Value
|
|
| | | COMMON STOCKS--continued | | | | |
| | | Healthcare--18.8% | | | | |
| 56,600 | | CIGNA Corp.
| | $ | 6,558,242 | |
| 176,100 | 1,2 | Caremark Rx, Inc.
| | | 9,227,640 | |
| 95,000 | 1,2 | Cerner Corp.
| | | 8,022,750 | |
| 162,300 | 1,2 | Covance, Inc.
| | | 7,895,895 | |
| 130,200 | 1,2 | Coventry Health Care, Inc.
| | | 7,029,498 | |
| 158,450 | 1 | DaVita, Inc.
| | | 7,792,571 | |
| 631,000 | 1,2 | Exelixis, Inc.
| | | 4,877,630 | |
| 97,400 | 1,2 | Express Scripts, Inc., Class A
| | | 7,344,934 | |
| 89,300 | 1 | Genzyme Corp.
| | | 6,456,390 | |
| 139,400 | 1 | Gilead Sciences, Inc.
| | | 6,586,650 | |
| 109,400 | 1,2 | Henry Schein, Inc.
| | | 4,336,616 | |
| 158,100 | 1 | Humana, Inc.
| | | 7,018,059 | |
| 115,700 | 1 | LifePoint Hospitals, Inc.
| | | 4,523,870 | |
| 149,700 | 2 | McKesson HBOC, Inc.
| | | 6,800,871 | |
| 119,500 | 1,2 | Medco Health Solutions, Inc.
| | | 6,751,750 | |
| 192,500 | 1,2 | Medimmune, Inc.
| | | 6,733,650 | |
| 249,900 | 1,2 | Protein Design Laboratories, Inc.
| | | 7,002,198 | |
| 115,700 | | Quest Diagnostic, Inc.
| | | 5,404,347 | |
| 67,700 | 1,2 | Sierra Health Services, Inc.
| | | 5,077,500 | |
| 120,800 | | St. Jude Medical, Inc.
|
|
| 5,806,856
|
|
| | | TOTAL
|
|
| 131,247,917
|
|
| | | Industrials--12.5% | | | | |
| 143,400 | 2 | AMETEK, Inc.
| | | 5,840,682 | |
| 110,200 | 2 | Alexander and Baldwin, Inc.
| | | 5,393,188 | |
| 72,400 | 1,2 | Alliant Techsystems, Inc.
| | | 5,083,928 | |
| 208,700 | 1,2 | Ceradyne, Inc.
| | | 8,181,040 | |
| 79,200 | | Corporate Executive Board Co.
| | | 6,545,088 | |
| 53,800 | 2 | Expeditors International Washington, Inc.
| | | 3,264,046 | |
| 173,600 | 2 | GATX Corp.
| | | 6,487,432 | |
| 135,100 | 2 | Goodrich (B.F.) Co.
| | | 4,873,057 | |
| 97,600 | 2 | Jacobs Engineering Group, Inc.
| | | 6,222,000 | |
| 154,750 | 2 | Joy Global, Inc.
| | | 7,098,382 | |
| 70,400 | | L-3 Communications Holdings, Inc.
| | | 5,478,528 | |
| 128,400 | | Precision Castparts Corp.
| | | 6,081,024 | |
Shares
|
|
|
|
| Value
|
|
| | | COMMON STOCKS--continued | | | | |
| | | Industrials--continued | | | | |
| 112,900 | | Rockwell Automation, Inc.
| | $ | 6,000,635 | |
| 124,500 | | Rockwell Collins
| | | 5,704,590 | |
| 60,400 | 2 | UTI Worldwide, Inc.
|
|
| 5,166,616
|
|
| | | TOTAL
|
|
| 87,420,236
|
|
| | | Information Technology--18.5% | | | | |
| 301,500 | 1,2 | ADC Telecommunications, Inc.
| | | 5,261,175 | |
| 1,130,300 | | ARM Holdings PLC, ADR
| | | 6,499,225 | |
| 242,400 | 1,2 | ASM Lithography Holding NV
| | | 4,115,952 | |
| 320,800 | 1,2 | ATI Technologies, Inc.
| | | 4,635,560 | |
| 371,821 | 1 | Activision, Inc.
| | | 5,863,622 | |
| 220,500 | 1,2 | Advanced Micro Devices, Inc.
| | | 5,120,010 | |
| 132,400 | 1 | Amdocs Ltd.
| | | 3,504,628 | |
| 86,800 | | Amphenol Corp., Class A
| | | 3,469,396 | |
| 185,000 | 1 | Ansys, Inc.
| | | 6,893,100 | |
| 120,800 | 1,2 | Anteon International Corp.
| | | 5,460,160 | |
| 129,800 | 1 | Autodesk, Inc.
| | | 5,857,874 | |
| 338,900 | 1,2 | Cadence Design Systems, Inc.
| | | 5,415,622 | |
| 156,500 | 1 | Citrix Systems, Inc.
| | | 4,314,705 | |
| 84,000 | 1 | Cognizant Technology Solutions Corp.
| | | 3,694,320 | |
| 169,300 | 1,2 | Comverse Technology, Inc.
| | | 4,249,430 | |
| 131,200 | | Global Payments, Inc.
| | | 5,621,920 | |
| 2,192,100 | 1,2 | JDS Uniphase Corp.
| | | 4,603,410 | |
| 116,200 | 1,2 | Jabil Circuit, Inc.
| | | 3,468,570 | |
| 126,900 | 1,2 | Lam Research Corp.
| | | 4,281,606 | |
| 363,400 | 1,2 | MEMC Electronic Materials
| | | 6,519,396 | |
| 94,300 | 1,2 | Macromedia, Inc.
| | | 4,141,656 | |
| 192,600 | 1 | McAfee, Inc.
| | | 5,783,778 | |
| 114,500 | 1 | NCR Corp.
| | | 3,460,190 | |
| 154,700 | 1 | NVIDIA Corp.
| | | 5,190,185 | |
| 293,400 | 1,2 | Sybase, Inc.
| | | 6,528,150 | |
| 226,700 | 1 | aQuantive, Inc.
|
|
| 4,908,055
|
|
| | | TOTAL
|
|
| 128,861,695
|
|
Shares
|
|
|
|
| Value
|
|
| | | COMMON STOCKS--continued | | | | |
| | | Materials--3.7% | | | | |
| 65,500 | 2 | Cleveland Cliffs, Inc.
| | $ | 5,340,870 | |
| 346,200 | 1,2 | Mosaic Co./The
| | | 4,569,840 | |
| 34,000 | | Phelps Dodge Corp.
| | | 4,095,980 | |
| 91,800 | | Potash Corp. of Saskatchewan, Inc.
| | | 7,556,976 | |
| 64,200 | | Vulcan Materials Co.
|
|
| 4,173,000
|
|
| | | TOTAL
|
|
| 25,736,666
|
|
| | | Telecommunication Services--4.4% | | | | |
| 329,600 | 1,2 | Alamosa Holdings, Inc.
| | | 4,878,080 | |
| 298,100 | 1,2 | American Tower Systems Corp.
| | | 7,109,685 | |
| 117,000 | 1,2 | NII Holdings, Inc.
| | | 9,701,640 | |
| 299,800 | 1 | NeuStar, Inc., Class A
|
|
| 9,173,880
|
|
| | | TOTAL
|
|
| 30,863,285
|
|
| | | Utilities--1.6% | | | | |
| 279,300 | 1,2 | AES Corp.
| | | 4,438,077 | |
| 64,500 | | Constellation Energy Group
| | | 3,534,600 | |
| 267,500 | 1,2 | Sierra Pacific Resources
|
|
| 3,464,125
|
|
| | | TOTAL
|
|
| 11,436,802
|
|
| | | TOTAL COMMON STOCKS
(IDENTIFIED COST $567,806,430)
|
|
| 668,636,609
|
|
Principal
Amounts
|
|
|
|
| Value
|
|
| | | REPURCHASE AGREEMENT--21.2% | | | | |
| $ | 27,854,000 | | Interest in $3,500,000,000 joint repurchase agreement 4.04%, dated 10/31/2005, under which Bank of America N.A. will repurchase a U.S. Government Agency security with a maturity of 7/1/2035 for $3,500,392,778 on 11/1/2005. The market value of the underlying security at the end of the period was $3,570,000,001.
| | $ | 27,854,000 | |
| 60,000,000 | | Interest in $2,000,000,000 joint repurchase agreement 4.04%, dated 10/31/2005 under which Bear Stearns and Co., Inc. will repurchase U.S. Government Agency securities with various maturities to 11/25/2035 for $2,000,224,444 on 11/1/2005. The market value of the underlying securities at the end of the period was $2,060,002,229 (held as collateral for securities lending).
| | | 60,000,000 | |
| 60,006,000 | | Interest in $1,000,000,000 joint repurchase agreement 4.04%, dated 10/31/2005 under which Deutsche Bank Securities, Inc. will repurchase U.S. Government Agency securities with various maturities to 11/1/2035 for $1,000,112,222 on 11/1/2005. The market value of the underlying securities at the end of the period was $1,022,185,524 (held as collateral for securities lending).
|
|
| 60,006,000
|
|
| | | TOTAL REPURCHASE AGREEMENTS
(AT AMORTIZED COST)
|
|
| 147,860,000
|
|
| | | TOTAL INVESTMENTS--117.1%
(IDENTIFIED COST $715,666,430) 3
|
|
| 816,496,609
|
|
| | | OTHER ASSETS AND LIABILITIES - NET--(17.1)%
|
|
| (119,116,702
| )
|
| | | TOTAL NET ASSETS--100%
|
| $
| 697,379,907
|
|
1 Non-income producing security.
2 Certain or all shares are temporarily on loan to unaffiliated brokers/dealers.
3 The cost of investments for federal tax purposes amounts to $715,952,215.
Note: The categories of investments are shown as a percentage of total net assets at October 31, 2005.
The following acronym is used throughout this portfolio:
| ADR | - --American Depositary Receipt |
See Notes which are an integral part of the Financial Statements
Statement of Assets and Liabilities
October 31, 2005
Assets:
| | | | | | | |
Investments in securities
| | $ | 668,636,609 | | | | |
Investments in repurchase agreements
|
|
| 147,860,000
|
|
|
|
|
Total investments in securities, at value including $118,525,846 of securities loaned (identified cost $715,666,430)
| | | | | $ | 816,496,609 | |
Cash
| | | | | | 3,000 | |
Income receivable
| | | | | | 16,896 | |
Receivable for investments sold
| | | | | | 12,654,707 | |
Receivable for shares sold
|
|
|
|
|
| 326,009
|
|
TOTAL ASSETS
|
|
|
|
|
| 829,497,221
|
|
Liabilities:
| | | | | | | |
Payable for investments purchased
| | | 10,518,094 | | | | |
Payable for shares redeemed
| | | 954,089 | | | | |
Payable for collateral due to broker
| | | 120,006,000 | | | | |
Payable for distribution services fee (Note 5)
| | | 102,797 | | | | |
Payable for shareholder services fees (Note 5)
| | | 139,186 | | | | |
Accrued expenses
|
|
| 397,148
|
|
|
|
|
TOTAL LIABILITIES
|
|
|
|
|
| 132,117,314
|
|
Net assets for 22,357,894 shares outstanding
|
|
|
|
| $
| 697,379,907
|
|
Net Assets Consist of:
| | | | | | | |
Paid-in capital
| | | | | $ | 747,265,378 | |
Net unrealized appreciation of investments
| | | | | | 100,830,179 | |
Accumulated net realized loss on investments
|
|
|
|
|
| (150,715,650
| )
|
TOTAL NET ASSETS
|
|
|
|
| $
| 697,379,907
|
|
Net Asset Value, Offering Price and Redemption Proceeds Per Share
| | | | | | | |
Class A Shares:
| | | | | | | |
Net asset value per share ($537,322,044 ÷ 16,872,832 shares outstanding) no par value, unlimited shares authorized
|
|
|
|
|
| $31.85
|
|
Offering price per share (100/94.50 of $31.85) 1
|
|
|
|
|
| $33.70
|
|
Redemption proceeds per share
|
|
|
|
|
| $31.85
|
|
Class B Shares:
| | | | | | | |
Net asset value per share ($129,154,975 ÷ 4,434,381 shares outstanding) no par value, unlimited shares authorized
|
|
|
|
|
| $29.13
|
|
Offering price per share
|
|
|
|
|
| $29.13
|
|
Redemption proceeds per share (94.50/100 of $29.13) 1
|
|
|
|
|
| $27.53
|
|
Class C Shares:
| | | | | | | |
Net asset value per share ($30,902,888 ÷ 1,050,681 shares outstanding) no par value, unlimited shares authorized
|
|
|
|
|
| $29.41
|
|
Offering price per share (100/99.00 of $29.41) 1
|
|
|
|
|
| $29.71
|
|
Redemption proceeds per share (99.00/100 of $29.41) 1
|
|
|
|
|
| $29.12
|
|
1 See "What Do Shares Cost?" in the Prospectus.
See Notes which are an integral part of the Financial Statements
Statement of Operations
Year Ended October 31, 2005
Investment Income:
| | | | | | | | | | | | |
Dividends (including $8,213 received from affiliated issuers and net of foreign taxes withheld of $17,841)(Note 5)
| | | | | | | | | | $ | 5,408,450 | |
Interest
|
|
|
|
|
|
|
|
|
|
| 788,532
|
|
TOTAL INCOME
|
|
|
|
|
|
|
|
|
|
| 6,196,982
|
|
Expenses:
| | | | | | | | | | | | |
Investment adviser fee (Note 5)
| | | | | | $ | 5,289,345 | | | | | |
Administrative personnel and services fee (Note 5)
| | | | | | | 565,036 | | | | | |
Custodian fees
| | | | | | | 35,970 | | | | | |
Transfer and dividend disbursing agent fees and expenses
| | | | | | | 1,109,143 | | | | | |
Directors'/Trustees' fees
| | | | | | | 7,399 | | | | | |
Auditing fees
| | | | | | | 22,922 | | | | | |
Legal fees
| | | | | | | 8,562 | | | | | |
Portfolio accounting fees
| | | | | | | 132,122 | | | | | |
Distribution services fee--Class B Shares (Note 5)
| | | | | | | 1,067,117 | | | | | |
Distribution services fee--Class C Shares (Note 5)
| | | | | | | 248,338 | | | | | |
Shareholder services fee--Class A Shares (Note 5)
| | | | | | | 1,230,025 | | | | | |
Shareholder services fee--Class B Shares (Note 5)
| | | | | | | 355,706 | | | | | |
Shareholder services fee--Class C Shares (Note 5)
| | | | | | | 81,910 | | | | | |
Share registration costs
| | | | | | | 57,269 | | | | | |
Printing and postage
| | | | | | | 97,290 | | | | | |
Insurance premiums
| | | | | | | 12,430 | | | | | |
Miscellaneous
|
|
|
|
|
|
| 2,431
|
|
|
|
|
|
TOTAL EXPENSES
|
|
|
|
|
|
| 10,323,015
|
|
|
|
|
|
Waivers, Reimbursements and Expense Reduction (Note 5):
| | | | | | | | | | | | |
Reimbursement of investment adviser fee
| | $ | (210 | ) | | | | | | | | |
Waiver of administrative personnel and services fee
| | | (27,639 | ) | | | | | | | | |
Waiver of shareholder services fee--Class A Shares
| | | (15,509 | ) | | | | | | | | |
Reimbursement of shareholder services fee--Class A Shares
| | | (287,224 | ) | | | | | | | | |
Fees paid indirectly from directed broker arrangement
|
|
| (126,959
| )
|
|
|
|
|
|
|
|
|
TOTAL WAIVERS, REIMBURSEMENTS AND EXPENSE REDUCTIONS
|
|
|
|
|
|
| (457,541
| )
|
|
|
|
|
Net expenses
|
|
|
|
|
|
|
|
|
|
| 9,865,474
|
|
Net investment income (loss)
|
|
|
|
|
|
|
|
|
|
| (3,668,492
| )
|
Realized and Unrealized Gain (Loss) on Investments:
| | | | | | | | | | | | |
Net realized gain on investments
| | | | | | | | | | | 104,213,423 | |
Net change in unrealized appreciation of investments
|
|
|
|
|
|
|
|
|
|
| 1,518,599
|
|
Net realized and unrealized gain on investments
|
|
|
|
|
|
|
|
|
|
| 105,732,022
|
|
Change in net assets resulting from operations
|
|
|
|
|
|
|
|
|
| $
| 102,063,530
|
|
See Notes which are an integral part of the Financial Statements
Statement of Changes in Net Assets
Year Ended October 31
|
|
| 2005
|
|
|
| 2004
| |
Increase (Decrease) in Net Assets
| | | | | | | | |
Operations:
| | | | | | | | |
Net investment income (loss)
| | $ | (3,668,492 | ) | | $ | (7,034,129 | ) |
Net realized gain on investments
| | | 104,213,423 | | | | 134,858,764 | |
Net increase due to reimbursement from adviser (Note 5)
| | | - -- | | | | 503,345 | |
Net change in unrealized appreciation/depreciation of investments
|
|
| 1,518,599
|
|
|
| (69,029,291
| )
|
CHANGE IN NET ASSETS RESULTING FROM OPERATIONS
|
|
| 102,063,530
|
|
|
| 59,298,689
|
|
Share Transactions:
| | | | | | | | |
Proceeds from sale of shares
| | | 128,563,676 | | | | 106,449,956 | |
Cost of shares redeemed
|
|
| (197,715,619
| )
|
|
| (203,847,524
| )
|
CHANGE IN NET ASSETS RESULTING FROM SHARE TRANSACTIONS
|
|
| (69,151,943
| )
|
|
| (97,397,568
| )
|
Change in net assets
|
|
| 32,911,587
|
|
|
| (38,098,879
| )
|
Net Assets:
| | | | | | | | |
Beginning of period
|
|
| 664,468,320
|
|
|
| 702,567,199
|
|
End of period
|
| $
| 697,379,907
|
|
| $
| 664,468,320
|
|
See Notes which are an integral part of the Financial Statements
Notes to Financial Statements
October 31, 2005
1. ORGANIZATION
Federated Equity Funds (the "Trust") is registered under the Investment Company Act of 1940, as amended (the "Act"), as an open-end management investment company. The Trust consists of eight diversified portfolios. The financial statements included herein are only those of Federated Mid Cap Growth Strategies Fund (the "Fund"). The financial statements of the other portfolios are presented separately. The assets of each portfolio are segregated and a shareholder's interest is limited to the portfolio in which shares are held. The Fund offers three classes of shares: Class A Shares, Class B Shares and Class C Shares. All shares of the Fund have equal rights with respect to voting, except on class-specific matters. The primary investment objective of the Fund is appreciation of capital.
2. SIGNIFICANT ACCOUNTING POLICIES
The following is a summary of significant accounting policies consistently followed by the Fund in the preparation of its financial statements. These policies are in conformity with generally accepted accounting principles (GAAP) in the United States of America.
Investment Valuation
Domestic and foreign equity securities are valued at the last sale price or official closing price reported in the market in which they are primarily traded (either a national securities exchange or the over-the-counter market), if available. If unavailable, the security is generally valued at the mean between the last closing bid and asked prices. With respect to valuation of foreign securities, trading in foreign cities may be completed at times which vary from the closing of the New York Stock Exchange (NYSE). Therefore, foreign securities are valued at the latest closing price on the exchange on which they are traded immediately prior to the closing of the NYSE. Foreign securities quoted in foreign currencies are translated in U.S. dollars at the foreign exchange rate in effect at 4:00 p.m., Eastern Time, on the day the value of the foreign security is determined. The Fund generally values fixed income and short-term securities according to prices furnished by an independent pricing service, except that securities with remaining maturities of 60 days or less at the time of purchase may be valued at amortized cost. Investments in other open-end regulated investment companies are valued at net asset value. Securities for which no quotations are readily available or whose values have been affected by a significant event occurring between the close of their primary markets and the closing of the NYSE are valued at fair value as determined in accordance with procedures established by and under general supervision of the Board of Trustees (the "Trustees").
Repurchase Agreements
It is the policy of the Fund to require the custodian bank to take possession, to have legally segregated in the Federal Reserve Book Entry System, or to have segregated within the custodian bank's vault, all securities held as collateral under repurchase agreement transactions. Additionally, procedures have been established by the Fund to monitor, on a daily basis, the market value of each repurchase agreement's collateral to ensure that the value of the collateral at least equals the repurchase price to be paid under the repurchase agreement.
The Fund will only enter into repurchase agreements with banks and other recognized financial institutions, such as broker/dealers, which are deemed by the Fund's adviser to be creditworthy pursuant to the guidelines and/or standards reviewed or established by the Trustees. Risks may arise from the potential inability of counterparties to honor the terms of the repurchase agreement. The Fund, along with other affiliated investment companies, may utilize a joint trading account for the purpose of entering into one or more repurchase agreements.
Investment Income, Gains and Losses, Expenses and Distributions
Interest income and expenses are accrued daily. Dividend income and distributions to shareholders are recorded on the ex-dividend date. Non-cash dividends included in dividend income, if any, are recorded at fair value. Investment income, realized and unrealized gains and losses, and certain fund-level expenses are allocated to each class based on relative average daily net assets, except that each class bears certain expenses unique to that class such as distribution and shareholder services fees. Dividends are declared separately for each class. No class has preferential dividend rights; differences in per share dividend rates are generally due to differences in separate class expenses.
Premium and Discount Amortization
All premiums and discounts on fixed-income securities are amortized/accreted.
Federal Taxes
It is the Fund's policy to comply with the Subchapter M provision of the Internal Revenue Code (the "Code") and to distribute to shareholders each year substantially all of its income. Accordingly, no provision for federal income tax is necessary.
Withholding taxes, and where appropriate, deferred withholding taxes, on foreign interest, dividends and capital gains have been provided for in accordance with the applicable country's tax rules and rates.
Foreign Currency Translation
The accounting records of the Fund are maintained in U.S. dollars. All assets and liabilities denominated in foreign currencies (FCs) are translated into U.S. dollars based on the rates of exchange of such currencies against U.S. dollars on the date of valuation. Purchases and sales of securities, income and expenses are translated at the rate of exchange quoted on the respective date that such transactions are recorded. The Fund does not isolate that portion of the results of operations resulting from changes in foreign exchange rates on investments from the fluctuations arising from changes in market prices of securities held. Such fluctuations are included with the net realized and unrealized gain or loss from investments.
Reported net realized foreign exchange gains or losses arise from sales of portfolio securities, sales and maturities of short-term securities, sales of FCs, currency gains or losses realized between the trade and settlement dates on securities transactions, the difference between the amounts of dividends, interest and foreign withholding taxes recorded on the Fund's books, and the U.S. dollar equivalent of the amounts actually received or paid. Net unrealized foreign exchange gains and losses arise from changes in the value of assets and liabilities other than investments in securities at fiscal year end, resulting from changes in the exchange rate.
Securities Lending
The Fund participates in a securities lending program providing for the lending of corporate bonds, equity and government securities to qualified brokers. The Fund normally receives cash collateral for securities loaned that is invested in an affiliated money market fund. Collateral is maintained at a minimum level of 102% of the market value of investments loaned, plus interest, if applicable. Earnings on collateral are allocated between the securities lending agent, as a fee for its services under the program, and the Fund, according to agreed-upon rates.
As of October 31, 2005, securities subject to this type of arrangement and related collateral were as follows:
Market Value of
Securities Loaned
|
| Market Value
of Collateral
|
$118,525,846
|
| $120,006,000
|
When-Issued and Delayed Delivery Transactions
The Fund may engage in when-issued or delayed delivery transactions. The Fund records when-issued securities on the trade date and maintains security positions such that sufficient liquid assets will be available to make payment for the securities purchased. Securities purchased on a when-issued or delayed delivery basis are marked to market daily and begin earning interest on the settlement date. Losses may occur on these transactions due to changes in market conditions or the failure of counterparties to perform under the contract.
Use of Estimates
The preparation of financial statements in conformity with GAAP requires management to make estimates and assumptions that affect the amounts of assets, liabilities, expenses and revenues reported in the financial statements. Actual results could differ from those estimated.
Other
Investment transactions are accounted for on a trade date basis. Realized gains and losses from investment transactions are recorded on an identified cost basis.
3. SHARES OF BENEFICIAL INTEREST
The following tables summarize share activity:
Year Ended October 31
|
| 2005
|
| 2004
|
Class A Shares:
|
| Shares
|
|
|
| Amount
|
|
| Shares
|
|
|
| Amount
|
|
Shares sold
| | 3,777,043 | | | $ | 116,540,873 | | | 3,507,607 | | | $ | 93,515,722 | |
Shares redeemed
|
| (4,638,951
| )
|
|
| (142,588,513
| )
|
| (5,858,385
| )
|
|
| (155,762,609
| )
|
NET CHANGE RESULTING FROM CLASS A SHARE TRANSACTIONS
|
| (861,908
| )
|
|
$
| (26,047,640
| )
|
| (2,350,778
| )
|
|
$
|
(62,246,887
| )
|
| | | | | | | | | | | | | | |
Year Ended October 31
|
| 2005
|
| 2004
|
Class B Shares:
|
| Shares
|
|
|
| Amount
|
|
| Shares
|
|
|
| Amount
|
|
Shares sold
| | 272,622 | | | $ | 7,630,944 | | | 275,781 | | | $ | 6,816,893 | |
Shares redeemed
|
| (1,561,164
| )
|
|
| (43,884,569
| )
|
| (1,492,060
| )
|
|
| (36,656,605
| )
|
NET CHANGE RESULTING FROM CLASS B SHARE TRANSACTIONS
|
| (1,288,542
| )
|
|
$
| (36,253,625
| )
|
| (1,216,279
| )
|
|
$
| (29,839,712
| )
|
| | | | | | | | | | | | | | |
Year Ended October 31
|
| 2005
|
| 2004
|
Class C Shares:
|
| Shares
|
|
|
| Amount
|
|
| Shares
|
|
|
| Amount
|
|
Shares sold
| | 155,935 | | | $ | 4,391,859 | | | 246,102 | | | $ | 6,117,341 | |
Shares redeemed
|
| (397,187
| )
|
|
| (11,242,537
| )
|
| (457,975
| )
|
|
| (11,428,310
| )
|
NET CHANGE RESULTING FROM CLASS C SHARE TRANSACTIONS
|
| (241,252
| )
|
|
$
| (6,850,678
| )
|
| (211,873
| )
|
|
$
| (5,310,969
| )
|
NET CHANGE RESULTING FROM SHARE TRANSACTIONS
|
| (2,391,702
| )
|
|
$
| (69,151,943
| )
|
| (3,778,930
| )
|
|
$
| (97,397,568
| )
|
4. FEDERAL TAX INFORMATION
The timing and character of income and capital gain distributions are determined in accordance with income tax regulations, which may differ from GAAP. These differences are due in part to differing treatments for foreign currency and net operating loss.
For the year ended October 31, 2005, permanent differences identified and reclassified among the components of net assets were as follows:
Increase (Decrease)
|
Paid-In Capital
|
| Undistributed
Net Investment
Income (Loss)
|
| Accumulated
Net Realized
Gains (Losses)
|
$(3,667,978)
|
| $3,668,492
|
| $(514)
|
Net investment income (loss), net realized gains (losses), and net assets were not affected by this reclassification.
As of October 31, 2005, the components of distributable earnings on a tax basis were as follows:
Net unrealized appreciation
|
| $
| 100,544,394
|
|
Capital loss carryforward
|
| $
| (150,429,868
| )
|
The difference between book-basis and tax-basis net unrealized appreciation/depreciation is attributable in part to differing treatments for the deferral of losses on wash sales.
At October 31, 2005, the cost of investments for federal tax purposes was $715,952,215. The net unrealized appreciation of investments for federal tax purposes was $100,544,394. This consists of net unrealized appreciation from investments for those securities having an excess of value over cost of $115,713,582 and net unrealized depreciation from investments for those securities having an excess of cost over value of $15,169,188.
At October 31, 2005, the Fund had a capital loss carryforward of $(150,429,868) which will reduce the Fund's taxable income arising from future net realized gains on investments, if any, to the extent permitted by the Code and thus will reduce the amount of distributions to shareholders which would otherwise be necessary to relieve the Fund of any liability for federal tax. Pursuant to the Code, such capital loss carryforward will expire in 2010.
As a result of a tax-free transfer of assets from Riggs Large Cap Growth Fund, certain capital loss carryforwards listed above may be limited.
5. INVESTMENT ADVISER FEE AND OTHER TRANSACTIONS WITH AFFILIATES
Investment Adviser Fee
Federated Equity Management Company of Pennsylvania, the Fund's investment adviser (the "Adviser"), receives for its services an annual investment adviser fee equal to 0.75% of the Fund's average daily net assets. The Adviser may voluntarily choose to waive any portion of its fee. The Adviser can modify or terminate this voluntary waiver at any time at its sole discretion.
Pursuant to a settlement with the New York Attorney General, the Adviser has agreed to waive management fees in compliance with an Assurance of Discontinuance dated November 17, 2005. The net management fee will be reduced to 0.4975% effective January 1, 2006 and may not be increased until after December 31, 2010.
Pursuant to an Exemptive Order issued by the Securities and Exchange Commission, the Fund may invest in Prime Value Obligations Fund which is managed by the Adviser or an affiliate of the Adviser. The Adviser has agreed to reimburse the Fund for certain investment adviser fees as a result of these transactions. Income distributions earned from investments in this fund are recorded as income in the accompanying financial statements and totaled $8,213 for the period.
Administrative Fee
Federated Administrative Services (FAS), under the Administrative Services Agreement, provides the Fund with administrative personnel and services. The fee paid to FAS is based on the average aggregate daily net assets of all Federated funds as specified below:
Maximum
Administrative Fee
|
| Average Aggregate Daily Net Assets
of the Federated Funds
|
0.150%
|
| on the first $5 billion
|
0.125%
|
| on the next $5 billion
|
0.100%
|
| on the next $10 billion
|
0.075%
|
| on assets in excess of $20 billion
|
The administrative fee received during any fiscal year shall be at least $150,000 per portfolio and $40,000 per each additional class of Shares. FAS may voluntarily choose to waive any portion of its fee. FAS can modify or terminate this voluntary waiver at any time at its sole discretion. For the year ended October 31, 2005, the net fee paid to FAS was 0.076% of average aggregate daily net assets of the Fund.
Distribution Services Fee
The Fund has adopted a Distribution Plan (the "Plan") pursuant to Rule 12b-1 under the Act. Under the terms of the Plan, the Fund will compensate Federated Securities Corp. (FSC), the principal distributor, from the daily net assets of the Fund's Class B Shares and Class C Shares to finance activities intended to result in the sale of these shares. The Plan provides that the Fund may incur distribution expenses according to the following schedule annually, to compensate FSC:
Share Class Name
|
| Percentage of Average Daily
Net Assets of Class
|
Class B Shares
|
| 0.75%
|
Class C Shares
|
| 0.75%
|
FSC may voluntarily choose to waive any portion of its fee. FSC can modify or terminate this voluntary waiver at any time at its sole discretion. Rather than paying financial intermediaries directly, the Fund may pay fees to FSC and FSC will use the fees to compensate financial intermediaries. For the year ended October 31, 2005, FSC retained $26,496 of fees paid by the Fund.
Sales Charges
For the year ended October 31, 2005, FSC, the principal distributor, retained $21,539 in sales charges from the sale of Class A Shares. FSC also retained $90 of contingent deferred sales charges relating to redemptions of Class C Shares. See "What Do Shares Cost?" in the Prospectus.
Shareholder Services Fee
The Fund may pay fees (Services Fees) up to 0.25% of the average daily net assets of the Fund's Class A Shares, Class B Shares and Class C Shares to financial intermediaries or to Federated Shareholder Services Company (FSSC), a subsidiary of Federated Investors, Inc., for providing services to shareholders and maintaining shareholder accounts. Under certain agreements, rather than paying financial intermediaries directly, the Fund may pay Service Fees to FSSC and FSSC will use the fees to compensate financial intermediaries. FSSC or these financial intermediaries may voluntarily choose to waive any portion of their fee. This voluntary waiver can be modified or terminated at any time. For the year ended October 31, 2005, FSSC voluntarily waived $15,509 of its fee. For the year ended October 31, 2005, FSSC retained $71,340 of fees paid by the Fund.
Commencing on August 1, 2005, and continuing through November 29, 2005, FSSC is reimbursing daily a portion of the shareholder services fee. This reimbursement resulted from an administrative delay in the implementation of contractual terms of the shareholder service fee agreement. This reimbursement amounted to $287,224 for the year ended October 31, 2005.
Other
Federated retained an outside law firm to perform an internal review of past mutual fund trading practices and report to a special investigative committee of Federated's Board. In conjunction with this review, the Independent Trustees of the Fund retained a financial expert to assess the impact of these trading practices. In accordance with the findings of the financial expert, the Fund's Adviser contributed $240,315 to the Fund during fiscal year 2004, which relates to a contribution to Paid-in-Capital for detrimental impact to the Fund that may have resulted from orders incorrectly accepted by Federated employees after the Funds' closing time.
The Fund's Adviser also voluntarily contributed $263,030 to the Fund during fiscal year 2004, for losses on investments inadvertently sold by the Fund.
Expense Reduction
The Fund directs portfolio trades to a broker that in turn pays a portion of the Fund's operating expenses. For the year ended October 31, 2005, the Fund's expenses were reduced by $126,959 under these arrangements.
General
Certain of the Officers and Directors of the Fund are Officers and Directors or Trustees of the above companies.
6. INVESTMENT TRANSACTIONS
Purchases and sales of investments, excluding long-term U.S. government securities and short-term obligations (and in-kind contributions), for the year ended October 31, 2005, were as follows:
Purchases
|
| $
| 954,955,899
|
Sales
|
| $
| 1,041,450,384
|
7. LEGAL PROCEEDINGS
Beginning in October 2003, Federated Investors, Inc. and various subsidiaries thereof (including the advisers and distributor for various investment companies, collectively, "Federated"), along with various investment companies sponsored by Federated ("Funds") were named as defendants in several class action lawsuits now pending in the United States District Court for the District of Maryland. The lawsuits were purportedly filed on behalf of people who purchased, owned and/or redeemed shares of Federated-sponsored mutual funds during specified periods beginning November 1, 1998. The suits are generally similar in alleging that Federated engaged in illegal and improper trading practices including market timing and late trading in concert with certain institutional traders, which allegedly caused financial injury to the mutual fund shareholders. These lawsuits began to be filed shortly after Federated's first public announcement that it had received requests for information on shareholder trading activities in the Funds from the Securities and Exchange Commission ("SEC"), the Office of the New York State Attorney General ("NYAG"), and other authorities. In that regard, on November 28, 2005, Federated announced that it had reached final settlements with the SEC and the NYAG with respect to those matters. As Federated previously reported in 2004, it has already paid approximately $8.0 million to certain funds as determined by an independent consultant. As part of these settlements, Federated agreed to pay for the benefit of fund shareholders additional disgorgement and a civil money penalty in the aggregate amount of an additional $72 million. Federated and various Funds have also been named as defendants in several additional lawsuits, the majority of which are now pending in the United States District Court for the Western District of Pennsylvania, alleging, among other things, excessive advisory and rule 12b-1 fees. The Board of the Funds has retained the law firm of Dickstein Shapiro Morin & Oshinsky LLP to represent the Funds in these lawsuits. Federated and the Funds, and their respective counsel, are reviewing the allegations and will respond appropriately. Additional lawsuits based upon similar allegations may be filed in the future. The potential impact of these lawsuits, all of which seek unquantified damages, attorneys' fees and expenses, and future potential similar suits is uncertain. Although we do not believe that these lawsuits will have a material adverse effect on the Funds, there can be no assurance that these suits, the ongoing adverse publicity and/or other developments resulting from the regulatory investigations will not result in increased Fund redemptions, reduced sales of Fund shares, or other adverse consequences for the Funds.
Report of Independent Registered Public Accounting Firm
TO THE BOARD OF TRUSTEES OF FEDERATED EQUITY FUNDS AND THE SHAREHOLDERS OF FEDERATED MID CAP GROWTH STRATEGIES FUND:
We have audited the accompanying statement of assets and liabilities, including the portfolio of investments, of Federated Mid Cap Growth Strategies Fund (the "Fund"), a portfolio of Federated Equity Funds, as of October 31, 2005, and the related statement of operations for the year then ended, the statements of changes in net assets for each of the two years in the period then ended, and the financial highlights for each of the five years in the period then ended. These financial statements and financial highlights are the responsibility of the Fund's management. Our responsibility is to express an opinion on these financial statements and financial highlights based on our audits.
We conducted our audits in accordance with the standards of the Public Company Accounting Oversight Board (United States). Those standards require that we plan and perform the audit to obtain reasonable assurance about whether the financial statements and financial highlights are free of material misstatement. The Fund is not required to have, nor were we engaged to perform, an audit of its internal control over financial reporting. Our audits included consideration of internal control over financial reporting as a basis for designing audit procedures that are appropriate in the circumstances, but not for the purpose of expressing an opinion on the effectiveness of the Fund's internal control over financial reporting. Accordingly, we express no such opinion. An audit also includes examining, on a test basis, evidence supporting the amounts and disclosures in the financial statements, assessing the accounting principles used and significant estimates made by management, as well as evaluating the overall financial statement presentation. Our procedures included confirmation of securities owned as of October 31, 2005, by correspondence with the custodian and brokers; where replies were not received from brokers, we performed other auditing procedures. We believe that our audits provide a reasonable basis for our opinion.
In our opinion, such financial statements and financial highlights present fairly, in all material respects, the financial position of the Fund as of October 31, 2005, the results of its operations for the year then ended, the changes in its net assets, and its financial highlights for the respective stated periods, in conformity with accounting principles generally accepted in the United States of America.
Deloitte & Touche LLP
Boston, Massachusetts
December 20, 2005
Board of Trustees and Trust Officers
The Board is responsible for managing the Trust's business affairs and for exercising all the Trust's powers except those reserved for the shareholders. The following tables give information about each Board member and the senior officers of the Fund. Where required, the tables separately list Board members who are "interested persons" of the Fund (i.e., "Interested" Board members) and those who are not (i.e., "Independent" Board members). Unless otherwise noted, the address of each person listed is Federated Investors Tower, 1001 Liberty Avenue, Pittsburgh, PA. As of December 31, 2004, the Trust comprised eight portfolios, and the Federated Fund Complex consisted of 44 investment companies (comprising 133 portfolios). Unless otherwise noted, each Officer is elected annually. Unless otherwise noted, each Board member oversees all portfolios in the Federated Fund Complex and serves for an indefinite term. The Fund's Statement of Additional Information includes additional information about Trust Trustees and is available, without charge and upon request, by calling 1-800-341-7400.
INTERESTED TRUSTEES BACKGROUND
|
|
|
Name
Birth Date
Address
Positions Held with Trust
Date Service Began
|
| Principal Occupation(s) for Past Five Years,
Other Directorships Held and Previous Position(s)
|
John F. Donahue*
Birth Date: July 28, 1924
CHAIRMAN AND TRUSTEE
Began serving: April 1984 | | Principal Occupations : Chairman and Director or Trustee of the Federated Fund Complex; Chairman and Director, Federated Investors, Inc.
Previous Positions : Trustee, Federated Investment Management Company and Chairman and Director, Federated Investment Counseling. |
|
|
|
J. Christopher Donahue*
Birth Date: April 11, 1949
PRESIDENT AND TRUSTEE
Began serving: January 2000 | | Principal Occupations : Principal Executive Officer and President of the Federated Fund Complex; Director or Trustee of some of the Funds in the Federated Fund Complex; President, Chief Executive Officer and Director, Federated Investors, Inc.; Chairman and Trustee, Federated Investment Management Company; Trustee, Federated Investment Counseling; Chairman and Director, Federated Global Investment Management Corp.; Chairman, Passport Research, Ltd.; Trustee, Federated Shareholder Services Company; Director, Federated Services Company.
Previous Positions : President, Federated Investment Counseling; President and Chief Executive Officer, Federated Investment Management Company, Federated Global Investment Management Corp. and Passport Research, Ltd. |
|
|
|
|
|
|
Name
Birth Date
Address
Positions Held with Trust
Date Service Began
|
| Principal Occupation(s) for Past Five Years,
Other Directorships Held and Previous Position(s)
|
Lawrence D. Ellis, M.D.*
Birth Date: October 11, 1932
3471 Fifth Avenue
Suite 1111
Pittsburgh, PA
TRUSTEE
Began serving: August 1987 | | Principal Occupations : Director or Trustee of the Federated Fund Complex; Professor of Medicine, University of Pittsburgh; Medical Director, University of Pittsburgh Medical Center Downtown; Hematologist, Oncologist and Internist, University of Pittsburgh Medical Center.
Other Directorships Held : Member, National Board of Trustees, Leukemia Society of America.
Previous Positions : Trustee, University of Pittsburgh; Director, University of Pittsburgh Medical Center. |
|
|
|
* Family relationships and reasons for "interested" status: John F. Donahue is the father of J. Christopher Donahue; both are "interested" due to the positions they hold with Federated Investors, Inc. and its subsidiaries. Lawrence D. Ellis, M.D. is "interested" because his son-in-law is employed by the Fund's principal underwriter, Federated Securities Corp.
INDEPENDENT TRUSTEES BACKGROUND
|
|
|
Name
Birth Date
Address
Positions Held with Trust
Date Service Began
|
| Principal Occupation(s) for Past Five Years,
Other Directorships Held and Previous Position(s)
|
Thomas G. Bigley
Birth Date: February 3, 1934
15 Old Timber Trail
Pittsburgh, PA
TRUSTEE
Began serving: October 1995 | | Principal Occupation : Director or Trustee of the Federated Fund Complex.
Other Directorships Held : Director, Member of Executive Committee, Children's Hospital of Pittsburgh; Director, University of Pittsburgh.
Previous Position : Senior Partner, Ernst & Young LLP. |
|
|
|
John T. Conroy, Jr.
Birth Date: June 23, 1937
Investment Properties Corporation
3838 North Tamiami Trail
Suite 402
Naples, FL
TRUSTEE
Began serving: November 1991 | | Principal Occupations : Director or Trustee of the Federated Fund Complex; Chairman of the Board, Investment Properties Corporation; Partner or Trustee in private real estate ventures in Southwest Florida.
Previous Positions : President, Investment Properties Corporation; Senior Vice President, John R. Wood and Associates, Inc., Realtors; President, Naples Property Management, Inc. and Northgate Village Development Corporation. |
|
|
|
|
|
|
Name
Birth Date
Address
Positions Held with Trust
Date Service Began
|
| Principal Occupation(s) for Past Five Years,
Other Directorships Held and Previous Position(s)
|
Nicholas P. Constantakis
Birth Date: September 3, 1939
175 Woodshire Drive
Pittsburgh, PA
TRUSTEE
Began serving: February 1998 | | Principal Occupations : Director or Trustee of the Federated Fund Complex.
Other Directorships Held : Director and Member of the Audit Committee, Michael Baker Corporation (engineering and energy services worldwide).
Previous Position : Partner, Andersen Worldwide SC. |
|
|
|
John F. Cunningham
Birth Date: March 5, 1943
353 El Brillo Way
Palm Beach, FL
TRUSTEE
Began serving: January 1999 | | Principal Occupation : Director or Trustee of the Federated Fund Complex.
Other Directorships Held : Chairman, President and Chief Executive Officer, Cunningham & Co., Inc. (strategic business consulting); Trustee Associate, Boston College.
Previous Positions : Director, Redgate Communications and EMC Corporation (computer storage systems); Chairman of the Board and Chief Executive Officer, Computer Consoles, Inc.; President and Chief Operating Officer, Wang Laboratories; Director, First National Bank of Boston; Director, Apollo Computer, Inc. |
|
|
|
Peter E. Madden
Birth Date: March 16, 1942
One Royal Palm Way
100 Royal Palm Way
Palm Beach, FL
TRUSTEE
Began serving: November 1991 | | Principal Occupation : Director or Trustee of the Federated Fund Complex.
Other Directorships Held : Board of Overseers, Babson College.
Previous Positions : Representative, Commonwealth of Massachusetts General Court; President, State Street Bank and Trust Company and State Street Corporation (retired); Director, VISA USA and VISA International; Chairman and Director, Massachusetts Bankers Association; Director, Depository Trust Corporation; Director, The Boston Stock Exchange. |
|
|
|
Charles F. Mansfield, Jr.
Birth Date: April 10, 1945
80 South Road
Westhampton Beach, NY
TRUSTEE
Began serving: January 1999 | | Principal Occupations : Director or Trustee of the Federated Fund Complex; Management Consultant; Executive Vice President, DVC Group, Inc. (marketing communications and technology) (prior to 9/1/00).
Previous Positions : Chief Executive Officer, PBTC International Bank; Partner, Arthur Young & Company (now Ernst & Young LLP); Chief Financial Officer of Retail Banking Sector, Chase Manhattan Bank; Senior Vice President, HSBC Bank USA (formerly, Marine Midland Bank); Vice President, Citibank; Assistant Professor of Banking and Finance, Frank G. Zarb School of Business, Hofstra University. |
|
|
|
|
|
|
Name
Birth Date
Address
Positions Held with Trust
Date Service Began
|
| Principal Occupation(s) for Past Five Years,
Other Directorships Held and Previous Position(s)
|
John E. Murray, Jr., J.D., S.J.D.
Birth Date: December 20, 1932
Chancellor, Duquesne University
Pittsburgh, PA
TRUSTEE
Began serving: February 1995 | | Principal Occupations : Director or Trustee of the Federated Fund Complex; Chancellor and Law Professor, Duquesne University; Partner, Murray, Hogue and Lannis.
Other Directorships Held : Director, Michael Baker Corp. (engineering, construction, operations and technical services).
Previous Positions : President, Duquesne University; Dean and Professor of Law, University of Pittsburgh School of Law; Dean and Professor of Law, Villanova University School of Law. |
|
|
|
Marjorie P. Smuts
Birth Date: June 21, 1935
4905 Bayard Street
Pittsburgh, PA
TRUSTEE
Began serving: April 1984 | | Principal Occupations : Director or Trustee of the Federated Fund Complex; Public Relations/Marketing Consultant/Conference Coordinator.
Previous Positions : National Spokesperson, Aluminum Company of America; television producer; President, Marj Palmer Assoc.; Owner, Scandia Bord. |
|
|
|
John S. Walsh
Birth Date: November 28, 1957
2604 William Drive
Valparaiso, IN
TRUSTEE
Began serving: January 1999 | | Principal Occupations : Director or Trustee of the Federated Fund Complex; President and Director, Heat Wagon, Inc. (manufacturer of construction temporary heaters); President and Director, Manufacturers Products, Inc. (distributor of portable construction heaters); President, Portable Heater Parts, a division of Manufacturers Products, Inc.
Previous Position : Vice President, Walsh & Kelly, Inc. |
|
|
|
OFFICERS
|
|
|
Name
Birth Date
Positions Held with Trust
Date Service Began
|
| Principal Occupation(s) for Past Five Years and Previous Position(s)
|
John W. McGonigle
Birth Date: October 26, 1938
EXECUTIVE VICE PRESIDENT
AND SECRETARY
Began serving: April 1984 | | Principal Occupations : Executive Vice President and Secretary of the Federated Fund Complex; Vice Chairman, Executive Vice President, Secretary and Director, Federated Investors, Inc.
Previous Positions : Trustee, Federated Investment Management Company and Federated Investment Counseling; Director, Federated Global Investment Management Corp., Federated Services Company and Federated Securities Corp. |
|
|
|
|
|
|
Name
Birth Date
Positions Held with Trust
Date Service Began
|
| Principal Occupation(s) for Past Five Years and Previous Position(s)
|
Richard J. Thomas
Birth Date: June 17, 1954
TREASURER
Began serving: November 1998 | | Principal Occupations : Principal Financial Officer and Treasurer of the Federated Fund Complex; Senior Vice President, Federated Administrative Services.
Previous Positions : Vice President, Federated Administrative Services; held various management positions within Funds Financial Services Division of Federated Investors, Inc. |
|
|
|
Richard B. Fisher
Birth Date: May 17, 1923
VICE PRESIDENT
Began serving: April 1984 | | Principal Occupations : Vice Chairman or Vice President of some of the Funds in the Federated Fund Complex; Vice Chairman, Federated Investors, Inc.; Chairman, Federated Securities Corp.
Previous Positions : President and Director or Trustee of some of the Funds in the Federated Fund Complex; Executive Vice President, Federated Investors, Inc. and Director and Chief Executive Officer, Federated Securities Corp. |
|
|
|
Stephen F. Auth
Birth Date: September 3, 1956
CHIEF INVESTMENT OFFICER
Began serving: November 2002 | | Principal Occupations : Chief Investment Officer of this Fund and various other Funds in the Federated Fund Complex; Executive Vice President, Federated Investment Counseling, Federated Global Investment Management Corp., Federated Equity Management Company of Pennsylvania and Passport Research II, Ltd.
Previous Positions : Executive Vice President, Federated Investment Management Company, and Passport Research, Ltd.; Senior Vice President, Global Portfolio Management Services Division; Senior Vice President, Federated Investment Management Company and Passport Research, Ltd.; Senior Managing Director and Portfolio Manager, Prudential Investments. |
|
|
|
Lawrence Auriana
Birth Date: January 8, 1944
VICE PRESIDENT
Began serving: November 2001 | | Lawrence Auriana is Vice President of the Trust. Mr. Auriana joined Federated in April 2001 as Co-Head of Investments/Federated Kaufmann. From August 1984 to April 2001, Mr. Auriana was President and Treasurer of Edgemont Asset Management Corp., and Chairman of the Board and Portfolio Manager to The Kaufmann Fund, Inc. (predecessor to the Federated Kaufmann Fund). Mr. Auriana earned a B.S. in economics from Fordham University and has been engaged in the securities business since 1965. |
|
|
|
|
|
|
Name
Birth Date
Positions Held with Trust
Date Service Began
|
| Principal Occupation(s) for Past Five Years and Previous Position(s)
|
James E. Grefenstette
Birth Date: November 7, 1962
VICE PRESIDENT
Began serving: November 1998 | | James E. Grefenstette has been the Fund's Portfolio Manager since 1994. He is Vice President of the Trust. Mr. Grefenstette joined Federated in 1992 and has been a Portfolio Manager since 1994. Mr. Grefenstette became a Senior Vice President of the Fund's Adviser in January 2000. He served as a Vice President of the Fund's Adviser from 1996 through 1999 and was an Assistant Vice President of the Fund's Adviser from 1994 until 1996. Mr. Grefenstette is a Chartered Financial Analyst; he received his M.S. in Industrial Administration from Carnegie Mellon University. |
|
|
|
Hans P. Utsch
Birth Date: July 3, 1936
VICE PRESIDENT
Began serving: November 2001 | | Hans P. Utsch is Vice President of the Trust. Mr. Utsch joined Federated in April 2001 as Co-Head of Investments/Federated Kaufmann. From August 1984 to April 2001, Mr. Utsch was Chairman of the Board and Secretary of Edgemont Asset Management Corp., and President and Portfolio Manager to The Kaufmann Fund, Inc. (predecessor to the Federated Kaufmann Fund). Mr. Utsch graduated from Amherst College and holds an M.B.A. from Columbia University. He has been engaged in the securities business since 1962. |
|
|
|
Board Review of Advisory Contract
As required by the Act, the Fund's Board has reviewed the Fund's investment advisory contract. The Board's decision to approve the contract reflects the exercise of its business judgment on whether to continue the existing arrangements. During its review of the contract, the Board considers many factors, among the most material of which are: the Fund's investment objectives; the Adviser's management philosophy, personnel, processes, and investment and operating strategies; long term performance; the preferences and expectations of Fund shareholders and their relative sophistication; the continuing state of competition in the mutual fund industry; the range of comparable fees for similar funds in the mutual fund industry; the range and quality of services provided to the Fund and its shareholders by the Federated organization in addition to investment advisory services; and the Fund's relationship to the Federated family of funds which include a comprehensive array of funds with different investment objectives, policies and strategies which are available for exchange without the incurrence of additional sales charge.
In its decision to appoint or renew the Adviser, the Board is mindful of the potential disruptions of the Fund's operations and various risks, uncertainties and other effects that could occur as a result of a decision to terminate or not renew an advisory contract. In particular, the Board recognizes that most shareholders have invested in the Fund on the strength of the Adviser's industry standing and reputation and in the expectation that the Adviser will have a continuing role in providing advisory services to the Fund. Thus, the Board's "selection" or approval of the Adviser must reflect the fact that it is the shareholders who have effectively selected the Adviser by virtue of having invested in the Fund. The Board also considers the compensation and benefits received by the Adviser. This includes fees received for services provided to the Fund by other entities in the Federated organization and research services received by the Adviser from brokers that execute fund trades, as well as advisory fees. In this regard, the Board is aware that various courts have interpreted provisions of the Act and have indicated in their decisions that the following factors may be relevant to an Adviser's fiduciary duty with respect to its receipt of compensation from a fund: the nature and quality of the services provided by the Adviser, including the performance of the Fund; the Adviser's cost of providing the services; the extent to which the Adviser may realize "economies of scale" as the Fund grows larger; any indirect benefits that may accrue to the Adviser and its affiliates as a result of the Adviser's relationship with the Fund; performance and expenses of comparable funds; and the extent to which the independent Board members are fully informed about all facts bearing on the Adviser's service and fee. The Fund's Board is aware of these factors and is guided by them in its review of the Fund's advisory contract to the extent they are appropriate and relevant, as discussed further below.
The Board considers and weighs these circumstances in light of its substantial accumulated experience in governing the Fund and working with Federated on matters relating to the Federated funds, and is assisted in its deliberations by the advice of independent legal counsel. In this regard, the Board requests and receives substantial and detailed information about the Fund and the Federated organization. Federated provides much of this information at each regular meeting of the Board, and furnishes additional reports in connection with the particular meeting at which the Board's formal review of the advisory contract occurs. In between regularly scheduled meetings, the Board may receive information on particular matters as the need arises. Thus, the Board's evaluation of an advisory contract is informed by reports covering such matters as: the Adviser's investment philosophy, personnel, and processes; operating strategies; the Fund's short- and long-term performance (in absolute terms, both on a gross basis and net of expenses, as well as in relationship to its particular investment program and certain competitor or "peer group" funds and/or other benchmarks, as appropriate), and comments on the reasons for performance; the Fund's expenses (including the advisory fee itself and the overall expense structure of the Fund, both in absolute terms and relative to similar and/or competing funds, with due regard for contractual or voluntary expense limitations); the use and allocation of brokerage commissions derived from trading the Fund's portfolio securities (if any); the nature and extent of the advisory and other services provided to the Fund by the Adviser and its affiliates; compliance and audit reports concerning the Federated funds and the Federated companies that service them (including communications from regulatory agencies), as well as Federated's responses to any issues raised therein; and relevant developments in the mutual fund industry and how the Federated funds and/or Federated are responding to them. The evaluation process is evolutionary, reflecting continually developing considerations. The criteria considered and the emphasis placed on relevant criteria change in recognition of changing circumstances in the mutual fund marketplace. For the past year, the Board concluded that the nature, quality and scope of services provided the fund by the Adviser and its affiliates was satisfactory.
With respect to the Fund's performance and expenses in particular, the Board has found the use of comparisons to other mutual funds with comparable investment programs to be particularly useful, given the high degree of competition in the mutual fund business. The Board focuses on comparisons with other similar mutual funds (rather than non-mutual fund products or services) because, simply put, they are more relevant. For example, other mutual funds are the products most like the Fund, they are readily available to Fund shareholders as alternative investment vehicles, and they are the type of investment vehicle in fact chosen and maintained by the Fund's investors. The range of their fees and expenses therefore appears to be a generally reliable indication of what consumers have found to be reasonable in the precise marketplace in which the Fund competes. The Fund's ability to deliver competitive performance when compared to its peer group may be a useful indicator of how the Adviser is executing on the Fund's investment program, which would in turn assist the Board in reaching a conclusion that the nature, extent, and quality of the Adviser's investment management services are such as to warrant continuation of the advisory contract.
During the year ending December 31, 2004, the Fund's performance for both the one and three year periods were above the median of the relevant peer group. During the year ending December 31, 2004, the Fund's investment advisory fee after waivers and expense reimbursements, if any, was above the median of the relevant peer group. The Board reviewed the fees and other expenses of the Fund with the Adviser and was satisfied that the overall expense structure of the Fund nevertheless remained competitive. The Board will continue to monitor advisory fees and other expenses borne by the Fund.
The Board also receives financial information about Federated, including reports on the compensation and benefits Federated derives from its relationships with the Federated funds. These reports cover not only the fees under the advisory contracts, but also fees received by Federated's subsidiaries for providing other services to the Federated funds under separate contracts (e.g., for serving as the Federated funds' administrator). The reports also discuss any indirect benefit Federated may derive from its receipt of research services from brokers who execute Federated fund trades as well as waivers of fees and/or reimbursements of expenses. In order for a fund to be competitive in the marketplace, Federated and its affiliates frequently waive fees and/or reimburse expenses. Although the Board considers the costs incurred and the profitability of the Federated organization as a whole, it does not evaluate, on a fund-by-fund basis, Federated's "profitability" and/or "costs" (which would include an assessment as to whether "economies of scale" would be realized if the fund were to grow to some sufficient size). In the Board's view, the cost of performing advisory services on a fund-specific basis is both difficult to estimate satisfactorily and a relatively minor consideration in its overall evaluation. Analyzing isolated funds would require constructed allocations of the costs of shared resources and operations based on artificial assumptions that are inconsistent with the existing relationships within a large and diversified family of funds that receive advisory and other services from the same organization. In addition, the availability of the exchange privilege among funds in the Federated family makes consideration of the overall cost and profitability of Federated more relevant than that of individual funds. Based upon this review, the Board is satisfied that the costs incurred in, as well as the profitability realized from, managing the Fund and the other Federated Funds are appropriate. Although the Board is always interested in discovering any genuine "economies of scale," its experience has been that such "economies" are likely to arise only when a fund grows dramatically, and becomes and remains very large in size. Even in these instances, purchase and redemption activity, as well as the presence of expense limitations (if any), may offset any perceived economies. As suggested above, the Board considers the information it receives about the Fund's performance and expenses as compared to an appropriate set of similar competing funds to be more relevant.
The Board bases its decision to approve an advisory contract on the totality of the circumstances and relevant factors and with a view to past and future long-term considerations. Not all of the factors and considerations identified above are relevant to every Federated fund, nor does the Board consider any one of them to be determinative. With respect to the factors that are relevant, the Board's decision to approve the contract reflects its determination that Federated's performance and actions provide a satisfactory basis to support the decision to continue the existing arrangements.
Voting Proxies on Fund Portfolio Securities
A description of the policies and procedures that the Fund uses to determine how to vote proxies, if any, relating to securities held in the Fund's portfolio is available, without charge and upon request, by calling 1-800-341-7400. A report on "Form N-PX" of how the Fund voted any such proxies during the most recent 12-month period ended June 30 is available through Federated's website. Go to FederatedInvestors.com, select "Products," select the "Prospectuses and Regulatory Reports" link, then select the Fund to access the link to Form N-PX. This information is also available from the EDGAR database on the SEC's website at www.sec.gov.
Quarterly Portfolio Schedule
The Fund files with the SEC a complete schedule of its portfolio holdings, as of the close of the first and third quarters of its fiscal year, on "Form N-Q." These filings are available on the SEC's website at www.sec.gov and may be reviewed and copied at the SEC's Public Reference Room in Washington, DC. (Call 1-800-SEC-0330 for information on the operation of the Public Reference Room.) You may also access this information from the "Products" section of the Federated Investors website at FederatedInvestors.com by clicking on "Portfolio Holdings" and selecting the name of the Fund, or by selecting the name of the Fund and clicking on "Portfolio Holdings." You must register on the website the first time you wish to access this information.
Mutual funds are not bank deposits or obligations, are not guaranteed by any bank, and are not insured or guaranteed by the U.S. government, the Federal Deposit Insurance Corporation, the Federal Reserve Board, or any other government agency. Investment in mutual funds involves investment risk, including the possible loss of principal.
This report is authorized for distribution to prospective investors only when preceded or accompanied by the Fund's prospectus, which contains facts concerning its objective and policies, management fees, expenses, and other information.
Federated
World-Class Investment Manager
Federated Mid Cap Growth Strategies Fund
Federated Investors Funds
5800 Corporate Drive
Pittsburgh, PA 15237-7000
Contact us at FederatedInvestors.com
or call 1-800-341-7400.
Federated Securities Corp., Distributor
Cusip 314172107
Cusip 314172206
Cusip 314172305
G01228-08 (12/05)
Federated is a registered mark of Federated Investors, Inc. 2005 (c)Federated Investors, Inc.
Federated
World-Class Investment Manager
Federated Technology Fund
Established 1999
A Portfolio of Federated Equity Funds
7TH ANNUAL SHAREHOLDER REPORT
October 31, 2005
Class A Shares
Class B Shares
Class C Shares
FINANCIAL HIGHLIGHTS
SHAREHOLDER EXPENSE EXAMPLE
MANAGEMENT'S DISCUSSION OF FUND PERFORMANCE
PORTFOLIO OF INVESTMENTS SUMMARY TABLE
PORTFOLIO OF INVESTMENTS
STATEMENT OF ASSETS AND LIABILITIES
STATEMENT OF OPERATIONS
STATEMENT OF CHANGES IN NET ASSETS
NOTES TO FINANCIAL STATEMENTS
REPORT OF INDEPENDENT REGISTERED PUBLIC ACCOUNTING FIRM
BOARD OF TRUSTEES AND TRUST OFFICERS
BOARD REVIEW OF ADVISORY CONTRACT
VOTING PROXIES ON FUND PORTFOLIO SECURITIES
QUARTERLY PORTFOLIO SCHEDULE
Not FDIC Insured * May Lose Value * No Bank Guarantee
Financial Highlights-Class A Shares
(For a Share Outstanding Throughout Each Period)
Year Ended October 31
|
| 2005
|
|
| 2004
|
|
| 2003
|
|
| 2002
|
|
| 2001
|
|
Net Asset Value, Beginning of Period
| | $5.06 | | | $4.96 | | | $3.33 | | | $4.76 | | | $14.64 | |
Income From Investment Operations:
| | | | | | | | | | | | | | | |
Net investment income (loss)
| | (0.07 | ) | | (0.09 | ) 1 | | (0.06 | ) 1 | | (0.08 | ) 1 | | (0.11 | ) 1 |
Net realized and unrealized gain
(loss) on investments, futures contracts and foreign currency transactions
|
| 0.21
|
|
| 0.19
|
|
| 1.69
|
|
| (1.35
| )
|
| (9.77
| )
|
TOTAL FROM INVESTMENT OPERATIONS
|
| 0.14
|
|
| 0.10
|
|
| 1.63
|
|
| (1.43
| )
|
| (9.88
| )
|
Net Asset Value, End of Period
|
| $5.20
|
|
| $5.06
|
|
| $4.96
|
|
| $3.33
|
|
| $4.76
|
|
Total Return 2
|
| 2.77
| %
|
| 2.02
| % 3
|
| 48.95
| %
|
| (30.04
| )%
|
| (67.49
| )%
|
| | | | | | | | | | | | | | | |
Ratios to Average Net Assets:
|
|
|
|
|
|
|
|
|
|
|
|
|
|
|
|
Net expenses
|
| 2.00
| % 4
|
| 2.01
| % 4
|
| 2.01
| % 4
|
| 2.04
| % 4
|
| 1.67
| %
|
Net investment income (loss)
|
| (1.24
| )%
|
| (1.72
| )%
|
| (1.66
| )%
|
| (1.68
| )%
|
| (1.29
| )%
|
Expense waiver/reimbursement 5
|
| 0.16
| %
|
| 0.19
| %
|
| 0.35
| %
|
| 0.12
| %
|
| 0.02
| %
|
Supplemental Data:
|
|
|
|
|
|
|
|
|
|
|
|
|
|
|
|
Net assets, end of period (000 omitted)
|
| $27,412
|
|
| $33,111
|
|
| $43,274
|
|
| $29,632
|
|
| $58,423
|
|
Portfolio turnover
|
| 71
| %
|
| 78
| %
|
| 96
| %
|
| 174
| %
|
| 224
| %
|
1 Per share numbers have been calculated using the average shares method.
2 Based on net asset value, which does not reflect the sales charge, redemption fee, or contingent deferred sales charge, if applicable. Total returns for periods of less than one year are not annualized.
3 During the period, the Fund was reimbursed by the Adviser, which had an impact of 0.21% on the total return. See Notes to Financial Statements (Note 5).
4 The net expense ratio is calculated without reduction for fees paid indirectly for directed brokerage arrangements. The net expense ratios are 1.99%, 2.00%, 2.01%, and 2.04% after taking into account these expense reductions for the years ended October 31, 2005, 2004, 2003, and 2002, respectively.
5 This expense decrease is reflected in both the net expense and the net investment income (loss) ratios shown above.
See Notes which are an integral part of the Financial Statements
Financial Highlights-Class B Shares
(For a Share Outstanding Throughout Each Period)
Year Ended October 31
|
| 2005
|
|
| 2004
|
|
| 2003
|
|
| 2002
|
|
| 2001
|
|
Net Asset Value, Beginning of Period
| | $4.87 | | | $4.81 | | | $3.25 | | | $4.68 | | | $14.53 | |
Income From Investment Operations:
| | | | | | | | | | | | | | | |
Net investment income (loss)
| | (0.12 | ) | | (0.12 | ) 1 | | (0.09 | ) 1 | | (0.11 | ) 1 | | (0.16 | ) 1 |
Net realized and unrealized gain (loss) on investments, futures contracts and foreign currency transactions
|
| 0.22
|
|
| 0.18
|
|
| 1.65
|
|
| (1.32
| )
|
| (9.69
| )
|
TOTAL FROM INVESTMENT OPERATIONS
|
| 0.10
|
|
| 0.06
|
|
| 1.56
|
|
| (1.43
| )
|
| (9.85
| )
|
Net Asset Value, End of Period
|
| $4.97
|
|
| $4.87
|
|
| $4.81
|
|
| $3.25
|
|
| $4.68
|
|
Total Return 2
|
| 2.05
| %
|
| 1.25
| % 3
|
| 48.00
| %
|
| (30.56
| )%
|
| (67.79
| )%
|
| | | | | | | | | | | | | | | |
Ratios to Average Net Assets:
|
|
|
|
|
|
|
|
|
|
|
|
|
|
|
|
Net expenses
|
| 2.75
| % 4
|
| 2.76
| % 4
|
| 2.76
| % 4
|
| 2.79
| % 4
|
| 2.42
| %
|
Net investment income (loss)
|
| (1.98
| )%
|
| (2.47
| )%
|
| (2.41
| )%
|
| (2.43
| )%
|
| (2.04
| )%
|
Expense waiver/reimbursement 5
|
| 0.16
| %
|
| 0.19
| %
|
| 0.35
| %
|
| 0.12
| %
|
| 0.02
| %
|
Supplemental Data:
|
|
|
|
|
|
|
|
|
|
|
|
|
|
|
|
Net assets, end of period (000 omitted)
|
| $51,836
|
|
| $68,981
|
|
| $84,252
|
|
| $66,179
|
|
| $126,320
|
|
Portfolio turnover
|
| 71
| %
|
| 78
| %
|
| 96
| %
|
| 174
| %
|
| 224
| %
|
1 Per share numbers have been calculated using the average shares method.
2 Based on net asset value, which does not reflect the sales charge, redemption fee, or contingent deferred sales charge, if applicable. Total returns for periods of less than one year are not annualized.
3 During the period, the Fund was reimbursed by the Adviser, which had an impact of 0.21% on the total return. See Notes to Financial Statements (Note 5).
4 The net expense ratio is calculated without reduction for fees paid indirectly for directed brokerage arrangements. The net expense ratios are 2.74%, 2.75%, 2.76%, and 2.79% after taking into account these expense reductions for the years ended October 31, 2005, 2004, 2003 and 2002, respectively.
5 This expense decrease is reflected in both the net expense and the net investment income (loss) ratios shown above.
See Notes which are an integral part of the Financial Statements
Financial Highlights-Class C Shares
(For a Share Outstanding Throughout Each Period)
Year Ended October 31
|
| 2005
|
|
| 2004
|
|
| 2003
|
|
| 2002
|
|
| 2001
|
|
Net Asset Value, Beginning of Period
| | $4.87 | | | $4.81 | | | $3.25 | | | $4.68 | | | $14.52 | |
Income From Investment Operations:
| | | | | | | | | | | | | | | |
Net investment income (loss)
| | (0.12 | ) | | (0.12 | ) 1 | | (0.09 | ) 1 | | (0.11 | ) 1 | | (0.16 | ) 1 |
Net realized and unrealized gain (loss) on investments, futures contracts and foreign currency transactions
|
| 0.22
|
|
| 0.18
|
|
| 1.65
|
|
| (1.32
| )
|
| (9.68
| )
|
TOTAL FROM INVESTMENT OPERATIONS
|
| 0.10
|
|
| 0.06
|
|
| 1.56
|
|
| (1.43
| )
|
| (9.84
| )
|
Net Asset Value, End of Period
|
| $4.97
|
|
| $4.87
|
|
| $4.81
|
|
| $3.25
|
|
| $4.68
|
|
Total Return 2
|
| 2.05
| %
|
| 1.25
| % 3
|
| 48.00
| %
|
| (30.56
| )%
|
| (67.77
| )%
|
| | | | | | | | | | | | | | | |
Ratios to Average Net Assets:
|
|
|
|
|
|
|
|
|
|
|
|
|
|
|
|
Net expenses
|
| 2.75
| % 4
|
| 2.76
| % 4
|
| 2.76
| % 4
|
| 2.79
| % 4
|
| 2.42
| %
|
Net investment income (loss)
|
| (1.97
| )%
|
| (2.47
| )%
|
| (2.41
| )%
|
| (2.43
| )%
|
| (2.04
| )%
|
Expense waiver/reimbursement 5
|
| 0.16
| %
|
| 0.19
| %
|
| 0.35
| %
|
| 0.12
| %
|
| 0.02
| %
|
Supplemental Data:
|
|
|
|
|
|
|
|
|
|
|
|
|
|
|
|
Net assets, end of period (000 omitted)
|
| $9,265
|
|
| $12,551
|
|
| $16,096
|
|
| $13,055
|
|
| $25,186
|
|
Portfolio turnover
|
| 71
| %
|
| 78
| %
|
| 96
| %
|
| 174
| %
|
| 224
| %
|
1 Per share numbers have been calculated using the average shares method.
2 Based on net asset value, which does not reflect the sales charge, redemption fee, or contingent deferred sales charge, if applicable. Total returns for periods of less than one year are not annualized.
3 During the period, the Fund was reimbursed by the Adviser, which had an impact of 0.21% on the total return. See Notes to Financial Statements (Note 5).
4 The net expense ratio is calculated without reduction for fees paid indirectly for directed brokerage arrangements. The net expense ratios are 2.74%, 2.75%, 2.76%, and 2.79% after taking into account these expense reductions for the years ended October 31, 2005, 2004, 2003, and 2002, respectively.
5 This expense decrease is reflected in both the net expense and the net investment income (loss) ratios shown above.
See Notes which are an integral part of the Financial Statements
Shareholder Expense Example
As a shareholder of the Fund, you incur two types of costs: (1) transaction costs, including sales charges (loads) on purchase or redemption payments; and (2) ongoing costs, including management fees; to the extent applicable, distribution (12b-1) fees and/or shareholder services fees; and other Fund expenses. This Example is intended to help you to understand your ongoing costs (in dollars) of investing in the Fund and to compare these costs with the ongoing costs of investing in other mutual funds. It is based on an investment of $1,000 invested at the beginning of the period and held for the entire period from May 1, 2005 to October 31, 2005.
ACTUAL EXPENSES
The first section of the table below provides information about actual account values and actual expenses. You may use the information in this section, together with the amount you invested, to estimate the expenses that you incurred over the period. Simply divide your account value by $1,000 (for example, an $8,600 account value divided by $1,000 = 8.6), then multiply the result by the number in the first section under the heading entitled "Expenses Paid During Period" to estimate the expenses attributable to your investment during this period.
HYPOTHETICAL EXAMPLE FOR COMPARISON PURPOSES
The second section of the table below provides information about hypothetical account values and hypothetical expenses based on the Fund's actual expense ratio and an assumed rate of return of 5% per year before expenses, which is not the Fund's actual return. Thus, you should not use the hypothetical account values and expenses to estimate the actual ending account balance or your expenses for the period. Rather, these figures are provided to enable you to compare the ongoing costs of investing in the Fund and other funds. To do so, compare this 5% hypothetical example with the 5% hypothetical examples that appear in the shareholder reports of the other funds.
Please note that the expenses shown in the table are meant to highlight your ongoing costs only and do not reflect any transaction costs, such as sales charges (loads) on purchase or redemption payments. Therefore, the second section of the table is useful in comparing ongoing costs only, and will not help you determine the relative total costs of owning different funds. In addition, if these transaction costs were included, your costs would have been higher.
|
| Beginning
Account Value
5/1/2005
|
| Ending
Account Value
10/31/2005
|
| Expenses Paid
During Period 1
|
Actual:
|
|
|
|
|
|
|
Class A Shares
|
| $1,000
|
| $1,092.40
|
| $10.60
|
Class B Shares
|
| $1,000
|
| $1,087.50
|
| $14.47
|
Class C Shares
|
| $1,000
|
| $1,089.90
|
| $14.49
|
Hypothetical (assuming a 5% return before expenses):
|
|
|
|
|
|
|
Class A Shares
|
| $1,000
|
| $1,015.07
|
| $10.21
|
Class B Shares
|
| $1,000
|
| $1,011.34
|
| $13.94
|
Class C Shares
|
| $1,000
|
| $1,011.34
|
| $13.94
|
1 Expenses are equal to the Fund's annualized net expense ratios multiplied by the average account value over the period, multiplied by 184/365 (to reflect the one-half year period). The annualized net expense ratios are as follows:
Class A Shares
|
| 2.01%
|
Class B Shares
|
| 2.75%
|
Class C Shares
|
| 2.75%
|
Management's Discussion of Fund Performance
The Federated Technology Fund's total return, based on net asset value, for the fiscal year ended October 31, 2005 was 2.77% for Class A Shares, 2.05% for Class B Shares and 2.05% for Class C Shares. This return trailed the 8.47% average return for the fund's peers in the Lipper Science & Technology Fund 1 category and the 8.96% return for the Merrill Lynch 100 Technology Index 2 (the "Index") for the same period. The fund's total return for the fiscal year reflected actual cash flows, transaction costs and other expenses which were not reflected in the total return of the Index.
MARKET OVERVIEW
Technology stocks, as measured by the Index, performed reasonably well through the first three quarters of the fund's fiscal year before giving some of those gains back in the last two months of the period. Overall, Technology stocks performed basically in line with the S&P 500 Index 3 over the reporting period.
The biggest issue over the past year was the rise in energy prices and the impact it is expected to have on economic growth and inflation.
PERFORMANCE REVIEW
The fund suffered from its larger-cap bias and focus on valuation.
The fund's performance versus the Index was hurt by weak security selection in Semiconductors, Enterprise Hardware, and Internet stocks. The fund also tended to be underweight versus the Index in Semiconductors and Internet - two of the best performing industries in Technology on an absolute basis over the reporting period. The fund benefited from its overweight and good security selection in Software, Semi-cap Equipment, Communications Equipment, and Storage stocks.
1 Lipper figures represent the average of the total returns reported by all the mutual funds designated by Lipper, Inc. as falling into the category indicated. They do not reflect sales charges.
2 The Merrill Lynch 100 Technology Index is an equal dollar-weighted index of 100 stocks designed to measure the performance of a cross section of large, actively traded technology stocks and American Depositary receipts (ADRs). The index was developed with a base value of 200 as of January 30, 1998. Indexes are unmanaged and it is not possible to invest directly in an index.
3 The S&P 500 Index is an unmanaged capitalization-weighted index of 500 stocks designed to measure performance of the broad domestic economy through changes in the aggregate market value of 500 stocks representing all major industries. It is not possible to invest directly in an index.
The fund maintained an underweight position in Internet stocks due to their high valuation, but still had exposure to market leaders Google , Yahoo , and eBay .. Given the fund's increased focus on enterprise IT spending versus consumer technology, the fund steadily increased its exposure to systems hardware as more attractive opportunities were found. In Semiconductors, the fund maintained an underweight position, as many of the second-tier companies continued to be expensive.
The securities that most positively impacted the fund included Motorola , a leading provider of communications equipment that gained almost 45% over the reporting period; Cymer , a supplier of semiconductor production equipment that gained almost 22% during the reporting period; Cadence Design , a market leader in the electronic design automation software segment that was up over 28% during the reporting period; Adobe Systems , a leading provider of digital media software that was up over 15% in the reporting period; PayChex , a payroll outsourcing provider focused on the Small and Medium Business customers market that was up over 20% during the reporting period; McAfee , a security software provider that was up 24% during the reporting period; and EMC , the leader in enterprise storage that was up 8.5% during the reporting period.
The securities that most negatively impacted the fund included Unisys , an IT service provider; Lexmark , a manufacturer of printers; Celestica , an electronic manufacturing service provider; and Sigmatel , a provider of mixed-signal integrated circuits.
GROWTH OF A $10,000 INVESTMENT - CLASS A SHARES
The graph below illustrates the hypothetical investment of $10,000 1 in Federated Technology Fund (Class A Shares) (the "Fund") from September 21, 1999 (start of performance) to October 31, 2005, compared to the NASDAQ Composite Index (NCI), 2 Merrill Lynch 100 Technology Index (MLT 100), 2 and the Lipper Science & Technology Funds Average (LSTFA). 2
Average Annual Total Returns 3 for the Periods Ended 10/31/2005
|
|
|
|
1 Year
|
| (2.80
| )%
|
5 Years
|
| (19.61
| )%
|
Start of Performance (9/21/1999)
|
| (10.95
| )%
|

Performance data quoted represents past performance which is no guarantee of future results. Investment return and principal value will fluctuate so that an investor's shares, when redeemed, may be worth more or less than their original cost. Mutual fund performance changes over time and current performance may be lower or higher than what is stated. For current to the most recent month-end performance and after-tax returns, visit FederatedInvestors.com or call 1-800-341-7400. Returns shown do not reflect the deduction of taxes that a shareholder would pay on Fund distributions or the redemption of Fund shares. Mutual funds are not obligations of or guaranteed by any bank and are not federally insured. Total returns shown include the maximum sales charge of 5.50%, as applicable.
1 Represents a hypothetical investment of $10,000 in the Fund after deducting the maximum sales charge of 5.50% ($10,000 investment minus $550 sales charge = $9,450). The Fund's performance assumes the reinvestment of all dividends and distributions. The NCI and the MLT 100 have been adjusted to reflect reinvestment of all dividends on securities in the indexes.
2 The NCI is an unmanaged index that measures all Nasdaq domestic and non-U.S.-based common stocks listed on the Nasdaq Stock Market. The MLT 100 is an equal dollar-weighted index of 100 stocks designed to measure the performance of a cross section of large, actively traded technology stocks and ADRs. The Index was developed with a base value of 200 as of January 30, 1998. The NCI and MLT 100 are not adjusted to reflect sales charges, expenses or other fees that the SEC requires to be reflected in the Fund's performance. The LSTFA represents the average of the total returns reported by all mutual funds designated by Lipper, Inc. as falling into the category, and is not adjusted to reflect any sales charges. However, these total returns are reported net of expenses or other fees that the SEC requires to be reflected in a fund's performance. The indexes are unmanaged and, unlike the Fund, are not affected by cashflows. It is not possible to invest in an index.
3 Total returns quoted reflect all applicable sales charges.
GROWTH OF A $10,000 INVESTMENT - CLASS B SHARES
The graph below illustrates the hypothetical investment of $10,000 1 in Federated Technology Fund (Class B Shares) (the "Fund") from September 21, 1999 (start of performance) to October 31, 2005, compared to the NASDAQ Composite Index (NCI), 2 Merrill Lynch 100 Technology Index (MLT 100), 2 and the Lipper Science & Technology Funds Average (LSTFA). 2
Average Annual Total Returns 3 for the Periods Ended 10/31/2005
|
|
|
|
1 Year
|
| (3.45
| )%
|
5 Years
|
| (19.64
| )%
|
Start of Performance (9/21/1999)
|
| (10.79
| )%
|

Performance data quoted represents past performance which is no guarantee of future results. Investment return and principal value will fluctuate so that an investor's shares, when redeemed, may be worth more or less than their original cost. Mutual fund performance changes over time and current performance may be lower or higher than what is stated. For current to the most recent month-end performance and after-tax returns, visit FederatedInvestors.com or call 1-800-341-7400. Returns shown do not reflect the deduction of taxes that a shareholder would pay on Fund distributions or the redemption of Fund shares. Mutual funds are not obligations of or guaranteed by any bank and are not federally insured. Total returns shown include the maximum contingent deferred sales charge of 5.50%, as applicable.
1 Represents a hypothetical investment of $10,000 in the Fund. The maximum contingent deferred sales charge is 5.50% on any redemption less than one year from the purchase date. The Fund's performance assumes the reinvestment of all dividends and distributions. The NCI and the MLT 100 have been adjusted to reflect reinvestment of all dividends on securities in the indexes.
2 The NCI is an unmanaged index that measures all Nasdaq domestic and non-U.S.-based common stocks listed on the Nasdaq Stock Market. The MLT 100 is an equal dollar-weighted index of 100 stocks designed to measure the performance of a cross section of large, actively traded technology stocks and ADRs. The Index was developed with a base value of 200 as of January 30, 1998. The NCI and MLT 100 are not adjusted to reflect sales charges, expenses or other fees that the SEC requires to be reflected in the Fund's performance. The LSTFA represents the average of the total returns reported by all mutual funds designated by Lipper, Inc. as falling into the category, and is not adjusted to reflect any sales charges. However, these total returns are reported net of expenses or other fees that the SEC requires to be reflected in a fund's performance. The indexes are unmanaged and, unlike the Fund, are not affected by cashflows. It is not possible to invest in an index.
3 Total returns quoted reflect all applicable contingent deferred sales charges.
GROWTH OF A $10,000 INVESTMENT - CLASS C SHARES
The graph below illustrates the hypothetical investment of $10,000 1 in Federated Technology Fund (Class C Shares) (the "Fund") from September 21, 1999 (start of performance) to October 31, 2005, compared to the NASDAQ Composite Index (NCI), 2 Merrill Lynch 100 Technology Index (MLT 100), 2 and the Lipper Science & Technology Funds Average (LSTFA). 2
Average Annual Total Returns 3 for the Periods Ended 10/31/2005
|
|
|
|
1 Year
|
| 0.03
| %
|
5 Years
|
| (19.46
| )%
|
Start of Performance (9/21/1999)
|
| (10.93
| )%
|
Performance data quoted represents past performance which is no guarantee of future results. Investment return and principal value will fluctuate so that an investor's shares, when redeemed, may be worth more or less than their original cost. Mutual fund performance changes over time and current performance may be lower or higher than what is stated. For current to the most recent month-end performance and after-tax returns, visit FederatedInvestors.com or call 1-800-341-7400. Returns shown do not reflect the deduction of taxes that a shareholder would pay on Fund distributions or the redemption of Fund shares. Mutual funds are not obligations of or guaranteed by any bank and are not federally insured. Total returns shown include the maximum sales charge of 1.00%, and the maximum contingent deferred sales charge of 1.00%, as applicable.
1 Represents a hypothetical investment of $10,000 in the Fund after deducting the maximum sales charge of 1.00% ($10,000 investment minus $100 sales charge = $9,900). A 1.00% contingent deferred sales charge would be applied to any redemption less than one year from purchase date. The Fund's performance assumes the reinvestment of all dividends and distributions. The NCI and the MLT 100 have been adjusted to reflect reinvestment of all dividends on securities in the indexes.
2 The NCI is an unmanaged index that measures all Nasdaq domestic and non-U.S.-based common stocks listed on the Nasdaq Stock Market. The MLT 100 is an equal dollar-weighted index of 100 stocks designed to measure the performance of a cross section of large, actively traded technology stocks and ADRs. The Index was developed with a base value of 200 as of January 30, 1998. The NCI and MLT 100 are not adjusted to reflect sales charges, expenses or other fees that the Securities and Exchange Commission SEC requires to be reflected in the Fund's performance. The LSTFA represents the average of the total returns reported by all mutual funds designated by Lipper, Inc. as falling into the category, and is not adjusted to reflect any sales charges. However, these total returns are reported net of expenses or other fees that the SEC requires to be reflected in a fund's performance. The indexes are unmanaged and, unlike the Fund, are not affected by cashflows. It is not possible to invest in an index.
3 Total returns quoted reflect all applicable sales charges and contingent deferred sales charges.
Performance data quoted represents past performance which is no guarantee of future results. Investment return and principal value will fluctuate so that an investor's shares, when redeemed, may be worth more or less than their original cost. Mutual fund performance changes over time and current performance may be lower or higher than what is stated. For current to the most recent month-end performance, visit FederatedInvestors.com or call 1-800-341-7400.
Portfolio of Investments Summary Table
At October 31, 2005, the Fund's sector composition 1 was as follows:
Sector
|
| Percentage of
Total Net Assets
|
Information Technology
|
| 87.8
| %
|
Health Care
|
| 6.8
| %
|
Consumer Discretionary
|
| 2.2
| %
|
Industrials
|
| 0.5
| %
|
Securities Lending Collateral 2
|
| 8.2
| %
|
Cash Equivalents 3
|
| 1.6
| %
|
Other Assets and Liabilities-Net 4
|
| (7.1
| )%
|
TOTAL
|
| 100.0
| %
|
1 Except for Securities Lending Collateral, Other Assets and Liabilities-Net and Cash Equivalents, sector classifications are based upon, and individual portfolio securities are assigned to, the classifications of the Global Industry Classification Standard (GICS) except that the adviser assigns a classification to securities not classified by the GICS and to securities for which the adviser does not have access to the classification made by the GICS.
2 Cash collateral received from lending portfolio securities which is invested in short-term investments such as repurchase agreements or money market funds.
3 Cash Equivalents includes any investments in money market mutual funds and/or overnight repurchase agreements other than those representing securities lending collateral.
4 See Statement of Assets and Liabilities.
Portfolio of Investments
October 31, 2005
Shares
|
|
|
|
| Value
|
|
| | COMMON STOCKS--97.3% | | | | |
| | Consumer Discretionary--2.2% | | | | |
| 37,200 | 1 | eBay, Inc.
| | $ | 1,473,120 | |
| 17,000 | 1 | XM Satellite Radio Holdings, Inc., Class A
|
|
| 490,110
|
|
| | TOTAL
|
|
| 1,963,230
|
|
| | Health Care--6.8% | | | | |
| 10,300 | 1 | Cephalon, Inc.
| | | 469,577 | |
| 64,700 | 1 | Exelixis, Inc.
| | | 500,131 | |
| 22,100 | | Medtronic, Inc.
| | | 1,252,186 | |
| 21,300 | 2 | Novartis AG, ADR
| | | 1,146,366 | |
| 3,900 | | Roche Holding AG
| | | 582,652 | |
| 10,900 | 2 | Schering AG, ADR
| | | 673,511 | |
| 44,800 | | Schering Plough Corp.
| | | 911,232 | |
| 12,800 | | Shire Pharmaceuticals Group PLC, ADR
|
|
| 458,752
|
|
| | TOTAL
|
|
| 5,994,407
|
|
| | Industrials--0.5% | | | | |
| 33,000 | 1 | Global Cash Access LLC
|
|
| 462,660
|
|
| | Information Technology--87.8% | | | | |
| 352,600 | | ARM Holdings PLC, ADR
| | | 2,027,450 | |
| 28,700 | 1,2 | ASM Lithography Holding NV
| | | 487,326 | |
| 32,400 | 1,2 | ATI Technologies, Inc.
| | | 468,180 | |
| 40,700 | 1,2 | Accenture Ltd.
| | | 1,070,817 | |
| 60,100 | 2 | Adobe Systems, Inc.
| | | 1,938,225 | |
| 19,600 | 1 | Advanced Micro Devices, Inc.
| | | 455,112 | |
| 46,300 | | Advantest Corp., ADR
| | | 847,290 | |
| 105,800 | 1 | Altera Corp.
| | | 1,761,570 | |
| 77,000 | 1,2 | Amdocs Ltd.
| | | 2,038,190 | |
Shares
|
|
|
|
| Value
|
|
| | COMMON STOCKS--continued | | | | |
| | Information Technology--continued | | | | |
| 55,900 | | Analog Devices, Inc.
| | $ | 1,944,202 | |
| 18,900 | 1 | Ansys, Inc.
| | | 704,214 | |
| 21,900 | 1 | Anteon International Corp.
| | | 989,880 | |
| 91,600 | | Applied Materials, Inc.
| | | 1,500,408 | |
| 10,800 | 1 | Atos SA
| | | 742,681 | |
| 117,100 | 1 | Avaya, Inc.
| | | 1,348,992 | |
| 71,900 | 1 | Cadence Design Systems, Inc.
| | | 1,148,962 | |
| 50,600 | 1,2 | Celestica, Inc.
| | | 483,736 | |
| 80,000 | 1,2 | Check Point Software Technologies Ltd.
| | | 1,788,800 | |
| 175,600 | 1 | Cisco Systems, Inc.
| | | 3,064,220 | |
| 39,600 | 1 | Cognizant Technology Solutions Corp.
| | | 1,741,608 | |
| 40,500 | 1,2 | Cognos, Inc.
| | | 1,519,965 | |
| 22,100 | 1 | Comverse Technology, Inc.
| | | 554,710 | |
| 34,700 | 1 | Corning, Inc.
| | | 697,123 | |
| 94,600 | 1 | Dell, Inc.
| | | 3,015,848 | |
| 38,600 | 1 | Dolby Laboratories, Class A
| | | 621,460 | |
| 190,400 | | EMC Corp. Mass
| | | 2,657,984 | |
| 38,800 | 1 | Electronics for Imaging, Inc.
| | | 974,268 | |
| 36,700 | 1 | Flextronics International Ltd.
| | | 340,943 | |
| 3,200 | 1 | Google Inc.
| | | 1,190,848 | |
| 21,000 | | IBM Corp.
| | | 1,719,480 | |
| 106,900 | | Intel Corp.
| | | 2,512,150 | |
| 133,100 | 1 | JDS Uniphase Corp.
| | | 279,510 | |
| 37,300 | 1 | Jabil Circuit, Inc.
| | | 1,113,405 | |
| 53,900 | 1,2 | Juniper Networks, Inc.
| | | 1,257,487 | |
| 40,970 | 2 | KLA-Tencor Corp.
| | | 1,896,501 | |
| 18,400 | 1 | Lexmark International Group, Class A
| | | 763,968 | |
| 62,000 | | Linear Technology Corp.
| | | 2,059,020 | |
Shares
|
|
|
|
| Value
|
|
| | COMMON STOCKS--continued | | | | |
| | Information Technology--continued | | | | |
| 156,600 | 1 | Lucent Technologies, Inc.
| | $ | 446,310 | |
| 23,400 | 1 | MEMC Electronic Materials
| | | 419,796 | |
| 49,500 | 2 | Maxim Integrated Products, Inc.
| | | 1,716,660 | |
| 22,700 | 1 | McAfee, Inc.
| | | 681,681 | |
| 73,280 | | Microsoft Corp.
| | | 1,883,296 | |
| 63,000 | | Motorola, Inc.
| | | 1,396,080 | |
| 37,500 | 1 | NCR Corp.
| | | 1,133,250 | |
| 25,000 | 1 | Network Appliance, Inc.
| | | 684,000 | |
| 79,800 | | Nokia Oyj, Class A, ADR
| | | 1,342,236 | |
| 214,500 | 1 | Nortel Networks Corp.
| | | 697,125 | |
| 192,600 | 1 | Oracle Corp.
| | | 2,442,168 | |
| 15,000 | 1 | Palm, Inc.
| | | 385,350 | |
| 41,800 | | Paychex, Inc.
| | | 1,620,168 | |
| 10,200 | 1 | Research in Motion Ltd.
| | | 627,198 | |
| 34,600 | | SAP AG, ADR
| | | 1,485,724 | |
| 58,100 | 1 | SSA Global Technologies, Inc.
| | | 909,265 | |
| 36,000 | 1,2 | Salesforce.com Inc.
| | | 899,640 | |
| 28,500 | | Scientific-Atlanta, Inc.
| | | 1,010,040 | |
| 27,400 | 1 | Semtech Corp.
| | | 413,192 | |
| 29,500 | 1,2 | Sigmatel Inc.
| | | 401,495 | |
| 93,282 | 1 | Symantec Corp.
| | | 2,224,776 | |
| 19,700 | | Telefonaktiebolaget LM Ericsson, Class B, ADR
| | | 646,357 | |
| 217,000 | 1 | Unisys Corp.
| | | 1,108,870 | |
| 81,000 | | Xilinx, Inc.
| | | 1,939,950 | |
| 38,900 | 1 | Yahoo, Inc.
|
|
| 1,438,133
|
|
| | TOTAL
|
|
| 77,679,293
|
|
| | TOTAL COMMON STOCKS (IDENTIFIED COST $76,619,338)
|
|
| 86,099,590
|
|
Shares or
Principal
Amounts
|
|
|
|
| Value
|
|
| | MUTUAL FUND--8.2% | | | | |
| 7,265,724 | 3 | Prime Value Obligations Fund, IS Shares (at net asset value)
(held as collateral for securities lending)
|
| $
| 7,265,724
|
|
| | REPURCHASE AGREEMENT--1.6% | | | | |
| $1,444,000 | | Interest in $3,500,000,000 joint repurchase agreement 4.04%, dated 10/31/2005, under which Bank of America N.A. will repurchase a U.S. Government Agency security with a maturity of 7/1/2035 for $3,500,392,778 on 11/1/2005. The market value of the underlying security at the end of the period was $3,570,000,001 (AT AMORTIZED COST)
|
|
| 1,444,000
|
|
| | TOTAL INVESTMENTS-107.1%
(IDENTIFIED COST $85,329,062) 4
|
|
| 94,809,314
|
|
| | OTHER ASSETS AND LIABILITIES - NET-(7.1)%
|
|
| (6,296,828
| )
|
| | TOTAL NET ASSETS-100%
|
| $
| 88,512,486
|
|
1 Non-income producing security.
2 All or a portion of these securities are temporarily on loan to unaffiliated broker/dealers.
3 Affiliated company.
4 The cost of investments for federal tax purposes amounts to $89,687,359.
Note: The categories of investments are shown as a percentage of total net assets at October 31, 2005.
The following acronym is used throughout this portfolio:
| ADR | - --American Depositary Receipt |
See Notes which are an integral part of the Financial Statements
Statement of Assets and Liabilities
October 31, 2005
Assets
| | | | | | | | |
Total investments in securities, at value including $7,265,724
of investments in affiliated issuers (Note 5) and $7,091,973 of
securities loaned (identified cost $85,329,062)
| | | | | | $ | 94,809,314 | |
Cash
| | | | | | | 370 | |
Income receivable
| | | | | | | 28,345 | |
Receivable for investments sold
| | | | | | | 2,187,275 | |
Receivable for shares sold
|
|
|
|
|
|
| 27,608
|
|
TOTAL ASSETS
|
|
|
|
|
|
| 97,052,912
|
|
Liabilities:
| | | | | | | | |
Payable for investments purchased
| | $ | 633,484 | | | | | |
Payable for shares redeemed
| | | 316,453 | | | | | |
Payable for collateral due to broker
| | | 7,265,724 | | | | | |
Payable for transfer and dividend disbursing agent fees and expenses
| | | 246,484 | | | | | |
Payable for distribution services fee (Note 5)
| | | 45,477 | | | | | |
Payable for shareholder services fee (Note 5)
| | | 13,165 | | | | | |
Accrued expenses
|
|
| 19,639
|
|
|
|
|
|
TOTAL LIABILITIES
|
|
|
|
|
|
| 8,540,426
|
|
Net assets for 17,576,214 shares outstanding
|
|
|
|
|
|
| 88,512,486
|
|
Net Assets Consist of:
| | | | | | | | |
Paid-in capital
| | | | | | $ | 840,088,777 | |
Net unrealized appreciation of investments
| | | | | | | 9,480,252 | |
Accumulated net realized loss on investments and foreign currency transactions
|
|
|
|
|
|
| (761,056,543
| )
|
TOTAL NET ASSETS
|
|
|
|
|
| $
| 88,512,486
|
|
Net Asset Value, Offering Price and Redemption Proceeds Per Share
| | | | | | | | |
Class A Shares:
| | | | | | | | |
Net asset value per share ($27,412,015 ÷ 5,272,623 shares outstanding), no par value, unlimited shares authorized
|
|
|
|
|
|
| $5.20
|
|
Offering price per share (100/94.50 of $5.20) 1
|
|
|
|
|
|
| $5.50
|
|
Redemption proceeds per share
|
|
|
|
|
|
| $5.20
|
|
Class B Shares:
| | | | | | | | |
Net asset value per share ($51,835,875 ÷ 10,437,682 shares outstanding), no par value, unlimited shares authorized
|
|
|
|
|
|
| $4.97
|
|
Offering price per share
|
|
|
|
|
|
| $4.97
|
|
Redemption proceeds per share (94.50/100 of $4.97) 1
|
|
|
|
|
|
| $4.70
|
|
Class C Shares:
| | | | | | | | |
Net asset value per share ($9,264,596 ÷ 1,865,909 shares outstanding), no par value, unlimited shares authorized
|
|
|
|
|
|
| $4.97
|
|
Offering price per share (100/99.00 of $4.97) 1
|
|
|
|
|
|
| $5.02
|
|
Redemption proceeds per share (99.00/100 of $4.97) 1
|
|
|
|
|
|
| $4.92
|
|
1 See "What Do Shares Cost?" in the Prospectus.
See Notes which are an integral part of the Financial Statements
Statement of Operations
Year Ended October 31, 2005
Investment Income:
| | | | | | | | | | | | |
Dividends (including $2,681 received from affiliated issuers (Note 5) and net of foreign taxes withheld of $24,005)
| | | | | | | | | | $ | 711,505 | |
Interest (including $32,036 of income on securities loaned)
|
|
|
|
|
|
|
|
|
|
| 49,855
|
|
TOTAL INCOME
|
|
|
|
|
|
|
|
|
|
| 761,360
|
|
Expenses:
| | | | | | | | | | | | |
Investment adviser fee (Note 5)
| | | | | | $ | 767,361 | | | | | |
Administrative personnel and services fee (Note 5)
| | | | | | | 230,000 | | | | | |
Custodian fees
| | | | | | | 7,324 | | | | | |
Transfer and dividend disbursing agent fees and expenses
| | | | | | | 760,390 | | | | | |
Directors'/Trustees' fees
| | | | | | | 2,562 | | | | | |
Auditing fees
| | | | | | | 20,722 | | | | | |
Legal fees
| | | | | | | 8,221 | | | | | |
Portfolio accounting fees
| | | | | | | 69,721 | | | | | |
Distribution services fee--Class A Shares (Note 5)
| | | | | | | 76,265 | | | | | |
Distribution services fee--Class B Shares (Note 5)
| | | | | | | 456,550 | | | | | |
Distribution services fee--Class C Shares (Note 5)
| | | | | | | 82,017 | | | | | |
Shareholder services fee--Class B Shares (Note 5)
| | | | | | | 152,183 | | | | | |
Shareholder services fee--Class C Shares (Note 5)
| | | | | | | 27,136 | | | | | |
Share registration costs
| | | | | | | 41,148 | | | | | |
Printing and postage
| | | | | | | 41,547 | | | | | |
Insurance premiums
| | | | | | | 8,686 | | | | | |
Miscellaneous
|
|
|
|
|
|
| 2,025
|
|
|
|
|
|
TOTAL EXPENSES
|
|
|
|
|
|
| 2,753,858
|
|
|
|
|
|
Waivers, Reimbursement and Expense Reduction (Note 5):
| | | | | | | | | | | | |
Waiver/reimbursement of investment adviser fee
| | $ | (124,039 | ) | | | | | | | | |
Waiver of administrative personnel and services fee
| | | (43,978 | ) | | | | | | | | |
Fees paid indirectly from directed brokerage arrangements
|
|
| (8,955
| )
|
|
|
|
|
|
|
|
|
TOTAL WAIVERS, REIMBURSEMENT AND EXPENSE REDUCTION
|
|
|
|
|
|
| (176,972
| )
|
|
|
|
|
Net expenses
|
|
|
|
|
|
|
|
|
|
| 2,576,886
|
|
Net investment income (loss)
|
|
|
|
|
|
|
|
|
|
| (1,815,526
| )
|
Realized and Unrealized Gain (Loss) on Investments:
| | | | | | | | | | | | |
Net realized gain on investments and foreign currency transactions
| | | | | | | | | | | 9,447,315 | |
Net change in unrealized appreciation of investments
|
|
|
|
|
|
|
|
|
|
| (5,034,291
| )
|
Net realized and unrealized gain on investments
|
|
|
|
|
|
|
|
|
|
| 4,413,024
|
|
Change in net assets resulting from operations
|
|
|
|
|
|
|
|
|
|
| $2,597,498
|
|
See Notes which are an integral part of the Financial Statements
Statement of Changes in Net Assets
Year Ended October 31
|
|
| 2005
|
|
|
| 2004
|
|
Increase (Decrease) in Net Assets
| | | | | | | | |
Operations:
| | | | | | | | |
Net investment income (loss)
| | $ | (1,815,526 | ) | | $ | (3,004,192 | ) |
Net realized gain on investments and foreign currency transactions
| | | 9,447,315 | | | | 22,191,183 | |
Net change in unrealized appreciation/depreciation of investments
| | | (5,034,291 | ) | | | (17,604,783 | ) |
Net increase due to reimbursement from Adviser (Note 5)
|
|
| - --
|
|
|
| 81,485
|
|
CHANGE IN NET ASSETS RESULTING FROM OPERATIONS
|
|
| 2,597,498
|
|
|
| 1,663,693
|
|
Share Transactions:
| | | | | | | | |
Proceeds from sale of shares
| | | 6,747,940 | | | | 16,038,701 | |
Cost of shares redeemed
|
|
| (35,475,057
| )
|
|
| (46,682,868
| )
|
CHANGE IN NET ASSETS RESULTING FROM SHARE TRANSACTIONS
|
|
| (28,727,117
| )
|
|
| (30,644,167
| )
|
Change in net assets
|
|
| (26,129,619
| )
|
|
| (28,980,474
| )
|
Net Assets:
| | | | | | | | |
Beginning of period
|
|
| 114,642,105
|
|
|
| 143,622,579
|
|
End of period
|
| $
| 88,512,486
|
|
| $
| 114,642,105
|
|
See Notes which are an integral part of the Financial Statements
Notes to Financial Statements
October 31, 2005
1. ORGANIZATION
Federated Equity Funds (the "Trust") is registered under the Investment Company Act of 1940, as amended (the "Act"), as an open-end management investment company. The Trust consists of eight portfolios. The financial statements included herein are only those of Federated Technology Fund (the "Fund"), a diversified portfolio. The financial statements of the other portfolios are presented separately. The assets of each portfolio are segregated and a shareholder's interest is limited to the portfolio in which shares are held. The Fund offers three classes of shares: Class A Shares, Class B Shares, and Class C Shares. All shares of the Fund have equal rights with respect to voting, except on class-specific matters. The primary investment objective of the Fund is to achieve capital appreciation.
2. SIGNIFICANT ACCOUNTING POLICIES
The following is a summary of significant accounting policies consistently followed by the Fund in the preparation of its financial statements. These policies are in conformity with generally accepted accounting principles (GAAP) in the United States of America.
Investment Valuation
Domestic and foreign equity securities are valued at the last sale price or official closing price reported in the market in which they are primarily traded (either a national securities exchange or the over-the-counter market), if available. If unavailable, the security is generally valued at the mean between the last closing bid and asked prices. With respect to valuation of foreign securities, trading in foreign cities may be completed at times which vary from the closing of the New York Stock Exchange (NYSE). Therefore, foreign securities are valued at the latest closing price on the exchange on which they are traded immediately prior to the closing of the NYSE. Foreign securities quoted in foreign currencies are translated in U.S. dollars at the foreign exchange rate in effect at 4:00 p.m., Eastern Time, on the day the value of the foreign security is determined. The Fund generally values fixed income and short-term securities according to prices furnished by an independent pricing service, except that securities with remaining maturities of 60 days or less at the time of purchase may be valued at amortized cost. Prices furnished by an independent pricing service are intended to be indicative of the mean between the bid and asked prices currently offered to institutional investors for the securities. Investments in other open-end regulated investment companies are valued at net asset value. Securities for which no quotations are readily available or whose values have been affected by a significant event occurring between the close of their primary markets and the closing of the NYSE are valued at fair value as determined in accordance with procedures established by and under general supervision of the Board of Trustees (the "Trustees").
Repurchase Agreements
It is the policy of the Fund to require the custodian bank to take possession, to have legally segregated in the Federal Reserve Book Entry System, or to have segregated within the custodian bank's vault, all securities held as collateral under repurchase agreement transactions. Additionally, procedures have been established by the Fund to monitor, on a daily basis, the market value of each repurchase agreement's collateral to ensure that the value of the collateral at least equals the repurchase price to be paid under the repurchase agreement.
The Fund will only enter into repurchase agreements with banks and other recognized financial institutions, such as broker/dealers, which are deemed by the Fund's adviser to be creditworthy pursuant to the guidelines and/or standards reviewed or established by the Trustees. Risks may arise from the potential inability of counterparties to honor the terms of the repurchase agreement. The Fund, along with other affiliated investment companies, may utilize a joint trading account for the purpose of entering into one or more repurchase agreements.
Investment Income, Gains and Losses, Expenses and Distributions
Interest income and expenses are accrued daily. Dividend income and distributions to shareholders are recorded on the ex-dividend date. Distributions of net investment income are accrued and paid annually. Non-cash dividends included in dividend income, if any, are recorded at fair value. Investment income, realized and unrealized gains and losses, and certain fund-level expenses are allocated to each class based on relative average daily net assets, except that each class bears certain expenses unique to that class such as distribution and shareholder services fees. Dividends are declared separately for each class. No class has preferential dividend rights; differences in per share dividend rates are generally due to differences in separate class expenses.
Premium and Discount Amortization
All premiums and discounts on fixed-income securities are amortized/accreted for financial statement purposes.
Federal Taxes
It is the Fund's policy to comply with the Subchapter M provision of the Internal Revenue Code (the "Code") and to distribute to shareholders each year substantially all of its income. Accordingly, no provision for federal income tax is necessary.
Withholding taxes, and where appropriate, deferred withholding taxes, on foreign interest, dividends and capital gains have been provided for in accordance with the applicable country's tax rules and rates.
When-Issued and Delayed Delivery Transactions
The Fund may engage in when-issued or delayed delivery transactions. The Fund records when-issued securities on the trade date and maintains security positions such that sufficient liquid assets will be available to make payment for the securities purchased. Securities purchased on a when-issued or delayed delivery basis are marked to market daily and begin earning interest on the settlement date. Losses may occur on these transactions due to changes in market conditions or the failure of counterparties to perform under the contract.
Foreign Currency Translation
The accounting records of the Fund are maintained in U.S. dollars. All assets and liabilities denominated in foreign currencies (FCs) are translated into U.S. dollars based on the rates of exchange of such currencies against U.S. dollars on the date of valuation. Purchases and sales of securities, income and expenses are translated at the rate of exchange quoted on the respective date that such transactions are recorded. The Fund does not isolate that portion of the results of operations resulting from changes in foreign exchange rates on investments from the fluctuations arising from changes in market prices of securities held. Such fluctuations are included with the net realized and unrealized gain or loss from investments.
Reported net realized foreign exchange gains or losses arise from sales of portfolio securities, sales and maturities of short-term securities, sales of FCs, currency gains or losses realized between the trade and settlement dates on securities transactions, the difference between the amounts of dividends, interest and foreign withholding taxes recorded on the Fund's books, and the U.S. dollar equivalent of the amounts actually received or paid. Net unrealized foreign exchange gains and losses arise from changes in the value of assets and liabilities other than investments in securities at fiscal year end, resulting from changes in the exchange rate.
Securities Lending
The Fund participates in a securities lending program providing for the lending of corporate bonds, equity and government securities to qualified brokers. The Fund normally receives cash collateral for securities loaned that is invested in an affiliated money market fund. Collateral is maintained at a minimum level of 102% of the market value of investments loaned, plus interest, if applicable. Earnings on collateral are allocated between the securities lending agent, as a fee for its services under the program, and the Fund, according to agreed-upon rates.
As of October 31, 2005, securities subject to this type of arrangement and related collateral were as follows:
Market Value of
Securities Loaned
|
| Market Value
of Collateral
|
$7,091,973
|
| $7,265,724
|
Use of Estimates
The preparation of financial statements in conformity with GAAP requires management to make estimates and assumptions that affect the amounts of assets, liabilities, expenses and revenues reported in the financial statements. Actual results could differ from those estimated.
Other
Investment transactions are accounted for on a trade date basis. Realized gains and losses from investment transactions are recorded on an identified cost basis.
3. SHARES OF BENEFICIAL INTEREST
The following tables summarize share activity:
Year Ended October 31
|
| 2005
|
|
| 2004
|
|
Class A Shares:
|
| Shares
|
|
|
| Amount
|
|
| Shares
|
|
|
| Amount
|
|
Shares sold
| | 948,737 | | | $ | 4,979,046 | | | 1,574,488 | | | $ | 8,127,571 | |
Shares redeemed
|
| (2,222,502
| )
|
|
| (11,594,611
| )
|
| (3,755,611
| )
|
|
| (19,128,541
| )
|
�� NET CHANGE RESULTING FROM CLASS A SHARE TRANSACTIONS
|
|
(1,273,765
| )
|
|
$
|
(6,615,565
| )
|
|
(2,181,123
| )
|
|
$
|
(11,000,970
| )
|
| | | | | | | | | | | | | | |
Year Ended October 31
|
| 2005
|
|
| 2004
|
|
Class B Shares:
|
| Shares
|
|
|
| Amount
|
|
| Shares
|
|
|
| Amount
|
|
Shares sold
| | 233,917 | | | $ | 1,178,080 | | | 1,317,560 | | | $ | 6,537,796 | |
Shares redeemed
|
| (3,966,518
| )
|
|
| (19,740,413
| )
|
| (4,669,476
| )
|
|
| (22,486,706
| )
|
NET CHANGE RESULTING FROM CLASS B SHARE TRANSACTIONS
|
|
(3,732,601
| )
|
|
$
|
(18,562,333
| )
|
|
(3,351,916
| )
|
|
$
|
(15,948,910
| )
|
| | | | | | | | | | | | | | |
Year Ended October 31
|
| 2005
|
|
| 2004
|
|
Class C Shares:
|
| Shares
|
|
|
| Amount
|
|
| Shares
|
|
|
| Amount
|
|
Shares sold
| | 117,498 | | | $ | 590,814 | | | 273,776 | | | $ | 1,373,334 | |
Shares redeemed
|
| (830,707
| )
|
|
| (4,140,033
| )
|
| (1,043,396
| )
|
|
| (5,067,621
| )
|
NET CHANGE RESULTING FROM CLASS C SHARE TRANSACTIONS
|
|
(713,209
| )
|
|
$
|
(3,549,219
| )
|
|
(769,620
| )
|
|
$
|
(3,694,287
| )
|
NET CHANGE RESULTING FROM SHARE TRANSACTIONS
|
|
(5,719,575
| )
|
|
$
|
(28,727,117
| )
|
|
(6,302,659
| )
|
|
$
|
(30,644,167
| )
|
4. FEDERAL TAX INFORMATION
The timing and character of income and capital gain distributions are determined in accordance with income tax regulations, which may differ from GAAP. These differences are due in part to differing treatments for foreign currency transactions, net operating loss and capital loss carryforward on merger.
For the year ended October 31, 2005, permanent differences identified and reclassified among the components of net assets were as follows:
Increase (Decrease)
|
Paid-In Capital
|
| Undistributed Net
Investment Income (Loss)
|
| Accumulated Net
Realized Loss
|
$(1,799,132)
|
| $1,815,526
|
| $(16,394)
|
Net investment income (loss), net realized gains (losses), and net assets were not affected by this reclassification.
As of October 31, 2005, the components of distributable earnings on a tax basis were as follows:
Net unrealized appreciation
|
| $
| 5,121,955
|
|
Capital loss carryforward
|
| $
| (756,698,244
| )
|
At October 31, 2005, the cost of investments for federal tax purposes was $89,687,359. The net unrealized appreciation was $5,121,955. This consists of net unrealized appreciation from investments for those securities having an excess of value over cost of $9,929,025 and net unrealized depreciation from investments for those securities having an excess of cost over value of $4,807,070.
The difference between book-basis and tax-basis net unrealized appreciation is attributable to differing treatments for the deferral of losses on wash sales.
At October 31, 2005, the Fund had a capital loss carryforward of $(756,698,244) which will reduce the Fund's taxable income arising from future net realized gains on investments, if any, to the extent permitted by the Code and thus will reduce the amount of distributions to shareholders which would otherwise be necessary to relieve the Fund of any liability for federal tax. Pursuant to the Code, such capital loss carryforward will expire as follows:
Expiration Year
|
| Expiration Amount
|
|
2008
|
| $(258,731,432
| )
|
2009
|
| $(436,150,066
| )
|
2010
|
| $ (59,356,831
| )
|
2011
|
| $ (2,459,915
| )
|
As a result of the tax-free transfer of assets from Federated Large Cap Technology Fund to the Fund certain capital loss carryforwards listed above may be limited.
The Fund used capital loss carryforwards of $8,875,672 to offset taxable gains realized during the year ended October 31, 2005.
5. INVESTMENT ADVISER FEE AND OTHER TRANSACTIONS WITH AFFILIATES
Investment Adviser Fee
Federated Equity Management Company of Pennsylvania, the Fund's investment adviser (the "Adviser"), receives for its services an annual investment adviser fee equal to 0.75% of the Fund's average daily net assets. The Adviser may voluntarily choose to waive any portion of its fee. The Adviser can modify or terminate this voluntary waiver at any time at its sole discretion. For the year ended October 31, 2005, the Adviser voluntarily waived $124,039 of its fee.
Certain of the Fund's assets are managed by Federated Global Investment Management Corp. (the "Sub-Adviser"). Under the terms of a sub-adviser agreement between the Adviser and the Sub-Adviser, the Sub-Adviser receives an allocable portion of the Fund's adviser fee. The fee is paid by the Adviser out of its resources and is not an incremental Fund expense.
Pursuant to an Exemptive Order issued by the Securities and Exchange Commission, the Fund may invest in Prime Value Obligations Fund, which is managed by the Adviser or an affiliate of the Adviser. The Adviser has agreed to reimburse the Fund for certain investment adviser fees as a result of these transactions. Income distributions earned from investments in this fund are recorded as income in the accompanying financial statements and totaled $2,681 for the period.
Administrative Fee
Federated Administrative Services (FAS), under the Administrative Services Agreement, provides the Fund with administrative personnel and services. The fee paid to FAS is based on the average aggregate daily net assets of all Federated funds as specified below:
Maximum
Administrative Fee
|
| Average Aggregate Daily Net Assets
of the Federated Funds
|
0.150%
|
| on the first $5 billion
|
0.125%
|
| on the next $5 billion
|
0.100%
|
| on the next $10 billion
|
0.075%
|
| on assets in excess of $20 billion
|
The administrative fee received during any fiscal year shall be at least $150,000 per portfolio and $40,000 per each additional class of Shares. FAS may voluntarily choose to waive any portion of its fee. FAS can modify or terminate this voluntary waiver at any time at its sole discretion. For the year ended October 31, 2005, the net fee paid to FAS was 0.182% of average aggregate daily net assets of the Fund.
Distribution Services Fee
The Fund has adopted a Distribution Plan (the "Plan") pursuant to Rule 12b-1 under the Act. Under the terms of the Plan, the Fund will compensate Federated Securities Corp. (FSC), the principal distributor, from the daily net assets of the Fund's Class A Shares, Class B Shares and Class C Shares to finance activities intended to result in the sale of these shares. The Plan provides that the Fund may incur distribution expenses according to the following schedule annually, to compensate FSC:
Share Class Name
|
| Percentage of Average Daily
Net Assets of Class
|
Class A Shares
|
| 0.25%
|
Class B Shares
|
| 0.75%
|
Class C Shares
|
| 0.75%
|
FSC may voluntarily choose to waive any portion of its fee. FSC can modify or terminate this voluntary waiver at any time at its sole discretion. Rather than paying financial intermediaries directly, the Fund may pay fees to FSC and FSC will use the fees to compensate financial intermediaries. For the year ended October 31, 2005, FSC retained $88,187 of fees paid by the Fund.
Sales Charges
For the year ended October 31, 2005, FSC retained $1,018 in sales charges from the sale of Class A Shares. FSC also retained $352 of contingent deferred sales charges relating to redemptions of Class C Shares. See "What Do Shares Cost?" in the Prospectus.
Shareholder Services Fee
The Fund may pay fees (Services Fees) up to 0.25% of the average daily net assets of the Fund's Class A Shares, Class B Shares and Class C Shares to financial intermediaries or to Federated Shareholder Services Company (FSSC), a subsidiary of Federated Investors, Inc., for providing services to shareholders and maintaining shareholder accounts. Under certain agreements, rather than paying financial intermediaries directly, the Fund may pay Service Fees to FSSC and FSSC will use the fees to compensate financial intermediaries. FSSC or these financial intermediaries may voluntarily choose to waive any portion of their fee. This voluntary waiver can be modified or terminated at any time. For the year ended October 31, 2005, FSSC did not retain any fees paid by the Fund.
Expense Reduction
The Fund directs portfolio trades to a broker that in turn pays a portion of the Fund's operating expenses. For the year ended October 31, 2005, the Fund's expenses were reduced by $8,955 under these arrangements.
Other
Federated retained an outside law firm to perform an internal review of past mutual fund trading practices and report to a special investigative committee of Federated's Board. In conjunction with this review, the Independent Trustees of the Fund retained a financial expert to assess the impact of these trading practices. In accordance with the findings of the financial expert, the Fund's Adviser contributed $81,485 to the Fund during fiscal year 2004, which relates to a contribution to Paid-in Capital for detrimental impact to the Fund from frequent trading activity and detrimental impact on those Funds that may have resulted from orders incorrectly accepted by Federated employees after the Fund's closing times.
General
Certain of the Officers and Trustees of the Fund are Officers and Directors or Trustees of the above companies.
6. INVESTMENT TRANSACTIONS
Purchases and sales of investments, excluding long-term U.S. government securities and short-term obligations, for the year ended October 31, 2005, were as follows:
Purchases
|
| $
| 72,414,537
|
Sales
|
| $
| 101,951,064
|
7. CONCENTRATION OF CREDIT RISK
The Fund may invest a portion of its assets in securities of companies that are deemed by the Fund's management to be classified in similar business sectors. The economic developments within a particular sector may have an adverse effect on the ability of issuers to meet their obligations. Additionally, economic developments may have an effect on the liquidity and volatility of the portfolio securities.
8. LEGAL PROCEEDINGS
Beginning in October, 2003, Federated Investors, Inc. and various subsidiaries thereof (including the advisers and distributor for various investment companies, collectively, "Federated"), along with various investment companies sponsored by Federated ("Funds") were named as defendants in several class action lawsuits now pending in the United States District Court for the District of Maryland. The lawsuits were purportedly filed on behalf of people who purchased, owned and/or redeemed shares of Federated-sponsored mutual funds during specified periods beginning November 1, 1998. The suits are generally similar in alleging that Federated engaged in illegal and improper trading practices including market timing and late trading in concert with certain institutional traders, which allegedly caused financial injury to the mutual fund shareholders. These lawsuits began to be filed shortly after Federated's first public announcement that it had received requests for information on shareholder trading activities in the Funds from the Securities and Exchange Commission ("SEC"), the Office of the New York State Attorney General ("NYAG"), and other authorities. In that regard, on November 28, 2005, Federated announced that it had reached final settlements with the SEC and the NYAG with respect to those matters. As Federated previously reported in 2004, it has already paid approximately $8.0 million to certain funds as determined by an independent consultant. As part of these settlements, Federated agreed to pay for the benefit of fund shareholders additional disgorgement and a civil money penalty in the aggregate amount of an additional $72 million. Federated and various Funds have also been named as defendants in several additional lawsuits, the majority of which are now pending in the United States District Court for the Western District of Pennsylvania, alleging, among other things, excessive advisory and rule 12b-1 fees. The Board of the Funds has retained the law firm of Dickstein Shapiro Morin & Oshinsky LLP to represent the Funds in these lawsuits. Federated and the Funds, and their respective counsel, are reviewing the allegations and will respond appropriately. Additional lawsuits based upon similar allegations may be filed in the future. The potential impact of these lawsuits, all of which seek unquantified damages, attorneys' fees and expenses, and future potential similar suits is uncertain. Although we do not believe that these lawsuits will have a material adverse effect on the Funds, there can be no assurance that these suits, the ongoing adverse publicity and/or other developments resulting from the regulatory investigations will not result in increased Fund redemptions, reduced sales of Fund shares, or other adverse consequences for the Funds.
Report of Independent Registered Public Accounting Firm
TO THE BOARD OF TRUSTEES OF FEDERATED EQUITY FUNDS AND THE SHAREHOLDERS OF FEDERATED TECHNOLOGY FUND:
We have audited the accompanying statement of assets and liabilities, including the portfolio of investments, of Federated Technology Fund (the "Fund"), a portfolio of Federated Equity Funds, as of October 31, 2005, and the related statement of operations for the year then ended, the statements of changes in net assets for each of the two years in the period then ended, and the financial highlights for each of the five years in the period then ended. These financial statements and financial highlights are the responsibility of the Fund's management. Our responsibility is to express an opinion on these financial statements and financial highlights based on our audits.
We conducted our audits in accordance with the standards of the Public Company Accounting Oversight Board (United States). Those standards require that we plan and perform the audit to obtain reasonable assurance about whether the financial statements and financial highlights are free of material misstatement. The Fund is not required to have, nor were we engaged to perform, an audit of its internal control over financial reporting. Our audits included consideration of internal control over financial reporting as a basis for designing audit procedures that are appropriate in the circumstances, but not for the purpose of expressing an opinion on the effectiveness of the Fund's internal control over financial reporting. Accordingly, we express no such opinion. An audit also includes examining, on a test basis, evidence supporting the amounts and disclosures in the financial statements, assessing the accounting principles used and significant estimates made by management, as well as evaluating the overall financial statement presentation. Our procedures included confirmation of securities owned as of October 31, 2005, by correspondence with the custodian and brokers; where replies were not received from brokers, we performed other auditing procedures. We believe that our audits provide a reasonable basis for our opinion.
In our opinion, such financial statements and financial highlights present fairly, in all material respects, the financial position of the Fund as of October 31, 2005, the results of its operations, the changes in its net assets, and its financial highlights for the respective stated periods, in conformity with accounting principles generally accepted in the United States of America.
Deloitte & Touche Llp
Boston, Massachusetts
December 20, 2005
Board of Trustees and Trust Officers
The Board is responsible for managing the Trust's business affairs and for exercising all the Trust's powers except those reserved for the shareholders. The following tables give information about each Board member and the senior officers of the Fund. Where required, the tables separately list Board members who are "interested persons" of the Fund (i.e., "Interested" Board members) and those who are not (i.e., "Independent" Board members). Unless otherwise noted, the address of each person listed is Federated Investors Tower, 1001 Liberty Avenue, Pittsburgh, PA. As of December 31, 2004, the Trust comprised eight portfolios, and the Federated Fund Complex consisted of 44 investment companies (comprising 133 portfolios). Unless otherwise noted, each Officer is elected annually. Unless otherwise noted, each Board member oversees all portfolios in the Federated Fund Complex and serves for an indefinite term. The Fund's Statement of Additional Information includes additional information about Trust Trustees and is available, without charge and upon request, by calling 1-800-341-7400.
INTERESTED TRUSTEES BACKGROUND
|
|
|
Name
Birth Date
Address
Positions Held with Trust
Date Service Began
|
| Principal Occupation(s) for Past Five Years,
Other Directorships Held and Previous Position(s)
|
John F. Donahue*
Birth Date: July 28, 1924
CHAIRMAN AND TRUSTEE
Began serving: April 1984 | | Principal Occupations : Chairman and Director or Trustee of the Federated Fund Complex; Chairman and Director, Federated Investors, Inc.
Previous Positions : Trustee, Federated Investment Management Company and Chairman and Director, Federated Investment Counseling. |
|
|
|
J. Christopher Donahue*
Birth Date: April 11, 1949
PRESIDENT AND TRUSTEE
Began serving: January 2000 | | Principal Occupations : Principal Executive Officer and President of the Federated Fund Complex; Director or Trustee of some of the Funds in the Federated Fund Complex; President, Chief Executive Officer and Director, Federated Investors, Inc.; Chairman and Trustee, Federated Investment Management Company; Trustee, Federated Investment Counseling; Chairman and Director, Federated Global Investment Management Corp.; Chairman, Passport Research, Ltd.; Trustee, Federated Shareholder Services Company; Director, Federated Services Company.
Previous Positions : President, Federated Investment Counseling; President and Chief Executive Officer, Federated Investment Management Company, Federated Global Investment Management Corp. and Passport Research, Ltd. |
|
|
|
|
|
|
Name
Birth Date
Address
Positions Held with Trust
Date Service Began
|
| Principal Occupation(s) for Past Five Years,
Other Directorships Held and Previous Position(s)
|
Lawrence D. Ellis, M.D.*
Birth Date: October 11, 1932
3471 Fifth Avenue
Suite 1111
Pittsburgh, PA
TRUSTEE
Began serving: August 1987 | | Principal Occupations : Director or Trustee of the Federated Fund Complex; Professor of Medicine, University of Pittsburgh; Medical Director, University of Pittsburgh Medical Center Downtown; Hematologist, Oncologist and Internist, University of Pittsburgh Medical Center.
Other Directorships Held : Member, National Board of Trustees, Leukemia Society of America.
Previous Positions : Trustee, University of Pittsburgh; Director, University of Pittsburgh Medical Center. |
|
|
|
* Family relationships and reasons for "interested" status: John F. Donahue is the father of J. Christopher Donahue; both are "interested" due to the positions they hold with Federated Investors, Inc. and its subsidiaries. Lawrence D. Ellis, M.D. is "interested" because his son-in-law is employed by the Fund's principal underwriter, Federated Securities Corp.
INDEPENDENT TRUSTEES BACKGROUND
|
|
|
Name
Birth Date
Address
Positions Held with Trust
Date Service Began
|
| Principal Occupation(s) for Past Five Years,
Other Directorships Held and Previous Position(s)
|
Thomas G. Bigley
Birth Date: February 3, 1934
15 Old Timber Trail
Pittsburgh, PA
TRUSTEE
Began serving: October 1995 | | Principal Occupation : Director or Trustee of the Federated Fund Complex.
Other Directorships Held : Director, Member of Executive Committee, Children's Hospital of Pittsburgh; Director, University of Pittsburgh.
Previous Position : Senior Partner, Ernst & Young LLP. |
|
|
|
John T. Conroy, Jr.
Birth Date: June 23, 1937
Investment Properties Corporation
3838 North Tamiami Trail
Suite 402
Naples, FL
TRUSTEE
Began serving: November 1991 | | Principal Occupations : Director or Trustee of the Federated Fund Complex; Chairman of the Board, Investment Properties Corporation; Partner or Trustee in private real estate ventures in Southwest Florida.
Previous Positions : President, Investment Properties Corporation; Senior Vice President, John R. Wood and Associates, Inc., Realtors; President, Naples Property Management, Inc. and Northgate Village Development Corporation. |
|
|
|
|
|
|
Name
Birth Date
Address
Positions Held with Trust
Date Service Began
|
| Principal Occupation(s) for Past Five Years,
Other Directorships Held and Previous Position(s)
|
Nicholas P. Constantakis
Birth Date: September 3, 1939
175 Woodshire Drive
Pittsburgh, PA
TRUSTEE
Began serving: February 1998 | | Principal Occupations : Director or Trustee of the Federated Fund Complex.
Other Directorships Held : Director and Member of the Audit Committee, Michael Baker Corporation (engineering and energy services worldwide).
Previous Position : Partner, Andersen Worldwide SC. |
|
|
|
John F. Cunningham
Birth Date: March 5, 1943
353 El Brillo Way
Palm Beach, FL
TRUSTEE
Began serving: January 1999 | | Principal Occupation : Director or Trustee of the Federated Fund Complex.
Other Directorships Held : Chairman, President and Chief Executive Officer, Cunningham & Co., Inc. (strategic business consulting); Trustee Associate, Boston College.
Previous Positions : Director, Redgate Communications and EMC Corporation (computer storage systems); Chairman of the Board and Chief Executive Officer, Computer Consoles, Inc.; President and Chief Operating Officer, Wang Laboratories; Director, First National Bank of Boston; Director, Apollo Computer, Inc. |
|
|
|
Peter E. Madden
Birth Date: March 16, 1942
One Royal Palm Way
100 Royal Palm Way
Palm Beach, FL
TRUSTEE
Began serving: November 1991 | | Principal Occupation : Director or Trustee of the Federated Fund Complex.
Other Directorships Held : Board of Overseers, Babson College.
Previous Positions : Representative, Commonwealth of Massachusetts General Court; President, State Street Bank and Trust Company and State Street Corporation (retired); Director, VISA USA and VISA International; Chairman and Director, Massachusetts Bankers Association; Director, Depository Trust Corporation; Director, The Boston Stock Exchange. |
|
|
|
Charles F. Mansfield, Jr.
Birth Date: April 10, 1945
80 South Road
Westhampton Beach, NY
TRUSTEE
Began serving: January 1999 | | Principal Occupations : Director or Trustee of the Federated Fund Complex; Management Consultant; Executive Vice President, DVC Group, Inc. (marketing communications and technology) (prior to 9/1/00).
Previous Positions : Chief Executive Officer, PBTC International Bank; Partner, Arthur Young & Company (now Ernst & Young LLP); Chief Financial Officer of Retail Banking Sector, Chase Manhattan Bank; Senior Vice President, HSBC Bank USA (formerly, Marine Midland Bank); Vice President, Citibank; Assistant Professor of Banking and Finance, Frank G. Zarb School of Business, Hofstra University. |
|
|
|
|
|
|
Name
Birth Date
Address
Positions Held with Trust
Date Service Began
|
| Principal Occupation(s) for Past Five Years,
Other Directorships Held and Previous Position(s)
|
John E. Murray, Jr., J.D., S.J.D.
Birth Date: December 20, 1932
Chancellor, Duquesne University
Pittsburgh, PA
TRUSTEE
Began serving: February 1995 | | Principal Occupations : Director or Trustee of the Federated Fund Complex; Chancellor and Law Professor, Duquesne University; Partner, Murray, Hogue and Lannis.
Other Directorships Held : Director, Michael Baker Corp. (engineering, construction, operations and technical services).
Previous Positions : President, Duquesne University; Dean and Professor of Law, University of Pittsburgh School of Law; Dean and Professor of Law, Villanova University School of Law. |
|
|
|
Marjorie P. Smuts
Birth Date: June 21, 1935
4905 Bayard Street
Pittsburgh, PA
TRUSTEE
Began serving: April 1984 | | Principal Occupations : Director or Trustee of the Federated Fund Complex; Public Relations/Marketing Consultant/Conference Coordinator.
Previous Positions : National Spokesperson, Aluminum Company of America; television producer; President, Marj Palmer Assoc.; Owner, Scandia Bord. |
|
|
|
John S. Walsh
Birth Date: November 28, 1957
2604 William Drive
Valparaiso, IN
TRUSTEE
Began serving: January 1999 | | Principal Occupations : Director or Trustee of the Federated Fund Complex; President and Director, Heat Wagon, Inc. (manufacturer of construction temporary heaters); President and Director, Manufacturers Products, Inc. (distributor of portable construction heaters); President, Portable Heater Parts, a division of Manufacturers Products, Inc.
Previous Position : Vice President, Walsh & Kelly, Inc. |
|
|
|
OFFICERS
|
|
|
Name
Birth Date
Positions Held with Trust
Date Service Began
|
| Principal Occupation(s) for Past Five Years and Previous Position(s)
|
John W. McGonigle
Birth Date: October 26, 1938
EXECUTIVE VICE PRESIDENT
AND SECRETARY
Began serving: April 1984 | | Principal Occupations : Executive Vice President and Secretary of the Federated Fund Complex; Vice Chairman, Executive Vice President, Secretary and Director, Federated Investors, Inc.
Previous Positions : Trustee, Federated Investment Management Company and Federated Investment Counseling; Director, Federated Global Investment Management Corp., Federated Services Company and Federated Securities Corp. |
|
|
|
|
|
|
Name
Birth Date
Positions Held with Trust
Date Service Began
|
| Principal Occupation(s) for Past Five Years and Previous Position(s)
|
Richard J. Thomas
Birth Date: June 17, 1954
TREASURER
Began serving: November 1998 | | Principal Occupations : Principal Financial Officer and Treasurer of the Federated Fund Complex; Senior Vice President, Federated Administrative Services.
Previous Positions : Vice President, Federated Administrative Services; held various management positions within Funds Financial Services Division of Federated Investors, Inc. |
|
|
|
Richard B. Fisher
Birth Date: May 17, 1923
VICE PRESIDENT
Began serving: April 1984 | | Principal Occupations : Vice Chairman or Vice President of some of the Funds in the Federated Fund Complex; Vice Chairman, Federated Investors, Inc.; Chairman, Federated Securities Corp.
Previous Positions : President and Director or Trustee of some of the Funds in the Federated Fund Complex; Executive Vice President, Federated Investors, Inc. and Director and Chief Executive Officer, Federated Securities Corp. |
|
|
|
Stephen F. Auth
Birth Date: September 3, 1956
CHIEF INVESTMENT OFFICER
Began serving: November 2002 | | Principal Occupations : Chief Investment Officer of this Fund and various other Funds in the Federated Fund Complex; Executive Vice President, Federated Investment Counseling, Federated Global Investment Management Corp., Federated Equity Management Company of Pennsylvania and Passport Research II, Ltd.
Previous Positions : Executive Vice President, Federated Investment Management Company, and Passport Research, Ltd.; Senior Vice President, Global Portfolio Management Services Division; Senior Vice President, Federated Investment Management Company and Passport Research, Ltd.; Senior Managing Director and Portfolio Manager, Prudential Investments. |
|
|
|
Lawrence Auriana
Birth Date: January 8, 1944
VICE PRESIDENT
Began serving: November 2001 | | Lawrence Auriana is Vice President of the Trust. Mr. Auriana joined Federated in April 2001 as Co-Head of Investments/Federated Kaufmann. From August 1984 to April 2001, Mr. Auriana was President and Treasurer of Edgemont Asset Management Corp., and Chairman of the Board and Portfolio Manager to The Kaufmann Fund, Inc. (predecessor to the Federated Kaufmann Fund). Mr. Auriana earned a B.S. in economics from Fordham University and has been engaged in the securities business since 1965. |
|
|
|
|
|
|
Name
Birth Date
Positions Held with Trust
Date Service Began
|
| Principal Occupation(s) for Past Five Years and Previous Position(s)
|
James E. Grefenstette
Birth Date: November 7, 1962
VICE PRESIDENT
Began serving: November 1998 | | James E. Grefenstette is Vice President of the Trust. Mr. Grefenstette joined Federated in 1992 and has been a Portfolio Manager since 1994. Mr. Grefenstette became a Senior Vice President of the Fund's Adviser in January 2000. He served as a Vice President of the Fund's Adviser from 1996 through 1999 and was an Assistant Vice President of the Fund's Adviser from 1994 until 1996. Mr. Grefenstette is a Chartered Financial Analyst; he received his M.S. in Industrial Administration from Carnegie Mellon University. |
|
|
|
Hans P. Utsch
Birth Date: July 3, 1936
VICE PRESIDENT
Began serving: November 2001 | | Hans P. Utsch is Vice President of the Trust. Mr. Utsch joined Federated in April 2001 as Co-Head of Investments/Federated Kaufmann. From August 1984 to April 2001, Mr. Utsch was Chairman of the Board and Secretary of Edgemont Asset Management Corp., and President and Portfolio Manager to The Kaufmann Fund, Inc. (predecessor to the Federated Kaufmann Fund). Mr. Utsch graduated from Amherst College and holds an M.B.A. from Columbia University. He has been engaged in the securities business since 1962. |
|
|
|
Board Review of Advisory Contract
As required by the Act, the Fund's Board has reviewed the Fund's investment advisory contract and subadvisory contract. The Board's decision to approve these contracts reflects the exercise of its business judgment on whether to continue the existing arrangements. During its review of these contracts, the Board considers many factors, among the most material of which are: the Fund's investment objectives; the Adviser's and subadviser's management philosophy, personnel, processes, and investment and operating strategies; long term performance; the preferences and expectations of Fund shareholders and their relative sophistication; the continuing state of competition in the mutual fund industry; the range of comparable fees for similar funds in the mutual fund industry; the range and quality of services provided to the Fund and its shareholders by the Federated organization in addition to investment advisory services; and the Fund's relationship to the Federated family of funds which include a comprehensive array of funds with different investment objectives, policies and strategies which are available for exchange without the incurrence of additional sales charge.
In its decision to appoint or renew an Adviser, the Board is mindful of the potential disruptions of the Fund's operations and various risks, uncertainties and other effects that could occur as a result of a decision to terminate or not renew an advisory contract. In particular, the Board recognizes that most shareholders have invested in the Fund on the strength of the Adviser's industry standing and reputation and in the expectation that the Adviser will have a continuing role in providing advisory services to the Fund. Thus, the Board's "selection" or approval of the Adviser must reflect the fact that it is the shareholders who have effectively selected the Adviser by virtue of having invested in the Fund. The Board also considers the compensation and benefits received by the Adviser and subadviser. This includes fees received for services provided to the Fund by other entities in the Federated organization and research services received by the Adviser from brokers that execute fund trades, as well as advisory fees. In this regard, the Board is aware that various courts have interpreted provisions of the Act and have indicated in their decisions that the following factors may be relevant to an Adviser's fiduciary duty with respect to its receipt of compensation from a fund: the nature and quality of the services provided by the Adviser, including the performance of the Fund; the Adviser's cost of providing the services; the extent to which the Adviser may realize "economies of scale" as the Fund grows larger; any indirect benefits that may accrue to the Adviser and its affiliates as a result of the Adviser's relationship with the Fund; performance and expenses of comparable funds; and the extent to which the independent Board members are fully informed about all facts bearing on the Adviser's service and fee. The Fund's Board is aware of these factors and is guided by them in its review of the Fund's advisory contract to the extent they are appropriate and relevant, as discussed further below.
The Board considers and weighs these circumstances in light of its substantial accumulated experience in governing the Fund and working with Federated on matters relating to the Federated funds, and is assisted in its deliberations by the advice of independent legal counsel. In this regard, the Board requests and receives substantial and detailed information about the Fund and the Federated organization. Federated provides much of this information at each regular meeting of the Board, and furnishes additional reports in connection with the particular meeting at which the Board's formal review of the advisory contract occurs. In between regularly scheduled meetings, the Board may receive information on particular matters as the need arises. Thus, the Board's evaluation of an advisory contract is informed by reports covering such matters as: the Adviser's investment philosophy, personnel, and processes; operating strategies; the Fund's short- and long-term performance (in absolute terms, both on a gross basis and net of expenses, as well as in relationship to its particular investment program and certain competitor or "peer group" funds and/or other benchmarks, as appropriate), and comments on the reasons for performance; the Fund's expenses (including the advisory fee itself and the overall expense structure of the Fund, both in absolute terms and relative to similar and/or competing funds, with due regard for contractual or voluntary expense limitations); the use and allocation of brokerage commissions derived from trading the Fund's portfolio securities (if any); the nature and extent of the advisory and other services provided to the Fund by the Adviser and its affiliates; compliance and audit reports concerning the Federated funds and the Federated companies that service them (including communications from regulatory agencies), as well as Federated's responses to any issues raised therein; and relevant developments in the mutual fund industry and how the Federated funds and/or Federated are responding to them. The evaluation process is evolutionary, reflecting continually developing considerations. The criteria considered and the emphasis placed on relevant criteria change in recognition of changing circumstances in the mutual fund marketplace. For the past year, the Board concluded that the nature, quality and scope of services provided the fund by the Adviser and its affiliates was satisfactory.
With respect to the Fund's performance and expenses in particular, the Board has found the use of comparisons to other mutual funds with comparable investment programs to be particularly useful, given the high degree of competition in the mutual fund business. The Board focuses on comparisons with other similar mutual funds (rather than non-mutual fund products or services) because, simply put, they are more relevant. For example, other mutual funds are the products most like the Fund, they are readily available to Fund shareholders as alternative investment vehicles, and they are the type of investment vehicle in fact chosen and maintained by the Fund's investors. The range of their fees and expenses therefore appears to be a generally reliable indication of what consumers have found to be reasonable in the precise marketplace in which the Fund competes. The Fund's ability to deliver competitive performance when compared to its peer group may be a useful indicator of how the Adviser is executing on the Fund's investment program, which would in turn assist the Board in reaching a conclusion that the nature, extent, and quality of the Adviser's investment management services are such as to warrant continuation of the advisory contract.
During the year ending December 31, 2004, the Fund's performance for both the one and three year periods were above the median of the relevant peer group. During the year ending December 31, 2004, the Fund's investment advisory fee after waivers and expense reimbursements, if any, was below the median of the relevant peer group.
The Board also receives financial information about Federated, including reports on the compensation and benefits Federated derives from its relationships with the Federated funds. These reports cover not only the fees under the advisory contracts, but also fees received by Federated's subsidiaries for providing other services to the Federated funds under separate contracts (e.g., for serving as the Federated funds' administrator). The reports also discuss any indirect benefit Federated may derive from its receipt of research services from brokers who execute Federated fund trades as well as waivers of fees and/or reimbursements of expenses. In order for a fund to be competitive in the marketplace, Federated and its affiliates frequently waive fees and/or reimburse expenses. Although the Board considers the costs incurred and the profitability of the Federated organization as a whole, it does not evaluate, on a fund-by-fund basis, Federated's "profitability" and/or "costs" (which would include an assessment as to whether "economies of scale" would be realized if the fund were to grow to some sufficient size). In the Board's view, the cost of performing advisory services on a fund-specific basis is both difficult to estimate satisfactorily and a relatively minor consideration in its overall evaluation. Analyzing isolated funds would require constructed allocations of the costs of shared resources and operations based on artificial assumptions that are inconsistent with the existing relationships within a large and diversified family of funds that receive advisory and other services from the same organization. In addition, the availability of the exchange privilege among funds in the Federated family makes consideration of the overall cost and profitability of Federated more relevant than that of individual funds. Based upon this review, the Board is satisfied that the costs incurred in, as well as the profitability realized from, managing the Fund and the other Federated Funds are appropriate. Although the Board is always interested in discovering any genuine "economies of scale," its experience has been that such "economies" are likely to arise only when a fund grows dramatically, and becomes and remains very large in size. Even in these instances, purchase and redemption activity, as well as the presence of expense limitations (if any), may offset any perceived economies. As suggested above, the Board considers the information it receives about the Fund's performance and expenses as compared to an appropriate set of similar competing funds to be more relevant.
The Board bases its decision to approve an advisory contract on the totality of the circumstances and relevant factors and with a view to past and future long-term considerations. Not all of the factors and considerations identified above are relevant to every Federated fund, nor does the Board consider any one of them to be determinative. With respect to the factors that are relevant, the Board's decision to approve the contract reflects its determination that Federated's performance and actions provide a satisfactory basis to support the decision to continue the existing arrangements.
Voting Proxies on Fund Portfolio Securities
A description of the policies and procedures that the Fund uses to determine how to vote proxies, if any, relating to securities held in the Fund's portfolio is available, without charge and upon request, by calling 1-800-341-7400. A report on "Form N-PX" of how the Fund voted any such proxies during the most recent 12-month period ended June 30 is available through Federated's website. Go to FederatedInvestors.com, select "Products," select the "Prospectuses and Regulatory Reports" link, then select the Fund to access the link to Form N-PX. This information is also available from the EDGAR database on the SEC's website at www.sec.gov.
Quarterly Portfolio Schedule
The Fund files with the SEC a complete schedule of its portfolio holdings, as of the close of the first and third quarters of its fiscal year, on "Form N-Q." These filings are available on the SEC's website at www.sec.gov and may be reviewed and copied at the SEC's Public Reference Room in Washington, DC. (Call 1-800-SEC-0330 for information on the operation of the Public Reference Room.) You may also access this information from the "Products" section of the Federated Investors website at FederatedInvestors.com by clicking on "Portfolio Holdings" and selecting the name of the Fund, or by selecting the name of the Fund and clicking on "Portfolio Holdings." You must register on the website the first time you wish to access this information.
Mutual funds are not bank deposits or obligations, are not guaranteed by any bank, and are not insured or guaranteed by the U.S. government, the Federal Deposit Insurance Corporation, the Federal Reserve Board, or any other government agency. Investment in mutual funds involves investment risk, including the possible loss of principal.
This report is authorized for distribution to prospective investors only when preceded or accompanied by the Fund's prospectus, which contains facts concerning its objective and policies, management fees, expenses, and other information.
Federated
World-Class Investment Manager
Federated Technology Fund
Federated Investors Funds
5800 Corporate Drive
Pittsburgh, PA 15237-7000
Contact us at FederatedInvestors.com
or call 1-800-341-7400.
Federated Securities Corp., Distributor
Cusip 314172818
Cusip 314172792
Cusip 314172784
G02681-04(12/05)
Federated is a registered mark of Federated Investors, Inc. 2005 (c)Federated Investors, Inc.
Federated
World-Class Investment Manager
Federated Strategic Value Fund
Established 2005
A Portfolio of Federated Equity Funds
1ST ANNUAL SHAREHOLDER REPORT
October 31, 2005
Institutional Shares
Class A Shares
Class C Shares
FINANCIAL HIGHLIGHTS
SHAREHOLDER EXPENSE EXAMPLE
MANAGEMENT'S DISCUSSION OF FUND PERFORMANCE
PORTFOLIO OF INVESTMENTS SUMMARY TABLE
PORTFOLIO OF INVESTMENTS
STATEMENT OF ASSETS AND LIABILITIES
STATEMENT OF OPERATIONS
STATEMENT OF CHANGES IN NET ASSETS
NOTES TO FINANCIAL STATEMENTS
REPORT OF INDEPENDENT REGISTERED PUBLIC ACCOUNTING FIRM
BOARD OF TRUSTEES AND TRUST OFFICERS
BOARD REVIEW OF ADVISORY CONTRACT
VOTING PROXIES ON FUND PORTFOLIO SECURITIES
QUARTERLY PORTFOLIO SCHEDULE
Not FDIC Insured * May Lose Value * No Bank Guarantee
Financial Highlights - Institutional Shares
(For a Share Outstanding Throughout the Period)
Period Ended October 31
|
| 2005
| 1
|
Net Asset Value, Beginning of Period
| | $5.00 | |
Income From Investment Operations:
| | | |
Net investment income
| | 0.13 | 2 |
Net realized and unrealized gain on investments and foreign currency transactions
|
| 0.19
|
|
TOTAL FROM INVESTMENT OPERATIONS
|
| 0.32
|
|
Less Distributions:
| | | |
Distributions from net investment income
|
| (0.10
| )
|
Net Asset Value, End of Period
|
| $5.22
|
|
Total Return3
|
| 6.45
| %
|
| | | |
Ratios to Average Net Assets:
|
|
|
|
Net expenses
|
| 0.22
| %4
|
Net investment income
|
| 4.37
| %4
|
Expense waiver/reimbursement5
|
| 1.50
| %4
|
Supplemental Data:
|
|
|
|
Net assets, end of period (000 omitted)
|
| $21,698
|
|
Portfolio turnover
|
| 16
| %
|
1 Reflects operations for the period from March 30, 2005 (date of initial public investment) to October 31, 2005.
2 Per share numbers have been calculated using the average shares method.
3 Based on net asset value, which does not reflect the sales charge, redemption fee or contingent deferred sales charge, if applicable. Total returns for periods of less than one year are not annualized.
4 Computed on an annualized basis.
5 This expense decrease is reflected in both the net expense and the net investment income ratios shown above.
See Notes which are an integral part of the Financial Statements
Financial Highlights - Class A Shares
(For a Share Outstanding Throughout the Period)
Period Ended October 31
|
|
2005
| 1
|
Net Asset Value, Beginning of Period
| | $5.00 | |
Income From Investment Operations:
| | | |
Net investment income
| | 0.12 | 2 |
Net realized and unrealized gain on investments and foreign currency transactions
|
| 0.19
|
|
TOTAL FROM INVESTMENT OPERATIONS
|
| 0.31
|
|
Less Distributions:
| | | |
Distributions from net investment income
|
| (0.10
| )
|
Net Asset Value, End of Period
|
| $5.21
|
|
Total Return3
|
| 6.12
| %
|
| | | |
Ratios to Average Net Assets:
|
|
|
|
Net expenses
|
| 0.47
| %4
|
Net investment income
|
| 3.96
| %4
|
Expense waiver/reimbursement5
|
| 1.45
| %4
|
Supplemental Data:
|
|
|
|
Net assets, end of period (000 omitted)
|
| $103,674
|
|
Portfolio turnover
|
| 16
| %
|
1 Reflects operations for the period from March 30, 2005 (date of initial public investment) to October 31, 2005.
2 Per share numbers have been calculated using the average shares method.
3 Based on net asset value, which does not reflect the sales charge, redemption fee or contingent deferred sales charge, if applicable. Total returns for periods of less than one year are not annualized.
4 Computed on an annualized basis.
5 This expense decrease is reflected in both the net expense and the net investment income ratios shown above.
See Notes which are an integral part of the Financial Statements
Financial Highlights - Class C Shares
(For a Share Outstanding Throughout the Period)
Period Ended October 31
|
|
2005
| 1
|
Net Asset Value, Beginning of Period
| | $5.00 | |
Income From Investment Operations:
| | | |
Net investment income
| | 0.10 | 2 |
Net realized and unrealized gain on investments and foreign currency transactions
|
| 0.20
|
|
TOTAL FROM INVESTMENT OPERATIONS
|
| 0.30
|
|
Less Distributions:
| | | |
Distributions from net investment income
|
| (0.08
| )
|
Net Asset Value, End of Period
|
| $5.22
|
|
Total Return3
|
| 5.92
| %
|
| | | |
Ratios to Average Net Assets:
|
|
|
|
Net expenses
|
| 1.22
| %4
|
Net investment income
|
| 3.26
| %4
|
Expense waiver/reimbursement5
|
| 1.43
| %4
|
Supplemental Data:
|
|
|
|
Net assets, end of period (000 omitted)
|
| $23,418
|
|
Portfolio turnover
|
| 16
| %
|
1 Reflects operations for the period from March 30, 2005 (date of initial public investment) to October 31, 2005.
2 Per share numbers have been calculated using the average shares method.
3 Based on net asset value, which does not reflect the sales charge, redemption fee or contingent deferred sales charge, if applicable. Total returns for periods of less than one year are not annualized.
4 Computed on an annualized basis.
5 This expense decrease is reflected in both the net expense and the net investment income ratios shown above.
See Notes which are an integral part of the Financial Statements
Shareholder Expense Example
As a shareholder of the Fund, you incur two types of costs: (1) transaction costs, including sales charges (loads) on purchase or redemption payments; and (2) ongoing costs, including management fees; to the extent applicable, distribution (12b-1) fees and/or shareholder services fees; and other Fund expenses. This Example is intended to help you to understand your ongoing costs (in dollars) of investing in the Fund and to compare these costs with the ongoing costs of investing in other mutual funds. It is based on an investment of $1,000 invested at the beginning of the period and held for the entire period from May 1, 2005 to October 31, 2005.
ACTUAL EXPENSES
The first section of the table below provides information about actual account values and actual expenses. You may use the information in this section, together with the amount you invested, to estimate the expenses that you incurred over the period. Simply divide your account value by $1,000 (for example, an $8,600 account value divided by $1,000 = 8.6), then multiply the result by the number in the first section under the heading entitled "Expenses Paid During Period" to estimate the expenses attributable to your investment during this period.
HYPOTHETICAL EXAMPLE FOR COMPARISON PURPOSES
The second section of the table below provides information about hypothetical account values and hypothetical expenses based on the Fund's actual expense ratio and an assumed rate of return of 5% per year before expenses, which is not the Fund's actual return. Thus, you should not use the hypothetical account values and expenses to estimate the actual ending account balance or your expenses for the period. Rather, these figures are provided to enable you to compare the ongoing costs of investing in the Fund and other funds. To do so, compare this 5% hypothetical example with the 5% hypothetical examples that appear in the shareholder reports of the other funds.
Please note that the expenses shown in the table are meant to highlight your ongoing costs only and do not reflect any transaction costs, such as sales charges (loads) on purchases or redemption payments. Therefore, the second section of the table is useful in comparing ongoing costs only, and will not help you determine the relative total costs of owning different funds. In addition, if these transaction costs were included, your costs would have been higher.
|
| Beginning
Account Value
5/1/2005
|
| Ending
Account Value
10/31/2005
|
| Expenses Paid
During Period1
|
Actual:
|
|
|
|
|
|
|
Institutional Shares
|
| $1,000
|
| $1,049.80
|
| $1.08
|
Class A Shares
|
| $1,000
|
| $1,048.47
|
| $2.43
|
Class C Shares
|
| $1,000
|
| $1,044.60
|
| $6.29
|
Hypothetical (assuming a 5% return before expenses):
|
|
|
|
|
|
|
Institutional Shares
|
| $1,000
|
| $1,024.15
|
| $1.07
|
Class A Shares
|
| $1,000
|
| $1,022.84
|
| $2.40
|
Class C Shares
|
| $1,000
|
| $1,019.06
|
| $6.21
|
1 Expenses are equal to the Fund's annualized net expense ratios multiplied by the average account value over the period, multiplied by 184/365 (to reflect the one-half year period). The annualized net expense ratios are as follows:
Institutional Shares
|
| 0.21%
|
Class A Shares
|
| 0.47%
|
Class C Shares
|
| 1.22%
|
Management's Discussion of Fund Performance
The fund's total return, based on net asset value, from its inception date of March 30, 2005 through the end of its fiscal year on October 31, 2005 was 6.12% for Class A Shares, 5.92% for Class C Shares and 6.45% for Institutional Shares. The total return over the same period was 7.57% for the Russell Midcap Value Index (the "Index")1. The fund's total return for the reporting period reflected actual cash flows, transaction costs and other expenses which were not reflected in the total return of the Index.
The equity market, as measured by the Index, was modestly positive over the reporting period despite uncertainty associated with hurricanes, high energy prices and inflation. As the fund's fiscal year ended, however, there appeared to be improving news on all three of these fronts. The hurricane season was near an end. The average price of gasoline had dropped sharply, and inflation, while rising, seemed under control.
During the reporting period, the fund was positively affected by its underweighting compared to the Index of the Consumer Discretionary and Industrial sectors which underperformed, and its overweighting of the Utilities sector which performed well. On a stock selection basis, the fund was helped by favorable results in the Consumer Staples sector and hurt by relatively weak performance in Utilities.
Individual stocks contributing positively to the fund's performance included Arden Realty Group, Inc., Gables Residential Trust, Carolina Group, Scottish Power PLC and Marathon Oil Corp. On the negative side, the fund's performance was adversely impacted by investments in UST Inc., Packaging Corporation of America, ConAgra Inc., UPM and Peoples Energy Corp.
1 The Russell Midcap Value Index is an unmanaged index that measures the performance of those Russell midcap companies with lower price-to-book ratios and lower forecasted growth. The stocks are also members of the Russell 1000 Value Index. The Russell Midcap Value Index is not adjusted to reflect sales charges, expenses, or other fees that the Securities and Exchange Commission (SEC) requires to be reflected in the fund's performance. Indexes are unmanaged, and it is not possible to invest directly in an index.
GROWTH OF A $50,000 INVESTMENT - INSTITUTIONAL SHARES
The graph below illustrates the hypothetical investment of $50,0001 in the Federated Strategic Value Fund (Institutional Shares) (the "Fund") from March 30, 2005 (start of performance) to October 31, 2005, compared to the Standard & Poor's 500 Index (S&P 500),2 and the Russell Midcap Value Index (RMCVI).2
Average Annual Total Return3 for the Period Ended 10/31/2005
|
|
|
Start of Performance (3/30/2005)
|
| 6.45%
|
Performance data quoted represents past performance which is no guarantee of future results. Investment return and principal value will fluctuate so that an investor's shares, when redeemed, may be worth more or less than their original cost. Mutual fund performance changes over time and current performance may be lower or higher than what is stated. For current to the most recent month-end performance and after-tax returns, visit FederatedInvestors.com or call 1-800-341-7400. Returns shown do not reflect the deduction of taxes that a shareholder would pay on Fund distributions or the redemption of Fund shares. Mutual funds are not obligations of or guaranteed by any bank and are not federally insured.
1 Represents a hypothetical investment of $50,000 in the Fund with no sales load. The Fund's performance assumes the reinvestment of all dividends and distributions. The S&P 500 and RMCVI have been adjusted to reflect reinvestment of dividends on securities in the indexes.
2 The S&P 500 is a capitalization-weighted index of 500 stocks designed to measure performance of the broad domestic economy through changes in the aggregate market value of 500 stocks representing all major industries. The RMCVI measures the performance of those Russell Midcap companies with lower price-to-book ratios and lower forecasted growth values. The stocks are also members of the Russell 1000 Value Index. The S&P 500 and RMCVI are not adjusted to reflect sales loads, expenses, or other fees that the SEC requires to be reflected in the Fund's performance. The indexes are unmanaged and, unlike the Fund, are not affected by cashflows. It is not possible to invest in an index.
3 Total returns for less than one year are cumulative.
GROWTH OF A $10,000 INVESTMENT - CLASS A SHARES
The graph below illustrates the hypothetical investment of $10,0001 in the Federated Strategic Value Fund (Class A Shares) (the "Fund") from March 30, 2005 (start of performance) to October 31, 2005, compared to the Standard & Poor's 500 Index (S&P 500),2 and the Russell Midcap Value Index (RMCVI).2
Average Annual Total Return3 for the Period Ended 10/31/2005
|
|
|
Start of Performance (3/30/2005)
|
| 0.31%
|

Performance data quoted represents past performance which is no guarantee of future results. Investment return and principal value will fluctuate so that an investor's shares, when redeemed, may be worth more or less than their original cost. Mutual fund performance changes over time and current performance may be lower or higher than what is stated. For current to the most recent month-end performance and after-tax returns, visit FederatedInvestors.com or call 1-800-341-7400. Returns shown do not reflect the deduction of taxes that a shareholder would pay on Fund distributions or the redemption of Fund shares. Mutual funds are not obligations of or guaranteed by any bank and are not federally insured. Total returns shown include the maximum sales charge of 5.50%.
1 Represents a hypothetical investment of $10,000 in the Fund after deducting the maximum sales charge of 5.50% ($10,000 investment minus $550 sales charge = $9,450).The Fund's performance assumes the reinvestment of all dividends and distributions. The S&P 500 and RMCVI have been adjusted to reflect reinvestment of dividends on securities in the indexes.
2 The S&P 500 is a capitalization-weighted index of 500 stocks designed to measure performance of the broad domestic economy through changes in the aggregate market value of 500 stocks representing all major industries. The RMCVI measures the performance of those Russell Midcap companies with lower price-to-book ratios and lower forecasted growth values. The stocks are also members of the Russell 1000 Value Index. The S&P 500 and RMCVI are not adjusted to reflect sales loads, expenses, or other fees that the SEC requires to be reflected in the Fund's performance. The indexes are unmanaged and, unlike the Fund, are not affected by cashflows. It is not possible to invest in an index.
3 Total returns quoted reflect all applicable sales charges. Total returns for less than one year are cumulative.
GROWTH OF A $10,000 INVESTMENT - CLASS C SHARES
The graph below illustrates the hypothetical investment of $10,0001 in the Federated Strategic Value Fund (Class C Shares) (the "Fund") from March 30, 2005 (start of performance) to October 31, 2005, compared to the Standard & Poor's 500 Index (S&P 500),2 and the Russell Midcap Value Index (RMCVI).2
Average Annual Total Return3 for the Period Ended 10/31/2005
|
|
|
Start of Performance (3/30/2005)
|
| 3.88%
|
Performance data quoted represents past performance which is no guarantee of future results. Investment return and principal value will fluctuate so that an investor's shares, when redeemed, may be worth more or less than their original cost. Mutual fund performance changes over time and current performance may be lower or higher than what is stated. For current to the most recent month-end performance and after-tax returns, visit FederatedInvestors.com or call 1-800-341-7400. Returns shown do not reflect the deduction of taxes that a shareholder would pay on Fund distributions or the redemption of Fund shares. Mutual funds are not obligations of or guaranteed by any bank and are not federally insured. Total returns shown include the maximum sales charge of 1.00% and the maximum contingent deferred sales charge of 1.00% as applicable.
1 Represents a hypothetical investment of $10,000 in the Fund after deducting the maximum sales charge of 1.00% ($10,000 investment minus $100 sales charge = $9,900). A 1.00% contingent deferred sales charge would be imposed on any redemption less than one year from the purchase date. The Fund's performance assumes the reinvestment of all dividends and distributions. The S&P 500 and RMCVI have been adjusted to reflect reinvestment of dividends on securities in the indexes.
2 The S&P 500 is a capitalization-weighted index of 500 stocks designed to measure performance of the broad domestic economy through changes in the aggregate market value of 500 stocks representing all major industries. The RMCVI measures the performance of those Russell Midcap companies with lower price-to-book ratios and lower forecasted growth values. The stocks are also members of the Russell 1000 Value Index. The S&P 500 and RMCVI are not adjusted to reflect sales loads, expenses, or other fees that the SEC requires to be reflected in the Fund's performance. The indexes are unmanaged and, unlike the Fund, are not affected by cashflows. It is not possible to invest in an index.
3 Total returns quoted reflect all applicable sales charges and contingent deferred sales charges. Total returns for less than one year are cumulative.
Performance data quoted represents past performance which is no guarantee of future results. Investment return and principal value will fluctuate so that an investor's shares, when redeemed, may be worth more or less than their original cost. Mutual fund performance changes over time and current performance may be lower or higher than what is stated. For current to the most recent month-end performance, visit FederatedInvestors.com or call 1-800-341-7400.
Portfolio of Investments Summary Table
At October 31, 2005, the Fund's sector composition1 was as follows:
Sector
|
| Percentage of
Total Net Assets
|
Financials
|
| 38.3
| %
|
Utilities
|
| 19.3
| %
|
Consumer Staples
|
| 18.7
| %
|
Telecommunication Services
|
| 11.3
| %
|
Materials
|
| 5.3
| %
|
Industrials
|
| 1.6
| %
|
Consumer Discretionary
|
| 1.3
| %
|
Energy
|
| 1.1
| %
|
Cash Equivalents2
|
| 3.2
| %
|
Other Assets and Liabilities--Net3
|
| (0.1
| )%
|
TOTAL
|
| 100.0
| %
|
1 Except for Cash Equivalents and Other Assets and Liabilities, sector classifications are based upon, and individual portfolio securities are assigned to, the classifications of the Global Industry Classification Standard (GICS), except that the adviser assigns a classification to securities not classified by the GICS and to securities for which the adviser does not have access to the classification made by the GICS.
2 Cash Equivalents includes any investments in money market mutual funds and/or overnight repurchase agreements.
3 See Statement of Assets and Liabilities.
Portfolio of Investments
October 31, 2005
Shares
|
|
|
|
| Value
|
|
| | | COMMON STOCKS--96.9% | | | | |
| | | Consumer Discretionary--1.3% | | | | |
| 500,900 | | Kingfisher PLC
|
| $
| 1,878,672
|
|
| | | Consumer Staples--18.7% | | | | |
| 127,104 | | Boots Group PLC, ADR
| | | 2,796,288 | |
| 46,174 | | British American Tobacco PLC, ADR
| | | 2,034,888 | |
| 57,600 | | Diageo PLC, ADR
| | | 3,423,168 | |
| 93,900 | | Heinz (H.J.) Co.
| | | 3,333,450 | |
| 73,622 | | Loews Corp.
| | | 3,029,545 | |
| 36,683 | | Reynolds American, Inc.
| | | 3,118,055 | |
| 440,800 | | Scottish & Newcastle PLC
| | | 3,645,834 | |
| 80,187 | | UST, Inc.
| | | 3,318,940 | |
| 76,724 | | Unilever PLC, ADR
|
|
| 3,114,994
|
|
| | | TOTAL
|
|
| 27,815,162
|
|
| | | Energy--1.1% | | | | |
| 27,725 | 1 | Royal Dutch Shell PLC, Class A, ADR
|
|
| 1,720,059
|
|
| | | Financials--38.3% | | | | |
| 124,200 | | Amsouth Bancorporation
| | | 3,133,566 | |
| 31,157 | | Arden Realty Group, Inc.
| | | 1,406,427 | |
| 283,700 | | Barclays PLC
| | | 2,810,757 | |
| 38,910 | | CarrAmerica Realty Corp.
| | | 1,281,306 | |
| 49,596 | | Colonial Properties Trust
| | | 2,167,841 | |
| 53,302 | | Duke Realty Corp.
| | | 1,817,598 | |
| 100,440 | | Equity Office Properties Trust
| | | 3,093,552 | |
| 77,000 | | First Horizon National Corp.
| | | 2,978,360 | |
| 45,285 | | First Industrial Realty Trust
| | | 1,839,930 | |
| 175,064 | | HRPT Properties Trust
| | | 1,909,948 | |
| 74,084 | | Health Care Property Investors, Inc.
| | | 1,885,438 | |
| 77,107 | | Health Care REIT, Inc.
| | | 2,717,251 | |
| 58,391 | | Healthcare Realty Trust, Inc.
| | | 2,209,515 | |
| 33,427 | | Heritage Property Investment
| | | 1,089,720 | |
| 38,923 | | Hospitality Properties Trust
| | | 1,545,243 | |
Shares
|
|
|
|
| Value
|
|
| | | COMMON STOCKS--continued | | | | |
| | | Financials--continued | | | | |
| 69,200 | | ING Groep NV, ADR
| | $ | 1,997,112 | |
| 89,300 | | KeyCorp
| | | 2,879,032 | |
| 41,322 | | Liberty Property Trust
| | | 1,722,714 | |
| 410,100 | | Lloyds TSB Group PLC
| | | 3,362,071 | |
| 85,776 | | National City Corp.
| | | 2,764,561 | |
| 69,507 | | Nationwide Health Properties, Inc.
| | | 1,611,867 | |
| 48,167 | | PNC Financial Services Group
| | | 2,924,219 | |
| 93,534 | | Senior Housing Properties Trust
| | | 1,656,487 | |
| 107,600 | | U.S. Bancorp
| | | 3,182,808 | |
| 75,183 | | Washington Mutual Bank
|
|
| 2,977,247
|
|
| | | TOTAL
|
|
| 56,964,570
|
|
| | | Industrials--1.6% | | | | |
| 223,225 | | BAA PLC, ADR
|
|
| 2,427,572
|
|
| | | Materials--5.3% | | | | |
| 75,000 | | Du Pont (E.I.) de Nemours & Co.
| | | 3,126,750 | |
| 150,033 | | Packaging Corp. of America
| | | 3,044,170 | |
| 89,448 | | UPM - Kymmene Oyj, ADR
|
|
| 1,729,924
|
|
| | | TOTAL
|
|
| 7,900,844
|
|
| | | Telecommunication Services--11.3% | | | | |
| 136,899 | | BCE, Inc.
| | | 3,388,251 | |
| 113,700 | | BellSouth Corp.
| | | 2,958,474 | |
| 151,200 | | SBC Communications, Inc.
| | | 3,606,120 | |
| 777,500 | | Telecom Corp. of New Zealand
| | | 3,181,061 | |
| 116,300 | | Verizon Communications
|
|
| 3,664,613
|
|
| | | TOTAL
|
|
| 16,798,519
|
|
| | | Utilities--19.3% | | | | |
| 43,391 | | Ameren Corp.
| | | 2,282,367 | |
| 23,449 | | Cinergy Corp.
| | | 935,615 | |
| 37,838 | | Consolidated Edison Co.
| | | 1,721,629 | |
| 62,922 | | KeySpan Corp.
| | | 2,175,214 | |
| 52,591 | | NICOR, Inc.
| | | 2,061,567 | |
| 62,474 | | NiSource, Inc.
| | | 1,477,510 | |
| 56,560 | | OGE Energy Corp.
| | | 1,456,986 | |
| 86,067 | | Peoples Energy Corp.
| | | 3,201,692 | |
Shares or
Principal
Amount
|
|
|
|
| Value
|
|
| | | COMMON STOCKS--continued | | | | |
| | | Utilities--continued | | | | |
| 71,758 | | Pepco Holdings, Inc.
| | $ | 1,542,080 | |
| 60,932 | | Pinnacle West Capital Corp.
| | | 2,544,520 | |
| 48,500 | | Progress Energy, Inc.
| | | 2,114,115 | |
| 53,242 | | Scottish Power PLC, ADR
| | | 2,081,762 | |
| 22,638 | | Southern Co.
| | | 792,104 | |
| 150,885 | | United Utilities PLC, ADR
| | | 3,376,806 | |
| 53,610 | | Xcel Energy, Inc.
|
|
| 982,671
|
|
| | | TOTAL
|
|
| 28,746,638
|
|
| | | TOTAL COMMON STOCKS (IDENTIFIED COST $144,397,947)
|
|
| 144,252,036
|
|
| | | REPURCHASE AGREEMENTS--3.2% | | | | |
| $ | 2,688,000 | | Interest in $3,500,000,000 joint repurchase agreement 4.04%, dated 10/31/2005, under which Bank of America N.A. will repurchase a U.S. Government Agency security with a maturity of 7/1/2035 for $3,500,392, 778 on 11/1/2005. The market value of the underlying security at the end of the period was $3,570,000,001.
| | | 2,688,000 | |
| 2,000,000 | | Interest in $1,500,000,000 joint repurchase agreement 4.04%, dated 10/31/2005, under which Barclays Capital, Inc. will repurchase a U.S. Government Agency securities with various maturities to 9/29/2025 for $1,500,168,333 on 11/1/2005. The market value of the underlying securities at the end of the period was $1,530,172,587.
|
|
| 2,000,000
|
|
| | | TOTAL REPURCHASE AGREEMENTS (AT AMORTIZED COST)
|
|
| 4,688,000
|
|
| | | TOTAL INVESTMENTS--100.1%
(IDENTIFIED COST $149,085,947)2
|
|
| 148,940,036
|
|
| | | OTHER ASSETS AND LIABILITIES - NET--(0.1)%
|
|
| (149,120
| )
|
| | | TOTAL NET ASSETS--100%
|
| $
| 148,790,916
|
|
1 Non-income producing security.
2 The cost of investments for federal tax purposes amounts to $149,085,947.
Note: The categories of investments are shown as a percentage of total net assets at October 31, 2005.
The following acronyms are used throughout this portfolio:
| ADR | - --American Depositary Receipt |
| REIT | - --Real Estate Investment Trust |
See Notes which are an integral part of the Financial Statements
Statement of Assets and Liabilities
October 31, 2005
Assets:
| | | | | | | |
Total investments in securities, at value (identified cost $149,085,947)
| | | | | $ | 148,940,036 | |
Cash
| | | | | | 4,352 | |
Income receivable
| | | | | | 354,569 | |
Receivable for investments sold
| | | | | | 45,841 | |
Receivable for shares sold
|
|
|
|
|
| 3,258,686
|
|
TOTAL ASSETS
|
|
|
|
|
| 152,603,484
|
|
Liabilities:
| | | | | | | |
Payable for investments purchased
| | $ | 3,573,610 | | | | |
Payable for shares redeemed
| | | 145,025 | | | | |
Payable for distribution services fee (Note 5)
| | | 13,676 | | | | |
Payable for shareholder services fee (Note 5)
| | | 21,023 | | | | |
Accrued expenses
|
|
| 59,234
|
|
|
|
|
TOTAL LIABILITIES
|
|
|
|
|
| 3,812,568
|
|
Net assets for 28,561,722 shares outstanding
|
|
|
|
| $
| 148,790,916
|
|
Net Assets Consist of:
| | | | | | | |
Paid-in capital
| | | | | $ | 148,340,341 | |
Net unrealized depreciation of investments and translation of assets and liabilities in foreign currency
| |
| | | | (144,002 | ) |
Accumulated net realized gain on investments and foreign currency transactions
| | | | | | 519,464 | |
Undistributed net investment income
|
|
|
|
|
| 75,113
|
|
TOTAL NET ASSETS
|
|
|
|
| $
| 148,790,916
|
|
Net Asset Value, Offering Price and Redemption Proceeds Per Share
| | | | | | | |
Institutional Shares:
| | | | | | | |
Net asset value per share ($21,698,278 ÷ 4,159,949 shares outstanding), no par value, unlimited shares authorized
|
|
|
|
|
| $5.22
|
|
Offering price per share
|
|
|
|
|
| $5.22
|
|
Redemption proceeds per share
|
|
|
|
|
| $5.22
|
|
Class A Shares:
| | | | | | | |
Net asset value per share ($103,674,470 ÷ 19,912,857 shares outstanding), no par value, unlimited shares authorized
|
|
|
|
|
| $5.21
|
|
Offering price per share (100/94.50 of $5.21)1
|
|
|
|
|
| $5.51
|
|
Redemption proceeds per share
|
|
|
|
|
| $5.21
|
|
Class C Shares:
| | | | | | | |
Net asset value per share ($23,418,168 ÷ 4,488,916 shares outstanding), no par value, unlimited shares authorized
|
|
|
|
|
| $5.22
|
|
Offering price per share (100/99.00 of $5.22)1
|
|
|
|
|
| $5.27
|
|
Redemption proceeds per share
|
|
|
|
|
| $5.22
|
|
1 See "What Do Shares Cost?" in the Prospectus.
See Notes which are an integral part of the Financial Statements
Statement of Operations
For the Period From March 30, 2005 to October 31, 2005
Investment Income:
| | | | | | | | | | | | |
Dividends (net of foreign taxes withheld of $21,415)
| | | | | | | | | | $ | 1,496,442 | |
Interest
|
|
|
|
|
|
|
|
|
|
| 76,021
|
|
TOTAL INCOME
|
|
|
|
|
|
|
|
|
|
| 1,572,463
|
|
Expenses:
| | | | | | | | | | | | |
Investment adviser fee (Note 5)
| | | | | | $ | 262,459 | | | | | |
Administrative personnel and services fee (Note 5)
| | | | | | | 136,110 | | | | | |
Custodian fees
| | | | | | | 24,366 | | | | | |
Transfer and dividend disbursing agent fees and expenses
| | | | | | | 33,000 | | | | | |
Auditing fees
| | | | | | | 13,894 | | | | | |
Legal fees
| | | | | | | 3,028 | | | | | |
Portfolio accounting fees
| | | | | | | 20,454 | | | | | |
Distribution services fee--Class C Shares (Note 5)
| | | | | | | 50,563 | | | | | |
Shareholder services fee--Class A Shares (Note 5)
| | | | | | | 51,309 | | | | | |
Shareholder services fee--Class C Shares (Note 5)
| | | | | | | 16,800 | | | | | |
Share registration costs
| | | | | | | 73,914 | | | | | |
Printing and postage
| | | | | | | 10,732 | | | | | |
Insurance premiums
| | | | | | | 9,200 | | | | | |
Miscellaneous
|
|
|
|
|
|
| 1,752
|
|
|
|
|
|
TOTAL EXPENSES
|
|
|
|
|
|
| 707,581
|
|
|
|
|
|
Waivers and Reimbursement (Note 5):
| | | | | | | | | | | | |
Waiver of investment adviser fee
| | $ | (262,459 | ) | | | | | | | | |
Waiver of administrative personnel and services fee
| | | (58,231 | ) | | | | | | | | |
Reimbursement of other operating expenses
|
|
| (191,099
| )
|
|
|
|
|
|
|
|
|
TOTAL WAIVERS AND REIMBURSEMENT
|
|
|
|
|
|
| (511,789
| )
|
|
|
|
|
Net expenses
|
|
|
|
|
|
|
|
|
|
| 195,792
|
|
Net investment income
|
|
|
|
|
|
|
|
|
|
| 1,376,671
|
|
Realized and Unrealized Gain (Loss) on Investments:
| | | | | | | | | | | | |
Net realized gain on investments and foreign currency transactions
|
|
|
|
|
|
|
|
|
|
| 532,650
|
|
Net change in unrealized appreciation (depreciation) of investments and translation of assets and liabilities in foreign currency
|
|
|
|
|
|
|
|
|
|
|
(144,002
| )
|
Net realized and unrealized gain on investments and foreign currency
|
|
|
|
|
|
|
|
|
|
| 388,648
|
|
Change in net assets resulting from operations
|
|
|
|
|
|
|
|
|
| $
| 1,765,319
|
|
See Notes which are an integral part of the Financial Statements
Statement of Changes in Net Assets
Period Ended October 31
|
|
2005
| 1
|
Increase (Decrease) in Net Assets
| | | | |
Operations:
| | | | |
Net investment income
| | $ | 1,376,671 | |
Net realized gain on investments and foreign currency transactions
| | | 532,650 | |
Net change in unrealized appreciation/depreciation of investments and translation of assets and liabilities in foreign currency
|
|
| (144,002
| )
|
CHANGE IN NET ASSETS RESULTING FROM OPERATIONS
|
|
| 1,765,319
|
|
Distributions to Shareholders:
| | | | |
Distributions from net investment income
| | | | |
Institutional Shares
| | | (293,527 | ) |
Class A Shares
| | | (820,805 | ) |
Class C Shares
|
|
| (200,412
| )
|
CHANGE IN NET ASSETS RESULTING FROM DISTRIBUTIONS TO SHAREHOLDERS
|
|
| (1,314,744
| )
|
Share Transactions:
| | | | |
Proceeds from sale of shares
| | | 151,066,487 | |
Net asset value of shares issued to shareholders in payment of distributions declared
| | | 821,855 | |
Cost of shares redeemed
|
|
| (3,548,001
| )
|
CHANGE IN NET ASSETS RESULTING FROM SHARE TRANSACTIONS
|
|
| 148,340,341
|
|
Change in net assets
|
|
| 148,790,916
|
|
Net Assets:
| | | | |
Beginning of period
|
|
| - --
|
|
End of period (including undistributed net investment income of $75,113)
|
| $
| 148,790,916
|
|
1 For the period from March 30, 2005 (date of initial public investment) to October 31, 2005.
See Notes which are an integral part of the Financial Statements
Notes to Financial Statements
October 31, 2005
1. ORGANIZATION
Federated Equity Funds (the "Trust") is registered under the Investment Company Act of 1940, as amended (the "Act"), as an open-end management investment company. The Trust consists of eight portfolios. The financial statements included herein are only those of Federated Strategic Value Fund (the "Fund"), a diversified portfolio. The financial statements of the other portfolios are presented separately. The assets of each portfolio are segregated and a shareholder's interest is limited to the portfolio in which shares are held. The Fund offers three classes of shares: Institutional Shares, Class A Shares and Class C Shares. All shares of the Fund have equal rights with respect to voting, except on class-specific matters. The primary investment objective of the Fund is to provide income and long-term capital appreciation.
Effective March 30, 2005, the Fund began offering Institutional Shares, Class A Shares, and Class C Shares.
2. SIGNIFICANT ACCOUNTING POLICIES
The following is a summary of significant accounting policies consistently followed by the Fund in the preparation of its financial statements. These policies are in conformity with generally accepted accounting principles (GAAP) in the United States of America.
Investment Valuation
Domestic and foreign equity securities are valued at the last sale price or official closing price reported in the market in which they are primarily traded (either a national securities exchange or the over-the-counter market), if available. If unavailable, the security is generally valued at the mean between the last closing bid and asked prices. With respect to valuation of foreign securities, trading in foreign cities may be completed at times which vary from the closing of the New York Stock Exchange (NYSE). Therefore, foreign securities are valued at the latest closing price on the exchange on which they are traded immediately prior to the closing of the NYSE. Foreign securities quoted in foreign currencies are translated into U.S. dollars at the foreign exchange rate in effect at 4:00 p.m., Eastern Time, on the day the value of the foreign security is determined. The Fund generally values fixed income and short-term securities according to prices furnished by an independent pricing service, except that securities with remaining maturities of less than 60 days at the time of purchase may be valued at amortized cost. Prices furnished by an independent pricing service are intended to be indicative of the mean between the bid and asked prices currently offered to institutional investors for the securities. Investments in other open-end registered investment companies are valued at net asset value. Securities for which no quotations are readily available or whose values have been affected by a significant event occurring between the close of their primary markets and the closing of the NYSE are valued at fair value as determined in accordance with procedures established by and under general supervision of the Board of Trustees (the "Trustees").
Repurchase Agreements
It is the policy of the Fund to require the custodian bank or broker to take possession, to have legally segregated in the Federal Reserve Book Entry System, or to have segregated within the custodian bank's vault, all securities held as collateral under repurchase agreement transactions. Additionally, procedures have been established by the Fund to monitor, on a daily basis, the market value of each repurchase agreement's collateral to ensure that the value of the collateral at least equals the repurchase price to be paid under the repurchase agreement.
The Fund will only enter into repurchase agreements with banks and other recognized financial institutions, such as broker/dealers, which are deemed by the Fund's adviser to be creditworthy pursuant to the guidelines and/or standards reviewed or established by the Trustees. Risks may arise from the potential inability of counterparties to honor the terms of the repurchase agreement. The Fund, along with other affiliated investment companies, may utilize a joint trading account for the purpose of entering into one or more repurchase agreements.
Investment Income, Gains and Losses, Expenses, and Distributions
Interest income and expenses are accrued daily. Dividend income and distributions to shareholders are recorded on the ex-dividend date. Distributions of net investment income are declared and paid quarterly. Non-cash dividends included in dividend income, if any, are recorded at fair value. Investment income, realized and unrealized gains and losses, and certain fund-level expenses are allocated to each class based on relative average daily net assets, except that each class bears certain expenses unique to that class such as distribution and shareholder services fees. Dividends are declared separately for each class. No class has preferential dividend rights; differences in per share dividend rates are generally due to differences in separate class expenses.
Premium and Discount Amortization
All premiums and discounts on fixed-income securities are amortized/accreted for financial statement purposes.
Federal Taxes
It is the Fund's policy to comply with the Subchapter M provision of the Internal Revenue Code (the "Code") and to distribute to shareholders each year substantially all of its income. Accordingly, no provision for federal income tax is necessary.
Withholding taxes, and where appropriate, deferred withholding taxes, on foreign interest, dividends, and capital gains have been provided for in accordance with the applicable country's tax rules and rates.
When-Issued and Delayed Delivery Transactions
The Fund may engage in when-issued or delayed delivery transactions. The Fund records when-issued securities on the trade date and maintains security positions such that sufficient liquid assets will be available to make payment for the securities purchased. Securities purchased on a when-issued or delayed delivery basis are marked to market daily and begin earning interest on the settlement date. Losses may occur on these transactions due to changes in market conditions or the failure of counterparties to perform under the contract.
Foreign Currency Translation
The accounting records of the Fund are maintained in U.S. dollars. All assets and liabilities denominated in foreign currencies (FCs) are translated into U.S. dollars based on the rates of exchange of such currencies against U.S. dollars on the date of valuation. Purchases and sales of securities, income and expenses are translated at the rate of exchange quoted on the respective date that such transactions are recorded. The Fund does not isolate that portion of the results of operations resulting from changes in foreign exchange rates on investments from the fluctuations arising from changes in market prices of securities held. Such fluctuations are included with the net realized and unrealized gain or loss from investments.
Reported net realized foreign exchange gains or losses arise from sales of portfolio securities, sales and maturities of short-term securities, sales of FCs, currency gains or losses realized between the trade and settlement dates on securities transactions, the difference between the amounts of dividends, interest and foreign withholding taxes recorded on the Fund's books, and the U.S. dollar equivalent of the amounts actually received or paid. Net unrealized foreign exchange gains and losses arise from changes in the value of assets and liabilities other than investments in securities at fiscal year end, resulting from changes in the exchange rate.
Use of Estimates
The preparation of financial statements in conformity with GAAP requires management to make estimates and assumptions that affect the amounts of assets, liabilities, expenses and revenues reported in the financial statements. Actual results could differ from those estimated.
Other
Investment transactions are accounted for on a trade date basis. Realized gains and losses from investment transactions are recorded on an identified cost basis.
3. SHARES OF BENEFICIAL INTEREST
The following tables summarize share activity:
Period Ended October 31
|
| 20051
|
|
Institutional Shares:
|
| Shares
|
|
|
| Amount
|
|
Shares sold
| | 4,245,888 | | | $ | 22,063,743 | |
Shares issued to shareholders in payment of distributions declared
| | 6,503 | | | | 34,129 | |
Shares redeemed
|
| (92,442
| )
|
|
| (490,947
| )
|
NET CHANGE RESULTING FROM INSTITUTIONAL SHARE TRANSACTIONS
|
| 4,159,949
|
|
|
$
| 21,606,925
|
|
| | | | | | | |
Period Ended October 31
|
| 20051
|
|
Class A Shares:
|
| Shares
|
|
|
| Amount
|
|
Shares sold
| | 20,304,382 | | | $ | 105,293,670 | |
Shares issued to shareholders in payment of distributions declared
| | 123,492 | | | | 644,306 | |
Shares redeemed
|
| (515,017
| )
|
|
| (2,680,511
| )
|
NET CHANGE RESULTING FROM CLASS A SHARE TRANSACTIONS
|
| 19,912,857
|
|
| $
| 103,257,465
|
|
| | | | | | | |
Period Ended October 31
|
| 20051
|
|
Class C Shares:
|
| Shares
|
|
|
| Amount
|
|
Shares sold
| | 4,533,193 | | | $ | 23,709,074 | |
Shares issued to shareholders in payment of distributions declared
| | 27,325 | | | | 143,420 | |
Shares redeemed
|
| (71,602
| )
|
|
| (376,543
| )
|
NET CHANGE RESULTING FROM CLASS C SHARE TRANSACTIONS
|
| 4,488,916
|
|
| $
| 23,475,951
|
|
NET CHANGE RESULTING FROM SHARE TRANSACTIONS
|
| 28,561,722
|
|
| $
| 148,340,341
|
|
1 For the period from March 30, 2005 (date of initial public investment) to October 31, 2005.
4. FEDERAL TAX INFORMATION
The timing and character of income and capital gain distributions are determined in accordance with income tax regulations, which may differ from GAAP. These differences are due to differing treatments for foreign currency transactions.
For the year ended October 31, 2005, permanent differences identified and reclassified among the components of net assets were as follows:
Increase (Decrease)
|
Undistributed
Net Investment
Income (Loss)
|
| Accumulated
Net Realized
Gains (Losses)
|
$13,186
|
| $(13,186)
|
Net investment income (loss), net realized gains (losses), and net assets were not affected by this reclassification.
The tax character of distributions as reported on the Statement of Changes in Net Assets for the period ended October 31, 2005, was as follows:
|
| 2005
|
Ordinary income1
|
| $1,314,744
|
1 For tax purposes short-term capital gain distributions are considered ordinary income distributions.
As of October 31, 2005, the components of distributable earnings on a tax basis were as follows:
Undistributed ordinary income
|
| $
| 594,576
|
|
Net unrealized depreciation
|
| $
| (145,911
| )
|
At October 31, 2005, the cost of investments for federal tax purposes was $149,085,947. The net unrealized depreciation of investments for federal tax was $145,911. This consists of net unrealized appreciation from investments for those securities having an excess of value over cost of $2,436,639 and net unrealized depreciation from investments for those securities having an excess of cost over value of $2,582,550.
5. INVESTMENT ADVISER FEE AND OTHER TRANSACTIONS WITH AFFILIATES
Investment Adviser Fee
Federated Equity Management Company of Pennsylvania, the Fund's investment adviser (the "Adviser"), receives for its services an annual investment adviser fee equal to 0.750% of the Fund's average daily net assets. The Adviser may voluntarily choose to waive any portion of its fee and/or reimburse certain operating expenses of the Fund. The Adviser can modify or terminate this voluntary waiver and/or reimbursement at any time at its sole discretion. For the period ended October 31, 2005, the Adviser voluntarily waived $262,459 of its fee and reimbursed $191,099 of other operating expenses.
Administrative Fee
Federated Administrative Services (FAS), under the Administrative Services Agreement, provides the Fund with administrative personnel and services. The fee paid to FAS is based on the average aggregate daily net assets of all Federated funds as specified below:
Maximum
Administrative Fee
|
| Average Aggregate Daily Net Assets
of the Federated Funds
|
0.150%
|
| on the first $5 billion
|
0.125%
|
| on the next $5 billion
|
0.100%
|
| on the next $10 billion
|
0.075%
|
| on assets in excess of $20 billion
|
The administrative fee received during any fiscal year shall be at least $150,000 per portfolio and $40,000 per each additional class of Shares. FAS may voluntarily choose to waive any portion of its fee. FAS can modify or terminate this voluntary waiver at any time at its sole discretion. For the period ended October 31, 2005, the net fee paid to FAS was 0.22% of average aggregate daily net assets of the Fund.
Distribution Services Fee
The Fund has adopted a Distribution Plan (the "Plan") pursuant to Rule 12b-1 under the Act. Under the terms of the Plan, the Fund will compensate Federated Securities Corp. (FSC), the principal distributor, from the daily net assets of the Fund's Class A Shares and Class C Shares to finance activities intended to result in the sale of these shares. The Plan provides that the Fund may incur distribution expenses according to the following schedule annually to compensate FSC.
Share Class Name
|
| Percentage of Average Daily
Net Assets of Class
|
Class A Shares
|
| 0.25%
|
Class C Shares
|
| 0.75%
|
FSC may voluntarily choose to waive any portion of its fee. FSC can modify or terminate this voluntary waiver at any time at its sole discretion. Rather than paying financial intermediaries directly, the Fund may pay fees to FSC and FSC will use the fees to compensate financial intermediaries. For the period ended October 31, 2005, FSC retained $39,992 of fees paid by the Fund.
For the period ended October 31, 2005, Class A Shares did not incur a distribution services fee.
Sales Charges
For the period ended October 31, 2005, FSC, the principal distributor, retained $154,779 in sales charges from the sale of Class A Shares. See "What Do Shares Cost?" in the Prospectus.
Shareholder Services Fee
The Fund may pay fees (Services Fees) up to 0.25% of the average daily net assets of the Fund's Class A Shares and Class C Shares to financial intermediaries or to Federated Shareholder Services Company (FSSC), a subsidiary of Federated Investors, Inc., for providing services to shareholders and maintaining shareholder accounts. Under certain agreements, rather than paying financial intermediaries directly, the Fund may pay Service Fees to FSSC and FSSC will use the fees to compensate financial intermediaries. FSSC or these financial intermediaries may voluntarily choose to waive any portion of their fee. This voluntary waiver can be modified or terminated at any time. For the period ended October 31, 2005, FSSC retained $2,640 of fees paid by the Fund.
General
Certain of the Officers and Trustees of the Fund are Officers and Directors or Trustees of the above companies.
6. INVESTMENT TRANSACTIONS
Purchases and sales of investments, excluding long-term U.S. government securities and short-term obligations, for the period ended October 31, 2005, were as follows:
Purchases
|
| $
| 153,707,870
|
Sales
|
| $
| 9,698,385
|
7. LEGAL PROCEEDINGS
Beginning in October 2003, Federated Investors, Inc. and various subsidiaries thereof (including the advisers and distributor for various investment companies, collectively, "Federated"), along with various investment companies sponsored by Federated ("Funds") were named as defendants in several class action lawsuits now pending in the United States District Court for the District of Maryland. The lawsuits were purportedly filed on behalf of people who purchased, owned and/or redeemed shares of Federated-sponsored mutual funds during specified periods beginning November 1, 1998. The suits are generally similar in alleging that Federated engaged in illegal and improper trading practices including market timing and late trading in concert with certain institutional traders, which allegedly caused financial injury to the mutual fund shareholders. These lawsuits began to be filed shortly after Federated's first public announcement that it had received requests for information on shareholder trading activities in the Funds from the Securities and Exchange Commission ("SEC"), the Office of the New York State Attorney General ("NYAG"), and other authorities. In that regard, on November 28, 2005, Federated announced that it had reached final settlements with the SEC and the NYAG with respect to those matters. As Federated previously reported in 2004, it has already paid approximately $8.0 million to certain funds as determined by an independent consultant. As part of these settlements, Federated agreed to pay for the benefit of fund shareholders additional disgorgement and a civil money penalty in the aggregate amount of an additional $72 million. Federated and various Funds have also been named as defendants in several additional lawsuits, the majority of which are now pending in the United States District Court for the Western District of Pennsylvania, alleging, among other things, excessive advisory and rule 12b-1 fees. The Board of the Funds has retained the law firm of Dickstein Shapiro Morin & Oshinsky LLP to represent the Funds in these lawsuits. Federated and the Funds, and their respective counsel, are reviewing the allegations and will respond appropriately. Additional lawsuits based upon similar allegations may be filed in the future. The potential impact of these lawsuits, all of which seek unquantified damages, attorneys' fees and expenses, and future potential similar suits is uncertain. Although we do not believe that these lawsuits will have a material adverse effect on the Funds, there can be no assurance that these suits, the ongoing adverse publicity and/or other developments resulting from the regulatory investigations will not result in increased Fund redemptions, reduced sales of Fund shares, or other adverse consequences for the Funds.
8. FEDERAL TAX INFORMATION (UNAUDITED)
For the fiscal year ended October 31, 2005, 84.5% of total income (including short-term capital gains) distributions made by the Fund are qualifying dividends which may be subject to a maximum tax rate of 15%, as provided for by the Jobs and Growth Tax Relief Act of 2003. Complete information is reported in conjunction with the reporting of your distributions on Form 1099-DIV.
Of the ordinary income (including short-term capital gain) distributions made by the Fund during the year ended October 31, 2005, 58.0% qualify for the dividend received deduction available to corporate shareholders.
Report of Independent Registered Public Accounting Firm
TO THE BOARD OF TRUSTEES OF FEDERATED EQUITY FUNDS AND SHAREHOLDERS OF FEDERATED STRATEGIC VALUE FUND:
We have audited the accompanying statement of assets and liabilities, including the portfolio of investments, of Federated Strategic Value Fund (one of the portfolios constituting Federated Equity Funds), (the "Fund"), as of October 31, 2005, and the related statement of operations, the statement of changes in net assets and the financial highlights for the period from March 30, 2005 (initial public investment) through October 31, 2005. These financial statements and financial highlights are the responsibility of the Fund's management. Our responsibility is to express an opinion on these financial statements and financial highlights based on our audits.
We conducted our audits in accordance with the standards of the Public Company Accounting Oversight Board (United States). Those standards require that we plan and perform the audit to obtain reasonable assurance about whether the financial statements and financial highlights are free of material misstatement. We were not engaged to perform an audit of the Fund's internal control over financial reporting. Our audits included consideration of internal control over financial reporting as a basis for designing audit procedures that are appropriate in the circumstances, but not for the purpose of expressing an opinion on the effectiveness of the Fund's internal control over financial reporting. Accordingly, we express no such opinion. An audit also includes examining, on a test basis, evidence supporting the amounts and disclosures in the financial statements and financial highlights, assessing the accounting principles used and significant estimates made by management, and evaluating the overall financial statement presentation. Our procedures included confirmation of securities owned as of October 31, 2005, by correspondence with the custodian and brokers, or by other appropriate auditing procedures where replies from brokers were not received. We believe that our audits provide a reasonable basis for our opinion.
In our opinion, the financial statements and financial highlights referred to above present fairly, in all material respects, the financial position of the Federated Strategic Value Fund of Federated Equity Funds at October 31, 2005, the results of its operations, changes in its net assets and the financial highlights for the period from March 30, 2005 (initial public investment) through October 31, 2005, in conformity with U.S. generally accepted accounting principles.
Ernst & Young LLP
Boston, Massachusetts
December 12, 2005
Board of Trustees and Trust Officers
The Board is responsible for managing the Trust's business affairs and for exercising all the Trust's powers except those reserved for the shareholders. The following tables give information about each Board member and the senior officers of the Fund. Where required, the tables separately list Board members who are "interested persons" of the Fund (i.e., "Interested" Board members) and those who are not (i.e., "Independent" Board members). Unless otherwise noted, the address of each person listed is Federated Investors Tower, 1001 Liberty Avenue, Pittsburgh, PA. As of December 31, 2004, the Trust comprised eight portfolios, and the Federated Fund Complex consisted of 44 investment companies (comprising 133 portfolios). Unless otherwise noted, each Officer is elected annually. Unless otherwise noted, each Board member oversees all portfolios in the Federated Fund Complex and serves for an indefinite term. The Fund's Statement of Additional Information includes additional information about Trust Trustees and is available, without charge and upon request, by calling 1-800-341-7400.
INTERESTED TRUSTEES BACKGROUND
|
|
|
Name
Birth Date
Address
Positions Held with Trust
Date Service Began
|
| Principal Occupation(s) for Past Five Years, Other Directorships Held and Previous Position(s)
|
John F. Donahue*
Birth Date: July 28, 1924
CHAIRMAN AND TRUSTEE
Began serving: April 1984 | | Principal Occupations: Chairman and Director or Trustee of the Federated Fund Complex; Chairman and Director, Federated Investors, Inc.
Previous Positions: Trustee, Federated Investment Management Company and Chairman and Director, Federated Investment Counseling. |
|
|
|
J. Christopher Donahue*
Birth Date: April 11, 1949
PRESIDENT AND TRUSTEE
Began serving: January 2000 | | Principal Occupations: Principal Executive Officer and President of the Federated Fund Complex; Director or Trustee of some of the Funds in the Federated Fund Complex; President, Chief Executive Officer and Director, Federated Investors, Inc.; Chairman and Trustee, Federated Investment Management Company; Trustee, Federated Investment Counseling; Chairman and Director, Federated Global Investment Management Corp.; Chairman, Passport Research, Ltd.; Trustee, Federated Shareholder Services Company; Director, Federated Services Company.
Previous Positions: President, Federated Investment Counseling; President and Chief Executive Officer, Federated Investment Management Company, Federated Global Investment Management Corp. and Passport Research, Ltd. |
|
|
|
|
|
|
Name
Birth Date
Address
Positions Held with Trust
Date Service Began
|
| Principal Occupation(s) for Past Five Years, Other Directorships Held and Previous Position(s)
|
Lawrence D. Ellis, M.D.*
Birth Date: October 11, 1932
3471 Fifth Avenue
Suite 1111
Pittsburgh, PA
TRUSTEE
Began serving: August 1987 | | Principal Occupations: Director or Trustee of the Federated Fund Complex; Professor of Medicine, University of Pittsburgh; Medical Director, University of Pittsburgh Medical Center Downtown; Hematologist, Oncologist and Internist, University of Pittsburgh Medical Center.
Other Directorships Held: Member, National Board of Trustees, Leukemia Society of America.
Previous Positions: Trustee, University of Pittsburgh; Director, University of Pittsburgh Medical Center. |
|
|
|
* Family relationships and reasons for "interested" status: John F. Donahue is the father of J. Christopher Donahue; both are "interested" due to the positions they hold with Federated Investors, Inc. and its subsidiaries. Lawrence D. Ellis, M.D. is "interested" because his son-in-law is employed by the Fund's principal underwriter, Federated Securities Corp.
INDEPENDENT TRUSTEES BACKGROUND
|
|
|
Name
Birth Date
Address
Positions Held with Trust
Date Service Began
|
| Principal Occupation(s) for Past Five Years, Other Directorships Held and Previous Position(s)
|
Thomas G. Bigley
Birth Date: February 3, 1934
15 Old Timber Trail
Pittsburgh, PA
TRUSTEE
Began serving: October 1995 | | Principal Occupation: Director or Trustee of the Federated Fund Complex.
Other Directorships Held: Director, Member of Executive Committee, Children's Hospital of Pittsburgh; Director, University of Pittsburgh.
Previous Position: Senior Partner, Ernst & Young LLP. |
|
|
|
John T. Conroy, Jr.
Birth Date: June 23, 1937
Investment Properties Corporation
3838 North Tamiami Trail
Suite 402
Naples, FL
TRUSTEE
Began serving: November 1991 | | Principal Occupations: Director or Trustee of the Federated Fund Complex; Chairman of the Board, Investment Properties Corporation; Partner or Trustee in private real estate ventures in Southwest Florida.
Previous Positions: President, Investment Properties Corporation; Senior Vice President, John R. Wood and Associates, Inc., Realtors; President, Naples Property Management, Inc. and Northgate Village Development Corporation. |
|
|
|
Nicholas P. Constantakis
Birth Date: September 3, 1939
175 Woodshire Drive
Pittsburgh, PA
TRUSTEE
Began serving: February 1998 | | Principal Occupations: Director or Trustee of the Federated Fund Complex.
Other Directorships Held: Director and Member of the Audit Committee, Michael Baker Corporation (engineering and energy services worldwide).
Previous Position: Partner, Andersen Worldwide SC. |
|
|
|
|
|
|
Name
Birth Date
Address
Positions Held with Trust
Date Service Began
|
| Principal Occupation(s) for Past Five Years, Other Directorships Held and Previous Position(s)
|
John F. Cunningham
Birth Date: March 5, 1943
353 El Brillo Way
Palm Beach, FL
TRUSTEE
Began serving: January 1999 | | Principal Occupation: Director or Trustee of the Federated Fund Complex.
Other Directorships Held: Chairman, President and Chief Executive Officer, Cunningham & Co., Inc. (strategic business consulting); Trustee Associate, Boston College.
Previous Positions: Director, Redgate Communications and EMC Corporation (computer storage systems); Chairman of the Board and Chief Executive Officer, Computer Consoles, Inc.; President and Chief Operating Officer, Wang Laboratories; Director, First National Bank of Boston; Director, Apollo Computer, Inc. |
|
|
|
Peter E. Madden
Birth Date: March 16, 1942
One Royal Palm Way
100 Royal Palm Way
Palm Beach, FL
TRUSTEE
Began serving: November 1991 | | Principal Occupation: Director or Trustee of the Federated Fund Complex.
Other Directorships Held: Board of Overseers, Babson College.
Previous Positions: Representative, Commonwealth of Massachusetts General Court; President, State Street Bank and Trust Company and State Street Corporation (retired); Director, VISA USA and VISA International; Chairman and Director, Massachusetts Bankers Association; Director, Depository Trust Corporation; Director, The Boston Stock Exchange. |
|
|
|
Charles F. Mansfield, Jr.
Birth Date: April 10, 1945
80 South Road
Westhampton Beach, NY
TRUSTEE
Began serving: January 1999 | | Principal Occupations: Director or Trustee of the Federated Fund Complex; Management Consultant; Executive Vice President, DVC Group, Inc. (marketing communications and technology) (prior to 9/1/00).
Previous Positions: Chief Executive Officer, PBTC International Bank; Partner, Arthur Young & Company (now Ernst & Young LLP); Chief Financial Officer of Retail Banking Sector, Chase Manhattan Bank; Senior Vice President, HSBC Bank USA (formerly, Marine Midland Bank); Vice President, Citibank; Assistant Professor of Banking and Finance, Frank G. Zarb School of Business, Hofstra University. |
|
|
|
John E. Murray, Jr., J.D., S.J.D.
Birth Date: December 20, 1932
Chancellor, Duquesne University
Pittsburgh, PA
TRUSTEE
Began serving: February 1995 | | Principal Occupations: Director or Trustee of the Federated Fund Complex; Chancellor and Law Professor, Duquesne University; Partner, Murray, Hogue and Lannis.
Other Directorships Held: Director, Michael Baker Corp. (engineering, construction, operations and technical services).
Previous Positions: President, Duquesne University; Dean and Professor of Law, University of Pittsburgh School of Law; Dean and Professor of Law, Villanova University School of Law. |
|
|
|
|
|
|
Name
Birth Date
Address
Positions Held with Trust
Date Service Began
|
| Principal Occupation(s) for Past Five Years, Other Directorships Held and Previous Position(s)
|
Marjorie P. Smuts
Birth Date: June 21, 1935
4905 Bayard Street
Pittsburgh, PA
TRUSTEE
Began serving: April 1984 | | Principal Occupations: Director or Trustee of the Federated Fund Complex; Public Relations/Marketing Consultant/Conference Coordinator.
Previous Positions: National Spokesperson, Aluminum Company of America; television producer; President, Marj Palmer Assoc.; Owner, Scandia Bord. |
|
|
|
John S. Walsh
Birth Date: November 28, 1957
2604 William Drive
Valparaiso, IN
TRUSTEE
Began serving: January 1999 | | Principal Occupations: Director or Trustee of the Federated Fund Complex; President and Director, Heat Wagon, Inc. (manufacturer of construction temporary heaters); President and Director, Manufacturers Products, Inc. (distributor of portable construction heaters); President, Portable Heater Parts, a division of Manufacturers Products, Inc.
Previous Position: Vice President, Walsh & Kelly, Inc. |
|
|
|
OFFICERS
|
|
|
Name
Birth Date
Positions Held with Trust
Date Service Began
|
| Principal Occupation(s) for Past Five Years and Previous Position(s)
|
John W. McGonigle
Birth Date: October 26, 1938
EXECUTIVE VICE PRESIDENT
AND SECRETARY
Began serving: April 1984 | | Principal Occupations: Executive Vice President and Secretary of the Federated Fund Complex; Vice Chairman, Executive Vice President, Secretary and Director, Federated Investors, Inc.
Previous Positions: Trustee, Federated Investment Management Company and Federated Investment Counseling; Director, Federated Global Investment Management Corp., Federated Services Company and Federated Securities Corp. |
|
|
|
Richard J. Thomas
Birth Date: June 17, 1954
TREASURER
Began serving: November 1998 | | Principal Occupations: Principal Financial Officer and Treasurer of the Federated Fund Complex; Senior Vice President, Federated Administrative Services.
Previous Positions: Vice President, Federated Administrative Services; held various management positions within Funds Financial Services Division of Federated Investors, Inc. |
|
|
|
Richard B. Fisher
Birth Date: May 17, 1923
VICE PRESIDENT
Began serving: April 1984 | | Principal Occupations: Vice Chairman or Vice President of some of the Funds in the Federated Fund Complex; Vice Chairman, Federated Investors, Inc.; Chairman, Federated Securities Corp.
Previous Positions: President and Director or Trustee of some of the Funds in the Federated Fund Complex; Executive Vice President, Federated Investors, Inc. and Director and Chief Executive Officer, Federated Securities Corp. |
|
|
|
|
|
|
Name
Birth Date
Positions Held with Trust
Date Service Began
|
| Principal Occupation(s) for Past Five Years and Previous Position(s)
|
Stephen F. Auth
Birth Date: September 3, 1956
CHIEF INVESTMENT OFFICER
Began serving: November 2002 | | Principal Occupations: Chief Investment Officer of this Fund and various other Funds in the Federated Fund Complex; Executive Vice President, Federated Investment Counseling, Federated Global Investment Management Corp., Federated Equity Management Company of Pennsylvania and Passport Research II, Ltd.
Previous Positions: Executive Vice President, Federated Investment Management Company, and Passport Research, Ltd.; Senior Vice President, Global Portfolio Management Services Division; Senior Vice President, Federated Investment Management Company and Passport Research, Ltd.; Senior Managing Director and Portfolio Manager, Prudential Investments. |
|
|
|
Lawrence Auriana
Birth Date: January 8, 1944
VICE PRESIDENT
Began serving: November 2001 | | Lawrence Auriana is Vice President of the Trust. Mr. Auriana joined Federated in April 2001 as Co-Head of Investments/Federated Kaufmann. From August 1984 to April 2001, Mr. Auriana was President and Treasurer of Edgemont Asset Management Corp., and Chairman of the Board and Portfolio Manager to The Kaufmann Fund, Inc. (predecessor to the Federated Kaufmann Fund). Mr. Auriana earned a B.S. in economics from Fordham University and has been engaged in the securities business since 1965. |
|
|
|
James E. Grefenstette
Birth Date: November 7, 1962
VICE PRESIDENT
Began serving: November 1998 | | James E. Grefenstette is Vice President of the Trust. Mr. Grefenstette joined Federated in 1992 and has been a Portfolio Manager since 1994. Mr. Grefenstette became a Senior Vice President of the Fund's Adviser in January 2000. He served as a Vice President of the Fund's Adviser from 1996 through 1999 and was an Assistant Vice President of the Fund's Adviser from 1994 until 1996. Mr. Grefenstette is a Chartered Financial Analyst; he received his M.S. in Industrial Administration from Carnegie Mellon University. |
|
|
|
Hans P. Utsch
Birth Date: July 3, 1936
VICE PRESIDENT
Began serving: November 2001 | | Hans P. Utsch is Vice President of the Trust. Mr. Utsch joined Federated in April 2001 as Co-Head of Investments/Federated Kaufmann. From August 1984 to April 2001, Mr. Utsch was Chairman of the Board and Secretary of Edgemont Asset Management Corp., and President and Portfolio Manager to The Kaufmann Fund, Inc. (predecessor to the Federated Kaufmann Fund). Mr. Utsch graduated from Amherst College and holds an M.B.A. from Columbia University. He has been engaged in the securities business since 1962. |
|
|
|
Board Review of Advisory Contract
As required by the Act, the Fund's Board has reviewed the Fund's investment advisory contract. The Board's decision to approve the contract reflects the exercise of its business judgment on whether to authorize the creation and offering of this new product, as proposed by, and based on information provided by, the Federated organization, and based on Federated's recommendation to go forward with development of the Fund. During its review of the contract, the Board considered several factors, among the most material of which are: the Fund's proposed investment objectives and proposed investment program; the Adviser's management philosophy, investment and operating strategies, personnel, and processes to implement the proposed investment program; Federated's business rationale for proposing the creation of the Fund (including estimates for near-term growth of the Fund); the design and positioning of the Fund within Federated's overall product lineup; the continuing state of competition in the mutual fund industry; the range of comparable fees for similar funds in the mutual fund industry; the range and quality of services expected to be provided to the Fund and its shareholders by the Federated organization in addition to investment advisory services; and the Fund's relationship to the Federated family of funds.
The Board also considered the anticipated compensation and benefits to be received by the Adviser. This includes fees to be received for services provided to the Fund by other entities in the Federated organization and research services that may be received by the Adviser from brokers that execute fund trades, as well as advisory fees. In this regard, the Board is aware that various courts have interpreted provisions of the 1940 Act and have indicated in their decisions that the following factors may be relevant to an Adviser's fiduciary duty with respect to its receipt of compensation from a fund: the nature and quality of the services provided by the Adviser, including the performance of the fund; the Adviser's cost of providing the services; the extent to which the Adviser may realize "economies of scale" as the fund grows larger; any indirect benefits that may accrue to the Adviser and its affiliates as a result of the Adviser's relationship with the fund; performance and expenses of comparable funds; and the extent to which the independent Board members are fully informed about all facts bearing on the Adviser's service and fee. The Fund's Board is aware of these factors and is guided by them in its review of the Fund's advisory contract to the extent they are appropriate and relevant, as discussed further below. The Board considered and weighed these circumstances in light of its substantial accumulated experience in governing, and working with Federated on matters relating to, the Federated family of funds, and was assisted in its deliberations by the advice of independent legal counsel.
With respect to the Fund's proposed advisory fee, the Board has found the use of comparisons to other mutual funds with comparable investment programs to be particularly useful, given the high degree of competition in the mutual fund business. The Board focused on comparisons with other similar mutual funds (rather than non-mutual fund products or services) because, simply put, they are more relevant. For example, other mutual funds are the products most like the Fund, and they are readily available to potential investors in the Fund as alternative investment vehicles. The range of their fees therefore appears to be a generally reliable indication of what consumers have found to be reasonable in the precise marketplace in which the Fund would be competing.
Because the Board was considering the advisory contract in the context of Federated's proposal to create a new fund, the factors mentioned above relating to such matters as past fund performance, the Adviser's cost of providing services, the extent to which the Adviser may realize "economies of scale" as the Fund grows, and any indirect benefits that may accrue to the Adviser and its affiliates as a result of the Adviser's relationship with the Fund, are essentially impossible to apply before the Fund has experienced any meaningful operating history. Nevertheless, in connection with the Board's governance of other Federated funds, it should be noted that the Board regularly receives financial information about Federated, including reports on the compensation and benefits Federated derives from its relationships with the other Federated funds. These reports cover not only the fees under the advisory contracts, but also fees received by Federated's subsidiaries for providing other services to the Federated funds under separate contracts (e.g., for serving as the Federated funds' administrator). The reports also discuss any indirect benefit Federated may derive from its receipt of research services from brokers who execute Federated fund trades.
The Board based its decision to approve the advisory contract (and, thus, effectively to "select" the Adviser) on the totality of the circumstances and relevant factors, and with a view to past and future long-term considerations. As noted, not all of the factors and considerations identified above were relevant to the Fund, nor does the Board consider any one of them to be determinative. With respect to the factors that are relevant, the Board's decision to approve the contract reflects its determination that, based upon the information requested and supplied, Federated's proposal to establish and manage the Fund, and its past performance and actions in providing services to other mutual funds, provide a satisfactory basis to support the business decision to approve the proposed arrangements.
Voting Proxies on Fund Portfolio Securities
A description of the policies and procedures that the Fund uses to determine how to vote proxies, if any, relating to securities held in the Fund's portfolio is available, without charge and upon request, by calling 1-800-341-7400. A report on "Form N-PX" of how the Fund voted any such proxies during the most recent 12-month period ended June 30 is available through Federated's website. Go to FederatedInvestors.com, select "Products," select the "Prospectuses and Regulatory Reports" link, then select the Fund to access the link to Form N-PX. This information is also available from the EDGAR database on the SEC's website at www.sec.gov.
Quarterly Portfolio Schedule
The Fund files with the SEC a complete schedule of its portfolio holdings, as of the close of the first and third quarters of its fiscal year, on "Form N-Q." These filings are available on the SEC's website at www.sec.gov and may be reviewed and copied at the SEC's Public Reference Room in Washington, DC. (Call 1-800-SEC-0330 for information on the operation of the Public Reference Room.) You may also access this information from the "Products" section of the Federated Investors website at FederatedInvestors.com by clicking on "Portfolio Holdings" and selecting the name of the Fund, or by selecting the name of the Fund and clicking on "Portfolio Holdings." You must register on the website the first time you wish to access this information.
Mutual funds are not bank deposits or obligations, are not guaranteed by any bank, and are not insured or guaranteed by the U.S. government, the Federal Deposit Insurance Corporation, the Federal Reserve Board, or any other government agency. Investment in mutual funds involves investment risk, including the possible loss of principal.
This report is authorized for distribution to prospective investors only when preceded or accompanied by the Fund's prospectus, which contains facts concerning its objective and policies, management fees, expenses, and other information.
Federated
World-Class Investment Manager
Federated Strategic Value Fund
Federated Investors Funds
5800 Corporate Drive
Pittsburgh, PA 15237-7000
Contact us at FederatedInvestors.com
or call 1-800-341-7400.
Federated Securities Corp., Distributor
Cusip 314172586
Cusip 314172578
Cusip 314172560
33982 (12/05)
Federated is a registered mark of Federated Investors, Inc. 2005 (c)Federated Investors, Inc.
Item 2.     Code of Ethics

(a) As of the end of the period covered by this report, the registrant has
adopted a code of ethics (the "Section 406 Standards for Investment Companies -
Ethical Standards for Principal Executive and Financial Officers") that applies
to the registrant's Principal Executive Officer and Principal Financial Officer;
the registrant's Principal Financial Officer also serves as the Principal
Accounting Officer.

(c) Not Applicable

(d) Not Applicable

(e) Not Applicable

(f)(3) The registrant hereby undertakes to provide any person, without charge,
upon request, a copy of the code of ethics. To request a copy of the code of
ethics, contact the registrant at 1-800-341-7400, and ask for a copy of the
Section 406 Standards for Investment Companies - Ethical Standards for Principal
Executive and Financial Officers.


Item 3.     Audit Committee Financial Expert

The registrant's Board has determined that each member of the Board's Audit
Committee is an "audit committee financial expert," and that each such
member is "independent," for purposes of this Item.  The Audit Committee
consists of the following Board members:  Thomas G. Bigley, John T. Conroy,
Jr., Nicholas P. Constantakis and Charles F. Mansfield, Jr.


Item 4.     Principal Accountant Fees and Services


(a) Audit Fees billed to the registrant for the two most recent fiscal years:

                        Fiscal year ended 2005 - $216,645

                        Fiscal year ended 2004 - $156,906


(b) Audit-Related Fees billed to the registrant for the two most recent fiscal
years:

                  Fiscal year ended 2005 - $161

                        Fiscal year ended 2004 - $84,480

            Transfer agent testing and Transfer Agent Service Auditors
      Report respectively.

      Amount requiring approval of the registrant's audit committee pursuant to
      paragraph (c)(7)(ii) of Rule 2-01 of Regulation S-X, $140,866 and $150,068
      respectively. Fiscal year ended 2005 - Sarbanes Oxley sec. 302 procedures,
      Transfer Agent Service Auditors report and fees for review of N-14 merger
      documents.

      Fiscal year ended 2004- Attestation services relating to the review of
      fund share transactions, Transfer Agent Service Auditors report and fees
      for review of N-14 merger documents.


(c) Tax Fees billed to the registrant for the two most recent fiscal years:

                  Fiscal year ended 2005 - $0

                  Fiscal year ended 2004 - $0

      Amount requiring approval of the registrant's audit committee pursuant to
      paragraph (c)(7)(ii) of Rule 2-01 of Regulation S-X, $16,089 and $65,000
      respectively.

      Analysis regarding the realignment of advisory companies.


(d) All Other Fees billed to the registrant for the two most recent fiscal
years:

                  Fiscal year ended 2005 - $0

                  Fiscal year ended 2004 - $0

      Amount requiring approval of the registrant's audit committee pursuant to
      paragraph (c)(7)(ii) of Rule 2-01 of Regulation S-X, $28,462 and $100,531
      respectively. Fiscal year ended 2005-Discussions with auditors related to
      market timing and late trading activities and executive compensation
      analysis. Fiscal year ended 2004- Consultation regarding information
      request by regulatory agencies and executive compensation analysis.


(e)(1) Audit Committee Policies regarding Pre-approval of Services.

            The Audit Committee is required to pre-approve audit and non-audit
services performed by the independent auditor in order to assure that the
provision of such services do not impair the auditor's independence. Unless a
type of service to be provided by the independent auditor has received general
pre-approval, it will require specific pre-approval by the Audit Committee. Any
proposed services exceeding pre-approved cost levels will require specific
pre-approval by the Audit Committee.

            Certain services have the general pre-approval of the Audit
Committee. The term of the general pre-approval is 12 months from the date of
pre-approval, unless the Audit Committee specifically provides for a different
period. The Audit Committee will annually review the services that may be
provided by the independent auditor without obtaining specific pre-approval from
the Audit Committee and may grant general pre-approval for such services. The
Audit Committee will revise the list of general pre-approved services from time
to time, based on subsequent determinations. The Audit Committee will not
delegate its responsibilities to pre-approve services performed by the
independent auditor to management.

            The Audit Committee has delegated pre-approval authority to its
Chairman. The Chairman will report any pre-approval decisions to the Audit
Committee at its next scheduled meeting. The Committee will designate another
member with such pre-approval authority when the Chairman is unavailable.


AUDIT SERVICES

      The annual Audit services engagement terms and fees will be subject to the
specific pre-approval of the Audit Committee. The Audit Committee must approve
any changes in terms, conditions and fees resulting from changes in audit scope,
registered investment company (RIC) structure or other matters.

      In addition to the annual Audit services engagement specifically approved
by the Audit Committee, the Audit Committee may grant general pre-approval for
other Audit Services, which are those services that only the independent auditor
reasonably can provide. The Audit Committee has pre-approved certain Audit
services, all other Audit services must be specifically pre-approved by the
Audit Committee.


AUDIT-RELATED SERVICES

      Audit-related services are assurance and related services that are
reasonably related to the performance of the audit or review of the Company's
financial statements or that are traditionally performed by the independent
auditor. The Audit Committee believes that the provision of Audit-related
services does not impair the independence of the auditor, and has pre-approved
certain Audit-related services, all other Audit-related services must be
specifically pre-approved by the Audit Committee.


TAX SERVICES

      The Audit Committee believes that the independent auditor can provide Tax
services to the Company such as tax compliance, tax planning and tax advice
without impairing the auditor's independence. However, the Audit Committee will
not permit the retention of the independent auditor in connection with a
transaction initially recommended by the independent auditor, the purpose of
which may be tax avoidance and the tax treatment of which may not be supported
in the Internal Revenue Code and related regulations. The Audit Committee has
pre-approved certain Tax services, all Tax services involving large and complex
transactions must be specifically pre-approved by the Audit Committee.


ALL OTHER SERVICES

      With respect to the provision of services other than audit, review or
attest services the pre-approval requirement is waived if:


(1)   The aggregate amount of all such services provided constitutes no
                  more than five percent of the total amount of revenues
                  paid by the registrant, the registrant's adviser (not
                  including any sub-adviser whose role is primarily
                  portfolio management and is subcontracted with or
                  overseen by another investment adviser), and any entity
                  controlling, controlled by, or under common control with
                  the investment adviser that provides ongoing services to
                  the registrant to its accountant during the fiscal year
                  in which the services are provided;
(2)   Such services were not recognized by the registrant, the registrant's
                  adviser (not including any sub-adviser whose role is
                  primarily portfolio management and is subcontracted with
                  or overseen by another investment adviser), and any
                  entity controlling, controlled by, or under common
                  control with the investment adviser that provides ongoing
                  services to the registrant  at the time of the engagement
                  to be non-audit services; and
(3)               Such services are promptly brought to the attention of the
                  Audit Committee of the issuer and approved prior to the
                  completion of the audit by the Audit Committee or by one or
                  more members of the Audit Committee who are members of the
                  board of directors to whom authority to grant such approvals
                  has been delegated by the Audit Committee.


      The Audit Committee may grant general pre-approval to those permissible
non-audit services classified as All Other services that it believes are routine
and recurring services, and would not impair the independence of the auditor.


      The SEC's rules and relevant guidance should be consulted to determine the
precise definitions of prohibited non-audit services and the applicability of
exceptions to certain of the prohibitions.


PRE-APPROVAL FEE LEVELS

      Pre-approval fee levels for all services to be provided by the independent
auditor will be established annually by the Audit Committee. Any proposed
services exceeding these levels will require specific pre-approval by the Audit
Committee.


PROCEDURES

      Requests or applications to provide services that require specific
approval by the Audit Committee will be submitted to the Audit Committee by both
the independent auditor and the Principal Accounting Officer and/or Internal
Auditor, and must include a joint statement as to whether, in their view, the
request or application is consistent with the SEC's rules on auditor
independence.


(e)(2) Percentage of services identified in items 4(b) through 4(d) that were
approved by the registrants audit committee pursuant to paragraph (c)(7)(i)(C)
of Rule 2-01 of Regulation S-X:

            4(b)

            Fiscal year ended 2005 - 0%

            Fiscal year ended 2004 - 0%

            Percentage of services provided to the registrants investment
            adviser and any entity controlling, controlled by, or under common
            control with the investment adviser that provides ongoing services
            to the registrant that were approved by the registrants audit
            committee pursuant to paragraph (c)(7)(i)(C) of Rule 2-01 of
            Regulation S-X, 0% and 0% respectively.


            4(c)

            Fiscal year ended 2005 - 0%

            Fiscal year ended 2004 - 0%

            Percentage of services provided to the registrants investment
            adviser and any entity controlling, controlled by, or under common
            control with the investment adviser that provides ongoing services
            to the registrant that were approved by the registrants audit
            committee pursuant to paragraph (c)(7)(i)(C) of Rule 2-01 of
            Regulation S-X, 0% and 0% respectively.


            4(d)

            Fiscal year ended 2005 - 0%

            Fiscal year ended 2004 - 0%

            Percentage of services provided to the registrants investment
            adviser and any entity controlling, controlled by, or under common
            control with the investment adviser that provides ongoing services
            to the registrant that were approved by the registrants audit
            committee pursuant to paragraph (c)(7)(i)(C) of Rule 2-01 of
            Regulation S-X, 0% and 0% respectively.


(f)   NA


(g)   Non-Audit Fees billed to the registrant, the registrant's investment
      adviser, and certain entities controlling, controlled by or under common
      control with the investment adviser:
            Fiscal year ended 2005 - $249,792

            Fiscal year ended 2004 - $796,159


(h) The registrant's Audit Committee has considered that the provision of
non-audit services that were rendered to the registrant's adviser (not including
any sub-adviser whose role is primarily portfolio management and is
subcontracted with or overseen by another investment adviser), and any entity
controlling, controlled by, or under common control with the investment adviser
that provides ongoing services to the registrant that were not pre-approved
pursuant to paragraph (c)(7)(ii) of Rule 2-01 of Regulation S-X is compatible
with maintaining the principal accountant's independence.


Item 5.     Audit Committee of Listed Registrants

            Not Applicable

Item 6.     Schedule of Investments

            Not Applicable

Item 7.     Disclosure of Proxy Voting Policies and Procedures for
            Closed-End Management Investment Companies

            Not Applicable

Item 8.     Portfolio Managers of Closed-End Management Investment
            Companies

            Not Applicable

Item 9.     Purchases of Equity Securities by Closed-End Management
            Investment Company and Affiliated Purchasers

            Not Applicable

Item 10.    Submission of Matters to a Vote of Security Holders

            Not Applicable

Item 11.    Controls and Procedures

(a) The registrant's President and Treasurer have concluded that the
registrant's disclosure controls and procedures (as defined in rule 30a-3(c)
under the Act) are effective in design and operation and are sufficient to form
the basis of the certifications required by Rule 30a-(2) under the Act, based on
their evaluation of these disclosure controls and procedures within 90 days of
the filing date of this report on Form N-CSR.

(b) There were no changes in the registrant's internal control over financial
reporting (as defined in rule 30a-3(d) under the Act) during the last fiscal
quarter that have materially affected, or are reasonably likely to materially
affect, the registrant's internal control over financial reporting.

Item 12.    Exhibits


SIGNATURES

Pursuant to the requirements of the Securities Exchange Act of 1934 and the
Investment Company Act of 1940, the registrant has duly caused this report to be
signed on its behalf by the undersigned, thereunto duly authorized.

Registrant  Federated Equity Funds

By          /S/ Richard J. Thomas
            Richard J. Thomas, Principal Financial Officer
            (insert name and title)

Date        December 22, 2005


Pursuant to the requirements of the Securities Exchange Act of 1934 and the
Investment Company Act of 1940, this report has been signed below by the
following persons on behalf of the registrant and in the capacities and on the
dates indicated.


By          /S/ ___J. Christopher Donahue, Principal Executive Officer______
            J. Christopher Donahue, Principal Executive Officer
Date        December 22, 2005


By          /S/ ___Richard J. Thomas, Principal Financial Officer______
            Richard J. Thomas, Principal Financial Officer
Date        December 22, 2005