United States
Securities and Exchange Commission
Washington, D.C. 20549
Form N-CSR
Certified Shareholder Report of Registered Management Investment Companies
811-4017
(Investment Company Act File Number)
Federated Equity Funds
_______________________________________________________________
(Exact Name of Registrant as Specified in Charter)
Federated Investors Funds
4000 Ericsson Drive
Warrendale, Pennsylvania 15086-7561
(Address of Principal Executive Offices)
(412) 288-1900
(Registrant's Telephone Number)
John W. McGonigle, Esquire
Federated Investors Tower
1001 Liberty Avenue
Pittsburgh, Pennsylvania 15222-3779
(Name and Address of Agent for Service)
(Notices should be sent to the Agent for Service)
Date of Fiscal Year End: 11/30/13
Date of Reporting Period: 11/30/13
Item 1. Reports to Stockholders

Annual Shareholder Report
November 30, 2013
| Share Class | Ticker |
| Institutional | FGLEX |
Federated Global Equity Fund
A Portfolio of Federated Equity Funds
Not FDIC Insured • May Lose Value • No Bank Guarantee
CONTENTS
| 1 |
| 8 |
| 10 |
| 16 |
| 17 |
| 18 |
| 19 |
| 20 |
| 30 |
| 31 |
| 32 |
| 33 |
| 39 |
| 44 |
| 44 |
Management's Discussion of Fund Performance (unaudited)
The total return of Federated Global Equity Fund (the “Fund”), based on net asset value, for the 12-month reporting period ended November 30, 2013, was 21.81% for the Institutional Shares. The return of the Fund's benchmark, the Morgan Stanley Capital International All Country World Index (MSCI ACWI),1 a broad-based securities market index, was 23.45% for the same period. The Fund's total return for the most recently completed fiscal year reflected actual cash flows, transaction costs and other expenses which were not reflected in the total return of the MSCI ACWI.
The Fund's investment strategy focused on: (a) country allocation and stock selection; and (b) U.S. industry group allocation. These were the most significant factors affecting the performance relative to the MSCI ACWI. The Fund's Institutional Shares underperformed the MSCI ACWI.
MARKET OVERVIEW
The global stock market rallied over the year as the growth outlook improved and economic risks diminished across the United States and Europe. Several key markets hit all-time highs. Investors gained confidence despite the U.S. debt ceiling and budget crisis, and the European debt crisis, both of which were a source of market volatility in previous years. While monetary policy diverged across the world, the U.S. Federal Reserve (the Fed), the European Central Bank (ECB) and the Bank of Japan (BoJ) maintained accommodative monetary policy in the face of fiscal headwinds. The “risk-on/risk-off” investing environment that had driven markets in previous years became less important than global divergences, which were most evident between developed and emerging markets. As developed markets recovered, the growth outlook in emerging markets deteriorated while inflation expectations rose. As G3 (Fed, ECB and BoJ) central banks increased liquidity, several key central banks in the developing world, such as India and Brazil, began to tighten policy. Those conditions, coupled with concerns over an eventual withdrawal of extraordinary liquidity by the Fed, or “Fed tapering,” caused a broad sell-off in emerging markets stocks, bonds and currencies.
The U.S. economy improved during the year, and re-emerged as a leading driver of global growth. A robust corporate sector was able to add 2.3 million jobs, while the corporate earnings outlook remained strong. Despite repeated debt ceiling and budget debates, consumer spending and corporate investment remained healthy and improved. The major U.S. stock benchmarks hit all-time highs, and the U.S. dollar remained strong. The improving economy and Fed comments led to speculation about Fed tapering, which caused volatility in yield sensitive assets. Signs that investors were re-allocating to stocks helped sentiment during the reporting period.
Annual Shareholder Report
European markets performed strongly during the year as the broader economy shifted from a recession to initial stages of a recovery. The European economy exhibited “very green shoots,” according to the ECB. During the year, the euro-zone Purchasing Manager (PMI) Survey moved from contraction to expansion for the first time in over two years. The economic performance of the region is still widely varied with Germany firing on multiple cylinders with above-trend real Gross Domestic Product (GDP) growth, while Italy is slowly emerging from its worst recession since World War II. Across Europe, economic confidence moved to multiyear highs and was given a further boost as ECB President Mario Draghi stated that the bank was willing to enact another long-term refinancing operation (LTRO), if needed, to assure bank funding costs remained low. In November, the ECB cut its policy rate by a quarter-point to an all-time low of 0.25% as inflation expectations dropped. Political continuity was strong as pro-euro governments were confirmed. In Germany, Chancellor Merkel won a third term, and a stable technocrat government emerged in Italy. During the year, the European Parliament approved a Single Supervisory Mechanism (SSM) for European banks. While the SSM is just the first step towards a banking union, it is an important institution that will help ensure the future stability in the euro area.
In Japan, the stock market had its best returns in more than a decade as the new Prime Minister Abe's sweeping economic revitalization plan and aggressive BoJ easing surprised markets. Japanese economic data improved consistently throughout the year. Important surveys such as the Tankan and Manufacturing PMI reflected an accelerating growth trend. After fifteen years of deflation, consumer prices stabilized and signaled moderate inflation. The BoJ continued to provide record low interest rates and maintained quantitative easing. Prime Minister Abe's broad plan for economic revitalization includes creation of three new business councils directing economic and fiscal policy, industrial competitiveness and regulatory reforms. Concurrent with a hike in the consumption tax, the government announced a stimulus plan targeted at incentivizing domestic corporate investment. Collectively, the structural reforms and fiscal and monetary policies, represent the “three arrows” of Japan's makeover under “Abenomics.” In October production growth hit a 46-month high signaling that Japan's economy continues to improve on an upward trajectory.
Emerging markets showed their widest underperformance to developed markets since the Asian crisis in 1998. While no economies entered into a recession during the year, the backdrop of tighter monetary policy in major emerging economies like Brazil and India, coupled with higher than expected inflation across many markets, hurt investor sentiment. More positive news from China helped improve the outlook during the end of the period as the new government released further details about their long range economic reform plans. While the economic data showed mixed signs of growth and stability, real
Annual Shareholder Report
GDP growth is expected to exceed 7 1∕2%. The Chinese government's action for domestic modernization and urbanization encouraged investors, particularly in the consumer sector. Furthermore, Chinese exports will be supported by the synchronized recovery underway in its major end markets, the U.S., Europe and Japan.
For the 12-month reporting period ended November 30, 2013, the MSCI USA Index2 (+29.5%) outperformed both the MSCI Emerging Markets Index3 (+3.7%) and MSCI EAFE Index4 (+24.8%). There was a strong divergence amongst country returns. Select major developed countries beat MSCI USA Index returns including MSCI Germany5 (+32.9%) and MSCI Japan6 (+32.8%). The top performing major emerging markets were MSCI China7 (+12.5%) and MSCI Korea8 (+11.1%).
Country allocation and Stock Selection
Country allocation remained a key driver of performance for the year, as it consistently has been over the past five years. The Fund maintained exposure to select healthy, high sovereign quality, developed and emerging markets.9 During the reporting period, the Fund underperformed the Morningstar World Stock Funds Average (MWSFA),10 a peer group average for the Fund, which had a total return of 25.54%.
In Europe, performance was positive. The Fund's top performer was Germany where a strong domestic economy, with the lowest unemployment rate in over 20 years, was boosted by improvement in the euro area economy and from improving global growth. Demand for autos and capital goods drove sales and earnings of companies such as Daimler AG (+77.3%) and Siemens AG (+38.0%). In Denmark shipping and logistics companies such as A.P. Moller Maersk A/S (+46.0%) and DSV A/S (+20.2%) benefited from improving volumes in Europe and continued growth out of Asia. Norway, the Fund's second largest overweight allocation at +7.03% relative to the benchmark, underperformed, as shares in energy service companies such as Subsea 7 ASA (-11.8%) and TGS-NOPEC Geophysical Company ASA (-16.1%) declined. More broadly in Europe, our underweight allocation to stocks in the UK and Switzerland, which outperformed, was largely offset by our long position in pound sterling.
In the Asia Pacific region, the Fund's overweight allocation to Japan and short yen position helped performance. Exporters such as Toto Ltd. (+40.6%) and Asahi Kasei Corp. (+41.4%) outperformed as yen weakness drove sentiment and earnings. Chinese stock selection was mixed, as holdings in internet stock Tencent Holdings Ltd (+78.2%), which benefited from the strong trends towards mobile media and e-commerce, were offset by poor performance of holdings in the traditional retail sector such as Golden Eagle Retail Group Ltd (-35.7%). The Fund's holdings in Korea had a negative impact on Fund performance, as labor issues and a weak yen (versus the Korean won) hurt investor sentiment for domestic auto and parts makers. Holdings in automotive companies Kia Motors
Annual Shareholder Report
(-0.2%) and Mando Corp. (-41.6%) underperformed. Elsewhere in Asia, the “Fed tapering” news led to a steep selloff in fiscally weaker emerging market countries. The Fund's holdings in Indonesia such as PT Bank Negara Indonesia Tbk (-30.4%) detracted from Fund performance. Fund performance was helped by our underweight allocation to Australia and New Zealand.
In the Americas, the Fund's holdings in Brazil detracted from performance as domestic economic growth slowed and persistent inflation resulted in a higher interest rate environment. In addition, the beginning of a recovery in commodity exports was insufficient to boost positive sentiment on stocks. Iron ore mining company Vale SA (-22.6%) contributed negatively to performance. Fund performance was helped by our underweight allocation to Canada, as the commodity rich country lagged in performance.
U.S. Industry Group Allocation
Our U.S. Industry Group positioning contributed positively to performance as consumer related groups such as Food and Staples Retailing and Consumer Durables outperformed. Our holdings in Fairway Group Holdings Corp (+91.9%) and Nike Inc. (+64.4%) posted strong performance. In addition, holdings in Media and Insurance, such as Viacom Inc. (+57.7%) and Lincoln National Corp. (+108.7%), outperformed. Fund performance was negatively impacted by our positioning in Tech Hardware. Companies such as Apple Inc. (-2.6%) and EMC Corp. (-9.1%) underperformed.
| 1 | Please see the footnotes to the line graphs under “Fund Performance and Growth of a $10,000 Investment” below for the definition of, and more information about, the MSCI ACWI. |
| 2 | The MSCI USA Index is a free float adjusted market capitalization index that is designed to measure large- and mid-cap U.S. equity market performance. The index is unmanaged, and it is not possible to invest directly in an index. |
| 3 | The MSCI Emerging Markets Index captures large- and mid-cap representation across 21 Emerging Markets (EM) countries. With 824 constituents, the index covers approximately 85% of the free float-adjusted market capitalization in each country. As of November 2013, the MSCI Emerging Markets Index consisted of the following country indices: Brazil, Chile, Colombia, Mexico, Peru, Czech Republic, Egypt, Greece, Hungary, Poland, Russia, South Africa, Turkey, China, India, Indonesia, Korea, Malaysia, Philippines, Taiwan and Thailand. The index is unmanaged, and it is not possible to invest directly in an index. |
| 4 | The MSCI EAFE Index is a free float-adjusted market capitalization weighted index that is designed to measure the equity market performance of developed markets outside of North America (Europe, Australasia and the Far East). As of November 2013, the MSCI EAFE Index consisted of 21 developed market country indices. The developed market country indices included are: Australia, Austria, Belgium, Denmark, Finland, France, Germany, Hong Kong, Ireland, Israel, Italy, Japan, Netherlands, New Zealand, Norway, Portugal, Singapore, Spain, Sweden, Switzerland and the United Kingdom. The index is unmanaged, and it is not possible to invest directly in an index. |
Annual Shareholder Report
| 5 | The MSCI Germany Index is designed to measure the performance of the large- and mid-cap segments of the German market. With 55 constituents, the index covers about 85% of the equity universe in Germany. The index is unmanaged, and it is not possible to invest directly in an index. |
| 6 | The MSCI Japan Index is designed to measure the performance of the large- and mid-cap segments of the Japanese market. With 320 constituents, the index covers approximately 85% of the free float-adjusted market capitalization in Japan. The index is unmanaged, and it is not possible to invest directly in an index. |
| 7 | The MSCI China Index captures large- and mid-cap representation across China H shares. With 138 constituents, the index covers about 85% of this China equity universe. The index is unmanaged, and it is not possible to invest directly in an index. |
| 8 | The MSCI Korea Index is designed to measure the performance of the large- and mid-cap segments of the South Korean market. With 105 constituents, the index covers about 85% of the Korean equity universe. The index is unmanaged, and it is not possible to invest directly in an index. |
| 9 | International investing involves special risks including currency risk, increased volatility of foreign securities, political risks and differences in auditing and other financial standards. Prices of emerging market securities can be significantly more volatile than the prices of securities in developed countries. Currency risk and political risks are accentuated in emerging markets. |
| 10 | Please see the footnotes to the line graphs under “Fund Performance and Growth of a $10,000 Investment” below for the definition of, and more information about, the MWSFA. |
Annual Shareholder Report
FUND PERFORMANCE AND GROWTH OF A $10,000 INVESTMENT
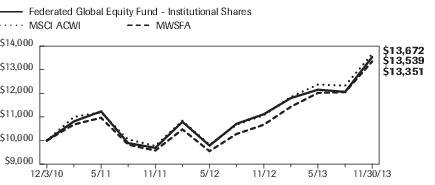
The Average Annual Total Return table below shows returns for Institutional Shares over the stated periods. The graph below illustrates the hypothetical investment of $10,0001 in the Federated Global Equity Fund (Institutional Shares) from December 3, 2010 (start of performance) to November 30, 2013, as compared to the MSCI All Country World Index (MSCI ACWI)2 and the Morningstar World Stock Funds Average (MWSFA).3
Average Annual Total Returns for the Period Ended 11/30/2013
| Share Class | 1 Year | Start of
Performance* |
| Institutional Shares | 21.81% | 10.66% |
| * | The Fund's Institutional Shares commenced operations on 12/3/2010. |
Performance data quoted represents past performance which is no guarantee of future results. Investment return and principal value will fluctuate so that an investor's shares, when redeemed, may be worth more or less than their original cost. Mutual fund performance changes over time and current performance may be lower or higher than what is stated. For current to the most recent month-end performance and after-tax returns, visit FederatedInvestors.com or call 1-800-341-7400. Returns shown do not reflect the deduction of taxes that a shareholder would pay on Fund distributions or the redemption of Fund shares. Mutual funds are not obligations of or guaranteed by any bank and are not federally insured.
Annual Shareholder Report
Growth of a $10,000 Investment - Institutional shares
Growth of $10,000 as of November 30, 2013
| Federated Global Equity Fund - | Institutional Shares | MSCI ACWI | MWSFA |
| 12/3/2010 | 10,000 | 10,000 | 10,000 |
| 2/28/2011 | 10,813 | 11,003 | 10,682 |
| 5/31/2011 | 11,234 | 11,195 | 10,964 |
| 8/31/2011 | 9,891 | 10,048 | 9,825 |
| 11/30/2011 | 9,691 | 9,772 | 9,578 |
| 2/29/2012 | 10,793 | 10,839 | 10,470 |
| 5/31/2012 | 9,787 | 9,819 | 9,552 |
| 8/31/2012 | 10,712 | 10,672 | 10,279 |
| 11/30/2012 | 11,115 | 11,075 | 10,669 |
| 2/28/2013 | 11,798 | 11,846 | 11,432 |
| 5/31/2013 | 12,154 | 12,373 | 12,016 |
| 8/31/2013 | 12,063 | 12,324 | 12,051 |
| 11/30/2013 | 13,539 | 13,672 | 13,351 |
41 graphic description end -->
| 1 | Represents a hypothetical investment of $10,000 in the Fund. The Fund's performance assumes the reinvestment of all dividends and distributions. The MSCI ACWI has been adjusted to reflect the reinvestment of dividends on securities in the index. |
| 2 | The MSCI ACWI captures large- and mid-cap representation across 23 developed markets countries and 21 emerging markets countries. With 2,436 constituents, the index covers approximately 85% of the global investable equity opportunity set. The Index is not adjusted to reflect sales loads, expenses and other fees that the Securities and Exchange Commission requires to be reflected in the Fund's performance. The Index is unmanaged, and, unlike the Fund, is not affected by cash flows. It is not possible to invest directly in an index. |
| 3 | Morningstar figures represent the average of the total returns reported by all the mutual funds designated by Morningstar as falling into the respective category indicated. They do not reflect sales charges. |
| | |
Annual Shareholder Report
Portfolio of Investments Summary Tables (unaudited)
At November 30, 2013, the Fund's portfolio composition1 was as follows:
| Country | Percentage of
Total Net Assets |
| United States | 46.9% |
| Japan | 14.4% |
| Germany | 8.3% |
| South Korea | 7.7% |
| Norway | 6.4% |
| Denmark | 4.0% |
| China | 3.3% |
| Poland | 2.8% |
| Brazil | 2.7% |
| Austria | 1.3% |
| Turkey | 1.0% |
| Derivative Contracts2 | 0.2% |
| Cash Equivalents3 | 0.7% |
| Other Assets and Liabilities—Net4 | 0.3% |
| TOTAL | 100.0% |
| 1 | Country allocations are based primarily on the country in which a company is incorporated. However, the Fund's Adviser may allocate a company to a country based on other factors such as location of the company's principal office, the location of the principal trading market for the company's securities or the country where a majority of the company's revenues are derived. |
| 2 | Based upon net unrealized appreciation (depreciation) or value of the derivative contracts as applicable. Derivative contracts may consist of futures, forwards, options and swaps. The impact of a derivative contract on the Fund's performance may be larger than its unrealized appreciation (depreciation) or value may indicate. In many cases, the notional value or amount of a derivative contract may provide a better indication of the contract's significance to the portfolio. More complete information regarding the Fund's direct investments in derivative contracts, including unrealized appreciation (depreciation), value and notional values or amounts of such contracts, can be found in the table at the end of the Portfolio of Investments included in this Report. |
| 3 | Cash Equivalents include any investments in money market mutual funds and/or overnight repurchase agreements. |
| 4 | Assets, other than investments in securities and derivative contracts, less liabilities. See Statement of Assets and Liabilities. |
Annual Shareholder Report
At November 30, 2013, the Fund's sector classification composition5 was as follows:
| Sector Classification | Percentage of
Total Net Assets |
| Financials | 21.8% |
| Consumer Discretionary | 20.6% |
| Information Technology | 17.1% |
| Industrials | 14.6% |
| Energy | 6.8% |
| Consumer Staples | 5.8% |
| Health Care | 5.7% |
| Telecommunication Services | 3.2% |
| Materials | 2.9% |
| Utilities | 0.3% |
| Derivative Contracts2 | 0.2% |
| Cash Equivalents3 | 0.7% |
| Other Assets and Liabilities—Net4 | 0.3% |
| TOTAL | 100.0% |
| 5 | Except for Derivative Contracts, Cash Equivalents and Other Assets and Liabilities, sector classifications are based upon, and individual securities are assigned to, the classifications of the Global Industry Classification Standard (GICS) except that the Adviser assigns a classification to securities not classified by the GICS and to securities for which the Adviser does not have access to the classification made by the GICS. |
Annual Shareholder Report
Portfolio of Investments
November 30, 2013
| Shares | | | Value in
U.S. Dollars |
| | | COMMON STOCKS—98.8% | |
| | | Austria—1.3% | |
| 3,100 | | Erste Group Bank AG | $109,141 |
| 700 | | Va Stahl Ag | 34,817 |
| 600 | | Vienna Insurance Group | 31,486 |
| | | TOTAL | 175,444 |
| | | Brazil—2.7% | |
| 9,000 | | Ambev SA, ADR | 68,040 |
| 3,192 | | CIELO SA | 92,645 |
| 1,600 | | Companhia Brasileira de Distribuicao Groupo Pao de Acucar, ADR | 75,328 |
| 9,540 | | Itau Unibanco Holding SA, ADR | 134,228 |
| | | TOTAL | 370,241 |
| | | China—3.3% | |
| 32,000 | | China Overseas Land & Investment | 99,683 |
| 510 | | CNOOC Ltd., ADR | 104,387 |
| 10,400 | | Prada SpA | 100,444 |
| 2,500 | | Tencent Holdings Ltd. | 144,598 |
| | | TOTAL | 449,112 |
| | | Denmark—4.0% | |
| 10 | | A P Moller-Maersk A/S | 101,463 |
| 450 | | Carlsberg A/S, Class B | 49,306 |
| 4,000 | 1 | Danske Bank A/S | 90,934 |
| 3,000 | | DSV AS | 91,808 |
| 725 | 1 | Jyske Bank A/S | 39,197 |
| 3,125 | | Nordea Bank AB | 40,377 |
| 700 | | Novo Nordisk A/S, ADR | 125,111 |
| | | TOTAL | 538,196 |
| | | Germany—8.3% | |
| 1,050 | | Allianz SE | 182,410 |
| 2,000 | | Bayerische Motoren Werke AG | 229,828 |
| 700 | | Continental AG | 146,194 |
| 2,100 | | Daimler AG | 174,063 |
| 1,100 | | Gerresheimer AG | 74,234 |
| 900 | | Rheinmetall AG | 55,472 |
| 2,080 | | Siemens AG | 274,718 |
| | | TOTAL | 1,136,919 |
Annual Shareholder Report
| Shares | | | Value in
U.S. Dollars |
| | | COMMON STOCKS—continued | |
| | | Japan—14.4% | |
| 3,300 | | Aisin Seiki Co. | $132,715 |
| 14,000 | | Asahi Kasei Corp. | 110,420 |
| 1,000 | | Astellas Pharma, Inc. | 59,251 |
| 2,500 | | Chugai Pharmaceutical Co. Ltd. | 59,666 |
| 2,000 | | Daiwa House Industry Co. Ltd. | 38,850 |
| 3,000 | | Fuji Heavy Industries | 84,689 |
| 7,000 | | Hitachi Ltd. | 51,589 |
| 3,000 | | Honda Motor Co. Ltd. | 126,800 |
| 4,500 | | Japan Tobacco, Inc. | 151,984 |
| 11,000 | | Kaneka Corp. | 67,646 |
| 13,000 | | Kubota Corp. | 222,197 |
| 11,000 | | Mitsubishi Chemical Holdings Corp. | 51,110 |
| 5,400 | | Mitsui & Co. | 74,797 |
| 8,000 | | Nippon Express Co. Ltd. | 41,232 |
| 5,500 | | Nomura Holdings, Inc. | 43,540 |
| 5,000 | | Orix Corp. | 91,025 |
| 7,000 | | Sekisui House Ltd. | 96,549 |
| 2,200 | | Shionogi and Co. | 48,362 |
| 900 | | Tokio Marine Holdings, Inc. | 29,870 |
| 6,000 | | Tokyu Corp. | 40,412 |
| 12,627 | | Toto Ltd. | 185,378 |
| 3,722 | | United Arrows Ltd. | 157,680 |
| | | TOTAL | 1,965,762 |
| | | Norway—6.4% | |
| 9,200 | | DnB ASA | 162,772 |
| 2,400 | | Fred Olsen Energy ASA | 94,796 |
| 3,119 | | Seadrill Ltd. | 132,867 |
| 7,600 | | Statoil ASA | 171,677 |
| 3,400 | | Subsea 7 SA | 66,204 |
| 3,000 | | Telenor ASA | 72,125 |
| 1,500 | | TGS Nopec Geophysical Co. ASA | 39,588 |
| 3,100 | | Yara International ASA | 135,246 |
| | | TOTAL | 875,275 |
| | | Poland—2.8% | |
| 400 | | M Bank SA | 72,027 |
| 28,500 | | Polskie Gornictwo Naftowe I Gazownictwo SA | 52,977 |
| 10,200 | | Powszechna Kasa Oszczednosci | 135,690 |
| 350 | | Powszechny Zaklad Ubezpieczen SA | 53,179 |
Annual Shareholder Report
| Shares | | | Value in
U.S. Dollars |
| | | COMMON STOCKS—continued | |
| | | Poland—continued | |
| 20,000 | | Tauron Polska Energia, S.A. | $33,298 |
| 5,200 | | Unicredito Italiano SpA | 37,731 |
| | | TOTAL | 384,902 |
| | | South Korea—7.7% | |
| 500 | | Binggrae | 46,631 |
| 1,800 | 1 | Cheil Worldwide, Inc. | 43,967 |
| 950 | | Hyundai Motor Co. | 226,212 |
| 2,200 | | Kia Motors Corp. | 125,560 |
| 280 | | Samsung Electronics Co. | 395,275 |
| 1,400 | | Samsung Heavy Industries Co., Ltd. | 51,857 |
| 680 | | Samsung SDI Co. Ltd. | 112,766 |
| 400 | | SK Innovation Co. Ltd. | 54,427 |
| | | TOTAL | 1,056,695 |
| | | Turkey—1.0% | |
| 1,400 | | BIM Birlesik Magazalar AS | 31,587 |
| 25,171 | | Trakya Cam Sanayii | 31,261 |
| 6,100 | | Turkiye Halk Bankasi AS | 46,783 |
| 12,000 | | Turkiye Vakiflar Bankasi T.A.O. | 27,194 |
| | | TOTAL | 136,825 |
| | | United States—46.9% | |
| 900 | | 3M Co. | 120,159 |
| 2,050 | | Accenture PLC | 158,813 |
| 500 | | Apple, Inc. | 278,035 |
| 2,500 | | Automatic Data Processing, Inc. | 200,050 |
| 16,000 | | Bank of America Corp. | 253,120 |
| 1,900 | | Bank of New York Mellon Corp. | 64,030 |
| 4,000 | | CBS Corp., Class B | 234,240 |
| 6,100 | | Cisco Systems, Inc. | 129,625 |
| 3,800 | | Citigroup, Inc. | 201,096 |
| 3,100 | | Discover Financial Services | 165,230 |
| 700 | | Dover Corp. | 63,518 |
| 4,700 | | EMC Corp. | 112,095 |
| 2,200 | | Emerson Electric Co. | 147,378 |
| 30,000 | | Frontier Communications Corp. | 140,400 |
| 1,800 | 1 | Gilead Sciences, Inc. | 134,658 |
| 6,000 | | Hewlett-Packard Co. | 164,100 |
| 2,000 | | HollyFrontier Corp. | 95,960 |
| 300 | | IBM Corp. | 53,904 |
Annual Shareholder Report
| Shares | | | Value in
U.S. Dollars |
| | | COMMON STOCKS—continued | |
| | | United States—continued | |
| 15,000 | | Interpublic Group of Cos., Inc. | $261,000 |
| 2,800 | 1 | Jacobs Engineering Group, Inc. | 167,356 |
| 6,400 | | Kroger Co. | 267,200 |
| 5,000 | | Lincoln National Corp. | 256,650 |
| 1,000 | 1 | Lululemon Athletica Inc. | 69,720 |
| 3,900 | | MetLife, Inc. | 203,541 |
| 8,000 | | Microsoft Corp. | 305,040 |
| 2,200 | | Nike, Inc., Class B | 174,108 |
| 3,800 | | Oracle Corp. | 134,102 |
| 8,700 | | Pfizer, Inc. | 276,051 |
| 2,900 | | Prudential Financial, Inc. | 257,404 |
| 1,000 | | Raytheon Co. | 88,680 |
| 2,100 | | Rockwell Automation, Inc. | 238,518 |
| 3,700 | | TD Ameritrade Holding Corp. | 106,486 |
| 2,600 | | Valero Energy Corp. | 118,872 |
| 4,450 | | Verizon Communications, Inc. | 220,809 |
| 4,000 | | Viacom, Inc., Class B | 320,680 |
| 700 | | Whirlpool Corp. | 106,932 |
| 1,800 | | Whole Foods Market, Inc. | 101,880 |
| | | TOTAL | 6,391,440 |
| | | TOTAL COMMON STOCKS
(IDENTIFIED COST $10,716,958) | 13,480,811 |
| | | INVESTMENT Company—0.7% | |
| 89,993 | 2,3 | Federated Prime Value Obligations Fund, Institutional Shares, 0.07%
(AT NET ASSET VALUE) | 89,993 |
| | | TOTAL INVESTMENTS—99.5%
(AT IDENTIFIED COST $10,806,951)4 | 13,570,804 |
| | | OTHER ASSETS AND LIABILITIES - NET—0.5%5 | 67,590 |
| | | TOTAL NET ASSETS—100% | $13,638,394 |
Annual Shareholder Report
At November 30, 2013, the Fund had the following outstanding foreign exchange contracts:
| Settlement Date | Foreign Currency
Units to
Receive/Deliver | In
Exchange
For | Unrealized
Appreciation
(Depreciation) |
| Contracts Purchased: |
| 12/18/2013 | 278,000 AUD | $266,596 | $(13,848) |
| 12/18/2013 | 320,000 GBP | $507,514 | $16,035 |
| 1/10/2014 | 2,900,000 RUB | $88,788 | $(2,007) |
| Contracts Sold: |
| 12/18/2013 | 94,600,000 JPY | $954,110 | $30,521 |
| NET UNREALIZED APPRECIATION ON FOREIGN EXCHANGE CONTRACTS | $30,701 |
Net Unrealized Appreciation on Foreign Exchange Contracts is included in “Other Assets and Liabilities—Net.”
| 1 | Non-income-producing security. |
| 2 | 7-day net yield. |
| 3 | Affiliated holding. |
| 4 | The cost of investments for federal tax purposes amounts to $10,830,458. |
| 5 | Assets, other than investments in securities, less liabilities. See Statement of Assets and Liabilities. |
Note: The categories of investments are shown as a percentage of total net assets at November 30, 2013.
Various inputs are used in determining the value of the Fund's investments. These inputs are summarized in the three broad levels listed below:
Level 1—quoted prices in active markets for identical securities, including investment companies with daily net asset values, if applicable.
Level 2—other significant observable inputs (including quoted prices for similar securities, interest rates, prepayment speeds, credit risk, etc.). Also includes securities valued at amortized cost.
Level 3—significant unobservable inputs (including the Fund's own assumptions in determining the fair value of investments).
The inputs or methodology used for valuing securities are not an indication of the risk associated with investing in those securities.
Annual Shareholder Report
The following is a summary of the inputs used, as of November 30, 2013, in valuing the Fund's assets carried at fair value:
| Valuation Inputs |
| | Level 1—
Quoted
Prices and
Investments in
Investment Companies | Level 2—
Other
Significant
Observable
Inputs | Level 3—
Significant
Unobservable
Inputs | Total |
| Equity Securities: | | | | |
| Common Stocks | | | | |
| Domestic | $6,391,440 | $— | $— | $6,391,440 |
| International | 7,089,371 | — | — | 7,089,371 |
| Investment Company | 89,993 | — | — | 89,993 |
| TOTAL SECURITIES | $13,570,804 | $— | $— | $13,570,804 |
| OTHER FINANCIAL INSTRUMENTS* | $— | $30,701 | $— | $30,701 |
| * | Other financial instruments include foreign exchange contracts. |
The following acronyms are used throughout this portfolio:
| ADR | —American Depositary Receipt |
| AUD | —Australian Dollar |
| GBP | —Great Britain Pound |
| JPY | —Japanese Yen |
| RUB | —Russian Ruble |
See Notes which are an integral part of the Financial Statements
Annual Shareholder Report
Financial Highlights–Institutional Shares
(For a Share Outstanding Throughout Each Period)
| | Year Ended November 30, | Period
Ended
11/30/20111 |
| 2013 | 2012 |
| Net Asset Value, Beginning of Period | $11.05 | $9.67 | $10.00 |
| Income From Investment Operations: | | | |
| Net investment income | 0.15 | 0.14 | 0.12 |
| Net realized and unrealized gain (loss) on investments, futures contracts and foreign currency transactions | 2.24 | 1.27 | (0.43) |
| TOTAL FROM INVESTMENT OPERATIONS | 2.39 | 1.41 | (0.31) |
| Less Distributions: | | | |
| Distributions from net investment income | (0.13) | (0.03) | (0.02) |
| Distributions from net realized gain on investments | (0.01) | — | — |
| TOTAL DISTRIBUTIONS | (0.14) | (0.03) | (0.02) |
| Net Asset Value, End of Period | $13.30 | $11.05 | $9.67 |
| Total Return2 | 21.81% | 14.69% | (3.09)% |
| Ratios to Average Net Assets: | | | |
| Net expenses | 1.15% | 1.15% | 1.15%3 |
| Net investment income | 1.22% | 1.31% | 1.14%3 |
| Expense waiver/reimbursement4 | 1.63% | 2.99% | 3.13%3 |
| Supplemental Data: | | | |
| Net assets, end of period (000 omitted) | $13,638 | $11,155 | $9,695 |
| Portfolio turnover | 48% | 51% | 49% |
| 1 | Reflects operations for the period from December 3, 2010 (date of initial investment) to November 30, 2011. |
| 2 | Based on net asset value. Total returns for periods of less than one year are not annualized. |
| 3 | Computed on an annualized basis. |
| 4 | This expense decrease is reflected in both the net expense and net investment income ratios shown above. |
See Notes which are an integral part of the Financial Statements
Annual Shareholder Report
Statement of Assets and Liabilities
November 30, 2013
| Assets: | | |
| Total investment in securities, at value including $89,993 of investment in an affiliated holding (Note 5) (identified cost $10,806,951) | | $13,570,804 |
| Cash | | 78,468 |
| Receivable for investments sold | | 148,108 |
| Unrealized appreciation on foreign exchange contracts | | 46,556 |
| Income receivable | | 36,199 |
| TOTAL ASSETS | | 13,880,135 |
| Liabilities: | | |
| Payable to custodian | $50,363 | |
| Unrealized depreciation on foreign exchange contracts | 15,855 | |
| Payable for investments purchased | 85,483 | |
| Payable for portfolio accounting fees | 47,251 | |
| Payable for auditing fees | 25,000 | |
| Payable for custodian fees | 9,140 | |
| Payable to adviser (Note 5) | 1,638 | |
| Payable for transfer agent fee | 951 | |
| Payable for Directors'/Trustees' fees (Note 5) | 52 | |
| Accrued expenses (Note 5) | 6,008 | |
| TOTAL LIABILITIES | | 241,741 |
| Net assets for 1,025,431 shares outstanding | | $13,638,394 |
| Net Assets Consists of: | | |
| Paid-in capital | | $10,277,665 |
| Net unrealized appreciation of investments and translation of assets and liabilities in foreign currency | | 2,794,312 |
| Accumulated net realized gain on investments and foreign currency transactions | | 454,437 |
| Undistributed net investment income | | 111,980 |
| TOTAL NET ASSETS | | $13,638,394 |
| Net Asset Value, Offering Price and Redemption Proceeds Per Share | | |
| Institutional Shares: | | |
| $13,638,394 ÷ 1,025,431 shares outstanding, no par value, unlimited shares authorized | | $13.30 |
See Notes which are an integral part of the Financial Statements
Annual Shareholder Report
Statement of Operations
Year Ended November 30, 2013
| Investment Income: | | | |
| Interest | | | $204 |
| Dividends (including $177 received from an affiliated holding (Note 5) and net of foreign tax withheld of $23,862) | | | 291,109 |
| TOTAL INCOME | | | 291,313 |
| Expenses: | | | |
| Investment adviser fee (Note 5) | | $110,334 | |
| Administrative fee (Note 5) | | 9,568 | |
| Custodian fees | | 17,829 | |
| Transfer agent fee | | 2,867 | |
| Directors'/Trustees' fees (Note 5) | | 430 | |
| Auditing fees | | 25,000 | |
| Legal fees | | 8,517 | |
| Portfolio accounting fees | | 123,384 | |
| Share registration costs | | 19,156 | |
| Printing and postage | | 13,936 | |
| Insurance premiums (Note 5) | | 4,112 | |
| Miscellaneous (Note 5) | | 5,794 | |
| TOTAL EXPENSES | | 340,927 | |
| Waiver and Reimbursements (Note 5): | | | |
| Waiver/reimbursement of investment adviser fee | $(110,334) | | |
| Reimbursement of other operating expenses | (89,009) | | |
| TOTAL WAIVER AND REIMBURSEMENTS | | (199,343) | |
| Net expenses | | | 141,584 |
| Net investment income | | | 149,729 |
| Realized and Unrealized Gain on Investments and Foreign Currency Transactions: | | | |
| Net realized gain on investments and foreign currency transactions | | | 480,275 |
| Net change in unrealized appreciation of investments and translation of assets and liabilities in foreign currency | | | 1,810,541 |
| Net realized and unrealized gain on investments and foreign currency transactions | | | 2,290,816 |
| Change in net assets resulting from operations | | | $2,440,545 |
See Notes which are an integral part of the Financial Statements
Annual Shareholder Report
Statement of Changes in Net Assets
| Year Ended November 30 | 2013 | 2012 |
| Increase (Decrease) in Net Assets | | |
| Operations: | | |
| Net investment income | $149,729 | $137,474 |
| Net realized gain on investments and foreign currency transactions | 480,275 | 81,725 |
| Net change in unrealized appreciation/depreciation of investments and translation of assets and liabilities in foreign currency | 1,810,541 | 1,199,342 |
| CHANGE IN NET ASSETS RESULTING FROM OPERATIONS | 2,440,545 | 1,418,541 |
| Distributions to Shareholders: | | |
| Distributions from net investment income | (129,207) | (34,777) |
| Distributions from net realized gain on investments | (6,687) | — |
| CHANGE IN NET ASSETS RESULTING FROM DISTRIBUTIONS TO SHAREHOLDERS | (135,894) | (34,777) |
| Share Transactions: | | |
| Proceeds from sale of shares | 48,589 | 61,002 |
| Net asset value of shares issued to shareholders in payment of distributions declared | 135,834 | 34,777 |
| Cost of shares redeemed | (6,134) | (19,489) |
| CHANGE IN NET ASSETS RESULTING FROM SHARE TRANSACTIONS | 178,289 | 76,290 |
| Change in net assets | 2,482,940 | 1,460,054 |
| Net Assets: | | |
| Beginning of period | 11,155,454 | 9,695,400 |
| End of period (including undistributed net investment income of $111,980 and $110,177, respectively) | $13,638,394 | $11,155,454 |
See Notes which are an integral part of the Financial Statements
Annual Shareholder Report
Notes to Financial Statements
November 30, 2013
1. ORGANIZATION
Federated Equity Funds (the “Trust”) is registered under the Investment Company Act of 1940, as amended, (the “Act”), as an open-end management investment company. The Trust consists of 12 portfolios. The financial statements included herein are only those of Federated Global Equity Fund (the “Fund”). The financial statements of the other portfolios are presented separately. The assets of each portfolio are segregated and a shareholder's interest is limited to the portfolio in which shares are held. Each portfolio pays its own expenses. The investment objective of the Fund is to provide long term capital appreciation.
2. SIGNIFICANT ACCOUNTING POLICIES
The following is a summary of significant accounting policies consistently followed by the Fund in the preparation of its financial statements. These policies are in conformity with U.S. generally accepted accounting principles (GAAP).
Investment Valuation
In calculating its net asset value (NAV), the Fund generally values investments as follows:
| ■ | Equity securities listed on an exchange or traded through a regulated market system are valued at their last reported sale price or official closing price in their principal exchange or market. |
| ■ | Shares of other mutual funds or non-exchange-traded investment companies are valued based upon their reported NAVs. |
| ■ | Fixed-income securities acquired with remaining maturities greater than 60 days are fair valued using price evaluations provided by a pricing service approved by the Fund's Board of Trustees (the “Trustees”). |
| ■ | Fixed-income securities and repurchase agreements acquired with remaining maturities of 60 days or less are valued at their amortized cost (adjusted for the accretion of any discount or amortization of any premium) unless the issuer's creditworthiness is impaired or other factors indicate that amortized cost is not an accurate estimate of the investment's fair value, in which case it would be valued in the same manner as a longer-term security. |
| ■ | Derivative contracts listed on exchanges are valued at their reported settlement or closing price. |
| ■ | Over-the-counter (OTC) derivative contracts are fair valued using price evaluations provided by a pricing service approved by the Trustees. |
| ■ | For securities that are fair valued in accordance with procedures established by and under the general supervision of the Trustees, certain factors may be considered such as: the purchase price of the security, information obtained by contacting the issuer, analysis of the issuer's financial statements or other available documents, fundamental analytical data, the nature and duration of restrictions on disposition, the movement of the market in which the security is normally traded and public trading in similar securities of the issuer or comparable issuers. |
If the Fund cannot obtain a price or price evaluation from a pricing service for an investment, the Fund may attempt to value the investment based upon the mean of bid and asked quotations or fair value the investment based on price evaluations, from one or more dealers. If any price, quotation, price evaluation or other pricing source is not readily available when the NAV is calculated, or if the Fund cannot obtain price evaluations from a pricing service or from
Annual Shareholder Report
more than one dealer for an investment within a reasonable period of time as set forth in the Fund's valuation policies and procedures, the Fund uses the fair value of the investment determined in accordance with the procedures described below. There can be no assurance that the Fund could purchase or sell an investment at the price used to calculate the Fund's NAV.
Fair Valuation and Significant Events Procedures
The Trustees have appointed a Valuation Committee comprised of officers of the Fund, Federated Global Investment Management Corp. (“Adviser”) and certain of the Adviser's affiliated companies to determine fair value of securities and in overseeing the calculation of the NAV. The Trustees have also authorized the use of pricing services recommended by the Valuation Committee to provide fair value evaluations of the current value of certain investments for purposes of calculating the NAV. The Valuation Committee employs various methods for reviewing third-party pricing-service evaluations including periodic reviews of third-party pricing services' policies, procedures and valuation methods (including key inputs and assumptions), transactional back-testing, comparisons of evaluations of different pricing services and review of price challenges by the Adviser based on recent market activity. In the event that market quotations and price evaluations are not available for an investment, the Valuation Committee determines the fair value of the investment in accordance with procedures adopted by the Trustees. The Trustees periodically review and approve the fair valuations made by the Valuation Committee and any changes made to the procedures.
Factors considered by pricing services in evaluating an investment include the yields or prices of investments of comparable quality, coupon, maturity, call rights and other potential prepayments, terms and type, reported transactions, indications as to values from dealers and general market conditions. Some pricing services provide a single price evaluation reflecting the bid-side of the market for an investment (a “bid” evaluation). Other pricing services offer both bid evaluations and price evaluations indicative of a price between the prices bid and asked for the investment (a “mid” evaluation). The Fund normally uses bid evaluations for U.S. Treasury and Agency securities, mortgage-backed securities and municipal securities. The Fund normally uses mid evaluations for other types of fixed-income securities and OTC derivative contracts. In the event that market quotations and price evaluations are not available for an investment, the fair value of the investment is determined in accordance with procedures adopted by the Trustees.
The Trustees also have adopted procedures requiring an investment to be priced at its fair value whenever the Adviser determines that a significant event affecting the value of the investment has occurred between the time as of which the price of the investment would otherwise be determined and the time as of which the NAV is computed. An event is considered significant if there is both an affirmative expectation that the investment's value will change in response to the event and a reasonable basis for quantifying the resulting change in value. Examples of significant events that may occur after the close of the principal market on which a security is traded, or after the time of a price evaluation provided by a pricing service or a dealer, include:
| ■ | With respect to securities traded in foreign markets, significant trends in U.S. equity markets or in the trading of foreign securities index futures contracts; |
| ■ | Political or other developments affecting the economy or markets in which an issuer conducts its operations or its securities are traded; and |
| ■ | Announcements concerning matters such as acquisitions, recapitalizations, litigation developments, a natural disaster affecting the issuer's operations or regulatory changes or market developments affecting the issuer's industry. |
Annual Shareholder Report
The Trustees have approved the use of a pricing service to determine the fair value of equity securities traded principally in foreign markets when the Adviser determines that there has been a significant trend in the U.S. equity markets or in index futures trading. For other significant events, the Fund may seek to obtain more current quotations or price evaluations from alternative pricing sources. If a reliable alternative pricing source is not available, the Fund will determine the fair value of the investment using another method approved by the Trustees.
Repurchase Agreements
The Fund may invest in repurchase agreements for short-term liquidity purposes. It is the policy of the Fund to require the other party to a repurchase agreement to transfer to the Fund's custodian or sub-custodian eligible securities or cash with a market value (after transaction costs) at least equal to the repurchase price to be paid under the repurchase agreement. The eligible securities are transferred to accounts with the custodian or sub-custodian in which the Fund holds a “securities entitlement” and exercises “control” as those terms are defined in the Uniform Commercial Code. The Fund has established procedures for monitoring the market value of the transferred securities and requiring the transfer of additional eligible securities if necessary to equal at least the repurchase price. These procedures also allow the other party to require securities to be transferred from the account to the extent that their market value exceeds the repurchase price or in exchange for other eligible securities of equivalent market value.
The insolvency of the other party or other failure to repurchase the securities may delay the disposition of the underlying securities or cause the Fund to receive less than the full repurchase price. Under the terms of the repurchase agreement, any amounts received by the Fund in excess of the repurchase price and related transaction costs must be remitted to the other party.
The Fund may enter into repurchase agreements in which eligible securities are transferred into joint trading accounts maintained by the custodian or sub-custodian for investment companies and other clients advised by the Fund's Adviser and its affiliates. The Fund will participate on a pro rata basis with the other investment companies and clients in its share of the securities transferred under such repurchase agreements and in its share of proceeds from any repurchase or other disposition of such securities.
Investment Income, Gains and Losses, Expenses and Distributions
Investment transactions are accounted for on a trade-date basis. Realized gains and losses from investment transactions are recorded on an identified-cost basis. Interest income and expenses are accrued daily. Dividend income and distributions to shareholders are recorded on the ex-dividend date. Foreign dividends are recorded on the ex-dividend date or when the Fund is informed of the ex-dividend date. Distributions of net investment income are declared daily and paid monthly. Non-cash dividends included in dividend income, if any, are recorded at fair value.
Premium and Discount Amortization
All premiums and discounts on fixed-income securities are amortized/accreted using the effective-interest-rate method.
Annual Shareholder Report
Federal Taxes
It is the Fund's policy to comply with the Subchapter M provision of the Internal Revenue Code (the “Code”) and to distribute to shareholders each year substantially all of its income. Accordingly, no provision for federal income tax is necessary. As of and during the year ended November 30, 2013, the Fund did not have a liability for any uncertain tax positions. The Fund recognizes interest and penalties, if any, related to tax liabilities as income tax expense in the Statement of Operations. As of November 30, 2013, tax years 2011 through 2013 remain subject to examination by the Fund's major tax jurisdictions, which include the United States of America and the Commonwealth of Massachusetts.
The Fund may be subject to taxes imposed by governments of countries in which it invests. Such taxes are generally based on either income or gains earned or repatriated. The Fund accrues and applies such taxes to net investment income, net realized gains and net unrealized gains as income and/or gains are earned.
When-Issued and Delayed-Delivery Transactions
The Fund may engage in when-issued or delayed-delivery transactions. The Fund records when-issued securities on the trade date and maintains security positions such that sufficient liquid assets will be available to make payment for the securities purchased. Securities purchased on a when-issued or delayed-delivery basis are marked to market daily and begin earning interest on the settlement date. Losses may occur on these transactions due to changes in market conditions or the failure of counterparties to perform under the contract.
Futures Contracts
The Fund purchases and sells financial futures contracts to manage country and market risk. Upon entering into a financial futures contract with a broker, the Fund is required to deposit in a segregated account a specified amount of cash or U.S. government securities. Futures contracts are valued daily and unrealized gains or losses are recorded in a “variation margin” account. Daily, the Fund receives from or pays to the broker a specified amount of cash based upon changes in the variation margin account. When a contract is closed, the Fund recognizes a realized gain or loss. Futures contracts have market risks, including the risk that the change in the value of the contract may not correlate with the changes in the value of the underlying securities. There is minimal counterparty risk to the Fund since futures are exchange traded and the exchange's clearing house, as counterparty to all exchange traded futures, guarantees the futures against default.
At November 30, 2013, the Fund had no outstanding futures contracts.
Foreign Exchange Contracts
The Fund may enter into foreign exchange contracts to manage currency and market risk. Purchased contracts are used to acquire exposure to foreign currencies, whereas, contracts to sell are used to hedge the Fund's securities against currency fluctuations. Risks may arise upon entering into these transactions from the potential inability of counterparties to meet the terms of their commitments and from unanticipated movements in security prices or foreign exchange rates. The foreign exchange contracts are adjusted by the daily exchange rate of the underlying currency and any gains or losses are recorded for financial statement purposes as unrealized until the settlement date.
Annual Shareholder Report
Foreign exchange contracts are subject to Master Netting Agreements (MNA) which are agreements between the Fund and its counterparties that provides for the net settlement of all transactions and collateral with the Fund, through a single payment, in the event of default or termination. Amounts presented on the Portfolio of Investments and Statement of Assets and Liabilities are not net settlement amounts but gross. Foreign exchange contracts outstanding at period end, including net unrealized appreciation/depreciation or net settlement amounts, are listed after the Fund's Portfolio of Investments.
The average value at settlement date payable and receivable of foreign exchange contracts purchased and sold by the Fund throughout the period was $38,457 and $46,461, respectively. This is based on amounts held as of each month-end throughout the fiscal period.
Foreign Currency Translation
The accounting records of the Fund are maintained in U.S. dollars. All assets and liabilities denominated in foreign currencies (FCs) are translated into U.S. dollars based on the rates of exchange of such currencies against U.S. dollars on the date of valuation. Purchases and sales of securities, income and expenses are translated at the rate of exchange quoted on the respective date that such transactions are recorded. The Fund does not isolate that portion of the results of operations resulting from changes in foreign exchange rates on investments from the fluctuations arising from changes in market prices of securities held. Such fluctuations are included with the net realized and unrealized gain or loss from investments.
Reported net realized foreign exchange gains or losses arise from sales of portfolio securities, sales and maturities of short-term securities, sales of FCs, currency gains or losses realized between the trade and settlement dates on securities transactions, the difference between the amounts of dividends, interest and foreign withholding taxes recorded on the Fund's books and the U.S. dollar equivalent of the amounts actually received or paid. Net unrealized foreign exchange gains and losses arise from changes in the value of assets and liabilities other than investments in securities at fiscal year end, resulting from changes in the exchange rate.
Additional Disclosure Related to Derivative Instruments
| Fair Value of Derivative Instruments |
| | Asset | Liability |
| | Statement of
Assets and
Liabilities
Location | Fair
Value | Statement of
Assets and
Liabilities
Location | Fair
Value |
Derivatives not accounted for as
hedging instruments under ASC
Topic 815 | | | | |
| Foreign exchange contracts | Unrealized
appreciation
on foreign
exchange
contracts | $46,556 | Unrealized
depreciation
on foreign
exchange
contracts | $15,855 |
Annual Shareholder Report
The Effect of Derivative Instruments on the Statement of Operations for the Year Ended November 30, 2013
| Amount of Realized Gain or (Loss) on Derivatives Recognized in Income |
| | Forward Currency
Contracts |
| Foreign exchange contracts | $49,377 |
| Change in Unrealized Appreciation or (Depreciation) on Derivatives Recognized in Income |
| | Forward Currency
Contracts |
| Foreign exchange contracts | $(17,728) |
Other
The preparation of financial statements in conformity with GAAP requires management to make estimates and assumptions that affect the amounts of assets, liabilities, expenses and revenues reported in the financial statements. Actual results could differ from those estimated.
3. SHARES OF BENEFICIAL INTEREST
The following table summarizes share activity:
| Year Ended November 30 | 2013 | 2012 |
| Shares sold | 3,991 | 5,665 |
| Shares issued to shareholders in payment of distributions declared | 12,150 | 3,708 |
| Shares redeemed | (484) | (1,825) |
| NET CHANGE RESULTING FROM FUND SHARE TRANSACTIONS | 15,657 | 7,548 |
4. FEDERAL TAX INFORMATION
The timing and character of income and capital gain distributions are determined in accordance with income tax regulations, which may differ from GAAP. These differences are due to differing treatments for foreign currency transactions.
For the year ended November 30, 2013, permanent differences identified and reclassified among the components of net assets were as follows:
| Increase (Decrease) |
Undistributed
Net Investment
Income (Loss) | Accumulated
Net Realized
Gain (Loss) |
| $(18,719) | $18,719 |
Net investment income (loss), net realized gains (losses) and net assets were not affected by the reclassification.
Annual Shareholder Report
The tax character of distributions as reported on the Statement of Changes in Net Assets for the years ended November 30, 2013 and 2012, was as follows:
| | 2013 | 2012 |
| Ordinary income | $129,207 | $34,777 |
| Long-term capital gains | $6,687 | $— |
As of November 30, 2013, the components of distributable earnings on a tax basis were as follows:
| Undistributed ordinary income | $ 236,877 |
| Undistributed long-term capital gains | $ 383,748 |
| Net unrealized appreciation | $ 2,740,104 |
The difference between book-basis and the tax-basis net unrealized appreciation/depreciation is attributable to differing treatments for the unrealized gains and losses on foreign currency contracts and the realization for tax purposes of unrealized gains on investments in passive foreign investment companies.
At November 30, 2013, the cost of investments for federal tax purposes was $10,830,458. The net unrealized appreciation of investments for federal tax purposes excluding: (a) any unrealized appreciation/depreciation resulting from the translation from FCs to U.S. dollars of assets and liabilities other than investments in securities; and (b) outstanding foreign currency commitments was $2,740,346. This consists of net unrealized appreciation from investments for those securities having an excess of value over cost of $2,875,069 and net unrealized depreciation from investments for those securities having an excess of cost over value of $134,723.
5. INVESTMENT ADVISER FEE AND OTHER TRANSACTIONS WITH AFFILIATES
Investment Adviser Fee
The advisory agreement between the Fund and the Adviser provides for an annual fee equal to 0.90% on the Fund's average daily net assets. Subject to the terms described in the Expense Limitation note, the Adviser may also voluntarily choose to waive any portion of its fee and/or reimburse certain operating expenses of the Fund. For the year ended November 30, 2013, the Adviser voluntarily waived $110,138 of its fee and voluntarily reimbursed $89,009 of other operating expenses.
Annual Shareholder Report
Administrative Fee
Federated Administrative Services (FAS), under the Administrative Services Agreement, provides the Fund with administrative personnel and services. For purposes of determining the appropriate rate breakpoint, “Investment Complex” is defined as all of the Federated Funds subject to a fee under the Administrative Services Agreement. The fee paid to FAS is based on the average daily net assets of the Investment Complex as specified below, plus certain out-of-pocket expenses:
| Administrative Fee | Average Daily Net Assets
of the Investment Complex |
| 0.150% | on the first $5 billion |
| 0.125% | on the next $5 billion |
| 0.100% | on the next $10 billion |
| 0.075% | on assets in excess of $20 billion |
Subject to the terms described in the Expense Limitation note, FAS may voluntarily choose to waive any portion of its fee. For the year ended November 30, 2013, the fee paid to FAS was 0.078% of average daily net assets of the Fund.
Expense Limitation
The Adviser and certain of its affiliates (which may include FAS) have voluntarily agreed to waive their respective fees and/or reimburse expenses so that the total annual fund operating expenses (as shown in the financial highlights, excluding extraordinary expenses and proxy-related expenses paid by the Fund, if any) paid by the Fund's Institutional Shares (after the voluntary waivers and reimbursements) will not exceed 1.15% (the “Fee Limit”), respectively, up to but not including the later of (the “Termination Date”): (a) February 1, 2015; or (b) the date of the Fund's next effective Prospectus. While the Adviser and its applicable affiliates currently do not anticipate terminating or increasing these arrangements prior to the Termination Date, these arrangements may only be terminated or the Fee Limit increased prior to the Termination Date with the agreement of the Trustees.
General
Certain Officers and Trustees of the Fund are Officers and Directors or Trustees of certain of the above companies. To efficiently facilitate payment, Directors'/Trustees' fees and certain expenses related to conducting meetings of the Directors/Trustees and other miscellaneous expenses are paid by an affiliate of the Adviser which in due course are reimbursed by the Fund.
Annual Shareholder Report
Transactions Involving Affiliated Holdings
Affiliated holdings are investment companies which are managed by the Adviser or an affiliate of the Adviser. The Adviser has agreed to reimburse the Fund for certain investment adviser fees as a result of transactions in other affiliated investment companies. For the year ended November 30, 2013, the Adviser reimbursed $196. Transactions involving the affiliated holding during the year ended November 30, 2013, were as follows:
| | Federated
Prime Value
Obligations Fund,
Institutional
Shares |
| Balance of Shares Held 11/30/2012 | 73,409 |
| Purchases/Additions | 3,241,632 |
| Sales/Reductions | (3,225,048) |
| Balance of Shares Held 11/30/2013 | 89,993 |
| Value | $89,993 |
| Dividend Income | $177 |
6. Investment TRANSACTIONS
Purchases and sales of investments, excluding long-term U.S. government securities and short-term obligations, for the year ended November 30, 2013, were as follows:
| Purchases | $5,882,797 |
| Sales | $5,783,064 |
7. CONCENTRATION OF RISK
The Fund invests in securities of non-U.S. issuers. Political or economic developments may have an effect on the liquidity and volatility of portfolio securities and currency holdings.
8. LINE OF CREDIT
The Fund participates in a $100,000,000 unsecured, uncommitted revolving line of credit (LOC) agreement with PNC Bank. The LOC was made available for extraordinary or emergency purposes, primarily for financing redemption payments. Borrowings are charged interest at a rate offered to the Fund by PNC Bank at the time of the borrowing. As of November 30, 2013, there were no outstanding loans. During the year ended November 30, 2013, the Fund did not utilize the LOC.
9. INTERFUND LENDING
Pursuant to an Exemptive Order issued by the Securities and Exchange Commission, the Fund, along with other funds advised by subsidiaries of Federated Investors, Inc., may participate in an interfund lending program. This program provides an alternative credit facility allowing the Fund to borrow from other participating affiliated funds. As of November 30, 2013, there were no outstanding loans. During the year ended November 30, 2013, the program was not utilized.
Annual Shareholder Report
10. FEDERAL TAX INFORMATION (UNAUDITED)
For the fiscal year ended November 30, 2013, 100% of total ordinary income distributions made by the Fund are qualifying dividends which may be subject to a maximum tax rate of 15%, as provided for by the Jobs and Growth Tax Relief Act of 2003. Complete information is reported in conjunction with the reporting of your distributions on Form 1099-DIV.
Of the ordinary income distributions made by the Fund during the year ended November 30, 2013, 58.87% qualify for the dividend received deduction available to corporate shareholders.
If the Fund meets the requirements of Section 853 of the Internal Revenue Code of 1986, as amended, the Fund will pass through to its shareholders credits for foreign taxes paid.
For the fiscal year ended November 30, 2013, the Fund derived $193,257 of gross income from foreign sources and paid foreign taxes of $23,491.
Annual Shareholder Report
Report of Independent Registered Public Accounting Firm
TO THE BOARD OF trustees of federated equity funds and shareholders OF Federated GLOBAL EQUITY fund:
We have audited the accompanying statement of assets and liabilities, including the portfolio of investments, of the Federated Global Equity Fund (the “Fund”), a portfolio of Federated Equity Funds, as of November 30, 2013, and the related statement of operations for the year then ended, the statement of changes in net assets for each of the years in the two-year period then ended, and financial highlights for each of the years or periods in the three-year period then ended. These financial statements and financial highlights are the responsibility of the Fund's management. Our responsibility is to express an opinion on these financial statements and financial highlights based on our audits.
We conducted our audits in accordance with the standards of the Public Company Accounting Oversight Board (United States). Those standards require that we plan and perform the audit to obtain reasonable assurance about whether the financial statements and financial highlights are free of material misstatement. An audit includes examining, on a test basis, evidence supporting the amounts and disclosures in the financial statements. Our procedures included confirmation of securities owned as of November 30, 2013, by correspondence with the custodian, transfer agent and brokers or by other appropriate auditing procedures. An audit also includes assessing the accounting principles used and significant estimates made by management, as well as evaluating the overall financial statement presentation. We believe that our audits provide a reasonable basis for our opinion.
In our opinion, the financial statements and financial highlights referred to above present fairly, in all material respects, the financial position of the Federated Global Equity Fund as of November 30, 2013, the results of its operations for the year then ended, the changes in its net assets for each of the years in the two-year period then ended, and the financial highlights for each of the years or periods in the three-year period then ended, in conformity with U.S. generally accepted accounting principles.
Boston, Massachusetts
January 23, 2014
Annual Shareholder Report
Shareholder Expense Example (unaudited)
As a shareholder of the Fund, you incur ongoing costs, including management fees and to the extent applicable, distribution (12b-1) fees and/or shareholder services fees and other Fund expenses. This Example is intended to help you to understand your ongoing costs (in dollars) of investing in the Fund and to compare these costs with the ongoing costs of investing in other mutual funds. It is based on an investment of $1,000 invested at the beginning of the period and held for the entire period from June 1, 2013 to November 30, 2013.
ACTUAL EXPENSES
The first section of the table below provides information about actual account values and actual expenses. You may use the information in this section, together with the amount you invested, to estimate the expenses that you incurred over the period. Simply divide your account value by $1,000 (for example, an $8,600 account value divided by $1,000 = 8.6), then multiply the result by the number in the first section under the heading entitled “Expenses Paid During Period” to estimate the expenses attributable to your investment during this period.
HYPOTHETICAL EXAMPLE FOR COMPARISON PURPOSES
The second section of the table below provides information about hypothetical account values and hypothetical expenses based on the Fund's actual expense ratio and an assumed rate of return of 5% per year before expenses, which is not the Fund's actual return. Thus, you should not use the hypothetical account values and expenses to estimate the actual ending account balance or your expenses for the period. Rather, these figures are required to be provided to enable you to compare the ongoing costs of investing in the Fund with other funds. To do so, compare this 5% hypothetical example with the 5% hypothetical examples that appear in the shareholder reports of the other funds.
Please note that the expenses shown in the table are meant to highlight your ongoing costs only. Therefore, the second section of the table is useful in comparing ongoing costs only, and will not help you determine the relative total costs of owning different funds.
| | Beginning
Account Value
6/1/2013 | Ending
Account Value
11/30/2013 | Expenses Paid
During Period1 |
| Actual | $1,000 | $1,113.90 | $6.09 |
Hypothetical (assuming a 5% return
before expenses) | $1,000 | $1,019.30 | $5.82 |
| 1 | Expenses are equal to the Fund's annualized net expense ratio of 1.15%, multiplied by the average account value over the period, multiplied by 183/365 (to reflect the one-half-year period). |
Annual Shareholder Report
Shareholder Meeting Results (unaudited)
A Special Meeting of Shareholders of Federated Equity Funds (the “Trust”), of which the Fund is a portfolio, was held on October 28, 2013. On August 29, 2013, the record date for shareholders voting at the meeting, there were 2,777,709,632.389 total outstanding shares of the Trust.
The following item was considered by shareholders of the Trust and the results of their voting were as follows:
AGENDA ITEM
Proposal to elect certain Trustees of the Trust:1
| Name | For | Withheld |
| John T. Collins | 2,104,364,292.660 | 29,376,009.057 |
| Maureen Lally-Green | 2,104,554,202.739 | 29,186,098.978 |
| Thomas M. O'Neill | 2,104,050,166.003 | 29,690,135.714 |
| P. Jerome Richey | 2,103,363,407.698 | 30,376,894.019 |
| 1 | The following Trustees continued their terms:
John F. Donahue, J. Christopher Donahue, Maureen Lally-Green (having been previously appointed by the Board), Peter E. Madden, Charles F. Mansfield, Jr., Thomas M. O'Neill (having been previously appointed by the Board), and John S. Walsh. |
Board of Trustees and Trust Officers
The Board of Trustees is responsible for managing the Corporation's business affairs and for exercising all the Corporation's powers except those reserved for the shareholders. The following tables give information about each Trustee and the senior officers of the Fund. Where required, the tables separately list Trustees who are “interested persons” of the Fund (i.e., “Interested” Trustees) and those who are not (i.e., “Independent” Trustees). Unless otherwise noted, the address of each person listed is Federated Investors Tower, 1001 Liberty Avenue, Pittsburgh, PA 15222. The address of all Independent Trustees listed is 4000 Ericsson Drive, Warrendale, PA 15086-7561; Attention: Mutual Fund Board. As of December 31, 2013, the Trust comprised 13 portfolio(s), and the Federated Fund Family consisted of 42 investment companies (comprising 135 portfolios). Unless otherwise noted, each Officer is elected annually. Unless otherwise noted, each Trustee oversees all portfolios in the Federated Fund Family and serves for an indefinite term. The Fund's Statement of Additional Information includes additional information about Trust Trustees and is available, without charge and upon request, by calling 1-800-341-7400.
In Memoriam - John F. Cunningham, Independent Trustee
With deep sadness, Federated announces the passing of John F. Cunningham, who served as an independent member of the Board of the Federated Fund Family since 1999. Mr. Cunningham's savvy business acumen and incisive intellect made him a powerful force on the Federated Fund Board. He was an advocate for shareholders and a respected colleague within the Federated family. Mr. Cunningham enjoyed an outstanding career in technology, having served as President and in other Senior Executive positions with leading companies in the industry. Federated expresses gratitude to Mr. Cunningham for his fine contributions as a Board member, colleague and friend. He will be greatly missed.
Interested Trustees Background
Name
Birth Date
Positions Held with Trust
Date Service Began | Principal Occupation(s) for Past Five Years,
Other Directorships Held and Previous Position(s) |
John F. Donahue*
Birth Date: July 28, 1924
Trustee
Began serving: April 1984 | Principal Occupations: Director or Trustee of the Federated Fund Family; Chairman and Director, Federated Investors, Inc.; Chairman of the Federated Fund Family's Executive Committee.
Previous Positions: Chairman of the Federated Fund Family; Trustee, Federated Investment Management Company; Chairman and Director, Federated Investment Counseling. |
Annual Shareholder Report
Name
Birth Date
Positions Held with Trust
Date Service Began | Principal Occupation(s) for Past Five Years,
Other Directorships Held and Previous Position(s) |
J. Christopher Donahue*
Birth Date: April 11, 1949
President and Trustee
Began serving: January 2000 | Principal Occupations: Principal Executive Officer and President of certain of the Funds in the Federated Fund Family; Director or Trustee of the Funds in the Federated Fund Family; President, Chief Executive Officer and Director, Federated Investors, Inc.; Chairman and Trustee, Federated Investment Management Company; Trustee, Federated Investment Counseling; Chairman and Director, Federated Global Investment Management Corp.; Chairman, Federated Equity Management Company of Pennsylvania and Passport Research, Ltd. (investment advisory subsidiary of Federated); Trustee, Federated Shareholder Services Company; Director, Federated Services Company.
Previous Positions: President, Federated Investment Counseling; President and Chief Executive Officer, Federated Investment Management Company, Federated Global Investment Management Corp. and Passport Research, Ltd. |
| * | Family relationships and reasons for “interested” status: John F. Donahue is the father of J. Christopher Donahue; both are “interested” due to their beneficial ownership of shares of Federated Investors, Inc. and the positions they hold with Federated and its subsidiaries. |
INDEPENDENT Trustees Background
Name
Birth Date
Positions Held with Trust
Date Service Began | Principal Occupation(s) for Past Five Years,
Other Directorships Held, Previous Position(s) and Qualifications |
John T. Collins
Birth Date: January 24, 1947
Trustee
Began serving: October 2013 | Principal Occupations: Director or Trustee of the Federated Fund Family; Chairman and CEO, The Collins Group, Inc. (a private equity firm).
Other Directorships Held: Chairman Emeriti, Bentley University; Director, Sterling Suffolk Downs, Inc.; Former Director, National Association of Printers and Lithographers.
Previous Positions: Director and Audit Committee Member, Bank of America Corp.
Qualifications: Business management and director experience. |
Annual Shareholder Report
Name
Birth Date
Positions Held with Trust
Date Service Began | Principal Occupation(s) for Past Five Years,
Other Directorships Held, Previous Position(s) and Qualifications |
Maureen Lally-Green
Birth Date: July 5, 1949
Trustee
Began serving: August 2009 | Principal Occupations: Director or Trustee of the Federated Fund Family; Associate General Secretary and Director, Office for Church Relations, Diocese of Pittsburgh; Adjunct Professor of Law, Duquesne University School of Law; Superior Court of Pennsylvania (service began 1998 and ended July 2009).
Other Directorships Held: Director, Consol Energy (service started June 2013); Director, Auberle (service ended December 2013); Member, Pennsylvania State Board of Education; Director, Saint Vincent College; Director, Ireland Institute of Pittsburgh (service ended December 2013); Director and Chair, UPMC Mercy Hospital; Regent, St. Vincent Seminary; Director, Epilepsy Foundation of Western and Central Pennsylvania; Director, Saint Thomas More Society (service ended December 2013); Director, Our Campaign for the Church Alive!, Inc.; Director, Pennsylvania Bar Institute (2013-present); Director, Cardinal Wuerl North Catholic High School (2013-present).
Previous Position: Professor of Law, Duquesne University School of Law, Pittsburgh (1983-1998).
Qualifications: Legal and director experience. |
Peter E. Madden
Birth Date: March 16, 1942
Trustee
Began serving: November 1991 | Principal Occupation: Director or Trustee, and Chairman of the Board of Directors or Trustees, of the Federated Fund Family.
Previous Positions: Representative, Commonwealth of Massachusetts General Court; President, Chief Operating Officer and Director, State Street Bank and Trust Company and State Street Corporation (retired); Director, VISA USA and VISA International; Chairman and Director, Massachusetts Bankers Association; Director, Depository Trust Corporation; Director, The Boston Stock Exchange.
Qualifications: Business management, mutual fund services and director experience. |
Charles F. Mansfield, Jr.
Birth Date: April 10, 1945
Trustee
Began serving: January 1999 | Principal Occupations: Director or Trustee of the Federated Fund Family; Management Consultant.
Previous Positions: Chief Executive Officer, PBTC International Bank; Partner, Arthur Young & Company (now Ernst & Young LLP); Chief Financial Officer of Retail Banking Sector, Chase Manhattan Bank; Senior Vice President, HSBC Bank USA (formerly Marine Midland Bank); Vice President, Citibank; Assistant Professor of Banking and Finance, Frank G. Zarb School of Business, Hofstra University; Executive Vice President, DVC Group, Inc. (marketing, communications and technology).
Qualifications: Banking, business management, education and director experience. |
Annual Shareholder Report
Name
Birth Date
Positions Held with Trust
Date Service Began | Principal Occupation(s) for Past Five Years,
Other Directorships Held, Previous Position(s) and Qualifications |
Thomas M. O'Neill
Birth Date: June 14, 1951
Trustee
Began serving: October 2006 | Principal Occupations: Director or Trustee, Vice Chairman of the Audit Committee of the Federated Fund Family; Sole Proprietor, Navigator Management Company (investment and strategic consulting).
Other Directorships Held: Board of Overseers, Children's Hospital of Boston; Visiting Committee on Athletics, Harvard College; Board of Directors, Medicines for Humanity; Board of Directors, The Golisano Children's Museum of Naples, Florida.
Previous Positions: Chief Executive Officer and President, Managing Director and Chief Investment Officer, Fleet Investment Advisors; President and Chief Executive Officer, Aeltus Investment Management, Inc.; General Partner, Hellman, Jordan Management Co., Boston, MA; Chief Investment Officer, The Putnam Companies, Boston, MA; Credit Analyst and Lending Officer, Fleet Bank; Director and Consultant, EZE Castle Software (investment order management software); Director, Midway Pacific (lumber).
Qualifications: Business management, mutual fund, director and investment experience. |
P. Jerome Richey
Birth Date: February 23, 1949
Trustee
Began serving: October 2013 | Principal Occupations: Director or Trustee of the Federated Fund Family; General Counsel, University of Pittsburgh.
Other Directorships Held: Board Chairman, Epilepsy Foundation of Western Pennsylvania; Board Member, World Affairs Council of Pittsburgh.
Previous Positions: Chief Legal Officer and Executive Vice President, CONSOL Energy Inc.; Shareholder, Buchanan Ingersoll & Rooney PC (a law firm).
Qualifications: Business management, legal and director experience. |
John S. Walsh
Birth Date: November 28, 1957
Trustee
Began serving: January 1999 | Principal Occupations: Director or Trustee, Chairman of the Audit Committee of the Federated Fund Family; President and Director, Heat Wagon, Inc. (manufacturer of construction temporary heaters); President and Director, Manufacturers Products, Inc. (distributor of portable construction heaters); President, Portable Heater Parts, a division of Manufacturers Products, Inc.
Previous Position: Vice President, Walsh & Kelly, Inc.
Qualifications: Business management and director experience. |
Annual Shareholder Report
OFFICERS
Name
Birth Date
Address
Positions Held with Trust
Date Service Began | Principal Occupation(s) for Past Five Years
and Previous Position(s) |
John W. McGonigle
Birth Date: October 26, 1938
EXECUTIVE VICE PRESIDENT AND SECRETARY
Officer since: April 1984 | Principal Occupations: Executive Vice President and Secretary of the Federated Fund Family; Vice Chairman, Executive Vice President, Secretary and Director, Federated Investors, Inc.
Previous Positions: Trustee, Federated Investment Management Company and Federated Investment Counseling; Director, Federated Global Investment Management Corp., Federated Services Company and Federated Securities Corp. |
Lori A. Hensler
Birth Date: January 6, 1967
TREASURER
Officer since: April 2013 | Principal Occupations: Principal Financial Officer and Treasurer of the Federated Fund Family; Senior Vice President, Federated Administrative Services; Financial and Operations Principal for Federated Securities Corp. and Edgewood Services, Inc.; and Assistant Treasurer, Federated Investors Trust Company. Ms. Hensler has received the Certified Public Accountant designation.
Previous Positions: Controller of Federated Investors, Inc.; Senior Vice President and Assistant Treasurer, Federated Investors Management Company; Treasurer, Federated Investors Trust Company; Assistant Treasurer, Federated Administrative Services, Federated Administrative Services, Inc., Federated Securities Corp., Edgewood Services, Inc., Federated Advisory Services Company, Federated Equity Management Company of Pennsylvania, Federated Global Investment Management Corp., Federated Investment Counseling, Federated Investment Management Company, Passport Research, Ltd., and Federated MDTA, LLC; Financial and Operations Principal for Federated Securities Corp., Edgewood Services, Inc. and Southpointe Distribution Services, Inc. |
Peter J. Germain
Birth Date: September 3, 1959
CHIEF LEGAL OFFICER
Officer since: January 2005 | Principal Occupations: Mr. Germain is Chief Legal Officer of the Federated Fund Family. He is General Counsel and Vice President, Federated Investors, Inc.; President, Federated Administrative Services and Federated Administrative Services, Inc.; Vice President, Federated Securities Corp.; Secretary, Federated Private Asset Management, Inc.; and Secretary, Retirement Plan Service Company of America. Mr. Germain joined Federated in 1984 and is a member of the Pennsylvania Bar Association.
Previous Positions: Deputy General Counsel, Special Counsel, Managing Director of Mutual Fund Services, Federated Investors, Inc.; Senior Vice President, Federated Services Company; and Senior Corporate Counsel, Federated Investors, Inc. |
Richard B. Fisher
Birth Date: May 17, 1923
VICE PRESIDENT
Officer since: April 1987 | Principal Occupations: Vice Chairman or Vice President of some of the Funds in the Federated Fund Family; Vice Chairman, Federated Investors, Inc.; Chairman, Federated Securities Corp.
Previous Positions: President and Director or Trustee of some of the Funds in the Federated Fund Family; Executive Vice President, Federated Investors, Inc.; Director and Chief Executive Officer, Federated Securities Corp. |
Annual Shareholder Report
Name
Birth Date
Address
Positions Held with Trust
Date Service Began | Principal Occupation(s) for Past Five Years
and Previous Position(s) |
Brian P. Bouda
Birth Date: February 28, 1947
CHIEF COMPLIANCE OFFICER AND SENIOR VICE PRESIDENT
Officer since: August 2004 | Principal Occupations: Senior Vice President and Chief Compliance Officer of the Federated Fund Family; Vice President and Chief Compliance Officer of Federated Investors, Inc. and Chief Compliance Officer of certain of its subsidiaries. Mr. Bouda joined Federated in 1999 and is a member of the American Bar Association and the State Bar Association of Wisconsin.
Previous Positions: Served in Senior Management positions with a large regional banking organization. |
Stephen F. Auth
Birth Date: September 3, 1956
450 Lexington Avenue
Suite 3700
New York, NY 10017-3943
CHIEF INVESTMENT OFFICER
Officer since: November 2002 | Principal Occupations: Stephen F. Auth is Chief Investment Officer of various Funds in the Federated Fund Family; Executive Vice President, Federated Investment Counseling, Federated Global Investment Management Corp. and Federated Equity Management Company of Pennsylvania.
Previous Positions: Executive Vice President, Federated Investment Management Company and Passport Research, Ltd. (investment advisory subsidiary of Federated); Senior Vice President, Global Portfolio Management Services Division; Senior Vice President, Federated Investment Management Company and Passport Research, Ltd.; Senior Managing Director and Portfolio Manager, Prudential Investments. |
Audrey H. Kaplan
Birth Date: February 20, 1967
VICE PRESIDENT
Officer since: February 2011
Portfolio Manager since: December 2010 | Principal Occupations: Senior Vice President, Senior Portfolio Manager of the Fund's Adviser and Head of the International Equity Team. Audrey H. Kaplan has been the Fund's Portfolio Manager since December 2010. She is Vice President of the Trust with respect to the Fund. Ms. Kaplan is responsible for portfolio management and research in the global equity area.
Previous Positions: Ms. Kaplan has 25 years of investment experience. Prior to joining Federated in August 2007, she managed the Rochdale Atlas Portfolio at Rochdale Investment Management, LLC in New York; was a hedge fund strategy consultant at BlueCrest Capital Management in London; worked in European quantitative strategy for Merrill Lynch in London; researched global emerging markets at Robert Fleming in London; and completed equity, fixed-income and derivative analysis with Salomon Brothers in Tokyo and New York. |
Annual Shareholder Report
Evaluation and Approval of Advisory Contract–May 2013
Federated Global Equity Fund (the “Fund”)
Following a review and recommendation of approval by the Fund's independent trustees, the Fund's Board reviewed and approved at its May 2013 meetings the Fund's investment advisory contract for an additional one-year term. The Board's decision regarding the contract reflects the exercise of its business judgment on whether to continue the existing arrangements.
In this connection, the Federated Funds' Board had previously appointed a Senior Officer, whose duties include specified responsibilities relating to the process by which advisory fees are to be charged to a Federated fund. The Senior Officer has the authority to retain consultants, experts, or staff as may be reasonably necessary to assist in the performance of his duties, reports directly to the Board, and may be terminated only with the approval of a majority of the independent members of the Board. The Senior Officer prepared and furnished to the Board an independent, written evaluation that covered topics discussed below (the “Evaluation”). The Board considered that Evaluation, along with other information, in deciding to approve the advisory contract.
The Board is also familiar with and considered judicial decisions concerning allegedly excessive investment advisory fees, which have indicated that the following factors may be relevant to an Adviser's fiduciary duty with respect to its receipt of compensation from a fund: the nature and quality of the services provided by the Adviser to a fund and its shareholders, including the performance and expenses of the fund and of comparable funds; the Adviser's cost of providing the services, including the profitability to the Adviser of providing advisory services to a fund; the extent to which the Adviser may realize “economies of scale” as a fund grows larger and, if such economies exist, whether they have been shared with a fund and its shareholders or the family of funds; any “fall-out financial benefits” that accrue to the Adviser because of its relationship with a fund (including research services received from brokers that execute fund trades and any fees paid to affiliates of the Adviser for services rendered to a fund); comparative fee structures, including a comparison of fees paid to the Adviser with those paid by similar funds; and the extent to which the Board members are fully informed about all facts the Board deems relevant to its consideration of the Adviser's services and fees. Consistent with these judicial decisions, the Board also considered management fees charged to institutional and other clients of the Adviser for what might be viewed as like services. The Board was aware of these factors and was guided by them in its review of the Fund's advisory contract to the extent it considered them to be appropriate and relevant, as discussed further below.
Annual Shareholder Report
The Board considered and weighed these circumstances in light of its substantial accumulated experience in governing the Fund and working with Federated on matters relating to the Federated funds, and was assisted in its deliberations by independent legal counsel. Throughout the year, and in connection with its May meetings, the Board requested and received substantial and detailed information about the Fund and the Federated organization that was in addition to the extensive materials that comprise and accompany the Senior Officer's Evaluation. Federated provided much of this information at each regular meeting of the Board, and furnished additional substantial information in connection with the May meeting at which the Board's formal review of the advisory contract occurred. At this May meeting, senior management of the Adviser also met with the independent trustees and their counsel to discuss the materials presented and any other matters thought relevant by the Adviser or the trustees. Between regularly scheduled meetings, the Board also received information on particular matters as the need arose. Thus, the Board's consideration of the advisory contract included review of the Senior Officer's Evaluation, accompanying data and additional information covering such matters as: the Adviser's investment philosophy, revenue, profitability, personnel and processes; investment and operating strategies; the Fund's short- and long-term performance (in absolute terms, both on a gross basis and net of expenses, as well as in relationship to its particular investment program and certain competitor or “peer group” funds and/or other benchmarks, as appropriate), and comments on the reasons for performance; the Fund's investment objectives; the Fund's expenses (including the advisory fee itself and the overall expense structure of the Fund, both in absolute terms and relative to similar and/or competing funds, with due regard for contractual or voluntary expense limitations); the use and allocation of brokerage commissions derived from trading the Fund's portfolio securities (if any); and the nature, quality and extent of the advisory and other services provided to the Fund by the Adviser and its affiliates. The Board also considered the preferences and expectations of Fund shareholders; the entrepreneurial risk assumed by the Adviser in sponsoring the funds; the continuing state of competition in the mutual fund industry and market practices; the range of comparable fees for similar funds in the mutual fund industry; the Fund's relationship to the Federated family of funds which include a comprehensive array of funds with different investment objectives, policies and strategies which are available for exchange without the incurrence of additional sales charges; compliance and audit reports concerning the Federated funds and the Federated companies that service them (including communications from regulatory agencies), as well as Federated's responses to any issues raised therein; and relevant developments in the mutual fund industry and how the Federated funds and/or Federated are responding to them. The Board's evaluation process is evolutionary. The criteria considered and the emphasis placed on relevant criteria change in recognition of changing circumstances in the mutual fund marketplace.
Annual Shareholder Report
While mindful that courts have cautioned against giving such comparisons too much weight, the Board has found the use of comparisons of the Fund's fees and expenses to other mutual funds with comparable investment programs to be relevant. The Board focused on comparisons with other similar mutual funds more heavily than non-mutual fund products or services because it is believed that they are more relevant. For example, other mutual funds are the products most like the Fund, they are readily available to Fund shareholders as alternative investment vehicles, and they are the type of investment vehicle in fact chosen and maintained by the Fund's investors. The range of their fees and expenses therefore appears to be a relevant indicator of what consumers have found to be reasonable in the precise marketplace in which the Fund competes.
It was noted in the materials for the Board meeting that for the period covered by the Evaluation, the Fund's investment advisory fee was waived in its entirety. The Board reviewed the contractual fee rate and other expenses of the Fund with the Adviser, noting that the overall expense structure of the Fund, after waivers and expense reimbursements, was above the median of the relevant peer group, but the Board still was satisfied that the overall expense structure of the Fund remained competitive.
By contrast, the Senior Officer has reviewed Federated's fees for providing advisory services to products outside the Federated family of funds (e.g., institutional and separate accounts). He concluded that mutual funds and institutional accounts are inherently different products. Those differences include, but are not limited to, different types of targeted investors; being subject to different laws and regulations; different legal structures; different average account sizes; different associated costs; different portfolio management techniques made necessary by different cash flows; and the time spent by portfolio managers and their teams, funds financial services, legal, compliance and risk management in reviewing securities pricing, addressing different administrative responsibilities, addressing different degrees of risk associated with management and a variety of different costs. The Senior Officer did not consider these fee schedules to be determinative in judging the appropriateness of mutual fund advisory fees.
The Fund's ability to deliver competitive performance when compared to its peer group was also deemed to be relevant by the Board as a useful indicator of how the Adviser is executing the Fund's investment program, which in turn assisted the Board in reaching a conclusion that the nature, extent, and quality of the Adviser's investment management services were such as to warrant continuation of the advisory contract.
The Senior Officer reviewed information compiled by Federated, using data supplied by independent fund ranking organizations, regarding the performance of, and fees charged by, other mutual funds, noting his view that comparisons to fund peer groups are relevant, though not conclusive in judging the reasonableness of proposed fees.
Annual Shareholder Report
For the one-year period covered by the Evaluation, the Fund's performance was above the median of the relevant peer group.
The Board also received financial information about Federated, including information regarding the compensation and benefits Federated derived from its relationships with the Federated funds. This information covered not only the fees under the advisory contracts, but also fees received by Federated's subsidiaries for providing other services to the Federated funds under separate contracts (e.g., for serving as the Federated funds' administrator). The information also detailed any indirect benefit Federated may derive from its receipt of research services from brokers who execute Federated fund trades. In addition, the Board considered the fact that, in order for a fund to be competitive in the marketplace, Federated and its affiliates frequently waived fees and/or reimbursed expenses and have disclosed to fund investors and/or indicated to the Board their intention to do so in the future, where appropriate. Moreover, the Board receives regular reporting as to the institution, adjustment or elimination of these voluntary waivers.
Federated furnished information, requested by the Senior Officer, that reported revenues on a fund-by-fund basis and made estimates of the allocation of expenses on a fund-by-fund basis, using allocation methodologies specified by the Senior Officer. The Senior Officer noted that, while these cost allocation reports apply consistent allocation processes, the inherent difficulties in arbitrarily allocating costs continues to cause the Senior Officer to question the precision of the process and to conclude that such reports may be unreliable, since a single change in an allocation estimate can dramatically alter the resulting estimate of cost and/or profitability of a fund. The allocation information was considered in the analysis by the Board but was determined to be of limited use.
The Board and the Senior Officer also reviewed information compiled by Federated comparing profitability information for Federated to other publicly held fund management companies. In this regard, the Senior Officer noted the limited availability of such information, but nonetheless concluded that Federated's profit margins did not appear to be excessive. The Board agreed with this assessment.
The Senior Officer's Evaluation also discussed the notion of possible realization of “economies of scale” as a fund grows larger. The Board considered in this regard that the Adviser has made significant and long-term investments in areas that support all of the Federated family of funds, such as personnel and processes for the portfolio management, shareholder services, compliance, internal audit, and risk management functions; and systems technology; and that the benefits of these efforts (as well as any economies, should they exist) were likely to be enjoyed by the fund family as a whole. Finally, the Board also noted the absence of any applicable regulatory or industry guidelines on this subject,
Annual Shareholder Report
which (as discussed in the Senior Officer's Evaluation) is compounded by the lack of any common industry practice or general pattern with respect to structuring fund advisory fees with “breakpoints” that serve to reduce the fee as the fund attains a certain size.
The Senior Officer noted that, subject to the comments and recommendations made within his Evaluation, his observations and the information accompanying the Evaluation supported a finding by the Board that the management fees for each of the funds were reasonable. Under these circumstances, no changes were recommended to, and no objection was raised to, the continuation of the Fund's advisory contract.
In its decision to continue an existing investment advisory contract, the Board was mindful of the potential disruptions of the Fund's operations and various risks, uncertainties and other effects that could occur as a result of a decision to terminate or not renew an advisory contract. In particular, the Board recognized that many shareholders have invested in the Fund on the strength of the Adviser's industry standing and reputation and with the expectation that the Adviser will have a continuing role in providing advisory services to the Fund. Thus, the Board's approval of the advisory contract reflected the fact that it is the shareholders who have effectively selected the Adviser by virtue of having invested in the Fund. The Board concluded that, in light of the factors discussed above, including the nature, quality and scope of the services provided to the Fund by the Adviser and its affiliates, continuation of the advisory contract was appropriate.
The Board based its decision to approve the advisory contract on the totality of the circumstances and relevant factors and with a view to past and future long-term considerations. Not all of the factors and considerations identified above were necessarily relevant to the Fund, nor did the Board consider any one of them to be determinative. With respect to the factors that were relevant, the Board's decision to approve the contract reflects its determination that Federated's performance and actions provided a satisfactory basis to support the decision to continue the existing arrangements.
Annual Shareholder Report
Voting Proxies on Fund Portfolio Securities
A description of the policies and procedures that the Fund uses to determine how to vote proxies, if any, relating to securities held in the Fund's portfolio is available, without charge and upon request, by calling 1-800-341-7400. A report on “Form N-PX” of how the Fund voted any such proxies during the most recent 12-month period ended June 30 is available via the Proxy Voting Record (Form N-PX) link associated with the Fund and share class name at www.Federatedinvestors.com/FundInformation. Form N-PX filings are also available at the SEC's website at www.sec.gov.
Quarterly Portfolio Schedule
The Fund files with the SEC a complete schedule of its portfolio holdings, as of the close of the first and third quarters of its fiscal year, on “Form N-Q.” These filings are available on the SEC's website at www.sec.gov and may be reviewed and copied at the SEC's Public Reference Room in Washington, DC. (Call 1-800-SEC-0330 for information on the operation of the Public Reference Room.) You may also access this information via the link to the Fund and share class name at www.Federatedinvestors.com/FundInformation.
Annual Shareholder Report
Mutual funds are not bank deposits or obligations, are not guaranteed by any bank and are not insured or guaranteed by the U.S. government, the Federal Deposit Insurance Corporation, the Federal Reserve Board or any other government agency. Investment in mutual funds involves investment risk, including the possible loss of principal.
This Report is authorized for distribution to prospective investors only when preceded or accompanied by the Fund's Prospectus, which contains facts concerning its objective and policies, management fees, expenses and other information.
Federated Global Equity Fund
Federated Investors Funds
4000 Ericsson Drive
Warrendale, PA 15086-7561
Contact us at FederatedInvestors.com
or call 1-800-341-7400.
Federated Securities Corp., Distributor
CUSIP 314172180
Q450778 (1/14)
Federated is a registered trademark of Federated Investors, Inc.
2014 ©Federated Investors, Inc.
Annual Shareholder Report
November 30, 2013
| Share Class | Ticker |
| A | RIMAX |
| B | ICFBX |
| C | ICFFX |
| R | ICFKX |
| Institutional | ICFIX |
| R6 | ICRSX |
Federated InterContinental Fund
Successor to the Rochdale Atlas Portfolio Established 1998
A Portfolio of Federated Equity Funds
Dear Valued Shareholder,
I am pleased to present the Annual Shareholder Report for your fund covering the period from December 1, 2012 through November 30, 2013. This report includes Management's Discussion of Fund Performance, a complete listing of your fund's holdings, performance information and financial statements along with other important fund information.
In addition, our website, FederatedInvestors.com, offers easy access to Federated resources that include timely fund updates, economic and market insights from our investment strategists, and financial planning tools. We invite you to register to take full advantage of its capabilities.
Thank you for investing with Federated. I hope you find this information useful and look forward to keeping you informed.
Sincerely,
J. Christopher Donahue, President
Not FDIC Insured • May Lose Value • No Bank Guarantee
CONTENTS
| 1 |
| 11 |
| 13 |
| 19 |
| 25 |
| 27 |
| 28 |
| 29 |
| 43 |
| 44 |
| 46 |
| 47 |
| 53 |
| 58 |
| 58 |
Management's Discussion of Fund Performance (unaudited)
The total return of Federated InterContinental Fund (the “Fund”), based on net asset value, for the 12-month reporting period ended November 30, 2013, was 15.91%, 14.97%, 14.98%, 15.64%, 16.27% and 15.91%1 for the Class A Shares, Class B Shares, Class C Shares, Class R Shares, Institutional Shares and Class R6 Shares, respectively. The return of the Fund's benchmark, the Morgan Stanley Capital International All Country World ex USA Index (MSCI ACWI ex USA),2 a broad-based securities market index, was 18.24% for the same period. The Fund's total return for the most recently completed fiscal year reflected actual cash flows, transaction costs and other expenses which were not reflected in the total return of the MSCI ACWI ex USA.
The Fund's investment strategy focused on: (a) country allocation and stock selection; and (b) currency allocation. These were the most significant factors affecting the performance relative to the MSCI ACWI ex USA.
The following discussion will focus on the performance of the Fund's Institutional Shares. The Fund's Institutional Shares underperformed the MSCI ACWI ex USA.
MARKET OVERVIEW
The global stock market rallied over the year as the growth outlook improved and economic risks diminished across the United States and Europe. Several key markets hit all-time highs. Investors gained confidence despite the U.S. debt ceiling and budget crisis and the European debt crisis, both of which were a source of market volatility in previous years. While monetary policy diverged across the world, the U.S. Federal Reserve (the Fed), the European Central Bank (ECB) and the Bank of Japan (BoJ) maintained accommodative monetary policy in the face of fiscal headwinds. The “risk-on/risk-off” investing environment that had driven markets in previous years became less important than global divergences, which were most evident between developed and emerging markets. As developed markets recovered, the growth outlook in emerging markets deteriorated while inflation expectations rose. As G3 (Fed, ECB and BoJ) central banks increased liquidity, several key central banks in the developing world, such as India and Brazil, began to tighten policy. Those conditions, coupled with concerns over an eventual withdrawal of extraordinary liquidity by the Fed, or “Fed tapering,” caused a broad sell-off in emerging markets stocks, bonds and currencies.
The U.S. economy improved during the year, and re-emerged as a leading driver of global growth. A robust corporate sector was able to add 2.3 million jobs, while the corporate earnings outlook remained strong. Despite repeated debt ceiling and budget debates, consumer spending and corporate investment remained healthy and improved. The major U.S. stock benchmarks hit all-time
Annual Shareholder Report
highs, and the U.S. dollar remained strong. The improving economy and Fed comments led to speculation about Fed tapering, which caused volatility in yield sensitive assets. Signs that investors were re-allocating to stocks helped sentiment during the reporting period.
European markets performed strongly during the year as the broader economy shifted from a recession to initial stages of a recovery. The European economy exhibited “very green shoots,” according to the ECB. During the year, the euro-zone Purchasing Manager (PMI) Survey moved from contraction to expansion for the first time in over two years. The economic performance of the region is still widely varied with Germany firing on multiple cylinders with above-trend real Gross Domestic Product (GDP) growth, while Italy is slowly emerging from its worst recession since World War II. Across Europe, economic confidence moved to multi-year highs and was given a further boost as ECB President Mario Draghi stated that the bank was willing to enact another long-term refinancing operation (LTRO), if needed, to assure bank funding costs remained low. In November, the ECB cut its policy rate by a quarter-point to an all-time low of 0.25% as inflation expectations dropped. Political continuity was strong as pro-euro governments were confirmed. In Germany, Chancellor Merkel won a third term, and a stable technocrat government emerged in Italy. During the year, the European Parliament approved a Single Supervisory Mechanism (SSM) for European banks. While the SSM is just the first step towards a banking union, it is an important institution that will help ensure the future stability in the euro area.
In Japan, the stock market had its best returns in more than a decade as the new Prime Minister Abe's sweeping economic revitalization plan and aggressive BoJ easing surprised markets. Japanese economic data improved consistently throughout the year. Important surveys such as the Tankan and Manufacturing PMI reflected an accelerating growth trend. After fifteen years of deflation, consumer prices stabilized and signaled moderate inflation. The Bank of Japan continued to provide record low interest rates and maintained quantitative easing. Prime Minister Abe's broad plan for economic revitalization includes creation of three new business councils directing economic and fiscal policy, industrial competitiveness and regulatory reforms. Concurrent with a hike in the consumption tax, the government announced a stimulus plan targeted at incentivizing domestic corporate investment. Collectively, the structural reforms and fiscal and monetary policies, represent the “three arrows” of Japan's makeover under “Abenomics.” In October production growth hit a 46-month high signaling that Japan's economy continues to improve on an upward trajectory.
Emerging markets showed their widest underperformance to developed markets since the Asian crisis in 1998. While no economies entered into a recession during the year, the backdrop of tighter monetary policy in major emerging economies like Brazil and India, coupled with higher than expected inflation across many markets, hurt investor sentiment. More positive news from
Annual Shareholder Report
China helped improve the outlook during the end of the period as the new government released further details about their long range economic reform plans. While the economic data showed mixed signs of growth and stability, real GDP growth is expected to exceed 7 1∕2 percent. The Chinese government's action for domestic modernization and urbanization encouraged investors, particularly in the consumer sector. Furthermore, Chinese exports will be supported by the synchronized recovery underway in its major end markets, the U.S., Europe and Japan.
For the 12-month reporting period ended November 30, 2013, the MSCI USA Index3 (+29.5%) outperformed both the MSCI Emerging Markets Index4 (+3.7%) and MSCI EAFE Index5 (+24.8%). There was a strong divergence amongst country returns. Select major developed countries beat MSCI USA Index returns including MSCI Germany6 (+32.9%) and MSCI Japan7 (+32.8%). The top performing major emerging markets were MSCI China8 (+12.5%) and MSCI Korea9(+11.1%).
Country allocation and stock selection
Country allocation remained a key driver of performance for the year, as it consistently has been over the past five years. The Fund maintained exposure to select healthy, high sovereign quality, developed and emerging markets.10 During the reporting period, the Fund underperformed the Morningstar Foreign Large Blend Funds Average (MFLBFA),11 a peer group average for the Fund, which had a total return of 21.69%.
In the euro area, performance was positive. The Fund's top performer was Germany where a strong domestic economy, with the lowest unemployment rate in over 20 years, was boosted by improvement in the euro area economy and from improving global growth. Demand for autos and capital goods drove sales and earnings of companies such as Daimler AG (+77.3%) and Siemens AG (+37.3%). Media Company Kabel Deutschland (+50.7%) was acquired as the sector continued to consolidate. In Denmark, shipping & logistics companies such as A.P. Moller Maersk A/S (+46.2%) and DSV A/S (+30.1%) benefited from improving volumes in Europe and continued growth out of Asia. Norway, the Fund's second largest overweight allocation at +11.8% relative to the benchmark, underperformed, as shares in energy service companies such as Subsea7 ASA (-11.9%) and TGS-Nopec Geophysical Company ASA (-13.4%) declined. More broadly in Europe, our underweight allocation to stocks in the UK and Switzerland, which outperformed, was largely offset by our long position in pound sterling.
In the Asia Pacific region, the Fund's overweight allocation to Japan and short yen position helped performance. Exporters such as Toto Ltd. (+74.8%) and Kubota Corp. (+52.5%) outperformed as yen weakness drove sentiment and earnings. Chinese holdings contributed positively to performance as internet companies such as Ctrip.com International Ltd (+122.1%) and Tencent Holdings Ltd (+78.2%) benefitted from increased domestic consumption as well
Annual Shareholder Report
as the strong trends towards mobile media and e-commerce. Chinese demand for sport utility vehicles (SUVs) remained robust driving up the shares of Great Wall Motor Co. (+86.2%). However, the fund's holdings in Korea had a negative impact on fund performance, as labor issues and a weak yen (versus the Korean won) hurt investor sentiment for domestic auto & parts makers. Holdings in automotive companies Kia Motors (-0.1%) and Mando Corp. (-41.1%) underperformed. Elsewhere in Asia, the “Fed tapering” news led to a steep selloff in fiscally weaker emerging market countries. The Fund's holdings in Indonesia such as PT Bank Negara Indonesia Tbk (-29.2%) detracted from fund performance. Fund performance was helped by our underweight allocation to Australia and New Zealand.
In the Americas, the Fund's holdings in Brazil detracted from performance as domestic economic growth slowed and persistent inflation resulted in a higher interest rate environment. In addition the beginning of a recovery in commodity exports was insufficient to boost positive sentiment on stocks. Iron ore mining company Vale SA (-22.8%), construction company Mills Estruturas E Servicos De Engenharia SA (-19.6%) and auto rental company Localiza Rent A Car SA (-16.3%) contributed negatively to performance. Fund performance was helped by our underweight allocation to Canada, as the commodity rich country lagged in performance.
Currency Allocation
During the reporting period, the Fund invested in currency forwards for hedging purposes. The overall net returns of the currency forward positions contributed positively to performance. Positive contribution from our long position in British pound (versus the U.S. dollar) and short position in Japanese yen (versus the U.S. dollar) was partially offset by our short position in Brazilian real (versus the U.S. dollar).
| 1 | The Fund's Class R6 Shares commenced operations on August 5, 2013. For the period prior to commencement of operations of the Class R6 Shares, the performance information shown is for the Class A Shares. |
| 2 | Please see the footnotes to the line graphs under “Fund Performance and Growth of a $10,000 Investment” below for the definition of, and more information about, the MSCI ACWI ex USA. |
| 3 | The MSCI USA Index is a free float adjusted market capitalization index that is designed to measure large- and mid-cap U.S. equity market performance. The index is unmanaged, and it is not possible to invest directly in an index. |
| 4 | The MSCI Emerging Markets Index captures large- and mid-cap representation across 21 Emerging Markets (EM) countries. With 824 constituents, the index covers approximately 85% of the free float-adjusted market capitalization in each country. As of November 2013, the MSCI Emerging Markets Index consisted of the following country indices: Brazil, Chile, Colombia, Mexico, Peru, Czech Republic, Egypt, Greece, Hungary, Poland, Russia, South Africa, Turkey, China, India, Indonesia, Korea, Malaysia, Philippines, Taiwan and Thailand. The index is unmanaged, and it is not possible to invest directly in an index. |
| 5 | The MSCI EAFE Index is a free float-adjusted market capitalization weighted index that is designed to measure the equity market performance of developed markets outside of North America (Europe, Australasia and the Far East). As of November 2013, the MSCI EAFE Index consisted of 21 developed market country indices. The developed market country indices included are: Australia, Austria, Belgium, |
Annual Shareholder Report
| | Denmark, Finland, France, Germany, Hong Kong, Ireland, Israel, Italy, Japan, Netherlands, New Zealand, Norway, Portugal, Singapore, Spain, Sweden, Switzerland and the United Kingdom. The index is unmanaged, and it is not possible to invest directly in an index. |
| 6 | The MSCI Germany Index is designed to measure the performance of the large- and mid-cap segments of the German market. With 55 constituents, the index covers about 85% of the equity universe in Germany. The index is unmanaged, and it is not possible to invest directly in an index. |
| 7 | The MSCI Japan Index is designed to measure the performance of the large- and mid-cap segments of the Japanese market. With 320 constituents, the index covers approximately 85% of the free float-adjusted market capitalization in Japan. The index is unmanaged, and it is not possible to invest directly in an index. |
| 8 | The MSCI China Index captures large- and mid-cap representation across China H shares. With 138 constituents, the index covers about 85% of this China equity universe. The index is unmanaged, and it is not possible to invest directly in an index. |
| 9 | The MSCI Korea Index is designed to measure the performance of the large- and mid-cap segments of the South Korean market. With 105 constituents, the index covers about 85% of the Korean equity universe. The index is unmanaged, and it is not possible to invest directly in an index. |
| 10 | International investing involves special risks including currency risk, increased volatility of foreign securities, political risks and differences in auditing and other financial standards. Prices of emerging market securities can be significantly more volatile than the prices of securities in developed countries. Currency risk and political risks are accentuated in emerging markets. |
| 11 | Please see the footnotes to the line graphs under “Fund Performance and Growth of a $10,000 Investment” below for the definition of, and more information about, the MFLBFA. |
Annual Shareholder Report
FUND PERFORMANCE AND GROWTH OF A $10,000 INVESTMENT1
The Average Annual Total Return table below shows returns for each class averaged over the stated periods. The graphs below illustrate the hypothetical investment of $10,0002 in the Federated InterContinental Fund from November 30, 2003 to November 30, 2013, compared to the MSCI ACWI ex USA3 and the Morningstar Foreign Large Blend Funds Average (MFLBFA).4
Average Annual Total Returns for the Period Ended 11/30/2013
(returns reflect all applicable sales charges and contingent deferred sales charges as specified below in footnote #2)
| Share Class | 1 Year | 5 Years | 10 Years |
| Class A Shares | 9.54% | 12.88% | 8.59% |
| Class B Shares | 9.47% | 13.03% | 8.60% |
| Class C Shares | 13.98% | 13.28% | 8.44% |
| Class R Shares | 15.64% | 13.84% | 8.89% |
| Institutional Shares | 16.27% | 14.53% | 9.42% |
| Class R6 Shares5 | 15.91% | 14.17% | 9.21% |
Performance data quoted represents past performance which is no guarantee of future results. Investment return and principal value will fluctuate so that an investor's shares, when redeemed, may be worth more or less than their original cost. Mutual fund performance changes over time and current performance may be lower or higher than what is stated. For current to the most recent month-end performance and after-tax returns, visit FederatedInvestors.com or call 1-800-341-7400. Returns shown do not reflect the deduction of taxes that a shareholder would pay on Fund distributions or the redemption of Fund shares. Mutual funds are not obligations of or guaranteed by any bank and are not federally insured.
Annual Shareholder Report
Growth of a $10,000 Investment–CLASS A SHARES
Growth of $10,000 as of November 30, 2013
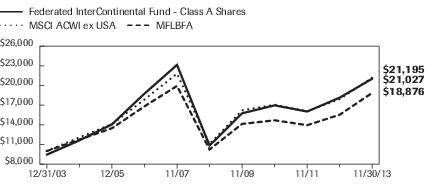
| Federated InterContinental Fund - | Class A Shares | MSCI ACWI ex USA | MFLBFA |
| 12/31/2003 | 9,450 | 10,000 | 10,000 |
| 12/31/2004 | 11,620 | 12,091 | 11,741 |
| 12/31/2005 | 14,068 | 14,101 | 13,480 |
| 12/31/2006 | 18,747 | 17,858 | 16,817 |
| 11/30/2007 | 23,136 | 21,796 | 19,927 |
| 11/30/2008 | 10,839 | 11,070 | 10,238 |
| 11/30/2009 | 15,754 | 16,209 | 14,134 |
| 11/30/2010 | 16,965 | 17,062 | 14,690 |
| 11/30/2011 | 16,025 | 16,055 | 13,942 |
| 11/30/2012 | 18,140 | 17,925 | 15,538 |
| 11/30/2013 | 21,027 | 21,195 | 18,876 |
41 graphic description end -->
| ■ | Total returns shown include the maximum sales charge of 5.50% ($10,000 investment minus $550 sales charge = $9,450). |
Growth of a $10,000 Investment–CLASS B SHARES
Growth of $10,000 as of November 30, 2013

| Federated InterContinental Fund - | Class B Shares | MSCI ACWI ex USA | MFLBFA |
| 11/30/2003 | 10,000 | 10,000 | 10,000 |
| 11/30/2004 | 12,668 | 12,478 | 12,069 |
| 11/30/2005 | 15,350 | 14,479 | 13,733 |
| 11/30/2006 | 20,330 | 18,639 | 17,456 |
| 11/30/2007 | 25,929 | 22,749 | 20,684 |
| 11/30/2008 | 12,054 | 11,554 | 10,627 |
| 11/30/2009 | 17,384 | 16,918 | 14,671 |
| 11/30/2010 | 18,573 | 17,808 | 15,248 |
| 11/30/2011 | 17,544 | 16,757 | 14,472 |
| 11/30/2012 | 19,860 | 18,709 | 16,129 |
| 11/30/2013 | 22,833 | 22,122 | 19,593 |
41 graphic description end -->
| ■ | Total returns shown include the maximum contingent deferred sales charge of 5.50% as applicable. |
Annual Shareholder Report
Growth of a $10,000 Investment–CLASS C SHARES
Growth of $10,000 as of November 30, 2013
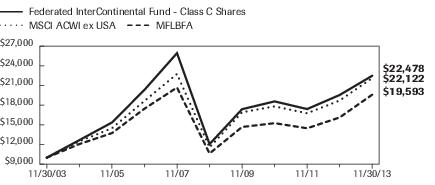
| Federated InterContinental Fund - | Class C Shares | MSCI ACWI ex USA | MFLBFA |
| 11/30/2003 | 10,000 | 10,000 | 10,000 |
| 11/30/2004 | 12,668 | 12,478 | 12,069 |
| 11/30/2005 | 15,350 | 14,479 | 13,733 |
| 11/30/2006 | 20,330 | 18,639 | 17,456 |
| 11/30/2007 | 25,927 | 22,749 | 20,684 |
| 11/30/2008 | 12,053 | 11,554 | 10,627 |
| 11/30/2009 | 17,381 | 16,918 | 14,671 |
| 11/30/2010 | 18,570 | 17,808 | 15,248 |
| 11/30/2011 | 17,402 | 16,757 | 14,472 |
| 11/30/2012 | 19,549 | 18,709 | 16,129 |
| 11/30/2013 | 22,478 | 22,122 | 19,593 |
41 graphic description end -->
| ■ | Total returns shown include the maximum contingent deferred sales charge of 1.00% as applicable. |
Growth of a $10,000 Investment–CLASS R SHARES
Growth of $10,000 as of November 30, 2013
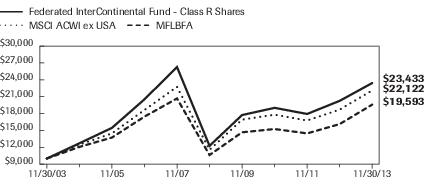
| Federated InterContinental Fund - | Class R Shares | MSCI ACWI ex USA | MFLBFA |
| 11/30/2003 | 10,000 | 10,000 | 10,000 |
| 11/30/2004 | 12,711 | 12,478 | 12,069 |
| 11/30/2005 | 15,453 | 14,479 | 13,733 |
| 11/30/2006 | 20,536 | 18,639 | 17,456 |
| 11/30/2007 | 26,272 | 22,749 | 20,684 |
| 11/30/2008 | 12,256 | 11,554 | 10,627 |
| 11/30/2009 | 17,738 | 16,918 | 14,671 |
| 11/30/2010 | 19,018 | 17,808 | 15,248 |
| 11/30/2011 | 17,932 | 16,757 | 14,472 |
| 11/30/2012 | 20,264 | 18,709 | 16,129 |
| 11/30/2013 | 23,433 | 22,122 | 19,593 |
41 graphic description end -->
Annual Shareholder Report
Growth of a $10,000 Investment–Institutional SHARES
Growth of $10,000 as of November 30, 2013

| Federated InterContinental Fund - | Class Institutional Shares | MSCI ACWI ex USA | MFLBFA |
| 11/30/2003 | 10,000 | 10,000 | 10,000 |
| 11/30/2004 | 12,740 | 12,478 | 12,069 |
| 11/30/2005 | 15,533 | 14,479 | 13,733 |
| 11/30/2006 | 20,693 | 18,639 | 17,456 |
| 11/30/2007 | 26,566 | 22,749 | 20,684 |
| 11/30/2008 | 12,486 | 11,554 | 10,627 |
| 11/30/2009 | 18,205 | 16,918 | 14,671 |
| 11/30/2010 | 19,669 | 17,808 | 15,248 |
| 11/30/2011 | 18,638 | 16,757 | 14,472 |
| 11/30/2012 | 21,166 | 18,709 | 16,129 |
| 11/30/2013 | 24,609 | 22,122 | 19,593 |
41 graphic description end -->
Growth of a $10,000 Investment–r6 shares
Growth of $10,000 as of November 30, 2013
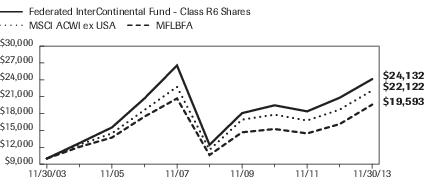
| Federated InterContinental Fund - | Class R6 Shares | MSCI ACWI ex USA | MFLBFA |
| 11/30/2003 | 10,000 | 10,000 | 10,000 |
| 11/30/2004 | 12,740 | 12,478 | 12,069 |
| 11/30/2005 | 15,534 | 14,479 | 13,733 |
| 11/30/2006 | 20,694 | 18,639 | 17,456 |
| 11/30/2007 | 26,553 | 22,749 | 20,684 |
| 11/30/2008 | 12,440 | 11,554 | 10,627 |
| 11/30/2009 | 18,080 | 16,918 | 14,671 |
| 11/30/2010 | 19,471 | 17,808 | 15,248 |
| 11/30/2011 | 18,392 | 16,757 | 14,472 |
| 11/30/2012 | 20,820 | 18,709 | 16,129 |
| 11/30/2013 | 24,132 | 22,122 | 19,593 |
41 graphic description end -->
| 1 | Federated InterContinental Fund is the successor to Rochdale Atlas Portfolio pursuant to a reorganization that took place on August 24, 2007. Shareholders of the Rochdale Atlas Portfolio received Class A Shares of the Fund as a result of the reorganization. The information presented above, for the periods prior to August 24, 2007, is historical information for Rochdale Atlas Portfolio. The fiscal year end of Rochdale Atlas Portfolio was December 31. The Fund's Class B, Class C, Class R and Institutional Shares commenced operations on August 25, 2007. For the period prior to the commencement of operations of the Fund's Class B Shares, Class C Shares and Class R Shares, the performance information shown is for the Fund's Class A Shares, adjusted to reflect the expenses of each new share class. For the period prior to the commencement of operations of Institutional Shares, the performance information shown is for the Fund's Class A Shares. The performance of the Class A Shares has not been adjusted to reflect the expenses of the Institutional Shares since the Institutional Shares have a lower expense ratio than the expense ratio of the Class A Shares. The performance of the Class A Shares has been adjusted to remove any voluntary waiver of Fund expenses related to the Class A Shares that may have occurred during the period prior to the commencement of operations of the Institutional Shares. |
| 2 | Represents a hypothetical investment of $10,000 in the Fund after deducting applicable sales charges: For Class A Shares, the maximum sales charge of 5.50% ($10,000 investment minus $550 sales charge = $9,450); For Class B Shares, the maximum contingent deferred sales charge is 5.50% on any redemption less than one year from purchase date; For Class C Shares, the maximum contingent |
Annual Shareholder Report
| | deferred sales charge is 1.00% on any redemption less than one year from purchase date. The Fund's performance assumes the reinvestment of all dividends and distributions. The MSCI ACWI ex USA has been adjusted to reflect reinvestment of dividends on securities in the index. |
| 3 | The MSCI ACWI ex USA captures large- and mid-cap representation across 22 of 23 developed markets countries (excluding the United States) and 21 emerging markets countries. With 1,826 constituents, the index covers approximately 85% of the global equity opportunity set outside the United States. The index is not adjusted to reflect sales loads, expenses or other fees that the Securities and Exchange Commission (SEC) requires to be reflected in the Fund's performance. The index is unmanaged and, unlike the Fund, is not affected by cash flows. It is not possible to invest directly in an index. |
| 4 | Morningstar figures represent the average of the total returns reported by all the mutual funds designated by Morningstar as falling into the respective category indicated. They do not reflect sales charges. |
| 5 | The Fund's Class R6 Shares commenced operations on August 5, 2013. For the period prior to commencement of operations of the Class R6 Shares, the performance information shown is for Class A Shares. The performance of the Class A Shares has not been adjusted to reflect the expenses of the Class R6 Shares since the Class R6 Shares have a lower expense ratio than the expense ratio of the Class A Shares. Additionally, the performance information shown has been adjusted to reflect the absence of sales charges applicable to Class A Shares. |
Annual Shareholder Report
Portfolio of Investments Summary Tables (unaudited)
At November 30, 2013, the Fund's portfolio composition1 was as follows:
| Country | Percentage of
Total Net Assets |
| Japan | 30.6% |
| Germany | 15.9% |
| South Korea | 12.2% |
| Norway | 12.1% |
| Denmark | 7.3% |
| Brazil | 5.8% |
| China | 5.7% |
| Poland | 4.7% |
| Turkey | 2.3% |
| Austria | 1.8% |
| U.S. Treasury Security | 0.1% |
| Securities Lending Collateral2 | 1.1% |
| Derivative Contracts3 | 0.5% |
| Other Assets and Liabilities—Net4 | (0.1)% |
| TOTAL | 100.0% |
| 1 | Country allocations are based primarily on the country in which a company is incorporated. However, the Fund's Adviser may allocate a company to a country based on other factors such as location of the company's principal office, the location of the principal trading market for the company's securities or the country where a majority of the company's revenues are derived. |
| 2 | Represents cash collateral received from portfolio securities on loan which are invested in short term investments such as repurchase agreements or money market funds. |
| 3 | Based upon net unrealized appreciation (depreciation) or value of the derivative contracts as applicable. Derivative contracts may consist of futures, forwards, options and swaps. The impact of a derivative contract on the Fund's performance may be larger than its unrealized appreciation (depreciation) or value may indicate. In many cases, the notional value or amount of a derivative contract may provide a better indication of the contract's significance to the portfolio. More complete information regarding the Fund's direct investments in derivative contracts, including unrealized appreciation (depreciation), value and notional values or amounts of such contracts, can be found in the table at the end of the Portfolio of Investments included in this Report. |
| 4 | Assets, other than investments in securities and derivative contracts, less liabilities. See Statement of Assets and Liabilities. |
Annual Shareholder Report
At November 30, 2013, the Fund's sector classification composition5 was as follows:
| Sector Classification | Percentage of
Total Net Assets |
| Consumer Discretionary | 22.2% |
| Financials | 18.9% |
| Industrials | 17.5% |
| Information Technology | 10.7% |
| Energy | 9.2% |
| Consumer Staples | 6.7% |
| Materials | 6.1% |
| Health Care | 5.1% |
| Utilities | 1.5% |
| Telecommunication Services | 0.5% |
| U.S. Treasury Security | 0.1% |
| Securities Lending Collateral2 | 1.1% |
| Derivative Contracts3 | 0.5% |
| Other Assets and Liabilities—Net4 | (0.1)% |
| TOTAL | 100.0% |
| 5 | Except for U.S. Treasury Security, Derivative Contracts and Other Assets and Liabilities, sector classifications are based upon, and individual securities assigned to, the classifications of the Global Industry Classification Standard (GICS) except that the Adviser assigns a classification to securities not classified by the GICS and to securities for which the Adviser does not have access to the classification made by the GICS. |
Annual Shareholder Report
Portfolio of Investments
November 30, 2013
Shares or Principal
Amount | | | Value in
U.S. Dollars |
| | | COMMON STOCKS—98.4% | |
| | | Austria—1.8% | |
| 140,000 | | Erste Group Bank AG | $4,928,936 |
| 105,000 | | UNIQA Versicherungen AG | 1,298,340 |
| 55,000 | | Va Stahl AG | 2,735,651 |
| 42,000 | | Vienna Insurance Group | 2,204,038 |
| | | TOTAL | 11,166,965 |
| | | Brazil—5.8% | |
| 961,000 | | Ambev SA, ADR | 7,265,160 |
| 222,000 | | Arezzo Industria e Comercio SA | 2,758,059 |
| 466,667 | | BB Seguridade Participacoes SA | 5,078,009 |
| 218,400 | | CIELO SA | 6,338,910 |
| 115,500 | | Companhia Brasileira de Distribuicao Groupo Pao de Acucar, ADR | 5,437,740 |
| 458,100 | | Itau Unibanco Holding SA, ADR | 6,445,467 |
| 202,500 | | Tractebel Energia SA | 3,317,382 |
| | | TOTAL | 36,640,727 |
| | | China—5.7% | |
| 185,706 | | Burberry Group PLC | 4,640,143 |
| 1,670,000 | | China Overseas Land & Investment | 5,202,224 |
| 26,700 | | CNOOC Ltd., ADR | 5,464,956 |
| 152,000 | 1 | Ctrip.com International Ltd., ADR | 7,262,560 |
| 700,000 | | Great Wall Motor Company Ltd. | 4,275,367 |
| 520,000 | | Prada Holding SpA | 5,022,219 |
| 71,000 | | Tencent Holdings Ltd. | 4,106,571 |
| | | TOTAL | 35,974,040 |
| | | Denmark—7.3% | |
| 534 | | A.P. Moller - Maersk A/S, Class B | 5,418,110 |
| 35,000 | | Carlsberg A/S, Class B | 3,834,909 |
| 335,000 | 1 | Danske Bank A/S | 7,615,716 |
| 211,000 | | DSV, De Sammensluttede Vognmad AS | 6,457,183 |
| 101,929 | 1 | Jyske Bank A/S | 5,510,780 |
| 359,375 | | Nordea Bank AB | 4,643,300 |
| 55,300 | | Novo Nordisk A/S, ADR | 9,883,769 |
| 100,000 | 1 | Sydbank AS | 2,812,540 |
| | | TOTAL | 46,176,307 |
Annual Shareholder Report
Shares or Principal
Amount | | | Value in
U.S. Dollars |
| | | COMMON STOCKS—continued | |
| | | Germany—15.9% | |
| 78,900 | | Allianz SE | $13,706,777 |
| 36,600 | | Bayer AG | 4,883,713 |
| 111,600 | | Bayerische Motoren Werke AG | 12,824,431 |
| 23,682 | | Continental AG | 4,945,951 |
| 246,000 | | Daimler AG | 20,390,249 |
| 255,000 | | Deutsche Post AG | 9,019,282 |
| 69,500 | | Gerresheimer AG | 4,690,216 |
| 72,500 | | HeidelbergerCement AG | 5,671,420 |
| 115,000 | | Rheinmetall AG | 7,088,078 |
| 130,300 | | Siemens AG | 17,209,501 |
| | | TOTAL | 100,429,618 |
| | | Japan—30.6% | |
| 307,700 | | Aisin Seiki Co. | 12,374,679 |
| 200,000 | | Ajinomoto Co., Inc. | 2,850,310 |
| 1,295,000 | | Asahi Kasei Corp. | 10,213,871 |
| 44,500 | | Astellas Pharma, Inc. | 2,636,683 |
| 125,000 | | Chugai Pharmaceutical Co. Ltd. | 2,983,308 |
| 83,000 | | Daiwa House Industry Co. Ltd. | 1,612,280 |
| 77,000 | 2 | Disco Corp. | 5,283,909 |
| 260,000 | | Fuji Heavy Industries Ltd. | 7,339,743 |
| 750,000 | | Hitachi Ltd. | 5,527,356 |
| 214,000 | | Honda Motor Co. Ltd. | 9,045,049 |
| 329,600 | | Japan Tobacco, Inc. | 11,131,983 |
| 810,000 | | Kaneka Corp. | 4,981,209 |
| 944,000 | | Kubota Corp. | 16,134,941 |
| 75,000 | | LIXIL Group Corp. | 1,940,797 |
| 670,000 | | Mitsubishi Chemical Holdings Corp. | 3,113,085 |
| 565,000 | | Mitsui & Co. | 7,826,004 |
| 146,700 | | Murata Manufacturing Co. Ltd. | 12,615,813 |
| 712,000 | | Nippon Express Co. Ltd. | 3,669,637 |
| 530,000 | | Nomura Holdings, Inc. | 4,195,715 |
| 55,000 | | NTT Data Corp. | 1,978,379 |
| 405,000 | | Orix Corp. | 7,372,981 |
| 644,000 | | Sekisui House Ltd. | 8,882,542 |
| 335,000 | | Shionogi and Co. | 7,364,147 |
| 410,300 | | Shiseido Co., Ltd. | 7,016,893 |
| 90,000 | | Tokio Marine Holdings, Inc. | 2,986,969 |
Annual Shareholder Report
Shares or Principal
Amount | | | Value in
U.S. Dollars |
| | | COMMON STOCKS—continued | |
| | | Japan—continued | |
| 540,000 | | Tokyu Corp. | $3,637,074 |
| 1,284,592 | | Toto Ltd. | 18,859,157 |
| 231,500 | | United Arrows Ltd. | 9,807,311 |
| | | TOTAL | 193,381,825 |
| | | Norway—12.1% | |
| 735,277 | | DNB Bank ASA | 13,008,973 |
| 725,000 | 1 | DNO International ASA | 2,681,394 |
| 164,164 | | Fred Olsen Energy ASA | 6,484,195 |
| 109,500 | 1,2 | Norwegian Air Shuttle ASA | 4,110,595 |
| 207,800 | | Seadrill Ltd. | 8,852,151 |
| 714,443 | | Statoil ASA | 16,138,621 |
| 307,290 | | Subsea 7 SA | 5,983,450 |
| 143,000 | | Telenor ASA | 3,437,966 |
| 151,258 | | TGS Nopec Geophysical Co. ASA | 3,992,005 |
| 277,500 | | Yara International ASA | 12,106,670 |
| | | TOTAL | 76,796,020 |
| | | Poland—4.7% | |
| 28,512 | 2 | MBank SA | 5,134,059 |
| 2,650,000 | | Polskie Gornictwo Naftowe I Gazownictwo SA | 4,925,969 |
| 655,000 | | Powszechna Kasa Oszczednosci | 8,713,429 |
| 36,300 | | Powszechny Zaklad Ubezpieczen SA | 5,515,469 |
| 1,600,000 | | Tauron Polska Energia SA | 2,663,822 |
| 410,000 | | Unicredit SpA | 2,974,968 |
| | | TOTAL | 29,927,716 |
| | | South Korea—12.2% | |
| 27,900 | | Binggrae | 2,602,032 |
| 140,000 | 1 | Cheil Communications, Inc. | 3,419,635 |
| 56,000 | | Coway Co. Ltd. | 3,502,977 |
| 55,500 | | Hyundai Motor Co. | 13,215,534 |
| 157,700 | | Kia Motors Corp. | 9,000,359 |
| 111,000 | 1 | Korea Electric Power Corp. | 3,356,326 |
| 93,000 | 1 | LG Display Co. Ltd. | 2,144,194 |
| 14,650 | | Samsung Electronics Co. | 20,681,376 |
| 194,500 | | Samsung Heavy Industries | 7,204,384 |
| 52,400 | | Samsung SDI Co. Ltd. | 8,689,597 |
| 24,300 | | SK Innovation Co. Ltd. | 3,306,435 |
| | | TOTAL | 77,122,849 |
Annual Shareholder Report
Shares or Principal
Amount | | | Value in
U.S. Dollars |
| | | COMMON STOCKS—continued | |
| | | Turkey—2.3% | |
| 109,000 | | BIM Birlesik Magazalar AS | $2,459,316 |
| 235,000 | | Tofas Turk Otomobil Fabrikasi AS | 1,540,659 |
| 1,610,986 | | Trakya Cam Sanayii AS | 2,000,730 |
| 560,000 | | Turkiye Halk Bankasi AS | 4,294,797 |
| 1,840,000 | | Turkiye Vakiflar Bankasi TAO, Class D | 4,169,714 |
| | | TOTAL | 14,465,216 |
| | | TOTAL COMMON STOCKS
(IDENTIFIED COST $485,591,887) | 622,081,283 |
| | | U.S. TREASURY—0.1% | |
| $400,000 | 3,4 | United States Treasury Bill, 0.06%, 2/27/2014
(IDENTIFIED COST $399,946) | 399,937 |
| | | INVESTMENT COMPANY—1.1% | |
| 6,638,708 | 5,6 | Federated Prime Value Obligations Fund, Institutional Shares, 0.07% (including $6,638,708 purchased with proceeds from securities lending collateral)
(AT NET ASSET VALUE) | 6,638,708 |
| | | TOTAL INVESTMENTS—99.6%
(IDENTIFIED COST $492,630,541)7 | 629,119,928 |
| | | OTHER ASSETS AND LIABILITIES - NET—0.4%8 | 2,729,280 |
| | | TOTAL NET ASSETS—100% | $631,849,208 |
At November 30, 2013, the Fund had the following outstanding futures contracts:
| Description | Number of
Contracts | Notional
Value | Expiration
Date | Unrealized
Appreciation
(Depreciation) |
| 1MSCI EAFE Index Long Futures | 67 | $6,275,220 | December 2013 | $(32,848) |
Annual Shareholder Report
At November 30, 2013, the Fund had the following outstanding foreign exchange contracts:
| Settlement Date | Foreign Currency
Units to
Receive/Deliver | In
Exchange
For | Unrealized
Appreciation
(Depreciation) |
| Contracts Purchased: |
| 12/18/2013 | 13,650,000 AUD | $13,090,077 | $(679,936) |
| 12/18/2013 | 27,450,000 GBP | $43,535,151 | $1,375,470 |
| 1/10/2014 | 264,900,000 RUB | $8,110,342 | $(183,296) |
| Contracts Sold: |
| 12/18/2013 | 8,325,900,000 JPY | $ 83,972,769 | $2,686,199 |
| 12/18/2013 | 730,270,000 JPY | $ 7,308,327 | $178,631 |
| 12/18/2013 | 328,500,000 JPY | $ 3,362,781 | $155,604 |
| NET UNREALIZED APPRECIATION ON FOREIGN EXCHANGE CONTRACTS | $3,532,672 |
Net Unrealized Appreciation on Futures Contracts and Foreign Exchange Contracts is included in “Other Assets and Liabilities—Net.”
| 1 | Non-income-producing security. |
| 2 | All or a portion of these securities are temporarily on loan to unaffiliated broker/dealers. |
| 3 | Discount rate at time of purchase. |
| 4 | Pledged as collateral to ensure the Fund is able to satisfy the obligations of its outstanding futures contracts. |
| 5 | Affiliated holding. |
| 6 | 7-day net yield. |
| 7 | The cost of investments for federal tax purposes amounts to $494,550,465. |
| 8 | Assets, other than investments in securities, less liabilities. See Statement of Assets and Liabilities. |
Note: The categories of investments are shown as a percentage of total net assets at November 30, 2013.
Various inputs are used in determining the value of the Fund's investments. These inputs are summarized in the three broad levels listed below:
Level 1—quoted prices in active markets for identical securities, including investment companies with daily net asset values, if applicable.
Level 2—other significant observable inputs (including quoted prices for similar securities, interest rates, prepayment speeds, credit risk, etc.). Also includes securities valued at amortized cost.
Level 3—significant unobservable inputs (including the Fund's own assumptions in determining the fair value of investments).
The inputs or methodology used for valuing securities are not an indication of the risk associated with investing in those securities.
Annual Shareholder Report
The following is a summary of the inputs used, as of November 30, 2013, in valuing the Fund's assets carried at fair value:
| Valuation Inputs |
| | Level 1—
Quoted
Prices and
Investments in
Investment
Companies | Level 2—
Other
Significant
Observable
Inputs | Level 3—
Significant
Unobservable
Inputs | Total |
| Equity Securities: | | | | |
| Common Stock | | | | |
| International | $622,081,283 | $— | $— | $622,081,283 |
| Debt Securities: | | | | |
| U.S. Treasury | — | 399,937 | — | 399,937 |
| Investment Company | 6,638,708 | — | — | 6,638,708 |
| TOTAL SECURITIES | $628,719,991 | $399,937 | $— | $629,119,928 |
| OTHER FINANCIAL INSTRUMENTS* | $(32,848) | $3,532,672 | $— | $3,499,824 |
| * | Other financial instruments include futures contracts and foreign exchange contracts. |
| | |
The following acronyms are used throughout this portfolio:
| ADR | —American Depositary Receipt |
| GBP | —Great Britain Pound |
| JPY | —Japanese Yen |
| RUB | —Russian Ruble |
See Notes which are an integral part of the Financial Statements
Annual Shareholder Report
Financial Highlights–Class A Shares
(For a Share Outstanding Throughout Each Period)
| Year Ended November 30 | 2013 | 2012 | 2011 | 2010 | 2009 |
| Net Asset Value, Beginning of Period | $48.01 | $42.91 | $45.68 | $43.37 | $31.59 |
| Income From Investment Operations: | | | | | |
| Net investment income1 | 0.56 | 0.68 | 0.60 | 0.33 | 0.41 |
| Net realized and unrealized gain (loss) on investments, futures contracts and foreign currency transactions | 7.02 | 4.89 | (3.09) | 2.94 | 13.22 |
| TOTAL FROM INVESTMENT OPERATIONS | 7.58 | 5.57 | (2.49) | 3.27 | 13.63 |
| Less Distributions: | | | | | |
| Distributions from net investment income | (0.54) | (0.47) | (0.28) | (0.97) | (1.87) |
| Redemption Fees | — | — | — | 0.002 | 0.002 |
| Regulatory Settlement Proceeds | — | — | — | 0.013 | 0.024 |
| Net Asset Value, End of Period | $55.05 | $48.01 | $42.91 | $45.68 | $43.37 |
| Total Return5 | 15.91% | 13.20% | (5.54)% | 7.69%3 | 45.34%4 |
| Ratios to Average Net Assets: | | | | | |
| Net expenses | 1.40% | 1.48% | 1.48%6 | 1.48%6 | 1.50% |
| Net investment income | 1.11% | 1.52% | 1.21% | 0.78% | 1.17% |
| Expense waiver/reimbursement7 | 0.11% | 0.07% | 0.07% | 0.10% | 0.13% |
| Supplemental Data: | | | | | |
| Net assets, end of period (000 omitted) | $296,381 | $262,870 | $290,181 | $503,104 | $467,912 |
| Portfolio turnover | 58% | 54% | 53% | 71% | 121% |
| 1 | Per share numbers have been calculated using the average shares method. |
| 2 | Represents less than $0.01. |
| 3 | During the year ended November 30, 2010, the Fund received a regulatory settlement from an unaffiliated third party, which had an impact of 0.05% on the total return. |
| 4 | During the year ended November 30, 2009, the Fund received a regulatory settlement from an unaffiliated third party, which had an impact of 0.07% on the total return. |
| 5 | Based on net asset value, which does not reflect the sales charge, redemption fee or contingent deferred sales charge, if applicable. |
| 6 | The net expense ratio is calculated without reduction for expense offset arrangements. The net expense ratios are 1.48% and 1.48% for the years ended November 30, 2011 and 2010, respectively, after taking into account these expense reductions. |
| 7 | This expense decrease is reflected in both the net expense and net investment income ratios shown above. |
See Notes which are an integral part of the Financial Statements
Annual Shareholder Report
Financial Highlights–Class B Shares
(For a Share Outstanding Throughout Each Period)
| Year Ended November 30 | 2013 | 2012 | 2011 | 2010 | 2009 |
| Net Asset Value, Beginning of Period | $47.72 | $42.59 | $45.45 | $43.19 | $31.32 |
| Net investment income1 | 0.18 | 0.31 | 0.15 | 0.002 | 0.17 |
| Net realized and unrealized gain (loss) on investments, futures contracts and foreign currency transactions | 6.95 | 4.93 | (3.01) | 2.91 | 13.14 |
| TOTAL FROM INVESTMENT OPERATIONS | 7.13 | 5.24 | (2.86) | 2.91 | 13.31 |
| Less Distributions: | | | | | |
| Distributions from net investment income | (0.10) | (0.11) | — | (0.66) | (1.46) |
| Redemption Fees | — | — | — | 0.002 | 0.002 |
| Regulatory Settlement Proceeds | — | — | — | 0.013 | 0.024 |
| Net Asset Value, End of Period | $54.75 | $47.72 | $42.59 | $45.45 | $43.19 |
| Total Return5 | 14.97% | 12.34% | (6.29)% | 6.84%3 | 44.21%4 |
| Ratios to Average Net Assets: | | | | | |
| Net expenses | 2.20% | 2.27% | 2.27%6 | 2.27%6 | 2.29% |
| Net investment income | 0.35% | 0.69% | 0.30% | 0.00%7 | 0.49% |
| Expense waiver/reimbursement8 | 0.23% | 0.23% | 0.17% | 0.18% | 0.19% |
| Supplemental Data: | | | | | |
| Net assets, end of period (000 omitted) | $9,482 | $10,583 | $12,734 | $17,381 | $20,886 |
| Portfolio turnover | 58% | 54% | 53% | 71% | 121% |
| 1 | Per share numbers have been calculated using the average shares method. |
| 2 | Represents less than $0.01. |
| 3 | During the year ended November 30, 2010, the Fund received a regulatory settlement from an unaffiliated third party, which had an impact of 0.05% on the total return. |
| 4 | During the year ended November 30, 2009, the Fund received a regulatory settlement from an unaffiliated third party, which had an impact of 0.10% on the total return. |
| 5 | Based on net asset value, which does not reflect the sales charge, redemption fee or contingent deferred sales charge, if applicable. |
| 6 | The net expense ratio is calculated without reduction for expense offset arrangements. The net expense ratios are 2.27% and 2.27% for the years ended November 30, 2011 and 2010, respectively, after taking into account these expense reductions. |
| 7 | Represents less than 0.01%. |
| 8 | This expense decrease is reflected in both the net expense and net investment income ratios shown above. |
See Notes which are an integral part of the Financial Statements
Annual Shareholder Report
Financial Highlights–Class C Shares
(For a Share Outstanding Throughout Each Period)
| Year Ended November 30 | 2013 | 2012 | 2011 | 2010 | 2009 |
| Net Asset Value, Beginning of Period | $47.61 | $42.49 | $45.34 | $43.09 | $31.31 |
| Income From Investment Operations: | | | | | |
| Net investment income1 | 0.17 | 0.30 | 0.14 | (0.00)2 | 0.18 |
| Net realized and unrealized gain (loss) on investments, futures contracts and foreign currency transactions | 6.95 | 4.93 | (2.99) | 2.90 | 13.10 |
| TOTAL FROM INVESTMENT OPERATIONS | 7.12 | 5.23 | (2.85) | 2.90 | 13.28 |
| Less Distributions: | | | | | |
| Distributions from net investment income | (0.15) | (0.11) | — | (0.66) | (1.52) |
| Redemption Fees | — | — | — | 0.002 | 0.002 |
| Regulatory Settlement Proceeds | — | — | — | 0.013 | 0.024 |
| Net Asset Value, End of Period | $54.58 | $47.61 | $42.49 | $45.34 | $43.09 |
| Total Return5 | 14.98% | 12.34% | (6.29)% | 6.84%3 | 44.20%4 |
| Ratios to Average Net Assets: | | | | | |
| Net expenses | 2.19% | 2.27% | 2.27%6 | 2.27%6 | 2.27% |
| Net investment income | 0.33% | 0.67% | 0.29% | (0.01)% | 0.51% |
| Expense waiver/reimbursement7 | 0.11% | 0.06% | 0.08% | 0.10% | 0.11% |
| Supplemental Data: | | | | | |
| Net assets, end of period (000 omitted) | $44,764 | $43,430 | $47,097 | $64,512 | $69,582 |
| Portfolio turnover | 58% | 54% | 53% | 71% | 121% |
| 1 | Per share numbers have been calculated using the average shares method. |
| 2 | Represents less than $0.01. |
| 3 | During the year ended November 30, 2010, the Fund received a regulatory settlement from an unaffiliated third party, which had an impact of 0.02% on the total return. |
| 4 | During the year ended November 30, 2009, the Fund received a regulatory settlement from an unaffiliated third party, which had an impact of 0.07% on the total return. |
| 5 | Based on net asset value, which does not reflect the sales charge, redemption fee or contingent deferred sales charge, if applicable. |
| 6 | The net expense ratio is calculated without reduction for expense offset arrangements. The net expense ratios are 2.27% and 2.27% for the years ended November 30, 2011 and 2010, respectively, after taking into account these expense reductions. |
| 7 | This expense decrease is reflected in both the net expense and net investment income ratios shown above. |
See Notes which are an integral part of the Financial Statements
Annual Shareholder Report
Financial Highlights–Class R Shares
(For a Share Outstanding Throughout Each Period)
| Year Ended November 30 | 2013 | 2012 | 2011 | 2010 | 2009 |
| Net Asset Value, Beginning of Period | $47.18 | $42.28 | $45.02 | $42.91 | $31.45 |
| Net investment income (loss)1 | 0.67 | 0.55 | 0.43 | 0.24 | (0.09) |
| Net realized and unrealized gain (loss) on investments, futures contracts and foreign currency transactions | 6.65 | 4.85 | (2.97) | 2.80 | 13.47 |
| TOTAL FROM INVESTMENT OPERATIONS | 7.32 | 5.40 | (2.54) | 3.04 | 13.38 |
| Less Distributions: | | | | | |
| Distributions from net investment income | (0.47) | (0.50) | (0.20) | (0.94) | (1.92) |
| Redemption Fees | — | — | — | 0.002 | 0.002 |
| Regulatory Settlement Proceeds | — | — | — | 0.013 | 0.002,4 |
| Net Asset Value, End of Period | $54.03 | $47.18 | $42.28 | $45.02 | $42.91 |
| Total Return5 | 15.64% | 13.00% | (5.71)% | 7.22%3 | 44.73% |
| Ratios to Average Net Assets: | | | | | |
| Net expenses | 1.64% | 1.67% | 1.67%6 | 1.91%6 | 1.91% |
| Net investment income (loss) | 1.34% | 1.24% | 0.92% | 0.56% | (0.22)% |
| Expense waiver/reimbursement7 | 0.41% | 0.29% | 0.31% | 0.09% | 0.07% |
| Supplemental Data: | | | | | |
| Net assets, end of period (000 omitted) | $5,643 | $37,967 | $33,219 | $33,189 | $5,262 |
| Portfolio turnover | 58% | 54% | 53% | 71% | 121% |
| 1 | Per share numbers have been calculated using the average shares method. |
| 2 | Represents less than $0.01. |
| 3 | During the year ended November 30, 2010, the Fund received a regulatory settlement from an unaffiliated third party, which had an impact of 0.02% on the total return. |
| 4 | During the year ended November 30, 2009, the Fund received a regulatory settlement from an unaffiliated third party, which did not have any impact on the total return. |
| 5 | Based on net asset value. |
| 6 | The net expense ratio is calculated without reduction for expense offset arrangements. The net expense ratios are 1.67% and 1.91% for the years ended November 30, 2011 and 2010, respectively, after taking into account these expense reductions. |
| 7 | This expense decrease is reflected in both the net expense and net investment income ratios shown above. |
See Notes which are an integral part of the Financial Statements
Annual Shareholder Report
Financial Highlights–Institutional Shares
(For a Share Outstanding Throughout Each Period)
| Year Ended November 30 | 2013 | 2012 | 2011 | 2010 | 2009 |
| Net Asset Value, Beginning of Period | $47.98 | $43.00 | $45.76 | $43.42 | $31.68 |
| Income From Investment Operations: | | | | | |
| Net investment income1 | 0.73 | 0.78 | 0.67 | 0.46 | 0.57 |
| Net realized and unrealized gain (loss) on investments, futures contracts and foreign currency transactions | 6.99 | 4.92 | (3.01) | 2.95 | 13.18 |
| TOTAL FROM INVESTMENT OPERATIONS | 7.72 | 5.70 | (2.34) | 3.41 | 13.75 |
| Less Distributions: | | | | | |
| Distributions from net investment income | (0.69) | (0.72) | (0.42) | (1.08) | (2.03) |
| Redemption Fees | — | — | — | 0.002 | 0.002 |
| Regulatory Settlement Proceeds | — | — | — | 0.013 | 0.024 |
| Net Asset Value, End of Period | $55.01 | $47.98 | $43.00 | $45.76 | $43.42 |
| Total Return5 | 16.27% | 13.56% | (5.24)% | 8.03%3 | 45.80%4 |
| Ratios to Average Net Assets: | | | | | |
| Net expenses | 1.09% | 1.17% | 1.17%6 | 1.16%6 | 1.18% |
| Net investment income | 1.49% | 1.73% | 1.38% | 1.06% | 1.62% |
| Expense waiver/reimbursement7 | 0.13% | 0.09% | 0.09% | 0.11% | 0.11% |
| Supplemental Data: | | | | | |
| Net assets, end of period (000 omitted) | $275,579 | $193,171 | $164,416 | $197,682 | $133,677 |
| Portfolio turnover | 58% | 54% | 53% | 71% | 121% |
| 1 | Per share numbers have been calculated using the average shares method. |
| 2 | Represents less than $0.01. |
| 3 | During the year ended November 30, 2010, the Fund received a regulatory settlement from an unaffiliated third party, which had an impact of 0.02% on the total return. |
| 4 | During the year ended November 30, 2009, the Fund received a regulatory settlement from an unaffiliated third party, which had an impact of 0.10% on the total return. |
| 5 | Based on net asset value. |
| 6 | The net expense ratio is calculated without reduction for expense offset arrangements. The net expense ratios are 1.17% and 1.16% for the years ended November 30, 2011 and 2010, respectively, after taking into account these expense reductions. |
| 7 | This expense decrease is reflected in both the net expense and net investment income ratios shown above. |
See Notes which are an integral part of the Financial Statements
Annual Shareholder Report
Financial Highlights–Class R6 Shares
(For a Share Outstanding Throughout the Period)
| Period Ended November 30 | 20131 |
| Net Asset Value, Beginning of Period | $51.01 |
| Net investment loss2 | (0.06) |
| Net realized and unrealized gain on investments, futures contracts and foreign currency transactions | 4.10 |
| TOTAL FROM INVESTMENT OPERATIONS | 4.04 |
| Distributions from net investment income | — |
| Net Asset Value, End of Period | $55.05 |
| Total Return3 | 7.92% |
| Ratios to Average Net Assets: | |
| Net expenses | 0.94%4 |
| Net investment income | (0.36)%4 |
| Supplemental Data: | |
| Net assets, end of period (000 omitted) | $—5 |
| Portfolio turnover | 58%6 |
| 1 | Reflects operations for the period from August 5, 2013 (date of initial investment) to November 30, 2013. |
| 2 | Per share numbers have been calculated using the average shares method. |
| 3 | Based on net asset value. Total returns for periods of less than one year are not annualized. |
| 4 | Computed on an annualized basis. |
| 5 | Represents less than $1,000. |
| 6 | Portfolio turnover is calculated at the Fund level. Percentage indicated was calculated for the fiscal year ended November 30, 2013. |
See Notes which are an integral part of the Financial Statements
Annual Shareholder Report
Statement of Assets and Liabilities
November 30, 2013
| Assets: | | |
| Total investment in securities, at value including $6,268,199 of securities loaned and $6,638,708 of investment in an affiliated holding (Note 5) (identified cost $492,630,541) | | $629,119,928 |
| Cash denominated in foreign currencies (identified cost $436,768) | | 439,478 |
| Receivable for investments sold | | 12,093,772 |
| Unrealized appreciation on foreign exchange contracts | | 4,395,904 |
| Income receivable | | 1,303,333 |
| Receivable for shares sold | | 136,572 |
| TOTAL ASSETS | | 647,488,987 |
| Liabilities: | | |
| Payable for collateral due to broker for securities lending | $6,638,708 | |
| Bank overdraft | 452,431 | |
| Unrealized depreciation on foreign exchange contracts | 863,232 | |
| Payable for investments purchased | 1,397,719 | |
| Payable for shares redeemed | 5,827,395 | |
| Payable for transfer agent fee (Note 2) | 115,866 | |
| Payable for shareholder services fee (Note 5) | 66,468 | |
| Payable for distribution services fee (Note 5) | 34,180 | |
| Payable for daily variation margin | 28,475 | |
| Payable for Directors'/Trustees' fees (Note 5) | 115 | |
| Accrued expenses (Note 5) | 215,190 | |
| TOTAL LIABILITIES | | 15,639,779 |
| Net assets for 11,491,840 shares outstanding | | $631,849,208 |
| Net Assets Consists of: | | |
| Paid-in capital | | $816,516,351 |
| Net unrealized appreciation of investments, futures contracts and translation of assets and liabilities in foreign currency | | 139,959,214 |
| Accumulated net realized loss on investments, futures contracts and foreign currency transactions | | (330,459,148) |
| Undistributed net investment income | | 5,832,791 |
| TOTAL NET ASSETS | | $631,849,208 |
Annual Shareholder Report
Statement of Assets and Liabilities–continued
| Net Asset Value, Offering Price and Redemption Proceeds Per Share | | |
| Class A Shares: | | |
Net asset value per share ($296,380,943 ÷ 5,384,005 shares outstanding),
no par value, unlimited shares authorized | | $55.05 |
| Offering price per share (100/94.50 of $55.05) | | $58.25 |
| Redemption proceeds per share | | $55.05 |
| Class B Shares: | | |
Net asset value per share ($9,482,025 ÷ 173,181 shares outstanding),
no par value, unlimited shares authorized | | $54.75 |
| Offering price per share | | $54.75 |
| Redemption proceeds per share (94.50/100 of $54.75) | | $51.74 |
| Class C Shares: | | |
Net asset value per share ($44,763,579 ÷ 820,170 shares outstanding),
no par value, unlimited shares authorized | | $54.58 |
| Offering price per share | | $54.58 |
| Redemption proceeds per share (99.00/100 of $54.58) | | $54.03 |
| Class R Shares: | | |
Net asset value per share ($5,643,111 ÷ 104,447 shares outstanding),
no par value, unlimited shares authorized | | $54.03 |
| Offering price per share | | $54.03 |
| Redemption proceeds per share | | $54.03 |
| Institutional Shares: | | |
Net asset value per share ($275,579,442 ÷ 5,010,035 shares outstanding),
no par value, unlimited shares authorized | | $55.01 |
| Offering price per share | | $55.01 |
| Redemption proceeds per share | | $55.01 |
| Class R6 Shares: | | |
Net asset value per share ($108 ÷ 2 shares outstanding),*
no par value, unlimited shares authorized | | $55.05 |
| Offering price per share | | $55.05 |
| Redemption proceeds per share | | $55.05 |
| * | Net assets total and shares outstanding are rounded to the nearest whole total. |
See Notes which are an integral part of the Financial Statements
Annual Shareholder Report
Statement of Operations
Year Ended November 30, 2013
| Investment Income: | | | |
| Dividends (including $13,134 received from affiliated holding (Note 5) and net of foreign taxes withheld of $1,913,862) | | | $14,768,455 |
| Interest (including income on securities loaned of $974,593) | | | 974,815 |
| TOTAL INCOME | | | 15,743,270 |
| Expenses: | | | |
| Investment adviser fee (Note 5) | | $5,897,866 | |
| Administrative fee (Note 5) | | 481,375 | |
| Custodian fees | | 197,751 | |
| Transfer agent fee (Note 2) | | 789,611 | |
| Auditing fees | | 29,000 | |
| Legal fees | | 9,543 | |
| Distribution services fee (Note 5) | | 515,705 | |
| Shareholder services fee (Note 5) | | 825,636 | |
| Account administration fee (Note 2) | | 8,088 | |
| Portfolio accounting fees | | 142,965 | |
| Share registration costs | | 96,575 | |
| Printing and postage | | 78,590 | |
| Insurance premiums (Note 5) | | 4,932 | |
| Miscellaneous (Note 5) | | 12,114 | |
| TOTAL EXPENSES | | 9,089,751 | |
| Waivers and Reimbursements: | | | |
| Waiver/reimbursement of investment adviser fee (Note 5) | $(535,852) | | |
| Waiver of distribution services fee (Note 5) | (54,816) | | |
| Reimbursement of transfer agent fee (Note 2) and (Note 5) | (201,482) | | |
| TOTAL WAIVERS AND REIMBURSEMENTS | | (792,150) | |
| Net expenses | | | 8,297,601 |
| Net investment income | | | 7,445,669 |
| Realized and Unrealized Gain (Loss) on Investments, Futures Contracts and Foreign Currency Transactions: | | | |
| Net realized gain on investments and foreign currency transactions | | | 25,261,187 |
| Net realized gain on futures contracts | | | 157,184 |
| Net change in unrealized appreciation of investments and translation of assets and liabilities in foreign currency | | | 56,329,926 |
| Net change in unrealized depreciation of futures contracts | | | (40,333) |
| Net realized and unrealized gain on investments, futures contracts and foreign currency transactions | | | 81,707,964 |
| Change in net assets resulting from operations | | | $89,153,633 |
See Notes which are an integral part of the Financial Statements
Annual Shareholder Report
Statement of Changes in Net Assets
| Year Ended November 30 | 2013 | 2012 |
| Increase (Decrease) in Net Assets | | |
| Operations: | | |
| Net investment income | $7,445,669 | $7,971,281 |
| Net realized gain on investments, futures and foreign currency transactions | 25,418,371 | 20,259,991 |
| Net change in unrealized appreciation/depreciation of investments, futures contracts and translation of assets and liabilities in foreign currency | 56,289,593 | 36,024,899 |
| CHANGE IN NET ASSETS RESULTING FROM OPERATIONS | 89,153,633 | 64,256,171 |
| Distributions to Shareholders: | | |
| Distributions from net investment income | | |
| Class A Shares | (2,877,767) | (3,030,893) |
| Class B Shares | (21,744) | (30,684) |
| Class C Shares | (132,745) | (113,864) |
| Class R Shares | (377,484) | (392,999) |
| Institutional Shares | (2,941,760) | (2,717,446) |
| CHANGE IN NET ASSETS RESULTING FROM DISTRIBUTIONS TO SHAREHOLDERS | (6,351,500) | (6,285,886) |
| Share Transactions: | | |
| Proceeds from sale of shares | 208,112,411 | 121,714,632 |
| Net asset value of shares issued to shareholders in payment of distributions declared | 4,874,385 | 4,451,028 |
| Cost of shares redeemed | (211,959,255) | (183,763,204) |
| CHANGE IN NET ASSETS RESULTING FROM SHARE TRANSACTIONS | 1,027,541 | (57,597,544) |
| Change in net assets | 83,829,674 | 372,741 |
| Net Assets: | | |
| Beginning of period | 548,019,534 | 547,646,793 |
| End of period (including undistributed net investment income of $5,832,791 and $6,350,439, respectively) | $631,849,208 | $548,019,534 |
See Notes which are an integral part of the Financial Statements
Annual Shareholder Report
Notes to Financial Statements
November 30, 2013
1. ORGANIZATION
Federated Equity Funds (the “Trust”) is registered under the Investment Company Act of 1940, as amended (the “Act”), as an open-end management investment company. The Trust consists of 12 portfolios. The financial statements included herein are only those of Federated InterContinental Fund (the “Fund”). The financial statements of the other portfolios are presented separately. The assets of each portfolio are segregated and a shareholder's interest is limited to the portfolio in which shares are held. Each portfolio pays its own expenses. The Fund offers six classes of shares: Class A Shares, Class B Shares, Class C Shares, Class R Shares, Institutional Shares and Class R6 Shares. All shares of the Fund have equal rights with respect to voting, except on class-specific matters. The investment objective of the Fund is to seek long-term capital appreciation.
2. SIGNIFICANT ACCOUNTING POLICIES
The following is a summary of significant accounting policies consistently followed by the Fund in the preparation of its financial statements. These policies are in conformity with U.S. generally accepted accounting principles (GAAP).
Investment Valuation
In calculating its net asset value (NAV), the Fund generally values investments as follows:
| ■ | Equity securities listed on an exchange or traded through a regulated market system are valued at their last reported sale price or official closing price in their principal exchange or market. |
| ■ | Shares of other mutual funds or non-exchange-traded investment companies are valued based upon their reported NAVs. |
| ■ | Fixed-income securities acquired with remaining maturities greater than 60 days are fair valued using price evaluations provided by a pricing service approved by the Fund's Board of Trustees (the “Trustees”). |
| ■ | Fixed-income securities and repurchase agreements acquired with remaining maturities of 60 days or less are valued at their amortized cost (adjusted for the accretion of any discount or amortization of any premium) unless the issuer's creditworthiness is impaired or other factors indicate that amortized cost is not an accurate estimate of the investment's fair value, in which case it would be valued in the same manner as a longer-term security. |
| ■ | Derivative contracts listed on exchanges are valued at their reported settlement or closing price. |
| ■ | Over-the-counter (OTC) derivative contracts are fair valued using price evaluations provided by a pricing service approved by the Trustees. |
| ■ | For securities that are fair valued in accordance with procedures established by and under the general supervision of the Trustees, certain factors may be considered such as: the purchase price of the security, information obtained by contacting the issuer, analysis of the issuer's financial statements or other available documents, fundamental analytical data, the nature and duration of restrictions on disposition, the movement of the market in which the security is normally traded and public trading in similar securities of the issuer or comparable issuers. |
Annual Shareholder Report
If the Fund cannot obtain a price or price evaluation from a pricing service for an investment, the Fund may attempt to value the investment based upon the mean of bid and asked quotations or fair value the investment based on price evaluations, from one or more dealers. If any price, quotation, price evaluation or other pricing source is not readily available when the NAV is calculated, or if the Fund cannot obtain price evaluations from a pricing service or from more than one dealer for an investment within a reasonable period of time as set forth in the Fund's valuation policies and procedures, the Fund uses the fair value of the investment determined in accordance with the procedures described below. There can be no assurance that the Fund could purchase or sell an investment at the price used to calculate the Fund's NAV.
Fair Valuation and Significant Events Procedures
The Trustees have appointed a Valuation Committee comprised of officers of the Fund, Federated Global Investment Management Corp. (“Adviser”) and certain of the Adviser's affiliated companies to determine fair value of securities and in overseeing the calculation of the NAV. The Trustees have also authorized the use of pricing services recommended by the Valuation Committee to provide fair value evaluations of the current value of certain investments for purposes of calculating the NAV. The Valuation Committee employs various methods for reviewing third-party pricing-service evaluations including periodic reviews of third-party pricing services' policies, procedures and valuation methods (including key inputs and assumptions), transactional back-testing, comparisons of evaluations of different pricing services and review of price challenges by the Adviser based on recent market activity. In the event that market quotations and price evaluations are not available for an investment, the Valuation Committee determines the fair value of the investment in accordance with procedures adopted by the Trustees. The Trustees periodically review and approve the fair valuations made by the Valuation Committee and any changes made to the procedures.
Factors considered by pricing services in evaluating an investment include the yields or prices of investments of comparable quality, coupon, maturity, call rights and other potential prepayments, terms and type, reported transactions, indications as to values from dealers and general market conditions. Some pricing services provide a single price evaluation reflecting the bid-side of the market for an investment (a “bid” evaluation). Other pricing services offer both bid evaluations and price evaluations indicative of a price between the prices bid and asked for the investment (a “mid” evaluation). The Fund normally uses bid evaluations for U.S. Treasury and Agency securities, mortgage-backed securities and municipal securities. The Fund normally uses mid evaluations for other types of fixed-income securities and OTC derivative contracts. In the event that market quotations and price evaluations are not available for an investment, the fair value of the investment is determined in accordance with procedures adopted by the Trustees.
Annual Shareholder Report
The Trustees also have adopted procedures requiring an investment to be priced at its fair value whenever the Adviser determines that a significant event affecting the value of the investment has occurred between the time as of which the price of the investment would otherwise be determined and the time as of which the NAV is computed. An event is considered significant if there is both an affirmative expectation that the investment's value will change in response to the event and a reasonable basis for quantifying the resulting change in value. Examples of significant events that may occur after the close of the principal market on which a security is traded, or after the time of a price evaluation provided by a pricing service or a dealer, include:
| ■ | With respect to securities traded in foreign markets, significant trends in U.S. equity markets or in the trading of foreign securities index futures contracts; |
| ■ | Political or other developments affecting the economy or markets in which an issuer conducts its operations or its securities are traded; and |
| ■ | Announcements concerning matters such as acquisitions, recapitalizations, litigation developments, a natural disaster affecting the issuer's operations or regulatory changes or market developments affecting the issuer's industry. |
The Trustees have approved the use of a pricing service to determine the fair value of equity securities traded principally in foreign markets when the Adviser determines that there has been a significant trend in the U.S. equity markets or in index futures trading. For other significant events, the Fund may seek to obtain more current quotations or price evaluations from alternative pricing sources. If a reliable alternative pricing source is not available, the Fund will determine the fair value of the investment using another method approved by the Trustees.
Repurchase Agreements
The Fund may invest in repurchase agreements for short-term liquidity purposes. It is the policy of the Fund to require the other party to a repurchase agreement to transfer to the Fund's custodian or sub-custodian eligible securities or cash with a market value (after transaction costs) at least equal to the repurchase price to be paid under the repurchase agreement. The eligible securities are transferred to accounts with the custodian or sub-custodian in which the Fund holds a “securities entitlement” and exercises “control” as those terms are defined in the Uniform Commercial Code. The Fund has established procedures for monitoring the market value of the transferred securities and requiring the transfer of additional eligible securities if necessary to equal at least the repurchase price. These procedures also allow the other party to require securities to be transferred from the account to the extent that their market value exceeds the repurchase price or in exchange for other eligible securities of equivalent market value. The insolvency of the other party or other failure to repurchase the securities may delay the disposition of the underlying securities or cause the Fund to receive less than the full repurchase price. Under the terms of the repurchase agreement, any amounts received by the Fund in excess of the repurchase price and related transaction costs must be remitted to the other party.
The Fund may enter into repurchase agreements in which eligible securities are transferred into joint trading accounts maintained by the custodian or sub-custodian for investment companies and other clients advised by the Fund's Adviser and its affiliates. The Fund will participate on a pro rata basis with the other investment companies and clients in its share of the securities transferred under such repurchase agreements and in its share of proceeds from any repurchase or other disposition of such securities.
Annual Shareholder Report
Investment Income, Gains and Losses, Expenses and Distributions
Investment transactions are accounted for on a trade-date basis. Realized gains and losses from investment transactions are recorded on an identified-cost basis. Interest income and expenses are accrued daily. Dividend income and distributions to shareholders are recorded on the ex-dividend date. Foreign dividends are recorded on the ex-dividend date or when the Fund is informed of the ex-dividend date. Distributions of net investment income are declared and paid annually. Non-cash dividends included in dividend income, if any, are recorded at fair value. Investment income, realized and unrealized gains and losses, and certain fund-level expenses are allocated to each class based on relative average daily net assets, except that Class A Shares, Class B Shares, Class C Shares, Class R Shares, Institutional Shares and Class R6 Shares may bear account administration fees, distribution services fees, shareholder services fees and certain transfer agent fees unique to those classes.
For the year ended November 30, 2013, transfer agent fees and account administration fees for the Fund were as follows:
| | Transfer Agent
Fees Incurred | Transfer Agent
Fees Reimbursed | Account
Administration
Fees Incurred |
| Class A Shares | $365,714 | $(53,622) | $7,915 |
| Class B Shares | 30,328 | (15,041) | — |
| Class C Shares | 74,851 | (9,409) | 173 |
| Class R Shares | 87,688 | (27,012) | — |
| Institutional Shares | 231,030 | (96,398) | — |
| Total | $789,611 | $(201,482) | $8,088 |
Dividends are declared separately for each class. No class has preferential dividend rights; differences in per share dividend rates are generally due to differences in separate class expenses.
Premium and Discount Amortization
All premiums and discounts on fixed-income securities are amortized/accreted using the effective-interest-rate method.
Federal Taxes
It is the Fund's policy to comply with the Subchapter M provision of the Internal Revenue Code (the “Code”) and to distribute to shareholders each year substantially all of its income. Accordingly, no provision for federal income tax is necessary. As of and during the year ended November 30, 2013, the Fund did not have a liability for any uncertain tax positions. The Fund recognizes interest and penalties, if any, related to tax liabilities as income tax expense in the Statement of Operations. As of November 30, 2013, tax years 2010 through 2013 remain subject to examination by the Fund's major tax jurisdictions, which include the United States of America and the Commonwealth of Massachusetts.
The Fund may be subject to taxes imposed by governments of countries in which it invests. Such taxes are generally based on either income or gains earned or repatriated. The Fund accrues and applies such taxes to net investment income, net realized gains and net unrealized gains as income and/or gains are earned.
Annual Shareholder Report
When-Issued and Delayed-Delivery Transactions
The Fund may engage in when-issued or delayed-delivery transactions. The Fund records when-issued securities on the trade date and maintains security positions such that sufficient liquid assets will be available to make payment for the securities purchased. Securities purchased on a when-issued or delayed-delivery basis are marked to market daily and begin earning interest on the settlement date. Losses may occur on these transactions due to changes in market conditions or the failure of counterparties to perform under the contract.
Foreign Exchange Contracts
The Fund may enter into foreign exchange contracts for the delayed delivery of securities or foreign currency exchange transactions. The Fund may enter into foreign exchange contracts to protect assets against adverse changes in foreign currency exchange rates or exchange control regulations. Purchased contracts are used to acquire exposure to foreign currencies, whereas, contracts to sell are used to hedge the Fund's securities against currency fluctuations. Risks may arise upon entering into these transactions from the potential inability of counterparties to meet the terms of their commitments and from unanticipated movements in security prices or foreign exchange rates. The foreign exchange contracts are adjusted by the daily exchange rate of the underlying currency and any gains or losses are recorded for financial statement purposes as unrealized until the settlement date.
Foreign exchange contracts are subject to Master Netting Agreements (MNA) which are agreements between the Fund and its counterparties that provides for the net settlement of all transactions and collateral with the Fund, through a single payment, in the event of default or termination. Amounts presented on the Portfolio of Investments and Statement of Assets and Liabilities are not net settlement amounts but gross. Foreign exchange contracts outstanding at period end, including net unrealized appreciation/depreciation or net settlement amount, are listed after the Fund's Portfolio of Investments.
The average value at settlement date payable and receivable of foreign exchange contracts purchased and sold by the Fund throughout the period was $3,106,003 and $2,219,538, respectively. This is based on the contracts held as of each month-end throughout the fiscal period.
Foreign Currency Translation
The accounting records of the Fund are maintained in U.S. dollars. All assets and liabilities denominated in foreign currencies (FCs) are translated into U.S. dollars based on the rates of exchange of such currencies against U.S. dollars on the date of valuation. Purchases and sales of securities, income and expenses are translated at the rate of exchange quoted on the respective date that such transactions are recorded. The Fund does not isolate that portion of the results of operations resulting from changes in foreign exchange rates on investments from the fluctuations arising from changes in market prices of securities held. Such fluctuations are included with the net realized and unrealized gain or loss from investments.
Reported net realized foreign exchange gains or losses arise from sales of portfolio securities, sales and maturities of short-term securities, sales of FCs, currency gains or losses realized between the trade and settlement dates on securities transactions, the difference between the amounts of dividends, interest and foreign withholding taxes recorded on the Fund's books and the U.S. dollar equivalent of the amounts actually received or paid. Net unrealized foreign exchange gains and losses arise from changes in the value of assets and liabilities other than investments in securities at fiscal year end, resulting from changes in the exchange rate.
Annual Shareholder Report
Futures Contracts
The Fund purchases and sells financial futures contracts to manage cash flows and duration, enhance yield and to potentially reduce transaction costs. Upon entering into a financial futures contract with a broker, the Fund is required to deposit in a segregated account a specified amount of cash or U.S. government securities which is shown as Restricted Cash in the Statement of Assets and Liabilities. Futures contracts are valued daily and unrealized gains or losses are recorded in a “variation margin” account. Daily, the Fund receives from or pays to the broker a specified amount of cash based upon changes in the variation margin account. When a contract is closed, the Fund recognizes a realized gain or loss. Futures contracts have market risks, including the risk that the change in the value of the contract may not correlate with the changes in the value of the underlying securities. There is minimal counterparty risk to the Fund since futures are exchange traded and the exchange's clearing house, as counterparty to all exchange traded futures, guarantees the futures against default.
Futures contracts outstanding at period end are listed after the Fund's Portfolio of Investments.
The average notional value of futures contracts held by the Fund throughout the period was $1,802,533. This is based on amounts held as of each month-end throughout the fiscal period.
Securities Lending
The Fund participates in a securities lending program providing for the lending of equity securities to qualified brokers. The Fund normally receives cash collateral for securities loaned that is invested in short-term securities including repurchase agreements. Collateral is maintained at a minimum level of 100% of the market value of investments loaned, plus interest, if applicable. Earnings on collateral are allocated between the securities lending agent, as a fee for its services under the program, and the Fund, according to agreed-upon rates.
Securities lending transactions are subject to MNA. Amounts presented on the Portfolio of Investments and Statement of Assets and Liabilities are not net settlement amounts but gross. As indicated below, the cash collateral received by the Fund exceeds the market value of the securities loaned reducing the net settlement amount to zero. The chart below identifies the amount of collateral received as well as the market value of securities on loan. Additionally, the securities lending agreement executed by the Fund includes an indemnification clause. This clause stipulates that the borrower will reimburse the Fund for any losses as a result of any failure of the borrower to return equivalent securities to the Fund. As of November 30, 2013, securities subject to this type of arrangement and related collateral was as follows:
Market Value of
Securities Loaned | Market Value
of Collateral |
| $6,268,199 | $6,638,708 |
Annual Shareholder Report
Additional Disclosure Related to Derivative Instruments
| Fair Value of Derivative Instruments |
| | Asset | Liability |
| | Statement of
Assets and
Liabilities
Location | Fair Value | Statement of
Assets and
Liabilities
Location | Fair Value |
Derivatives not accounted
for as hedging instruments
under ASC Topic 815 | | | | |
| Equity contracts | | $— | Payable for
daily variation
margin | $32,848* |
| Foreign exchange contracts | Unrealized
appreciation on
foreign exchange
contracts | $4,395,904 | Unrealized
depreciation on foreign exchange
contracts | $863,232 |
Total derivatives not
accounted for as
hedging instruments
under ASC Topic 815 | | $4,395,904 | | $896,080 |
| * | Includes cumulative appreciation/depreciation of futures contracts as reported in the footnotes to the Portfolio of Investments. Only the current day's variation margin is reported within the Statement of Assets and Liabilities. |
The Effect of Derivative Instruments on the Statement of Operations for the Year Ended November 30, 2013
| Amount of Realized Gain or (Loss) on Derivatives Recognized in Income |
| | Futures | Forward
Currency
Contracts | Total |
| Equity contracts | $157,184 | $— | $157,184 |
| Foreign exchange contracts | $— | $2,705,023 | $2,705,023 |
| TOTAL | $157,184 | $2,705,023 | $2,862,207 |
| Change in Unrealized Appreciation or (Depreciation) on Derivatives Recognized in Income |
| | Futures | Forward
Currency
Contracts | Total |
| Equity contracts | $(40,333) | $— | $(40,333) |
| Foreign exchange contracts | $— | $28,944 | $28,944 |
| TOTAL | $(40,333) | $28,944 | $(11,389) |
Annual Shareholder Report
Other
The preparation of financial statements in conformity with GAAP requires management to make estimates and assumptions that affect the amounts of assets, liabilities, expenses and revenues reported in the financial statements. Actual results could differ from those estimated.
3. SHARES OF BENEFICIAL INTEREST
The following tables summarize share activity:
| Year Ended November 30 | 2013 | 2012 |
| Class A Shares: | Shares | Amount | Shares | Amount |
| Shares sold | 1,569,642 | $79,908,898 | 1,370,179 | $62,515,461 |
| Shares issued to shareholders in payment of distributions declared | 56,161 | 2,772,650 | 72,110 | 2,923,351 |
| Shares redeemed | (1,716,572) | (87,427,578) | (2,730,333) | (120,572,883) |
NET CHANGE RESULTING FROM
CLASS A SHARE TRANSACTIONS | (90,769) | $(4,746,030) | (1,288,044) | $(55,134,071) |
| Year Ended November 30 | 2013 | 2012 |
| Class B Shares: | Shares | Amount | Shares | Amount |
| Shares sold | 17,829 | $912,555 | 10,201 | $457,455 |
| Shares issued to shareholders in payment of distributions declared | 405 | 20,050 | 670 | 27,207 |
| Shares redeemed | (66,822) | (3,389,486) | (88,062) | (3,958,409) |
NET CHANGE RESULTING FROM
CLASS B SHARE TRANSACTIONS | (48,588) | $(2,456,881) | (77,191) | $(3,473,747) |
| Year Ended November 30 | 2013 | 2012 |
| Class C Shares: | Shares | Amount | Shares | Amount |
| Shares sold | 128,584 | $6,510,104 | 122,613 | $5,492,665 |
| Shares issued to shareholders in payment of distributions declared | 2,343 | 115,533 | 2,430 | 98,399 |
| Shares redeemed | (222,993) | (11,255,883) | (321,114) | (14,334,948) |
NET CHANGE RESULTING FROM
CLASS C SHARE TRANSACTIONS | (92,066) | $(4,630,246) | (196,071) | $(8,743,884) |
| Year Ended November 30 | 2013 | 2012 |
| Class R Shares: | Shares | Amount | Shares | Amount |
| Shares sold | 88,501 | $4,406,671 | 179,128 | $8,148,571 |
| Shares issued to shareholders in payment of distributions declared | 7,763 | 376,953 | 9,824 | 392,093 |
| Shares redeemed | (796,538) | (40,048,712) | (169,907) | (7,589,304) |
NET CHANGE RESULTING FROM
CLASS R SHARE TRANSACTIONS | (700,274) | $(35,265,088) | 19,045 | $951,360 |
Annual Shareholder Report
| Year Ended November 30 | 2013 | 2012 |
| Institutional Shares: | Shares | Amount | Shares | Amount |
| Shares sold | 2,305,886 | $116,374,083 | 1,009,009 | $45,100,480 |
| Shares issued to shareholders in payment of distributions declared | 32,307 | 1,589,199 | 24,999 | 1,009,978 |
| Shares redeemed | (1,353,975) | (69,837,596) | (831,804) | (37,307,660) |
NET CHANGE RESULTING FROM
INSTITUTIONAL SHARE TRANSACTIONS | 984,218 | $48,125,686 | 202,204 | $8,802,798 |
| | Period Ended
11/30/20131 | Year Ended
11/30/2012 |
| Class R6 Shares: | Shares | Amount | Shares | Amount |
| Shares sold | 2 | $100 | — | $— |
| Shares issued to shareholders in payment of distributions declared | — | — | — | — |
| Shares redeemed | — | — | — | — |
NET CHANGE RESULTING FROM
CLASS R6 SHARE TRANSACTIONS | 2 | $100 | — | $— |
NET CHANGE RESULTING FROM
TOTAL FUND SHARE TRANSACTIONS | 52,523 | $1,027,541 | (1,340,057) | $(57,597,544) |
| 1 | Reflects operations for the period from August 5, 2013 (date of initial investment) to November 30, 2013. |
4. FEDERAL TAX INFORMATION
The timing and character of income and capital gain distributions are determined in accordance with income tax regulations, which may differ from GAAP. These differences are due to differing treatments for foreign currency transactions.
For the year ended November 30, 2013, permanent differences identified and reclassified among the components of net assets were as follows:
| Increase (Decrease) |
Undistributed
Net Investment
Income (Loss) | Accumulated
Net Realized
Gain (Loss) |
| $(1,611,817) | $1,611,817 |
Net investment income (loss), net realized gains (losses) and net assets were not affected by the reclassification.
The tax character of distributions as reported on the Statement of Changes in Net Assets for the years ended November 30, 2013 and 2012, was as follows:
| | 2013 | 2012 |
| Ordinary income | $6,351,500 | $6,285,886 |
Annual Shareholder Report
As of November 30, 2013, the components of distributable earnings on a tax basis were as follows:
| Undistributed ordinary income | $ 7,507,012 |
| Net unrealized appreciation | $ 134,705,743 |
| Capital loss carryforwards | $ (326,879,898) |
The difference between book-basis and the tax-basis net unrealized appreciation/depreciation is attributable to differing treatments for the deferral of losses on wash sales and the realization for tax purposes of unrealized gains on investments in passive foreign investment companies.
At November 30, 2013, the cost of investments for federal tax purposes was $494,550,465. The net unrealized appreciation of investments for federal tax purposes excluding: (a) any unrealized appreciation/depreciation resulting from the translation of FCs to U.S. dollars of assets and liabilities other than investments in securities; (b) outstanding foreign currency commitments; and (c) futures contracts was $134,569,463. This consists of net unrealized appreciation from investments for those securities having an excess of value over cost of $140,003,521 and net unrealized depreciation from investments for those securities having an excess of cost over value of $5,434,058.
At November 30, 2013, the Fund had a capital loss carryforward of $326,879,898 which will reduce the Fund's taxable income arising from future net realized gains on investments, if any, to the extent permitted by the Code, thereby reducing the amount of distributions to shareholders which would otherwise be necessary to relieve the Fund of any liability for federal income tax. Pursuant to the Code, a net capital loss incurred in taxable years beginning on or before December 22, 2010, is characterized as short-term and may be carried forward for a maximum of eight tax years (“Carryforward Limit”), whereas a net capital loss incurred in taxable years beginning after December 22, 2010, retains its character as either short-term or long-term, does not expire and is required to be utilized prior to the losses which have a Carryforward Limit.
The following schedule summarizes the Fund's capital loss carryforwards and expiration years:
| Expiration Year | Short-Term | Long-Term | Total |
| 2016 | $ 76,397,253 | NA | $76,397,253 |
| 2017 | $ 250,482,645 | NA | $ 250,482,645 |
The Fund used capital loss carryforwards of $27,553,415 to offset taxable capital gains realized during the year ended November 30, 2013.
5. INVESTMENT ADVISER FEE AND OTHER TRANSACTIONS WITH AFFILIATES
Investment Adviser Fee
The advisory agreement between the Fund and the Adviser provides for an annual fee equal to 0.90% of the Fund's average daily net assets. Prior to June 24, 2013, the annual advisory fee was 1.00% of the Fund's average daily net assets. Subject to the terms described in the Expense Limitation note, the Adviser may also voluntarily choose to waive any portion of its fee. For the year ended November 30, 2013, the Adviser voluntarily waived $498,237 of its fee and reimbursed $201,482 of transfer agent fees.
Annual Shareholder Report
Administrative Fee
Federated Administrative Services (FAS), under the Administrative Services Agreement, provides the Fund with administrative personnel and services. For purposes of determining the appropriate rate breakpoint, “Investment Complex” is defined as all of the Federated Funds subject to a fee under the Administrative Services Agreement. The fee paid to FAS is based on the average daily net assets of the Investment Complex as specified below, plus certain out-of-pocket expenses:
| Administrative Fee | Average Daily Net Assets
of the Investment Complex |
| 0.150% | on the first $5 billion |
| 0.125% | on the next $5 billion |
| 0.100% | on the next $10 billion |
| 0.075% | on assets in excess of $20 billion |
Subject to the terms described in the Expense Limitation note, FAS may voluntarily choose to waive any portion of its fee. For the year ended November 30, 2013, the fee paid to FAS was 0.078% of the average daily net assets of the Fund.
Distribution Services Fee
The Fund has adopted a Distribution Plan (the “Plan”) pursuant to Rule 12b-1 under the Act. Under the terms of the Plan, the Fund will compensate Federated Securities Corp. (FSC), the principal distributor, from the daily net assets of the Fund's Class A Shares, Class B Shares, Class C Shares and Class R Shares to finance activities intended to result in the sale of these shares. The Plan provides that the Fund may incur distribution expenses at the following percentages of average daily net assets annually, to compensate FSC:
| Share Class Name | Percentage of Average Daily
Net Assets of Class |
| Class A Shares | 0.05% |
| Class B Shares | 0.75% |
| Class C Shares | 0.75% |
| Class R Shares | 0.50% |
Subject to the terms described in the Expense Limitation note, FSC may voluntarily choose to waive any portion of its fee. For the year ended November 30, 2013, distribution services fees for the Fund were as follows:
| | Distribution
Service Fees
Incurred | Distribution
Services Fees
Waived |
| Class B Shares | $75,582 | $— |
| Class C Shares | 330,490 | — |
| Class R Shares | 109,633 | (54,816) |
| TOTAL | $515,705 | $(54,816) |
For the year ended November 30, 2013, the Fund's Class A Shares did not incur a distribution services fee; however, it may begin to incur this fee upon approval of the Trustees.
Annual Shareholder Report
When FSC receives fees, it may pay some or all of them to financial intermediaries whose customers purchase shares. For the year ended November 30, 2013, FSC retained $49,940 of fees paid by the Fund.
Sales Charges
Front-end sales charges and contingent deferred sales charges (CDSC) do not represent expenses of the Fund. They are deducted from the proceeds of sales of Fund shares prior to investment or from redemption proceeds prior to remittance, as applicable. For the year ended November 30, 2013, FSC retained $12,958 in sales charges from the sale of Class A Shares. FSC also retained $3,225 of CDSC relating to redemptions of Class A Shares, $7,704 of CDSC relating to redemptions of Class B Shares and $1,982 relating to redemptions of Class C Shares.
Shareholder Services Fee
The Fund may pay fees (“Service Fees”) up to 0.25% of the average daily net assets of the Fund's Class A Shares, Class B Shares and Class C Shares to financial intermediaries or to Federated Shareholder Services Company (FSSC) for providing services to shareholders and maintaining shareholder accounts. Financial intermediaries may include a company affiliated with management of Federated Investors, Inc. A financial intermediary affiliated with management of Federated Investors, Inc. received $18,434 of Service Fees for the year ended November 30, 2013. Subject to the terms described in the Expense Limitation note, FSSC may voluntarily reimburse the Fund for Service Fees. For the year ended November 30, 2013, Service Fees for the Fund were as follows:
| | Service Fees
Incurred |
| Class A Shares | $690,451 |
| Class B Shares | 25,194 |
| Class C Shares | 109,991 |
| TOTAL | $825,636 |
For the year ended November 30, 2013, FSSC did not receive any fees paid by the Fund.
Expense Limitation
Effective February 1, 2014, the Adviser and certain of its affiliates (which may include FSC, FAS and FSSC) have voluntarily agreed to waive their respective fees and/or reimburse expenses so that the total annual fund operating expenses (as shown in the financial highlights, excluding tax reclaim recovery expenses, extraordinary expenses and proxy-related expenses paid by the Fund, if any) paid by the Fund's Class A Shares, Class B Shares, Class C Shares, Class R Shares, Institutional Shares and Class R6 Shares (after the voluntary waivers and reimbursements) will not exceed 1.29%, 2.08%, 2.08%, 1.45%, 0.98% and 0.94% (the “Fee Limit”), respectively, up to but not including the later of (the “Termination Date”): (a) February 1, 2015; or (b) the date of the Fund's next effective Prospectus. While the Adviser and its applicable affiliates currently do not anticipate terminating or increasing these arrangements prior to the Termination Date, these arrangements may only be terminated or the Fee Limit increased prior to the Termination Date with agreement of the Trustess.
Annual Shareholder Report
General
Certain Officers and Trustees of the Fund are Officers and Directors or Trustees of certain of the above companies. To efficiently facilitate payment, Directors'/Trustees' fees and certain expenses related to conducting meetings of the Directors/Trustees and other miscellaneous expenses are paid by an affiliate of the Adviser which in due course are reimbursed by the Fund.
Transactions Involving Affiliated Holdings
Affiliated holdings are investment companies which are managed by the Adviser or an affiliate of the Adviser. The Adviser has agreed to reimburse the Fund for certain investment adviser fees as a result of transactions in other affiliated investment companies. For the year ended November 30, 2013, the Adviser reimbursed $37,615. Transactions involving the affiliated holding during the year ended November 30, 2013, were as follows:
| | Federated
Prime Value
Obligations
Fund,
Institutional
Shares |
| Balance of Shares Held 11/30/2012 | 14,434,630 |
| Purchases/Additions | 248,284,877 |
| Sales/Reductions | (256,080,799) |
| Balance of Shares Held 11/30/2013 | 6,638,708 |
| Value | $6,638,708 |
| Dividend Income | $13,134 |
6. Investment TRANSACTIONS
Purchases and sales of investments, excluding long-term U.S. government securities and short-term obligations, for the year ended November 30, 2013, were as follows:
| Purchases | $ 358,290,696 |
| Sales | $ 346,168,379 |
7. CONCENTRATION OF RISK
The Fund invests in securities of non-U.S. issuers. Political or economic developments may have an effect on the liquidity and volatility of portfolio securities and currency holdings.
8. LINE OF CREDIT
The Fund participates in a $100,000,000 unsecured, uncommitted revolving line of credit (LOC) agreement with PNC Bank. The LOC was made available for extraordinary or emergency purposes, primarily for financing redemption payments. Borrowings are charged interest at a rate offered to the Fund by PNC Bank at the time of the borrowing. As of November 30, 2013, there were no outstanding loans. During the year ended November 30, 2013, the Fund did not utilize the LOC.
Annual Shareholder Report
9. INTERFUND LENDING
Pursuant to an Exemptive Order issued by the Securities and Exchange Commission, the Fund, along with other funds advised by subsidiaries of Federated Investors, Inc., may participate in an interfund lending program. This program provides an alternative credit facility allowing the Fund to borrow from other participating affiliated funds. As of November 30, 2013, there were no outstanding loans. During the year ended November 30, 2013, the program was not utilized.
10. FEDERAL TAX INFORMATION (UNAUDITED)
For the fiscal year ended November 30, 2013, 100% of total income distributions made by the Fund are qualifying dividends which may be subject to a maximum tax rate of 15%, as provided for by the Jobs and Growth Tax Relief Act of 2003. Complete information is reported in conjunction with the reporting of your distributions on Form 1099-DIV.
To the extent the Fund meets the requirements of Section 853 of the Internal Revenue Code of 1986, as amended, the Fund will pass through to its shareholders credits for foreign taxes paid.
For the fiscal year ended November 30, 2013, the Fund derived $10,494,021 of gross income from foreign sources and paid foreign taxes of $565,399.
Annual Shareholder Report
Report of Independent Registered Public Accounting Firm
TO THE BOARD OF TRUSTEES OF THE FEDERATED EQUITY FUNDS AND SHAREHOLDERS OF Federated Intercontinental fund:
We have audited the accompanying statement of assets and liabilities, including the portfolio of investments, of the Federated InterContinental Fund (the “Fund”), a portfolio of Federated Equity Funds, as of November 30, 2013, and the related statement of operations for the year then ended, the statements of changes in net assets for each of the years in the two-year period then ended, and the financial highlights for each of the years or periods in the five-year period then ended. These financial statements and financial highlights are the responsibility of the Fund's management. Our responsibility is to express an opinion on these financial statements and financial highlights based on our audits.
We conducted our audits in accordance with the standards of the Public Company Accounting Oversight Board (United States). Those standards require that we plan and perform the audit to obtain reasonable assurance about whether the financial statements and financial highlights are free of material misstatement. An audit includes examining, on a test basis, evidence supporting the amounts and disclosures in the financial statements. Our procedures included confirmation of securities owned as of November 30, 2013, by correspondence with the custodian, transfer agent and brokers or by other appropriate auditing procedures. An audit also includes assessing the accounting principles used and significant estimates made by management, as well as evaluating the overall financial statement presentation. We believe that our audits provide a reasonable basis for our opinion.
In our opinion, the financial statements and financial highlights referred to above present fairly, in all material respects, the financial position of the Federated InterContinental Fund as of November 30, 2013, and the results of its operations for the year then ended, the changes in its net assets for each of the years in the two-year period then ended, and the financial highlights for each of the years or periods in the five-year period then ended, in conformity with U.S. generally accepted accounting principles.
Boston, Massachusetts
January 23, 2014
Annual Shareholder Report
Shareholder Expense Example (unaudited)
As a shareholder of the Fund, you incur two types of costs: (1) transaction costs, including sales charges (“loads”) on purchase or redemption payments and (2) ongoing costs, including management fees and to the extent applicable, distribution (12b-1) fees and/or shareholder services fees and other Fund expenses. This Example is intended to help you to understand your ongoing costs (in dollars) of investing in the Fund and to compare these costs with the ongoing costs of investing in other mutual funds. It is based on an investment of $1,000 invested at the beginning of the period and held for the entire period from June 1, 2013 to November 30, 2013.
ACTUAL EXPENSES
The first section of the table below provides information about actual account values and actual expenses. You may use the information in this section, together with the amount you invested, to estimate the expenses that you incurred over the period. Simply divide your account value by $1,000 (for example, an $8,600 account value divided by $1,000 = 8.6), then multiply the result by the number in the first section under the heading entitled “Expenses Paid During Period” to estimate the expenses attributable to your investment during this period.
HYPOTHETICAL EXAMPLE FOR COMPARISON PURPOSES
The second section of the table below provides information about hypothetical account values and hypothetical expenses based on the Fund's actual expense ratio and an assumed rate of return of 5% per year before expenses, which is not the Fund's actual return. Thus, you should not use the hypothetical account values and expenses to estimate the actual ending account balance or your expenses for the period. Rather, these figures are required to be provided to enable you to compare the ongoing costs of investing in the Fund with other funds. To do so, compare this 5% hypothetical example with the 5% hypothetical examples that appear in the shareholder reports of the other funds.
Annual Shareholder Report
Please note that the expenses shown in the table are meant to highlight your ongoing costs only and do not reflect any transaction costs, such as sales charges (loads) on purchase or redemption payments. Therefore, the second section of the table is useful in comparing ongoing costs only, and will not help you determine the relative total costs of owning different funds. In addition, if these transaction costs were included, your costs would have been higher.
| | Beginning
Account Value
6/1/2013 | Ending
Account Value
11/30/2013 | Expenses Paid
During Period |
| Actual: | | | |
| Class A Shares | $1,000 | $1,096.40 | $6.881 |
| Class B Shares | $1,000 | $1,091.90 | $11.071 |
| Class C Shares | $1,000 | $1,092.00 | $11.011 |
| Class R Shares | $1,000 | $1,095.30 | $7.931 |
| Institutional Shares | $1,000 | $1,098.20 | $5.311 |
| Class R6 Shares | $1,000 | $1,079.20 | $3.162 |
Hypothetical (assuming a 5% return
before expenses): | | | |
| Class A Shares | $1,000 | $1,018.50 | $6.631 |
| Class B Shares | $1,000 | $1,014.49 | $10.661 |
| Class C Shares | $1,000 | $1,014.54 | $10.611 |
| Class R Shares | $1,000 | $1,017.50 | $7.641 |
| Institutional Shares | $1,000 | $1,020.00 | $5.111 |
| Class R6 Shares | $1,000 | $1,020.36 | $4.762 |
| 1 | Expenses are equal to the Fund's annualized net expense ratios, multiplied by the average account value over the period, multiplied by 183/365 (to reflect the one-half-year period). The annualized net expense ratios are as follows: |
| Class A Shares | 1.31% |
| Class B Shares | 2.11% |
| Class C Shares | 2.10% |
| Class R Shares | 1.51% |
| Institutional Shares | 1.01% |
| 2 | “Actual” expense information for the Class R6 Shares is for the period from August 5, 2013 (date of initial investment) to November 30, 2013. Actual expenses are equal to the Class R6 Shares annualized expense ratio of 0.94%, multiplied by 118/365 (to reflect the period from initial investment to November 30, 2013). “Hypothetical” expense information for Class R6 Shares is presented on the basis of the full one-half year period to enable comparison to the other funds. It is based on assuming the same annualized expense ratio, but is multiplied by 183/365 (to reflect the full half-year period). |
Annual Shareholder Report
Shareholder Meeting Results (unaudited)
A Special Meeting of Shareholders of Federated Equity Funds (the “Trust”), of which the Fund is a portfolio, was held on October 28, 2013. On August 29, 2013, the record date for shareholders voting at the meeting, there were 2,777,709,632.389 total outstanding shares of the Trust.
The following item was considered by shareholders of the Trust and the results of their voting were as follows:
AGENDA ITEM
Proposal to elect certain Trustees of the Trust:1
| Name | For | Withheld |
| John T. Collins | 2,104,364,292.660 | 29,376,009.057 |
| Maureen Lally-Green | 2,104,554,202.739 | 29,186,098.978 |
| Thomas M. O'Neill | 2,104,050,166.003 | 29,690,135.714 |
| P. Jerome Richey | 2,103,363,407.698 | 30,376,894.019 |
| 1 | The following Trustees continued their terms:
John F. Donahue, J. Christopher Donahue, Maureen Lally-Green (having been previously appointed by the Board), Peter E. Madden, Charles F. Mansfield, Jr., Thomas M. O'Neill (having been previously appointed by the Board), and John S. Walsh. |
Board of Trustees and Trust Officers
The Board of Trustees is responsible for managing the Trust business affairs and for exercising all the Trust powers except those reserved for the shareholders. The following tables give information about each Trustee and the senior officers of the Fund. Where required, the tables separately list Trustees who are “interested persons” of the Fund (i.e., “Interested” Trustees) and those who are not (i.e., “Independent” Trustees). Unless otherwise noted, the address of each person listed is Federated Investors Tower, 1001 Liberty Avenue, Pittsburgh, PA 15222. The address of all Independent Trustees listed is 4000 Ericsson Drive, Warrendale, PA 15086-7561; Attention: Mutual Fund Board. As of December 31, 2013, the Trust comprised 13 portfolio(s), and the Federated Fund Family consisted of 42 investment companies (comprising 135 portfolios). Unless otherwise noted, each Officer is elected annually. Unless otherwise noted, each Trustee oversees all portfolios in the Federated Fund Family and serves for an indefinite term. The Fund's Statement of Additional Information includes additional information about Trust Trustees and is available, without charge and upon request, by calling 1-800-341-7400.
In Memoriam - John F. Cunningham, Independent Trustee
With deep sadness, Federated announces the passing of John F. Cunningham, who served as an independent member of the Board of the Federated Fund Family since 1999. Mr. Cunningham's savvy business acumen and incisive intellect made him a powerful force on the Federated Fund Board. He was an advocate for shareholders and a respected colleague within the Federated family. Mr. Cunningham enjoyed an outstanding career in technology, having served as President and in other Senior Executive positions with leading companies in the industry. Federated expresses gratitude to Mr. Cunningham for his fine contributions as a Board member, colleague and friend. He will be greatly missed.
Interested Trustees Background
Name
Birth Date
Positions Held with Trust
Date Service Began | Principal Occupation(s) for Past Five Years,
Other Directorships Held and Previous Position(s) |
John F. Donahue*
Birth Date: July 28, 1924
Trustee
Began serving: April 1984 | Principal Occupations: Director or Trustee of the Federated Fund Family; Chairman and Director, Federated Investors, Inc.; Chairman of the Federated Fund Family's Executive Committee.
Previous Positions: Chairman of the Federated Fund Family; Trustee, Federated Investment Management Company; Chairman and Director, Federated Investment Counseling. |
Annual Shareholder Report
Name
Birth Date
Positions Held with Trust
Date Service Began | Principal Occupation(s) for Past Five Years,
Other Directorships Held and Previous Position(s) |
J. Christopher Donahue*
Birth Date: April 11, 1949
President and Trustee
Began serving: January 2000 | Principal Occupations: Principal Executive Officer and President of certain of the Funds in the Federated Fund Family; Director or Trustee of the Funds in the Federated Fund Family; President, Chief Executive Officer and Director, Federated Investors, Inc.; Chairman and Trustee, Federated Investment Management Company; Trustee, Federated Investment Counseling; Chairman and Director, Federated Global Investment Management Corp.; Chairman, Federated Equity Management Company of Pennsylvania and Passport Research, Ltd. (investment advisory subsidiary of Federated); Trustee, Federated Shareholder Services Company; Director, Federated Services Company.
Previous Positions: President, Federated Investment Counseling; President and Chief Executive Officer, Federated Investment Management Company, Federated Global Investment Management Corp. and Passport Research, Ltd. |
| * | Family relationships and reasons for “interested” status: John F. Donahue is the father of J. Christopher Donahue; both are “interested” due to their beneficial ownership of shares of Federated Investors, Inc. and the positions they hold with Federated and its subsidiaries. |
INDEPENDENT Trustees Background
Name
Birth Date
Positions Held with Trust
Date Service Began | Principal Occupation(s) for Past Five Years,
Other Directorships Held, Previous Position(s) and Qualifications |
John T. Collins
Birth Date: January 24, 1947
Trustee
Began serving: October 2013 | Principal Occupations: Director or Trustee of the Federated Fund Family; Chairman and CEO, The Collins Group, Inc. (a private equity firm).
Other Directorships Held: Chairman Emeriti, Bentley University; Director, Sterling Suffolk Downs, Inc.; Former Director, National Association of Printers and Lithographers.
Previous Positions: Director and Audit Committee Member, Bank of America Corp.
Qualifications: Business management and director experience. |
Annual Shareholder Report
Name
Birth Date
Positions Held with Trust
Date Service Began | Principal Occupation(s) for Past Five Years,
Other Directorships Held, Previous Position(s) and Qualifications |
Maureen Lally-Green
Birth Date: July 5, 1949
Trustee
Began serving: August 2009 | Principal Occupations: Director or Trustee of the Federated Fund Family; Associate General Secretary and Director, Office for Church Relations, Diocese of Pittsburgh; Adjunct Professor of Law, Duquesne University School of Law; Superior Court of Pennsylvania (service began 1998 and ended July 2009).
Other Directorships Held: Director, Consol Energy (service started June 2013); Director, Auberle (service ended December 2013); Member, Pennsylvania State Board of Education; Director, Saint Vincent College; Director, Ireland Institute of Pittsburgh (service ended December 2013); Director and Chair, UPMC Mercy Hospital; Regent, St. Vincent Seminary; Director, Epilepsy Foundation of Western and Central Pennsylvania; Director, Saint Thomas More Society (service ended December 2013); Director, Our Campaign for the Church Alive!, Inc.; Director, Pennsylvania Bar Institute (2013-present); Director, Cardinal Wuerl North Catholic High School (2013-present).
Previous Position: Professor of Law, Duquesne University School of Law, Pittsburgh (1983-1998).
Qualifications: Legal and director experience. |
Peter E. Madden
Birth Date: March 16, 1942
Trustee
Began serving: November 1991 | Principal Occupation: Director or Trustee, and Chairman of the Board of Directors or Trustees, of the Federated Fund Family.
Previous Positions: Representative, Commonwealth of Massachusetts General Court; President, Chief Operating Officer and Director, State Street Bank and Trust Company and State Street Corporation (retired); Director, VISA USA and VISA International; Chairman and Director, Massachusetts Bankers Association; Director, Depository Trust Corporation; Director, The Boston Stock Exchange.
Qualifications: Business management, mutual fund services and director experience. |
Charles F. Mansfield, Jr.
Birth Date: April 10, 1945
Trustee
Began serving: January 1999 | Principal Occupations: Director or Trustee of the Federated Fund Family; Management Consultant.
Previous Positions: Chief Executive Officer, PBTC International Bank; Partner, Arthur Young & Company (now Ernst & Young LLP); Chief Financial Officer of Retail Banking Sector, Chase Manhattan Bank; Senior Vice President, HSBC Bank USA (formerly Marine Midland Bank); Vice President, Citibank; Assistant Professor of Banking and Finance, Frank G. Zarb School of Business, Hofstra University; Executive Vice President, DVC Group, Inc. (marketing, communications and technology).
Qualifications: Banking, business management, education and director experience. |
Annual Shareholder Report
Name
Birth Date
Positions Held with Trust
Date Service Began | Principal Occupation(s) for Past Five Years,
Other Directorships Held, Previous Position(s) and Qualifications |
Thomas M. O'Neill
Birth Date: June 14, 1951
Trustee
Began serving: October 2006 | Principal Occupations: Director or Trustee, Vice Chairman of the Audit Committee of the Federated Fund Family; Sole Proprietor, Navigator Management Company (investment and strategic consulting).
Other Directorships Held: Board of Overseers, Children's Hospital of Boston; Visiting Committee on Athletics, Harvard College; Board of Directors, Medicines for Humanity; Board of Directors, The Golisano Children's Museum of Naples, Florida.
Previous Positions: Chief Executive Officer and President, Managing Director and Chief Investment Officer, Fleet Investment Advisors; President and Chief Executive Officer, Aeltus Investment Management, Inc.; General Partner, Hellman, Jordan Management Co., Boston, MA; Chief Investment Officer, The Putnam Companies, Boston, MA; Credit Analyst and Lending Officer, Fleet Bank; Director and Consultant, EZE Castle Software (investment order management software); Director, Midway Pacific (lumber).
Qualifications: Business management, mutual fund, director and investment experience. |
P. Jerome Richey
Birth Date: February 23, 1949
Trustee
Began serving: October 2013 | Principal Occupations: Director or Trustee of the Federated Fund Family; General Counsel, University of Pittsburgh.
Other Directorships Held: Board Chairman, Epilepsy Foundation of Western Pennsylvania; Board Member, World Affairs Council of Pittsburgh.
Previous Positions: Chief Legal Officer and Executive Vice President, CONSOL Energy Inc.; Shareholder, Buchanan Ingersoll & Rooney PC (a law firm).
Qualifications: Business management, legal and director experience. |
John S. Walsh
Birth Date: November 28, 1957
Trustee
Began serving: January 1999 | Principal Occupations: Director or Trustee, Chairman of the Audit Committee of the Federated Fund Family; President and Director, Heat Wagon, Inc. (manufacturer of construction temporary heaters); President and Director, Manufacturers Products, Inc. (distributor of portable construction heaters); President, Portable Heater Parts, a division of Manufacturers Products, Inc.
Previous Position: Vice President, Walsh & Kelly, Inc.
Qualifications: Business management and director experience. |
Annual Shareholder Report
OFFICERS
Name
Birth Date
Address
Positions Held with Trust
Date Service Began | Principal Occupation(s) for Past Five Years
and Previous Position(s) |
John W. McGonigle
Birth Date: October 26, 1938
EXECUTIVE VICE PRESIDENT AND SECRETARY
Officer since: April 1984 | Principal Occupations: Executive Vice President and Secretary of the Federated Fund Family; Vice Chairman, Executive Vice President, Secretary and Director, Federated Investors, Inc.
Previous Positions: Trustee, Federated Investment Management Company and Federated Investment Counseling; Director, Federated Global Investment Management Corp., Federated Services Company and Federated Securities Corp. |
Lori A. Hensler
Birth Date: January 6, 1967
TREASURER
Officer since: April 2013 | Principal Occupations: Principal Financial Officer and Treasurer of the Federated Fund Family; Senior Vice President, Federated Administrative Services; Financial and Operations Principal for Federated Securities Corp. and Edgewood Services, Inc.; and Assistant Treasurer, Federated Investors Trust Company. Ms. Hensler has received the Certified Public Accountant designation.
Previous Positions: Controller of Federated Investors, Inc.; Senior Vice President and Assistant Treasurer, Federated Investors Management Company; Treasurer, Federated Investors Trust Company; Assistant Treasurer, Federated Administrative Services, Federated Administrative Services, Inc., Federated Securities Corp., Edgewood Services, Inc., Federated Advisory Services Company, Federated Equity Management Company of Pennsylvania, Federated Global Investment Management Corp., Federated Investment Counseling, Federated Investment Management Company, Passport Research, Ltd., and Federated MDTA, LLC; Financial and Operations Principal for Federated Securities Corp., Edgewood Services, Inc. and Southpointe Distribution Services, Inc. |
Peter J. Germain
Birth Date: September 3, 1959
CHIEF LEGAL OFFICER
Officer since: January 2005 | Principal Occupations: Mr. Germain is Chief Legal Officer of the Federated Fund Family. He is General Counsel and Vice President, Federated Investors, Inc.; President, Federated Administrative Services and Federated Administrative Services, Inc.; Vice President, Federated Securities Corp.; Secretary, Federated Private Asset Management, Inc.; and Secretary, Retirement Plan Service Company of America. Mr. Germain joined Federated in 1984 and is a member of the Pennsylvania Bar Association.
Previous Positions: Deputy General Counsel, Special Counsel, Managing Director of Mutual Fund Services, Federated Investors, Inc.; Senior Vice President, Federated Services Company; and Senior Corporate Counsel, Federated Investors, Inc. |
Richard B. Fisher
Birth Date: May 17, 1923
VICE PRESIDENT
Officer since: April 1987 | Principal Occupations: Vice Chairman or Vice President of some of the Funds in the Federated Fund Family; Vice Chairman, Federated Investors, Inc.; Chairman, Federated Securities Corp.
Previous Positions: President and Director or Trustee of some of the Funds in the Federated Fund Family; Executive Vice President, Federated Investors, Inc.; Director and Chief Executive Officer, Federated Securities Corp. |
Annual Shareholder Report
Name
Birth Date
Address
Positions Held with Trust
Date Service Began | Principal Occupation(s) for Past Five Years
and Previous Position(s) |
Brian P. Bouda
Birth Date: February 28, 1947
CHIEF COMPLIANCE OFFICER AND SENIOR VICE PRESIDENT
Officer since: August 2004 | Principal Occupations: Senior Vice President and Chief Compliance Officer of the Federated Fund Family; Vice President and Chief Compliance Officer of Federated Investors, Inc. and Chief Compliance Officer of certain of its subsidiaries. Mr. Bouda joined Federated in 1999 and is a member of the American Bar Association and the State Bar Association of Wisconsin.
Previous Positions: Served in Senior Management positions with a large regional banking organization. |
Stephen F. Auth
Birth Date: September 3, 1956
450 Lexington Avenue
Suite 3700
New York, NY 10017-3943
CHIEF INVESTMENT OFFICER
Officer since: November 2002 | Principal Occupations: Stephen F. Auth is Chief Investment Officer of various Funds in the Federated Fund Family; Executive Vice President, Federated Investment Counseling, Federated Global Investment Management Corp. and Federated Equity Management Company of Pennsylvania.
Previous Positions: Executive Vice President, Federated Investment Management Company and Passport Research, Ltd. (investment advisory subsidiary of Federated); Senior Vice President, Global Portfolio Management Services Division; Senior Vice President, Federated Investment Management Company and Passport Research, Ltd.; Senior Managing Director and Portfolio Manager, Prudential Investments. |
Audrey H. Kaplan
Birth Date: February 20, 1967
Vice President
Officer since: February 2011
Portfolio Manager since: February 2004 | Principal Occupations: Senior Vice President, Senior Portfolio Manager of the Fund's Adviser and Head of the International Equity Team. Audrey H. Kaplan has been the Fund's Portfolio Manager since February 2004. She is Vice President of the Trust with respect to the Fund. Ms. Kaplan is responsible for portfolio management and research in the global equity area.
Previous Positions: Ms. Kaplan has 25 years of investment experience. Prior to joining Federated in August 2007, she managed the Rochdale Atlas Portfolio at Rochdale Investment Management, LLC in New York; was a hedge fund strategy consultant at BlueCrest Capital Management in London; worked in European quantitative strategy for Merrill Lynch in London; researched global emerging markets at Robert Fleming in London; and completed equity, fixed-income and derivative analysis with Salomon Brothers in Tokyo and New York. |
Annual Shareholder Report
Evaluation and Approval of Advisory Contract–May 2013
Federated InterContinental Fund (the “Fund”)
Following a review and recommendation of approval by the Fund's independent trustees, the Fund's Board reviewed and approved at its May 2013 meetings the Fund's investment advisory contract for an additional one-year term. The Board's decision regarding the contract reflects the exercise of its business judgment on whether to continue the existing arrangements.
In this connection, the Federated Funds' Board had previously appointed a Senior Officer, whose duties include specified responsibilities relating to the process by which advisory fees are to be charged to a Federated fund. The Senior Officer has the authority to retain consultants, experts, or staff as may be reasonably necessary to assist in the performance of his duties, reports directly to the Board, and may be terminated only with the approval of a majority of the independent members of the Board. The Senior Officer prepared and furnished to the Board an independent, written evaluation that covered topics discussed below (the “Evaluation”). The Board considered that Evaluation, along with other information, in deciding to approve the advisory contract.
The Board is also familiar with and considered judicial decisions concerning allegedly excessive investment advisory fees, which have indicated that the following factors may be relevant to an Adviser's fiduciary duty with respect to its receipt of compensation from a fund: the nature and quality of the services provided by the Adviser to a fund and its shareholders, including the performance and expenses of the fund and of comparable funds; the Adviser's cost of providing the services, including the profitability to the Adviser of providing advisory services to a fund; the extent to which the Adviser may realize “economies of scale” as a fund grows larger and, if such economies exist, whether they have been shared with a fund and its shareholders or the family of funds; any “fall-out financial benefits” that accrue to the Adviser because of its relationship with a fund (including research services received from brokers that execute fund trades and any fees paid to affiliates of the Adviser for services rendered to a fund); comparative fee structures, including a comparison of fees paid to the Adviser with those paid by similar funds; and the extent to which the Board members are fully informed about all facts the Board deems relevant to its consideration of the Adviser's services and fees. Consistent with these judicial decisions, the Board also considered management fees charged to institutional and other clients of the Adviser for what might be viewed as like services. The Board was aware of these factors and was guided by them in its review of the Fund's advisory contract to the extent it considered them to be appropriate and relevant, as discussed further below.
Annual Shareholder Report
The Board considered and weighed these circumstances in light of its substantial accumulated experience in governing the Fund and working with Federated on matters relating to the Federated funds, and was assisted in its deliberations by independent legal counsel. Throughout the year, and in connection with its May meetings, the Board requested and received substantial and detailed information about the Fund and the Federated organization that was in addition to the extensive materials that comprise and accompany the Senior Officer's Evaluation. Federated provided much of this information at each regular meeting of the Board, and furnished additional substantial information in connection with the May meeting at which the Board's formal review of the advisory contract occurred. At this May meeting, senior management of the Adviser also met with the independent trustees and their counsel to discuss the materials presented and any other matters thought relevant by the Adviser or the trustees. Between regularly scheduled meetings, the Board also received information on particular matters as the need arose. Thus, the Board's consideration of the advisory contract included review of the Senior Officer's Evaluation, accompanying data and additional information covering such matters as: the Adviser's investment philosophy, revenue, profitability, personnel and processes; investment and operating strategies; the Fund's short- and long-term performance (in absolute terms, both on a gross basis and net of expenses, as well as in relationship to its particular investment program and certain competitor or “peer group” funds and/or other benchmarks, as appropriate), and comments on the reasons for performance; the Fund's investment objectives; the Fund's expenses (including the advisory fee itself and the overall expense structure of the Fund, both in absolute terms and relative to similar and/or competing funds, with due regard for contractual or voluntary expense limitations); the use and allocation of brokerage commissions derived from trading the Fund's portfolio securities (if any); and the nature, quality and extent of the advisory and other services provided to the Fund by the Adviser and its affiliates. The Board also considered the preferences and expectations of Fund shareholders; the entrepreneurial risk assumed by the Adviser in sponsoring the funds; the continuing state of competition in the mutual fund industry and market practices; the range of comparable fees for similar funds in the mutual fund industry; the Fund's relationship to the Federated family of funds which include a comprehensive array of funds with different investment objectives, policies and strategies which are available for exchange without the incurrence of additional sales charges; compliance and audit reports concerning the Federated funds and the Federated companies that service them (including communications from regulatory agencies), as well as Federated's responses to any issues raised therein; and relevant developments in the mutual fund industry and how the Federated funds and/or Federated are responding to them. The Board's evaluation process is evolutionary. The criteria considered and the emphasis placed on relevant criteria change in recognition of changing circumstances in the mutual fund marketplace.
Annual Shareholder Report
While mindful that courts have cautioned against giving such comparisons too much weight, the Board has found the use of comparisons of the Fund's fees and expenses to other mutual funds with comparable investment programs to be relevant. The Board focused on comparisons with other similar mutual funds more heavily than non-mutual fund products or services because it is believed that they are more relevant. For example, other mutual funds are the products most like the Fund, they are readily available to Fund shareholders as alternative investment vehicles, and they are the type of investment vehicle in fact chosen and maintained by the Fund's investors. The range of their fees and expenses therefore appears to be a relevant indicator of what consumers have found to be reasonable in the precise marketplace in which the Fund competes.
It was noted in the materials for the Board meeting that for the period covered by the Evaluation, the Fund's investment advisory fee, after waivers and expense reimbursements, if any, was above the median of the relevant peer group. The Board reviewed the fees and other expenses of the Fund with the Adviser, noting that the overall expense structure of the Fund, after waivers and expense reimbursements, was above the median of the relevant peer group, but the Board still was satisfied that the overall expense structure of the Fund remained competitive. The Board will continue to monitor advisory fees and other expenses borne by the Fund.
By contrast, the Senior Officer has reviewed Federated's fees for providing advisory services to products outside the Federated family of funds (e.g., institutional and separate accounts). He concluded that mutual funds and institutional accounts are inherently different products. Those differences include, but are not limited to, different types of targeted investors; being subject to different laws and regulations; different legal structures; different average account sizes; different associated costs; different portfolio management techniques made necessary by different cash flows; and the time spent by portfolio managers and their teams, funds financial services, legal, compliance and risk management in reviewing securities pricing, addressing different administrative responsibilities, addressing different degrees of risk associated with management and a variety of different costs. The Senior Officer did not consider these fee schedules to be determinative in judging the appropriateness of mutual fund advisory fees.
The Fund's ability to deliver competitive performance when compared to its peer group was also deemed to be relevant by the Board as a useful indicator of how the Adviser is executing the Fund's investment program, which in turn assisted the Board in reaching a conclusion that the nature, extent, and quality of the Adviser's investment management services were such as to warrant continuation of the advisory contract.
Annual Shareholder Report
The Senior Officer reviewed information compiled by Federated, using data supplied by independent fund ranking organizations, regarding the performance of, and fees charged by, other mutual funds, noting his view that comparisons to fund peer groups are relevant, though not conclusive in judging the reasonableness of proposed fees.
For the one-year, three-year and five-year periods covered by the Evaluation, the Fund's performance was above the median of the relevant peer group.
The Board also received financial information about Federated, including information regarding the compensation and benefits Federated derived from its relationships with the Federated funds. This information covered not only the fees under the advisory contracts, but also fees received by Federated's subsidiaries for providing other services to the Federated funds under separate contracts (e.g., for serving as the Federated funds' administrator). The information also detailed any indirect benefit Federated may derive from its receipt of research services from brokers who execute Federated fund trades. In addition, the Board considered the fact that, in order for a fund to be competitive in the marketplace, Federated and its affiliates frequently waived fees and/or reimbursed expenses and have disclosed to fund investors and/or indicated to the Board their intention to do so in the future, where appropriate. Moreover, the Board receives regular reporting as to the institution, adjustment or elimination of these voluntary waivers. In this regard, Federated presented a proposal at the May 2013 Board meeting to increase its waiver by 23 basis points, which the Board approved. In addition, the Senior Officer proposed, and the Board approved, a reduction in the contractual advisory fee of 10 basis points. This change more closely aligned the contractual fee with the net fee actually charged after the imposition of applicable voluntary waivers and was believed by both the Senior Officer and the Board to improve the market competitiveness of the Fund.
Federated furnished information, requested by the Senior Officer, that reported revenues on a fund-by-fund basis and made estimates of the allocation of expenses on a fund-by-fund basis, using allocation methodologies specified by the Senior Officer. The Senior Officer noted that, while these cost allocation reports apply consistent allocation processes, the inherent difficulties in arbitrarily allocating costs continues to cause the Senior Officer to question the precision of the process and to conclude that such reports may be unreliable, since a single change in an allocation estimate can dramatically alter the resulting estimate of cost and/or profitability of a fund. The allocation information was considered in the analysis by the Board but was determined to be of limited use.
The Board and the Senior Officer also reviewed information compiled by Federated comparing profitability information for Federated to other publicly held fund management companies. In this regard, the Senior Officer noted the limited availability of such information, but nonetheless concluded that Federated's profit margins did not appear to be excessive. The Board agreed with this assessment.
Annual Shareholder Report
The Senior Officer's Evaluation also discussed the notion of possible realization of “economies of scale” as a fund grows larger. The Board considered in this regard that the Adviser has made significant and long-term investments in areas that support all of the Federated family of funds, such as personnel and processes for the portfolio management, shareholder services, compliance, internal audit, and risk management functions; and systems technology; and that the benefits of these efforts (as well as any economies, should they exist) were likely to be enjoyed by the fund family as a whole. Finally, the Board also noted the absence of any applicable regulatory or industry guidelines on this subject, which (as discussed in the Senior Officer's Evaluation) is compounded by the lack of any common industry practice or general pattern with respect to structuring fund advisory fees with “breakpoints” that serve to reduce the fee as the fund attains a certain size.
The Senior Officer noted that, subject to the comments and recommendations made within his Evaluation, his observations and the information accompanying the Evaluation supported a finding by the Board that the management fees for each of the funds were reasonable. Under these circumstances, other than the reduction in the contractual (or gross) advisory fee noted above, no changes were recommended to, and no objection was raised to, the continuation of the Fund's advisory contract.
In its decision to continue an existing investment advisory contract, the Board was mindful of the potential disruptions of the Fund's operations and various risks, uncertainties and other effects that could occur as a result of a decision to terminate or not renew an advisory contract. In particular, the Board recognized that many shareholders have invested in the Fund on the strength of the Adviser's industry standing and reputation and with the expectation that the Adviser will have a continuing role in providing advisory services to the Fund. Thus, the Board's approval of the advisory contract reflected the fact that it is the shareholders who have effectively selected the Adviser by virtue of having invested in the Fund. The Board concluded that, in light of the factors discussed above, including the nature, quality and scope of the services provided to the Fund by the Adviser and its affiliates, continuation of the advisory contract was appropriate.
The Board based its decision to approve the advisory contract on the totality of the circumstances and relevant factors and with a view to past and future long-term considerations. Not all of the factors and considerations identified above were necessarily relevant to the Fund, nor did the Board consider any one of them to be determinative. With respect to the factors that were relevant, the Board's decision to approve the contract reflects its determination that Federated's performance and actions provided a satisfactory basis to support the decision to continue the existing arrangements.
Annual Shareholder Report
Voting Proxies on Fund Portfolio Securities
A description of the policies and procedures that the Fund uses to determine how to vote proxies, if any, relating to securities held in the Fund's portfolio is available, without charge and upon request, by calling 1-800-341-7400. A report on “Form N-PX” of how the Fund voted any such proxies during the most recent 12-month period ended June 30 is available via the Proxy Voting Record (Form N-PX) link associated with the Fund and share class name at www.Federatedinvestors.com/FundInformation. Form N-PX filings are also available at the SEC's website at www.sec.gov.
Quarterly Portfolio Schedule
The Fund files with the SEC a complete schedule of its portfolio holdings, as of the close of the first and third quarters of its fiscal year, on “Form N-Q.” These filings are available on the SEC's website at www.sec.gov and may be reviewed and copied at the SEC's Public Reference Room in Washington, DC. (Call 1-800-SEC-0330 for information on the operation of the Public Reference Room.) You may also access this information via the link to the Fund and share class name at www.Federatedinvestors.com/FundInformation.
Annual Shareholder Report
Mutual funds are not bank deposits or obligations, are not guaranteed by any bank and are not insured or guaranteed by the U.S. government, the Federal Deposit Insurance Corporation, the Federal Reserve Board or any other government agency. Investment in mutual funds involves investment risk, including the possible loss of principal.
This Report is authorized for distribution to prospective investors only when preceded or accompanied by the Fund's Prospectus, which contains facts concerning its objective and policies, management fees, expenses and other information.
Federated InterContinental Fund
Federated Investors Funds
4000 Ericsson Drive
Warrendale, PA 15086-7561
Contact us at FederatedInvestors.com
or call 1-800-341-7400.
Federated Securities Corp., Distributor
CUSIP 314172511
CUSIP 314172495
CUSIP 314172487
CUSIP 314172479
CUSIP 314172461
CUSIP 314172164
37865 (1/14)
Federated is a registered trademark of Federated Investors, Inc.
2014 ©Federated Investors, Inc.
Annual Shareholder Report
November 30, 2013
| Share Class | Ticker |
| A | IVFAX |
| C | IVFCX |
| Institutional | IVFIX |
Federated International Strategic Value Dividend Fund
Fund Established 2008
A Portfolio of Federated Equity Funds
Dear Valued Shareholder,
I am pleased to present the Annual Shareholder Report for your fund covering the period from December 1, 2012 through November 30, 2013. This report includes Management's Discussion of Fund Performance, a complete listing of your fund's holdings, performance information and financial statements along with other important fund information.
In addition, our website, FederatedInvestors.com, offers easy access to Federated resources that include timely fund updates, economic and market insights from our investment strategists, and financial planning tools. We invite you to register to take full advantage of its capabilities.
Thank you for investing with Federated. I hope you find this information useful and look forward to keeping you informed.
Sincerely,
J. Christopher Donahue, President
Not FDIC Insured • May Lose Value • No Bank Guarantee
CONTENTS
| 1 |
| 9 |
| 11 |
| 14 |
| 17 |
| 18 |
| 19 |
| 20 |
| 31 |
| 32 |
| 34 |
| 35 |
| 41 |
| 46 |
| 46 |
Management's Discussion of Fund Performance (unaudited)
The total return of Federated International Strategic Value Dividend Fund (the “Fund”), based on net asset value, for the 12-month reporting period ended November 30, 2013, was 12.25% for the Class A Shares, 11.57% for the Class C Shares and 12.78% for the Institutional Shares. The total return of the MSCI EAFE High Dividend Yield Index (MSCI HDY),1 a broad-based securities market index that represents the international dividend-paying universe, was 24.83% for the reporting period. The MSCI EAFE Index (MSCI EAFE),2 representative of the broad securities market outside of North and South America, had a total return of 24.84% for the same period.3 The Fund's total return for the most recently completed fiscal year reflected actual cash flows, transaction costs and other expenses which are not reflected in the total return of the MSCI HDY or the MSCI EAFE.
The Fund's investment strategy focused on its goal of providing a consistent and growing income stream through dividend-based performance. This was the most significant factor affecting the Fund's performance relative to the MSCI HDY.
The following discussion will focus on the performance of the Fund's Institutional Shares. During the reporting period, the Fund's Institutional Shares underperformed the MSCI EAFE HDY and the MSCI EAFE. The 12.78% total return of the Institutional Shares consisted of 4.02% in dividend income and 8.76% in appreciation of the net asset value of the shares.
MARKET OVERVIEW
At the inception of the reporting period, equity investors remained cautious amid concerns that the euro zone could fall further into recession and that the U.S. “fiscal cliff” (automatic spending cuts that were slated to occur at the beginning of 2013), looming sequester spending cuts, and lingering impacts from Hurricane Sandy could threaten the domestic economy.
As 2013 progressed, investors' caution gave way to optimism. In the United States, the fiscal cliff was ultimately circumvented thanks to an eleventh-hour compromise that reduced the likelihood of a recession and helped pave the way for the strongest January for major stock indexes since 1989. Positive share performance continued throughout most of 2013, as investors looked past the drama in Washington and focused instead on data that was indicative of economic expansion. In addition to upbeat economic data, an accommodative Federal Reserve (the Fed) delayed any plans to taper its Quantitative Easing (QE) measures, providing another catalyst for an already bullish market. And in spite of the reporting period ending as it began, with another down-to-the-wire debt ceiling clash, U.S. equity markets ultimately rallied strongly in October and November with the Dow Jones Industrial Average4 and S&P 500 Index5 setting new highs.
Annual Shareholder Report
Outside of the U.S., the reporting period got off to a slow start, especially in the euro zone where the economy extended its contraction and unemployment hit another record high. Meanwhile, a bailout of Cypriot banks stoked fears of contagion and economic contraction in the region. However, sources of optimism began to emerge throughout the 12-month period. German retail sales began to rise, suggesting the euro zone's dominant economy was improving. And in spite of the tumult surrounding their bailout, Cypriot banks reopened to relative calm. As the euro-zone economy continued on its path of “gradual bottoming,” there were even some hints of improvement on the periphery, as the Spanish Purchasing Managers Index rose and Greek hiring showed some improvement (albeit off of a very low base). By August 2013, the euro zone had officially broken out of its recession, ending its longest period of contraction since World War II. In October, even Spain followed suit, with its central bank announcing that the country's two-year recession had finally ended. Signs of progress in the euro zone's periphery seemed to have a positive impact on both investors and consumers, as economic sentiment indicators and consumer surveys reflected a pickup in confidence. However, even as hints of optimism in southern Europe drove shares higher going into year end, the outlook for a full-blown European recovery remained tenuous as budgetary constraints and uncertain employment prospects served as a reminder of the delicate state of the region's economy.
Share performance in other parts of the world was also widely positive during the reporting period. Across the Pacific, the severity of China's slowdown loomed as a worry early in 2013, weighing on Australian stocks and causing downward pressure on the Australian Dollar. But ultimately signs of stabilization in China helped fuel a recovery in the Australian stock market as fears of rapid deceleration abated. Meanwhile, Japan's Nikkei Index6 posted some of 2013's highest total returns as the country's new government and central bank leadership launched a massive stimulus program, providing ample liquidity to support the Nikkei's rally.
Back in North America, Canadian shares fared relatively well in 2013, with the S&P/TSX Composite Index7 finishing the reporting period with five straight months of advances. Stock performance was fueled, in part, by improving Gross Domestic Product (GDP) growth and an accommodative monetary policy in Canada. However in spite of the healthy returns enjoyed by Canadian investors, the country's currency finished the reporting period at nearly a 3 1∕2 year low versus the U.S. Dollar as concerns about declining oil prices, high household debt, and the future of the Canadian housing sector pointed to interest rates remaining low for the foreseeable future.
And in South America, Brazil's Bovespa was one of only a handful of global stock indexes to finish the year in negative territory. Concerns about disappointing GDP growth and rising inflation weighed on both share performance and currency valuation as the Brazilian Real declined 9.7% versus the U.S. Dollar over the 12-month period.
Annual Shareholder Report
DIVIDEND-BASED PERFORMANCE
The Fund ended the 12-month reporting period with a 30-day SEC yield of 4.39% and a gross weighted-average dividend yield of 4.84%.8 The Fund's gross yield was greater than the yield of the 10-Year U.S. Treasury Note (2.8%), the yield of the broad market, represented by the MSCI EAFE (3.0%), and the yield of the MSCI HDY (4.5%). In addition to its higher-than-market yield, the portfolio seeks to own high-quality companies that can raise their dividends over time.9 Some of the most generous increases over the reporting period came from Australia & New Zealand Banking Group, Munich Re Group, Unilever and Imperial Tobacco Group. These companies increased their dividends by 13.1%, 12.0%, 10.7% and 10.2%, respectively.
Even with the Fund's low Beta of 0.77 (Wilshire 3-year beta versus the MSCI EAFE calculated using monthly return), the Fund still posted a favorable total return of 12.78%. The Fund primarily invests in high-yielding, low-beta, large-cap, high-quality holdings which are representative of a dividend-oriented strategy. While positive returns were noted across all Global Industry Classification Standard sectors in the 12-month period, high-beta, low-yielding stocks tended to outperform the more dividend-friendly sectors that are central to the Fund's strategy. But in spite of investors' preference for cyclical sectors that offer little opportunity for dividend investors, the Fund did enjoy strong contributions from core income-generating sectors such as Health Care and Telecommunications. Holdings in these sectors contributed weighted-average total returns of 29.3% and 19.3% each, led by Roche Holdings (+46.18%), Novartis AG (+32.10%) and Vodafone (+51.67%). Vodafone notably advanced after the September 2nd announcement that Verizon Communications reached an agreement to acquire Vodafone's 45% interest in Verizon Wireless for $130 billion. Vodafone is planning to pay out 71% of the net proceeds to shareholders as a special dividend in early 2014.
To the detriment of the portfolio, several individual stocks did post losses for the reporting period. Among these holdings were Banco do Brasil (-11.16%), U.K. insurer RSA (-4.9%), Japanese pharmaceutical company Eisai (-3.93%) and Australian health care services company Sonic (-1.00%). These four stocks in aggregate comprised only 2.55% of the portfolio and were ultimately sold during the reporting period. Australian bottling company Coca Cola Amatil also posted a loss of -18.16%, but was still owned at the end of the reporting period as its investment thesis had yet to play out. Norwegian integrated energy company Statoil also generated a loss of -3.41% in the period, due in part to currency fluctuation as the Norwegian Krone declined -7.40% against the U.S. Dollar. Statoil shares were still held in the Fund at the end of the reporting period, as they continued to support the strategy's pursuit of healthy businesses that generate rising income streams.
Annual Shareholder Report
Most foreign equity markets generated positive returns in the 12-month period, with Japan and the euro-zone countries producing some of the strongest performance in the global equity universe. Meanwhile, the Fund maintained only modest exposure to these countries due to their relatively limited offering of high-quality dividend opportunities. Consistent with its defensive, dividend-focused strategy, the Fund's holdings remained focused on stable, mature markets that offer an abundance of high-dividend paying stocks, especially the United Kingdom, Canada, Switzerland and Australia. And while these dividend-friendly countries all made positive contributions to the Fund's overall performance, all of them except Switzerland generated total returns that were, on average, below that of the global equity market (as represented by the MSCI EAFE). However, in spite of the Fund's bias toward dividend-friendly domiciles, the vast majority of its country allocations contributed positive total returns for the period. Holdings in France, Germany and Sweden provided the Fund's highest weighted-average total returns, led by Swedish bank Svenska Handelsbanken, German reinsurer Munich Re and French integrated energy company Total SA. These holdings returned 35.68%, 33.55% and 27.70% respectively for the period. Partially offsetting these positive contributors were the negative returns generated by investments in Brazil and Norway. However, the Fund's modest exposure to these countries (8.04% in aggregate) minimized the effect on the strategy's total returns. Foreign exchange rates also acted as a partial counterweight to positive Fund performance in the 12-month period. The negative impact of currency movements was noted especially on holdings in Australia, Canada, Norway and Brazil where the local currencies depreciated -12.40%, -6.17%, -7.40% and -9.65% each, versus the U.S. Dollar.
Over the 12-month reporting period, global markets were significantly affected by events such as political elections, uncertainty around central bank policies, unclear signs of a slow recovery in Europe, and an abundance of liquidity to fund burgeoning investor optimism. Despite the ups and downs of the market during the reporting period, the Fund remained positioned to effectively provide investors with positive income, reliable dividend growth and lower downside risk in a variety of market environments.
Annual Shareholder Report
| 1 | Please see the footnotes to the line graphs below for definitions of, and further information about, the MSCI HDY. |
| 2 | Please see the footnotes to the line graphs below for definitions of, and further information about, the MSCI EAFE. |
| 3 | International investing involves special risks including currency risk, increased volatility of foreign securities, political risks and differences in auditing and other financial standards. |
| 4 | The Dow Jones Industrial Average is a price-weighted average of 30 significant stocks traded on the New York Stock Exchange and the Nasdaq. The index is unmanaged, and it is not possible to invest directly in an index. |
| 5 | The S&P 500 Index is a capitalization-weighted index of 500 stocks designed to measure performance of the broad domestic economy through changes in the aggregate market value of 500 stocks representing all major industries. The index is unmanaged, and it is not possible to invest directly in an index. |
| 6 | The Nikkei Index is a price-weighted index comprised of Japan's top 225 blue-chip companies on the Tokyo Stock Exchange. The index is unmanaged, and it is not possible to invest directly in an index. |
| 7 | The S&P/TSX Composite Index is an index of the stock (equity) prices of the largest companies on the Toronto Stock Exchange (TSX) as measured by market capitalization. The index is unmanaged, and it is not possible to invest directly in an index. |
| 8 | Represents the 30-day SEC yield for the Fund's Institutional Shares. In the absence of temporary expense waivers or reimbursements the 30-day SEC yield would have been 4.14% for the Fund's Institutional Shares. The dividend yield represents the average yield of the underlying securities within the portfolio. |
| 9 | There are no guarantees that dividend-paying stocks will continue to pay dividends. In addition, dividend-paying stocks may not experience the same capital appreciation potential as non-dividend-paying stocks. |
Annual Shareholder Report
FUND PERFORMANCE AND GROWTH OF A $10,000 INVESTMENT
The Average Annual Total Return table below shows returns for each class averaged over the stated periods. The graphs below illustrate the hypothetical investment of $10,0001 in the Federated International Strategic Value Dividend Fund from June 4, 2008 (start of performance) to November 30, 2013, compared to the MSCI EAFE High Dividend Yield Index (MSCI HDY)2 and the Morgan Stanley Capital International Europe, Australasia and Far East Index (MSCI EAFE).3
Average Annual Total Returns for the Period Ended 11/30/2013
(returns reflect all applicable sales charges and contingent deferred sales charge as specified below in footnote #1)
| Share Class | 1 Year | 5 Year | Start of
Performance4 |
| Class A Shares | 5.96% | 9.87% | -0.34% |
| Class C Shares | 10.57% | 10.20% | -0.09% |
| Institutional Shares | 12.78% | 11.42% | 0.92% |
Performance data quoted represents past performance which is no guarantee of future results. Investment return and principal value will fluctuate so that an investor's shares, when redeemed, may be worth more or less than their original cost. Mutual fund performance changes over time and current performance may be lower or higher than what is stated. For current to the most recent month-end performance and after-tax returns, visit FederatedInvestors.com or call 1-800-341-7400. Returns shown do not reflect the deduction of taxes that a shareholder would pay on Fund distributions or the redemption of Fund shares. Mutual funds are not obligations of or guaranteed by any bank and are not federally insured.
Annual Shareholder Report
Growth of a $10,000 Investment–class A SHARES
Growth of $10,000 as of November 30, 2013
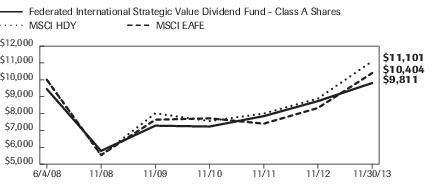
| Federated International Strategic Value Dividend Fund - | Class A Shares | MSCI HDY | MSCI EAFE |
| 6/4/2008 | 9,450 | 10,000 | 10,000 |
| 11/30/2008 | 5,785 | 5,517 | 5,544 |
| 11/30/2009 | 7,281 | 8,014 | 7,634 |
| 11/30/2010 | 7,232 | 7,555 | 7,719 |
| 11/30/2011 | 7,848 | 8,002 | 7,402 |
| 11/30/2012 | 8,740 | 8,893 | 8,335 |
| 11/30/2013 | 9,811 | 11,101 | 10,404 |
41 graphic description end -->
| ■ | Total returns shown include the maximum sales charge of 5.50% ($10,000 investment minus $550 sales charge = $9,450). |
Growth of a $10,000 Investment–class C SHARES
Growth of $10,000 as of November 30, 2013
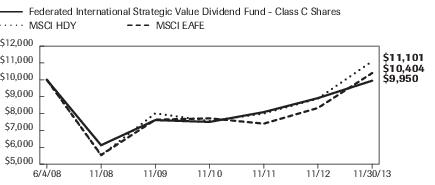
| Federated International Strategic Value Dividend Fund - | Class C Shares | MSCI HDY | MSCI EAFE |
| 6/4/2008 | 10,000 | 10,000 | 10,000 |
| 11/30/2008 | 6,123 | 5,517 | 5,544 |
| 11/30/2009 | 7,613 | 8,014 | 7,634 |
| 11/30/2010 | 7,504 | 7,555 | 7,719 |
| 11/30/2011 | 8,086 | 8,002 | 7,402 |
| 11/30/2012 | 8,918 | 8,893 | 8,335 |
| 11/30/2013 | 9,950 | 11,101 | 10,404 |
41 graphic description end -->
| ■ | Total returns shown include the maximum contingent deferred sales charge of 1.00% as applicable. |
Annual Shareholder Report
Growth of a $10,000 Investment–INSTITUTIONAL SHARES
Growth of $10,000 as of November 30, 2013

| Federated International Strategic Value Dividend Fund - | Institutional Shares | MSCI HDY | MSCI EAFE |
| 6/4/2008 | 10,000 | 10,000 | 10,000 |
| 11/30/2008 | 6,123 | 5,517 | 5,544 |
| 11/30/2009 | 7,713 | 8,014 | 7,634 |
| 11/30/2010 | 7,677 | 7,555 | 7,719 |
| 11/30/2011 | 8,349 | 8,002 | 7,402 |
| 11/30/2012 | 9,322 | 8,893 | 8,335 |
| 11/30/2013 | 10,513 | 11,101 | 10,404 |
41 graphic description end -->
| 1 | Represents a hypothetical investment of $10,000 in the Fund after deducting applicable sales charges: for Class A Shares, the maximum sales charge of 5.50% ($10,000 investment minus $550 sales charge = $9,450); for Class C Shares, the maximum contingent deferred sales charge is 1.00% on any redemption less than one year from the purchase date. The Fund's performance assumes the reinvestment of all dividends and distributions. The MSCI HDY and the MSCI EAFE have been adjusted to reflect reinvestment of dividends on securities in the indexes. |
| 2 | The MSCI HDY is based on MSCI EAFE, its parent index, and includes large-and mid-cap representation across developed markets countries around the world, excluding the United States and Canada. The index is designed to reflect the performance of equities in the parent index (excluding REITs) with higher than average dividend yields that are both sustainable and persistent. The index also applies quality screens and reviews 12-month past performance to omit stocks with potentially deteriorating fundamentals that could force them to cut or reduce dividends. The index is not adjusted to reflect sales loads, expenses or other fees that the Securities and Exchange Commission (SEC) requires to be reflected in the Fund's performance. The index is unmanaged and, unlike the Fund, is not affected by cash flows. It is not possible to invest directly in an index. |
| 3 | The MSCI EAFE Index is an equity index which captures large-and mid-cap representation across developed markets countries around the world, excluding the United States and Canada. With 906 constituents, the index covers approximately 85% of the free float-adjusted market capitalization in each country. The index is not adjusted to reflect sales loads, expenses or other fees that the Securities and Exchange Commission (SEC) requires to be reflected in the Fund's performance. The index is unmanaged and, unlike the Fund, is not affected by cash flows. It is not possible to invest directly in an index. |
| 4 | The Fund's Class A Shares, Class C Shares and Institutional Shares commenced operations on June 4, 2008. |
Annual Shareholder Report
Portfolio of Investments Summary Tables (unaudited)
At November 30, 2013, the Fund's portfolio composition1 was as follows:
| Country | Percentage of
Total Net Assets |
| United Kingdom | 39.2% |
| Canada | 18.1% |
| Australia | 10.2% |
| Switzerland | 8.0% |
| France | 5.7% |
| Sweden | 4.4% |
| Brazil | 3.4% |
| Italy | 3.2% |
| Singapore | 3.1% |
| Norway | 2.1% |
| Germany | 1.2% |
| Cash Equivalents2 | 0.7% |
| Other Assets and Liabilities—Net3 | 0.7% |
| TOTAL | 100.0% |
| 1 | Country allocations are based primarily on the country in which a company is incorporated. However, the Fund's Adviser may allocate a company to a country based on other factors such as location of the company's principal office, the location of the principal trading market for the company's securities or the country where a majority of the company's revenues are derived. |
| 2 | Cash Equivalents include any investments in money market mutual funds and/or overnight repurchase agreements. |
| 3 | Assets, other than investments in securities, less liabilities. See Statement of Assets and Liabilities. |
Annual Shareholder Report
At November 30, 2013, the Fund's sector classification composition4 was as follows:
| Sector Classification | Percentage of
Total Net Assets |
| Energy | 18.6% |
| Financials | 18.6% |
| Telecommunication Services | 18.5% |
| Consumer Staples | 16.8% |
| Health Care | 11.2% |
| Utilities | 10.2% |
| Consumer Discretionary | 4.7% |
| Cash Equivalents2 | 0.7% |
| Other Assets and Liabilities—Net3 | 0.7% |
| TOTAL | 100.0% |
| 4 | Except for Cash Equivalents and Other Assets and Liabilities, sector classifications are based upon, and individual securities assigned to, the classifications of the Global Industry Classification Standard (GICS) except that the Adviser assigns a classification to securities not classified by the GICS and to securities for which the Adviser does not have access to the classification made by the GICS. |
Annual Shareholder Report
Portfolio of Investments
November 30, 2013
| Shares | | | Value in U.S. Dollars |
| | | COMMON STOCKS—98.6% | |
| | | Banks—17.4% | |
| 330,800 | | Australia & New Zealand Banking Group, Melbourne | $$9,605,425 |
| 276,100 | | Bank of Montreal | 19,127,308 |
| 252,200 | | Canadian Imperial Bank of Commerce | 21,620,534 |
| 1,894,000 | | HSBC Holdings PLC | 21,133,288 |
| 485,000 | | National Australia Bank Ltd., Melbourne | 15,266,066 |
| 64,000 | | Svenska Handelsbanken AB, Class A | 2,973,953 |
| 518,100 | | Swedbank AB | 13,230,236 |
| 409,000 | | Westpac Banking Corp. Ltd., Sydney | 12,240,961 |
| | | TOTAL | 115,197,771 |
| | | Energy—18.6% | |
| 1,849,000 | | BP PLC | 14,583,116 |
| 573,800 | | Crescent Point Energy Corp. | 21,552,261 |
| 888,600 | | ENI SpA | 21,383,681 |
| 400,725 | | Royal Dutch Shell PLC, Class B | 14,061,734 |
| 627,705 | | Statoil ASA | 14,179,288 |
| 376,906 | | Total S.A. | 22,838,986 |
| 268,000 | | Vermilion Energy Inc. | 14,833,259 |
| | | TOTAL | 123,432,325 |
| | | Food & Staples Retailing—2.6% | |
| 2,092,000 | | Tesco PLC | 11,910,909 |
| 176,600 | | Woolworth's Ltd. | 5,415,669 |
| | | TOTAL | 17,326,578 |
| | | Food Beverage & Tobacco—14.2% | |
| 436,115 | | British American Tobacco PLC | 23,271,170 |
| 790,000 | | Coca-Cola Amatil Ltd. | 8,693,883 |
| 617,155 | | Imperial Tobacco Group PLC | 23,469,118 |
| 167,100 | | Nestle S.A. | 12,204,347 |
| 661,849 | | Unilever PLC | 26,739,077 |
| | | TOTAL | 94,377,595 |
| | | Insurance—1.2% | |
| 37,375 | | Muenchener Rueckversicherungs-Gesellschaft AG | 8,176,448 |
| | | Media—4.7% | |
| 615,000 | | Pearson PLC | 13,585,489 |
Annual Shareholder Report
| Shares | | | Value in U.S. Dollars |
| | | COMMON STOCKS—continued | |
| | | Media—continued | |
| 767,700 | | Shaw Communications, Inc., Class B | $17,672,523 |
| | | TOTAL | 31,258,012 |
| | | Pharmaceuticals Biotechnology & Life Sciences—11.2% | |
| 351,227 | | AstraZeneca PLC | 20,192,693 |
| 506,643 | | GlaxoSmithKline PLC | 13,417,795 |
| 181,100 | | Novartis AG | 14,315,771 |
| 41,900 | | Roche Holding AG | 11,681,520 |
| 141,453 | | Sanofi - Aventis | 14,961,412 |
| | | TOTAL | 74,569,191 |
| | | Telecommunication Services—18.5% | |
| 246,000 | | BCE, Inc. | 10,858,216 |
| 329,500 | | Rogers Communications, Inc., Class B | 14,692,682 |
| 6,819,385 | | Singapore Telecom Ltd. | 20,216,051 |
| 29,220 | | Swisscom AG | 14,932,374 |
| 824,950 | | Telef Brasil, ADR | 16,053,527 |
| 1,552,000 | | TeliaSonera AB | 12,670,402 |
| 3,638,515 | | Telstra Corp. Ltd. | 16,758,498 |
| 4,517,000 | | Vodafone Group PLC | 16,763,301 |
| | | TOTAL | 122,945,051 |
| | | Utilities—10.2% | |
| 2,909,000 | | Centrica PLC | 16,103,197 |
| 405,000 | | CPFL Energia SA, ADR | 6,710,850 |
| 855,167 | | National Grid PLC | 10,844,747 |
| 576,700 | | Scottish & Southern Energy PLC | 12,522,391 |
| 1,980,770 | | United Utilities Group PLC | 21,343,038 |
| | | TOTAL | 67,524,223 |
| | | TOTAL COMMON STOCKS
(IDENTIFIED COST $608,849,018) | 654,807,194 |
| | | INVESTMENT COMPANY—0.7% | |
| 4,362,161 | 1,2 | Federated Prime Value Obligations Fund, Institutional Shares, 0.07%
(AT NET ASSET VALUE) | 4,362,161 |
| | | TOTAL INVESTMENTS—99.3%
(IDENTIFIED COST $613,211,179)3 | 659,169,355 |
| | | OTHER ASSETS AND LIABILITIES - NET—0.7%4 | 4,847,938 |
| | | TOTAL NET ASSETS—100% | $664,017,293 |
| 1 | Affiliated holding. |
| 2 | 7-day net yield. |
| 3 | The cost of investments for federal tax purposes amounts to $613,877,129. |
| 4 | Assets, other than investments in securities, less liabilities. See Statement of Assets and Liabilities. |
Annual Shareholder Report
Note: The categories of investments are shown as a percentage of total net assets at November 30, 2013.
Various inputs are used in determining the value of the Fund's investments. These inputs are summarized in the three broad levels listed below:
Level 1—quoted prices in active markets for identical securities, including investment companies with daily net asset values, if applicable.
Level 2—other significant observable inputs (including quoted prices for similar securities, interest rates, prepayment speeds, credit risk, etc.) Also includes securities valued at amortized cost.
Level 3—significant unobservable inputs (including the Fund's own assumptions in determining the fair value of investments).
The inputs or methodology used for valuing securities are not an indication of the risk associated with investing in those securities.
As of November 30, 2013, all investments of the Fund utilized Level 1 inputs in valuing the Fund's assets carried at fair value.
The following acronym is used throughout this portfolio:
| ADR | —American Depositary Receipt |
See Notes which are an integral part of the Financial Statements
Annual Shareholder Report
Financial Highlights–Class A Shares
(For a Share Outstanding Throughout Each Period)
| Year Ended November 30 | 2013 | 2012 | 2011 | 2010 | 2009 |
| Net Asset Value, Beginning of Period | $3.88 | $3.61 | $3.47 | $3.64 | $3.05 |
| Income From Investment Operations: | | | | | |
| Net investment income1 | 0.15 | 0.16 | 0.17 | 0.17 | 0.08 |
| Net realized and unrealized gain (loss) on investments and foreign currency transactions | 0.32 | 0.24 | 0.12 | (0.20) | 0.68 |
| TOTAL FROM INVESTMENT OPERATIONS | 0.47 | 0.40 | 0.29 | (0.03) | 0.76 |
| Less Distributions: | | | | | |
| Distributions from net investment income | (0.14) | (0.13) | (0.15) | (0.14) | (0.17) |
| Distributions from net realized gain on investments and foreign currency transactions | (0.00)2 | — | (0.00)2 | — | — |
| TOTAL DISTRIBUTIONS | (0.14) | (0.13) | (0.15) | (0.14) | (0.17) |
| Redemption fees | — | — | — | 0.002 | 0.002 |
| Net Asset Value, End of Period | $4.21 | $3.88 | $3.61 | $3.47 | $3.64 |
| Total Return3 | 12.25% | 11.37% | 8.52% | (0.68)% | 25.86% |
| Ratios to Average Net Assets: | | | | | |
| Net expenses | 1.10% | 1.04% | 1.00%4 | 1.00%4 | 0.99% |
| Net investment income | 3.70% | 4.34% | 4.55% | 4.90% | 2.38% |
| Expense waiver/reimbursement5 | 0.18% | 0.38% | 1.25% | 2.56% | 9.84% |
| Supplemental Data: | | | | | |
| Net assets, end of period (000 omitted) | $263,210 | $110,082 | $38,968 | $19,060 | $1,083 |
| Portfolio turnover | 14% | 26% | 38% | 23% | 31% |
| 1 | Per share numbers have been calculated using the average shares method. |
| 2 | Represents less than $0.01. |
| 3 | Based on net asset value, which does not reflect the sales charge, redemption fee or contingent deferred sales charge, if applicable. |
| 4 | The net expense ratio is calculated without reduction for expense offset arrangements. The net expense ratios are 1.00% and 1.00% for the years ended November 30, 2011 and 2010, respectively, after taking into account these expense reductions. |
| 5 | This expense decrease is reflected in both the net expense and net investment income ratios shown above. |
See Notes which are an integral part of the Financial Statements
Annual Shareholder Report
Financial Highlights–Class C Shares
(For a Share Outstanding Throughout Each Period)
| Year Ended November 30 | 2013 | 2012 | 2011 | 2010 | 2009 |
| Net Asset Value, Beginning of Period | $3.86 | $3.60 | $3.46 | $3.63 | $3.05 |
| Income from Investment Operations: | | | | | |
| Net investment income1 | 0.12 | 0.13 | 0.15 | 0.13 | 0.09 |
| Net realized and unrealized gain (loss) on investments and foreign currency transactions | 0.32 | 0.23 | 0.12 | (0.19) | 0.63 |
| TOTAL FROM INVESTMENT OPERATIONS | 0.44 | 0.36 | 0.27 | (0.06) | 0.72 |
| Less Distributions: | | | | | |
| Distributions from net investment income | (0.11) | (0.10) | (0.13) | (0.11) | (0.14) |
| Distributions from net realized gain on investments and foreign currency transactions | (0.00)2 | — | (0.00)2 | — | — |
| TOTAL DISTRIBUTIONS | (0.11) | (0.10) | (0.13) | (0.11) | (0.14) |
| Redemption fees | — | — | — | 0.002 | 0.002 |
| Net Asset Value, End of Period | $4.19 | $3.86 | $3.60 | $3.46 | $3.63 |
| Total Return3 | 11.57% | 10.29% | 7.76% | (1.43)% | 24.33% |
| Ratios to Average Net Assets: | | | | | |
| Net expenses | 1.85% | 1.79% | 1.75%4 | 1.74%4 | 1.75% |
| Net investment income | 3.00% | 3.56% | 3.94% | 3.72% | 2.82% |
| Expense waiver/reimbursement5 | 0.18% | 0.37% | 1.25% | 3.01% | 10.38% |
| Supplemental Data: | | | | | |
| Net assets, end of period (000 omitted) | $77,421 | $23,155 | $6,130 | $3,022 | $1,241 |
| Portfolio turnover | 14% | 26% | 38% | 23% | 31% |
| 1 | Per share numbers have been calculated using the average shares method. |
| 2 | Represents less than $0.01. |
| 3 | Based on net asset value, which does not reflect the sales charge, redemption fee or contingent deferred sales charge, if applicable. |
| 4 | The net expense ratio is calculated without reduction for expense offset arrangements. The net expense ratios are 1.75% and 1.74% for the years ended November 30, 2011 and 2010, respectively, after taking into account these expense reductions. |
| 5 | This expense decrease is reflected in both the net expense and net investment income ratios shown above. |
See Notes which are an integral part of the Financial Statements
Annual Shareholder Report
Financial Highlights–Institutional Shares
(For a Share Outstanding Throughout Each Period)
| Year Ended November 30 | 2013 | 2012 | 2011 | 2010 | 2009 |
| Net Asset Value, Beginning of Period | $3.88 | $3.61 | $3.47 | $3.64 | $3.05 |
| Income from Investment Operations: | | | | | |
| Net investment income1 | 0.16 | 0.17 | 0.17 | 0.17 | 0.11 |
| Net realized and unrealized gain (loss) on investments and foreign currency transactions | 0.33 | 0.24 | 0.13 | (0.19) | 0.65 |
| TOTAL FROM INVESTMENT OPERATIONS | 0.49 | 0.41 | 0.30 | (0.02) | 0.76 |
| Less Distributions: | | | | | |
| Distributions from net investment income | (0.15) | (0.14) | (0.16) | (0.15) | (0.17) |
| Distributions from net realized gain on investments and foreign currency transactions | (0.00)2 | — | (0.00)2 | — | — |
| TOTAL DISTRIBUTIONS | (0.15) | (0.14) | (0.16) | (0.15) | (0.17) |
| Redemption fees | — | — | — | 0.002 | 0.002 |
| Net Asset Value, End of Period | $4.22 | $3.88 | $3.61 | $3.47 | $3.64 |
| Total Return3 | 12.78% | 11.66% | 8.75% | (0.47)% | 25.97% |
| Ratios to Average Net Assets: | | | | | |
| Net expenses | 0.85% | 0.79% | 0.75%4 | 0.75%4 | 0.74% |
| Net investment income | 4.02% | 4.55% | 4.80% | 4.80% | 3.28% |
| Expense waiver/reimbursement5 | 0.18% | 0.37% | 1.23% | 3.05% | 10.72% |
| Supplemental Data: | | | | | |
| Net assets, end of period (000 omitted) | $323,386 | $134,463 | $37,527 | $13,644 | $8,592 |
| Portfolio turnover | 14% | 26% | 38% | 23% | 31% |
| 1 | Per share numbers have been calculated using the average shares method. |
| 2 | Represents less than $0.01. |
| 3 | Based on net asset value. |
| 4 | The net expense ratio is calculated without reduction for expense offset arrangements. The net expense ratios are 0.75% and 0.75% for the years ended November 30, 2011 and 2010, respectively, after taking into account these expense reductions. |
| 5 | This expense decrease is reflected in both the net expense and net investment income ratios shown above. |
See Notes which are an integral part of the Financial Statements
Annual Shareholder Report
Statement of Assets and Liabilities
November 30, 2013
| Assets: | | |
| Total investments in securities, at value including $4,362,161 of investment in an affiliated holding (Note 5) (identified cost $613,211,179) | | $659,169,355 |
| Cash denominated in foreign currencies (identified cost $236,505) | | 241,387 |
| Receivable for shares sold | | 4,147,432 |
| Income receivable | | 3,780,591 |
| Receivable for investments sold | | 1,299,200 |
| TOTAL ASSETS | | 668,637,965 |
| Liabilities: | | |
| Payable for investments purchased | $2,595,762 | |
| Payable for shares redeemed | 1,699,372 | |
| Payable for shareholder services fee (Note 5) | 66,161 | |
| Payable for distribution services fee (Note 5) | 46,727 | |
| Accrued expenses (Note 5) | 212,650 | |
| TOTAL LIABILITIES | | 4,620,672 |
| Net assets for 157,658,997 shares outstanding | | $664,017,293 |
| Net Assets Consists of: | | |
| Paid-in capital | | $615,857,059 |
| Net unrealized appreciation of investments and translation of assets and liabilities in foreign currency | | 45,953,958 |
| Accumulated net realized loss on investments and foreign currency transactions | | (351,110) |
| Undistributed net investment income | | 2,557,386 |
| TOTAL NET ASSETS | | $664,017,293 |
| Net Asset Value, Offering Price and Redemption Proceeds Per Share | | |
| Class A Shares: | | |
| Net asset value per share ($263,209,988 ÷ 62,487,103 shares outstanding), no par value, unlimited shares authorized | | $4.21 |
| Offering price per share (100/94.50 of $4.21) | | $4.46 |
| Redemption proceeds per share | | $4.21 |
| Class C Shares: | | |
| Net asset value per share ($77,420,969 ÷ 18,458,408 shares outstanding), no par value, unlimited shares authorized | | $4.19 |
| Offering price per share | | $4.19 |
| Redemption proceeds per share (99.00/100 of $4.19) | | $4.15 |
| Institutional Shares: | | |
| Net asset value per share ($323,386,336 ÷ 76,713,486 shares outstanding), no par value, unlimited shares authorized | | $4.22 |
| Offering price per share | | $4.22 |
| Redemption proceeds per share | | $4.22 |
See Notes which are an integral part of the Financial Statements
Annual Shareholder Report
Statement of Operations
Year Ended November 30, 2013
| Investment Income: | | |
| Dividends (including $6,528 received from affiliated holding (Note 5) and net of foreign taxes withheld of $1,525,588) | | $22,287,372 |
| Expenses: | | |
| Investment adviser fee (Note 5) | $3,451,129 | |
| Administrative fee (Note 5) | 359,164 | |
| Custodian fees | 67,165 | |
| Transfer agent fee | 496,418 | |
| Directors'/Trustees' fees (Note 5) | 1,738 | |
| Auditing fees | 28,500 | |
| Legal fees | 8,518 | |
| Distribution services fee (Note 5) | 370,251 | |
| Shareholder services fee (Note 5) | 581,220 | |
| Portfolio accounting fees | 127,003 | |
| Share registration costs | 124,342 | |
| Printing and postage | 55,893 | |
| Insurance premiums (Note 5) | 4,729 | |
| Miscellaneous (Note 5) | 24,813 | |
| TOTAL EXPENSES | 5,700,883 | |
| Waiver and Reimbursement (Note 5): | | |
| Waiver/reimbursement of investment adviser fee | $(825,794) | |
| Net expenses | | 4,875,089 |
| Net investment income | | 17,412,283 |
| Realized and Unrealized Gain (Loss) on Investments and Foreign Currency Transactions: | | |
| Net realized loss on investments and foreign currency transactions | | (775,208) |
| Net change in unrealized appreciation of investments and translation of assets and liabilities in foreign currency | | 35,003,739 |
| Net realized and unrealized gain on investments and foreign currency transactions | | 34,228,531 |
| Change in net assets resulting from operations | | $51,640,814 |
See Notes which are an integral part of the Financial Statements
Annual Shareholder Report
Statement of Changes in Net Assets
| Year Ended November 30 | 2013 | 2012 |
| Increase (Decrease) in Net Assets | | |
| Operations: | | |
| Net investment income | $17,412,283 | $7,056,549 |
| Net realized loss on investments and foreign currency transactions | (775,208) | (143,200) |
| Net change in unrealized appreciation/depreciation of investments and translation of assets and liabilities in foreign currency | 35,003,739 | 10,787,583 |
| CHANGE IN NET ASSETS RESULTING FROM OPERATIONS | 51,640,814 | 17,700,932 |
| Distribution to Shareholders: | | |
| Distributions from net investment income | | |
| Class A Shares | (5,917,210) | (2,626,680) |
| Class C Shares | (1,275,497) | (363,856) |
| Institutional Shares | (8,012,608) | (2,806,269) |
| Distributions from net realized gain on investments and foreign currency transactions | | |
| Class A Shares | (49,405) | — |
| Class C Shares | (10,610) | — |
| Institutional Shares | (59,383) | — |
| CHANGE IN NET ASSETS RESULTING FROM DISTRIBUTIONS TO SHAREHOLDERS | (15,324,713) | (5,796,805) |
| Share Transactions: | | |
| Proceeds from sale of shares | 456,322,386 | 218,219,793 |
| Net asset value of shares issued to shareholders in payment of distributions declared | 13,631,621 | 5,099,342 |
| Cost of shares redeemed | (109,953,592) | (50,146,899) |
| CHANGE IN NET ASSETS RESULTING FROM SHARE TRANSACTIONS | 360,000,415 | 173,172,236 |
| Change in net assets | 396,316,516 | 185,076,363 |
| Net Assets: | | |
| Beginning of period | 267,700,777 | 82,624,414 |
| End of period (including undistributed net investment income of $2,557,386 and $894,726, respectively) | $664,017,293 | $267,700,777 |
See Notes which are an integral part of the Financial Statements
Annual Shareholder Report
Notes to Financial Statements
November 30, 2013
1. ORGANIZATION
Federated Equity Funds (the “Trust”) is registered under the Investment Company Act of 1940, as amended (the “Act”), as an open-end management investment company. The Trust consists of 12 portfolios. The financial statements included herein are only those of Federated International Strategic Value Dividend Fund (the “Fund”), a diversified portfolio. The financial statements of the other portfolios are presented separately. The assets of each portfolio are segregated and a shareholder's interest is limited to the portfolio in which shares are held. Each portfolio pays its own expenses. The Fund offers three classes of shares: Class A Shares, Class C Shares and Institutional Shares. All shares of the Fund have equal rights with respect to voting, except on class-specific matters. The investment objective of the Fund is to provide income and long-term capital appreciation.
2. SIGNIFICANT ACCOUNTING POLICIES
The following is a summary of significant accounting policies consistently followed by the Fund in the preparation of its financial statements. These policies are in conformity with U.S. generally accepted accounting principles (GAAP).
Investment Valuation
In calculating its net asset value (NAV), the Fund generally values investments as follows:
| ■ | Equity securities listed on an exchange or traded through a regulated market system are valued at their last reported sale price or official closing price in their principal exchange or market. |
| ■ | Shares of other mutual funds or non-exchange-traded investment companies are valued based upon their reported NAVs. |
| ■ | Fixed-income securities acquired with remaining maturities greater than 60 days are fair valued using price evaluations provided by a pricing service approved by the Fund's Board of Trustees (the “Trustees”). |
| ■ | Fixed-income securities and repurchase agreements acquired with remaining maturities of 60 days or less are valued at their amortized cost (adjusted for the accretion of any discount or amortization of any premium) unless the issuer's creditworthiness is impaired or other factors indicate that amortized cost is not an accurate estimate of the investment's fair value, in which case it would be valued in the same manner as a longer-term security. |
| ■ | Derivative contracts listed on exchanges are valued at their reported settlement or closing price. |
| ■ | Over-the-counter (OTC) derivative contracts are fair valued using price evaluations provided by a pricing service approved by the Trustees. |
| ■ | For securities that are fair valued in accordance with procedures established by and under the general supervision of the Trustees, certain factors may be considered such as: the purchase price of the security, information obtained by contacting the issuer, analysis of the issuer's financial statements or other available documents, fundamental analytical data, the nature and duration of restrictions on disposition, the movement of the market in which the security is normally traded and public trading in similar securities of the issuer or comparable issuers. |
Annual Shareholder Report
If the Fund cannot obtain a price or price evaluation from a pricing service for an investment, the Fund may attempt to value the investment based upon the mean of bid and asked quotations or fair value the investment based on price evaluations, from one or more dealers. If any price, quotation, price evaluation or other pricing source is not readily available when the NAV is calculated, or if the Fund cannot obtain price evaluations from a pricing service or from more than one dealer for an investment within a reasonable period of time as set forth in the Fund's valuation policies and procedures, the Fund uses the fair value of the investment determined in accordance with the procedures described below. There can be no assurance that the Fund could purchase or sell an investment at the price used to calculate the Fund's NAV.
Fair Valuation and Significant Events Procedures
The Trustees have appointed a Valuation Committee comprised of officers of the Fund, Federated Equity Management Company of Pennsylvania (“Adviser”) and certain of the Adviser's affiliated companies to determine fair value of securities and in overseeing the calculation of the NAV. The Trustees have also authorized the use of pricing services recommended by the Valuation Committee to provide fair value evaluations of the current value of certain investments for purposes of calculating the NAV. The Valuation Committee employs various methods for reviewing third-party pricing-service evaluations including periodic reviews of third-party pricing services' policies, procedures and valuation methods (including key inputs and assumptions), transactional back-testing, comparisons of evaluations of different pricing services and review of price challenges by the Adviser based on recent market activity. In the event that market quotations and price evaluations are not available for an investment, the Valuation Committee determines the fair value of the investment in accordance with procedures adopted by the Trustees. The Trustees periodically review and approve the fair valuations made by the Valuation Committee and any changes made to the procedures.
Factors considered by pricing services in evaluating an investment include the yields or prices of investments of comparable quality, coupon, maturity, call rights and other potential prepayments, terms and type, reported transactions, indications as to values from dealers and general market conditions. Some pricing services provide a single price evaluation reflecting the bid-side of the market for an investment (a “bid” evaluation). Other pricing services offer both bid evaluations and price evaluations indicative of a price between the prices bid and asked for the investment (a “mid” evaluation). The Fund normally uses bid evaluations for U.S. Treasury and Agency securities, mortgage-backed securities and municipal securities. The Fund normally uses mid evaluations for other types of fixed-income securities and OTC derivative contracts. In the event that market quotations and price evaluations are not available for an investment, the fair value of the investment is determined in accordance with procedures adopted by the Trustees.
Annual Shareholder Report
The Trustees also have adopted procedures requiring an investment to be priced at its fair value whenever the Adviser determines that a significant event affecting the value of the investment has occurred between the time as of which the price of the investment would otherwise be determined and the time as of which the NAV is computed. An event is considered significant if there is both an affirmative expectation that the investment's value will change in response to the event and a reasonable basis for quantifying the resulting change in value. Examples of significant events that may occur after the close of the principal market on which a security is traded, or after the time of a price evaluation provided by a pricing service or a dealer, include:
| ■ | With respect to securities traded in foreign markets, significant trends in U.S. equity markets or in the trading of foreign securities index futures contracts; |
| ■ | Political or other developments affecting the economy or markets in which an issuer conducts its operations or its securities are traded; and |
| ■ | Announcements concerning matters such as acquisitions, recapitalizations, litigation developments, a natural disaster affecting the issuer's operations or regulatory changes or market developments affecting the issuer's industry. |
The Trustees have approved the use of a pricing service to determine the fair value of equity securities traded principally in foreign markets when the Adviser determines that there has been a significant trend in the U.S. equity markets or in index futures trading. For other significant events, the Fund may seek to obtain more current quotations or price evaluations from alternative pricing sources. If a reliable alternative pricing source is not available, the Fund will determine the fair value of the investment using another method approved by the Trustees.
Repurchase Agreements
The Fund may invest in repurchase agreements for short-term liquidity purposes. It is the policy of the Fund to require the other party to a repurchase agreement to transfer to the Fund's custodian or sub-custodian eligible securities or cash with a market value (after transaction costs) at least equal to the repurchase price to be paid under the repurchase agreement. The eligible securities are transferred to accounts with the custodian or sub-custodian in which the Fund holds a “securities entitlement” and exercises “control” as those terms are defined in the Uniform Commercial Code. The Fund has established procedures for monitoring the market value of the transferred securities and requiring the transfer of additional eligible securities if necessary to equal at least the repurchase price. These procedures also allow the other party to require securities to be transferred from the account to the extent that their market value exceeds the repurchase price or in exchange for other eligible securities of equivalent market value.
The insolvency of the other party or other failure to repurchase the securities may delay the disposition of the underlying securities or cause the Fund to receive less than the full repurchase price. Under the terms of the repurchase agreement, any amounts received by the Fund in excess of the repurchase price and related transaction costs must be remitted to the other party.
The Fund may enter into repurchase agreements in which eligible securities are transferred into joint trading accounts maintained by the custodian or sub-custodian for investment companies and other clients advised by the Fund's Adviser and its affiliates. The Fund will participate on a pro rata basis with the other investment companies and clients in its share of the securities transferred under such repurchase agreements and in its share of proceeds from any repurchase or other disposition of such securities.
Annual Shareholder Report
Investment Income, Gains and Losses, Expenses and Distributions
Investment transactions are accounted for on a trade-date basis. Realized gains and losses from investment transactions are recorded on an identified-cost basis. Interest income and expenses are accrued daily. Dividend income and distributions to shareholders are recorded on the ex-dividend date. Foreign dividends are recorded on the ex-dividend date or when the Fund is informed of the ex-dividend date. Distributions of net investment income are declared and paid monthly. Non-cash dividends included in dividend income, if any, are recorded at fair value. Investment income, realized and unrealized gains and losses, and certain fund-level expenses are allocated to each class based on relative average daily net assets, except that Class A Shares and Class C Shares may bear account administration fees, distribution services fees and shareholder services fees unique to those classes. Dividends are declared separately for each class. No class has preferential dividend rights; differences in per share dividend rates are generally due to differences in separate class expenses.
Premium and Discount Amortization
All premiums and discounts on fixed-income securities are amortized/accreted using the effective-interest-rate method.
Federal Taxes
It is the Fund's policy to comply with the Subchapter M provision of the Internal Revenue Code (the “Code”) and to distribute to shareholders each year substantially all of its income. Accordingly, no provision for federal income tax is necessary. As of and during the year ended November 30, 2013, the Fund did not have a liability for any uncertain tax positions. The Fund recognizes interest and penalties, if any, related to tax liabilities as income tax expense in the Statement of Operations. As of November 30, 2013, tax years 2010 through 2013 remain subject to examination by the Fund's major tax jurisdictions, which include the United States of America and the Commonwealth of Massachusetts.
The Fund may be subject to taxes imposed by governments of countries in which it invests. Such taxes are generally based on either income or gains earned or repatriated. The Fund accrues and applies such taxes to net investment income, net realized gains and net unrealized gains as income and/or gains are earned.
When-Issued and Delayed-Delivery Transactions
The Fund may engage in when-issued or delayed-delivery transactions. The Fund records when-issued securities on the trade date and maintains security positions such that sufficient liquid assets will be available to make payment for the securities purchased. Securities purchased on a when-issued or delayed-delivery basis are marked to market daily and begin earning interest on the settlement date. Losses may occur on these transactions due to changes in market conditions or the failure of counterparties to perform under the contract.
Foreign Exchange Contracts
The Fund may enter into foreign exchange contracts for the delayed delivery of securities or foreign currency exchange transactions. The Fund may enter into foreign exchange contracts to protect assets against adverse changes in foreign currency exchange rates or exchange control regulations. Purchased contracts are used to acquire exposure to foreign currencies, whereas, contracts to sell are used to hedge the Fund's securities against currency fluctuations. Risks may arise upon entering into these transactions from the potential inability
Annual Shareholder Report
of counterparties to meet the terms of their commitments and from unanticipated movements in security prices or foreign exchange rates. The foreign exchange contracts are adjusted by the daily exchange rate of the underlying currency and any gains or losses are recorded for financial statement purposes as unrealized until the settlement date.
At November 30, 2013, the Fund had no outstanding foreign exchange contracts.
The average value at settlement date payable and receivable of foreign exchange contracts purchased and sold by the Fund throughout the period was $3,148 and $5,358, respectively. This is based on the contracts held as of each month-end throughout the fiscal period.
Foreign Currency Translation
The accounting records of the Fund are maintained in U.S. dollars. All assets and liabilities denominated in foreign currencies (FCs) are translated into U.S. dollars based on the rates of exchange of such currencies against U.S. dollars on the date of valuation. Purchases and sales of securities, income and expenses are translated at the rate of exchange quoted on the respective date that such transactions are recorded. The Fund does not isolate that portion of the results of operations resulting from changes in foreign exchange rates on investments from the fluctuations arising from changes in market prices of securities held. Such fluctuations are included with the net realized and unrealized gain or loss from investments.
Reported net realized foreign exchange gains or losses arise from sales of portfolio securities, sales and maturities of short-term securities, sales of FCs, currency gains or losses realized between the trade and settlement dates on securities transactions, the difference between the amounts of dividends, interest and foreign withholding taxes recorded on the Fund's books and the U.S. dollar equivalent of the amounts actually received or paid. Net unrealized foreign exchange gains and losses arise from changes in the value of assets and liabilities other than investments in securities at fiscal year end, resulting from changes in the exchange rate.
Additional Disclosure Related to Derivative Instruments
The Effect of Derivative Instruments on the Statement of Operations for the Year Ended November 30, 2013
| Amount of Realized Gain or (Loss) on Derivatives Recognized in Income |
| | Forward
Currency
Contracts |
| Foreign exchange contracts | $(385,284) |
Other
The preparation of financial statements in conformity with GAAP requires management to make estimates and assumptions that affect the amounts of assets, liabilities, expenses and revenues reported in the financial statements. Actual results could differ from those estimated.
Annual Shareholder Report
3. SHARES OF BENEFICIAL INTEREST
The following tables summarize share activity:
| Year Ended November 30 | 2013 | 2012 |
| Class A Shares: | Shares | Amount | Shares | Amount |
| Shares sold | 44,823,268 | $181,831,024 | 23,377,302 | $87,029,143 |
| Shares issued to shareholders in payment of distributions declared | 1,404,359 | 5,708,426 | 698,791 | 2,593,180 |
| Shares redeemed | (12,141,017) | (49,657,407) | (6,481,918) | (24,215,511) |
| NET CHANGE RESULTING FROM CLASS A SHARE TRANSACTIONS | 34,086,610 | $137,882,043 | 17,594,175 | $65,406,812 |
| Year Ended November 30 | 2013 | 2012 |
| Class C Shares: | Shares | Amount | Shares | Amount |
| Shares sold | 13,423,087 | $54,503,154 | 4,649,673 | $17,431,239 |
| Shares issued to shareholders in payment of distributions declared | 288,365 | 1,170,342 | 92,245 | 341,828 |
| Shares redeemed | (1,246,997) | (5,047,299) | (450,953) | (1,669,554) |
| NET CHANGE RESULTING FROM CLASS C SHARE TRANSACTIONS | 12,464,455 | $50,626,197 | 4,290,965 | $16,103,513 |
| Year Ended November 30 | 2013 | 2012 |
| Institutional Shares: | Shares | Amount | Shares | Amount |
| Shares sold | 54,003,449 | $219,988,208 | 30,270,699 | $113,759,411 |
| Shares issued to shareholders in payment of distributions declared | 1,657,679 | 6,752,853 | 579,747 | 2,164,334 |
| Shares redeemed | (13,616,216) | (55,248,886) | (6,574,943) | (24,261,834) |
| NET CHANGE RESULTING FROM INSTITUTIONAL SHARE TRANSACTIONS | 42,044,912 | $171,492,175 | 24,275,503 | $91,661,911 |
| NET CHANGE RESULTING FROM TOTAL FUND SHARE TRANSACTIONS | 88,595,977 | $360,000,415 | 46,160,643 | $173,172,236 |
4. FEDERAL TAX INFORMATION
The timing and character of income and capital gain distributions are determined in accordance with income tax regulations, which may differ from GAAP. These differences are due to differing treatments for foreign currency transactions.
Annual Shareholder Report
For the year ended November 30, 2013, permanent differences identified and reclassified among the components of net assets were as follows:
| Increase (Decrease) |
| Paid-In Capital | Undistributed
Net Investment
Income (Loss) | Accumulated
Net Realized
Gain (Loss) |
| $120,209 | $(544,308) | $424,099 |
Net investment income (loss), net realized gains (losses) and net assets were not affected by the reclassification.
The tax character of distributions as reported on the Statement of Changes in Net Assets for the years ended November 30, 2013 and 2012, was as follows:
| | 2013 | 2012 |
| Ordinary income1 | $15,324,713 | $5,796,805 |
| 1 | For tax purposes, short-term capital gain distributions are considered ordinary income distributions. |
| | |
As of November 30, 2013, the components of distributable earnings on a tax basis were as follows:
| Undistributed ordinary income2 | $ 2,788,818 |
| Net unrealized appreciation | $ 45,288,008 |
| Undistributed long-term capital gains | $ 83,408 |
| 2 | For tax purposes, short-term capital gains are considered ordinary income for distribution purposes. |
| | |
At November 30, 2013, the cost of investments for federal tax purposes was $613,877,129. The net unrealized appreciation of investments for federal tax purposes excluding any unrealized appreciation/depreciation resulting from the translation from FCs to U.S. dollars of assets and liabilities other than investments in securities was $45,292,226. This consists of net unrealized appreciation from investments for those securities having an excess of value over cost of $55,937,815 and net unrealized depreciation from investments for those securities having an excess of cost over value of $10,645,589.
The Fund used capital loss carryforwards of $153,186 to offset capital gains realized during the year ended November 30, 2013.
5. INVESTMENT ADVISER FEE AND OTHER TRANSACTIONS WITH AFFILIATES
Investment Adviser Fee
The advisory agreement between the Fund and the Adviser provides for an annual fee equal to 0.75% of the Fund's average daily net assets. Subject to the terms described in the Expense Limitation note, the Adviser may voluntarily choose to waive any portion of its fee. For the year ended November 30, 2013, the Adviser voluntarily waived $818,037 of its fee.
Annual Shareholder Report
Administrative Fee
Federated Administrative Services (FAS), under the Administrative Services Agreement, provides the Fund with administrative personnel and services. For purposes of determining the appropriate rate breakpoint, “Investment Complex” is defined as all of the Federated Funds subject to a fee under the Administrative Services Agreement. The fee paid to FAS is based on the average daily net assets of the Investment Complex as specified below, plus certain out-of-pocket expenses:
| Administrative Fee | Average Daily Net Assets
of the Investment Complex |
| 0.150% | on the first $5 billion |
| 0.125% | on the next $5 billion |
| 0.100% | on the next $10 billion |
| 0.075% | on assets in excess of $20 billion |
Subject to the terms described in the Expense Limitation note, FAS may voluntarily choose to waive any portion of its fee and/or reimburse certain operating expenses of the Fund. For the year ended November 30, 2013, the net fee paid to FAS was 0.078% of average daily net assets of the Fund.
Distribution Services Fee
The Fund has adopted a Distribution Plan (the “Plan”) pursuant to Rule 12b-1 under the Act. Under the terms of the Plan, the Fund will compensate Federated Securities Corp. (FSC), the principal distributor, from the daily net assets of the Fund's Class A Shares and Class C Shares to finance activities intended to result in the sale of these shares. The Plan provides that the Fund may incur distribution expenses at the following percentages of average daily net assets annually, to compensate FSC:
| Share Class Name | Percentage of Average Daily
Net Assets of Class |
| Class A Shares | 0.05% |
| Class C Shares | 0.75% |
Subject to the terms described in the Expense Limitation note, FSC may voluntarily choose to waive any portion of its fee. For the year ended November 30, 2013, distribution services fees for the Fund were as follows:
| | Distribution
Service Fees
Incurred |
| Class C Shares | $370,251 |
When FSC receives fees, it may pay some or all of them to financial intermediaries whose customers purchase shares. For the year ended November 30, 2013, FSC retained $251,078 of fees paid by the Fund. For the year ended November 30, 2013, the Fund's Class A Shares did not incur a distribution services fee; however, it may begin to incur this fee upon approval of the Trustees.
Annual Shareholder Report
Sales Charges
Front-end sales charges and contingent deferred sales charges (CDSC) do not represent expenses of the Fund. They are deducted from the proceeds of sales of Fund shares prior to investment or from redemption proceeds prior to remittance, as applicable. For the year ended November 30, 2013, FSC retained $154,412 in sales charges from the sale of Class A Shares. FSC also retained $12,607 of CDSC relating to redemptions of Class C Shares.
Shareholder Services Fee
The Fund may pay fees (“Service Fees”) up to 0.25% of the average daily net assets of the Fund's Class A Shares and Class C Shares to financial intermediaries or to Federated Shareholder Services Company (FSSC) for providing services to shareholders and maintaining shareholder accounts. Subject to the terms described in the Expense Limitation note, FSSC may voluntarily reimburse the Fund for Service Fees. For the year ended November 30, 2013, Service Fees for the Fund were as follows:
| | Service Fees
Incurred |
| Class A Shares | $457,803 |
| Class C Shares | 123,417 |
| TOTAL | $581,220 |
For the year ended November 30, 2013, FSSC received $4,705 of Service Fees paid by the Fund.
Expense Limitation
The Adviser and certain of its affiliates (which may include FSC, FAS and FSSC) have voluntarily agreed to waive their respective fees and/or reimburse expenses so that the total annual fund operating expenses (as shown in the financial highlights, excluding tax reclaim recovery expenses, extraordinary expenses and proxy-related expenses paid by the Fund, if any) paid by the Fund's Class A Shares, Class C Shares and Institutional Shares (after the voluntary waivers and reimbursements) will not exceed 1.10%, 1.85% and 0.85% (the “Fee Limit”), respectively, up to but not including the later of (the “Termination Date”): (a) February 1, 2015; or (b) the date of the Fund's next effective Prospectus. While the Adviser and its applicable affiliates currently do not anticipate terminating or increasing these arrangements prior to the Termination Date, these arrangements may only be terminated or the Fee Limit increased prior to the Termination Date with the agreement of the Trustees.
General
Certain Officers and Trustees of the Fund are Officers and Directors or Trustees of certain of the above companies. To efficiently facilitate payment, Directors'/Trustees' fees and certain expenses related to conducting meetings of the Directors/Trustees and other miscellaneous expenses are paid by an affiliate of the Adviser which in due course are reimbursed by the Fund.
Annual Shareholder Report
Transactions with Affiliated Holdings
Affiliated holdings are investment companies which are managed by the Adviser or an affiliate of the Adviser. The Adviser has agreed to reimburse the Fund for certain investment adviser fees as a result of transactions in other affiliated investment companies. For the year ended November 30, 2013, the Adviser reimbursed $7,757. Transactions with the affiliated holding during the year ended November 30, 2013, were as follows:
| | Federated Prime Value
Obligations Fund,
Institutional Shares |
| Balance of Shares Held 11/30/2012 | 4,394,142 |
| Purchases/Additions | 152,151,764 |
| Sales/Reductions | (152,183,745) |
| Balance of Shares Held 11/30/2013 | 4,362,161 |
| Value | $4,362,161 |
| Dividend Income | 6,528 |
6. Investment TRANSACTIONS
Purchases and sales of investments, excluding long-term U.S. government securities and short-term obligations, for the year ended November 30, 2013, were as follows:
| Purchases | $ 419,328,281 |
| Sales | $ 62,309,231 |
7. CONCENTRATION OF RISK
The Fund invests in securities of non-U.S. issuers. Political or economic developments may have an effect on the liquidity and volatility of portfolio securities and currency holdings.
8. LINE OF CREDIT
The Fund participates in a $100,000,000 unsecured, uncommitted revolving line of credit (LOC) agreement with PNC Bank. The LOC was made available for extraordinary or emergency purposes, primarily for financing redemption payments. Borrowings are charged interest at a rate offered to the Fund by PNC Bank at the time of the borrowing. As of November 30, 2013, there were no outstanding loans. During the year ended November 30, 2013, the Fund did not utilize the LOC.
9. INTERFUND LENDING
Pursuant to an Exemptive Order issued by the Securities and Exchange Commission, the Fund, along with other funds advised by subsidiaries of Federated Investors, Inc., may participate in an interfund lending program. This program provides an alternative credit facility allowing the Fund to borrow from other participating affiliated funds. As of November 30, 2013, there were no outstanding loans. During the year ended November 30, 2013, the program was not utilized.
Annual Shareholder Report
10. FEDERAL TAX INFORMATION (UNAUDITED)
For the fiscal year ended November 30, 2013, 100% of the total ordinary income distributions made by the Fund are qualifying dividends which may be subject to a maximum tax rate of 15%, as provided for by the Jobs and Growth Tax Relief Act of 2003. Complete information is reported in conjunction with the reporting of your distributions on Form 1099-DIV.
If the Fund meets the requirements of Section 853 of the Internal Revenue Code of 1986, as amended, the Fund will pass through to its shareholders credits of foreign taxes paid.
For the fiscal year ended November 30, 2013, the Fund derived $20,481,931 of gross income from foreign sources and paid foreign taxes of $1,525,588.
Annual Shareholder Report
Report of Independent Registered Public Accounting Firm
TO THE BOARD OF TRUSTEES OF THE FEDERATED EQUITY FUNDS AND SHAREHOLDERS OF Federated InternATIONAL STRATEGIC VALUE Dividend fund:
We have audited the accompanying statement of assets and liabilities, including the portfolio of investments, of the Federated International Strategic Value Dividend Fund (the “Fund”), a portfolio of Federated Equity Funds, as of November 30, 2013, and the related statement of operations for the year then ended, the statements of changes in net assets for each of the years in the two-year period then ended and the financial highlights for each of the years in the five-year period then ended. These financial statements and financial highlights are the responsibility of the Fund's management. Our responsibility is to express an opinion on these financial statements and financial highlights based on our audits.
We conducted our audits in accordance with the standards of the Public Company Accounting Oversight Board (United States). Those standards require that we plan and perform the audit to obtain reasonable assurance about whether the financial statements and financial highlights are free of material misstatement. An audit includes examining, on a test basis, evidence supporting the amounts and disclosures in the financial statements. Our procedures included confirmation of securities owned as of November 30, 2013, by correspondence with the custodian, transfer agent and brokers or by other appropriate auditing procedures. An audit also includes assessing the accounting principles used and significant estimates made by management, as well as evaluating the overall financial statement presentation. We believe that our audits provide a reasonable basis for our opinion.
In our opinion, the financial statements and financial highlights referred to above present fairly, in all material respects, the financial position of the Federated International Strategic Value Dividend Fund as of November 30, 2013, and the results of its operations for the year then ended, the changes in its net assets for each of the years in the two-year period then ended and the financial highlights for each of the years in the five-year period then ended, in conformity with U.S. generally accepted accounting principles.
Boston, Massachusetts
January 23, 2014
Annual Shareholder Report
Shareholder Expense Example (unaudited)
As a shareholder of the Fund, you incur two types of costs: (1) transaction costs, including sales charges (loads) on purchase or redemption payments and redemption/exchange fees; and (2) ongoing costs, including management fees and to the extent applicable, distribution (12b-1) fees and/or shareholder services fees and other Fund expenses. This Example is intended to help you to understand your ongoing costs (in dollars) of investing in the Fund and to compare these costs with the ongoing costs of investing in other mutual funds. It is based on an investment of $1,000 invested at the beginning of the period and held for the entire period from June 1, 2013 to November 30, 2013.
ACTUAL EXPENSES
The first section of the table below provides information about actual account values and actual expenses. You may use the information in this section, together with the amount you invested, to estimate the expenses that you incurred over the period. Simply divide your account value by $1,000 (for example, an $8,600 account value divided by $1,000 = 8.6), then multiply the result by the number in the first section under the heading entitled “Expenses Paid During Period” to estimate the expenses attributable to your investment during this period.
HYPOTHETICAL EXAMPLE FOR COMPARISON PURPOSES
The second section of the table below provides information about hypothetical account values and hypothetical expenses based on the Fund's actual expense ratio and an assumed rate of return of 5% per year before expenses, which is not the Fund's actual return. Thus, you should not use the hypothetical account values and expenses to estimate the actual ending account balance or your expenses for the period. Rather, these figures are required to be provided to enable you to compare the ongoing costs of investing in the Fund with other funds. To do so, compare this 5% hypothetical example with the 5% hypothetical examples that appear in the shareholder reports of the other funds.
Annual Shareholder Report
Please note that the expenses shown in the table are meant to highlight your ongoing costs only and do not reflect any transaction costs, such as sales charges (loads) on purchase or redemption payments, or redemption/exchange fees. Therefore, the second section of the table is useful in comparing ongoing costs only, and will not help you determine the relative total costs of owning different funds. In addition, if these transaction costs were included, your costs would have been higher.
| | Beginning
Account Value
6/1/2013 | Ending
Account Value
11/30/2013 | Expenses Paid
During Period1 |
| Actual: | | | |
| Class A Shares | $1,000 | $1,063.40 | $5.69 |
| Class C Shares | $1,000 | $1,060.40 | $9.56 |
| Institutional Shares | $1,000 | $1,067.20 | $4.40 |
Hypothetical (assuming a 5% return
before expenses): | | | |
| Class A Shares | $1,000 | $1,019.55 | $5.57 |
| Class C Shares | $1,000 | $1,015.79 | $9.35 |
| Institutional Shares | $1,000 | $1,020.81 | $4.31 |
| 1 | Expenses are equal to the Fund's annualized net expense ratios, multiplied by the average account value over the period, multiplied by 183/365 (to reflect the one-half-year period). The annualized net expense ratios are as follows: |
| Class A Shares | 1.10% |
| Class C Shares | 1.85% |
| Institutional Shares | 0.85% |
Annual Shareholder Report
Shareholder Meeting Results (unaudited)
A Special Meeting of Shareholders of Federated Equity Funds (the “Trust”), of which the Fund is a portfolio, was held on October 28, 2013. On August 29, 2013, the record date for shareholders voting at the meeting, there were 2,777,709,632.389 total outstanding shares of the Trust.
The following item was considered by shareholders of the Trust and the results of their voting were as follows:
AGENDA ITEM
Proposal to elect certain Trustees of the Trust:1
| Name | For | Withheld |
| John T. Collins | 2,104,364,292.660 | 29,376,009.057 |
| Maureen Lally-Green | 2,104,554,202.739 | 29,186,098.978 |
| Thomas M. O'Neill | 2,104,050,166.003 | 29,690,135.714 |
| P. Jerome Richey | 2,103,363,407.698 | 30,376,894.019 |
| 1 | The following Trustees continued their terms:
John F. Donahue, J. Christopher Donahue, Maureen Lally-Green (having been previously appointed by the Board), Peter E. Madden, Charles F. Mansfield, Jr., Thomas M. O'Neill (having been previously appointed by the Board), and John S. Walsh. |
Board of Trustees and Trust Officers
The Board of Trustees is responsible for managing the Trust's business affairs and for exercising all the Trust's powers except those reserved for the shareholders. The following tables give information about each Trustee and the senior officers of the Fund. Where required, the tables separately list Trustees who are “interested persons” of the Fund (i.e., “Interested” Trustees) and those who are not (i.e., “Independent” Trustees). Unless otherwise noted, the address of each person listed is Federated Investors Tower, 1001 Liberty Avenue, Pittsburgh, PA 15222. The address of all Independent Trustees listed is 4000 Ericsson Drive, Warrendale, PA 15086-7561; Attention: Mutual Fund Board. As of December 31, 2013, the Trust comprised 13 portfolio(s), and the Federated Fund Family consisted of 42 investment companies (comprising 135 portfolios). Unless otherwise noted, each Officer is elected annually. Unless otherwise noted, each Trustee oversees all portfolios in the Federated Fund Family and serves for an indefinite term. The Fund's Statement of Additional Information includes additional information about Trust Trustees and is available, without charge and upon request, by calling 1-800-341-7400.
In Memoriam - John F. Cunningham, Independent Trustee
With deep sadness, Federated announces the passing of John F. Cunningham, who served as an independent member of the Board of the Federated Fund Family since 1999. Mr. Cunningham's savvy business acumen and incisive intellect made him a powerful force on the Federated Fund Board. He was an advocate for shareholders and a respected colleague within the Federated family. Mr. Cunningham enjoyed an outstanding career in technology, having served as President and in other Senior Executive positions with leading companies in the industry. Federated expresses gratitude to Mr. Cunningham for his fine contributions as a Board member, colleague and friend. He will be greatly missed.
Interested Trustees Background
Name
Birth Date
Positions Held with Trust
Date Service Began | Principal Occupation(s) for Past Five Years,
Other Directorships Held and Previous Position(s) |
John F. Donahue*
Birth Date: July 28, 1924
Trustee
Began serving: April 1984 | Principal Occupations: Director or Trustee of the Federated Fund Family; Chairman and Director, Federated Investors, Inc.; Chairman of the Federated Fund Family's Executive Committee.
Previous Positions: Chairman of the Federated Fund Family; Trustee, Federated Investment Management Company; Chairman and Director, Federated Investment Counseling. |
Annual Shareholder Report
Name
Birth Date
Positions Held with Trust
Date Service Began | Principal Occupation(s) for Past Five Years,
Other Directorships Held and Previous Position(s) |
J. Christopher Donahue*
Birth Date: April 11, 1949
President and Trustee
Began serving: January 2000 | Principal Occupations: Principal Executive Officer and President of certain of the Funds in the Federated Fund Family; Director or Trustee of the Funds in the Federated Fund Family; President, Chief Executive Officer and Director, Federated Investors, Inc.; Chairman and Trustee, Federated Investment Management Company; Trustee, Federated Investment Counseling; Chairman and Director, Federated Global Investment Management Corp.; Chairman, Federated Equity Management Company of Pennsylvania and Passport Research, Ltd. (investment advisory subsidiary of Federated); Trustee, Federated Shareholder Services Company; Director, Federated Services Company.
Previous Positions: President, Federated Investment Counseling; President and Chief Executive Officer, Federated Investment Management Company, Federated Global Investment Management Corp. and Passport Research, Ltd. |
| * | Family relationships and reasons for “interested” status: John F. Donahue is the father of J. Christopher Donahue; both are “interested” due to their beneficial ownership of shares of Federated Investors, Inc. and the positions they hold with Federated and its subsidiaries. |
INDEPENDENT Trustees Background
Name
Birth Date
Positions Held with Trust
Date Service Began | Principal Occupation(s) for Past Five Years,
Other Directorships Held, Previous Position(s) and Qualifications |
John T. Collins
Birth Date: January 24, 1947
Trustee
Began serving: October 2013 | Principal Occupations: Director or Trustee of the Federated Fund Family; Chairman and CEO, The Collins Group, Inc. (a private equity firm).
Other Directorships Held: Chairman Emeriti, Bentley University; Director, Sterling Suffolk Downs, Inc.; Former Director, National Association of Printers and Lithographers.
Previous Positions: Director and Audit Committee Member, Bank of America Corp.
Qualifications: Business management and director experience. |
Annual Shareholder Report
Name
Birth Date
Positions Held with Trust
Date Service Began | Principal Occupation(s) for Past Five Years,
Other Directorships Held, Previous Position(s) and Qualifications |
Maureen Lally-Green
Birth Date: July 5, 1949
Trustee
Began serving: August 2009 | Principal Occupations: Director or Trustee of the Federated Fund Family; Associate General Secretary and Director, Office for Church Relations, Diocese of Pittsburgh; Adjunct Professor of Law, Duquesne University School of Law; Superior Court of Pennsylvania (service began 1998 and ended July 2009).
Other Directorships Held: Director, Consol Energy (service started June 2013); Director, Auberle (service ended December 2013); Member, Pennsylvania State Board of Education; Director, Saint Vincent College; Director, Ireland Institute of Pittsburgh (service ended December 2013); Director and Chair, UPMC Mercy Hospital; Regent, St. Vincent Seminary; Director, Epilepsy Foundation of Western and Central Pennsylvania; Director, Saint Thomas More Society (service ended December 2013); Director, Our Campaign for the Church Alive!, Inc.; Director, Pennsylvania Bar Institute (2013-present); Director, Cardinal Wuerl North Catholic High School (2013-present).
Previous Position: Professor of Law, Duquesne University School of Law, Pittsburgh (1983-1998).
Qualifications: Legal and director experience. |
Peter E. Madden
Birth Date: March 16, 1942
Trustee
Began serving: November 1991 | Principal Occupation: Director or Trustee, and Chairman of the Board of Directors or Trustees, of the Federated Fund Family.
Previous Positions: Representative, Commonwealth of Massachusetts General Court; President, Chief Operating Officer and Director, State Street Bank and Trust Company and State Street Corporation (retired); Director, VISA USA and VISA International; Chairman and Director, Massachusetts Bankers Association; Director, Depository Trust Corporation; Director, The Boston Stock Exchange.
Qualifications: Business management, mutual fund services and director experience. |
Charles F. Mansfield, Jr.
Birth Date: April 10, 1945
Trustee
Began serving: January 1999 | Principal Occupations: Director or Trustee of the Federated Fund Family; Management Consultant.
Previous Positions: Chief Executive Officer, PBTC International Bank; Partner, Arthur Young & Company (now Ernst & Young LLP); Chief Financial Officer of Retail Banking Sector, Chase Manhattan Bank; Senior Vice President, HSBC Bank USA (formerly Marine Midland Bank); Vice President, Citibank; Assistant Professor of Banking and Finance, Frank G. Zarb School of Business, Hofstra University; Executive Vice President, DVC Group, Inc. (marketing, communications and technology).
Qualifications: Banking, business management, education and director experience. |
Annual Shareholder Report
Name
Birth Date
Positions Held with Trust
Date Service Began | Principal Occupation(s) for Past Five Years,
Other Directorships Held, Previous Position(s) and Qualifications |
Thomas M. O'Neill
Birth Date: June 14, 1951
Trustee
Began serving: October 2006 | Principal Occupations: Director or Trustee, Vice Chairman of the Audit Committee of the Federated Fund Family; Sole Proprietor, Navigator Management Company (investment and strategic consulting).
Other Directorships Held: Board of Overseers, Children's Hospital of Boston; Visiting Committee on Athletics, Harvard College; Board of Directors, Medicines for Humanity; Board of Directors, The Golisano Children's Museum of Naples, Florida.
Previous Positions: Chief Executive Officer and President, Managing Director and Chief Investment Officer, Fleet Investment Advisors; President and Chief Executive Officer, Aeltus Investment Management, Inc.; General Partner, Hellman, Jordan Management Co., Boston, MA; Chief Investment Officer, The Putnam Companies, Boston, MA; Credit Analyst and Lending Officer, Fleet Bank; Director and Consultant, EZE Castle Software (investment order management software); Director, Midway Pacific (lumber).
Qualifications: Business management, mutual fund, director and investment experience. |
P. Jerome Richey
Birth Date: February 23, 1949
Trustee
Began serving: October 2013 | Principal Occupations: Director or Trustee of the Federated Fund Family; General Counsel, University of Pittsburgh.
Other Directorships Held: Board Chairman, Epilepsy Foundation of Western Pennsylvania; Board Member, World Affairs Council of Pittsburgh.
Previous Positions: Chief Legal Officer and Executive Vice President, CONSOL Energy Inc.; Shareholder, Buchanan Ingersoll & Rooney PC (a law firm).
Qualifications: Business management, legal and director experience. |
John S. Walsh
Birth Date: November 28, 1957
Trustee
Began serving: January 1999 | Principal Occupations: Director or Trustee, Chairman of the Audit Committee of the Federated Fund Family; President and Director, Heat Wagon, Inc. (manufacturer of construction temporary heaters); President and Director, Manufacturers Products, Inc. (distributor of portable construction heaters); President, Portable Heater Parts, a division of Manufacturers Products, Inc.
Previous Position: Vice President, Walsh & Kelly, Inc.
Qualifications: Business management and director experience. |
Annual Shareholder Report
OFFICERS
Name
Birth Date
Address
Positions Held with Trust
Date Service Began | Principal Occupation(s) for Past Five Years
and Previous Position(s) |
John W. McGonigle
Birth Date: October 26, 1938
EXECUTIVE VICE PRESIDENT AND SECRETARY
Officer since: April 1984 | Principal Occupations: Executive Vice President and Secretary of the Federated Fund Family; Vice Chairman, Executive Vice President, Secretary and Director, Federated Investors, Inc.
Previous Positions: Trustee, Federated Investment Management Company and Federated Investment Counseling; Director, Federated Global Investment Management Corp., Federated Services Company and Federated Securities Corp. |
Lori A. Hensler
Birth Date: January 6, 1967
TREASURER
Officer since: April 2013 | Principal Occupations: Principal Financial Officer and Treasurer of the Federated Fund Family; Senior Vice President, Federated Administrative Services; Financial and Operations Principal for Federated Securities Corp. and Edgewood Services, Inc.; and Assistant Treasurer, Federated Investors Trust Company. Ms. Hensler has received the Certified Public Accountant designation.
Previous Positions: Controller of Federated Investors, Inc.; Senior Vice President and Assistant Treasurer, Federated Investors Management Company; Treasurer, Federated Investors Trust Company; Assistant Treasurer, Federated Administrative Services, Federated Administrative Services, Inc., Federated Securities Corp., Edgewood Services, Inc., Federated Advisory Services Company, Federated Equity Management Company of Pennsylvania, Federated Global Investment Management Corp., Federated Investment Counseling, Federated Investment Management Company, Passport Research, Ltd., and Federated MDTA, LLC; Financial and Operations Principal for Federated Securities Corp., Edgewood Services, Inc. and Southpointe Distribution Services, Inc. |
Peter J. Germain
Birth Date: September 3, 1959
CHIEF LEGAL OFFICER
Officer since: January 2005 | Principal Occupations: Mr. Germain is Chief Legal Officer of the Federated Fund Family. He is General Counsel and Vice President, Federated Investors, Inc.; President, Federated Administrative Services and Federated Administrative Services, Inc.; Vice President, Federated Securities Corp.; Secretary, Federated Private Asset Management, Inc.; and Secretary, Retirement Plan Service Company of America. Mr. Germain joined Federated in 1984 and is a member of the Pennsylvania Bar Association.
Previous Positions: Deputy General Counsel, Special Counsel, Managing Director of Mutual Fund Services, Federated Investors, Inc.; Senior Vice President, Federated Services Company; and Senior Corporate Counsel, Federated Investors, Inc. |
Richard B. Fisher
Birth Date: May 17, 1923
Vice President
Officer since: April 1987 | Principal Occupations: Vice Chairman or Vice President of some of the Funds in the Federated Fund Family; Vice Chairman, Federated Investors, Inc.; Chairman, Federated Securities Corp.
Previous Positions: President and Director or Trustee of some of the Funds in the Federated Fund Family; Executive Vice President, Federated Investors, Inc.; Director and Chief Executive Officer, Federated Securities Corp. |
Annual Shareholder Report
Name
Birth Date
Address
Positions Held with Trust
Date Service Began | Principal Occupation(s) for Past Five Years
and Previous Position(s) |
Brian P. Bouda
Birth Date: February 28, 1947
CHIEF COMPLIANCE OFFICER AND SENIOR VICE PRESIDENT
Officer since: August 2004 | Principal Occupations: Senior Vice President and Chief Compliance Officer of the Federated Fund Family; Vice President and Chief Compliance Officer of Federated Investors, Inc. and Chief Compliance Officer of certain of its subsidiaries. Mr. Bouda joined Federated in 1999 and is a member of the American Bar Association and the State Bar Association of Wisconsin.
Previous Positions: Served in Senior Management positions with a large regional banking organization. |
Stephen F. Auth
Birth Date: September 3, 1956
450 Lexington Avenue
Suite 3700
New York, NY 10017-3943
CHIEF INVESTMENT OFFICER
Officer since: November 2002 | Principal Occupations: Stephen F. Auth is Chief Investment Officer of various Funds in the Federated Fund Family; Executive Vice President, Federated Investment Counseling, Federated Global Investment Management Corp. and Federated Equity Management Company of Pennsylvania.
Previous Positions: Executive Vice President, Federated Investment Management Company and Passport Research, Ltd. (investment advisory subsidiary of Federated); Senior Vice President, Global Portfolio Management Services Division; Senior Vice President, Federated Investment Management Company and Passport Research, Ltd.; Senior Managing Director and Portfolio Manager, Prudential Investments. |
Walter C. Bean
Birth Date: June 22, 1945
VICE PRESIDENT
Officer since: November 2006
Portfolio Manager since: June 2008 | Principal Occupations: Walter C. Bean has been the Fund's Portfolio Manager since June 2008. He is Vice President of the Trust with respect to the Fund. Mr. Bean is a Senior Vice President, Senior Portfolio Manager and the Head of the Strategic Value Team of the Fund's Adviser. Mr. Bean joined Federated in 2000. His previous associations included: various investment management and research positions with C.S. McKee & Company, First Chicago Investment Advisors, CIGNA Investment Advisors and Mellon Bank. Mr. Bean earned a Bachelors Degree in Business Administration from Ohio University and an M.B.A. from the Pennsylvania State University. Mr. Bean has received the Chartered Financial Analyst designation and has 43 years of investment experience. |
Annual Shareholder Report
Evaluation and Approval of Advisory Contract–May 2013
Federated International Strategic Value Dividend Fund (the “Fund”)
Following a review and recommendation of approval by the Fund's independent trustees, the Fund's Board reviewed and approved at its May 2013 meetings the Fund's investment advisory contract for an additional one-year term. The Board's decision regarding the contract reflects the exercise of its business judgment on whether to continue the existing arrangements.
In this connection, the Federated Funds' Board had previously appointed a Senior Officer, whose duties include specified responsibilities relating to the process by which advisory fees are to be charged to a Federated fund. The Senior Officer has the authority to retain consultants, experts, or staff as may be reasonably necessary to assist in the performance of his duties, reports directly to the Board, and may be terminated only with the approval of a majority of the independent members of the Board. The Senior Officer prepared and furnished to the Board an independent, written evaluation that covered topics discussed below (the “Evaluation”). The Board considered that Evaluation, along with other information, in deciding to approve the advisory contract.
The Board is also familiar with and considered judicial decisions concerning allegedly excessive investment advisory fees, which have indicated that the following factors may be relevant to an Adviser's fiduciary duty with respect to its receipt of compensation from a fund: the nature and quality of the services provided by the Adviser to a fund and its shareholders, including the performance and expenses of the fund and of comparable funds; the Adviser's cost of providing the services, including the profitability to the Adviser of providing advisory services to a fund; the extent to which the Adviser may realize “economies of scale” as a fund grows larger and, if such economies exist, whether they have been shared with a fund and its shareholders or the family of funds; any “fall-out financial benefits” that accrue to the Adviser because of its relationship with a fund (including research services received from brokers that execute fund trades and any fees paid to affiliates of the Adviser for services rendered to a fund); comparative fee structures, including a comparison of fees paid to the Adviser with those paid by similar funds; and the extent to which the Board members are fully informed about all facts the Board deems relevant to its consideration of the Adviser's services and fees. Consistent with these judicial decisions, the Board also considered management fees charged to institutional and other clients of the Adviser for what might be viewed as like services. The Board was aware of these factors and was guided by them in its review of the Fund's advisory contract to the extent it considered them to be appropriate and relevant, as discussed further below.
Annual Shareholder Report
The Board considered and weighed these circumstances in light of its substantial accumulated experience in governing the Fund and working with Federated on matters relating to the Federated funds, and was assisted in its deliberations by independent legal counsel. Throughout the year, and in connection with its May meetings, the Board requested and received substantial and detailed information about the Fund and the Federated organization that was in addition to the extensive materials that comprise and accompany the Senior Officer's Evaluation. Federated provided much of this information at each regular meeting of the Board, and furnished additional substantial information in connection with the May meeting at which the Board's formal review of the advisory contract occurred. At this May meeting, senior management of the Adviser also met with the independent trustees and their counsel to discuss the materials presented and any other matters thought relevant by the Adviser or the trustees. Between regularly scheduled meetings, the Board also received information on particular matters as the need arose. Thus, the Board's consideration of the advisory contract included review of the Senior Officer's Evaluation, accompanying data and additional information covering such matters as: the Adviser's investment philosophy, revenue, profitability, personnel and processes; investment and operating strategies; the Fund's short- and long-term performance (in absolute terms, both on a gross basis and net of expenses, as well as in relationship to its particular investment program and certain competitor or “peer group” funds and/or other benchmarks, as appropriate), and comments on the reasons for performance; the Fund's investment objectives; the Fund's expenses (including the advisory fee itself and the overall expense structure of the Fund, both in absolute terms and relative to similar and/or competing funds, with due regard for contractual or voluntary expense limitations); the use and allocation of brokerage commissions derived from trading the Fund's portfolio securities (if any); and the nature, quality and extent of the advisory and other services provided to the Fund by the Adviser and its affiliates. The Board also considered the preferences and expectations of Fund shareholders; the entrepreneurial risk assumed by the Adviser in sponsoring the funds; the continuing state of competition in the mutual fund industry and market practices; the range of comparable fees for similar funds in the mutual fund industry; the Fund's relationship to the Federated family of funds which include a comprehensive array of funds with different investment objectives, policies and strategies which are available for exchange without the incurrence of additional sales charges; compliance and audit reports concerning the Federated funds and the Federated companies that service them (including communications from regulatory agencies), as well as Federated's responses to any issues raised therein; and relevant developments in the mutual fund industry and how the Federated funds and/or Federated are responding to them. The Board's evaluation process is evolutionary. The criteria considered and the emphasis placed on relevant criteria change in recognition of changing circumstances in the mutual fund marketplace.
Annual Shareholder Report
While mindful that courts have cautioned against giving such comparisons too much weight, the Board has found the use of comparisons of the Fund's fees and expenses to other mutual funds with comparable investment programs to be relevant. The Board focused on comparisons with other similar mutual funds more heavily than non-mutual fund products or services because it is believed that they are more relevant. For example, other mutual funds are the products most like the Fund, they are readily available to Fund shareholders as alternative investment vehicles, and they are the type of investment vehicle in fact chosen and maintained by the Fund's investors. The range of their fees and expenses therefore appears to be a relevant indicator of what consumers have found to be reasonable in the precise marketplace in which the Fund competes.
It was noted in the materials for the Board meeting that for the period covered by the Evaluation, the Fund's investment advisory fee, after waivers and expense reimbursements, if any, was below the median of the relevant peer group. The Board reviewed the fees and other expenses of the Fund with the Adviser, noting that the overall expense structure of the Fund, after waivers and expense reimbursements, was below the median of the relevant peer group, and was satisfied that the overall expense structure of the Fund remained competitive.
By contrast, the Senior Officer has reviewed Federated's fees for providing advisory services to products outside the Federated family of funds (e.g., institutional and separate accounts). He concluded that mutual funds and institutional accounts are inherently different products. Those differences include, but are not limited to, different types of targeted investors; being subject to different laws and regulations; different legal structures; different average account sizes; different associated costs; different portfolio management techniques made necessary by different cash flows; and the time spent by portfolio managers and their teams, funds financial services, legal, compliance and risk management in reviewing securities pricing, addressing different administrative responsibilities, addressing different degrees of risk associated with management and a variety of different costs. The Senior Officer did not consider these fee schedules to be determinative in judging the appropriateness of mutual fund advisory fees.
The Fund's ability to deliver competitive performance when compared to its peer group was also deemed to be relevant by the Board as a useful indicator of how the Adviser is executing the Fund's investment program, which in turn assisted the Board in reaching a conclusion that the nature, extent, and quality of the Adviser's investment management services were such as to warrant continuation of the advisory contract.
The Senior Officer reviewed information compiled by Federated, using data supplied by independent fund ranking organizations, regarding the performance of, and fees charged by, other mutual funds, noting his view that comparisons to fund peer groups are relevant, though not conclusive in judging the reasonableness of proposed fees.
Annual Shareholder Report
For the periods covered by the Evaluation, the Fund's performance for the three-year period was above the median of the relevant peer group, and the Fund's performance fell below the median of the relevant peer group for the one-year period. The Board discussed the Fund's performance with the Adviser and recognized the efforts being undertaken by the Adviser. The Board will continue to monitor these efforts and the performance of the Fund.
The Board also received financial information about Federated, including information regarding the compensation and benefits Federated derived from its relationships with the Federated funds. This information covered not only the fees under the advisory contracts, but also fees received by Federated's subsidiaries for providing other services to the Federated funds under separate contracts (e.g., for serving as the Federated funds' administrator). The information also detailed any indirect benefit Federated may derive from its receipt of research services from brokers who execute Federated fund trades. In addition, the Board considered the fact that, in order for a fund to be competitive in the marketplace, Federated and its affiliates frequently waived fees and/or reimbursed expenses and have disclosed to fund investors and/or indicated to the Board their intention to do so in the future, where appropriate. Moreover, the Board receives regular reporting as to the institution, adjustment or elimination of these voluntary waivers.
Federated furnished information, requested by the Senior Officer, that reported revenues on a fund-by-fund basis and made estimates of the allocation of expenses on a fund-by-fund basis, using allocation methodologies specified by the Senior Officer. The Senior Officer noted that, while these cost allocation reports apply consistent allocation processes, the inherent difficulties in arbitrarily allocating costs continues to cause the Senior Officer to question the precision of the process and to conclude that such reports may be unreliable, since a single change in an allocation estimate can dramatically alter the resulting estimate of cost and/or profitability of a fund. The allocation information was considered in the analysis by the Board but was determined to be of limited use.
The Board and the Senior Officer also reviewed information compiled by Federated comparing profitability information for Federated to other publicly held fund management companies. In this regard, the Senior Officer noted the limited availability of such information, but nonetheless concluded that Federated's profit margins did not appear to be excessive. The Board agreed with this assessment.
The Senior Officer's Evaluation also discussed the notion of possible realization of “economies of scale” as a fund grows larger. The Board considered in this regard that the Adviser has made significant and long-term investments in areas that support all of the Federated family of funds, such as personnel and processes for the portfolio management, shareholder services, compliance, internal audit, and risk management functions; and systems technology; and that the benefits of these efforts (as well as any economies, should they exist) were likely to be enjoyed by the fund family as a whole. Finally, the Board also noted
Annual Shareholder Report
the absence of any applicable regulatory or industry guidelines on this subject, which (as discussed in the Senior Officer's Evaluation) is compounded by the lack of any common industry practice or general pattern with respect to structuring fund advisory fees with “breakpoints” that serve to reduce the fee as the fund attains a certain size.
The Senior Officer noted that, subject to the comments and recommendations made within his Evaluation, his observations and the information accompanying the Evaluation supported a finding by the Board that the management fees for each of the funds were reasonable. Under these circumstances, no changes were recommended to, and no objection was raised to, the continuation of the Fund's advisory contract.
In its decision to continue an existing investment advisory contract, the Board was mindful of the potential disruptions of the Fund's operations and various risks, uncertainties and other effects that could occur as a result of a decision to terminate or not renew an advisory contract. In particular, the Board recognized that many shareholders have invested in the Fund on the strength of the Adviser's industry standing and reputation and with the expectation that the Adviser will have a continuing role in providing advisory services to the Fund. Thus, the Board's approval of the advisory contract reflected the fact that it is the shareholders who have effectively selected the Adviser by virtue of having invested in the Fund. The Board concluded that, in light of the factors discussed above, including the nature, quality and scope of the services provided to the Fund by the Adviser and its affiliates, continuation of the advisory contract was appropriate.
The Board based its decision to approve the advisory contract on the totality of the circumstances and relevant factors and with a view to past and future long-term considerations. Not all of the factors and considerations identified above were necessarily relevant to the Fund, nor did the Board consider any one of them to be determinative. With respect to the factors that were relevant, the Board's decision to approve the contract reflects its determination that Federated's performance and actions provided a satisfactory basis to support the decision to continue the existing arrangements.
Annual Shareholder Report
Voting Proxies on Fund Portfolio Securities
A description of the policies and procedures that the Fund uses to determine how to vote proxies, if any, relating to securities held in the Fund's portfolio is available, without charge and upon request, by calling 1-800-341-7400. A report on “Form N-PX” of how the Fund voted any such proxies during the most recent 12-month period ended June 30 is available via the Proxy Voting Record (Form N-PX) link associated with the Fund and share class name at www.Federatedinvestors.com/FundInformation. Form N-PX filings are also available at the SEC's website at www.sec.gov.
Quarterly Portfolio Schedule
The Fund files with the SEC a complete schedule of its portfolio holdings, as of the close of the first and third quarters of its fiscal year, on “Form N-Q.” These filings are available on the SEC's website at www.sec.gov and may be reviewed and copied at the SEC's Public Reference Room in Washington, DC. (Call 1-800-SEC-0330 for information on the operation of the Public Reference Room.) You may also access this information via the link to the Fund and share class name at www.Federatedinvestors.com/FundInformation.
Annual Shareholder Report
[PAGE INTENTIONALLY LEFT BLANK]
[PAGE INTENTIONALLY LEFT BLANK]
[PAGE INTENTIONALLY LEFT BLANK]
[PAGE INTENTIONALLY LEFT BLANK]
[PAGE INTENTIONALLY LEFT BLANK]
[PAGE INTENTIONALLY LEFT BLANK]
[PAGE INTENTIONALLY LEFT BLANK]
Mutual funds are not bank deposits or obligations, are not guaranteed by any bank and are not insured or guaranteed by the U.S. government, the Federal Deposit Insurance Corporation, the Federal Reserve Board or any other government agency. Investment in mutual funds involves investment risk, including the possible loss of principal.
This Report is authorized for distribution to prospective investors only when preceded or accompanied by the Fund's Prospectus, which contains facts concerning its objective and policies, management fees, expenses and other information.
Federated International Strategic Value Dividend Fund
Federated Investors Funds
4000 Ericsson Drive
Warrendale, PA 15086-7561
Contact us at FederatedInvestors.com
or call 1-800-341-7400.
Federated Securities Corp., Distributor
CUSIP 314172388
CUSIP 314172370
CUSIP 314172362
39834 (1/14)
Federated is a registered trademark of Federated Investors, Inc.
2014 ©Federated Investors, Inc.
Item 2. Code of Ethics
(a) As of the end of the period covered by this report, the registrant has adopted a code of ethics (the "Section 406 Standards for Investment Companies - Ethical Standards for Principal Executive and Financial Officers") that applies to the registrant's Principal Executive Officer and Principal Financial Officer; the registrant's Principal Financial Officer also serves as the Principal Accounting Officer.
(c) Not Applicable
(d) Not Applicable
(e) Not Applicable
(f)(3) The registrant hereby undertakes to provide any person, without charge, upon request, a copy of the code of ethics. To request a copy of the code of ethics, contact the registrant at 1-800-341-7400, and ask for a copy of the Section 406 Standards for Investment Companies - Ethical Standards for Principal Executive and Financial Officers.
Item 3. Audit Committee Financial Expert
The registrant's Board has determined that each of the following members of the Board's Audit Committee is an “audit committee financial expert,” and is "independent," for purposes of this Item: Charles F. Mansfield, Jr., Thomas M. O'Neill and John S. Walsh.
Item 4. Principal Accountant Fees and Services
(a) Audit Fees billed to the registrant for the two most recent fiscal years:
Fiscal year ended 2013 - $366,000
Fiscal year ended 2012 - $383,700
(b) Audit-Related Fees billed to the registrant for the two most recent fiscal years:
Fiscal year ended 2013 - $0
Fiscal year ended 2012 - $145
Travel to Audit Committee Meeting.
Amount requiring approval of the registrant’s audit committee pursuant to paragraph (c)(7)(ii) of Rule 2-01 of Regulation S-X, $10,580 and $8,370 respectively. Fiscal year ended 2013- Audit consent fees for N-14 merger document. Fiscal year ended 2012- Audit consent fees for N-14 merger documents.
(c) Tax Fees billed to the registrant for the two most recent fiscal years:
Fiscal year ended 2013 - $0
Fiscal year ended 2012 - $0
Amount requiring approval of the registrant’s audit committee pursuant to paragraph (c)(7)(ii) of Rule 2-01 of Regulation S-X, $9,720 and $0 respectively. Fiscal year ended 2013- Service fee for tax reclaim recovery.
(d) All Other Fees billed to the registrant for the two most recent fiscal years:
Fiscal year ended 2013 - $0
Fiscal year ended 2012 - $0
Amount requiring approval of the registrant’s audit committee pursuant to paragraph (c)(7)(ii) of Rule 2-01 of Regulation S-X, $16,337 and $18,894 respectively. Fiscal year ended 2013- Service fee for analysis of potential Passive Foreign Investment Company holdings. Fiscal year ended 2012- Service fee for analysis of potential Passive Foreign Investment Company holdings.
(e)(1) Audit Committee Policies regarding Pre-approval of Services.
The Audit Committee is required to pre-approve audit and non-audit services performed by the independent auditor in order to assure that the provision of such services do not impair the auditor’s independence. Unless a type of service to be provided by the independent auditor has received general pre-approval, it will require specific pre-approval by the Audit Committee. Any proposed services exceeding pre-approved cost levels will require specific pre-approval by the Audit Committee.
Certain services have the general pre-approval of the Audit Committee. The term of the general pre-approval is 12 months from the date of pre-approval, unless the Audit Committee specifically provides for a different period. The Audit Committee will annually review the services that may be provided by the independent auditor without obtaining specific pre-approval from the Audit Committee and may grant general pre-approval for such services. The Audit Committee will revise the list of general pre-approved services from time to time, based on subsequent determinations. The Audit Committee will not delegate its responsibilities to pre-approve services performed by the independent auditor to management.
The Audit Committee has delegated pre-approval authority to its Chairman. The Chairman will report any pre-approval decisions to the Audit Committee at its next scheduled meeting. The Committee will designate another member with such pre-approval authority when the Chairman is unavailable.
AUDIT SERVICES
The annual Audit services engagement terms and fees will be subject to the specific pre-approval of the Audit Committee. The Audit Committee must approve any changes in terms, conditions and fees resulting from changes in audit scope, registered investment company (RIC) structure or other matters.
In addition to the annual Audit services engagement specifically approved by the Audit Committee, the Audit Committee may grant general pre-approval for other Audit Services, which are those services that only the independent auditor reasonably can provide. The Audit Committee has pre-approved certain Audit services, all other Audit services must be specifically pre-approved by the Audit Committee.
AUDIT-RELATED SERVICES
Audit-related services are assurance and related services that are reasonably related to the performance of the audit or review of the Company’s financial statements or that are traditionally performed by the independent auditor. The Audit Committee believes that the provision of Audit-related services does not impair the independence of the auditor, and has pre-approved certain Audit-related services, all other Audit-related services must be specifically pre-approved by the Audit Committee.
TAX SERVICES
The Audit Committee believes that the independent auditor can provide Tax services to the Company such as tax compliance, tax planning and tax advice without impairing the auditor’s independence. However, the Audit Committee will not permit the retention of the independent auditor in connection with a transaction initially recommended by the independent auditor, the purpose of which may be tax avoidance and the tax treatment of which may not be supported in the Internal Revenue Code and related regulations. The Audit Committee has pre-approved certain Tax services, all Tax services involving large and complex transactions must be specifically pre-approved by the Audit Committee.
ALL OTHER SERVICES
With respect to the provision of services other than audit, review or attest services the pre-approval requirement is waived if:
| (1) | The aggregate amount of all such services provided constitutes no more than five percent of the total amount of revenues paid by the registrant, the registrant’s adviser (not including any sub-adviser whose role is primarily portfolio management and is subcontracted with or overseen by another investment adviser), and any entity controlling, controlled by, or under common control with the investment adviser that provides ongoing services to the registrant to its accountant during the fiscal year in which the services are provided; |
| (2) | Such services were not recognized by the registrant, the registrant’s adviser (not including any sub-adviser whose role is primarily portfolio management and is subcontracted with or overseen by another investment adviser), and any entity controlling, controlled by, or under common control with the investment adviser that provides ongoing services to the registrant at the time of the engagement to be non-audit services; and |
| (3) | Such services are promptly brought to the attention of the Audit Committee of the issuer and approved prior to the completion of the audit by the Audit Committee or by one or more members of the Audit Committee who are members of the board of directors to whom authority to grant such approvals has been delegated by the Audit Committee. |
The Audit Committee may grant general pre-approval to those permissible non-audit services classified as All Other services that it believes are routine and recurring services, and would not impair the independence of the auditor.
The SEC’s rules and relevant guidance should be consulted to determine the precise definitions of prohibited non-audit services and the applicability of exceptions to certain of the prohibitions.
PRE-APPROVAL FEE LEVELS
Pre-approval fee levels for all services to be provided by the independent auditor will be established annually by the Audit Committee. Any proposed services exceeding these levels will require specific pre-approval by the Audit Committee.
PROCEDURES
Requests or applications to provide services that require specific approval by the Audit Committee will be submitted to the Audit Committee by both the independent auditor and the Principal Accounting Officer and/or Internal Auditor, and must include a joint statement as to whether, in their view, the request or application is consistent with the SEC’s rules on auditor independence.
(e)(2) Percentage of services identified in items 4(b) through 4(d) that were approved by the registrants audit committee pursuant to paragraph (c)(7)(i)(C) of Rule 2-01 of Regulation S-X:
4(b)
Fiscal year ended 2013 – 0%
Fiscal year ended 2012 - 0%
Percentage of services provided to the registrants investment adviser and any entity controlling, controlled by, or under common control with the investment adviser that provides ongoing services to the registrant that were approved by the registrants audit committee pursuant to paragraph (c)(7)(i)(C) of Rule 2-01 of Regulation S-X, 0% and 0% respectively.
4(c)
Fiscal year ended 2013 – 0%
Fiscal year ended 2012 – 0%
Percentage of services provided to the registrants investment adviser and any entity controlling, controlled by, or under common control with the investment adviser that provides ongoing services to the registrant that were approved by the registrants audit committee pursuant to paragraph (c)(7)(i)(C) of Rule 2-01 of Regulation S-X, 0% and 0% respectively.
4(d)
Fiscal year ended 2013 – 0%
Fiscal year ended 2012 – 0%
Percentage of services provided to the registrants investment adviser and any entity controlling, controlled by, or under common control with the investment adviser that provides ongoing services to the registrant that were approved by the registrants audit committee pursuant to paragraph (c)(7)(i)(C) of Rule 2-01 of Regulation S-X, 0% and 0% respectively.
| (g) | Non-Audit Fees billed to the registrant, the registrant’s investment adviser, and certain entities controlling, controlled by or under common control with the investment adviser: |
Fiscal year ended 2013 - $155,393
Fiscal year ended 2012 - $403,127
(h) The registrant’s Audit Committee has considered that the provision of non-audit services that were rendered to the registrant’s adviser (not including any sub-adviser whose role is primarily portfolio management and is subcontracted with or overseen by another investment adviser), and any entity controlling, controlled by, or under common control with the investment adviser that provides ongoing services to the registrant that were not pre-approved pursuant to paragraph (c)(7)(ii) of Rule 2-01 of Regulation S-X is compatible with maintaining the principal accountant’s independence.
Item 5. Audit Committee of Listed Registrants
Not Applicable
Item 6. Schedule of Investments
(a) The registrant’s Schedule of Investments is included as part of the Report to Stockholders filed under Item 1 of this form.
(b) Not Applicable; Fund had no divestments during the reporting period covered since the previous Form N-CSR filing.
Item 7. Disclosure of Proxy Voting Policies and Procedures for Closed-End Management Investment Companies
Item 8. Portfolio Managers of Closed-End Management Investment Companies
Item 9. Purchases of Equity Securities by Closed-End Management Investment Company and Affiliated Purchasers
Item 10. Submission of Matters to a Vote of Security Holders
No Changes to Report
Item 11. Controls and Procedures
(a) The registrant’s President and Treasurer have concluded that the
registrant’s disclosure controls and procedures (as defined in rule 30a-3(c) under the Act) are effective in design and operation and are sufficient to form the basis of the certifications required by Rule 30a-(2) under the Act, based on their evaluation of these disclosure controls and procedures within 90 days of the filing date of this report on Form N-CSR.
(b) There were no changes in the registrant’s internal control over financial reporting (as defined in rule 30a-3(d) under the Act) during the second fiscal quarter of the period covered by this report that have materially affected, or are reasonably likely to materially affect, the registrant’s internal control over financial reporting.
Item 12. Exhibits
(a)(1) Code of Ethics- Not Applicable to this Report.
(a)(2) Certifications of Principal Executive Officer and Principal Financial Officer.
(a)(3) Not Applicable.
(b) Certifications pursuant to 18 U.S.C. Section 1350.
SIGNATURES
Pursuant to the requirements of the Securities Exchange Act of 1934 and the Investment Company Act of 1940, the registrant has duly caused this report to be signed on its behalf by the undersigned, thereunto duly authorized.
Registrant Federated Equity Funds
By /S/ Lori A. Hensler
Lori A. Hensler, Principal Financial Officer
Date January 24, 2014
Pursuant to the requirements of the Securities Exchange Act of 1934 and the Investment Company Act of 1940, this report has been signed below by the following persons on behalf of the registrant and in the capacities and on the dates indicated.
By /S/ J. Christopher Donahue
J. Christopher Donahue, Principal Executive Officer
Date January 24, 2014
By /S/ Lori A. Hensler
Lori A. Hensler, Principal Financial Officer
Date January 24, 2014