0000745968federated:FederatedInvestorsIncIndexRussell3000Index13162BroadBasedIndexMember2018-10-31
United States Securities and Exchange Commission
Washington, D.C. 20549
Form N-CSR
Certified Shareholder Report of Registered Management Investment Companies
811-4017
(Investment Company Act File Number)
Federated Hermes Equity Funds
(Exact Name of Registrant as Specified in Charter)
Federated Hermes Funds
4000 Ericsson Drive
Warrendale, PA 15086-7561
(Address of Principal Executive Offices)
(412) 288-1900
(Registrant’s Telephone Number)
Peter J. Germain, Esquire
1001 Liberty Avenue
Pittsburgh, Pennsylvania 15222-3779
(Name and Address of Agent for Service)
(Notices should be sent to the Agent for Service)
Date of Fiscal Year End: 2024-10-31
Date of Reporting Period: 2024-10-31
| Item 1. | Reports to Stockholders |
Federated Hermes Kaufmann Fund
Annual Shareholder Report - October 31, 2024
A Portfolio of Federated Hermes Equity Funds
This annual shareholder report contains important information about the Federated Hermes Kaufmann Fund (the "Fund") for the period of November 1, 2023 to October 31, 2024. You can find additional information at FederatedHermes.com/us/FundInformation. You can also request this information by contacting us at 1-800-341-7400, Option 4, or your financial advisor.
This report describes changes made to or planned for the Fund since the beginning of the reporting period.
What were the Fund costs for the last year?
(based on a hypothetical $10,000 investment)
| Class Name | Costs of a $10,000 investment | Costs paid as a percentage of a $10,000 investment |
|---|
| Class A Shares | $230 | 1.95% |
Management's Discussion of Fund Performance
The following discussion compares the performance of the Fund to the Russell Midcap Growth Index to show how the Fund’s performance compares to the returns of similar investments for the reporting period. See the Average Annual Total Returns table below for the returns of the Fund and related indexes, including the Russell 3000 Index, which represents approximately 98% of investable U.S. equities by market capitalization. The Fund seeks to provide capital appreciation by investing principally in common stocks of small and medium-sized companies that are traded on national securities exchanges, the NASDAQ stock market and on the over-the-counter market.
Top Contributors to Performance
■ By sector, allocation to the Industrials and Financials sectors positively affected Fund relative performance.
■ Top individual Fund holdings that contributed positively to performance included Apollo Global, Blue Owl, Eaton Corp.,
Hamilton Lane, Quanta Services and Trane Technologies.
■ Fund holdings in the Consumer Staples sector also led to outperformance as companies with pricing power were able to pass
price increases through to customers during the reporting period.
Top Detractors from Performance
■ The allocation to the Healthcare sector detracted from Fund relative performance as these stocks lagged the overall market
significantly during the reporting period.
■ By sector, stock selection in Real Estate detracted from Fund relative performance.
■ A top individual Fund holding that detracted from performance was New Fortress Energy, Inc.
Annual Shareholder Report
Federated Hermes Kaufmann Fund
Keep in mind that the Fund’s past performance is not a good predictor of how the Fund will perform in the future. The graph and table do not reflect the deduction of taxes that a shareholder would pay on fund distributions or redemption of fund shares.
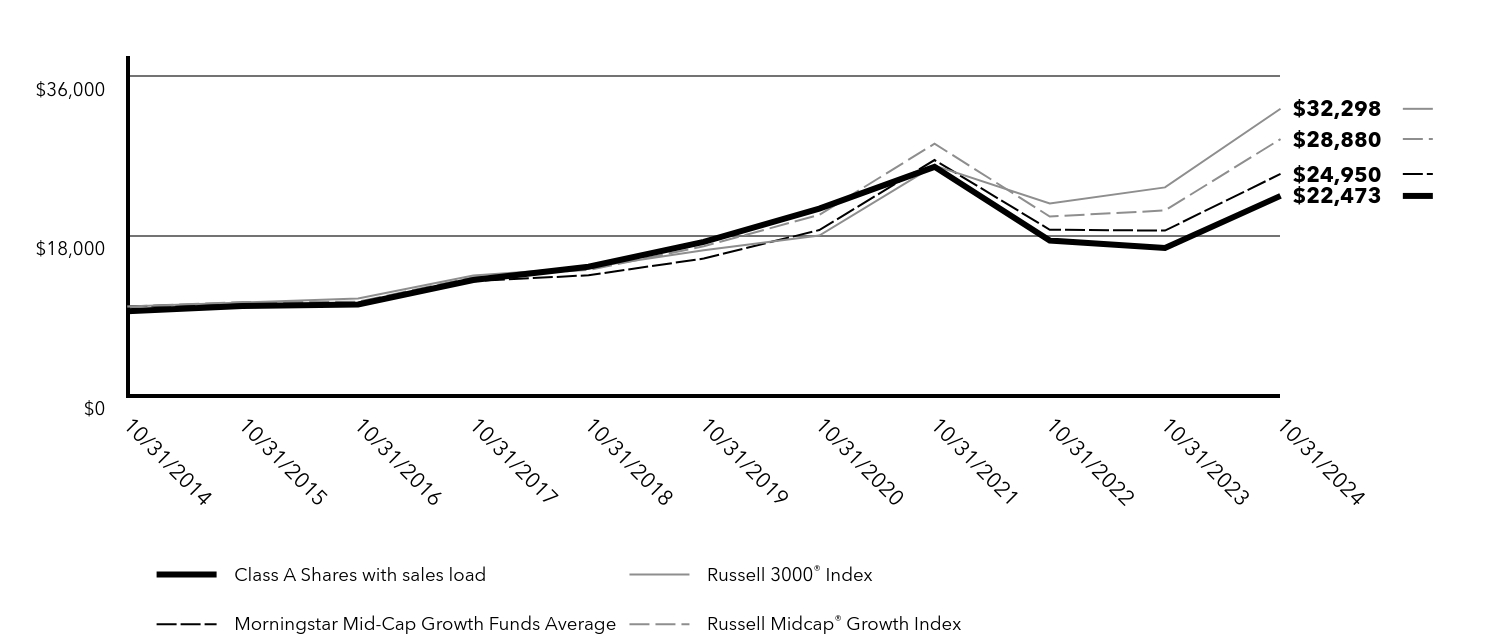
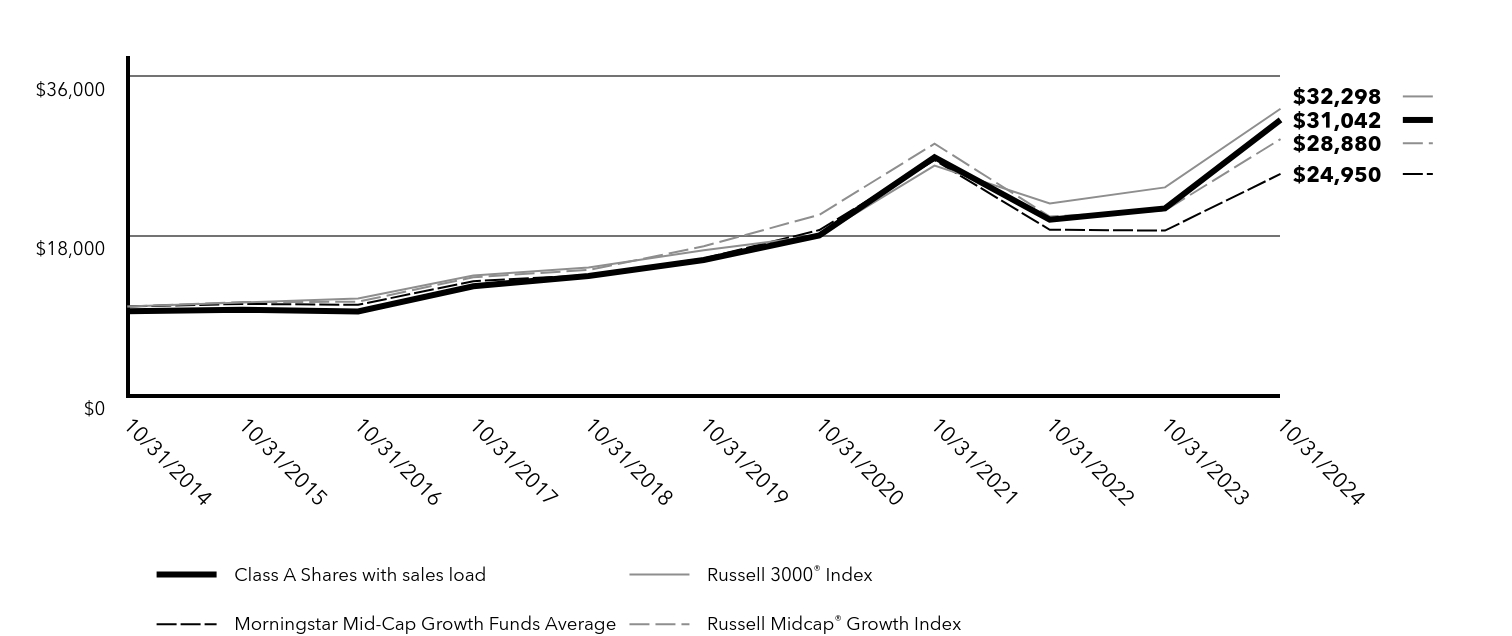
Cumulative Performance: 10/31/2014 to 10/31/2024
Total Return Based on $10,000 Investment
| Class A Shares with sales load | Russell 3000® Index | Morningstar Mid-Cap Growth Funds Average | Russell Midcap® Growth Index |
|---|
| 10/31/2014 | $9,450 | $10,000 | $10,000 | $10,000 |
| 10/31/2015 | $10,044 | $10,449 | $10,288 | $10,494 |
| 10/31/2016 | $10,222 | $10,892 | $10,193 | $10,536 |
| 10/31/2017 | $12,979 | $13,504 | $12,856 | $13,301 |
| 10/31/2018 | $14,490 | $14,395 | $13,522 | $14,118 |
| 10/31/2019 | $17,290 | $16,337 | $15,407 | $16,790 |
| 10/31/2020 | $21,044 | $17,995 | $18,615 | $20,339 |
| 10/31/2021 | $25,751 | $25,894 | $26,515 | $28,358 |
| 10/31/2022 | $17,437 | $21,617 | $18,653 | $20,151 |
| 10/31/2023 | $16,598 | $23,429 | $18,560 | $20,826 |
| 10/31/2024 | $22,473 | $32,298 | $24,950 | $28,880 |
Average Annual Total Returns
| Fund/Index | 1 Year | 5 Years | 10 Years |
|---|
| Class A Shares with sales load | 27.95% | 4.20% | 8.43% |
| Class A Shares without sales load | 35.39% | 5.38% | 9.05% |
Russell 3000®IndexFootnote Reference* | 37.86% | 14.60% | 12.44% |
Russell Midcap® Growth Index | 38.67% | 11.45% | 11.19% |
| Morningstar Mid-Cap Growth Funds Average | 34.44% | 10.17% | 9.55% |
| Footnote | Description |
Footnote* | The Fund has designated the Russell 3000® Index as its new broad-based securities market index in accordance with the SEC’s revised definition for such an index. |
Visit FederatedHermes.com/us/FundInformation and click on the link to your fund and share class for more recent performance information.
| Net Assets | $5,002,105,855 |
| Number of Investments | 157 |
| Portfolio Turnover | 34% |
| Total Advisory Fees Paid | $62,305,185 |
Annual Shareholder Report
Federated Hermes Kaufmann Fund
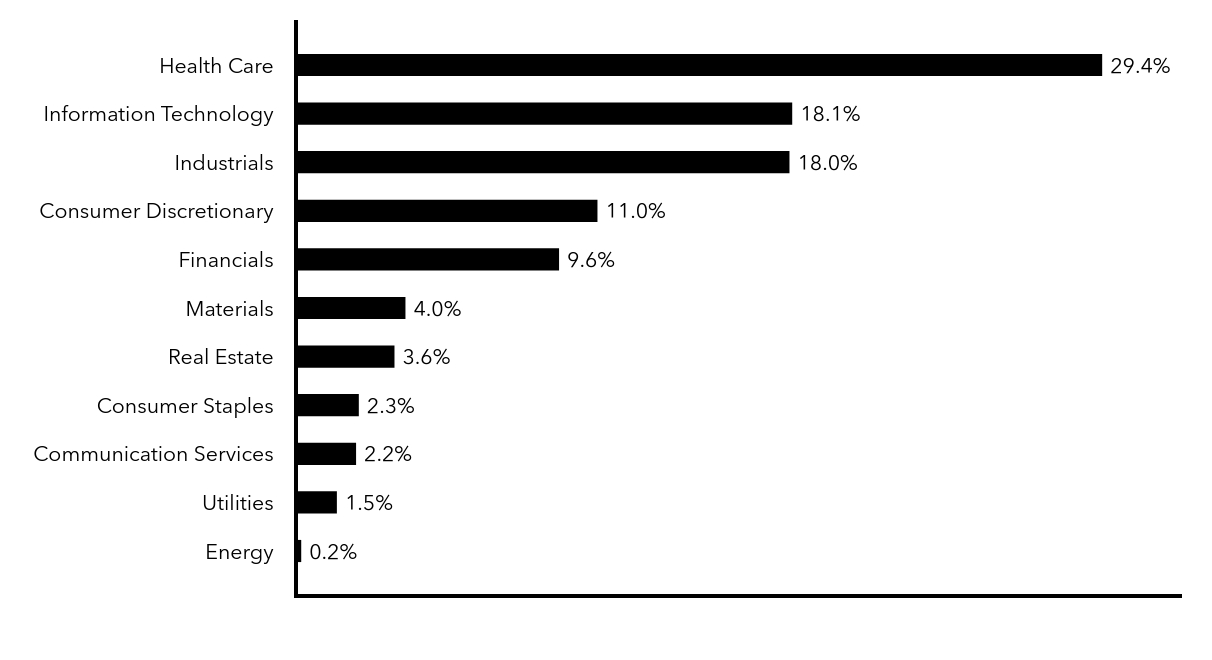
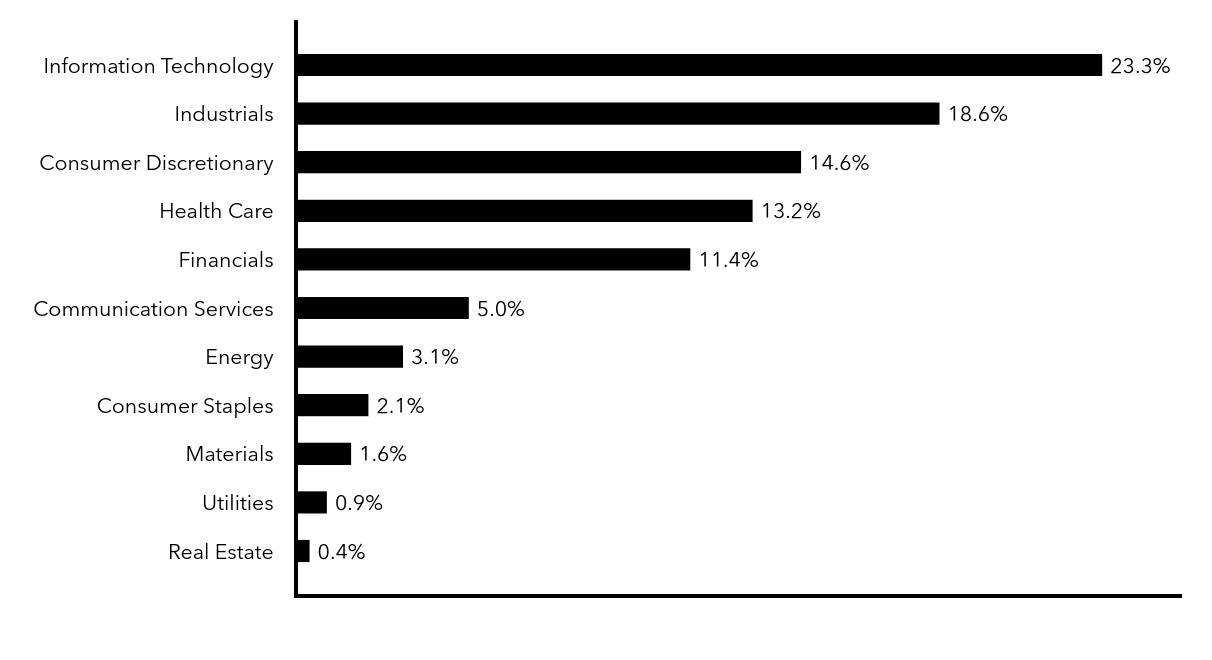
Top Sectors (% of Total Net Assets)
| Value | Value |
|---|
| Energy | 0.2% |
| Utilities | 1.5% |
| Communication Services | 2.2% |
| Consumer Staples | 2.3% |
| Real Estate | 3.6% |
| Materials | 4.0% |
| Financials | 9.6% |
| Consumer Discretionary | 11.0% |
| Industrials | 18.0% |
| Information Technology | 18.1% |
| Health Care | 29.4% |
Following is a summary of material changes made to or planned for the Fund since the beginning of the reporting period. For more complete and current information, you may review the Fund’s disclosure documents on its webpage at FederatedHermes.com/us/FundInformation or upon request at 1-800-341-7400, Option 4, or by contacting your financial advisor.
Effective August 1, 2024, the Fund’s Sub-Adviser, Federated Global Investment Management Corp., became the Fund’s Adviser, replacing Federated Equity Management Company of Pennsylvania. There were no changes to the Fund’s portfolio managers, investment objectives, investment strategies or fees and expenses as a result of the Adviser replacement.
Effective September 30, 2024, Mark Bauknight, Senior Portfolio Manager, retired from the Fund’s Adviser. The other members of the portfolio management team continue to manage the Fund.
Effective January 1, 2025, the Fund’s investment advisory contract with its Adviser is amended to reduce the breakpoint schedule for determining the Fund’s management fee. Effective January 1, 2025, the Fund pays the Adviser a fee at the annual rate of 1.275% on the first $7 billion of the Fund’s average daily net assets, 1.255% on $7 billion - $8 billion of the Fund’s average daily net assets, 1.205% on $8 billion - $9 billion of the Fund’s average daily net assets, 1.155% on $9 billion - $10 billion of the Fund’s average daily net assets and 1.105% of the Fund’s average daily net assets over $10 billion.
Additional Information about the Fund
Additional information is available on the Fund’s website at FederatedHermes.com/us/FundInformation, including its:
• prospectus • financial information • holdings • proxy voting information
CUSIP 314172677
26396-A (12/24)
Federated Securities Corp., Distributor
FederatedHermes.com/us
© 2024 Federated Hermes, Inc.
Federated Hermes Kaufmann Fund
Annual Shareholder Report - October 31, 2024
A Portfolio of Federated Hermes Equity Funds
This annual shareholder report contains important information about the Federated Hermes Kaufmann Fund (the "Fund") for the period of November 1, 2023 to October 31, 2024. You can find additional information at FederatedHermes.com/us/FundInformation. You can also request this information by contacting us at 1-800-341-7400, Option 4, or your financial advisor.
This report describes changes made to or planned for the Fund since the beginning of the reporting period.
What were the Fund costs for the last year?
(based on a hypothetical $10,000 investment)
| Class Name | Costs of a $10,000 investment | Costs paid as a percentage of a $10,000 investment |
|---|
| Class C Shares | $288 | 2.46% |
Management's Discussion of Fund Performance
The following discussion compares the performance of the Fund to the Russell Midcap Growth Index to show how the Fund’s performance compares to the returns of similar investments for the reporting period. See the Average Annual Total Returns table below for the returns of the Fund and related indexes, including the Russell 3000 Index, which represents approximately 98% of investable U.S. equities by market capitalization. The Fund seeks to provide capital appreciation by investing principally in common stocks of small and medium-sized companies that are traded on national securities exchanges, the NASDAQ stock market and on the over-the-counter market.
Top Contributors to Performance
■ By sector, allocation to the Industrials and Financials sectors positively affected Fund relative performance.
■ Top individual Fund holdings that contributed positively to performance included Apollo Global, Blue Owl, Eaton Corp.,
Hamilton Lane, Quanta Services and Trane Technologies.
■ Fund holdings in the Consumer Staples sector also led to outperformance as companies with pricing power were able to pass
price increases through to customers during the reporting period.
Top Detractors from Performance
■ The allocation to the Healthcare sector detracted from Fund relative performance as these stocks lagged the overall market
significantly during the reporting period.
■ By sector, stock selection in Real Estate detracted from Fund relative performance.
■ A top individual Fund holding that detracted from performance was New Fortress Energy, Inc.
Annual Shareholder Report
Federated Hermes Kaufmann Fund
Keep in mind that the Fund’s past performance is not a good predictor of how the Fund will perform in the future. The graph and table do not reflect the deduction of taxes that a shareholder would pay on fund distributions or redemption of fund shares.
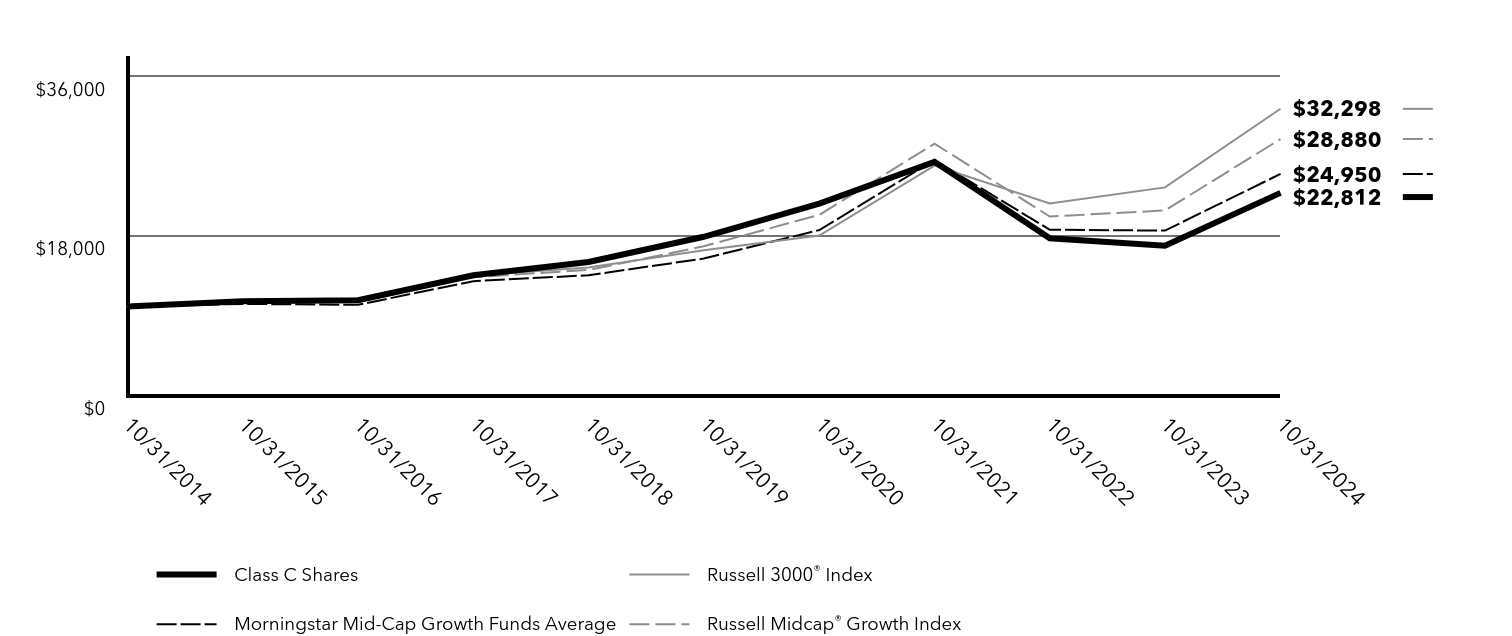
Cumulative Performance: 10/31/2014 to 10/31/2024
Total Return Based on $10,000 Investment
| Class C Shares | Russell 3000® Index | Morningstar Mid-Cap Growth Funds Average | Russell Midcap® Growth Index |
|---|
| 10/31/2014 | $10,000 | $10,000 | $10,000 | $10,000 |
| 10/31/2015 | $10,586 | $10,449 | $10,288 | $10,494 |
| 10/31/2016 | $10,708 | $10,892 | $10,193 | $10,536 |
| 10/31/2017 | $13,516 | $13,504 | $12,856 | $13,301 |
| 10/31/2018 | $15,020 | $14,395 | $13,522 | $14,118 |
| 10/31/2019 | $17,863 | $16,337 | $15,407 | $16,790 |
| 10/31/2020 | $21,606 | $17,995 | $18,615 | $20,339 |
| 10/31/2021 | $26,316 | $25,894 | $26,515 | $28,358 |
| 10/31/2022 | $17,700 | $21,617 | $18,653 | $20,151 |
| 10/31/2023 | $16,849 | $23,429 | $18,560 | $20,826 |
| 10/31/2024 | $22,812 | $32,298 | $24,950 | $28,880 |
Average Annual Total Returns
| Fund/Index | 1 Year | 5 Years | 10 Years |
|---|
| Class C Shares with sales load | 33.34% | 4.82% | 8.60% |
| Class C Shares without sales load | 34.34% | 4.82% | 8.60% |
Russell 3000®IndexFootnote Reference* | 37.86% | 14.60% | 12.44% |
Russell Midcap® Growth Index | 38.67% | 11.45% | 11.19% |
| Morningstar Mid-Cap Growth Funds Average | 34.44% | 10.17% | 9.55% |
| Footnote | Description |
Footnote* | The Fund has designated the Russell 3000® Index as its new broad-based securities market index in accordance with the SEC’s revised definition for such an index. |
Visit FederatedHermes.com/us/FundInformation and click on the link to your fund and share class for more recent performance information.
| Net Assets | $5,002,105,855 |
| Number of Investments | 157 |
| Portfolio Turnover | 34% |
| Total Advisory Fees Paid | $62,305,185 |
Annual Shareholder Report
Federated Hermes Kaufmann Fund
Top Sectors (% of Total Net Assets)
| Value | Value |
|---|
| Energy | 0.2% |
| Utilities | 1.5% |
| Communication Services | 2.2% |
| Consumer Staples | 2.3% |
| Real Estate | 3.6% |
| Materials | 4.0% |
| Financials | 9.6% |
| Consumer Discretionary | 11.0% |
| Industrials | 18.0% |
| Information Technology | 18.1% |
| Health Care | 29.4% |
Following is a summary of material changes made to or planned for the Fund since the beginning of the reporting period. For more complete and current information, you may review the Fund’s disclosure documents on its webpage at FederatedHermes.com/us/FundInformation or upon request at 1-800-341-7400, Option 4, or by contacting your financial advisor.
Effective August 1, 2024, the Fund’s Sub-Adviser, Federated Global Investment Management Corp., became the Fund’s Adviser, replacing Federated Equity Management Company of Pennsylvania. There were no changes to the Fund’s portfolio managers, investment objectives, investment strategies or fees and expenses as a result of the Adviser replacement.
Effective September 30, 2024, Mark Bauknight, Senior Portfolio Manager, retired from the Fund’s Adviser. The other members of the portfolio management team continue to manage the Fund.
Effective January 1, 2025, the Fund’s investment advisory contract with its Adviser is amended to reduce the breakpoint schedule for determining the Fund’s management fee. Effective January 1, 2025, the Fund pays the Adviser a fee at the annual rate of 1.275% on the first $7 billion of the Fund’s average daily net assets, 1.255% on $7 billion - $8 billion of the Fund’s average daily net assets, 1.205% on $8 billion - $9 billion of the Fund’s average daily net assets, 1.155% on $9 billion - $10 billion of the Fund’s average daily net assets and 1.105% of the Fund’s average daily net assets over $10 billion.
Additional Information about the Fund
Additional information is available on the Fund’s website at FederatedHermes.com/us/FundInformation, including its:
• prospectus • financial information • holdings • proxy voting information
CUSIP 314172651
26396-B (12/24)
Federated Securities Corp., Distributor
FederatedHermes.com/us
© 2024 Federated Hermes, Inc.
Federated Hermes Kaufmann Fund
Institutional Shares | KAUIX
Annual Shareholder Report - October 31, 2024
A Portfolio of Federated Hermes Equity Funds
This annual shareholder report contains important information about the Federated Hermes Kaufmann Fund (the "Fund") for the period of November 1, 2023 to October 31, 2024. You can find additional information at FederatedHermes.com/us/FundInformation. You can also request this information by contacting us at 1-800-341-7400, Option 4, or your financial advisor.
This report describes changes made to or planned for the Fund since the beginning of the reporting period.
What were the Fund costs for the last year?
(based on a hypothetical $10,000 investment)
| Class Name | Costs of a $10,000 investment | Costs paid as a percentage of a $10,000 investment |
|---|
| Institutional Shares | $172 | 1.46% |
Management's Discussion of Fund Performance
The following discussion compares the performance of the Fund to the Russell Midcap Growth Index to show how the Fund’s performance compares to the returns of similar investments for the reporting period. See the Average Annual Total Returns table below for the returns of the Fund and related indexes, including the Russell 3000 Index, which represents approximately 98% of investable U.S. equities by market capitalization. The Fund seeks to provide capital appreciation by investing principally in common stocks of small and medium-sized companies that are traded on national securities exchanges, the NASDAQ stock market and on the over-the-counter market.
Top Contributors to Performance
■ By sector, allocation to the Industrials and Financials sectors positively affected Fund relative performance.
■ Top individual Fund holdings that contributed positively to performance included Apollo Global, Blue Owl, Eaton Corp.,
Hamilton Lane, Quanta Services and Trane Technologies.
■ Fund holdings in the Consumer Staples sector also led to outperformance as companies with pricing power were able to pass
price increases through to customers during the reporting period.
Top Detractors from Performance
■ The allocation to the Healthcare sector detracted from Fund relative performance as these stocks lagged the overall market
significantly during the reporting period.
■ By sector, stock selection in Real Estate detracted from Fund relative performance.
■ A top individual Fund holding that detracted from performance was New Fortress Energy, Inc.
Annual Shareholder Report
Federated Hermes Kaufmann Fund
Keep in mind that the Fund’s past performance is not a good predictor of how the Fund will perform in the future. The graph and table do not reflect the deduction of taxes that a shareholder would pay on fund distributions or redemption of fund shares.
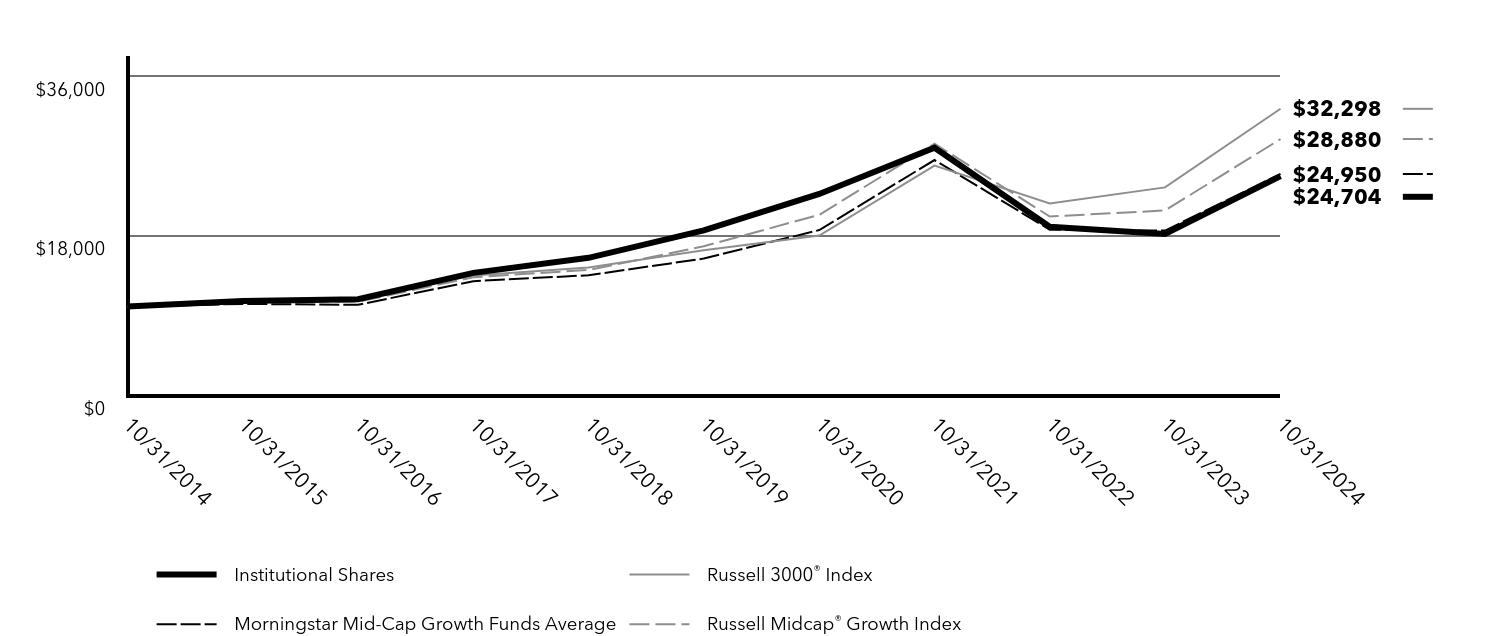
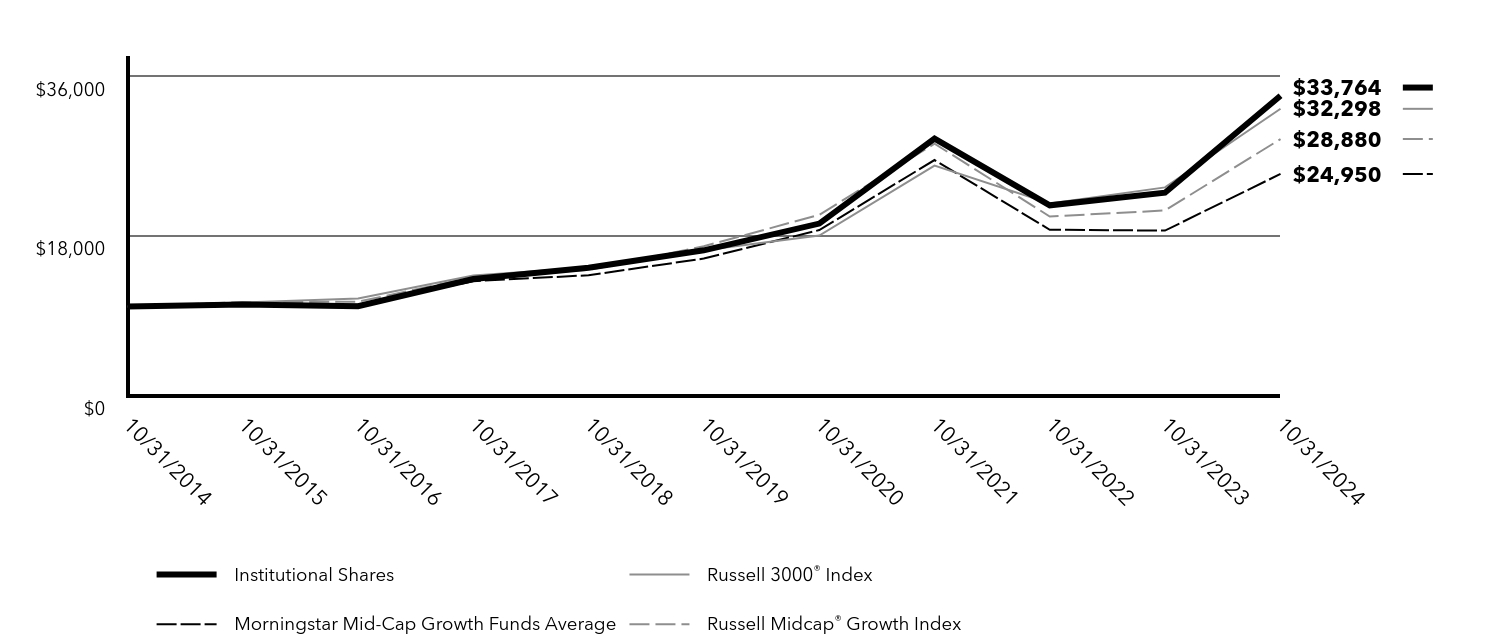
Cumulative Performance: 10/31/2014 to 10/31/2024
Total Return Based on $10,000 Investment
| Institutional Shares | Russell 3000® Index | Morningstar Mid-Cap Growth Funds Average | Russell Midcap® Growth Index |
|---|
| 10/31/2014 | $10,000 | $10,000 | $10,000 | $10,000 |
| 10/31/2015 | $10,628 | $10,449 | $10,288 | $10,494 |
| 10/31/2016 | $10,815 | $10,892 | $10,193 | $10,536 |
| 10/31/2017 | $13,794 | $13,504 | $12,856 | $13,301 |
| 10/31/2018 | $15,490 | $14,395 | $13,522 | $14,118 |
| 10/31/2019 | $18,584 | $16,337 | $15,407 | $16,790 |
| 10/31/2020 | $22,693 | $17,995 | $18,615 | $20,339 |
| 10/31/2021 | $27,904 | $25,894 | $26,515 | $28,358 |
| 10/31/2022 | $18,984 | $21,617 | $18,653 | $20,151 |
| 10/31/2023 | $18,183 | $23,429 | $18,560 | $20,826 |
| 10/31/2024 | $24,704 | $32,298 | $24,950 | $28,880 |
Average Annual Total Returns
| Fund/Index | 1 Year | 5 Years | 10 Years |
|---|
| Institutional Shares | 35.86% | 5.86% | 9.47% |
Russell 3000®IndexFootnote Reference* | 37.86% | 14.60% | 12.44% |
Russell Midcap® Growth Index | 38.67% | 11.45% | 11.19% |
| Morningstar Mid-Cap Growth Funds Average | 34.44% | 10.17% | 9.55% |
| Footnote | Description |
Footnote* | The Fund has designated the Russell 3000® Index as its new broad-based securities market index in accordance with the SEC’s revised definition for such an index. |
Visit FederatedHermes.com/us/FundInformation and click on the link to your fund and share class for more recent performance information.
| Net Assets | $5,002,105,855 |
| Number of Investments | 157 |
| Portfolio Turnover | 34% |
| Total Advisory Fees Paid | $62,305,185 |
Annual Shareholder Report
Federated Hermes Kaufmann Fund
Top Sectors (% of Total Net Assets)
| Value | Value |
|---|
| Energy | 0.2% |
| Utilities | 1.5% |
| Communication Services | 2.2% |
| Consumer Staples | 2.3% |
| Real Estate | 3.6% |
| Materials | 4.0% |
| Financials | 9.6% |
| Consumer Discretionary | 11.0% |
| Industrials | 18.0% |
| Information Technology | 18.1% |
| Health Care | 29.4% |
Following is a summary of material changes made to or planned for the Fund since the beginning of the reporting period. For more complete and current information, you may review the Fund’s disclosure documents on its webpage at FederatedHermes.com/us/FundInformation or upon request at 1-800-341-7400, Option 4, or by contacting your financial advisor.
Effective August 1, 2024, the Fund’s Sub-Adviser, Federated Global Investment Management Corp., became the Fund’s Adviser, replacing Federated Equity Management Company of Pennsylvania. There were no changes to the Fund’s portfolio managers, investment objectives, investment strategies or fees and expenses as a result of the Adviser replacement.
Effective September 30, 2024, Mark Bauknight, Senior Portfolio Manager, retired from the Fund’s Adviser. The other members of the portfolio management team continue to manage the Fund.
Effective January 1, 2025, the Fund’s investment advisory contract with its Adviser is amended to reduce the breakpoint schedule for determining the Fund’s management fee. Effective January 1, 2025, the Fund pays the Adviser a fee at the annual rate of 1.275% on the first $7 billion of the Fund’s average daily net assets, 1.255% on $7 billion - $8 billion of the Fund’s average daily net assets, 1.205% on $8 billion - $9 billion of the Fund’s average daily net assets, 1.155% on $9 billion - $10 billion of the Fund’s average daily net assets and 1.105% of the Fund’s average daily net assets over $10 billion.
Additional Information about the Fund
Additional information is available on the Fund’s website at FederatedHermes.com/us/FundInformation, including its:
• prospectus • financial information • holdings • proxy voting information
CUSIP 31421N873
26396-D (12/24)
Federated Securities Corp., Distributor
FederatedHermes.com/us
© 2024 Federated Hermes, Inc.
Federated Hermes Kaufmann Fund
Annual Shareholder Report - October 31, 2024
A Portfolio of Federated Hermes Equity Funds
This annual shareholder report contains important information about the Federated Hermes Kaufmann Fund (the "Fund") for the period of November 1, 2023 to October 31, 2024. You can find additional information at FederatedHermes.com/us/FundInformation. You can also request this information by contacting us at 1-800-341-7400, Option 4, or your financial advisor.
This report describes changes made to or planned for the Fund since the beginning of the reporting period.
What were the Fund costs for the last year?
(based on a hypothetical $10,000 investment)
| Class Name | Costs of a $10,000 investment | Costs paid as a percentage of a $10,000 investment |
|---|
| Class R Shares | $229 | 1.95% |
Management's Discussion of Fund Performance
The following discussion compares the performance of the Fund to the Russell Midcap Growth Index to show how the Fund’s performance compares to the returns of similar investments for the reporting period. See the Average Annual Total Returns table below for the returns of the Fund and related indexes, including the Russell 3000 Index, which represents approximately 98% of investable U.S. equities by market capitalization. The Fund seeks to provide capital appreciation by investing principally in common stocks of small and medium-sized companies that are traded on national securities exchanges, the NASDAQ stock market and on the over-the-counter market.
Top Contributors to Performance
■ By sector, allocation to the Industrials and Financials sectors positively affected Fund relative performance.
■ Top individual Fund holdings that contributed positively to performance included Apollo Global, Blue Owl, Eaton Corp.,
Hamilton Lane, Quanta Services and Trane Technologies.
■ Fund holdings in the Consumer Staples sector also led to outperformance as companies with pricing power were able to pass
price increases through to customers during the reporting period.
Top Detractors from Performance
■ The allocation to the Healthcare sector detracted from Fund relative performance as these stocks lagged the overall market
significantly during the reporting period.
■ By sector, stock selection in Real Estate detracted from Fund relative performance.
■ A top individual Fund holding that detracted from performance was New Fortress Energy, Inc.
Annual Shareholder Report
Federated Hermes Kaufmann Fund
Keep in mind that the Fund’s past performance is not a good predictor of how the Fund will perform in the future. The graph and table do not reflect the deduction of taxes that a shareholder would pay on fund distributions or redemption of fund shares.
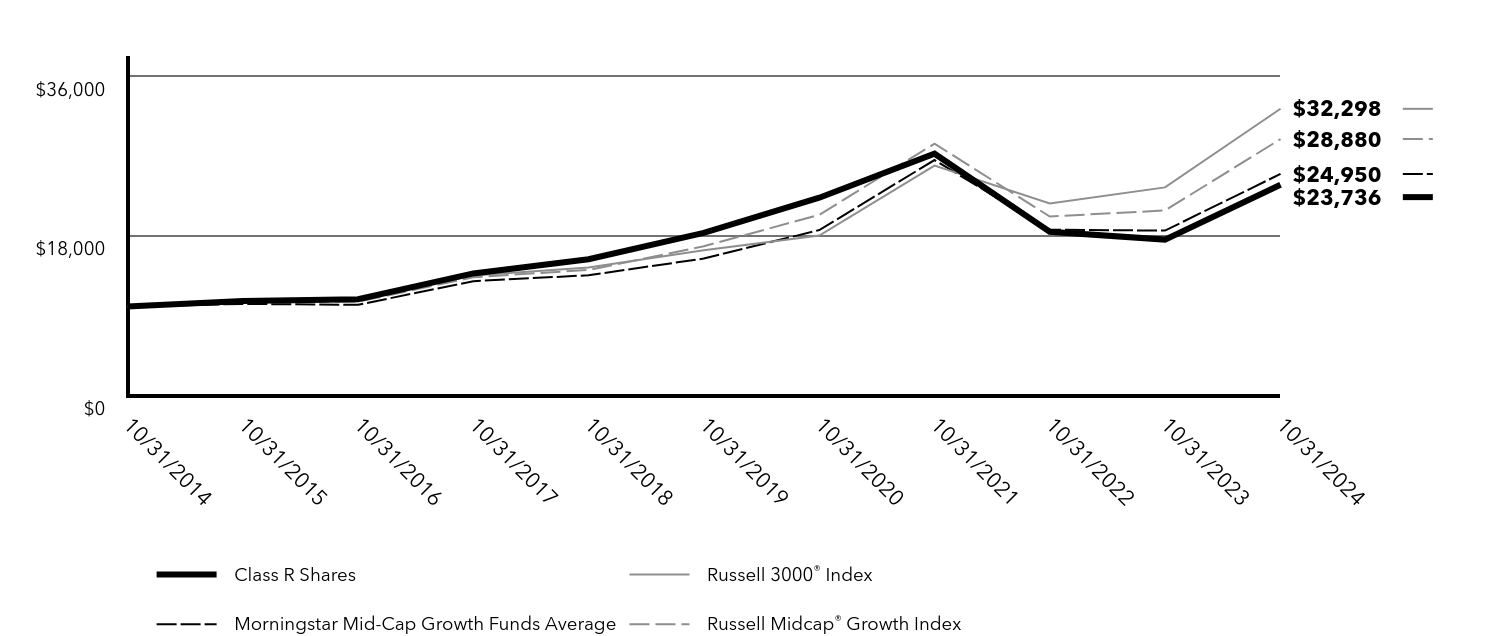
Cumulative Performance: 10/31/2014 to 10/31/2024
Total Return Based on $10,000 Investment
| Class R Shares | Russell 3000® Index | Morningstar Mid-Cap Growth Funds Average | Russell Midcap® Growth Index |
|---|
| 10/31/2014 | $10,000 | $10,000 | $10,000 | $10,000 |
| 10/31/2015 | $10,628 | $10,449 | $10,288 | $10,494 |
| 10/31/2016 | $10,815 | $10,892 | $10,193 | $10,536 |
| 10/31/2017 | $13,726 | $13,504 | $12,856 | $13,301 |
| 10/31/2018 | $15,322 | $14,395 | $13,522 | $14,118 |
| 10/31/2019 | $18,306 | $16,337 | $15,407 | $16,790 |
| 10/31/2020 | $22,267 | $17,995 | $18,615 | $20,339 |
| 10/31/2021 | $27,232 | $25,894 | $26,515 | $28,358 |
| 10/31/2022 | $18,426 | $21,617 | $18,653 | $20,151 |
| 10/31/2023 | $17,542 | $23,429 | $18,560 | $20,826 |
| 10/31/2024 | $23,736 | $32,298 | $24,950 | $28,880 |
Average Annual Total Returns
| Fund/Index | 1 Year | 5 Years | 10 Years |
|---|
| Class R Shares | 35.31% | 5.33% | 9.03% |
Russell 3000®IndexFootnote Reference* | 37.86% | 14.60% | 12.44% |
Russell Midcap® Growth Index | 38.67% | 11.45% | 11.19% |
| Morningstar Mid-Cap Growth Funds Average | 34.44% | 10.17% | 9.55% |
| Footnote | Description |
Footnote* | The Fund has designated the Russell 3000® Index as its new broad-based securities market index in accordance with the SEC’s revised definition for such an index. |
Visit FederatedHermes.com/us/FundInformation and click on the link to your fund and share class for more recent performance information.
| Net Assets | $5,002,105,855 |
| Number of Investments | 157 |
| Portfolio Turnover | 34% |
| Total Advisory Fees Paid | $62,305,185 |
Annual Shareholder Report
Federated Hermes Kaufmann Fund
Top Sectors (% of Total Net Assets)
| Value | Value |
|---|
| Energy | 0.2% |
| Utilities | 1.5% |
| Communication Services | 2.2% |
| Consumer Staples | 2.3% |
| Real Estate | 3.6% |
| Materials | 4.0% |
| Financials | 9.6% |
| Consumer Discretionary | 11.0% |
| Industrials | 18.0% |
| Information Technology | 18.1% |
| Health Care | 29.4% |
Following is a summary of material changes made to or planned for the Fund since the beginning of the reporting period. For more complete and current information, you may review the Fund’s disclosure documents on its webpage at FederatedHermes.com/us/FundInformation or upon request at 1-800-341-7400, Option 4, or by contacting your financial advisor.
Effective August 1, 2024, the Fund’s Sub-Adviser, Federated Global Investment Management Corp., became the Fund’s Adviser, replacing Federated Equity Management Company of Pennsylvania. There were no changes to the Fund’s portfolio managers, investment objectives, investment strategies or fees and expenses as a result of the Adviser replacement.
Effective September 30, 2024, Mark Bauknight, Senior Portfolio Manager, retired from the Fund’s Adviser. The other members of the portfolio management team continue to manage the Fund.
Effective January 1, 2025, the Fund’s investment advisory contract with its Adviser is amended to reduce the breakpoint schedule for determining the Fund’s management fee. Effective January 1, 2025, the Fund pays the Adviser a fee at the annual rate of 1.275% on the first $7 billion of the Fund’s average daily net assets, 1.255% on $7 billion - $8 billion of the Fund’s average daily net assets, 1.205% on $8 billion - $9 billion of the Fund’s average daily net assets, 1.155% on $9 billion - $10 billion of the Fund’s average daily net assets and 1.105% of the Fund’s average daily net assets over $10 billion.
Additional Information about the Fund
Additional information is available on the Fund’s website at FederatedHermes.com/us/FundInformation, including its:
• prospectus • financial information • holdings • proxy voting information
CUSIP 314172644
26396-C (12/24)
Federated Securities Corp., Distributor
FederatedHermes.com/us
© 2024 Federated Hermes, Inc.
Federated Hermes Kaufmann Large Cap Fund
Annual Shareholder Report - October 31, 2024
A Portfolio of Federated Hermes Equity Funds
This annual shareholder report contains important information about the Federated Hermes Kaufmann Large Cap Fund (the "Fund") for the period of November 1, 2023 to October 31, 2024. You can find additional information at FederatedHermes.com/us/FundInformation. You can also request this information by contacting us at 1-800-341-7400, Option 4, or your financial advisor.
This report describes changes made to the Fund during the reporting period.
What were the Fund costs for the last year?
(based on a hypothetical $10,000 investment)
| Class Name | Costs of a $10,000 investment | Costs paid as a percentage of a $10,000 investment |
|---|
| Class A Shares | $128 | 1.08% |
Management's Discussion of Fund Performance
The following discussion compares the performance of the Fund to the Russell 1000 Growth Index to show how the Fund’s performance compares to the returns of similar investments for the reporting period. See the Average Annual Total Returns table below for the returns of the Fund and related indexes, including the Russell 3000 Index, which represents approximately 98% of investable U.S. equities by market capitalization. The Fund seeks to provide capital appreciation by investing primarily in securities of large-cap companies traded on national security exchanges, the NASDAQ stock market and on the over-the-counter market.
Top Contributors to Performance
■ By sector, allocations to Consumer Staples, Industrials and Materials positively affected Fund relative performance.
■ The Materials sector contributed to performance of the Fund as inflation persisted which benefitted Fund holdings like Sherwin
Williams and Ecolab which were able to pass along pricing with a profit margin boost.
■ Top individual Fund holdings that contributed positively to performance included BlackRock, Inc., Costco, Eaton Corp., Quanta Services and Trane Technologies.
Top Detractors from Performance
■ Stock selection in the Healthcare and Communication Services sectors detracted the most from Fund relative performance.
■ The allocation to the Technology sector was a laggard for the Fund as the underweight to the sector and stock selection detracted
from Fund relative performance.
Annual Shareholder Report
Federated Hermes Kaufmann Large Cap Fund
Keep in mind that the Fund’s past performance is not a good predictor of how the Fund will perform in the future. The graph and table do not reflect the deduction of taxes that a shareholder would pay on fund distributions or redemption of fund shares.
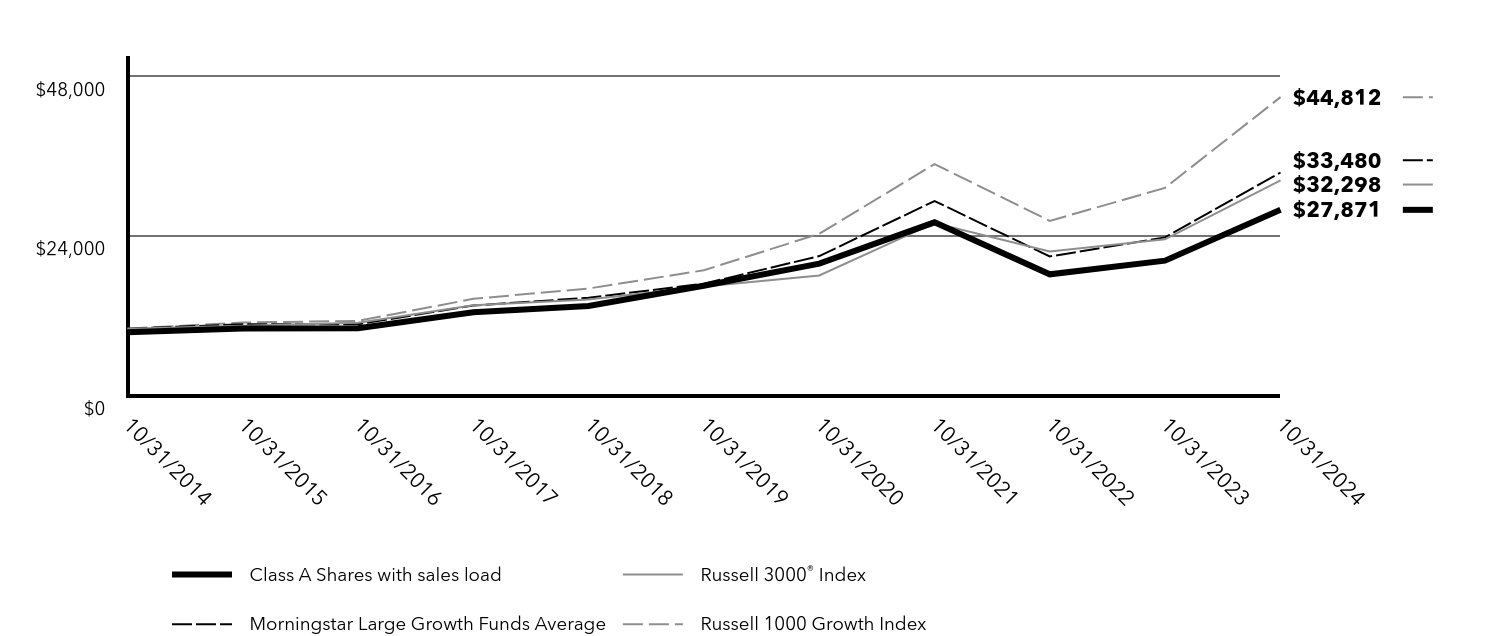
Cumulative Performance: 10/31/2014 to 10/31/2024
Total Return Based on $10,000 Investment
| Class A Shares with sales load | Russell 3000® Index | Morningstar Large Growth Funds Average | Russell 1000 Growth Index |
|---|
| 10/31/2014 | $9,450 | $10,000 | $10,000 | $10,000 |
| 10/31/2015 | $10,030 | $10,449 | $10,657 | $10,918 |
| 10/31/2016 | $10,063 | $10,892 | $10,649 | $11,167 |
| 10/31/2017 | $12,474 | $13,504 | $13,484 | $14,485 |
| 10/31/2018 | $13,404 | $14,395 | $14,641 | $16,037 |
| 10/31/2019 | $16,455 | $16,337 | $16,756 | $18,779 |
| 10/31/2020 | $19,770 | $17,995 | $20,913 | $24,267 |
| 10/31/2021 | $25,989 | $25,894 | $29,194 | $34,752 |
| 10/31/2022 | $18,166 | $21,617 | $20,852 | $26,204 |
| 10/31/2023 | $20,224 | $23,429 | $23,726 | $31,170 |
| 10/31/2024 | $27,871 | $32,298 | $33,480 | $44,812 |
Average Annual Total Returns
| Fund/Index | 1 Year | 5 Years | 10 Years |
|---|
| Class A Shares with sales load | 30.25% | 9.87% | 10.79% |
| Class A Shares without sales load | 37.81% | 11.11% | 11.42% |
Russell 3000®IndexFootnote Reference* | 37.86% | 14.60% | 12.44% |
| Russell 1000 Growth Index | 43.77% | 18.99% | 16.18% |
| Morningstar Large Growth Funds Average | 41.03% | 14.86% | 12.85% |
| Footnote | Description |
Footnote* | The Fund has designated the Russell 3000® Index as its new broad-based securities market index in accordance with the SEC’s revised definition for such an index. |
Visit FederatedHermes.com/us/FundInformation and click on the link to your fund and share class for more recent performance information.
| Net Assets | $1,469,656,500 |
| Number of Investments | 55 |
| Portfolio Turnover | 18% |
| Total Advisory Fees Paid | $10,135,361 |
Annual Shareholder Report
Federated Hermes Kaufmann Large Cap Fund
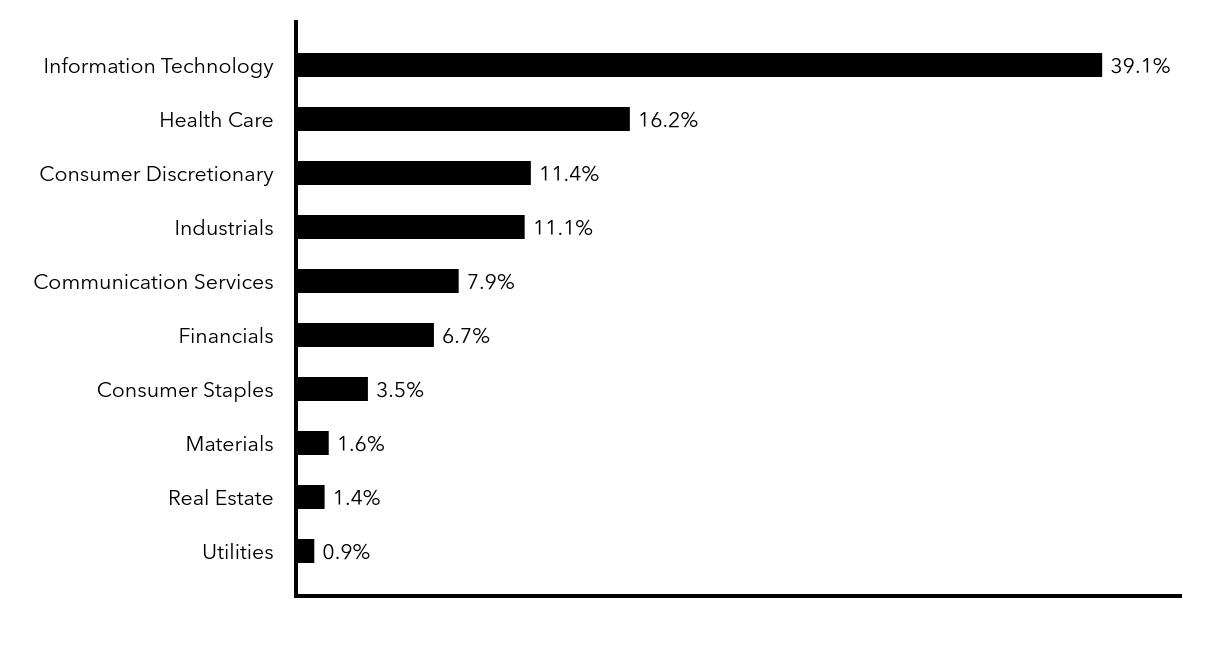
Top Sectors (% of Total Net Assets)
| Value | Value |
|---|
| Utilities | 0.9% |
| Real Estate | 1.4% |
| Materials | 1.6% |
| Consumer Staples | 3.5% |
| Financials | 6.7% |
| Communication Services | 7.9% |
| Industrials | 11.1% |
| Consumer Discretionary | 11.4% |
| Health Care | 16.2% |
| Information Technology | 39.1% |
Following is a summary of material changes made to the Fund during the reporting period. For more complete and current information, you may review the Fund’s disclosure documents on its webpage at FederatedHermes.com/us/FundInformation or upon request at 1-800-341-7400, Option 4, or by contacting your financial advisor.
Effective July 1, 2024, the Fund’s annual investment advisory fee payable to its investment adviser is reduced from 0.75% to 0.74% of the Fund’s average daily net assets.
Effective August 1, 2024, the Fund’s Sub-Adviser, Federated Global Investment Management Corp., became the Fund’s Adviser, replacing Federated Equity Management Company of Pennsylvania. There were no changes to the Fund’s portfolio managers, investment objectives, investment strategies or fees and expenses as a result of the Adviser replacement.
Effective September 30, 2024, Mark Bauknight, Senior Portfolio Manager, retired from the Fund’s Adviser. The other members of the portfolio management team continue to manage the Fund.
Additional Information about the Fund
Additional information is available on the Fund’s website at FederatedHermes.com/us/FundInformation, including its:
• prospectus • financial information • holdings • proxy voting information
CUSIP 314172446
39667-A (12/24)
Federated Securities Corp., Distributor
FederatedHermes.com/us
© 2024 Federated Hermes, Inc.
Federated Hermes Kaufmann Large Cap Fund
Annual Shareholder Report - October 31, 2024
A Portfolio of Federated Hermes Equity Funds
This annual shareholder report contains important information about the Federated Hermes Kaufmann Large Cap Fund (the "Fund") for the period of November 1, 2023 to October 31, 2024. You can find additional information at FederatedHermes.com/us/FundInformation. You can also request this information by contacting us at 1-800-341-7400, Option 4, or your financial advisor.
This report describes changes made to the Fund during the reporting period.
What were the Fund costs for the last year?
(based on a hypothetical $10,000 investment)
| Class Name | Costs of a $10,000 investment | Costs paid as a percentage of a $10,000 investment |
|---|
| Class C Shares | $221 | 1.87% |
Management's Discussion of Fund Performance
The following discussion compares the performance of the Fund to the Russell 1000 Growth Index to show how the Fund’s performance compares to the returns of similar investments for the reporting period. See the Average Annual Total Returns table below for the returns of the Fund and related indexes, including the Russell 3000 Index, which represents approximately 98% of investable U.S. equities by market capitalization. The Fund seeks to provide capital appreciation by investing primarily in securities of large-cap companies traded on national security exchanges, the NASDAQ stock market and on the over-the-counter market.
Top Contributors to Performance
■ By sector, allocations to Consumer Staples, Industrials and Materials positively affected Fund relative performance.
■ The Materials sector contributed to performance of the Fund as inflation persisted which benefitted Fund holdings like Sherwin
Williams and Ecolab which were able to pass along pricing with a profit margin boost.
■ Top individual Fund holdings that contributed positively to performance included BlackRock, Inc., Costco, Eaton Corp., Quanta Services and Trane Technologies.
Top Detractors from Performance
■ Stock selection in the Healthcare and Communication Services sectors detracted the most from Fund relative performance.
■ The allocation to the Technology sector was a laggard for the Fund as the underweight to the sector and stock selection detracted
from Fund relative performance.
Annual Shareholder Report
Federated Hermes Kaufmann Large Cap Fund
Keep in mind that the Fund’s past performance is not a good predictor of how the Fund will perform in the future. The graph and table do not reflect the deduction of taxes that a shareholder would pay on fund distributions or redemption of fund shares.
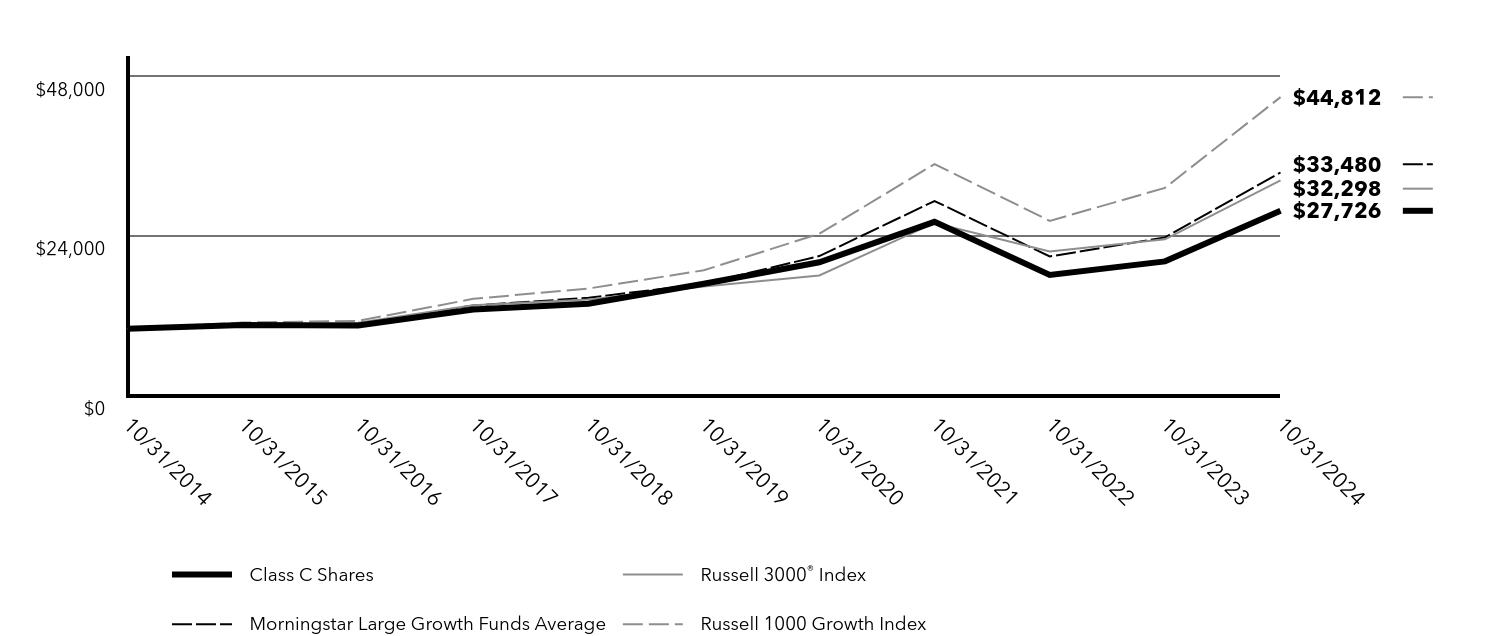
Cumulative Performance: 10/31/2014 to 10/31/2024
Total Return Based on $10,000 Investment
| Class C Shares | Russell 3000® Index | Morningstar Large Growth Funds Average | Russell 1000 Growth Index |
|---|
| 10/31/2014 | $10,000 | $10,000 | $10,000 | $10,000 |
| 10/31/2015 | $10,534 | $10,449 | $10,657 | $10,918 |
| 10/31/2016 | $10,487 | $10,892 | $10,649 | $11,167 |
| 10/31/2017 | $12,894 | $13,504 | $13,484 | $14,485 |
| 10/31/2018 | $13,751 | $14,395 | $14,641 | $16,037 |
| 10/31/2019 | $16,755 | $16,337 | $16,756 | $18,779 |
| 10/31/2020 | $19,974 | $17,995 | $20,913 | $24,267 |
| 10/31/2021 | $26,061 | $25,894 | $29,194 | $34,752 |
| 10/31/2022 | $18,071 | $21,617 | $20,852 | $26,204 |
| 10/31/2023 | $20,119 | $23,429 | $23,726 | $31,170 |
| 10/31/2024 | $27,726 | $32,298 | $33,480 | $44,812 |
Average Annual Total Returns
| Fund/Index | 1 Year | 5 Years | 10 Years |
|---|
| Class C Shares with sales load | 35.87% | 10.26% | 10.74% |
| Class C Shares without sales load | 36.81% | 10.26% | 10.74% |
Russell 3000®IndexFootnote Reference* | 37.86% | 14.60% | 12.44% |
| Russell 1000 Growth Index | 43.77% | 18.99% | 16.18% |
| Morningstar Large Growth Funds Average | 41.03% | 14.86% | 12.85% |
| Footnote | Description |
Footnote* | The Fund has designated the Russell 3000® Index as its new broad-based securities market index in accordance with the SEC’s revised definition for such an index. |
Visit FederatedHermes.com/us/FundInformation and click on the link to your fund and share class for more recent performance information.
| Net Assets | $1,469,656,500 |
| Number of Investments | 55 |
| Portfolio Turnover | 18% |
| Total Advisory Fees Paid | $10,135,361 |
Annual Shareholder Report
Federated Hermes Kaufmann Large Cap Fund
Top Sectors (% of Total Net Assets)
| Value | Value |
|---|
| Utilities | 0.9% |
| Real Estate | 1.4% |
| Materials | 1.6% |
| Consumer Staples | 3.5% |
| Financials | 6.7% |
| Communication Services | 7.9% |
| Industrials | 11.1% |
| Consumer Discretionary | 11.4% |
| Health Care | 16.2% |
| Information Technology | 39.1% |
Following is a summary of material changes made to the Fund during the reporting period. For more complete and current information, you may review the Fund’s disclosure documents on its webpage at FederatedHermes.com/us/FundInformation or upon request at 1-800-341-7400, Option 4, or by contacting your financial advisor.
Effective July 1, 2024, the Fund’s annual investment advisory fee payable to its investment adviser is reduced from 0.75% to 0.74% of the Fund’s average daily net assets.
Effective August 1, 2024, the Fund’s Sub-Adviser, Federated Global Investment Management Corp., became the Fund’s Adviser, replacing Federated Equity Management Company of Pennsylvania. There were no changes to the Fund’s portfolio managers, investment objectives, investment strategies or fees and expenses as a result of the Adviser replacement.
Effective September 30, 2024, Mark Bauknight, Senior Portfolio Manager, retired from the Fund’s Adviser. The other members of the portfolio management team continue to manage the Fund.
Additional Information about the Fund
Additional information is available on the Fund’s website at FederatedHermes.com/us/FundInformation, including its:
• prospectus • financial information • holdings • proxy voting information
CUSIP 314172438
39667-B (12/24)
Federated Securities Corp., Distributor
FederatedHermes.com/us
© 2024 Federated Hermes, Inc.
Federated Hermes Kaufmann Large Cap Fund
Annual Shareholder Report - October 31, 2024
A Portfolio of Federated Hermes Equity Funds
This annual shareholder report contains important information about the Federated Hermes Kaufmann Large Cap Fund (the "Fund") for the period of November 1, 2023 to October 31, 2024. You can find additional information at FederatedHermes.com/us/FundInformation. You can also request this information by contacting us at 1-800-341-7400, Option 4, or your financial advisor.
This report describes changes made to the Fund during the reporting period.
What were the Fund costs for the last year?
(based on a hypothetical $10,000 investment)
| Class Name | Costs of a $10,000 investment | Costs paid as a percentage of a $10,000 investment |
|---|
| Class R6 Shares | $92 | 0.77% |
Management's Discussion of Fund Performance
The following discussion compares the performance of the Fund to the Russell 1000 Growth Index to show how the Fund’s performance compares to the returns of similar investments for the reporting period. See the Average Annual Total Returns table below for the returns of the Fund and related indexes, including the Russell 3000 Index, which represents approximately 98% of investable U.S. equities by market capitalization. The Fund seeks to provide capital appreciation by investing primarily in securities of large-cap companies traded on national security exchanges, the NASDAQ stock market and on the over-the-counter market.
Top Contributors to Performance
■ By sector, allocations to Consumer Staples, Industrials and Materials positively affected Fund relative performance.
■ The Materials sector contributed to performance of the Fund as inflation persisted which benefitted Fund holdings like Sherwin
Williams and Ecolab which were able to pass along pricing with a profit margin boost.
■ Top individual Fund holdings that contributed positively to performance included BlackRock, Inc., Costco, Eaton Corp., Quanta Services and Trane Technologies.
Top Detractors from Performance
■ Stock selection in the Healthcare and Communication Services sectors detracted the most from Fund relative performance.
■ The allocation to the Technology sector was a laggard for the Fund as the underweight to the sector and stock selection detracted
from Fund relative performance.
Annual Shareholder Report
Federated Hermes Kaufmann Large Cap Fund
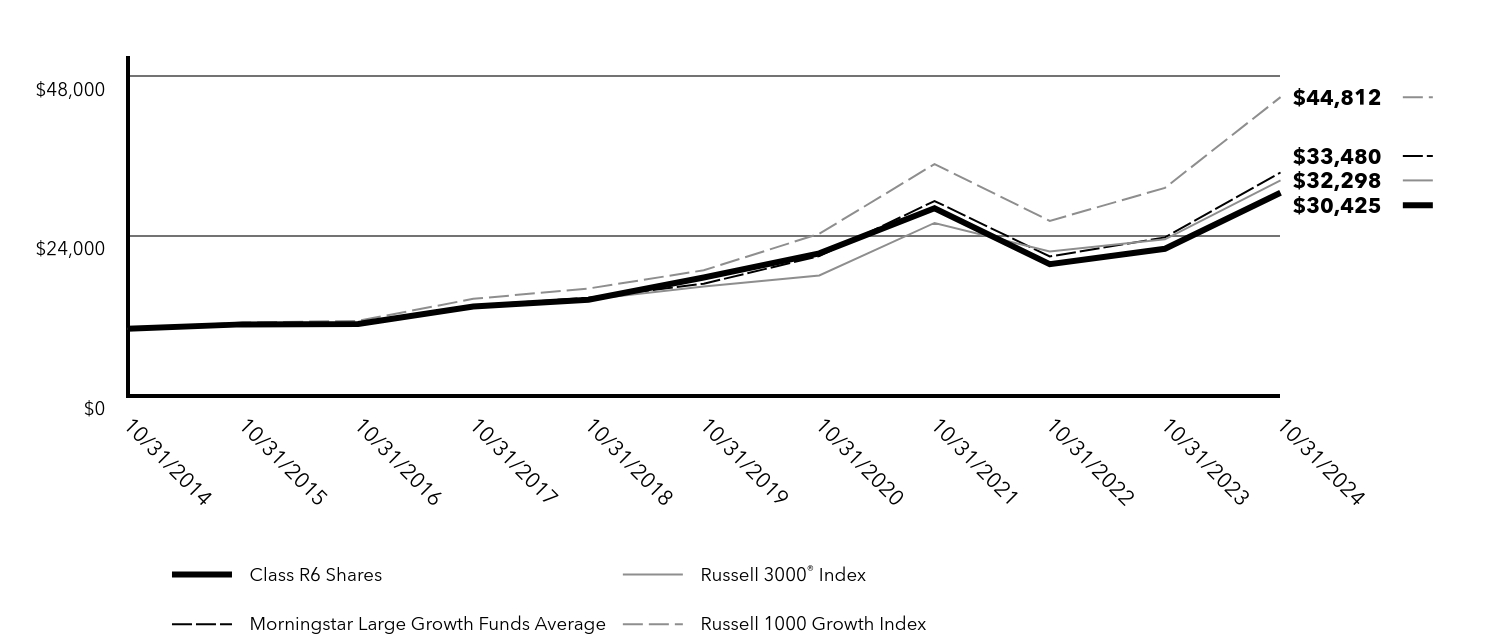
Keep in mind that the Fund’s past performance is not a good predictor of how the Fund will perform in the future. The graph and table do not reflect the deduction of taxes that a shareholder would pay on fund distributions or redemption of fund shares.
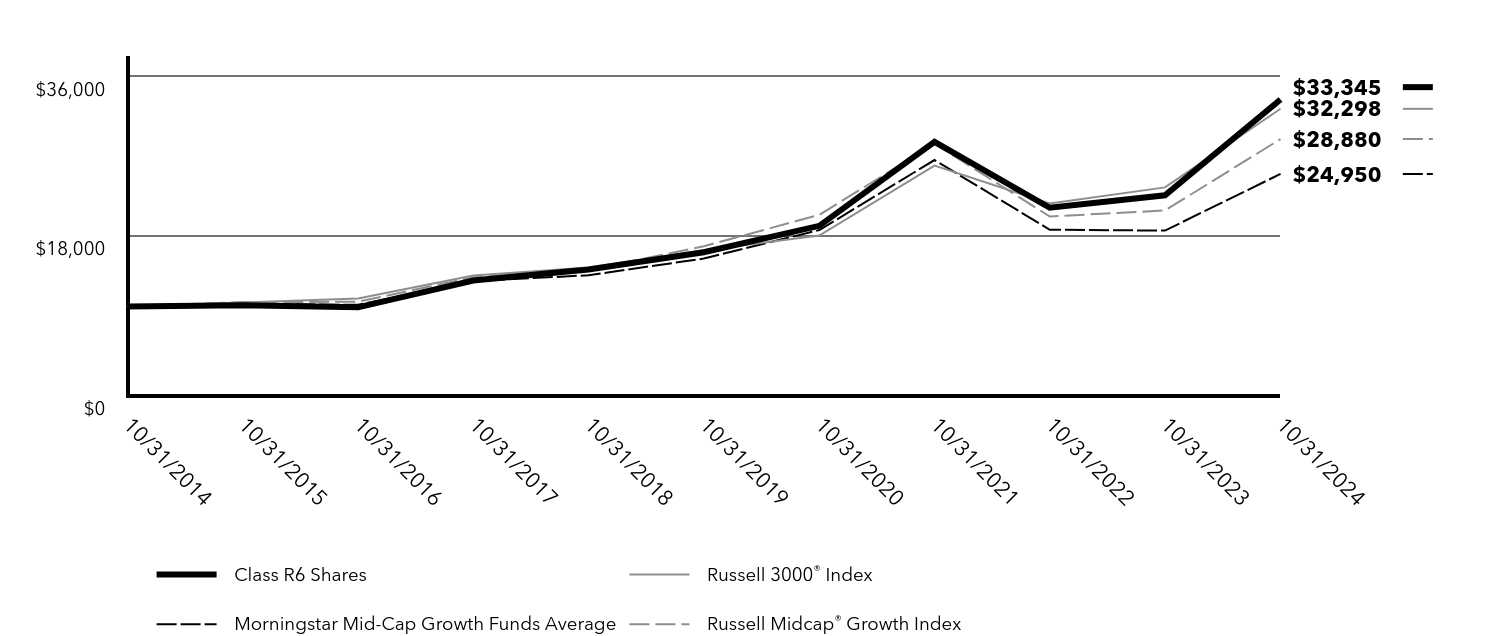
Cumulative Performance: 10/31/2014 to 10/31/2024
Total Return Based on $10,000 Investment
| Class R6 Shares | Russell 3000® Index | Morningstar Large Growth Funds Average | Russell 1000 Growth Index |
|---|
| 10/31/2014 | $10,000 | $10,000 | $10,000 | $10,000 |
| 10/31/2015 | $10,643 | $10,449 | $10,657 | $10,918 |
| 10/31/2016 | $10,716 | $10,892 | $10,649 | $11,167 |
| 10/31/2017 | $13,320 | $13,504 | $13,484 | $14,485 |
| 10/31/2018 | $14,358 | $14,395 | $14,641 | $16,037 |
| 10/31/2019 | $17,685 | $16,337 | $16,756 | $18,779 |
| 10/31/2020 | $21,313 | $17,995 | $20,913 | $24,267 |
| 10/31/2021 | $28,103 | $25,894 | $29,194 | $34,752 |
| 10/31/2022 | $19,705 | $21,617 | $20,852 | $26,204 |
| 10/31/2023 | $22,006 | $23,429 | $23,726 | $31,170 |
| 10/31/2024 | $30,425 | $32,298 | $33,480 | $44,812 |
Average Annual Total Returns
| Fund/Index | 1 Year | 5 Years | 10 Years |
|---|
| Class R6 Shares | 38.26% | 11.46% | 11.77% |
Russell 3000®IndexFootnote Reference* | 37.86% | 14.60% | 12.44% |
| Russell 1000 Growth Index | 43.77% | 18.99% | 16.18% |
| Morningstar Large Growth Funds Average | 41.03% | 14.86% | 12.85% |
| Footnote | Description |
Footnote* | The Fund has designated the Russell 3000® Index as its new broad-based securities market index in accordance with the SEC’s revised definition for such an index. |
Visit FederatedHermes.com/us/FundInformation and click on the link to your fund and share class for more recent performance information.
| Net Assets | $1,469,656,500 |
| Number of Investments | 55 |
| Portfolio Turnover | 18% |
| Total Advisory Fees Paid | $10,135,361 |
Annual Shareholder Report
Federated Hermes Kaufmann Large Cap Fund
Top Sectors (% of Total Net Assets)
| Value | Value |
|---|
| Utilities | 0.9% |
| Real Estate | 1.4% |
| Materials | 1.6% |
| Consumer Staples | 3.5% |
| Financials | 6.7% |
| Communication Services | 7.9% |
| Industrials | 11.1% |
| Consumer Discretionary | 11.4% |
| Health Care | 16.2% |
| Information Technology | 39.1% |
Following is a summary of material changes made to the Fund during the reporting period. For more complete and current information, you may review the Fund’s disclosure documents on its webpage at FederatedHermes.com/us/FundInformation or upon request at 1-800-341-7400, Option 4, or by contacting your financial advisor.
Effective July 1, 2024, the Fund’s annual investment advisory fee payable to its investment adviser is reduced from 0.75% to 0.74% of the Fund’s average daily net assets.
Effective August 1, 2024, the Fund’s Sub-Adviser, Federated Global Investment Management Corp., became the Fund’s Adviser, replacing Federated Equity Management Company of Pennsylvania. There were no changes to the Fund’s portfolio managers, investment objectives, investment strategies or fees and expenses as a result of the Adviser replacement.
Effective September 30, 2024, Mark Bauknight, Senior Portfolio Manager, retired from the Fund’s Adviser. The other members of the portfolio management team continue to manage the Fund.
Additional Information about the Fund
Additional information is available on the Fund’s website at FederatedHermes.com/us/FundInformation, including its:
• prospectus • financial information • holdings • proxy voting information
CUSIP 314172131
39667-E (12/24)
Federated Securities Corp., Distributor
FederatedHermes.com/us
© 2024 Federated Hermes, Inc.
Federated Hermes Kaufmann Large Cap Fund
Institutional Shares | KLCIX
Annual Shareholder Report - October 31, 2024
A Portfolio of Federated Hermes Equity Funds
This annual shareholder report contains important information about the Federated Hermes Kaufmann Large Cap Fund (the "Fund") for the period of November 1, 2023 to October 31, 2024. You can find additional information at FederatedHermes.com/us/FundInformation. You can also request this information by contacting us at 1-800-341-7400, Option 4, or your financial advisor.
This report describes changes made to the Fund during the reporting period.
What were the Fund costs for the last year?
(based on a hypothetical $10,000 investment)
| Class Name | Costs of a $10,000 investment | Costs paid as a percentage of a $10,000 investment |
|---|
| Institutional Shares | $99 | 0.83% |
Management's Discussion of Fund Performance
The following discussion compares the performance of the Fund to the Russell 1000 Growth Index to show how the Fund’s performance compares to the returns of similar investments for the reporting period. See the Average Annual Total Returns table below for the returns of the Fund and related indexes, including the Russell 3000 Index, which represents approximately 98% of investable U.S. equities by market capitalization. The Fund seeks to provide capital appreciation by investing primarily in securities of large-cap companies traded on national security exchanges, the NASDAQ stock market and on the over-the-counter market.
Top Contributors to Performance
■ By sector, allocations to Consumer Staples, Industrials and Materials positively affected Fund relative performance.
■ The Materials sector contributed to performance of the Fund as inflation persisted which benefitted Fund holdings like Sherwin
Williams and Ecolab which were able to pass along pricing with a profit margin boost.
■ Top individual Fund holdings that contributed positively to performance included BlackRock, Inc., Costco, Eaton Corp., Quanta Services and Trane Technologies.
Top Detractors from Performance
■ Stock selection in the Healthcare and Communication Services sectors detracted the most from Fund relative performance.
■ The allocation to the Technology sector was a laggard for the Fund as the underweight to the sector and stock selection detracted
from Fund relative performance.
Annual Shareholder Report
Federated Hermes Kaufmann Large Cap Fund
Keep in mind that the Fund’s past performance is not a good predictor of how the Fund will perform in the future. The graph and table do not reflect the deduction of taxes that a shareholder would pay on fund distributions or redemption of fund shares.
Cumulative Performance: 10/31/2014 to 10/31/2024
Total Return Based on $10,000 Investment
| Institutional Shares | Russell 3000® Index | Morningstar Large Growth Funds Average | Russell 1000 Growth Index |
|---|
| 10/31/2014 | $10,000 | $10,000 | $10,000 | $10,000 |
| 10/31/2015 | $10,638 | $10,449 | $10,657 | $10,918 |
| 10/31/2016 | $10,700 | $10,892 | $10,649 | $11,167 |
| 10/31/2017 | $13,300 | $13,504 | $13,484 | $14,485 |
| 10/31/2018 | $14,326 | $14,395 | $14,641 | $16,037 |
| 10/31/2019 | $17,631 | $16,337 | $16,756 | $18,779 |
| 10/31/2020 | $21,238 | $17,995 | $20,913 | $24,267 |
| 10/31/2021 | $27,988 | $25,894 | $29,194 | $34,752 |
| 10/31/2022 | $19,612 | $21,617 | $20,852 | $26,204 |
| 10/31/2023 | $21,885 | $23,429 | $23,726 | $31,170 |
| 10/31/2024 | $30,243 | $32,298 | $33,480 | $44,812 |
Average Annual Total Returns
| Fund/Index | 1 Year | 5 Years | 10 Years |
|---|
| Institutional Shares | 38.19% | 11.40% | 11.70% |
Russell 3000®IndexFootnote Reference* | 37.86% | 14.60% | 12.44% |
| Russell 1000 Growth Index | 43.77% | 18.99% | 16.18% |
| Morningstar Large Growth Funds Average | 41.03% | 14.86% | 12.85% |
| Footnote | Description |
Footnote* | The Fund has designated the Russell 3000® Index as its new broad-based securities market index in accordance with the SEC’s revised definition for such an index. |
Visit FederatedHermes.com/us/FundInformation and click on the link to your fund and share class for more recent performance information.
| Net Assets | $1,469,656,500 |
| Number of Investments | 55 |
| Portfolio Turnover | 18% |
| Total Advisory Fees Paid | $10,135,361 |
Annual Shareholder Report
Federated Hermes Kaufmann Large Cap Fund
Top Sectors (% of Total Net Assets)
| Value | Value |
|---|
| Utilities | 0.9% |
| Real Estate | 1.4% |
| Materials | 1.6% |
| Consumer Staples | 3.5% |
| Financials | 6.7% |
| Communication Services | 7.9% |
| Industrials | 11.1% |
| Consumer Discretionary | 11.4% |
| Health Care | 16.2% |
| Information Technology | 39.1% |
Following is a summary of material changes made to the Fund during the reporting period. For more complete and current information, you may review the Fund’s disclosure documents on its webpage at FederatedHermes.com/us/FundInformation or upon request at 1-800-341-7400, Option 4, or by contacting your financial advisor.
Effective July 1, 2024, the Fund’s annual investment advisory fee payable to its investment adviser is reduced from 0.75% to 0.74% of the Fund’s average daily net assets.
Effective August 1, 2024, the Fund’s Sub-Adviser, Federated Global Investment Management Corp., became the Fund’s Adviser, replacing Federated Equity Management Company of Pennsylvania. There were no changes to the Fund’s portfolio managers, investment objectives, investment strategies or fees and expenses as a result of the Adviser replacement.
Effective September 30, 2024, Mark Bauknight, Senior Portfolio Manager, retired from the Fund’s Adviser. The other members of the portfolio management team continue to manage the Fund.
Additional Information about the Fund
Additional information is available on the Fund’s website at FederatedHermes.com/us/FundInformation, including its:
• prospectus • financial information • holdings • proxy voting information
CUSIP 314172412
39667-D (12/24)
Federated Securities Corp., Distributor
FederatedHermes.com/us
© 2024 Federated Hermes, Inc.
Federated Hermes Kaufmann Large Cap Fund
Annual Shareholder Report - October 31, 2024
A Portfolio of Federated Hermes Equity Funds
This annual shareholder report contains important information about the Federated Hermes Kaufmann Large Cap Fund (the "Fund") for the period of November 1, 2023 to October 31, 2024. You can find additional information at FederatedHermes.com/us/FundInformation. You can also request this information by contacting us at 1-800-341-7400, Option 4, or your financial advisor.
This report describes changes made to the Fund during the reporting period.
What were the Fund costs for the last year?
(based on a hypothetical $10,000 investment)
| Class Name | Costs of a $10,000 investment | Costs paid as a percentage of a $10,000 investment |
|---|
| Class R Shares | $174 | 1.47% |
Management's Discussion of Fund Performance
The following discussion compares the performance of the Fund to the Russell 1000 Growth Index to show how the Fund’s performance compares to the returns of similar investments for the reporting period. See the Average Annual Total Returns table below for the returns of the Fund and related indexes, including the Russell 3000 Index, which represents approximately 98% of investable U.S. equities by market capitalization. The Fund seeks to provide capital appreciation by investing primarily in securities of large-cap companies traded on national security exchanges, the NASDAQ stock market and on the over-the-counter market.
Top Contributors to Performance
■ By sector, allocations to Consumer Staples, Industrials and Materials positively affected Fund relative performance.
■ The Materials sector contributed to performance of the Fund as inflation persisted which benefitted Fund holdings like Sherwin
Williams and Ecolab which were able to pass along pricing with a profit margin boost.
■ Top individual Fund holdings that contributed positively to performance included BlackRock, Inc., Costco, Eaton Corp., Quanta Services and Trane Technologies.
Top Detractors from Performance
■ Stock selection in the Healthcare and Communication Services sectors detracted the most from Fund relative performance.
■ The allocation to the Technology sector was a laggard for the Fund as the underweight to the sector and stock selection detracted
from Fund relative performance.
Annual Shareholder Report
Federated Hermes Kaufmann Large Cap Fund
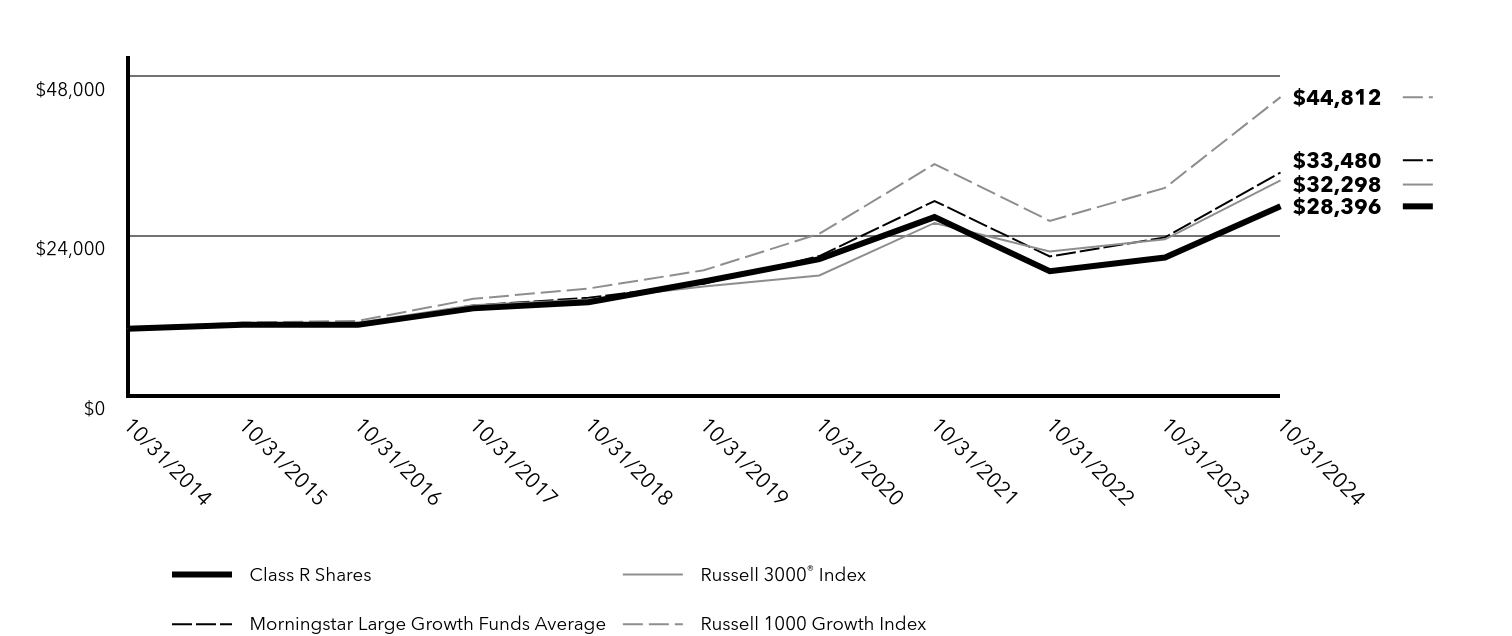
Keep in mind that the Fund’s past performance is not a good predictor of how the Fund will perform in the future. The graph and table do not reflect the deduction of taxes that a shareholder would pay on fund distributions or redemption of fund shares.
Cumulative Performance: 10/31/2014 to 10/31/2024
Total Return Based on $10,000 Investment
| Class R Shares | Russell 3000® Index | Morningstar Large Growth Funds Average | Russell 1000 Growth Index |
|---|
| 10/31/2014 | $10,000 | $10,000 | $10,000 | $10,000 |
| 10/31/2015 | $10,574 | $10,449 | $10,657 | $10,918 |
| 10/31/2016 | $10,569 | $10,892 | $10,649 | $11,167 |
| 10/31/2017 | $13,049 | $13,504 | $13,484 | $14,485 |
| 10/31/2018 | $13,969 | $14,395 | $14,641 | $16,037 |
| 10/31/2019 | $17,081 | $16,337 | $16,756 | $18,779 |
| 10/31/2020 | $20,451 | $17,995 | $20,913 | $24,267 |
| 10/31/2021 | $26,778 | $25,894 | $29,194 | $34,752 |
| 10/31/2022 | $18,643 | $21,617 | $20,852 | $26,204 |
| 10/31/2023 | $20,688 | $23,429 | $23,726 | $31,170 |
| 10/31/2024 | $28,396 | $32,298 | $33,480 | $44,812 |
Average Annual Total Returns
| Fund/Index | 1 Year | 5 Years | 10 Years |
|---|
| Class R Shares | 37.26% | 10.70% | 11.00% |
Russell 3000®IndexFootnote Reference* | 37.86% | 14.60% | 12.44% |
| Russell 1000 Growth Index | 43.77% | 18.99% | 16.18% |
| Morningstar Large Growth Funds Average | 41.03% | 14.86% | 12.85% |
| Footnote | Description |
Footnote* | The Fund has designated the Russell 3000® Index as its new broad-based securities market index in accordance with the SEC’s revised definition for such an index. |
Visit FederatedHermes.com/us/FundInformation and click on the link to your fund and share class for more recent performance information.
| Net Assets | $1,469,656,500 |
| Number of Investments | 55 |
| Portfolio Turnover | 18% |
| Total Advisory Fees Paid | $10,135,361 |
Annual Shareholder Report
Federated Hermes Kaufmann Large Cap Fund
Top Sectors (% of Total Net Assets)
| Value | Value |
|---|
| Utilities | 0.9% |
| Real Estate | 1.4% |
| Materials | 1.6% |
| Consumer Staples | 3.5% |
| Financials | 6.7% |
| Communication Services | 7.9% |
| Industrials | 11.1% |
| Consumer Discretionary | 11.4% |
| Health Care | 16.2% |
| Information Technology | 39.1% |
Following is a summary of material changes made to the Fund during the reporting period. For more complete and current information, you may review the Fund’s disclosure documents on its webpage at FederatedHermes.com/us/FundInformation or upon request at 1-800-341-7400, Option 4, or by contacting your financial advisor.
Effective July 1, 2024, the Fund’s annual investment advisory fee payable to its investment adviser is reduced from 0.75% to 0.74% of the Fund’s average daily net assets.
Effective August 1, 2024, the Fund’s Sub-Adviser, Federated Global Investment Management Corp., became the Fund’s Adviser, replacing Federated Equity Management Company of Pennsylvania. There were no changes to the Fund’s portfolio managers, investment objectives, investment strategies or fees and expenses as a result of the Adviser replacement.
Effective September 30, 2024, Mark Bauknight, Senior Portfolio Manager, retired from the Fund’s Adviser. The other members of the portfolio management team continue to manage the Fund.
Additional Information about the Fund
Additional information is available on the Fund’s website at FederatedHermes.com/us/FundInformation, including its:
• prospectus • financial information • holdings • proxy voting information
CUSIP 314172420
39667-C (12/24)
Federated Securities Corp., Distributor
FederatedHermes.com/us
© 2024 Federated Hermes, Inc.
Federated Hermes Kaufmann Small Cap Fund
Annual Shareholder Report - October 31, 2024
A Portfolio of Federated Hermes Equity Funds
This annual shareholder report contains important information about the Federated Hermes Kaufmann Small Cap Fund (the "Fund") for the period of November 1, 2023 to October 31, 2024. You can find additional information at FederatedHermes.com/us/FundInformation. You can also request this information by contacting us at 1-800-341-7400, Option 4, or your financial advisor.
This report describes changes made to the Fund during the reporting period.
What were the Fund costs for the last year?
(based on a hypothetical $10,000 investment)
| Class Name | Costs of a $10,000 investment | Costs paid as a percentage of a $10,000 investment |
|---|
| Class A Shares | $155 | 1.35% |
Management's Discussion of Fund Performance
The following discussion compares the performance of the Fund to the Russell 2000 Growth Index to show how the Fund’s performance compares to the returns of similar investments for the reporting period. See the Average Annual Total Returns table below for the returns of the Fund and related indexes, including the Russell 3000 Index, which represents approximately 98% of investable U.S. equities by market capitalization. The Fund seeks to provide capital appreciation by investing primarily in the common stocks of small companies that are traded on national security exchanges, the NASDAQ stock market and on the over-the-counter market.
Top Contributors to Performance
■ Stock selection in Industrials, specifically capital goods companies in the sector, contributed positively to Fund relative performance.
■ Fund holdings in the Financials sector were the leading contributor to performance for the Fund during the reporting period.
Fund holdings such as Ares Management Corporation and Hamilton Lane benefitted from higher prices and strong capital raises for
their private funds throughout the year.
■ By sector, Materials also aided performance during the reporting period.
■ A top individual Fund holding that contributed positively to performance was Comfort Systems.
Top Detractors from Performance
■ By sector, stock selection in Information Technology detracted from Fund relative performance.
■ Stock selection in Healthcare was also a laggard for the Fund, specifically biotechnology companies in the sector detracted
from performance.
■ Top individual Fund holdings that detracted from performance were Structure Therapeutics, Inc., Legend Biotech Corp. and
Dyanvax Technologies.
Annual Shareholder Report
Federated Hermes Kaufmann Small Cap Fund
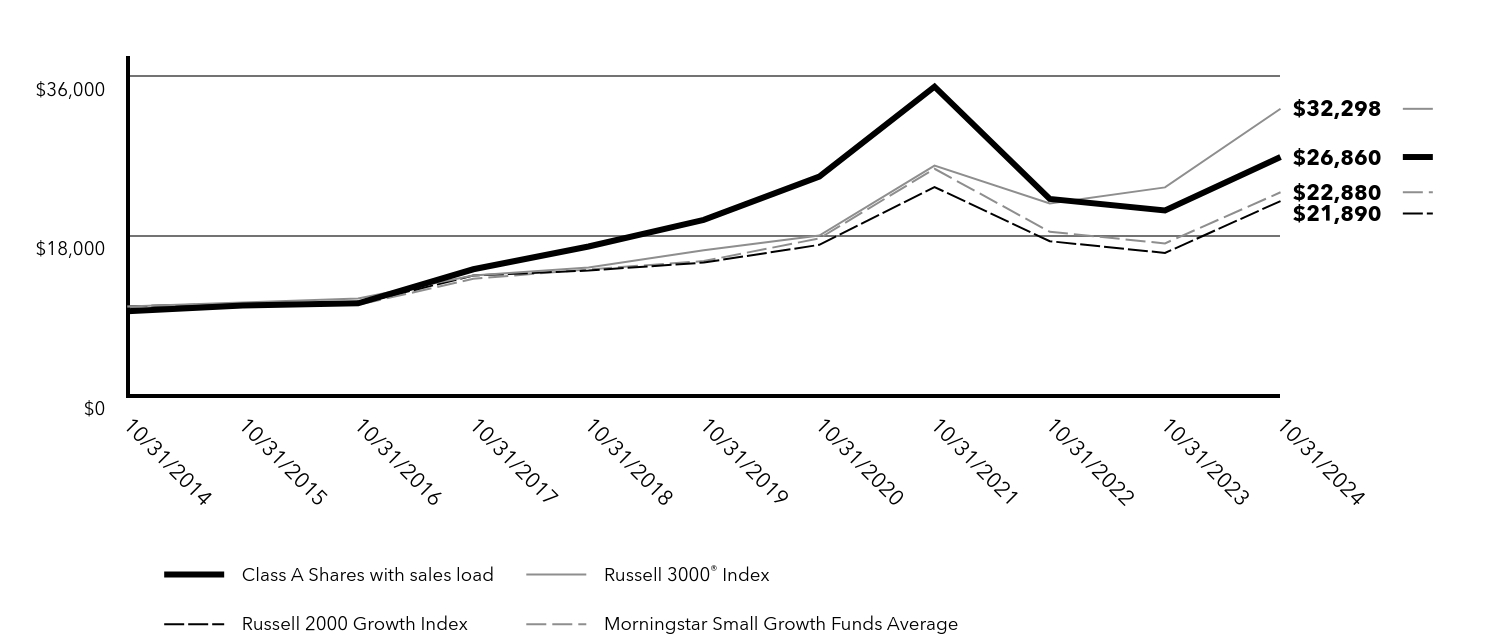
Keep in mind that the Fund’s past performance is not a good predictor of how the Fund will perform in the future. The graph and table do not reflect the deduction of taxes that a shareholder would pay on fund distributions or redemption of fund shares.
Cumulative Performance: 10/31/2014 to 10/31/2024
Total Return Based on $10,000 Investment
| Class A Shares with sales load | Russell 3000® Index | Russell 2000 Growth Index | Morningstar Small Growth Funds Average |
|---|
| 10/31/2014 | $9,451 | $10,000 | $10,000 | $10,000 |
| 10/31/2015 | $10,124 | $10,449 | $10,352 | $10,157 |
| 10/31/2016 | $10,354 | $10,892 | $10,302 | $10,186 |
| 10/31/2017 | $14,198 | $13,504 | $13,495 | $13,124 |
| 10/31/2018 | $16,763 | $14,395 | $14,053 | $14,180 |
| 10/31/2019 | $19,769 | $16,337 | $14,952 | $15,118 |
| 10/31/2020 | $24,653 | $17,995 | $16,951 | $17,676 |
| 10/31/2021 | $34,790 | $25,894 | $23,469 | $25,533 |
| 10/31/2022 | $22,123 | $21,617 | $17,362 | $18,426 |
| 10/31/2023 | $20,838 | $23,429 | $16,037 | $17,117 |
| 10/31/2024 | $26,860 | $32,298 | $21,890 | $22,880 |
Average Annual Total Returns
| Fund/Index | 1 Year | 5 Years | 10 Years |
|---|
| Class A Shares with sales load | 21.80% | 5.13% | 10.39% |
| Class A Shares without sales load | 28.90% | 6.32% | 11.01% |
Russell 3000®IndexFootnote Reference* | 37.86% | 14.60% | 12.44% |
| Russell 2000 Growth Index | 36.49% | 7.92% | 8.15% |
| Morningstar Small Growth Funds Average | 33.60% | 8.66% | 8.65% |
| Footnote | Description |
Footnote* | The Fund has designated the Russell 3000® Index as its new broad-based securities market index in accordance with the SEC’s revised definition for such an index. |
Visit FederatedHermes.com/us/FundInformation and click on the link to your fund and share class for more recent performance information.
| Net Assets | $3,849,961,889 |
| Number of Investments | 150 |
| Portfolio Turnover | 34% |
| Total Advisory Fees Paid | $31,044,037 |
Annual Shareholder Report
Federated Hermes Kaufmann Small Cap Fund
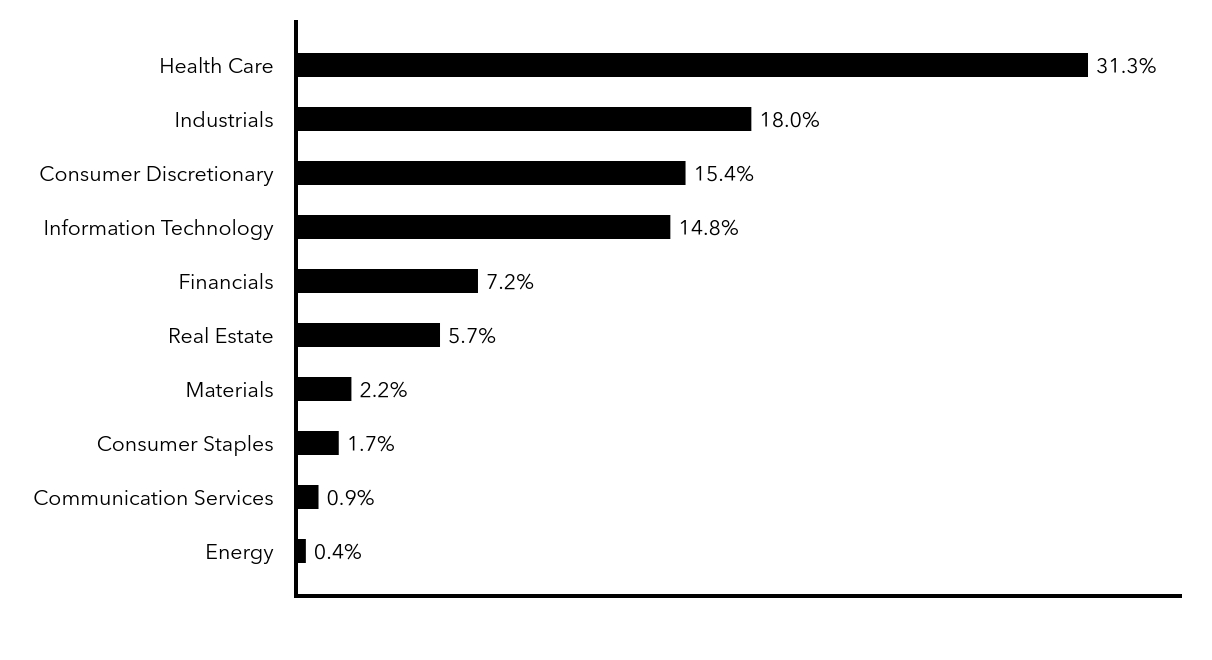
Top Sectors (% of Total Net Assets)
| Value | Value |
|---|
| Energy | 0.4% |
| Communication Services | 0.9% |
| Consumer Staples | 1.7% |
| Materials | 2.2% |
| Real Estate | 5.7% |
| Financials | 7.2% |
| Information Technology | 14.8% |
| Consumer Discretionary | 15.4% |
| Industrials | 18.0% |
| Health Care | 31.3% |
Following is a summary of material changes made to the Fund during the reporting period. For more complete and current information, you may review the Fund’s disclosure documents on its webpage at FederatedHermes.com/us/FundInformation or upon request at 1-800-341-7400, Option 4, or by contacting your financial advisor.
Effective August 1, 2024, the Fund’s Sub-Adviser, Federated Global Investment Management Corp., became the Fund’s Adviser, replacing Federated Equity Management Company of Pennsylvania. There were no changes to the Fund’s portfolio managers, investment objectives, investment strategies or fees and expenses as a result of the Adviser replacement.
Effective September 30, 2024, Mark Bauknight, Senior Portfolio Manager, retired from the Fund’s Adviser. The other members of the portfolio management team continue to manage the Fund.
Additional Information about the Fund
Additional information is available on the Fund’s website at FederatedHermes.com/us/FundInformation, including its:
• prospectus • financial information • holdings • proxy voting information
CUSIP 314172636
29503-A (12/24)
Federated Securities Corp., Distributor
FederatedHermes.com/us
© 2024 Federated Hermes, Inc.
Federated Hermes Kaufmann Small Cap Fund
Annual Shareholder Report - October 31, 2024
A Portfolio of Federated Hermes Equity Funds
This annual shareholder report contains important information about the Federated Hermes Kaufmann Small Cap Fund (the "Fund") for the period of November 1, 2023 to October 31, 2024. You can find additional information at FederatedHermes.com/us/FundInformation. You can also request this information by contacting us at 1-800-341-7400, Option 4, or your financial advisor.
This report describes changes made to the Fund during the reporting period.
What were the Fund costs for the last year?
(based on a hypothetical $10,000 investment)
| Class Name | Costs of a $10,000 investment | Costs paid as a percentage of a $10,000 investment |
|---|
| Class C Shares | $227 | 1.99% |
Management's Discussion of Fund Performance
The following discussion compares the performance of the Fund to the Russell 2000 Growth Index to show how the Fund’s performance compares to the returns of similar investments for the reporting period. See the Average Annual Total Returns table below for the returns of the Fund and related indexes, including the Russell 3000 Index, which represents approximately 98% of investable U.S. equities by market capitalization. The Fund seeks to provide capital appreciation by investing primarily in the common stocks of small companies that are traded on national security exchanges, the NASDAQ stock market and on the over-the-counter market.
Top Contributors to Performance
■ Stock selection in Industrials, specifically capital goods companies in the sector, contributed positively to Fund relative performance.
■ Fund holdings in the Financials sector were the leading contributor to performance for the Fund during the reporting period.
Fund holdings such as Ares Management Corporation and Hamilton Lane benefitted from higher prices and strong capital raises for
their private funds throughout the year.
■ By sector, Materials also aided performance during the reporting period.
■ A top individual Fund holding that contributed positively to performance was Comfort Systems.
Top Detractors from Performance
■ By sector, stock selection in Information Technology detracted from Fund relative performance.
■ Stock selection in Healthcare was also a laggard for the Fund, specifically biotechnology companies in the sector detracted
from performance.
■ Top individual Fund holdings that detracted from performance were Structure Therapeutics, Inc., Legend Biotech Corp. and
Dyanvax Technologies.
Annual Shareholder Report
Federated Hermes Kaufmann Small Cap Fund
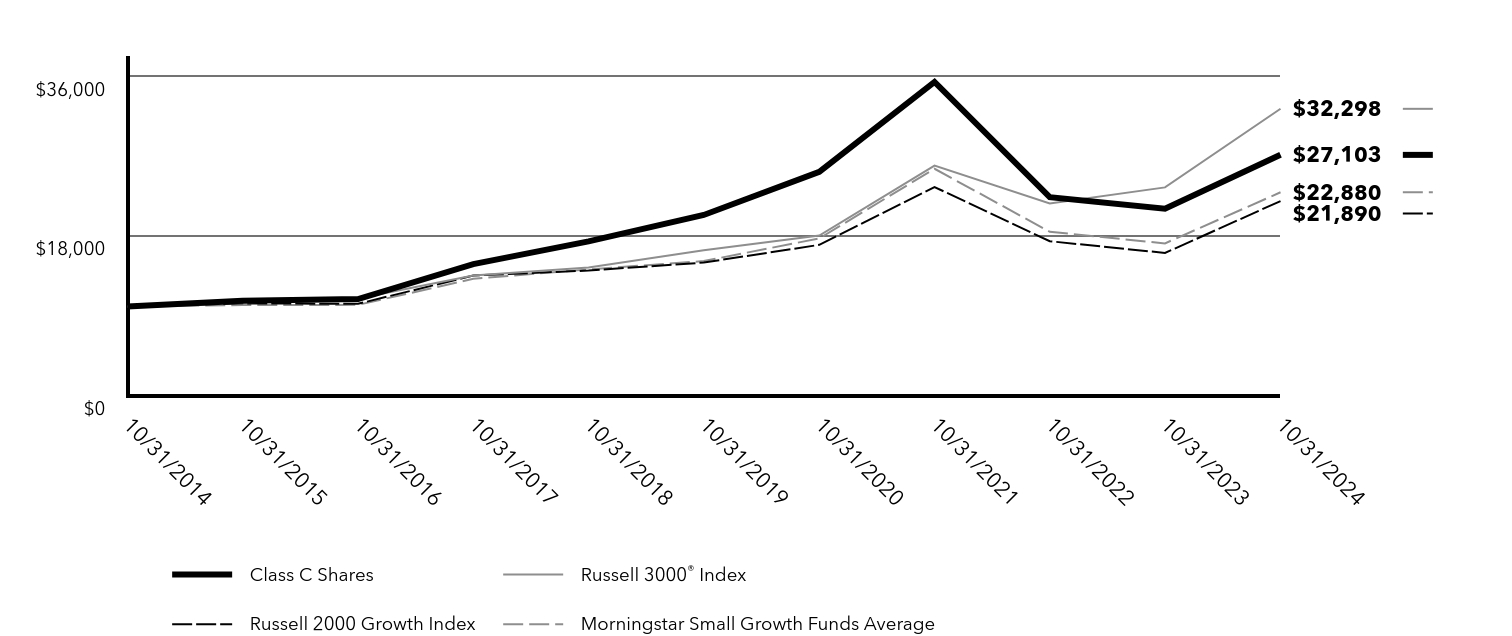
Keep in mind that the Fund’s past performance is not a good predictor of how the Fund will perform in the future. The graph and table do not reflect the deduction of taxes that a shareholder would pay on fund distributions or redemption of fund shares.
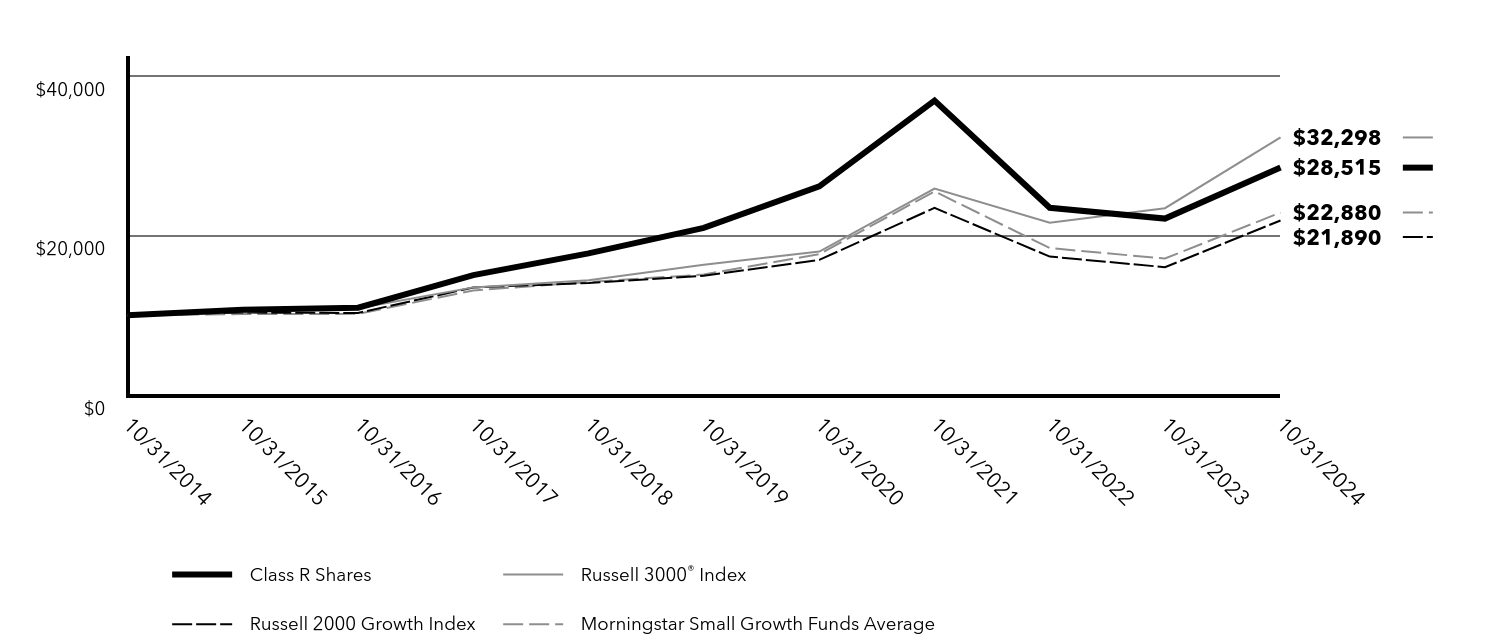
Cumulative Performance: 10/31/2014 to 10/31/2024
Total Return Based on $10,000 Investment
| Class C Shares | Russell 3000® Index | Russell 2000 Growth Index | Morningstar Small Growth Funds Average |
|---|
| 10/31/2014 | $10,000 | $10,000 | $10,000 | $10,000 |
| 10/31/2015 | $10,652 | $10,449 | $10,352 | $10,157 |
| 10/31/2016 | $10,833 | $10,892 | $10,302 | $10,186 |
| 10/31/2017 | $14,775 | $13,504 | $13,495 | $13,124 |
| 10/31/2018 | $17,339 | $14,395 | $14,053 | $14,180 |
| 10/31/2019 | $20,319 | $16,337 | $14,952 | $15,118 |
| 10/31/2020 | $25,179 | $17,995 | $16,951 | $17,676 |
| 10/31/2021 | $35,321 | $25,894 | $23,469 | $25,533 |
| 10/31/2022 | $22,323 | $21,617 | $17,362 | $18,426 |
| 10/31/2023 | $21,027 | $23,429 | $16,037 | $17,117 |
| 10/31/2024 | $27,103 | $32,298 | $21,890 | $22,880 |
Average Annual Total Returns
| Fund/Index | 1 Year | 5 Years | 10 Years |
|---|
| Class C Shares with sales load | 27.07% | 5.66% | 10.48% |
| Class C Shares without sales load | 28.07% | 5.66% | 10.48% |
Russell 3000®IndexFootnote Reference* | 37.86% | 14.60% | 12.44% |
| Russell 2000 Growth Index | 36.49% | 7.92% | 8.15% |
| Morningstar Small Growth Funds Average | 33.60% | 8.66% | 8.65% |
| Footnote | Description |
Footnote* | The Fund has designated the Russell 3000® Index as its new broad-based securities market index in accordance with the SEC’s revised definition for such an index. |
Visit FederatedHermes.com/us/FundInformation and click on the link to your fund and share class for more recent performance information.
| Net Assets | $3,849,961,889 |
| Number of Investments | 150 |
| Portfolio Turnover | 34% |
| Total Advisory Fees Paid | $31,044,037 |
Annual Shareholder Report
Federated Hermes Kaufmann Small Cap Fund
Top Sectors (% of Total Net Assets)
| Value | Value |
|---|
| Energy | 0.4% |
| Communication Services | 0.9% |
| Consumer Staples | 1.7% |
| Materials | 2.2% |
| Real Estate | 5.7% |
| Financials | 7.2% |
| Information Technology | 14.8% |
| Consumer Discretionary | 15.4% |
| Industrials | 18.0% |
| Health Care | 31.3% |
Following is a summary of material changes made to the Fund during the reporting period. For more complete and current information, you may review the Fund’s disclosure documents on its webpage at FederatedHermes.com/us/FundInformation or upon request at 1-800-341-7400, Option 4, or by contacting your financial advisor.
Effective August 1, 2024, the Fund’s Sub-Adviser, Federated Global Investment Management Corp., became the Fund’s Adviser, replacing Federated Equity Management Company of Pennsylvania. There were no changes to the Fund’s portfolio managers, investment objectives, investment strategies or fees and expenses as a result of the Adviser replacement.
Effective September 30, 2024, Mark Bauknight, Senior Portfolio Manager, retired from the Fund’s Adviser. The other members of the portfolio management team continue to manage the Fund.
Additional Information about the Fund
Additional information is available on the Fund’s website at FederatedHermes.com/us/FundInformation, including its:
• prospectus • financial information • holdings • proxy voting information
CUSIP 314172610
29503-B (12/24)
Federated Securities Corp., Distributor
FederatedHermes.com/us
© 2024 Federated Hermes, Inc.
Federated Hermes Kaufmann Small Cap Fund
Institutional Shares | FKAIX
Annual Shareholder Report - October 31, 2024
A Portfolio of Federated Hermes Equity Funds
This annual shareholder report contains important information about the Federated Hermes Kaufmann Small Cap Fund (the "Fund") for the period of November 1, 2023 to October 31, 2024. You can find additional information at FederatedHermes.com/us/FundInformation. You can also request this information by contacting us at 1-800-341-7400, Option 4, or your financial advisor.
This report describes changes made to the Fund during the reporting period.
What were the Fund costs for the last year?
(based on a hypothetical $10,000 investment)
| Class Name | Costs of a $10,000 investment | Costs paid as a percentage of a $10,000 investment |
|---|
| Institutional Shares | $102 | 0.89% |
Management's Discussion of Fund Performance
The following discussion compares the performance of the Fund to the Russell 2000 Growth Index to show how the Fund’s performance compares to the returns of similar investments for the reporting period. See the Average Annual Total Returns table below for the returns of the Fund and related indexes, including the Russell 3000 Index, which represents approximately 98% of investable U.S. equities by market capitalization. The Fund seeks to provide capital appreciation by investing primarily in the common stocks of small companies that are traded on national security exchanges, the NASDAQ stock market and on the over-the-counter market.
Top Contributors to Performance
■ Stock selection in Industrials, specifically capital goods companies in the sector, contributed positively to Fund relative performance.
■ Fund holdings in the Financials sector were the leading contributor to performance for the Fund during the reporting period.
Fund holdings such as Ares Management Corporation and Hamilton Lane benefitted from higher prices and strong capital raises for
their private funds throughout the year.
■ By sector, Materials also aided performance during the reporting period.
■ A top individual Fund holding that contributed positively to performance was Comfort Systems.
Top Detractors from Performance
■ By sector, stock selection in Information Technology detracted from Fund relative performance.
■ Stock selection in Healthcare was also a laggard for the Fund, specifically biotechnology companies in the sector detracted
from performance.
■ Top individual Fund holdings that detracted from performance were Structure Therapeutics, Inc., Legend Biotech Corp. and
Dyanvax Technologies.
Annual Shareholder Report
Federated Hermes Kaufmann Small Cap Fund
Keep in mind that the Fund’s past performance is not a good predictor of how the Fund will perform in the future. The graph and table do not reflect the deduction of taxes that a shareholder would pay on fund distributions or redemption of fund shares.
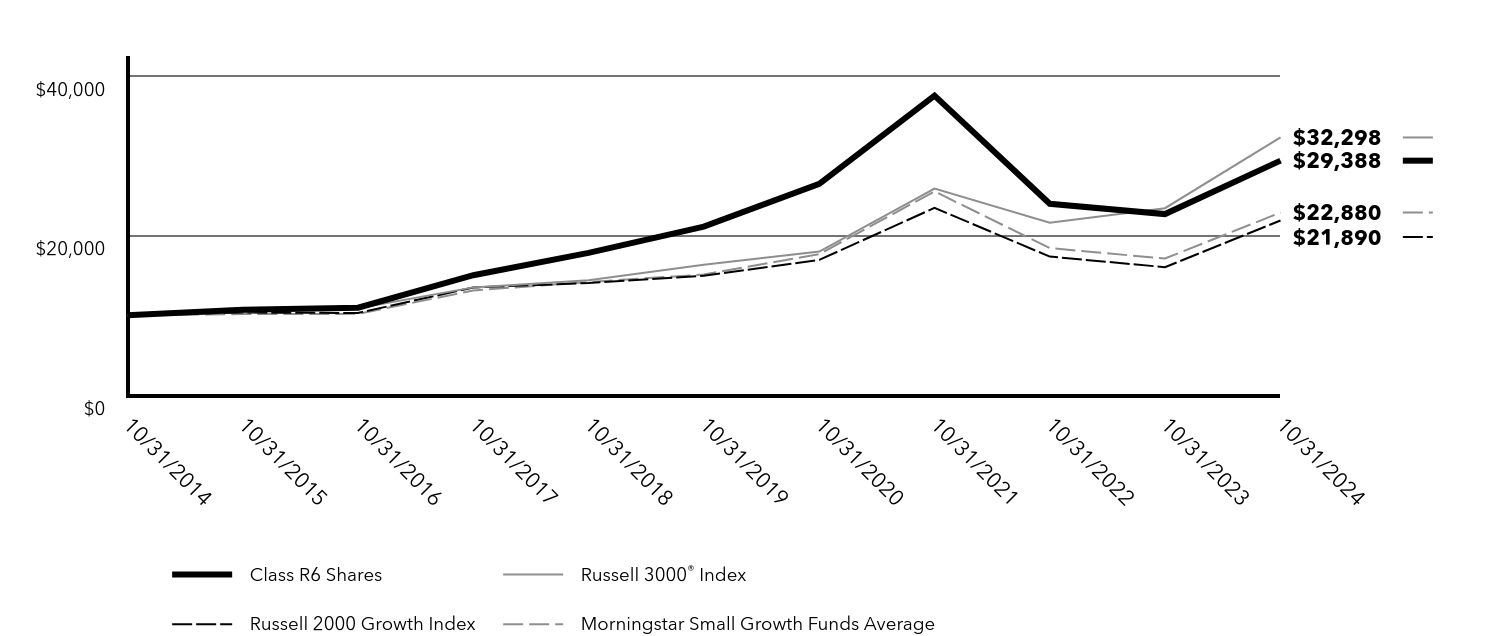
Cumulative Performance: 10/31/2014 to 10/31/2024
Total Return Based on $10,000 Investment
| Institutional Shares | Russell 3000® Index | Russell 2000 Growth Index | Morningstar Small Growth Funds Average |
|---|
| 10/31/2014 | $10,000 | $10,000 | $10,000 | $10,000 |
| 10/31/2015 | $10,712 | $10,449 | $10,352 | $10,157 |
| 10/31/2016 | $10,997 | $10,892 | $10,302 | $10,186 |
| 10/31/2017 | $15,147 | $13,504 | $13,495 | $13,124 |
| 10/31/2018 | $17,966 | $14,395 | $14,053 | $14,180 |
| 10/31/2019 | $21,282 | $16,337 | $14,952 | $15,118 |
| 10/31/2020 | $26,666 | $17,995 | $16,951 | $17,676 |
| 10/31/2021 | $37,805 | $25,894 | $23,469 | $25,533 |
| 10/31/2022 | $24,156 | $21,617 | $17,362 | $18,426 |
| 10/31/2023 | $22,854 | $23,429 | $16,037 | $17,117 |
| 10/31/2024 | $29,593 | $32,298 | $21,890 | $22,880 |
Average Annual Total Returns
| Fund/Index | 1 Year | 5 Years | 10 Years |
|---|
| Institutional Shares | 29.48% | 6.82% | 11.46% |
Russell 3000®IndexFootnote Reference* | 37.86% | 14.60% | 12.44% |
| Russell 2000 Growth Index | 36.49% | 7.92% | 8.15% |
| Morningstar Small Growth Funds Average | 33.60% | 8.66% | 8.65% |
| Footnote | Description |
Footnote* | The Fund has designated the Russell 3000® Index as its new broad-based securities market index in accordance with the SEC’s revised definition for such an index. |
Visit FederatedHermes.com/us/FundInformation and click on the link to your fund and share class for more recent performance information.
| Net Assets | $3,849,961,889 |
| Number of Investments | 150 |
| Portfolio Turnover | 34% |
| Total Advisory Fees Paid | $31,044,037 |
Annual Shareholder Report
Federated Hermes Kaufmann Small Cap Fund
Top Sectors (% of Total Net Assets)
| Value | Value |
|---|
| Energy | 0.4% |
| Communication Services | 0.9% |
| Consumer Staples | 1.7% |
| Materials | 2.2% |
| Real Estate | 5.7% |
| Financials | 7.2% |
| Information Technology | 14.8% |
| Consumer Discretionary | 15.4% |
| Industrials | 18.0% |
| Health Care | 31.3% |
Following is a summary of material changes made to the Fund during the reporting period. For more complete and current information, you may review the Fund’s disclosure documents on its webpage at FederatedHermes.com/us/FundInformation or upon request at 1-800-341-7400, Option 4, or by contacting your financial advisor.
Effective August 1, 2024, the Fund’s Sub-Adviser, Federated Global Investment Management Corp., became the Fund’s Adviser, replacing Federated Equity Management Company of Pennsylvania. There were no changes to the Fund’s portfolio managers, investment objectives, investment strategies or fees and expenses as a result of the Adviser replacement.
Effective September 30, 2024, Mark Bauknight, Senior Portfolio Manager, retired from the Fund’s Adviser. The other members of the portfolio management team continue to manage the Fund.
Additional Information about the Fund
Additional information is available on the Fund’s website at FederatedHermes.com/us/FundInformation, including its:
• prospectus • financial information • holdings • proxy voting information
CUSIP 31421N402
29503-D (12/24)
Federated Securities Corp., Distributor
FederatedHermes.com/us
© 2024 Federated Hermes, Inc.
Federated Hermes Kaufmann Small Cap Fund
Annual Shareholder Report - October 31, 2024
A Portfolio of Federated Hermes Equity Funds
This annual shareholder report contains important information about the Federated Hermes Kaufmann Small Cap Fund (the "Fund") for the period of November 1, 2023 to October 31, 2024. You can find additional information at FederatedHermes.com/us/FundInformation. You can also request this information by contacting us at 1-800-341-7400, Option 4, or your financial advisor.
This report describes changes made to the Fund during the reporting period.
What were the Fund costs for the last year?
(based on a hypothetical $10,000 investment)
| Class Name | Costs of a $10,000 investment | Costs paid as a percentage of a $10,000 investment |
|---|
| Class R6 Shares | $101 | 0.88% |
Management's Discussion of Fund Performance
The following discussion compares the performance of the Fund to the Russell 2000 Growth Index to show how the Fund’s performance compares to the returns of similar investments for the reporting period. See the Average Annual Total Returns table below for the returns of the Fund and related indexes, including the Russell 3000 Index, which represents approximately 98% of investable U.S. equities by market capitalization. The Fund seeks to provide capital appreciation by investing primarily in the common stocks of small companies that are traded on national security exchanges, the NASDAQ stock market and on the over-the-counter market.
Top Contributors to Performance
■ Stock selection in Industrials, specifically capital goods companies in the sector, contributed positively to Fund relative performance.
■ Fund holdings in the Financials sector were the leading contributor to performance for the Fund during the reporting period.
Fund holdings such as Ares Management Corporation and Hamilton Lane benefitted from higher prices and strong capital raises for
their private funds throughout the year.
■ By sector, Materials also aided performance during the reporting period.
■ A top individual Fund holding that contributed positively to performance was Comfort Systems.
Top Detractors from Performance
■ By sector, stock selection in Information Technology detracted from Fund relative performance.
■ Stock selection in Healthcare was also a laggard for the Fund, specifically biotechnology companies in the sector detracted
from performance.
■ Top individual Fund holdings that detracted from performance were Structure Therapeutics, Inc., Legend Biotech Corp. and
Dyanvax Technologies.
Annual Shareholder Report
Federated Hermes Kaufmann Small Cap Fund
Keep in mind that the Fund’s past performance is not a good predictor of how the Fund will perform in the future. The graph and table do not reflect the deduction of taxes that a shareholder would pay on fund distributions or redemption of fund shares.
Cumulative Performance: 10/31/2014 to 10/31/2024
Total Return Based on $10,000 Investment
| Class R6 Shares | Russell 3000® Index | Russell 2000 Growth Index | Morningstar Small Growth Funds Average |
|---|
| 10/31/2014 | $10,000 | $10,000 | $10,000 | $10,000 |
| 10/31/2015 | $10,712 | $10,449 | $10,352 | $10,157 |
| 10/31/2016 | $10,955 | $10,892 | $10,302 | $10,186 |
| 10/31/2017 | $15,032 | $13,504 | $13,495 | $13,124 |
| 10/31/2018 | $17,833 | $14,395 | $14,053 | $14,180 |
| 10/31/2019 | $21,127 | $16,337 | $14,952 | $15,118 |
| 10/31/2020 | $26,472 | $17,995 | $16,951 | $17,676 |
| 10/31/2021 | $37,531 | $25,894 | $23,469 | $25,533 |
| 10/31/2022 | $23,982 | $21,617 | $17,362 | $18,426 |
| 10/31/2023 | $22,690 | $23,429 | $16,037 | $17,117 |
| 10/31/2024 | $29,388 | $32,298 | $21,890 | $22,880 |
Average Annual Total Returns
| Fund/Index | 1 Year | 5 Years | 10 Years |
|---|
| Class R6 Shares | 29.52% | 6.82% | 11.38% |
Russell 3000®IndexFootnote Reference* | 37.86% | 14.60% | 12.44% |
| Russell 2000 Growth Index | 36.49% | 7.92% | 8.15% |
| Morningstar Small Growth Funds Average | 33.60% | 8.66% | 8.65% |
| Footnote | Description |
Footnote* | The Fund has designated the Russell 3000® Index as its new broad-based securities market index in accordance with the SEC’s revised definition for such an index. |
Visit FederatedHermes.com/us/FundInformation and click on the link to your fund and share class for more recent performance information.
| Net Assets | $3,849,961,889 |
| Number of Investments | 150 |
| Portfolio Turnover | 34% |
| Total Advisory Fees Paid | $31,044,037 |
Annual Shareholder Report
Federated Hermes Kaufmann Small Cap Fund
Top Sectors (% of Total Net Assets)
| Value | Value |
|---|
| Energy | 0.4% |
| Communication Services | 0.9% |
| Consumer Staples | 1.7% |
| Materials | 2.2% |
| Real Estate | 5.7% |
| Financials | 7.2% |
| Information Technology | 14.8% |
| Consumer Discretionary | 15.4% |
| Industrials | 18.0% |
| Health Care | 31.3% |
Following is a summary of material changes made to the Fund during the reporting period. For more complete and current information, you may review the Fund’s disclosure documents on its webpage at FederatedHermes.com/us/FundInformation or upon request at 1-800-341-7400, Option 4, or by contacting your financial advisor.
Effective August 1, 2024, the Fund’s Sub-Adviser, Federated Global Investment Management Corp., became the Fund’s Adviser, replacing Federated Equity Management Company of Pennsylvania. There were no changes to the Fund’s portfolio managers, investment objectives, investment strategies or fees and expenses as a result of the Adviser replacement.
Effective September 30, 2024, Mark Bauknight, Senior Portfolio Manager, retired from the Fund’s Adviser. The other members of the portfolio management team continue to manage the Fund.
Additional Information about the Fund
Additional information is available on the Fund’s website at FederatedHermes.com/us/FundInformation, including its:
• prospectus • financial information • holdings • proxy voting information
CUSIP 31421N683
29503-E (12/24)
Federated Securities Corp., Distributor
FederatedHermes.com/us
© 2024 Federated Hermes, Inc.
Federated Hermes Kaufmann Small Cap Fund
Annual Shareholder Report - October 31, 2024
A Portfolio of Federated Hermes Equity Funds
This annual shareholder report contains important information about the Federated Hermes Kaufmann Small Cap Fund (the "Fund") for the period of November 1, 2023 to October 31, 2024. You can find additional information at FederatedHermes.com/us/FundInformation. You can also request this information by contacting us at 1-800-341-7400, Option 4, or your financial advisor.
This report describes changes made to the Fund during the reporting period.
What were the Fund costs for the last year?
(based on a hypothetical $10,000 investment)
| Class Name | Costs of a $10,000 investment | Costs paid as a percentage of a $10,000 investment |
|---|
| Class R Shares | $152 | 1.33% |
Management's Discussion of Fund Performance
The following discussion compares the performance of the Fund to the Russell 2000 Growth Index to show how the Fund’s performance compares to the returns of similar investments for the reporting period. See the Average Annual Total Returns table below for the returns of the Fund and related indexes, including the Russell 3000 Index, which represents approximately 98% of investable U.S. equities by market capitalization. The Fund seeks to provide capital appreciation by investing primarily in the common stocks of small companies that are traded on national security exchanges, the NASDAQ stock market and on the over-the-counter market.
Top Contributors to Performance
■ Stock selection in Industrials, specifically capital goods companies in the sector, contributed positively to Fund relative performance.
■ Fund holdings in the Financials sector were the leading contributor to performance for the Fund during the reporting period.
Fund holdings such as Ares Management Corporation and Hamilton Lane benefitted from higher prices and strong capital raises for
their private funds throughout the year.
■ By sector, Materials also aided performance during the reporting period.
■ A top individual Fund holding that contributed positively to performance was Comfort Systems.
Top Detractors from Performance
■ By sector, stock selection in Information Technology detracted from Fund relative performance.
■ Stock selection in Healthcare was also a laggard for the Fund, specifically biotechnology companies in the sector detracted
from performance.
■ Top individual Fund holdings that detracted from performance were Structure Therapeutics, Inc., Legend Biotech Corp. and
Dyanvax Technologies.
Annual Shareholder Report
Federated Hermes Kaufmann Small Cap Fund
Keep in mind that the Fund’s past performance is not a good predictor of how the Fund will perform in the future. The graph and table do not reflect the deduction of taxes that a shareholder would pay on fund distributions or redemption of fund shares.
Cumulative Performance: 10/31/2014 to 10/31/2024
Total Return Based on $10,000 Investment
| Class R Shares | Russell 3000® Index | Russell 2000 Growth Index | Morningstar Small Growth Funds Average |
|---|
| 10/31/2014 | $10,000 | $10,000 | $10,000 | $10,000 |
| 10/31/2015 | $10,715 | $10,449 | $10,352 | $10,157 |
| 10/31/2016 | $10,967 | $10,892 | $10,302 | $10,186 |
| 10/31/2017 | $15,043 | $13,504 | $13,495 | $13,124 |
| 10/31/2018 | $17,769 | $14,395 | $14,053 | $14,180 |
| 10/31/2019 | $20,961 | $16,337 | $14,952 | $15,118 |
| 10/31/2020 | $26,153 | $17,995 | $16,951 | $17,676 |
| 10/31/2021 | $36,914 | $25,894 | $23,469 | $25,533 |
| 10/31/2022 | $23,479 | $21,617 | $17,362 | $18,426 |
| 10/31/2023 | $22,123 | $23,429 | $16,037 | $17,117 |
| 10/31/2024 | $28,515 | $32,298 | $21,890 | $22,880 |
Average Annual Total Returns
| Fund/Index | 1 Year | 5 Years | 10 Years |
|---|
| Class R Shares | 28.89% | 6.35% | 11.05% |
Russell 3000®IndexFootnote Reference* | 37.86% | 14.60% | 12.44% |
| Russell 2000 Growth Index | 36.49% | 7.92% | 8.15% |
| Morningstar Small Growth Funds Average | 33.60% | 8.66% | 8.65% |
| Footnote | Description |
Footnote* | The Fund has designated the Russell 3000® Index as its new broad-based securities market index in accordance with the SEC’s revised definition for such an index. |
Visit FederatedHermes.com/us/FundInformation and click on the link to your fund and share class for more recent performance information.
| Net Assets | $3,849,961,889 |
| Number of Investments | 150 |
| Portfolio Turnover | 34% |
| Total Advisory Fees Paid | $31,044,037 |
Annual Shareholder Report
Federated Hermes Kaufmann Small Cap Fund
Top Sectors (% of Total Net Assets)
| Value | Value |
|---|
| Energy | 0.4% |
| Communication Services | 0.9% |
| Consumer Staples | 1.7% |
| Materials | 2.2% |
| Real Estate | 5.7% |
| Financials | 7.2% |
| Information Technology | 14.8% |
| Consumer Discretionary | 15.4% |
| Industrials | 18.0% |
| Health Care | 31.3% |
Following is a summary of material changes made to the Fund during the reporting period. For more complete and current information, you may review the Fund’s disclosure documents on its webpage at FederatedHermes.com/us/FundInformation or upon request at 1-800-341-7400, Option 4, or by contacting your financial advisor.
Effective August 1, 2024, the Fund’s Sub-Adviser, Federated Global Investment Management Corp., became the Fund’s Adviser, replacing Federated Equity Management Company of Pennsylvania. There were no changes to the Fund’s portfolio managers, investment objectives, investment strategies or fees and expenses as a result of the Adviser replacement.
Effective September 30, 2024, Mark Bauknight, Senior Portfolio Manager, retired from the Fund’s Adviser. The other members of the portfolio management team continue to manage the Fund.
Additional Information about the Fund
Additional information is available on the Fund’s website at FederatedHermes.com/us/FundInformation, including its:
• prospectus • financial information • holdings • proxy voting information
CUSIP 314172537
29503-C (12/24)
Federated Securities Corp., Distributor
FederatedHermes.com/us
© 2024 Federated Hermes, Inc.
Federated Hermes MDT Mid Cap Growth Fund
Annual Shareholder Report - October 31, 2024
A Portfolio of Federated Hermes Equity Funds
This annual shareholder report contains important information about the Federated Hermes MDT Mid Cap Growth Fund (the "Fund") for the period of November 1, 2023 to October 31, 2024. You can find additional information at FederatedHermes.com/us/FundInformation. You can also request this information by contacting us at 1-800-341-7400, Option 4, or your financial advisor.
What were the Fund costs for the last year?
(based on a hypothetical $10,000 investment)
| Class Name | Costs of a $10,000 investment | Costs paid as a percentage of a $10,000 investment |
|---|
| Class A Shares | $141 | 1.14% |
Management's Discussion of Fund Performance
The following discussion compares the performance of the Fund to the Russell Midcap Growth Index to show how the Fund’s performance compares to the returns of similar investments for the reporting period. See the Average Annual Total Returns table below for the returns of the Fund and related indexes, including the Russell 3000 Index, which represents approximately 98% of investable U.S. equities by market capitalization. The Fund seeks to provide appreciation of capital by investing primarily in domestic, mid cap common stocks that offer superior growth prospects.
Top Contributors to Performance
■ An overweight position in and solid stock selection among younger companies with strong analyst conviction contributed
positively to Fund relative performance.
■ By sector, stock selection in Consumer Discretionary and Information Technology aided performance.
■ Top individual Fund holdings that contributed positively to performance included overweight positions in AppLovin Corp.
(Class A), Allison Transmission Holdings, Inc. and Spotify Technology SA.
Top Detractors from Performance
■ An underweight position in companies with negative analyst conviction, positive free cash flow and weakening earnings to price
ratios detracted from Fund relative performance.
■ By sector, stock selection in Financials detracted from performance.
■ Top individual Fund holdings that detracted from performance were underweight positions in Palantir Technologies Inc.
(Class A) and Fair Isaac Corporation.
Annual Shareholder Report
Federated Hermes MDT Mid Cap Growth Fund
Keep in mind that the Fund’s past performance is not a good predictor of how the Fund will perform in the future. The graph and table do not reflect the deduction of taxes that a shareholder would pay on fund distributions or redemption of fund shares.
Cumulative Performance: 10/31/2014 to 10/31/2024
Total Return Based on $10,000 Investment
| Class A Shares with sales load | Russell 3000® Index | Morningstar Mid-Cap Growth Funds Average | Russell Midcap® Growth Index |
|---|
| 10/31/2014 | $9,449 | $10,000 | $10,000 | $10,000 |
| 10/31/2015 | $9,635 | $10,449 | $10,288 | $10,494 |
| 10/31/2016 | $9,436 | $10,892 | $10,193 | $10,536 |
| 10/31/2017 | $12,285 | $13,504 | $12,856 | $13,301 |
| 10/31/2018 | $13,444 | $14,395 | $13,522 | $14,118 |
| 10/31/2019 | $15,245 | $16,337 | $15,407 | $16,790 |
| 10/31/2020 | $17,999 | $17,995 | $18,615 | $20,339 |
| 10/31/2021 | $26,833 | $25,894 | $26,515 | $28,358 |
| 10/31/2022 | $19,795 | $21,617 | $18,653 | $20,151 |
| 10/31/2023 | $21,056 | $23,429 | $18,560 | $20,826 |
| 10/31/2024 | $31,042 | $32,298 | $24,950 | $28,880 |
Average Annual Total Returns
| Fund/Index | 1 Year | 5 Years | 10 Years |
|---|
| Class A Shares with sales load | 39.33% | 13.99% | 11.99% |
| Class A Shares without sales load | 47.43% | 15.28% | 12.63% |
Russell 3000®IndexFootnote Reference* | 37.86% | 14.60% | 12.44% |
Russell Midcap® Growth Index | 38.67% | 11.45% | 11.19% |
| Morningstar Mid-Cap Growth Funds Average | 34.44% | 10.17% | 9.55% |
| Footnote | Description |
Footnote* | The Fund has designated the Russell 3000® Index as its new broad-based securities market index in accordance with the SEC’s revised definition for such an index. |
Visit FederatedHermes.com/us/FundInformation and click on the link to your fund and share class for more recent performance information.
| Net Assets | $1,947,386,992 |
| Number of Investments | 126 |
| Portfolio Turnover | 75% |
| Total Advisory Fees Paid | $8,233,846 |
Annual Shareholder Report
Federated Hermes MDT Mid Cap Growth Fund
Top Sectors (% of Total Net Assets)
| Value | Value |
|---|
| Real Estate | 0.4% |
| Utilities | 0.9% |
| Materials | 1.6% |
| Consumer Staples | 2.1% |
| Energy | 3.1% |
| Communication Services | 5.0% |
| Financials | 11.4% |
| Health Care | 13.2% |
| Consumer Discretionary | 14.6% |
| Industrials | 18.6% |
| Information Technology | 23.3% |
Additional Information about the Fund
Additional information is available on the Fund’s website at FederatedHermes.com/us/FundInformation, including its:
• prospectus • financial information • holdings • proxy voting information
CUSIP 314172107
G01228-08-A (12/24)
Federated Securities Corp., Distributor
FederatedHermes.com/us
© 2024 Federated Hermes, Inc.
Federated Hermes MDT Mid Cap Growth Fund
Annual Shareholder Report - October 31, 2024
A Portfolio of Federated Hermes Equity Funds
This annual shareholder report contains important information about the Federated Hermes MDT Mid Cap Growth Fund (the "Fund") for the period of November 1, 2023 to October 31, 2024. You can find additional information at FederatedHermes.com/us/FundInformation. You can also request this information by contacting us at 1-800-341-7400, Option 4, or your financial advisor.
What were the Fund costs for the last year?
(based on a hypothetical $10,000 investment)
| Class Name | Costs of a $10,000 investment | Costs paid as a percentage of a $10,000 investment |
|---|
| Class C Shares | $236 | 1.92% |
Management's Discussion of Fund Performance
The following discussion compares the performance of the Fund to the Russell Midcap Growth Index to show how the Fund’s performance compares to the returns of similar investments for the reporting period. See the Average Annual Total Returns table below for the returns of the Fund and related indexes, including the Russell 3000 Index, which represents approximately 98% of investable U.S. equities by market capitalization. The Fund seeks to provide appreciation of capital by investing primarily in domestic, mid cap common stocks that offer superior growth prospects.
Top Contributors to Performance
■ An overweight position in and solid stock selection among younger companies with strong analyst conviction contributed
positively to Fund relative performance.
■ By sector, stock selection in Consumer Discretionary and Information Technology aided performance.
■ Top individual Fund holdings that contributed positively to performance included overweight positions in AppLovin Corp.
(Class A), Allison Transmission Holdings, Inc. and Spotify Technology SA.
Top Detractors from Performance
■ An underweight position in companies with negative analyst conviction, positive free cash flow and weakening earnings to price
ratios detracted from Fund relative performance.
■ By sector, stock selection in Financials detracted from performance.
■ Top individual Fund holdings that detracted from performance were underweight positions in Palantir Technologies Inc.
(Class A) and Fair Isaac Corporation.
Annual Shareholder Report
Federated Hermes MDT Mid Cap Growth Fund
Keep in mind that the Fund’s past performance is not a good predictor of how the Fund will perform in the future. The graph and table do not reflect the deduction of taxes that a shareholder would pay on fund distributions or redemption of fund shares.
Cumulative Performance: 10/31/2014 to 10/31/2024
Total Return Based on $10,000 Investment
| Class C Shares | Russell 3000® Index | Morningstar Mid-Cap Growth Funds Average | Russell Midcap® Growth Index |
|---|
| 10/31/2014 | $10,000 | $10,000 | $10,000 | $10,000 |
| 10/31/2015 | $10,118 | $10,449 | $10,288 | $10,494 |
| 10/31/2016 | $9,837 | $10,892 | $10,193 | $10,536 |
| 10/31/2017 | $12,714 | $13,504 | $12,856 | $13,301 |
| 10/31/2018 | $13,805 | $14,395 | $13,522 | $14,118 |
| 10/31/2019 | $15,535 | $16,337 | $15,407 | $16,790 |
| 10/31/2020 | $18,203 | $17,995 | $18,615 | $20,339 |
| 10/31/2021 | $26,925 | $25,894 | $26,515 | $28,358 |
| 10/31/2022 | $19,702 | $21,617 | $18,653 | $20,151 |
| 10/31/2023 | $20,957 | $23,429 | $18,560 | $20,826 |
| 10/31/2024 | $30,895 | $32,298 | $24,950 | $28,880 |
Average Annual Total Returns
| Fund/Index | 1 Year | 5 Years | 10 Years |
|---|
| Class C Shares with sales load | 45.30% | 14.39% | 11.94% |
| Class C Shares without sales load | 46.30% | 14.39% | 11.94% |
Russell 3000®IndexFootnote Reference* | 37.86% | 14.60% | 12.44% |
Russell Midcap® Growth Index | 38.67% | 11.45% | 11.19% |
| Morningstar Mid-Cap Growth Funds Average | 34.44% | 10.17% | 9.55% |
| Footnote | Description |
Footnote* | The Fund has designated the Russell 3000® Index as its new broad-based securities market index in accordance with the SEC’s revised definition for such an index. |
Visit FederatedHermes.com/us/FundInformation and click on the link to your fund and share class for more recent performance information.
| Net Assets | $1,947,386,992 |
| Number of Investments | 126 |
| Portfolio Turnover | 75% |
| Total Advisory Fees Paid | $8,233,846 |
Annual Shareholder Report
Federated Hermes MDT Mid Cap Growth Fund
Top Sectors (% of Total Net Assets)
| Value | Value |
|---|
| Real Estate | 0.4% |
| Utilities | 0.9% |
| Materials | 1.6% |
| Consumer Staples | 2.1% |
| Energy | 3.1% |
| Communication Services | 5.0% |
| Financials | 11.4% |
| Health Care | 13.2% |
| Consumer Discretionary | 14.6% |
| Industrials | 18.6% |
| Information Technology | 23.3% |
Additional Information about the Fund
Additional information is available on the Fund’s website at FederatedHermes.com/us/FundInformation, including its:
• prospectus • financial information • holdings • proxy voting information
CUSIP 314172305
G01228-08-B (12/24)
Federated Securities Corp., Distributor
FederatedHermes.com/us
© 2024 Federated Hermes, Inc.
Federated Hermes MDT Mid Cap Growth Fund
Institutional Shares | FGSIX
Annual Shareholder Report - October 31, 2024
A Portfolio of Federated Hermes Equity Funds
This annual shareholder report contains important information about the Federated Hermes MDT Mid Cap Growth Fund (the "Fund") for the period of November 1, 2023 to October 31, 2024. You can find additional information at FederatedHermes.com/us/FundInformation. You can also request this information by contacting us at 1-800-341-7400, Option 4, or your financial advisor.
What were the Fund costs for the last year?
(based on a hypothetical $10,000 investment)
| Class Name | Costs of a $10,000 investment | Costs paid as a percentage of a $10,000 investment |
|---|
| Institutional Shares | $104 | 0.84% |
Management's Discussion of Fund Performance
The following discussion compares the performance of the Fund to the Russell Midcap Growth Index to show how the Fund’s performance compares to the returns of similar investments for the reporting period. See the Average Annual Total Returns table below for the returns of the Fund and related indexes, including the Russell 3000 Index, which represents approximately 98% of investable U.S. equities by market capitalization. The Fund seeks to provide appreciation of capital by investing primarily in domestic, mid cap common stocks that offer superior growth prospects.
Top Contributors to Performance
■ An overweight position in and solid stock selection among younger companies with strong analyst conviction contributed
positively to Fund relative performance.
■ By sector, stock selection in Consumer Discretionary and Information Technology aided performance.
■ Top individual Fund holdings that contributed positively to performance included overweight positions in AppLovin Corp.
(Class A), Allison Transmission Holdings, Inc. and Spotify Technology SA.
Top Detractors from Performance
■ An underweight position in companies with negative analyst conviction, positive free cash flow and weakening earnings to price
ratios detracted from Fund relative performance.
■ By sector, stock selection in Financials detracted from performance.
■ Top individual Fund holdings that detracted from performance were underweight positions in Palantir Technologies Inc.
(Class A) and Fair Isaac Corporation.
Annual Shareholder Report
Federated Hermes MDT Mid Cap Growth Fund
Keep in mind that the Fund’s past performance is not a good predictor of how the Fund will perform in the future. The graph and table do not reflect the deduction of taxes that a shareholder would pay on fund distributions or redemption of fund shares.
Cumulative Performance: 10/31/2014 to 10/31/2024
Total Return Based on $10,000 Investment
| Institutional Shares | Russell 3000® Index | Morningstar Mid-Cap Growth Funds Average | Russell Midcap® Growth Index |
|---|
| 10/31/2014 | $10,000 | $10,000 | $10,000 | $10,000 |
| 10/31/2015 | $10,219 | $10,449 | $10,288 | $10,494 |
| 10/31/2016 | $10,035 | $10,892 | $10,193 | $10,536 |
| 10/31/2017 | $13,097 | $13,504 | $12,856 | $13,301 |
| 10/31/2018 | $14,363 | $14,395 | $13,522 | $14,118 |
| 10/31/2019 | $16,336 | $16,337 | $15,407 | $16,790 |
| 10/31/2020 | $19,352 | $17,995 | $18,615 | $20,339 |
| 10/31/2021 | $28,925 | $25,894 | $26,515 | $28,358 |
| 10/31/2022 | $21,405 | $21,617 | $18,653 | $20,151 |
| 10/31/2023 | $22,829 | $23,429 | $18,560 | $20,826 |
| 10/31/2024 | $33,764 | $32,298 | $24,950 | $28,880 |
Average Annual Total Returns
| Fund/Index | 1 Year | 5 Years | 10 Years |
|---|
| Institutional Shares | 47.90% | 15.63% | 12.94% |
Russell 3000®IndexFootnote Reference* | 37.86% | 14.60% | 12.44% |
Russell Midcap® Growth Index | 38.67% | 11.45% | 11.19% |
| Morningstar Mid-Cap Growth Funds Average | 34.44% | 10.17% | 9.55% |
| Footnote | Description |
Footnote* | The Fund has designated the Russell 3000® Index as its new broad-based securities market index in accordance with the SEC’s revised definition for such an index. |
Visit FederatedHermes.com/us/FundInformation and click on the link to your fund and share class for more recent performance information.
| Net Assets | $1,947,386,992 |
| Number of Investments | 126 |
| Portfolio Turnover | 75% |
| Total Advisory Fees Paid | $8,233,846 |
Annual Shareholder Report
Federated Hermes MDT Mid Cap Growth Fund
Top Sectors (% of Total Net Assets)
| Value | Value |
|---|
| Real Estate | 0.4% |
| Utilities | 0.9% |
| Materials | 1.6% |
| Consumer Staples | 2.1% |
| Energy | 3.1% |
| Communication Services | 5.0% |
| Financials | 11.4% |
| Health Care | 13.2% |
| Consumer Discretionary | 14.6% |
| Industrials | 18.6% |
| Information Technology | 23.3% |
Additional Information about the Fund
Additional information is available on the Fund’s website at FederatedHermes.com/us/FundInformation, including its:
• prospectus • financial information • holdings • proxy voting information
CUSIP 314172198
G01228-08-C (12/24)
Federated Securities Corp., Distributor
FederatedHermes.com/us
© 2024 Federated Hermes, Inc.
Federated Hermes MDT Mid Cap Growth Fund
Annual Shareholder Report - October 31, 2024
A Portfolio of Federated Hermes Equity Funds
This annual shareholder report contains important information about the Federated Hermes MDT Mid Cap Growth Fund (the "Fund") for the period of November 1, 2023 to October 31, 2024. You can find additional information at FederatedHermes.com/us/FundInformation. You can also request this information by contacting us at 1-800-341-7400, Option 4, or your financial advisor.
What were the Fund costs for the last year?
(based on a hypothetical $10,000 investment)
| Class Name | Costs of a $10,000 investment | Costs paid as a percentage of a $10,000 investment |
|---|
| Class R6 Shares | $103 | 0.83% |
Management's Discussion of Fund Performance
The following discussion compares the performance of the Fund to the Russell Midcap Growth Index to show how the Fund’s performance compares to the returns of similar investments for the reporting period. See the Average Annual Total Returns table below for the returns of the Fund and related indexes, including the Russell 3000 Index, which represents approximately 98% of investable U.S. equities by market capitalization. The Fund seeks to provide appreciation of capital by investing primarily in domestic, mid cap common stocks that offer superior growth prospects.
Top Contributors to Performance
■ An overweight position in and solid stock selection among younger companies with strong analyst conviction contributed
positively to Fund relative performance.
■ By sector, stock selection in Consumer Discretionary and Information Technology aided performance.
■ Top individual Fund holdings that contributed positively to performance included overweight positions in AppLovin Corp.
(Class A), Allison Transmission Holdings, Inc. and Spotify Technology SA.
Top Detractors from Performance
■ An underweight position in companies with negative analyst conviction, positive free cash flow and weakening earnings to price
ratios detracted from Fund relative performance.
■ By sector, stock selection in Financials detracted from performance.
■ Top individual Fund holdings that detracted from performance were underweight positions in Palantir Technologies Inc.
(Class A) and Fair Isaac Corporation.
Annual Shareholder Report
Federated Hermes MDT Mid Cap Growth Fund
Keep in mind that the Fund’s past performance is not a good predictor of how the Fund will perform in the future. The graph and table do not reflect the deduction of taxes that a shareholder would pay on fund distributions or redemption of fund shares.
Cumulative Performance: 10/31/2014 to 10/31/2024
Total Return Based on $10,000 Investment
| Class R6 Shares | Russell 3000® Index | Morningstar Mid-Cap Growth Funds Average | Russell Midcap® Growth Index |
|---|
| 10/31/2014 | $10,000 | $10,000 | $10,000 | $10,000 |
| 10/31/2015 | $10,149 | $10,449 | $10,288 | $10,494 |
| 10/31/2016 | $9,903 | $10,892 | $10,193 | $10,536 |
| 10/31/2017 | $12,928 | $13,504 | $12,856 | $13,301 |
| 10/31/2018 | $14,177 | $14,395 | $13,522 | $14,118 |
| 10/31/2019 | $16,123 | $16,337 | $15,407 | $16,790 |
| 10/31/2020 | $19,099 | $17,995 | $18,615 | $20,339 |
| 10/31/2021 | $28,557 | $25,894 | $26,515 | $28,358 |
| 10/31/2022 | $21,133 | $21,617 | $18,653 | $20,151 |
| 10/31/2023 | $22,545 | $23,429 | $18,560 | $20,826 |
| 10/31/2024 | $33,345 | $32,298 | $24,950 | $28,880 |
Average Annual Total Returns
| Fund/Index | 1 Year | 5 Years | 10 Years |
|---|
| Class R6 Shares | 47.90% | 15.64% | 12.80% |
Russell 3000®IndexFootnote Reference* | 37.86% | 14.60% | 12.44% |
Russell Midcap® Growth Index | 38.67% | 11.45% | 11.19% |
| Morningstar Mid-Cap Growth Funds Average | 34.44% | 10.17% | 9.55% |
| Footnote | Description |
Footnote* | The Fund has designated the Russell 3000® Index as its new broad-based securities market index in accordance with the SEC’s revised definition for such an index. |
Visit FederatedHermes.com/us/FundInformation and click on the link to your fund and share class for more recent performance information.
| Net Assets | $1,947,386,992 |
| Number of Investments | 126 |
| Portfolio Turnover | 75% |
| Total Advisory Fees Paid | $8,233,846 |
Annual Shareholder Report
Federated Hermes MDT Mid Cap Growth Fund
Top Sectors (% of Total Net Assets)
| Value | Value |
|---|
| Real Estate | 0.4% |
| Utilities | 0.9% |
| Materials | 1.6% |
| Consumer Staples | 2.1% |
| Energy | 3.1% |
| Communication Services | 5.0% |
| Financials | 11.4% |
| Health Care | 13.2% |
| Consumer Discretionary | 14.6% |
| Industrials | 18.6% |
| Information Technology | 23.3% |
Additional Information about the Fund
Additional information is available on the Fund’s website at FederatedHermes.com/us/FundInformation, including its:
• prospectus • financial information • holdings • proxy voting information
CUSIP 314172529
G01228-08-D (12/24)
Federated Securities Corp., Distributor
FederatedHermes.com/us
© 2024 Federated Hermes, Inc.
(a) As of the end of the period covered by this report, the registrant has adopted a code of ethics (the “Section 406 Standards for Investment Companies - Ethical Standards for Principal Executive and Financial Officers”) that applies to the registrant’s Principal Executive Officer and Principal Financial Officer; the registrant’s Principal Financial Officer also serves as the Principal Accounting Officer.
(c) There was no amendment to the registrant’s code of ethics described in Item 2(a) above during the period covered by the report.
(d) There was no waiver granted, either actual or implicit, from a provision to the registrant’s code of ethics described in Item 2(a) above during the period covered by the report.
(e) Not Applicable
(f)(3) The registrant hereby undertakes to provide any person, without charge, upon request, a copy of the code of ethics. To request a copy of the code of ethics, contact the registrant at 1-800-341-7400, and ask for a copy of the Section 406 Standards for Investment Companies - Ethical Standards for Principal Executive and Financial Officers.
| Item 3. | Audit Committee Financial Expert |
The registrant’s Board has determined that each of the following members of the Board’s Audit Committee is an “audit committee financial expert,” and is “independent,” for purposes of this Item 3: Thomas M. O’Neill and John S. Walsh.
| Item 4. | Principal Accountant Fees and Services |
(a) Audit Fees billed to the registrant for the two most recent fiscal years:
Fiscal year ended 2024 – $345,529
Fiscal year ended 2023 - $328,128
(b) Audit-Related Fees billed to the registrant for the two most recent fiscal years:
Fiscal year ended 2024 - $0
Fiscal year ended 2023 - $0
Amount requiring approval of the registrant’s Audit Committee pursuant to paragraph (c)(7)(ii) of Rule 2-01 of Regulation S-X, $1,530 and $0 respectively. Fiscal year ended 2024- Travel expenses for attendance at Board meeting.
(c) Tax Fees billed to the registrant for the two most recent fiscal years:
Fiscal year ended 2024 - $0
Fiscal year ended 2023 - $0
Amount requiring approval of the registrant’s Audit Committee pursuant to paragraph (c)(7)(ii) of Rule 2-01 of Regulation S-X, $0 and $0 respectively.
(d) All Other Fees billed to the registrant for the two most recent fiscal years:
Fiscal year ended 2024 - $0
Fiscal year ended 2023 - $0
Amount requiring approval of the registrant’s Audit Committee pursuant to paragraph (c)(7)(ii) of Rule 2-01 of Regulation S-X, $28,653 and $64,383 respectively. Fiscal year ended 2024- Service fees for analysis of potential Passive Foreign Investment Company holdings. Fiscal year ended 2023- Service fees for analysis of potential Passive Foreign Investment Company holdings.
(e)(1) Audit Committee Policies regarding Pre-approval of Services.
The Audit Committee is required to pre-approve audit and non-audit services performed by the independent auditor in order to assure that the provision of such services do not impair the auditor’s independence. The Audit Committee is required to pre-concur with independence conclusions made by the independent auditor regarding non-audit services to be provided by the independent auditor to the Funds, the Funds Board of Directors, or any entity that is controlled directly or indirectly by the Funds. Unless a type of service to be provided by the independent auditor has received general pre-approval, it will require specific pre-approval(and pre-concurrence for non-audit services) by the Audit Committee. Any proposed services exceeding pre-approved cost levels will require specific pre-approval by the Audit Committee.
Certain services have the general pre-approval of the Audit Committee. The term of the general pre-approval is 12 months from the date of pre-approval, unless the Audit Committee specifically provides for a different period. The Audit Committee will annually review the services that may be provided by the independent auditor without obtaining specific pre-approval from the Audit Committee and may grant general pre-approval for such services. The Audit Committee will revise the list of general pre-approved services from time to time, based on subsequent determinations. The Audit Committee will not delegate to management its responsibilities to pre-approve services performed by the independent auditor.
The Audit Committee has delegated pre-approval/pre-concurrence authority to its chairman (the “Chairman”) for services that do not exceed a specified dollar threshold. The Chairman or Chief Audit Executive will report any such pre-approval/pre-concurrence decisions to the Audit Committee at its next scheduled meeting. The Committee will designate another member with such pre-approval/pre-concurrence authority when the Chairman is unavailable.
AUDIT SERVICES
The annual audit services engagement terms and fees will be subject to the specific pre-approval of the Audit Committee. The Audit Committee will approve, if necessary, any changes in terms, conditions and fees resulting from changes in audit scope, registered investment company (RIC) structure or other matters.
In addition to the annual audit services engagement specifically approved by the Audit Committee, the Audit Committee may grant general pre-approval for other audit services, which are those services that only the independent auditor reasonably can provide. The Audit Committee has pre-approved certain audit services; with limited exception, all other audit services must be specifically pre-approved by the Audit Committee.
AUDIT-RELATED SERVICES
Audit-related services are assurance and related services that are reasonably related to the performance of the audit or review of the RIC’s financial statements or that are traditionally performed by the independent auditor. The Audit Committee believes that the provision of audit-related services does not impair the independence of the auditor, and has pre-approved certain audit-related services; all other audit-related services must be specifically pre-approved by the Audit Committee.
TAX SERVICES
The Audit Committee believes that the independent auditor can provide tax services to the RIC such as tax compliance, tax planning and tax advice without impairing the auditor’s independence. However, the Audit Committee will not permit the retention of the independent auditor in connection with a transaction initially recommended by the independent auditor, the purpose of which may be tax avoidance and the tax treatment of which may not be supported in the Internal Revenue Code and related regulations. The Audit Committee has pre-approved/pre-concurred certain tax services; with limited exception, all tax services involving large and complex transactions must be specifically pre-approved/pre-concurred by the Audit Committee.
ALL OTHER SERVICES
With respect to the provision of permissible services other than audit, review or attest services the pre-approval/pre-concurrence requirement is waived if:
(1) With respect to such services rendered to the Funds, the aggregate amount of all such services provided constitutes no more than five percent of the total amount of revenues paid by the audit client to its accountant during the fiscal year in which the services are provided; and,
(2) With respect to such services rendered to the Fund’s investment adviser ( the “Adviser”)and any entity controlling, controlled by to under common control with the Adviser such as affiliated non-U.S. and U.S. funds not under the Audit Committee’s purview and which do not fall within a category of service which has been determined by the Audit Committee not to have a direct impact on the operations or financial reporting of the RIC, the aggregate amount of all services provided constitutes no more than five percent of the total amount of revenues paid to the RIC’s auditor by the RIC, its Adviser and any entity controlling, controlled by, or under common control with the Adviser during the fiscal year in which the services are provided; and
(3) Such services were not recognized by the issuer or RIC at the time of the engagement to be non-audit services; and
(4) Such services are promptly brought to the attention of the Audit Committee and approved prior to the completion of the audit by the Audit Committee or by one or more members of the Audit Committee who are members of the Board of Directors to whom authority to grant such approvals has been delegated by the Audit Committee.
The Audit Committee may grant general pre-approval/pre-concurrence to those permissible non-audit services which qualify for pre-approval and which it believes are routine and recurring services, and would not impair the independence of the auditor.
The Securities and Exchange Commission’s (the “SEC”) rules and relevant guidance should be consulted to determine the precise definitions of these services and applicability of exceptions to certain of the prohibitions.
PRE-APPROVAL FEE LEVELS
Pre-approval fee levels for all services to be provided by the independent auditor will be established annually by the Audit Committee. Any proposed services exceeding these levels will require specific pre-approval by the Audit Committee.
PROCEDURES
Requests or applications to provide services that require specific approval/concurrence by the Audit Committee will be submitted to the Audit Committee by the Fund’s Principal Accounting Officer and/or the Chief Audit Executive of Federated Hermes, Inc., only after those individuals have determined that the request or application is consistent with the SEC’s rules on auditor independence.
(e)(2) Percentage of services identified in items 4(b) through 4(d) that were approved by the registrant’s Audit Committee pursuant to paragraph (c)(7)(i)(C) of Rule 2-01 of Regulation S-X:
4(b)
Fiscal year ended 2024 – 0%
Fiscal year ended 2023 - 0%
Percentage of services provided to the registrant’s Adviser and any entity controlling, controlled by, or under common control with the Adviser that provides ongoing services to the registrant that were approved by the registrant’s Audit Committee pursuant to paragraph (c)(7)(i)(C) of Rule 2-01 of Regulation S-X, 0% and 0% respectively.
4(c)
Fiscal year ended 2024 – 0%
Fiscal year ended 2023 – 0%
Percentage of services provided to the registrant’s Adviser and any entity controlling, controlled by, or under common control with the Adviser that provides ongoing services to the registrant that were approved by the registrant’s Audit Committee pursuant to paragraph (c)(7)(i)(C) of Rule 2-01 of Regulation S-X, 0% and 0% respectively.
4(d)
Fiscal year ended 2024 – 0%
Fiscal year ended 2023 – 0%
Percentage of services provided to the registrant’s Adviser and any entity controlling, controlled by, or under common control with the Adviser that provides ongoing services to the registrant that were approved by the registrant’s Audit Committee pursuant to paragraph (c)(7)(i)(C) of Rule 2-01 of Regulation S-X, 0% and 0% respectively.
(f) NA
(g) Non-Audit Fees billed to the registrant, the registrant’s Adviser, and certain entities controlling, controlled by or under common control with the Adviser:
Fiscal year ended 2024 - $223,415
Fiscal year ended 2023 - $272,108
(h) The registrant’s Audit Committee has considered that the provision of non-audit services that were rendered to the registrant’s Adviser (not including any sub-adviser whose role is primarily portfolio management and is subcontracted with or overseen by another investment adviser), and any entity controlling, controlled by, or under common control with the Adviser that provides ongoing services to the registrant that were not pre-approved pursuant to paragraph (c)(7)(ii) of Rule 2-01 of Regulation S-X is compatible with maintaining the principal accountant’s independence.
| Item 5. | Audit Committee of Listed Registrants |
Not Applicable
| Item 6. | Schedule of Investments |
(a) The registrant’s Schedule of Investments is included as part of the Financial Statements filed under Item 7 of this form.
(b) Not Applicable
| Item 7. | Financial Statements and Financial Highlights for Open-End Management Companies |
Annual Financial Statements
and Additional Information
Federated Hermes Kaufmann Fund
A Portfolio of Federated Hermes Equity FundsNot FDIC Insured ▪ May Lose Value ▪ No Bank Guarantee
Portfolio of Investments
| | | |
| | | |
| | Communication Services—2.2% | |
| | | |
| | | |
| | | |
| | | |
| | | |
| | Universal Music Group N.V. | |
| | | |
| | Consumer Discretionary—11.0% | |
| | | |
| | | |
| | | |
| | Chipotle Mexican Grill, Inc. | |
| | | |
| | | |
| | | |
| | Floor & Decor Holdings, Inc. | |
| | | |
| | | |
| | | |
| | | |
| | | |
| | | |
| | | |
| | | |
| | | |
| | | |
| | | |
| | | |
| | | |
| | Philip Morris International, Inc. | |
| | | |
| | | |
| | New Fortress Energy, Inc. | |
| | | |
| | Apollo Global Management, Inc. | |
| | | |
| | | |
| | FA Private Equity Fund IV LP | |
| | | |
| | London Stock Exchange Group PLC | |
| | | |
| | | |
| | | |
| | | |
| | | |
| | Albireo Pharma CVR, Rights | |
| | Amphastar Pharmaceuticals, Inc. | |
| | Arcturus Therapeutics Holdings, Inc. | |
| | | |
Annual Financial Statements and Additional Information
| | | |
| | | |
| | | |
| | | |
| | | |
| | | |
| | Contra Akouos, Inc., Rights | |
| | | |
| | | |
| | Dynavax Technologies Corp. | |
| | | |
| | | |
| | EyePoint Pharmaceuticals, Inc. | |
| | | |
| | | |
| | Inspire Medical Systems, Inc. | |
| | | |
| | Intellia Therapeutics, Inc. | |
| | | |
| | | |
| | Legend Biotech Corp., ADR | |
| | | |
| | Minerva Neurosciences, Inc. | |
| | Moonlake Immunotherapeutics | |
| | | |
| | | |
| | Phathom Pharmaceuticals, Inc. | |
| | PROCEPT BioRobotics Corp. | |
| | Regulus Therapeutics, Inc. | |
| | Regulus Therapeutics, Inc. - Rights | |
| | | |
| | | |
| | Rhythm Pharmaceuticals, Inc. | |
| | | |
| | Sarepta Therapeutics, Inc. | |
| | | |
| | | |
| | Structure Therapeutics, Inc., ADR | |
| | | |
| | Syndax Pharmaceuticals, Inc. | |
| | | |
| | Ultragenyx Pharmaceutical, Inc. | |
| | | |
| | | |
| | | |
| | | |
| | | |
| | Xenon Pharmaceuticals, Inc. | |
| | | |
| | | |
| | | |
| | | |
| | | |
| | | |
| | Comfort Systems USA, Inc. | |
Annual Financial Statements and Additional Information
| | | |
| | | |
| | | |
| | | |
| | | |
| | | |
| | | |
| | | |
| | | |
| | | |
| | | |
| | | |
| | | |
| | | |
| | | |
| | | |
| | Information Technology—18.1% | |
| | | |
| | Advanced Micro Devices, Inc. | |
| | Crowdstrike Holdings, Inc. | |
| | | |
| | | |
| | | |
| | | |
| | | |
| | | |
| | | |
| | | |
| | | |
| | | |
| | | |
| | | |
| | | |
| | | |
| | | |
| | Sensable Technologies, Inc. | |
| | | |
| | | |
| | | |
| | | |
| | Taiwan Semiconductor Manufacturing Co. Ltd., ADR | |
| | | |
| | | |
| | | |
| | | |
| | | |
| | | |
| | | |
| | | |
| | Martin Marietta Materials | |
| | | |
| | | |
| | | |
| | | |
| | Americold Realty Trust, Inc. | |
Annual Financial Statements and Additional Information
| | | |
| | | |
| | | |
| | | |
| | Gaming and Leisure Properties, Inc. | |
| | Healthpeak Properties, Inc. | |
| | Ryman Hospitality Properties, Inc. | |
| | | |
| | | |
| | | |
| | American Electric Power Co., Inc. | |
| | | |
| | | |
| | | |
| | TOTAL COMMON STOCKS
(IDENTIFIED COST $2,770,853,157) | |
| | | |
| | | |
| | | |
| | Regulus Therapeutics, Inc. | |
| | Regulus Therapeutics, Inc., Conv. Pfd., 1.000% | |
| | | |
| | Information Technology—0.0% | |
| | Multiplex, Inc., Pfd., Series C | |
| | TOTAL PREFERRED STOCKS
(IDENTIFIED COST $29,655,052) | |
| | | |
| | | |
| | Minerva Neurosciences, Inc., Warrants 12/31/2099 | |
| | Rezolute, Inc., Warrants 10/8/2027 | |
| | Rezolute, Inc., Warrants 1/1/2099 | |
| | Rezolute, Inc., Warrants 6/24/2099 | |
| | Rezolute, Inc., Warrants 12/31/2099 | |
| | Scynexis, Inc., Warrants 1/1/2099 | |
| | Scynexis, Inc., Warrants 4/26/2029 | |
| | TOTAL WARRANTS
(IDENTIFIED COST $23,318,039) | |
| | | |
| | Federated Hermes Government Obligations Fund, Premier Shares, 4.77%6 (IDENTIFIED COST $24,022,661) | |
| | TOTAL INVESTMENT IN SECURITIES—100.4%
(IDENTIFIED COST $2,847,848,909)7 | |
| | OTHER ASSETS AND LIABILITIES - NET—(0.4)%8 | |
| | | |
Annual Financial Statements and Additional Information
An affiliated company is a company in which the Fund, alone or in combination with other Federated Hermes funds, has ownership of at least 5% of the voting shares. Transactions with affiliated companies during the period ended October 31, 2024, were as follows:
| | | | Change in
Unrealized
Appreciation/
(Depreciation) | | | Shares
Held as of
10/31/2024 | |
| | | | | | | | |
Amphastar Pharmaceuticals, Inc.** | | | | | | | | |
Arcturus Therapeutics Holdings, Inc. | | | | | | | | |
| | | | | | | | |
Dynavax Technologies Corp.** | | | | | | | | |
EyePoint Pharmaceuticals, Inc. | | | | | | | | |
| | | | | | | | |
| | | | | | | | |
Minerva Neurosciences, Inc. | | | | | | | | |
Regulus Therapeutics, Inc. | | | | | | | | |
Regulus Therapeutics, Inc. - Rights | | | | | | | | |
| | | | | | | | |
Rezolute, Inc., Warrants 10/8/2027 | | | | | | | | |
Rezolute, Inc., Warrants 1/1/2099 | | | | | | | | |
Rezolute, Inc., Warrants 6/24/2099 | | | | | | | | |
Rezolute, Inc., Warrants 12/31/2099 | | | | | | | | |
Rhythm Pharmaceuticals, Inc.** | | | | | | | | |
| | | | | | | | |
Scynexis, Inc., Warrants 1/1/2099 | | | | | | | | |
Scynexis, Inc., Warrants 4/26/2029 | | | | | | | | |
Affiliated issuers no longer in the port- folio at period end | | | | | | | | |
TOTAL OF AFFILIATED COMPANIES
TRANSACTIONS | | | | | | | | |
| At October 31, 2024, the Fund no longer has ownership of at least 5% of the voting shares. |
Transactions with affiliated investment companies, which are funds managed by the Adviser or an affiliate of the Adviser, during the period ended October 31, 2024, were as follows:
| Federated
Hermes
Government
Obligations
Fund,
Premier
Shares* | Federated
Hermes
Institutional
Prime Value
Obligations
Fund,
Institutional
Shares* | Total of
Affiliated
Transactions |
| | | |
| | | |
| | | |
Change in Unrealized Appreciation/Depreciation | | | |
| | | |
| | | |
Shares Held as of 10/31/2024 | | | |
| | | |
| All or a portion of the balance/activity for the fund relates to cash collateral received on securities lending transactions. |
Annual Financial Statements and Additional Information
| Non-income-producing security. |
| Market quotations and price evaluations are not available. Fair value determined using significant unobservable inputs in accordance with procedures established by and under the general supervision of the Fund’s Adviser acting through its Valuation Committee. |
| Denotes a restricted security that either: (a) cannot be offered for public sale without first being registered, or availing of an exemption from registration, under the Securities Act of 1933; or (b) is subject to a contractual restriction on public sales. At October 31, 2024, these restricted securities amounted to $18,468,414, which represented 0.4% of total net assets. |
| All or a portion of these securities are temporarily on loan to unaffiliated broker/dealers. |
| Equity security is subject to lock-up or market standoff agreement. As of period end, the total fair value of equity securities subject to contractual sale restriction is $3,790,596 and all restrictions are set to expire on or before March 11, 2025. Under normal market conditions, there are no circumstances that could cause the restrictions to lapse. |
| |
| The cost of investments for federal tax purposes amounts to $2,907,888,070. |
| Assets, other than investments in securities, less liabilities. See Statement of Assets and Liabilities. |
Note: The categories of investments are shown as a percentage of total net assets at October 31, 2024.
Various inputs are used in determining the value of the Fund’s investments. These inputs are summarized in the three broad levels listed below:
Level 1—quoted prices in active markets for identical securities.
Level 2—other significant observable inputs (including quoted prices for similar securities, interest rates, prepayment speeds, credit risk, etc.). Also includes securities valued at amortized cost.
Level 3—significant unobservable inputs (including the Fund’s own assumptions in determining the fair value of investments).
The inputs or methodology used for valuing securities are not an indication of the risk associated with investing in those securities.
The following is a summary of the inputs used, as of October 31, 2024, in valuing the Fund’s assets carried at fair value:
|
| | Level 2—
Other
Significant
Observable
Inputs | Level 3—
Significant
Unobservable
Inputs | |
| | | | |
| | | | |
| | | | |
| | | | |
| | | | |
| | | | |
| | | | |
| | | | |
| | | | |
| | | | |
| | | | |
The following acronym(s) are used throughout this portfolio: | |
| —American Depositary Receipt |
| |
See Notes which are an integral part of the Financial Statements
Annual Financial Statements and Additional Information
Financial Highlights–Class A Shares
(For a Share Outstanding Throughout Each Period)
| |
| | | | | |
Net Asset Value, Beginning of Period | | | | | |
Income From Investment Operations: | | | | | |
Net investment income (loss)1 | | | | | |
Net realized and unrealized gain (loss) | | | | | |
Total From Investment Operations | | | | | |
| | | | | |
Distributions from net realized gain | | | | | |
Net Asset Value, End of Period | | | | | |
| | | | | |
Ratios to Average Net Assets: | | | | | |
| | | | | |
Net investment income (loss) | | | | | |
Expense waiver/reimbursement4 | | | | | |
| | | | | |
Net assets, end of period (000 omitted) | | | | | |
| | | | | |
| Per share numbers have been calculated using the average shares method. |
| Based on net asset value, which does not reflect the sales charge, redemption fee or contingent deferred sales charge, if applicable. |
| Amount does not reflect net expenses incurred by investment companies in which the Fund may invest. |
| This expense decrease is reflected in both the net expense and the net investment income (loss) ratios shown above. Amount does not reflect expense waiver/ reimbursement recorded by investment companies in which the Fund may invest. |
| Represents less than 0.01%. |
| Securities that mature are considered sales for purposes of this calculation. |
See Notes which are an integral part of the Financial Statements
Annual Financial Statements and Additional Information
Financial Highlights–Class C Shares
(For a Share Outstanding Throughout Each Period)
| |
| | | | | |
Net Asset Value, Beginning of Period | | | | | |
Income From Investment Operations: | | | | | |
Net investment income (loss)1 | | | | | |
Net realized and unrealized gain (loss) | | | | | |
Total From Investment Operations | | | | | |
| | | | | |
Distributions from net realized gain | | | | | |
Net Asset Value, End of Period | | | | | |
| | | | | |
Ratios to Average Net Assets: | | | | | |
| | | | | |
Net investment income (loss) | | | | | |
Expense waiver/reimbursement4 | | | | | |
| | | | | |
Net assets, end of period (000 omitted) | | | | | |
| | | | | |
| Per share numbers have been calculated using the average shares method. |
| Based on net asset value, which does not reflect the sales charge, redemption fee or contingent deferred sales charge, if applicable. |
| Amount does not reflect net expenses incurred by investment companies in which the Fund may invest. |
| This expense decrease is reflected in both the net expense and the net investment income (loss) ratios shown above. Amount does not reflect expense waiver/ reimbursement recorded by investment companies in which the Fund may invest. |
| Represents less than 0.01%. |
| Securities that mature are considered sales for purposes of this calculation. |
See Notes which are an integral part of the Financial Statements
Annual Financial Statements and Additional Information
Financial Highlights–Class R Shares
(For a Share Outstanding Throughout Each Period)
| |
| | | | | |
Net Asset Value, Beginning of Period | | | | | |
Income From Investment Operations: | | | | | |
Net investment income (loss)1 | | | | | |
Net realized and unrealized gain (loss) | | | | | |
Total From Investment Operations | | | | | |
| | | | | |
Distributions from net realized gain | | | | | |
Net Asset Value, End of Period | | | | | |
| | | | | |
Ratios to Average Net Assets: | | | | | |
| | | | | |
Net investment income (loss) | | | | | |
Expense waiver/reimbursement4 | | | | | |
| | | | | |
Net assets, end of period (000 omitted) | | | | | |
| | | | | |
| Per share numbers have been calculated using the average shares method. |
| Based on net asset value. |
| Amount does not reflect net expenses incurred by investment companies in which the Fund may invest. |
| This expense decrease is reflected in both the net expense and the net investment income (loss) ratios shown above. Amount does not reflect expense waiver/ reimbursement recorded by investment companies in which the Fund may invest. |
| Securities that mature are considered sales for purposes of this calculation. |
See Notes which are an integral part of the Financial Statements
Annual Financial Statements and Additional Information
Financial Highlights–Institutional Shares
(For a Share Outstanding Throughout Each Period)
| |
| | | | | |
Net Asset Value, Beginning of Period | | | | | |
Income From Investment Operations: | | | | | |
Net investment income (loss)1 | | | | | |
Net realized and unrealized gain (loss) | | | | | |
Total From Investment Operations | | | | | |
| | | | | |
Distributions from net realized gain | | | | | |
Net Asset Value, End of Period | | | | | |
| | | | | |
Ratios to Average Net Assets: | | | | | |
| | | | | |
Net investment income (loss) | | | | | |
Expense waiver/reimbursement5 | | | | | |
| | | | | |
Net assets, end of period (000 omitted) | | | | | |
| | | | | |
| Per share numbers have been calculated using the average shares method. |
| Represents less than $0.01. |
| Based on net asset value. |
| Amount does not reflect net expenses incurred by investment companies in which the Fund may invest. |
| This expense decrease is reflected in both the net expense and the net investment income (loss) ratios shown above. Amount does not reflect expense waiver/ reimbursement recorded by investment companies in which the Fund may invest. |
| Represents less than 0.01%. |
| Securities that mature are considered sales for purposes of this calculation. |
See Notes which are an integral part of the Financial Statements
Annual Financial Statements and Additional Information
Statement of Assets and LiabilitiesOctober 31, 2024
| |
Investment in securities, at value including $22,913,229 of securities loaned and $350,417,725 of investments in affiliated holdings* (identified cost $2,847,848,909, including $347,593,831 of identified cost in affiliated holdings) | |
Cash denominated in foreign currencies (identified cost $51,470) | |
| |
Income receivable from affiliated holdings | |
Receivable for investments sold | |
Receivable for shares sold | |
| |
| |
Payable for investments purchased | |
Payable for shares redeemed | |
| |
Payable for collateral due to broker for securities lending (Note 2) | |
Payable for investment adviser fee (Note 5) | |
Payable for administrative fee (Note 5) | |
Payable for Directors’/Trustees’ fees (Note 5) | |
Payable for distribution services fee (Note 5) | |
Payable for other service fees (Notes 2 and 5) | |
Accrued expenses (Note 5) | |
| |
Net assets for 827,545,016 shares outstanding | |
| |
| |
Total distributable earnings (loss) | |
| |
Net Asset Value, Offering Price and Redemption Proceeds Per Share: | |
| |
Net asset value per share ($1,106,332,554 ÷ 183,298,103 shares outstanding), no par value, unlimited shares authorized | |
Offering price per share (100/94.50 of $6.04) | |
Redemption proceeds per share | |
| |
Net asset value per share ($43,070,938 ÷ 10,107,638 shares outstanding), no par value, unlimited shares authorized | |
| |
Redemption proceeds per share (99.00/100 of $4.26) | |
| |
Net asset value per share ($3,547,368,509 ÷ 586,162,826 shares outstanding), no par value, unlimited shares authorized | |
| |
Redemption proceeds per share | |
| |
Net asset value per share ($305,333,854 ÷ 47,976,449 shares outstanding), no par value, unlimited shares authorized | |
| |
Redemption proceeds per share | |
| See information listed after the Fund’s Portfolio of Investments. |
See Notes which are an integral part of the Financial Statements
Annual Financial Statements and Additional Information
Statement of OperationsYear Ended October 31, 2024
| |
Dividends (including $2,943,281 received from affiliated holdings* and net of foreign taxes withheld of $628,196) | |
| |
Net income on securities loaned (includes $5,083,982 earned from affiliated holdings related to cash collateral balances) (Note 2) | |
| |
| |
Investment adviser fee (Note 5) | |
Administrative fee (Note 5) | |
| |
Transfer agent fees (Note 2) | |
Directors’/Trustees’ fees (Note 5) | |
| |
| |
Portfolio accounting fees | |
Distribution services fee (Note 5) | |
Other service fees (Notes 2 and 5) | |
| |
| |
| |
| |
Waiver and Reimbursement: | |
Reimbursement of investment adviser fee (Note 5) | |
Waiver of other operating expenses (Note 5) | |
TOTAL WAIVER AND REIMBURSEMENT | |
| |
Net investment income (loss) | |
Realized and Unrealized Gain (Loss) on Investments and Foreign Currency Transactions: | |
Net realized gain on investments (including net realized gain of $174,875,364 on sales of investments in affiliated holdings*) | |
Net realized gain on foreign currency transactions | |
Net change in unrealized appreciation of investments (including net change in unrealized depreciation of $4,227,398 on investments in affiliated holdings*) | |
Net change in unrealized appreciation of translation of assets and liabilities in foreign currency | |
Net realized and unrealized gain (loss) on investments and foreign currency transactions | |
Change in net assets resulting from operations | |
| See information listed after the Fund’s Portfolio of Investments. |
See Notes which are an integral part of the Financial Statements
Annual Financial Statements and Additional Information
Statement of Changes in Net Assets
| | |
Increase (Decrease) in Net Assets | | |
| | |
| | |
| | |
Net change in unrealized appreciation/depreciation | | |
CHANGE IN NET ASSETS RESULTING FROM OPERATIONS | | |
Distributions to Shareholders: | | |
| | |
| | |
| | |
| | |
CHANGE IN NET ASSETS RESULTING FROM DISTRIBUTIONS TO SHAREHOLDERS | | |
| | |
Proceeds from sale of shares | | |
Net asset value of shares issued to shareholders in payment of distributions declared | | |
| | |
CHANGE IN NET ASSETS RESULTING FROM SHARE TRANSACTIONS | | |
| | |
| | |
| | |
| | |
See Notes which are an integral part of the Financial Statements
Annual Financial Statements and Additional Information
Notes to Financial Statements
Federated Hermes Equity Funds (the “Trust”) is registered under the Investment Company Act of 1940, as amended (the “Act”), as an open-end management investment company. The Trust consists of eight portfolios. The financial statements included herein are only those of Federated Hermes Kaufmann Fund (the “Fund”), a diversified portfolio. The financial statements of the other portfolios are presented separately. The assets of each portfolio are segregated and a shareholder’s interest is limited to the portfolio in which shares are held. Each portfolio pays its own expenses. The Fund offers four classes of shares: Class A Shares, Class C Shares, Class R Shares and Institutional Shares. All shares of the Fund have equal rights with respect to voting, except on class-specific matters. The investment objective of the Fund is to provide capital appreciation.
At the close of business on February 3, 2023, Class B Shares were converted into the Fund’s existing Class A Shares pursuant to a Plan of Conversion approved by the Fund’s Board of Trustees (the “Trustees”). The conversion occurred on a tax-free basis. The cash value of a shareholder’s investment was not changed as a result of the share class conversion. No action was required by shareholders to effect the conversion.
The Fund’s Trustees approved the replacement of Federated Equity Management Company of Pennsylvania with Federated Global Investment Management Corp. (“Fed Global”) as Adviser to the Fund, effective August 1, 2024. Previously, Fed Global served as the Fund’s Sub-Adviser.
2. SIGNIFICANT ACCOUNTING POLICIES
The following is a summary of significant accounting policies consistently followed by the Fund in the preparation of its financial statements. These policies are in conformity with U.S. generally accepted accounting principles (GAAP).
In calculating its net asset value (NAV), the Fund generally values investments as follows:
■
Equity securities listed on an exchange or traded through a regulated market system are valued at their last reported sale price or official closing price in their principal exchange or market.
■
Shares of other mutual funds or non-exchange-traded investment companies are valued based upon their reported NAVs, or NAV per share practical expedient, as applicable.
■
Fixed-income securities are fair valued using price evaluations provided by a pricing service approved by Fed Global (the “Adviser”).
■
Derivative contracts listed on exchanges are valued at their reported settlement or closing price, except that options are valued at the mean of closing bid and ask quotations.
■
Over-the-counter (OTC) derivative contracts are fair valued using price evaluations provided by a pricing service approved by the Adviser.
■
For securities that are fair valued in accordance with procedures established by and under the general supervision of the Adviser, certain factors may be considered, such as: the last traded or purchase price of the security, information obtained by contacting the issuer or dealers, analysis of the issuer’s financial statements or other available documents, fundamental analytical data, the nature and duration of restrictions on disposition, the movement of the market in which the security is normally traded, public trading in similar securities or derivative contracts of the issuer or comparable issuers, movement of a relevant index, or other factors including but not limited to industry changes and relevant government actions.
If any price, quotation, price evaluation or other pricing source is not readily available when the NAV is calculated, if the Fund cannot obtain price evaluations from a pricing service or from more than one dealer for an investment within a reasonable period of time as set forth in the Adviser’s valuation policies and procedures for the Fund, or if information furnished by a pricing service, in the opinion of the Adviser’s valuation committee (“Valuation Committee”), is deemed not representative of the fair value of such security, the Fund uses the fair value of the investment determined in accordance with the procedures described below. There can be no assurance that the Fund could obtain the fair value assigned to an investment if it sold the investment at approximately the time at which the Fund determines its NAV per share, and the actual value obtained could be materially different.
Fair Valuation and Significant Events Procedures
Pursuant to Rule 2a-5 under the Act, the Trustees have designated the Adviser as the Fund’s valuation designee to perform any fair value determinations for securities and other assets held by the Fund. The Adviser is subject to the Trustees’ oversight and certain reporting and other requirements intended to provide the Trustees the information needed to oversee the Adviser’s fair value determinations.
The Adviser, acting through its Valuation Committee, is responsible for determining the fair value of investments for which market quotations are not readily available. The Valuation Committee is comprised of officers of the Adviser and certain of the Adviser’s affiliated companies and determines fair value and oversees the calculation of the NAV. The Valuation Committee is also authorized to use pricing services to provide fair value evaluations of the current value of certain investments for purposes of calculating the NAV. The Valuation Committee employs various methods for reviewing third-party pricing-service evaluations including periodic reviews of third-party pricing services’ policies, procedures and valuation methods (including key inputs, methods, models and assumptions), transactional back-testing, comparisons of evaluations of different pricing services, and review of price challenges by the Adviser based on recent market activity. In the event that market quotations and price evaluations are not available for an investment, the Valuation Committee determines the fair value of the investment in accordance with procedures adopted by the Adviser. The Trustees periodically review the fair valuations made by the Valuation Committee. The Trustees have also approved the Adviser’s fair valuation and significant events procedures as part of the Fund’s compliance program and will review any changes made to the procedures.
Annual Financial Statements and Additional Information
Factors considered by pricing services in evaluating an investment include the yields or prices of investments of comparable quality, coupon, maturity, call rights and other potential prepayments, terms and type, reported transactions, indications as to values from dealers and general market conditions. Some pricing services provide a single price evaluation reflecting the bid-side of the market for an investment (a “bid” evaluation). Other pricing services offer both bid evaluations and price evaluations indicative of a price between the prices bid and ask for the investment (a “mid” evaluation). The Fund normally uses bid evaluations for any U.S. Treasury and Agency securities, mortgage-backed securities and municipal securities. The Fund normally uses mid evaluations for any other types of fixed-income securities and any OTC derivative contracts. In the event that market quotations and price evaluations are not available for an investment, the fair value of the investment is determined in accordance with procedures adopted by the Adviser.
The Adviser has also adopted procedures requiring an investment to be priced at its fair value whenever the Valuation Committee determines that a significant event affecting the value of the investment has occurred between the time as of which the price of the investment would otherwise be determined and the time as of which the NAV is computed. An event is considered significant if there is both an affirmative expectation that the investment’s value will change in response to the event and a reasonable basis for quantifying the resulting change in value. Examples of significant events that may occur after the close of the principal market on which a security is traded, or after the time of a price evaluation provided by a pricing service or a dealer, include:
■
With respect to securities traded principally in foreign markets, significant trends in U.S. equity markets or in the trading of foreign securities index futures contracts;
■
Political or other developments affecting the economy or markets in which an issuer conducts its operations or its securities are traded;
■
Announcements concerning matters such as acquisitions, recapitalizations, litigation developments, or a natural disaster affecting the issuer’s operations or regulatory changes or market developments affecting the issuer’s industry.
The Adviser has adopted procedures whereby the Valuation Committee uses a pricing service to provide factors to update the fair value of equity securities traded principally in foreign markets from the time of the close of their respective foreign stock exchanges to the pricing time of the Fund. For other significant events, the Fund may seek to obtain more current quotations or price evaluations from alternative pricing sources. If a reliable alternative pricing source is not available, the Valuation Committee will determine the fair value of the investment in accordance with the fair valuation procedures approved by the Adviser. The Trustees periodically review fair valuations made in response to significant events.
The Fund may invest in repurchase agreements for short-term liquidity purposes. It is the policy of the Fund to require the other party to a repurchase agreement to transfer to the Fund’s custodian or sub-custodian eligible securities or cash with a market value (after transaction costs) at least equal to the repurchase price to be paid under the repurchase agreement. The eligible securities are transferred to accounts with the custodian or sub-custodian in which the Fund holds a “securities entitlement” and exercises “control” as those terms are defined in the Uniform Commercial Code. The Fund has established procedures for monitoring the market value of the transferred securities and requiring the transfer of additional eligible securities if necessary to equal at least the repurchase price. These procedures also allow the other party to require securities to be transferred from the account to the extent that their market value exceeds the repurchase price or in exchange for other eligible securities of equivalent market value.
The insolvency of the other party or other failure to repurchase the securities may delay the disposition of the underlying securities or cause the Fund to receive less than the full repurchase price. Under the terms of the repurchase agreement, any amounts received by the Fund in excess of the repurchase price and related transaction costs must be remitted to the other party.
The Fund may enter into repurchase agreements in which eligible securities are transferred into joint trading accounts maintained by the custodian or sub-custodian for investment companies and other clients advised by the Fund’s Adviser and its affiliates. The Fund will participate on a pro rata basis with the other investment companies and clients in its share of the securities transferred under such repurchase agreements and in its share of proceeds from any repurchase or other disposition of such securities.
Investment Income, Gains and Losses, Expenses and Distributions
Investment transactions are accounted for on a trade-date basis. Realized gains and losses from investment transactions are recorded on an identified-cost basis. Interest income and expenses are accrued daily. Dividend income and distributions to shareholders are recorded on the ex-dividend date. Foreign dividends are recorded on the ex-dividend date or when the Fund is informed of the ex-dividend date. Distributions of net investment income, if any, are declared and paid annually. Non-cash dividends included in dividend income, if any, are recorded at fair value. Amortization/accretion of premium and discount is included in investment income. Investment income, realized and unrealized gains and losses, and certain fund-level expenses are allocated to each class based on relative average daily net assets, except that select classes will bear certain expenses unique to those classes. Dividends are declared separately for each class. No class has preferential dividend rights; differences in per share dividend rates are generally due to differences in separate class expenses. The detail of the total fund expense waivers and reimbursement of $8,726,074 is disclosed in various locations in Note 5.
Annual Financial Statements and Additional Information
Transfer Agent Fees
For the year ended October 31, 2024, transfer agent fees for the Fund were as follows:
| Transfer Agent
Fees Incurred |
| |
| |
| |
| |
| |
The Fund may pay other service fees up to 0.25% of the average daily net assets of the Fund’s Class A Shares, Class C Shares and Class R Shares to unaffiliated financial intermediaries or to Federated Shareholder Services Company (FSSC) for providing services to shareholders and maintaining shareholder accounts. Prior to their conversion to Class A Shares at the close of business on February 3, 2023, the Class B Shares were also subject to these fees. Subject to the terms described in the Expense Limitation note, FSSC may voluntarily reimburse the Fund for other service fees.
For the year ended October 31, 2024, other service fees for the Fund were as follows:
| Other Service
Fees Incurred |
| |
| |
| |
| |
It is the Fund’s policy to comply with the Subchapter M provision of the Internal Revenue Code of 1986 and to distribute to shareholders each year substantially all of its income. Accordingly, no provision for federal income tax is necessary. As of and during the year ended October 31, 2024, the Fund did not have a liability for any uncertain tax positions. The Fund recognizes interest and penalties, if any, related to tax liabilities as income tax expense in the Statement of Operations. As of October 31, 2024, tax years 2021 through 2024 remain subject to examination by the Fund’s major tax jurisdictions, which include the United States of America and the Commonwealth of Massachusetts.
The Fund may be subject to taxes imposed by governments of countries in which it invests. Such taxes are generally based on either income or gains earned or repatriated. The Fund accrues and applies such taxes to net investment income, net realized gains and net unrealized gains as income and/or gains are earned.
When-Issued and Delayed-Delivery Transactions
The Fund may engage in when-issued or delayed-delivery transactions. The Fund records when-issued securities on the trade date and maintains security positions such that sufficient liquid assets will be available to make payment for the securities purchased. Securities purchased on a when-issued or delayed-delivery basis are marked to market daily and begin earning interest on the settlement date. Losses may occur on these transactions due to changes in market conditions or the failure of counterparties to perform under the contract.
Foreign Currency Translation
The accounting records of the Fund are maintained in U.S. dollars. All assets and liabilities denominated in foreign currencies are translated into U.S. dollars based on the rates of exchange of such currencies against U.S. dollars on the date of valuation. Purchases and sales of securities, income and expenses are translated at the rate of exchange quoted on the respective date that such transactions are recorded. The Fund does not isolate that portion of the results of operations resulting from changes in foreign exchange rates on investments from the fluctuations arising from changes in market prices of securities held. Such fluctuations are included with the net realized and unrealized gain or loss from investments.
Reported net realized foreign exchange gains or losses arise from sales of foreign currencies, currency gains or losses realized between the trade and settlement dates on securities transactions, the difference between the amounts of dividends, interest and foreign withholding taxes recorded on the Fund’s books, and the U.S. dollar equivalent of the amounts actually received or paid. Net unrealized foreign exchange gains and losses arise from changes in the value of assets and liabilities other than investments in securities at period end, resulting from changes in the exchange rate.
The Fund participates in a securities lending program providing for the lending of equity securities to qualified brokers. The term of the loans within the program is one year or less. The Fund normally receives cash collateral for securities loaned that may be invested in affiliated money market funds, other money market instruments and/or repurchase agreements. Collateral is maintained at a minimum level of 100% of the market value of investments loaned, plus interest, if applicable. Earnings from collateral invested in affiliated holdings as presented parenthetically on the Statement of Operations do not reflect fees and rebates and are allocated between the
Annual Financial Statements and Additional Information
borrower of the security, the securities lending agent, as a fee for its services under the program and the Fund, according to agreed-upon rates. The Fund will not have the right to vote on securities while they are on loan. However, the Fund will attempt to terminate a loan in an effort to reacquire the securities in time to vote on matters that are deemed to be material by the Adviser. There can be no assurance that the Fund will have sufficient notice of such matters to be able to terminate the loan in time to vote thereon.
Securities lending transactions are subject to Master Netting Agreements which are agreements between the Fund and its counterparties that provide for the net settlement of all transactions and collateral with the Fund, through a single payment, in the event of default or termination. Amounts presented on the Portfolio of Investments and Statement of Assets and Liabilities are not net settlement amounts but gross. As indicated below, the cash collateral received by the Fund exceeds the market value of the securities loaned reducing the net settlement amount to zero. The chart below identifies the amount of collateral received as well as the market value of securities on loan. Additionally, the securities lending agreement executed by the Fund includes an indemnification clause. This clause stipulates that the borrower will reimburse the Fund for any losses as a result of any failure of the borrower to return equivalent securities to the Fund.
As of October 31, 2024, securities subject to this type of arrangement and related collateral were as follows:
Fair Value of
Securities Loaned | |
| |
The Fund may purchase securities which are considered restricted. Restricted securities are securities that either: (a) cannot be offered for public sale without first being registered, or being able to take advantage of an exemption from registration, under the 1933 Act; or (b) are subject to contractual restrictions on public sales. In some cases, when a security cannot be offered for public sale without first being registered, the issuer of the restricted security has agreed to register such securities for resale, at the issuer’s expense, either upon demand by the Fund or in connection with another registered offering of the securities. Many such restricted securities may be resold in the secondary market in transactions exempt from registration. Restricted securities may be determined to be liquid under criteria established by the Trustees. The Fund will not incur any registration costs upon such resales. The Fund’s restricted securities, like other securities, are priced in accordance with procedures established by and under the general supervision of the Adviser.
Additional information on restricted securities held at October 31, 2024, is as follows:
| | | |
| | | |
| | | |
FA Private Equity Fund IV LP | | | |
| | | |
Multiplex, Inc., Pfd., Series C | | | |
| | | |
Sensable Technologies, Inc. | | | |
| | | |
The preparation of financial statements in conformity with GAAP requires management to make estimates and assumptions that affect the amounts of assets, liabilities, expenses and revenues reported in the financial statements. Actual results could differ materially from those estimated. The Fund applies investment company accounting and reporting guidance.
3. SHARES OF BENEFICIAL INTEREST
The following tables summarize share activity:
| | |
| | | | |
| | | | |
Shares issued to shareholders in payment of distributions declared | | | | |
Conversion of Class B Shares to Class A Shares1 | | | | |
| | | | |
NET CHANGE RESULTING FROM CLASS A SHARE TRANSACTIONS | | | | |
Annual Financial Statements and Additional Information
| | |
| | | | |
| | | | |
Shares issued to shareholders in payment of distributions declared | | | | |
Conversion of Class B Shares to Class A Shares1 | | | | |
| | | | |
NET CHANGE RESULTING FROM CLASS B SHARE TRANSACTIONS | | | | |
| | |
| | | | |
| | | | |
Shares issued to shareholders in payment of distributions declared | | | | |
| | | | |
NET CHANGE RESULTING FROM CLASS C SHARE TRANSACTIONS | | | | |
| | |
| | | | |
| | | | |
Shares issued to shareholders in payment of distributions declared | | | | |
| | | | |
NET CHANGE RESULTING FROM CLASS R SHARE TRANSACTIONS | | | | |
| | |
| | | | |
| | | | |
Shares issued to shareholders in payment of distributions declared | | | | |
| | | | |
NET CHANGE RESULTING FROM INSTITUTIONAL SHARE TRANSACTIONS | | | | |
NET CHANGE RESULTING FROM TOTAL FUND SHARE TRANSACTIONS | | | | |
| On February 3, 2023, Class B Shares were converted into Class A Shares. Within the Statement of Changes in Net Assets, the conversion from Class B Shares is within the Cost of shares redeemed and the conversion to Class A Shares is within Proceeds from sale of shares. |
4. FEDERAL TAX INFORMATION
The tax character of distributions as reported on the Statement of Changes in Net Assets for the years ended October 31, 2024 and 2023, was as follows:
As of October 31, 2024, the components of distributable earnings on a tax-basis were as follows:
Net unrealized appreciation | |
Undistributed long-term capital gains | |
| |
Other temporary differences | |
| |
At October 31, 2024, the cost of investments for federal tax purposes was $2,907,888,070. The net unrealized appreciation of investments for federal tax purposes was $2,112,617,702. This consists of unrealized appreciation from investments for those securities having an excess of value over cost of $2,266,612,509 and unrealized depreciation from investments for those securities having an excess of cost over value of $153,994,807. The difference between book-basis and tax-basis net unrealized appreciation is attributable to differing treatments for deferral of losses on wash sales, partnership adjustments and passive foreign investment company adjustments.
Annual Financial Statements and Additional Information
Under current tax rules, a late-year ordinary loss may be deferred, in whole or in part, and treated as occurring on the first day of the following fiscal year. As of October 31, 2024, for federal income tax purposes, a late year ordinary loss of $279,778 was deferred to November 1, 2024.
5. INVESTMENT ADVISER FEE AND OTHER TRANSACTIONS WITH AFFILIATES
The Fund’s investment advisory contract provides for payment to the Adviser of an annual investment advisory fee based on the Fund’s average daily net assets as shown in the chart below:
| |
| |
| |
| |
$10 billion - $12 billion | |
| |
The Adviser has agreed to reimburse the Fund for certain investment adviser fees as a result of transactions in other affiliated investment companies. For the year ended October 31, 2024, the Adviser reimbursed $130,743.
Prior to becoming Adviser effective August 1, 2024, Fed Global acted as a sub-adviser to the Fund and received an allocable portion of the Fund’s adviser fee. The fee was paid by the prior adviser out of its resources and was not an incremental Fund expense. For the year ended October 31, 2024, Fed Global earned a sub-adviser fee of $38,284,608.
Federated Administrative Services (FAS), under the Administrative Services Agreement, provides the Fund with administrative personnel and services. For purposes of determining the appropriate rate breakpoint, “Investment Complex” is defined as all of the Federated Hermes Funds subject to a fee under the Administrative Services Agreement. The fee paid to FAS is based on the average daily net assets of the Investment Complex as specified below:
| Average Daily Net Assets
of the Investment Complex |
| on assets up to $50 billion |
| on assets over $50 billion |
Subject to the terms described in the Expense Limitation note, FAS may voluntarily choose to waive any portion of its fee. For the year ended October 31, 2024, the annualized fee paid to FAS was 0.078% of average daily net assets of the Fund.
In addition, FAS may charge certain out-of-pocket expenses to the Fund.
Distribution Services Fee
The Fund has adopted a Distribution Plan (the “Plan”) pursuant to Rule 12b-1 under the Act. Under the terms of the Plan, the Fund will compensate Federated Securities Corp. (FSC), the principal distributor, from the daily net assets of the Fund’s Class A Shares, Class C Shares and Class R Shares to finance activities intended to result in the sale of these shares. The Plan provides that the Fund may incur distribution expenses at the following percentages of average daily net assets annually, to compensate FSC:
| Percentage of Average Daily
Net Assets of Class |
| |
| |
| |
Prior to their conversion to Class A Shares at the close of business on February 3, 2023, the Class B Shares were also subject to the Plan at 0.75% of average daily net assets of the Class B Shares.
Subject to the terms described in the Expense Limitation note, FSC may voluntarily choose to waive any portion of its fee. For the year ended October 31, 2024, distribution services fees for the Fund were as follows:
| Distribution Services
Fees Incurred | Distribution Services
Fees Waived |
| | |
| | |
| | |
| | |
Annual Financial Statements and Additional Information
When FSC receives fees, it may pay some or all of them to financial intermediaries whose customers purchase shares. For the year ended October 31, 2024, FSC retained $10,716,551 of fees paid by the Fund.
Front-end sales charges and contingent deferred sales charges (CDSC) do not represent expenses of the Fund. They are deducted from the proceeds of sales of Fund shares prior to investment or from redemption proceeds prior to remittance, as applicable. For the year ended October 31, 2024, FSC retained $22,522 in sales charges from the sale of Class A Shares. FSC also retained $686 of CDSC relating to redemptions of Class C Shares.
For the year ended October 31, 2024, FSSC received $6,279,658 of the other service fees disclosed in Note 2.
Commitments and Contingencies
In the course of pursuing its investment objective, the Fund may invest in limited partnerships and limited liability companies. These entities often require the Fund to commit to a total dollar amount to be invested. The actual investments are usually made in installments over a period of time. At October 31, 2024 the Fund had total commitments to limited partnerships and limited liability companies of $28,625,483; of this amount, $28,625,483 was actually invested by the Fund leaving the Fund contingently liable for additional investments of $0.
The Adviser and certain of its affiliates (which may include FSC, FAS and FSSC) on their own initiative have agreed to waive certain amounts of their respective fees and/or reimburse expenses. Total annual fund operating expenses (as shown in the financial highlights, excluding dividends and other expenses related to short sales, interest expense, extraordinary expenses, tax reclaim recovery expenses and proxy-related expenses, if any) paid by the Fund’s Class A Shares, Class C Shares, Class R Shares and Institutional Shares (after the voluntary waivers and/or reimbursements) will not exceed 1.95%, 2.50%, 1.95% and 1.50% (the “Fee Limit”), respectively, up to but not including the later of (the “Termination Date”): (a) January 1, 2026; or (b) the date of the Fund’s next effective Prospectus. While the Adviser and its applicable affiliates currently do not anticipate terminating or increasing these arrangements prior to the Termination Date, these arrangements may only be terminated or the Fee Limit increased prior to the Termination Date with the agreement of the Trustees.
During the year ended October 31, 2024, the Fund engaged in purchase and sale transactions with funds that have a common investment adviser (or affiliated investment advisers), common Directors/Trustees and/or common Officers. These purchase and sale transactions complied with Rule 17a-7 under the Act and amounted to $4,701,530 and $2,181,063, respectively. Net realized loss recognized on these transactions was $(734,330).
Directors’/Trustees’ and Miscellaneous Fees
Certain Officers and Trustees of the Fund are Officers and Directors or Trustees of certain of the above companies. To efficiently facilitate payment, Independent Directors’/Trustees’ fees and certain expenses related to conducting meetings of the Directors/Trustees and other miscellaneous expenses are paid by an affiliate of the Adviser which in due course are reimbursed by the Fund. These expenses related to conducting meetings of the Directors/Trustees and other miscellaneous expenses may be included in Accrued and Miscellaneous Expenses on the Statement of Assets and Liabilities and Statement of Operations, respectively.
6. INVESTMENT TRANSACTIONS
Purchases and sales of investments, excluding long-term U.S. government securities and short-term obligations, for the year ended October 31, 2024, were as follows:
The Fund may invest a portion of its assets in securities of companies that are deemed by the Fund’s management to be classified in similar business sectors. Economic developments may have an effect on the liquidity and volatility of the portfolio securities.
A substantial portion of the Fund’s portfolio may be comprised of entities in the Health Care sector. As a result, the Fund may be more susceptible to any economic, business, political or other developments which generally affect these entities.
The Fund participates with certain other Federated Hermes Funds, on a several basis, in an up to $500,000,000 unsecured, 364-day, committed, revolving line of credit (LOC) agreement dated June 18, 2024. The LOC was made available to temporarily finance the repurchase or redemption of shares of the Fund, failed trades, payment of dividends, settlement of trades and for other short-term, temporary or emergency general business purposes. The Fund cannot borrow under the LOC if an inter-fund loan is outstanding. The Fund’s ability to borrow under the LOC also is subject to the limitations of the Act and various conditions precedent that must be satisfied before the Fund can borrow. Loans under the LOC are charged interest at a fluctuating rate per annum equal to (a) the highest,
Annual Financial Statements and Additional Information
on any day, of (i) the federal funds effective rate, (ii) the published secured overnight financing rate plus an assigned percentage, and (iii) 0.0%, plus (b) a margin. Any fund eligible to borrow under the LOC pays its pro rata share of a commitment fee based on the amount of the lenders’ commitment that has not been utilized, quarterly in arrears and at maturity. As of October 31, 2024, the Fund had no outstanding loans. During the year ended October 31, 2024, the Fund did not utilize the LOC.
Pursuant to an Exemptive Order issued by the Securities and Exchange Commission, the Fund, along with other funds advised by subsidiaries of Federated Hermes, Inc., may participate in an interfund lending program. This program provides an alternative credit facility allowing the Fund to borrow from other participating affiliated funds. As of October 31, 2024, there were no outstanding loans. During the year ended October 31, 2024, the program was not utilized.
Under the Fund’s organizational documents, its Officers and Directors/Trustees are indemnified against certain liabilities arising out of the performance of their duties to the Fund (other than liabilities arising out of their willful misfeasance, bad faith, gross negligence or reckless disregard of their duties to the Fund). In addition, in the normal course of business, the Fund provides certain indemnifications under arrangements with third parties. Typically, obligations to indemnify a third party arise in the context of an arrangement entered into by the Fund under which the Fund agrees to indemnify such third party for certain liabilities arising out of actions taken pursuant to the arrangement, provided the third party’s actions are not deemed to have breached an agreed-upon standard of care (such as willful misfeasance, bad faith, gross negligence or reckless disregard of their duties under the contract). The Fund’s maximum exposure under these arrangements is unknown as this would involve future claims that may be made against the Fund that have not yet arisen. The Fund does not anticipate any material claims or losses pursuant to these arrangements at this time, and accordingly expects the risk of loss to be remote.
Effective January 1, 2025, the Fund’s investment advisory contract with its Adviser is amended to reduce the breakpoint schedule for determining the Fund’s management fee. Effective January 1, 2025, the Fund pays the Adviser a fee at the annual rate of 1.275% on the first $7 billion of the Fund’s average daily net assets, 1.255% on $7 billion - $8 billion of the Fund’s average daily net assets, 1.205% on $8 billion - $9 billion of the Fund’s average daily net assets, 1.155% on $9 billion - $10 billion of the Fund’s average daily net assets and 1.105% of the Fund’s average daily net assets over $10 billion.
12. FEDERAL TAX INFORMATION (UNAUDITED)
For the year ended October 31, 2024, the amount of long-term capital gains designated by the Fund was $91,826,135.
Annual Financial Statements and Additional Information
Report of Independent Registered Public Accounting Firm
TO THE BOARD OF TRUSTEES OF FEDERATED HERMES EQUITY FUNDS AND SHAREHOLDERS OF FEDERATED HERMES KAUFMANN FUND:
Opinion on the Financial Statements
We have audited the accompanying statement of assets and liabilities of Federated Hermes Kaufmann Fund (the “Fund”) (one of the portfolios constituting Federated Hermes Equity Funds (the “Trust”)), including the portfolio of investments, as of October 31, 2024, and the related statement of operations for the year then ended, the statement of changes in net assets for each of the two years in the period then ended, the financial highlights for each of the five years in the period then ended and the related notes (collectively referred to as the “financial statements”). In our opinion, the financial statements present fairly, in all material respects, the financial position of the Fund (one of the portfolios constituting Federated Hermes Equity Funds) at October 31, 2024, the results of its operations for the year then ended, the changes in its net assets for each of the two years in the period then ended and its financial highlights for each of the five years in the period then ended, in conformity with U.S. generally accepted accounting principles.
These financial statements are the responsibility of the Trust’s management. Our responsibility is to express an opinion on the Fund’s financial statements based on our audits. We are a public accounting firm registered with the Public Company Accounting Oversight Board (United States) (“PCAOB”) and are required to be independent with respect to the Trust in accordance with the U.S. federal securities laws and the applicable rules and regulations of the Securities and Exchange Commission and the PCAOB.
We conducted our audits in accordance with the standards of the PCAOB. Those standards require that we plan and perform the audit to obtain reasonable assurance about whether the financial statements are free of material misstatement, whether due to error or fraud. The Trust is not required to have, nor were we engaged to perform, an audit of the Trust’s internal control over financial reporting. As part of our audits, we are required to obtain an understanding of internal control over financial reporting, but not for the purpose of expressing an opinion on the effectiveness of the Trust’s internal control over financial reporting. Accordingly, we express no such opinion.
Our audits included performing procedures to assess the risks of material misstatement of the financial statements, whether due to error or fraud, and performing procedures that respond to those risks. Such procedures included examining, on a test basis, evidence regarding the amounts and disclosures in the financial statements. Our procedures included confirmation of securities owned as of October 31, 2024, by correspondence with the custodian, brokers, and others; when replies were not received from brokers or others, we performed other auditing procedures. Our audits also included evaluating the accounting principles used and significant estimates made by management, as well as evaluating the overall presentation of the financial statements. We believe that our audits provide a reasonable basis for our opinion. 
We have served as the auditor of one or more Federated Hermes investment companies since 1979.
Boston, Massachusetts
December 23, 2024
Annual Financial Statements and Additional Information
Shareholder Meeting Results (unaudited)
At a Special Meeting held on October 25, 2024, shareholders of the Federated Hermes Equity Funds (the “Trust”) elected Trustees of the Trust. Shareholders of the Trust elected three new individuals to serve as Trustees effective January 1, 2025, who will serve on the Board with current Trustees Messrs. J. Christopher Donahue, John B. Fisher, John G. Carson, G. Thomas Hough, Thomas M. O’Neill, John S. Walsh and Ms. Madelyn A. Reilly. Under the Trust’s Director Service Policy, existing Trustees Judge Maureen Lally-Green and Mr. P. Jerome Richey are expected to retire from the Board on December 31, 2024. The number of votes cast for, against or withheld, as well as the number of abstentions and broker non-votes with respect to the election of each nominee for office, is included below.
Annual Financial Statements and Additional Information
Evaluation and Approval of Advisory Contract–May 2024
Federated Hermes Kaufmann Fund (the “Fund”)
At its meetings in May 2024 (the “May Meetings”), the Fund’s Board of Trustees (the “Board”), including those Trustees who are not “interested persons” of the Fund, as defined in the Investment Company Act of 1940 (the “Independent Trustees”), reviewed and unanimously approved the continuation of the investment advisory contract between the Fund and Federated Equity Management Company of Pennsylvania (the “Adviser”) and the investment sub-advisory contract between the Adviser and Federated Global Investment Management Corp. (the “Sub-Adviser” and together with the Adviser, the “Advisers”) with respect to the Fund (together, the “Contracts”) for an additional one-year term. The Board’s determination to approve the continuation of the Contracts reflects the exercise of its business judgment after considering all of the information and factors believed to be relevant and appropriate on whether to approve the continuation of the existing arrangements. The information, factors and conclusions that formed the basis for the Board’s approval are summarized below.
Information Received and Review Process
At the request of the Independent Trustees, the Fund’s Chief Compliance Officer (the “CCO”) furnished to the Board in advance of its May Meetings an independent written evaluation of the Fund’s management fee (the “CCO Fee Evaluation Report”). The Board considered the CCO Fee Evaluation Report, along with other information, in evaluating the reasonableness of the Fund’s management fee and in determining to approve the continuation of the Contracts.
In addition to the extensive materials that comprise and accompany the CCO Fee Evaluation Report, the Board considered information specifically prepared in connection with the approval of the continuation of the Contracts that was presented at the May Meetings. In this regard, in the months preceding the May Meetings, the Board requested and reviewed written responses and supporting materials prepared by the Advisers and their affiliates (collectively, “Federated Hermes”) in response to requests posed to Federated Hermes by independent legal counsel on behalf of the Independent Trustees encompassing a wide variety of topics, including those summarized below. The Board also considered such additional matters as the Independent Trustees deemed reasonably necessary to evaluate the Contracts, which included detailed information about the Fund and Federated Hermes furnished to the Board at its meetings throughout the year and in between regularly scheduled meetings on particular matters as the need arose. The Independent Trustees also considered the presentation from Federated Hermes’s Chief Investment Officer of Equities received at the Board’s February 2024 meetings regarding the Fund and its performance, portfolio management team and other investment-related matters.
The Board’s consideration of the Contracts included review of materials and information covering the following matters, among others: (1) copies of the Contracts; (2) the nature, quality and extent of the advisory and other services provided to the Fund by Federated Hermes; (3) Federated Hermes’ business and operations; (4) the Advisers’ investment philosophy, personnel and processes; (5) the Fund’s investment objectives and strategies; (6) the Fund’s short-term and long-term performance–in absolute terms (both on a gross basis and net of expenses) and relative to an appropriate group of peer funds and its benchmark index; (7) the Fund’s fees and expenses, including the advisory fee and the overall expense structure of the Fund–in absolute terms and relative to an appropriate group of peer funds, with due regard for contractual or voluntary expense limitations (if any); (8) the financial condition of Federated Hermes; (9) the Adviser’s profitability with respect to managing the Fund; (10) distribution and sales activity for the Fund; and (11) the use and allocation of brokerage commissions derived from trading the Fund’s portfolio securities (if any).
The Board also considered judicial decisions concerning allegedly excessive investment advisory fees charged to other registered funds in evaluating the Contracts. Using these judicial decisions as a guide, the Board considered several factors they deemed relevant to an adviser’s fiduciary duty with respect to its receipt of compensation from a fund, including: (1) the nature and quality of the services provided by the adviser to the fund and its shareholders, including the performance of the fund, its benchmark and comparable funds; (2) the adviser’s cost of providing the services and the profitability to the adviser of providing advisory services to the fund; (3) the extent to which the adviser may realize “economies of scale” as the fund grows larger and, if such economies of scale exist, whether they have been appropriately shared with the fund and its shareholders or the family of funds; (4) any “fall-out” benefits that accrue to the adviser because of its relationship with the fund, including research services received from brokers that execute fund trades and any fees paid to affiliates of the adviser for services rendered to the fund; (5) comparative fees and expenses, including a comparison of management fees paid to the adviser with those paid by similar funds managed by the same adviser or other advisers as well as management fees charged to institutional and other advisory clients of the same adviser for what might be viewed as like services; and (6) the extent of care, conscientiousness and independence with which the fund’s board members perform their duties and their expertise, including whether they are fully informed about all facts the board deems relevant to its consideration of the adviser’s services and fees. The Board considered that the Securities and Exchange Commission (“SEC”) disclosure requirements regarding the basis for a fund board’s approval of the fund’s investment advisory contract generally align with the factors listed above. The Board was guided by these factors in its
Annual Financial Statements and Additional Information
evaluation of the Contracts to the extent it considered them to be appropriate and relevant, as discussed further below. The Board considered and weighed these factors in light of its substantial accumulated experience in governing the Fund and working with Federated Hermes on matters relating to the oversight of the other funds advised by Federated Hermes (each, a “Federated Hermes Fund” and, collectively, the “Federated Hermes Funds”).
In addition, the Board considered the preferences and expectations of Fund shareholders and the potential disruptions of the Fund’s operations and various risks, uncertainties and other effects that could occur as a result of a decision to terminate or not renew the Contracts. In particular, the Board recognized that many shareholders likely have invested in the Fund based on the strength of Federated Hermes’ industry standing and reputation and with the expectation that Federated Hermes will have a continuing role in providing advisory services to the Fund. Thus, the Board observed that there are a range of investment options available to the Fund’s shareholders in the marketplace and such shareholders, having had the opportunity to consider other investment options, have effectively selected Federated Hermes by virtue of investing in the Fund.
In determining to approve the continuation of the Contracts, the members of the Board reviewed and evaluated information and factors they believed to be relevant and appropriate through the exercise of their reasonable business judgment. While individual members of the Board may have weighed certain factors differently, the Board’s determination to approve the continuation of the Contracts was based on a comprehensive consideration of all information provided to the Board throughout the year and specifically with respect to the continuation of the Contracts. The Board recognized that its evaluation process is evolutionary and that the factors considered and emphasis placed on relevant factors may change in recognition of changing circumstances in the registered fund marketplace. The Independent Trustees were assisted throughout the evaluation process by independent legal counsel. In connection with their deliberations at the May Meetings, the Independent Trustees met separately in executive session with their independent legal counsel and without management present to review the relevant materials and consider their responsibilities under applicable laws. In addition, senior management representatives of Federated Hermes also met with the Independent Trustees and their independent legal counsel to discuss the materials and presentations furnished to the Board at the May Meetings. The Board considered the approval of the Contracts for the Fund as part of its consideration of agreements for funds across the family of Federated Hermes Funds, but its approvals were made on a fund-by-fund basis.
Nature, Extent and Quality of Services
The Board considered the nature, extent and quality of the services provided to the Fund by the Advisers and the resources of Federated Hermes dedicated to the Fund. In this regard, the Board evaluated, among other things, the terms of the Contracts and the full range of services provided to the Fund by Federated Hermes. The Board considered the Advisers’ personnel, investment philosophy and process, investment research capabilities and resources, trade operations capabilities, experience and performance track record. The Board reviewed the qualifications, backgrounds and responsibilities of the portfolio management team primarily responsible for the day-to-day management of the Fund and evaluated Federated Hermes’ ability and experience in attracting and retaining qualified personnel to service the Fund. The Board considered the trading operations by the Advisers, including the execution of portfolio transactions and the selection of brokers for those transactions. The Board also considered the Advisers’ ability to deliver competitive investment performance for the Fund when compared to the Fund’s Performance Peer Group (as defined below), which was deemed by the Board to be a useful indicator of how the Advisers are executing the Fund’s investment program.
In addition, the Board considered the financial resources and overall reputation of Federated Hermes and its willingness to consider and make investments in personnel, infrastructure, technology, cybersecurity, business continuity planning and operational enhancements that are designed to benefit the Federated Hermes Funds. The Board noted the benefits of the previous significant acquisition of Hermes Fund Managers Limited by Federated Hermes, which has deepened Federated Hermes’ investment management expertise and capabilities and expanded its access to analytical resources related to environmental, social and governance (“ESG”) factors and issuer engagement on ESG matters where appropriate. The Board considered Federated Hermes’ oversight of the securities lending program for the Federated Hermes Funds that engage in securities lending and noted the income earned by the Federated Hermes Funds that participate in such program. In addition, the Board considered the quality of Federated Hermes’ communications with the Board and responsiveness to Board inquiries and requests made from time to time with respect to the Federated Hermes Funds. The Board also considered that Federated Hermes is responsible for providing the Federated Hermes Funds’ officers.
The Board received and evaluated information regarding Federated Hermes’ regulatory and compliance environment. The Board considered Federated Hermes’ compliance program and compliance history and reports from the CCO about Federated Hermes’ compliance with applicable laws and regulations, including responses to regulatory developments and any compliance or other issues raised by regulatory agencies. The Board also noted Federated Hermes’ support of the Federated Hermes Funds’ compliance control structure and the compliance-related resources devoted by Federated Hermes in support of the Fund’s obligations pursuant to Rule 38a-1 under the Investment Company Act of 1940, including Federated Hermes’ commitment to respond to rulemaking and other regulatory initiatives of the SEC. The Board
Annual Financial Statements and Additional Information
considered Federated Hermes’ approach to internal audits and risk management with respect to the Federated Hermes Funds and its day-to-day oversight of the Federated Hermes Funds’ compliance with their investment objectives and policies as well as with applicable laws and regulations, noting that regulatory and other developments had over time led, and continue to lead, to an increase in the scope of Federated Hermes’ oversight in this regard. In addition, the Board noted Federated Hermes’ commitment to maintaining high quality systems and expending substantial resources to prepare for and respond to ongoing changes due to the market, regulatory and control environments in which the Fund and its service providers operate.
The Board considered Federated Hermes’ efforts to provide shareholders in the Federated Hermes Funds with a comprehensive array of funds with different investment objectives, policies and strategies. The Board considered the expenses that Federated Hermes had incurred, as well as the entrepreneurial and other risks assumed by Federated Hermes, in sponsoring and providing on-going services to new funds to expand these opportunities for shareholders. The Board noted the benefits to shareholders of being part of the family of Federated Hermes Funds, which include the general right to exchange investments between the same class of shares without the incurrence of additional sales charges.
Based on these considerations, the Board concluded that it was satisfied with the nature, extent and quality of the services provided by the Advisers to the Fund.
Fund Investment Performance
The Board considered the investment performance of the Fund. In evaluating the Fund’s investment performance, the Board considered performance results in light of the Fund’s investment objective, strategies and risks. The Board considered the Fund’s unique investment strategies. The Board considered detailed investment reports on, and the Advisers’ analysis of, the Fund’s performance over different time periods that were provided to the Board throughout the year and in connection with the May Meetings. These reports included, among other items, information on the Fund’s gross and net returns, the Fund’s investment performance compared to one or more relevant categories or groups of peer funds and the Fund’s benchmark index, performance attribution information and commentary on the effect of market conditions. The Board considered that, in its evaluation of investment performance at meetings throughout the year, it focused particular attention on information indicating less favorable performance of certain Federated Hermes Funds for specific time periods and discussed with Federated Hermes the reasons for such performance as well as any specific actions Federated Hermes had taken, or had agreed to take, to seek to enhance Fund investment performance and the results of those actions.
The Board also reviewed comparative information regarding the performance of other registered funds in the category of peer funds selected by Morningstar, Inc. (the “Morningstar”), an independent fund ranking organization (the “Performance Peer Group”). The Board noted the CCO’s view that comparisons to fund peer groups may be helpful, though not conclusive, in evaluating the performance of the Advisers in managing the Fund. The Board considered the CCO’s view that, in evaluating such comparisons, in some cases there may be differences in the funds’ objectives or investment management techniques, or the costs to implement the funds, even within the same Performance Peer Group. In this connection, the Board considered that the longevity and experience of the Fund’s portfolio management team and its extensive bottom-up approach to investing may limit the utility of comparisons to other equity mutual funds.
The Board also considered comparative performance data from Lipper, Inc. that was included in reports provided to the Board throughout the year. The Board noted that differences may exist between the Performance Peer Group and Lipper peers and that the results of these performance comparisons may vary.
The Board considered that the Fund’s performance fell below the median of the Performance Peer Group for the one-year, three-year and five-year periods ended December 31, 2023. The Board discussed the Fund’s performance with the Advisers and recognized the efforts being taken by the Advisers in the context of other factors considered relevant by the Board. The Board considered information regarding the historical performance of the Fund, the uniqueness of the Fund’s investment strategy, the substantial investment and research resources utilized in implementing this strategy and the views of the Advisers on the Fund’s relative performance, including with respect to other pooled investment vehicles.
Based on these considerations, the Board concluded that it had continued confidence in the Advisers’ overall capabilities to manage the Fund.
The Board considered the advisory fee, sub-advisory fee, and overall expense structure of the Fund and the comparative fee and expense information that had been provided in connection with the May Meetings. In this regard, the Board was presented with, and considered, information regarding the contractual advisory fee rates, net advisory fee rates, total expense ratios and each element of the Fund’s total expense ratio (i.e., gross and net advisory fees, administrative fees, custody fees, portfolio accounting fees and transfer agency fees) relative to an appropriate group of peer funds compiled
Annual Financial Statements and Additional Information
by Federated Hermes from the overall category of peer funds selected by Morningstar (the “Expense Peer Group”). The Board received a description of the methodology used to select the Expense Peer Group from the overall Morningstar category. The Board also reviewed comparative information regarding the fees and expenses of the broader group of funds in the overall Morningstar category.
While mindful that courts have cautioned against giving too much weight to comparative information concerning fees charged to funds by other advisers, the use of comparisons between the Fund and its Expense Peer Group assisted the Board in its evaluation of the Fund’s fees and expenses. The Board focused on comparisons with other registered funds more heavily than non-registered fund products or services because such comparisons are believed to be more relevant. The Board considered that other registered funds are the products most like the Fund, in that they are readily available to Fund shareholders as alternative investment vehicles, and they are the type of investment vehicle, in fact, chosen and maintained by the Fund’s shareholders. The Board noted that the range of such other registered funds’ fees and expenses, therefore, appears to be a relevant indicator of what investors have found to be reasonable in the marketplace in which the Fund competes.
The Board reviewed the contractual advisory fee rate, net advisory fee rate and other expenses of the Fund and noted the position of the Fund’s fee rates relative to its Expense Peer Group. In this regard, the Board noted that the contractual advisory fee rate was above the median of the Expense Peer Group, but the Board noted the applicable waivers and reimbursements, and that the overall expense structure of the Fund remained competitive in the context of other factors considered by the Board. The Board considered the CCO’s view that, in 2023, while the Fund’s total expenses were above median relative to its Expense Peer Group, those expenses remained reasonable in light of its extensive bottom-up investment process, the relative expense of that process, the resulting estimated profitability of the Fund over time, and the performance generated over time compared to peer funds. In considering the Fund’s expenses, the Board noted the gross advisory fee reduction implemented in July 2022, in which the Adviser committed to permanently replace the Fund’s then-current contractual investment advisory fee rate of 1.30% with an investment advisory fee schedule that imposes an advisory fee rate of 1.275% on assets up to $8 billion and incorporates breakpoints that reduce fee rates upon the Fund reaching $8 billion, $9 billion, $10 billion and $12 billion in size.
The Board also received and considered information about the nature and extent of services offered and fees charged by Federated Hermes to other types of clients with investment strategies similar to those of the Federated Hermes Funds, including non-registered fund clients (such as institutional separate accounts) and third-party unaffiliated registered funds for which any of the Advisers or their affiliates serve as sub-adviser. The Board noted the CCO’s conclusion that non-registered fund clients are inherently different products due to the following differences, among others: (i) different types of targeted investors; (ii) different applicable laws and regulations; (iii) different legal structures; (iv) different average account sizes and portfolio management techniques made necessary by different cash flows and different associated costs; (v) the time spent by portfolio managers and their teams (among other personnel across various departments, including legal, compliance and risk management) in reviewing securities pricing; (vi) different SEC mandated risk management programs with respect to fund liquidity and use of derivatives; (vii) different administrative responsibilities; (viii) different degrees of risk associated with management; and (ix) a variety of different costs. The Board also considered information regarding the differences in the nature of the services required for Federated Hermes to manage its proprietary registered fund business versus managing a discrete pool of assets as a sub-adviser to another institution’s registered fund, noting the CCO’s view that Federated Hermes generally performs significant additional services and assumes substantially greater risks in managing the Fund and other Federated Hermes Funds than in its role as sub-adviser to an unaffiliated third-party registered fund. The Board noted that the CCO did not consider the fees for providing advisory services to other types of clients to be determinative in judging the appropriateness of the Federated Hermes Funds’ advisory fees.
In the case of the Fund, the Board noted that Federated Hermes does not manage any other types of clients that are comparable to the Fund.
Based on these considerations, the Board concluded that the fees and total operating expenses of the Fund, in conjunction with other matters considered, are reasonable in light of the services provided.
The Board received and considered profitability information furnished by Federated Hermes. Such profitability information included revenues reported on a fund-by-fund basis and estimates of the allocation of expenses made on a fund-by-fund basis, using allocation methodologies specified by the CCO and described to the Board. The Board considered the CCO’s view that, while these cost allocation reports apply consistent allocation processes, the inherent difficulties in allocating costs on a fund-by-fund basis continues to cause the CCO to question the precision of the process and to conclude that such reports may be unreliable because a single change in an allocation estimate may dramatically alter the resulting estimate of cost and/or profitability of a Federated Hermes Fund and may produce unintended consequences. In addition, the Board considered the CCO’s view that the allocation methodologies used by Federated Hermes in estimating profitability for purposes of reporting to the Board in connection with the continuation of the
Annual Financial Statements and Additional Information
Contracts are consistent with the methodologies previously reviewed by an independent consultant. The Board noted that the independent consultant had previously conducted a review of the allocation methodologies and reported to the Board that, although there is no single best method to allocate expenses, the methodologies used by Federated Hermes are reasonable. The Board considered the CCO’s view that the estimated profitability to the Adviser from its relationship with the Fund was not unreasonable in relation to the services provided.
The Board also reviewed information compiled by Federated Hermes comparing its profitability information to other publicly-held fund management companies, including information regarding profitability trends over time. The Board recognized that profitability comparisons among fund management companies are difficult because of the variation in the type of comparative information that is publicly available, and the profitability of any fund management company is affected by numerous factors. The Board considered the CCO’s conclusion that, based on such profitability information, Federated Hermes’ profit margins did not appear to be excessive. The Board also considered the CCO’s view that Federated Hermes appeared financially sound, with the resources necessary to fulfill its obligations under its contracts with the Federated Hermes Funds.
The Board received and considered information about the notion of possible realization of “economies of scale” as a fund grows larger, the difficulties of isolating and quantifying economies of scale at an individual fund level, and the extent to which potential scale benefits are shared with shareholders. In this regard, the Board considered the breakpoints in the contractual advisory fee schedule for the Fund that were implemented in July 2022, which reduce fee rates as the Fund’s assets grow over time. In addition, the Board considered that Federated Hermes has made significant and long-term investments in areas that support all of the Federated Hermes Funds, such as: portfolio management, investment research and trading operations; shareholder services; compliance; business continuity, cybersecurity and information security programs; internal audit and risk management functions; and technology, systems capabilities and use of data. The Board noted that Federated Hermes’ investments in these areas are extensive and are designed to provide enhanced or expanded services to the Federated Hermes Funds and their shareholders. The Board considered that the benefits of these investments are likely to be shared with the family of Federated Hermes Funds as a whole.
In addition, the Board considered that fee waivers and expense reimbursements are another means for potential economies of scale to be shared with shareholders and can provide protection from an increase in expenses if a Federated Hermes Fund’s assets decline. The Board considered that, in order for the Federated Hermes Funds to remain competitive in the marketplace, Federated Hermes has frequently waived fees and/or reimbursed expenses for the Federated Hermes Funds and has disclosed to shareholders and/or reported to the Board its intention to do so (or continue to do so) in the future. The Board also considered that Federated Hermes has been active in managing expenses of the Federated Hermes Funds in recent years, which has resulted in benefits being realized by shareholders.
The Board also received and considered information on adviser-paid fees (commonly referred to as “revenue sharing” payments) that was provided to the Board throughout the year and in connection with the May Meetings. The Board considered that Federated Hermes and the CCO believe that this information is relevant to considering whether Federated Hermes had an incentive to either not apply breakpoints, or to apply breakpoints at higher levels, but should not be considered when evaluating the reasonableness of advisory fees. The Board also noted the absence of any applicable regulatory or industry guidelines on economies of scale, which is compounded by the lack of any uniform methodology or pattern with respect to structuring fund advisory fees with breakpoints that serve to reduce the fees as a fund attains a certain size.
The Board considered information regarding the compensation and other ancillary (or “fall-out”) benefits that Federated Hermes derived from its relationships with the Federated Hermes Funds. The Board noted that, in addition to receiving advisory fees under the Federated Hermes Funds’ investment advisory contracts, Federated Hermes’ affiliates also receive fees for providing other services to the Federated Hermes Funds under separate service contracts, including for serving as the Federated Hermes Funds’ administrator and distributor. In this regard, the Board considered that Federated Hermes’ affiliates provide distribution and shareholder services to the Federated Hermes Funds, for which they may be compensated through distribution and servicing fees paid pursuant to Rule 12b-1 plans or otherwise. The Board also received and considered information detailing the benefits, if any, that Federated Hermes may derive from its receipt of research services from brokers who execute portfolio trades for the Federated Hermes Funds.
The Board considered: (i) the CCO’s conclusion that his observations and the information accompanying the CCO Fee Evaluation Report show that the management fee for the Fund is reasonable; and (ii) the CCO’s recommendation that the Board approve the management fee. The Board noted that, under these circumstances, no changes were recommended to, and no objection was raised to the continuation of, the Contracts by the CCO. The CCO also recognized that the Board’s
Annual Financial Statements and Additional Information
evaluation of the Federated Hermes Funds’ advisory and sub-advisory arrangements is a continuing and ongoing process that is informed by the information that the Board requests and receives from management throughout the course of the year and, in this regard, the CCO and Board noted certain items, and management has committed to reviewing certain items, for future reporting to the Board as the Board continues its ongoing oversight of the Federated Hermes Funds.
On the basis of the information and factors summarized above, among other information and factors deemed relevant by the Board, and the evaluation thereof, the Board, including the Independent Trustees, unanimously voted to approve the continuation of the Contracts. The Board based its determination to approve the Contracts on the totality of the circumstances and relevant factors and with a view of past and future long-term considerations. Not all of the factors and considerations identified above were necessarily deemed to be relevant to the Fund, nor did the Board consider any one of them to be determinative.
Annual Financial Statements and Additional Information
Mutual funds are not bank deposits or obligations, are not guaranteed by any bank and are not insured or guaranteed by the U.S. government, the Federal Deposit Insurance Corporation, the Federal Reserve Board or any other government agency. Investment in mutual funds involves investment risk, including the possible loss of principal.
This information is authorized for distribution to prospective investors only when preceded or accompanied by the Fund’s Prospectus, which contains facts concerning its objective and policies, management fees, expenses and other information.
Federated Hermes Kaufmann Fund
Federated Hermes Funds
4000 Ericsson Drive
Warrendale, PA 15086-7561
Contact us at FederatedHermes.com/us
or call 1-800-341-7400.
Federated Securities Corp., Distributor
CUSIP 314172677
CUSIP 314172651
CUSIP 314172644
CUSIP 31421N873
© 2024 Federated Hermes, Inc.
Annual Financial Statements
and Additional Information
Federated Hermes Kaufmann Large Cap Fund
A Portfolio of Federated Hermes Equity FundsNot FDIC Insured ▪ May Lose Value ▪ No Bank Guarantee
Portfolio of Investments
| | | |
| | | |
| | Communication Services—7.9% | |
| | | |
| | | |
| | | |
| | | |
| | Consumer Discretionary—11.4% | |
| | | |
| | | |
| | Chipotle Mexican Grill, Inc. | |
| | | |
| | | |
| | | |
| | | |
| | | |
| | | |
| | | |
| | | |
| | London Stock Exchange Group PLC | |
| | | |
| | | |
| | | |
| | | |
| | | |
| | | |
| | | |
| | | |
| | | |
| | | |
| | | |
| | | |
| | | |
| | Sarepta Therapeutics, Inc. | |
| | | |
| | | |
| | | |
| | Vertex Pharmaceuticals, Inc. | |
| | | |
| | | |
| | | |
| | | |
| | | |
| | | |
| | | |
| | | |
| | | |
| | Information Technology—39.1% | |
| | | |
| | Advanced Micro Devices, Inc. | |
| | | |
| | | |
Annual Financial Statements and Additional Information
| | | |
| | | |
| | Information Technology—continued | |
| | | |
| | Crowdstrike Holdings, Inc. | |
| | | |
| | | |
| | | |
| | | |
| | | |
| | | |
| | | |
| | | |
| | | |
| | Taiwan Semiconductor Manufacturing Co. Ltd., ADR | |
| | | |
| | | |
| | | |
| | | |
| | | |
| | | |
| | | |
| | | |
| | | |
| | | |
| | TOTAL COMMON STOCKS
(IDENTIFIED COST $628,889,784) | |
| | | |
| | Federated Hermes Government Obligations Fund, Premier Shares, 4.77%3 (IDENTIFIED COST $502,183) | |
| | TOTAL INVESTMENT IN SECURITIES—99.8%
(IDENTIFIED COST $629,391,967)4 | |
| | OTHER ASSETS AND LIABILITIES - NET—0.2%5 | |
| | | |
Transactions with affiliated investment companies, which are funds managed by the Adviser or an affiliate of the Adviser, during the period ended October 31, 2024, were as follows:
| Federated Hermes
Government
Obligations Fund,
Premier Shares* | Federated Hermes
Institutional
Prime Value
Obligations Fund,
Institutional Shares | Total of
Affiliated
Transactions |
| | | |
| | | |
| | | |
Change in Unrealized Appreciation/Depreciation | | | |
| | | |
| | | |
Shares Held as of 10/31/2024 | | | |
| | | |
| All or a portion of the balance/activity for the fund relates to cash collateral received on securities lending transactions. |
Annual Financial Statements and Additional Information
| Non-income-producing security. |
| Market quotations and price evaluations are not available. Fair value determined using significant unobservable inputs in accordance with procedures established by and under the general supervision of the Fund’s Adviser acting through its Valuation Committee (“Valuation Committee”). |
| |
| The cost of investments for federal tax purposes amounts to $632,368,552. |
| Assets, other than investments in securities, less liabilities. See Statement of Assets and Liabilities. |
Note: The categories of investments are shown as a percentage of total net assets at October 31, 2024.
Various inputs are used in determining the value of the Fund’s investments. These inputs are summarized in the three broad levels listed below:
Level 1—quoted prices in active markets for identical securities.
Level 2—other significant observable inputs (including quoted prices for similar securities, interest rates, prepayment speeds, credit risk, etc.). Also includes securities valued at amortized cost.
Level 3—significant unobservable inputs (including the Fund’s own assumptions in determining the fair value of investments).
The inputs or methodology used for valuing securities are not an indication of the risk associated with investing in those securities.
The following is a summary of the inputs used, as of October 31, 2024, in valuing the Fund’s assets carried at fair value:
|
| | Level 2—
Other
Significant
Observable
Inputs | Level 3—
Significant
Unobservable
Inputs | |
| | | | |
| | | | |
| | | | |
| | | | |
| | | | |
| | | | |
The following acronym(s) are used throughout this portfolio: | |
| —American Depositary Receipt |
See Notes which are an integral part of the Financial Statements
Annual Financial Statements and Additional Information
Financial Highlights–Class A Shares
(For a Share Outstanding Throughout Each Period)
| |
| | | | | |
Net Asset Value, Beginning of Period | | | | | |
Income From Investment Operations: | | | | | |
Net investment income (loss)1 | | | | | |
Net realized and unrealized gain (loss) | | | | | |
Total From Investment Operations | | | | | |
| | | | | |
Distributions from net realized gain | | | | | |
Net Asset Value, End of Period | | | | | |
| | | | | |
Ratios to Average Net Assets: | | | | | |
| | | | | |
Net investment income (loss) | | | | | |
Expense waiver/reimbursement4 | | | | | |
| | | | | |
Net assets, end of period (000 omitted) | | | | | |
| | | | | |
| Per share numbers have been calculated using the average shares method. |
| Based on net asset value, which does not reflect the sales charge, redemption fee or contingent deferred sales charge, if applicable. |
| Amount does not reflect net expenses incurred by investment companies in which the Fund may invest. |
| This expense decrease is reflected in both the net expense and the net investment income (loss) ratios shown above. Amount does not reflect expense waiver/ reimbursement recorded by investment companies in which the Fund may invest. |
| Securities that mature are considered sales for purposes of this calculation. |
See Notes which are an integral part of the Financial Statements
Annual Financial Statements and Additional Information
Financial Highlights–Class C Shares
(For a Share Outstanding Throughout Each Period)
| |
| | | | | |
Net Asset Value, Beginning of Period | | | | | |
Income From Investment Operations: | | | | | |
Net investment income (loss)1 | | | | | |
Net realized and unrealized gain (loss) | | | | | |
Total From Investment Operations | | | | | |
| | | | | |
Distributions from net realized gain | | | | | |
Net Asset Value, End of Period | | | | | |
| | | | | |
Ratios to Average Net Assets: | | | | | |
| | | | | |
Net investment income (loss) | | | | | |
Expense waiver/reimbursement4 | | | | | |
| | | | | |
Net assets, end of period (000 omitted) | | | | | |
| | | | | |
| Per share numbers have been calculated using the average shares method. |
| Based on net asset value, which does not reflect the sales charge, redemption fee or contingent deferred sales charge, if applicable. |
| Amount does not reflect net expenses incurred by investment companies in which the Fund may invest. |
| This expense decrease is reflected in both the net expense and the net investment income (loss) ratios shown above. Amount does not reflect expense waiver/ reimbursement recorded by investment companies in which the Fund may invest. |
| Securities that mature are considered sales for purposes of this calculation. |
See Notes which are an integral part of the Financial Statements
Annual Financial Statements and Additional Information
Financial Highlights–Class R Shares
(For a Share Outstanding Throughout Each Period)
| |
| | | | | |
Net Asset Value, Beginning of Period | | | | | |
Income From Investment Operations: | | | | | |
Net investment income (loss)1 | | | | | |
Net realized and unrealized gain (loss) | | | | | |
Total From Investment Operations | | | | | |
| | | | | |
Distributions from net realized gain | | | | | |
Net Asset Value, End of Period | | | | | |
| | | | | |
Ratios to Average Net Assets: | | | | | |
| | | | | |
Net investment income (loss) | | | | | |
Expense waiver/reimbursement4 | | | | | |
| | | | | |
Net assets, end of period (000 omitted) | | | | | |
| | | | | |
| Per share numbers have been calculated using the average shares method. |
| Based on net asset value. |
| Amount does not reflect net expenses incurred by investment companies in which the Fund may invest. |
| This expense decrease is reflected in both the net expense and the net investment income (loss) ratios shown above. Amount does not reflect expense waiver/ reimbursement recorded by investment companies in which the Fund may invest. |
| Securities that mature are considered sales for purposes of this calculation. |
See Notes which are an integral part of the Financial Statements
Annual Financial Statements and Additional Information
Financial Highlights–Institutional Shares
(For a Share Outstanding Throughout Each Period)
| |
| | | | | |
Net Asset Value, Beginning of Period | | | | | |
Income From Investment Operations: | | | | | |
Net investment income (loss)1 | | | | | |
Net realized and unrealized gain (loss) | | | | | |
Total From Investment Operations | | | | | |
| | | | | |
Distributions from net realized gain | | | | | |
Net Asset Value, End of Period | | | | | |
| | | | | |
Ratios to Average Net Assets: | | | | | |
| | | | | |
Net investment income (loss) | | | | | |
Expense waiver/reimbursement4 | | | | | |
| | | | | |
Net assets, end of period (000 omitted) | | | | | |
| | | | | |
| Per share numbers have been calculated using the average shares method. |
| Based on net asset value. |
| Amount does not reflect net expenses incurred by investment companies in which the Fund may invest. |
| This expense decrease is reflected in both the net expense and the net investment income (loss) ratios shown above. Amount does not reflect expense waiver/ reimbursement recorded by investment companies in which the Fund may invest. |
| Securities that mature are considered sales for purposes of this calculation. |
See Notes which are an integral part of the Financial Statements
Annual Financial Statements and Additional Information
Financial Highlights–Class R6 Shares
(For a Share Outstanding Throughout Each Period)
| |
| | | | | |
Net Asset Value, Beginning of Period | | | | | |
Income From Investment Operations: | | | | | |
Net investment income (loss)1 | | | | | |
Net realized and unrealized gain (loss) | | | | | |
Total From Investment Operations | | | | | |
| | | | | |
Distributions from net realized gain | | | | | |
Net Asset Value, End of Period | | | | | |
| | | | | |
Ratios to Average Net Assets: | | | | | |
| | | | | |
Net investment income (loss) | | | | | |
Expense waiver/reimbursement4 | | | | | |
| | | | | |
Net assets, end of period (000 omitted) | | | | | |
| | | | | |
| Per share numbers have been calculated using the average shares method. |
| Based on net asset value. |
| Amount does not reflect net expenses incurred by investment companies in which the Fund may invest. |
| This expense decrease is reflected in both the net expense and the net investment income (loss) ratios shown above. Amount does not reflect expense waiver/ reimbursement recorded by investment companies in which the Fund may invest. |
| Securities that mature are considered sales for purposes of this calculation. |
See Notes which are an integral part of the Financial Statements
Annual Financial Statements and Additional Information
Statement of Assets and LiabilitiesOctober 31, 2024
| |
Investment in securities, at value including $502,183 of investments in affiliated holdings* (identified cost $629,391,967, including $502,183 of identified cost in affiliated holdings) | |
Cash denominated in foreign currencies (identified cost $1,823) | |
| |
Income receivable from affiliated holdings | |
Receivable for investments sold | |
Receivable for shares sold | |
| |
| |
Payable for investments purchased | |
Payable for shares redeemed | |
Payable for investment adviser fee (Note 5) | |
Payable for administrative fee (Note 5) | |
Payable for auditing fees | |
Payable for portfolio accounting fees | |
Payable for distribution services fee (Note 5) | |
Payable for other service fees (Notes 2 and 5) | |
Accrued expenses (Note 5) | |
| |
Net assets for 66,352,131 shares outstanding | |
| |
| |
Total distributable earnings (loss) | |
| |
Net Asset Value, Offering Price and Redemption Proceeds Per Share: | |
| |
Net asset value per share ($558,998,309 ÷ 25,727,142 shares outstanding), no par value, unlimited shares authorized | |
Offering price per share (100/94.50 of $21.73) | |
Redemption proceeds per share | |
| |
Net asset value per share ($77,368,738 ÷ 4,803,916 shares outstanding), no par value, unlimited shares authorized | |
| |
Redemption proceeds per share (99.00/100 of $16.11) | |
| |
Net asset value per share ($46,771,005 ÷ 2,511,560 shares outstanding), no par value, unlimited shares authorized | |
| |
Redemption proceeds per share | |
| |
Net asset value per share ($719,123,029 ÷ 30,487,921 shares outstanding), no par value, unlimited shares authorized | |
| |
Redemption proceeds per share | |
| |
Net asset value per share ($67,395,419 ÷ 2,821,592 shares outstanding), no par value, unlimited shares authorized | |
| |
Redemption proceeds per share | |
| See information listed after the Fund’s Portfolio of Investments. |
See Notes which are an integral part of the Financial Statements
Annual Financial Statements and Additional Information
Statement of OperationsYear Ended October 31, 2024
| |
Dividends (including $748,905 received from affiliated holdings* and net of foreign taxes withheld of $91,523) | |
Net income on securities loaned (includes $148,021 earned from affiliated holdings related to cash collateral balances) | |
| |
| |
| |
Investment adviser fee (Note 5) | |
Administrative fee (Note 5) | |
| |
Transfer agent fees (Note 2) | |
Directors’/Trustees’ fees (Note 5) | |
| |
| |
Portfolio accounting fees | |
Distribution services fee (Note 5) | |
Other service fees (Notes 2 and 5) | |
| |
| |
| |
| |
Waivers and Reimbursements: | |
Waiver/reimbursement of investment adviser fee (Note 5) | |
Waiver/reimbursement of other operating expenses (Notes 2 and 5) | |
TOTAL WAIVERS AND REIMBURSEMENTS | |
| |
Net investment income (loss) | |
Realized and Unrealized Gain (Loss) on Investments, Foreign Currency Transactions and Foreign Exchange Contracts: | |
Net realized gain on investments (including net realized loss of $(4,240) on sales of investments in affiliated holdings*) | |
Net realized gain on foreign currency transactions | |
Net realized gain on foreign exchange contracts | |
Net change in unrealized appreciation of investments | |
Net change in unrealized appreciation/depreciation of translation of assets and liabilities in foreign currency | |
Net realized and unrealized gain (loss) on investments, foreign currency transactions and foreign exchange contracts | |
Change in net assets resulting from operations | |
| See information listed after the Fund’s Portfolio of Investments. |
See Notes which are an integral part of the Financial Statements
Annual Financial Statements and Additional Information
Statement of Changes in Net Assets
| | |
Increase (Decrease) in Net Assets | | |
| | |
| | |
| | |
Net change in unrealized appreciation/depreciation | | |
CHANGE IN NET ASSETS RESULTING FROM OPERATIONS | | |
Distributions to Shareholders: | | |
| | |
| | |
| | |
| | |
| | |
CHANGE IN NET ASSETS RESULTING FROM DISTRIBUTIONS TO SHAREHOLDERS | | |
| | |
Proceeds from sale of shares | | |
Net asset value of shares issued to shareholders in payment of distributions declared | | |
| | |
CHANGE IN NET ASSETS RESULTING FROM SHARE TRANSACTIONS | | |
| | |
| | |
| | |
| | |
See Notes which are an integral part of the Financial Statements
Annual Financial Statements and Additional Information
Notes to Financial Statements
Federated Hermes Equity Funds (the “Trust”) is registered under the Investment Company Act of 1940, as amended (the “Act”), as an open-end management investment company. The Trust consists of eight portfolios. The financial statements included herein are only those of Federated Hermes Kaufmann Large Cap Fund (the “Fund”), a diversified portfolio. The financial statements of the other portfolios are presented separately. The assets of each portfolio are segregated and a shareholder’s interest is limited to the portfolio in which shares are held. Each portfolio pays its own expenses. The Fund offers five classes of shares: Class A Shares, Class C Shares, Class R Shares, Institutional Shares and Class R6 Shares. All shares of the Fund have equal rights with respect to voting, except on class-specific matters. The investment objective of the Fund is to provide capital appreciation.
The Fund’s Board of Trustees (the “Trustees”) have approved the replacement of Federated Equity Management Company of Pennsylvania with Federated Global Investment Management Corp. (“Fed Global”) as adviser to the Fund, effective August 1, 2024. Previously, Fed Global served as the Fund’s sub-adviser.
2. SIGNIFICANT ACCOUNTING POLICIES
The following is a summary of significant accounting policies consistently followed by the Fund in the preparation of its financial statements. These policies are in conformity with U.S. generally accepted accounting principles (GAAP).
In calculating its net asset value (NAV), the Fund generally values investments as follows:
■
Equity securities listed on an exchange or traded through a regulated market system are valued at their last reported sale price or official closing price in their principal exchange or market.
■
Shares of other mutual funds or non-exchange-traded investment companies are valued based upon their reported NAVs, or NAV per share practical expedient, as applicable.
■
Fixed-income securities are fair valued using price evaluations provided by a pricing service approved by Fed Global (the “Adviser”).
■
Derivative contracts listed on exchanges are valued at their reported settlement or closing price, except that options are valued at the mean of closing bid and ask quotations.
■
Over-the-counter (OTC) derivative contracts are fair valued using price evaluations provided by a pricing service approved by the Adviser.
■
For securities that are fair valued in accordance with procedures established by and under the general supervision of the Adviser, certain factors may be considered, such as: the last traded or purchase price of the security, information obtained by contacting the issuer or dealers, analysis of the issuer’s financial statements or other available documents, fundamental analytical data, the nature and duration of restrictions on disposition, the movement of the market in which the security is normally traded, public trading in similar securities or derivative contracts of the issuer or comparable issuers, movement of a relevant index, or other factors including but not limited to industry changes and relevant government actions.
If any price, quotation, price evaluation or other pricing source is not readily available when the NAV is calculated, if the Fund cannot obtain price evaluations from a pricing service or from more than one dealer for an investment within a reasonable period of time as set forth in the Adviser’s valuation policies and procedures for the Fund, or if information furnished by a pricing service, in the opinion of the Adviser’s valuation committee (“Valuation Committee”), is deemed not representative of the fair value of such security, the Fund uses the fair value of the investment determined in accordance with the procedures described below. There can be no assurance that the Fund could obtain the fair value assigned to an investment if it sold the investment at approximately the time at which the Fund determines its NAV per share, and the actual value obtained could be materially different.
Fair Valuation and Significant Events Procedures
Pursuant to Rule 2a-5 under the Act, the Trustees have designated the Adviser as the Fund’s valuation designee to perform any fair value determinations for securities and other assets held by the Fund. The Adviser is subject to the Trustees’ oversight and certain reporting and other requirements intended to provide the Trustees the information needed to oversee the Adviser’s fair value determinations.
The Adviser, acting through its Valuation Committee, is responsible for determining the fair value of investments for which market quotations are not readily available. The Valuation Committee is comprised of officers of the Adviser and certain of the Adviser’s affiliated companies and determines fair value and oversees the calculation of the NAV. The Valuation Committee is also authorized to use pricing services to provide fair value evaluations of the current value of certain investments for purposes of calculating the NAV. The Valuation Committee employs various methods for reviewing third-party pricing-service evaluations including periodic reviews of third-party pricing services’ policies, procedures and valuation methods (including key inputs, methods, models and assumptions), transactional back-testing, comparisons of evaluations of different pricing services, and review of price challenges by the Adviser based on recent market activity. In the event that market quotations and price evaluations are not available for an investment, the Valuation Committee determines the fair value of the investment in accordance with procedures adopted by the Adviser. The Trustees periodically review the fair valuations made by the Valuation Committee. The Trustees have also approved the Adviser’s fair valuation and significant events procedures as part of the Fund’s compliance program and will review any changes made to the procedures.
Factors considered by pricing services in evaluating an investment include the yields or prices of investments of comparable quality, coupon, maturity, call rights and other potential prepayments, terms and type, reported transactions, indications as to values from dealers and general market conditions. Some pricing services provide a single price evaluation reflecting the bid-side of the market for an investment (a “bid” evaluation). Other pricing services offer both bid evaluations and price evaluations indicative of a price between
Annual Financial Statements and Additional Information
the prices bid and ask for the investment (a “mid” evaluation). The Fund normally uses bid evaluations for any U.S. Treasury and Agency securities, mortgage-backed securities and municipal securities. The Fund normally uses mid evaluations for any other types of fixed-income securities and any OTC derivative contracts. In the event that market quotations and price evaluations are not available for an investment, the fair value of the investment is determined in accordance with procedures adopted by the Adviser.
The Adviser has also adopted procedures requiring an investment to be priced at its fair value whenever the Valuation Committee determines that a significant event affecting the value of the investment has occurred between the time as of which the price of the investment would otherwise be determined and the time as of which the NAV is computed. An event is considered significant if there is both an affirmative expectation that the investment’s value will change in response to the event and a reasonable basis for quantifying the resulting change in value. Examples of significant events that may occur after the close of the principal market on which a security is traded, or after the time of a price evaluation provided by a pricing service or a dealer, include:
■
With respect to securities traded principally in foreign markets, significant trends in U.S. equity markets or in the trading of foreign securities index futures contracts;
■
Political or other developments affecting the economy or markets in which an issuer conducts its operations or its securities are traded;
■
Announcements concerning matters such as acquisitions, recapitalizations, litigation developments, or a natural disaster affecting the issuer’s operations or regulatory changes or market developments affecting the issuer’s industry.
The Adviser has adopted procedures whereby the Valuation Committee uses a pricing service to provide factors to update the fair value of equity securities traded principally in foreign markets from the time of the close of their respective foreign stock exchanges to the pricing time of the Fund. For other significant events, the Fund may seek to obtain more current quotations or price evaluations from alternative pricing sources. If a reliable alternative pricing source is not available, the Valuation Committee will determine the fair value of the investment in accordance with the fair valuation procedures approved by the Adviser. The Trustees periodically review fair valuations made in response to significant events.
Investment Income, Gains and Losses, Expenses and Distributions
Investment transactions are accounted for on a trade-date basis. Realized gains and losses from investment transactions are recorded on an identified-cost basis. Interest income and expenses are accrued daily. Dividend income and distributions to shareholders are recorded on the ex-dividend date. Foreign dividends are recorded on the ex-dividend date or when the Fund is informed of the ex-dividend date. Distributions of net investment income, if any, are declared and paid annually. Non-cash dividends included in dividend income, if any, are recorded at fair value. Amortization/accretion of premium and discount is included in investment income. Investment income, realized and unrealized gains and losses, and certain fund-level expenses are allocated to each class based on relative average daily net assets, except that select classes will bear certain expenses unique to those classes. The detail of the total fund expense waivers and reimbursements of $1,797,018 is disclosed in various locations in this Note 2 and Note 5. Dividends are declared separately for each class. No class has preferential dividend rights; differences in per share dividend rates are generally due to differences in separate class expenses.
For the year ended October 31, 2024, transfer agent fees for the Fund were as follows:
| Transfer Agent
Fees Incurred | Transfer Agent
Fees Reimbursed |
| | |
| | |
| | |
| | |
| | |
| | |
The Fund may pay other service fees up to 0.25% of the average daily net assets of the Fund’s Class A Shares and Class C Shares to financial intermediaries or to Federated Shareholder Services Company (FSSC) for providing services to shareholders and maintaining shareholder accounts. Subject to the terms described in the Expense Limitation note, FSSC may voluntarily reimburse the Fund for other service fees.
For the year ended October 31, 2024, other service fees for the Fund were as follows:
| Other Service
Fees Incurred |
| |
| |
| |
Annual Financial Statements and Additional Information
Federal Taxes
It is the Fund’s policy to comply with the Subchapter M provision of the Internal Revenue Code of 1986 and to distribute to shareholders each year substantially all of its income. Accordingly, no provision for federal income tax is necessary. As of and during the year ended October 31, 2024, the Fund did not have a liability for any uncertain tax positions. The Fund recognizes interest and penalties, if any, related to tax liabilities as income tax expense in the Statement of Operations. As of October 31, 2024, tax years 2021 through 2024 remain subject to examination by the Fund’s major tax jurisdictions, which include the United States of America and the Commonwealth of Massachusetts.
The Fund may be subject to taxes imposed by governments of countries in which it invests. Such taxes are generally based on either income or gains earned or repatriated. The Fund accrues and applies such taxes to net investment income, net realized gains and net unrealized gains as income and/or gains are earned.
When-Issued and Delayed-Delivery Transactions
The Fund may engage in when-issued or delayed-delivery transactions. The Fund records when-issued securities on the trade date and maintains security positions such that sufficient liquid assets will be available to make payment for the securities purchased. Securities purchased on a when-issued or delayed-delivery basis are marked to market daily and begin earning interest on the settlement date. Losses may occur on these transactions due to changes in market conditions or the failure of counterparties to perform under the contract.
Foreign Currency Translation
The accounting records of the Fund are maintained in U.S. dollars. All assets and liabilities denominated in foreign currencies are translated into U.S. dollars based on the rates of exchange of such currencies against U.S. dollars on the date of valuation. Purchases and sales of securities, income and expenses are translated at the rate of exchange quoted on the respective date that such transactions are recorded. The Fund does not isolate that portion of the results of operations resulting from changes in foreign exchange rates on investments from the fluctuations arising from changes in market prices of securities held. Such fluctuations are included with the net realized and unrealized gain or loss from investments.
Reported net realized foreign exchange gains or losses arise from sales of foreign currencies, currency gains or losses realized between the trade and settlement dates on securities transactions, the difference between the amounts of dividends, interest and foreign withholding taxes recorded on the Fund’s books, and the U.S. dollar equivalent of the amounts actually received or paid. Net unrealized foreign exchange gains and losses arise from changes in the value of assets and liabilities other than investments in securities at fiscal year end, resulting from changes in the exchange rate.
The Fund may purchase securities which are considered restricted. Restricted securities are securities that either: (a) cannot be offered for public sale without first being registered, or being able to take advantage of an exemption from registration, under the Securities Act of 1933; or (b) are subject to contractual restrictions on public sales. In some cases, when a security cannot be offered for public sale without first being registered, the issuer of the restricted security has agreed to register such securities for resale, at the issuer’s expense, either upon demand by the Fund or in connection with another registered offering of the securities. Many such restricted securities may be resold in the secondary market in transactions exempt from registration. Restricted securities may be determined to be liquid under criteria established by the Trustees. The Fund will not incur any registration costs upon such resales. The Fund’s restricted securities, like other securities, are priced in accordance with procedures established by and under the general supervision of the Adviser.
The Fund participates in a securities lending program providing for the lending of equity securities to qualified brokers. The term of the loans within the program is one year or less. The Fund normally receives cash collateral for securities loaned that is invested in affiliated money market funds, other money market instruments and/or repurchase agreements. Collateral is maintained at a minimum level of 100% of the market value of investments loaned, plus interest, if applicable. In accordance with the Fund’s securities lending agreement, the market value of securities on loan is determined each day at the close of business and any additional collateral required to cover the value of securities on loan is delivered to the Fund on the next business day. Earnings from collateral invested in affiliated holdings as presented parenthetically on the Statement of Operations do not reflect fees and rebates and are allocated between the borrower of the security, the securities lending agent, as a fee for its services under the program and the Fund, according to agreed-upon rates. The Fund will not have the right to vote on securities while they are on loan. However, the Fund will attempt to terminate a loan in an effort to reacquire the securities in time to vote on matters that are deemed to be material by the Adviser. There can be no assurance that the Fund will have sufficient notice of such matters to be able to terminate the loan in time to vote thereon.
As of October 31, 2024, the Fund had no outstanding securities on loan.
The preparation of financial statements in conformity with GAAP requires management to make estimates and assumptions that affect the amounts of assets, liabilities, expenses and revenues reported in the financial statements. Actual results could differ materially from those estimated. The Fund applies investment company accounting and reporting guidance.
Annual Financial Statements and Additional Information
3. SHARES OF BENEFICIAL INTEREST
The following tables summarize share activity:
| | |
| | | | |
| | | | |
Shares issued to shareholders in payment of distributions declared | | | | |
| | | | |
NET CHANGE RESULTING FROM CLASS A SHARE TRANSACTIONS | | | | |
| | |
| | | | |
| | | | |
Shares issued to shareholders in payment of distributions declared | | | | |
| | | | |
NET CHANGE RESULTING FROM CLASS C SHARE TRANSACTIONS | | | | |
| | |
| | | | |
| | | | |
Shares issued to shareholders in payment of distributions declared | | | | |
| | | | |
NET CHANGE RESULTING FROM CLASS R SHARE TRANSACTIONS | | | | |
| | |
| | | | |
| | | | |
Shares issued to shareholders in payment of distributions declared | | | | |
| | | | |
NET CHANGE RESULTING FROM INSTITUTIONAL SHARE TRANSACTIONS | | | | |
| | |
| | | | |
| | | | |
Shares issued to shareholders in payment of distributions declared | | | | |
| | | | |
NET CHANGE RESULTING FROM CLASS R6 SHARE TRANSACTIONS | | | | |
NET CHANGE RESULTING FROM TOTAL FUND SHARE TRANSACTIONS | | | | |
4. FEDERAL TAX INFORMATION
The tax character of distributions as reported on the Statement of Changes in Net Assets for the years ended October 31, 2024 and 2023, was as follows:
Annual Financial Statements and Additional Information
As of October 31, 2024, the components of distributable earnings on a tax-basis were as follows:
Undistributed ordinary income | |
Net unrealized appreciation | |
Undistributed long-term capital gains | |
Other temporary differences | |
| |
At October 31, 2024, the cost of investments for federal tax purposes was $632,368,552. The net unrealized appreciation of investments for federal tax purposes was $834,645,903. This consists of unrealized appreciation from investments for those securities having an excess of value over cost of $838,205,788 and unrealized depreciation from investments for those securities having an excess of cost over value of $3,559,885. The difference between book-basis and tax-basis net unrealized appreciation is attributable to differing treatments for deferral of losses on wash sales.
5. INVESTMENT ADVISER FEE AND OTHER TRANSACTIONS WITH AFFILIATES
The advisory agreement between the Fund and the Adviser provides for an annual fee equal to 0.74% of the Fund’s average daily net assets. Prior to July 1, 2024, the investment adviser fee was 0.75% of the Fund’s average daily net assets. Subject to the terms described in the Expense Limitation note, the Adviser may voluntarily choose to waive any portion of its fee and/or reimburse certain operating expenses of the Fund for competitive reasons such as to maintain the Fund’s expense ratio, or as and when appropriate, to maintain positive or zero net yields. For the year ended October 31, 2024, the Adviser voluntarily waived $1,611,033 of its fee and voluntarily reimbursed $147,863 of transfer agent fees.
The Adviser has agreed to reimburse the Fund for certain investment adviser fees as a result of transactions in other affiliated investment companies. For the year ended October 31, 2024, the Adviser reimbursed $14,009.
Prior to becoming Adviser effective August 1, 2024, Fed Global acted as a sub-adviser to the Fund and received an allocable portion of the Fund’s adviser fee. The fee was paid by the prior adviser out of its resources and was not an incremental Fund expense. For the year ended October 31, 2024, Fed Global earned a sub-adviser fee of $7,428,245.
Federated Administrative Services (FAS), under the Administrative Services Agreement, provides the Fund with administrative personnel and services. For purposes of determining the appropriate rate breakpoint, “Investment Complex” is defined as all of the Federated Hermes Funds subject to a fee under the Administrative Services Agreement. The fee paid to FAS is based on the average daily net assets of the Investment Complex as specified below:
| Average Daily Net Assets
of the Investment Complex |
| on assets up to $50 billion |
| on assets over $50 billion |
Subject to the terms described in the Expense Limitation note, FAS may voluntarily choose to waive any portion of its fee. For the year ended October 31, 2024, the annualized fee paid to FAS was 0.078% of average daily net assets of the Fund.
In addition, FAS may charge certain out-of-pocket expenses to the Fund.
Distribution Services Fee
The Fund has adopted a Distribution Plan (the “Plan”) pursuant to Rule 12b-1 under the Act. Under the terms of the Plan, the Fund will compensate Federated Securities Corp. (FSC), the principal distributor, from the daily net assets of the Fund’s Class A Shares, Class C Shares and Class R Shares to finance activities intended to result in the sale of these shares. The Plan provides that the Fund may incur distribution expenses at the following percentages of average daily net assets annually, to compensate FSC:
| Percentage of Average Daily
Net Assets of Class |
| |
| |
| |
Annual Financial Statements and Additional Information
Subject to the terms described in the Expense Limitation note, FSC may voluntarily choose to waive any portion of its fee. For the year ended October 31, 2024, distribution services fees for the Fund were as follows:
| Distribution Services
Fees Incurred | Distribution Services
Fees Waived |
| | |
| | |
| | |
When FSC receives fees, it may pay some or all of them to financial intermediaries whose customers purchase shares. For the year ended October 31, 2024, FSC retained $8,983 of fees paid by the Fund. For the year ended October 31, 2024, the Fund’s Class A Shares did not incur a distribution services fee; however, it may begin to incur this fee upon approval of the Trustees.
Front-end sales charges and contingent deferred sales charges (CDSC) do not represent expenses of the Fund. They are deducted from the proceeds of sales of Fund shares prior to investment or from redemption proceeds prior to remittance, as applicable. For the year ended October 31, 2024, FSC retained $17,859 in sales charges from the sale of Class A Shares. FSC also retained $19,254 of CDSC relating to redemptions of Class C Shares.
For the year ended October 31, 2024, FSSC received $37,110 of the other service fees disclosed in Note 2.
The Adviser and certain of its affiliates (which may include FSC, FAS and FSSC) on their own initiative have agreed to waive certain amounts of their respective fees and/or reimburse expenses. Total annual fund operating expenses (as shown in the financial highlights, excluding dividends and other expenses related to short sales, interest expense, extraordinary expenses and proxy-related expenses, if any) paid by the Fund’s Class A Shares, Class C Shares, Class R Shares, Institutional Shares and Class R6 Shares (after the voluntary waivers and/or reimbursements) will not exceed 1.08%, 1.88%, 1.47%, 0.83% and 0.77% (the “Fee Limit”), respectively, up to but not including the later of (the “Termination Date”): (a) January 1, 2026; or (b) the date of the Fund’s next effective Prospectus. While the Adviser and its applicable affiliates currently do not anticipate terminating or increasing these arrangements prior to the Termination Date, these arrangements may only be terminated or the Fee Limit increased prior to the Termination Date with the agreement of the Trustees.
During the year ended October 31, 2024, the Fund engaged in sale transactions with funds that have a common investment adviser (or affiliated investment advisers), common Directors/Trustees and/or common Officers. These sale transactions complied with Rule 17a-7 under the Act and amounted to $799,915. Net realized gain recognized on these transactions was $463,775.
Directors’/Trustees’ and Miscellaneous Fees
Certain Officers and Trustees of the Fund are Officers and Directors or Trustees of certain of the above companies. To efficiently facilitate payment, Independent Directors’/Trustees’ fees and certain expenses related to conducting meetings of the Directors/Trustees and other miscellaneous expenses are paid by an affiliate of the Adviser which in due course are reimbursed by the Fund. These expenses related to conducting meetings of the Directors/Trustees and other miscellaneous expenses may be included in Accrued and Miscellaneous Expenses on the Statement of Assets and Liabilities and Statement of Operations, respectively.
6. INVESTMENT TRANSACTIONS
Purchases and sales of investments, excluding long-term U.S. government securities and short-term obligations, for the year ended October 31, 2024, were as follows:
The Fund may invest a portion of its assets in securities of companies that are deemed by the Fund’s management to be classified in similar business sectors. Economic developments may have an effect on the liquidity and volatility of the portfolio securities.
A substantial portion of the Fund’s portfolio may be comprised of entities in the Information Technology sector. As a result, the Fund may be more susceptible to any economic, business, political or other developments which generally affect these entities.
The Fund participates with certain other Federated Hermes Funds, on a several basis, in an up to $500,000,000 unsecured, 364-day, committed, revolving line of credit (LOC) agreement dated June 18, 2024. The LOC was made available to temporarily finance the repurchase or redemption of shares of the Fund, failed trades, payment of dividends, settlement of trades and for other short-term, temporary or emergency general business purposes. The Fund cannot borrow under the LOC if an inter-fund loan is outstanding. The Fund’s ability to borrow under the LOC also is subject to the limitations of the Act and various conditions precedent that must be
Annual Financial Statements and Additional Information
satisfied before the Fund can borrow. Loans under the LOC are charged interest at a fluctuating rate per annum equal to (a) the highest, on any day, of (i) the federal funds effective rate, (ii) the published secured overnight financing rate plus an assigned percentage, and (iii) 0.0%, plus (b) a margin. Any fund eligible to borrow under the LOC pays its pro rata share of a commitment fee based on the amount of the lenders’ commitment that has not been utilized, quarterly in arrears and at maturity. As of October 31, 2024, the Fund had no outstanding loans. During the year ended October 31, 2024, the Fund did not utilize the LOC.
Pursuant to an Exemptive Order issued by the Securities and Exchange Commission, the Fund, along with other funds advised by subsidiaries of Federated Hermes, Inc., may participate in an interfund lending program. This program provides an alternative credit facility allowing the Fund to borrow from other participating affiliated funds. As of October 31, 2024, there were no outstanding loans. During the year ended October 31, 2024, the program was not utilized.
Under the Fund’s organizational documents, its Officers and Directors/Trustees are indemnified against certain liabilities arising out of the performance of their duties to the Fund (other than liabilities arising out of their willful misfeasance, bad faith, gross negligence or reckless disregard of their duties to the Fund). In addition, in the normal course of business, the Fund provides certain indemnifications under arrangements with third parties. Typically, obligations to indemnify a third party arise in the context of an arrangement entered into by the Fund under which the Fund agrees to indemnify such third party for certain liabilities arising out of actions taken pursuant to the arrangement, provided the third party’s actions are not deemed to have breached an agreed-upon standard of care (such as willful misfeasance, bad faith, gross negligence or reckless disregard of their duties under the contract). The Fund’s maximum exposure under these arrangements is unknown as this would involve future claims that may be made against the Fund that have not yet arisen. The Fund does not anticipate any material claims or losses pursuant to these arrangements at this time, and accordingly expects the risk of loss to be remote.
11. FEDERAL TAX INFORMATION (UNAUDITED)
For the year ended October 31, 2024, the amount of long-term capital gains designated by the Fund was $417,716,867.
Annual Financial Statements and Additional Information
Report of Independent Registered Public Accounting Firm
TO THE BOARD OF TRUSTEES OF FEDERATED HERMES EQUITY FUNDS AND SHAREHOLDERS OF FEDERATED HERMES KAUFMANN LARGE CAP FUND:
Opinion on the Financial Statements
We have audited the accompanying statement of assets and liabilities of Federated Hermes Kaufmann Large Cap Fund (the “Fund”) (one of the portfolios constituting Federated Hermes Equity Funds (the “Trust”)), including the portfolio of investments, as of October 31, 2024, and the related statement of operations for the year then ended, the statement of changes in net assets for each of the two years in the period then ended, the financial highlights for each of the five years in the period then ended and the related notes (collectively referred to as the “financial statements”). In our opinion, the financial statements present fairly, in all material respects, the financial position of the Fund (one of the portfolios constituting Federated Hermes Equity Funds) at October 31, 2024, the results of its operations for the year then ended, the changes in its net assets for each of the two years in the period then ended and its financial highlights for each of the five years in the period then ended, in conformity with U.S. generally accepted accounting principles.
These financial statements are the responsibility of the Trust’s management. Our responsibility is to express an opinion on the Fund’s financial statements based on our audits. We are a public accounting firm registered with the Public Company Accounting Oversight Board (United States) (“PCAOB”) and are required to be independent with respect to the Trust in accordance with the U.S. federal securities laws and the applicable rules and regulations of the Securities and Exchange Commission and the PCAOB.
We conducted our audits in accordance with the standards of the PCAOB. Those standards require that we plan and perform the audit to obtain reasonable assurance about whether the financial statements are free of material misstatement, whether due to error or fraud. The Trust is not required to have, nor were we engaged to perform, an audit of the Trust’s internal control over financial reporting. As part of our audits, we are required to obtain an understanding of internal control over financial reporting, but not for the purpose of expressing an opinion on the effectiveness of the Trust’s internal control over financial reporting. Accordingly, we express no such opinion.
Our audits included performing procedures to assess the risks of material misstatement of the financial statements, whether due to error or fraud, and performing procedures that respond to those risks. Such procedures included examining, on a test basis, evidence regarding the amounts and disclosures in the financial statements. Our procedures included confirmation of securities owned as of October 31, 2024, by correspondence with the custodian, brokers, and others; when replies were not received from brokers or others, we performed other auditing procedures. Our audits also included evaluating the accounting principles used and significant estimates made by management, as well as evaluating the overall presentation of the financial statements. We believe that our audits provide a reasonable basis for our opinion. We have served as the auditor of one or more Federated Hermes investment companies since 1979.
Boston, Massachusetts
December 23, 2024
Annual Financial Statements and Additional Information
Shareholder Meeting Results (unaudited)
At a Special Meeting held on October 25, 2024, shareholders of the Federated Hermes Equity Funds (the “Trust”) elected Trustees of the Trust. Shareholders of the Trust elected three new individuals to serve as Trustees effective January 1, 2025, who will serve on the Board with current Trustees Messrs. J. Christopher Donahue, John B. Fisher, John G. Carson, G. Thomas Hough, Thomas M. O’Neill, John S. Walsh and Ms. Madelyn A. Reilly. Under the Trust’s Director Service Policy, existing Trustees Judge Maureen Lally-Green and Mr. P. Jerome Richey are expected to retire from the Board on December 31, 2024. The number of votes cast for, against or withheld, as well as the number of abstentions and broker non-votes with respect to the election of each nominee for office, is included below.
Annual Financial Statements and Additional Information
Evaluation and Approval of Advisory Contract–May 2024
Federated Hermes Kaufmann Large Cap Fund (the “Fund”)
At its meetings in May 2024 (the “May Meetings”), the Fund’s Board of Trustees (the “Board”), including those Trustees who are not “interested persons” of the Fund, as defined in the Investment Company Act of 1940 (the “Independent Trustees”), reviewed and unanimously approved the continuation of the investment advisory contract between the Fund and Federated Equity Management Company of Pennsylvania (the “Adviser”) and the investment sub-advisory contract between the Adviser and Federated Global Investment Management Corp. (the “Sub-Adviser” and together with the Adviser, the “Advisers”) with respect to the Fund (together, the “Contracts”) for an additional one-year term. The Board’s determination to approve the continuation of the Contracts reflects the exercise of its business judgment after considering all of the information and factors believed to be relevant and appropriate on whether to approve the continuation of the existing arrangements. The information, factors and conclusions that formed the basis for the Board’s approval are summarized below.
Information Received and Review Process
At the request of the Independent Trustees, the Fund’s Chief Compliance Officer (the “CCO”) furnished to the Board in advance of its May Meetings an independent written evaluation of the Fund’s management fee (the “CCO Fee Evaluation Report”). The Board considered the CCO Fee Evaluation Report, along with other information, in evaluating the reasonableness of the Fund’s management fee and in determining to approve the continuation of the Contracts.
In addition to the extensive materials that comprise and accompany the CCO Fee Evaluation Report, the Board considered information specifically prepared in connection with the approval of the continuation of the Contracts that was presented at the May Meetings. In this regard, in the months preceding the May Meetings, the Board requested and reviewed written responses and supporting materials prepared by the Advisers and their affiliates (collectively, “Federated Hermes”) in response to requests posed to Federated Hermes by independent legal counsel on behalf of the Independent Trustees encompassing a wide variety of topics, including those summarized below. The Board also considered such additional matters as the Independent Trustees deemed reasonably necessary to evaluate the Contracts, which included detailed information about the Fund and Federated Hermes furnished to the Board at its meetings throughout the year and in between regularly scheduled meetings on particular matters as the need arose. The Independent Trustees also considered the presentation from Federated Hermes’ Chief Investment Officer of Equities received at the Board’s February 2024 meetings regarding the Fund and its performance, portfolio management team and other investment-related matters.
The Board’s consideration of the Contracts included review of materials and information covering the following matters, among others: (1) copies of the Contracts; (2) the nature, quality and extent of the advisory and other services provided to the Fund by Federated Hermes; (3) Federated Hermes’ business and operations; (4) the Advisers’ investment philosophy, personnel and processes; (5) the Fund’s investment objectives and strategies; (6) the Fund’s short-term and long-term performance - in absolute terms (both on a gross basis and net of expenses) and relative to an appropriate group of peer funds and its benchmark index; (7) the Fund’s fees and expenses, including the advisory fee and the overall expense structure of the Fund - in absolute terms and relative to an appropriate group of peer funds, with due regard for contractual or voluntary expense limitations (if any); (8) the financial condition of Federated Hermes; (9) the Adviser’s profitability with respect to managing the Fund; (10) distribution and sales activity for the Fund; and (11) the use and allocation of brokerage commissions derived from trading the Fund’s portfolio securities (if any).
The Board also considered judicial decisions concerning allegedly excessive investment advisory fees charged to other registered funds in evaluating the Contracts. Using these judicial decisions as a guide, the Board considered several factors they deemed relevant to an adviser’s fiduciary duty with respect to its receipt of compensation from a fund, including: (1) the nature and quality of the services provided by the adviser to the fund and its shareholders, including the performance of the fund, its benchmark and comparable funds; (2) the adviser’s cost of providing the services and the profitability to the adviser of providing advisory services to the fund; (3) the extent to which the adviser may realize “economies of scale” as the fund grows larger and, if such economies of scale exist, whether they have been appropriately shared with the fund and its shareholders or the family of funds; (4) any “fall-out” benefits that accrue to the adviser because of its relationship with the fund, including research services received from brokers that execute fund trades and any fees paid to affiliates of the adviser for services rendered to the fund; (5) comparative fees and expenses, including a comparison of management fees paid to the adviser with those paid by similar funds managed by the same adviser or other advisers as well as management fees charged to institutional and other advisory clients of the same adviser for what might be viewed as like services; and (6) the extent of care, conscientiousness and independence with which the fund’s board members perform their duties and their expertise, including whether they are fully informed about all facts the board deems relevant to its consideration of the adviser’s services and fees. The Board considered that the Securities and Exchange Commission (“SEC”) disclosure requirements regarding the basis for a fund board’s approval of the fund’s investment advisory contract generally align with the factors listed above. The Board was guided by these factors in its
Annual Financial Statements and Additional Information
evaluation of the Contracts to the extent it considered them to be appropriate and relevant, as discussed further below. The Board considered and weighed these factors in light of its substantial accumulated experience in governing the Fund and working with Federated Hermes on matters relating to the oversight of the other funds advised by Federated Hermes (each, a “Federated Hermes Fund” and, collectively, the “Federated Hermes Funds”).
In addition, the Board considered the preferences and expectations of Fund shareholders and the potential disruptions of the Fund’s operations and various risks, uncertainties and other effects that could occur as a result of a decision to terminate or not renew the Contracts. In particular, the Board recognized that many shareholders likely have invested in the Fund based on the strength of Federated Hermes’ industry standing and reputation and with the expectation that Federated Hermes will have a continuing role in providing advisory services to the Fund. Thus, the Board observed that there are a range of investment options available to the Fund’s shareholders in the marketplace and such shareholders, having had the opportunity to consider other investment options, have effectively selected Federated Hermes by virtue of investing in the Fund.
In determining to approve the continuation of the Contracts, the members of the Board reviewed and evaluated information and factors they believed to be relevant and appropriate through the exercise of their reasonable business judgment. While individual members of the Board may have weighed certain factors differently, the Board’s determination to approve the continuation of the Contracts was based on a comprehensive consideration of all information provided to the Board throughout the year and specifically with respect to the continuation of the Contracts. The Board recognized that its evaluation process is evolutionary and that the factors considered and emphasis placed on relevant factors may change in recognition of changing circumstances in the registered fund marketplace. The Independent Trustees were assisted throughout the evaluation process by independent legal counsel. In connection with their deliberations at the May Meetings, the Independent Trustees met separately in executive session with their independent legal counsel and without management present to review the relevant materials and consider their responsibilities under applicable laws. In addition, senior management representatives of Federated Hermes also met with the Independent Trustees and their independent legal counsel to discuss the materials and presentations furnished to the Board at the May Meetings. The Board considered the approval of the Contracts for the Fund as part of its consideration of agreements for funds across the family of Federated Hermes Funds, but its approvals were made on a fund-by-fund basis.
Nature, Extent and Quality of Services
The Board considered the nature, extent and quality of the services provided to the Fund by the Advisers and the resources of Federated Hermes dedicated to the Fund. In this regard, the Board evaluated, among other things, the terms of the Contracts and the full range of services provided to the Fund by Federated Hermes. The Board considered the Advisers’ personnel, investment philosophy and process, investment research capabilities and resources, trade operations capabilities, experience and performance track record. The Board reviewed the qualifications, backgrounds and responsibilities of the portfolio management team primarily responsible for the day-to-day management of the Fund and evaluated Federated Hermes’ ability and experience in attracting and retaining qualified personnel to service the Fund. The Board considered the trading operations by the Advisers, including the execution of portfolio transactions and the selection of brokers for those transactions. The Board also considered the Advisers’ ability to deliver competitive investment performance for the Fund when compared to the Fund’s Performance Peer Group (as defined below), which was deemed by the Board to be a useful indicator of how the Advisers are executing the Fund’s investment program.
In addition, the Board considered the financial resources and overall reputation of Federated Hermes and its willingness to consider and make investments in personnel, infrastructure, technology, cybersecurity, business continuity planning and operational enhancements that are designed to benefit the Federated Hermes Funds. The Board noted the benefits of the previous significant acquisition of Hermes Fund Managers Limited by Federated Hermes, which has deepened Federated Hermes’ investment management expertise and capabilities and expanded its access to analytical resources related to environmental, social and governance (“ESG”) factors and issuer engagement on ESG matters where appropriate. The Board considered Federated Hermes’ oversight of the securities lending program for the Federated Hermes Funds that engage in securities lending and noted the income earned by the Federated Hermes Funds that participate in such program. In addition, the Board considered the quality of Federated Hermes’ communications with the Board and responsiveness to Board inquiries and requests made from time to time with respect to the Federated Hermes Funds. The Board also considered that Federated Hermes is responsible for providing the Federated Hermes Funds’ officers.
The Board received and evaluated information regarding Federated Hermes’ regulatory and compliance environment. The Board considered Federated Hermes’ compliance program and compliance history and reports from the CCO about Federated Hermes’ compliance with applicable laws and regulations, including responses to regulatory developments and any compliance or other issues raised by regulatory agencies. The Board also noted Federated Hermes’ support of the Federated Hermes Funds’ compliance control structure and the compliance-related resources devoted by Federated Hermes in support of the Fund’s obligations pursuant to Rule 38a-1 under the Investment Company Act of 1940, including Federated Hermes’ commitment to respond to rulemaking and other regulatory initiatives of the SEC. The Board
Annual Financial Statements and Additional Information
considered Federated Hermes’ approach to internal audits and risk management with respect to the Federated Hermes Funds and its day-to-day oversight of the Federated Hermes Funds’ compliance with their investment objectives and policies as well as with applicable laws and regulations, noting that regulatory and other developments had over time led, and continue to lead, to an increase in the scope of Federated Hermes’ oversight in this regard. In addition, the Board noted Federated Hermes’ commitment to maintaining high quality systems and expending substantial resources to prepare for and respond to ongoing changes due to the market, regulatory and control environments in which the Fund and its service providers operate.
The Board considered Federated Hermes’ efforts to provide shareholders in the Federated Hermes Funds with a comprehensive array of funds with different investment objectives, policies and strategies. The Board considered the expenses that Federated Hermes had incurred, as well as the entrepreneurial and other risks assumed by Federated Hermes, in sponsoring and providing on-going services to new funds to expand these opportunities for shareholders. The Board noted the benefits to shareholders of being part of the family of Federated Hermes Funds, which include the general right to exchange investments between the same class of shares without the incurrence of additional sales charges.
Based on these considerations, the Board concluded that it was satisfied with the nature, extent and quality of the services provided by the Advisers to the Fund.
Fund Investment Performance
The Board considered the investment performance of the Fund. In evaluating the Fund’s investment performance, the Board considered performance results in light of the Fund’s investment objective, strategies and risks. The Board considered detailed investment reports on, and the Advisers’ analysis of, the Fund’s performance over different time periods that were provided to the Board throughout the year and in connection with the May Meetings. These reports included, among other items, information on the Fund’s gross and net returns, the Fund’s investment performance compared to one or more relevant categories or groups of peer funds and the Fund’s benchmark index, performance attribution information and commentary on the effect of market conditions. The Board considered that, in its evaluation of investment performance at meetings throughout the year, it focused particular attention on information indicating less favorable performance of certain Federated Hermes Funds for specific time periods and discussed with Federated Hermes the reasons for such performance as well as any specific actions Federated Hermes had taken, or had agreed to take, to seek to enhance Fund investment performance and the results of those actions.
The Board also reviewed comparative information regarding the performance of other registered funds in the category of peer funds selected by Morningstar, Inc. (the “Morningstar”), an independent fund ranking organization (the “Performance Peer Group”). The Board noted the CCO’s view that comparisons to fund peer groups may be helpful, though not conclusive, in evaluating the performance of the Advisers in managing the Fund. The Board considered the CCO’s view that, in evaluating such comparisons, in some cases there may be differences in the funds’ objectives or investment management techniques, or the costs to implement the funds, even within the same Performance Peer Group. In this connection, the Board considered that the longevity and experience of the Fund’s portfolio management team and its extensive bottom-up approach to investing may limit the utility of comparisons to other equity mutual funds.
The Board also considered comparative performance data from Lipper, Inc. that was included in reports provided to the Board throughout the year. The Board noted that differences may exist between the Performance Peer Group and Lipper peers and that the results of these performance comparisons may vary.
The Board considered that the Fund’s performance fell below the median of the Performance Peer Group for the one-year, three-year and five-year periods ended December 31, 2023. The Board discussed the Fund’s performance with the Advisers and recognized the efforts being taken by the Advisers in the context of other factors considered relevant by the Board.
Based on these considerations, the Board concluded that it had continued confidence in the Advisers’ overall capabilities to manage the Fund.
The Board considered the advisory fee, sub-advisory fee, and overall expense structure of the Fund and the comparative fee and expense information that had been provided in connection with the May Meetings. In this regard, the Board was presented with, and considered, information regarding the contractual advisory fee rates, net advisory fee rates, total expense ratios and each element of the Fund’s total expense ratio (i.e., gross and net advisory fees, administrative fees, custody fees, portfolio accounting fees and transfer agency fees) relative to an appropriate group of peer funds compiled by Federated Hermes from the overall category of peer funds selected by Morningstar (the “Expense Peer Group”). The Board received a description of the methodology used to select the Expense Peer Group from the overall Morningstar category. The Board also reviewed comparative information regarding the fees and expenses of the broader group of funds in the overall Morningstar category.
Annual Financial Statements and Additional Information
While mindful that courts have cautioned against giving too much weight to comparative information concerning fees charged to funds by other advisers, the use of comparisons between the Fund and its Expense Peer Group assisted the Board in its evaluation of the Fund’s fees and expenses. The Board focused on comparisons with other registered funds more heavily than non-registered fund products or services because such comparisons are believed to be more relevant. The Board considered that other registered funds are the products most like the Fund, in that they are readily available to Fund shareholders as alternative investment vehicles, and they are the type of investment vehicle, in fact, chosen and maintained by the Fund’s shareholders. The Board noted that the range of such other registered funds’ fees and expenses, therefore, appears to be a relevant indicator of what investors have found to be reasonable in the marketplace in which the Fund competes.
The Board reviewed the contractual advisory fee rate, net advisory fee rate and other expenses of the Fund and noted the position of the Fund’s fee rates relative to its Expense Peer Group. In this regard, the Board noted that the contractual advisory fee rate was above the median of the Expense Peer Group, but the Board noted the applicable waivers and reimbursements, and that the overall expense structure of the Fund remained competitive in the context of other factors considered by the Board. In considering the Fund’s expenses, the Board noted that the Adviser recommended, and the Board approved, a gross advisory fee reduction from 0.75% to 0.74% for the Fund at the May 2024 Meetings.
The Board also received and considered information about the nature and extent of services offered and fees charged by Federated Hermes to other types of clients with investment strategies similar to those of the Federated Hermes Funds, including non-registered fund clients (such as institutional separate accounts) and third-party unaffiliated registered funds for which any of the Advisers or their affiliates serve as sub-adviser. The Board noted the CCO’s conclusion that non-registered fund clients are inherently different products due to the following differences, among others: (i) different types of targeted investors; (ii) different applicable laws and regulations; (iii) different legal structures; (iv) different average account sizes and portfolio management techniques made necessary by different cash flows and different associated costs; (v) the time spent by portfolio managers and their teams (among other personnel across various departments, including legal, compliance and risk management) in reviewing securities pricing; (vi) different SEC mandated risk management programs with respect to fund liquidity and use of derivatives; (vii) different administrative responsibilities; (viii) different degrees of risk associated with management; and (ix) a variety of different costs. The Board also considered information regarding the differences in the nature of the services required for Federated Hermes to manage its proprietary registered fund business versus managing a discrete pool of assets as a sub-adviser to another institution’s registered fund, noting the CCO’s view that Federated Hermes generally performs significant additional services and assumes substantially greater risks in managing the Fund and other Federated Hermes Funds than in its role as sub-adviser to an unaffiliated third-party registered fund. The Board noted that the CCO did not consider the fees for providing advisory services to other types of clients to be determinative in judging the appropriateness of the Federated Hermes Funds’ advisory fees.
Based on these considerations, the Board concluded that the fees and total operating expenses of the Fund, in conjunction with other matters considered, are reasonable in light of the services provided.
The Board received and considered profitability information furnished by Federated Hermes. Such profitability information included revenues reported on a fund-by-fund basis and estimates of the allocation of expenses made on a fund-by-fund basis, using allocation methodologies specified by the CCO and described to the Board. The Board considered the CCO’s view that, while these cost allocation reports apply consistent allocation processes, the inherent difficulties in allocating costs on a fund-by-fund basis continues to cause the CCO to question the precision of the process and to conclude that such reports may be unreliable because a single change in an allocation estimate may dramatically alter the resulting estimate of cost and/or profitability of a Federated Hermes Fund and may produce unintended consequences. In addition, the Board considered the CCO’s view that the allocation methodologies used by Federated Hermes in estimating profitability for purposes of reporting to the Board in connection with the continuation of the Contracts are consistent with the methodologies previously reviewed by an independent consultant. The Board noted that the independent consultant had previously conducted a review of the allocation methodologies and reported to the Board that, although there is no single best method to allocate expenses, the methodologies used by Federated Hermes are reasonable. The Board considered the CCO’s view that the estimated profitability to the Adviser from its relationship with the Fund was not unreasonable in relation to the services provided.
The Board also reviewed information compiled by Federated Hermes comparing its profitability information to other publicly-held fund management companies, including information regarding profitability trends over time. The Board recognized that profitability comparisons among fund management companies are difficult because of the variation in the type of comparative information that is publicly available, and the profitability of any fund management company is
Annual Financial Statements and Additional Information
affected by numerous factors. The Board considered the CCO’s conclusion that, based on such profitability information, Federated Hermes’ profit margins did not appear to be excessive. The Board also considered the CCO’s view that Federated Hermes appeared financially sound, with the resources necessary to fulfill its obligations under its contracts with the Federated Hermes Funds.
The Board received and considered information about the notion of possible realization of “economies of scale” as a fund grows larger, the difficulties of isolating and quantifying economies of scale at an individual fund level, and the extent to which potential scale benefits are shared with shareholders. In this regard, the Board considered that Federated Hermes has made significant and long-term investments in areas that support all of the Federated Hermes Funds, such as: portfolio management, investment research and trading operations; shareholder services; compliance; business continuity, cybersecurity and information security programs; internal audit and risk management functions; and technology, systems capabilities and use of data. The Board noted that Federated Hermes’ investments in these areas are extensive and are designed to provide enhanced or expanded services to the Federated Hermes Funds and their shareholders. The Board considered that the benefits of these investments are likely to be shared with the family of Federated Hermes Funds as a whole.
In addition, the Board considered that fee waivers and expense reimbursements are another means for potential economies of scale to be shared with shareholders and can provide protection from an increase in expenses if a Federated Hermes Fund’s assets decline. The Board considered that, in order for the Federated Hermes Funds to remain competitive in the marketplace, Federated Hermes has frequently waived fees and/or reimbursed expenses for the Federated Hermes Funds and has disclosed to shareholders and/or reported to the Board its intention to do so (or continue to do so) in the future. The Board also considered that Federated Hermes has been active in managing expenses of the Federated Hermes Funds in recent years, which has resulted in benefits being realized by shareholders.
The Board also received and considered information on adviser-paid fees (commonly referred to as “revenue sharing” payments) that was provided to the Board throughout the year and in connection with the May Meetings. The Board considered that Federated Hermes and the CCO believe that this information is relevant to considering whether Federated Hermes had an incentive to either not apply breakpoints, or to apply breakpoints at higher levels, but should not be considered when evaluating the reasonableness of advisory fees. The Board also noted the absence of any applicable regulatory or industry guidelines on economies of scale, which is compounded by the lack of any uniform methodology or pattern with respect to structuring fund advisory fees with breakpoints that serve to reduce the fees as a fund attains a certain size.
The Board considered information regarding the compensation and other ancillary (or “fall-out”) benefits that Federated Hermes derived from its relationships with the Federated Hermes Funds. The Board noted that, in addition to receiving advisory fees under the Federated Hermes Funds’ investment advisory contracts, Federated Hermes’ affiliates also receive fees for providing other services to the Federated Hermes Funds under separate service contracts, including for serving as the Federated Hermes Funds’ administrator and distributor. In this regard, the Board considered that Federated Hermes’ affiliates provide distribution and shareholder services to the Federated Hermes Funds, for which they may be compensated through distribution and servicing fees paid pursuant to Rule 12b-1 plans or otherwise. The Board also received and considered information detailing the benefits, if any, that Federated Hermes may derive from its receipt of research services from brokers who execute portfolio trades for the Federated Hermes Funds.
The Board considered: (i) the CCO’s conclusion that his observations and the information accompanying the CCO Fee Evaluation Report show that the management fee for the Fund is reasonable; and (ii) the CCO’s recommendation that the Board approve the management fee. The Board noted that, under these circumstances, no changes were recommended to, and no objection was raised to the continuation of, the Contracts by the CCO. The CCO also recognized that the Board’s evaluation of the Federated Hermes Funds’ advisory and sub-advisory arrangements is a continuing and ongoing process that is informed by the information that the Board requests and receives from management throughout the course of the year and, in this regard, the CCO and Board noted certain items, and management has committed to reviewing certain items, for future reporting to the Board as the Board continues its ongoing oversight of the Federated Hermes Funds.
On the basis of the information and factors summarized above, among other information and factors deemed relevant by the Board, and the evaluation thereof, the Board, including the Independent Trustees, unanimously voted to approve the continuation of the Contracts. The Board based its determination to approve the Contracts on the totality of the circumstances and relevant factors and with a view of past and future long-term considerations. Not all of the factors and considerations identified above were necessarily deemed to be relevant to the Fund, nor did the Board consider any one of them to be determinative.
Annual Financial Statements and Additional Information
Mutual funds are not bank deposits or obligations, are not guaranteed by any bank and are not insured or guaranteed by the U.S. government, the Federal Deposit Insurance Corporation, the Federal Reserve Board or any other government agency. Investment in mutual funds involves investment risk, including the possible loss of principal.
This information is authorized for distribution to prospective investors only when preceded or accompanied by the Fund’s Prospectus, which contains facts concerning its objective and policies, management fees, expenses and other information.
Federated Hermes Kaufmann Large Cap Fund
Federated Hermes Funds
4000 Ericsson Drive
Warrendale, PA 15086-7561
Contact us at FederatedHermes.com/us
or call 1-800-341-7400.
Federated Securities Corp., Distributor
CUSIP 314172446
CUSIP 314172438
CUSIP 314172420
CUSIP 314172412
CUSIP 314172131
© 2024 Federated Hermes, Inc.
Annual Financial Statements
and Additional Information
Federated Hermes Kaufmann Small Cap Fund
A Portfolio of Federated Hermes Equity FundsNot FDIC Insured ▪ May Lose Value ▪ No Bank Guarantee
Portfolio of Investments
| | | |
| | | |
| | Communication Services—0.9% | |
| | Infrastrutture Wireless Italiane SPA | |
| | | |
| | | |
| | | |
| | Consumer Discretionary—15.4% | |
| | Abercrombie & Fitch Co., Class A | |
| | | |
| | | |
| | Choice Hotels International, Inc. | |
| | | |
| | | |
| | | |
| | | |
| | | |
| | First Watch Restaurant Group, Inc. | |
| | Floor & Decor Holdings, Inc. | |
| | | |
| | | |
| | | |
| | | |
| | | |
| | Six Flags Entertainment Corp. | |
| | | |
| | | |
| | | |
| | | |
| | | |
| | | |
| | | |
| | | |
| | Grocery Outlet Holding Corp. | |
| | | |
| | | |
| | | |
| | | |
| | New Fortress Energy, Inc. | |
| | | |
| | | |
| | | |
| | Artisan Partners Asset Management, Inc. | |
| | | |
| | | |
| | | |
| | | |
| | Amphastar Pharmaceuticals, Inc. | |
| | Arcturus Therapeutics Holdings, Inc. | |
| | | |
| | | |
| | | |
| | | |
Annual Financial Statements and Additional Information
| | | |
| | | |
| | | |
| | | |
| | Clementia Pharmaceuticals, Inc., Rights | |
| | Contra Akouos, Inc., Rights | |
| | | |
| | Dynavax Technologies Corp. | |
| | | |
| | EyePoint Pharmaceuticals, Inc. | |
| | | |
| | | |
| | | |
| | Inspire Medical Systems, Inc. | |
| | | |
| | Intellia Therapeutics, Inc. | |
| | Legend Biotech Corp., ADR | |
| | | |
| | Minerva Neurosciences, Inc. | |
| | Moonlake Immunotherapeutics | |
| | | |
| | Phathom Pharmaceuticals, Inc. | |
| | PROCEPT BioRobotics Corp. | |
| | Regulus Therapeutics, Inc. | |
| | | |
| | | |
| | | |
| | Rhythm Pharmaceuticals, Inc. | |
| | | |
| | Sarepta Therapeutics, Inc. | |
| | | |
| | Structure Therapeutics, Inc., ADR | |
| | Syndax Pharmaceuticals, Inc. | |
| | Ultragenyx Pharmaceutical, Inc. | |
| | | |
| | | |
| | | |
| | | |
| | | |
| | Xenon Pharmaceuticals, Inc. | |
| | | |
| | | |
| | | |
| | | |
| | | |
| | Advanced Drainage System, Inc. | |
| | Applied Industrial Technologies, Inc. | |
| | Aris Water Solutions, Inc. | |
| | | |
| | | |
| | Comfort Systems USA, Inc. | |
| | Fiverr International Ltd. | |
| | | |
| | | |
| | | |
| | | |
| | | |
Annual Financial Statements and Additional Information
| | | |
| | | |
| | | |
| | Montrose Environmental Group, Inc. | |
| | | |
| | | |
| | | |
| | | |
| | | |
| | | |
| | | |
| | | |
| | Information Technology—14.8% | |
| | Allegro MicroSystems, Inc. | |
| | | |
| | | |
| | | |
| | | |
| | | |
| | | |
| | | |
| | | |
| | | |
| | | |
| | | |
| | | |
| | | |
| | | |
| | | |
| | | |
| | | |
| | | |
| | | |
| | | |
| | | |
| | | |
| | | |
| | | |
| | | |
| | | |
| | | |
| | | |
| | Americold Realty Trust, Inc. | |
| | | |
| | | |
| | Gaming and Leisure Properties, Inc. | |
| | Healthpeak Properties, Inc. | |
| | | |
| | Ryman Hospitality Properties, Inc. | |
| | | |
| | | |
| | TOTAL COMMON STOCKS
(IDENTIFIED COST $2,164,221,486) | |
| | | |
| | | |
| | | |
| | Regulus Therapeutics, Inc. | |
Annual Financial Statements and Additional Information
| | | |
| | PREFERRED STOCKS—continued | |
| | | |
| | Regulus Therapeutics, Inc. - Rights | |
| | Regulus Therapeutics, Inc., Conv. Pfd., 1.000% | |
| | TOTAL PREFERRED STOCKS
(IDENTIFIED COST $25,230,344) | |
| | | |
| | | |
| | Gossamer Bio, Inc., Warrants 7/24/2028 | |
| | Immatics N.V., Warrants 6/23/2025 | |
| | Minerva Neurosciences, Inc., Warrants 12/31/2099 | |
| | Rezolute, Inc., Warrants 10/8/2027 | |
| | Rezolute, Inc., Warrants 1/1/2099 | |
| | Rezolute, Inc., Warrants 6/24/2099 | |
| | Rezolute, Inc., Warrants 12/31/2099 | |
| | Scynexis, Inc., Warrants 4/26/2029 | |
| | Scynexis, Inc., Warrants 1/1/2099 | |
| | | |
| | | |
| | NANO Nuclear Energy, Inc., Warrants 10/25/2029 | |
| | TOTAL WARRANTS
(IDENTIFIED COST $21,501,563) | |
| | | |
| | Federated Hermes Government Obligations Fund, Premier Shares, 4.77%6 (IDENTIFIED COST $169,166,677) | |
| | TOTAL INVESTMENT IN SECURITIES—102.0%
(IDENTIFIED COST $2,380,120,070)7 | |
| | OTHER ASSETS AND LIABILITIES - NET—(2.0)%8 | |
| | | |
Annual Financial Statements and Additional Information
An affiliated company is a company in which the Fund, alone or in combination with other Federated Hermes funds, has ownership of at least 5% of the voting shares. Transactions with affiliated companies during the period ended October 31, 2024, were as follows:
| | | | Change in
Unrealized
Appreciation/
(Depreciation)* | | | Shares
Held as of
10/31/2024 | |
| | | | | | | | |
| | | | | | | | |
| | | | | | | | |
| | | | | | | | |
Amphastar Pharmaceuticals, Inc.** | | | | | | | | |
Arcturus Therapeutics Holdings, Inc. | | | | | | | | |
| | | | | | | | |
Dynavax Technologies Corp.** | | | | | | | | |
EyePoint Pharmaceuticals, Inc. | | | | | | | | |
| | | | | | | | |
| | | | | | | | |
Minerva Neurosciences, Inc. | | | | | | | | |
Minerva Neurosciences, Inc., Warrants 12/31/2099 | | | | | | | | |
Regulus Therapeutics, Inc. | | | | | | | | |
Regulus Therapeutics, Inc. | | | | | | | | |
Regulus Therapeutics, Inc. - Rights | | | | | | | | |
Regulus Therapeutics, Inc., Conv. Pfd., 1.000% | | | | | | | | |
| | | | | | | | |
Rezolute, Inc., Warrants 10/8/2027 | | | | | | | | |
Rezolute, Inc., Warrants 1/1/2099 | | | | | | | | |
Rezolute, Inc., Warrants 6/24/2099 | | | | | | | | |
Rezolute, Inc., Warrants 12/31/2099 | | | | | | | | |
| | | | | | | | |
Scynexis, Inc., Warrants 4/26/2029 | | | | | | | | |
Scynexis, Inc., Warrants 1/1/2099 | | | | | | | | |
| | | | | | | | |
| | | | | | | | |
| | | | | | | | |
Affiliated issuers no longer in the port- folio at period end | | | | | | | | |
TOTAL OF AFFILIATED COMPANIES
TRANSACTIONS | | | | | | | | |
| A portion of the amount shown may have been recorded when the Fund no longer had ownership of at least 5% of the voting shares. |
| At October 31, 2024, the Fund no longer has ownership of at least 5% of the voting shares. |
Transactions with affiliated investment companies, which are funds managed by the Adviser or an affiliate of the Adviser, during the period ended October 31, 2024, were as follows:
| Federated Hermes
Government
Obligations Fund,
Premier Shares* | Federated Hermes
Institutional
Prime Value
Obligations Fund,
Institutional Shares* | Total of
Affiliated
Transactions |
| | | |
| | | |
| | | |
Change in Unrealized Appreciation/Depreciation | | | |
| | | |
| | | |
Shares Held as of 10/31/2024 | | | |
| | | |
| All or a portion of the balance/activity for the fund relates to cash collateral received on securities lending transactions. |
Annual Financial Statements and Additional Information
| Non-income-producing security. |
| All or a portion of these securities are temporarily on loan to unaffiliated broker/dealers. |
| Market quotations and price evaluations are not available. Fair value determined using significant unobservable inputs in accordance with procedures established by and under the general supervision of the Fund’s Adviser acting through its Valuation Committee. |
| Denotes a restricted security that either: (a) cannot be offered for public sale without first being registered, or availing of an exemption from registration, under the Securities Act of 1933; or (b) is subject to a contractual restriction on public sales. At October 31, 2024, these restricted securities amounted to $18,528,478, which represented 0.5% of total net assets. |
| Equity security is subject to lock-up or market standoff agreement. As of period end, the total fair value of equity securities subject to contractual sale restriction is $3,215,892 and all restrictions are set to expire on or before March 11, 2025. Under normal market conditions, there are no circumstances that could cause the restrictions to lapse. |
| |
| The cost of investments for federal tax purposes amounts to $2,449,667,380. |
| Assets, other than investments in securities, less liabilities. See Statement of Assets and Liabilities. |
Note: The categories of investments are shown as a percentage of total net assets at October 31, 2024.
Various inputs are used in determining the value of the Fund’s investments. These inputs are summarized in the three broad levels listed below:
Level 1—quoted prices in active markets for identical securities.
Level 2—other significant observable inputs (including quoted prices for similar securities, interest rates, prepayment speeds, credit risk, etc.). Also includes securities valued at amortized cost.
Level 3—significant unobservable inputs (including the Fund’s own assumptions in determining the fair value of investments).
The inputs or methodology used for valuing securities are not an indication of the risk associated with investing in those securities.
The following is a summary of the inputs used, as of October 31, 2024, in valuing the Fund’s assets carried at fair value:
|
| | Level 2—
Other
Significant
Observable
Inputs | Level 3—
Significant
Unobservable
Inputs | |
| | | | |
| | | | |
| | | | |
| | | | |
| | | | |
| | | | |
| | | | |
| | | | |
| | | | |
| | | | |
| | | | |
The following acronym(s) are used throughout this portfolio: | |
| —American Depositary Receipt |
See Notes which are an integral part of the Financial Statements
Annual Financial Statements and Additional Information
Financial Highlights–Class A Shares
(For a Share Outstanding Throughout Each Period)
| |
| | | | | |
Net Asset Value, Beginning of Period | | | | | |
Income From Investment Operations: | | | | | |
Net investment income (loss)1 | | | | | |
Net realized and unrealized gain (loss) | | | | | |
Total From Investment Operations | | | | | |
| | | | | |
Distributions from net investment income | | | | | |
Distributions from net realized gain | | | | | |
| | | | | |
Net Asset Value, End of Period | | | | | |
| | | | | |
Ratios to Average Net Assets: | | | | | |
| | | | | |
Net investment income (loss) | | | | | |
Expense waiver/reimbursement4 | | | | | |
| | | | | |
Net assets, end of period (000 omitted) | | | | | |
| | | | | |
| Per share numbers have been calculated using the average shares method. |
| Based on net asset value, which does not reflect the sales charge, redemption fee or contingent deferred sales charge, if applicable. |
| Amount does not reflect net expenses incurred by investment companies in which the Fund may invest. |
| This expense decrease is reflected in both the net expense and the net investment income (loss) ratios shown above. Amount does not reflect expense waiver/ reimbursement recorded by investment companies in which the Fund may invest. |
| Securities that mature are considered sales for purposes of this calculation. |
See Notes which are an integral part of the Financial Statements
Annual Financial Statements and Additional Information
Financial Highlights–Class C Shares
(For a Share Outstanding Throughout Each Period)
| |
| | | | | |
Net Asset Value, Beginning of Period | | | | | |
Income From Investment Operations: | | | | | |
Net investment income (loss)1 | | | | | |
Net realized and unrealized gain (loss) | | | | | |
Total From Investment Operations | | | | | |
| | | | | |
Distributions from net realized gain | | | | | |
Net Asset Value, End of Period | | | | | |
| | | | | |
Ratios to Average Net Assets: | | | | | |
| | | | | |
Net investment income (loss) | | | | | |
Expense waiver/reimbursement4 | | | | | |
| | | | | |
Net assets, end of period (000 omitted) | | | | | |
| | | | | |
| Per share numbers have been calculated using the average shares method. |
| Based on net asset value, which does not reflect the sales charge, redemption fee or contingent deferred sales charge, if applicable. |
| Amount does not reflect net expenses incurred by investment companies in which the Fund may invest. |
| This expense decrease is reflected in both the net expense and the net investment income (loss) ratios shown above. Amount does not reflect expense waiver/ reimbursement recorded by investment companies in which the Fund may invest. |
| Securities that mature are considered sales for purposes of this calculation. |
See Notes which are an integral part of the Financial Statements
Annual Financial Statements and Additional Information
Financial Highlights–Class R Shares
(For a Share Outstanding Throughout Each Period)
| |
| | | | | |
Net Asset Value, Beginning of Period | | | | | |
Income From Investment Operations: | | | | | |
Net investment income (loss)1 | | | | | |
Net realized and unrealized gain (loss) | | | | | |
Total From Investment Operations | | | | | |
| | | | | |
Distributions from net investment income | | | | | |
Distributions from net realized gain | | | | | |
| | | | | |
Net Asset Value, End of Period | | | | | |
| | | | | |
Ratios to Average Net Assets: | | | | | |
| | | | | |
Net investment income (loss) | | | | | |
Expense waiver/reimbursement4 | | | | | |
| | | | | |
Net assets, end of period (000 omitted) | | | | | |
| | | | | |
| Per share numbers have been calculated using the average shares method. |
| Based on net asset value. |
| Amount does not reflect net expenses incurred by investment companies in which the Fund may invest. |
| This expense decrease is reflected in both the net expense and the net investment income (loss) ratios shown above. Amount does not reflect expense waiver/ reimbursement recorded by investment companies in which the Fund may invest. |
| Securities that mature are considered sales for purposes of this calculation. |
See Notes which are an integral part of the Financial Statements
Annual Financial Statements and Additional Information
Financial Highlights–Institutional Shares
(For a Share Outstanding Throughout Each Period)
| |
| | | | | |
Net Asset Value, Beginning of Period | | | | | |
Income From Investment Operations: | | | | | |
Net investment income (loss)1 | | | | | |
Net realized and unrealized gain (loss) | | | | | |
Total From Investment Operations | | | | | |
| | | | | |
Distributions from net investment income | | | | | |
Distributions from net realized gain | | | | | |
| | | | | |
Net Asset Value, End of Period | | | | | |
| | | | | |
Ratios to Average Net Assets: | | | | | |
| | | | | |
Net investment income (loss) | | | | | |
Expense waiver/reimbursement4 | | | | | |
| | | | | |
Net assets, end of period (000 omitted) | | | | | |
| | | | | |
| Per share numbers have been calculated using the average shares method. |
| Based on net asset value. |
| Amount does not reflect net expenses incurred by investment companies in which the Fund may invest. |
| This expense decrease is reflected in both the net expense and the net investment income (loss) ratios shown above. Amount does not reflect expense waiver/ reimbursement recorded by investment companies in which the Fund may invest. |
| Securities that mature are considered sales for purposes of this calculation. |
See Notes which are an integral part of the Financial Statements
Annual Financial Statements and Additional Information
Financial Highlights–Class R6 Shares
(For a Share Outstanding Throughout Each Period)
| |
| | | | | |
Net Asset Value, Beginning of Period | | | | | |
Income From Investment Operations: | | | | | |
Net investment income (loss)1 | | | | | |
Net realized and unrealized gain (loss) | | | | | |
Total From Investment Operations | | | | | |
| | | | | |
Distributions from net investment income | | | | | |
Distributions from net realized gain | | | | | |
| | | | | |
Net Asset Value, End of Period | | | | | |
| | | | | |
Ratios to Average Net Assets: | | | | | |
| | | | | |
Net investment income (loss) | | | | | |
Expense waiver/reimbursement4 | | | | | |
| | | | | |
Net assets, end of period (000 omitted) | | | | | |
| | | | | |
| Per share numbers have been calculated using the average shares method. |
| Based on net asset value. |
| Amount does not reflect net expenses incurred by investment companies in which the Fund may invest. |
| This expense decrease is reflected in both the net expense and the net investment income (loss) ratios shown above. Amount does not reflect expense waiver/ reimbursement recorded by investment companies in which the Fund may invest. |
| Securities that mature are considered sales for purposes of this calculation. |
See Notes which are an integral part of the Financial Statements
Annual Financial Statements and Additional Information
Statement of Assets and LiabilitiesOctober 31, 2024
| |
Investment in securities, at value including $84,688,452 of securities loaned and $561,902,683 of investments in affiliated holdings* (identified cost $2,380,120,070, including $533,719,999 of identified cost in affiliated holdings) | |
| |
Cash denominated in foreign currencies (identified cost $151,134) | |
| |
Income receivable from affiliated holdings | |
Receivable for investments sold | |
Receivable for shares sold | |
| |
| |
Payable for investments purchased | |
Payable for shares redeemed | |
Payable for collateral due to broker for securities lending (Note 2) | |
Payable for investment adviser fee (Note 5) | |
Payable for administrative fee (Note 5) | |
Payable for Directors’/Trustees’ fees (Note 5) | |
Payable for distribution services fee (Note 5) | |
Payable for other service fees (Notes 2 and 5) | |
Accrued expenses (Note 5) | |
| |
Net assets for 75,888,525 shares outstanding | |
| |
| |
Total distributable earnings (loss) | |
| |
Net Asset Value, Offering Price and Redemption Proceeds Per Share: | |
| |
Net asset value per share ($712,581,670 ÷ 14,289,271 shares outstanding), no par value, unlimited shares authorized | |
Offering price per share (100/94.50 of $49.87) | |
Redemption proceeds per share | |
| |
Net asset value per share ($163,228,214 ÷ 4,051,600 shares outstanding), no par value, unlimited shares authorized | |
| |
Redemption proceeds per share (99.00/100 of $40.29) | |
| |
Net asset value per share ($118,128,761 ÷ 2,353,404 shares outstanding), no par value, unlimited shares authorized | |
| |
Redemption proceeds per share | |
| |
Net asset value per share ($2,283,708,632 ÷ 44,061,708 shares outstanding), no par value, unlimited shares authorized | |
| |
Redemption proceeds per share | |
| |
Net asset value per share ($572,314,612 ÷ 11,132,542 shares outstanding), no par value, unlimited shares authorized | |
| |
Redemption proceeds per share | |
| See information listed after the Fund’s Portfolio of Investments. |
See Notes which are an integral part of the Financial Statements
Annual Financial Statements and Additional Information
Statement of OperationsYear Ended October 31, 2024
| |
Dividends (including $4,983,837 received from affiliated holdings* and net of foreign taxes withheld of $776,520) | |
Net income on securities loaned (includes $12,563,434 earned from affiliated holdings related to cash collateral balances*) (Note 2) | |
| |
| |
| |
Investment adviser fee (Note 5) | |
Administrative fee (Note 5) | |
| |
Transfer agent fees (Note 2) | |
Directors’/Trustees’ fees (Note 5) | |
| |
| |
Portfolio accounting fees | |
Distribution services fee (Note 5) | |
Other service fees (Notes 2 and 5) | |
| |
| |
| |
| |
Waivers and Reimbursements: | |
Waiver/reimbursement of investment adviser fee (Note 5) | |
Waivers/reimbursements of other operating expenses (Notes 2 and 5) | |
TOTAL WAIVERS AND REIMBURSEMENTS | |
| |
Net investment income (loss) | |
Realized and Unrealized Gain (Loss) on Investments and Foreign Currency Transactions: | |
Net realized gain on investments (including net realized gain of $117,339,634 on sales of investments in affiliated holdings*) | |
Net realized loss on foreign currency transactions | |
Net change in unrealized appreciation of investments (including net change in unrealized depreciation of $35,933,744 on investments in affiliated holdings*) | |
Net change in unrealized appreciation/depreciation of translation of assets and liabilities in foreign currency | |
Net realized and unrealized gain (loss) on investments and foreign currency transactions | |
Change in net assets resulting from operations | |
| See information listed after the Fund’s Portfolio of Investments. |
See Notes which are an integral part of the Financial Statements
Annual Financial Statements and Additional Information
Statement of Changes in Net Assets
| | |
Increase (Decrease) in Net Assets | | |
| | |
Net investment income (loss) | | |
| | |
Net change in unrealized appreciation/depreciation | | |
CHANGE IN NET ASSETS RESULTING FROM OPERATIONS | | |
Distributions to Shareholders: | | |
| | |
| | |
| | |
| | |
| | |
CHANGE IN NET ASSETS RESULTING FROM DISTRIBUTIONS TO SHAREHOLDERS | | |
| | |
Proceeds from sale of shares | | |
Net asset value of shares issued to shareholders in payment of distributions declared | | |
| | |
CHANGE IN NET ASSETS RESULTING FROM SHARE TRANSACTIONS | | |
| | |
| | |
| | |
| | |
See Notes which are an integral part of the Financial Statements
Annual Financial Statements and Additional Information
Notes to Financial Statements
Federated Hermes Equity Funds (the “Trust”) is registered under the Investment Company Act of 1940, as amended (the “Act”), as an open-end management investment company. The Trust consists of eight portfolios. The financial statements included herein are only those of Federated Hermes Kaufmann Small Cap Fund (the “Fund”), a diversified portfolio. The financial statements of the other portfolios are presented separately. The assets of each portfolio are segregated and a shareholder’s interest is limited to the portfolio in which shares are held. Each portfolio pays its own expenses. The Fund offers five classes of shares: Class A Shares, Class C Shares, Class R Shares, Institutional Shares and Class R6 Shares. All shares of the Fund have equal rights with respect to voting, except on class-specific matters. The investment objective of the Fund is to provide capital appreciation.
At the close of business on February 3, 2023, Class B Shares were converted into the Fund’s existing Class A Shares pursuant to a Plan of Conversion approved by the Fund’s Board of Trustees (the “Trustees”). The conversion occurred on a tax-free basis. The cash value of a shareholder’s investment was not changed as a result of the share class conversion. No action was required by shareholders to effect the conversion.
The Fund’s Trustees approved the replacement of Federated Equity Management Company of Pennsylvania with Federated Global Investment Management Corp. (“Fed Global”) as Adviser to the Fund, effective August 1, 2024. Previously, Fed Global served as the Fund’s Sub-Adviser.
2. SIGNIFICANT ACCOUNTING POLICIES
The following is a summary of significant accounting policies consistently followed by the Fund in the preparation of its financial statements. These policies are in conformity with U.S. generally accepted accounting principles (GAAP).
In calculating its net asset value (NAV), the Fund generally values investments as follows:
■
Equity securities listed on an exchange or traded through a regulated market system are valued at their last reported sale price or official closing price in their principal exchange or market.
■
Shares of other mutual funds or non-exchange-traded investment companies are valued based upon their reported NAVs, or NAV per share practical expedient, as applicable.
■
Fixed-income securities are fair valued using price evaluations provided by a pricing service approved by Fed Global (the “Adviser”).
■
Derivative contracts listed on exchanges are valued at their reported settlement or closing price, except that options are valued at the mean of closing bid and ask quotations.
■
Over-the-counter (OTC) derivative contracts are fair valued using price evaluations provided by a pricing service approved by the Adviser.
■
For securities that are fair valued in accordance with procedures established by and under the general supervision of the Adviser, certain factors may be considered, such as: the last traded or purchase price of the security, information obtained by contacting the issuer or dealers, analysis of the issuer’s financial statements or other available documents, fundamental analytical data, the nature and duration of restrictions on disposition, the movement of the market in which the security is normally traded, public trading in similar securities or derivative contracts of the issuer or comparable issuers, movement of a relevant index, or other factors including but not limited to industry changes and relevant government actions.
If any price, quotation, price evaluation or other pricing source is not readily available when the NAV is calculated, if the Fund cannot obtain price evaluations from a pricing service or from more than one dealer for an investment within a reasonable period of time as set forth in the Adviser’s valuation policies and procedures for the Fund, or if information furnished by a pricing service, in the opinion of the Adviser’s valuation committee (“Valuation Committee”), is deemed not representative of the fair value of such security, the Fund uses the fair value of the investment determined in accordance with the procedures described below. There can be no assurance that the Fund could obtain the fair value assigned to an investment if it sold the investment at approximately the time at which the Fund determines its NAV per share, and the actual value obtained could be materially different.
Fair Valuation and Significant Events Procedures
Pursuant to Rule 2a-5 under the Act, the Fund’s Trustees have designated the Adviser as the Fund’s valuation designee to perform any fair value determinations for securities and other assets held by the Fund. The Adviser is subject to the Trustees’ oversight and certain reporting and other requirements intended to provide the Trustees the information needed to oversee the Adviser’s fair value determinations.
The Adviser, acting through its Valuation Committee, is responsible for determining the fair value of investments for which market quotations are not readily available. The Valuation Committee is comprised of officers of the Adviser and certain of the Adviser’s affiliated companies and determines fair value and oversees the calculation of the NAV. The Valuation Committee is also authorized to use pricing services to provide fair value evaluations of the current value of certain investments for purposes of calculating the NAV. The Valuation Committee employs various methods for reviewing third-party pricing-service evaluations including periodic reviews of third-party pricing services’ policies, procedures and valuation methods (including key inputs, methods, models and assumptions), transactional back-testing, comparisons of evaluations of different pricing services, and review of price challenges by the Adviser based on recent market activity. In the event that market quotations and price evaluations are not available for an investment, the Valuation Committee determines the fair value of the investment in accordance with procedures adopted by the Adviser. The Trustees periodically review the fair valuations made by the Valuation Committee. The Trustees have also approved the Adviser’s fair valuation and significant events procedures as part of the Fund’s compliance program and will review any changes made to the procedures.
Annual Financial Statements and Additional Information
Factors considered by pricing services in evaluating an investment include the yields or prices of investments of comparable quality, coupon, maturity, call rights and other potential prepayments, terms and type, reported transactions, indications as to values from dealers and general market conditions. Some pricing services provide a single price evaluation reflecting the bid-side of the market for an investment (a “bid” evaluation). Other pricing services offer both bid evaluations and price evaluations indicative of a price between the prices bid and ask for the investment (a “mid” evaluation). The Fund normally uses bid evaluations for any U.S. Treasury and Agency securities, mortgage-backed securities and municipal securities. The Fund normally uses mid evaluations for any other types of fixed-income securities and any OTC derivative contracts. In the event that market quotations and price evaluations are not available for an investment, the fair value of the investment is determined in accordance with procedures adopted by the Adviser.
The Adviser has also adopted procedures requiring an investment to be priced at its fair value whenever the Valuation Committee determines that a significant event affecting the value of the investment has occurred between the time as of which the price of the investment would otherwise be determined and the time as of which the NAV is computed. An event is considered significant if there is both an affirmative expectation that the investment’s value will change in response to the event and a reasonable basis for quantifying the resulting change in value. Examples of significant events that may occur after the close of the principal market on which a security is traded, or after the time of a price evaluation provided by a pricing service or a dealer, include:
■
With respect to securities traded principally in foreign markets, significant trends in U.S. equity markets or in the trading of foreign securities index futures contracts;
■
Political or other developments affecting the economy or markets in which an issuer conducts its operations or its securities are traded;
■
Announcements concerning matters such as acquisitions, recapitalizations, litigation developments, or a natural disaster affecting the issuer’s operations or regulatory changes or market developments affecting the issuer’s industry.
The Adviser has adopted procedures whereby the Valuation Committee uses a pricing service to provide factors to update the fair value of equity securities traded principally in foreign markets from the time of the close of their respective foreign stock exchanges to the pricing time of the Fund. For other significant events, the Fund may seek to obtain more current quotations or price evaluations from alternative pricing sources. If a reliable alternative pricing source is not available, the Valuation Committee will determine the fair value of the investment in accordance with the fair valuation procedures approved by the Adviser. The Trustees periodically review fair valuations made in response to significant events.
The Fund may invest in repurchase agreements for short-term liquidity purposes. It is the policy of the Fund to require the other party to a repurchase agreement to transfer to the Fund’s custodian or sub-custodian eligible securities or cash with a market value (after transaction costs) at least equal to the repurchase price to be paid under the repurchase agreement. The eligible securities are transferred to accounts with the custodian or sub-custodian in which the Fund holds a “securities entitlement” and exercises “control” as those terms are defined in the Uniform Commercial Code. The Fund has established procedures for monitoring the market value of the transferred securities and requiring the transfer of additional eligible securities if necessary to equal at least the repurchase price. These procedures also allow the other party to require securities to be transferred from the account to the extent that their market value exceeds the repurchase price or in exchange for other eligible securities of equivalent market value.
The insolvency of the other party or other failure to repurchase the securities may delay the disposition of the underlying securities or cause the Fund to receive less than the full repurchase price. Under the terms of the repurchase agreement, any amounts received by the Fund in excess of the repurchase price and related transaction costs must be remitted to the other party.
The Fund may enter into repurchase agreements in which eligible securities are transferred into joint trading accounts maintained by the custodian or sub-custodian for investment companies and other clients advised by the Fund’s Adviser and its affiliates. The Fund will participate on a pro rata basis with the other investment companies and clients in its share of the securities transferred under such repurchase agreements and in its share of proceeds from any repurchase or other disposition of such securities.
Investment Income, Gains and Losses, Expenses and Distributions
Investment transactions are accounted for on a trade-date basis. Realized gains and losses from investment transactions are recorded on an identified-cost basis. Interest income and expenses are accrued daily. Dividend income and distributions to shareholders are recorded on the ex-dividend date. Foreign dividends are recorded on the ex-dividend date or when the Fund is informed of the ex-dividend date. Distributions of net investment income, if any, are declared and paid annually. Non-cash dividends included in dividend income, if any, are recorded at fair value. Amortization/accretion of premium and discount is included in investment income. Investment income, realized and unrealized gains and losses, and certain fund-level expenses are allocated to each class based on relative average daily net assets, except that select classes will bear certain expenses unique to those classes. Dividends are declared separately for each class. No class has preferential dividend rights; differences in per share dividend rates are generally due to differences in separate class expenses. The detail of the total fund expense waivers and reimbursements of $4,539,879 is disclosed in various locations in this Note 2 and Note 5.
Annual Financial Statements and Additional Information
Transfer Agent Fees
For the year ended October 31, 2024, transfer agent fees for the Fund were as follows:
| Transfer Agent
Fees Incurred | Transfer Agent
Fees Reimbursed |
| | |
| | |
| | |
| | |
| | |
| | |
The Fund may pay other service fees up to 0.25% of the average daily net assets of the Fund’s Class A Shares and Class C Shares to financial intermediaries or to Federated Shareholder Services Company (FSSC) for providing services to shareholders and maintaining shareholder accounts. Prior to their conversion to Class A Shares at the close of business on February 3, 2023, the Class B Shares were also subject to these fees. Subject to the terms described in the Expense Limitation note, FSSC may voluntarily reimburse the Fund for other service fees.
For the year ended October 31, 2024, other service fees for the Fund were as follows:
| Other Service
Fees Incurred |
| |
| |
| |
It is the Fund’s policy to comply with the Subchapter M provision of the Internal Revenue Code of 1986 and to distribute to shareholders each year substantially all of its income. Accordingly, no provision for federal income tax is necessary. As of and during the year ended October 31, 2024, the Fund did not have a liability for any uncertain tax positions. The Fund recognizes interest and penalties, if any, related to tax liabilities as income tax expense in the Statement of Operations. As of October 31, 2024, tax years 2021 through 2024 remain subject to examination by the Fund’s major tax jurisdictions, which include the United States of America and the Commonwealth of Massachusetts.
The Fund may be subject to taxes imposed by governments of countries in which it invests. Such taxes are generally based on either income or gains earned or repatriated. The Fund accrues and applies such taxes to net investment income, net realized gains and net unrealized gains as income and/or gains are earned.
When-Issued and Delayed-Delivery Transactions
The Fund may engage in when-issued or delayed-delivery transactions. The Fund records when-issued securities on the trade date and maintains security positions such that sufficient liquid assets will be available to make payment for the securities purchased. Securities purchased on a when-issued or delayed-delivery basis are marked to market daily and begin earning interest on the settlement date. Losses may occur on these transactions due to changes in market conditions or the failure of counterparties to perform under the contract.
Foreign Currency Translation
The accounting records of the Fund are maintained in U.S. dollars. All assets and liabilities denominated in foreign currencies are translated into U.S. dollars based on the rates of exchange of such currencies against U.S. dollars on the date of valuation. Purchases and sales of securities, income and expenses are translated at the rate of exchange quoted on the respective date that such transactions are recorded. The Fund does not isolate that portion of the results of operations resulting from changes in foreign exchange rates on investments from the fluctuations arising from changes in market prices of securities held. Such fluctuations are included with the net realized and unrealized gain or loss from investments.
Reported net realized foreign exchange gains or losses arise from sales of foreign currencies, currency gains or losses realized between the trade and settlement dates on securities transactions, the difference between the amounts of dividends, interest and foreign withholding taxes recorded on the Fund’s books, and the U.S. dollar equivalent of the amounts actually received or paid. Net unrealized foreign exchange gains and losses arise from changes in the value of assets and liabilities other than investments in securities at fiscal year end, resulting from changes in the exchange rate.
The Fund participates in a securities lending program providing for the lending of equity securities to qualified brokers. The term of the loans within the program is one year or less. The Fund normally receives cash collateral for securities loaned that may be invested in affiliated money market funds, other money market instruments and/or repurchase agreements. Collateral is maintained at a minimum level of 100% of the market value of investments loaned, plus interest, if applicable. Earnings from collateral invested in affiliated holdings as presented parenthetically on the Statement of Operations do not reflect fees and rebates and are allocated between the
Annual Financial Statements and Additional Information
borrower of the security, the securities lending agent, as a fee for its services under the program and the Fund, according to agreed-upon rates. The Fund will not have the right to vote on securities while they are on loan. However, the Fund will attempt to terminate a loan in an effort to reacquire the securities in time to vote on matters that are deemed to be material by the Adviser. There can be no assurance that the Fund will have sufficient notice of such matters to be able to terminate the loan in time to vote thereon.
Securities lending transactions are subject to Master Netting Agreements which are agreements between the Fund and its counterparties that provide for the net settlement of all transactions and collateral with the Fund, through a single payment, in the event of default or termination. Amounts presented on the Portfolio of Investments and Statement of Assets and Liabilities are not net settlement amounts but gross. As indicated below, the cash collateral received by the Fund exceeds the market value of the securities loaned reducing the net settlement amount to zero. The chart below identifies the amount of collateral received as well as the market value of securities on loan. Additionally, the securities lending agreement executed by the Fund includes an indemnification clause. This clause stipulates that the borrower will reimburse the Fund for any losses as a result of any failure of the borrower to return equivalent securities to the Fund.
As of October 31, 2024, securities subject to this type of arrangement and related collateral were as follows:
Fair Value of
Securities Loaned | |
| |
The Fund may purchase securities which are considered restricted. Restricted securities are securities that either: (a) cannot be offered for public sale without first being registered, or being able to take advantage of an exemption from registration, under the Securities Act of 1933; or (b) are subject to contractual restrictions on public sales. In some cases, when a security cannot be offered for public sale without first being registered, the issuer of the restricted security has agreed to register such securities for resale, at the issuer’s expense, either upon demand by the Fund or in connection with another registered offering of the securities. Many such restricted securities may be resold in the secondary market in transactions exempt from registration. Restricted securities may be determined to be liquid under criteria established by the Trustees. The Fund will not incur any registration costs upon such resales. The Fund’s restricted securities, like other securities, are priced in accordance with procedures established by and under the general supervision of the Adviser.
Additional information on restricted securities, held at October 31, 2024, is as follows:
The preparation of financial statements in conformity with GAAP requires management to make estimates and assumptions that affect the amounts of assets, liabilities, expenses and revenues reported in the financial statements. Actual results could differ materially from those estimated. The Fund applies investment company accounting and reporting guidance.
3. SHARES OF BENEFICIAL INTEREST
The following tables summarize share activity:
| | |
| | | | |
| | | | |
Shares issued to shareholders in payment of distributions declared | | | | |
Conversion of Class B Shares to Class A Shares1 | | | | |
| | | | |
NET CHANGE RESULTING FROM CLASS A SHARE TRANSACTIONS | | | | |
| | |
| | | | |
| | | | |
Shares issued to shareholders in payment of distributions declared | | | | |
Conversion of Class B Shares to Class A Shares1 | | | | |
| | | | |
NET CHANGE RESULTING FROM CLASS B SHARE TRANSACTIONS | | | | |
Annual Financial Statements and Additional Information
| | |
| | | | |
| | | | |
Shares issued to shareholders in payment of distributions declared | | | | |
| | | | |
NET CHANGE RESULTING FROM CLASS C SHARE TRANSACTIONS | | | | |
| | |
| | | | |
| | | | |
Shares issued to shareholders in payment of distributions declared | | | | |
| | | | |
NET CHANGE RESULTING FROM CLASS R SHARE TRANSACTIONS | | | | |
| | |
| | | | |
| | | | |
Shares issued to shareholders in payment of distributions declared | | | | |
| | | | |
NET CHANGE RESULTING FROM INSTITUTIONAL SHARE TRANSACTIONS | | | | |
| | |
| | | | |
| | | | |
Shares issued to shareholders in payment of distributions declared | | | | |
| | | | |
NET CHANGE RESULTING FROM CLASS R6 SHARE TRANSACTIONS | | | | |
NET CHANGE RESULTING FROM TOTAL FUND SHARE TRANSACTIONS | | | | |
| On February 3, 2023, Class B Shares were converted to Class A Shares. Within the Statement of Changes in Net Assets, the conversion from Class B Shares is within the Cost of shares redeemed and the conversion to Class A Shares is within Proceeds from sale of shares. |
4. FEDERAL TAX INFORMATION
The tax character of distributions as reported on the Statement of Changes in Net Assets for the years ended October 31, 2024 and 2023, was as follows:
| For tax purposes, short-term capital gains distributions are considered ordinary income distributions. |
As of October 31, 2024, the components of distributable earnings on a tax-basis were as follows:
Undistributed ordinary income | |
Net unrealized appreciation | |
Undistributed long-term capital gains | |
Other temporary differences | |
| |
At October 31, 2024, the cost of investments for federal tax purposes was $2,449,667,380. The net unrealized appreciation of investments for federal tax purposes was $1,478,114,135. This consists of unrealized appreciation from investments for those securities having an excess of value over cost of $1,642,533,555 and unrealized depreciation from investments for those securities having an excess of cost over value of $164,419,420. The difference between book-basis and tax-basis net unrealized appreciation is attributable to differing treatments for the deferral of losses on wash sales and passive foreign investment company adjustments.
Annual Financial Statements and Additional Information
5. INVESTMENT ADVISER FEE AND OTHER TRANSACTIONS WITH AFFILIATES
The advisory agreement between the Fund and the Adviser provides for an annual fee equal to 0.80% of the Fund’s average daily net assets. Subject to the terms described in the Expense Limitation note, the Adviser may voluntarily choose to waive any portion of its fee and/or reimburse certain operating expenses of the Fund for competitive reasons such as to maintain the Fund’s expense ratio, or as and when appropriate, to maintain positive or zero net yields. For the year ended October 31, 2024, the Adviser voluntarily waived $1,063,652 of its fee and voluntarily reimbursed $2,474,940 of transfer agent fees.
The Adviser has agreed to reimburse the Fund for certain investment adviser fees as a result of transactions in other affiliated investment companies. For the year ended October 31, 2024, the Adviser reimbursed $261,922.
Prior to becoming Adviser effective August 1, 2024, Fed Global acted as a sub-adviser to the Fund and received an allocable portion of the Fund’s adviser fee. The fee was paid by the prior adviser out of its resources and was not an incremental Fund expense. For the year ended October 31, 2024, Fed Global earned a sub-adviser fee of $20,227,887.
Federated Administrative Services (FAS), under the Administrative Services Agreement, provides the Fund with administrative personnel and services. For purposes of determining the appropriate rate breakpoint, “Investment Complex” is defined as all of the Federated Hermes Funds subject to a fee under the Administrative Services Agreement. The fee paid to FAS is based on the average daily net assets of the Investment Complex as specified below:
| Average Daily Net Assets
of the Investment Complex |
| on assets up to $50 billion |
| on assets over $50 billion |
Subject to the terms described in the Expense Limitation note, FAS may voluntarily choose to waive any portion of its fee. For the year ended October 31, 2024, the annualized fee paid to FAS was 0.078% of average daily net assets of the Fund.
In addition, FAS may charge certain out-of-pocket expenses to the Fund.
Distribution Services Fee
The Fund has adopted a Distribution Plan (the “Plan”) pursuant to Rule 12b-1 under the Act. Under the terms of the Plan, the Fund will compensate Federated Securities Corp. (FSC), the principal distributor, from the daily net assets of the Fund’s Class A Shares, Class C Shares and Class R Shares to finance activities intended to result in the sale of these shares. The Plan provides that the Fund may incur distribution expenses at the following percentages of average daily net assets annually, to compensate FSC:
| Percentage of Average Daily
Net Assets of Class |
| |
| |
| |
Prior to their conversion to Class A Shares at the close of business on February 3, 2023, the Class B Shares were also subject to the Plan at 0.75% of average daily net assets of the Class B Shares.
Subject to the terms described in the Expense Limitation note, FSC may voluntarily choose to waive any portion of its fee. For the year ended October 31, 2024, distribution services fees for the Fund were as follows:
| Distribution Services
Fees Incurred | Distribution Services
Fees Waived |
| | |
| | |
| | |
| | |
When FSC receives fees, it may pay some or all of them to financial intermediaries whose customers purchase shares. For the year ended October 31, 2024, FSC retained $1,158,462 of fees paid by the Fund.
Front-end sales charges and contingent deferred sales charges (CDSC) do not represent expenses of the Fund. They are deducted from the proceeds of sales of Fund shares prior to investment or from redemption proceeds prior to remittance, as applicable. For the year ended October 31, 2024, FSC retained $46,126 in sales charges from the sale of Class A Shares. FSC also retained $15,179 of CDSC relating to redemptions of Class C Shares.
For the year ended October 31, 2024, FSSC received $96,952 of the other service fees disclosed in Note 2.
Annual Financial Statements and Additional Information
Expense Limitation
The Adviser and certain of its affiliates (which may include FSC, FAS and FSSC) on their own initiative have agreed to waive certain amounts of their respective fees and/or reimburse expenses. Total annual fund operating expenses (as shown in the financial highlights, excluding dividends and other expenses related to short sales, extraordinary expenses and proxy-related expenses, if any) paid by the Fund’s Class A Shares, Class R Shares, Institutional Shares and Class R6 Shares (after the voluntary waivers and/or reimbursements) will not exceed 1.35%, 1.35%, 0.89% and 0.88% (the “Fee Limit”), respectively, up to but not including the later of (the “Termination Date”): (a) January 1, 2026; or (b) the date of the Fund’s next effective Prospectus. While the Adviser and its applicable affiliates currently do not anticipate terminating or increasing these arrangements prior to the Termination Date, these arrangements may only be terminated or the Fee Limit increased prior to the Termination Date with the agreement of the Trustees.
During the year ended October 31, 2024, the Fund engaged in purchase and sale transactions with funds that have a common investment adviser (or affiliated investment advisers), common Directors/Trustees and/or common Officers. These purchase and sale transactions complied with Rule 17a-7 under the Act and amounted to $2,242,200 and $4,385,736, respectively. Net realized loss recognized on these transactions was $(6,687,022).
Directors’/Trustees’ and Miscellaneous Fees
Certain Officers and Trustees of the Fund are Officers and Directors or Trustees of certain of the above companies. To efficiently facilitate payment, Independent Directors’/Trustees’ fees and certain expenses related to conducting meetings of the Directors/Trustees and other miscellaneous expenses are paid by an affiliate of the Adviser which in due course are reimbursed by the Fund. These expenses related to conducting meetings of the Directors/Trustees and other miscellaneous expenses may be included in Accrued and Miscellaneous Expenses on the Statement of Assets and Liabilities and Statement of Operations, respectively.
6. INVESTMENT TRANSACTIONS
Purchases and sales of investments, excluding long-term U.S. government securities and short-term obligations, for the year ended October 31, 2024, were as follows:
The Fund may invest a portion of its assets in securities of companies that are deemed by the Fund’s management to be classified in similar business sectors. Economic developments may have an effect on the liquidity and volatility of the portfolio securities.
A substantial portion of the Fund’s portfolio may be comprised of entities in the Health Care sector. As a result, the Fund may be more susceptible to any economic, business, political or other developments which generally affect these entities.
The Fund participates with certain other Federated Hermes Funds, on a several basis, in an up to $500,000,000 unsecured, 364-day, committed, revolving line of credit (LOC) agreement dated June 18, 2024. The LOC was made available to temporarily finance the repurchase or redemption of shares of the Fund, failed trades, payment of dividends, settlement of trades and for other short-term, temporary or emergency general business purposes. The Fund cannot borrow under the LOC if an inter-fund loan is outstanding. The Fund’s ability to borrow under the LOC also is subject to the limitations of the Act and various conditions precedent that must be satisfied before the Fund can borrow. Loans under the LOC are charged interest at a fluctuating rate per annum equal to (a) the highest, on any day, of (i) the federal funds effective rate, (ii) the published secured overnight financing rate plus an assigned percentage, and (iii) 0.0%, plus (b) a margin. Any fund eligible to borrow under the LOC pays its pro rata share of a commitment fee based on the amount of the lenders’ commitment that has not been utilized, quarterly in arrears and at maturity. As of October 31, 2024, the Fund had no outstanding loans. During the year ended October 31, 2024, the Fund did not utilize the LOC.
Pursuant to an Exemptive Order issued by the Securities and Exchange Commission, the Fund, along with other funds advised by subsidiaries of Federated Hermes, Inc., may participate in an interfund lending program. This program provides an alternative credit facility allowing the Fund to borrow from other participating affiliated funds. As of October 31, 2024, there were no outstanding loans. During the year ended October 31, 2024, the program was not utilized.
Under the Fund’s organizational documents, its Officers and Directors/Trustees are indemnified against certain liabilities arising out of the performance of their duties to the Fund (other than liabilities arising out of their willful misfeasance, bad faith, gross negligence or reckless disregard of their duties to the Fund). In addition, in the normal course of business, the Fund provides certain indemnifications under arrangements with third parties. Typically, obligations to indemnify a third party arise in the context of an arrangement entered into by the Fund under which the Fund agrees to indemnify such third party for certain liabilities arising out of actions taken pursuant to
Annual Financial Statements and Additional Information
the arrangement, provided the third party’s actions are not deemed to have breached an agreed-upon standard of care (such as willful misfeasance, bad faith, gross negligence or reckless disregard of their duties under the contract). The Fund’s maximum exposure under these arrangements is unknown as this would involve future claims that may be made against the Fund that have not yet arisen. The Fund does not anticipate any material claims or losses pursuant to these arrangements at this time, and accordingly expects the risk of loss to be remote.
11. FEDERAL TAX INFORMATION (UNAUDITED)
For the fiscal year ended October 31, 2024, 99.99% of total ordinary income (including short-term capital gain) distributions made by the Fund are qualifying dividends which may be subject to a maximum tax rate of 15%, as provided for by the Jobs and Growth Tax Relief Act of 2003. Complete information is reported in conjunction with the reporting of your distributions on Form 1099-DIV.
Of the ordinary income (including short-term capital gain) distributions made by the Fund during the year ended October 31, 2024, 99.99% qualify for the dividend received deduction available to corporate shareholders.
Annual Financial Statements and Additional Information
Report of Independent Registered Public Accounting Firm
TO THE BOARD OF TRUSTEES OF FEDERATED HERMES EQUITY FUNDS AND SHAREHOLDERS OF FEDERATED HERMES KAUFMANN SMALL CAP FUND:
Opinion on the Financial Statements
We have audited the accompanying statement of assets and liabilities of Federated Hermes Kaufmann Small Cap Fund (the “Fund”) (one of the portfolios constituting Federated Hermes Equity Funds (the “Trust”)), including the portfolio of investments, as of October 31, 2024, and the related statement of operations for the year then ended, the statement of changes in net assets for each of the two years in the period then ended, the financial highlights for each of the five years in the period then ended and the related notes (collectively referred to as the “financial statements”). In our opinion, the financial statements present fairly, in all material respects, the financial position of the Fund (one of the portfolios constituting Federated Hermes Equity Funds) at October 31, 2024, the results of its operations for the year then ended, the changes in its net assets for each of the two years in the period then ended and its financial highlights for each of the five years in the period then ended, in conformity with U.S. generally accepted accounting principles.
These financial statements are the responsibility of the Trust’s management. Our responsibility is to express an opinion on the Fund’s financial statements based on our audits. We are a public accounting firm registered with the Public Company Accounting Oversight Board (United States) (“PCAOB”) and are required to be independent with respect to the Trust in accordance with the U.S. federal securities laws and the applicable rules and regulations of the Securities and Exchange Commission and the PCAOB.
We conducted our audits in accordance with the standards of the PCAOB. Those standards require that we plan and perform the audit to obtain reasonable assurance about whether the financial statements are free of material misstatement, whether due to error or fraud. The Trust is not required to have, nor were we engaged to perform, an audit of the Trust’s internal control over financial reporting. As part of our audits, we are required to obtain an understanding of internal control over financial reporting, but not for the purpose of expressing an opinion on the effectiveness of the Trust’s internal control over financial reporting. Accordingly, we express no such opinion.
Our audits included performing procedures to assess the risks of material misstatement of the financial statements, whether due to error or fraud, and performing procedures that respond to those risks. Such procedures included examining, on a test basis, evidence regarding the amounts and disclosures in the financial statements. Our procedures included confirmation of securities owned as of October 31, 2024, by correspondence with the custodian, brokers, and others; when replies were not received from brokers or others, we performed other auditing procedures. Our audits also included evaluating the accounting principles used and significant estimates made by management, as well as evaluating the overall presentation of the financial statements. We believe that our audits provide a reasonable basis for our opinion. We have served as the auditor of one or more Federated Hermes investment companies since 1979.
Boston, Massachusetts
December 23, 2024
Annual Financial Statements and Additional Information
Shareholder Meeting Results (unaudited)
At a Special Meeting held on October 25, 2024, shareholders of the Federated Hermes Equity Funds (the “Trust”) elected Trustees of the Trust. Shareholders of the Trust elected three new individuals to serve as Trustees effective January 1, 2025, who will serve on the Board with current Trustees Messrs. J. Christopher Donahue, John B. Fisher, John G. Carson, G. Thomas Hough, Thomas M. O’Neill, John S. Walsh and Ms. Madelyn A. Reilly. Under the Trust’s Director Service Policy, existing Trustees Judge Maureen Lally-Green and Mr. P. Jerome Richey are expected to retire from the Board on December 31, 2024. The number of votes cast for, against or withheld, as well as the number of abstentions and broker non-votes with respect to the election of each nominee for office, is included below.
Annual Financial Statements and Additional Information
Evaluation and Approval of Advisory Contract–May 2024
Federated Hermes Kaufmann Small Cap Fund (the “Fund”)
At its meetings in May 2024 (the “May Meetings”), the Fund’s Board of Trustees (the “Board”), including those Trustees who are not “interested persons” of the Fund, as defined in the Investment Company Act of 1940 (the “Independent Trustees”), reviewed and unanimously approved the continuation of the investment advisory contract between the Fund and Federated Equity Management Company of Pennsylvania (the “Adviser”) and the investment sub-advisory contract between the Adviser and Federated Global Investment Management Corp. (the “Sub-Adviser” and together with the Adviser, the “Advisers”) with respect to the Fund (together, the “Contracts”) for an additional one-year term. The Board’s determination to approve the continuation of the Contracts reflects the exercise of its business judgment after considering all of the information and factors believed to be relevant and appropriate on whether to approve the continuation of the existing arrangements. The information, factors and conclusions that formed the basis for the Board’s approval are summarized below.
Information Received and Review Process
At the request of the Independent Trustees, the Fund’s Chief Compliance Officer (the “CCO”) furnished to the Board in advance of its May Meetings an independent written evaluation of the Fund’s management fee (the “CCO Fee Evaluation Report”). The Board considered the CCO Fee Evaluation Report, along with other information, in evaluating the reasonableness of the Fund’s management fee and in determining to approve the continuation of the Contracts.
In addition to the extensive materials that comprise and accompany the CCO Fee Evaluation Report, the Board considered information specifically prepared in connection with the approval of the continuation of the Contracts that was presented at the May Meetings. In this regard, in the months preceding the May Meetings, the Board requested and reviewed written responses and supporting materials prepared by the Advisers and their affiliates (collectively, “Federated Hermes”) in response to requests posed to Federated Hermes by independent legal counsel on behalf of the Independent Trustees encompassing a wide variety of topics, including those summarized below. The Board also considered such additional matters as the Independent Trustees deemed reasonably necessary to evaluate the Contracts, which included detailed information about the Fund and Federated Hermes furnished to the Board at its meetings throughout the year and in between regularly scheduled meetings on particular matters as the need arose. The Independent Trustees also considered the presentation from Federated Hermes’ Chief Investment Officer of Equities received at the Board’s February 2024 meetings regarding the Fund and its performance, portfolio management team and other investment-related matters.
The Board’s consideration of the Contracts included review of materials and information covering the following matters, among others: (1) copies of the Contracts; (2) the nature, quality and extent of the advisory and other services provided to the Fund by Federated Hermes; (3) Federated Hermes’ business and operations; (4) the Advisers’ investment philosophy, personnel and processes; (5) the Fund’s investment objectives and strategies; (6) the Fund’s short-term and long-term performance - in absolute terms (both on a gross basis and net of expenses) and relative to an appropriate group of peer funds and its benchmark index; (7) the Fund’s fees and expenses, including the advisory fee and the overall expense structure of the Fund - in absolute terms and relative to an appropriate group of peer funds, with due regard for contractual or voluntary expense limitations (if any); (8) the financial condition of Federated Hermes; (9) the Adviser’s profitability with respect to managing the Fund; (10) distribution and sales activity for the Fund; and (11) the use and allocation of brokerage commissions derived from trading the Fund’s portfolio securities (if any).
The Board also considered judicial decisions concerning allegedly excessive investment advisory fees charged to other registered funds in evaluating the Contracts. Using these judicial decisions as a guide, the Board considered several factors they deemed relevant to an adviser’s fiduciary duty with respect to its receipt of compensation from a fund, including: (1) the nature and quality of the services provided by the adviser to the fund and its shareholders, including the performance of the fund, its benchmark and comparable funds; (2) the adviser’s cost of providing the services and the profitability to the adviser of providing advisory services to the fund; (3) the extent to which the adviser may realize “economies of scale” as the fund grows larger and, if such economies of scale exist, whether they have been appropriately shared with the fund and its shareholders or the family of funds; (4) any “fall-out” benefits that accrue to the adviser because of its relationship with the fund, including research services received from brokers that execute fund trades and any fees paid to affiliates of the adviser for services rendered to the fund; (5) comparative fees and expenses, including a comparison of management fees paid to the adviser with those paid by similar funds managed by the same adviser or other advisers as well as management fees charged to institutional and other advisory clients of the same adviser for what might be viewed as like services; and (6) the extent of care, conscientiousness and independence with which the fund’s board members perform their duties and their expertise, including whether they are fully informed about all facts the board deems relevant to its consideration of the adviser’s services and fees. The Board considered that the Securities and Exchange Commission (“SEC”) disclosure requirements regarding the basis for a fund board’s approval of the fund’s investment advisory contract generally align with the factors listed above. The Board was guided by these factors in its
Annual Financial Statements and Additional Information
evaluation of the Contracts to the extent it considered them to be appropriate and relevant, as discussed further below. The Board considered and weighed these factors in light of its substantial accumulated experience in governing the Fund and working with Federated Hermes on matters relating to the oversight of the other funds advised by Federated Hermes (each, a “Federated Hermes Fund” and, collectively, the “Federated Hermes Funds”).
In addition, the Board considered the preferences and expectations of Fund shareholders and the potential disruptions of the Fund’s operations and various risks, uncertainties and other effects that could occur as a result of a decision to terminate or not renew the Contracts. In particular, the Board recognized that many shareholders likely have invested in the Fund based on the strength of Federated Hermes’ industry standing and reputation and with the expectation that Federated Hermes will have a continuing role in providing advisory services to the Fund. Thus, the Board observed that there are a range of investment options available to the Fund’s shareholders in the marketplace and such shareholders, having had the opportunity to consider other investment options, have effectively selected Federated Hermes by virtue of investing in the Fund.
In determining to approve the continuation of the Contracts, the members of the Board reviewed and evaluated information and factors they believed to be relevant and appropriate through the exercise of their reasonable business judgment. While individual members of the Board may have weighed certain factors differently, the Board’s determination to approve the continuation of the Contracts was based on a comprehensive consideration of all information provided to the Board throughout the year and specifically with respect to the continuation of the Contracts. The Board recognized that its evaluation process is evolutionary and that the factors considered and emphasis placed on relevant factors may change in recognition of changing circumstances in the registered fund marketplace. The Independent Trustees were assisted throughout the evaluation process by independent legal counsel. In connection with their deliberations at the May Meetings, the Independent Trustees met separately in executive session with their independent legal counsel and without management present to review the relevant materials and consider their responsibilities under applicable laws. In addition, senior management representatives of Federated Hermes also met with the Independent Trustees and their independent legal counsel to discuss the materials and presentations furnished to the Board at the May Meetings. The Board considered the approval of the Contracts for the Fund as part of its consideration of agreements for funds across the family of Federated Hermes Funds, but its approvals were made on a fund-by-fund basis.
Nature, Extent and Quality of Services
The Board considered the nature, extent and quality of the services provided to the Fund by the Advisers and the resources of Federated Hermes dedicated to the Fund. In this regard, the Board evaluated, among other things, the terms of the Contracts and the full range of services provided to the Fund by Federated Hermes. The Board considered the Advisers’ personnel, investment philosophy and process, investment research capabilities and resources, trade operations capabilities, experience and performance track record. The Board reviewed the qualifications, backgrounds and responsibilities of the portfolio management team primarily responsible for the day-to-day management of the Fund and evaluated Federated Hermes’ ability and experience in attracting and retaining qualified personnel to service the Fund. The Board considered the trading operations by the Advisers, including the execution of portfolio transactions and the selection of brokers for those transactions. The Board also considered the Advisers’ ability to deliver competitive investment performance for the Fund when compared to the Fund’s Performance Peer Group (as defined below), which was deemed by the Board to be a useful indicator of how the Advisers are executing the Fund’s investment program.
In addition, the Board considered the financial resources and overall reputation of Federated Hermes and its willingness to consider and make investments in personnel, infrastructure, technology, cybersecurity, business continuity planning and operational enhancements that are designed to benefit the Federated Hermes Funds. The Board noted the benefits of the previous significant acquisition of Hermes Fund Managers Limited by Federated Hermes, which has deepened Federated Hermes’ investment management expertise and capabilities and expanded its access to analytical resources related to environmental, social and governance (“ESG”) factors and issuer engagement on ESG matters where appropriate. The Board considered Federated Hermes’ oversight of the securities lending program for the Federated Hermes Funds that engage in securities lending and noted the income earned by the Federated Hermes Funds that participate in such program. In addition, the Board considered the quality of Federated Hermes’ communications with the Board and responsiveness to Board inquiries and requests made from time to time with respect to the Federated Hermes Funds. The Board also considered that Federated Hermes is responsible for providing the Federated Hermes Funds’ officers.
The Board received and evaluated information regarding Federated Hermes’ regulatory and compliance environment. The Board considered Federated Hermes’ compliance program and compliance history and reports from the CCO about Federated Hermes’ compliance with applicable laws and regulations, including responses to regulatory developments and any compliance or other issues raised by regulatory agencies. The Board also noted Federated Hermes’ support of the Federated Hermes Funds’ compliance control structure and the compliance-related resources devoted by Federated Hermes in support of the Fund’s obligations pursuant to Rule 38a-1 under the Investment Company Act of 1940, including Federated Hermes’ commitment to respond to rulemaking and other regulatory initiatives of the SEC. The Board
Annual Financial Statements and Additional Information
considered Federated Hermes’ approach to internal audits and risk management with respect to the Federated Hermes Funds and its day-to-day oversight of the Federated Hermes Funds’ compliance with their investment objectives and policies as well as with applicable laws and regulations, noting that regulatory and other developments had over time led, and continue to lead, to an increase in the scope of Federated Hermes’ oversight in this regard. In addition, the Board noted Federated Hermes’ commitment to maintaining high quality systems and expending substantial resources to prepare for and respond to ongoing changes due to the market, regulatory and control environments in which the Fund and its service providers operate.
The Board considered Federated Hermes’ efforts to provide shareholders in the Federated Hermes Funds with a comprehensive array of funds with different investment objectives, policies and strategies. The Board considered the expenses that Federated Hermes had incurred, as well as the entrepreneurial and other risks assumed by Federated Hermes, in sponsoring and providing on-going services to new funds to expand these opportunities for shareholders. The Board noted the benefits to shareholders of being part of the family of Federated Hermes Funds, which include the general right to exchange investments between the same class of shares without the incurrence of additional sales charges.
Based on these considerations, the Board concluded that it was satisfied with the nature, extent and quality of the services provided by the Advisers to the Fund.
Fund Investment Performance
The Board considered the investment performance of the Fund. In evaluating the Fund’s investment performance, the Board considered performance results in light of the Fund’s investment objective, strategies and risks. The Board considered detailed investment reports on, and the Advisers’ analysis of, the Fund’s performance over different time periods that were provided to the Board throughout the year and in connection with the May Meetings. These reports included, among other items, information on the Fund’s gross and net returns, the Fund’s investment performance compared to one or more relevant categories or groups of peer funds and the Fund’s benchmark index, performance attribution information and commentary on the effect of market conditions. The Board considered that, in its evaluation of investment performance at meetings throughout the year, it focused particular attention on information indicating less favorable performance of certain Federated Hermes Funds for specific time periods and discussed with Federated Hermes the reasons for such performance as well as any specific actions Federated Hermes had taken, or had agreed to take, to seek to enhance Fund investment performance and the results of those actions.
The Board also reviewed comparative information regarding the performance of other registered funds in the category of peer funds selected by Morningstar, Inc. (the “Morningstar”), an independent fund ranking organization (the “Performance Peer Group”). The Board noted the CCO’s view that comparisons to fund peer groups may be helpful, though not conclusive, in evaluating the performance of the Advisers in managing the Fund. The Board considered the CCO’s view that, in evaluating such comparisons, in some cases there may be differences in the funds’ objectives or investment management techniques, or the costs to implement the funds, even within the same Performance Peer Group. In this connection, the Board considered that the longevity and experience of the Fund’s portfolio management team and its extensive bottom-up approach to investing may limit the utility of comparisons to other equity mutual funds.
The Board also considered comparative performance data from Lipper, Inc. that was included in reports provided to the Board throughout the year. The Board noted that differences may exist between the Performance Peer Group and Lipper peers and that the results of these performance comparisons may vary.
The Board considered that the Fund’s performance fell below the median of the Performance Peer Group for the one-year, three-year and five-year periods ended December 31, 2023. The Board discussed the Fund’s performance with the Advisers and recognized the efforts being taken by the Advisers in the context of other factors considered relevant by the Board.
Based on these considerations, the Board concluded that it had continued confidence in the Advisers’ overall capabilities to manage the Fund.
The Board considered the advisory fee, sub-advisory fee, and overall expense structure of the Fund and the comparative fee and expense information that had been provided in connection with the May Meetings. In this regard, the Board was presented with, and considered, information regarding the contractual advisory fee rates, net advisory fee rates, total expense ratios and each element of the Fund’s total expense ratio (i.e., gross and net advisory fees, administrative fees, custody fees, portfolio accounting fees and transfer agency fees) relative to an appropriate group of peer funds compiled by Federated Hermes from the overall category of peer funds selected by Morningstar (the “Expense Peer Group”). The Board received a description of the methodology used to select the Expense Peer Group from the overall Morningstar category. The Board also reviewed comparative information regarding the fees and expenses of the broader group of funds in the overall Morningstar category.
Annual Financial Statements and Additional Information
While mindful that courts have cautioned against giving too much weight to comparative information concerning fees charged to funds by other advisers, the use of comparisons between the Fund and its Expense Peer Group assisted the Board in its evaluation of the Fund’s fees and expenses. The Board focused on comparisons with other registered funds more heavily than non-registered fund products or services because such comparisons are believed to be more relevant. The Board considered that other registered funds are the products most like the Fund, in that they are readily available to Fund shareholders as alternative investment vehicles, and they are the type of investment vehicle, in fact, chosen and maintained by the Fund’s shareholders. The Board noted that the range of such other registered funds’ fees and expenses, therefore, appears to be a relevant indicator of what investors have found to be reasonable in the marketplace in which the Fund competes.
The Board reviewed the contractual advisory fee rate, net advisory fee rate and other expenses of the Fund and noted the position of the Fund’s fee rates relative to its Expense Peer Group. In this regard, the Board noted that the contractual advisory fee rate was below the median of the Expense Peer Group, and the Board was satisfied that the overall expense structure of the Fund remained competitive. The Board considered the CCO’s view that, in 2022, while the Fund’s total expenses were above median relative to its Expense Peer Group, those expenses remained reasonable in light of its extensive bottom-up investment process, the relative expense of that process, the resulting estimated profitability of the Fund over time, and the performance generated over time compared to peer funds.
The Board also received and considered information about the nature and extent of services offered and fees charged by Federated Hermes to other types of clients with investment strategies similar to those of the Federated Hermes Funds, including non-registered fund clients (such as institutional separate accounts) and third-party unaffiliated registered funds for which any of the Advisers or their affiliates serve as sub-adviser. The Board noted the CCO’s conclusion that non-registered fund clients are inherently different products due to the following differences, among others: (i) different types of targeted investors; (ii) different applicable laws and regulations; (iii) different legal structures; (iv) different average account sizes and portfolio management techniques made necessary by different cash flows and different associated costs; (v) the time spent by portfolio managers and their teams (among other personnel across various departments, including legal, compliance and risk management) in reviewing securities pricing; (vi) different SEC mandated risk management programs with respect to fund liquidity and use of derivatives; (vii) different administrative responsibilities; (viii) different degrees of risk associated with management; and (ix) a variety of different costs. The Board also considered information regarding the differences in the nature of the services required for Federated Hermes to manage its proprietary registered fund business versus managing a discrete pool of assets as a sub-adviser to another institution’s registered fund, noting the CCO’s view that Federated Hermes generally performs significant additional services and assumes substantially greater risks in managing the Fund and other Federated Hermes Funds than in its role as sub-adviser to an unaffiliated third-party registered fund. The Board noted that the CCO did not consider the fees for providing advisory services to other types of clients to be determinative in judging the appropriateness of the Federated Hermes Funds’ advisory fees.
In the case of the Fund, the Board noted that Federated Hermes does not manage any other types of clients that are comparable to the Fund.
Based on these considerations, the Board concluded that the fees and total operating expenses of the Fund, in conjunction with other matters considered, are reasonable in light of the services provided.
The Board received and considered profitability information furnished by Federated Hermes. Such profitability information included revenues reported on a fund-by-fund basis and estimates of the allocation of expenses made on a fund-by-fund basis, using allocation methodologies specified by the CCO and described to the Board. The Board considered the CCO’s view that, while these cost allocation reports apply consistent allocation processes, the inherent difficulties in allocating costs on a fund-by-fund basis continues to cause the CCO to question the precision of the process and to conclude that such reports may be unreliable because a single change in an allocation estimate may dramatically alter the resulting estimate of cost and/or profitability of a Federated Hermes Fund and may produce unintended consequences. In addition, the Board considered the CCO’s view that the allocation methodologies used by Federated Hermes in estimating profitability for purposes of reporting to the Board in connection with the continuation of the Contracts are consistent with the methodologies previously reviewed by an independent consultant. The Board noted that the independent consultant had previously conducted a review of the allocation methodologies and reported to the Board that, although there is no single best method to allocate expenses, the methodologies used by Federated Hermes are reasonable. The Board considered the CCO’s view that the estimated profitability to the Adviser from its relationship with the Fund was not unreasonable in relation to the services provided.
The Board also reviewed information compiled by Federated Hermes comparing its profitability information to other publicly-held fund management companies, including information regarding profitability trends over time. The Board recognized that profitability comparisons among fund management companies are difficult because of the variation in the type of comparative information that is publicly available, and the profitability of any fund management company is
Annual Financial Statements and Additional Information
affected by numerous factors. The Board considered the CCO’s conclusion that, based on such profitability information, Federated Hermes’ profit margins did not appear to be excessive. The Board also considered the CCO’s view that Federated Hermes appeared financially sound, with the resources necessary to fulfill its obligations under its contracts with the Federated Hermes Funds.
The Board received and considered information about the notion of possible realization of “economies of scale” as a fund grows larger, the difficulties of isolating and quantifying economies of scale at an individual fund level, and the extent to which potential scale benefits are shared with shareholders. In this regard, the Board considered that Federated Hermes has made significant and long-term investments in areas that support all of the Federated Hermes Funds, such as: portfolio management, investment research and trading operations; shareholder services; compliance; business continuity, cybersecurity and information security programs; internal audit and risk management functions; and technology, systems capabilities and use of data. The Board noted that Federated Hermes’ investments in these areas are extensive and are designed to provide enhanced or expanded services to the Federated Hermes Funds and their shareholders. The Board considered that the benefits of these investments are likely to be shared with the family of Federated Hermes Funds as a whole.
In addition, the Board considered that fee waivers and expense reimbursements are another means for potential economies of scale to be shared with shareholders and can provide protection from an increase in expenses if a Federated Hermes Fund’s assets decline. The Board considered that, in order for the Federated Hermes Funds to remain competitive in the marketplace, Federated Hermes has frequently waived fees and/or reimbursed expenses for the Federated Hermes Funds and has disclosed to shareholders and/or reported to the Board its intention to do so (or continue to do so) in the future. The Board also considered that Federated Hermes has been active in managing expenses of the Federated Hermes Funds in recent years, which has resulted in benefits being realized by shareholders.
The Board also received and considered information on adviser-paid fees (commonly referred to as “revenue sharing” payments) that was provided to the Board throughout the year and in connection with the May Meetings. The Board considered that Federated Hermes and the CCO believe that this information is relevant to considering whether Federated Hermes had an incentive to either not apply breakpoints, or to apply breakpoints at higher levels, but should not be considered when evaluating the reasonableness of advisory fees. The Board also noted the absence of any applicable regulatory or industry guidelines on economies of scale, which is compounded by the lack of any uniform methodology or pattern with respect to structuring fund advisory fees with breakpoints that serve to reduce the fees as a fund attains a certain size.
The Board considered information regarding the compensation and other ancillary (or “fall-out”) benefits that Federated Hermes derived from its relationships with the Federated Hermes Funds. The Board noted that, in addition to receiving advisory fees under the Federated Hermes Funds’ investment advisory contracts, Federated Hermes’ affiliates also receive fees for providing other services to the Federated Hermes Funds under separate service contracts, including for serving as the Federated Hermes Funds’ administrator and distributor. In this regard, the Board considered that Federated Hermes’ affiliates provide distribution and shareholder services to the Federated Hermes Funds, for which they may be compensated through distribution and servicing fees paid pursuant to Rule 12b-1 plans or otherwise. The Board also received and considered information detailing the benefits, if any, that Federated Hermes may derive from its receipt of research services from brokers who execute portfolio trades for the Federated Hermes Funds.
The Board considered: (i) the CCO’s conclusion that his observations and the information accompanying the CCO Fee Evaluation Report show that the management fee for the Fund is reasonable; and (ii) the CCO’s recommendation that the Board approve the management fee. The Board noted that, under these circumstances, no changes were recommended to, and no objection was raised to the continuation of, the Contracts by the CCO. The CCO also recognized that the Board’s evaluation of the Federated Hermes Funds’ advisory and sub-advisory arrangements is a continuing and ongoing process that is informed by the information that the Board requests and receives from management throughout the course of the year and, in this regard, the CCO and Board noted certain items, and management has committed to reviewing certain items, for future reporting to the Board as the Board continues its ongoing oversight of the Federated Hermes Funds.
On the basis of the information and factors summarized above, among other information and factors deemed relevant by the Board, and the evaluation thereof, the Board, including the Independent Trustees, unanimously voted to approve the continuation of the Contracts. The Board based its determination to approve the Contracts on the totality of the circumstances and relevant factors and with a view of past and future long-term considerations. Not all of the factors and considerations identified above were necessarily deemed to be relevant to the Fund, nor did the Board consider any one of them to be determinative.
Annual Financial Statements and Additional Information
Mutual funds are not bank deposits or obligations, are not guaranteed by any bank and are not insured or guaranteed by the U.S. government, the Federal Deposit Insurance Corporation, the Federal Reserve Board or any other government agency. Investment in mutual funds involves investment risk, including the possible loss of principal.
This information is authorized for distribution to prospective investors only when preceded or accompanied by the Fund’s Prospectus, which contains facts concerning its objective and policies, management fees, expenses and other information.
Federated Hermes Kaufmann Small Cap Fund
Federated Hermes Funds
4000 Ericsson Drive
Warrendale, PA 15086-7561
Contact us at FederatedHermes.com/us
or call 1-800-341-7400.
Federated Securities Corp., Distributor
CUSIP 314172636
CUSIP 314172610
CUSIP 314172537
CUSIP 31421N402
CUSIP 31421N683
© 2024 Federated Hermes, Inc.
Annual Financial Statements
and Additional Information
Federated Hermes MDT Mid Cap Growth Fund
A Portfolio of Federated Hermes Equity FundsNot FDIC Insured ▪ May Lose Value ▪ No Bank Guarantee
Portfolio of Investments
| | | |
| | | |
| | Communication Services—5.0% | |
| | Live Nation Entertainment, Inc. | |
| | | |
| | | |
| | | |
| | | |
| | | |
| | Consumer Discretionary—14.6% | |
| | | |
| | | |
| | | |
| | | |
| | | |
| | | |
| | Dick’s Sporting Goods, Inc. | |
| | | |
| | | |
| | | |
| | | |
| | | |
| | | |
| | | |
| | Norwegian Cruise Line Holdings Ltd. | |
| | | |
| | Royal Caribbean Cruises, Ltd. | |
| | | |
| | | |
| | | |
| | | |
| | | |
| | | |
| | | |
| | | |
| | Church & Dwight Co., Inc. | |
| | | |
| | | |
| | | |
| | | |
| | | |
| | | |
| | | |
| | | |
| | | |
| | Ameriprise Financial, Inc. | |
| | | |
| | | |
| | | |
| | | |
| | | |
| | Kinsale Capital Group, Inc. | |
Annual Financial Statements and Additional Information
| | | |
| | | |
| | | |
| | | |
| | NU Holdings Ltd./Cayman Islands | |
| | | |
| | Ryan Specialty Group Holdings, Inc. | |
| | | |
| | | |
| | | |
| | | |
| | | |
| | | |
| | Alnylam Pharmaceuticals, Inc. | |
| | | |
| | | |
| | | |
| | | |
| | | |
| | GE HealthCare Technologies, Inc. | |
| | | |
| | | |
| | | |
| | | |
| | | |
| | | |
| | | |
| | Mettler-Toledo International, Inc. | |
| | | |
| | | |
| | Neurocrine Biosciences, Inc. | |
| | | |
| | Sarepta Therapeutics, Inc. | |
| | | |
| | | |
| | | |
| | Allison Transmission Holdings, Inc. | |
| | | |
| | Booz Allen Hamilton Holding Corp. | |
| | Broadridge Financial Solutions | |
| | | |
| | | |
| | | |
| | | |
| | | |
| | Old Dominion Freight Lines, Inc. | |
| | | |
| | | |
| | Rockwell Automation, Inc. | |
| | | |
| | | |
| | | |
| | United Rentals North America, Inc. | |
| | | |
| | | |
Annual Financial Statements and Additional Information
| | | |
| | | |
| | | |
| | | |
| | | |
| | | |
| | Information Technology—23.3% | |
| | | |
| | | |
| | | |
| | | |
| | | |
| | | |
| | | |
| | | |
| | | |
| | | |
| | | |
| | | |
| | | |
| | | |
| | Manhattan Associates, Inc. | |
| | | |
| | | |
| | | |
| | | |
| | Palantir Technologies, Inc. | |
| | | |
| | Procore Technologies, Inc. | |
| | | |
| | | |
| | | |
| | | |
| | | |
| | Zoom Video Communications, Inc. | |
| | | |
| | | |
| | Axalta Coating Systems Ltd. | |
| | | |
| | | |
| | | |
| | | |
| | Equity Lifestyle Properties, Inc. | |
| | | |
| | | |
| | | |
| | | |
| | TOTAL COMMON STOCKS
(IDENTIFIED COST $1,520,401,515) | |
Annual Financial Statements and Additional Information
| | | |
| | | |
| | Federated Hermes Government Obligations Fund, Premier Shares, 4.77%2 (IDENTIFIED COST $52,115,537) | |
| | TOTAL INVESTMENT IN SECURITIES—96.9%
(IDENTIFIED COST $1,572,517,052)3 | |
| | OTHER ASSETS AND LIABILITIES - NET—3.1%4 | |
| | | |
Transactions with affiliated investment companies, which are funds managed by the Adviser or an affiliate of the Adviser, during the period ended October 31, 2024, were as follows:
| Federated
Hermes
Government
Obligations Fund,
Premier Shares | Federated
Hermes
Institutional
Prime Value
Obligations Fund,
Institutional Shares | Total of
Affiliated
Transactions |
| | | |
| | | |
| | | |
Change in Unrealized Appreciation/Depreciation | | | |
| | | |
| | | |
Shares Held as of 10/31/2024 | | | |
| | | |
| Non-income-producing security. |
| |
| The cost of investments for federal tax purposes amounts to $1,577,048,722. |
| Assets, other than investments in securities, less liabilities. See Statement of Assets and Liabilities. |
Note: The categories of investments are shown as a percentage of total net assets at October 31, 2024.
Various inputs are used in determining the value of the Fund’s investments. These inputs are summarized in the three broad levels listed below:
Level 1—quoted prices in active markets for identical securities.
Level 2—other significant observable inputs (including quoted prices for similar securities, interest rates, prepayment speeds, credit risk, etc.). Also includes securities valued at amortized cost.
Level 3—significant unobservable inputs (including the Fund’s own assumptions in determining the fair value of investments).
The inputs or methodology used for valuing securities are not an indication of the risk associated with investing in those securities.
At October 31, 2024, all investments of the Fund utilized Level 1 inputs in valuing the Fund’s assets carried at fair value.
See Notes which are an integral part of the Financial Statements
Annual Financial Statements and Additional Information
Financial Highlights–Class A Shares
(For a Share Outstanding Throughout Each Period)
| |
| | | | | |
Net Asset Value, Beginning of Period | | | | | |
Income From Investment Operations: | | | | | |
Net investment income (loss)1 | | | | | |
Net realized and unrealized gain (loss) | | | | | |
Total From Investment Operations | | | | | |
| | | | | |
Distributions from net realized gain | | | | | |
Distributions from return of capital | | | | | |
| | | | | |
Net Asset Value, End of Period | | | | | |
| | | | | |
Ratios to Average Net Assets: | | | | | |
| | | | | |
Net investment income (loss) | | | | | |
Expense waiver/reimbursement4 | | | | | |
| | | | | |
Net assets, end of period (000 omitted) | | | | | |
| | | | | |
| Per share numbers have been calculated using the average shares method. |
| Based on net asset value, which does not reflect the sales charge, redemption fee or contingent deferred sales charge, if applicable. |
| Amount does not reflect net expenses incurred by investment companies in which the Fund may invest. |
| This expense decrease is reflected in both the net expense and the net investment income (loss) ratios shown above. Amount does not reflect expense waiver/ reimbursement recorded by investment companies in which the Fund may invest. |
| Securities that mature are considered sales for purposes of this calculation. |
See Notes which are an integral part of the Financial Statements
Annual Financial Statements and Additional Information
Financial Highlights–Class C Shares
(For a Share Outstanding Throughout Each Period)
| |
| | | | | |
Net Asset Value, Beginning of Period | | | | | |
Income From Investment Operations: | | | | | |
Net investment income (loss)1 | | | | | |
Net realized and unrealized gain (loss) | | | | | |
Total From Investment Operations | | | | | |
| | | | | |
Distributions from net realized gain | | | | | |
Distributions from return of capital | | | | | |
| | | | | |
Net Asset Value, End of Period | | | | | |
| | | | | |
Ratios to Average Net Assets: | | | | | |
| | | | | |
Net investment income (loss) | | | | | |
Expense waiver/reimbursement4 | | | | | |
| | | | | |
Net assets, end of period (000 omitted) | | | | | |
| | | | | |
| Per share numbers have been calculated using the average shares method. |
| Based on net asset value, which does not reflect the sales charge, redemption fee or contingent deferred sales charge, if applicable. |
| Amount does not reflect net expenses incurred by investment companies in which the Fund may invest. |
| This expense decrease is reflected in both the net expense and the net investment income (loss) ratios shown above. Amount does not reflect expense waiver/ reimbursement recorded by investment companies in which the Fund may invest. |
| Securities that mature are considered sales for purposes of this calculation. |
See Notes which are an integral part of the Financial Statements
Annual Financial Statements and Additional Information
Financial Highlights–Institutional Shares
(For a Share Outstanding Throughout Each Period)
| |
| | | | | |
Net Asset Value, Beginning of Period | | | | | |
Income From Investment Operations: | | | | | |
Net investment income (loss)1 | | | | | |
Net realized and unrealized gain (loss) | | | | | |
Total From Investment Operations | | | | | |
| | | | | |
Distributions from net realized gain | | | | | |
Distributions from return of capital | | | | | |
| | | | | |
Net Asset Value, End of Period | | | | | |
| | | | | |
Ratios to Average Net Assets: | | | | | |
| | | | | |
Net investment income (loss) | | | | | |
Expense waiver/reimbursement6 | | | | | |
| | | | | |
Net assets, end of period (000 omitted) | | | | | |
| | | | | |
| Per share numbers have been calculated using the average shares method. |
| Represents less than $0.01. |
| Based on net asset value. |
| Amount does not reflect net expenses incurred by investment companies in which the Fund may invest. |
| Represents less than 0.01%. |
| This expense decrease is reflected in both the net expense and the net investment income (loss) ratios shown above. Amount does not reflect expense waiver/ reimbursement recorded by investment companies in which the Fund may invest. |
| Securities that mature are considered sales for purposes of this calculation. |
See Notes which are an integral part of the Financial Statements
Annual Financial Statements and Additional Information
Financial Highlights–Class R6 Shares
(For a Share Outstanding Throughout Each Period)
| |
| | | | | |
Net Asset Value, Beginning of Period | | | | | |
Income From Investment Operations: | | | | | |
Net investment income (loss)1 | | | | | |
Net realized and unrealized gain (loss) | | | | | |
Total From Investment Operations | | | | | |
| | | | | |
Distributions from net realized gain | | | | | |
Distributions from return of capital | | | | | |
| | | | | |
Net Asset Value, End of Period | | | | | |
| | | | | |
Ratios to Average Net Assets: | | | | | |
| | | | | |
Net investment income (loss) | | | | | |
Expense waiver/reimbursement5 | | | | | |
| | | | | |
Net assets, end of period (000 omitted) | | | | | |
| | | | | |
| Per share numbers have been calculated using the average shares method. |
| Represents less than $0.01. |
| Based on net asset value. |
| Amount does not reflect net expenses incurred by investment companies in which the Fund may invest. |
| This expense decrease is reflected in both the net expense and the net investment income (loss) ratios shown above. Amount does not reflect expense waiver/ reimbursement recorded by investment companies in which the Fund may invest. |
| Securities that mature are considered sales for purposes of this calculation. |
See Notes which are an integral part of the Financial Statements
Annual Financial Statements and Additional Information
Statement of Assets and LiabilitiesOctober 31, 2024
| |
Investment in securities, at value including $52,115,537 of investments in affiliated holdings* (identified cost $1,572,517,052, including $52,115,537 of identified cost in affiliated holdings) | |
| |
| |
Income receivable from affiliated holdings | |
Receivable for investments sold | |
Receivable for shares sold | |
| |
| |
Payable for investments purchased | |
Payable for shares redeemed | |
Payable for investment adviser fee (Note 5) | |
Payable for administrative fee (Note 5) | |
Payable for distribution services fee (Note 5) | |
Payable for other service fees (Notes 2 and 5) | |
Accrued expenses (Note 5) | |
| |
Net assets for 34,437,469 shares outstanding | |
| |
| |
Total distributable earnings (loss) | |
| |
Net Asset Value, Offering Price and Redemption Proceeds Per Share: | |
| |
Net asset value per share ($395,125,698 ÷ 7,112,951 shares outstanding), no par value, unlimited shares authorized | |
Offering price per share (100/94.50 of $55.55) | |
Redemption proceeds per share | |
| |
Net asset value per share ($15,396,717 ÷ 603,010 shares outstanding), no par value, unlimited shares authorized | |
| |
Redemption proceeds per share (99.00/100 of $25.53) | |
| |
Net asset value per share ($1,222,850,332 ÷ 20,583,147 shares outstanding), no par value, unlimited shares authorized | |
| |
Redemption proceeds per share | |
| |
Net asset value per share ($314,014,245 ÷ 6,138,361 shares outstanding), no par value, unlimited shares authorized | |
| |
Redemption proceeds per share | |
| See information listed after the Fund’s Portfolio of Investments. |
See Notes which are an integral part of the Financial Statements
Annual Financial Statements and Additional Information
Statement of OperationsYear Ended October 31, 2024
| |
Dividends (including $1,654,883 received from affiliated holdings*) | |
Net income on securities loaned (includes $44,498 earned from affiliated holdings related to cash collateral balances*) (Note 2) | |
| |
| |
Investment adviser fee (Note 5) | |
Administrative fee (Note 5) | |
| |
Transfer agent fees (Note 2) | |
Directors’/Trustees’ fees (Note 5) | |
| |
| |
Portfolio accounting fees | |
Distribution services fee (Note 5) | |
Other service fees (Notes 2 and 5) | |
| |
| |
| |
| |
Waiver and Reimbursements: | |
Waiver/reimbursement of investment adviser fee (Note 5) | |
Reimbursement of other operating expenses (Notes 2 and 5) | |
TOTAL WAIVER AND REIMBURSEMENTS | |
| |
Net investment income (loss) | |
Realized and Unrealized Gain (Loss) on Investments: | |
Net realized gain on investments (including net realized loss of $(6,392) on sales of investments in affiliated holdings*) | |
Net change in unrealized appreciation of investments (including net change in unrealized appreciation of $(1,263) on investments in affiliated holdings*) | |
Net realized and unrealized gain (loss) on investments | |
Change in net assets resulting from operations | |
| See information listed after the Fund’s Portfolio of Investments. |
See Notes which are an integral part of the Financial Statements
Annual Financial Statements and Additional Information
Statement of Changes in Net Assets
| | |
Increase (Decrease) in Net Assets | | |
| | |
| | |
| | |
Net change in unrealized appreciation/depreciation | | |
CHANGE IN NET ASSETS RESULTING FROM OPERATIONS | | |
Distributions to Shareholders: | | |
Distributions From Net Realized Gain: | | |
| | |
| | |
| | |
| | |
Distributions From Return of Capital: | | |
| | |
| | |
| | |
| | |
CHANGE IN NET ASSETS RESULTING FROM DISTRIBUTIONS TO SHAREHOLDERS | | |
| | |
Proceeds from sale of shares | | |
Net asset value of shares issued to shareholders in payment of distributions declared | | |
| | |
CHANGE IN NET ASSETS RESULTING FROM SHARE TRANSACTIONS | | |
| | |
| | |
| | |
| | |
See Notes which are an integral part of the Financial Statements
Annual Financial Statements and Additional Information
Notes to Financial Statements
Federated Hermes Equity Funds (the “Trust”) is registered under the Investment Company Act of 1940, as amended (the “Act”), as an open-end management investment company. The Trust consists of eight portfolios. The financial statements included herein are only those of Federated Hermes MDT Mid Cap Growth Fund (the “Fund”), a diversified portfolio. The financial statements of the other portfolios are presented separately. The assets of each portfolio are segregated and a shareholder’s interest is limited to the portfolio in which shares are held. Each portfolio pays its own expenses. The Fund offers four classes of shares: Class A Shares, Class C Shares, Institutional Shares and Class R6 Shares. All shares of the Fund have equal rights with respect to voting, except on class-specific matters. The investment objective of the Fund is appreciation of capital.
2. SIGNIFICANT ACCOUNTING POLICIES
The following is a summary of significant accounting policies consistently followed by the Fund in the preparation of its financial statements. These policies are in conformity with U.S. generally accepted accounting principles (GAAP).
In calculating its net asset value (NAV), the Fund generally values investments as follows:
■
Equity securities listed on an exchange or traded through a regulated market system are valued at their last reported sale price or official closing price in their principal exchange or market.
■
Shares of other mutual funds or non-exchange-traded investment companies are valued based upon their reported NAVs, or NAV per share practical expedient, as applicable.
■
For securities that are fair valued in accordance with procedures established by and under the general supervision of Federated MDTA LLC (the “Adviser”) certain factors may be considered, such as: the last traded or purchase price of the security, information obtained by contacting the issuer or dealers, analysis of the issuer’s financial statements or other available documents, fundamental analytical data, the nature and duration of restrictions on disposition, the movement of the market in which the security is normally traded, public trading in similar securities or derivative contracts of the issuer or comparable issuers, movement of a relevant index, or other factors including but not limited to industry changes and relevant government actions.
If any price, quotation, price evaluation or other pricing source is not readily available when the NAV is calculated, if the Fund cannot obtain price evaluations from a pricing service or from more than one dealer for an investment within a reasonable period of time as set forth in the Adviser’s valuation policies and procedures for the Fund, or if information furnished by a pricing service, in the opinion of the Adviser’s valuation committee (“Valuation Committee”), is deemed not representative of the fair value of such security, the Fund uses the fair value of the investment determined in accordance with the procedures described below. There can be no assurance that the Fund could obtain the fair value assigned to an investment if it sold the investment at approximately the time at which the Fund determines its NAV per share, and the actual value obtained could be materially different.
Fair Valuation and Significant Events Procedures
Pursuant to Rule 2a-5 under the Act, the Fund’s Board of Trustees (the “Trustees”) has designated the Adviser as the Fund’s valuation designee to perform any fair value determinations for securities and other assets held by the Fund. The Adviser is subject to the Trustees’ oversight and certain reporting and other requirements intended to provide the Trustees the information needed to oversee the Adviser’s fair value determinations.
The Adviser, acting through its Valuation Committee, is responsible for determining the fair value of investments for which market quotations are not readily available. The Valuation Committee is comprised of officers of the Adviser and certain of the Adviser’s affiliated companies and determines fair value and oversees the calculation of the NAV. The Valuation Committee is also authorized to use pricing services to provide fair value evaluations of the current value of certain investments for purposes of calculating the NAV. The Valuation Committee employs various methods for reviewing third-party pricing-service evaluations including periodic reviews of third-party pricing services’ policies, procedures and valuation methods (including key inputs, methods, models and assumptions), transactional back-testing, comparisons of evaluations of different pricing services, and review of price challenges by the Adviser based on recent market activity. In the event that market quotations and price evaluations are not available for an investment, the Valuation Committee determines the fair value of the investment in accordance with procedures adopted by the Adviser. The Trustees periodically review the fair valuations made by the Valuation Committee. The Trustees have also approved the Adviser’s fair valuation and significant events procedures as part of the Fund’s compliance program and will review any changes made to the procedures.
Factors considered by pricing services in evaluating an investment include the yields or prices of investments of comparable quality, coupon, maturity, call rights and other potential prepayments, terms and type, reported transactions, indications as to values from dealers and general market conditions. Some pricing services provide a single price evaluation reflecting the bid-side of the market for an investment (a “bid” evaluation). Other pricing services offer both bid evaluations and price evaluations indicative of a price between the prices bid and ask for the investment (a “mid” evaluation). The Fund normally uses bid evaluations for any U.S. Treasury and Agency securities, mortgage-backed securities and municipal securities. The Fund normally uses mid evaluations for any other types of fixed-income securities and any OTC derivative contracts. In the event that market quotations and price evaluations are not available for an investment, the fair value of the investment is determined in accordance with procedures adopted by the Adviser.
Annual Financial Statements and Additional Information
The Adviser has also adopted procedures requiring an investment to be priced at its fair value whenever the Valuation Committee determines that a significant event affecting the value of the investment has occurred between the time as of which the price of the investment would otherwise be determined and the time as of which the NAV is computed. An event is considered significant if there is both an affirmative expectation that the investment’s value will change in response to the event and a reasonable basis for quantifying the resulting change in value. Examples of significant events that may occur after the close of the principal market on which a security is traded, or after the time of a price evaluation provided by a pricing service or a dealer, include:
■
With respect to securities traded principally in foreign markets, significant trends in U.S. equity markets or in the trading of foreign securities index futures contracts;
■
Political or other developments affecting the economy or markets in which an issuer conducts its operations or its securities are traded;
■
Announcements concerning matters such as acquisitions, recapitalizations, litigation developments, or a natural disaster affecting the issuer’s operations or regulatory changes or market developments affecting the issuer’s industry.
The Adviser has adopted procedures whereby the Valuation Committee uses a pricing service to provide factors to update the fair value of equity securities traded principally in foreign markets from the time of the close of their respective foreign stock exchanges to the pricing time of the Fund. For other significant events, the Fund may seek to obtain more current quotations or price evaluations from alternative pricing sources. If a reliable alternative pricing source is not available, the Valuation Committee will determine the fair value of the investment in accordance with the fair valuation procedures approved by the Adviser. The Trustees periodically review fair valuations made in response to significant events.
The Fund may invest in repurchase agreements for short-term liquidity purposes. It is the policy of the Fund to require the other party to a repurchase agreement to transfer to the Fund’s custodian or sub-custodian eligible securities or cash with a market value (after transaction costs) at least equal to the repurchase price to be paid under the repurchase agreement. The eligible securities are transferred to accounts with the custodian or sub-custodian in which the Fund holds a “securities entitlement” and exercises “control” as those terms are defined in the Uniform Commercial Code. The Fund has established procedures for monitoring the market value of the transferred securities and requiring the transfer of additional eligible securities if necessary to equal at least the repurchase price. These procedures also allow the other party to require securities to be transferred from the account to the extent that their market value exceeds the repurchase price or in exchange for other eligible securities of equivalent market value.
The insolvency of the other party or other failure to repurchase the securities may delay the disposition of the underlying securities or cause the Fund to receive less than the full repurchase price. Under the terms of the repurchase agreement, any amounts received by the Fund in excess of the repurchase price and related transaction costs must be remitted to the other party.
The Fund may enter into repurchase agreements in which eligible securities are transferred into joint trading accounts maintained by the custodian or sub-custodian for investment companies and other clients advised by the Fund’s Adviser and its affiliates. The Fund will participate on a pro rata basis with the other investment companies and clients in its share of the securities transferred under such repurchase agreements and in its share of proceeds from any repurchase or other disposition of such securities.
Investment Income, Gains and Losses, Expenses and Distributions
Investment transactions are accounted for on a trade-date basis. Realized gains and losses from investment transactions are recorded on an identified-cost basis. Interest income and expenses are accrued daily. Dividend income and distributions to shareholders are recorded on the ex-dividend date. Foreign dividends are recorded on the ex-dividend date or when the Fund is informed of the ex-dividend date. Distributions of net investment income, if any, are declared and paid annually. Non-cash dividends included in dividend income, if any, are recorded at fair value. Amortization/accretion of premium and discount is included in investment income. Investment income, realized and unrealized gains and losses, and certain fund-level expenses are allocated to each class based on relative average daily net assets, except that select classes will bear certain expenses unique to those classes. The detail of the total fund expense waiver and reimbursements of $1,407,692 is disclosed in various locations in this Note 2 and Note 5. Dividends are declared separately for each class. No class has preferential dividend rights; differences in per share dividend rates are generally due to differences in separate class expenses.
For the year ended October 31, 2024, transfer agent fees for the Fund were as follows:
| Transfer Agent
Fees Incurred | Transfer Agent
Fees Reimbursed |
| | |
| | |
| | |
| | |
| | |
The Fund may pay other service fees up to 0.25% of the average daily net assets of the Fund’s Class A Shares and Class C Shares to financial intermediaries or to Federated Shareholder Services Company (FSSC) for providing services to shareholders and maintaining shareholder accounts. Subject to the terms described in the Expense Limitation note, FSSC may voluntarily reimburse the Fund for other service fees.
Annual Financial Statements and Additional Information
For the year ended October 31, 2024, other service fees for the Fund were as follows:
| Other Service
Fees Incurred |
| |
| |
| |
It is the Fund’s policy to comply with the Subchapter M provision of the Internal Revenue Code of 1986 and to distribute to shareholders each year substantially all of its income. Accordingly, no provision for federal income tax is necessary. As of and during the year ended October 31, 2024, the Fund did not have a liability for any uncertain tax positions. The Fund recognizes interest and penalties, if any, related to tax liabilities as income tax expense in the Statement of Operations. As of October 31, 2024, tax years 2021 through 2024 remain subject to examination by the Fund’s major tax jurisdictions, which include the United States of America and the Commonwealth of Massachusetts.
The Fund may be subject to taxes imposed by governments of countries in which it invests. Such taxes are generally based on either income or gains earned or repatriated. The Fund accrues and applies such taxes to net investment income, net realized gains and net unrealized gains as income and/or gains are earned.
When-Issued and Delayed-Delivery Transactions
The Fund may engage in when-issued or delayed-delivery transactions. The Fund records when-issued securities on the trade date and maintains security positions such that sufficient liquid assets will be available to make payment for the securities purchased. Securities purchased on a when-issued or delayed-delivery basis are marked to market daily and begin earning interest on the settlement date. Losses may occur on these transactions due to changes in market conditions or the failure of counterparties to perform under the contract.
Foreign Currency Translation
The accounting records of the Fund are maintained in U.S. dollars. All assets and liabilities denominated in foreign currencies are translated into U.S. dollars based on the rates of exchange of such currencies against U.S. dollars on the date of valuation. Purchases and sales of securities, income and expenses are translated at the rate of exchange quoted on the respective date that such transactions are recorded. The Fund does not isolate that portion of the results of operations resulting from changes in foreign exchange rates on investments from the fluctuations arising from changes in market prices of securities held. Such fluctuations are included with the net realized and unrealized gain or loss from investments.
Reported net realized foreign exchange gains or losses arise from sales of foreign currencies, currency gains or losses realized between the trade and settlement dates on securities transactions, the difference between the amounts of dividends, interest and foreign withholding taxes recorded on the Fund’s books, and the U.S. dollar equivalent of the amounts actually received or paid. Net unrealized foreign exchange gains and losses arise from changes in the value of assets and liabilities other than investments in securities at fiscal year end, resulting from changes in the exchange rate.
The Fund participates in a securities lending program providing for the lending of equity securities to qualified brokers. The term of the loans within the program is one year or less. The Fund normally receives cash collateral for securities loaned that may be invested in affiliated money market funds, other money market instruments and/or repurchase agreements. Collateral is maintained at a minimum level of 100% of the market value of investments loaned, plus interest, if applicable. In accordance with the Fund’s securities lending agreement, the market value of securities on loan is determined each day at the close of business and any additional collateral required to cover the value of securities on loan is delivered to the Fund on the next business day. Earnings from collateral invested in affiliated holdings as presented parenthetically on the Statement of Operations do not reflect fees and rebates and are allocated between the borrower of the security, the securities lending agent, as a fee for its services under the program and the Fund, according to agreed-upon rates. The Fund will not have the right to vote on securities while they are on loan. However, the Fund will attempt to terminate a loan in an effort to reacquire the securities in time to vote on matters that are deemed to be material by the Adviser. There can be no assurance that the Fund will have sufficient notice of such matters to be able to terminate the loan in time to vote thereon.
As of October 31, 2024, the Fund had no outstanding securities on loan.
The preparation of financial statements in conformity with GAAP requires management to make estimates and assumptions that affect the amounts of assets, liabilities, expenses and revenues reported in the financial statements. Actual results could differ materially from those estimated. The Fund applies investment company accounting and reporting guidance.
Annual Financial Statements and Additional Information
3. SHARES OF BENEFICIAL INTEREST
The following table summarizes share activity:
| | |
| | | | |
| | | | |
Shares issued to shareholders in payment of distributions declared | | | | |
| | | | |
NET CHANGE RESULTING FROM CLASS A SHARE TRANSACTIONS | | | | |
| | |
| | | | |
| | | | |
Shares issued to shareholders in payment of distributions declared | | | | |
| | | | |
NET CHANGE RESULTING FROM CLASS C SHARE TRANSACTIONS | | | | |
| | |
| | | | |
| | | | |
Shares issued to shareholders in payment of distributions declared | | | | |
| | | | |
NET CHANGE RESULTING FROM INSTITUTIONAL SHARE TRANSACTIONS | | | | |
| | |
| | | | |
| | | | |
Shares issued to shareholders in payment of distributions declared | | | | |
| | | | |
NET CHANGE RESULTING FROM CLASS R6 SHARE TRANSACTIONS | | | | |
NET CHANGE RESULTING FROM TOTAL FUND SHARE TRANSACTIONS | | | | |
4. FEDERAL TAX INFORMATION
The accounting treatment of certain items in accordance with income tax regulations may differ from the accounting treatment in accordance with GAAP which may result in permanent differences. In the case of the Fund, such differences primarily result from net operating losses.
For the year ended October 31, 2024, permanent differences identified and reclassified among the components of net assets were as follows:
|
| Total Distributable
Earnings (Loss) |
| |
The tax character of distributions as reported on the Statement of Changes in Net Assets for the years ended October 31, 2024 and 2023, was as follows:
Annual Financial Statements and Additional Information
As of October 31, 2024, the components of distributable earnings on a tax-basis were as follows:
Net unrealized appreciation | |
Undistributed long-term capital gains | |
| |
| |
At October 31, 2024, the cost of investments for federal tax purposes was $1,577,048,722. The net unrealized appreciation of investments for federal tax purposes was $309,036,841. This consists of unrealized appreciation from investments for those securities having an excess of value over cost of $331,570,454 and unrealized depreciation from investments for those securities having an excess of cost over value of $22,533,613. The difference between book-basis and tax-basis net unrealized appreciation is attributable to differing treatments for deferral of losses on wash sales.
Under current tax rules, a late-year ordinary loss may be deferred, in whole or in part, and treated as occurring on the first day of the following fiscal year. As of October 31, 2024, for federal income tax purposes, a late year ordinary loss of $1,677,706 was deferred to November 1, 2024.
5. INVESTMENT ADVISER FEE AND OTHER TRANSACTIONS WITH AFFILIATES
The advisory agreement between the Fund and the Adviser provides for an annual fee equal to 0.75% of the Fund’s average daily net assets. Subject to the terms described in the Expense Limitation note, the Adviser may voluntarily choose to waive any portion of its fee and/or reimburse certain operating expenses of the Fund for competitive reasons such as to maintain the Fund’s expense ratio, or as and when appropriate, to maintain positive or zero net yields. For the year ended October 31, 2024, the Adviser voluntarily waived $707,538 of its fee and voluntarily reimbursed $674,278 of transfer agent fees.
The Adviser has agreed to reimburse the Fund for certain investment adviser fees as a result of transactions in other affiliated investment companies. For the year ended October 31, 2024, the Adviser reimbursed $25,876.
Federated Administrative Services (FAS), under the Administrative Services Agreement, provides the Fund with administrative personnel and services. For purposes of determining the appropriate rate breakpoint, “Investment Complex” is defined as all of the Federated Hermes Funds subject to a fee under the Administrative Services Agreement. The fee paid to FAS is based on the average daily net assets of the Investment Complex as specified below:
| Average Daily Net Assets
of the Investment Complex |
| on assets up to $50 billion |
| on assets over $50 billion |
Subject to the terms described in the Expense Limitation note, FAS may voluntarily choose to waive any portion of its fee. For the year ended October 31, 2024, the annualized fee paid to FAS was 0.078% of average daily net assets of the Fund.
In addition, FAS may charge certain out-of-pocket expenses to the Fund.
Distribution Services Fee
The Fund has adopted a Distribution Plan (the “Plan”) pursuant to Rule 12b-1 under the Act. Under the terms of the Plan, the Fund will compensate Federated Securities Corp. (FSC), the principal distributor, from the daily net assets of the Fund’s Class C Shares to finance activities intended to result in the sale of these shares. The Plan provides that the Fund may incur distribution expenses at 0.75% of average daily net assets, annually, to compensate FSC. Subject to the terms described in the Expense Limitation note, FSC may voluntarily choose to waive any portion of its fee.
For the year ended October 31, 2024, distribution services fees for the Fund were as follows:
| Distribution Services
Fees Incurred |
| |
When FSC receives fees, it may pay some or all of them to financial intermediaries whose customers purchase shares. For the year ended October 31, 2024, FSC retained $19,688 of fees paid by the Fund.
Front-end sales charges and contingent deferred sales charges (CDSC) do not represent expenses of the Fund. They are deducted from the proceeds of sales of Fund shares prior to investment or from redemption proceeds prior to remittance, as applicable. For the year ended October 31, 2024, FSC retained $28,195 in sales charges from the sale of Class A Shares. FSC also retained $1,203 of CDSC relating to redemptions of Class C Shares.
For the year ended October 31, 2024, FSSC received $71,948 of the other service fees disclosed in Note 2.
Annual Financial Statements and Additional Information
Expense Limitation
The Adviser and certain of its affiliates (which may include FSC, FAS and FSSC) on their own initiative have agreed to waive certain amounts of their respective fees and/or reimburse expenses. Total annual fund operating expenses (as shown in the financial highlights, excluding interest expense, extraordinary expenses and proxy-related expenses, if any) paid by the Fund’s Class A Shares, Class C Shares, Institutional Shares and Class R6 Shares (after the voluntary waivers and/or reimbursements) will not exceed 1.14%, 1.94%, 0.84% and 0.83% (the “Fee Limit”), respectively, up to but not including the later of (the “Termination Date”): (a) January 1, 2026; or (b) the date of the Fund’s next effective Prospectus. While the Adviser and its applicable affiliates currently do not anticipate terminating or increasing these arrangements prior to the Termination Date, these arrangements may only be terminated or the Fee Limit increased prior to the Termination Date with the agreement of the Trustees.
Directors’/Trustees’ and Miscellaneous Fees
Certain Officers and Trustees of the Fund are Officers and Directors or Trustees of certain of the above companies. To efficiently facilitate payment, Independent Directors’/Trustees’ fees and certain expenses related to conducting meetings of the Directors/Trustees and other miscellaneous expenses are paid by an affiliate of the Adviser which in due course are reimbursed by the Fund. These expenses related to conducting meetings of the Directors/Trustees and other miscellaneous expenses may be included in Accrued and Miscellaneous Expenses on the Statement of Assets and Liabilities and Statement of Operations, respectively.
6. INVESTMENT TRANSACTIONS
Purchases and sales of investments, excluding long-term U.S. government securities and short-term obligations, for the year ended October 31, 2024, were as follows:
The Fund may invest a portion of its assets in securities of companies that are deemed by the Fund’s management to be classified in similar business sectors. Economic developments may have an effect on the liquidity and volatility of the portfolio securities.
The Fund may place its cash on deposit with financial institutions in the United States, which is insured by the Federal Deposit Insurance Company (“FDIC”) up to $250,000. The Fund’s credit risk in the event of failure of these financial institutions is represented by the difference between the FDIC limit and the total amounts on deposit. The Fund from time to time may have amounts on deposit in excess of the insured limits.
The Fund participates with certain other Federated Hermes Funds, on a several basis, in an up to $500,000,000 unsecured, 364-day, committed, revolving line of credit (LOC) agreement dated June 18, 2024. The LOC was made available to temporarily finance the repurchase or redemption of shares of the Fund, failed trades, payment of dividends, settlement of trades and for other short-term, temporary or emergency general business purposes. The Fund cannot borrow under the LOC if an inter-fund loan is outstanding. The Fund’s ability to borrow under the LOC also is subject to the limitations of the Act and various conditions precedent that must be satisfied before the Fund can borrow. Loans under the LOC are charged interest at a fluctuating rate per annum equal to (a) the highest, on any day, of (i) the federal funds effective rate, (ii) the published secured overnight financing rate plus an assigned percentage, and (iii) 0.0%, plus (b) a margin. Any fund eligible to borrow under the LOC pays its pro rata share of a commitment fee based on the amount of the lenders’ commitment that has not been utilized, quarterly in arrears and at maturity. As of October 31, 2024, the Fund had no outstanding loans. During the year ended October 31, 2024, the Fund did not utilize the LOC.
Pursuant to an Exemptive Order issued by the Securities and Exchange Commission, the Fund, along with other funds advised by subsidiaries of Federated Hermes, Inc., may participate in an interfund lending program. This program provides an alternative credit facility allowing the Fund to borrow from other participating affiliated funds. As of October 31, 2024, there were no outstanding loans. During the year ended October 31, 2024, the program was not utilized.
Under the Fund’s organizational documents, its Officers and Directors/Trustees are indemnified against certain liabilities arising out of the performance of their duties to the Fund (other than liabilities arising out of their willful misfeasance, bad faith, gross negligence or reckless disregard of their duties to the Fund). In addition, in the normal course of business, the Fund provides certain indemnifications under arrangements with third parties. Typically, obligations to indemnify a third party arise in the context of an arrangement entered into by the Fund under which the Fund agrees to indemnify such third party for certain liabilities arising out of actions taken pursuant to the arrangement, provided the third party’s actions are not deemed to have breached an agreed-upon standard of care (such as willful misfeasance, bad faith, gross negligence or reckless disregard of their duties under the contract). The Fund’s maximum exposure under these arrangements is unknown as this would involve future claims that may be made against the Fund that have not yet arisen. The Fund does not anticipate any material claims or losses pursuant to these arrangements at this time, and accordingly expects the risk of loss to be remote.
Annual Financial Statements and Additional Information
Report of Independent Registered Public Accounting Firm
To the Board of Trustees of Federated Hermes Equity Funds and the Shareholders of Federated Hermes MDT Mid Cap Growth Fund:
Opinion on the Financial Statements
We have audited the accompanying statement of assets and liabilities of Federated Hermes MDT Mid Cap Growth Fund (the Fund), a portfolio of Federated Hermes Equity Funds, including the portfolio of investments, as of October 31, 2024, the related statement of operations for the year then ended, the statements of changes in net assets for each of the years in the two-year period then ended, and the related notes (collectively, the financial statements) and the financial highlights for each of the years in the five-year period then ended. In our opinion, the financial statements and financial highlights present fairly, in all material respects, the financial position of the Fund as of October 31, 2024, the results of its operations for the year then ended, the changes in its net assets for each of the years in the two-year period then ended, and the financial highlights for each of the years in the five-year period then ended, in conformity with U.S. generally accepted accounting principles.
These financial statements and financial highlights are the responsibility of the Fund’s management. Our responsibility is to express an opinion on these financial statements and financial highlights based on our audits. We are a public accounting firm registered with the Public Company Accounting Oversight Board (United States) (PCAOB) and are required to be independent with respect to the Fund in accordance with the U.S. federal securities laws and the applicable rules and regulations of the Securities and Exchange Commission and the PCAOB.
We conducted our audits in accordance with the standards of the PCAOB. Those standards require that we plan and perform the audit to obtain reasonable assurance about whether the financial statements and financial highlights are free of material misstatement, whether due to error or fraud. Our audits included performing procedures to assess the risks of material misstatement of the financial statements and financial highlights, whether due to error or fraud, and performing procedures that respond to those risks. Such procedures included examining, on a test basis, evidence regarding the amounts and disclosures in the financial statements and financial highlights. Such procedures also included confirmation of securities owned as of October 31, 2024, by correspondence with the custodian, transfer agent and brokers; when replies were not received from brokers, we performed other auditing procedures. Our audits also included evaluating the accounting principles used and significant estimates made by management, as well as evaluating the overall presentation of the financial statements and financial highlights. We believe that our audits provide a reasonable basis for our opinion. 
We have served as the auditor for one or more of Federated Hermes’ investment companies since 2006.
Boston, Massachusetts
December 23, 2024
Annual Financial Statements and Additional Information
Shareholder Meeting Results (unaudited)
At a Special Meeting held on October 25, 2024, shareholders of the Federated Hermes Equity Funds (the “Trust”) elected Trustees of the Trust. Shareholders of the Trust elected three new individuals to serve as Trustees effective January 1, 2025, who will serve on the Board with current Trustees Messrs. J. Christopher Donahue, John B. Fisher, John G. Carson, G. Thomas Hough, Thomas M. O’Neill, John S. Walsh and Ms. Madelyn A. Reilly. Under the Trust’s Director Service Policy, existing Trustees Judge Maureen Lally-Green and Mr. P. Jerome Richey are expected to retire from the Board on December 31, 2024. The number of votes cast for, against or withheld, as well as the number of abstentions and broker non-votes with respect to the election of each nominee for office, is included below.
Annual Financial Statements and Additional Information
Evaluation and Approval of Advisory Contract–May 2024
Federated Hermes MDT Mid-Cap Growth Fund (the “Fund”)
At its meetings in May 2024 (the “May Meetings”), the Fund’s Board of Trustees (the “Board”), including those Trustees who are not “interested persons” of the Fund, as defined in the Investment Company Act of 1940 (the “Independent Trustees”), reviewed and unanimously approved the continuation of the investment advisory contract between the Fund and Federated MDTA LLC (the “Adviser”) with respect to the Fund (the “Contract”) for an additional one-year term. The Board’s determination to approve the continuation of the Contract reflects the exercise of its business judgment after considering all of the information and factors believed to be relevant and appropriate on whether to approve the continuation of the existing arrangement. The information, factors and conclusions that formed the basis for the Board’s approval are summarized below.
Information Received and Review Process
At the request of the Independent Trustees, the Fund’s Chief Compliance Officer (the “CCO”) furnished to the Board in advance of its May Meetings an independent written evaluation of the Fund’s management fee (the “CCO Fee Evaluation Report”). The Board considered the CCO Fee Evaluation Report, along with other information, in evaluating the reasonableness of the Fund’s management fee and in determining to approve the continuation of the Contract.
In addition to the extensive materials that comprise and accompany the CCO Fee Evaluation Report, the Board considered information specifically prepared in connection with the approval of the continuation of the Contract that was presented at the May Meetings. In this regard, in the months preceding the May Meetings, the Board requested and reviewed written responses and supporting materials prepared by the Adviser and its affiliates (collectively, “Federated Hermes”) in response to requests posed to Federated Hermes by independent legal counsel on behalf of the Independent Trustees encompassing a wide variety of topics, including those summarized below. The Board also considered such additional matters as the Independent Trustees deemed reasonably necessary to evaluate the Contract, which included detailed information about the Fund and Federated Hermes furnished to the Board at its meetings throughout the year and in between regularly scheduled meetings on particular matters as the need arose.
The Board’s consideration of the Contract included review of materials and information covering the following matters, among others: (1) copies of the Contracts; (2) the nature, quality and extent of the advisory and other services provided to the Fund by Federated Hermes; (3) Federated Hermes’ business and operations; (4) the Adviser’s investment philosophy, personnel and processes; (5) the Fund’s investment objectives and strategies; (6) the Fund’s short-term and long-term performance - in absolute terms (both on a gross basis and net of expenses) and relative to an appropriate group of peer funds and its benchmark; (7) the Fund’s fees and expenses, including the advisory fee and the overall expense structure of the Fund - in absolute terms and relative to an appropriate group of peer funds, with due regard for contractual or voluntary expense limitations (if any); (8) the financial condition of Federated Hermes; (9) the Adviser’s profitability with respect to managing the Fund; (10) distribution and sales activity for the Fund; and (11) the use and allocation of brokerage commissions derived from trading the Fund’s portfolio securities (if any).
The Board also considered judicial decisions concerning allegedly excessive investment advisory fees charged to other registered funds in evaluating the Contract. Using these judicial decisions as a guide, the Board considered several factors they deemed relevant to an adviser’s fiduciary duty with respect to its receipt of compensation from a fund, including: (1) the nature and quality of the services provided by the adviser to the fund and its shareholders, including the performance of the fund, its benchmark and comparable funds; (2) the adviser’s cost of providing the services and the profitability to the adviser of providing advisory services to the fund; (3) the extent to which the adviser may realize “economies of scale” as the fund grows larger and, if such economies of scale exist, whether they have been appropriately shared with the fund and its shareholders or the family of funds; (4) any “fall-out” benefits that accrue to the adviser because of its relationship with the fund, including research services received from brokers that execute fund trades and any fees paid to affiliates of the adviser for services rendered to the fund; (5) comparative fees and expenses, including a comparison of management fees paid to the adviser with those paid by similar funds managed by the same adviser or other advisers as well as management fees charged to institutional and other advisory clients of the same adviser for what might be viewed as like services; and (6) the extent of care, conscientiousness and independence with which the fund’s board members perform their duties and their expertise, including whether they are fully informed about all facts the board deems relevant to its consideration of the adviser’s services and fees. The Board considered that the Securities and Exchange Commission (“SEC”) disclosure requirements regarding the basis for a fund board’s approval of the fund’s investment advisory contract generally align with the factors listed above. The Board was guided by these factors in its evaluation of the Contract to the extent it considered them to be appropriate and relevant, as discussed further below. The Board considered and weighed these factors in light of its substantial accumulated experience in governing the Fund and working with Federated Hermes on matters relating to the oversight of the other funds advised by Federated Hermes (each, a “Federated Hermes Fund” and, collectively, the “Federated Hermes Funds”).
Annual Financial Statements and Additional Information
In addition, the Board considered the preferences and expectations of Fund shareholders and the potential disruptions of the Fund’s operations and various risks, uncertainties and other effects that could occur as a result of a decision to terminate or not renew the Contract. In particular, the Board recognized that many shareholders likely have invested in the Fund based on the strength of Federated Hermes’ industry standing and reputation and with the expectation that Federated Hermes will have a continuing role in providing advisory services to the Fund. Thus, the Board observed that there are a range of investment options available to the Fund’s shareholders in the marketplace, and such shareholders, having had the opportunity to consider other investment options, have effectively selected Federated Hermes by virtue of investing in the Fund.
In determining to approve the continuation of the Contract, the members of the Board reviewed and evaluated information and factors they believed to be relevant and appropriate through the exercise of their reasonable business judgment. While individual members of the Board may have weighed certain factors differently, the Board’s determination to approve the continuation of the Contract was based on a comprehensive consideration of all information provided to the Board throughout the year and specifically with respect to the continuation of the Contract. The Board recognized that its evaluation process is evolutionary and that the factors considered and emphasis placed on relevant factors may change in recognition of changing circumstances in the registered fund marketplace. The Independent Trustees were assisted throughout the evaluation process by independent legal counsel. In connection with their deliberations at the May Meetings, the Independent Trustees met separately in executive session with their independent legal counsel and without management present to review the relevant materials and consider their responsibilities under applicable laws. In addition, senior management representatives of Federated Hermes also met with the Independent Trustees and their independent legal counsel to discuss the materials and presentations furnished to the Board at the May Meetings. The Board considered the approval of the Contract for the Fund as part of its consideration of agreements for funds across the family of Federated Hermes Funds, but its approvals were made on a fund-by-fund basis.
Nature, Extent and Quality of Services
The Board considered the nature, extent and quality of the services provided to the Fund by the Adviser and the resources of Federated Hermes dedicated to the Fund. In this regard, the Board evaluated, among other things, the terms of the Contract and the full range of services provided to the Fund by Federated Hermes. The Board considered the Adviser’s personnel, investment philosophy and process, investment research capabilities and resources, trade operations capabilities, experience and performance track record. The Board reviewed the qualifications, backgrounds and responsibilities of the portfolio management team primarily responsible for the day-to-day management of the Fund and evaluated Federated Hermes’ ability and experience in attracting and retaining qualified personnel to service the Fund. The Board considered the trading operations by the Adviser, including the execution of portfolio transactions and the selection of brokers for those transactions. The Board also considered the Adviser’s ability to deliver competitive investment performance for the Fund when compared to the Fund’s Performance Peer Group (as defined below), which was deemed by the Board to be a useful indicator of how the Adviser is executing the Fund’s investment program.
In addition, the Board considered the financial resources and overall reputation of Federated Hermes and its willingness to consider and make investments in personnel, infrastructure, technology, cybersecurity, business continuity planning and operational enhancements that are designed to benefit the Federated Hermes Funds. The Board noted the benefits of the previous significant acquisition of Hermes Fund Managers Limited by Federated Hermes, which has deepened Federated Hermes’ investment management expertise and capabilities and expanded its access to analytical resources related to environmental, social and governance (“ESG”) factors and issuer engagement on ESG matters where appropriate. The Board considered Federated Hermes’ oversight of the securities lending program for the Federated Hermes Funds that engage in securities lending and noted the income earned by the Federated Hermes Funds that participate in such program. In addition, the Board considered the quality of Federated Hermes’ communications with the Board and responsiveness to Board inquiries and requests made from time to time with respect to the Federated Hermes Funds. The Board also considered that Federated Hermes is responsible for providing the Federated Hermes Funds’ officers.
The Board received and evaluated information regarding Federated Hermes’ regulatory and compliance environment. The Board considered Federated Hermes’ compliance program and compliance history and reports from the CCO about Federated Hermes’ compliance with applicable laws and regulations, including responses to regulatory developments and any compliance or other issues raised by regulatory agencies. The Board also noted Federated Hermes’ support of the Federated Hermes Funds’ compliance control structure and the compliance-related resources devoted by Federated Hermes in support of the Fund’s obligations pursuant to Rule 38a-1 under the Investment Company Act of 1940, including Federated Hermes’ commitment to respond to rulemaking and other regulatory initiatives of the SEC. The Board considered Federated Hermes’ approach to internal audits and risk management with respect to the Federated Hermes Funds and its day-to-day oversight of the Federated Hermes Funds’ compliance with their investment objectives and policies as well as with applicable laws and regulations, noting that regulatory and other developments had over time led, and continue to lead, to an increase in the scope of Federated Hermes’ oversight in this regard.
Annual Financial Statements and Additional Information
In addition, the Board noted Federated Hermes’ commitment to maintaining high quality systems and expending substantial resources to prepare for and respond to ongoing changes due to the market, regulatory and control environments in which the Fund and its service providers operate.
The Board considered Federated Hermes’ efforts to provide shareholders in the Federated Hermes Funds with a comprehensive array of funds with different investment objectives, policies and strategies. The Board considered the expenses that Federated Hermes had incurred, as well as the entrepreneurial and other risks assumed by Federated Hermes, in sponsoring and providing on-going services to new funds to expand these opportunities for shareholders. The Board noted the benefits to shareholders of being part of the family of Federated Hermes Funds, which include the general right to exchange investments between the same class of shares without the incurrence of additional sales charges.
Based on these considerations, the Board concluded that it was satisfied with the nature, extent and quality of the services provided by the Adviser to the Fund.
Fund Investment Performance
The Board considered the investment performance of the Fund. In evaluating the Fund’s investment performance, the Board considered performance results in light of the Fund’s investment objective, strategies and risks. The Board considered detailed investment reports on, and the Adviser’s analysis of, the Fund’s performance over different time periods that were provided to the Board throughout the year and in connection with the May Meetings. These reports included, among other items, information on the Fund’s gross and net returns, the Fund’s investment performance compared to one or more relevant categories or groups of peer funds and the Fund’s benchmark index, performance attribution information and commentary on the effect of market conditions. The Board considered that, in its evaluation of investment performance at meetings throughout the year, it focused particular attention on information indicating less favorable performance of certain Federated Hermes Funds for specific time periods and discussed with Federated Hermes the reasons for such performance as well as any specific actions Federated Hermes had taken, or had agreed to take, to seek to enhance Fund investment performance and the results of those actions.
The Board also reviewed comparative information regarding the performance of other registered funds in the category of peer funds selected by Morningstar, Inc. (the “Morningstar”), an independent fund ranking organization (the “Performance Peer Group”). The Board noted the CCO’s view that comparisons to fund peer groups may be helpful, though not conclusive, in evaluating the performance of the Adviser in managing the Fund. The Board considered the CCO’s view that, in evaluating such comparisons, in some cases there may be differences in the funds’ objectives or investment management techniques, or the costs to implement the funds, even within the same Performance Peer Group. In this connection, the Board considered that the quantitative focus of the management of the Fund makes fee and expense comparisons particularly difficult as the funds in the Performance Peer Group varied widely in terms of the complexity of their management, and the management of the Fund is among the more complex relative to its Performance Peer Group. The Board also considered a report comparing the performance of the Fund solely to other funds with a quantitative focus in the Performance Peer Group.
The Board also considered comparative performance data from Lipper, Inc. that was included in reports provided to the Board throughout the year. The Board noted that differences may exist between the Performance Peer Group and Lipper peers and that the results of these performance comparisons may vary.
The Board considered that for the one-year, three-year and five-year periods ended December 31, 2023, the Fund’s performance was above the median of the Performance Peer Group. In addition, the Board was informed by the Adviser that, for the same periods, the Fund outperformed its benchmark index for the one-year, three-year and five-year periods.
Based on these considerations, the Board concluded that it had continued confidence in the Adviser’s overall capabilities to manage the Fund.
The Board considered the advisory fee, and overall expense structure of the Fund and the comparative fee and expense information that had been provided in connection with the May Meetings. In this regard, the Board was presented with, and considered, information regarding the contractual advisory fee rates, net advisory fee rates, total expense ratios and each element of the Fund’s total expense ratio (i.e., gross and net advisory fees, administrative fees, custody fees, portfolio accounting fees and transfer agency fees) relative to an appropriate group of peer funds compiled by Federated Hermes from the overall category of peer funds selected by Morningstar (the “Expense Peer Group”). The Board received a description of the methodology used to select the Expense Peer Group from the overall Morningstar category. The Board also reviewed comparative information regarding the fees and expenses of the broader group of funds in the overall Morningstar category.
Annual Financial Statements and Additional Information
While mindful that courts have cautioned against giving too much weight to comparative information concerning fees charged to funds by other advisers, the use of comparisons between the Fund and its Expense Peer Group assisted the Board in its evaluation of the Fund’s fees and expenses. The Board focused on comparisons with other registered funds more heavily than non-registered fund products or services because such comparisons are believed to be more relevant. The Board considered that other registered funds are the products most like the Fund, in that they are readily available to Fund shareholders as alternative investment vehicles, and they are the type of investment vehicle, in fact, chosen and maintained by the Fund’s shareholders. The Board noted that the range of such other registered funds’ fees and expenses, therefore, appears to be a relevant indicator of what investors have found to be reasonable in the marketplace in which the Fund competes.
The Board reviewed the contractual advisory fee rate, net advisory fee rate and other expenses of the Fund and noted the position of the Fund’s fee rates relative to its Expense Peer Group. In this regard, the Board noted that the contractual advisory fee rate was below the median of the Expense Peer Group, and the Board was satisfied that the overall expense structure of the Fund remained competitive.
The Board also received and considered information about the nature and extent of services offered and fees charged by Federated Hermes to other types of clients with investment strategies similar to those of the Federated Hermes Funds, including non-registered fund clients (such as institutional separate accounts) and third-party unaffiliated registered funds for which the Adviser or its affiliates serve as sub-adviser. The Board noted the CCO’s conclusion that non-registered fund clients are inherently different products due to the following differences, among others: (i) different types of targeted investors; (ii) different applicable laws and regulations; (iii) different legal structures; (iv) different average account sizes and portfolio management techniques made necessary by different cash flows and different associated costs; (v) the time spent by portfolio managers and their teams (among other personnel across various departments, including legal, compliance and risk management) in reviewing securities pricing; (vi) different SEC mandated risk management programs with respect to fund liquidity and use of derivatives; (viii) different administrative responsibilities; (viii) different degrees of risk associated with management; and (ix) a variety of different costs. The Board also considered information regarding the differences in the nature of the services required for Federated Hermes to manage its proprietary registered fund business versus managing a discrete pool of assets as a sub-adviser to another institution’s registered fund, noting the CCO’s view that Federated Hermes generally performs significant additional services and assumes substantially greater risks in managing the Fund and other Federated Hermes Funds than in its role as sub-adviser to an unaffiliated third-party registered fund. The Board noted that the CCO did not consider the fees for providing advisory services to other types of clients to be determinative in judging the appropriateness of the Federated Hermes Funds’ advisory fees.
Based on these considerations, the Board concluded that the fees and total operating expenses of the Fund, in conjunction with other matters considered, are reasonable in light of the services provided.
The Board received and considered profitability information furnished by Federated Hermes. Such profitability information included revenues reported on a fund-by-fund basis and estimates of the allocation of expenses made on a fund-by-fund basis, using allocation methodologies specified by the CCO and described to the Board. The Board considered the CCO’s view that, while these cost allocation reports apply consistent allocation processes, the inherent difficulties in allocating costs on a fund-by-fund basis continues to cause the CCO to question the precision of the process and to conclude that such reports may be unreliable because a single change in an allocation estimate may dramatically alter the resulting estimate of cost and/or profitability of a Federated Hermes Fund and may produce unintended consequences. In addition, the Board considered the CCO’s view that the allocation methodologies used by Federated Hermes in estimating profitability for purposes of reporting to the Board in connection with the continuation of the Contract are consistent with the methodologies previously reviewed by an independent consultant. The Board noted that the independent consultant had previously conducted a review of the allocation methodologies and reported to the Board that, although there is no single best method to allocate expenses, the methodologies used by Federated Hermes are reasonable. The Board considered the CCO’s view that the estimated profitability to the Adviser from its relationship with the Fund was not unreasonable in relation to the services provided.
The Board also reviewed information compiled by Federated Hermes comparing its profitability information to other publicly-held fund management companies, including information regarding profitability trends over time. The Board recognized that profitability comparisons among fund management companies are difficult because of the variation in the type of comparative information that is publicly available, and the profitability of any fund management company is affected by numerous factors. The Board considered the CCO’s conclusion that, based on such profitability information, Federated Hermes’ profit margins did not appear to be excessive. The Board also considered the CCO’s view that Federated Hermes appeared financially sound, with the resources necessary to fulfill its obligations under its contracts with the Federated Hermes Funds.
Annual Financial Statements and Additional Information
Economies of Scale
The Board received and considered information about the notion of possible realization of “economies of scale” as a fund grows larger, the difficulties of isolating and quantifying economies of scale at an individual fund level, and the extent to which potential scale benefits are shared with shareholders. In this regard, the Board considered that Federated Hermes has made significant and long-term investments in areas that support all of the Federated Hermes Funds, such as: portfolio management, investment research and trading operations; shareholder services; compliance; business continuity, cybersecurity and information security programs; internal audit and risk management functions; and technology, systems capabilities and use of data. The Board noted that Federated Hermes’ investments in these areas are extensive and are designed to provide enhanced or expanded services to the Federated Hermes Funds and their shareholders. The Board considered that the benefits of these investments are likely to be shared with the family of Federated Hermes Funds as a whole. In addition, the Board considered that fee waivers and expense reimbursements are another means for potential economies of scale to be shared with shareholders and can provide protection from an increase in expenses if a Federated Hermes Fund’s assets decline. The Board considered that, in order for the Federated Hermes Funds to remain competitive in the marketplace, Federated Hermes has frequently waived fees and/or reimbursed expenses for the Federated Hermes Funds and has disclosed to shareholders and/or reported to the Board its intention to do so (or continue to do so) in the future. The Board also considered that Federated Hermes has been active in managing expenses of the Federated Hermes Funds in recent years, which has resulted in benefits being realized by shareholders.
The Board also received and considered information on adviser-paid fees (commonly referred to as “revenue sharing” payments) that was provided to the Board throughout the year and in connection with the May Meetings. The Board considered that Federated Hermes and the CCO believe that this information is relevant to considering whether Federated Hermes had an incentive to either not apply breakpoints, or to apply breakpoints at higher levels, but should not be considered when evaluating the reasonableness of advisory fees. The Board also noted the absence of any applicable regulatory or industry guidelines on economies of scale, which is compounded by the lack of any uniform methodology or pattern with respect to structuring fund advisory fees with breakpoints that serve to reduce the fees as a fund attains a certain size.
The Board considered information regarding the compensation and other ancillary (or “fall-out”) benefits that Federated Hermes derived from its relationships with the Federated Hermes Funds. The Board noted that, in addition to receiving advisory fees under the Federated Hermes Funds’ investment advisory contracts, Federated Hermes’ affiliates also receive fees for providing other services to the Federated Hermes Funds under separate service contracts including for serving as the Federated Hermes Funds’ administrator and distributor. In this regard, the Board considered that Federated Hermes’ affiliates provide distribution and shareholder services to the Federated Hermes Funds, for which they may be compensated through distribution and servicing fees paid pursuant to Rule 12b-1 plans or otherwise. The Board also received and considered information detailing the benefits, if any, that Federated Hermes may derive from its receipt of research services from brokers who execute portfolio trades for the Federated Hermes Funds.
The Board considered: (i) the CCO’s conclusion that his observations and the information accompanying the CCO Fee Evaluation Report show that the management fee for the Fund is reasonable; and (ii) the CCO’s recommendation that the Board approve the management fee. The Board noted that, under these circumstances, no changes were recommended to, and no objection was raised to the continuation of, the Contract by the CCO. The CCO also recognized that the Board’s evaluation of the Federated Hermes Funds’ advisory and sub-advisory arrangements is a continuing and ongoing process that is informed by the information that the Board requests and receives from management throughout the course of the year and, in this regard, the CCO noted certain items, and management has committed to reviewing certain items, for future reporting to the Board as the Board continues its ongoing oversight of the Federated Hermes Funds.
On the basis of the information and factors summarized above, among other information and factors deemed relevant by the Board, and the evaluation thereof, the Board, including the Independent Trustees, unanimously voted to approve the continuation of the Contract. The Board based its determination to approve the Contract on the totality of the circumstances and relevant factors and with a view of past and future long-term considerations. Not all of the factors and considerations identified above were necessarily deemed to be relevant to the Fund, nor did the Board consider any one of them to be determinative.
Annual Financial Statements and Additional Information
Mutual funds are not bank deposits or obligations, are not guaranteed by any bank and are not insured or guaranteed by the U.S. government, the Federal Deposit Insurance Corporation, the Federal Reserve Board or any other government agency. Investment in mutual funds involves investment risk, including the possible loss of principal.
This information is authorized for distribution to prospective investors only when preceded or accompanied by the Fund’s Prospectus, which contains facts concerning its objective and policies, management fees, expenses and other information.
Federated Hermes MDT Mid Cap Growth Fund
Federated Hermes Funds
4000 Ericsson Drive
Warrendale, PA 15086-7561
Contact us at FederatedHermes.com/us
or call 1-800-341-7400.
Federated Securities Corp., Distributor
CUSIP 314172107
CUSIP 314172305
CUSIP 314172198
CUSIP 314172529
© 2024 Federated Hermes, Inc.
| Item 8. | Changes in and Disagreements with Accountants for Open-End Management Investment Companies |
Federated Hermes Kaufmann Fund: Not Applicable.
Federated Hermes Kaufmann Large Cap Fund: Not Applicable.
Federated Hermes Kaufmann Small Cap Fund: Not Applicable.
Federated Hermes MDT Mid Cap Growth Fund: Not Applicable.
| Item 9. | Proxy Disclosures for Open-End Management Investment Companies. |
Federated Hermes Kaufmann Fund: The Fund’s report on its most recent meeting of shareholders is filed under Item 7 of this form.
Federated Hermes Kaufmann Large Cap Fund: The Fund’s report on its most recent meeting of shareholders is filed under Item 7 of this form.
Federated Hermes Kaufmann Small Cap Fund: The Fund’s report on its most recent meeting of shareholders is filed under Item 7 of this form.
Federated Hermes MDT Mid Cap Growth Fund: The Fund’s report on its most recent meeting of shareholders is filed under Item 7 of this form.
| Item 10. | Remuneration Paid to Directors, Officers, and Others of Open-End Management Investment Companies. |
Federated Hermes Kaufmann Fund: The Fund’s disclosure of remuneration items is included as part of the Financial Statements filed under Item 7 of this form.
Federated Hermes Kaufmann Large Cap Fund: The Fund’s disclosure of remuneration items is included as part of the Financial Statements filed under Item 7 of this form.
Federated Hermes Kaufmann Small Cap Fund: The Fund’s disclosure of remuneration items is included as part of the Financial Statements filed under Item 7 of this form.
Federated Hermes MDT Mid Cap Growth Fund: The Fund’s disclosure of remuneration items is included as part of the Financial Statements filed under Item 7 of this form.
| Item 11. | Statement Regarding Basis for Approval of Investment Advisory Contract. |
Federated Hermes Kaufmann Fund: The Fund’s Evaluation and Approval of Advisory Contract summary by fund appear in the Financial Statements filed under Item 7 of this form.
Federated Hermes Kaufmann Large Cap Fund: The Fund’s Evaluation and Approval of Advisory Contract summary by fund appear in the Financial Statements filed under Item 7 of this form.
Federated Hermes Kaufmann Small Cap Fund: The Fund’s Evaluation and Approval of Advisory Contract summary by fund appear in the Financial Statements filed under Item 7 of this form.
Federated Hermes MDT Mid Cap Growth Fund: The Fund’s Evaluation and Approval of Advisory Contract summary by fund appear in the Financial Statements filed under Item 7 of this form.
| Item 12. | Disclosure of Proxy Voting Policies and Procedures for Closed-End Management Investment Companies |
Not Applicable
| Item 13. | Portfolio Managers of Closed-End Management Investment Companies. |
Not Applicable
| Item 14. | Purchases of Equity Securities by Closed-End Management Investment Company and Affiliated Purchasers. |
Not Applicable
| Item 15. | Submission of Matters to a Vote of Security Holders. |
No Changes to Report
| Item 16. | Controls and Procedures. |
(a) The registrant’s Principal Executive Officer and Principal Financial Officer have concluded that the registrant’s disclosure controls and procedures (as defined in Rule 30a-3(c) under the Act) are effective in design and operation and are sufficient to form the basis of the certifications required by Rule 30a-(2) under the Act, based on their evaluation of these disclosure controls and procedures as of a date within 90 days of the filing date of this report on Form N-CSR.
(b) There were no changes in the registrant’s internal control over financial reporting (as defined in Rule 30a-3(d) under the Act) during the period covered by this report that have materially affected, or are reasonably likely to materially affect, the registrant’s internal control over financial reporting.
| Item 17. | Disclosure of Securities Lending Activities for Closed-End Management Investment Companies. |
Not Applicable
| Item 18. | Recovery of Erroneously Awarded Compensation |
(a) Not Applicable
(b) Not Applicable
(a)(1) Not Applicable.
(a)(2) Not Applicable.
(a)(3) Certifications of Principal Executive Officer and Principal Financial Officer.
(a)(4) Not Applicable.
(a)(5) Not Applicable.
(b) Certifications pursuant to 18 U.S.C. Section 1350.
SIGNATURES
Pursuant to the requirements of the Securities Exchange Act of 1934 and the Investment Company Act of 1940, the registrant has duly caused this report to be signed on its behalf by the undersigned, thereunto duly authorized.
Registrant: Federated Hermes Equity Funds
By: /s/ Jeremy D. Boughton
Jeremy D. Boughton, Principal Financial Officer
Date: December 23, 2024
Pursuant to the requirements of the Securities Exchange Act of 1934 and the Investment Company Act of 1940, this report has been signed below by the following persons on behalf of the registrant and in the capacities and on the dates indicated.
By: /s/ J. Christopher Donahue
J. Christopher Donahue, Principal Executive Officer
Date: December 23, 2024
By: /s/ Jeremy D. Boughton
Jeremy D. Boughton, Principal Financial Officer
Date: December 23, 2024