

AMEX: MSL
12th Annual Burkenroad Reports
Investment Conference
New Orleans Sheraton Hotel
April 25, 2008
__________________________________________________________________________________________________________
C.R. “Rusty Cloutier
President & Chief Executive Officer
J. Eustis Corrigan, Jr.
Executive Vice President and Chief Financial Officer

The Private Securities Litigation Act of 1995 provides a safe harbor for
disclosure of information about a company’s anticipated future financial
performance. This act protects a company from unwarranted litigation if
actual results differ from management expectations. This discussion and
analysis reflects management’s current views and estimates of future
economic circumstances, industry conditions, MidSouth’s performance
and financial results. A number of factors and uncertainties could cause
actual results to differ from the anticipated results and expectations
expressed in the discussion.

Growth-oriented, bank holding company
Headquarters: Lafayette, Louisiana
Employees: 423 ● Locations: 34 ● ATMs: 120+
Market Statistics as of March 31, 2008:
> Total Assets: $937 Million
> Market Cap: $142.8 Million
> Stock Price: $18.70 ● Book Value: $10.65
> Shares Outstanding: 6.6 Million
> Insider Ownership: 41% ● Institutional Ownership: 7%
Corporate Profile

Corporate Profile
CORPORATE HISTORY
1985 - Chartered as a National Bank
1987 - Acquired Breaux Bridge Bank & Trust (LA)
1989 - Acquired Commerce & Energy Bank (LA)
1993 - Listed on AMEX: MSL
1995 - Acquired Sugarland State Bank (LA)
2004 - Acquired Lamar Bank (Beaumont, TX)
BUSINESS FUNDAMENTALS
• Small business focus supported by retail and commercial funding
• Experienced leadership
• Entrepreneurial management style
• Organic growth
• Quality relationships

MidSouth Bank is proud to be a part of
The Burkenroad
Reports!
CONGRATULATIONS
on 12 Great Years!
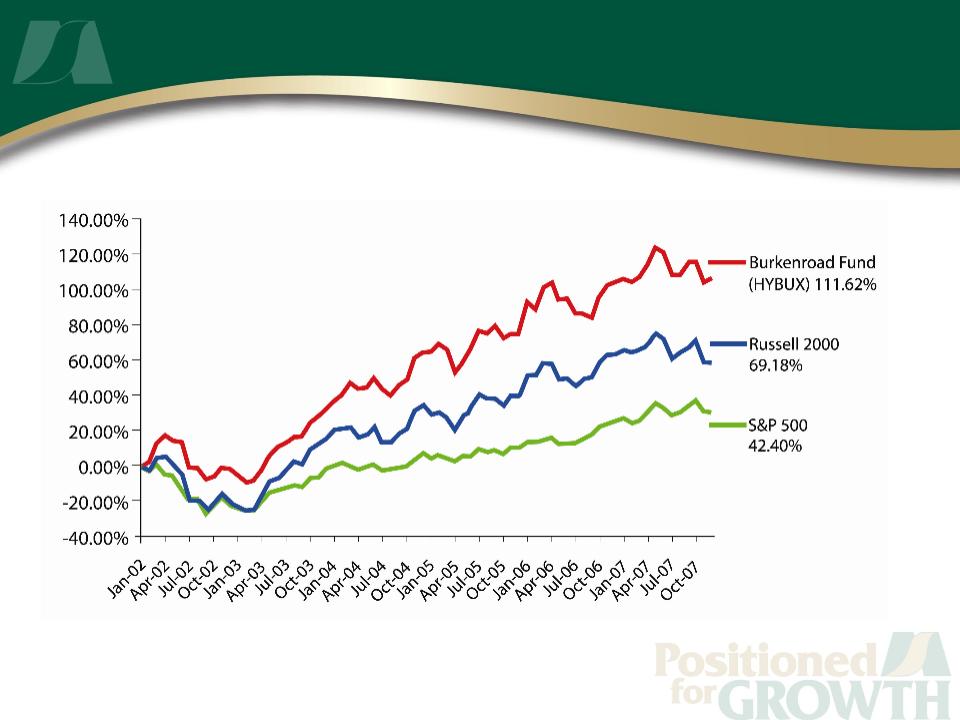
Outstanding Performance
Burkenroad Fund - 5 Year

Peter Ricchiuti
Founder & Director of Research
BURKENROAD REPORTS
BURKENROAD REPORTS
Special Thanks

Karen
Hail
Executive Vice President
MIDSOUTH BANK
Special Thanks

CONGRATULATIONS
Karen Hail
was named as one of
the 25 Most Powerful
Women in Banking
Women in Banking
by US Banker Magazine
in 2007!
Special Thanks

Special Thanks
Dr. Joe
Hargroder
Founding Board Member
MIDSOUTH BANK

You have been the
CORNERSTONE
CORNERSTONE
of MidSouth Bank’s
success!
Always the ANCHOR of
our team, you represent the
HEART & SOUL of MidSouth!
Special Thanks

13
Strategic Focus
Profitable Growth
&
&
Expansion
Operational
Enhancement
Capital & Funds
Management
Maximize
Shareholder Value
Human
Capital
§Target Markets
§Existing Growth Markets
§Focus on TX/LA Footprint
§“Buy & Build”
Opportunities
§Preserve Culture
§CRM Implementation
§Expense Governance
§Vendor Management
§Charter Merger
§Maintain Sound Capital
Levels
Levels
§ Asset Quality Management
§Focus on Deposit Mix
Versus Competing on Price
Versus Competing on Price
§Retain Veteran Team
§Compensation Structure
§Strategic Initiatives
§Strengthen Infrastructure

Financial Performance
INCOME STATEMENT | 1Q07 | 4Q07 | 1Q08 | Linked QTR % Change |
Net Interest Income | 8,338 | 9,613 | 9,274 | -3.5% |
Loan Loss Provision | 0 | 525 | 1,200 | 128.6% |
Total Non-Interest Income | 3,263 | 3,732 | 3,587 | -3.9% |
Total Non-Interest Expense | 9,079 | 10,569 | 10,293 | -2.6% |
Income Tax Expense | 576 | 357 | 169 | -52.7% |
Net Income | 1,946 | 1,894 | 1,199 | -36.7% |
EPS | $0.29 | $0.28 | $0.18 | -35.7% |

Financial Performance
BALANCE SHEET | 1Q07 | 4Q07 | 1Q08 | Linked QTR % Change |
Total Assets | 814,660 | 854,056 | 937,030 | 9.7% |
Total Loans | 510,561 | 569,506 | 569,745 | .04% |
Premises and Equipment | 31,488 | 39,229 | 39,967 | 1.9% |
Total Deposits | 728,839 | 733,517 | 818,004 | 11.5% |
Total Shareholders' Equity | 61,676 | 68,469 | 70,331 | 2.7% |
16
Financial Performance
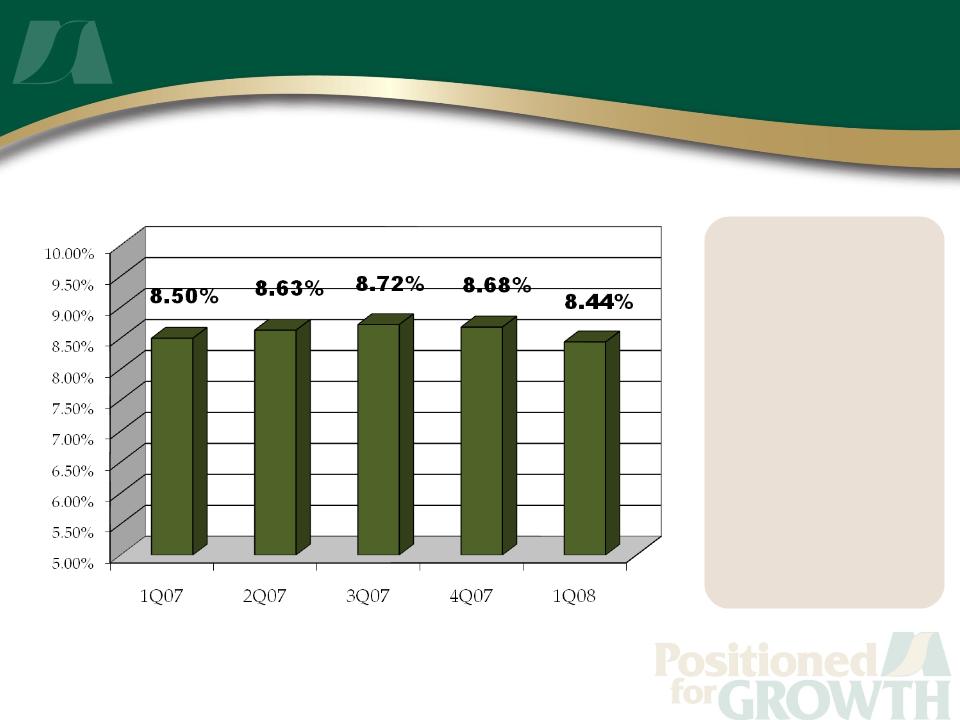
Sound Capital
Levels
▪ 5 Quarter Average
Leverage Ratio
8.59%
8.59%
▪ Dividend Payout
Ratio 25%
▪ Dividend Yield
1.36
Leverage Ratio

Financial Performance
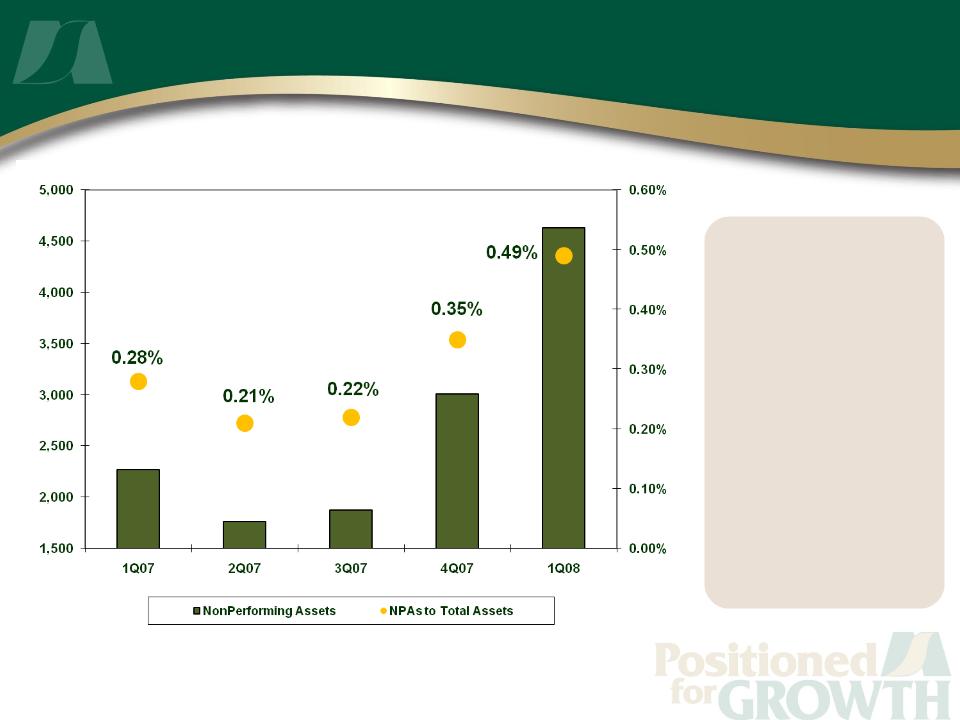
CREDIT QUALITY | 1Q07 | 4Q07 | 1Q08 | Linked QTR bps Change |
Allowance as a % of TTL Lns | 0.96% | 0.99% | 1.08% | 9 bps |
NPA's to Total Assets | 0.28% | 0.35% | 0.49% | 14 bps |
Net YTD Charge-offs to TTL Lns | 0.02% | 0.09% | 0.12% | 3 bps |
18
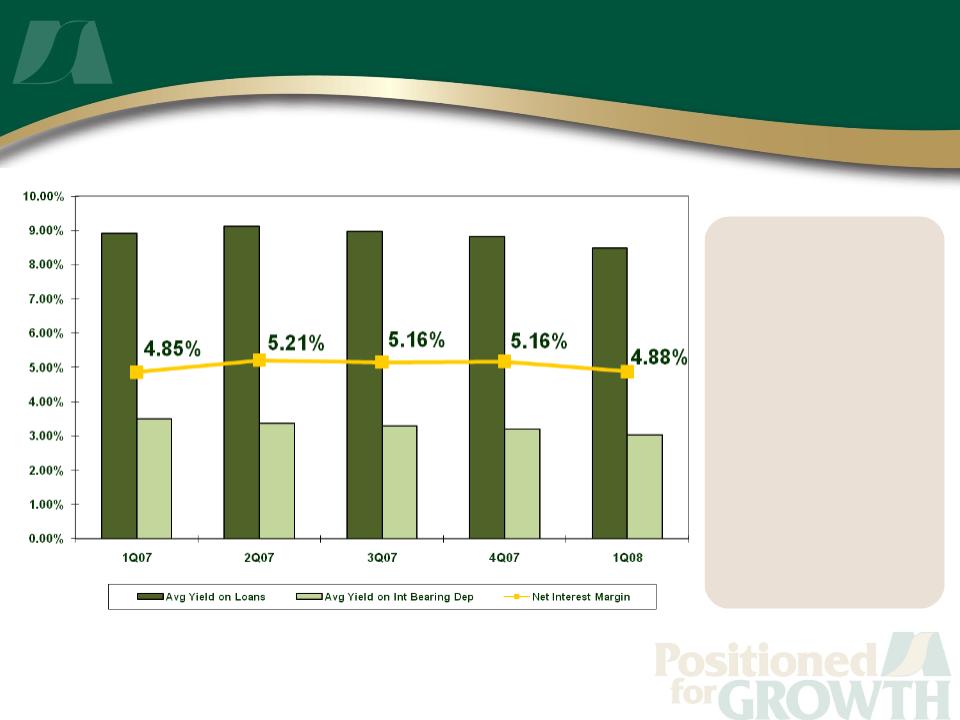
Yields
▪ Consistent NIM
▪ Active
management of
Loan/Deposit
Pricing
management of
Loan/Deposit
Pricing
Financial Performance
19
Asset
Quality
▪ Engaged & Focused
on Regional
Economies
on Regional
Economies
▪ Experienced and
Accomplished
Management & Board
Accomplished
Management & Board
Financial Performance
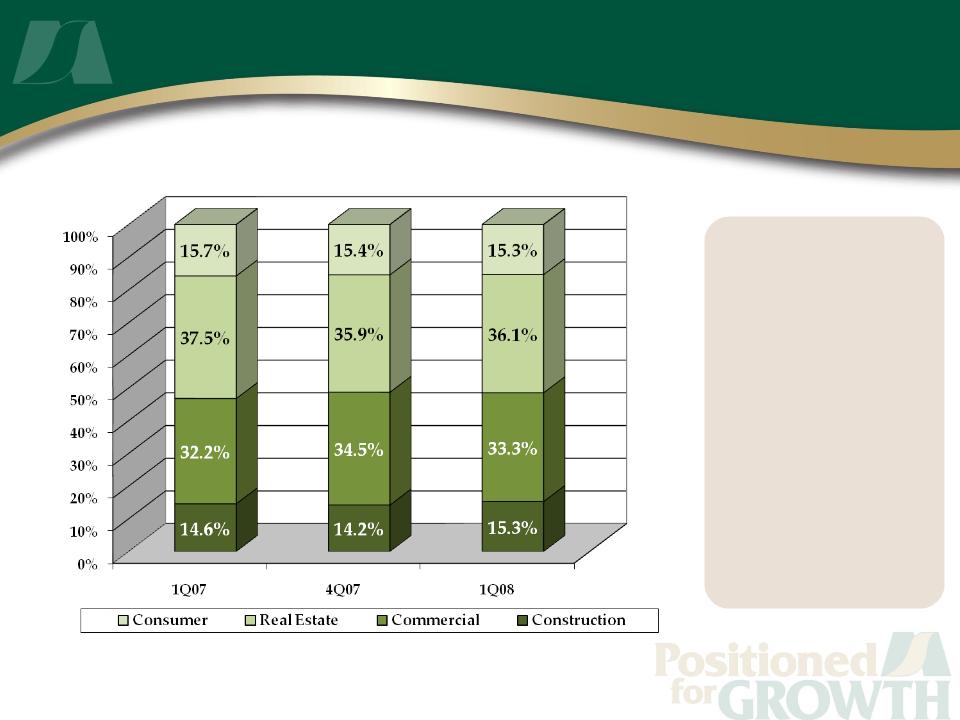
Financial Performance
1Q07 to
1Q08
Loan Mix
1Q08
Loan Mix
§ Diversified Loan
Portfolio
Portfolio
§ C&I Customers
Diversified by
Industry &
Geography
Diversified by
Industry &
Geography
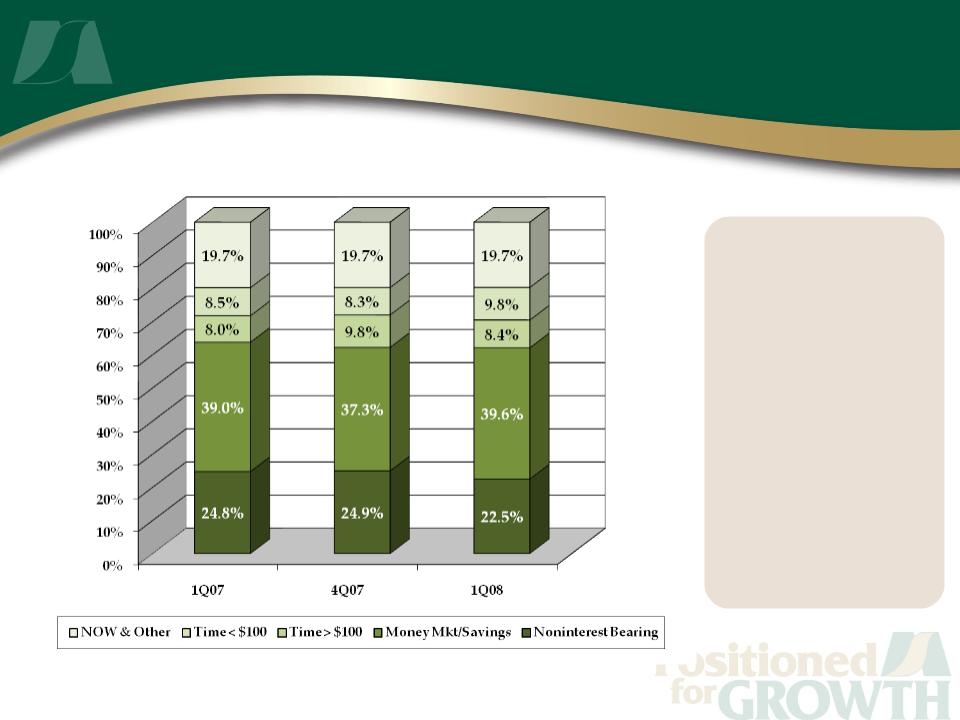
Financial Performance
1Q07 to
1Q08
Deposit Mix
1Q08
Deposit Mix
§ Strong & Stable
Core Funding
Source
Core Funding
Source
§ Maintaining
Solid Non-Interest
Bearing Base
Solid Non-Interest
Bearing Base
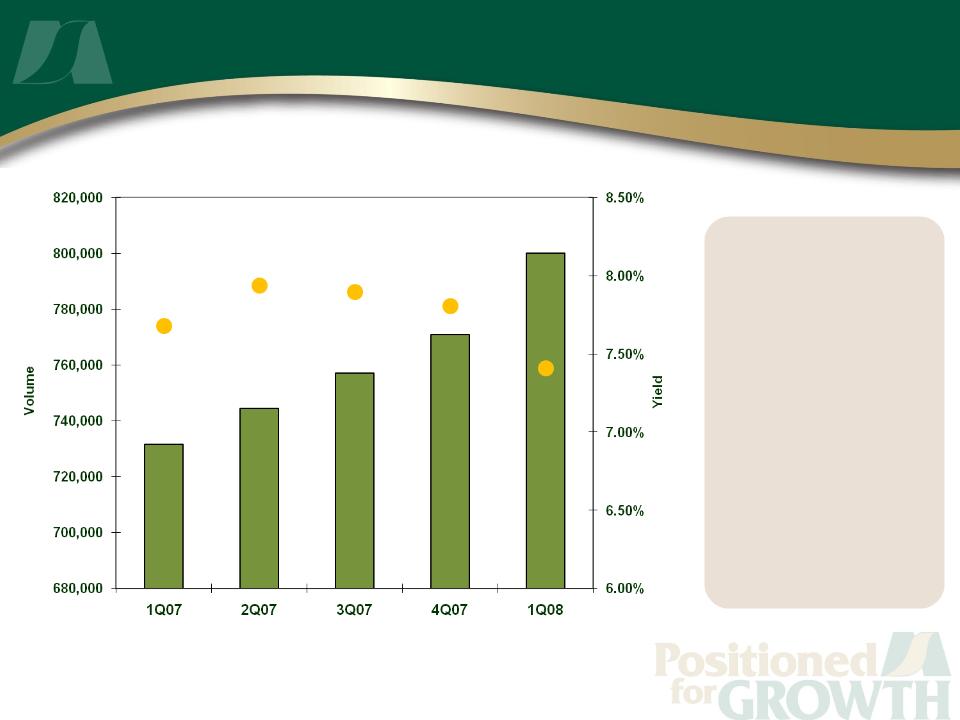
Earning
Assets
▪ Premium Yield
on Average
Earning Assets
on Average
Earning Assets
▪ Capacity to
Leverage Yield
Financial Performance
7.68%
7.94%
7.80%
7.90%
7.41%
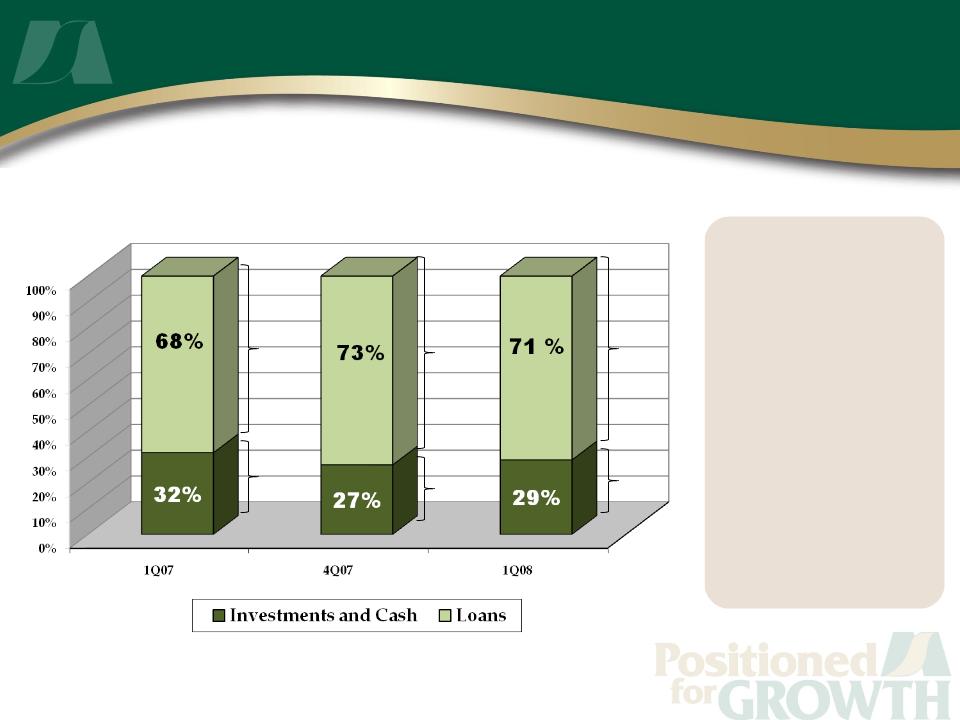
Earning
Asset Mix
▪ Stability in
Earning Assets
▪ Liquidity/Funding
Position
Financial Performance
4.96%
5.09%
4.74%
8.91%
8.82%
8.48%
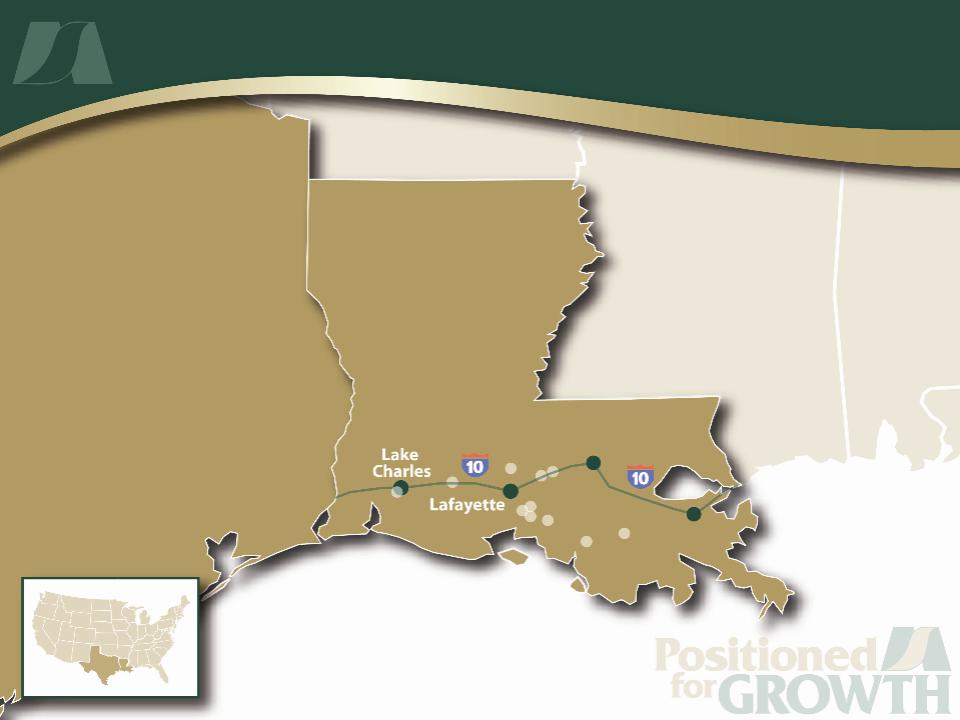
Franchise Footprint 2003
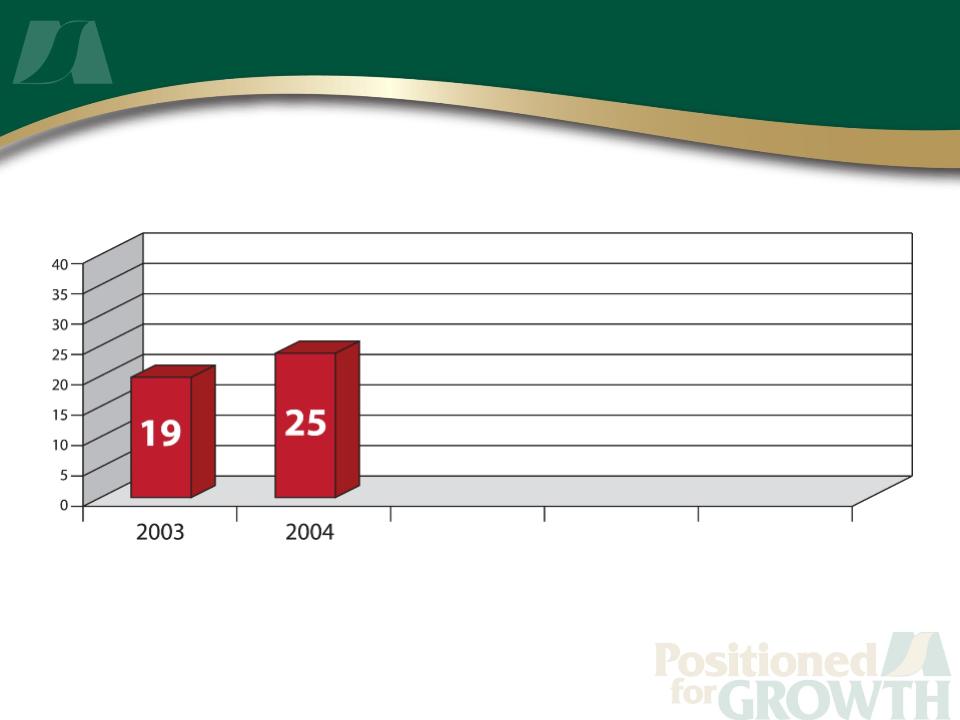
25
Franchise Expansion
Locations
2004
• Beaumont (3), Vidor, Conroe, College Station
• Expansion into Texas
26
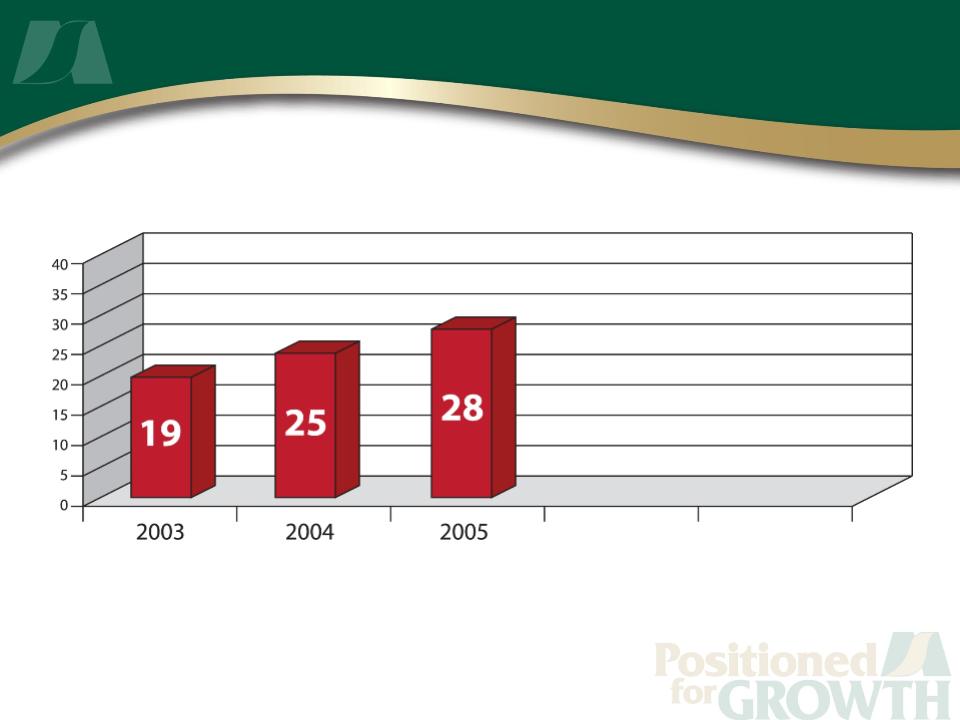
Franchise Expansion
Locations
2005
Baton Rouge
Houma (SE Louisiana)
Lafayette (8th location)
27
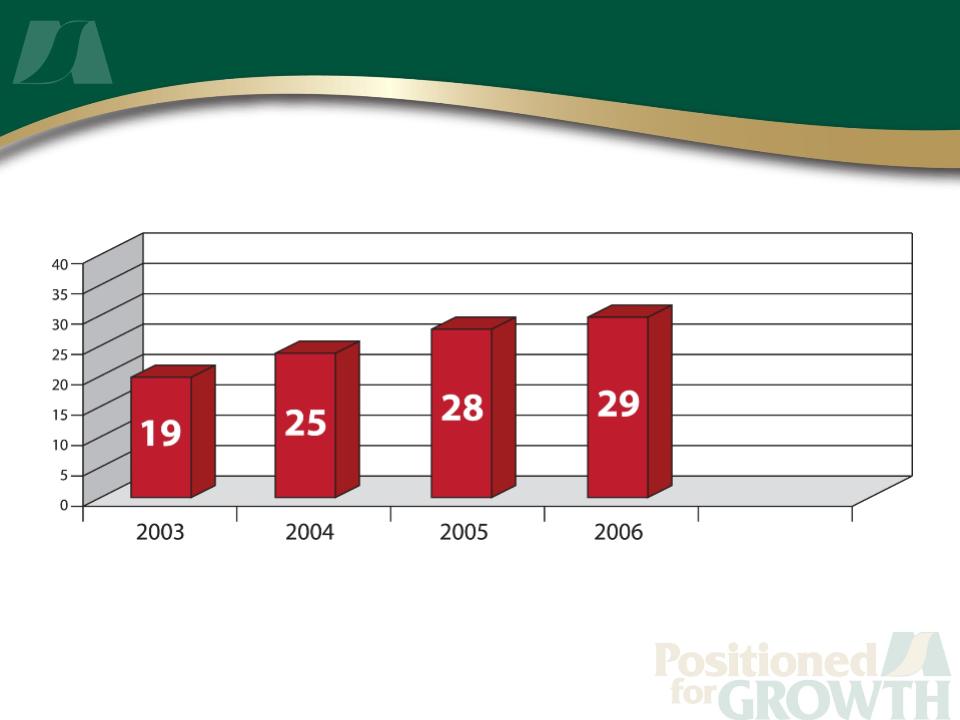
Franchise Expansion
Locations
2006
Lafayette (9th location)
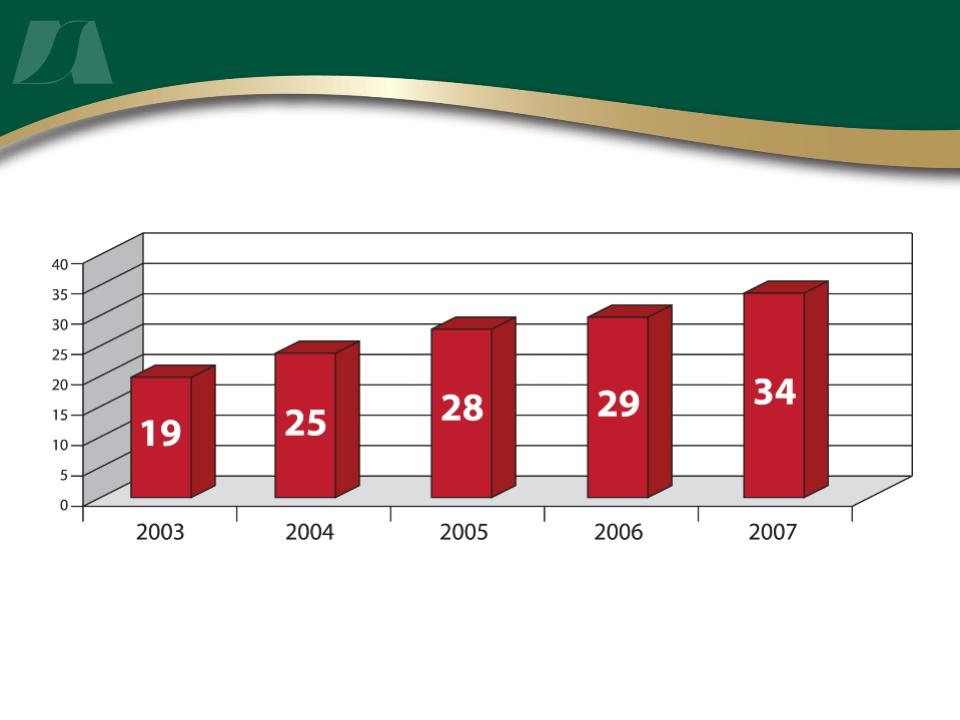
Franchise Expansion
Locations
2007
TEXAS: Houston, Conroe*, College Station
LOUISIANA: Baton Rouge (2nd location),
Lake Charles (2nd location), Thibodaux*, Cut Off
*Relocation
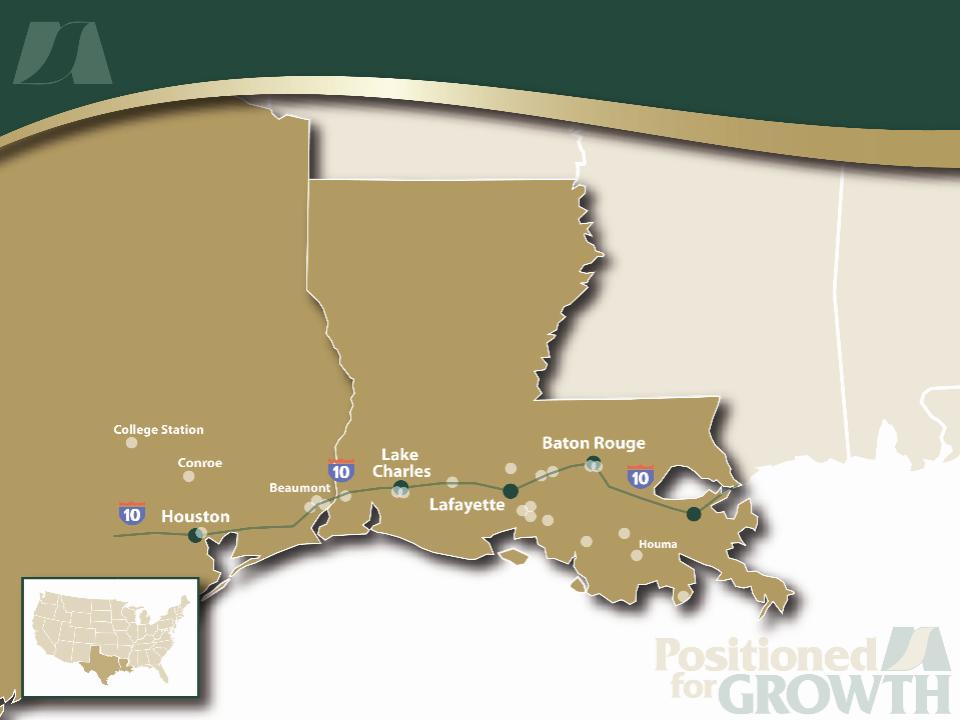
Franchise Footprint 2008
30
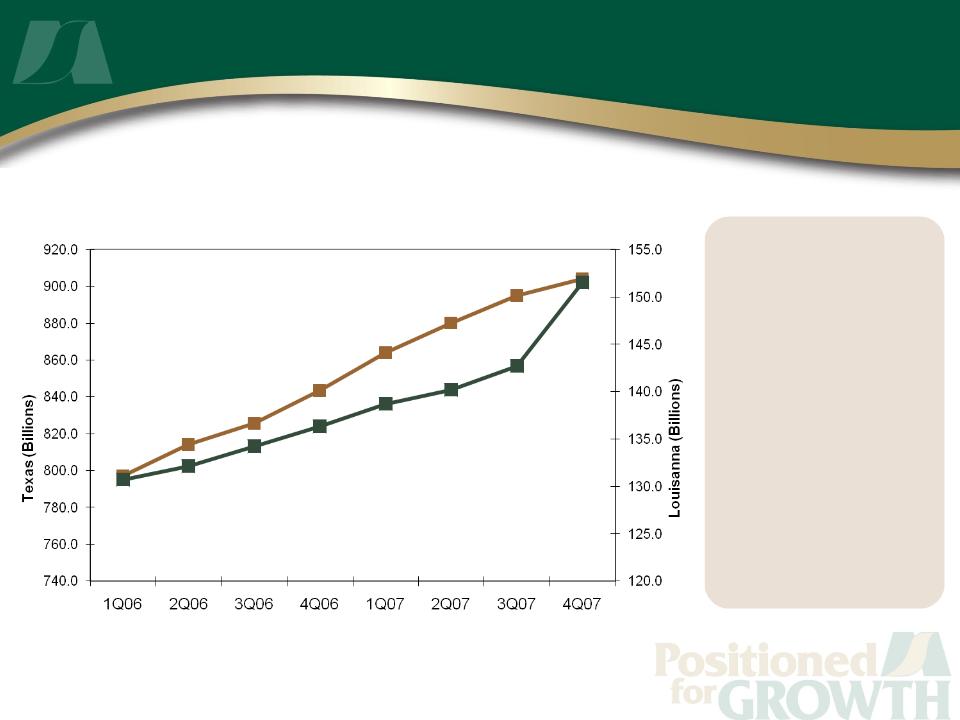
Personal Income Growth
Quarterly
Personal
Income
▪ Sustained
Income
Growth
Source: Federal Reserve Bank of Dallas
LOUISIANA
TEXAS
31
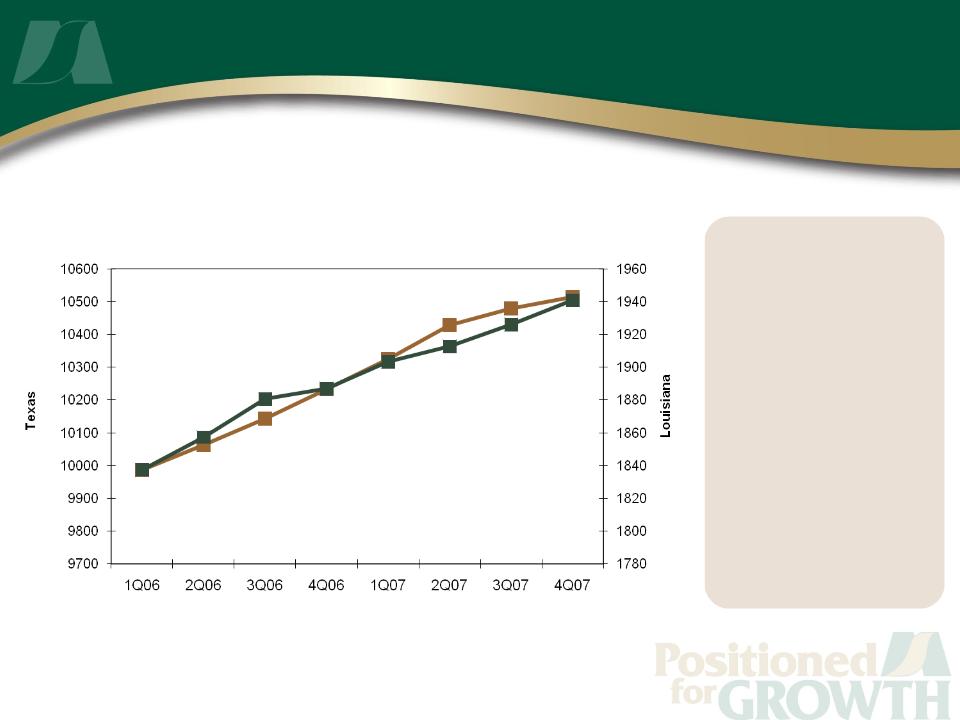
Employment Growth
Total
Non-Farm
Employment
▪ Sustained
Employment
Growth
Source: Federal Reserve Bank of Dallas
LOUISIANA
TEXAS
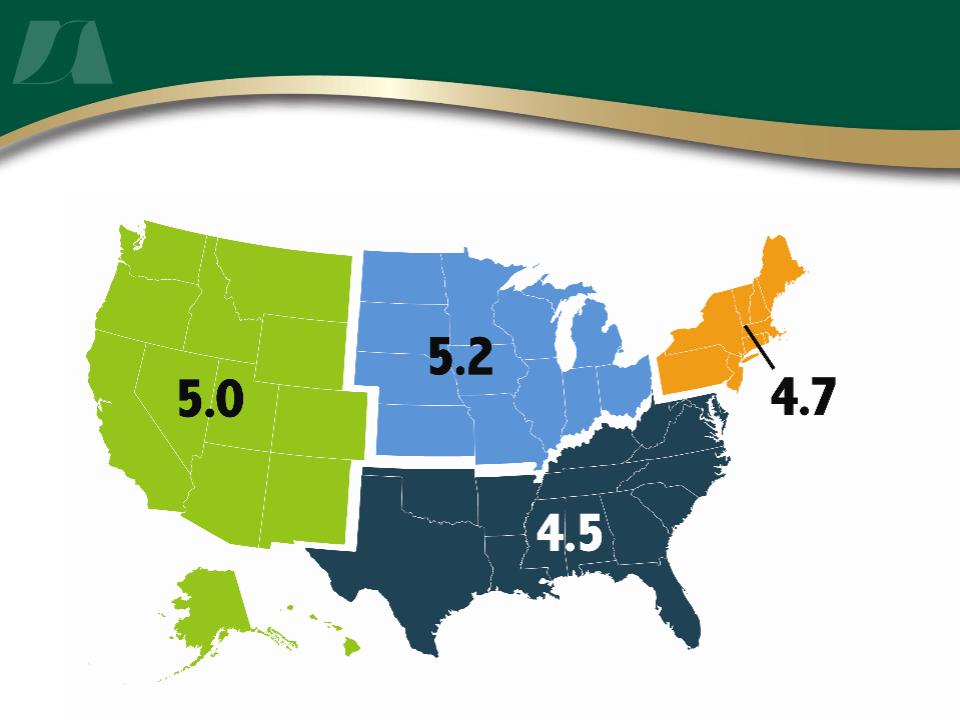
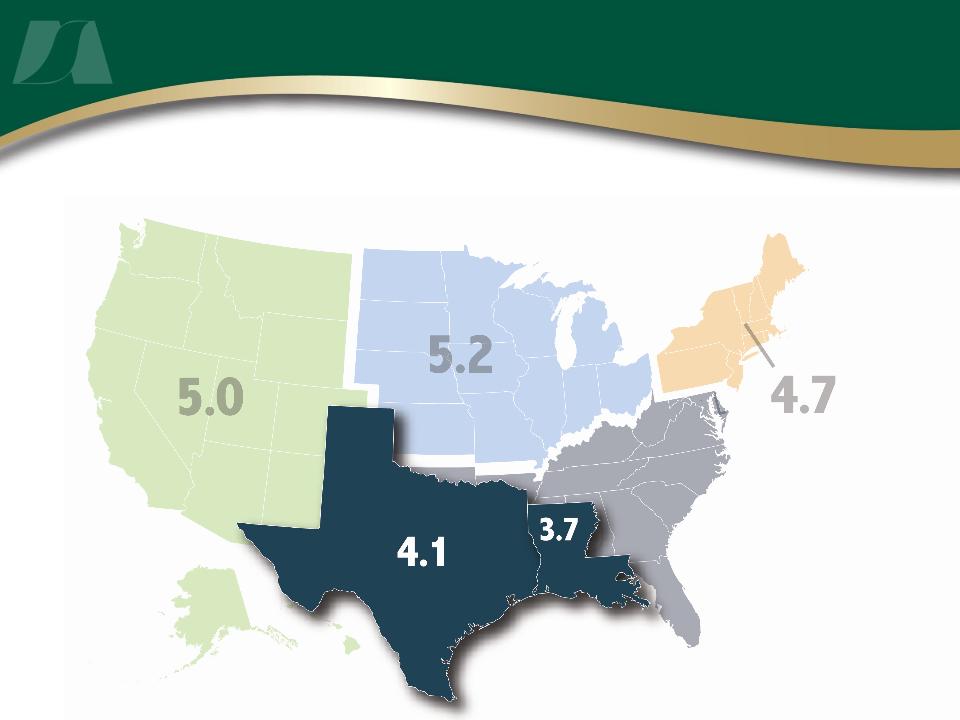
Unemployment Rates
Source: US Bureau of Labor Statistics (as of February 2008)
Unemployment Rates
Source: US Bureau of Labor Statistics (as of February 2008)

Unemployment Rates
Market MSAs | Sep-07 | Oct-07 | Nov-07 | Dec-07 | Jan-08 | Feb-08 |
Louisiana | 3.9 | 3.6 | 3.7 | 4.0 | 4.0 | 3.7 |
Baton Rouge | 4.1 | 2.9 | 2.9 | 3.5 | 4.5 | 3.4 |
Houma | 2.9 | 2.0 | 2.2 | 2.5 | 3.4 | 2.5 |
Lafayette | 3.1 | 2.1 | 2.3 | 2.6 | 3.4 | 2.6 |
Lake Charles | 4.3 | 2.9 | 3.0 | 3.7 | 4.8 | 3.6 |
Texas | 4.3 | 4.3 | 4.2 | 4.2 | 4.3 | 4.1 |
Beaumont | 5.6 | 4.9 | 5.3 | 5.9 | 6.2 | 5.5 |
College Station | 3.7 | 3.2 | 3.4 | 3.3 | 3.8 | 3.4 |
Houston | 4.3 | 3.8 | 4.0 | 4.2 | 4.5 | 4.2 |
MSA Average | 4.0 | 3.1 | 3.3 | 3.7 | 4.4 | 3.6 |
Source: US Bureau of Labor Statistics

Occupation % Chg in Avg Wage*
Carpenters 70.9%
Electricians 18.7%
Engineers 14.1%
Helpers 35.2%
Plumbers 21.9%
Technicians 41.4%
Total 39.6%
*2005 to 2006
Wage Growth
Supply and Demand - Construction Labor Wage Impact
Source: La. Economic Outlook: 2008 and 2009
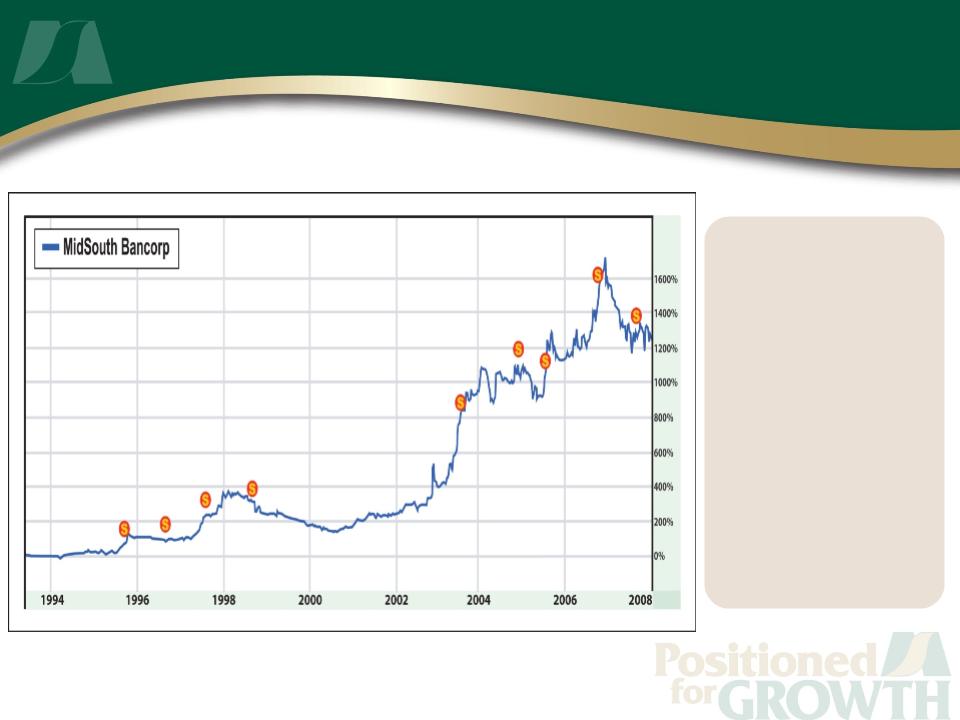
Historical
Stock
Performance
▪ Life to Date
Growth
Stock Performance
Source: Finance.Yahoo.com - April 26, 1993 - April 21, 2008
April 1993 - April 2008
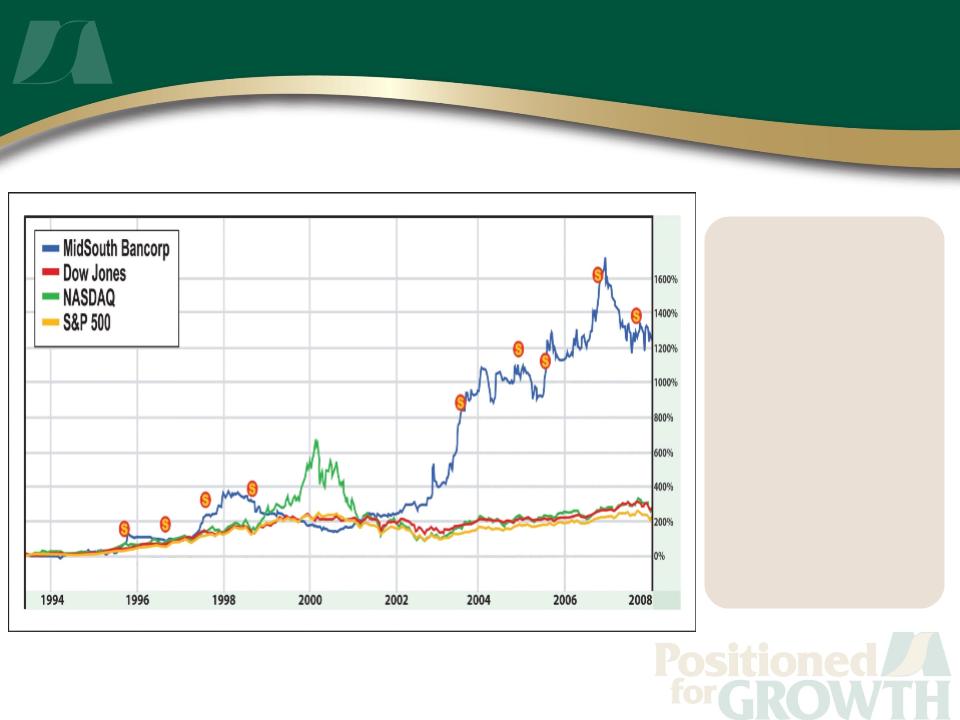
Relative
Stock
Performance
▪ MSL vs.
Major Indexes
▪ Life to Date
Growth
Stock Performance
Source: Finance.Yahoo.com - April 26, 1993 - April 21, 2008
April 1993 - April 2008

38
SUMMARY
• Regional Strategic Growth Model
• Focused & Driven Leadership
• Superior Financial Performance and Focus on Credit Quality
• Excellent Shareholder Returns
MidSouth Bancorp