1Q17 Energy Update

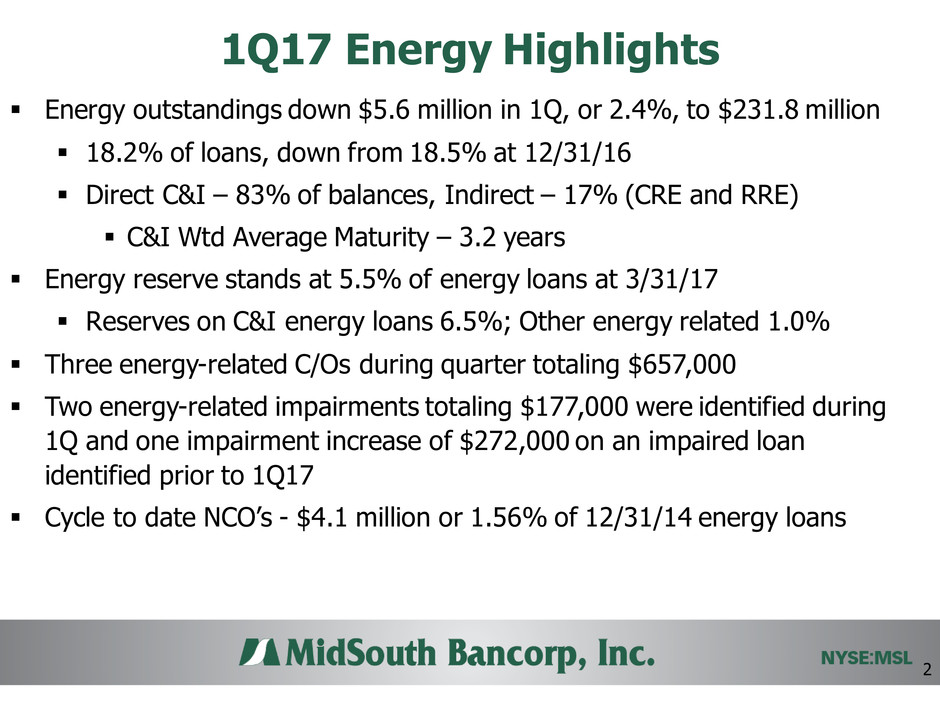
1Q17 Energy Highlights Energy outstandings down $5.6 million in 1Q, or 2.4%, to $231.8 million 18.2% of loans, down from 18.5% at 12/31/16 Direct C&I – 83% of balances, Indirect – 17% (CRE and RRE) C&I Wtd Average Maturity – 3.2 years Energy reserve stands at 5.5% of energy loans at 3/31/17 Reserves on C&I energy loans 6.5%; Other energy related 1.0% Three energy-related C/Os during quarter totaling $657,000 Two energy-related impairments totaling $177,000 were identified during 1Q and one impairment increase of $272,000 on an impaired loan identified prior to 1Q17 Cycle to date NCO’s - $4.1 million or 1.56% of 12/31/14 energy loans 2

1Q17 Energy Highlights (cont’d) Total criticized energy loans 48.1% of total energy loans vs. 50.2% at 12/31/16 Total criticized down $7.7 million to $111.5 million (down 6.5%) Seven energy-related rating changes during quarter 1 relationship downgraded to Special Mention (SM) - $108,000 5 relationships downgraded to Substandard (SS) - $23.4 Million 1 relationship totaling $438,000 was upgraded to Pass 2 Shared National Credits – $14.2 million or 6.1% of energy loans Unfunded Commitments – Only 20% of outstanding balances $45.5 million at 3/31/17 - Utilization rate of 56.7% vs. 50.7% at 12/31/16 The increased utilization rate was impacted by a $13.9 million decrease in original lines and a $0.8 million increase in ending balances A/R – 82% of commitments, Equipment 11%, CRE 2% A/R customers have lockbox agreements and/or at minimum provide monthly borrowing base certificates Houston non-owner occupied CRE - $32.0 million, 2.5% of total loans 3

Energy Portfolio as of 03/31/2017 (*) *Includes loans where the borrower's ability to repay could be disproportionately impacted by prolonged low oil and gas prices ($’s in Millions) 4 Collateral Total $’s (Millions) % of Energy Portfolio # of Loans # of Relationships Avg $ per Relationship Wt'd Avg Maturity (Yrs) Accounts Receivables $ 51.7 22.3% 64 60 $ 0.9 0.2 Barges, Crew Boats, Marine Vessels 61.1 26.3% 30 22 2.8 5.7 Equipment 73.0 31.5% 170 83 0.9 3.3 Inventory 2.0 0.9% 6 6 0.3 2.1 CD/Mkt. Securities 2.2 0.9% 17 12 0.2 0.8 All Other 3.2 1.4% 90 79 0.0 0.0 Sub Total C & I 193.1 83.3% 377 262 $ 0.7 3.2 Commercial Real Estate 34.9 15.1% 65 55 0.6 11.0 Consumer Real Estate 3.4 1.5% 43 38 0.1 10.9 Other 0.4 0.2% 20 20 0.0 0.0 Sub Total Non C & I $ 38.7 16.7% 128 113 $ 0.3 10.9 Total $ 231.8 100.0% 505 375 $ 0.6 4.5

Past Due Energy Loans as of 03/31/2017 (*) *Includes loans where the borrower's ability to repay could be disproportionately impacted by prolonged low oil and gas prices > 30 days + nonaccruals = 12.40% of energy loans ($’s in Millions) 5 Collateral Total $’s (Millions) % of Energy Portfolio Total Past Due $’s (Millions) % of Energy Portfolio 0-29 30-59 60-89 90+ Non- Accruals Accounts Receivables $ 51.7 22.3% $ 10.69 4.6% $ 9.35 - - - $ 1.35 Barges, Crew Boats, Marine Vessels 61.1 26.3% 23.43 10.1% 4.86 0.30 - - 18.27 Equipment 73.0 31.5% 7.80 3.4% 0.81 0.58 0.54 0.37 5.50 Commercial Real Estate 34.9 15.1% 1.62 0.7% - - - - 1.62 Consumer Real Estate 3.4 1.5% 0.61 0.3% 0.41 - - - 0.20 Inventory 2.0 0.9% 0.50 0.2% 0.50 - - - - CD/Mkt. Securities 2.2 0.9% 0.34 0.1% 0.34 - - - - All Other 3.6 1.5% 0.53 0.2% 0.52 0.01 - - 0.01 Total $ 231.8 100.0% $ 45.53 19.6% $ 16.79 $ 0.89 $ 0.54 $0.37 $ 26.95 Accruing – Past Due ($ Millions)

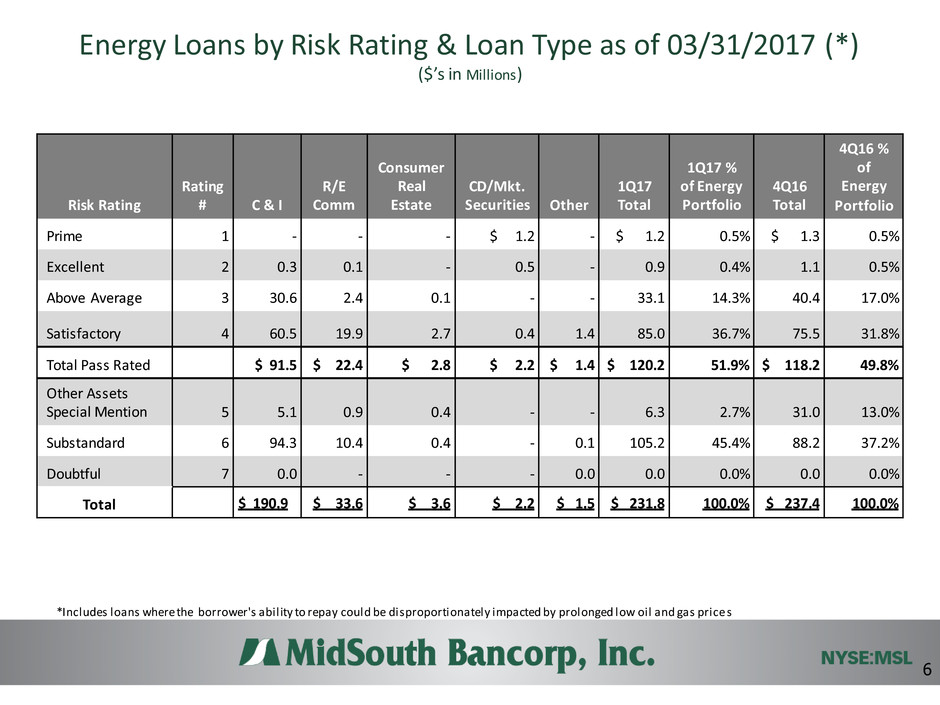
Energy Loans by Risk Rating & Loan Type as of 03/31/2017 (*) ($’s in Millions) *Includes loans where the borrower's ability to repay could be disproportionately impacted by prolonged low oil and gas price s 6 Risk Rating Rating # C & I R/E Comm Consumer Real Estate CD/Mkt. Securities Other 1Q17 Total 1Q17 % of Energy Portfolio 4Q16 Total 4Q16 % of Energy Portfolio Prime 1 - - - $ 1.2 - $ 1.2 0.5% $ 1.3 0.5% Excellent 2 0.3 0.1 - 0.5 - 0.9 0.4% 1.1 0.5% Above Average 3 30.6 2.4 0.1 - - 33.1 14.3% 40.4 17.0% Satisfactory 4 60.5 19.9 2.7 0.4 1.4 85.0 36.7% 75.5 31.8% Total Pass Rated $ 91.5 $ 22.4 $ 2.8 $ 2.2 $ 1.4 $ 120.2 51.9% $ 118.2 49.8% Other Assets Special Mention 5 5.1 0.9 0.4 - - 6.3 2.7% 31.0 13.0% Substandard 6 94.3 10.4 0.4 - 0.1 105.2 45.4% 88.2 37.2% Doubtful 7 0.0 - - - 0.0 0.0 0.0% 0.0 0.0% Total $ 190.9 $ 33.6 $ 3.6 $ 2.2 $ 1.5 $ 231.8 100.0% $ 237.4 100.0%

Energy Loans by Risk Rating & Collateral as of 03/31/2017 (*) ($’s in Millions) *Includes loans where the borrower's abil ity to repay could be disproportionately impacted by prolonged low oil and gas prices 7 Collateral Pass Other Assets Special Mention Substandard Doubtful 1Q17 Total 1Q17 % of Energy Portfolio 4Q16 Total 4Q16 % of Energy Portfolio Accounts Receivables $ 18.8 $ 1.9 $ 30.9 - $ 51.7 22.3% $ 47.0 19.8% Barges, Crew Boats, Marine Vessels 22.5 - 38.6 - 61.1 26.3% 64.1 27.0% Equipment 45.7 3.2 24.0 - 73.0 31.5% 72.9 30.7% Commercial Real Estate 23.6 0.9 10.4 - 34.9 15.1% 41.4 17.4% Real Estate 2.6 0.4 0.4 - 3.4 1.5% 3.5 1.5% Inventory 1.5 - 0.5 - 2.0 0.9% 2.2 0.9% CD Secured 2.2 - - - 2.2 0.9% 2.2 0.9% All Other 3.3 0.0 0.2 0.0 3.5 1.5% 4.0 1.7% Total $ 120.2 $ 6.3 $ 105.2 $ 0.0 $ 231.8 100.0% $ 237.4 100.0%

Energy Loans by Type of Facility as of 03/31/2017 (*) * Includes loans where the borrower's ability to repay could be disproportionately impacted by prolonged low oil and gas pric es 8 Facility Type Bal 03.31.17 ($'s in Millions) % of Energy Portfolio Bal 12.31.16 ($'s in Millions) % of Energy Portfolio Net Change 1Q17 Closed-End LOC $ 158.5 68.4 % $ 164.9 69.4 % - $ 6.4 Revolving LOC 68.2 29.4 % 64.9 27.4 % 3.2 Other 5.1 2.2 % 7.6 3.2 % - 2.5 Total $ 231.8 100.0 % $ 237.4 100.0 % - $ 5.6

Energy Loans Unfunded Commitment as of 03/31/2017 (*) * Includes loans where the borrower's ability to repay could be disproportionately impacted by prolonged low oil and gas pric es Combined utilization rate (including straight lines of credit) was 56.7% compared to 50.7% at 12/31/2016. The increased utilization rate was impacted by an $13.9 million decrease in original lines and $.8 million increase in ending balances. Revolving Lines of Credit ($’s in Millions) 9 Collateral Original Line Amount Current Balance Unfunded Amount Accounts Receivables $ 88.7 $ 51.7 $ 37.1 Barges, Crew Boats, Marine Vessels 0.5 0.2 0.3 Equipment 16.6 11.8 4.8 Commercial Real Estate 3.2 2.1 1.1 Real Estate 0.4 0.4 0.0 Inventory 0.8 0.6 0.2 CD Secured 2.0 0.9 1.2 All Other 1.4 0.6 0.8 Total $ 113.7 $ 68.2 $ 45.5


