FORM 18-K/A
For Foreign Governments and Political Subdivisions Thereof
SECURITIES AND EXCHANGE COMMISSION
Washington, D.C. 20549
AMENDMENT NO. 7
to
ANNUAL REPORT
of
PROVINCE OF ONTARIO
(Canada)
(Name of Registrant)
Date of end of last fiscal year: March 31, 2012
SECURITIES REGISTERED*
(As of the close of the fiscal year)
| Title of Issue | Amounts as to which registration is effective | Names of exchanges on which registered |
| N/A | N/A | N/A |
communications from the Securities and Exchange Commission:
Sean Sunderland
Counsellor (Intergovernmental Affairs)
and
Deputy Head of Section
Canadian Embassy
501 Pennsylvania Avenue N.W.
Washington, D.C. 20001
Copies to:
Jason R. Lehner
Shearman & Sterling LLP
Commerce Court West, 199 Bay Street
Suite 4405, P.O. Box 247
Toronto, Ontario, Canada M5L IE8
* The Registrant is filing this annual report on a voluntary basis.
PROVINCE OF ONTARIO
The undersigned registrant hereby amends its Annual Report on Form 18-K for the fiscal year ended March 31, 2012 (the “Annual Report“) as follows:
The following additional exhibit is added to the Annual Report:
| | Exhibit (k) | Public Accounts of Ontario: 2012-2013 Annual Report and Consolidated Financial Statements |
SIGNATURE
Pursuant to the requirements of the Securities Exchange Act of 1934, the registrant has duly caused this amendment to the annual report to be signed on its behalf by the undersigned, thereunto duly authorized, at Toronto, Ontario.
PROVINCE OF ONTARIO
(Name of registrant)
September 16, 2013 | By: /s/ Irene Stich |
Name: Irene Stich
Title: Director, Capital Markets Operations
Capital Markets Division
Ontario Financing Authority
EXHIBIT INDEX
| Exhibit (k): | Public Accounts of Ontario: 2012-2013 Annual Report and Consolidated Financial Statements. |
EXHIBIT (k)
Public Accounts of Ontario 2012-2013
Annual Report and Consolidated Financial Statements
[The Ontario Coat of Arms]
Ministry of Finance
PUBLIC
ACCOUNTS
of
ONTARIO
2012–2013
Annual Report
and
Consolidated Financial
Statements
2012–2013 PUBLIC ACCOUNTS
To the Honourable
David C. Onley
Lieutenant Governor of Ontario
May It Please Your Honour:
The undersigned has the honour to present the Public Accounts of the Province of Ontario for the fiscal year ended March 31, 2013, in accordance with the requirements of the Financial Administration Act.
Respectfully submitted,
/s/ Charles Sousa
The Honourable Charles Sousa
Minister of Finance
Toronto, September 2013
TABLE OF CONTENTS
Foreword iii
Introduction 1
Guide to the Public Accounts 3
Annual Report 3
Supporting Volumes 4
Statement of Responsibility 5
FINANCIAL STATEMENT DISCUSSION AND ANALYSIS
Overview 9
Analysis of 2012–13 results 11
Revenue 12
Investments in services, programs and infrastructure 14
Borrowing and financial position 18
Indicators of financial condition 19
Balancing the budget 21
Restraining growth in spending 21
Accountability and transparency in financial management and reporting 24
Delivering results 26
Better access to health care, better value for money 26
Keeping Ontario at the forefront of education and job creation 27
A cleaner, reliable electricity system 29
2012–13 Interim to Actual results 31
CONSOLIDATED FINANCIAL STATEMENTS
Auditor’s Report 35
Consolidated Statement of Operations 37
Consolidated Statement of Financial Position 38
Consolidated Statement of Change in Net Debt 39
Consolidated Statement of Change in Accumulated Deficit 40
Consolidated Statement of Cash Flow 41
Notes to the Consolidated Financial Statements 42
Schedules to the Consolidated Financial Statements 67
Glossary 85
Sources of Additional Information 91
I am pleased to present the Province of Ontario’s Public Accounts for the year 2012–13.
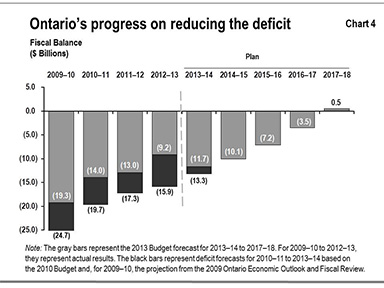
The new government is committed to creating jobs and building a strong and prosperous economy and to eliminating the deficit by 2017–18. This year the deficit is $9.2 billion, $5.6 billion lower than projected in the 2012 Budget, and a further reduction of $0.6 billion since the 2013 Budget.
This government has a plan for A Prosperous and Fair Ontario. It is focused on creating jobs and helping people with their everyday lives. Premier Kathleen Wynne and our government have a plan for jobs and growth that builds on strong economic fundamentals to enable Ontario’s economy to be more productive and more competitive.
The government’s plan includes a competitive tax system for business, making regulations smarter and less burdensome, and enhancing the stability and efficiency of capital markets. For example, by streamlining tax administration, Ontario businesses are saving more than $635 million per year in reduced compliance costs. This enables them to expand, make investments and create more jobs.
The plan also includes making strategic investments in modern infrastructure. In an increasingly competitive global economy, well-maintained and modern infrastructure helps to attract investment and lower business and manufacturing costs. These infrastructure investments remain focused on the most critical areas, such as transportation, health care and education, and help support over 100,000 jobs annually across the province.
A highly skilled and adaptable workforce is critical to Ontario’s success. It will help us meet the challenges of rising global competition and technological change. We are providing even more opportunities for Ontario’s youth by introducing an Ontario Youth Employment Fund as part of the Youth Jobs Strategy.
The new government is also working to promote entrepreneurship and innovation. Ontario’s continued prosperity depends on its ability to transform ideas into innovative goods and services for global markets.
We are also focused on helping Ontario companies go global. Our export-based economy is well positioned to take advantage of emerging global opportunities. We are going to work with business to promote Ontario’s many export industry strengths and expand market access beyond Ontario’s borders to other provinces, the United States and into emerging markets. This will lead to increased competitiveness and productivity benefits.
Finally, we are going to continue to support our vibrant and strong communities across the province. We will continue to work with municipalities and local industries to overcome their unique challenges, while helping them take advantage of new opportunities for jobs and growth.
In 2012–13, we had a lower deficit and net debt-to-GDP is almost two percentage points lower than the 2012 Budget forecast. This marks the fourth year in a row that we have reported a deficit lower than forecast — making us the only government in Canada to achieve this level of success. These results are due to our focus on deficit elimination by 2017–18, a commitment that is reinforced by our goal of reducing net debt-to-GDP to the pre-recession level of 27 per cent once the budget is balanced.
Our plan for eliminating the deficit is to manage spending effectively but also includes strategic investments to create jobs and grow the economy. Growth in program spending was less than one per cent for the second consecutive year. In fact, program spending in 2012–13 declined for the first time in a decade. Once again, ministries, including Health and Education, contained their growth in spending and most managed well below their 2012–13 budget.
In the years ahead we are taking further action. We will move forward with our plan to transform public services by changing the way programs and services are delivered to give Ontarians better value for their money. We will further integrate recommendations from the Commission on the Reform of Ontario’s Public Services (the Commission) into our plans by continuing to move forward with 60 per cent of the recommendations this year.
Going forward, these and other actions will help us control the rate of growth in program spending in a way that is fair and balanced, while also ensuring the integrity of provincial revenues to fund public services and infrastructure.
Achieving these results will require some difficult choices. Ontario already has the lowest per capita spending on public services among the provinces. Across-the-board cuts are a simplistic tool that does not work; the Commission also advised against across-the-board cuts. This approach would actually hurt public services and undermine programs that are providing high-quality services to the public such as health care and education. Instead, we will continue to carefully review spending to determine which programs should be enhanced or reduced, while transforming public services to increase efficiencies and improve outcomes.
Our government is taking strong action now. And in the years to come, controlling spending growth will take the same, ongoing effort. Through a balanced approach we will continue to strategically invest in key public services such as health care and education, and focus on creating jobs while at the same time continue to reduce the deficit.
/s/ Charles Sousa
The Honourable Charles Sousa
Minister of Finance
This Annual Report presents Ontario’s financial results, activities and position for the year ending March 31, 2013. The Annual Report is a key element of the Public Accounts of the Province of Ontario and central to demonstrating the Province’s transparency and accountability for financial resources.
This report compares the Province’s actual financial results for the 2012–13 fiscal year to the Budget plan presented in the fiscal update of April 25, 2012. It also outlines trends in a number of key financial indicators over the past several years. By providing comparisons and historical trends, the Financial Statement Discussion and Analysis contained in this Annual Report helps users of the financial statements to understand the impact of economic conditions and other factors on government finances for the year and over time. This information supports the government’s commitment to accountability and transparency in financial reporting.
Producing the Public Accounts of Ontario, including the three supplementary volumes and this Annual Report, requires teamwork and collaboration on the part of many staff members across the provincial government and Ontario’s public sector. In addition, the Office of the Auditor General plays a critical role in auditing and reporting on the Province’s financial statements. I would like to thank everyone who was involved in preparing the 2012–13 Public Accounts for their essential and valuable contributions.
We welcome your comments on the Public Accounts. Please share your thoughts by email at annualreport@ontario.ca, or by writing to the Office of the Provincial Controller, Re: Annual Report, Ontario Ministry of Finance, Second Floor, Frost Building South, 7 Queen’s Park Crescent, Toronto, ON M7A 1Y7.
/s/ Murray Lindo
Murray Lindo, CMA
Assistant Deputy Minister and Provincial Controller
Ontario Ministry of Finance
GUIDE TO THE PUBLIC ACCOUNTS
The Public Accounts of the Province of Ontario comprise this Annual Report and three supporting volumes.
Annual Report
The Annual Report includes a Financial Statement Discussion and Analysis section that examines the Province’s financial results and other information. It also contains the Consolidated Financial Statements, which are made up of several documents and schedules:
| | ● | The Auditor General’s Report expresses the opinion of the Auditor General as to whether the statements fairly report the activities of the government in accordance with Canadian public sector accounting standards. |
| | ● | The Consolidated Statement of Operations reports the annual surplus or deficit from operations in the period. It shows government revenue against the cost of providing programs and services and financing debt. The difference is the annual surplus or deficit. The statement also provides a comparison to the Budget plan presented in the fiscal update of April 25, 2012, which is referred to in this Annual Report as the Budget plan. |
| | ● | The Consolidated Statement of Financial Position shows the assets of the Province, which are classified as financial or non-financial, against its obligations. The Province’s net debt consists of its obligations less its financial assets. The Province’s accumulated deficit is its net debt less the value of its non-financial assets. |
| | ● | The Consolidated Statement of Change in Net Debt shows the impact of financing the annual deficit and investments in capital assets. As well, this statement reflects the annual change in the fair value of the Ontario Nuclear Funds Agreement (ONFA) investments. |
| | ● | The Consolidated Statement of Change in Accumulated Deficit shows the impact of the annual deficit and unrealized gains and losses due to changes in the fair value of the ONFA investments. |
| | ● | The Consolidated Statement of Cash Flow shows the sources and uses of cash over the period. Sources of cash include taxation and other revenues, increases in debt and decreases in financial investments, while uses of cash include operating expenses, investments in infrastructure and other assets. The Statement shows the impact of all these activities on the Province’s holdings of cash and cash equivalents over the year. |
| | ● | Notes and schedules provide further information on the items in the various statements and form an integral part of the Consolidated Financial Statements. The notes also include a summary of the significant accounting policies that reflect the basis on which the Province’s financial statements are prepared, as well as upcoming changes to accounting standards. |
Supporting Volumes
Volume 1 contains ministry statements and detailed schedules of debt and other items. The ministry statements, which are presented on the accrual basis of accounting, compare the amounts that were appropriated by the Legislative Assembly to actual expenses incurred. The ministry statements include amounts appropriated to fund some provincial organizations, including hospitals, school boards and colleges. The results of all provincial organizations in the government reporting entity are consolidated with those of the Province to produce the Consolidated Financial Statements, following the methodology described in Note 1 to the statements.
Volume 2 contains the individual financial statements of significant provincial corporations, boards and commissions that are part of the government’s reporting entity, and other miscellaneous financial statements.
Volume 3 contains detailed schedules of ministry payments.
STATEMENT OF RESPONSIBILITY
The Consolidated Financial Statements and Financial Statement Discussion and Analysis are prepared by the Government of Ontario in compliance with legislation and in accordance with the accounting principles for governments recommended by the Public Sector Accounting Board (PSAB) of the Canadian Institute of Chartered Accountants (CICA) and, where applicable, the recommendations of the Accounting Standards Board (AcSB) of the CICA.
The government accepts responsibility for the objectivity and integrity of these Consolidated Financial Statements and the Financial Statement Discussion and Analysis.
The government is also responsible for maintaining systems of financial management and internal control to provide reasonable assurance that transactions recorded in the Consolidated Financial Statements are within statutory authority, assets are properly safeguarded and reliable financial information is available for preparation of these Consolidated Financial Statements.
The Consolidated Financial Statements have been audited by the Auditor General of Ontario and his report appears on page 35 of this document.
/s/ Steve Orsini /s/ Murray Lindo | Steve Orsini | | Murray Lindo, CMA |
Deputy Minister and Secretary of Treasury Board | | Assistant Deputy Minister and Provincial Controller |
| August 14, 2013 | | August 14, 2013 |
FINANCIAL STATEMENT DISCUSSION
AND ANALYSIS
2012–13 Actual results against 2012 Budget plan1 Table 1 ($ Billions) |
| | 2012 Budget2 | 2012–13 Actual | Variance |
| Revenue | 112.6 | 113.4 | 0.8 |
| Expense | | | |
| Programs | 115.8 | 112.3 | (3.5) |
| Interest on debt | 10.6 | 10.3 | (0.3) |
| Total Expense | 126.4 | 122.6 | (3.8) |
| Reserve | 1.0 | – | (1.0) |
| Annual Deficit | (14.8) | (9.2) | (5.6) |
Notes: 1 Budget and related variance numbers may not add due to rounding. 2 As presented in the fiscal update of April 25, 2012. |
Ontario’s deficit for 2012–13 was $9.2 billion, a $5.6 billion improvement from the forecast outlined in the fiscal update of April 25, 2012. With this significant reduction, Ontario continues its strong track record in recent years of improving on its deficit projections through a combination of fiscal discipline and responsible management.
For the first year in more than a decade, total spending fell from the previous year. At $122.6 billion, total spending was 0.1 per cent lower than in 2011–12. Ontario remains committed to controlling the growth in spending while protecting key public services. This approach will help achieve the government’s goal of returning to fiscal balance by 2017–18 while continuing to build a prosperous and fair Ontario.
At $113.4 billion, revenues for 2012–13 were $0.8 billion above forecast, due largely to higher-than-expected income from government business enterprises and a one-time gain in taxation revenues, while spending on programs and interest on debt, at $122.6 billion, was $3.8 billion less than planned. Most ministries and program areas, including health care, spent less than planned in the Budget. The Province also used a $1.0��billion reserve built into the fiscal plan to further reduce the deficit.
Ontario’s economy continued to expand modestly in 2012–13, recording growth in real gross domestic product (GDP) of 1.5 per cent in 2012, lower than the projected 1.7 per cent. Solid gains in business investment and international exports as well as continued growth in household spending were the main contributors to growth in 2012.
The outlook for the global economy continues to be uncertain. Expectations for global economic growth have weakened, reflecting a slowdown in several key emerging market economies. Economic forecasts for the United States, a major export market for Ontario, have also been reduced. However, recently there are encouraging signs that U.S. growth is picking up. Ontario is addressing these and other challenges to its performance, including a high Canadian dollar and low productivity growth, with an economic plan intended to take advantage of opportunities for growth in the global economy.
This plan builds on leveraging such Ontario strengths as highly skilled workers and a commitment to modern infrastructure. These important elements of the plan underscore the need for continued strategic investments while maintaining an overall focus on fiscal balance.
The significant investments Ontario has already made in infrastructure and quality public services have helped to attract investment, ensure a strong workforce and improve quality of life. A Conference Board of Canada report, for example, estimates that Ontario’s recent and planned infrastructure investments boost Ontario’s GDP and lower the unemployment rate relative to where it would otherwise have been.
As a result of investments in education, health care and other key public services over the past several years:
| | ● | Ontario continues to lead the country in achieving the best overall wait-times reductions of all provinces, and is transforming the system to ensure it remains sustainable; |
| | ● | Ontario’s students are ranked by the Organisation for Economic Co-operation and Development (OECD) among the best in the world, and perform above the Canadian average in all three areas of math, reading and science in national assessments; and |
| | ● | A commitment to a clean, modern and reliable electricity system has created a culture of conservation with measurable savings, significantly increased renewable energy supply and seen the shutdown of 11 of Ontario’s 19 coal-powered generating units. |
Detailed performance results in each of these areas are presented starting on page 26.
ANALYSIS OF 2012–13 RESULTS
Details of 2012–13 Actual results against Budget plan1 Table 2 ($ Billions) |
| | | 2012 Budget2 | 2012–13 Actual | Variance |
| Revenue | | | | |
| Taxation | | 79.1 | 79.4 | 0.3 |
| Government of Canada | | 21.8 | 21.7 | (0.1) |
| Income from government business enterprises | | 4.1 | 4.5 | 0.4 |
| Other non-tax revenue | | 7.6 | 7.8 | 0.2 |
| Total Revenue | | 112.6 | 113.4 | 0.8 |
| Expense | | | | |
| Health | | 48.3 | 47.6 | (0.8) |
| Education | | 23.9 | 21.7 | (2.2) |
| Postsecondary and training | | 7.5 | 7.4 | (0.1) |
| Children’s and social services | | 14.0 | 13.9 | (0.1) |
| Justice | | 4.0 | 4.0 | – |
Other programs3 | | 18.0 | 17.7 | (0.3) |
| Total Program Expense | | 115.8 | 112.3 | (3.5) |
| Interest on debt | | 10.6 | 10.3 | (0.3) |
| Total Expense | | 126.4 | 122.6 | (3.8) |
| Reserve | | 1.0 | – | (1.0) |
| Annual Deficit | | (14.8) | (9.2) | (5.6) |
Notes: 1 Budget and related variance numbers may not add due to rounding. 2 As presented in the fiscal update of April 25, 2012. 3 Includes Teachers’ Pension Plan expense. In the Consolidated Financial Statements, this expense item appears under the Ministry of Education. Schedule 3 to the financial statements provides details. |
Through a combination of fiscal discipline and responsible management, Ontario performed $5.6 billion better than planned in 2012–13, going from an original deficit estimate of $14.8 billion in April 2012 to a final deficit of $9.2 billion. Much of the improvement arose from strong management of expenses, which came in $3.8 billion below plan. Higher-than-expected revenues contributed $0.8 billion to the improvement, and the government used a $1.0 billion reserve built into the plan to further reduce the expected deficit.
At the time of the 2012 Ontario Economic Outlook and Fiscal Review, released last October, the deficit projection had been revised to $14.4 billion to reflect higher revenue stemming from a higher 2011–12 tax base. By January, with the release of the 2012–13 Third Quarter Ontario Finances, the outlook had improved to $11.9 billion. This included additional expected gains on the revenue side, application of $0.5 billion of the reserve to deficit reduction, and a total expense outlook projected to be $1.2 billion lower than forecast. The lower expense projection largely reflected one-time savings in the Ministry of Education, which are explained in more detail in the section below entitled “Investments in services, programs and infrastructure” along with savings on interest on debt. These factors together reduced the deficit forecast by a further $2.5 billion.
The 2013 Budget, presented in May, provided interim projected results for 2012–13. With performance on track, the government applied the remaining $0.5 billion in the reserve to further reducing the deficit. The new projection of $9.8 billion, an improvement of $5.0 billion from the initial forecast, also included additional savings across ministries, further projected savings of interest expense as a result of the lower deficit forecast, and further upward revision of the revenue forecast.
The final deficit number for the year, at $9.2 billion, is $5.6 billion better than the initial forecast. The further improvement from interim reflects additional savings on the expense side, partially offset by downward revision of the revenue estimate. Page 31 sets out and discusses the variances between interim and actual results.
Revenue
Changes to taxation revenue are largely a reflection of economic activity. Ontario’s economy expanded by 1.5 per cent in 2012, as measured by growth in real GDP. This was below the 1.7 per cent growth projection used in developing the 2012 Budget plan.
Ontario and the rest of the global economy face continuing challenges. Ontario still relies heavily on the U.S. economy as a major export market and must address the issues of a high Canadian dollar and low productivity growth.
The government has already fundamentally restructured the tax system to improve Ontario’s business tax competitiveness and enhance Ontario’s advantages in sustaining long‐term economic growth and job creation.
Ontario’s plan for jobs and growth builds on strong economic fundamentals supported by government policy and investments in six key areas:
| | ● | Competitive business climate — supporting a competitive tax system and effective regulation promotes new business investment for job creation and economic growth; |
| | ● | Modern infrastructure — investing in transit, roads, hospitals and schools is a key foundation for a productive economy; |
| | ● | Highly skilled workforce — investing in skills and education, as well as youth employment, ensures the people of this province can work and prosper; |
| | ● | Promoting entrepreneurship and innovation — strengthening Ontario’s ability to transform ideas into innovative goods and services for the global economy; |
| | ● | Going global — working with business to expand market access for goods and services beyond Ontario’s borders to other provinces, the United States and emerging economies; and |
| | ● | Vibrant and strong communities — helping all communities and regional economies benefit from job creation and economic growth. |
These measures will enhance Ontario’s competitiveness and allow its businesses to take greater advantage of opportunities for growth in the global economy.
Ontario has already made considerable progress in recovering from the recession that began in 2008, the most serious global downturn since the 1930s. Real GDP is now 2.7 per cent above its pre-recession peak. Ontario has created more than 433,000 jobs since June 2009, recovering all of the jobs lost during the recession. The current level of employment is nearly 168,000 jobs above the high point before the recession.
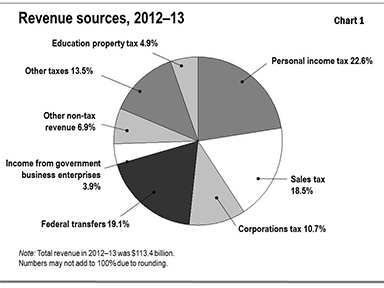
With the continuing recovery in Ontario, revenues have gradually expanded. Total revenue, at $113.4 billion, grew by 3.3 per cent in 2012–13 over the previous year.
Total revenue was $796 million higher than the level projected in the 2012 Budget plan, mainly as a result of higher-than-expected taxation revenues and income from government business enterprises.
Total taxation revenues were $295 million above forecast. A one-time boost to corporations tax related to tax assessments during 2012 for years before 2011 contributed to higher-than-projected revenues of $1.3 billion, but this was partly offset by lower results from most other sources of taxation. In particular, personal income tax revenues were $0.5 billion lower due to lower labour compensation growth and a one-time adjustment for an overestimate of the 2011–12 results.
Total non-tax revenues were up $501 million from the 2012 Budget plan.
The combined net income from investment in government business enterprises was $404 million higher than expected, reflecting stronger results across all four enterprises — the Liquor Control Board of Ontario, Ontario Lottery and Gaming Corporation, Ontario Power Generation Inc. and Hydro One Inc. The better-than-expected total reflected both lower expenses and stronger revenues in these businesses.
Other non-tax revenues were also up by $212 million, mainly from higher-than-expected recoveries of prior-year expenditures by ministries.
Transfers from the Government of Canada were $115 million lower than expected, partially offsetting the gains in total non-tax revenues. The decline was due mainly to lower infrastructure revenue and Canada Health Transfers. The decline in federal transfers was partially offset by a decrease in related spending.
Investments in services, programs and infrastructure
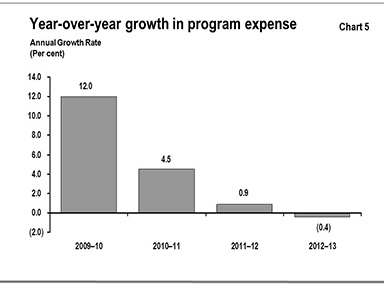
Continuing efforts to find savings and efficiencies were central to keeping program spending to $112.3 billion, as compared to the 2012 Budget forecast of $115.8 billion. Program spending decreased by 0.4 per cent from the previous year, falling from $112.7 billion, after an increase of only 0.9 per cent from 2010–11 to 2011–12.
Key variances between the Budget plan and actual results for the year include:
| | ● | In the health care sector, a reduction in planned expense of $752 million, due mainly to lower-than-projected spending by hospitals through effective management of their budgets, lower hospital amortization expense than projected, savings in the Ontario Drug Benefit program, and lower-than-planned spending in various ministry programs, such as clinical education. |
| | ● | In the primary and secondary education sector, a decrease of $2.2 billion from plan due mainly to one-time savings of $1.3 billion from reducing liabilities carried by school boards for sick-day banking and retirement gratuities, and other lower-than-expected school board expense. |
| | ● | Postsecondary and training sector expense was $147 million lower, as lower-than-expected demand resulted in lower spending on financial assistance for students and on employment and training programs. |
| | ● | Children’s and social services sector expense was $126 million below plan, due mainly to lower-than-projected expenditures on the Ontario Child Benefit and the Children’s Activity Tax Credit, and lower-than-forecast Ontario Works caseloads. |
| | ● | Justice sector expense came in $85 million lower than planned, mainly because of lower-than-expected costs related to municipal policing, lower overtime costs and other internal efficiencies. |
Expense for all other programs combined was lower than planned. Major decreases were attributable to:
| | ● | Higher-than-forecast prices for agricultural commodities, reducing payments made under business risk management programs administered by the Ministry of Agriculture and Food and contributing to an overall decrease of $98 million in the ministry’s planned spending; |
| | ● | Actual electricity prices and consumption that differed from the assumptions used in forecasting the Ontario Clean Energy Benefit, lower-than-expected take-up of the Northern Ontario Energy Credit and savings in other areas that together resulted in a net reduction of $97 million in planned spending for the Ministry of Energy; |
| | ● | Internal efficiencies and lower-than-planned spending on a range of initiatives that reduced expense in the Ministry of Finance by $197 million from plan; and |
| | ● | A net reduction of $212 million in total expense for the Ministry of Infrastructure due mainly to a change in the accounting treatment of real estate assets under development. |
Higher spending in some program areas, including funding the remediation of a contaminated site as required by federal legislation, revising media tax credit estimates for unprocessed applications and providing additional resources for fighting forest fires, partially offset these reductions.
The 2012 Budget plan included operating and capital contingency funds totalling $500 million to protect against unforeseen changes in expense. It also included a $500 million transition fund that could be drawn down if needed to help ministries manage costs associated with organizational changes. The portions of the contingency funds and transition fund that were unallocated by year-end were applied to further reducing the deficit.
The net impact of all changes in other programs was a reduction in spending of $258 million from plan.
Interest on debt for 2012–13 was $278 million lower than planned, reflecting mainly lower-than-forecast interest rates and lower deficits than expected for 2011–12 and 2012–13.
Infrastructure expenditures, 2012–131 Table 3 ($ Billions) |
| Sector | Investment in Capital Assets2 | Transfers and Other3 | Totals, 2012–13 Actual |
| Transportation and transit | 4.7 | 0.5 | 5.2 |
| Health | 3.8 | 0.3 | 4.1 |
| Education, postsecondary and training | 2.0 | 0.2 | 2.2 |
| Municipal and other | 1.2 | 0.7 | 2.0 |
| Totals | 11.7 | 1.7 | 13.5 |
1 Numbers may not add due to rounding. 2 Includes adjustments for the net book value of assets disposed of during the year, as well as changes in valuation. 3 Mainly transfers for capital purposes to municipalities and universities and expenditures for capital repairs. Transfers for capital-related purposes and other infrastructure expenditures are recorded as expenses in the Province’s Consolidated Statement of Operations. |
Infrastructure spending, including third-party funding, was $13.5 billion, slightly below the $13.9 billion set out in the 2012 Budget. The change was due mainly to lower-than-forecast construction activity.
In an increasingly competitive global economy, well-maintained and modern infrastructure helps to attract investment and lower business and manufacturing costs. Infrastructure investments stimulate economic growth and job creation, support a cleaner environment, enhance the quality of life and contribute to the overall prosperity of Ontario.
In a recent report, the Conference Board of Canada found that each $100 million of public infrastructure investment in Ontario boosts GDP by $114 million. Among other findings, the report estimates that Ontario’s recent and planned infrastructure investments will add more than $1,000 to the average Ontarian’s annual income by 2014, and lower the unemployment rate by almost one percentage point relative to where it would otherwise have been.
Since 2003, Ontario has invested more than $85 billion in public infrastructure, supporting close to 100,000 jobs on average each year. Major investments include ReNew Ontario, short-term stimulus, and recent projects in such critical areas as transportation, health and education, consistent with the Province’s long-term infrastructure plan, Building Together.
Examples of recent and current infrastructure projects include:
| | ● | Improving the flow of goods and people on Ontario’s highways by widening sections of Highway 11/17 between Thunder Bay and Nipigon and making improvements along Highway 417 in Ottawa, including bridge repair and replacement and widening sections of the highway. |
| | ● | Enhancing transit services by continuing to construct bus rapidways for use by Viva Bus Rapid Transit in York Region and constructing the Union Pearson Express, which will provide a new rail service linking Toronto’s Union Station to Pearson International Airport. |
| | ● | Investing in modern health infrastructure, such as the recently completed Bridgepoint Hospital in Toronto and 15 other major hospital projects under way across the province, including the New Oakville Hospital of Halton Healthcare Services. |
| | ● | Building better places to learn and supporting the rollout of full-day kindergarten across the province by providing more than $1.4 billion in capital funding since 2010 that is helping create close to 3,500 new kindergarten classrooms through additions and major retrofits. |
| | ● | Supporting the development of a skilled and innovative workforce by helping to fund the construction of major new facilities at colleges and universities, including Lakehead University Law School in Thunder Bay and Sir Sandford Fleming College’s Kawartha Trades and Technology Centre in Peterborough. |
| | ● | Working with the federal government to help address the infrastructure needs of Ontario’s communities, such as recent improvements to the Highway 8 Kitchener-Waterloo Expressway, which are part of a joint federal-provincial investment. |
| | ● | Strengthening municipal asset management planning through the Municipal Infrastructure Investment Initiative, by providing nearly $9 million to help municipalities prepare asset management plans. |
Borrowing and financial position
Ontario’s total debt increased by $23.8 billion in 2012–13, net of refinancing, rising from $257.3 billion to $281.1 billion, with the increase applied mainly to financing the deficit and investing in infrastructure. Ontario successfully completed its annual borrowing program in 2012–13, despite continuing challenges in global financial markets, taking advantage of the historically low interest rate environment and strong demand for Ontario bonds.
Strong global investor demand for Canadian-dollar assets, the liquidity of Ontario benchmark bonds and continuing confidence in the Province allowed Ontario to borrow 72 per cent of its needs in the Canadian-dollar market in 2012–13. While down from 81 per cent in 2011–12, this is consistent with the target of at least 70 per cent set out in the 2012 Budget.
The following table summarizes how the Province used its net new financing in 2012–13:
Use of new financing by the Province, 2012–13 Table 4 ($ Billions) |
Operating deficit and other transactions1: | | 4.8 |
Cash invested in capital assets owned by the Province and its consolidated organizations, including hospitals, school boards and colleges2: | | 11.6 |
| Increase in the Province’s cash and investments: | | 8.7 |
| | | 25.1 |
Less: Increase in other long-term financing3: | | (1.3) |
| Net new financing | | 23.8 |
1 The Province’s operating deficit of $9.2 billion offset by a net $4.4 billion in changes to assets and liabilities that provided cash for operating purposes. See the Consolidated Statement of Cash Flow. 2 New investments of $11.7 billion less proceeds of $0.1 billion from the sale of tangible capital assets. 3 Including net increase in financing of capital projects through Alternative Financing and Procurement. These obligations reflect a claim on future government resources. See Note 5 to the Consolidated Financial Statements. |
The Province’s net debt, which consists of its obligations less its financial resources, was $252.1 billion at March 31, 2013, up from $235.6 billion a year earlier. Net debt at year-end was lower than the $259.8 billion forecast in the April 25, 2012 fiscal update, owing largely to better-than-expected fiscal results. Financial resources, including cash, short-term and other investments, and accounts and loans receivable, amounted to $79.3 billion at year-end.
The ratio of net debt-to-GDP for 2012–13 was 37.4 per cent, an improvement from the 39.4 per cent projected for the year in the April 25, 2012 fiscal update. With the government’s plan to eliminate the deficit, increases in the ratio have moderated since the years immediately following the economic downturn that began in 2008. After eliminating the deficit by 2017–18, overall spending increases will be restricted to one per cent below GDP growth until the Province’s net debt-to-GDP ratio returns to the pre-recession level of 27 per cent.
Ontario’s borrowing program also provides a portion of the funds used to finance infrastructure projects, including transit, roads, hospitals and schools. These infrastructure investments steadily increase the level of assets available to provide public services. The net book value of these tangible capital assets was $85.0 billion at the end of the 2012–13 fiscal year, up from $77.2 billion a year earlier.
With Ontario on its way to a return to fiscal balance, the growth in debt continues to moderate. Although lower than forecast in the Budget plan, interest expense totalled $10.3 billion in 2012–13, up by $259 million from a year earlier. The government’s commitment to eliminating the deficit is key to helping control growth in interest expense.
Indicators of financial condition
The use of financial indicators helps the public and other readers of the Annual Report assess the financial health of the Province. The indicators’ levels and trends show the impacts of global economic events on the Province’s finances, as well as how the government is responding to these and other events.
Indicators of financial condition Table 5 |
| | 2010–11 | 2011–12 | 2012–13 |
| Net debt to revenues | 200.2% | 214.6% | 222.4% |
| Interest expense to revenues | 8.8% | 9.2% | 9.1% |
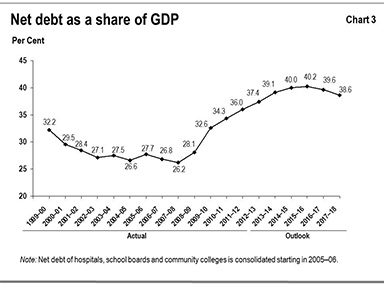
| Net debt-to-GDP | 34.3% | 36.0% | 37.4% |
| Interest on debt to GDP | 1.5% | 1.5% | 1.5% |
| Net debt per capita | $16,099 | $17,497 | $18,558 |
| Federal transfers to total revenues | 21.5% | 19.4% | 19.1% |
| Tangible capital assets per capita | $5,249 | $5,732 | $6,254 |
Such measures as net debt to revenues and interest expense to revenues show the relationships among government borrowings, the cost of those borrowings, and revenues. The ratio of net debt to revenues has increased as borrowings rose to cover the deficit and finance investments in infrastructure. Interest expense as a percentage of revenues declined slightly, with GDP increasing at a slightly faster rate than interest expense.
Net debt-to-GDP and interest expense to GDP both compare the government’s commitments to lenders to the province’s total economic output. Net debt-to-GDP has increased as the Province increased its borrowings to finance deficits in response to the global recession and provide stimulus funding to build infrastructure and protect jobs. However, with continued work to restrain growth in spending and trim annual deficits, the rate of growth of net debt has slowed, dampening growth in the ratio of net debt-to-GDP. As Chart 3 indicates, the ratio of net debt-to-GDP is expected to peak in 2015–16 and then begin declining. The ratio of interest on debt to GDP has been relatively stable for the past three years, showing that interest paid to lenders has grown at roughly the same rate as the Ontario economy.
The ratio of federal transfers to total revenues decreased to 19.1 per cent in 2012–13 from 19.4 per cent a year earlier. Federal transfers increased slightly in 2012–13 from the previous year, but revenue as a whole grew more strongly.
Tangible capital assets per capita provides a measure of how much the Province has invested on behalf of each resident in such important public assets as transit, roads, hospitals and schools. The steady increase in this ratio — from $5,249 in 2010–11, to $5,732 in 2011–12 and $6,254 in the year just ended — shows the extent to which people in Ontario are benefiting from the investments made to modernize, renew and update public infrastructure in recent years.
BALANCING THE BUDGET
Restraining growth in spending
The results of the fiscal year ended March 31, 2013 show that the Ontario government is acting on its plan to eliminate the deficit by 2017–18 in a way that is fiscally responsible, while strengthening the economy and building a more prosperous and fair Ontario.
To support deficit reduction, in February 2012 the Commission on the Reform of Ontario’s Public Services, led by Don Drummond, released a report on how to deliver the most effective and efficient public services possible and achieve sustainable fiscal balance. Over the 2012–13 fiscal year, the Ontario government began to move forward on more than half of the Commission’s 362 recommendations. In 2013–14, it is moving forward with a total of 60 per cent of the recommendations and is continuing to study the remainder.
Progress on implementing the Commission’s recommendations crosses many areas of service delivery and management, ranging from health care and tax compliance to environmental approvals and efficiencies in the justice system.
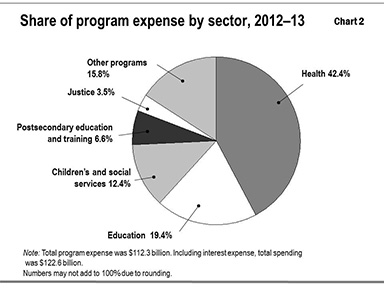
Ontario’s health care sector accounted for 42.4 per cent of the Province’s program spending in 2012–13. Transforming the sector to be sustainable while delivering quality services is a key priority in the government’s plan to eliminate the deficit.
Change is being shaped by Ontario’s Action Plan for Health Care, which the government released in January 2012. The Action Plan involves improving the quality of care based on the best available evidence and ensuring patients receive timely access to the most appropriate care in the most appropriate setting. The Action Plan and the Commission’s recommendations both aim to transform the health care sector to achieve quality care that is financially sustainable and better meets the needs of the people of Ontario. Significant achievements in the 2012–13 fiscal year included:
| | ● | Continuing to implement a new patient- and activity-based hospital funding model to replace the existing lump-sum payments to hospitals, so that funding follows the patient and better reflects case complexity and volume of procedures; |
| | ● | Increasing investments in home care and community services to provide patients who do not need acute care, especially seniors, with quality care in the right setting and take pressure off hospital facilities; |
| | ● | Negotiating a new compensation agreement with the Ontario Medical Association that manages costs and works towards more effective health care through such mechanisms as e-consultations, expansion of telemedicine, and an evidence-based approach to ensuring procedures and tests are appropriate to the individual patient; |
| | ● | Expanding the scope of practice for pharmacists to administer flu vaccines and smoking cessation services; and |
| | ● | Developing a new income-tested deductible under the Ontario Drug Benefit program so that high-income seniors will pay more of their prescription drug costs. |
In the areas of elementary, secondary and postsecondary education, the government is working to protect important gains, including improved student achievement, while ensuring fiscal sustainability. Key milestones in 2012–13 to implement the Commission’s recommendations included:
| | ● | Implementing a different funding approach for successful secondary school credits beyond a 34-credit threshold; |
| | ● | Eliminating banked sick days and retirement gratuities, and making changes to post-retirement health benefits for elementary and secondary teachers; |
| | ● | In the postsecondary sector, working with institutions to develop formal agreements on their mandates as part of a strategy to support greater differentiation among institutions; |
| | ● | Harmonizing the range of scholarships, grants and other assistance programs across postsecondary institutions, and modernizing student aid programs; and |
| | ● | Supporting key projects by universities and employee groups to put single-employer pension plans on a more sustainable track. |
In response to the Commission’s recommendations, in other sectors the government is also:
| | ● | Reforming social assistance to improve employment supports, simplify asset and income rules, and increase program accountability; |
| | ● | Integrating employment and training services across government with Employment Ontario, and improving the collection of data on program uptake and outcomes; |
| | ● | Working to develop full-cost recovery models for environmental programs and services; and |
| | ● | In the justice sector, using civilians for administrative duties such as data entry, where possible, and streamlining operations by integrating programs and back-office functions. |
After 2009–10, annual increases in program spending declined sharply — from 12.0 per cent in the depth of the recession, when strong stimulus and supports were needed, to 4.5 per cent and then 0.9 per cent in 2011–12, and the past year saw the first decline in more than a decade.
The government of Ontario already spends less per resident delivering public services than any other province, and is working internally to achieve even greater cost effectiveness while continuing to offer quality, timely service. Reflecting measures to improve efficiency, Ontario’s per capita program spending in 2012–13 was $8,311, which was the lowest among the provinces.
The 2009 Budget announced measures to make the Ontario Public Service more efficient by reducing its size by five per cent or roughly 3,400 full-time equivalent staff over three years through attrition and other measures. The government achieved this reduction by March 31, 2012. It is well on its way to meeting a commitment to a further reduction of 1,500 full-time equivalent staff by March 31, 2014.
The Commission noted that the government’s pension expense had risen significantly in recent years and projected that, without action, it would continue to do so. Ontario acted in 2012–13 to mitigate this risk. After extensive consultation, it signed agreements with the four jointly sponsored pension plans consolidated in its financial statements. These agreements will freeze contribution rates at the levels already agreed to until the deficit is eliminated in 2017–18. During the freeze period, plans that experience new funding shortfalls will be required to reduce future benefits, subject to certain exceptions, instead of raising contribution rates.
The government’s pension expense is forecast to be a cumulative $6.5 billion lower by 2017–18 compared to the Commission’s forecast. This reduction can largely be attributed to the government’s successful efforts to constrain public‐sector wage growth and better‐than‐expected investment performance.
Pension expense, 2012–13 to 2017–181 Table 6 ($ Billions) |
| | 2012–13 | 2013–14 | 2014–15 | 2015–16 | 2016–17 | 2017–18 |
Forecast, Commission on the Reform of Ontario’s Public Services | 3.1 | 3.7 | 3.6 | 3.7 | 4.0 | 4.2 |
Pension expense2 | 3.0 | 3.1 | 2.6 | 2.4 | 2.4 | 2.4 |
| Difference | (0.1) | (0.6) | (1.0) | (1.4) | (1.6) | (1.8) |
1 Numbers may not add due to rounding. 2 Actual for 2012–13, projected for other years. |
The government has also provided temporary solvency funding relief to a number of single-employer pension plans, mainly in the university sector, in which the employer often bears a disproportionate share of contributions. The government remains committed to ensuring these plans move to equal cost-sharing for ongoing contributions within five years.
To find further savings and support measures to eliminate the deficit, Ontario is also:
| | ● | Using the Alternative Financing and Procurement model to leverage private-sector resources and expertise to deliver projects on time and on budget. Infrastructure Ontario has applied the model to 83 capital projects for the Ontario government valued at about $38 billion, with an estimated $3 billion in value-for-money savings. |
| | ● | Establishing a working group to advise on the implementation of a pooled asset management entity for public sector pension plans. |
| | ● | Working with the federal government on enhanced compliance to address the underground economy and corporate tax avoidance and to support the integrity of Ontario’s tax system. In 2012–13, more than $200 million was realized through initiatives to reduce corporate tax avoidance. |
| | ● | Centralizing the collection of outstanding tax and non-tax accounts within the Ministry of Finance. |
| | ● | Working to increase value in such areas as Liquor Control Board of Ontario sales and gaming modernization while ensuring social responsibility. |
Accountability and transparency in financial management and reporting
The government is accountable to the public for the appropriate use of taxpayer dollars and for clearly communicating the goals and results of its spending. Ontario continues to strengthen its accountability to the public, improve transparency in financial reporting, and ensure effective stewardship over government funds.
Publicly funded organizations, including provincial agencies, are accountable for delivering on the mandates assigned to them, while the ministries that oversee them must ensure that effective accountability tools are in place. The tools should both support financial and other reporting by agencies and identify when changes may be necessary to ensure that agency operations align with their mandates and achieve value for money. The government continues to improve the framework that supports these tools. During the year, it took action to enhance ministry reviews of their agencies and other organizations. These changes have placed greater focus on evaluating the entities’ financial results and internal controls, including identifying and mitigating risks and ensuring compliance with relevant government directives.
The government has enhanced the reporting and disclosure of salaries required under the Public Sector Salary Disclosure Act, 1996. In June 2012, it amended the act to allow the Province to audit organizations subject to the act to help ensure full reporting compliance. In the fall of 2012, it extended the definition of salary to include per diem payments made to appointees of government bodies and other non‐profit organizations subject to the act. These changes have enhanced the transparency and accountability of public sector salary reporting.
Accounting standards determined by the Public Sector Accounting Board (PSAB) of the Canadian Institute of Chartered Accountants establish standards for the measurement and recording of the financial activities of governments and public sector organizations and the reporting of these to the public. To help ensure information is clear and understandable, consistency in measuring and presenting both planned and actual results is important. Alignment between fiscal plans and financial reporting is thus common among senior governments in Canada. Ontario, like other senior Canadian governments, continues to support the PSAB standards and to provide input to the standard‐setting process.
PSAB continues work on a project to review its accounting conceptual framework for the Canadian public sector. A sound conceptual framework is key to ensuring that PSAB’s standards continue to serve the public interest and reflect government accountability. Conversely, without a sound framework, governments might be forced to reconsider the basis upon which they report, in order to ensure clarity, accountability and consistency between planning and reporting. All Canadian senior governments, including Ontario, support efforts to develop a sound framework. Ontario expects that PSAB will incorporate the results of its conceptual framework review into its current standards and any future proposals. Additional discussion on the future direction of accounting standards is provided in the notes to the Consolidated Financial Statements, which form part of this Annual Report.
DELIVERING RESULTS
The government continues to focus on its key priorities — the public services like education and health care that people value and rely on, and that are helping to build prosperity, opportunity and a fair society. These services have benefited from significant public investments over the past several years, and this section outlines the measurable improvements that those investments have created. While Ontario is taking action to return to fiscal balance, preserving and building on those gains remains a priority.
Better access to health care, better value for money
Ontario has invested heavily over the past decade in improving the health care system. Performance measures and third-party evaluation show that, as a result, Ontario is the Canadian leader in such areas as reduced wait times for five priority medical procedures. Building on that foundation, Ontario is undertaking fundamental transformation of the health care sector to ensure that those gains are protected now and for future generations. Under the transformational plan laid out in the Action Plan for Health Care, the focus is on how the various parts of the health care system can work better together so that people stay healthier in the first place, family health care teams become the front door and navigators of the system, and services are delivered by the right provider at the right time and in the right place. At the same time, higher quality of care, better access to services and better value for investment will lead to improved patient and client satisfaction.
In the 2012–13 fiscal year, Ontario made significant progress on these goals:
| | ● | To better integrate the delivery of care to high-needs patients — the five per cent of the population that accounts for two-thirds of health care costs — Ontario has to date created 25 Health Links, a new model that encourages greater collaboration among health care providers and could reduce unnecessary hospital visits and readmissions for patients with complex needs. The goal over time is to expand Health Links across the province. |
| | ● | Funding to hospitals is the largest area of health spending, so managing it is critical to controlling health care expenditures as a whole. The Ministry of Health and Long-Term Care began phasing in Health System Funding Reform on April 1, 2012. This change will result in more efficient delivery of services and treatments through a transparent, patient-centred funding model that reimburses providers at an established rate, based on quality care for standard patient groups. At the same time, the growth in hospitals’ overall base operating funding was held to zero per cent in 2012–13. |
| | ● | Some 200 Family Health Teams now operate in Ontario, serving nearly three million patients — a number that is growing. This innovative primary health care model was launched in 2005 to provide broad-based services using interdisciplinary teams including health care professionals such as nurse practitioners, social workers and dietitians. Family Health Teams can see more patients, and physicians are freed up to focus more time on patients with complex health needs. About 718,000 people who previously did not have a family health care provider are now being served by a Family Health Team. |
| | ● | Nurse practitioner-led clinics are another innovative primary health care model. As of January 2013, 26 of these clinics were operational. This model, often used to provide primary care in previously underserved communities, is now caring for more than 32,900 patients, many of whom previously did not have a primary health care provider, and that number is climbing. Similar to the Family Health Team, it uses an interdisciplinary team to improve access to care. |
| | ● | As of January 2013, more than 189,000 Ontarians had been referred to a family physician or nurse practitioner through the Health Care Connect program, which helps people find a primary health care provider. Patients with the greatest need are referred first. |
| | ● | There were 25,480 physicians practising in Ontario in 2011, the most recent year for which data are available, compared to 24,875 in 2010. |
| | ● | In 2012, Ontario had 127,611 nurses compared with 126,573 in 2011. Ontario continues to be one of the few jurisdictions in the world to guarantee a full-time job opportunity to new nursing graduates. Since 2007, more than 14,300 new nursing graduates have received a full-time job opportunity through the Nursing Graduate Guarantee. Overall, the percentage of nurses working full time in Ontario was 66.6 per cent in 2012. |
| | ● | In 2012, Ontario was once again the national leader in reducing wait times for five priority health services, according to a report card issued by the Wait Time Alliance. In 2012–13, investments included $75.1 million in additional capacity in hip and knee revisions, general surgery, pediatric surgery, and MRI and CT scans. Ontario’s Wait Times Strategy is committed to increasing the number of procedures for targeted services; investing in new, more efficient technology such as MRI machines; standardizing best practices; and collecting and reporting wait-times data to allow better decision-making and increased accountability. |
| | ● | Ontario’s ground-breaking website, www.ontario.ca/waittimes, continues to publicly record and provide information on current hospital wait times for key health services across the province. Since implementation of the Wait Times Strategy, Ontarians are getting cataract surgeries 164 days earlier; hip and knee replacements 158 and 224 days earlier, respectively; key cardiac procedures up to 30 days earlier; cancer surgeries 33 days earlier; and general surgeries 23 days earlier. In addition, since 2008, patients with complex conditions are spending 30.4 per cent less time in emergency rooms and patients with minor, uncomplicated conditions are spending 17.6 per cent less time. |
Keeping Ontario at the forefront of education and job creation
A well-educated workforce is a key pillar for job and growth. The overall skill and knowledge level of Ontario’s students must continue to rise to remain competitive in a global economy. At the same time, the achievement gap must be closed between students who excel and students who struggle because of personal, cultural or academic barriers. This is the foundation of a fair society in which everyone contributes to a higher quality of life.
Ontario continues to be recognized as a worldwide leader in education. This province has experienced nine consecutive years of improvement in student results — a feat that has earned international renown. A report released by the Organisation for Economic Co-operation and Development (OECD) in March 2012, entitled Strong Performers and Successful Reformers in Education, noted that the Ontario government’s emphasis on elementary and secondary education has helped increase literacy and numeracy achievement, improve graduation rates and reduce the number of low-performing schools. This builds on previous OECD reports that ranked Ontario’s students among the best in the world.
The evidence is clear that the province’s students are now far better prepared to succeed:
| | ● | As of September 2012, full-day kindergarten was being offered in roughly 1,700 Ontario schools, benefiting about 122,000 students or almost half of Ontario’s four- and five-year-olds. It marks the third year of the program, which gives Ontario’s youngest learners the best possible start and provides a solid foundation for future learning. About 184,000 students will benefit by September 2013, and full-day kindergarten will be available to all four- and five-year-olds by September 2014. |
| | ● | In 2011–12, the most recent year for which data are available, 70 per cent of students in Grades 3 and 6 were meeting or beating the provincial standard (a “B” grade) in reading, writing and math, up 16 percentage points from 54 per cent nine years ago. Over 50,000 more students in Grades 3, 6 and 9 were meeting or beating the provincial standard in reading, writing and math compared to 2002–03. Results for each division and school are available on the Education Quality and Accountability Office website at www.eqao.com. |
| | ● | Released in December 2012, the results of the 2011 Progress in International Reading Literacy Study show that Ontario’s Grade 4 students performed near the top in the world in reading achievement. Ontario’s students have sustained their high level in reading achievement since the previous evaluation in 2001 and have narrowed the gender achievement gap. |
| | ● | The Province’s goal of all primary classes in Ontario having 23 or fewer students was met in 2008–09 and has been maintained every year since. In 2003–04, only 64 per cent had 23 or fewer. Class sizes by school, school board and provincially are available at www.edu.gov.on.ca/eng/cst/. |
| | ● | The number of students attending colleges or universities or learning a trade has increased by 220,000 since 2002–03, and there are 160,000 additional students enrolled at Ontario colleges and universities over the last 10 years, an increase that is greater than in any decade in Ontario’s history. |
| | ● | More than 350,000 students received Ontario Student Assistance Program (OSAP) funding, including the 30% Off Ontario Tuition grant in 2012–13. |
| | ● | The percentage of working-age people in Ontario with postsecondary education rose to more than 65 per cent in 2012 from 56 per cent in 2002, while over the same period the graduation rate for university students increased to 81 per cent from 74 per cent, and for college students it rose to 65 per cent from 57 per cent. |
A skilled workforce also depends on the ability to upgrade skills and learn while on the job. Employment Ontario investments of more than $1 billion in 2012–13 helped Ontarians access a wide range of employment and training services. Roughly one million Ontarians benefited, including employers who can use the Employment Ontario network to find workers; laid-off workers who benefit from skills training and other services; and workers, apprentices, newcomers and youth who get access to lifelong learning.
A clean, reliable electricity system
The government remains committed to a clean, reliable electricity system that focuses on conservation and new renewable energy sources, as well as such existing assets as Ontario’s strong hydroelectric network, to ensure the right balance of supply and demand. A major element of the government’s strategy is eliminating the emissions from coal-fired electricity generation.
| | ● | As part of its commitment to a cleaner energy system, the Ontario government has shut down 11 of the province’s 19 coal-burning units since 2003. In September 2012, the Atikokan Generating Station closed to begin conversion from coal to biomass fuel. By the end of 2013, the Province will have shut down 17 of 19 coal units, completing the phase-out of 96 per cent of coal capacity. Eliminating coal-fired electricity generation will reduce annual carbon dioxide emissions by up to 30 megatonnes a year. To replace coal, Ontario is relying on a mix of conservation, refurbished nuclear, renewable energy and natural gas. |
| | ● | Since 2003, more than 12,000 megawatts (MW) of new and refurbished energy supply have come online, including a mix of cleaner gas-fired generation, nuclear power and renewable energy. This new supply includes more than 3,300 MW of renewable energy supply from wind, hydro, solar and bio-energy sources. |
| | ● | Ontario now has over 2,000 MW of wind power from more than 1,100 wind turbines online — enough to power 550,000 homes a year. In 2003, there were only 15 MW of wind power from 10 turbines. The province is also a leader in solar, with the most solar photovoltaic capacity online of any jurisdiction in Canada — over 750 MW, or enough to power more than 90,000 homes a year. |
| | ● | Ontario’s clean energy strategy has attracted significant renewable energy development, investments and economic opportunities. More than 30 companies are currently operating, or plan to build, solar and wind manufacturing facilities in Ontario. More than 31,000 clean energy jobs have been created, and municipalities across Ontario are currently building feed-in tariff projects, including Brockville, Kitchener, Lambton Shores, Markham, Waterloo and Welland. |
| | ● | The 10.2-kilometre Niagara Tunnel, the single biggest construction project in the Niagara region in almost six decades, became fully operational in early March 2013. The tunnel, which has increased the amount of water available to the Sir Adam Beck Generating Station, is producing enough clean, renewable hydro power to power about 160,000 homes a year. It is expected to operate for up to 100 years with little maintenance. |
| | ● | As a result of the government’s conservation and energy efficiency programs, as well as the efforts of families and business across the province, Ontario has saved more than 1,900 MW of electricity since 2005. Overall, in 2011, conservation programs in Ontario influenced 717 million kilowatt-hours of verified and sustained annual energy savings. |
| | ● | More than 4.7 million smart meters have been deployed across Ontario. These meters provide real-time readings of energy consumption, usually every hour, to utilities. Smart meters have also enabled time-of-use pricing, so that the price consumers pay for electricity now better reflects the cost of producing it. Over 4.4 million customers are currently on time-of-use pricing and more are coming on every day. Smart meters are also a key component in the transition to a smarter power grid and smart appliances, which will allow greater flexibility in shifting consumption away from the highest-demand periods, deferring the need for new generation and resulting in savings for ratepayers. |
2012–13 INTERIM TO ACTUAL RESULTS
The Province provided interim estimates of results for 2012–13 in the 2013 Budget, tabled in May of this year. At that time, the deficit was estimated at $9.8 billion. The final deficit of $9.2 billion reported for the year represents an improvement of $0.6 billion from the interim estimate. Table 7 outlines the major variances from the earlier figure.
Comparison of 2012–13 Interim and Actual results Table 7 ($ Billions ) |
| | | 2012–13 Interim | 2012–13 Actual | Variance |
| Revenue | | | | |
Taxation | | 80.3 | 79.4 | (0.9) |
Government of Canada | | 21.7 | 21.7 | – |
Income from government business enterprises | | 4.5 | 4.5 | – |
Other non-tax revenue | | 7.8 | 7.8 | 0.1 |
| Total Revenue | | 114.2 | 113.4 | (0.8) |
| Expense | | | | |
Programs | | 113.6 | 112.3 | (1.4) |
Interest on debt | | 10.4 | 10.3 | (0.1) |
| Total Expense | | 124.0 | 122.6 | (1.4) |
| Annual Deficit | | (9.8) | (9.2) | (0.6) |
Note: Interim numbers and related variances may not add due to rounding. | | |
Revenues were down slightly from the interim estimate. This was largely due to downward revision of taxation revenue estimates as additional information became available after the fiscal year-end.
The impact of the downward revision in revenue was more than offset by actual spending that was lower than estimated at interim reporting. This was largely due to lower spending in the education and health sectors than anticipated in the interim estimates. As well, the estimated expense for interest on debt was revised slightly downward.
CONSOLIDATED
FINANCIAL STATEMENTS
Province of Ontario Consolidated Statement of Operations |
| ($ Millions) | 2012–13 Budget1 | 2012–13 Actual | 2011–12 Actual |
Revenues (Schedules 1 and 2) |
| Personal Income Tax | 26,085 | 25,574 | 24,548 |
| Sales Tax | 21,135 | 20,957 | 20,159 |
| Corporations Tax | 10,798 | 12,093 | 9,944 |
| Education Property Tax | 5,631 | 5,511 | 5,765 |
| Employer Health Tax | 5,149 | 5,137 | 5,092 |
| Gasoline and Fuel Taxes | 3,095 | 3,100 | 3,090 |
| Ontario Health Premium | 3,098 | 3,067 | 2,916 |
| Other Taxes | 4,132 | 3,979 | 4,084 |
| Total Taxation | 79,123 | 79,418 | 75,598 |
| Transfers from Government of Canada | 21,776 | 21,661 | 21,305 |
Income from Investment in Government Business Enterprises (Schedule 9) | 4,065 | 4,469 | 4,413 |
| Other | 7,609 | 7,821 | 8,457 |
| | 112,573 | 113,369 | 109,773 |
Expenses (Schedules 3 and 4) | | | |
| Health | 48,334 | 47,582 | 46,476 |
| Education | 24,742 | 22,629 | 23,454 |
| Children’s and Social Services | 14,047 | 13,921 | 13,472 |
| Environment, Resources and Economic Development | 10,859 | 11,069 | 10,711 |
| Interest on Debt | 10,619 | 10,341 | 10,082 |
| Post-Secondary Education and Training | 7,509 | 7,362 | 7,261 |
| Justice | 4,047 | 3,962 | 3,873 |
| General Government and Other | 6,236 | 5,723 | 7,413 |
| | 126,393 | 122,589 | 122,742 |
| Reserve | 1,000 | – | – |
| Annual Deficit | (14,820) | (9,220) | (12,969) |
1 Amounts reported as “Plan” in 2012 Budget, as presented in the April 25, 2012 fiscal update, restated for presentation changes. See accompanying Notes and Schedules to the Financial Statements. |
Province of Ontario Consolidated Statement of Financial Position |
As at March 31 ($ Millions) | | 2013 | | 2012 |
| Liabilities | | | | |
Accounts Payable and Accrued Liabilities (Schedule 5) | | 21,554 | | 21,128 |
Debt (Note 3) | | 281,065 | | 257,278 |
Other Long-Term Financing (Note 5) | | 11,534 | | 10,193 |
Deferred Revenue and Capital Contributions (Note 6) | | 9,117 | | 8,553 |
Pensions and Other Employee Future Benefits (Note 7) | | 4,362 | | 4,802 |
Other Liabilities (Note 8) | | 3,749 | | 2,794 |
| | | 331,381 | | 304,748 |
| Financial Assets | | | | |
| Cash and Cash Equivalents | | 18,497 | | 16,380 |
Investments (Note 9) | | 20,841 | | 14,298 |
Accounts Receivable (Schedule 6) | | 8,425 | | 9,263 |
Loans Receivable (Schedule 7) | | 11,110 | | 10,381 |
| Other Assets | | 1,873 | | 1,585 |
Investment in Government Business Enterprises (Schedule 9) | | 18,547 | | 17,259 |
| | | 79,293 | | 69,166 |
| Net Debt | | (252,088) | | (235,582) |
| Non-Financial Assets | | | | |
Tangible Capital Assets (Note 10) | | 84,956 | | 77,172 |
| Accumulated Deficit | | (167,132) | | (158,410) |
Contingent Liabilities (Note 12) and Contractual Obligations (Note 13). See accompanying Notes and Schedules to the Financial Statements. |
Province of Ontario Consolidated Statement of Change in Net Debt |
For the year ended March 31 ($ Millions) | 2013 | 2012 |
| Annual Deficit | | (9,220) | | (12,969) |
Acquisition of Tangible Capital Assets (Note 10) | (11,787) | | (11,033) | |
Amortization of Tangible Capital Assets (Note 10) | 3,930 | | 3,647 | |
| Proceeds on Sale of Tangible Capital Assets | 150 | | 105 | |
| (Gain)/Loss on Sale of Tangible Capital Assets | (77) | | 47 | |
| | | (7,784) | | (7,234) |
Increase/(Decrease) in Fair Value of Ontario Nuclear Funds (Note 11) | 639 | (3) |
| Increase in Net Debt | (16,365) | (20,206) |
| Net Debt at Beginning of Year | (235,582) | (214,511) |
| IFRS Transitional Impact | – | (758) |
PSAB Transitional Impact (Note 2) | (141) | (107) |
| Restated Net Debt at Beginning of Year | (235,723) | (215,376) |
| Net Debt at End of Year | (252,088) | (235,582) |
See accompanying Notes and Schedules to the Financial Statements. |
Province of Ontario Consolidated Statement of Change in Accumulated Deficit |
For the year ended March 31 ($ Millions) | 2013 | 2012 |
| Accumulated Deficit at Beginning of Year | (158,410) | (144,573) |
| IFRS Transitional Impact | – | (758) |
PSAB Transitional Impact (Note 2) | (141) | (107) |
| Restated Accumulated Deficit at Beginning of Year | (158,551) | (145,438) |
| Annual Deficit | (9,220) | (12,969) |
Increase/(Decrease) in Fair Value of Ontario Nuclear Funds (Note 11) | 639 | (3) |
| Accumulated Deficit at End of Year | (167,132) | (158,410) |
| See accompanying Notes and Schedules to the Financial Statements. |
Province of Ontario Consolidated Statement of Cash Flow |
For the year ended March 31 ($ Millions) | 2013 | 2012 |
| Operating Transactions |
| Annual Deficit | (9,220) | (12,969) |
| Non-Cash Items: | | |
Amortization of Tangible Capital Assets (Note 10) | 3,930 | 3,647 |
| (Gain)/Loss on Sale of Tangible Capital Assets | (77) | 47 |
Income from Investment in Government Business Enterprises (Schedule 9) | (4,469) | (4,413) |
| PSAB Transitional Impact | (141) | (107) |
| Cash Items: | | |
Decrease/(Increase) in Accounts Receivable (Schedule 6) | 838 | (937) |
Increase in Loans Receivable (Schedule 7) | (729) | (1,163) |
Increase in Accounts Payable and Accrued Liabilities (Schedule 5) | 426 | 1,029 |
(Decrease)/Increase in Liability for Pensions and Other Employee Future Benefits (Note 7) | (440) | 352 |
Increase/(Decrease) in Other Liabilities (Note 8) | 955 | (1,445) |
Increase in Deferred Revenue and Capital Contributions (Note 6) | 564 | 514 |
Remittances from Investment in Government Business Enterprises (Schedule 9) | 3,820 | 3,962 |
| (Increase)/Decrease in Other Assets | (288) | 40 |
| Cash Provided by/(Applied to) Operating Transactions | (4,831) | (11,443) |
| Capital Transactions | | |
Acquisition of Tangible Capital Assets (Note 10) | (11,787) | (11,033) |
| Proceeds from Sale of Tangible Capital Assets | 150 | 105 |
| Cash Applied to Capital Transactions | (11,637) | (10,928) |
| Investing Transactions | | |
Increase in Investments (Note 9) | (6,543) | (181) |
| Cash Provided by/(Applied to) Investing Transactions | (6,543) | (181) |
| Financing Transactions | | |
| Long-Term Debt Issued | 37,301 | 35,276 |
| Long-Term Debt Retired | (16,522) | (14,086) |
| Net Change in Short-Term Debt | 3,008 | (541) |
| Increase in Other Long-Term Financing | 1,341 | 711 |
| Cash Provided by/(Applied to) Financing Transactions | 25,128 | 21,360 |
| Net Increase/(Decrease) in Cash and Cash Equivalents | 2,117 | (1,192) |
| Cash and Cash Equivalents at Beginning of Year | 16,380 | 17,572 |
| Cash and Cash Equivalents at End of Year | 18,497 | 16,380 |
| See accompanying Notes and Schedules to the Financial Statements. |
NOTES TO THE CONSOLIDATED FINANCIAL STATEMENTS
| | 1. | Summary of Significant Accounting Policies |
Basis of Accounting
The Consolidated Financial Statements are prepared by the Government of Ontario in compliance with legislation and in accordance with the accounting principles for governments recommended by the Public Sector Accounting Board (PSAB) of the Canadian Institute of Chartered Accountants (CICA) and, where applicable, the recommendations of the Accounting Standards Board (AcSB) of the CICA.
Reporting Entity
These financial statements report the activities of the Consolidated Revenue Fund combined with those organizations that are controlled by the Province.
Government business enterprises, significant broader public sector (BPS) organizations (i.e., hospitals, school boards and colleges) and other government organizations controlled by the Province are included in these financial statements. Controlled organizations are consolidated if they meet one of the following criteria: i) their revenues, expenses, assets or liabilities are greater than $50 million, or ii) their outside sources of revenue, deficit or surplus are greater than $10 million. However, in accordance with PSAB, the Province also applies the “benefit versus cost constraint” in determining which organizations should be consolidated in the Province’s financial statements. A listing of consolidated government organizations is provided in Schedule 8.
The activities of organizations that do not meet the materiality thresholds for consolidation or that do not meet the PSAB “benefit versus cost constraint,” such as Children’s Aid Societies and Community Care Access Centres, are reflected in these financial statements through the accounts of the ministries responsible for them.
Trusts administered by the Province on behalf of other parties are excluded from the reporting entity but are disclosed in Note 14.
Principles of Consolidation
Government business enterprises are defined as those government organizations that i) are separate legal entities with the power to contract in their own name and that can sue and be sued; ii) have the financial and operating authority to carry on a business; iii) have as their principal activity and source of revenue the selling of goods and services to individuals and non-government organizations; and iv) are able to maintain their operations and meet their obligations from revenues generated outside the government reporting entity. The activities of government business enterprises are recorded in the financial statements using the modified equity method. Under this method, government business enterprises are reported in accordance with the accounting principles generally accepted for business enterprises. Their combined net assets are included in the financial statements as Investment in Government Business Enterprises on the Consolidated Statement of Financial Position and their net income is shown as a separate item, Income from Investment in Government Business Enterprises, on the Consolidated Statement of Operations.
The assets and liabilities of the BPS organizations are consolidated with those of the Province on a line-by-line basis on the Consolidated Statement of Financial Position. As such, the net debt of hospitals, school boards and colleges is included in the consolidated net debt of the Province. The total annual expenses of these BPS organizations, net of revenues they receive directly from the public, such as tuition fees, patient fees, donations and other recoveries, are included with the consolidated expenses of the Province. The expenses of hospitals are included with Health expenses, school boards with Education expenses, and colleges with Post-Secondary Education and Training expenses on the Consolidated Statement of Operations. Where necessary, adjustments are made to present the accounts of these organizations on a basis consistent with the accounting policies of the Province, and to eliminate significant inter-organizational accounts on the Consolidated Statement of Financial Position and to remove inter-organizational gains/losses from the Consolidated Statement of Operations.
Other government organizations are included on a line-by-line basis with the consolidated assets, liabilities, revenues and expenses of the Province. Where necessary, adjustments are also made to present the accounts of these organizations on a basis consistent with the accounting policies of the Province, and to eliminate significant inter-organizational accounts and transactions.
Measurement Uncertainty
Uncertainty in the determination of the amount at which an item is recognized or disclosed in the financial statements is known as measurement uncertainty. Such uncertainty exists when there could be a material variance between the recognized or disclosed amount and another reasonably possible amount.
Measurement uncertainty in these financial statements and notes thereto exists in the valuation of pensions and other employee future benefits obligations, the value of tangible capital assets, the estimation of personal income tax, corporations tax and harmonized sales tax revenue accruals, and the valuation of the Canada Health Transfer and Canada Social Transfer entitlements.
Uncertainty related to pensions and other employee future benefits accruals arises because actual results may differ significantly from the Province’s best estimate of expected results (for example, the difference between actual results and actuarial assumptions regarding return on investment of pension fund assets and health care cost trend rates for retiree benefits). Uncertainty in the value of tangible capital assets exists because of differences between estimated useful lives of the assets and their actual useful lives. Uncertainty related to the accrual for personal income tax, corporations tax and harmonized sales tax revenues arises due to possible subsequent revisions of estimates based on information available in the future related to past-year tax return processing. Uncertainty in the estimation of the Canada Health Transfer and Canada Social Transfer entitlements arises from variances between the estimated and actual Ontario shares of the Canada-wide personal income and corporations tax base and population.
Estimates are based on the best information available at the time of preparation of the financial statements and are reviewed annually to reflect new information as it becomes available. By their very nature, estimates are subject to measurement uncertainty. Therefore, actual results may differ from the government’s estimates.
Revenues
Revenues are recognized in the fiscal year that the events giving rise to the revenues occur and they are earned. Amounts received prior to the end of the year, which relate to revenues that will be earned in a subsequent fiscal year, are deferred and reported as liabilities.
Expenses
Expenses are recognized in the fiscal year that the events giving rise to the expenses occur and resources are consumed.
Transfer payments are recognized in the year that the transfer is authorized and all eligibility criteria have been met by the recipient. Any transfers paid are deemed to have met all eligibility criteria.
Interest on debt includes: i) interest on outstanding debt net of interest income on investments and loans; ii) amortization of foreign exchange gains or losses; iii) amortization of debt discounts, premiums and commissions; iv) amortization of deferred hedging gains and losses; and v) debt servicing costs and other costs.
Employee future benefits such as pensions, other retirement benefits and entitlements upon termination are recognized as expenses over the years in which the benefits are earned by employees. These expenses are the government’s share of the current year’s cost of benefits, interest on the net benefits’ liability or asset, amortization of actuarial gains or losses, cost of or gain on plan amendment, and other adjustments.
Other employee future benefits are recognized in the period when the event that obligates the government occurs or in the period when the benefits are earned and accumulated by employees.
The costs of buildings, transportation infrastructure, vehicles, aircraft, leased assets, machinery, equipment and information technology infrastructure and systems owned by the Province and its consolidated organizations are amortized and recognized as expenses over their estimated useful lives on a straight-line basis.
Liabilities
Liabilities are recorded to the extent that they represent present obligations of the government to outside parties as a result of events and transactions occurring prior to the end of the fiscal year. The settlement of liabilities will result in the sacrifice of economic benefits in the future.
Liabilities include obligations to make transfer payments to organizations and individuals, present obligations for environmental costs, probable losses on loan guarantees issued by the government, and contingencies when it is likely that a loss will be realized and the amount can be reasonably determined.
Liabilities also include obligations to government business enterprises.
Deferred revenue represents unspent externally restricted receipts from the federal government or other third parties. Amounts received prior to year-end that relate to funding for a subsequent fiscal year are reported as deferred revenue. Deferred revenues are recorded into revenue in the period in which the amounts received are used for the purposes specified or all external restrictions are satisfied. Deferred capital contributions represent the unamortized amount of contributions received from the federal government and other third parties to construct or acquire tangible capital assets. These contributions are recognized as deferred capital contributions and recorded into revenue over the useful life of the tangible capital assets based on the relevant stipulations of the contributions taken together with the actions and communications of the Province.
Alternative Financing and Procurement (AFP) refers to the Province using private-sector partners to procure and finance infrastructure assets. Assets procured via AFP are recognized as tangible capital assets and the related obligations are recognized as other long-term financing liabilities in these financial statements as the assets are constructed.
Debt
Debt consists of treasury bills, commercial paper, medium- and long-term notes, savings bonds, debentures and loans.
Debt denominated in foreign currencies that has been hedged is recorded at the Canadian dollar equivalent using the rates of exchange established by the terms of the hedge agreements. Other foreign currency denominated debt is translated to Canadian dollars at year-end rates of exchange and any exchange gains or losses are amortized over the remaining term to maturity.
Derivatives are financial contracts, the value of which is derived from underlying instruments. The Province uses derivatives for the purpose of managing risk associated with interest cost. The Province does not use derivatives for speculative purposes. Gains or losses arising from derivative transactions are deferred and amortized over the remaining life of the related debt issue.
Pensions and Other Employee Future Benefits
The liabilities for pensions and other employee future benefits are calculated on an actuarial basis using the government’s best estimates of future inflation rates, investment returns, employee salary levels and other underlying assumptions, and, where applicable, the government’s borrowing rate. When actual plan experience of pensions, other retirement benefits and termination pay differs from that expected, or when assumptions are revised, actuarial gains and losses arise. These gains and losses are amortized over the expected average remaining service life of plan members.
Liabilities for selected employee future benefits (such as pensions, other retirement benefits and termination pay) represent the government’s share of the actuarial present values of benefits attributed to services rendered by employees and former employees, less its share of the assets of the plans. In addition, the liability includes the Province’s share of the unamortized balance of actuarial gains or losses, and other adjustments primarily for differences between the fiscal year-end of the pension plans and that of the Province.
Assets
Assets are resources controlled by the government from which it has reasonable expectation of deriving future benefit. Assets are recognized in the year the events giving rise to the government’s control of the benefit occur.
Financial Assets
Financial assets are resources that can be used to discharge existing liabilities or finance future operations. They include cash and cash equivalents, investments, accounts receivable, loans receivable, advances, and investments in government business enterprises.
Investments include temporary investments, investments in the auto sector, asset-backed term notes and portfolio investments. Temporary investments are recorded at the lower of cost or market value. Investments in the auto sector, asset-backed term notes and portfolio investments are recorded at the lower of cost or their estimated net realizable value.
Accounts receivables are recorded at cost. A valuation allowance is recorded when collection of the receivable is considered doubtful.
Loans receivable include loans to government business enterprises and loans under the student loans program, advanced manufacturing investment program, and the automotive investment strategy fund. Loans receivable with significant concessionary terms are considered in part to be grants and are recorded on the date of issuance at face value discounted by the amount of the grant portion. The grant portion is recognized as an expense at the date of issuance of the loan or when the concession is provided. The amount of the loan discount is amortized to revenue over the term of the loan.
Investment in government business enterprises represents the net assets of government business enterprises recorded on the modified equity basis as described under Principles of Consolidation.
Tangible Capital Assets
Tangible capital assets are recorded at historical cost less accumulated amortization. Historical cost includes the costs directly related to the acquisition, design, construction, development, improvement or betterment of tangible capital assets. Cost includes overheads directly attributable to construction and development, as well as interest related to financing during construction. Estimated historical cost was used to record existing tangible capital assets if actual cost was unknown when the Province first implemented tangible capital assets accounting. Tangible capital assets, except land, are amortized over the estimated useful lives of the assets on a straight-line basis.
Maintenance and repair costs are recognized as an expense when incurred. Betterments or improvements that significantly increase or prolong the service life or capacity of a tangible capital asset are capitalized. External contributions for acquisition of tangible capital assets are recorded as deferred capital contributions and amortized to revenue consistent with the amortization to expense of the related tangible capital assets, reflecting the intent of the external contributors that the grants be used to construct or acquire assets that will provide public services over the useful lives of the underlying assets.
Future Changes in Accounting Standards
PSAB 3450 – Financial Instruments and PSAB 2601 – Foreign Currency Translation
PSAB has introduced new sections on Financial Instruments and Foreign Currency Translation that categorize items to be accounted for at either fair value, cost or amortized cost. Fair value measurement applies to derivatives and portfolio investments in equity instruments that are quoted in an active market. Other financial assets and financial liabilities will generally be measured at cost or amortized cost. Until an item is derecognized (for example, through disposition), any gains and losses arising due to changes in fair value (remeasurements) will be reported in the Statement of Remeasurement Gains and Losses. Under PSAB, senior governments are required to adopt these standards in fiscal year 2015–16 or earlier. The Province is currently assessing the impact of these standards on its financial statements and will provide input to PSAB’s review of the standard planned for completion by December 2013.
PSAB 3260 – Liabilities for Contaminated Sites
During 2009–10, PSAB published a new standard on Liabilities for Contaminated Sites that provides additional guidance on how to apply the standard for liabilities (PSAB 3200) when it relates to environmental contamination of land. The new standard will apply to fiscal years beginning on or after April 1, 2014. The Ministry of Finance is currently working with relevant ministries to assess the effects of this new standard. The impact of any changes on the Province’s Consolidated Financial Statements is not reasonably determinable at this time.
Future Decision on Rate Regulated Entities
The financial results of Ontario Power Generation Inc. and Hydro One Inc. are prepared on a U.S. GAAP basis, but are consolidated in the Province’s financial statements on a Canadian GAAP basis, both bases reflecting rate regulated accounting. In December 2009, PSAB approved a standard requiring that government business enterprises adopt International Financial Reporting Standards (IFRS) for fiscal years beginning on or after January 1, 2011. As a result of concerns raised by the rate regulated sector, the IFRS implementation date for entities with qualifying rate regulated activities was extended by the Accounting Standards Board to January 1, 2015, while standard setters assess the requirements for rate regulated accounting.
PSAB/AcSB Statement of Principles on Not-for-Profit Accounting
In December 2010, not-for-profit accounting standards were incorporated into PSAB standards for use by government not-for-profit organizations for fiscal years beginning on or after January 1, 2012. In April 2013, AcSB and the Public Sector Accounting Board issued a joint Statement of Principles on Improvements to the Not-for-Profit Standards that proposes to change the way not-for-profit organizations recognize revenue, report controlled organizations, and record other activities. The Province’s Consolidated Financial Statements may be affected by any changes in the standards to the extent that government organizations are impacted by any final changes. The Ministry of Finance will continue to consult with consolidated entities and their respective ministries to identify concerns and comments to share with standard setters.
Concepts Underlying Financial Performance
PSAB is currently in the process of revisiting its conceptual framework. The conceptual framework establishes principles for the development of standards used for financial reporting by governments. The conceptual framework is important to ensure public sector standards appropriately reflect the economic substance of government transactions and to support transparency and accountability in public sector reporting. PSAB expects to complete its review by 2016.
| | 2. | Accounting and Financial Statement Presentation Changes |
During the fiscal period, many consolidated government organizations reporting on a not-for-profit basis were required by PSAB to implement changes to the standards they follow. These changes more effectively aligned their standards with those followed by governments. The change, which primarily impacts the accounting for pension and other employee future benefits by consolidated government organizations, has resulted in an adjustment to the opening net debt, accumulated deficit and other liabilities of $141 million.
The Province borrows in both domestic and international markets. Debt of $281.1 billion, as at March 31, 2013 (2012, $257.3 billion), is composed mainly of bonds and debentures issued in both the short- and long-term public capital markets and non-public debt held by certain federal and provincial public sector pension funds. Debt comprises Debt Issued for Provincial Purposes of $253.7 billion (2012, $230.3 billion) and Ontario Electricity Financial Corporation (OEFC) Debt of $27.4 billion (2012, $27.0 billion). The following table presents the maturity schedule of the Province’s outstanding debt, by currency of repayment, expressed in Canadian dollars, and reflects the effects of related derivative contracts.
Debt As at March 31 ($ Millions) | 2013 | 2012 |
| Currency | Canadian Dollar | U.S. Dollar | Japanese Yen | Euro | Other Currencies1 | Total | Total |
| Maturing in: |
| 2013 | | | | | | | $33,705 |
| 2014 | $28,640 | 12,593 | 163 | 2,345 | 1,621 | $45,362 | 24,993 |
| 2015 | 11,787 | 9,022 | 54 | – | 752 | 21,615 | 21,671 |
| 2016 | 8,449 | 9,811 | 1,033 | – | 1,798 | 21,091 | 16,723 |
| 2017 | 11,227 | 7,107 | – | – | 496 | 18,830 | 18,857 |
| 2018 | 11,110 | 4,729 | – | 385 | – | 16,224 | – |
| 1–5 years | 71,213 | 43,262 | 1,250 | 2,730 | 4,667 | 123,122 | 115,949 |
| 6–10 years | 47,480 | 7,527 | 474 | 6,277 | 2,048 | 63,806 | 52,904 |
| 11–15 years | 18,796 | – | – | – | – | 18,796 | 16,963 |
| 16–20 years | 14,227 | – | – | – | – | 14,227 | 14,200 |
| 21–25 years | 21,913 | – | – | – | – | 21,913 | 17,091 |
26–502 years | 39,201 | – | – | – | – | 39,201 | 40,171 |
Total3, 4 | $212,830 | 50,789 | 1,724 | 9,007 | 6,715 | $281,065 | $257,278 |
Debt Issued for Provincial Purposes5 | 188,721 | 48,835 | 1,724 | 8,828 | 5,621 | 253,729 | 230,314 |
OEFC Debt | 24,109 | 1,954 | – | 179 | 1,094 | 27,336 | 26,964 |
| Total | $212,830 | 50,789 | 1,724 | 9,007 | 6,715 | $281,065 | $257,278 |
| Effective Interest Rates (Weighted Average) |
| 2013 | 4.42% | 2.75% | 1.40% | 4.29% | 3.80% | 4.08% | – |
| 2012 | 4.74% | 2.99% | 1.27% | 4.24% | 3.79% | – | 4.35% |
1 Other currencies comprise Australian dollar, New Zealand dollar, Norwegian krone, UK Pound sterling, Swiss franc, Hong Kong dollar and South African rand. 2 The longest term to maturity is to June 2, 2062. 3 Total foreign currency denominated debt as at March 31, 2013, was $68.2 billion (2012, $65.3 billion). Of that, $66.3 billion or 97.1 per cent (2012, $63.0 billion or 96.4 per cent) was fully hedged to Canadian dollars. The remaining 2.9 per cent (2012, 3.6 per cent) of foreign debt was unhedged as follows: $1.5 billion (2012, $1.8 billion) Japanese yen denominated debt and $486 million (2012, $500 million) Swiss franc denominated debt. 4 Total debt includes issues totalling $0.75 billion (2012, $0.75 billion), which have embedded options exercisable by either the Province or the bondholder under specific conditions. 5 Debt denominated in Canadian dollars as at March 31, 2013 includes $4.9 billion (2012, $3.4 billion) long-term debt and $1.4 billion (2012, $0.05 billion) short-term debt purchased and held by the Province. |
Debt As at March 31 ($ Millions) | 2013 | 2012 |
| Debt Payable to/of: | | |
| Public Investors | $267,448 | $242,295 |
| Canada Pension Plan Investment Fund | 10,233 | 10,233 |
| Ontario Immigrant Investor Corporation | 1,108 | 1,185 |
| School Board Trust Debt | 739 | 759 |
| Public Service Pension Plan Fund | 656 | 1,048 |
| Canada Mortgage and Housing Corporation | 569 | 635 |
| Ontario Public Service Employees Union Pension Fund | 312 | 498 |
| Ontario Teachers’ Pension Plan Fund | – | 625 |
| Total | $281,065 | $257,278 |
Fair value of debt outstanding approximates amounts at which debt instruments could be exchanged in a current transaction between willing parties. In valuing the Province’s debt, fair value is estimated using discounted cash flows and other valuation techniques and is compared to public market quotations where available. These estimates are affected by the assumptions made concerning discount rates and the amount and timing of future cash flows.
The estimated fair value of debt as at March 31, 2013 was $318.4 billion (2012, $292.3 billion). This is higher than the book value of $281.1 billion (2012, $257.3 billion) because current interest rates are generally lower than the interest rates at which the debt was issued. The fair value of debt does not reflect the effect of related derivative contracts.
School Board Trust Debt
A School Board Trust was created in June 2003 to permanently refinance debt incurred by 55 school boards. The Trust issued 30-year sinking fund debentures amounting to $891 million, and provided $882 million of the proceeds to the 55 school boards in exchange for the irrevocable right to receive future transfer payments from the Province related to this debt. An annual transfer payment is made by the Ministry of Education to the Trust’s sinking fund under the School Board Operating Grant program to retire the debt over 30 years.
| | 4. | Risk Management and Derivative Financial Instruments |
The Province employs various risk management strategies and operates within strict risk exposure limits to ensure exposure to risk is managed in a prudent and cost-effective manner. A variety of strategies are used, including the use of derivative financial instruments (“derivatives”).
Derivatives are financial contracts, the value of which is derived from underlying instruments. The Province uses derivatives to hedge and to minimize interest costs. Hedges are created primarily through swaps, which are legal contracts under which the Province agrees with another party to exchange cash flows based on one or more notional amounts using stipulated reference interest rates for a specified period. Swaps allow the Province to offset its existing obligations and thereby effectively convert them into obligations with more desirable characteristics. Other derivative instruments used by the Province include forward foreign exchange contracts, forward rate agreements, futures and options.
Foreign exchange or currency risk is the risk that foreign currency debt principal and interest payments and foreign currency transactions will vary in Canadian dollar terms due to fluctuations in foreign exchange rates. To manage currency risk, the Province uses derivative contracts including forward foreign exchange contracts, futures, options and swaps to convert foreign currency cash flows into Canadian dollar cash flows. Most of the derivative contracts hedge the underlying debt by matching all the critical terms to achieve effectiveness. In the instances where the term of forward foreign exchange contracts used for hedging is shorter than the term of the underlying debt, the effectiveness is maintained by continuously rolling the forward foreign exchange contract over the remaining term of the underlying debt, or until replaced with a long-term derivative contract.
The current market risk policy allows the amount of unhedged foreign currency debt principal net of foreign currency holdings to reach a maximum of 5 per cent of Total Debt Issued for Provincial Purposes and OEFC. At March 31, 2013, the respective unhedged levels were 0.8 and nil per cent (2012, 1.0 and nil per cent). A one Japanese yen appreciation of the Japanese currency, relative to the Canadian dollar, would result in unhedged debt denominated in Japanese yen increasing by $16.2 million (2012, $22.2 million) and a corresponding increase in interest on debt of $6.4 million (2012, $7.0 million). A one Swiss rappen appreciation of the Swiss currency, relative to the Canadian dollar, would result in unhedged debt denominated in Swiss franc increasing by $5.1 million (2012, $5.6 million) and a corresponding increase in interest on debt of $0.7 million (2012, $0.9 million). Total foreign exchange gains/losses recognized in the Statement of Operations for 2012–13 were losses of $5.0 million (2011–12, losses of $53.2 million).
Interest on debt expense may also vary as a result of changes in interest rates. In respect of Debt Issued for Provincial Purposes and OEFC debt, the risk is measured as interest rate resetting risk, which is the net of floating rate exposure, liquid reserves and fixed rate debt maturing within the next 12-month period as a percentage of Debt Issued for Provincial Purposes and OEFC debt respectively. Depending on market conditions, the Province creates or reduces its exposure to interest rate changes by issuing or retiring short-term debt, or by entering into or closing out derivative positions.
The current market risk policy limits net interest rate resetting risk for Debt Issued for Provincial Purposes and OEFC debt to a maximum of 35 per cent. At March 31, 2013, the net interest rate resetting risk for Debt Issued for Provincial Purposes and OEFC debt was 8.9 per cent and 28.0 per cent respectively (2012, 8.3 per cent and 13.2 per cent). Based on floating rate interest-bearing financial instruments on hand at March 31, 2013, plus planned refinancing of maturing debt in the coming year, a one per cent (100 basis point) increase in interest rates would result in an increase in interest on debt of $308 million (2012, $232 million).
Liquidity risk is the risk that the Province will not be able to meet its current short-term financial obligations. To reduce liquidity risk, the Province maintains liquid reserves, that is, cash and temporary investments (Note 9), adjusted for collateral (Note 12), at levels that will meet future cash requirements and give the Province flexibility in the timing of issuing debt. Pledged assets are considered encumbered for liquidity purposes while collateral held that can be sold or repledged is a source of liquidity. In addition, the Province has short-term note programs as alternative sources of liquidity.
The table below presents a maturity schedule of the Province’s derivatives, by type, outstanding as at March 31, 2013, based on the notional amounts of the contracts. Notional amounts represent the volume of outstanding derivative contracts and are not indicative of credit risk, market risk or actual cash flows.
Derivative Portfolio Notional Value As at March 31 ($ Millions) | 2013 | 2012 |
Maturity in Fiscal Year | 2014 | 2015 | 2016 | 2017 | 2018 | 6-10 Years | Over 10 Years | Total | Total |
| Swaps: | | | | | | | | | |
Interest Rate1 | $15,398 | $23,687 | $19,272 | $17,812 | $10,730 | $22,752 | $7,385 | $117,036 | $112,799 |
| Cross Currency | 11,702 | 9,650 | 8,649 | 8,349 | 3,676 | 19,848 | – | 61,874 | 65,780 |
Forward Foreign Exchange Contracts | 19,303 | – | – | – | – | – | – | 19,303 | 11,877 |
Swaption2 | 100 | 150 | – | 500 | – | – | – | 750 | 750 |
| Total | $46,503 | $33,487 | $27,921 | $26,661 | $14,406 | $42,600 | $7,385 | $198,963 | $191,206 |
1 Includes $3.7 billion (2012, $3.2 billion) of interest rate swaps related to loans receivable held by a consolidated entity. 2 See glossary for definition. |
The use of derivatives introduces credit risk, which is the risk of a counterparty defaulting on contractual derivative obligations in which the Province has an unrealized gain. The table below presents the credit risk associated with the derivative financial instrument portfolio, measured through the replacement value of derivative contracts, at March 31, 2013.
Credit Risk Exposure As at March 31 ($ Millions) | 2013 | 2012 |
| Gross Credit Risk Exposure | $4,774 | $4,866 |
| Less: Netting | (3,977) | (3,962) |
| Net Credit Risk Exposure | 797 | 904 |
Less: Collateral Received (Note 12) | (456) | (616) |
| Net Credit Risk Exposure (Net of Collateral) | $341 | $288 |
The Province manages its credit risk exposure from derivatives by, among other things, dealing only with high credit quality counterparties and regularly monitoring compliance to credit limits. In addition, the Province enters into contractual agreements (“master agreements”) that provide for termination netting and, if applicable, payment netting with most of its counterparties. Gross Credit Risk Exposure represents the loss that the Province would incur if every counterparty to which the Province had credit risk exposure were to default at the same time, and the contracted netting provisions were not exercised or could not be enforced. Net Credit Risk Exposure is the loss including the mitigating impact of these netting provisions. Net Credit Risk Exposure (Net of Collateral) is the potential loss to the Province further mitigated by the collateral received from counterparties.
| | 5. | Other Long-Term Financing |
Other long-term financing comprises the total debt of the Broader Public Sector (BPS) and obligations under Alternative Financing and Procurement (AFP) arrangements.
Other Long-Term Financing of $11.5 billion, as at March 31, 2013 (2012, $10.2 billion) includes BPS Debt of $5.7 billion (2012, $5.8 billion), BPS AFP obligations of $4.0 billion (2012, $2.8 billion) and direct provincial AFP obligations of $1.8 billion (2012, $1.6 billion).
| | 6. | Deferred Revenue and Capital Contributions |
Deferred Revenue and Capital Contributions As at March 31 ($ Millions) | 2013 | 2012 |
| Deferred Revenue: | | |
Teranet | $1,022 | $1,054 |
Vehicle and Driver Licences | 687 | 649 |
| Other | 1,790 | 1,653 |
| Total Deferred Revenue | 3,499 | 3,356 |
Deferred Capital Contributions1 | 5,618 | 5,197 |
| Total | $9,117 | $8,553 |
1 Most federal transfers have been reclassified to deferred capital contributions. |
In 2010–11, the Province renewed its long-standing business partnership with Teranet Inc. by extending Teranet’s exclusive licences to provide electronic land registration and writs services in Ontario for an additional 50 years. The Province received approximately a $1 billion upfront payment for the transaction, which is amortized into revenue over the life of the contract.
The Province provides a two-year vehicle licence plate renewal option and multi-year driver licence renewals (two years for seniors and five years for all others). Amounts received under these multi-year renewals are recognized as revenue over the periods covered by the licences.
Deferred capital contributions represent the unamortized portion of tangible capital assets or liabilities to construct or acquire tangible capital assets from specific-purpose funding received from the Government of Canada, municipalities or third parties. Deferred capital contributions are recorded in revenue over the estimated useful life of the underlying tangible capital asset once constructed or acquired by the Province.
| | 7. | Pensions and Other Employee Future Benefits |
| Pensions and Other Employee Future Benefits Liability (Asset) |
As at March 31 ($ Millions) | 2013 | 2013 | 2013 | 2012 |
| | Pensions | Other Employee Future Benefits | Total | Total |
| Obligation for benefits | $103,500 | $12,607 | $116,107 | $113,741 |
| Less: plan fund assets | (108,400) | (515) | (108,915) | (103,740) |
| Unamortized actuarial gains | (3,552) | (1,385) | (4,937) | (7,242) |
Adjustments1 | 2,100 | 7 | 2,107 | 2,043 |
| Total | ($6,352) | $10,714 | $4,362 | $4,802 |
1 Adjustments for pensions consist of: i) differences for amounts reported by the pension plans at December 31, instead of the Province’s year-end of March 31 ii) unamortized difference between employer and employee contributions for jointly sponsored pension plans iii) unamortized employee contribution reductions for solely sponsored plans iv) amounts payable by the Province that are reflected as contributions in the pension plan assets. |
| Pensions and Other Employee Future Benefits Expense |
For the year ended March 31 ($ Millions) | 2013 | 2013 | 2013 | 2012 |
| | Pensions | Other Employee Future Benefits | Total | Total |
| Cost of benefits | $2,166 | $529 | $2,695 | $2,528 |
| Amortization of actuarial losses | 255 | 205 | 460 | 162 |
| Employee contributions | (304) | – | (304) | (307) |
| Interest (income) expense | (275) | 313 | 38 | (121) |
Adjustments1 | (102) | (1) | (103) | (88) |
Total2,3 | $1,740 | $1,046 | $2,786 | $2,174 |
1 Adjustments for Pensions consist of amortization of: i) the difference between employer and employee contributions for jointly sponsored pension plans ii) employee contribution reductions for solely sponsored plans. 2 Total Pensions and Other Employee Future Benefits Expense is reported in Schedule 3. The Teachers’ Pension expense of $895 million (2011–12, $523 million) is included in the Education expense in the Consolidated Statement of Operations and is disclosed separately in Schedule 4. The Public Service and OPSEU Pension expense of $845 million (2011–12, $706 million) and Other Employee Future Benefits — Retirement Benefits expense of $674 million (2011–12, $594 million) are included in the General Government and Other expense in the Consolidated Statement of Operations. The combined total of Public Service and OPSEU Pension and Other Employee Future Benefits — Retirement Benefits expense of $1,519 million (2011–12, $1,300 million) is disclosed separately in Schedule 4. The remainder of Other Employee Future Benefits expense is included in the relevant ministries’ expenses in Schedule 4. 3 The Pensions and Other Employee Future Benefits Expenses for the hospitals, school boards and colleges sectors (except for the Ontario Teachers’ Pension Plan) are not included in the table above. These expenses are included in the Salaries, Wages and Benefits of BPS organizations (Schedule 10) and in the expenses of the BPS ministries (Education, Health and Long-Term Care, and Training, Colleges and Universities) in Schedule 4. |
Pensions
The Province sponsors several pension plans. It is the sole sponsor of the Public Service Pension Plan (PSPP) and joint sponsor of the Ontario Public Service Employees Union (OPSEU) Pension Plan and the Ontario Teachers’ Pension Plan (OTPP).
These three plans are contributory defined benefit plans that provide Ontario government employees and elementary and secondary school teachers and administrators with a guaranteed amount of retirement income. Benefits are based primarily on the best five-year average salary of members and their length of service, and are indexed to changes in the Consumer Price Index to provide protection against inflation. Plan members normally contribute seven to eleven per cent of their salaries to these plans. The Province matches these contributions.
The obligation for benefits and plan fund assets of these plans is based on actuarial accounting valuations that are performed annually. The government’s best estimate of the long-term annual inflation rate used in the pension and other employee future benefits calculations disclosed in these financial statements is 2.5 per cent; the salary escalation rate is 3.5 per cent; and the discount rate and expected rate of return on pension plan assets are 6.75 per cent for OTPP, 6.5 per cent for PSPP and 6.75 per cent for OPSEU Pension Plan. Salary assumptions incorporate recent bargaining agreements reached including the Province of Ontario’s two-year legislated teachers’ salary freeze for 2012 and 2013. Actuarial gains or losses are amortized over the expected average remaining service life of the employees of 10.6 to 14.6 years.
Funding of these plans is based on statutory actuarial funding valuations undertaken at least once every three years. The Province contributed $1,395 million to OTPP in 2012–13 (2011–12, $1,346 million), $366 million (including a $127 million special payment) to PSPP (2011–12, $359 million including a $127 million special payment), and $231 million to OPSEU Pension Plan (2011–12, $212 million). During calendar year 2012, OTPP paid benefits, including transfers to other plans, of $4.9 billion (2011, $4.7 billion), PSPP paid $1,023 million (2011, $937 million) and OPSEU Pension Plan paid $745 million (2011, $664 million). Under agreements between the Province and OPSEU, and between the Province and the Ontario Teachers’ Federation (OTF), gains and losses arising from statutory actuarial funding valuations are shared by the co-sponsors.
The Province is also responsible for sponsoring the Public Service Supplementary Benefits Plan and the Ontario Teachers’ Retirement Compensation Arrangement. Expenses and liabilities of these plans are included in the Pensions Expense and Pensions Liability reported in the above tables.
Pension benefits for employees in the hospital and colleges sectors are provided by the Healthcare of Ontario Pension Plan (HOOPP) and the Colleges of Applied Arts and Technology Pension Plan (CAATPP).
HOOPP is a multi-employer pension plan covering employees of Ontario’s health care community. CAATPP is a multi-employer pension plan covering employees of the Colleges of Applied Arts and Technology in Ontario, the Board of Trustees, the Ontario College Application Services and the Ontario College Library Services. Both of these plans are accounted for as joint contributory defined benefit plans that provide eligible members with a retirement income based on a formula that takes into account a member’s earnings history and length of service in the plan. The plans are financed by contributions from participating members and employers, and by investment earnings. As organizations covered under these plans are in the government’s reporting entity, the Province includes 56 per cent of BPS organizations’ portion1 of the net obligation of HOOPP and includes 50 per cent of the net obligation of CAATPP. ______________________________________
1 BPS organizations are represented in HOOPP at 86 per cent in 2012–13 (2011–12, 87 per cent).
The obligation for benefits and plan fund assets of these plans is based on actuarial accounting valuations that are performed annually. The government’s best estimate of the long-term annual inflation rate used in the pension calculations for BPS organizations disclosed in these financial statements is 2.5 per cent; the salary escalation rate is 4.75 per cent for HOOPP and 3.5 per cent for CAATPP; and the discount rate and expected rate of return on pension plan assets are 6.25 per cent for HOOPP and 6.5 per cent for CAATPP. Actuarial gains or losses are amortized over the expected average remaining service life of the employees of 12.3 years for HOOPP and 10.6 years for CAATPP.
Expenses for HOOPP of $1,036 million (2011–12, $995 million) and CAATPP of $213 million (2011–12, $179 million) are included in the Salaries, Wages and Benefits expenses of the hospital and colleges sectors respectively (Schedule 10) and in the expenses of the related ministries (Schedule 4). The related liabilities are included in the Pensions and Other Employee Future Benefits liability on the Consolidated Statement of Financial Position.
Funding of these plans is based on statutory actuarial funding valuations undertaken at least once every three years. The employers contributed $847 million to HOOPP in 2012–13 (2011–12, $827 million) and $169 million to CAATPP (2011–12, $153 million). During calendar year 2012, HOOPP paid benefits of $1,486 million (2011, $1,335 million), and CAATPP paid $332 million (2011, $303 million).
Other Employee Future Benefits
Other Employee Future Benefits are non-pension retirement benefits, post-employment benefits, compensated absences and termination benefits.
Non-Pension Retirement Benefits
The Province provides dental, basic life insurance, supplementary health and hospital benefits to retired employees through a self-insured, unfunded defined benefit plan. The liability for non-pension retirement benefits of $7.8 billion as at March 31, 2013 (2012, $7.5 billion) is included in the Other Employee Future Benefits Liability. The expense for 2012–13 of $674 million (2011–12, $594 million) (excluding the expense for BPS organizations) is included in the Other Employee Future Benefits Expense. The BPS expense of $349 million in 2012–13 (2011–12, $757 million) includes a plan curtailment for school boards that resulted in a one-time gain of $464 million, due to changes to employee retirement gratuity plan benefits associated with vested sick leave and retiree health, life and dental plans. The BPS expense is included in the Salaries, Wages and Benefits expense of BPS organizations (Schedule 10) and in the expenses of the related ministries (Schedule 4).
The discount rate used in the non-pension retirement benefits calculation for 2012–13 is 4.20 per cent (2011–12, 4.85 per cent). The discount rate used by BPS organizations in the non-pension retirement benefits calculation for 2012–13 ranges from 2.75 per cent to 4.00 per cent (2011–12, 4.00 per cent to 5.00 per cent).
Post-Employment Benefits, Compensated Absences and Termination Benefits
The Province provides, on a self-insured basis, workers’ compensation benefits, long-term disability benefits and regular benefits to employees who are on long-term disability. For employees who have completed five years of service, the Province provides termination pay equal to one week’s salary for each year of service up to a maximum of 50 per cent of their annual salary. Employees who have completed one year of service but less than five years are also entitled to termination pay in the event of death, retirement or release from employment. The total post-employment benefits liability of $2.9 billion as at March 31, 2013 (2012, $3.6 billion) is included in the Other Employee Future Benefits Liability. The total post-employment benefits expense for 2012–13 of $372 million (2011–12, $351 million) (excluding the expense for BPS organizations) is included in the Other Employee Future Benefits Expense. The BPS post-employment benefits recovery of $17 million in 2012–13 (2011–12, BPS post-employment benefit expense of $746 million) includes a plan curtailment for school boards that resulted in a one-time gain of $981 million, due to changes to post-employment and compensated absence benefits associated with non-vested, accumulated sick leave. The BPS expense is included in the Salaries, Wages and Benefits expense of BPS organizations (Schedule 10) and in the expenses of the related ministries (Schedule 4).
The discount rate used in the post-employment benefits, compensated absences and termination benefits calculations for 2012–13 is 3.70 per cent (2011–12, 4.30 per cent). The discount rate used by BPS organizations in the post-employment benefits for 2012–13 ranges from 2.75 per cent to 4.00 per cent (2011–12, 3.00 per cent to 5.00 per cent).
Other Liabilities As at March 31 ($ Millions) | 2013 | 2012 |
| Power Purchase Contracts | $939 | $1,202 |
| Other Funds and Liabilities | 2,810 | 1,592 |
| Total | $3,749 | $2,794 |
Power Purchase Contracts
Power supply contracts include both power purchase contracts and power supply support agreements. Power purchase contracts and related loan agreements were entered into by Ontario Hydro with non-utility generators (NUGs) located in Ontario. As the legal continuation of Ontario Hydro, Ontario Electricity Financial Corporation (OEFC), a consolidated government organization, is the counterparty to these contracts. The contracts, expiring on various dates to 2048, provided for the purchase of power at prices that were expected to be in excess of the market price. Accordingly, a liability was recorded at $4.3 billion on a discounted cash-flow basis when Ontario Hydro was continued as OEFC on April 1, 1999.
Under legislated reforms to the electricity market, OEFC began receiving actual contract prices for power from ratepayers effective January 1, 2005, and no longer incurs losses on these contracts. At that time, it was estimated that the bulk of the liability would be eliminated over 12 years as existing electricity contracts expired. The decrease in the liability for power purchase contracts for 2012–13 was $263 million (2011–12, $317 million). This results in a liability of $0.9 billion as at March 31, 2013 (2012, $1.2 billion).
In addition, effective January 1, 2009, OEFC entered into a support contract with Ontario Power Generation Inc. (OPG) whereby OPG agreed to maintain the reliability and availability of Lambton and Nanticoke coal-fired stations following implementation of a greenhouse gas emissions-reduction strategy. Under the contract, OEFC agreed to ensure OPG would recover the actual costs of operating the stations after implementing this strategy. Any costs to OEFC under this agreement, which expires December 31, 2014, are fully recovered from electricity ratepayers. In March 2013, the contract was amended to support the decision to advance the closure of these plants by one year to the end of 2013. Under the amended contract, OPG is allowed to recover actual costs that cannot reasonably be avoided or mitigated, during the period from the early shutdown date until December 31, 2014, consistent with the original end date of the contract.
During the year ended March 31, 2013, OEFC’s cost under power supply contracts totalled $1,323 million (2011–12, $1,375 million), including purchases of power from NUGs of $1,026 million (2011–12, $1,020 million) and OPG support contract costs of $297 million (2011–12, $355 million). These costs were recovered from electricity ratepayers (as shown in Schedules 1, 3 and 4).
Other Funds and Liabilities
Other funds and liabilities include pension and benefit funds related to the Provincial Judges’ Pension Fund, the Public Service and the Deputy Ministers’ Supplementary Benefit Accounts, externally restricted funds and other long-term liabilities.
Investments As at March 31 ($ Millions) | 2013 | 2012 |
| Temporary Investments | $15,534 | $10,247 |
| Add: Assets Purchased under Resale Agreements | 2,587 | 1,818 |
| Less: Assets Sold under Repurchase Agreements | (273) | (823) |
| Total Temporary Investments | $17,848 | $11,242 |
| Auto Sector Investments at Net Realizable Value | 737 | 737 |
| Other Investments | 1,833 | 1,881 |
| Asset-Backed Term Notes | 423 | 438 |
| Total Investments | $20,841 | $14,298 |
Temporary Investments
Temporary investments primarily consist of investments in government bonds. The fair value of temporary investments, including assets purchased and sold under resale and repurchase agreements at March 31, 2013, is $17.8 billion (2012, $11.2 billion). Fair value is determined using quoted market prices.
A resale agreement is an agreement between two parties where the Province purchases and subsequently resells a security at a specified price on a specified date. A repurchase agreement is an agreement between two parties where the Province sells and subsequently repurchases a security at a specified price on a specified date.
Investments in the Auto Sector
In 2009, the Province committed to provide one-third of the total Canadian financial assistance, to a maximum of $4.8 billion, as part of a co-ordinated response with the Canadian and U.S. federal governments to support the restructuring of the North American automotive industry. The Province’s one-third interest was initiated through a Loan Participation Agreement with Export Development Canada (EDC), a federal Crown corporation. Interest-bearing loans of $13.7 billion were issued by the Canadian government through EDC, of which the Province’s interest in the loans issued was $4.6 billion.
During 2010, EDC agreed to transfer $9.1 billion of the $13.7 billion of outstanding loans to the Canada Development Investment Corporation (CDIC), another federal Crown corporation, through a transfer agreement for nominal consideration. These loans were exchanged by CDIC for common and preferred shares of the borrower. The rights of the Province to a one-third interest in the proceeds of these shares are governed under Memoranda of Understanding between the Canadian government and the Province.
The Province has accounted for its participative interests in the auto sector as investments in these financial statements. The balance as at March 31, 2013 of $737 million (2012, $737 million) includes $603 million (2012, $603 million) of marketable securities with a quoted market value of $1.3 billion (2012, $1.2 billion).
Asset-Backed Term Notes
On January 21, 2009, the restructuring of the frozen Canadian third-party asset-backed commercial paper (ABCP) was completed. Upon completion, the Province received long-term notes issued by the Master Asset Vehicle (MAV). As at March 31, 2013, the Province held $545 million (2012, $576 million) at par with an estimated net realizable value of $423 million (2012, $438 million) in these restructured long-term notes that were issued by the MAV.
Other Investments
Other investments represent the investments of BPS organizations. These investments primarily consist of fixed income securities. The fair value of these investments approximates book value.
| | 10. | Tangible Capital Assets |
Tangible Capital Assets As at March 31 ($ Millions) |
| | Land | Buildings | Transportation Infrastructure | Machinery and Equipment | Information Technology | Other | Total |
| Cost |
| Opening Balance | 11,400 | 59,960 | 25,588 | 10,550 | 3,291 | 4,426 | 115,215 |
Additions and Valuation Adjustments1 | 632 | 5,754 | 3,142 | 839 | 432 | 988 | 11,787 |
| Disposals | (17) | (194) | (2,933) | (240) | (139) | (50) | (3,573) |
| Closing Balance | 12,015 | 65,520 | 25,797 | 11,149 | 3,584 | 5,364 | 123,429 |
| | | | | | | | |
| Accumulated Amortization |
| Opening Balance | – | 16,538 | 10,185 | 7,723 | 1,995 | 1,602 | 38,043 |
| Additions | – | 1,718 | 909 | 709 | 271 | 323 | 3,930 |
| Disposals | – | (148) | (2,937) | (235) | (131) | (49) | (3,500) |
| Closing Balance | – | 18,108 | 8,157 | 8,197 | 2,135 | 1,876 | 38,473 |
| | | | | | | | |
| Net Book Value |
| 2013 | 12,015 | 47,412 | 17,640 | 2,952 | 1,449 | 3,488 | 84,956 |
| 2012 | 11,400 | 43,422 | 15,403 | 2,827 | 1,296 | 2,824 | 77,172 |
1 Includes write-downs and other adjustments. |
Land includes land acquired for transportation infrastructure, parks, buildings and other program use, and land improvements that have an indefinite life and are not being amortized. Land excludes Crown lands acquired by right.
Buildings includes administrative and service structures, and construction in progress.
Transportation Infrastructure includes provincial highways, railways, bridges and related structures and facilities, but excludes land and buildings.
Machinery and Equipment consists mainly of hospital equipment.
Information Technology consists of computer hardware and software.
Other includes leased assets, vehicles, aircraft and other miscellaneous tangible capital assets owned by the government and its consolidated organizations.
Works of art and historical treasures are excluded from tangible capital assets.
All tangible capital assets, except assets under construction, land and land improvements with an indefinite life, are being amortized on a straight-line basis over their estimated useful lives. Amortization expense for the fiscal year 2012–13 totalled $3.9 billion, of which $1.5 billion (2011–12, $1.3 billion) relates to the Province and $2.4 billion (2011–12, $2.3 billion) relates to the BPS. The latter expense is included under the BPS expense reported on Schedule 10. The useful lives of the Province’s tangible capital assets have been estimated as:
Buildings 20 to 40 years
Transportation Infrastructure 10 to 60 years
Machinery and Equipment 3 to 30 years
Information Technology 3 to 10 years
Other 3 to 25 years
| | 11. | Changes in the Fair Value of Ontario Nuclear Funds |
The Ontario Nuclear Funds Agreement (ONFA) Funds were established by Ontario Power Generation Inc. (OPG) and the Province to ensure that sufficient funds will be available to pay for the costs of nuclear station decommissioning and nuclear used fuel waste management. Effective January 1, 2007, OPG adopted the new accounting standards issued by the Canadian Institute of Chartered Accountants on the recognition and measurement of financial instruments. As a result, the ONFA Funds are carried at fair value in OPG’s financial statements.
Since April 1, 2007, the fair value of ONFA Funds has been reflected in the Province’s Consolidated Financial Statements. Unrealized gains and losses of ONFA Funds are included in Investment in Government Business Enterprises and recorded as an Increase (Decrease) in Fair Value of Ontario Nuclear Funds in the Consolidated Statement of Change in Net Debt and the Consolidated Statement of Change in Accumulated Deficit. Realized gains and losses of ONFA Funds are included in Income from Investment in Government Business Enterprises. Inter-organizational balances related to ONFA Funds are eliminated.
ONFA Funds incurred unrealized gains in 2012–13 of $639 million (unrealized losses in 2011–12, $3 million) that resulted in an increase in Investment in Government Business Enterprises, and a corresponding decrease in Net Debt and Accumulated Deficit.
| | 12. | Contingent Liabilities |
Obligations Guaranteed by the Province
The authorized limit for loans guaranteed by the Province as at March 31, 2013, was $1.5 billion (2012, $1.1 billion). The outstanding loans guaranteed and other contingencies amounted to $1.2 billion as at March 31, 2013 (2012, $931 million). A provision of $8 million (2012, $12 million) based on an estimate of the likely loss arising from guarantees under the Student Support Programs has been reflected in these financial statements.
Ontario Nuclear Funds Agreement (ONFA)
Under ONFA, the Province is liable to make payments should the cost estimate for nuclear used fuel waste management rise above specified thresholds, for a fixed volume of used fuel. The likelihood and amount by which the cost estimate could rise above these thresholds cannot be determined at this time. The cost estimate will be updated periodically to reflect new developments in the management of nuclear used fuel waste.
As well, under ONFA, the Province guarantees a return of 3.25 per cent over the Ontario Consumer Price Index for the portion of the nuclear used fuel waste management segregated fund related to the fixed volume of used fuel. If the earnings on assets in that fund related to the fixed volume exceed the guaranteed rate, the Province is entitled to the excess.
Two agreements are in place to satisfy the Canadian Nuclear Safety Commission (CNSC) licensing requirements for financial guarantees in respect of OPG’s nuclear station decommissioning and nuclear waste management obligations. One agreement gives the CNSC access (in prescribed circumstances) to the segregated funds established under ONFA. The other agreement between the Province and the CNSC provides a direct provincial guarantee to the CNSC on behalf of OPG. This guarantee, for up to $1.551 billion, effective January 1, 2013, previously $1.545 billion, relates to the portion of the decommissioning and waste management obligations not funded by the estimated value of ONFA funds as at January 1, 2013. In return, the Province receives from OPG an annual fee equal to 0.5 per cent of the value of the guarantee. The provincial guarantee is in effect through the end of 2017, when the next reference plan for the CNSC is planned to be approved.
Social Housing — Loan Insurance Agreements
For all non-profit housing projects in the provincial portfolio, the Province is liable to indemnify and reimburse the Canada Mortgage and Housing Corporation (CMHC) for any net costs, including any environmental liabilities, incurred as a result of project defaults through the Ministry of Municipal Affairs and Housing or the Ontario Mortgage and Housing Corporation.
At March 31, 2013, there were $6.3 billion (2012, $6.7 billion) of mortgage loans outstanding. As operating subsidies provided by the Province are sufficient to ensure that all mortgage payments can be made when due, default is unlikely. To date, there have been no claims for defaults on insured mortgage loans.
Claims Against the Crown
There are claims outstanding against the Crown of which 62 (2012, 65) are for amounts over $50 million. These claims arise from legal action, either in progress or threatened, in respect of aboriginal land claims, breach of contract, damages to persons and property, and like items. The cost to the Province, if any, cannot be determined because the outcome of these actions is uncertain.
Canadian Blood Services
The provincial and territorial governments of Canada have entered into a Canadian Blood Services Excess Insurance Captive Support Agreement (the “Captive Support Agreement”) with Canadian Blood Services (CBS) and Canadian Blood Services Captive Insurance Company Limited (CBSI), a wholly owned subsidiary of CBS. Under the Captive Support Agreement, each government indemnifies CBSI for its pro-rata share of any payments that CBSI becomes obliged to make under a comprehensive blood risks insurance policy it provides to CBS. The policy has an overall limit of $750 million, which may cover settlements, judgments and defence costs. The policy is in excess of, and secondary to, a $250 million comprehensive insurance policy underwritten by CBS Insurance Company Limited, a subsidiary of CBS. Given current populations, Ontario’s maximum potential liability under the Captive Support Agreement is approximately $376 million. The Province is not aware of any proceedings that could lead to a claim against it under the Captive Support Agreement.
Legal Aid Ontario – Certificates
Legal Aid Ontario (LAO) issues certificates to individuals seeking legal aid assistance. Each certificate issued authorizes legal services to be performed within the tariff guidelines. At March 31, 2013, a potential $53.6 million (2012, $50.4 million) could still be incurred on certificates issued on or before March 31, 2013, over and above the billings received to date.
Pan/Parapan American Games
On November 6, 2009, Pan American Sports Organization (PASO) members voted to award Toronto and the Golden Horseshoe region the hosting rights of the 2015 Pan/Parapan American Games. Under the Ontario Support Agreement (OSA), the Province has agreed to act as the deficit guarantor. The deficit guarantee will be applicable to the activities of Toronto 2015 in performing its Pan Am-related commitments. The deficit guarantee stipulates that payments of any approved expenses in excess of the aggregate agreed contribution to the Games by all parties are the responsibility of the Province, provided that such expenses have been incurred in an agreed manner and approved by the Province in accordance with the terms and conditions of the OSA. Any future expense associated with this guarantee is undeterminable as at March 31, 2013.
General Real Estate Portfolio – Lease Obligation
Prior to the amalgamation of Stadium Corporation of Ontario Limited (STADCO) with Infrastructure Ontario and the Ontario Realty Corporation on June 6, 2011, all assets, liabilities and operations of STADCO were transferred to the General Real Estate Portfolio (GREP), including ground leases dated June 3, 1989, with Canada Lands Company (CLC) for the SkyDome Lands and the sublease to Rogers Stadium Limited Partnership (sub-tenant). Under the terms of the ground lease, GREP is responsible for base rent, realty taxes, utilities and certain operating costs, which are assumed by the sub-tenant under the terms of the sub-lease. In the event of a default by the sub-tenant, the potential financial impact to GREP is estimated to be the base rent, in the range of $300 million to $400 million annually, plus realty taxes, utilities and certain operating costs.
Collateral
The Province has entered into securities repurchase agreements and collateralized swap agreements with certain counterparties. Under the terms of those agreements, the Province may be required to pledge and/or receive assets relating to obligations to the counterparties. In the normal course of business, these pledged securities will be returned to the pledgor when there are no longer any outstanding obligations.
As at March 31, 2013, the Province pledged assets in the carrying amount of $1.9 billion (2012, $2.6 billion), which are included in Investments and/or Cash and Cash Equivalents.
| | 13. | Contractual Obligations |
Contractual Obligations as at March 31 ($ Millions) | | Minimum Payments to be made in: |
| 2013 | 2012 | 2014 | 2015 | 2016 | 2017 | 2018 | 2019 and thereafter |
| Transfer Payments | $9,326 | $8,967 | $4,479 | $2,999 | $796 | $454 | $295 | $303 |
| Alternative Financing Contracts | 20,076 | 14,738 | 1,637 | 2,200 | 2,321 | 555 | 1,364 | 11,999 |
| Ontario Power Generation | 6,689 | 6,091 | 1,181 | 861 | 619 | 336 | 329 | 3,363 |
| Leases | 3,435 | 4,581 | 608 | 497 | 412 | 330 | 254 | 1,334 |
| Construction Contracts | 4,120 | 1,940 | 1,809 | 436 | 223 | 176 | 160 | 1,316 |
| Other | 10,423 | 9,756 | 6,280 | 947 | 592 | 673 | 382 | 1,549 |
Total Contractual Obligations | $54,069 | $46,073 | $15,994 | $7,940 | $4,963 | $2,524 | $2,784 | $19,864 |
Ontario Power Generation Inc.’s contractual obligations include future contributions under ONFA of $3.7 billion, fuel supply agreements of $1.1 billion and Lower Mattagami River construction of $908 million.
In November 2009, the Pan American Sports Organization selected the City of Toronto and the Golden Horseshoe region to host the 2015 Pan/Parapan American Games. The Government of Ontario is investing funds to help plan and stage the Games, and to support the construction of the Athletes Village. Transfer payments and alternative financing contracts in the table above include $982 million in commitments that are still to be provided for the Games and the Athletes Village project.
The Province has entered into a number of multiple-year alternative financing contracts for the construction of assets and delivery of services. The contractual obligations represent the unperformed capital and operating portion of the contracts and will become liabilities in the future when the terms of the contracts are met.
| | 14. | Trust Funds Under Administration |
Summary financial information from the most recent financial statements of trust funds under administration is provided below.
Workplace Safety and Insurance Board (WSIB)1 As at December 31 ($ Millions) | 2012 | 2011 |
| Assets | $19,384 | $17,382 |
| Liabilities | 30,580 | 29,699 |
| Deficiency of Assets | (11,196) | (12,317) |
| Unfunded Liability attributable to WSIB stakeholders | ($13,299) | ($14,222) |
1 The financial statements have been prepared in accordance with IFRS. |
Other Trust Funds As at March 31, 2013 ($ Millions) |
| | Assets | Liabilities | Fund Balance (Unfunded Liability) |
The Public Guardian and Trustee for Province of Ontario | $1,556 | $58 | | $1,498 |
| Motor Vehicle Accident Claims Fund | 58 | 215 | | (157) |
| Pension Benefits Guarantee Fund | 486 | 230 | | 256 |
| As at December 31, 2012 | Assets | Liabilities | Fund Balance |
| Deposit Insurance Corporation of Ontario | $162 | $15 | $147 |
Unfunded liabilities of trusts under administration are not included in the Province’s consolidated financial statements as it is intended that they will be discharged by external parties. The most recent financial statements of these trusts are reproduced in Volume 2 of the Public Accounts of Ontario.
The comparative figures have been reclassified as necessary to conform to the 2013 presentation.
SCHEDULES TO THE CONSOLIDATED FINANCIAL STATEMENTS
| Schedule 1 | Revenues by Source | 68 |
| Schedule 2 | Revenues by Sector | 70 |
| Schedule 3 | Expenses by Sector | 72 |
| Schedule 4 | Expenses by Ministry | 74 |
| Schedule 5 | Accounts Payable and Accrued Liabilities | 75 |
| Schedule 6 | Accounts Receivable | 75 |
| Schedule 7 | Loans Receivable | 76 |
| Schedule 8 | Government Organizations | 77 |
| Schedule 9 | Government Business Enterprises | 82 |
| Schedule 10 | Broader Public Sector Organizations | 84 |
Province of Ontario Schedule 1: Revenues by Source |
| ($ Millions) | 2012–13 Budget | 2012–13 Actual | 2011–12 Actual |
| Taxation | | | |
| Personal Income Tax | 26,085 | 25,574 | 24,548 |
| Sales Tax | 21,135 | 20,957 | 20,159 |
Corporations Tax1 | 10,798 | 12,093 | 9,944 |
| Education Property Tax | 5,631 | 5,511 | 5,765 |
| Employer Health Tax | 5,149 | 5,137 | 5,092 |
| Ontario Health Premium | 3,098 | 3,067 | 2,916 |
| Gasoline Tax | 2,371 | 2,390 | 2,380 |
| Land Transfer Tax | 1,374 | 1,484 | 1,432 |
| Tobacco Tax | 1,185 | 1,142 | 1,150 |
| Fuel Tax | 724 | 710 | 710 |
| Beer and Wine Tax | 557 | 560 | 561 |
| Electricity Payments-In-Lieu of Taxes | 555 | 324 | 367 |
| Other Taxes | 461 | 469 | 574 |
| | 79,123 | 79,418 | 75,598 |
| Transfers from Government of Canada | | | |
| Canada Health Transfer | 11,378 | 11,315 | 10,705 |
| Canada Social Transfer | 4,596 | 4,591 | 4,469 |
| Equalization Payments | 3,261 | 3,261 | 2,200 |
| Labour Market Development Agreement | 617 | 607 | 609 |
| Social Housing | 476 | 483 | 489 |
| Indian Welfare Services Agreement | 210 | 220 | 220 |
| Labour Market Agreement | 194 | 190 | 194 |
| Infrastructure Programs | 204 | 116 | 353 |
| Wait Times Reduction Fund | 97 | 97 | 97 |
| Bilingualism Development | 81 | 88 | 92 |
| Labour Market Agreement for Persons with Disabilities | 76 | 76 | 76 |
| Youth Criminal Justice | 65 | 66 | 67 |
| Legal Aid Criminal | 50 | 50 | 54 |
| Federal Transition Assistance | – | – | 1,300 |
| Other | 471 | 501 | 380 |
| | 21,776 | 21,661 | 21,305 |
Province of Ontario Schedule 1: Revenues by Source (cont’d) |
| ($ Millions) | 2012–13 Budget | 2012–13 Actual | 2011–12 Actual |
Income from Investment in Government Business Enterprises (Schedule 9) | 4,065 | 4,469 | 4,413 |
| Other | | | |
| Power Supply Contract Recoveries | 1,262 | 1,323 | 1,372 |
| Sales and Rentals | 1,068 | 1,188 | 1,193 |
| Vehicle and Driver Registration Fees | 1,163 | 1,125 | 1,075 |
| Electricity Debt Retirement Charge | 946 | 939 | 952 |
| Other Fees and Licences | 819 | 760 | 776 |
Net Reduction of Power Purchase Contracts (Note 8) | 263 | 263 | 317 |
| Royalties | 204 | 226 | 200 |
| Independent Electricity System Operator Revenue | 173 | 120 | 114 |
| Local Services Realignment | 89 | 88 | 89 |
| Miscellaneous | 1,622 | 1,789 | 2,369 |
| | 7,609 | 7,821 | 8,457 |
| Total Revenues | 112,573 | 113,369 | 109,773 |
1 Corporations tax revenue is subject to uncertainty, which may be material to these Consolidated Financial Statements. 2012–13 corporations tax revenue includes $1,998 million due to higher-than-estimated tax assessments for tax years 2011 and prior (Note 1). |
Province of Ontario Schedule 2: Revenues by Sector |
| Sectors | Health1 | Education2 | Children’s and Social Services3 | Environment, Resources and Economic Development4 |
For the year ended March 31 ($ Millions) | 2013 | 2012 | 2013 | 2012 | 2013 | 2012 | 2013 | 2012 |
| Revenues | | | | | | | | |
Taxation (Schedule 1) | – | – | – | – | – | – | 2 | – |
Transfers from Government of Canada (Schedule 1) | 74 | 99 | 81 | 84 | 310 | 312 | 928 | 964 |
Income from Investment in Government Business Enterprises (Schedule 9) | – | – | – | – | – | – | 932 | 872 |
Other (Schedule 1) | 460 | 394 | 27 | 29 | 77 | 44 | 3,212 | 2,834 |
| Total | 534 | 493 | 108 | 113 | 387 | 356 | 5,074 | 4,670 |
1 Includes the activities of the Ministry of Health and Long-Term Care. 2 Includes the activities of the Ministry of Education. 3 Includes the activities of the Ministries of Children and Youth Services, and Community and Social Services. 4 Includes the activities of the Ministries of Aboriginal Affairs, Agriculture and Food/Rural Affairs, Citizenship and Immigration, Consumer Services, Economic Development, Trade and Employment/Research and Innovation, Energy, Environment, Labour, Municipal Affairs and Housing, Natural Resources, Northern Development and Mines, Tourism, Culture and Sport, and Transportation. |
| |
Post-Secondary Education and Training5 | Justice6 | General Government and Other7 | Total |
2013 | 2012 | 2013 | 2012 | 2013 | 2012 | 2013 | 2012 |
| | | | | | | | |
| – | – | – | – | 79,416 | 75,598 | 79,418 | 75,598 |
| 868 | 934 | 95 | 100 | 19,305 | 18,812 | 21,661 | 21,305 |
| – | – | – | – | 3,537 | 3,541 | 4,469 | 4,413 |
| 68 | 92 | 713 | 737 | 3,264 | 4,327 | 7,821 | 8,457 |
| 936 | 1,026 | 808 | 837 | 105,522 | 102,278 | 113,369 | 109,773 |
5 Includes the activities of the Ministry of Training, Colleges and Universities. 6 Includes the activities of the Ministries of Attorney General, and Community Safety and Correctional Services. 7 Includes the activities of the Ministries of Government Services, Infrastructure, Finance, the Board of Internal Economy, Executive Offices and the Office of Francophone Affairs. |
Province of Ontario Schedule 3: Expenses by Sector1 |
| Sectors | Health2 | Education3 | Children’s and Social Services4 | Environment, Resources and Economic Development5 |
For the year ended March 31 ($ Millions) | 2013 | 2012 | 2013 | 2012 | 2013 | 2012 | 2013 | 2012 |
| Expenses | | | | | | | | |
| Transfer Payments | 46,430 | 45,605 | 24,005 | 23,262 | 13,191 | 12,728 | 5,799 | 5,438 |
| Interest on Debt | – | – | – | – | – | – | – | – |
| Salaries and Wages | 605 | 571 | 186 | 195 | 444 | 454 | 1,663 | 1,696 |
| Services | 1,021 | 934 | 107 | 111 | 151 | 159 | 1,282 | 1,298 |
Pensions and Employee Future Benefits (Note 7) | 6 | 6 | 895 | 523 | 6 | 7 | 10 | 10 |
| Power Supply Contract Costs | – | – | – | – | – | – | – | – |
| Amortization of Tangible Capital Assets | 75 | 64 | 8 | 8 | 3 | 2 | 1,177 | 1,101 |
| Employee Benefits | 105 | 98 | 39 | 30 | 69 | 71 | 294 | 292 |
| Supplies and Equipment | 296 | 293 | 9 | 10 | 10 | 12 | 192 | 202 |
| Transportation and Communication | 76 | 84 | 13 | 17 | 21 | 20 | 97 | 91 |
Impact of Broader Public Sector Organizations on Provincial Expenses (Schedule 10) | (1,132) | (1,241) | (2,659) | (720) | – | – | – | – |
| Other | 100 | 62 | 26 | 18 | 26 | 19 | 555 | 583 |
Total10 | 47,582 | 46,476 | 22,629 | 23,454 | 13,921 | 13,472 | 11,069 | 10,711 |
1 The information in the sectors’ columns represents activities of ministries and consolidated agencies after adjustments to eliminate transactions between sectors. 2 Includes the activities of the Ministry of Health and Long-Term Care. 3 Includes the activities of the Ministry of Education. 4 Includes the activities of the Ministries of Children and Youth Services, and Community and Social Services. 5 Includes the activities of the Ministries of Aboriginal Affairs, Agriculture and Food/Rural Affairs, Citizenship and Immigration, Consumer Services, Economic Development, Trade and Employment/Research and Innovation, Energy, Environment, Labour, Municipal Affairs and Housing, Natural Resources, Northern Development and Mines, Tourism, Culture and Sport, and Transportation. |
| |
Post-Secondary Education and Training6 | Justice7 | General Government and Other8 | Interest on Debt9 | Total |
2013 | 2012 | 2013 | 2012 | 2013 | 2012 | 2013 | 2012 | 2013 | 2012 |
| | | | | | | | | | |
| 7,144 | 7,116 | 338 | 315 | 946 | 2,443 | – | – | 97,853 | 96,907 |
| – | – | – | – | – | – | 10,341 | 10,082 | 10,341 | 10,082 |
| 97 | 96 | 2,134 | 2,142 | 973 | 1,051 | – | – | 6,102 | 6,205 |
| 67 | 54 | 839 | 23 | 58 | 420 | – | – | 3,525 | 2,999 |
| – | – | 18 | 17 | 1,851 | 1,611 | – | – | 2,786 | 2,174 |
| – | – | – | – | 1,323 | 1,375 | – | – | 1,323 | 1,375 |
| 1 | 1 | 9 | 7 | 221 | 186 | – | – | 1,494 | 1,369 |
| 13 | 14 | 276 | 277 | 164 | 125 | – | – | 960 | 907 |
| 2 | 1 | 162 | 150 | 49 | 62 | – | – | 720 | 730 |
| 4 | 4 | 69 | 68 | 68 | 20 | – | – | 348 | 304 |
| (22) | (60) | – | – | – | – | – | – | (3,813) | (2,021) |
| 56 | 35 | 117 | 874 | 70 | 120 | – | – | 950 | 1,711 |
| 7,362 | 7,261 | 3,962 | 3,873 | 5,723 | 7,413 | 10,341 | 10,082 | 122,589 | 122,742 |
6 Includes the activities of the Ministry of Training, Colleges and Universities. 7 Includes the activities of the Ministries of Attorney General, and Community Safety and Correctional Services. 8 Includes the activities of the Ministries of Government Services, Infrastructure, Finance, the Board of Internal Economy, Executive Offices and the Office of Francophone Affairs. 9 Includes the activities related to the management of the debt of the Province. 10 The comparative figures have been reclassified to conform to the 2013 presentation. |
Schedule 4: Expenses by Ministry |
| ($ Millions) | 2012–13 Budget | 2012–13 Actual | 2011–12 Actual |
| Aboriginal Affairs | 76 | 65 | 96 |
| Agriculture and Food/Rural Affairs | 1,136 | 1,038 | 1,287 |
| Attorney General | 1,732 | 1,678 | 1,699 |
| Board of Internal Economy | 197 | 197 | 271 |
| Children and Youth Services | 4,083 | 3,999 | 3,943 |
| Citizenship and Immigration | 435 | 471 | 170 |
| Community and Social Services | 9,964 | 9,922 | 9,529 |
| Community Safety and Correctional Services | 2,315 | 2,284 | 2,174 |
| Consumer Services | 20 | 20 | 19 |
| Economic Development, Trade and Employment/Research and Innovation | 955 | 954 | 961 |
| Education | 23,892 | 21,734 | 22,931 |
Teachers' Pension (Note 7) | 850 | 895 | 523 |
| Energy | 1,432 | 1,335 | 1,531 |
| Environment | 486 | 577 | 537 |
| Executive Offices | 31 | 30 | 31 |
| Finance | 1,093 | 896 | 2,451 |
Contingency Fund1 | 400 | – | – |
Interest on Debt | 10,619 | 10,341 | 10,082 |
Municipal Partnership Fund | 592 | 592 | 598 |
Power Supply Contract Costs | 1,262 | 1,323 | 1,375 |
Transition Fund | 500 | – | – |
| Government Services | 998 | 1,097 | 1,051 |
Public Service/OPSEU Pension and Other Employee Future Benefits (Note 7) | 1,545 | 1,519 | 1,300 |
| Health and Long-Term Care | 48,334 | 47,582 | 46,476 |
| Infrastructure | 278 | 66 | 331 |
| Capital Contingency Fund | 100 | – | – |
| Labour | 300 | 282 | 185 |
| Municipal Affairs and Housing | 803 | 841 | 728 |
| Natural Resources | 752 | 855 | 908 |
| Northern Development and Mines | 771 | 720 | 729 |
| Office of Francophone Affairs | 5 | 5 | 5 |
| Tourism, Culture and Sport | 1,106 | 1,432 | 1,221 |
| Training, Colleges and Universities | 7,509 | 7,362 | 7,261 |
| Transportation | 2,587 | 2,477 | 2,339 |
Year-End Savings2 | (765) | – | – |
| Total Expenses | 126,393 | 122,589 | 122,742 |
1 See glossary for definition. 2 For Budget purposes, these items were not allocated to individual ministries. |
Province of Ontario Schedule 5: Accounts Payable and Accrued Liabilities |
As at March 31 ($ Millions) | 2013 | 2012 |
| Transfer Payments | 6,077 | 4,330 |
| Interest on Debt | 4,686 | 4,642 |
| Salaries, Wages and Benefits | 2,584 | 2,373 |
Liability for CRA1 Overpayment | 133 | 266 |
| Other | 8,074 | 9,517 |
| Total Accounts Payable and Accrued Liabilities | 21,554 | 21,128 |
1 CRA – Canada Revenue Agency. |
Province of Ontario Schedule 6: Accounts Receivable |
As at March 31 ($ Millions) | 2013 | 2012 |
| Taxes | 4,348 | 5,522 |
Transfer Payments1 | 663 | 690 |
Other Accounts Receivable2 | 3,754 | 3,319 |
| | 8,765 | 9,531 |
Less: Allowance for Doubtful Accounts3 | (1,092) | (1,208) |
| | 7,673 | 8,323 |
| Government of Canada | 752 | 940 |
| Total Accounts Receivable | 8,425 | 9,263 |
1 The Transfer Payment receivable consists primarily of recoverables of $534 million (2012, $552 million) for the Ontario Disability Support Program – Financial Assistance. 2 Other Accounts Receivable includes trade receivables. 3 The Allowance for Doubtful Accounts includes a provision of $463 million (2012, $488 million) for the Ontario Disability Support Program – Financial Assistance. |
Province of Ontario Schedule 7: Loans Receivable |
As at March 31 ($ Millions) | 2013 | 2012 |
Government Business Enterprises1 | 4,038 | 4,146 |
Municipalities2 | 4,581 | 3,997 |
Students3 | 2,851 | 2,638 |
Industrial and Commercial4 | 529 | 591 |
Pension Benefit Guarantee Fund5 | 231 | 242 |
Universities6 | 36 | 29 |
| Other | 99 | 86 |
| | 12,365 | 11,729 |
Unamortized Concession Discounts7 | (323) | (357) |
Allowance for Doubtful Accounts8 | (932) | (991) |
| Total Loans Receivable | 11,110 | 10,381 |
1 Loans to government business enterprises bear interest at rates of 2.32 per cent to 6.33 per cent (2012, 1.31 per cent to 6.33 per cent). 2 Loans to municipalities bear interest at rates up to 8.00 per cent (2012, 8.00 per cent). 3 Loans to students bear interest at rates of 1.45 per cent to 3.00 per cent (2012, 2.00 per cent to 3.00 per cent). 4 Loans to industrial and commercial enterprises bear interest at rates up to 6.24 per cent (2012, 8.01 per cent). 5 The loan to the Pension Benefit Guarantee Fund is interest-free. 6 Loans to universities are mortgages bearing interest at rates of 5.88 per cent to 7.13 per cent (2012, 2.77 per cent to 11.04 per cent). 7 Unamortized concession discounts related to loans made to municipalities of $85 million (2012, $104 million), loans to the Pension Benefit Guarantee Fund of $113 million (2012, $119 million), and loans to industrial and commercial enterprises and other of $125 million (2012, $134 million). 8 Allowance for doubtful accounts related to loans made to students of $600 million (2012, $632 million), municipalities of $158 million (2012, $158 million), industrial and commercial enterprises and other of $56 million (2012, $78 million), and the Pension Benefit Guarantee Fund of $118 million (2012, $123 million). |
| Repayment Terms | Principal Repayment ($ Millions) |
| Years to Maturity | 2013 | 2012 |
| 1 year | 1,134 | 941 |
| 2 years | 430 | 490 |
| 3 years | 513 | 376 |
| 4 years | 1,324 | 498 |
| 5 years | 463 | 1,309 |
| 1–5 years | 3,864 | 3,614 |
| 6–10 years | 2,025 | 2,109 |
| 11–15 years | 751 | 577 |
| 16–20 years | 1,299 | 1,256 |
| 21–25 years | 1,303 | 1,106 |
| Over 25 years | 632 | 632 |
| Subtotal | 9,874 | 9,294 |
| No fixed maturity | 2,491 | 2,435 |
| Total | 12,365 | 11,729 |
| | |
Province of Ontario Schedule 8: Government Organizations1 | |
Government Business Enterprises2 | Responsible Ministry | |
| Hydro One Inc. | Energy | |
| Liquor Control Board of Ontario | Finance | |
| Ontario Lottery and Gaming Corporation | Finance | |
| Ontario Power Generation Inc. | Energy | |
Other Government Organizations2 | Responsible Ministry | |
| Agricorp | Agriculture and Food/Rural Affairs | |
| Agricultural Research Institute of Ontario | Agriculture and Food/Rural Affairs | |
| Algonquin Forestry Authority | Natural Resources | |
| Cancer Care Ontario | Health and Long-Term Care | |
| Education Quality and Accountability Office | Education | |
| eHealth Ontario | Health and Long-Term Care | |
| Forest Renewal Trust | Natural Resources | |
| General Real Estate Portfolio | Infrastructure | |
| Independent Electricity System Operator | Energy | |
| Legal Aid Ontario | Attorney General | |
| Local Health Integration Networks | | |
Central East Local Health Integration Network | Health and Long-Term Care | |
Central Local Health Integration Network | Health and Long-Term Care | |
Central West Local Health Integration Network | Health and Long-Term Care | |
Champlain Local Health Integration Network | Health and Long-Term Care | |
Erie St. Clair Local Health Integration Network | Health and Long-Term Care | |
Hamilton Niagara Haldimand Brant Local Health Integration Network | Health and Long-Term Care | |
Mississauga Halton Local Health Integration Network | Health and Long-Term Care | |
North East Local Health Integration Network | Health and Long-Term Care | |
North Simcoe Muskoka Local Health Integration Network | Health and Long-Term Care | |
North West Local Health Integration Network | Health and Long-Term Care | |
South East Local Health Integration Network | Health and Long-Term Care | |
South West Local Health Integration Network | Health and Long-Term Care | |
Toronto Central Local Health Integration Network | Health and Long-Term Care | |
Waterloo Wellington Local Health Integration Network | Health and Long-Term Care | |
| Metrolinx | Transportation | |
| Metropolitan Toronto Convention Centre | Tourism, Culture and Sport | |
| Niagara Parks Commission | Tourism, Culture and Sport | |
| Northern Ontario Heritage Fund Corporation | Northern Development and Mines | |
| Ontario Agency for Health Protection and Promotion | Health and Long-Term Care | |
| Ontario Arts Council | Tourism, Culture and Sport | |
| Ontario Capital Growth Corporation | Economic Development, Trade and Employment/Research and Innovation | |
| Ontario Clean Water Agency | Environment | |
| Ontario Educational Communications Authority | Education | |
| Ontario Electricity Financial Corporation | Finance | |
| Ontario Energy Board | Energy | |
| Ontario Financing Authority | Finance | |
| Ontario French-Language Educational Communications Authority | Education | |
| Ontario Immigrant Investor Corporation | Economic Development, Trade and Employment/Research and Innovation | |
| Ontario Infrastructure and Lands Corporation | Infrastructure | |
| Ontario Mortgage and Housing Corporation | Municipal Affairs and Housing | |
1 The schedule of government organizations is updated on an annual basis to reflect any amalgamations or dissolutions of consolidated organizations in the year. This listing represents all consolidated organizations included in the Province’s financial statements as at March 31, 2013. 2 The most recent audited financial statements of these organizations are included in Volume 2, Public Accounts of Ontario. | |
Province of Ontario Schedule 8: Government Organizations | |
Other Government Organizations (cont’d) | Responsible Ministry (cont’d) |
| Ontario Northland Transportation Commission | Northern Development and Mines |
| Ontario Place Corporation | Tourism, Culture and Sport |
| Ontario Power Authority | Energy |
| Ontario Racing Commission | Agriculture and Food/Rural Affairs |
| Ontario Science Centre | Tourism, Culture and Sport |
| Ontario Securities Commission | Finance |
| Ontario Student Loan Trust | Training, Colleges and Universities |
| Ontario Tourism Marketing Partnership Corporation | Tourism, Culture and Sport |
| Ontario Trillium Foundation | Tourism, Culture and Sport |
| Ornge | Health and Long-Term Care |
| Ottawa Convention Centre | Tourism, Culture and Sport |
| Royal Ontario Museum | Tourism, Culture and Sport |
| Toronto Organizing Committee for the 2015 Pan American and Parapan American Games | Citizenship and Immigration |
| Transmission Corridor Program | Infrastructure |
| Waterfront Toronto | Infrastructure |
| Broader Public Sector Organizations |
| Public Hospitals – Ministry of Health and Long-Term Care |
Alexandra Hospital Ingersoll Alexandra Marine & General Hospital Almonte General Hospital Anson General Hospital Arnprior and District Memorial Hospital Atikokan General Hospital Baycrest Centre for Geriatric Care Bingham Memorial Hospital Blind River District Health Centre Bluewater Health Brant Community Healthcare System Bridgepoint Hospital Brockville General Hospital Bruyere Continuing Care Inc. Cambridge Memorial Hospital Campbellford Memorial Hospital Carleton Place and District Memorial Hospital Casey House Hospice Chatham-Kent Health Alliance Children's Hospital of Eastern Ontario Clinton Public Hospital Collingwood General and Marine Hospital Cornwall Community Hospital Deep River and District Hospital Corporation Dryden Regional Health Centre Englehart and District Hospital Inc. Espanola General Hospital Four Counties Health Services Georgian Bay General Hospital Geraldton District Hospital Grand River Hospital | Grey Bruce Health Services Groves Memorial Community Hospital Guelph General Hospital Haldimand War Memorial Hospital Haliburton Highlands Health Services Corporation Halton Healthcare Services Corporation Hamilton Health Sciences Corporation Hanover & District Hospital Headwaters Health Care Centre Health Sciences North Holland Bloorview Kids Rehabilitation Hospital Hôpital Général de Hawkesbury and District General Hospital Inc. Hôpital Glengarry Memorial Hospital Hôpital Montfort Hôpital Notre Dame Hospital (Hearst) Hornepayne Community Hospital Hospital for Sick Children Hôtel-Dieu Grace Hospital Hôtel-Dieu Hospital, Cornwall Humber River Regional Hospital Joseph Brant Hospital Kemptville District Hospital Kingston General Hospital Kirkland and District Hospital Lady Dunn Health Centre Lady Minto Hospital at Cochrane Lake of the Woods District Hospital Lakeridge Health Leamington District Memorial Hospital Lennox and Addington County General Hospital Listowel Memorial Hospital |
Province of Ontario Schedule 8: Government Organizations |
| Public Hospitals – Ministry of Health and Long-Term Care (cont’d) |
London Health Sciences Centre Mackenzie Health Manitoulin Health Centre Manitouwadge General Hospital Markham Stouffville Hospital Mattawa General Hospital McCausland Hospital Mount Sinai Hospital Muskoka Algonquin Healthcare Niagara Health System Nipigon District Memorial Hospital Norfolk General Hospital North Bay Regional Health Centre North Wellington Health Care Corporation North York General Hospital Northumberland Hills Hospital Orillia Soldiers' Memorial Hospital Ottawa Hospital Pembroke Regional Hospital Inc. Perth and Smiths Falls District Hospital Peterborough Regional Health Centre Providence Care Centre (Kingston) Providence Healthcare Queensway-Carleton Hospital Quinte Healthcare Corporation Red Lake Margaret Cochenour Memorial Hospital Corporation Religious Hospitallers of St. Joseph of the Hôtel Dieu of Kingston Religious Hospitallers of St. Joseph of the Hotel Dieu of St. Catharines Renfrew Victoria Hospital Riverside Health Care Facilities Inc. Ross Memorial Hospital Rouge Valley Health System Royal Victoria Regional Health Centre Runnymede Healthcare Centre Salvation Army Toronto Grace Hospital Sault Area Hospital Scarborough Hospital Seaforth Community Hospital Sensenbrenner Hospital Services de santé de Chapleau Health Services Sioux Lookout Meno-Ya-Win Health Centre | Smooth Rock Falls Hospital South Bruce Grey Health Centre South Huron Hospital Association Southlake Regional Health Centre St. Francis Memorial Hospital St. Joseph's Care Group St. Joseph’s Continuing Care Centre of Sudbury St. Joseph's General Hospital, Elliot Lake St. Joseph's Health Care, London St. Joseph's Health Centre (Guelph) St. Joseph's Health Centre (Toronto) St. Joseph's Healthcare Hamilton St. Mary's General Hospital St. Mary’s Memorial Hospital St. Michael's Hospital St. Thomas - Elgin General Hospital Stevenson Memorial Hospital Stratford General Hospital Strathroy Middlesex General Hospital Sunnybrook Health Sciences Centre Temiskaming Hospital Thunder Bay Regional Health Sciences Centre Tillsonburg District Memorial Hospital Timmins and District Hospital Toronto East General Hospital Trillium Health Partners University Health Network University of Ottawa Heart Institute Weeneebayko Area Health Authority West Haldimand General Hospital West Lincoln Memorial Hospital West Nipissing General Hospital West Park Healthcare Centre West Parry Sound Health Centre William Osler Health System Wilson Memorial General Hospital Winchester District Memorial Hospital Windsor Regional Hospital Wingham and District Hospital Women’s College Hospital Woodstock General Hospital Trust |
| Specialty Psychiatric Hospitals – Ministry of Health and Long-Term Care |
Centre for Addiction and Mental Health Ontario Shores Centre for Mental Health Sciences | Royal Ottawa Health Care Group Waypoint Centre for Mental Health Care |
Province of Ontario Schedule 8: Government Organizations |
| School Boards – Ministry of Education |
Algoma District School Board Algonquin and Lakeshore Catholic District School Board Avon Maitland District School Board Bloorview MacMillan School Authority Bluewater District School Board Brant Haldimand Norfolk Catholic District School Board Bruce-Grey Catholic District School Board Campbell Children's School Authority Catholic District School Board of Eastern Ontario Conseil des écoles publiques de l’Est de l’Ontario Conseil scolaire de district catholique Centre-Sud Conseil scolaire de district catholique de l'Est ontarien Conseil scolaire de district catholique des Aurores boréales Conseil scolaire de district catholique des Grandes Rivieres Conseil scolaire de district catholique du Centre-Est de l'Ontario Conseil scolaire de district catholique du Nouvel-Ontario Conseil scolaire de district catholique Franco-Nord Conseil scolaire de district des écoles catholiques du Sud-Ouest Conseil scolaire de district du Grand Nord de l'Ontario Conseil scolaire de district du Nord-Est de l'Ontario Conseil scolaire Viamonde District School Board of Niagara District School Board Ontario North East Dufferin-Peel Catholic District School Board Durham Catholic District School Board Durham District School Board Grand Erie District School Board Greater Essex County District School Board Halton Catholic District School Board Halton District School Board Hamilton-Wentworth Catholic District School Board Hamilton-Wentworth District School Board Hastings and Prince Edward District School Board Huron-Perth Catholic District School Board Huron-Superior Catholic District School Board James Bay Lowlands Secondary School Board John McGivney Children’s Centre School Authority Kawartha Pine Ridge District School Board Keewatin-Patricia District School Board Kenora Catholic District School Board KidsAbility School Authority Lakehead District School Board | Lambton Kent District School Board Limestone District School Board London District Catholic School Board Moose Factory Island District School Area Board Moosonee District School Area Board Near North District School Board Niagara Catholic District School Board Niagara Peninsula Children's Centre School Authority Nipissing-Parry Sound Catholic District School Board Northeastern Catholic District School Board Northwest Catholic District School Board Ottawa Catholic District School Board Ottawa Children's Treatment Centre School Authority Ottawa-Carleton District School Board Peel District School Board Penetanguishene Protestant Separate School Board Peterborough Victoria Northumberland and Clarington Catholic District School Board Rainbow District School Board Rainy River District School Board Renfrew County Catholic District School Board Renfrew County District School Board Simcoe County District School Board Simcoe Muskoka Catholic District School Board St. Clair Catholic District School Board Sudbury Catholic District School Board Superior North Catholic District School Board Superior-Greenstone District School Board Thames Valley District School Board Thunder Bay Catholic District School Board Toronto Catholic District School Board Toronto District School Board Trillium Lakelands District School Board Upper Canada District School Board Upper Grand District School Board Waterloo Catholic District School Board Waterloo Region District School Board Wellington Catholic District School Board Windsor-Essex Catholic District School Board York Catholic District School Board York Region District School Board |
Province of Ontario Schedule 8: Government Organizations |
| Colleges – Ministry of Training, Colleges and Universities |
Algonquin College of Applied Arts and Technology Cambrian College of Applied Arts and Technology Canadore College of Applied Arts and Technology Centennial College of Applied Arts and Technology College Boréal d’arts appliqués et de technologie College d’arts appliqués et de technologie La Cité collégiale Conestoga College Institute of Technology and Advanced Learning Confederation College of Applied Arts and Technology Durham College of Applied Arts and Technology Fanshawe College of Applied Arts and Technology George Brown College of Applied Arts and Technology Georgian College of Applied Arts and Technology | Humber College Institute of Technology and Advanced Learning Lambton College of Applied Arts and Technology Loyalist College of Applied Arts and Technology Mohawk College of Applied Arts and Technology Niagara College of Applied Arts and Technology Northern College of Applied Arts and Technology Sault College of Applied Arts and Technology Seneca College of Applied Arts and Technology Sheridan College Institute of Technology and Advanced Learning Sir Sandford Fleming College of Applied Arts and Technology St. Clair College of Applied Arts and Technology St. Lawrence College of Applied Arts and Technology |
Province of Ontario Schedule 9: Government Business Enterprises Summary financial information of Government Business Enterprises is provided below. | | |
For the year ended March 31, 2013 ($ Millions) | Hydro One Inc.1 | Liquor Control Board of Ontario2 | Ontario Lottery and Gaming Corporation2 | Ontario Power Generation Inc.3 | Total | |
| Assets | | | | | | | |
| Cash and Temporary Investments | 9 | 317 | 603 | 568 | 1,497 | |
| Accounts Receivable | 966 | 42 | 108 | 573 | 1,689 | |
| Inventories | 25 | 378 | 26 | 576 | 1,005 | |
| Prepaid Expenses | 119 | 13 | 28 | 73 | 233 | |
| Long-Term Investments | 251 | – | – | – | 251 | |
| Fixed Assets | 15,816 | 340 | 1,440 | 16,483 | 34,079 | |
| Other Assets | 3,860 | – | 2 | 17,301 | 21,163 | |
| Total Assets | 21,046 | 1,090 | 2,207 | 35,574 | 59,917 | |
| Liabilities | | | | | | | |
| Bank Indebtedness | 39 | – | – | – | 39 | |
| Accounts Payable | 737 | 572 | 380 | 1,480 | 3,169 | |
| Deferred Revenue | – | – | 10 | 12 | 22 | |
| Long-Term Debt | 7,879 | 108 | 89 | 5,756 | 13,832 | |
| Other Liabilities | 5,443 | 3 | 144 | 18,718 | 24,308 | |
| Total Liabilities | 14,098 | 683 | 623 | 25,966 | 41,370 | |
| Net Assets | 6,948 | 407 | 1,584 | 9,608 | 18,547 | |
| Revenue | 5,836 | 4,939 | 6,684 | 4,768 | 22,227 | |
| Expenses | 5,040 | 3,218 | 4,868 | 4,632 | 17,758 | |
| Net Income (Loss) | 7964 | 1,721 | 1,816 | 1364 | 4,469 | |
Net Assets at Beginning of Year | 6,369 | 386 | 1,671 | 8,833 | 17,259 | |
Increase in Fair Value of Ontario Nuclear Funds (Note 11) | – | – | – | 639 | 639 | |
Remittances (to) Consolidated Revenue Fund | (217) | (1,700) | (1,903) | – | (3,820) | |
| Net Assets | | 6,948 407 | 1,584 | 9,608 | 18,547 |
1 Total assets and total liabilities for Hydro One are reported using standards recommended by the U.S. Financial Accounting Standards Board (FASB) and net assets approximate Canadian GAAP. 2 Amounts reported using IFRS. 3 Amounts reported using Canadian GAAP standards as recommended by the AcSB. 4 Existing policy and practice is to have the hydro sector's net income remain in the hydro sector to pay down the debt of Ontario Electricity Financial Corporation, an agency of the Province responsible for managing the stranded debt and other liabilities of the former Ontario Hydro. | | |
Province of Ontario Schedule 9: Government Business Enterprises |
Hydro One Inc.
The principal business of Hydro One Inc. is the transmission and distribution of electricity to customers within Ontario. It is regulated by the Ontario Energy Board.
Liquor Control Board of Ontario
The Liquor Control Board of Ontario regulates the purchase, sale and distribution of liquor for home consumption and liquor sales to licensed establishments through Liquor Control Board stores, Brewers’ Retail stores and winery retail stores throughout Ontario. The Board buys wine and liquor products for resale to the public, tests all products sold and establishes prices for beer, wine and spirits.
Ontario Lottery and Gaming Corporation
The Corporation conducts lottery games and operates commercial casinos, charity casinos, and slot machines at Ontario racetracks.
Ontario Power Generation Inc.
The principal business of Ontario Power Generation Inc. is the generation and sale of electricity in the Ontario wholesale market and in the interconnected markets of Quebec, Manitoba and the northeast and midwest United States.
Province of Ontario Schedule 10: Broader Public Sector Organizations Summary financial information of Broader Public Sector Organizations is provided below. |
For the year ended March 31, 2013 ($ Millions) | Hospitals | School Boards | Colleges | Total |
| Expense | | | | |
Salaries, Wages and Benefits1 | 16,846 | 16,862 | 2,260 | 35,968 |
| Amortization Expense | 1,289 | 899 | 248 | 2,436 |
Interest Expense2 | 102 | 418 | 17 | 537 |
| Other Expense | 6,734 | 3,390 | 1,118 | 11,242 |
| Fees, Donations and Other Recoveries | (3,749) | (1,273) | (1,945) | (6,967) |
| Total Sector Expense | 21,222 | 20,296 | 1,698 | 43,216 |
| Transfers from the Province | (22,354) | (22,955) | (1,720) | (47,029) |
| Impact on Provincial Expense – (Decrease) | (1,132) | (2,659) | (22) | (3,813) |
1 The School Boards sector’s salaries, wages and benefits include a one-time net savings of $1,296 million primarily as a result of a curtailment in the compensated absences of retirement benefits plans. 2 Interest revenue is netted with Interest Expense. |
Note: The descriptions of the terms in the glossary are provided for the purpose of assisting readers of the 2012–13 Public Accounts. The descriptions do not affect or alter the meaning of any term under law. The glossary does not form part of the audited consolidated financial statements.
Accumulated Amortization: the total amortization that has been recorded over the life of an asset to date. The asset’s total cost less the accumulated amortization gives the asset’s net book value.
Accumulated Deficit: the difference between liabilities and assets. It represents the total of all past annual deficits minus all past annual surpluses, including prior period adjustments.
Amortization: expensing a portion of an asset’s cost in an accounting period by allocating its cost over its estimated useful life. This is applicable to tangible capital assets and items such as expenses relating to a debt issue.
Appropriation: an authority of the Legislative Assembly to pay money out of the Consolidated Revenue Fund or to incur a non-cash expense.
Broader Public Sector (BPS): public hospitals, specialty psychiatric hospitals, school boards and colleges. For financial statement purposes, universities and other organizations such as municipalities are excluded because they do not meet the criteria of government organizations as recommended by the Public Sector Accounting Board of the Canadian Institute of Chartered Accountants.
Canada Health Transfer (CHT): a federal transfer provided to each province and territory in support of health care.
Canada Social Transfer (CST): a federal transfer provided to each province and territory in support of post-secondary education, social assistance and social services, including early childhood development, early learning and child care.
Capital Gain: the profit arising from the sale or transfer of capital assets or investments. For accounting purposes, it is the proceeds or market value received less the net book value of the capital asset or investment.
Capital Lease: a lease that, from the point of view of the lessee, transfers substantially all the benefits and risks incident to ownership of property to the lessee.
Cash and Cash Equivalents: cash or other short-term liquid low-risk instruments that are readily convertible to cash, typically within three months or less.
Consolidated Revenue Fund (CRF): the aggregate of all public monies on deposit to the credit of the Minister of Finance or in the name of any agency of the Crown approved by the Lieutenant Governor in Council. Payments made from the CRF must be appropriated by a statute. See Appropriation.
Consolidation: the inclusion of the financial results of government-controlled organizations in the Province’s consolidated financial statements.
Consumer Price Index (CPI): a broad measure of the cost of living. Through the monthly CPI, Statistics Canada tracks the retail price of a representative shopping basket of goods and services from an average household’s expenditure: food, housing, transportation, furniture, clothing, and recreation. The percentage of the total basket that any item occupies is termed the “weight” and reflects typical consumer spending patterns. Since people tend to spend more on food than clothing, changes in the price of food have a bigger impact on the index than, for example, changes in the price of clothing and footwear.
Contingency Fund: an amount of expense that is approved by the Legislative Assembly at the beginning of the year to cover higher spending due to unforeseen events. This approved spending limit is allocated during the year to ministries for their programs and activities. The actual costs incurred are charged to the respective programs and activities and not to the contingency fund. Therefore, the contingency fund as at the end of the Province’s fiscal year is nil. See Reserve.
Contingent Liabilities: possible obligations that may result in the future sacrifice of economic benefits arising from existing conditions or situations involving uncertainty, that will ultimately be resolved when one or more future events not wholly within the government’s control occur or fail to occur. Resolution of the uncertainty will confirm the incurrence or non-incurrence of a liability.
Contractual Obligations: obligations of a government to others that will become liabilities when the terms of any contract or agreement, which the government had entered into, are met.
Debenture: a debt instrument where the issuer promises to pay interest and repay the principal by the maturity date. It is unsecured, meaning there is no lien on any specific asset.
Debt: an obligation resulting from the borrowing of money.
Deferred Capital Contribution: the unamortized portion of tangible capital assets or liabilities to construct or acquire tangible capital assets from specific funding received from other levels of government or third parties. Deferred capital contribution is recorded in revenue over the estimated useful life of the underlying tangible capital assets once constructed or acquired by the Province.
Deferred Revenue: unspent externally restricted grants from other levels of government and third parties for operating activities. Deferred revenues are recorded into revenue in the period in which the amount received is used for the purposes specified.
Deficit: the amount by which government expenses exceed revenues in any given year. On a forecast basis, a reserve may be included.
Derivatives: financial contracts that derive their value from other underlying instruments. The Province uses derivatives including swaps, forward foreign exchange contracts, forward rate agreements, futures and options to hedge and minimize interest costs.
Expected Average Remaining Service Life: total number of years of future services expected to be rendered by that group of employees divided by the number of employees in the group.
Fair Value: the price that would be agreed upon in an arm’s length transaction and in an open market between knowledgeable, willing parties who are under no compulsion to act. It is not the effect of a forced or liquidation sale.
Financial Assets: assets that could be used to discharge existing liabilities or finance future operations and are not for consumption in the normal course of operations. Financial assets include cash; an asset that is convertible to cash; a contractual right to receive cash or another financial asset from another party; a temporary or portfolio investment; a financial claim on an outside organization or individual; and inventory.
Financial Instrument: liquid asset, equity security in an entity, or a contract that gives rise to a financial asset of one contracting party and a financial liability or equity instrument of the other contracting party.
Fiscal Plan: an outline of the government’s consolidated revenue and expense plan for the upcoming fiscal year and the medium term, including information on the projected surplus/deficit. The plan is formally presented in the Budget, which the government presents in the spring of each year and is updated, as required, during the year. The fiscal plan numbers can be different from the expenditures outlined in the Printed Estimates.
Fiscal Year: the Province of Ontario’s fiscal year runs from April 1 of a year to March 31 of the following year.
Floating Rate Notes (FRNs): debt instruments that bear a variable rate of interest.
Forgivable Loan: advances where the terms and conditions of the loan agreement allow for the non-repayment of the principal or accrued interest when certain conditions are met.
Forward Contract: a contract that obligates one party to buy, and another party to sell, a specified amount of a particular asset at a specified price, on a given date in the future.
Forward Rate Agreement: a forward contract in which one party pays a fixed interest rate and receives a floating interest rate.
Fund: fiscal and accounting entity segregated for the purpose of carrying on specific activities, or attaining certain objectives in accordance with special regulations, restrictions or limitations.
Futures: an exchange-traded contract that confers an obligation to buy or sell a physical or financial commodity at a specified price and amount on a future date.
Gross Domestic Product (GDP): the total unduplicated value of the goods and services produced in the economy of a country or region during a given period of time such as a quarter or a year. Gross domestic product can be measured three ways: as total income earned in current production, as total final expenditures, or as total net value added in current production.
Hedging: a strategy to minimize the risk of loss on an asset (or a liability) from market fluctuations such as interest rate or foreign exchange rate changes. This is accomplished by entering into offsetting commitments with the expectation that a future change in the value of the hedging instrument will offset the change in the value of the asset (or the liability).
Indemnity: an agreement whereby one party agrees to compensate another party for any loss suffered by that party. The Province can either seek or provide indemnification.
Infrastructure: the facilities, systems and equipment required to provide public services and support private-sector economic activity including network infrastructure (e.g., roads, bridges, water and wastewater systems, large information technology systems), buildings (e.g., hospitals, schools, courts), and machinery and equipment (e.g., medical equipment, research equipment).
Loan Guarantee: an agreement to pay all or part of the amount due on a debt obligation in the event of default by the borrower.
Net Book Value of Tangible Capital Assets: historical cost of tangible capital assets less both the accumulated amortization and the amount of any write-downs.
Net Debt: the difference between the Province’s total liabilities and financial assets. It represents the Province’s future revenue requirements to pay for past transactions and events.
Nominal: an amount expressed in dollar terms without adjusting for changes in prices due to inflation or deflation. It is not a good basis for comparing values of GDP in different years, for which a “real” value expressed in constant dollars (i.e., adjusted for price changes) is needed. See Real GDP.
Non-Financial Assets: assets that normally do not generate cash capable of being used to repay existing debts. The non-financial assets of the Province are tangible capital assets.
Non-Tax Revenue: revenue received by the government from external sources. This also includes revenues from the sale of goods and services, fines and penalties associated with the enforcement of government regulations and laws; fees and licences; royalties; profits from a self-sustaining Crown agency; and asset sales.
Ontario Disability Support Program (ODSP): a program designed to meet the unique needs of people with disabilities who are in financial need, or who want and are able to work and need support. Ontarians aged 65 years or older who are ineligible for Old Age Security may also qualify for ODSP supports if they are in financial need.
Option: a contract that confers the right, but not the obligation, to buy or sell a specific amount of a commodity, currency or security at a specific price, on a certain future date.
Pension Actuarial Accounting Valuation: a valuation performed by an actuary to measure the pension benefit obligations at the end of the period or a point in time. The valuation attributes the cost of the pension benefit obligations to the period the related services are rendered by the members.
Pension Statutory Actuarial Funding Valuation: a valuation performed by an actuary to determine whether a pension plan has sufficient money to pay for its obligations when they become due. The valuation determines the contributions required to meet the pension benefit obligations.
Present Value: the current worth of one or more future cash payments, determined by discounting the payments using a given rate of interest.
Program Expense: total expense excluding interest on debt.
Public Accounts: the Consolidated Financial Statements of the Province along with supporting statements and schedules as required by the Financial Administration Act.
Real GDP: gross domestic product measured to exclude the impact of changing prices.
Recognition: the process of including an item in the financial statements of an entity.
Reserve: an amount included in the fiscal plan to protect the plan against unforeseen adverse changes in the economic outlook, or in the Provincial revenue and expense. Actual costs incurred by the ministry, which pertains to the reserve, are recorded as expenses of that ministry. See Contingency Fund.
Segment: a distinguishable activity or group of activities of a government for which it is appropriate to separately report financial information to help users of the financial statements identify the resources allocated to support the major activities of the government.
Sinking Fund Debenture: a debenture that is secured by periodic payments into a fund established to retire long-term debt.
Straight-Line Basis of Amortization: a method whereby the annual amortization expense is computed by dividing i) the historical cost of the asset by ii) the number of years the asset is expected to be used.
Surplus: the amount by which revenues exceed government expenses in any given year. On a forecast basis, a reserve may be included.
Swaption: an option granting its owner the right but not the obligation to enter into an underlying swap. Although options can be traded on a variety of swaps, the term swaption typically refers to options on interest rate swaps.
Tangible Capital Assets: physical assets including land, buildings, transportation infrastructure, vehicles, leased assets, machinery, furniture, equipment and information technology infrastructure and systems, and construction in progress.
Temporary Investments: investments that are transitional or current in nature and generally capable of reasonably prompt liquidation.
Total Debt: the Province’s total borrowings outstanding.
Total Expense: sum of program expense and interest on debt expense.
Transfer Payments: grants to individuals, organizations or other levels of government for which the government making the transfer does not
| | ● | receive any goods or services directly in return, as would occur in a purchase or sale transaction; |
| | ● | expect to be repaid, as would be expected in a loan; or |
| | ● | expect a financial return, as would be expected in an investment. |
Treasury Bills: short-term debt instrument issued by governments on a discount basis.
Unrealized Gain or Loss: an increase or decrease in the fair value of an asset accruing to the holder. Once the asset is disposed of or written off, the gain or loss is realized.
SOURCES OF ADDITIONAL INFORMATION
The Ontario Budget
The Ontario government presents a Budget each year, usually in the early spring. This document outlines expected expense and revenue for the upcoming fiscal year. For an electronic copy of the Ontario Budget, visit the Ministry of Finance website at www.fin.gov.on.ca.
The Estimates of the Province of Ontario
The government’s spending Estimates for the fiscal year commencing April 1 are presented to members of the Legislative Assembly following the presentation of the Ontario Budget by the Minister of Finance. The Estimates outline the spending plans of each ministry and are submitted for approval to the Legislative Assembly according to the Supply Act. For electronic access, go to: www.fin.gov.on.ca.
Ontario Finances
This is a quarterly report on the performance of the government’s Budget for the fiscal year. It covers developments during a quarter and provides a revised outlook for the remainder of the year. For electronic access, go to: www.fin.gov.on.ca.
Ontario Economic Accounts
This quarterly report contains data on Ontario’s economic activity. For electronic access,
go to: www.fin.gov.on.ca.