UNITED STATES
SECURITIES AND EXCHANGE COMMISSION
Washington, D.C. 20549
FORM 18-K/A
For Foreign Governments and Political Subdivisions Thereof
AMENDMENT NO. 1 TO
ANNUAL REPORT
of
PROVINCE OF ONTARIO
(Canada)
(Name of Registrant)
Date of end of last fiscal year: March 31, 2014
___________________
SECURITIES REGISTERED*
(As of the close of the fiscal year)
| Title of Issue | Amounts as to which registration is effective | Names of exchanges on which registered |
| N/A | N/A | N/A |
Name and address of persons authorized to receive notices and
communications from the Securities and Exchange Commission:
Monique Smith
Ontario Representative
Canadian Embassy
501 Pennsylvania Avenue N.W.
Washington, D.C. 20001
Copies to:
Jason R. Lehner
Shearman & Sterling LLP
Commerce Court West, 199 Bay Street
Suite 4405, P.O. Box 247
Toronto, Ontario, Canada M5L IE8
* The Registrant is filing this annual report on a voluntary basis.
PROVINCE OF ONTARIO
The undersigned registrant hereby amends its Annual Report on Form 18-K for the fiscal year ended March 31, 2014 (the “Annual Report“) as follows:
The following additional exhibits are added to the Annual Report:
| Exhibit (99.3) | 2015 Ontario Budget: Budget Papers |
SIGNATURE
Pursuant to the requirements of the Securities Exchange Act of 1934, the registrant has duly caused this amendment to the annual report to be signed on its behalf by the undersigned, thereunto duly authorized, at Toronto, Ontario.
PROVINCE OF ONTARIO
(Name of registrant)
| April 28, 2015 | By: /s/ Opallycia A. Kandelas | |
Name: Opallycia A. Kandelas
Title: Director, Capital Markets Operations
Capital Markets Division
Ontario Financing Authority
EXHIBIT INDEX
| Exhibit (99.3): | 2015 Ontario Budget: Budget Papers |
2015 Ontario Budget: Budget Papers
For general inquiries regarding the 2015 Ontario Budget:
Budget Papers, please call:
Toll-free English & French inquiries: 1-800-337-7222
Teletypewriter (TTY): 1-800-263-7776
For electronic copies of this document, visit our website at
www.ontario.ca/budget
A printed copy of this publication can be ordered:
Online at: www.serviceontario.ca/publications
By phone through the ServiceOntario Contact Centre
Monday to Friday, 8:30 AM to 5:00 PM
416 326-5300
416 325-3408 (TTY)
1 800 668-9938 Toll-free across Canada
1 800 268-7095 TTY Toll-free across Ontario
© Queen’s Printer for Ontario, 2015
ISBN 978-1-4606-5692-1 (Print)
ISBN 978-1-4606-5693-8 (HTML)
ISBN 978-1-4606-5694-5 (PDF)
Ce document est disponible en français sous le titre:
Budget de l’Ontario 2015 – Documents budgétaires
Contents
Foreword xvii
Chapter I: Implementing the Plan
Section A: Investing in People’s Talents and Skills
Supporting Every Child, Reaching Every Student 7
Modernizing Child Care and Early Learning 10
Building a Competitive Workforce 14
Experience Ontario 14
Ensuring an Accessible, High-Quality and Sustainable Postsecondary Education System 14
Matching Skilled Workers to the Right Jobs 21
Renewing the Ontario Youth Jobs Strategy 24
Supporting Ontario’s Skilled Tradespeople 29
Helping Newcomers Integrate Successfully into Their Communities and the Workplace 32
Section B: Building Modern Infrastructure and Transportation Networks
Building Together: Ontario’s Plan to Invest in Public Infrastructure 38
Ongoing Investments in Transportation 38
Moving Ontario Forward 42
Dedicated Funds to Support Moving Ontario Forward 42
Investing in Transit Inside the GTHA 46
Investing in Transportation and Other Critical Infrastructure Outside the GTHA 53
Building Together: Modernizing Infrastructure in Communities across Ontario 58
Education Infrastructure 58
Postsecondary Infrastructure 60
Health and Social Infrastructure 61
Justice Infrastructure 63
Energy Infrastructure 64
Cost-Effective Delivery of Infrastructure Projects 66
Federal Funding for Infrastructure 69
Progress on the Building Canada Plan 69
Strengthening Land Use Planning 71
Section C: Unlocking the Value of Provincial Assets
Introduction 73
Trillium Trust 76
General Motors 76
Premier’s Advisory Council on Government Assets 77
Update on Council Progress and Recommendations 77
Recommendations for Hydro One 78
Recommendations for Beer Retailing and Distribution 82
Optimizing the Value of the Province’s Real Estate Assets 86
Section D: Creating an Innovative and Dynamic Business Environment
Supporting a Competitive Tax Environment 89
Making Strategic Investments 92
Jobs and Prosperity Fund 93
Regional and Community Partnerships 95
Access to Capital for Entrepreneurs 96
Attracting Foreign Direct Investment 97
Fostering an Innovation Ecosystem 98
Helping More Ontario Startups Scale Up 99
Supporting Excellence in Technology and Business Management 100
Supporting Health Innovation 100
Supporting the Sharing Economy 103
Strengthening International and Interprovincial Trade 104
Going Global Trade Strategy 104
Growing Opportunities Interprovincially 107
Creating a Supportive Business Environment 109
Helping Businesses Manage Electricity Costs 109
Effective Regulation 111
Managing Forfeited Corporate Property 112
Reviewing Labour Laws to Enhance Security and Competitiveness 112
Ensuring Workplace Stability During Transition 113
Modernizing Financial Services Regulation 114
Investments in Tourism and Culture 118
Enabling Long-Term Success for Ontario’s Horse Racing Industry 121
Supporting the Agriculture and Agri-Food Sector 123
Tackling Climate Change 124
Growing Businesses in the North 128
Renewing Ontario’s Mineral Development Strategy128
Forest Access Roads 129
Continued Electricity Support for Northern Industries 129
Supporting Northern Municipalities through the Ontario Municipal Partnership Fund 129
Section E: Strengthening Retirement Security
Introduction 131
The Need for Action to Enhance Retirement Savings 133
A Strategy to Enhance Retirement Savings 138
A New Ontario Pension Plan 138
The Proposed Ontario Retirement Pension Plan Act, 2014 139
Key Design Questions 139
Scope of the Plan 141
Minimum Earnings Threshold 143
Supporting the Self-Employed 146
Establishing the ORPP Administration Corporation 148
Ontarians with Self-Directed Retirement Savings 151
Strengthening Workplace Pension Plans 152
Target Benefit Pension Plans 152
Reforms to Pension Regulation 153
Sustainability and Affordability of Ontario’s Public-Sector Pension Plans 155
Section F: A Fair Society
Building a Fair Society for All Ontarians 159
Effective Health Care System for All 161
Patients First: Action Plan for Health Care 161
Providing Faster Access to the Right Care 162
Providing Better Coordinated and Integrated Care in the Community, Closer to Home 165
Providing Information to Help Ontarians Make the Right Decisions about their Health 169
Sustaining Ontario’s Universal Publicly Funded Health Care System for Generations to Come 170
Renewed Poverty Reduction Strategy 171
The Strategy’s Four Pillars 171
Assistance for the Vulnerable and Enhancing Safety 178
Supporting People with Developmental Disabilities 178
Ontario’s Youth Action Plan: Helping At-Risk Youth Succeed 180
An Action Plan to Stop Sexual Violence and Harassment 181
Increased Legal Aid Eligibility 183
Seniors Community Grant Program 183
Community Hubs 185
Fairness for Ontario Consumers 186
Taking Further Action to Protect Auto Insurance Consumers and Ensure Affordable Premiums 186
Keeping Electricity Cost-Effective and Efficient 191
Connecting Remote Communities to the Electricity Grid 193
Increasing Protection in the Condominium Market 193
Chapter II: Ontario’s Economic Outlook and Fiscal Plan
Section A: A Balanced Path to a Balanced Budget
Section B: Ontario’s Plan to Eliminate the Deficit
Program Review, Renewal and Transformation — Managing Spending while Transforming Programs and Services 203
Examples of Successful Transformation Initiatives 204
Transformation and Savings Initiatives in 2015–16 205
Moving Forward with PRRT 209
Success in Managing Compensation Costs 210
Overview 210
Public-Sector Bargaining Outcomes 210
Executive Compensation in the Broader Public Sector 212
Managing Public-Sector Pension Costs 213
Steps Taken to Maintain Tax Fairness and a Level Playing Field for Business 214
Combating the Underground Economy 215
Reducing Aggressive Corporate Tax Avoidance 219
Government Transparency, Financial Management and Fiscal Accountability 220
Government Transparency 220
Financial Management 221
Fiscal Accountability 222
Section C: 2014–15 Interim Fiscal Performance
In-Year Revenue Performance 227
Revenue Changes 228
In-Year Expense Performance 229
Expense Changes 231
Achieving the 2014–15 Savings Target 232
Section D: Ontario’s Economic Outlook
Ontario’s Economy Gaining Momentum 234
Employment Gains Continue 236
Global Economic Developments and Outlook 238
U.S. Economy 239
Oil Prices 241
The Canadian Dollar 243
Financial Markets 244
Outlook for Ontario’s Economic Growth 248
Details of the Ontario Economic Outlook 256
Private-Sector Forecasts 257
Comparison to the 2014 Budget 259
Section E: Ontario’s Fiscal Plan
Ontario’s Recovery Plan 261
Key Changes since the 2014 Budget 262
Ontario’s Revenue Outlook 264
Medium-Term Revenue Outlook 265
Key Changes in the Medium-Term Revenue Outlook since the 2014 Budget 270
User Fees and Other Non-Tax Revenue 278
Medium-Term Expense Outlook 281
Risks to Expense Outlook 284
Contingent Liabilities 286
Fiscal Prudence 286
Section F: Details of Ontario’s Finances
Fiscal Tables and Charts 287
Support from Gaming 297
Chapter III: National Leadership — Strong Ontario, Strong Canada
Intergovernmental Partnerships that Address 21st Century Challenges 301
Need for Responsible Federal Action 302
The Fiscal Imbalance in the Federation 302
Fiscal Arrangements Need to Be Modernized 305
Building Blocks of a Strong Economic Union 306
Canadian Infrastructure Partnership 306
Ring of Fire 309
First Nation Communities 311
Support for Advanced Manufacturing 313
Labour Market Development Agreement 314
Canadian Energy Strategy 315
Support for Clean Energy 316
Support for Natural Disaster Response, Assistance and Mitigation 317
Chapter IV: A Fair and Sustainable Tax System
Introduction 321
Business Tax Supports 323
Apprenticeship Training Tax Credit 324
Ontario Interactive Digital Media Tax Credit 327
Film and Television Tax Credits 328
Ontario Sound Recording Tax Credit 331
Paralleling Federal Measures 332
Taxation of Trusts and Estates 332
Ontario Resource Tax Credit and the Additional Tax on Crown Royalties 333
Supporting Consolidation of the Electricity Distribution Sector 334
Other Measures 336
Registration Requirements for Certain Road-Building Machines 336
Property Tax Measures 336
Provincial Land Tax 336
Power Dam Special Payment Program 339
Strengthening the Property Assessment System 340
Summary of Measures 342
Technical Amendments 343
Chapter V: Borrowing and Debt Management
Introduction 347
Term of Borrowing 348
2014–15 Borrowing Details and Green Bonds 349
Borrowing Program Results 351
Borrowing Program Outlook 352
Interest on Debt Savings and Affordability 355
Ensuring Preferred Market Access 357
Ensuring Adequate Liquidity Levels 360
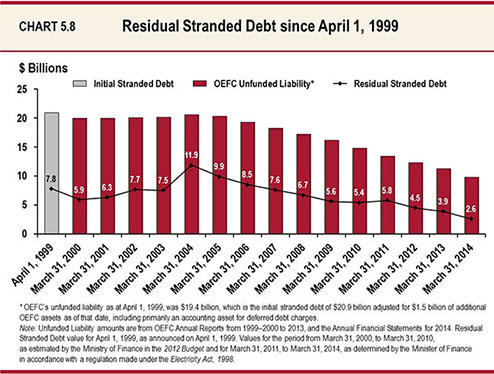
Reducing Ontario’s Stranded Debt 361
Impact of Proposed Hydro One Initial Public Offering on Residual Stranded Debt 362
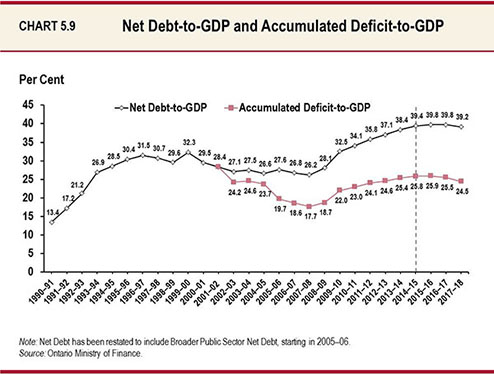
Net Debt 363
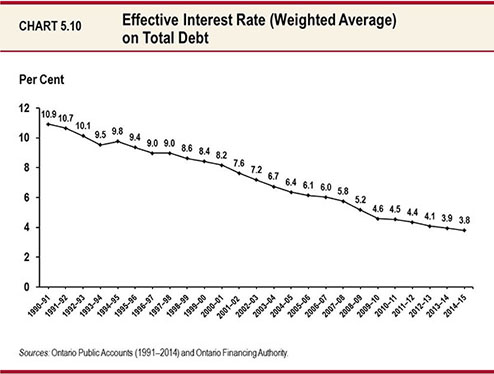
Cost of Debt 365
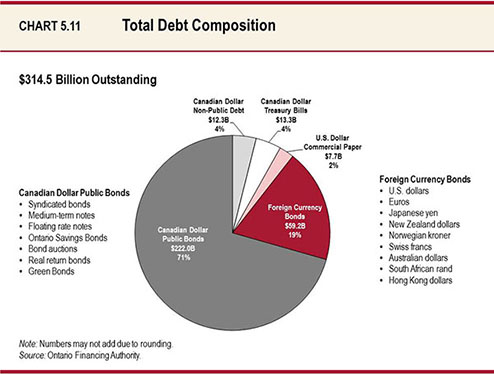
Total Debt Composition 366
Limiting Risk Exposure 367
Consolidated Financial Tables 370
List of Tables
Chapter I: Implementing the Plan
| Table 1.1 | Dedicated Funds for Moving Ontario Forward 45 | |
| Table 1.2 | GO Transit Rail Service Improvements 50 | |
| Table 1.3 | Measures the Government Has Taken to Maintain a Competitive Business Tax System 89 |
| Table 1.4 | Recent Strategic Partnership Investments 94 |
| Table 1.5 | Recent Examples of Supporting Economic Development in Ontario’s Communities 95 |
Chapter II: Ontario’s Economic Outlook and Fiscal Plan
| Table 2.1 | Difference in Projected Pension Expense versus Commission on the Reform of Ontario’s Public Services’ Forecast 213 |
| Table 2.2 | 2014–15 In-Year Fiscal Performance 225 | |
| Table 2.3 | Summary of Revenue Changes since the 2014 Budget 227 | |
| Table 2.4 | Summary of Expense Changes since the 2014 Budget 230 | |
| Table 2.5 | Ontario Economic Outlook 233 | |
| Table 2.6 | Outlook for External Factors 246 | |
| Table 2.7 | Impacts of Sustained Changes in Key External Factors on Ontario’s Real GDP Growth 247 |
| Table 2.8 | The Ontario Economy, 2013 to 2018 256 | |
| Table 2.9 | Private-Sector Forecasts for Ontario Real GDP Growth 257 | |
| Table 2.10 | Changes in Ministry of Finance Key Economic Forecast Assumptions: 2014 Budget Compared to 2015 Budget 260 | |
| Table 2.11 | Ontario’s Recovery Plan 261 | |
| Table 2.12 | Change in Medium-Term Fiscal Outlook since the 2014 Budget 263 |
| Table 2.13 | Summary of Medium-Term Outlook 265 | |
| Table 2.14 | Personal Income Tax Revenue Outlook 266 | |
| Table 2.15 | Sales Tax Revenue Outlook 267 | |
| Table 2.16 | Corporations Tax Revenue Outlook 268 | |
| Table 2.17 | Summary of Medium-Term Revenue Changes since the 2014 Budget 270 |
| Table 2.18 | Selected Economic and Revenue Risks and Sensitivities 273 | |
| Table 2.19 | Summary of Medium-Term Expense Outlook 281 | |
| Table 2.20 | Selected Expense Sensitivities 285 | |
| Table 2.21 | Medium-Term Fiscal Plan and Outlook 287 | |
| Table 2.23 | Total Expense 289 | |
| Table 2.24 | Details of Other Expense 290 | |
| Table 2.25 | 2015–16 Infrastructure Expenditures 291 | |
| Table 2.26 | Ten-Year Review of Selected Financial and Economic Statistics 292 |
| Table 2.27 | Support for Health Care, Charities, Problem Gambling and Related Programs, Municipalities and Ontario First Nations 297 | |
Chapter III: National Leadership — Strong Ontario, Strong Canada
| Table 3.1 | Recent Examples of Investments in the Automotive Sector 313 | |
Chapter IV: A Fair and Sustainable Tax System
| Table 4.1 | 2015 Budget Tax Measures 342 | |
Chapter V: Borrowing and Debt Management
| Table 5.1 | 2014–15 Borrowing Program: Province and Ontario Electricity Financial Corporation 351 |
| Table 5.2 | Medium-Term Borrowing Outlook: Province and Ontario Electricity Financial Corporation 352 |
| Table 5.3 | Net Debt and Accumulated Deficit 370 | |
| Table 5.4 | Medium-Term Outlook: Net Debt and Accumulated Deficit 371 | |
| Table 5.5 | Debt Maturity Schedule 372 | |
List of Charts
Chapter I: Implementing the Plan
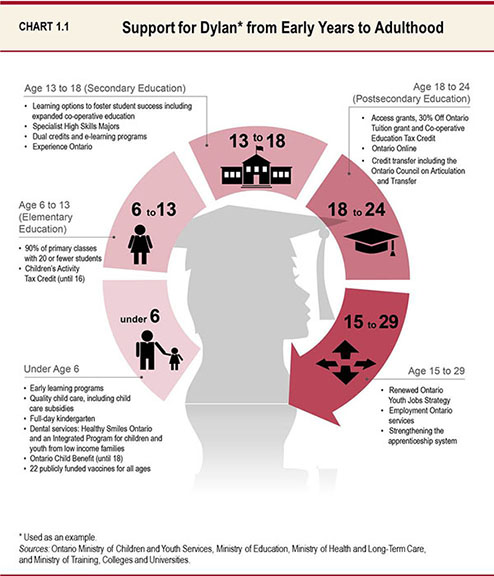
| Chart 1.1 | Support for Dylan from Early Years to Adulthood 6 | |
| Chart 1.2 | Key Achievements in Education 9 | |
| Chart 1.3 | Key Achievements in Postsecondary Education 16 | |
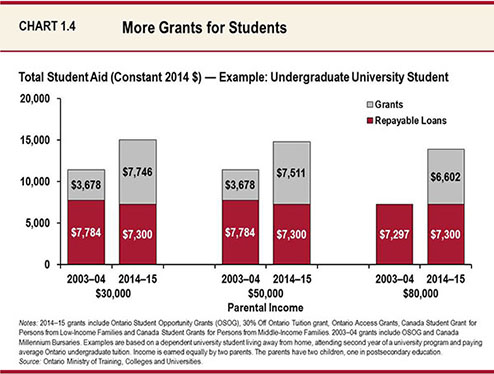
| Chart 1.4 | More Grants for Students 20 | |
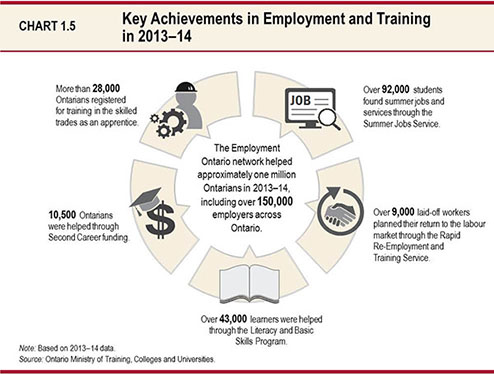
| Chart 1.5 | Key Achievements in Employment and Training in 2013–14 22 | |
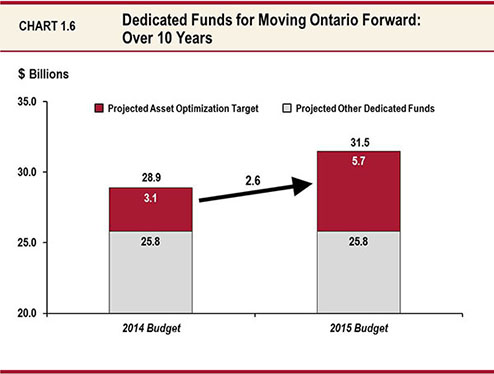
| Chart 1.6 | Dedicated Funds for Moving Ontario Forward: Over 10 Years 44 |
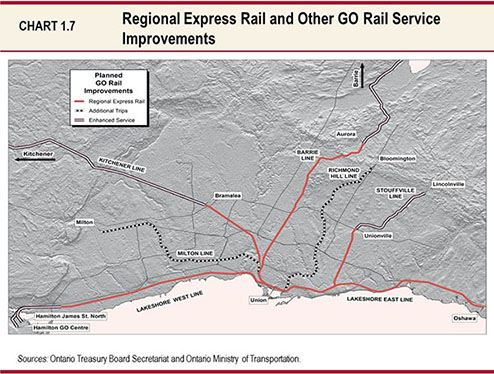
| Chart 1.7 | Regional Express Rail and Other GO Rail Service Improvements 47 |
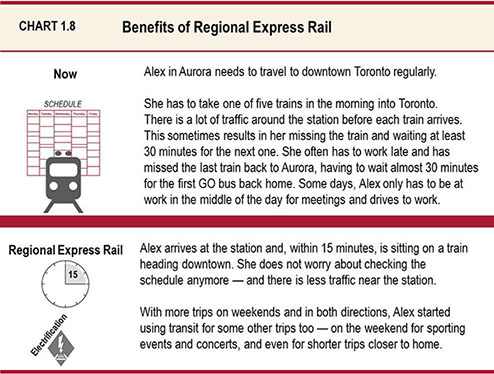
| Chart 1.8 | Benefits of Regional Express Rail 48 | |
| Chart 1.9 | Moving Ontario Forward – GTHA 52 | |
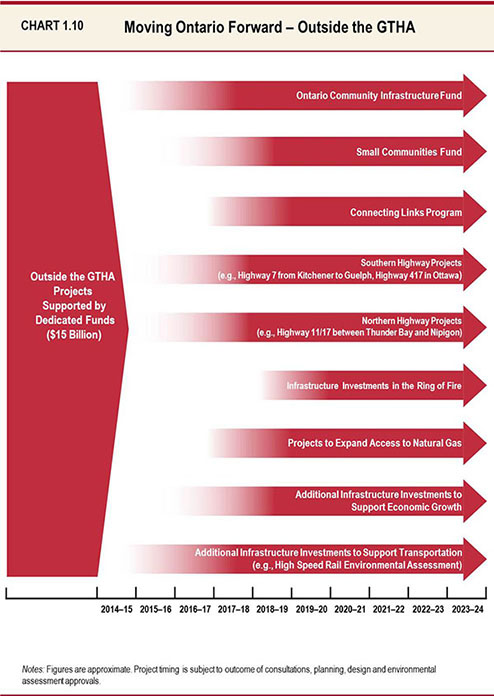
| Chart 1.10 | Moving Ontario Forward – Outside the GTHA 54 | |
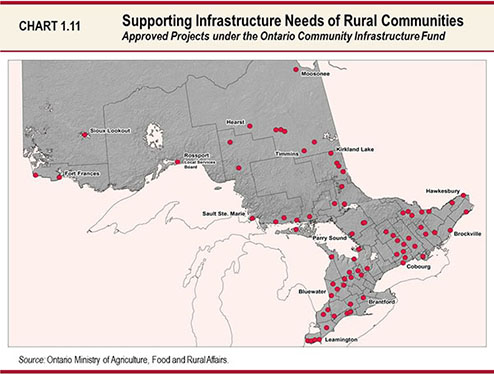
| Chart 1.11 | Supporting Infrastructure Needs of Rural Communities 55 | |
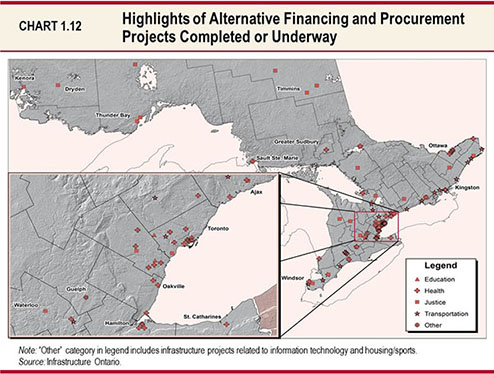
| Chart 1.12 | Highlights of Alternative Financing and Procurement Projects Completed or Underway 67 |
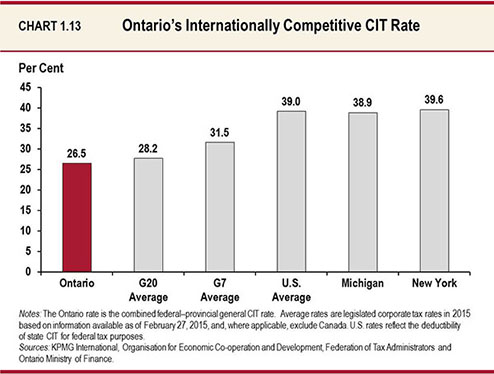
| Chart 1.13 | Ontario’s Internationally Competitive CIT Rate 90 | |
| Chart 1.14 | Ontario’s Marginal Effective Tax Rate on New Business Investment Has Been Cut in Half 91 |
| Chart 1.15 | Ontario Exceeds Most G7 Countries in Venture Capital Investment Intensity 96 | |
| Chart 1.16 | Ontario’s Accident Benefits Claims Costs Decrease from Past Reforms but Remain Highest 188 |
Chapter II: Ontario’s Economic Outlook and Fiscal Plan
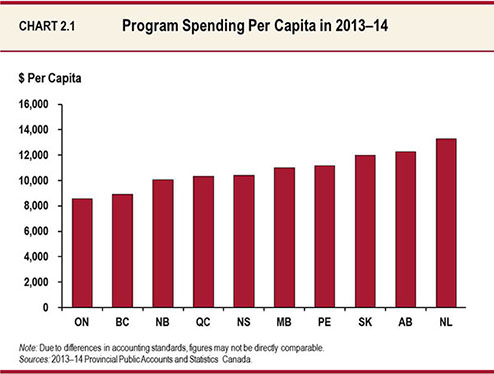
| Chart 2.1 | Program Spending Per Capita in 2013–14 198 |
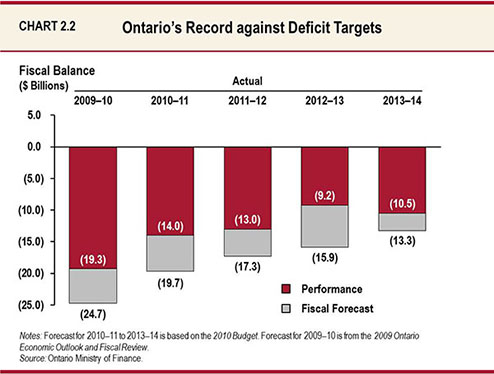
| Chart 2.2 | Ontario’s Record against Deficit Targets 199 | |
| Chart 2.3 | Ratio of Program Expense to GDP, 2009–10 to 2014–15 200 | |
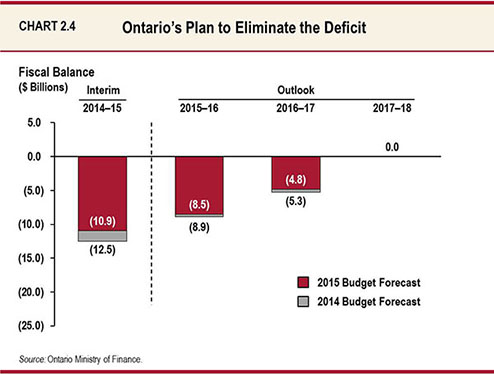
| Chart 2.4 | Ontario’s Plan to Eliminate the Deficit 201 | |
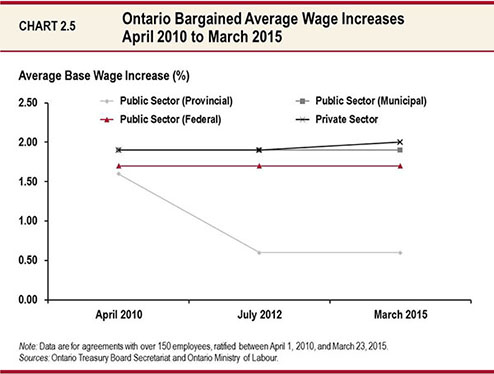
| Chart 2.5 | Ontario Bargained Average Wage Increases April 2010 to March 2015 211 |
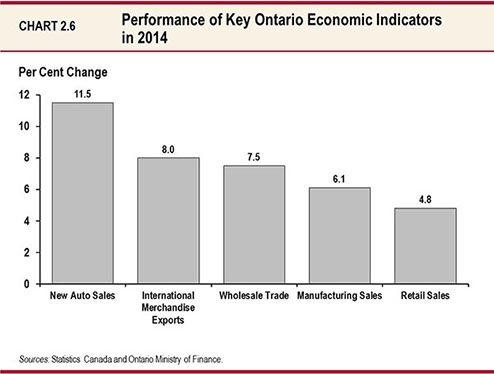
| Chart 2.6 | Performance of Key Ontario Economic Indicators in 2014 234 | |
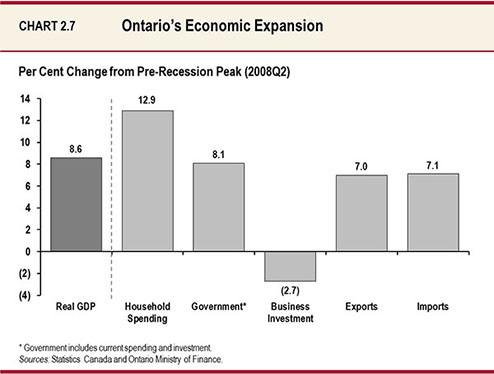
| Chart 2.7 | Ontario’s Economic Expansion 235 | |
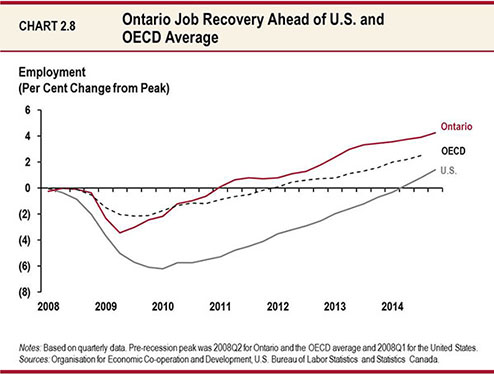
| Chart 2.8 | Ontario Job Recovery Ahead of U.S. and OECD Average 236 | |
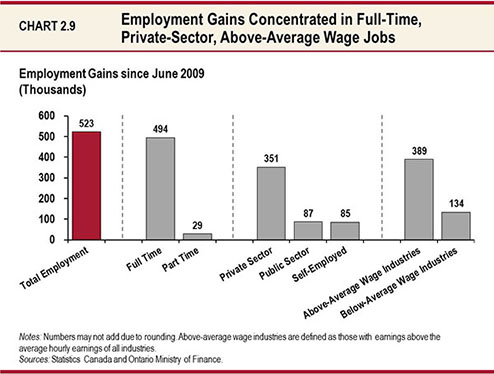
| Chart 2.9 | Employment Gains Concentrated in Full-Time, Private-Sector, Above-Average Wage Jobs 237 |
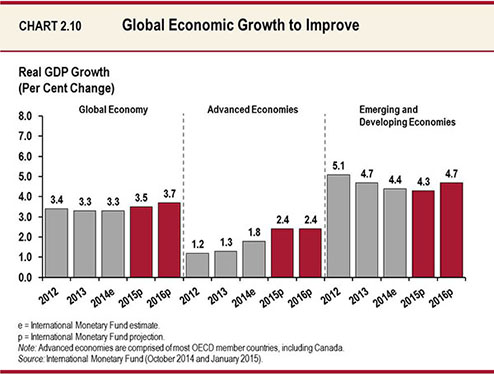
| Chart 2.10 | Global Economic Growth to Improve 239 | |
| Chart 2.11 | Strengthening U.S. Recovery 240 | |
| Chart 2.12 | Oil Prices Expected to Recover Gradually 241 |
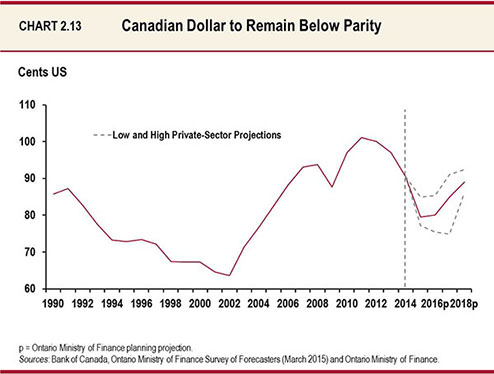
| Chart 2.13 | Canadian Dollar to Remain Below Parity 243 | |
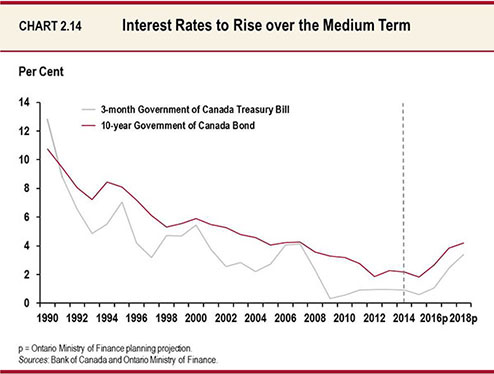
| Chart 2.14 | Interest Rates to Rise over the Medium Term 245 | |
| Chart 2.15 | Inflation Expected to Remain Moderate 249 | |
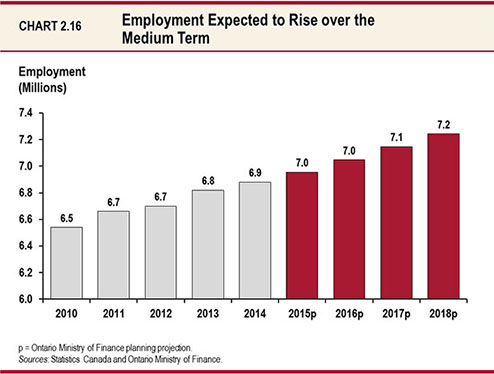
| Chart 2.16 | Employment Expected to Rise over the Medium Term 250 | |
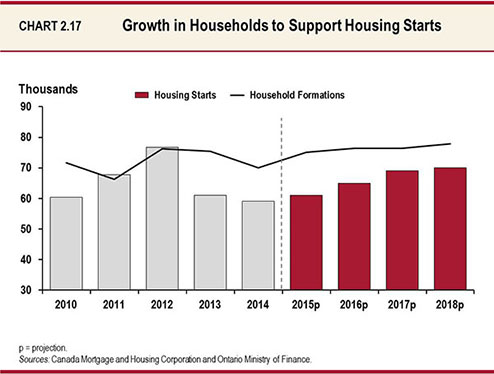
| Chart 2.17 | Growth in Households to Support Housing Starts 251 | |
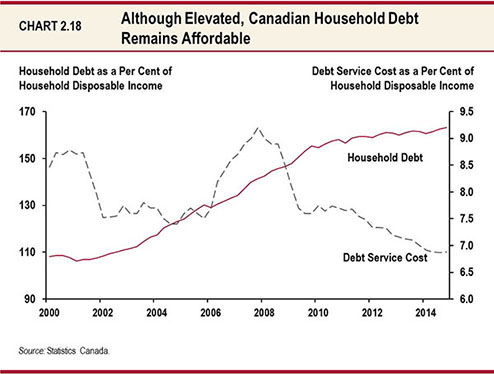
| Chart 2.18 | Although Elevated, Canadian Household Debt Remains Affordable 252 |
| Chart 2.19 | Ontario Business Machinery and Equipment Investment Expected to Rise in Line with Profits 253 | |
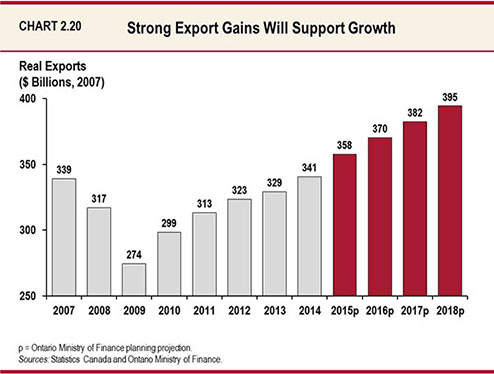
| Chart 2.20 | Strong Export Gains Will Support Growth 255 |
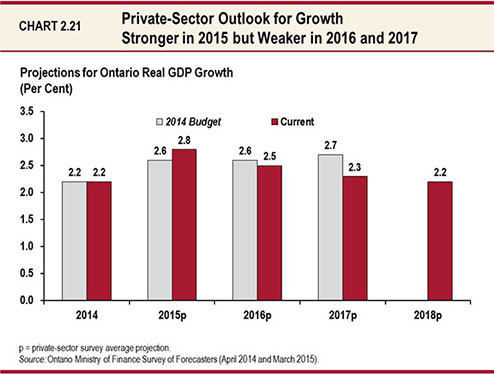
| Chart 2.21 | Private-Sector Outlook for Growth Stronger in 2015 but Weaker in 2016 and 2017 258 |
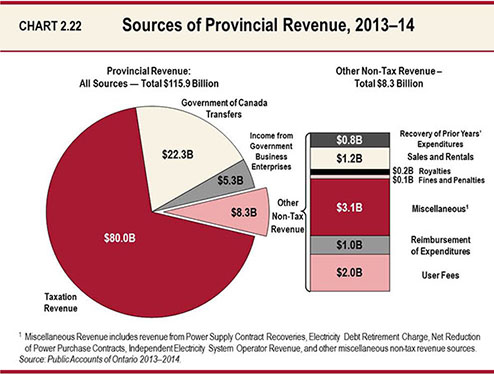
| Chart 2.22 | Sources of Provincial Revenue, 2013–14 280 |
| Chart 2.23 | Composition of Revenue, 2015–16 294 | |
| Chart 2.24 | Composition of Total Expense, 2015–16 295 |
| Chart 2.25 | Composition of Program Expense, 2015–16 296 |
Chapter III: National Leadership — Strong Ontario, Strong Canada
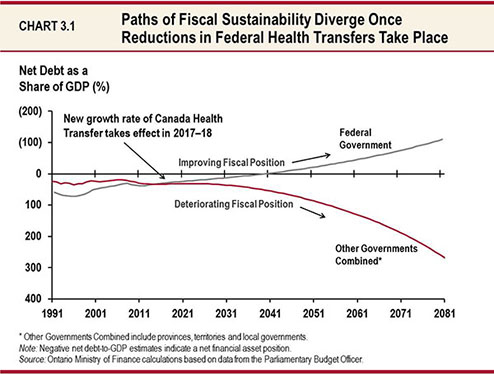
| Chart 3.1 | Paths of Fiscal Sustainability Diverge Once Reductions in Federal Health Transfers Take Place 303 |
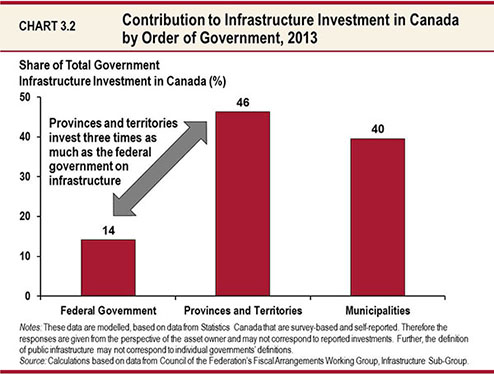
| Chart 3.2 | Contribution to Infrastructure Investment in Canada by Order of Government, 2013 307 |
Chapter IV: A Fair and Sustainable Tax System
| Chart 4.1 | New Apprenticeship Registrations in Trades Eligible for the ATTC, 2003–04 to 2013–14 325 |
Chapter V: Borrowing and Debt Management
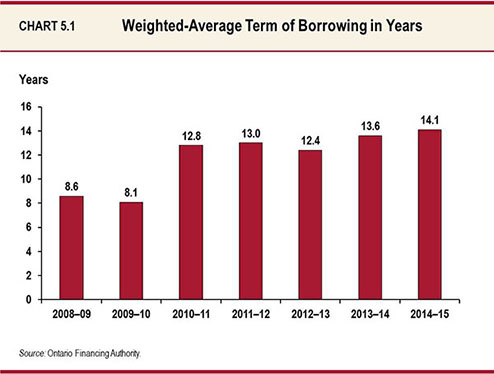
| Chart 5.1 | Weighted-Average Term of Borrowing in Years 348 | |
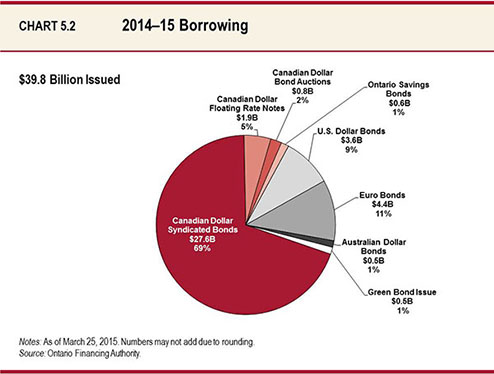
| Chart 5.2 | 2014–15 Borrowing 349 | |
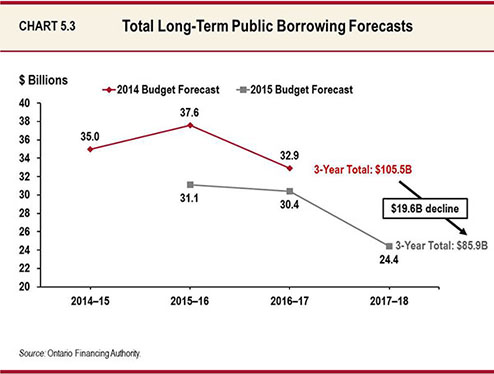
| Chart 5.3 | Total Long-Term Public Borrowing Forecasts 353 | |
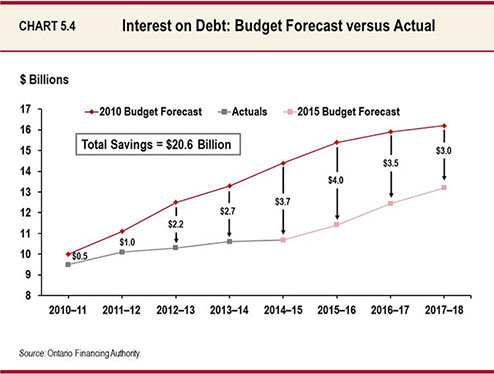
| Chart 5.4 | Interest on Debt: Budget Forecast versus Actual 355 | |
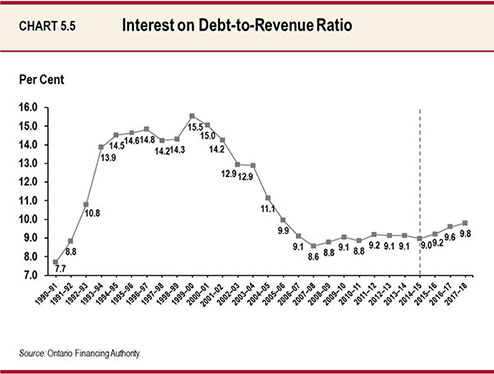
| Chart 5.5 | Interest on Debt-to-Revenue Ratio 356 | |
| Chart 5.6 | Canadian Dollar and Foreign Currency Borrowing 357 | |
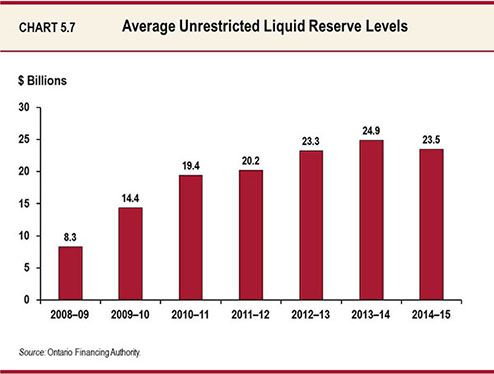
| Chart 5.7 | Average Unrestricted Liquid Reserve Levels 360 |
| Chart 5.8 | Residual Stranded Debt since April 1, 1999 361 |
| Chart 5.9 | Net Debt-to-GDP and Accumulated Deficit-to-GDP 364 | |
| Chart 5.10 | Effective Interest Rate (Weighted Average) on Total Debt 365 | |
| Chart 5.11 | Total Debt Composition 366 | |
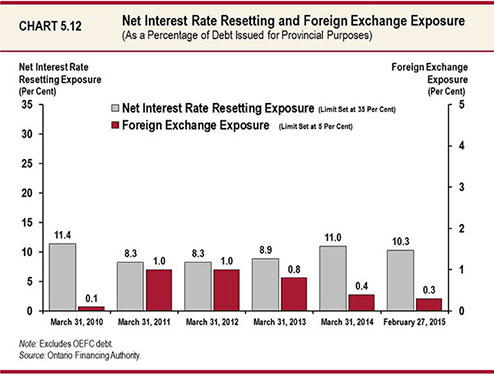
| Chart 5.12 | Net Interest Rate Resetting and Foreign Exchange Exposure (As a Percentage of Debt Issued for Provincial Purposes) 367 |
Foreword
Building Ontario Up
Ontario is moving forward with a plan for the economy focused on investing in modern public infrastructure such as roads, bridges and transit, creating an innovative and dynamic business environment, investing in people’s skills and talents, and building a strong and secure retirement income system.
We are building Ontario up by making investments that grow the economy and create jobs.
We are unlocking the value of Provincial assets in order to make unprecedented investments in modern infrastructure, which is essential to a 21st century economy.
The government’s plan is working. Performance indicators that measure economic progress prove this. Foreign direct investment remains strong, employment is up, youth employment is improving, graduation rates are up — and we are beating our deficit targets. The 2015 Ontario Budget builds on our plan by making key investments in priorities that matter to Ontarians.
Our plan rests on a foundation of fiscal responsibility. We are taking a deliberate and thoughtful approach to eliminating the deficit by 2017–18.
Ontario’s path to a balanced budget is focused on improving the quality of life of all Ontarians. As always, we must manage our limited resources in a way that is efficient and effective. As a government, this means doing some things differently. We will make the right investments to help grow the economy and to preserve and improve the vital services that our families and communities rely on.
That is why the government continues to invest in next-generation industries through, for example, our Jobs and Prosperity Fund.
We are investing in skills and training so we have the diverse workforce needed to take advantage of the job opportunities of tomorrow.
We are preparing youth for the jobs of today as well as for tomorrow’s opportunities.
We are also preserving and improving the programs and services that Ontarians expect and trust. At the same time, we are ensuring that people get the best possible value for every tax dollar spent.
Our society is compassionate and competitive. We will not let the vulnerable fall behind.
We have made significant progress. What comes next is further action on our plan to build Ontario up.
Maximizing the Value of Provincial Assets
A key part of strong fiscal management is making the most of the Province’s assets over the long term. Using them strategically is a cornerstone of good government. That is why Ontario is moving forward on a plan to unlock the value of certain Provincial assets, including the Liquor Control Board of Ontario (LCBO) head office lands, Ontario Power Generation’s head office building and Seaton and Lakeview lands.
In addition, the Premier’s Advisory Council on Government Assets has recommended ways to unlock the value of Provincial assets in a way that creates lasting public benefits. The Council recommended reforming Ontario’s beverage alcohol system, while maintaining a strong commitment to social responsibility. With respect to Hydro One, the Council recommended broadening ownership while ensuring ongoing consumer protection. It has done so in a way that is transparent, professional and independently validated.
Reforming Beverage Alcohol Sales
Ontario will permit the sale of beer in grocery stores for the first time in its history.
Ontario is also entering into a new agreement with the owners of the Beer Store that returns the framework closer to its original cooperative roots, opening up ownership to small and craft brewers.
At the same time, the LCBO will modernize its practices to improve the retail experience for all Ontarians.
The Premier’s Advisory Council on Government Assets will continue to refine its recommendations on how to maximize value in the wine retailing sector.
Selling alcohol is a public trust and the government will continue to adhere to the principle of social responsibility supporting the safe consumption of alcohol in light of the expansion of alcohol distribution channels in the province.
Broadening Ownership of Hydro One
The government intends to broaden ownership in Hydro One Inc., including through an initial public offering of approximately 15 per cent, in order to help strengthen its long-term performance.
The Province intends to ultimately retain 40 per cent of its Hydro One common shares and is proposing legislation so that no other shareholder or group of shareholders would be permitted to own more than 10 per cent.
The ability to set rates will continue to be at arm’s length from Hydro One management, with rates set by the independent regulator, the Ontario Energy Board (OEB).
Unlocked Value Placed in the Trillium Trust
Actions taken to unlock the value of Provincial assets will allow us to realize even more value than originally anticipated. An increased asset optimization target of $5.7 billion — a $2.6 billion increase over the 2014 Budget projection — will be reinvested to build bridges, transit, roads and other priority infrastructure throughout Ontario. This includes net proceeds from the sale of qualifying assets that will be placed in the Trillium Trust.
These projects will benefit Ontarians for years to come. The Trillium Trust has already received $1.35 billion from the sale of the Province’s shares in General Motors.
The Trillium Trust signifies the government’s commitment to building critically needed infrastructure.
Infrastructure: Building to Grow
Modern infrastructure is vital to Ontario’s growth and quality of life; it forms the backbone of a well-functioning economy and prosperous society. Infrastructure includes roads, bridges, public transit, water systems, hospitals and schools — in other words, important elements that help our economy grow and modern society thrive. We need efficient modes of transport to move goods to market, and to move commuters between their homes and workplaces.
That is why we are renewing and expanding Ontario’s infrastructure.
The government is investing more than $130 billion across the province over 10 years. These investments would support over 110,000 jobs per year on average. This investment will fund projects in public transit, highways, schools, health facilities, postsecondary institutions and other assets from Cornwall to Kenora and from Windsor to Moosonee.
Moving Ontario Forward is a plan to create jobs, boost productivity and revitalize communities. Unlocking the value of certain government assets will allow us to increase the dedicated funds available for Moving Ontario Forward by $2.6 billion, to $31.5 billion over 10 years. It will allow us to accelerate service enhancements on the GO Transit network, laying the foundation for Regional Express Rail. It will also allow us to enhance regional mobility by investing in new transit projects in Mississauga, Brampton and Hamilton. Outside the Greater Toronto and Hamilton Area (GTHA), it will allow us to invest in priority projects such as helping more communities gain access to natural gas, continuing to improve roads and highways and investing in the Ring of Fire in northern Ontario.
Infrastructure projects support jobs today while meeting our education, health care and transportation needs of the future. When Ontario invests in infrastructure, it is building — and when it is building, it is growing.
Creating an Innovative and Dynamic Business Environment
Through our four-part economic plan, we are supporting greater investment in productivity and innovation, providing a renewed focus on international exports, encouraging the transition to a low-carbon economy and creating more jobs for Ontarians.
These investments will help people achieve their full potential, so they can enjoy a better way of life, and help our province become an even better place to live.
The Jobs and Prosperity Fund allows us to partner with business to enhance productivity, increase innovation, grow exports and create jobs. We will enhance the Jobs and Prosperity Fund by an additional $200 million to attract more business investments and create jobs, and by making the forestry sector eligible.
We are ensuring that Ontario’s economy is resilient as we compete in the global environment by making strategic decisions to ensure our business supports are well targeted, effective and fiscally sustainable. The 2015 Budget highlights proposed measures to improve the effectiveness of supports to business and to achieve the best possible outcomes for every dollar we spend, while ensuring that Ontario remains one of the most attractive and competitive locations for business investment.
Improving Education and Skills Training Opportunities
We know that Ontario’s continued economic prosperity depends on a highly skilled workforce that is diverse, adaptable and innovative. That is how the Province attracts jobs and investments, which, in turn, improve our communities and the opportunities found in them. Studies suggest that seven of every 10 new jobs created are expected to require postsecondary education or training.
The success of Ontario’s workers is founded on a first-rate education system that starts in the earliest years. That is why the government is continuing to improve education and skills training, from preschool and full-day kindergarten through to postsecondary education and apprenticeship programs. We are building on past investments, including doubling child care funding since 2004 to more than $1 billion annually; continuously improving our education system with innovations such as experiential learning pilot programs; and providing more than $1.3 billion in grants and loans for student aid in 2013–14.
We are renewing the Ontario Youth Jobs Strategy by investing an additional $250 million over two years to provide employment and skills development opportunities for up to 150,000 youth. We are supporting the skilled trades by investing an additional $23 million over two years in the Apprenticeship Enhancement Fund for better equipment to help train more people.
A Fair Society: Living and Working in Ontario
Ontario’s most valuable resource is its people. Ontarians are the key to Ontario’s prosperity.
That is why the government is dedicated to ensuring all Ontarians can reach their full potential through access to high-quality education, excellent health care, rewarding employment opportunities and social services they can continue to rely on. We are also committed to ensuring that consumers are protected. Among other initiatives, Ontario is taking steps to keep auto insurance rates affordable and to assist low-income people with the cost of electricity.
Investments that focus on building a fair society for all Ontarians make economic sense. Focusing on early intervention programs supports good health, lifts people out of poverty, and enhances security for all Ontarians. This will, in turn, reduce government expenditures over the longer term.
National Leadership and a Strong Economic Union
Ontario will thrive when, working with other provinces and territories, as well as the federal government, we achieve a strong Canadian economic union.
As we adapt to the realities and challenges of the 21st century, we need stronger intergovernmental partnerships to create a stronger Canadian economic union. Ontarians, like all Canadians, expect their governments to work together to improve the economic well-being and quality of life of the people they serve.
Ontario is showing the necessary national leadership. Through the Council of the Federation, we are working with Canada’s premiers to promote international trade, reduce internal trade barriers, and develop a Canadian Energy Strategy. Ontario is a leader in helping to set up the Cooperative Capital Markets Regulatory System and to launch the renminbi trading hub in Toronto, serving all of North and South America. Ontario has also led the way in inviting the federal government to increase investment in public infrastructure and improve Canada’s economic competitiveness.
Ontario continues to be a strong voice at the national level — the challenges that Canada faces cannot be met by one order of government alone.
Retirement Security: Securing Our Future
The decisions we make today will help shape tomorrow.
Evidence shows that many Ontarians are not saving adequately for retirement. Unless action is taken now, the retirement undersaving challenge will worsen over time.
That is why the Province is leading the way to help Ontario workers secure the retirement future they deserve. Moving forward with strengthening workplace pension plans and introducing the Ontario Retirement Pension Plan by 2017 will ensure that today’s workers have a secure retirement income foundation.
Ontario’s retirement system should ensure that individual Ontarians can maintain their standard of living in retirement. For the economy as a whole, increased retirement savings will contribute to higher investment and strong economic growth over the long term. Higher incomes for retirees will lead to increased consumption, generating future economic growth and helping the Ontario economy better cope with an aging population.
Confronting Climate Change
Confronting climate change and protecting our environment will help ensure Ontario continues to be a great place to live. These actions will also help ensure that we have a strong economy.
The environmental, social and economic challenges of climate change are global issues. Ontario has been hit hard by the effects of climate change, including recent extreme weather events such as ice storms, severe thunderstorms and flash flooding. These events have caused unprecedented damage to the places Ontarians live, work and play, costing the government, businesses and families hundreds of millions of dollars. In the years to come, such damages and costs will likely be greater if current trends are left unchecked.
We will be moving ahead with a cap-and-trade system to protect the air we breathe, the water we drink, and the health of our children. We will take a balanced approach that protects both the environment and the economy. We will consult with experts, industry, environmental groups and the public, to determine what will work best for Ontario, with the intent to link with the cap-and-trade markets already in place in Quebec and California. This will be part of a comprehensive strategy to fight climate change.
Sound Fiscal Management
The government has a proven track record of strong fiscal management. We are not only meeting our deficit targets, but we are beating them. Our deficit for 2014–15 is projected to be $10.9 billion, an improvement of $1.6 billion, beating our deficit target set out in the 2014 Budget. For 2015–16, we are forecasting a deficit of $8.5 billion, which would be the lowest since the onset of the global recession.
We continue to overachieve on savings targets by managing expenses and making sure every dollar counts. The 2014 Budget outlined a plan to eliminate the deficit by 2017–18, and we remain committed to do so, based on managing growth in program spending while maintaining the integrity of Provincial revenues.
In fact, over the past four years, the Province has managed to hold average annual growth in program spending to 1.5 per cent, below inflation, without cutting vital services. Indeed, Ontario had the lowest per capita program spending of any province in 2013–14.
Achieving a balanced budget requires a disciplined focus on finding smarter, better ways to deliver the best possible value for every dollar spent, while continuing to make investments that create jobs, expand opportunities and secure prosperity for all Ontarians. To eliminate the deficit by 2017–18, the government will maintain a strong and unwavering commitment to fiscal discipline. Critical to this approach will be Program Review, Renewal and Transformation (PRRT). An internal process first discussed in the 2014 Ontario Economic Outlook and Fiscal Review, PRRT is focused on making smart and responsible choices while ensuring sustainable public services that serve Ontarians efficiently.
Program Review, Renewal and Transformation is a new approach to multi-year planning and budgeting. From an across-government perspective, ministries are working together to better deliver services to people. At the same time, the Province is making tough choices to transform or end programs that are not performing, do not link to government priorities or no longer clearly serve the public interest.
Making Progress
Most forecasters are predicting that Ontario will be among the provincial leaders in economic growth over the next two years, with growth outpacing the national average.
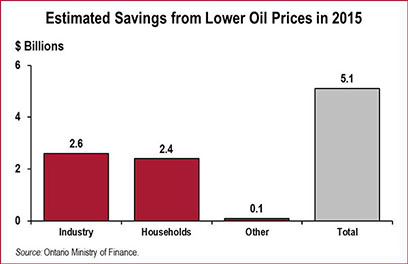
A combination of low oil prices, low interest rates, a lower Canadian dollar and the improving U.S. economy is giving Ontario’s economy new opportunities to grow. But we will not base our economic planning solely on these factors, which are volatile and difficult to predict. It is important to continue to build on our foundational strengths, rather than simply exploiting changes in circumstances.
Supported by the government’s sound fiscal management and favourable economic trends, Ontario continues to create jobs. Employment has rebounded strongly from the recessionary low in June 2009, with over half a million net new jobs created — the majority in industries paying above-average wages. These high-quality jobs provide opportunities for people to maximize their potential while also creating financial stability and securing prosperity for all Ontarians.
These conditions highlight Ontario’s advantage — its solid economic foundation.
What Is Important to Ontarians
The 2015 Budget sets out the government’s priorities for the coming year. But these are also Ontarians’ priorities. To make sure we have got it right, the Province undertook our most extensive budget consultation process to date. Through the new Budget Talks website, face-to-face sessions across the province and telephone town halls with tens of thousands of participants, we heard from more Ontarians than ever before.
For example, we heard that Ontarians want a world-class education and skills training system so that young people can compete for the jobs of tomorrow. We also heard that people are concerned about gridlock and want more public transit. People in northern and rural areas want better roads so they can more easily travel from community to community.
We listened to the views of Ontarians and their suggestions are reflected in the pages of this Budget.
Conclusion
Looking ahead, as we continue to invest in people’s talents and skills, build infrastructure, foster an innovative and dynamic business environment, and build retirement security, we are creating the conditions necessary for all Ontarians to succeed and enjoy a better life. At the same time, eliminating the deficit means securing the future of Ontario’s public services, such as health care and education, which make it possible for us to succeed.
Together, we are working hard to build Ontario up and help unlock the potential in our society and in each of us.
Originally signed by
The Honourable Charles Sousa
Minister of Finance
Chapter I
IMPLEMENTING THE PLAN
Section A: Investing in People’s Talents and Skills
Ontario’s greatest strength is its people. The Province’s highly skilled, diverse and adaptive workforce is a competitive advantage. That is a key reason why, despite global challenges and uncertain market conditions, Ontario continues to create jobs.
The Province has a world-class education and skills training system and is continually striving to improve it. By investing in people today and giving Ontarians the support they need to get the right skills and the right jobs, the Province is developing the strong economy of tomorrow. This principle is the foundation of the first pillar of the government’s four-point plan, outlined in the 2014 Budget. The plan provides a blueprint for excellence in education from early years to adulthood. Key elements include:
| › | Continuing to modernize and strengthen Ontario’s child care system; |
| › | Fully implementing full-day kindergarten; |
| › | Implementing Achieving Excellence, a new vision for education that prepares learners for a rapidly changing, technology-driven, globalized world; |
| › | Advancing postsecondary education and training by supporting programs that foster innovative, entrepreneurial and creative graduates; and |
| › | Renewing the Ontario Youth Jobs Strategy. |
The government is continuing to implement its plan by:
| › | Introducing and implementing the Child Care Modernization Act, 2014, which will strengthen oversight of the province’s child care sector; |
| › | Completing the implementation of full-day kindergarten across the province; |
| › | Implementing “Achieving Excellence” and successfully launching: |
| › | Over 40 experiential learning pilots across Ontario; |
| › | A Specialist High Skills Major certificate in Innovation, Creativity and Entrepreneurship in every school board in Ontario; and |
| › | A Math Action Plan to improve outcomes in math. |
| › | Completing Strategic Mandate Agreements with all 45 publicly supported colleges and universities to ensure postsecondary institutions focus on their areas of strength and avoid unnecessary duplication; and |
| › | Helping more than 29,000 young people access jobs, develop skills and gain valuable work experience through the Youth Employment Fund, part of the Ontario Youth Jobs Strategy. |
Ontario’s plan builds on the progress of successive investments in education and training over the past 12 years:
| › | 84 per cent of students graduated from high school in 2014, up from 68 per cent in 2004; |
| › | 66 per cent of adults in Ontario had a postsecondary credential in 2013, up from 56 per cent in 2002 and higher than any country in the Organisation for Economic Co-operation and Development; and |
| › | 84 per cent of 2010‒11 college graduates and 87 per cent of 2011 university graduates in the labour force were employed within six months of graduation. |
Despite these successes, more must be done to equip Ontarians to compete in a rapidly changing and highly competitive global economy. That is why the government is taking new measures, including:
| › | Renewing the Ontario Youth Jobs Strategy by investing an additional $250 million over two years in a suite of programs that will serve up to 150,000 clients and focus on skills development, labour market connections, entrepreneurship and innovation; |
| › | Modernizing the Ontario Student Assistance Program to strengthen financial assistance for students; and |
| › | Launching an Experience Ontario pilot that will help recent high school graduates pursue their passions and choose a postsecondary pathway. |
The government’s enduring commitment to improving education and training will help ensure Ontario has the best workforce and attracts the best jobs, leading to an even stronger economy and better way of life.
Supporting Every Child, Reaching Every Student
Ontario’s education system is recognized as one of the best in the world and the government is committed to making it even better. Through the implementation of Achieving Excellence: A Renewed Vision for Education in Ontario, the Province will continue its progress towards an increasingly responsive, high-quality and accessible system.
Ontario’s vision builds on the progress of the last 10 years and focuses on achieving tangible results for both students and educators through four key goals:
| › | Promoting well-being; and |
| › | Enhancing confidence in the publicly funded education system. |
The Province’s plan also includes a focus on 21st century teaching and learning skills, the modernization of early learning and child care, and improving math achievement.
Over the last year, the government has made significant progress towards implementing its vision for education, with the following results:
| › | Over 40 experiential learning pilots launched across Ontario in 2014‒15 to explore new ways to support the delivery of innovative, student-driven, hands-on learning experiences that are connected to the community; |
The Innovation, Creativity and Entrepreneurship (ICE) element of the Specialist High Skills Major (SHSM) program was delivered to 2,000 students in 2014‒15. The new program was a partnership between the government and the University of Toronto’s Rotman School of Management. The government is investing an additional $1 million in 2015‒16 to support expansion of the ICE component of the SHSM program. |
| › | Specialist High Skills Major (SHSM) in Innovation, Creativity and Entrepreneurship (ICE) launched in every school board in 2014‒15. SHSMs are bundles of 8 to 10 courses that allow students to focus on a specific economic sector while acquiring their high school diploma. Participants graduate with the 21st century skills of ICE to create the jobs of tomorrow; |
| › | Math Action Plan implemented, with emphasis on expanding opportunities for teacher and principal professional learning in math; and |
| › | 31 pilot programs launched in 2014‒15 to develop innovative strategies to improve educational outcomes for students in the care of children’s aid societies. |
Supporting Technology and Innovation in Classrooms In the first year of the Technology and Learning Fund, the government invested $40 million to support technology and pedagogy for classrooms of the future. Some successes to date include: ● Students in remote communities in the Keewatin-Patricia District School Board are using Skype technology in Grade 4 social studies classes to communicate with students in other parts of the world, and learn about geography and different communities; and ● In the Waterloo Region District School Board’s Futures Forum program, high school students blog about real-world issues and participate in book studies with one of 12 teachers across the region, using online discussion forums to collaborate with and learn from other students.
|
Modernizing Child Care and Early Learning
Safe, responsive and accessible child care, integrated with early learning programs, contributes to healthy child development and a stronger future.
Over the years, there has been little fundamental change to Ontario’s child care system. The government is committed to modernizing and building a child care and early years system that will enhance programs and supports for children under age 12 by:
| › | Modernizing the legislative and regulatory framework for child care. |
| › | Increasing transparency with a new funding formula for child care. |
| › | Enhancing program quality and consistency in child care and early years programs to reflect a focus on safe and healthy child development and well-being. |
› | Making full-day kindergarten available to every four- and five-year-old in Ontario. The rollout of this initiative was completed in September 2014. |
| › | Ensuring that before- and after-school programs are available to six- to twelve-year-olds, where there is sufficient demand. |
Legislative Framework
Through the Child Care Modernization Act, 2014, enacted in December 2014, the government introduced reforms that will strengthen oversight of the unlicensed child care sector and provide families with increased access to licensed child care options. The Act will also allow the Province to immediately shut down a child care provider when a child’s safety is at risk.
What People Are Saying about the Child Care Modernization Act, 2014 (Bill 10) “Bill 10 is a declaration that children in our province are valued and that our government cares about their well-being. Protection of our youngest citizens is long overdue and must be the foundation upon which we build our system of education and care. Bill 10 gives us this foundation.” Sheila Olan-MacLean, President of the Ontario Coalition for Better Child Care. |
The online registry of unlicensed child care violations can be found at www.earlyyears.edu.gov.on.ca/ Unlicenced CCRegistryWeb. |
This legislation builds on steps that Ontario has already taken to strengthen oversight of the unlicensed child care sector. They include the creation of a dedicated enforcement team to investigate complaints against unlicensed providers, as well as an online searchable registry — paired with a toll-free number — of unlicensed child care violations.
Investing in Results
Since 2004, the government has doubled child care funding to more than $1 billion annually. In 2013‒14, an estimated 447,472 children benefited from Ontario’s child care investments. In 2015, the Province is allocating an additional $44.5 million in child care funding through the funding formula, which will help stabilize fees, improve the reliability of child care, and better meet the needs of child care operators and parents — protecting the gains made through previously announced investments.
A community hub can be a school, a neighbourhood centre or another public space that offers coordinated services such as education, health care and social services. |
As part of the Province’s commitment to increase child care spaces, Ontario is investing $120 million over three years in capital funding to create thousands more child care spaces in schools. This investment is another important step towards achieving the full vision of a seamless and integrated early years system in Ontario. It also represents an important component of the government’s commitment to community hubs. See Chapter I, Section F: A Fair Society for more details on community hubs.
Ontario’s Investments Continue to Improve Access to Child Care ● Since 2003, licensed child care spaces have increased by 70 per cent to 317,868, providing more than 130,000 additional children with safe and reliable child care. ● In January 2015, Ontario implemented a wage increase of $1 per hour for eligible child care workers in the licensed child care sector. Another wage increase is set for next year. This investment enhances employers’ ability to recruit and retain highly qualified and talented educators. |
Full-Day Kindergarten
With more than $1.5 billion in funding, full-day kindergarten is one of the most significant investments Ontario has made in a generation. The program supports over 260,000 children in approximately 3,600 schools across the province, and saves families up to $6,500 a year per child on child care costs. Program benefits include improved social skills, language and cognitive development, as well as communication skills and general knowledge. Overall, students in full-day kindergarten are better prepared to enter Grade 1 and be more successful in school, compared with those in half-day programs.1
“Children’s early experiences have profound and long-lasting influences on their development and on the kind of learner they become.” “A Meta-Perspective on the Evaluation of Full-Day Kindergarten during the First Two Years of Implementation,” (October 2013). |
| 1 | “A Meta-Perspective on the Evaluation of Full-Day Kindergarten during the First Two Years of Implementation,” (October 2013). Report informed by the Social Program Evaluation Group — Queen’s University, “Final Report: Evaluation of the Implementation of the Ontario Full-Day Early Learning Kindergarten Program,” (Fall 2012); the Offord Centre for Child Studies — McMaster University, “The Full Day Kindergarten Early Learning Program Final Report,” (October 2012); and the Ontario Ministry of Education. |
Building a Competitive Workforce
Ontario’s students are key to the Province’s economic future. The government is building an education system that is innovative and responsive to labour market demands, producing graduates ready for today’s jobs and tomorrow’s opportunities. The Province is also building a modern and cohesive employment and training services network to help people find jobs and employers find workers.
Experience Ontario
The government is investing $20 million to launch Experience Ontario. This new pilot program will support graduating high school students to better identify future goals, choose the most appropriate postsecondary education and succeed once they enrol.
Ensuring an Accessible, High-Quality and Sustainable Postsecondary Education System
Ontario’s colleges and universities play an increasingly important role in preparing students to seize employment opportunities. Studies suggest that seven of every 10 new jobs are expected to require postsecondary education or training.
Building on one of the best public elementary and secondary education systems in the world, Ontario boasts a leading system of postsecondary education. With higher postsecondary attainment rates than any country in the Organisation for Economic Co-operation and Development, Ontario is already leading the world with a globally competitive, highly educated workforce. But there is more to do.
In 2013, 66 per cent of adults in Ontario had a postsecondary credential, up from 56 per cent in 2002 — higher than the rates for any country in the Organisation for Economic Co-operation and Development. |
As steward of the system, the government is continuing to invest in an accessible, affordable and student-centred system — one that supports innovative, creative and entrepreneurial graduates. To achieve this goal, the Province continues to transform postsecondary education based on the best evidence, investing in what works and focusing on outcomes.
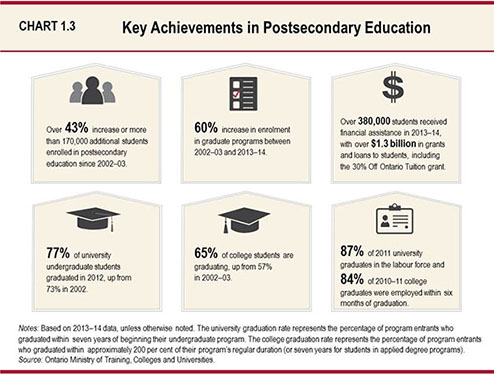
The government has increased funding for postsecondary education by 83 per cent since 2002‒03. This has resulted in more Ontarians than ever participating in postsecondary education, with over 170,000 more students enrolled in colleges and universities since 2002‒03 and more students graduating every year. This puts Ontario in a position to meet, if not exceed, its target of a 70 per cent attainment rate by 2020.
As a step in the transformation of the postsecondary education system, Ontario is helping all 45 publicly supported colleges and universities build on their unique strengths and specializations to offer students the best possible learning experience. The Strategic Mandate Agreements now in place are helping guide further growth and avoid or limit expansion in academic areas where well-established programs already exist.
The Strategic Mandate Agreements will also ensure that students continue to gain hands-on experience through opportunities such as co-op programs and applied research. This approach helps students create new businesses or find highly skilled work that will benefit Ontario’s economy.
To ensure quality and sustainability, Ontario will be reforming the postsecondary education system funding model, starting with the university sector. This spring, the Province will begin open, formal and transparent engagement with the sector that will help shape a new model. The government will work with institutions to find ways to better align public funding with desired outcomes and to ensure that Ontarians receive the best possible value from investments made in postsecondary education. Among other things, the new funding model will also support greater differentiation in the university sector.
Differentiation within postsecondary education means focusing on institutional strengths while preserving and enhancing educational quality for students within a sustainable cost structure. Differentiation leads to more effective use of government and institutional resources to improve overall performance of the system, and to help Ontario compete internationally. |
Giving Students the Skills and Experience They Need to Get the Jobs They Want George Brown College focuses on its institutional strengths by providing applied research expertise that enhances student learning and supports industry innovation. It embeds applied research through a number of centres including the: ● Green Building Centre; ● Health Technology, Entrepreneurship and Commercialization Hub (HealthTech); ● Food Innovation and Research Studio (FIRSt); and ● Centre for Arts and Design, a digital media and gaming incubator. |
The government is also following through on its commitment to expand online learning opportunities. Ontario Online will give students the flexibility to receive world-class instruction wherever and whenever it works best for them. In 2014, Ontario Online was established as a collaborative Centre of Excellence in technology-enabled learning to give students across the province one-window access to transferable online courses. The government has invested $22.3 million over the past two years towards developing or redesigning 280 high-quality online courses and 56 online curricular content, learner support and credit recognition modules. With all of Ontario’s publicly assisted colleges and universities as members, Ontario Online will start offering state-of-the-art online courses in the 2015–16 academic year.
“Over its history, the University of Waterloo has been a leader in online education and, through the new Ontario Online initiative, we look forward to using this experience for the benefit of students throughout Ontario.” Feridun Hamdullahpur, President and Vice-Chancellor, University of Waterloo. |
The Province is also continuing to improve the credit transfer system to ensure students do not have to repeat relevant prior learning when moving between postsecondary institutions. Students will know in advance how many credits they can expect to receive before arriving at a new institution.
In partnership with colleges, universities and the Ontario Council on Articulation and Transfer (ONCAT), Ontario has created close to 800,000 transfer opportunities for students from the over 750 pathways now available — more than double the pathways that were offered in 2011.
“Transfer pathway” refers to a defined route from one program or institution to another that clearly sets out eligibility requirements and acceptable credits. |
The bilingual credit transfer website, ONTransfer.ca, was launched to make information on transfer opportunities and institutional transfer processes more publicly accessible. This will make it easier for students to navigate the postsecondary education system, reach their preferred credentials faster, and enter or re‐enter the labour market sooner.
Modernizing Student Financial Assistance
Ontario is helping students with the costs of postsecondary education so that every qualified Ontarian who wants to attend college or university can afford to do so.
Ontario Has Made Postsecondary Education More Affordable ● Provided more than $1.3 billion in grants and loans in 2013‒14 — 70 per cent of this aid was in the form of grants that students do not have to repay. ● Helped almost 230,000 college and university students in 2013‒14 save up to $1,780 in tuition through the 30% Off Ontario Tuition grant. ● Implemented a multi-year tuition framework that caps tuition fee increases at an average of three per cent per year. |
The government is also increasing support for students and modernizing the Ontario Student Assistance Program (OSAP) by:
| › | Indexing the Ontario maximum student aid levels annually to inflation, starting with the 2015–16 school year; |
Ontario is the first province to index maximum student aid levels to inflation. |
| › | Launching the Ontario Student Loan Rehabilitation Program, a new initiative that will allow past borrowers who defaulted on the Ontario portion of their student loan to bring their loan back into good standing through scheduled partial payments; |
| › | Indexing the debt cap — the level above which student loans are forgiven — to inflation, ensuring that OSAP remains sustainable in the long term. Repayable debt will remain at 60 per cent of the maximum amount of financial aid available to students; |
| › | Eliminating the requirement for students to report their vehicle as an asset for OSAP assessment and aligning with the 2014‒15 change in federal treatment of vehicles; and |
| › | Streamlining and simplifying the back-office administration of student loans by funding student loans directly through the Ministry of Training, Colleges and Universities and proposing to terminate the Ontario Student Loan Trust. The process of how students apply for and receive student loans will remain unchanged. |
Strengthening Financial Supports for Students ● In the 2015–16 school year, the Ontario student loan limit increases to $155 per week for single students and $355 per week for students who are married or have dependent children. ● By increasing the Ontario student loan limit with the rate of inflation each year, a student starting a four-year university degree in 2014–15 is eligible to receive about $1,000 more in financial aid over the four years. ● Student debt is capped at no more than $7,400 for a two-term academic year for the 2015–16 school year. |
Matching Skilled Workers to the Right Jobs
Ontario’s workers, employers and training service providers work better when they are working together. Once Ontarians have the right education and skills, they need to find the right job. Employers will also need the right employees to grow, innovate and take advantage of new opportunities.
The Province invests over $1 billion every year in employment and training programs and services through Employment Ontario that serve about one million Ontarians. These programs:
| › | Enable Ontarians to access the supports they need to succeed in today’s job market; |
| › | Deliver relevant skills training; and |
| › | Deliver employment and planning services to individuals and employers. |
Ontario is integrating employment and training programs and services across government. This will improve access and provide job seekers and employers with proven, coordinated and targeted services that meet their needs. The government is continuing to engage stakeholders on the design, development and implementation of new initiatives.
Employment and Training Services Integration The government is consulting on the design and implementation of five priority areas: ● Youth employment programming; ● Common assessment for employment-related needs; ● Pre-employment services; ● Employment supports for people with disabilities; and ● Local Employment Planning Council pilots to address local labour market needs and strengths. |
Canada–Ontario Job Grant
As part of the government’s commitment to create more on-the-job training opportunities, Ontario has placed a renewed focus on programs and services that better meet employers’ needs.
The Canada–Ontario Job Fund Agreement, signed by the governments of Ontario and Canada in March 2014, is a source of funding for employer-driven training initiatives such as the Canada–Ontario Job Grant.
By providing two-thirds of total eligible training costs up to $10,000, with additional flexibility for small employers, the Canada–Ontario Job Grant offers employers the opportunity to invest in their workforce. The new program began accepting employer applications in September 2014.
As part of the Canada–Ontario Job Grant, the Province also introduced two employer-driven skills training pilots. These pilots will investigate new ways of working with employers to provide flexible, short-term training. They include the:
| › | Customized Training pilot to help develop and deliver firm-specific training that meets employers’ workforce development needs; and |
| › | UpSkill pilot to support essential and technical skills training in specific sectors for potentially vulnerable workers in low- and medium-skilled occupations. |
While the Canada–Ontario Job Grant supports those who have a strong attachment to the workforce, there is a critical need for funding to support skills development for the most vulnerable job seekers. Federal collaboration to support skills training does not go far enough — far too many unemployed Ontarians are not eligible for skills training supported through Canada–Ontario labour market agreements. Federal investments in skills training for Canada’s unemployed must be increased. See Chapter III: National Leadership — Strong Ontario, Strong Canada.
Renewing the Ontario Youth Jobs Strategy
Young Ontarians face particular challenges in finding rewarding, permanent jobs. High unemployment has economic consequences for the province today, such as loss of revenue and increased cost of services but, more importantly, it can also lead to negative long-term consequences, such as lower wages and a higher likelihood of future unemployment. The Province has made progress in reducing youth unemployment from a high of 18.6 per cent to its current rate of 14.9 per cent; however, too many young people are still out of work. That is why the Province is renewing its Ontario Youth Jobs Strategy. The Province is working to ensure that every Ontarian is able to find the best employment opportunities that match their skills and passions.
Tackling youth unemployment was a key component of Ontario’s 2013 and 2014 budgets. Since launching the $295 million Ontario Youth Jobs Strategy, the government has made significant progress in advancing youth employment across the province.
Ontario Youth Jobs Strategy — Success Stories ● Having completed one year of a college diploma in interior design, Jenny went to an Employment Ontario service provider in St. Thomas for help obtaining work in her field. Through the Youth Employment Fund, she secured a job at a home decor store where she has been mentored in customer service, business, decorating and design. She is taking her skills to the next level by taking the lead on maintaining the online store and, with the support of her employer through the Canada–Ontario Job Grant, is continuing her diploma studies part time. ● With a Grade 12 education and part-time work experience in retail, Yousif went to an Employment Ontario service provider in Windsor for help finding full-time work. His winning attitude, combined with support from the Youth Employment Fund, helped him land a job at a masonry company, cutting and installing granite and stone finishes. His placement under the program has finished, but his company continues to employ him. |
However, overall youth unemployment remains unacceptably high. That is why the government is renewing the Ontario Youth Jobs Strategy by investing an additional $250 million over the next two years, bringing the total investment in youth employment programming to more than $565 million.
The renewed Strategy will build on successes to date and enhance a comprehensive suite of programs and services that are tailored to the individual needs of youth, including at-risk youth, Aboriginal youth, newcomers and youth with disabilities. The extension of the Strategy will serve up to 150,000 clients and focus on skills development, labour market connections, entrepreneurship and innovation.
Skills Development
Ontario has a world-class education system. However, many youth still lack the specific skills needed to get ahead in today’s competitive job market. Through targeted investments, the government will help enhance the skills of Ontario’s youth by:
| › | Creating Youth Job Connection, an intensive employment support program to help youth who experience multiple barriers to employment; |
The Aboriginal Institutes deliver a wide range of accredited postsecondary programs in partnership with colleges and universities. These institutions also develop curriculum to address the current and future human resource needs of Aboriginal communities. |
| › | Providing an additional $5 million in funding through the Postsecondary Education Fund for Aboriginal Learners (PEFAL) to ensure that high-quality postsecondary education and training remain accessible to Aboriginal youth through the Province’s nine Aboriginal Institutes; and |
| › | Supporting the creation of a Mechatronics Simulation and Demonstration Centre at Seneca College with an investment of $651,000. In partnership with Siemens Canada, the Centre will strengthen Ontario’s manufacturing skills and expertise and also support the modernization and regeneration of industries such as automotive manufacturing, plastics, and building technology province-wide. |
Labour Market Connections
The government recognizes that businesses all over the province are hungry for talent that will help them grow and thrive. That is why the Province is working hard to ensure the best fit between the skills youth have and the skills employers need. This improved alignment will help Ontario’s youth connect to the careers they are interested in and help businesses find the talent they need.
| › | Youth Job Link: For students and youth who do not face significant barriers to employment, access to job search resources and information to help transition to the labour market, including summer employment placement opportunities; and |
| › | Youth Skills Connections Fund: Funding for programs that bridge the gap between postsecondary training programs and the skills that businesses need today. |
Entrepreneurship
Programs under the Ontario Youth Jobs Strategy are based on the principle that Ontario’s economy needs a culture of startups to drive creativity and competitiveness in this new world economy. These programs also lead to measurable spinoff economic activity in regions across the province.
By expanding support to effective initiatives such as the Starter Company program and Summer Company program, the Province will continue to encourage the next generation of entrepreneurs. These programs provide mentorship, specialized training, individualized outreach, and startup capital to young Ontarians who want to start, grow or buy a small business. The government is also expanding its investment in:
| › | Campus-Linked Accelerators that are growing and expanding entrepreneurship programs at universities and colleges across the province. Students are getting the skills, tools, advice and support they need to start a business; and |
| › | On-Campus Entrepreneurship Activities programs that are helping to launch initiatives at universities and colleges across Ontario where they currently do not exist. |
Together, these two programs encourage the next generation of innovators by connecting them to training opportunities and regional business support services. They are giving students the chance to develop their ideas while at school and grow their entrepreneurial skills. The programs have been established at 42 out of the province’s 45 publicly funded postsecondary institutions and have helped create 1,749 companies.
Innovation
Businesses everywhere are seeking to locate in jurisdictions with workers who can drive innovation and productivity through their knowledge and skill. The Ontario Youth Jobs Strategy is designed in part to help Ontario support these workers, starting with young people. The Province is doing this through a number of funding initiatives, including the:
| › | TalentEdge Program, which has produced 328 internships for graduate and postgraduate students. These internships are integral to boosting campus-linked industrial research and development and commercializing the innovative ideas of young researchers; and |
| › | Youth Business Acceleration Program (Youth BAP), which has created 980 jobs by assisting youth-led, innovative companies with mentorship, startup funding and business development training. Thalmic Labs, a company that received Youth BAP services, was founded by three University of Waterloo engineering graduates. It raised $14.5 million in funding and made Forbes’ list of “Hottest Global Startups.” |
● TalentEdge Program provides the opportunity for postsecondary students and postdoctoral fellows to enhance their skills in industrial research, development and commercialization projects and enhance their technical problem-solving skills through joint industry–academia collaborations. ● Youth Business Acceleration Program provides training, mentorship and market intelligence for youth starting “technology enterprises” to help them develop and implement business models and address business challenges, such as marketing, human resources, product/service distribution or legal advice. |
Supporting Ontario’s Skilled Tradespeople
Skilled trades provide rewarding, well-paid work for many Ontarians and are a critical factor to Ontario’s continued prosperity.
The government has demonstrated a strong commitment to Ontario’s apprenticeship system by investing approximately $164.5 million in 2014–15 and by significantly increasing available opportunities since 2002. However, despite these investments, completion rates have remained stagnant, meaning many apprentices are not completing their trade certification. This has a negative impact, primarily on earning and future labour market success, because apprentices who receive certification in a trade receive higher hourly wages than those who do not. That is why Ontario will continue to provide supports for employers, apprenticeships and training institutions to promote access to and completion of apprenticeships, while raising the profile of the skilled trades as a career path on par with other forms of postsecondary education.
Ontario’s Investments Strengthen Its Apprenticeship System ● In 2014‒15, the government invested approximately $164.5 million in Ontario’s apprenticeship system, including: ● Over $146.5 million for 17 programs that offer support to both apprentices and employers; ● Nearly $16 million for colleges and other training delivery agents to make capital upgrades and purchase state-of-the-art equipment essential to the technical training of apprentices; and ● $2 million in loans to apprentices to buy the tools and equipment they need to begin their careers. ● The government is also helping apprentices complete their programs and obtain certification by providing: ● Completion bonuses for both apprentices and employers when training is successfully concluded; and ● Income supports to help apprentices with the costs associated with attending school. ● As a result of the government’s investments and support of the apprenticeship system, new annual apprenticeship registrations have grown from 17,100 in 2002‒03 to more than 28,000 in 2013‒14. |
Ontario will further support the apprenticeship system by:
| › | Investing an additional $13 million over two years for pre-apprenticeship programs; |
| › | Providing $19 million over three years to increase the per diem for apprenticeship classroom training; and |
| › | Investing an additional $23 million over two years in the Apprenticeship Enhancement Fund. |
Pre-Apprenticeship Programs
Programs that reach potential tradespeople early have proven to be highly effective in encouraging successful completion of apprenticeship programs. That is why the government is investing an additional $13 million over two years for pre-apprenticeship programs that help potential entrants to the system develop their job skills and readiness to find work as apprentices, through in-class training sessions and work placements. This additional funding will enrich the learning environment for all students, including those from underrepresented groups, such as women and Aboriginal peoples.
Increasing Per Diem Funding for Classroom Training Seats
One of the key ways that Ontario supports apprentices is by funding in-class training delivered by colleges and other training delivery agents across the province. Funding is provided on a per diem basis, linked to the training requirements of each trade. However, funding levels have not been adjusted since 2008–09, which has led to a decline in the resources available to ensure quality training for students.
The government is addressing this issue by investing more than $19 million over three years, increasing the per diem to $61.36 in 2015‒16 and to $63.09 in 2016‒17 and beyond. This increase will ensure that apprentices continue to receive the highest quality training, through support for equipment upgrades and more opportunities for lab time during their in-school training sessions.
Apprenticeship Enhancement Fund
As part of the Ontario Youth Jobs Strategy, Ontario is supporting young people by investing an additional $23 million over two years in the Apprenticeship Enhancement Fund. This Fund will help colleges and other delivery agents train more people and deliver relevant, high-quality apprenticeship programs by investing in equipment, technologies and space to meet the evolving needs of the workforce.
Ontario College of Trades
Trades play a vital role in Ontario’s infrastructure development and economic growth. In 2009, the Province created the Ontario College of Trades to regulate and promote skilled trades. Then, in October 2014, the government appointed Tony Dean to review issues related to the scope of practice and the process and criteria for the review of the classification of trades as compulsory or voluntary, to support the continued success of the College.
In January 2015, a consultation guide was released and stakeholders, including apprentices, tradespeople, employers, associations and training providers, were invited to provide written submissions. In-person consultations are currently taking place across various regions of the province. The final report will be submitted to the government in October 2015.
Helping Newcomers Integrate Successfully into Their Communities and the Workplace
Immigrants bring new skills to the Ontario economy, build businesses that employ Ontarians and open doors to global markets. Ontario remains the number one destination for newcomers in Canada. Nearly 40 per cent of Canada’s immigrants land in Ontario.
Successful integration of immigrants into Ontario’s workforce is vital for the province’s continued economic success. This is why Ontario continues to support various settlement and integration programs, including Ontario Bridge Training, with an investment of more than $63 million between 2013‒14 and 2015‒16. To date, the Province’s bridge training projects have targeted more than 100 occupations, helping close to 50,000 highly skilled immigrants.
Ontario Bridge Training helps skilled newcomers get their licence or certificate in their profession or trade, so they can find employment in Ontario that fits their skills and experience. |
A key objective of Ontario’s Immigration Strategy is to help immigrants and their families settle and achieve success. Ontario has invested $17.8 million over the past two years in the Newcomer Settlement Program, helping more than 80,000 newcomers each year access the services they need to settle in Ontario.
Ontario needs to be well positioned for an increased role in immigrant selection. In 2015, Ontario is set to receive 5,200 nominations through its Provincial Nominee Program, up from 2,500 the previous year.
In November 2014, the government reintroduced the proposed Ontario Immigration Act, a key element of the Ontario Immigration Strategy. If passed, the Act would:
| › | Position Ontario as a full partner in immigration with the federal government by giving Ontario a framework to design, deliver and manage a larger and more complex selection program; |
| › | Provide a regulatory framework to respond to Ontario’s responsibilities in the immigration system and support transparency, accountability and consistency in the Province’s selection programs; and |
| › | Provide the government with the necessary tools to preserve the integrity of Ontario’s selection programs and help protect potentially vulnerable applicants from the risk of program fraud. |
The Province’s Immigration Strategy lays out a plan to better support and welcome newcomers to vibrant communities throughout Ontario. In that spirit, and at the request of the University of Toronto, the government is seeking to amend The University of Toronto Act, 1971, eliminating the Canadian citizenship requirement for membership on the University of Toronto Governing Council. This would remove a barrier to membership on the University’s Governing Council, which currently excludes international students, as well as faculty and staff who are not Canadian citizens.
Section B: Building Modern Infrastructure and Transportation Networks
Modern infrastructure is the basis of a well-functioning economy and prosperous society. It includes roads, bridges, public transit, hospitals, schools and water systems, all of which are important elements that together allow a strong economy and modern society to thrive. If governments fail to invest in infrastructure, economic and productivity growth slows, and quality of life suffers.
Renewing and expanding public infrastructure supports Ontario’s industries, creates jobs and positions Ontario to better compete in the 21st century economy. For example, an October 2014 “World Economic Outlook” report by the International Monetary Fund found that effective and efficient infrastructure investment can provide a much-needed boost to short- and long-term output.1 Similarly, a 2013 study by The Conference Board of Canada estimated that the Province’s infrastructure investments from 2006 to 2014 would add over $1,000 to the average annual income of Ontarians by 2014, and lower the unemployment rate by almost one percentage point relative to where it otherwise would have been.2
| 1 | International Monetary Fund, “World Economic Outlook: Legacies, Clouds, Uncertainties,” (October 2014). |
| 2 | Pedro Antunes and Jacqueline Palladini, “The Economic Impact of Ontario’s Infrastructure Investment Program,” The Conference Board of Canada (April 2013). |
Investing in Transportation and Infrastructure — Benefits of Transit The evidence is clear that the benefits of transit use are wide-ranging and significant, including personal cost savings and broader economic returns. Some examples include: ● Congestion in the Greater Toronto and Hamilton Area (GTHA) alone costs Ontario’s economy at least $6 billion per year,3 with one estimate putting the cost at up to $11 billion per year.4 ● In the United States in 2002, the use of public transit generated up to 47 cents US in congestion savings for every passenger mile of travel.5 Similarly, other research has found that transit provides vehicle cost savings of 30 to 50 cents US (2001) per vehicle mile, based on a reduction of operating expenses, risk of car accidents, parking offences, vehicle ownership and other user fees.6 |
That is why investing in infrastructure is a key pillar of the government’s economic plan. In the 2014 Budget, the Province announced its plan to invest more than $130 billion in public infrastructure over the next 10 years. This included a commitment to make nearly $29 billion in dedicated funds available for Moving Ontario Forward, to invest in transit, transportation and other priority infrastructure within and outside the Greater Toronto and Hamilton Area (GTHA).
4 Benjamin Dachis, “Cars, Congestion and Costs: A New Approach to Evaluating Government Infrastructure Investment,” C.D. Howe Institute (2013).
5 Jon D. Harford, “Congestion, Pollution, and Benefit-to-Cost Ratios of US Public Transit Systems,” Transportation Research Part D (2006): 45–58.
6 Todd Litman, “Evaluating Public Transit Benefits and Costs,” Victoria Transport Policy Institute (2015).
In total, these investments would support over 110,000 jobs per year, on average, in construction and related industries, including more than 20,000 jobs from investments made as part of Moving Ontario Forward. This commitment builds on over $100 billion in infrastructure investments by the Province since 2003, which have supported an average of 100,000 jobs each year.
In implementing its plan, Ontario is projecting investments of $11.7 billion in 2014–15, with another $11.9 billion planned in 2015–16. This funding is driving key infrastructure projects such as:
| › | Continuing to improve highways throughout northern Ontario. Since 2003, the Province has built or repaired over 4,600 kilometres of provincial highways in the north; |
| › | Widening and improving Highway 417 in eastern Ontario; |
| › | Building rapid transit bus lanes in both York Region and Mississauga in the GTHA; and |
| › | Constructing the Waterloo Rapid Transit project in southwestern Ontario. |
Recognizing that infrastructure investment is critical to creating jobs and enhancing quality of life for Ontarians, this Budget announces a $2.6 billion increase in dedicated funds for Moving Ontario Forward, for a total of $31.5 billion over 10 years. The increase is a result of a higher target from asset optimization, described in Chapter I, Section C: Unlocking the Value of Provincial Assets.
Building Together: Ontario’s Plan to Invest in Public Infrastructure
Ongoing Investments in Transportation
The Province, through its ongoing and planned investments, is leading the renewal and expansion of transportation and other critical infrastructure for Ontarians. Over the last decade, the Province has made unprecedented investments in public infrastructure, including transit, supporting mobility and economic growth across Ontario.
To support Building Together, Ontario’s long-term infrastructure plan, investments of more than $100 billion over 10 years are underway, including $50 billion for transportation infrastructure. This is above the commitment to make $31.5 billion in dedicated funds available through Moving Ontario Forward.
These record investment levels have supported improved GO Transit service and major projects that are underway and planned, such as:
| › | Union Pearson (UP) Express, which begins service this spring, providing a dedicated rail link connecting Toronto Pearson International Airport with Union Station in downtown Toronto in 25 minutes. By 2020, Metrolinx expects UP Express to attract approximately 2.5 million riders annually. |
| › | The Mississauga Transitway, the first phase of which includes four stations, which opened in November 2014. Work continues to complete the full 18-kilometre corridor of the dedicated transitway by 2017. This transitway is expected to divert thousands of riders a day from private vehicles, reducing automobile traffic significantly during high-volume periods. |
Types of Rapid Transit Projects Metrolinx’s regional transportation plan includes different types of rapid transit: ● Bus rapid transit — buses run predominantly on a roadway separate from regular traffic. ● Light rail transit — electric trains run along tracks on a roadway separate from regular traffic. |
| › | Expanding the Bus Rapid Transit (vivaNext) rapidways throughout York Region. In August 2014, a new segment was opened along Highway 7 in Markham from Highway 404 to South Town Centre Boulevard. |
| › | Construction on the Eglinton Crosstown Light Rail Transit (LRT) project. The Eglinton Crosstown LRT is expected to be completed by 2020, providing fast, reliable and convenient transit, moving commuters in half the time of current transit options. Tunnelling from Black Creek Drive to Allen Road was completed in January 2015. |
| › | The Finch West and Sheppard East LRT projects, which will provide reliable and improved transit service on these busy corridors. The Finch West LRT will run along Finch Avenue between Humber College and Keele Street, and the Sheppard East LRT will run along Sheppard Avenue from Don Mills Station to Morningside Avenue. The procurement process for the Finch West LRT project is expected to begin later in 2015. |
Green Bonds Ontario is the first province to issue Green Bonds and is leading the way in creating a Green Bond market. Green Bonds are an important tool for Ontario to build transit and other environmentally friendly projects across the province, supporting job creation and strengthening the economy. In October 2014, the Province launched its first Green Bond issue valued at $500 million, attracting investors from around the world. Ontario’s inaugural Green Bond was oversubscribed, with orders of $2.4 billion, far surpassing the size of the bond issue by $1.9 billion. Eight new international investors were added to Ontario’s Canadian-dollar investor base and an additional five new investors were added to Ontario’s total investor base. The Eglinton Crosstown Light Rail Transit was selected as the first project to receive funding through the initiative. The Province plans to issue its second Green Bond this fiscal year. |
The Province’s investments in PRESTO have helped make transit more convenient and integrated in Ontario. The system makes it easier for commuters to travel across different transit systems with the simple tap of a single, reloadable fare card. There are already over 1.4 million activated PRESTO cards in use, which enable transit riders to pay their fares across nine transit agencies in the GTHA, as well as in Ottawa.
PRESTO allows customers to use a single, seamless, integrated fare payment method across participating transit systems including bus, train and subway routes. Today, PRESTO is used as a fare card to make it easier for transit riders to pay their fare with the simple tap of a card while travelling within and between participating transit systems. Users pay for their trip by tapping their PRESTO card on a PRESTO fare payment device when boarding a transit vehicle or entering a station. |
PRESTO is currently available at 15 Toronto Transit Commission (TTC) subway stations, and PRESTO card implementation began on Toronto’s streetcar network in late 2014. Once fully deployed, approximately 10,000 PRESTO devices are expected to be on the TTC’s fleet of streetcars and buses and in all subway stations. At that point, more than 2.5 million customers are expected to be using PRESTO cards throughout the GTHA and in Ottawa.
The Province is supporting key municipal transit projects, including:
| › | ION, the Region of Waterloo’s 36‐kilometre rapid transit project that will link Kitchener, Waterloo and Cambridge, and connect commuters to GO train service between the Region of Waterloo and the Greater Toronto Area. Construction is underway and is expected to be completed by 2017. The Province is investing up to $300 million towards the project. |
| › | The Confederation Line, Ottawa’s 12.5-kilometre LRT project, with major sections expected to be ready by the summer of 2017. Studies suggest that in the first year of service, the new line could generate 4.6 million new trips and reduce the time it takes to cross downtown Ottawa by 10 to 15 minutes, on average. The project is supported by a Provincial funding commitment of up to $600 million. |
| › | The renewal of Toronto’s streetcar fleet, supported by a Provincial investment of up to $416 million. In August 2014, the first of the new accessible vehicles began service on the 510 Spadina route. The new vehicles can carry almost twice as many passengers as current streetcars. |
| › | Toronto’s extension of the Bloor–Danforth subway through Scarborough. The Project Assessment Study is currently underway. |
Ontario is supporting municipal transit systems through the Gas Tax Program, which provides ongoing funding for eligible municipalities to improve and expand their transit services. Since 2004, the Province has committed more than $3.1 billion in gas tax funding.
The government is also investing in numerous major highway projects, some of which will come into service over the next year, to support economic growth and improve mobility:
| › | The Right Honourable Herb Gray Parkway in Windsor–Essex, which is partially open and is expected to be completed in the summer of 2015; |
| › | Widening Highway 410 in Peel Region, from south of Highway 401 in Mississauga to Queen Street in Brampton, which began in the summer of 2014. The project will add two lanes in each direction to this busy stretch of highway, including a high-occupancy vehicle (HOV) lane and a general purpose lane; |
| › | The first phase of the Highway 407 East Extension, spanning from Brock Road in Pickering to Harmony Road in Oshawa, which will open to traffic later this year. Construction on the second phase, from Harmony Road to Highway 35/115 in Clarington, will begin in the fall of 2015; and |
| › | Four‐laning major highway corridors in northern Ontario, including widening and realigning sections of Highway 69 between Parry Sound and Sudbury and parts of Highway 11/17 between Thunder Bay and Nipigon. |
Moving Ontario Forward
Modernizing infrastructure will help Ontario grow and prosper today and in the future. In the 2014 Budget, the Province announced nearly $29 billion available for investment over the next 10 years in the Moving Ontario Forward plan, to create jobs, boost productivity and revitalize communities. This Budget increases the dedicated funds by $2.6 billion, for a total of $31.5 billion to be made available over 10 years for public transit, transportation and other priority infrastructure projects across Ontario. This increase in dedicated funds will accelerate priority projects and enable new projects to come on stream.
The total dedicated funds for Moving Ontario Forward will be allocated to the GTHA and the rest of the province using census data from Statistics Canada. By allocating the dedicated funds to the GTHA and outside the GTHA based on their relative shares of the population, the Province is ensuring that the allocation is fair, accountable and transparent. This distribution would amount to an investment of about $16 billion in transit projects in the GTHA and about $15 billion in critical infrastructure projects elsewhere in Ontario.
An online portal to report publicly on construction progress will be established later this year.
Dedicated Funds to Support Moving Ontario Forward
As announced in the 2014 Budget, Ontario is taking a strong stance on the importance of investing in critical infrastructure, in part by strategically examining ways to unlock value from certain Provincial assets. Reinvesting the value of certain Provincial assets in modernizing public infrastructure is vital to Ontario’s growth and quality of life. That is why the Province established dedicated funds that will be made available for transportation and other critical infrastructure across Ontario.
As part of the establishment of dedicated funds outlined in the 2014 Budget, the government announced an asset optimization target of $3.1 billion. In this Budget, the government is announcing that it is revising its asset optimization target to $5.7 billion — a $2.6 billion increase over the 2014 Budget projection. This increase will help support the Province to:
| › | Accelerate service enhancements to the GO Transit network, which will lay the foundation for Regional Express Rail (RER); |
| › | Launch a new Connecting Links program, which provides funding for municipal roads that connect to provincial highways; |
| › | Develop a new program to expand the natural gas network, which would help more communities generate economic growth; and |
| › | Enhance regional mobility by investing in Metrolinx’s Next Wave projects of The Big Move, such as the Hurontario–Main Light Rail Transit project in Mississauga and Brampton, and rapid transit in Hamilton. |
This revised asset optimization target will be achieved through the pursuit of a number of key opportunities, including the potential sale of a number of prime-located real estate assets, as well as the sale or optimization of Provincially owned assets that result from acting on the recommendations of the Premier’s Advisory Council on Government Assets. All net proceeds from the sale of qualifying Provincially owned assets will be placed in the Trillium Trust, and will be used to support the infrastructure investments under the Moving Ontario Forward plan.
The Trillium Trust was established to provide for the dedication of net proceeds from the sale of qualifying assets to be used for key infrastructure priorities, including roads, bridges and transit. |
See Chapter I, Section C: Unlocking the Value of Provincial Assets for more details.
In addition to the government’s asset optimization target, the $31.5 billion in Moving Ontario Forward dedicated funds are supported by:
| › | Dedicating proceeds from 7.5 cents of the existing Provincial gasoline tax to public transit and transportation infrastructure priorities, starting in 2014–15. This is above the existing gas tax funding provided to municipalities, with no increase to the current tax rate; |
| › | Repurposing revenues from the existing Harmonized Sales Tax (HST) charged on the current Provincial taxes on gasoline and road diesel across the province; |
| › | Dedicating proceeds from the following targeted revenue measures: restricting large corporations from claiming the small business deduction, increasing the aviation fuel tax rate by one cent per litre each year for four years, and proposing to restrict the fuel tax exemption for certain road-building machines; |
The Province continues to assess the feasibility of building new and converting select high-occupancy vehicle (HOV) lanes in the GTHA into high-occupancy toll (HOT) lanes, in which carpooling drivers would continue to drive for free, but other drivers could choose to drive and pay a toll. |
| › | Working with the federal government to secure federal funding through the Building Canada Plan for key transportation-related projects throughout the province; |
| › | Dedicating net revenue gains from high-occupancy toll lanes when they become available; and |
| › | Supplementing dedicated funds by leveraging Provincial borrowing to ensure a stable funding source available to support priority projects as they are constructed. |
TABLE 1.1 Dedicated Funds for Moving Ontario Forward ($ Billions) | | |
| | | | 2014–15 | * | | | 2015–16 | | | | 2016–17 | | | | 2017–18 | | 10-Year Total | |
2014 Budget: Dedicated Funds | | | 3.3 | | | | 3.3 | | | | 3.0 | | | | 3.2 | | 28.9 | | |
| Projected Asset Optimization Target (Including Contributions through the Trillium Trust) | | | 1.1 | | | | 1.0 | | | | 0.5 | | | | 0.5 | | 3.1 | | | |
| | | | | | | | | | | | | | | | | | | | | | |
| Increase in Dedicated Funds | | | 0.2 | | | | 0.6 | | | | 0.5 | | | | 0.5 | | 2.6 | | | |
| Change to Asset Optimization Target (Including Contributions through the Trillium Trust) | | | 0.2 | | | | 0.6 | | | | 0.5 | | | | 0.5 | | 2.6 | | | |
| | | | | | | | | | | | | | | | | | | | | | |
2015 Budget: Dedicated Funds | | | 3.5 | | | | 3.9 | | | | 3.4 | | | | 3.6 | | 31.5 | | | |
| Projected Revised Asset Optimization Target (Including Contributions through the Trillium Trust) | | | 1.3 | | | | 1.6 | | | | 1.0 | | | | 1.0 | | 5.7 | | | |
* Includes $249 million in net proceeds resulting from the sale of General Motors shares in 2013–14. Note: Numbers may not add due to rounding. |
Investing in Transit Inside the GTHA
Regional Express Rail
Moving more people and goods faster and more efficiently is a key objective of Moving Ontario Forward. Working closely with Metrolinx, Ontario will make smart investments and improve GO service. The result will be Regional Express Rail (RER). It will mean more trains, more frequent trips and, most importantly, faster service.
Regional Express Rail (RER) will change the way people think about regional transportation. The RER vision will provide significant new travel choices including: ● Enhanced service on rail corridors, with trains running up to every 15 minutes in core areas. ● Two-way, all-day service on weekdays, during the evenings and on weekends in core areas. |
While commuters will be able to get to and from work more easily, more drivers will be able to choose transit to move around the region and leave their cars at home. As the service steadily improves, RER will help ease congestion and gridlock across the region.
Regional Express Rail is the Province’s vision. Making it happen starts now.
To deliver this vision, Metrolinx will continue the planning, design and construction work necessary to improve services across the GO Transit network. This requires partnerships with rail companies, which own some of the corridors that GO Transit uses, to help find solutions that will allow for additional GO service. The Province is also enhancing train service on all lines, including fully electrifying the Barrie, Stouffville and Lakeshore East corridors.
Regional Express Rail will deliver electrified service, at about 15-minute frequencies, along the following routes:
| › | Lakeshore East and Lakeshore West corridors, between Oshawa and Burlington; |
| › | Union Station to Unionville on the Stouffville corridor; |
| › | Union Station to Bramalea on the Kitchener corridor, including UP Express; and |
| › | Union Station to Aurora on the Barrie corridor. |
Major infrastructure projects such as RER require intensive planning and design work prior to construction. Supported by the increase in dedicated funds announced in this Budget for Moving Ontario Forward, the Province can now move to immediately enhance GO rail service, which is the first step to phasing in RER. Beginning in 2015–16, the government will provide additional funding to Metrolinx to offer new services on all rail corridors, including:
| › | New peak trips during the morning and afternoon commutes; |
| › | New trips during the day and in the evening; and |
The GO system, strengthened by the Province’s investments in RER, including on the Stouffville and Kitchener lines, will provide the backbone for a regional network. This network will also be the foundation for the SmartTrack proposal in the City of Toronto. Additional funding is needed to support key elements of this proposal, such as new stations along the route and an extension along Eglinton to the busy airport area. The SmartTrack funding proposal entails contributions of about $5.2 billion in new funding from partners, including the City of Toronto and the federal government.
SmartTrack SmartTrack is a proposal for rapid transit throughout the City of Toronto. The proposal requires electrification of the GO Transit Stouffville and Kitchener lines. The plan would result in more rapid transit options for the City and the region to help manage congestion. The SmartTrack plan would also extend to the important airport employment lands, providing easy access to the area without a car. |
New partner funding would also help other RER projects move forward. For example, flood mitigation projects in the GO Richmond Hill corridor will be required to support future service enhancements along the line and could help support Toronto’s infrastructure. The Province encourages municipal partners to explore financing tools, such as asset optimization, to help ensure these projects may proceed.
In 2015–16, planned service enhancements to GO Transit rail service include the addition of up to 24 weekday rail trips. By 2020, this initiative will increase rail service on the GO Transit network by approximately 50 per cent over current levels. Additional weekend and off-peak trips will also increase opportunities for commuters to choose transit not just for getting to work, but also for getting around.
TABLE 1.2 GO Transit Rail Service Improvements |
GO Transit Rail Service | Current Service Levels (# of daily trips) | Planned Service Levels by 2020* (# of daily trips) | |
| Weekday Peak | 159 | 190 | |
| Weekday Off-Peak | 93 | 160 | |
| Weekend | 128 | 220 | |
| Total | 380 | 570 | |
* The Province, through Metrolinx, will work with the corridor owners, as required, to implement these planned service improvements. The final schedule for service increases and electrification will depend on negotiations between Metrolinx and Canadian National Railway or Canadian Pacific Railway, which currently own about 20 per cent of the rail corridors GO Transit uses. | |
GO Transit is also increasing bus service to address new demand areas, reduce overcrowding and improve reliability. Planned service enhancements include the introduction of 14 new buses and the addition of 250 weekly bus trips in 2015–16.
Other Priority Rapid Transit Projects
In addition to RER, the Province will work with related municipalities to move towards implementation of the Hurontario–Main Light Rail Transit project in Mississauga and Brampton, and rapid transit in Hamilton. These projects will help improve regional mobility and can connect to the GO Transit network. Ongoing planning and design work will continue for projects in the Next Wave of The Big Move, including:
| › | Dundas Street Bus Rapid Transit, linking Toronto, Mississauga, Oakville and Burlington; |
| › | Durham–Scarborough Bus Rapid Transit; |
| › | Brampton Queen Street Rapid Transit; |
| › | Toronto Relief Line; and |
| › | Yonge North Subway Extension. |
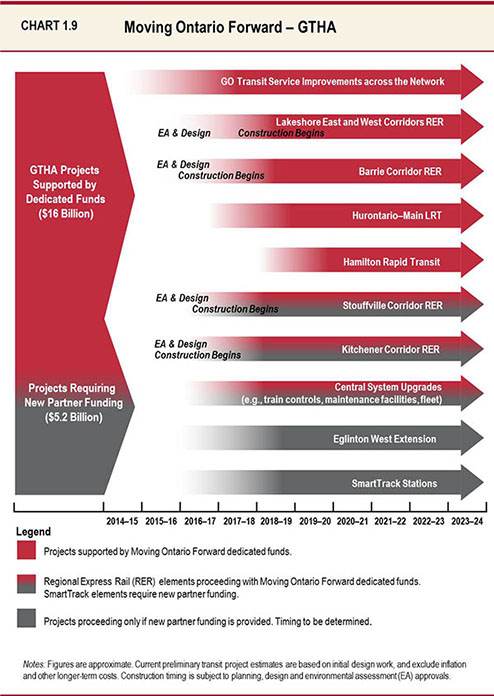
Investing in Transportation and Other Critical Infrastructure Outside the GTHA
A prosperous Ontario depends on strong, interconnected communities that serve an increasingly mobile population. Dedicated funding through Moving Ontario Forward will help connect regions, develop new economic opportunities and improve the quality of life of Ontarians by improving critical infrastructure in cities, towns, and rural and remote communities across the province. The government will work with regions and communities outside the GTHA to make targeted investments to meet local infrastructure needs and support economic development.
A number of investments are already underway and slated to begin in 2015–16. New investments will build on the success of existing programs to improve critical infrastructure. Priority will also be placed on investments that support economic development, in partnership with communities and regions.
In August 2014, the Province took steps to deliver its support for strong communities by launching the new permanent Ontario Community Infrastructure Fund and an intake process for the federal government’s Small Communities Fund.
The Ontario Community Infrastructure Fund will provide $100 million per year to help small, rural and northern municipalities build and repair critical infrastructure and create jobs across Ontario. The Fund includes $50 million in stable, predictable, formula-based funding and $50 million in application-based funding. In February 2015, the first round of funding under the application-based component was announced for 78 projects.
The Small Communities Fund will provide $272 million each from Ontario and the federal government to support community projects in municipalities with fewer than 100,000 residents. Ontario recently submitted its project nominations for the Small Communities Fund to the federal government.
The Province is also moving forward with investments in transportation networks that will help improve mobility outside the GTHA, including:
| › | Expanding additional segments of Highway 11/17 between Thunder Bay and Nipigon; |
| › | Constructing a new alignment of Highway 7 between Kitchener and Guelph; |
| › | Making improvements to Highway 401 in London and Highway 417 in Ottawa; |
| › | Advancing an environmental assessment for a high-speed rail line that will connect Windsor, London, Kitchener–Waterloo and Toronto; |
| › | Supporting the Maley Drive Extension project in Sudbury. In December 2014, the Province proposed the project to the federal government for cost-sharing under the Building Canada Fund; and |
| › | Committing to infrastructure development, including transportation, in the Ring of Fire region. |
The Ring of Fire In the 2014 Budget, Ontario committed up to $1 billion for strategic transportation infrastructure development in the Ring of Fire region, located about 540 kilometres northeast of Thunder Bay. Ontario is calling on the federal government to match the Province’s investment to develop the necessary infrastructure. Recently, Ontario and the federal government announced more than $785,000 for a joint study in the region. Funding is being provided to remote Matawa communities to examine the benefits of developing an all-season transportation corridor connecting First Nation communities in the area with existing roadways. The road would establish a transportation corridor connecting the area of mineral deposits and four remote First Nations (Webequie, Eabametoong, Neskantaga and Nibinamik) to Pickle Lake, Ontario, about 500 kilometres northwest of Thunder Bay. The study supports Ontario’s plan to drive development in the Ring of Fire and ensure its tremendous potential can be realized for First Nations, Ontario and Canada. In the summer of 2014, Ontario established the Ring of Fire Infrastructure Development Corporation to move forward in a smart, sustainable and collaborative way with First Nations, the private sector and communities. See Chapter III: National Leadership — Strong Ontario, Strong Canada for more details. |
Supported by the increase in dedicated funds announced in this Budget for Moving Ontario Forward, the Province will now be able to provide funding for a new Connecting Links program beginning in 2016–17, to help improve local roads that connect to the provincial highway network. These improvements will support the efficient movement of people and goods throughout the province. The Province will work with its municipal partners to design a program that addresses these projects in a systematic way.
The ability to connect to the natural gas network is an example of critical infrastructure investment that can remove a barrier to growth in many municipalities. Supported by the increase in dedicated funds for Moving Ontario Forward, the Province will develop a new program to help communities partner with utilities to extend access to natural gas supplies. Natural gas access can help stimulate the economy, particularly in smaller communities, by attracting new industry, making commercial transportation more affordable, benefiting agricultural producers and providing consumers with more energy choices.
Beginning in 2015, the Province will work with regions, communities and the private sector to design new programs and a framework to prioritize and evaluate infrastructure needs based on their economic, social and environmental returns. This framework will be used to select the next generation of infrastructure investments that improve the competitiveness of Ontario’s communities, enhance productivity, promote innovation and develop new economic opportunities. Potential projects could include investments in municipal rapid transit projects in Ottawa, Waterloo and London, and in GO Transit, including Regional Express Rail service beyond the boundaries of the GTHA.
Building Together: Modernizing Infrastructure in Communities across Ontario
Education Infrastructure
Investments in schools help provide safe and healthy learning environments so students can focus on their education and development. This funding also responds to local needs and supports Building Together, Ontario’s long-term infrastructure plan.
Over 10 years, the Province plans to provide more than $11 billion in capital grants to school boards. This funding will help build new schools in areas of high growth, improve the condition of existing school facilities, and invest in projects to reduce surplus space through school consolidations. As of the spring of 2015, nearly 100 major capital projects are either in planning or underway across the province, including:
| › | New elementary schools in: |
| › | Collingwood — to accommodate 200 French-language students; |
| › | East Gwillimbury — to replace an existing school and meet growth and full-day kindergarten needs, accommodating 461 students; |
| › | Ottawa — to meet growth and full-day kindergarten needs, accommodating 412 students; |
| › | Severn — to accommodate 317 students as a result of the consolidation of two schools; |
| › | Toronto — to replace an existing elementary school and address growth pressures, accommodating 642 students; and |
| › | Vaughan — to help meet growing needs in the area, accommodating 615 students. |
| › | New secondary schools in: |
| › | Fort Erie — to accommodate 750 secondary school students in the area as a result of the consolidation of two schools; and |
| › | Peterborough — to build a new JK–Grade 12 French Catholic school with modern learning spaces, accommodating 432 French-language students. |
| › | Renovations and additions, such as: |
| › | An additional four classrooms for École Élémentaire Catholique Sainte-Marie to meet growth in Chatham; |
| › | Consolidation of two elementary schools into W. F. Herman Secondary School in Windsor, to help accommodate 1,395 students from JK–Grade 12; |
| › | An additional five classrooms and retrofit for Coronation Public School in Brantford to support consolidation with Fairview Public School; |
| › | The renovation and construction of 11 classrooms in Barrie North Collegiate to support the consolidation of students from Barrie Central Collegiate and to accommodate 1,360 students; |
| › | A retrofit of Madawaska Valley District High School in Barry’s Bay to accommodate the consolidation of students from Sherwood Public School; |
| › | The retrofit of Land of Lakes Senior Public School in Burk’s Falls to accommodate incoming students from M.A. Wittick Junior Public School; and |
| › | An addition to St. Paschal Baylon Catholic School in North York to accommodate enrolment growth in the Yonge–Sheppard community, accommodating 727 students. |
Postsecondary Infrastructure
The government is committed to focusing on postsecondary capacity expansion that increases local access to education in areas of the province where enrolment demand will be strong and capacity gaps are expected to develop over time. This will support Ontario’s growing knowledge-based economy.
As outlined in the 2014 Budget, the Province launched a call for proposals in March 2014 as the first step in a formal, transparent and competitive process to evaluate decisions about future expansions. The panel that was established to conduct the evaluation process recently concluded its work and the government will communicate next steps related to the current call for proposals at a future date.
Ensuring safe and effective learning environments for Ontario’s postsecondary students remains a priority for Ontario’s ongoing investments in the sector. That is why the government will continue its investments in critical maintenance repairs and upgrades to existing postsecondary facilities. As announced in the 2014 Budget, the Province is providing additional funding of almost $500 million over the next 10 years, bringing the total planned investments to almost $900 million.
Examples of approved postsecondary infrastructure projects include:
| › | Humber College — $75 million to support construction of the Learning Resource Commons, which will be the new entrance to the Humber North Campus. The six-storey, 260,000-square-foot facility will open in September 2015. |
| › | McMaster University — $45.5 million to support construction of L.R. Wilson Hall, which will open later in 2015 and be the new home for the Faculties of Humanities and Social Sciences. |
Health and Social Infrastructure
Investments in health care and social infrastructure help support the delivery of quality services and help Ontarians lead healthier lives.
The Province plans to provide more than $11 billion in hospital capital grants over 10 years to build adequate infrastructure capacity in the health care sector. Across Ontario, approximately 40 major hospital projects are under construction or in various stages of planning, including:
| › | Halton Healthcare Services’ Milton District Hospital Redevelopment. The project includes a significant addition to the existing hospital to accommodate the growing community in Milton and will start construction in 2015–16. |
| › | Joseph Brant Hospital in Burlington — Phase I Redevelopment, which includes construction of a new seven-storey tower and renovations to existing space to accommodate expanded inpatient and ambulatory services. Construction is underway. |
| › | St. Joseph’s Care Group in Thunder Bay — Specialized Mental Health Rehabilitation Program, which will include 38 inpatient beds and related outpatient programs to serve people with serious mental illness. The new facility will enable videoconferencing to better meet the needs of clients, family members and staff who live in the region and cannot readily access specialized clinical services in their home communities. The project is in procurement. |
| › | St. Thomas Elgin General Hospital — Emergency, Ambulatory and Mental Health Redevelopment, which will expand the existing hospital and include an acute mental health unit with 15 inpatient beds and ambulatory services, an emergency department and a surgical suite. The project is in procurement. |
| › | University of Ottawa Heart Institute — Cardiac Life Support Services Redevelopment, which will add five floors for clinical and inpatient services to improve access to high-quality specialized cardiac services for residents in the Champlain Local Health Integration Network region. Construction is underway. |
| › | William Osler Health System — Etobicoke General Hospital Redevelopment Phase 1 Patient Tower, which includes construction of a new four-storey tower providing a larger emergency department, intensive care unit and ambulatory procedures unit. The project is in procurement. |
In the 2014 Budget, the Province announced new funding of $300 million over 10 years to help shift care from hospitals to community settings and ensure adequate infrastructure capacity in the health care sector. New funding is supporting the expansion of eligibility for community-sector capital grants and implementation of innovative new approaches to health care delivery.
The Province is also investing in children’s and social services facilities, such as the new ErinoakKids Centre for Treatment and Development, Ontario’s largest children’s treatment centre, located in Brampton, Mississauga and Oakville. The new facilities will serve more than 14,500 children and youth annually, and will make it easier to access treatment such as physiotherapy, speech and language services, and occupational therapy. Construction on the three facilities is expected to begin in the spring and summer of 2015 and they are scheduled to open in 2017.
Justice Infrastructure
Investments in justice facilities help strengthen community safety and provide meaningful support to everyone involved in the justice system. The Province is modernizing the justice system to enhance service delivery, provide timely access to justice and assist vulnerable populations.
Examples of projects underway include:
› | Constructing a new trades training centre at the William E. Hay Centre in Ottawa, which will provide rehabilitation for youth in secure custody and improve access to trades training and education. |
| › | Moving ahead with plans to build a new courthouse in downtown Toronto to consolidate a number of Ontario Court of Justice and Superior Court of Justice operations from five locations into one. The new facility will enable more effective and responsive delivery of justice services and increase access to social justice programs in the city. |
| › | Continuing efforts to modernize Ontario Provincial Police (OPP) facilities across the province with the construction of several new OPP detachments. |
Energy Infrastructure
A clean, reliable and affordable supply of electricity is critical to the present and future prosperity of Ontario’s people and businesses.
Since 2003, the government has made significant progress transforming the electricity system into one that Ontarians can count on. More than $30 billion has been invested in cleaner generation and Hydro One alone has invested over $13 billion in modern transmission and distribution infrastructure. Over 15,000 megawatts (MW) of new and refurbished capacity have come online, including more than 6,000 MW of wind, solar and other renewable energy supply.
One megawatt (MW) of electricity is equal to one million watts (a “watt” is a measurement unit of power). One MW could power 100,000 10-watt LED light bulbs. |
Ontario is now home to North America’s largest power plant fuelled completely by biomass; converted from using coal, the Atikokan Generating Station has a capacity of over 200 MW. The station is now generating electricity and helping meet local power needs in northwestern Ontario. In addition, the Thunder Bay Generating Station is leading the electricity industry with exciting new technology that came into service as of early 2015. The station can meet changes in electricity demand using a clean and renewable fuel through its conversion to advanced biomass.
Six new generating units on the Lower Mattagami River have come online, with the last unit coming into service in December 2014. These units have added 438 MW of emission-free electricity to the previous 486 MW — or enough incremental capacity to meet twice the peak demand of Greater Sudbury.
Ontario is building on its Long-Term Energy Plan, Achieving Balance, and making smart investments in modernizing its energy infrastructure through support for renewable energy projects and refurbishment of 10 nuclear units at the Darlington and Bruce sites. These investments are made in a manner that balances each of the Long-Term Energy Plan’s principles of cost-effectiveness, reliability, clean energy, community engagement and an emphasis on conservation first.
Expanding Natural Gas Distribution
Natural gas access can help stimulate the economy, particularly in smaller communities, by attracting new industry, making commercial transportation more affordable, benefiting agricultural producers and providing consumers with more energy choices.
As a first step, the government has asked the Ontario Energy Board (OEB) to examine opportunities to facilitate access to natural gas services in more communities across Ontario. The OEB has invited interested parties to propose one or more plans for natural gas expansion. If the economics of a proposed project may not be accommodated within the current regulatory framework, the OEB has invited applicants to identify options that would address any regulatory impediments to connecting the proposed projects. The OEB has indicated that it will consider these options.
The Province is also developing a new program that will help communities partner with utilities to extend access to natural gas supplies. This program is in the early stages of development and will be designed following input from stakeholders.
Cost-Effective Delivery of Infrastructure Projects
Ontario is a leading jurisdiction for Alternative Financing and Procurement (AFP) projects, with nearly 10 years’ experience in using the AFP model to renew hospitals, courthouses and other public assets across the province.
Before the Province decides to deliver an infrastructure project through AFP, it assesses a project’s size, complexity and cost to ensure the model can deliver value for Ontario. Infrastructure Ontario (IO) also undertakes a value-for-money assessment during and after procurement to ensure that AFP delivery will provide better value for Ontarians than traditional procurement.
Alternative Financing and Procurement (AFP) is an innovative procurement model designed to foster infrastructure partnerships with the private sector. |
Infrastructure Ontario, on behalf of the Ontario government, is delivering over 80 AFP projects valued at about $35 billion in capital construction costs. Almost all completed AFP projects — 36 of 37 — have been delivered on budget.
Examples of AFP projects currently underway or recently completed include:
| › | The Athletes’ Village, which is the largest infrastructure project associated with the 2015 Pan/Parapan American Games. The Village is expected to house more than 10,000 athletes and officials participating in the Games. After the Games, the Village will be transformed into a mixed-use neighbourhood with affordable housing, a new YMCA, health services and a residence for George Brown College students. The project won Canadian Architect magazine’s Award of Excellence in 2012. |
| › | Consolidated courthouses built in Thunder Bay and St. Thomas, which will improve access to justice services and reduce delays in the court system. The St. Thomas Courthouse was recognized in 2014 as a Gold Award winner at the Canadian Council for Public–Private Partnerships’ National Awards for Innovation and Excellence. |
› | Markham Stouffville Hospital, completed in the summer of 2014, which will help meet the needs of a growing population and enhance access to essential health care services by doubling the size of the previous facility. |
Infrastructure Ontario Leading the Way “There are many benefits that the P3 [public–private partnerships] model has brought in to the [Ontario] system…. Leveraging the expertise and project management discipline of the private sector through the judicious use of P3s, should continue to be a tool in the infrastructure procurement toolbox.” TD Economics Special Report, “Ontario’s P3s — Cost Does Not Equal Value,” March 31, 2015. |
The Auditor General of Ontario recently completed an assessment of the AFP model. The report acknowledged IO’s strong record of delivering infrastructure projects on time and on budget, and confirmed that, through AFP projects, IO is transferring risks to the private sector that could otherwise result in higher costs and delays.
The government is committed to continuous improvement and modernization of its project procurement and delivery. Infrastructure Ontario will continue to enhance the AFP model by addressing the Auditor General’s recommendations, applying lessons learned, developing best practices, and being open and transparent with the public and stakeholders.
Federal Funding for Infrastructure
Progress on the Building Canada Plan
Modern infrastructure is essential not just for Ontario’s economy, but also for the Canadian economy as a whole.
The Province is leveraging its infrastructure investments by participating in the Building Canada Plan. In December 2014, Ontario submitted a priority list of diverse and strategic projects to the federal government for funding under the Provincial–Territorial Infrastructure Component. Ontario’s submission includes:
| › | Investments in GO Transit improvements; |
| › | Six northern highway projects; |
| › | Five projects that will improve the quality of Ontario Parks’ drinking water; |
| › | Five disaster mitigation projects that will improve the resiliency of Ontario’s dams to natural hazards and mitigate the impact of climate change; and |
| › | Key municipal projects, including Sudbury’s Maley Drive Extension and the Ottawa River Action Plan. |
The Province shares the federal government’s interest in the Toronto Port Lands Flood Protection Project and looks forward to completion of due diligence work in support of this critical initiative in collaboration with the City of Toronto and the federal government.
Later this year, the Province will also submit a second list of projects for funding under the Building Canada Fund.
In addition, the Province recently submitted its initial list of projects under the Small Communities Fund component of the Building Canada Fund. Ontario was one of the first provinces to accept submissions from municipalities under this program and a second intake round will be announced later this year. The Province is calling on the federal government to quickly approve these priority projects so that work can begin in communities across the province.
In Canada, provinces and territories are investing three times as much as the federal government on infrastructure. Provincial and territorial spending makes up 46 per cent of total government infrastructure spending, and municipal spending represents 40 per cent. This means that federal spending represents only 14 per cent, even after taking into account federal transfers to other orders of government. However, the federal government collects roughly the same amount of revenues derived from the economic growth associated with these infrastructure investments as do provinces and territories combined. A pan-Canadian infrastructure partnership is needed to balance this misalignment between investments and benefits. Ontario calls on the federal government to participate fully in this partnership.
See Chapter III: National Leadership — Strong Ontario, Strong Canada for more details on the benefits of a Canadian infrastructure partnership.
Strengthening Land Use Planning
Ontario is holding public consultations on provincial land use plans that were put in place to protect the Greenbelt and prime agricultural land, build transit-friendly communities and support economic development. This coordinated review includes the Growth Plan for the Greater Golden Horseshoe, the Niagara Escarpment Plan, the Oak Ridges Moraine Conservation Plan and the Greenbelt Plan. Each of these plans has been forward-looking, but they can be made even stronger and more integrated. That is why the Province is encouraging Ontarians to participate in the review. The review will be completed in early 2016, with public comments being accepted until May 28, 2015.
The government has also heard from other areas of the province on the importance of developing plans to support growth and protect Ontario’s natural resources, including valuable agricultural lands. That is why the Province will consider growth planning for eastern Ontario, supported by public consultation and stakeholder input.
Section C: Unlocking the Value of Provincial Assets
Introduction
Sound fiscal management is achieved in part through optimization of the Province’s assets; using them strategically is a cornerstone of good government. That is why Ontario is moving ahead with its plan to unlock the value of its assets to help support Moving Ontario Forward. In the case of asset sales, Ontario is reinvesting the net proceeds through the Trillium Trust in transit, transportation, and other priority infrastructure projects that will create jobs, expand opportunity and improve prosperity for all Ontarians.
The Province has sold its remaining General Motors shares and is in the process of selling the Liquor Control Board of Ontario’s (LCBO) head office lands. The Province is also looking at its other real estate assets, including Ontario Power Generation’s (OPG) head office building, as well as Seaton and Lakeview lands.
As laid out in the 2014 Budget, the government put processes in place to move forward with plans to unlock the economic value of Provincial assets, including establishing the Premier’s Advisory Council on Government Assets.
In the 2014 Ontario Economic Outlook and Fiscal Review, the Province shared the Council’s initial findings, which the government supported. The Council’s mandate was enhanced so that it could undertake further due diligence and consultations with stakeholders, develop an implementation plan for the government and provide final recommendations to inform the 2015 Budget. The Council has now delivered its recommendations to the Province, with respect to beer retailing in Ontario and broadening the ownership of Hydro One. They include the following:
| › | Proceed with an initial public offering (IPO) of approximately 15 per cent of the common shares in Hydro One Inc. (Hydro One), with additional share sales in subsequent years, over time totalling up to 60 per cent of the Province’s common shares in Hydro One. |
| › | Use Hydro One Brampton as a catalyst for local distribution company (LDC) consolidation through a merger between Hydro One Brampton and three other urban LDCs. |
| › | Introduce competition into the retailing system by authorizing up to 450 Ontario grocery stores to sell beer subject to certain restrictions. |
| › | Support Ontario’s craft beer industry by reducing red tape and expanding retail opportunities for the sector. |
| › | Enter into a new, fundamentally revised Beer Framework with the Beer Store that balances the interests of government, taxpayers, brewers, restaurants and bars, and Ontario consumers in a socially responsible way. |
| › | Continue to modernize the LCBO’s retail practices and the retailing of wine and spirits to increase the benefit of the retail system for consumers, suppliers and all Ontarians. |
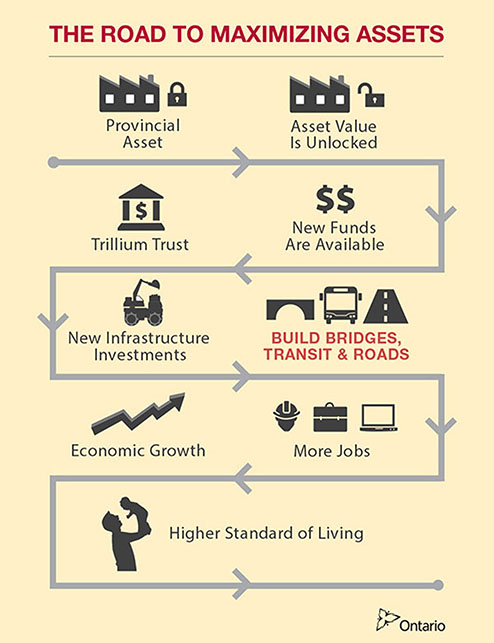
Trillium Trust
The 2014 Budget introduced the Trillium Trust Act, 2014, which established the Trillium Trust to provide for the dedication of net proceeds from the sale of qualifying assets to support the Province’s key infrastructure priorities such as roads, bridges and public transit.
General Motors
Working jointly with the U.S. and Canadian federal governments, Ontario was the only subnational government to invest in General Motors (GM) as part of the restructuring of the North American auto sector during the global recession. The financial support provided by the Ontario and federal governments to the auto sector in 2009 was crucial in protecting jobs across the province. In return for assistance to GM and as part of the company’s restructuring, Ontario received shares in the company. With the recovery of the auto sector, holding these shares was no longer in the public interest.
On February 4, 2015, the Province completed the sale of its remaining 36.7 million GM common shares for total proceeds of $1.55 billion, resulting in a fiscal gain of $1.08 billion. The average price at which these shares were sold was $42.34 Cdn. General Motors redeemed the Province’s preferred shares on December 31, 2014, for total proceeds of $0.16 billion, including a gain of $0.02 billion.
The $1.1 billion gain on the sale of the common and preferred shares exceeds the $900 million asset optimization target included in the 2014 Budget for 2014–15 Net Revenue Gains from Asset Optimization.
The Ontario government directed the gain from the sale, including the additional $200 million generated above the 2014 target, to the Trillium Trust to invest in Moving Ontario Forward. The Province has also directed to the Trillium Trust the $249 million net proceeds from the September 2013 sale of the Province’s interest in 10 million shares of GM.
As a result, the Trillium Trust now has $1.35 billion available for investment in roads, bridges and public transit throughout Ontario.
Premier’s Advisory Council on Government Assets
Since April 2014, the Premier’s Advisory Council on Government Assets has been examining ways to unlock the value of key Provincial assets, generate a better return, and generate lasting benefits for the people of Ontario. This will help expand the economy, boost productivity, improve competitiveness and create jobs for Ontarians.
The Council’s work has been guided by three key principles:
| › | The public interest remains paramount and protected; |
| › | Decisions align with maximizing value to Ontarians; and |
| › | The decision process remains transparent, professional and independently validated. |
Update on Council Progress and Recommendations
On November 13, 2014, the Council delivered a report on its initial findings on ways to maximize the value of LCBO, Hydro One and OPG to the Province. Since then, the Council has been working on the second phase of its review.
On April 16, 2015, the Council released two reports entitled Striking the Right Balance. The reports outlined the findings from the second phase of the Council’s review and addressed beer retailing and distribution, broadening ownership of Hydro One and supporting consolidation in the electricity distribution sector.
The government is currently acting on the Council’s recommendations as outlined below, as this will help provide funds to invest in infrastructure that could deliver high societal and economic returns to Ontario.
Recommendations for Hydro One
The Council has conducted further due diligence on Hydro One’s businesses and consulted with a range of stakeholders on its initial findings.
The Council has now finalized its analysis on maximizing value for Ontarians and providing enhanced protection to ratepayers, and is recommending that the Province move forward with an IPO of approximately 15 per cent of the common shares in Hydro One, with additional shares being made available in subsequent years, over time totalling up to 60 per cent of the Province’s common shares in Hydro One. By law, the Province would retain 40 per cent of its initial common shares in Hydro One, following the IPO and subsequent share offerings.
What is an initial public offering (IPO)? An IPO is the first offering of shares of a company to the public to be traded on a securities exchange, such as the Toronto Stock Exchange. An IPO allows a company to tap into a wide pool of potential investors. |
The rest of the voting shares in Hydro One would be broadly held, with no other shareholder allowed to have more than a 10 per cent holding. As such, immediately following the IPO and subsequent offerings, the Province expects to be the largest shareholder in Hydro One. The Province intends to introduce legislation that would, if passed and proclaimed, enshrine the share ownership restrictions.
In addition, the Council recommends using Hydro One Brampton as a catalyst for LDC consolidation in the Greater Toronto and Hamilton Area (GTHA), in the immediate term, through a merger between Hydro One Brampton and three other urban LDCs, and thereby strengthening competition in the electricity distribution sector. It is the Council’s view that such a merger would protect the interests of electricity ratepayers by facilitating consolidation.
Through its work, the Council has identified a number of significant benefits associated with keeping Hydro One’s transmission and distribution businesses together:
| › | Divesting a portion of the integrated company would yield greater economic value to Ontario taxpayers and avoid the significant lead time and cost necessary to split the company. |
| › | The Council heard from stakeholders on the importance of keeping the two businesses together and that retaining a significant government ownership position in both strikes a balance between providing funding for infrastructure and continued public ownership, with the Province receiving financial benefits from a growth-oriented company. |
| › | Retaining the integrated business with the introduction of private-sector discipline would allow Hydro One to achieve operating efficiencies while maintaining a share of public ownership and regulatory oversight to protect Ontarians. |
| › | Moving forward with an IPO of the consolidated company at this time would allow the Province to capitalize on the current low interest rate environment and attractive market conditions. |
The Council has identified that these uniquely attractive conditions enable the government to maximize value and obtain greater net proceeds. Under legislative amendments proposed as part of this Budget, these would be available to be credited to the Trillium Trust and directed into building transit, transportation, and other priority infrastructure, through Moving Ontario Forward, as described in Chapter I, Section B: Building Modern Infrastructure and Transportation Networks.
Most importantly, the Council recognized that a consolidated Hydro One would continue to have its rates regulated by the independent Ontario Energy Board (OEB), ensuring that Hydro One customers and ratepayers are protected and adequately served.
As part of an effort to strengthen long-term performance and unlock the benefit for all Ontarians, the government accepts the Council’s recommendation and intends to broaden ownership in Hydro One. Accordingly, the Province is planning to launch an IPO for approximately 15 per cent of Hydro One common shares in fiscal 2015–16.
Electricity ratepayers are an important priority for the government. As is currently the case, the ability to set rates would continue to be beyond the authority of Hydro One and its board and management. Rate-setting would continue to be the responsibility of the independent OEB under the authority of the Ontario Energy Board Act, 1998.
Rate regulation is a sound and transparent framework that ensures ratepayers’ interests remain protected and that necessary investments are made to provide reliable and affordable services. The OEB already regulates both public- and private-sector-owned companies, such as natural gas utilities and electricity transmitters and distributors. Rate regulation of widely held companies is commonly used in other jurisdictions across the world. The government proposes to introduce legislation that would strengthen the OEB to further enhance its ability to protect electricity ratepayers with respect to cost, consumer protection and service reliability.
The Province intends to retain 40 per cent of its Hydro One common shares and, as a responsible shareholder, to take steps through its ownership and the structure of the IPO to ensure that strong governance continues to be a core value of Hydro One. The rest of Hydro One shares would be broadly held, with no other shareholder allowed to hold more than 10 per cent of the equity.
The government is introducing proposed legislation that would require that Hydro One retain the company’s headquarters and grid control centre in Ontario. In addition, the proposed legislation provides for substantially all of Hydro One’s senior executives with strategic decision-making authority to be located, and carry out those functions, in the province.
To support Hydro One’s transition to being broadly held, the government agrees with the Council’s recommendations that the company should operate, to the extent possible, in the same legislative and regulatory environment as other publicly traded, rate-regulated entities. To achieve this, the Province would put in place revised articles of incorporation and a new governance agreement, and is also proposing several legislative amendments.
“The Council believes that this approach strikes the best possible balance. It offers the people of Ontario maximum financial return, providing funds for investment in strategic transit and transportation infrastructure all across Ontario. It preserves the Province as the largest stakeholder, ensuring the long-term preservation of the public interest. It provides for a strong new governance structure, and it allows the government to share in the future of this large, growth-oriented company thereby retaining a growing income stream for the lasting benefit of the people of Ontario. By unfettering Hydro One and allowing it to expand its business opportunities, the company could also return an increasingly profitable dividend to all Ontarians.” Premier’s Advisory Council on Government Assets, “Striking the Right Balance: Improving Performance and Unlocking Value in the Electricity Sector in Ontario,” (April 16, 2015). |
These reforms will help support a large, Ontario-based and broadly held company that can succeed and grow with this proposed new ownership and governance structure. Ratepayers would continue to be protected through the OEB and governance and accountability controls put in place by the Province, in addition to the disclosure and governance requirements that apply to all publicly traded companies. The benefits generated from introducing new capital and allowing Hydro One to be more innovative and efficient in its operations would benefit ratepayers, the Province and Hydro One’s new broad base of shareholders. This would further solidify the company as it continues to provide high-quality transmission and distribution services in the province to support Ontario’s people and businesses.
Incorporating new capital in Hydro One would also empower the company to continue pursuing opportunities to support consolidation in the electricity distribution sector on a voluntary commercial basis. Moving forward with the proposed merger of Hydro One Brampton and three other urban LDCs would create one of the largest LDCs in the province by number of customers, and provide an additional catalyst for further consolidation in the provincial electricity distribution system.
Through these consolidation initiatives, Ontarians would benefit from a modern and more efficient electricity sector. To further incent efficiencies through consolidation and to benefit ratepayers, the Province is also taking steps to lower the transfer tax on municipally owned electricity utilities and address other potential tax implications of consolidation, on a time-limited basis, as discussed in Chapter IV: A Fair and Sustainable Tax System.
Most importantly, the government, through the Trillium Trust, will invest the net proceeds from the broadening of ownership in Hydro One into building public transit, roads and transportation infrastructure. These investments are part of the Province’s plan to produce long-term economic benefits for Ontarians by stimulating and supporting economic growth and creating jobs.
Recommendations for Beer Retailing and Distribution
Unlocking the value of Provincial assets and redeploying that value to better serve the public is a responsible way of managing assets for the public good. In its initial report released in November 2014, the Council described Ontario’s beverage alcohol retail system as consisting of three quasi-monopolies: the privately owned Brewers Retail Inc., operating as the Beer Store, the Liquor Control Board of Ontario (LCBO) and off-site Winery Retail Stores. The Council believed the Province had an opportunity to retain the system’s efficiencies, enhance the customer experience, increase access in a managed and socially responsible way, and give taxpayers a fairer share of the benefits of the system, while keeping prices below the Canadian average.
The government agreed with the Council’s initial findings and asked it to move to the second phase of its review. In this phase, the Council engaged more directly with the LCBO and key stakeholders to refine its findings. After considering the Council’s work and recommendations, the Province is developing a path forward for beverage alcohol retailing in Ontario to maximize returns to Ontario and create a fairer, more consumer-friendly retail system.
Grocery Store Sales of Beer in Ontario
The Province will authorize the sale of beer in grocery stores to improve consumer service, in a manner that meets the government’s social responsibility mandate for the sale of alcohol beverages in Ontario. Introducing competition into this retail market should incent innovation, while improving customer convenience.
The government will move as quickly as possible to open up grocery store sales of beer in urban population centres across Ontario. The Province will work to have sales available in up to 150 stores by May 1, 2017. Depending on consumer demand, up to 450 such stores could be put in place over the next 10 years.
The government continues to be committed to social responsibility as it relates to beverage alcohol distribution. The LCBO and/or Alcohol and Gaming Commission of Ontario (AGCO) will oversee the sale of beer at grocers and the government will mandate in law that the sale of alcohol be restricted to set hours, that alcohol be placed in a designated section of each store, and that grocers implement the necessary staff training for the sale of alcohol to the public.
Ontario’s Craft Brewers
Ontario benefits from a thriving craft beer industry that is creating jobs and providing increased choice to consumers. The government remains committed to supporting Ontario’s craft beer industry by reducing red tape and expanding retail opportunities. To meet this commitment, the Province is changing beer retailing in Ontario by:
| › | Requiring the Beer Store to promote the sale of small brewers’ products through merchandising, promotion and the allocation of shelf space. All new private retailers will also be required to support the sale of small brewers’ products. |
| › | Allowing small brewers (under 25,000 hectolitres of annual production) to operate a second on-site store if they have more than one production site, providing greater exposure to customers. This change will encourage new capital investments, create jobs and increase tourism opportunities for Ontario’s growing beer manufacturing sector, while enhancing the retail system for both consumers and manufacturers. |
| › | Directing the LCBO to amend its beer delivery policies to allow small beer manufacturers with a licensed production facility in Ontario and with annual worldwide beer production of less than 150,000 hectolitres to arrange for pooled delivery of their products from their Ontario production facilities to the LCBO and licensed establishments (i.e., bars and restaurants) and to use third-party carriers and warehousing. This change will create opportunities for manufacturers to cut costs and streamline their business practices. |
The Beer Store
The Council has successfully negotiated a framework of key principles with the Beer Store and its owners. The government has accepted the key principles and is now negotiating a New Beer Framework, a binding agreement based on these principles, with the Beer Store and its owners. The New Beer Framework will improve the fairness, transparency and consumer appeal of the Beer Store, while maintaining its operation as a low-cost, efficient distributor of beer in Ontario. Some of the key principles to be included in the New Beer Framework are:
| › | Brewers with manufacturing facilities in Ontario can qualify for a meaningful opportunity to become equity shareholders of the Beer Store. All transactions between the Beer Store and its shareholders will be conducted in a transparent, auditable and commercially reasonable manner. |
| › | The Beer Store will operate under a new best practices governance structure that will provide fair representation for all shareholders and include independent directors representing the broader public interest. An independent Beer Store Ombudsperson will be appointed to ensure brewer and customer complaints are handled in an unbiased manner. |
| › | The Beer Store will spend $100 million in capital improvements over the next four years, 80 per cent with respect to its retail stores. Customers will see more modern self-service and open-concept formats at stores. |
| › | Changes to the Beer Store’s retailing and marketing practices will ensure all brewers are treated fairly and will provide additional retail opportunities including: |
| › | Establishing a new category called “Craft”; |
| › | Dedicating a minimum of 20 per cent of shelf space to small brewers; |
| › | Allocating shelf space based on local market share adjusted for a brand’s growth; |
| › | Providing additional merchandising, marketing and promotional activities and listing opportunities to all brewers, including growing brands and brewers; and |
| › | Introducing a new tiered rate sheet that will set fees for all brewers, resulting in lower service fees for small brewers than for larger brewers. |
| › | Implementing a two-year restriction on price increases for the Beer Store’s main brewers’ most popular beer products will keep the price of beer below the Canadian average. Beer prices will continue to be subject to annual minimum price increases to ensure responsible consumption. |
| › | Responding to consumer demands and preferences, the LCBO will conduct a 10-store pilot across Ontario to explore the viability of offering 12-packs. Based on an evaluation of the pilot, the Province will have the option to expand the sale of 12-packs in up to 60 stores. |
| › | Indexing the current 2015 LCBO cost of service charges on beer to inflation in subsequent years. |
| › | Renewing the Ontario Deposit Return Program contract (currently to end in February 2017). The Program will be extended to the end of the New Beer Framework on certain revised terms. The fee payable to the Beer Store will be reduced by approximately $1 million per year and the fee will no longer be indexed annually to inflation. |
| › | Adjusting the Beer Store’s policies for sales to certain small licensees (i.e., restaurants and bars) to allow them to buy up to 250 cases of beer a year at retail prices to better meet their inventory demands. This will provide a benefit to almost 9,000 of the province’s licensees. |
The New Beer Framework will be in effect for an initial period of 10 years, subject to a renewal for five years. This will provide for some degree of long-term stability for planning purposes, without locking in the proposed model. The government is introducing legislation to permit implementation of the Council’s findings.
Government Revenues from the Sale of Beer
The Province will introduce legislation to increase its annual revenues from all beer sold in Ontario by approximately $100 million, phased in over four years, by implementing a new three cents per litre beer charge in November 2015. The new charge will increase by three cents per litre every year until 2018, or approximately 25 cents per 24-pack annually, on average.
Council Next Steps
Over the coming months, the Council will engage with wine and spirits stakeholders on reforms to their sectors. The LCBO will proceed with consumer enhancement initiatives, which are built into their 2015–16 Business Plan. As this work progresses, the Council will continue to work with the LCBO on enhancing their pricing and mark-up strategies to better leverage their buying power in a transparent and rule-based manner.
Social Responsibility Initiatives
Selling alcohol responsibly is a public trust that the government takes very seriously. As part of the Province’s efforts to ensure alcohol is sold in a socially responsible manner, the government will establish and enforce social responsibility standards for any new retailers of beverage alcohol. Additionally, the Province will move to rationalize the AGCO’s and LCBO’s oversight of beverage alcohol retailing in Ontario to, among other things, ensure all current and future activities are aligned to support the Province’s social responsibility goals and priorities. The Ministry of Finance will work with the Ministry of Health and Long-Term Care to continue to develop initiatives to support safe consumption of alcohol, in light of the expansion of alcohol sales in Ontario.
Optimizing the Value of the Province’s Real Estate Assets
The government continues to move forward with the process to sell the LCBO’s head office lands. A Request for Proposal (RFP) was issued on September 4, 2014, and the transaction is expected to close in 2015–16. This sale will ensure that Ontarians get greater value from this public asset.
The Province has also been performing due diligence on options for OPG’s head office building and continues to move forward on the sale process.
Other real estate assets continue to be reviewed under a longer-term revitalization plan, including the former Lakeview generating station property in southeastern Mississauga and the Seaton lands in Pickering. The government is currently moving forward, by examining and evaluating options to maximize value for these real estate assets.
Section D: Creating an Innovative and Dynamic Business Environment
To create rewarding, high-paying jobs, Ontario’s businesses must succeed and grow. Success and growth in today’s rapidly changing global economy require innovative responses to constantly evolving competitive challenges. That is why creating an innovative and competitive business climate is the third pillar of the government’s four-part economic plan, outlined in the 2014 Budget.
The government has improved Ontario’s competitiveness through various initiatives:
| › | Corporate tax reductions and sales tax reform have substantially enhanced Ontario’s attractiveness as a location for business investment. The Province has also cut business regulations by 17 per cent. As a result, the cost of doing business in Ontario is competitive within Canada and around the world. |
| › | Ontario’s Jobs and Prosperity Fund (JPF) is partnering with businesses to attract new investments to the province that will enhance innovation, increase productivity and grow Ontario’s exports. |
| › | By supporting its key sectors, Ontario is experiencing promising growth in new, high-value sectors of the economy, including advanced manufacturing, biotechnology and life sciences, and information and communications technologies (ICT). |
| › | The Going Global Trade Strategy is helping firms export. In 2012, over 18,000 Ontario firms exported, an increase of more than 600 firms since the global recession. |
| › | By making strategic investments that improve access to capital, the government has helped Ontario exceed most G7 countries in venture capital investment intensity. |
The evidence shows that Ontario’s plan is having the right impact. Since the recessionary low in June 2009, over 500,000 net new jobs have been created, primarily in the private sector. Not only has Ontario recovered all the jobs lost since the 2008 recession, but the majority of new jobs are full time and in industries paying above-average wages. High-quality jobs provide opportunities for personal development while helping to create financial stability for families.
Notwithstanding Ontario’s successes, more must be done to ensure Ontario’s continued prosperity. Accordingly, the Province is taking steps in this Budget to address the following challenges:
| › | Intense international competition, including from emerging economies; |
| › | Not enough small firms scaling up into medium and large firms; and |
| › | Inadequate productivity growth and underinvestment in innovation. |
The government continues to build on its economic plan by addressing these challenges through:
| › | Supporting a competitive tax environment; |
| › | Making strategic investments; |
| › | Strengthening international and interprovincial trade; |
| › | Creating a supportive business environment; |
| › | Tackling climate change; and |
| › | Growing businesses in the north. |
In particular, the government will:
| › | Enhance the Jobs and Prosperity Fund (JPF) by a total of $200 million to attract more business investments that will spur innovation and create jobs. The government will also extend eligibility to the forestry sector; |
| › | Participate in the creation of a new innovation initiative with an experienced group of senior business leaders who will bring their capital, knowledge and networks to the mission of bringing Ontario startups to scale; and |
| › | Provide ongoing electricity pricing support for qualifying large northern industrial facilities, which sustains jobs and global competitiveness, beyond March 2016. |
Supporting a Competitive Tax Environment
Business investment is necessary to support long-term economic growth and job creation. In today’s global economy, where jurisdictions must compete for business investment, a competitive tax system is critical. Through recent tax reforms, Ontario has significantly improved its tax competitiveness.
TABLE 1.3 Measures the Government Has Taken to Maintain a Competitive Business Tax System |
| Sales Tax Reform | The Harmonized Sales Tax (HST) will remove $4.7 billion a year in embedded sales taxes paid by businesses when fully implemented. |
| Corporate Income Tax Rate Reductions | The government has cut Corporate Income Tax (CIT) rates for businesses, providing $2.3 billion of tax relief per year: › The general CIT rate was reduced in stages from 14 per cent in 2009 to 11.5 per cent in 2011. › The CIT rate for manufacturers and processors (M&P) was reduced from 12 per cent in 2009 to 10 per cent in 2010. › The CIT rate for small businesses was reduced from 5.5 per cent in 2009 to 4.5 per cent in 2010. |
| Capital Tax Elimination | The government eliminated Capital Tax, which corporations paid whether or not they had a profit. This measure provides $2.1 billion of tax relief per year. |
| Business Education Tax Reductions | The government implemented significant cuts to high Business Education Tax rates, resulting in ongoing savings of over $200 million per year for Ontario businesses. |
Supporting Manufacturing and Processing Investment | Paralleling the 2013 federal extension of the accelerated depreciation rate for manufacturing and processing machinery and equipment to December 31, 2015, provides a benefit of $265 million over three years. |
| Administrative Savings for Business | The HST and streamlined CIT administration are reducing business compliance costs by more than $635 million per year. |
Ontario’s general Corporate Income Tax (CIT) rate was reduced in stages from 14 per cent in 2009 to the current 11.5 per cent, resulting in a combined federal–Ontario general CIT rate of 26.5 per cent. Ontario’s combined rate is lower than the combined federal–state CIT rate in any of the U.S. states and lower than the average CIT rate of G7 and G20 member countries.
The CIT rate reductions, Sales Tax reform and Capital Tax elimination have together cut Ontario’s marginal effective tax rate (METR) on new business investment by half since 2009. As a result, Ontario’s METR is lower than the average METR among Organisation for Economic Co-operation and Development (OECD) countries and is well below the average METR in the United States.
Since 2007, both Ontario and the federal government have provided an accelerated deduction for investments in manufacturing and processing machinery and equipment. This deduction helps businesses rebuild capacity and remain competitive in the global economy. Ontario has encouraged the federal government to continue this support for manufacturers and processors, which is set to expire on December 31, 2015, and commits to paralleling the federal government in this regard.
Making Strategic Investments
Productivity growth is an important driver of an economy’s prosperity and is strongly linked to competitiveness. Growth in the productivity of an economy can be affected by a variety of investments, including in machinery and equipment and research and development (R&D). Innovation — the ability to turn ideas into useful new products and services and new ways of doing things — is also a vital driver of competitiveness and prosperity.
The government is supporting the private sector to become more competitive and make productivity-enhancing and innovation-focused investments through:
| › | A new 10-year Jobs and Prosperity Fund; |
| › | Regional and community partnerships; |
| › | Investing in infrastructure; |
| › | Access to capital for entrepreneurs; |
| › | Attracting foreign direct investment; |
| › | Fostering an innovation ecosystem; |
| › | Helping more Ontario startups scale up; |
| › | Supporting excellence in technology and business management; |
| › | Supporting health innovation; and |
| › | Supporting the sharing economy. |
Jobs and Prosperity Fund
In January 2015, the government launched a 10-year, $2.5 billion Jobs and Prosperity Fund to partner with businesses. The Fund is anchored in enhancing productivity growth, innovation and exports of Ontario companies. These three principles are also part of the government’s new Strategic Investment Framework, which is used to evaluate potential projects. When determining Provincial support for a potential project, the Strategic Investment Framework also takes into consideration:
Incremental investments are business activities that occur only because of government support and exclude activities that would have occurred regardless. |
| › | Leveraging incremental investments; |
| › | Alignment with Ontario’s key growth sectors; and |
| › | The requirement that projects provide a positive rate of return and net economic benefit to Ontario’s economy. |
The Fund has three distinct streams to help support businesses across the economy:
| › | The New Economy Stream — Increasing firms’ capacity for innovation; encouraging productivity-enhancing investments in ICT and advanced manufacturing equipment; and helping businesses expand their reach in the global marketplace. |
| › | The Strategic Partnerships Stream — Bringing together business, research institutions and entrepreneurs to create and adopt new technologies and improve their competitiveness. |
| › | The Food and Beverage Growth Fund — Improving the productivity and competitiveness of food, beverage and bioproduct manufacturers. |
Under the Jobs and Prosperity Fund, Ontario will also extend funding eligibility to the province’s forestry sector to help it increase production capacity and expand into new markets while ensuring this resource is managed sustainably. This will also help modernize the forestry sector and facilitate the production of higher value-added products by supporting the adoption of new technologies.
Project commitments will help create and retain jobs. For example, the investment in Linamar will create 1,200 jobs and retain more than 6,800 jobs over 10 years. To enable the Province to partner with more businesses, the Fund will be enhanced by a total of $200 million beginning in 2015–16, increasing the Fund to $2.7 billion over 10 years.
| TABLE 1.4 Recent Strategic Partnership Investments |
| Company | Description |
| Linamar (2015) | An investment of over $500 million over 10 years through support from the Jobs and Prosperity Fund. The project will result in investments in productivity-enhancing equipment, increased research and development (R&D) activity, and increased exports, with the Province projected to recoup its investment in six years. |
| Honda Canada (2014) | An investment of $857.4 million in Ontario’s auto sector, including R&D, training, supplier tooling and installation of new technologies at the company’s three Ontario facilities. |
OpenText (2014) | An investment of up to $2 billion to expand the company’s operations across Ontario, including new jobs in R&D. OpenText is Canada’s largest software company, specializing in enterprise information management software. |
Cisco (2013) | An investment of up to $4 billion that will establish Ontario as one of the company’s R&D hubs. This project will support the development of technology used in mobile computing and video technology. |
Regional and Community Partnerships
Regional and community development funds support businesses and communities across Ontario, helping to create jobs, boost productivity and form a solid foundation for regional economic growth. The government continues to directly support regions around the province by making more than $150 million available annually through its funds.
Regional and community development funds include the:
| › | Eastern Ontario Development Fund; |
| › | Southwestern Ontario Development Fund; |
| › | Northern Ontario Heritage Fund Corporation; |
| › | Rural Economic Development program; and |
| › | Aboriginal Economic Development Fund. |
| TABLE 1.5 Recent Examples of Supporting Economic Development in Ontario’s Communities |
| Company | Description |
| Nemak of Canada Corp. | Located in Windsor, Nemak supplies high-tech aluminum casting components for the automotive industry. The company received a $1.5 million grant from the Southwestern Ontario Development Fund for a facility expansion, creating 80 new jobs and leveraging $14.6 million in private investment. |
| Silicorp Developments Inc. | Received a $535,000 grant from the Northern Ontario Heritage Fund Corporation to establish a silica crushing and processing plant in North Bay, leveraging $1.4 million in private investment and creating 16 new jobs. |
| Mushkegowuk Council | Receiving $457,348 over three years from the Aboriginal Economic Development Fund to implement its regional business organization project, allowing both parties to be effective partners in resource development and other emerging sectors. The project is expected to create or sustain up to 375 jobs and provide skills training for up to 185 Aboriginal people. |
Access to Capital for Entrepreneurs
Access to capital plays a critical role in accelerating the growth of innovative startups and entrepreneurial firms into medium and large companies. That is why the government has made strategic investments that improve access to capital. In January 2014, Ontario launched the Northleaf Venture Catalyst Fund in partnership with the federal government and private-sector partners. To date, the Fund has made nine investments in companies and other venture capital funds.
The Fund’s investment activities contributed to a strong year for venture capital investment activity in Ontario. According to the Canadian Venture Capital and Private Equity Association, more than $930 million was invested in Ontario-based companies in 2014. Ontario’s venture capital activity has improved since 2009, and the province outpaces most other G7 countries in venture capital investment as a proportion of GDP.
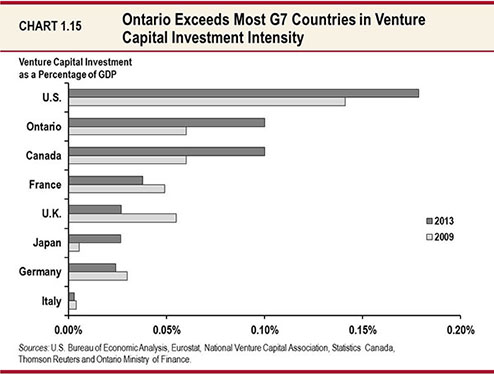
Partnerships with the private sector are also helping improve access to capital for social enterprises. Social enterprises often face unique financing challenges as they pursue their vision. In December 2014, the MaRS Centre announced a partnership with Virgin Unite, the non-profit arm of the Virgin Group. The MaRS Centre for Impact Investing will manage a new $1 million fund on behalf of Virgin and the Mindset Social Innovation Foundation to support early-stage social enterprises, with a goal of raising up to $5 million from additional investors.
Social enterprises are organizations that use business strategies to maximize their social or environmental goals.
|
In February 2015, the government announced support for 11 social finance organizations through the Social Enterprise Demonstration Fund. With the Province’s $4 million contribution, these organizations will provide loans or grants to accelerate the growth of early-stage social enterprises. Ontario’s funding is expected to leverage more than $6 million from other sources, including the private sector. |
Attracting Foreign Direct Investment
Foreign direct investment (FDI) can play a key role in improving productivity and competitiveness. The Ontario government has played an important role in attracting FDI by contributing to a positive business investment climate and leveraging major capital spending projects by leading global companies. Ontario remains the leading destination in North America for FDI.
| › | fDi Intelligence, a major source of research and analysis on FDI trends globally, published in its report on global FDI trends in 2013 that Ontario is the number one destination in North America for global FDI, based on capital spending projects. |
| › | Ontario ranked second in North America in the software and information technology sector, third in autos and fourth in financial services. The province continues to punch above its weight in FDI in these major sectors, while ranking only fifth in North America in overall economic size. |
Fostering an Innovation Ecosystem
Ontario’s innovation ecosystem, which includes the Ontario Network of Entrepreneurs (ONE), is among the most robust in the world. Over the last decade, a culture of entrepreneurship has blossomed in Ontario. Thousands of new companies are starting. Those companies are attracting customers and risk capital, both domestically and internationally, fuelling their growth and creating jobs.
Ontario Network of Entrepreneurs The Ontario Network of Entrepreneurs (ONE) is a comprehensive suite of programs, services and resources to assist businesses at every stage of their development — from local businesses to globally focused, technology-based firms. ONE provides advice and mentorship, skills and knowledge development opportunities, as well as access to local networks of academics and investors, and access to seed capital. ONE consists of: ● Regional Innovation Centres (RICs) — Operating across the province, Ontario’s 17 RICs are a province-wide innovation network that supports technology-based entrepreneurs. The RICs work together with the Ontario Centres of Excellence and MaRS Discovery District. ● Small Business Enterprise Centres — With 57 locations across Ontario, Small Business Enterprise Centres are a partnership between the Province and local municipalities focusing on “main street” businesses. Working with a local Small Business Enterprise Centre helped the Krista Norris Collection, an Ottawa-based fashion accessory company, double the number of retailers carrying its products throughout Ontario and the United States. ● Business Advisory Services — The Province helps existing and aspiring entrepreneurs grow their businesses at home and abroad through 12 Business Advisory Services offices across Ontario. The government will engage international experts to evaluate the effectiveness of the ONE to maintain its global leadership position. The review aims to ensure that Ontario continues to be one of the top jurisdictions globally for companies to start and grow. It is vital that an innovation network adapt to new approaches and opportunities, with a focus on growing the next generation of leading innovation-driven businesses. |
Building on its successes, Ontario has an opportunity to compete with Silicon Valley and establish itself as a globally recognized hotbed of innovation.
Helping More Ontario Startups Scale Up
Alongside venture capital and other risk capital, mentorship helps to support the growth and expansion of innovative startups and entrepreneurial firms. For this reason, the Province will participate in the creation of a new innovation initiative that will convene an experienced group of civic-minded senior business leaders to bring together their capital, knowledge and networks to scale up Ontario startups.
Communitech’s Corporate Innovation Lab Recognizing the need to boost productivity by adopting new technologies and business models, large companies such as the TD Bank Group and Canadian Tire have partnered with the Communitech Hub in Kitchener. This relationship is helping some of Canada’s companies become more competitive, while at the same time accelerating the growth of innovative startups through new sales and partnerships — a true win–win. Ontario proudly supports the startup ecosystem through the Ontario Network of Entrepreneurs. |
Supporting Excellence in Technology and Business Management
The Institute for Competitiveness and Prosperity had previously identified a gap in Ontario’s technology management expertise. To address this gap and support the high-tech industry, funding will be provided for a new school within Wilfrid Laurier University.
The Lazaridis Institute for the Management of Technology Enterprises will teach students the specific management skills required by the technology sector. It will focus on teaching these skills through customized curricula, research activities, seminars and conferences. The Province will contribute $1.5 million annually to the Institute over the next 10 years to leverage an investment of $20 million from the private sector.
In addition, the Province is investing $10 million over two years to expand Brock University’s Goodman School of Business through renovation and additions. It will also leverage an investment from the private sector. This expansion will provide more students with innovative learning options and greater flexibility to gain the skills and knowledge required for success after they graduate.
Supporting Health Innovation
To support the growth and competitiveness of Ontario’s health technology sector, the Ontario Health Innovation Council (OHIC) was established in November 2013. In December 2014, the Council issued a final report and provided recommendations to the government, including options to reduce barriers to innovation and to better support the use of health care technologies in Ontario.
The Province will adopt all of the Council’s recommendations including the appointment of a Chief Health Innovation Strategist and six innovation brokers to connect health technology entrepreneurs with the people and resources needed to advance their innovations. The government will also establish the $20 million Health Technology Innovation Evaluation Fund to support pre-market evaluations and early adoption of home-grown innovative health technologies. In addition, the government will continue working on shifting to strategic, value-based procurement and creating incentives for innovation.
Helping Innovators Bring New Technologies to the Health System In line with the work of the Ontario Health Innovation Council, the government already supports the development, procurement and adoption of new health innovations through three initiatives: ● MaRS EXCITE — MaRS EXCITE (Excellence in Clinical Innovation Technology Evaluation) helps innovators accelerate the development, regulatory approval and adoption of their health technologies through a single, harmonized, pre-market, evidence-based process. MaRS EXCITE will receive $2.3 million in funding over the next four years. ● AdvancingHealth Program — The AdvancingHealth Program, delivered by the Ontario Centres of Excellence, connects health care organizations, innovators and academic institutions to better align health needs with innovative technologies and services developed in Ontario. ● Improving Procurement of Health Innovation — With government support, the Healthcare Supply Chain Network encourages a shift to value-based procurement activities and a competitive process that is more open to health innovations. Government support for health innovation is already making a difference: ● Provincial funding to Xagenic has supported the development of a revolutionary molecular diagnostic system. ● With government support, Interface Biologics develops biomedical polymer technologies that enhance the safety and effectiveness of implantable medical devices. |
Ontario is a global leader in various fields of health research including neuroscience, oncology and regenerative medicine. The Province continues to support groundbreaking medical research in those areas and more, which helps improve health care outcomes for Ontarians, while supporting the commercialization of innovations developed in Ontario:
| › | The Province will commit $23.5 million over five years to help establish the Aging and Brain Health Innovation (ABHI) Centre at Baycrest Health Sciences, a world leader in the study of cognitive neuroscience. The ABHI Centre will support the development of new technologies, products and resources to enable people to age in the setting of their choice by maintaining their cognitive, emotional and physical well-being and independence as long as possible. |
| › | The Province is investing $25 million over five years to support the recently established Ontario Institute for Regenerative Medicine (OIRM). The Institute offers a strategic opportunity to accelerate the translation of discoveries into new treatments and therapies for a wide variety of diseases and conditions, including cancer, diabetes, blindness, and heart and lung diseases. |
| › | In February 2015, the government announced a $6.4 million investment over four years in the Health Services Research Program of the Ontario Institute for Cancer Research (OICR). The funding will support new research on increasing screening rates for colon cancer, decreasing toxicity for patients undergoing chemotherapy, and improving pain management for cancer patients. The OICR is at the leading edge of cancer research and has received commitments of more than $750 million in Provincial funding since 2006. |
| › | The Alzheimer Society of Canada estimates that the economic burden of dementia in Canada will increase to $24 billion by 2018. To improve the diagnosis and treatment of conditions such as autism, depression, Alzheimer’s disease and Parkinson’s disease, the Province will continue to support the work of the Ontario Brain Institute (OBI). |
| › | Ontario is providing $2 million to support the Brain Imaging Centre at The Royal’s Institute of Mental Health Research in Ottawa. The funding will be used to acquire a unique PET–MRI brain-imaging system that will advance the understanding of a variety of mental health disorders. It will also enable mentoring and training to build Ontario’s and Canada’s next generation of researchers and clinicians. |
Supporting the Sharing Economy
The right regulatory and tax environment can help innovation thrive. As part of the growing shift to the sharing economy, new technologies are disrupting existing business models. These software-driven applications often involve thousands of individual operators. As these business models are quickly emerging, the labour landscape is changing. Moreover, aspects of the regulatory and taxation environment may need to adapt to new and previously unconsidered business models.
To help vibrant, emerging sectors thrive, the government commits to working with firms and industries to help them comply with existing obligations and to consulting on an ongoing basis to ensure those obligations reflect a changing economy.
Strengthening International and Interprovincial Trade
Ontario’s economic growth and continued prosperity depend on increasing its exports within Canada, within North America and around the world.
Global opportunities to grow and diversify Ontario’s exports have never been better. Ontario’s principal export market, the United States, is rebounding as a global leader, at a time when lower oil prices and a more competitive Canadian dollar are helping lift the province’s exports. Fast-growing markets within emerging economies remain a significant growth opportunity for Ontario businesses.
Going Global Trade Strategy
In the fall of 2013, the Province introduced its Going Global Trade Strategy, to capitalize on global export trends and help Ontario firms compete and become more productive. The fast-changing global trading environment holds tremendous opportunities and some market challenges for firms. Ontario’s trade strategy is helping new and existing exporters learn about foreign opportunities and successfully respond to market changes.
Since 2000, Ontario exports have more than tripled to Asia and doubled to Latin America, as firms have been slowly diversifying towards these fast-growing markets. As these regions’ large middle classes grow and demand higher-quality products and services, Ontario exporters must be ready and able to meet the challenge. |
Key elements of the Going Global Trade Strategy include:
| › | Helping firms start exporting and existing exporters build capabilities; |
› | Diversifying exports into global markets, building on U.S. export success; |
| › | Promoting Ontario’s high-quality and competitive industry strengths; |
| › | Collaborating with the federal government and industry associations, including many business groups representing Ontario’s immigrant communities. Together with foreign partners, Ontario is helping to provide customized advisory services, foreign facility access and innovation partnerships to help businesses access global markets; and |
| › | Working with the federal government to negotiate important new trade agreements. These include the Canada–European Union Comprehensive Economic and Trade Agreement (CETA), Canada–South Korea Free Trade Agreement, and potential future pacts with India, Japan and the 12-nation Trans-Pacific Partnership. |
Small and medium-sized enterprises (SMEs) account for over 90 per cent of all exporters in Ontario and have led the growth in exporting to foreign markets, focusing on niches such as quality food products and specialized machinery. Small and medium-sized enterprises need to build on their strengths in the U.S. marketplace, take advantage of supply-chain linkages, boost their exports overseas and scale up into larger companies. Almost half of all SMEs in the Ontario manufacturing sector export products, but mainly only to the United States. |
Successfully Moving Forward
The Province’s trade strategy continues to build on its recent success in helping Ontario exporters. Over 18,000 firms exported in 2012, according to Export Development Canada. This is an increase of more than 600 net new exporters since the global recession.
Customer demand for Ontario’s high-value-added goods and services is growing around the world. Emerging markets such as China and India are expected to continue expanding at a rapid pace. For example, China’s share of the global economy is expected to almost double to 27 per cent by 2035. Regions such as the United States and Europe will continue to generate solid demand for Ontario’s resources, high-technology exports, and professional and technical services.
Initiatives under the Going Global Trade Strategy will help Ontario exporters continue to grow in number, capability and success:
| › | China remains an important market with which Ontario continues to build stronger ties. During the Premier’s 2014 international trade mission to China, Ontario secured 11 investment projects valued at $966 million. These projects will create about 1,800 jobs in communities across the province, from Ottawa to Niagara Falls to Stouffville. In addition, the government will conduct a trade mission to China in April 2015 to increase opportunities for Ontario’s agriculture and agri-food sector. |
| › | More than 2,400 Ontario exporters have received help to become export-ready and expand globally, supporting $750 million in new business opportunities (from 2013 to late 2014). |
| › | Ontario has undertaken a growing number of trade missions to help develop business interests, including 97 trade missions to the Americas, Europe, the Middle East and Asia Pacific. Almost 1,000 Ontario companies have participated. |
| › | International Marketing Centres have helped more than 830 Ontario companies looking to access new export markets. Centres are located in New York, San Francisco, Mexico City, São Paulo, London, Paris, Munich, Beijing, Shanghai, Tokyo and New Delhi (with a satellite office in Mumbai). |
| › | In early February, Minister of Finance Charles Sousa travelled to Chicago, Illinois, where he met with both direct and fixed-income investors to promote greater cooperation, partnership and investment between the State of Illinois and Ontario. |
The government continues to undertake new initiatives, such as finding new markets; expanding opportunities for firms to connect with foreign buyers; expanding the reach of Ontario’s exports, particularly to fast-growing emerging nations; and promoting Ontario-made, innovative goods and services.
Growing Opportunities Interprovincially
Interprovincial trade plays an essential role in the economy, supporting thousands of jobs across the province. In 2014, Ontario’s interprovincial exports of goods and services were valued at $134 billion. Quebec remains Ontario’s largest provincial export market, accounting for more than one-third of total interprovincial exports, followed by Alberta and British Columbia.
Barriers to interprovincial trade can add unnecessary obstacles to doing business across Canada and hinder economic potential. Canada’s Premiers recognize this economic reality and are working together to strengthen and modernize the internal trade framework. Ontario is co-leading this renewal with Manitoba, Saskatchewan and Nova Scotia to secure an ambitious and balanced updated internal trade agreement that levels the playing field for trade within Canada.
Ontario–Quebec Partnerships
At a joint meeting of ministers held in Toronto in November 2014, the Premiers of Ontario and Quebec committed to reinvigorating the Ontario–Quebec Trade and Cooperation Agreement (OQTCA). The objectives include increasing regional trade and investment, enhancing the region as a centre of productivity and innovation, and promoting it as an export hub within Canada. The two provinces agreed to work together to:
| › | Align OQTCA government procurement commitments with those of the CETA, to ensure that Ontario and Quebec suppliers are treated no less favourably than European Union suppliers in each other’s markets; |
| › | Enhance the OQTCA regulatory cooperation chapter to share information on proposed regulations and regulatory best practices, with a view to having a tangible impact on business; and |
| › | Explore opportunities to conduct joint trade missions for industries of mutual interest, or to countries or regions of mutual interest, with a view to leveraging existing resources and international linkages. |
Ontario and Quebec also signed agreements to work together to keep electricity affordable and reliable, tackle climate change, build modern infrastructure and support La Francophonie. The next joint meeting will take place in Quebec City later this year.
See Chapter III: National Leadership — Strong Ontario, Strong Canada for more details about Ontario’s intergovernmental relations.
Creating a Supportive Business Environment
Ontario is creating an environment where businesses can flourish through targeted legislation, smart regulations, and the effective delivery of publicly provided goods and services.
Helping Businesses Manage Electricity Costs
The government is committed to reducing electricity cost pressures on small businesses and industrial consumers while promoting the conservation of energy and electricity. Through Ontario’s five‐point small business energy savings plan, small businesses will have the tools they need to conserve energy, manage costs and save money.
Industrial Electricity Incentive
In the 2014 Budget, Ontario announced an expanded Industrial Electricity Incentive (IEI) to further capitalize on the province’s strong supply of electricity by incenting industrial expansion through rate mitigation — supporting a dynamic and innovative business climate in which companies can thrive, grow and create jobs.
As part of this enhancement, eligibility for the IEI was expanded to encourage participation from more diverse economic sectors throughout the province.
Under the IEI Stream 3 intake, eligible companies in electricity-intensive sectors qualify for reductions related to the cost of their incremental power consumption, and will allow for better use of Ontario’s current surplus energy capacity to drive local economic growth and support domestic job creation. Under Stream 3, 22 companies have received offers for 24 different projects.
Industrial Conservation Initiative
Ontario remains committed to ensuring competitive industrial electricity rates to support large industrials while also promoting the demand management of electricity.
In the 2014 Budget, Ontario committed to expanding the Industrial Conservation Initiative (ICI) to provide a stronger incentive for more large and medium-sized electricity consumers to shift their electricity consumption away from peak periods, thereby improving reliability and lowering total system costs. To date, the ICI program has helped more than 200 of Ontario’s largest energy consumers save an average of 10 to 20 per cent on their electricity bills. These benefits help support large industrials and associated employment, and are central to Ontario’s economic plan to support an innovative and dynamic business climate.
The ICI is being expanded by lowering the threshold for qualifying industrial sectors from five megawatts (MW) to three. New eligible participants that opt in will begin receiving billing under the ICI starting July 1, 2015. Lowering this threshold will make more companies eligible for this rate mitigation program. This helps a wider array of businesses across the province save on the cost of electricity, especially medium-sized companies in the manufacturing, mining, quarrying, oil/gas extraction, refrigerated warehousing, greenhouse and data processing sectors.
Effective Regulation
An effective and streamlined regulatory environment is key to business efficiency and economic growth. The government continually reviews regulations to ensure they are appropriate and do not impose unnecessary burdens.
Reducing Business Regulation
The Better Business Climate Act, 2014, was enacted in December 2014. It will reduce unnecessary regulatory burdens and practices that cost businesses time and money. The Province’s target is to reduce compliance costs by $100 million by the end of 2017.
Under the Act, the Province is required to report every June on the progress of burden reduction activities undertaken by ministries. This builds on the government’s earlier initiatives that have resulted in eliminating 80,000 regulatory requirements, a 17 per cent reduction, since 2008.
Review of Business Legislation The government will undertake a comprehensive review of the Province’s corporate and commercial statutes to ensure Ontario has modern laws that facilitate an efficient market and prosperous business climate. Ontario has over a million active business corporations, with over 60,000 new corporations being created every year. While targeted legislation has been passed to modernize and respond to particular business needs, a comprehensive review of corporate and commercial statutes has not been undertaken in the past 10 years. This review strengthens Ontario’s competitive advantage in a global economy and supports a dynamic business climate. Through this review, the government will explore innovative business structures to solidify Ontario’s position as a jurisdiction of choice for new business, including for social entrepreneurs who are driving innovation and competing to attract investment globally. As an early priority, the government will take steps to enable the proclamation of the Ontario Not-for-Profit Corporations Act, 2010. |
Amending the Personal Property Security Act
The government will introduce an amendment to the Personal Property Security Act to remove the current five-year limit on the registration period with respect to collateral that is or includes consumer goods. If enacted, this would remove an unnecessary burden on Ontario businesses that must file one or more renewal registrations where the financing or lease transaction relating to consumer goods is longer than five years.
Managing Forfeited Corporate Property
The government intends to move forward with the introduction of proposed new legislation to support the efficient and effective management of forfeited corporate property. The Province comes into ownership of forfeited corporate property when a property-holding corporation ceases to exist because it has been dissolved, either of its own accord or by government action. Any property the corporation owns at the time it is dissolved forfeits to the government.
The new framework would help put properties back into productive use faster, save Ontarians money and strengthen corporate responsibility to benefit businesses and communities across Ontario.
Reviewing Labour Laws to Enhance Security and Competitiveness
Like most developed economies, Ontario has experienced significant changes in the workplace over the past several decades. These changes have included jobs shifting towards the services sector and an increase in non-standard employment. Dramatic technological change has become common in the workplace, affecting many routine-based jobs. As well, Ontario’s workforce itself has become more diverse.
In this environment, it is important to ensure that labour and employment laws are responsive — supporting the competitiveness of business while providing security for workers. That is why the government has initiated a review of Ontario’s labour and employment laws, including the Labour Relations Act, 1995, and Employment Standards Act, 2000. The Changing Workplace Review is being conducted by two Special Advisors who will lead public consultations, balance different perspectives about employment and labour law reform, and report back to the Minister of Labour. This will be the first step in identifying potential labour and employment law reforms that would help strengthen Ontario as a place to work and invest.
Ensuring Workplace Stability During Transition
The government remains committed to ensuring good relationships between unions and employers, and ensuring disputes between unions are handled as fairly as possible and with minimal interruption to workers, employers and the public. To that end, Ontario will propose to amend the Public Sector Labour Relations Transition Act, 1997, to reduce unnecessary strife by ensuring that when changes are made to the structure of public workplaces, workers undergo the disruption and expense of a vote only when there is a reasonable prospect of success. The Province will introduce a minimum threshold necessary to trigger a vote under the Act.
Modernizing Financial Services Regulation
Ontario’s financial services sector remains the Province’s second-largest sector after manufacturing, based on output. In 2014, the sector created jobs almost twice as fast as the overall Ontario economy.
The government will continue to strengthen the financial services sector, protect investors and consumers, and bolster the stability and efficiency of financial markets. In particular, the government plans to:
| › | Actively work with other jurisdictions to establish a Cooperative Capital Markets Regulatory System (CCMR) in Canada. |
| › | Review the regulation of financial advisers and planners. |
| › | Move forward with enhancing access to capital for businesses of all sizes and stages of development. |
| › | Carefully consider the recommendations of the five-year review of the Credit Unions and Caisses Populaires Act, 1994, when it is completed in the fall of 2015. |
| › | Conduct mandate reviews of the Financial Services Commission of Ontario, the Financial Services Tribunal and the Deposit Insurance Corporation of Ontario, and consider legislative changes to the governing acts. |
| › | Implement key recommendations from the five-year review of the Mortgage Brokerages, Lenders and Administrators Act, 2006, by strengthening fraud prevention measures in regulations and prohibiting advance fees for arranging mortgages of less than $400,000 — an increase from the current threshold of $300,000. |
| › | Propose future changes to update securities laws and related legislation, including: |
| › | Amendments to the take-over bid provisions in the Securities Act to harmonize with other Canadian jurisdictions and with the proposed approach under the CCMR; |
| › | Strengthened enforcement provisions, including in relation to insider trading and tipping, and more robust registration oversight tools, that are more harmonized with approaches in other CCMR-participating jurisdictions and the consultation draft Provincial Capital Markets Act; |
| › | Amendments to the Securities Act relating to cease trade orders to increase efficiency and harmonize with the approach in other jurisdictions; |
| › | Changes to give the Ontario Securities Commission (OSC) broader tools to ensure an accurate, reliable and transparent proxy voting infrastructure; and |
| › | Changes to the Securities Act and Commodity Futures Act that would increase the scope of OSC compliance and continuous disclosure reviews. |
| › | Propose technical changes to the Financial Services Commission of Ontario Act, 1997, and related acts to improve administrative clarity and effectiveness; and |
| › | Ensure an efficient and modern insurance system by repealing legislation, such as the Marine Insurance Act, that is no longer necessary and that is regulated by federal legislation. |
Establishing a Cooperative Capital Markets Regulatory System
Ontario is taking a leadership role, working with other provincial and territorial jurisdictions and the federal government, to achieve the milestones set out in the Memorandum of Agreement (MOA) Regarding the Cooperative Capital Markets Regulatory System (CCMR) that was released in September 2014. The MOA is the fundamental document that formalized the terms and conditions of the CCMR.
The CCMR, once implemented, would enhance Canada’s stature and competitiveness in global capital markets, which would in turn promote economic activity in all provinces and territories. The CCMR would also foster more effective regulation and enforcement through a strong and more competitive regulatory structure that would help grow business investment.
The participating jurisdictions are reviewing the comments received relating to the consultation drafts of the capital markets legislation and federal complementary legislation that were released in September 2014. It is expected that further CCMR-related developments will be announced and that draft initial regulations will be published for comment in the coming months.
Reviewing the Regulation of Financial Planning
The government is moving forward with its review of a potential regulatory gap in the general oversight of financial advisory and planning services. More tailored regulation of these increasingly vital services would foster the growth of the profession by promoting appropriate educational requirements and qualifications, and help consumers make informed choices and investments.
As announced in the 2014 Ontario Economic Outlook and Fiscal Review, the Province has appointed an expert committee to thoroughly consider more tailored regulation of financial advisers, including financial planners. The committee will be mandated to provide key recommendations and submit its final report to the government for review by early 2016.
Increasing Access to Capital
The government, together with the OSC, continues to foster a regulatory environment that accommodates newer ways for businesses to raise capital, while maintaining appropriate investor protection. The Minister of Finance recently approved several new prospectus exemptions proposed by the OSC that are designed to facilitate capital formation and job creation. The OSC is also expected to bring forward this year other proposed prospectus exemptions to facilitate capital raising, including a crowdfunding proposal.
Reviewing Ontario’s Legislative Framework for Credit Unions and Caisses Populaires
Following the launch of the five-year review of the Credit Unions and Caisses Populaires Act, 1994, in the fall of 2014, a number of steps have been taken to solicit public input. These will contribute to a comprehensive analysis of ways to improve the legislative and regulatory framework. Regional consultations were held in eight communities across the province, with over 220 participants from the sector and the public. As well, the public was invited to provide written comments on a consultation paper released in November 2014.
Laura Albanese, Member of Provincial Parliament and Parliamentary Assistant to the Minister of Finance, led the consultations and continues to lead the review. She is expected to submit a final report in the fall.
Reviewing the Mandates of Key Financial Services Regulators
The government has appointed an expert panel to lead the mandate reviews of the Financial Services Commission of Ontario, the Financial Services Tribunal and the Deposit Insurance Corporation of Ontario. The panel consists of:
| › | George Cooke — former president and chief executive officer of The Dominion of Canada General Insurance Company, and current chair of the board of directors of OMERS Administration Corporation; |
| › | James Daw — former Toronto Star personal finance columnist who has written extensively about all facets of Ontario’s financial system; and |
| › | Larry Ritchie — Osler, Hoskin & Harcourt llp partner and former vice-chair of the OSC. |
Work is currently underway and the panel will be conducting consultations this spring. The reviews will continue the government’s efforts to modernize financial services by ensuring that regulatory activities are carried out in the most appropriate and efficient manner, reflecting the complexity of this important sector. The reviews also benefit the financial services sector by ensuring that the mandates of each agency remain flexible in a changing environment.
The mandate reviews also provide an opportunity to improve public administration by bolstering the Province’s commitment to enhancing oversight and risk management in the agencies sector.
The expert panel will deliver its recommendations to the government by early next winter.
Investments in Tourism and Culture
400th Anniversary of the Francophone Presence in Ontario
In 2015, the province is celebrating the 400th anniversary of the Francophone presence in Ontario. The government has committed $5.9 million to support a wide range of initiatives that will help mark the anniversary of Samuel de Champlain’s passage through the province and highlight the important role of Franco-Ontarians in the province’s history and development. These include local and regional events that celebrate Franco-Ontarian culture, refurbishing a park in the Town of Penetanguishene, and commemorative plaques marking de Champlain’s journey. Community organizations, municipalities and others are also planning a variety of activities, including festivals, concerts and museum collections that will attract tourists, contribute to the economy, and leave a notable legacy. Celebrations will take place in communities throughout the summer and fall of 2015, including at the 2015 Pan/Parapan American Games in Toronto.
150th Anniversary of Confederation
On July 1, 2017, Canada will celebrate the 150th anniversary of Confederation. This milestone provides an opportunity for celebration, commemoration, and looking forward to Canada’s collective future. The government will engage Ontarians to share ideas for commemoration and will work collaboratively to make Canada’s 150th birthday an occasion for pride and celebration across the province.
2015 Pan/Parapan American Games
The 2015 Pan/Parapan American Games will be the largest multi-sport event ever held in Canada. This summer, Toronto will be the proud host city of the Pan Am Games from July 10 to 26 and the Parapan Am Games from August 7 to 15.
Toronto, partner municipalities and First Nation communities in the Greater Golden Horseshoe region will welcome more than 10,000 athletes, coaches and delegates from the Caribbean and Central, South and North America. Athletes will compete in 51 sports at more than 40 venues, spread across several municipalities.
The Games will showcase Toronto and Ontario to an international audience, attracting tourists, jobs and new business investments. The Games are expected to generate more than 26,000 new jobs, boost GDP by $3.7 billion and attract over 250,000 tourists. Beyond 2015, the Games will provide housing, transportation, sport, educational, accessibility and recreational legacies for decades to come.
2016 FINA World Championships
The City of Windsor will host the 13th Fédération Internationale de Natation (FINA) World Swimming Championships (short-course) from December 7 to 11, 2016. The Province will support the event with an investment of $2.5 million over the next two years. The short-course international swimming event is expected to draw approximately 2,500 visitors, including more than 700 athletes from around the world, and will showcase the region’s vitality, diversity and hospitality. This will be the first time this event has been held in Canada, and the first time since 2004 that it has been held in North America.
Continuation of the Ontario Music Fund
Ontario has the largest music sector in Canada and one of the most diverse in the world. To support the development of strong, competitive and sustainable music companies, the Province established the Ontario Music Fund in 2013 as a three-year program. The Fund is aimed at strengthening Ontario’s music industry while advancing live music and creating opportunities for emerging artists. By supporting activities that contribute to a thriving music sector, the Fund helps position the province as a leading global destination to record and perform music. Support from the Fund’s first year has already helped to create or retain 2,000 jobs and produced $24 million in additional revenue for music-related businesses.
With the Music Fund now successfully in place and meeting the needs of Ontario’s music industry, the government is committing to the continuation of the $15 million per year Fund.
Interactive Digital Media Fund
The Province will invest $6 million in 2015–16 and $10 million per year starting in 2016–17 in a renewed Interactive Digital Media (IDM) Fund to help support some co-production opportunities and activities that would not be eligible for the Ontario Interactive Digital Media Tax Credit (OIDMTC) after the proposed changes described in Chapter IV: A Fair and Sustainable Tax System. Through the redesign, Ontario will ensure that the Fund will continue to support early product development, intellectual property investment, and company incubation, while also broadening its scope to include co-productions and magazines. This investment is made possible by the savings from the proposed changes to the OIDMTC.
Established in 2005, the IDM Fund is a grant program that supports Ontario-based IDM companies by providing access to the final piece of funding required to move content projects into production. The IDM Fund has provided $19 million since 2005 to support 169 projects. This investment has resulted in more than $56 million in product revenues and supported more than 950 highly skilled jobs.
Enabling Long-Term Success for Ontario’s Horse Racing Industry
The horse racing industry is vital to rural communities across Ontario and is an important part of Ontario’s rich heritage. The industry supports rural jobs and economic development in the agricultural sector, particularly as they relate to the horse breeding sector.
Recognizing this, in June 2012, the government established a panel to determine how best to modernize the industry. After extensive and productive consultations with stakeholders and the public, the panel’s final report, released in October 2013, included a number of key recommendations.
Informed by the panel’s recommendations, the government created the Horse Racing Partnership Plan (HRPP) and raised the investment in this plan to $500 million over five years. The HRPP is the government’s plan to support a world-class horse racing industry in the province, and reflects the willingness of many in the industry to build a new partnership with government and work together to ensure long-term success.
As part of the HRPP, the government directed the Ontario Lottery and Gaming Corporation (OLG) to integrate horse racing into its gaming strategy, as permitted under existing statutory authorities. The industry has much to contribute to the Province’s gaming strategy — offering available facilities, an established customer base and the name recognition of internationally known horse races such as the annual Queen’s Plate.
The government is committed to strategically realigning Provincial horse racing regulation, adjudication and funding within government and agencies. Strengthening collaboration between industry and government is important to the industry’s long-term sustainability, recognizing its role in both rural and urban Ontario.
In 2015–16, the government will propose legislative changes to a number of statutes. If passed, these changes would integrate support for provincial horse racing within OLG’s mandate and transfer the Province’s regulatory responsibilities for horse racing to the Alcohol and Gaming Commission of Ontario. This could involve development of a new statute and potential changes to the following:
| › | Ontario Lottery and Gaming Corporation Act, 1999; |
| › | Alcohol and Gaming Regulation and Public Protection Act, 1996; |
| › | Licence Appeal Tribunal Act, 1999; |
| › | Ministry of Agriculture, Food and Rural Affairs Act; and |
| › | Racing Commission Act, 2000. |
The government will also be looking to the industry for leadership and continued collaboration. The industry may, in future, manage industry programs while championing the interests of all its members and customers, and providing non-binding advice to the Province and its agencies.
The government is working aggressively on these changes as part of the framework to support the long-term success of the horse racing industry.
Supporting the Agriculture and Agri-Food Sector
Ontario’s agri-food sector, including both agricultural production and food processing, supports over 780,000 jobs and $34 billion in economic activity.
The Province’s suite of business risk management programs helps farmers manage risks beyond their control, like fluctuating costs and market pricing. The government continues to support farmers through these programs and, through Agricorp, make changes to ensure it is meeting the needs of Ontario’s producers. Going forward, the Province will ensure that production insurance programs provide the funding and support that farmers need to mitigate risk.
The Premier’s Agri-Food Challenge Ontario’s diverse and dynamic agri-food sector, which ranges from farming and food processing to wholesale and retail food services, continues to advance. In October 2013, the Premier challenged the sector to double its growth rate and create more than 120,000 jobs by 2020. The industry is responding and making progress on these goals. Between 2013 and 2014, the agri-food sector created over 17,000 net new jobs, with total employment rising to over 780,000, and exports from the sector increased by 5.5 per cent to almost $12.5 billion. |
Tackling Climate Change
The environmental, social and economic challenges of climate change are a global issue. Similar to many other jurisdictions, Ontario has endured the effects of climate change, including recent extreme weather events such as ice storms, severe thunderstorms and flash flooding. These events have caused unprecedented damage to the places Ontarians live, work and play, costing governments, businesses and families hundreds of millions of dollars.
The government is committed to tackling climate change and recognizes the importance of acting now to ensure a prosperous economic future and a flourishing society. If local and broader action is not taken, the Province will see more frequent and severe weather events that will threaten its infrastructure and economy. A changing climate will also pose risks to biodiversity, agriculture, and the health and well-being of all Ontarians. Addressing these challenges will open up many new opportunities to grow the economy in a sustainable way.
As the world gains more momentum in addressing climate change, an enormous economic opportunity has emerged for low-carbon production and services. This is an opportunity that Ontario, with its many strengths, is well positioned to take advantage of to maintain its leading role.
Ontario has already demonstrated leadership in response to this challenge. In 2007, Ontario established concrete targets for reducing emissions by six per cent below 1990 levels by 2014, 15 per cent by 2020 and 80 per cent by 2050. The Province has taken a significant step by successfully ending coal-fired electricity generation. Eliminating emissions from coal-fired electricity generation played a large role in helping the government exceed its 2014 target, and is the single largest climate initiative in North America to date.
An End to Coal-Fired Electricity Generation in Ontario In April 2014, as the Thunder Bay Generating Station — the province’s last coal-fired power plant — burned its last supply of coal, Ontario fulfilled its commitment to end coal-fired generation before its target of the end of 2014. Coal has been replaced by a mix of refurbished nuclear, natural gas, renewables and conservation. Eliminating coal- fired electricity generation represents a reduction of 30 megatonnes of greenhouse gas emissions annually. In 2014, about 90 per cent of the electricity generated in Ontario came from emission-free sources. The proposed Ending Coal for Cleaner Air Act, 2014, will protect the health, environmental and climate change benefits of ending coal use by ensuring that coal-fired electricity generation will never happen again. |
Many of Ontario’s energy-intensive industries that produce raw materials, such as cement, are also leading the way in reducing the use of fossil fuels by switching to alternative low-carbon fuels. As well, Ontario businesses in the clean technology sector, including firms providing water and wastewater solutions, environmental engineering, recycling and composting, and power generation such as wind and solar, are all helping the province advance towards a low-carbon economy.
The government has been working for a number of years to create a culture of energy conservation and develop clean energy sources. Its aggressive conservation efforts, including improvements to building codes and time-of-use electricity rates, are helping families, schools, hospitals, businesses and other public institutions reduce their energy bills while contributing to a cleaner environment. Since 2003, the government has ensured that over one-third of its new electricity generation capacity, over 6,000 megawatts, is from wind, solar and other renewable energy sources.
In November 2014, Ontario and Quebec signed a Memorandum of Understanding (MOU) to collaborate on concerted climate change actions. The MOU recognizes the significant threat of climate change to the development and security of individuals, communities and states, and recognizes the need for jurisdictions to work together to fight climate change and its impacts. Subsequently, Ontario also issued a joint statement with California, Quebec and British Columbia, identifying climate change as a serious environmental and economic threat, and resolving to work together towards greenhouse gas reduction goals.
In February 2015, the government released a climate change discussion paper and held broad public consultations, asking all Ontarians to participate in the creation of the vision and guiding principles for Ontario’s transition towards a low-carbon economy. The discussion paper provides an overview of the opportunities and actions needed, including:
| › | Short-term climate-critical actions: Taking action now in certain policy areas will help Ontario achieve its 2020 emissions target. This includes strengthening conservation, supporting technological innovation and implementing emissions-reduction measures. These actions will also lay the foundation for long-term change. |
| › | Long-term transformational actions: The economies of China, India, the United States and the European Union are all investing in a low-carbon future. To build on the leadership it has already demonstrated, Ontario needs to be part of this global transformation to build a strong low-carbon economy that is sustained by clean energy sources, robust infrastructure and well-built communities. |
Building on this, Ontario intends to join Quebec and California in moving forward with a cap-and-trade system as its carbon pricing mechanism. Cap-and-trade is a way of incorporating a price on carbon into business and household decision-making. The government is able to set an overall emission limit (the cap) on those facilities included in the program, providing certainty for emission reduction, rewarding innovative companies and creating more opportunities for investment in Ontario. Under this system, businesses will have their own greenhouse gas quota and will then be able to sell (trade) their quota if they are under their emitting limit.
The government recognizes that Ontarians want a balanced approach — one that protects the environment and economy, now and in the future. It also recognizes that the fight against climate change requires a range of initiatives, which is why, in the fall, Ontario will release a comprehensive strategy to address climate change.
The Province will consult throughout the summer, listening to experts, industry and environmental groups, as it develops the design of a cap-and-trade program. A variety of options will be considered to determine what works best for Ontario’s unique circumstances and how Ontario could link the province with the cap-and-trade program already in place between Quebec and California. Part of this plan will be to ensure that the proceeds from a cap-and-trade program would be directed towards key priorities that will help lower greenhouse gas emissions and help businesses remain competitive, which could include:
| › | Research and development of new and innovative green technology solutions; and |
| › | Increased energy efficiency in homes, buildings and automobiles. |
The consultations will also inform the initiatives that make up the comprehensive climate change strategy.
Growing Businesses in the North
Northern Ontario is the largest region in Ontario, with vast, diverse landscapes and a wealth of natural resources. The government recognizes the unique economic climate of the north and continues to ensure the needs of northern Ontarians are met while helping contribute to the region’s long-term sustainability and prosperity. The Northern Ontario Heritage Fund Corporation (NOHFC), for example, helps northerners invest in innovative technologies, infrastructure and economic development capacity. The Province understands the economic importance of traditionally strong sectors such as mining and forestry. That is why Ontario continues to help these industries develop, innovate and create jobs in the 21st century.
Ring of Fire The Ring of Fire, located 540 kilometres northeast of Thunder Bay, has chromite and nickel deposits estimated to be of $60 billion value. The 2014 Budget committed up to $1 billion towards strategic transportation infrastructure development in the Ring of Fire region. In the summer of 2014, the government established the Ring of Fire Infrastructure Development Corporation to create partnerships with industry and First Nation communities to facilitate investment decisions in strategic transportation. See Chapter III: National Leadership — Strong Ontario, Strong Canada for more details about the Ring of Fire. |
Renewing Ontario’s Mineral Development Strategy
Ontario is a global mining hub and the largest mineral producer in Canada, with the value of mineral production reaching $11 billion in 2014. To further strengthen its position as a world leader in mining, the Province released a discussion paper on March 2, 2015, to renew its Mineral Development Strategy. The government is currently consulting with industry, Aboriginal communities and other interested parties for their input on addressing key challenges and opportunities. A renewed strategy is expected to be released later this year.
Forest Access Roads
The government is moving forward with its commitment to the forest industry, and will be investing $60 million in the Forest Access Roads Program for 2015–16. This investment will create safer roads and allow industry greater access to forestry resources, which will in turn create jobs and economic growth.
Continued Electricity Support for Northern Industries
To ensure northern industries remain competitive, the government introduced the Northern Industrial Electricity Rate (NIER) Program in the 2010 Budget. It was a three-year, $150 million annual initiative that allowed qualifying large industrial facilities in northern Ontario to reduce their electricity prices by two cents per kilowatt hour, thereby sustaining jobs and maintaining global competitiveness. In December 2012, having created or sustained 16,000 jobs at 24 mining and forestry facilities through NIER, the government announced its extension, investing $120 million per year over three years to March 31, 2016.
Building on this success, the government is committing to ongoing support for northern industrial facilities beyond March 2016, with continued investment of up to $120 million annually. The government will undertake a review of the efficiency and effectiveness of the program and options for a sustainable approach. This will support and retain large electricity users, as well as promote competitiveness and jobs in northern Ontario for the benefit of all Ontarians.
Supporting Northern Municipalities through the Ontario Municipal Partnership Fund
The Province will enhance the Ontario Municipal Partnership Fund (OMPF) to further support northern municipalities with their unique challenges by increasing the Northern Communities grant component by $5 million in 2016. This will increase the amount of funding dedicated to the north through this component of the OMPF to $84 million, providing more funding for northern municipalities to invest in infrastructure and other key priorities for their communities. As a result, the OMPF will total $505 million in 2016.
Section E: Strengthening Retirement Security
Introduction
After a lifetime of hard work, Ontarians deserve a secure retirement. However, retirement security is becoming harder to attain. For many workers in today’s economy, long-term, full-time employment with pension benefits is elusive. Many Ontarians must save and invest on their own, forcing them to deal individually with the complexities of stock markets, interest rates and currency fluctuations. As well, all Ontarians will face greater financial uncertainty due to the prospect of living longer.
Evidence shows that many Ontarians are not saving adequately for retirement. Unless action is taken now, retirement savings challenges will likely worsen over time.
Ontario needs a system that helps individuals maintain their standard of living in retirement. A better retirement income system would also support the prosperity of the province as a whole. Increased retirement savings would contribute to higher investment and stronger economic growth over the long term.1 As well, growth in retirement savings would lead to higher incomes and consumption for retirees, and help the Ontario economy better cope with an aging population.
That is why strengthening retirement security is a key pillar of the government’s four-part economic plan, as outlined in the 2014 Budget. Highlights of the plan are:
| › | Creating the Ontario Retirement Pension Plan (ORPP) to provide a predictable, lifelong stream of retirement income to eligible Ontarians; |
| 1 | Evidence over the past several decades for advanced economies suggests that in spite of international capital mobility, domestic saving rates are highly correlated with domestic investment rates. David A. Dodge and Richard Dion, “Macroeconomic Aspects of Retirement Savings,” Bennett Jones llp (April 2014). |
| › | Taking measures to help Ontarians obtain the best financial advice possible in managing their self-directed retirement savings and providing a wide range of savings options; and |
| › | Implementing initiatives to strengthen and modernize workplace pension plans. |
The government has taken the following decisive actions to fulfil the commitments made in the 2014 Budget:
| › | In December 2014, the government introduced the proposed Ontario Retirement Pension Plan Act, 2014, and released a consultation paper outlining key ORPP design questions. In early 2015, the Associate Minister of Finance, the Honourable Mitzie Hunter, hosted consultations in 10 communities across the province to discuss the future of the retirement income system and how to create the best possible plan for Ontarians. |
| › | In December 2014, the government introduced the proposed Pooled Registered Pension Plans Act, 2014. This statute would, if passed, provide a legal framework for the creation of pooled registered pension plans (PRPPs) in Ontario. Pooled registered pension plans would give employees and the self-employed a new type of voluntary, low-cost, tax-assisted option to help increase retirement savings. |
| › | In July 2014, the Building Opportunity and Securing Our Future Act (Budget Measures), 2014, amended the Pension Benefits Act (PBA) to provide a legislative framework for the voluntary conversion of public-sector, single-employer pension plans into jointly sponsored plans. Joint sponsorship provides for shared governance and risk among employers and plan members, thereby potentially enhancing affordability and sustainability. |
As part of its continuing progress to enhance retirement income security for all Ontarians, the government announces the following measures in this Budget:
| › | The government is introducing legislation that would, if passed, create an arm’s-length entity to administer the ORPP. The proposed legislation reflects best practices of good governance and would be based on key principles of independence, accountability, transparency and cost-effectiveness. |
| › | The government has appointed an expert committee to thoroughly consider more tailored regulation of financial advisers, including financial planners. By enhancing regulation of the financial advice sector, the government can help consumers build a more secure retirement future in relation to their savings, investments and other financial choices. |
| › | The government is introducing legislation that would, if passed: |
| › | Enable the payment of variable benefits directly from defined contribution pension plans, thereby increasing portability and withdrawal options for qualifying plan members and retirees; and |
| › | Extend the deadline for consolidating “split pensions” from July 1, 2016, to July 1, 2017. |
The Need for Action to Enhance Retirement Savings
Recent studies by The Conference Board of Canada, Manulife Bank of Canada and RBC show that a significant number of Canadians are concerned that they will not have sufficient income for their retirement years.2 A Sun Life Financial report also shows that 36 per cent of working Canadians are not confident about having enough money to enjoy the lifestyle they want in retirement, compared to 20 per cent of current retirees.3
These concerns reflect the economic and social changes taking place in the province, which underpin the need to enhance retirement savings.
| 2 | The Conference Board of Canada, “A Survey of Non-Retirees and Retirees in Canada: Retirement Perspectives and Plans,” (October 27, 2014); Manulife Bank of Canada, “Manulife Bank Debt Survey,” (Fall 2014); and RBC, “25th Annual RRSP Poll,” (2015). |
| 3 | Sun Life Financial, “Sun Life Canadian Unretirement Index Report,” (2015). |
A Changing Labour Market
In today’s workforce, people change jobs and employers frequently. It is estimated that, on average, workers can expect to change employers about five times throughout their careers.
A mobile workforce makes consistent participation in a workplace pension plan more difficult because most workplace pension plans, where they exist, are specific to an employer. Even individuals participating in generous workplace pension plans at any one point in their careers may not be covered under such plans through to retirement.
The modern workforce is also characterized by an increase in non-standard employment, which includes temporary work, part-time work and holding multiple jobs. Between 1997 and 2014, non-standard employment in Ontario grew at an average annual rate of 2.4 per cent, nearly double the growth rate of standard employment during this same period. The long-term growth of non-standard employment has been driven largely by increasing temporary employment, which has grown at an annual rate of 3.5 per cent.
Workers in non-standard employment, particularly temporary workers, may find it difficult to access workplace pension plans.4 In 2013, only 35 per cent of Ontario workers participated in a workplace pension plan. Pension coverage is even lower for younger workers — in 2012, only about one-quarter of workers aged 25 to 34 participated in workplace plans, compared to nearly half of workers aged 45 to 54.5
| 4 | Katherine Marshall, “Benefits of the Job,” Statistics Canada: Perspectives on Labour and Income (2003); and Andrea Noack and Leah Vosko, “Precarious Jobs in Ontario: Mapping Dimensions of Labour Market Insecurity by Workers’ Social Location and Context,” Law Commission of Ontario (2011). |
| 5 | Statistics Canada (2015). Special tabulation based on the 2012 Longitudinal and International Study of Adults. |
In this context, it is important to note that the benefits provided by the Canada Pension Plan (CPP) and Old Age Security (OAS) are simply inadequate to meet the retirement income needs of many Ontarians. The CPP replaces 25 per cent of an individual’s earnings up to a maximum earnings level, which currently is $53,600. The current annual maximum CPP benefit is about $12,800 per year, but in 2014 the average CPP annual benefit was only about $6,900 in Ontario. When combined with that year’s average OAS benefit to Ontario’s seniors, this amounted to about $13,100 per year.
These modest benefits contribute to the undersaving problem faced by so many Ontarians, and further underscore the need for improved access to workplace pension plans.
Without action, there is potential for a growing disparity between those who are well prepared for retirement and those who are not. This is of special concern for today’s younger workers, who are at particular risk of being ill prepared for retirement.
Non-Standard Employment Non-standard employment is common among a significant portion of the Ontario workforce. In 2011, among workers aged 18 to 64, about one in five held more than one job throughout the year and one in five was employed part time. |
Longer Lifespans
Average lifespans are increasing and this trend is likely to continue. Half of Canadians who are 20 years old today are expected to reach age 90, and one in 10 is expected to live to 100.6 While increasing life expectancy is a sign of higher living standards, it puts greater pressure on savings to provide sufficient income for Ontarians throughout their retirement years.
Without action to enhance access to retirement savings vehicles that provide a steady stream of payments for life, an increasing number of Ontarians may face greater financial uncertainty in their retirement due to the prospect of outliving their savings.
Low Personal Savings
Experts generally recommend that individuals aim to replace 50 to 70 per cent of their pre-retirement income to maintain a similar standard of living in retirement. However, a number of studies show that many people are not saving enough to meet this goal. The percentage of households not saving sufficiently ranges from approximately 15 to 50 per cent.7
With declining access to workplace pension plans, personal savings become even more important in preparing for retirement. However, many families without workplace pension plans are not compensating for their lack of pension coverage by utilizing voluntary savings vehicles. For example, in 2012, even when accounting for differences in income levels, Ontario families without workplace pension plan assets were less likely than those with them to hold various types of assets for retirement, including investments, registered retirement savings plans (RRSPs) and real estate.
| 6 | Office of the Chief Actuary, “Mortality Projections for Social Security Programs in Canada,” Actuarial Study No. 12, Office of the Superintendent of Financial Institutions Canada (April 2014). |
| 7 | Keith Horner, “Retirement Saving by Canadian Households,” (2009); McKinsey & Company, “Building on Canada’s Strong Retirement Readiness,” (2015); Kevin D. Moore, William Robson and Alexandre Laurin, C.D. Howe Institute, “Canada’s Looming Retirement Challenge,” (2010); Michael C. Wolfson, “Projecting the Adequacy of Canadians’ Retirement Incomes,” (2011); and CIBC, “Canadians’ Retirement Future: Mind the Gap,” (2013). |
| | The variation in results is due to the different methodologies and assumptions (e.g., definition and level of target replacement rates, potential sources of retirement income, age and income groups) used in each study. |
Many Ontarians do not take full advantage of voluntary individual retirement savings vehicles. In 2013, there was approximately $790 billion in unused RRSP room in Canada, including about $300 billion in Ontario alone.
Savings Are Important to Ontario’s Economy
Ontario’s retirees will become a growing share of the population, a trend that will have a significant impact on the economy in the future. It means that there will be fewer people of working age to support each senior, putting pressure on younger workers to support health care and other services for seniors.
Without adequate retirement incomes, as individuals age, their consumption of goods and services could decline, which would dampen economic growth. Increasing retirement savings today would, over the longer term, help ensure that future seniors have greater income security in their retirement. This would allow future retirees to maintain their consumption of goods and services and enhance growth in employment and the economy.
As noted by David Dodge, former Governor of the Bank of Canada, and Richard Dion, Senior Business Advisor at Bennett Jones llp, improving productivity is an important way to foster economic growth and address the demographic challenge. Enhancing productivity requires greater investments in Ontario’s people, equipment and infrastructure. An effective way to finance these investments would be through an expeditious and sustained increase in the household savings of the current working population.8 | 8 | David A. Dodge and Richard Dion, “Macroeconomic Aspects of Retirement Savings,” Bennett Jones llp (April 2014). |
A Strategy to Enhance Retirement Savings
The government is continuing to move forward with its 2013 commitment to ensure a strong retirement income system through a three-pronged approach, focused on:
| › | A new Ontario pension plan; |
| › | Ontarians with self-directed retirement savings; and |
| › | Ontarians with workplace pension plans. |
A New Ontario Pension Plan
Unless action is taken now, saving adequately for retirement will likely become more difficult over time. That is why, as first announced in the 2014 Budget, the government is moving forward with a new mandatory provincial pension plan — the Ontario Retirement Pension Plan (ORPP). Designed for today’s changing labour market and mobile workforce, the ORPP would be a significant step forward in addressing the retirement savings challenge by helping ensure Ontario’s workers have a secure retirement income foundation.
The ORPP would build on the strengths of the CPP and would:
| › | Offer a predictable stream of income in retirement for life, and index benefits to inflation; |
| › | Aim to replace 15 per cent of an individual’s pre-retirement earnings up to $90,000 (in 2014 dollars); |
| › | Require contribution rates to be the same for employers and employees, with a maximum combined rate not exceeding 3.8 per cent; and |
| › | Require benefits to be earned as contributions are made, to ensure that younger generations would not pay additional costs associated with older workers’ benefits. |
Through mandatory contributions, the ORPP would provide a secure retirement income foundation for eligible Ontario workers. The ORPP is intended to complement workplace and other voluntary retirement savings arrangements that will continue to play a critical role in helping Ontarians maintain their standard of living in retirement.
The Proposed Ontario Retirement Pension Plan Act, 2014
On December 8, 2014, the government introduced Bill 56, the Ontario Retirement Pension Plan Act, 2014 (the “proposed ORPP Act”). The proposed ORPP Act lays the foundation for the plan including:
| › | A commitment to establish the ORPP by January 1, 2017; |
| › | Key plan design parameters, such as participation, contribution and benefit requirements; and |
| › | A requirement to establish an entity to administer the ORPP, including enrolling eligible employees and employers, collecting and investing contributions, and administering benefits. The proposed ORPP Act requires the administrative entity to hold the ORPP funds in trust for beneficiaries, separate from the Consolidated Revenue Fund. |
Before January 2017, the Province will also introduce legislation that would finalize details of the plan, based on extensive actuarial and legal analysis and ongoing engagement with Ontarians.
Key Design Questions
In December 2014, the government also released a consultation paper on three key ORPP design questions, including:
| › | Scope of the Plan: Whether to exclude participants in defined benefit (DB) pension plans, target benefit multi-employer pension plans (MEPPs), defined contribution (DC) pension plans, pooled registered pension plans (PRPPs), group registered retirement savings plans (RRSPs) and deferred profit sharing plans from enrolment in the ORPP; |
| › | Minimum Earnings Threshold: Whether to mirror the CPP’s minimum earnings threshold of $3,500, below which contributions would not be made; and |
| › | Supporting the Self-Employed: How to support the self-employed in achieving retirement income security, given their exemption from the ORPP as a result of the current rules relating to registered pension plans under the federal Income Tax Act (ITA). |
To help shape the Province’s approach to these key areas, Associate Minister of Finance Mitzie Hunter led an extensive consultation process with business, labour, associations, young workers, pension experts, individuals and families from across Ontario. In early 2015, the government heard from a wide range of stakeholders through:
| › | Regional and community roundtables in 10 locations across Ontario; |
| › | Sector-specific roundtables consisting of low-income stakeholders, not-for-profit associations, businesses, young professionals and the self-employed; |
| › | Ongoing dialogue with technical experts and advisers, including the Technical Advisory Group on Retirement Security, David Dodge, and Michael Nobrega, former president and chief executive officer of OMERS (Ontario Municipal Employees Retirement System) and Implementation Lead for the ORPP; and |
| › | Over 1,000 written submissions from individuals, businesses and organizations. |
The government is considering feedback from the consultations and considering further analysis, as described below. It will announce its conclusions on the key design questions shortly.
Scope of the Plan
The ORPP is being designed to reflect the results of research, consultation and analysis of the CPP, and to incorporate the key features of a strong pension plan, including:
| › | A lifetime benefit, addressing the risk of individuals outliving their savings by providing a predictable stream of income for life; |
| › | A benefit that is indexed to inflation, to protect the purchasing power of the benefit throughout retirement; |
| › | Mandatory employer contributions, reflecting a shared responsibility for retirement security and the benefit of higher retirement income levels to businesses, the broader Ontario economy and society; |
| › | Pooled investment risk, allowing individuals to share the risk of lower-than-expected market returns or a sudden and unexpected market downturn either before or during retirement; and |
| › | Locked-in funds, to ensure that savings are available in retirement and are not compromised by shorter-term financial pressures. |
The consultation paper proposed a potential exemption for individuals already participating in workplace pension plans that replicated to the greatest extent the ORPP’s proposed key features — specifically DB plans and target benefit MEPPs.
Feedback from Consultations
A variety of different views on the issue were expressed, highlighting many important considerations.
The benefits of a broad-based ORPP participation model, with no exemptions for existing workplace pension plans, were emphasized by some stakeholders. This approach would align most closely with the CPP, provide the most continuous coverage across employers, and offer the greatest protection against risk for the broadest possible membership. Administrative efficiency for employers and for the ORPP plan administrator was also highlighted.
It was noted that an approach that provides the broadest possible coverage for workers in every situation and at every stage of their working lives would also contribute to a large, stable membership of the ORPP. This approach would promote cost-effectiveness, enable better investment and contribute to the overall health of the plan. In turn, this would help ensure that it is available for generations to come.
In contrast, other stakeholders focused on the important features of capital accumulation plans (CAPs), including DC plans and group RRSPs. For example, employers take pride in the retirement savings options they offer their workers, highlighting that many CAPs include significant contributions from employers and result in generous benefits. They cited the importance of options that involve a degree of individual choice and responsibility with respect to how to invest and access retirement savings.
Some also commented that ORPP contributions may require adjustments to overall compensation and existing benefit offerings. They emphasized that it will be important to consider the impact of the ORPP not in isolation, but as part of Ontario’s overall approach to building an attractive business climate. In addition, these stakeholders noted that Ontario employers should be treated fairly and not incur competitive disadvantages on the basis of the retirement savings vehicles they provide for their employees.
Discussions highlighted that the financial services sector is thinking creatively to improve offerings for employees and employers in response to long-standing retirement income issues, and to tackle new challenges arising from the changing retirement savings landscape. Ontario has built world-class financial services that should be leveraged in considering ORPP design.
Feedback from the consultations also indicated that individuals and families want to increase their knowledge about the retirement savings landscape in general, noting the importance of financial literacy, and to understand what different plan design parameters might mean for them.
Most importantly, it was clear that individuals, businesses, communities, families and associations want to be part of the process and to continue to help shape the plan.
Moving Forward on Plan Scope
The extent and variety of feedback from these consultations highlight the complexity of this issue. They also highlight the need for further analysis and dialogue to determine how best to meet the government’s objective of strengthening the retirement income foundation for Ontarians through the ORPP.
Minimum Earnings Threshold
Under the CPP, employers and employees make contributions on annual earnings above $3,500 up to a maximum pensionable earnings threshold that now stands at $53,600. In the 2014 Budget, the government committed to consult on whether to mirror the CPP’s $3,500 minimum earnings threshold in the ORPP.
The minimum earnings threshold for the ORPP needs to balance a number of important considerations, including:
| › | Ensuring that, in the context of a mobile workforce with greater non-standard employment, workers have access to opportunities to save for retirement: a higher threshold would exclude those part-time and temporary workers whose total earnings are below it; |
| › | Opportunities to maximize workers’ ability to benefit from the plan: a low minimum earnings threshold would allow workers experiencing temporary periods of low earnings to continue to accumulate benefits for those periods, and would allow many individuals holding multiple jobs to contribute on a greater portion of their total earnings; |
| › | The administrative impact on employers: given that employers already have systems in place to administer CPP contributions, mirroring its $3,500 minimum earnings threshold would help reduce the complexity of payroll deductions; |
| › | The impact of contributions on today’s low-income workers: it is important to recognize the impact of both employee and employer contributions on wages and hiring patterns; and |
| › | The impact of benefits on tomorrow’s low-income seniors: benefits from the federal Guaranteed Income Supplement (GIS) and the Ontario Guaranteed Annual Income System (GAINS) are reduced for every dollar of additional income a senior receives from the CPP, the Quebec Pension Plan, potentially the ORPP, and other sources; as such, some workers who contribute to the ORPP might not fully realize these benefits when they retire. |
The federal Guaranteed Income Supplement (GIS) is an income-tested program that provides financial support to low-income seniors. It consists of a basic benefit and an additional top-up benefit for those recipients with the lowest incomes. Combined, the GIS provided a maximum annual benefit of about $9,050 to single seniors and about $12,000 to senior couples in 2014. The basic GIS benefit is reduced by 50 cents for every dollar of household private income. The top-up benefit is reduced by 25 cents per dollar, starting at $2,000 for single seniors and $4,000 for couples. The Ontario Guaranteed Annual Income System (GAINS) provides a maximum annual benefit of $996 to seniors with the lowest incomes. It is a provincial top-up to the federal Old Age Security (OAS) and GIS. GAINS is reduced by 50 cents for every dollar of household private income. To be eligible for GIS and GAINS benefits, individuals must be receiving OAS. |
Feedback from Consultations
The government held consultations to help inform the discussion regarding a minimum earnings threshold. The discussion paper released by the government to support these consultations notes that:
| › | Most workers with low earnings in a particular year will not experience persistently low earnings over their entire career and do not belong to a low-income household; |
| › | Periods of low earnings during working years do not necessarily indicate whether a worker will receive the GIS in retirement; and |
| › | A high minimum earnings threshold would prevent low earners from participating in the ORPP and many workers holding multiple jobs from accumulating benefits on a large portion of their earnings. |
Many anti-poverty advocates and community groups and some policy experts highlighted the importance of a low minimum earnings threshold to ensure that workers in multiple jobs, or part-time or temporary work, benefit as much as possible from the ORPP. They emphasized the particular challenges faced by recent immigrants, persons with disabilities and youth, who face barriers to securing jobs with workplace pension benefits.
Employers in some sectors called for a high minimum earnings threshold, pointing out that a low threshold would significantly impact their costs, which could affect compensation and hiring decisions.
Some employers have also suggested that requiring all employees to contribute to the ORPP could create barriers to employment for younger workers and others entering the labour market.
Moving Forward on the ORPP Minimum Earnings Threshold
The consultations highlighted the balance that must be achieved between ensuring that all workers have adequate retirement income security and ensuring that long-term low-income workers are not adversely affected by saving more for retirement. Further analysis and dialogue are needed to determine how best to achieve that balance and what, if any, additional measures may be required to assist current low-income workers (for example, through an enhancement to the federal Working Income Tax Benefit) and future low-income seniors. Further discussion with respect to impacts on employers will also be critical.
Call for an Enhancement to the Federal Working Income Tax Benefit While the government has already taken steps to improve income security for low-income Ontarians through the Poverty Reduction Strategy, further supports are needed. That is why the Strategy calls for an enhancement to the federal Working Income Tax Benefit (WITB), a refundable tax credit intended to supplement the incomes of working individuals and families. An enhancement to the WITB would provide additional support to low-income workers so they could better manage their living expenses, while helping them save for their retirement through the ORPP. Ontario is not alone in calling on the federal government to take action; the House of Commons’ Standing Committee on Finance has also recommended: That the federal government formally review the Working Income Tax Benefit to determine how it could be expanded or modified to further benefit Canadians and further incent workforce attachment, subject to the government’s stated intention to balance the budget in the medium term. “Income Inequality in Canada: An Overview,” Report of the Standing Committee on Finance (2013). |
Supporting the Self-Employed
The self-employed occupy a unique position in the labour market, with financial circumstances and needs that can be more complex than those in traditional employer–employee relationships.
In this instance, the term “self-employed” refers to those individuals who either:
| › | Own and operate unincorporated businesses (i.e., sole proprietors, partnerships and some independent contractors); or |
| › | Own and operate incorporated businesses but are not employees and do not receive a salary or wages as compensation (e.g., an individual who receives distributions from the corporation that are not considered salary or wages, such as dividends). |
As individuals who are not in an employer–employee relationship, and do not receive a salary or wages as compensation, the self-employed are precluded by the federal ITA from participating in registered pension plans, including the proposed ORPP.
The self-employed are able to take advantage of other voluntary retirement savings vehicles, including PRPPs, once available in Ontario.
Pooled Registered Pension Plans Voluntary retirement savings tools, such as registered retirement savings plans (RRSPs) and pooled registered pension plans (PRPPs), will continue to play an important role in Ontario’s three-pronged approach to ensuring a strong retirement income system. PRPPs would give employees and the self-employed a new type of voluntary, low-cost, tax-assisted option to help increase retirement savings. Fulfilling its commitment in the 2014 Budget, the government introduced the proposed Pooled Registered Pension Plans Act, 2014 (the “proposed PRPP Act”) on December 8, 2014. The proposed PRPP Act provides a legal framework for the establishment and administration of PRPPs in Ontario. Ontario is committed to the creation of a coordinated approach to the administration and regulation of PRPPs across the country. As the government moves forward with implementing PRPPs, it will continue to work with other jurisdictions in an effort to promote harmonization, which could help minimize costs and foster greater portability, supporting a modern, mobile workforce. |
Feedback from Consultations
Throughout the consultation period, many self-employed individuals indicated they are concerned about their retirement futures and voiced an interest in participating in the ORPP. They are looking to the government to facilitate their inclusion in the ORPP or to consider allowing them to opt in or opt out of the plan.
Not being permitted to participate in the ORPP due to federal ITA provisions, self-employed individuals are interested in learning about other retirement savings vehicles and financial tools available to them. The roles of different players — from schools to financial institutions to government — were highlighted as part of a shared responsibility for improving financial literacy.
Moving Forward on Supporting the Self-Employed
The Province will continue to explore collaboration with the federal government to enable the participation of the self-employed in the ORPP, with a view to bringing forward options as part of a future proposed legislative review of the ORPP.
Establishing the ORPP Administration Corporation
Ontario is a global leader in pension administration and management. Pension organizations such as the Ontario Teachers’ Pension Plan and the Canada Pension Plan Investment Board have been recognized as some of the top performers in the world. Experts attribute the success of these organizations to features such as strong, independent governance structures; the ability to attract talented teams of investment and pension administration professionals; and the scale required to achieve high performance at a low cost.
Building on the best attributes of these models and the framework in Bill 56, Ontario is introducing legislation that would establish the Ontario Retirement Pension Plan Administration Corporation (ORPP AC), a professional, independent pension organization that would be responsible for administering the ORPP. The government envisions the ORPP AC as evolving into one of the world’s leading pension organizations.
Key attributes of the ORPP AC would include the following:
| › | Responsibility for operationalizing the ORPP, administering the plan and investing contributions; |
| › | An independent, professional board of directors composed of between nine and 15 members appointed by the Lieutenant Governor in Council; |
| › | A board nomination process aimed at securing highly qualified, expert board members, including an independent nominating committee composed of three members: the Chair of the Board’s Governance Committee and two non-Board members appointed by the Lieutenant Governor in Council; |
| › | A transparency and accountability framework based on best practices in pension governance, including annual reporting, an annual meeting and strong financial controls; and |
| › | Directors and officers subject to duties that are consistent with prudent and responsible pension management. |
Amendments to several other statutes would be introduced to support the establishment of the ORPP AC.
The ORPP contributions and investment funds would be held in trust for ORPP beneficiaries and would not form part of general government revenues.
The government is considering options for additional elements of the ORPP’s accountability framework. These may include:
| › | An Office of the Chief Actuary to provide actuarial advice related to the ORPP that could be modelled on the federal Office of the Chief Actuary; and |
| › | An appeals process for reviewing administrative decisions by the ORPP AC. |
The legislation would also mandate a legislative review within 10 years, which would provide an opportunity to ensure that the mandate, governance and operational framework of the ORPP AC continue to be appropriate for the long term.
To support the ORPP’s strong governance framework, the government would put in place a focused interim board to oversee the implementation process. If the legislation passes, the Province expects to name an interim chair for the ORPP AC in the coming months. Furthermore, to facilitate the implementation of the ORPP, including design parameters of the pension plan and the establishment of the ORPP administrative entity, the government has established an implementation team of professionals with a wide range of relevant experience and expertise.
Implementation of the ORPP
One of the government’s initial implementation priorities is to identify potential providers that could help deliver a simple, reliable and cost-effective pension service-delivery system for the ORPP. At this time, the government is assessing a range of service-delivery options for pension administration. As part of this process, the Province is proceeding with a procurement to identify potential third-party service-delivery providers for the ORPP. Costs of administering the ORPP would be borne by the plan.
Designing the administration of the ORPP is a significant undertaking. The government was reminded during its consultations that the administration must be simple, seamless and responsive. As the government proceeds with implementation, it continues to leverage the considerable expertise and experience of Ontario’s world-class pension plans, the financial sector and other governments. In addition, the Province continues to benefit from the advice of experts such as Michael Nobrega and David Dodge, and the Technical Advisory Group on Retirement Security.
The government is committed to a smooth transition to the ORPP. For example, the Province will provide employers and employees with regular updates on implementation and will ensure a simplified process to minimize administrative costs. In addition, the government will continue to work with the business community, pension plan administrators, labour and other impacted stakeholders to create a plan that reflects the needs of Ontarians.
Ontarians with Self-Directed Retirement Savings
As noted previously, 65 per cent of Ontario workers did not participate in a workplace pension plan in 2013. For these individuals, self-directed retirement savings and investment returns are often the only way to achieve retirement security.
Developing an appropriate investment strategy usually involves specialized knowledge and persistent attention. For this reason, financial literacy has become increasingly important. Government agencies such as the Financial Services Commission of Ontario (FSCO) and Ontario Securities Commission (OSC), through its Office of Investor Policy, Education and Outreach, have responded to this growing need by introducing and promoting financial literacy initiatives to help individuals make informed financial and investment choices.
Many hardworking Ontarians also need the assistance of sound and professional financial advice and planning services. In response, the government has appointed an expert committee to thoroughly consider more tailored regulation of financial advisers, including financial planners. By enhancing regulation of the financial advice sector, the government can help consumers build a more secure retirement future in relation to their savings, investments and other financial choices. See Chapter I, Section D: Creating an Innovative and Dynamic Business Environment for more details.
Strengthening Workplace Pension Plans
Ontario’s three-pronged approach also includes reforms to strengthen and modernize workplace pension plans by:
| › | Fostering the development of new pension models such as target benefit pension plans; |
| › | Modernizing pension regulation; and |
| › | Helping keep public-sector plans affordable and sustainable. |
Target Benefit Pension Plans
Target benefit pension plans combine features of DB and DC pension plans, “targeting” a specified retirement pension funded by fixed contributions. Unlike DB plans, target benefit plans may reduce accrued benefits to address funding shortfalls. Many current multi-employer pension plans (MEPPs) share these characteristics.
The government will soon be releasing a consultation paper on a proposed regulatory framework for target benefit MEPPs. Once implemented, it is anticipated that this framework would replace the time-limited funding regulations that are currently in place for certain MEPPs, known as specified Ontario multi-employer pension plans (SOMEPPs).
Feedback from the consultation on a target benefit framework for MEPPs will help inform the subsequent development of a framework for single-employer target benefit pension plans.
Reforms to Pension Regulation
Since the passage of Bills 236 and 120 in 2010, Ontario has made significant progress in updating the regulation of pensions. The Province will continue this modernization process throughout 2015.
In 2014, the government continued to implement pension reforms, including important regulations to enhance the transparency of pension administration. Of particular note, in November 2014, two regulations under the Pension Benefits Act (PBA) were introduced, requiring pension plan administrators to:
| › | Send biennial information statements to retired and former members; and |
| › | Disclose in their statements to active, former and retired members whether environmental, social and governance factors are incorporated in the plan’s statement of investment policies and procedures (SIPP), and file the SIPP with the regulator. |
Additional initiatives currently being undertaken by the government include:
| › | Amendments to the PBA: Proposed changes being introduced would permit the payment of variable benefits directly from DC plans, including permitting increased portability and withdrawal options, and would extend the deadline for certain pension plans to complete the process of implementing the transfer of past pensions to new plans, consistent with the “split pension” provisions of the PBA. |
| › | Consultation on draft regulations: A draft regulation has recently been posted to the Regulatory Registry for consideration and comment by stakeholders: |
| › | Contribution holidays: This proposal is intended to implement a framework for contribution holidays that specifies eligibility conditions and ensures affected pension parties are appropriately informed; and |
| › | Benefit improvements: This proposal would require the acceleration of the funding of certain pension benefit improvements. |
| › | Exemption from the “30 per cent rule” for pension investments in Ontario infrastructure: A regulation is being drafted to exempt pension investments from the application of the “30 per cent rule” in respect of Ontario infrastructure. This rule limits the ability of pension plans to take large voting interests in a corporation. A description of the proposed regulation was posted to the Regulatory Registry and comments were received earlier this year. Stakeholder feedback will be considered in the development of the draft regulation, which will be posted for further comment in the coming months. |
Updating Reporting Standards
The government is also taking steps to ensure that pension plan reporting properly reflects professional reporting standards. In the summer of 2014, the government sought stakeholder feedback to proposed regulations under the PBA that would update reporting requirements to reflect changes to professional accounting standards. In light of comments received, the Province is considering broadening the scope of these regulatory amendments, to reduce the administrative burden of regulatory compliance while maintaining transparent financial reporting.
Possible amendments could include:
| › | Increasing the threshold at which an auditor’s report must be filed respecting the financial statements of a plan, from the current $3 million in assets to $10 million; |
| › | Identifying an alternative to the requirement for the filing of audited financial statements for a pension fund; |
| › | Extending the requirement to file an Investment Information Statement to DC plans; and |
| › | Easing the requirement for detailed information about individual investments exceeding one per cent of the fair value of the pension fund. |
Enhanced Transparency through Pension Advisory Committees
Additional steps will be undertaken in 2015 to further enhance transparency for pension beneficiaries through the development of regulations to facilitate the creation of pension advisory committees (PACs). The role of PACs will be to monitor plan administration, make recommendations to the administrator regarding the pension plan, and promote awareness and understanding of the pension plan.
Review of Regulator
The government recognizes that a strong pension regulator is necessary to ensure promised benefits are secure. The 2014 Ontario Economic Outlook and Fiscal Review announced a mandate review of the Financial Services Commission of Ontario (FSCO) that will consider, among other issues, the role of the FSCO in regulating pensions.
The government has also signalled its intention to proceed with the development of regulations to implement 2010 reforms to the PBA to modernize the powers of the Superintendent of Financial Services. These regulations will be informed by the views of stakeholders and the results of the mandate review.
Sustainability and Affordability of Ontario’s Public-Sector Pension Plans
Solvency Relief
The financial crisis of 2008 had a major effect on virtually all pension plans in Ontario. Reductions in asset values, coupled with low long-term interest rates, created funding challenges for most DB pension plans, including those in the public sector. The Province sponsors or co-sponsors public-sector pension plans, or provides indirect funding through transfer payments to public-sector employers who sponsor pension plans. As such, the economic environment also had the potential to impact the Province’s finances.
Beginning in 2011, the government has provided temporary regulatory relief from solvency funding rules for many broader public-sector single-employer pension plans (SEPPs). These measures reduce the solvency payment requirements of eligible SEPPs in exchange for commitments from employer sponsors to negotiate plan changes that would improve the sustainability and affordability of their plans in the long term.
Since the temporary solvency funding relief program was implemented, 25 plans have been granted relief; most have already negotiated plan changes, including increased employee contributions and reduced future benefits. The relief has resulted in a $1.3 billion cumulative reduction in required solvency payments as of the end of 2014. Total solvency funding relief is expected to reach an estimated $2.1 billion by the end of 2016.
These measures reduce the risk that employers would be required to divert funding from services to pension plans, thereby protecting jobs and programs, while facilitating sustainable plan changes.
New Models for Public-Sector Plans
While most of the largest pension plans in Ontario are jointly sponsored, many public-sector employers sponsor SEPPs. Some of these employers, along with a number of employee groups, have been exploring the possibility of converting to the jointly sponsored pension plan (JSPP) model, which provides for greater transparency, and shared governance and risk-taking.
A single-employer pension plan (SEPP) may provide a defined benefit (DB) or a defined contribution (DC) pension plan, which is generally administered by the employer, who is solely responsible for determining plan design. Accrued benefits in a DB pension plan cannot be reduced even if the plan is wound up and, most importantly, employers are responsible for funding any shortfalls. A jointly sponsored pension plan (JSPP) is a DB pension plan in which employer(s) and plan members share responsibility for the plan’s governance, administration and funding. Employers and members jointly determine the terms and conditions of the plan, including benefit and contribution levels, the allocation of surplus and how deficits are funded. Accrued benefits can be reduced on wind-up if there are insufficient assets. |
To facilitate the transformation of public-sector pension plans from SEPPs into JSPPs, the Building Opportunity and Securing Our Future Act (Budget Measures), 2014, amended the PBA to provide a legislative framework for the voluntary conversion of public-sector employer-sponsored SEPPs into jointly sponsored plans.
Earlier this year, the government posted on the Regulatory Registry for consultation a description of the proposed regulations that would give effect to the amendments. Many valuable comments were received and will be considered as the government moves forward in drafting the regulations. Interested stakeholders will have an opportunity to comment on draft regulations later this year.
The availability of an exemption from solvency funding rules may be one of the main factors for stakeholders considering the move to joint sponsorship. It should be noted that virtually all of the existing JSPPs that were granted a solvency exemption in 2011 are MEPPs with sophisticated governance structures, numerous participating employers and a large asset base. These characteristics help mitigate the risks associated with an exemption from solvency funding requirements.
The 2014 Budget committed the government to developing criteria, in consultation with stakeholders, for exempting new public-sector, multi-employer JSPPs from solvency funding requirements. In response, the government recently released for consultation proposed criteria to be used in determining whether new JSPPs receive a solvency exemption. The government will consider feedback before finalizing the criteria.
Asset Pooling
In 2013, the government established a technical working group to advise on the design, governance and transition issues associated with the implementation of a new pooled asset management entity for Ontario’s broader public-sector funds. The working group reflected the government’s interest in receiving technical investment management recommendations from key stakeholders that represent potential participants of the proposed entity.
The co-chairs of the technical working group recently provided the government with their final report. The Province has studied the report closely, and drawn from it to develop legislation that is being proposed to create a new pooled asset corporation.
Section F: A Fair Society
Building a Fair Society for All Ontarians
A foundational principle of this government is that all Ontarians should have opportunities to realize their full potential. Acting on this principle, the government introduced its plan for a fair society in the 2014 Budget.
This plan will create the conditions that help lift people out of poverty and provide new opportunities for all Ontarians, including the most vulnerable. It is premised on enhancements to essential services and benefits, such as:
› | Enhancing community care by strengthening the recruitment and retention of skilled personal support workers (PSWs); |
› | Increasing the minimum wage and tying future increases to inflation; |
| › | Expanding the Ontario Child Benefit (OCB); |
| › | Investing $810 million in the provision of community and developmental services to reduce waitlists and expand programs; |
| › | Increasing social assistance rates; |
| › | Expanding the Healthy Smiles Ontario program to enable more children from low-income families to receive affordable dental care; |
| › | Creating a more accessible justice system for low-income individuals and families; and |
› | Taking further action to reduce auto insurance rates. |
The government is implementing the plan and it is working:
› | On June 1, 2014, the hourly minimum wage rose to $11 and October 2015 will see the minimum wage rise from $11 to $11.25; |
| › | July 2015 will see the maximum annual OCB per child rise to $1,336, as a result of indexing to inflation for the first time; |
| › | The government has already eliminated the 2014 Special Services at Home waitlist for children with physical or developmental disabilities, 16 months ahead of the original two-year timeline; |
| › | By February 2015, 525 more developmentally disabled adults with urgent needs were approved for residential supports; |
| › | In the fall of 2014, Ontario raised social assistance rates by one per cent for adult Ontario Works recipients and people with disabilities receiving Ontario Disability Support Program (ODSP) benefits. With both the one per cent increase and an additional top-up, Ontario Works singles without children received a total increase of $30 per month; |
| › | Starting in 2014, 70,000 more children and youth are eligible for dental care under the Healthy Smiles Ontario program; |
| › | The government announced a total hourly wage increase of up to $4.00 over three years, raising the base wage of publicly funded PSWs to at least $16.50 per hour by April 1, 2016; and |
| › | By the spring of 2015, the income eligibility threshold for legal aid will have increased by 12 per cent. |
Implementing the plan for a fair society makes Ontario a better place for all, but more needs to be done. That is why the government is continuing to enhance critical supports for Ontarians, with a focus on:
| › | Effective health care for all: The Province’s recently released Patients First: Action Plan for Health Care will help ensure that all Ontarians get the high-quality health care services they need and rely on. |
| › | Renewed Poverty Reduction Strategy: Through its renewed Poverty Reduction Strategy, the Province is raising social assistance rates and investing in initiatives that break the cycle of poverty and enhance employment and income security so all Ontarians have the foundation to reach their full potential. The government is also introducing legislative amendments to facilitate the implementation of the Poverty Reduction Strategy and related poverty-reduction initiatives. |
| › | Assistance for the vulnerable and enhancing safety for all Ontarians: The Action Plan to Stop Sexual Violence and Harassment and enhancements to Ontario’s successful Youth Action Plan will both lead to a safer province, and help bring permanent social change to those at risk. |
| › | Protecting consumers: The government is proposing legislation that would, if passed, provide the legislative basis for electricity-rate mitigation for low-income individuals and families. The government is also introducing further measures to ensure affordable auto insurance rates. |
Effective Health Care System for All
Patients First: Action Plan for Health Care
Since launching Ontario’s Action Plan for Health Care in January 2012, the government has moved forward in transforming health care in the province from a fragmented system with rising costs, to a system focused on better access, quality and value for all Ontarians. The government has reduced growth in health care spending to about two per cent annually from about six to seven per cent per year, significantly bending the health care cost curve while continuing to improve.
Ontario has made important health care advances in recent years:
| › | The Province now has the most comprehensive newborn screening program in Canada — babies were checked for just two diseases in 2003; today, they are screened for 29; |
| › | Ontario had eight publicly funded vaccines in 2003; today, 22 vaccines save Ontarians about $2,500 per child; and |
| › | In 2014, the Wait Time Alliance gave Ontario straight As for reducing wait times for hip and knee replacements, radiation therapy, and cataract and cardiac bypass surgeries. |
The government is committed to sustaining and improving Ontario’s universal public health care system — despite the challenges related to a growing and aging population and more people living with chronic conditions.
An efficient and effective health care system must be forward looking and anticipate rather than react — based on evidence — so that health care interventions are smart, targeted and effective. Putting the needs of people and patients first will help improve patient outcomes and make the best use of every dollar spent.
The government’s 2015 Patients First: Action Plan for Health Care builds on the progress made since 2012. Patients First focuses on four key objectives:
| › | Providing faster access to the right care; |
| › | Delivering better coordinated and integrated care in the community, closer to home; |
| › | Supporting Ontarians with evidence-based information so they can make the right decisions about their health; and |
| › | Protecting Ontario’s universal public health care system by making decisions based on value and quality — to sustain the system for generations to come. |
Providing Faster Access to the Right Care
The government is committed to making sure Ontarians have improved access to the tools, information and care they need for living and staying healthy, at every stage of life.
Increasing Access to Fertility Treatments and Midwifery
The Province is increasing access to fertility treatments to help more people expand their families. In 2015, Ontario plans to contribute to the costs of one in vitro fertilization (IVF) cycle per patient for all eligible forms of infertility — for example, for cancer patients undergoing treatments that cause infertility, giving them hope of having a family one day. Sharing the cost of IVF will improve affordability and access for an estimated 4,000 more patients while protecting the health and safety of the mothers and their babies. Families or their health plans will continue to pay for associated drugs and ancillary services.
Ontario will also continue to support midwifery practice groups and Aboriginal midwives who offer support to expectant mothers and their babies.
Faster Access to Primary Health Care
Often the first point of access, primary care is the foundation of a strong health care system and a necessary component of improving health outcomes and decreasing the burden of disease.
The government continues working to ensure that Ontarians have timely access to primary health care providers, such as family doctors, nurse practitioners and integrated health care teams.
Health Care Connect (HCC) was designed to help patients find a primary health care provider. Today, as a result of HCC and other primary care reforms, 94 per cent of Ontarians have a primary care provider.
To further improve access to primary care providers, and reduce wait times for patients, the government supported Health Quality Ontario’s Advanced Access initiative. The initiative has given patients the opportunity to book an appointment with their provider on the same day or next day of their choice. More than 800 primary care providers have participated, benefiting an estimated 650,000 Ontarians.
As well, close to 3.7 million Ontarians are receiving quality, comprehensive interdisciplinary primary care through Family Health Teams, Nurse Practitioner-Led Clinics, Community Health Centres and Aboriginal Health Access Centres. These approaches give people in diverse communities across Ontario access to an array of health care providers — including doctors, nurse practitioners, nurses and social workers — with the right skills to meet their health care needs, as close to home as possible. Ontario is investing about $4 million, for example, to expand access to physiotherapy services in primary care settings for an estimated 71,000 people across the province.
For those Ontarians who need to consult with a specialist, the government is removing the barriers to direct referrals to specialists by nurse practitioners, so patients get the right care as quickly as possible. Enabling nurse practitioners and other professionals to work to their full scope of practice, particularly on collaborative interdisciplinary teams, allows each health care provider to contribute their skills most efficiently and effectively.
To help all Ontarians get care when and where they need it — including those in northern, rural and fast-growing communities — the government plans to continue organizing primary health care providers and teams around the needs of the population across the province.
Ontario’s health care landscape is evolving. Changing population needs, health system funding reform, and technology are just some of the factors driving this change. To better align key initiatives, maximize investments and ensure that Ontarians have a health care system that is both high quality and sustainable, the government is moving forward to establish a comprehensive capacity planning framework. A sustainable health care system equipped to meet the needs of future generations requires long-term planning to provide appropriate services and establish a complementary infrastructure footprint that reflects the changes occurring across the province. As a way of supporting capacity planning across the health care system, the government is committed to supporting communities with the necessary resources to plan and design health infrastructure. This will be done in a way that reflects the needs of local communities, and will bolster the work of Local Health Integration Networks (LHINs) to plan and integrate programs and services, while also aligning with the government’s Patients First: Action Plan for Health Care.
Investing in the Right Care for Mental Health and Addictions
About 30 per cent of Ontarians experience a mental health and/or substance abuse challenge at some point in their lives. Seventy per cent of mental health issues start early in life. That is why the first three years of Ontario’s 10-year Comprehensive Mental Health and Addictions Strategy, launched in 2011, focused on mental health supports for children and youth. As a result, almost 800 more mental health workers now serve children and youth in Ontario communities, schools and courts. Telemental health services are providing almost 3,000 psychiatric consults this year alone, for youth in rural, remote and underserved communities.
Building on the early intervention approach with children and youth, the second phase of the Strategy supports key transitions for people of all ages who need mental health or addictions services — transitions between youth and adult services, between housing, justice and employment services, and between care teams.
With the advice of an expert Mental Health and Addictions Leadership Advisory Council, the Strategy includes increased access to services such as supportive housing, short-term crisis support and treatment programs.
The next phase of the Strategy includes investing $138 million through LHINs over three years starting in 2014–15 for community organizations across Ontario to improve mental health and addictions services.
Better Access to Mental Health Services Phase One of the Comprehensive Mental Health and Addictions Strategy provided more than 50,000 additional children and youth across Ontario with access to mental health and addictions services. The Mental Health Innovation Fund has funded 32 projects (with up to $6 million annually since 2012) to improve access to high-quality mental health services for postsecondary students. In addition, the government funded the hiring of 21 full-time registered nurses for early psychosis intervention programs, and 24 new nurse practitioners for Aboriginal Community Health Centres and Aboriginal Health Access Centres. |
Providing Better Coordinated and Integrated Care in the Community, Closer to Home
As Ontario’s population ages, the demand for faster access, better coordinated home care and community services continues to grow. Recognizing that quality and appropriate care can be delivered at or near home at a lower cost than in hospitals or long-term care homes, Ontario has more than doubled funding for home care services since 2003.
Ontario is also helping more people receive faster access to quality home and community care and will continue to publicly report on its five-day wait time target. Today, within five days of being approved for services, 93 per cent of eligible patients receive their first nursing visit and 84 per cent receive a visit from a PSW.
The Province is already providing 6.5 million nursing visits and 27 million hours of personal support and home making services to more than 600,000 clients per year. About 1.46 million people, mostly seniors, receive community support services, such as meals, transportation and caregiver support.
To further enhance capacity and drive system transformation, the government will continue to increase funding in the sector by about five per cent per year, investing more than $750 million over the next three years.
Funding will support people of all ages who require care in their home, at school or in the community. This includes:
| › | Investing $75 million to support more visits at home for people who need nursing services and more hours of care for those who have complex care needs and require in-home personal support services like dressing, bathing and help taking medication; |
| › | Moving forward with the recommendations of the report prepared by the Home and Community Care Expert Group, “Bringing Care Home,” by testing innovative approaches to bundle funding specific to a patient’s needs as they transition out of hospital and back into their homes and communities; |
| › | Investing more than $40 million over four years, including about 10,000 more rehabilitation therapy visits, to enhance coordinated services for frail, complex-needs seniors who have recently lost strength or mobility due to an injury or long hospital stay. Services will help seniors regain strength and remain independent longer, reduce their need for admission to hospital or a long-term care home, and support families and caregivers; and |
| › | Creating 69 Community Health Links across the province by bringing local health care providers together to work with complex-needs patients and their families by coordinating the delivery of care. By wrapping care around the patient, the team of providers can avoid duplicated or unnecessary services, avoid gaps in their care or prevent trips to the hospital. |
How Coordinated Care Helps Improve Outcomes An 82-year-old married man, who speaks no English, frequently visited his nearby hospital emergency department to obtain free acetaminophen. To improve his care, a care coordinator from the local Community Care Access Centre, which is connected with the local Health Link, visited him at home with a translator. The care coordinator discovered that the man had been visiting the emergency department to relieve pain from an untreated hernia, and did not know how to arrange for surgery through the specialist he had been referred to. The Health Link, working with the patient’s primary care provider, developed a personalized, coordinated care plan for him, and arranged for the surgery and for someone to accompany him. The care coordinator continued to work closely with the man and his family doctor to ensure he continued to receive appropriate, coordinated primary and community care in line with his own objectives. |
Improvement for Personal Support Services and Workers
To meet the growing demand and ensure people receive quality community and home care, Ontario continues to strengthen the recruitment and retention of skilled PSWs. As first announced in the 2014 Budget, to ensure a more equitable compensation model for publicly funded PSWs, the government remains committed to a total hourly wage increase of up to $4.00 over three years, raising their base wage to at least $16.50 per hour by April 1, 2016. The Province’s PSW Workforce Stabilization Strategy also includes measures to create more permanent and less casual employment for PSWs.
Travel Vaccines in Pharmacies
Aiming to give Ontarians more options for care closer to home, while also working to ensure that health care professionals can fully use their skills and knowledge, the government is considering allowing Ontarians to receive travel vaccines in their local pharmacies.
Ensuring Comfort in Long-Term Care Homes
Should the time come for a move into a long-term care (LTC) home, seniors and their families deserve to feel confident and comfortable that they will be well taken care of. That is why the Province continues to conduct rigorous inspections of LTC homes, and requires annual updates and testing of all LTC homes’ fire safety and emergency plans. Ontario is also encouraging capital redevelopment of about 300 older LTC homes, with support to home operators to address disparities between older and newer homes.
Improving Palliative Care Services
In recognition of the tireless and valuable work of volunteers in the hospice and palliative care communities, the government is providing support to Hospice Palliative Care Ontario to expand training for volunteers and caregivers. This will ensure that they are equipped with the skills and resources to support patients and their families, and provide Ontarians with access to tools to cope with bereavement and grief.
These key investments of about $250,000 will build on the government’s commitment to improve the quality of palliative care in Ontario while supporting patients, their caregivers and volunteers.
Providing Information to Help Ontarians Make the Right Decisions about their Health
Helping Kids Stay Healthy and Active
The government is committed to providing information and support to help Ontarians stay healthy and make the right decisions about their health. To help kids stay healthy, and reduce the long-term health risks and costs associated with childhood obesity, the government’s Healthy Kids Strategy promotes the well-being of Ontario’s children and youth with three aims: a healthy start in life, healthy food, and healthy, active communities.
Healthy Communities The government’s Healthy Kids Community Challenge has selected 45 communities across Ontario to receive funding, training and guidance on providing local programs over the next four years to encourage healthy behaviours and focus on physical activity and healthy eating. The government also supports the Northern Fruit and Vegetable Program. Delivered in partnership with the Ontario Fruit and Vegetable Growers’ Association, local Public Health Units and their partners, the program provides free servings of fresh fruit and vegetables to over 36,000 school-aged children in communities in the Porcupine, Algoma and Sudbury districts, of whom about 6,600 are of Aboriginal descent. |
The proposed Making Healthier Choices Act, 2014, would, if passed, make Ontario the first province to require food service premises with 20 or more locations that provide standard food items to post calories on menus to help families make healthier food choices.
Towards a Smoke-Free Ontario
Ontario’s smoking rate dropped to 18.1 per cent in 2013, down from 24.5 per cent in 2000. To help Ontario achieve the lowest smoking rate in Canada, the government continues to take active steps to protect young people from the health risks and impacts of smoking. As of January 1, 2015, it is illegal to smoke on bar and restaurant patios, in playgrounds, and on public sports fields, and to sell tobacco on university and college campuses. To discourage youth under age 19 from buying tobacco or developing a smoking habit, the government has proposed banning the sale of flavoured tobacco products, which often appeal to young people. Bans are also proposed on the use of electronic or e-cigarettes anywhere tobacco smoking is prohibited, and on the sale of e-cigarettes to anyone under age 19.
Sustaining Ontario’s Universal Publicly Funded Health Care System for Generations to Come
A sustainable health care system means controlling costs and targeting funding, with a focus on preventing illness and improving results for patients. Three key elements continue to drive the sustainability of the health care system and promote confidence in its future, including:
| › | Health System Funding Reform; |
| › | Strengthening integrated care; and |
| › | Providing the right care at the right time and place. |
Renewed Poverty Reduction Strategy
All Ontarians should have opportunities to realize their full potential and lead healthy and prosperous lives.
In September 2014, the government released its renewed Poverty Reduction Strategy — Realizing Our Potential. This new Strategy focuses on long-term and sustainable solutions that break the cycle of poverty. The Province is undertaking a multi-faceted approach to tackling the root causes of poverty, by making investments in public services such as health care, income security, employment supports, and affordable housing, and investments to end homelessness.
Given the high social and economic costs of poverty, enhancing key social services can help reduce costs over the longer term.
The Strategy’s Four Pillars
Ontario’s Poverty Reduction Strategy has four pillars:
| › | Breaking the cycle of poverty for children and youth; |
| › | Moving towards greater employment and income security; |
| › | Ending homelessness and investing in affordable housing; and |
| › | Using evidence to develop policy and measure success. |
Breaking the Cycle of Poverty for Children and Youth
Programs that support children can help the whole family get ahead. From 2008 to 2011, the most recent years for which historical data on poverty are available,1 the Strategy helped lift 47,000 children out of poverty.
Between 2003 and 2015, the total income (after tax and transfers) of a single parent with two children, working full time at minimum wage, increased from about $20,000 to over $36,000. |
The government’s investments also help keep children and their families from falling into poverty. In 2011 alone, 61,000 children and their families were prevented from falling into poverty.
This progress has been achieved in part by the Ontario Child Benefit (OCB), a key element of the Strategy. The government enhanced the maximum annual OCB per child by $100 in July 2014. Beginning in July 2015, the OCB’s maximum benefit and the income threshold at which it starts to be reduced will be indexed to annual increases in the Ontario Consumer Price Index. The maximum annual OCB per child will be $1,336, and the income threshold will be $20,400 in July 2015.
The Ontario Child Benefit The Ontario Child Benefit (OCB) is an income-tested, non-taxable, provincial payment that is provided monthly to low- to moderate-income families to help with the cost of raising children. This year, the OCB will support about one million children in more than 500,000 families. |
| 1 | Statistics Canada has changed the survey used to measure poverty rates and released data only for 2012. The agency has cautioned that results for 2012 are not comparable with previous estimates. It will not be possible to provide an update on progress in reducing child poverty until historical estimates are released by Statistics Canada. |
The government has also introduced initiatives that support the well-being of children and break the cycle of intergenerational poverty. Starting in 2014, the Healthy Smiles Ontario program was enhanced, allowing approximately 70,000 more children and youth to receive the dental care provided under this program. As a next step, the government will integrate a number of existing programs into the Healthy Smiles Ontario program. This initiative will help families obtain dental care they otherwise could not afford, faster and more easily — with streamlined registration.
Building on this progress, the government is committed to providing extended health benefits such as vision care, prescription drug coverage, assistive devices and mental health care to children in low-income families. Ongoing regular health care prevents emergencies, improves long-term health and reduces the impact of poverty.
Taken together, these commitments will help the government continue to make progress towards achieving its commitment to reduce child poverty by 25 per cent.
Moving towards Employment and Income Security
While government programs help break the cycle of poverty, achieving employment and income security is critical for Ontarians to succeed. That is why the renewed Poverty Reduction Strategy aims to support and encourage people to find meaningful employment. It continues to focus on providing opportunities for youth and vulnerable populations to develop the skills and experience needed to enter the labour market.
For example, the Employment Service — part of Employment Ontario — has helped more than 684,000 Ontarians look for a job at more than 400 points of service across the province.
The government is focusing its employment and training resources on those who need them most, including implementing a comprehensive suite of programs and services tailored to the needs of youth. This includes Youth Job Connection, which will provide intensive employment supports for youth who experience multiple barriers to employment.
Some Ontario families and individuals may, for various reasons, experience challenges in achieving financial independence. The Province’s social assistance programs provide supports for these vulnerable Ontarians.
In 2013 and 2014, Ontario implemented social assistance rate increases and provided top-ups for those with the lowest incomes, namely single adults without children receiving Ontario Works. Building on this progress, the government will further increase social assistance rates in 2015 by one per cent for adult Ontario Works clients and people with disabilities receiving Ontario Disability Support Program (ODSP) benefits. The government will provide a further top-up for single adults without children receiving Ontario Works. With both the one per cent increase and the top-up, Ontario Works single adults without children will receive a total increase of $25 per month, giving these recipients $75 more per month than they had in 2012.
In addition, the comfort allowance will increase by one per cent for low-income residents of long-term care homes.
Social assistance rate increases will take effect in October 2015 for ODSP and in November 2015 for Ontario Works. Municipalities will not be required to cost-share the Ontario Works rate increase until January 2016.
With this increase, and the social assistance changes announced in 2013 and 2014, the government has taken important first steps in addressing the recommendations of the Commission for the Review of Social Assistance in Ontario. Ontario will continue to reform social assistance guided by the Commission’s recommendations and over the coming year will consult with clients, stakeholders and other partners on how to redesign the rate structure.
Moving forward, the Province will continue to make investments that are strategic and support employment and income security. However, Ontario’s plan for a fair society requires support from the federal government. For example, the Province continues to call on the federal government to make enhancements to the Working Income Tax Benefit (WITB) to help the lowest income earners gain a stronger foothold in the labour market.
Ending Homelessness and Investing in Affordable Housing
When Ontarians are not securely housed, it impacts all facets of their lives — from their ability to access education and training, to finding and keeping a job, to feeling secure and staying healthy. Unfortunately, low- to moderate-income individuals and families often face significant challenges in finding and retaining suitable and affordable housing.
Expert Advisory Panel on Homelessness
In early 2015, the government established an Expert Advisory Panel on Homelessness that will advise on a provincial definition of homelessness, methods to improve the collection of data about homelessness, and applying evidence to promote the most effective approaches to preventing and ending homelessness.
Long-Term Affordable Housing Strategy
Ontario’s Long-Term Affordable Housing Strategy (LTAHS), released in 2010 and currently being implemented as part of the government’s Poverty Reduction Strategy, is intended to give municipalities more flexibility in creating affordable housing for Ontario’s most vulnerable households. It also calls on the federal government to provide long-term, flexible funding for affordable housing.
The government has committed to review the LTAHS in 2015–16 to reflect lessons learned and integrate new research on best practices related to housing and homelessness.
Extending the Investment in Affordable Housing Program
The Province continues to build new affordable housing and repair existing units for Ontarians with housing needs. Ontario’s funding commitment of more than $4 billion towards affordable housing since 2003 is the largest such investment in the province’s history. With this funding, Ontario supports the creation of more than 20,000 new affordable rental housing units, more than 275,000 repairs and improvements to social and affordable housing units, and rental and down-payment assistance to more than 90,000 additional households in need.
Extending the jointly funded federal–provincial Investment in Affordable Housing (IAH) program for another five years is a key component of the LTAHS moving forward. Both governments signed an agreement to extend the IAH program in August 2014.
Through the IAH program, low-income households can access new affordable rental housing, receive down-payment assistance to own an affordable home, and repair and modify their homes.
The program also provides dedicated funding assistance for the housing needs of off-reserve Aboriginal communities and remote communities in northern Ontario.
Ontario is contributing $80 million annually over five years to this renewed program, cost-matched by the federal government.
Community Homelessness Prevention Initiative
A housing-first approach to homelessness is based on the concept that a person’s first and most basic need — aside from food and clean water — is stable housing. Stable and affordable housing helps at-risk individuals have better access to training and employment, and to various services such as health care.
Established on January 1, 2013, the Community Homelessness Prevention Initiative (CHPI) combines funding from five formerly separate housing and homelessness programs into a single, flexible and locally coordinated program. The CHPI is administered by municipal service managers to better meet the needs of individuals and families who are homeless or at risk of becoming homeless.
In August 2014, consistent with the success of the housing-first approach in Ontario, the government announced an additional $42 million in annual CHPI funding to municipalities, beginning in 2014–15, for a total of $294 million annually. On March 30, 2015, the Province announced the allocation of $587 million to municipalities to help families and individuals at risk of homelessness get the housing that best suits their needs. This funding will enable communities to offer a wider range of services to meet their local needs.
Measuring the Outcomes of the Community Homelessness Prevention Initiative (CHPI) In 2013–14, its first year of operation, the Community Homelessness Prevention Initiative (CHPI) helped approximately 33,100 households experiencing homelessness obtain transitional or permanent housing. It also helped approximately 83,800 households at risk of homelessness remain in their homes. Affordable Housing Changes Lives Fred had been homeless in London for 15 years. In a single year, he made 259 visits to the hospital and had 108 encounters with the police. Since being housed a year ago, he has visited the hospital twice and had six encounters with the police. Fred is Ontario’s Poverty Reduction Strategy in action. |
Using Evidence to Develop Policy and Measure Success
Measuring success is at the core of Ontario’s poverty reduction efforts. Launched in 2008, the first Poverty Reduction Strategy established specific indicators to help the Province track progress. While progress has been made, more needs to be done.
The new Strategy builds on the foundation of the first one and strengthens the government’s commitment to measuring success, with a dedicated focus on evidence-based policy and the introduction of new indicators. By measuring the impact of government investments, the Province can help identify further opportunities to prevent and reduce poverty in Ontario.
The Local Poverty Reduction Fund, announced in the 2014 Budget, is a $50 million fund that will be used to combat poverty in new, innovative, evidence-based ways — specifically at the local level. The government will collaborate with organizations that know what works best for their communities. Successful applicants to the Fund will identify local, innovative solutions to poverty reduction. These new solutions will demonstrate proven, measurable results, and the potential to be scaled up to a larger level for similar communities across Ontario. The Fund will provide funding over six years, starting in the fall of 2015.
Assistance for the Vulnerable and Enhancing Safety
The Province as a whole benefits when all Ontarians overcome barriers and achieve their full potential. That is why the government is investing in programs and services that increase access to justice and support vulnerable groups, including at-risk youth, people with disabilities, and victims of sexual violence and harassment.
Supporting People with Developmental Disabilities
People with developmental disabilities want to be active participants in their communities. The government is committed to providing — and improving on — local programs and services that promote inclusion and involvement.
In keeping with this commitment, the 2014 Budget announced $810 million over three years as part of an action plan to build stronger services and supports for individuals while encouraging new approaches, collaboration and partnerships in the developmental services system. This total investment is the single largest increase in funding to the sector in Ontario’s history.
Since last fall, as part of this investment, the government has provided direct funding to 8,000 more children with developmental disabilities and their families through the Special Services at Home program, eliminating the 2014 waitlist 16 months ahead of the original two-year timeline. At the same time, 525 more adults with urgent needs — including vulnerable young adults transitioning from children’s services — have been approved for residential supports. |
As part of this action plan, the government has also:
| › | Launched the Community Transportation Pilot Grant Program, a two-year program to improve community transportation services for people with disabilities, and others, allowing them to take advantage of more community programs and services; |
| › | Established the Developmental Services Housing Task Force to collaborate with community partners to find innovative and inclusive housing solutions for people with developmental disabilities; and |
| › | Supported 38 community-based projects under the new Developmental Services Employment and Modernization Fund to promote greater inclusion and independence for people with developmental disabilities through meaningful employment and modernized service delivery. |
Developmental Services in Action: Promoting Inclusive Employment The $810 million investment in the community and developmental services sector announced in the 2014 Budget is directly supporting more than 600 non-profit delivery partners across Ontario, enabling them to provide more and better programs and services for their clients with developmental disabilities. One area of particular focus is promoting opportunities for employment for those with developmental disabilities. For example, LiveWorkPlay, an Ottawa organization that champions community inclusion for people with developmental disabilities, helps developmentally disabled adults find employment in the Ottawa area. With Provincial funding assistance provided to LiveWorkPlay, Royce Rinne has had an opportunity to work at a local car dealership, counting and cataloguing spare parts. After a brief trial period, Royce was offered a part-time position as an Inventory Analyst. Royce’s commitment to and success on the job has inspired two partner dealerships and a third separate dealership to employ other LiveWorkPlay clients. “Being paid well and living on my own — that makes me very happy.” — Royce Rinne |
Ontario’s Youth Action Plan: Helping At-Risk Youth Succeed
All young people in Ontario have the potential to contribute positively to their communities and to the province. Unfortunately, some youth face more significant obstacles to success than others. At-risk youth are those who have faced discrimination or a difficult socioeconomic or family environment. As a result, they may experience social exclusion and higher unemployment, and have lower levels of educational achievement and fewer opportunities than their peers. Sometimes, these factors contribute to youth violence.
In 2012, Ontario’s Youth Action Plan was developed to foster safer communities and give young people the support and opportunities they need to succeed. The first phase of the Youth Action Plan has been implemented. The first phase and other programs and supports targeted towards at-risk youth have contributed to improved outcomes.
For example, the overall youth crime rate in Ontario is 43 per cent lower than in 2003. The youth violent crime rate is down by 30 per cent over the same period — better than the national rate, which dropped 28 per cent. And, since 2006, nearly 128,000 young people have benefited from the support and mentorship of a youth outreach worker in the province.
Despite these successes, however, much more needs to be done. The government will implement the next phase of the Youth Action Plan — an annual, cross-government investment starting at $14 million in 2015–16, and growing to almost $21 million in 2016–17.
This investment will further the Province’s efforts to prevent youth violence by:
| › | Addressing service gaps for youth with the highest needs; |
| › | Scaling up local initiatives that have been shown to have real, positive results; and |
| › | Expanding youth opportunities to high-needs areas of Ontario that were not included in the first phase of the Youth Action Plan. |
Ontario’s Youth Action Plan: Successes in Outreach One of the initiatives under Ontario’s Youth Action Plan is the Youth Outreach Worker program. Under this program, outreach workers meet at-risk youth in the places they gather to make sure they know about the wide range of programs and services available to them. The workers also encourage young people to get involved in positive projects in their community. Since 2012, with funding from the Province, the number of Youth Outreach Workers across the province has increased from 62 to 97. Likwa Nkala, Lead for the East Quadrant Youth Outreach Worker Team and Outreach and Resource Specialist, East Metro (Toronto) Youth Services, has had a positive impact on many over the years. Since he began in his role, Likwa has helped hundreds of at-risk youth on a one-on-one basis and hundreds more through presentations and workshops. |
An Action Plan to Stop Sexual Violence and Harassment
Sexual violence and harassment cross all social boundaries, affect people of every age and culture, and can profoundly affect survivors and their families. To combat sexual violence and harassment, and improve support for survivors, the government announced It’s Never Okay: An Action Plan to Stop Sexual Violence and Harassment on March 6, 2015. The Action Plan will lead the way to a safer Ontario and move the Province forward in its collective aim to bring permanent social change to an issue that has resisted change for far too long.
The Action Plan includes a number of key initiatives, including:
| › | The #whowillyouhelp multimedia public education campaign, which aims to help change behaviours and calls on bystanders to intervene; the campaign has received positive attention across the world since its launch on March 6, 2015; |
| › | A new health and physical education curriculum that will help students, from Grades 1 to 12, develop a deeper learning about healthy relationships and consent; |
| › | Stronger workplace safety legislation that, if passed, would require employers to investigate and address workplace harassment, including sexual harassment; |
| › | An enhanced prosecution model tailored to the needs of sexual assault cases that will help ensure that all such charges are prosecuted as fairly, effectively and respectfully as possible; |
| › | Legislation that, if passed, would eliminate the two-year limitation period for civil sexual assault claims and claims of sexual assault before the Criminal Injuries Compensation Board; |
| › | Increased and stabilized funding for supports for survivors provided by community partners; and |
| › | Introduction of legislation to require colleges and universities to work with students to adopt campus-wide sexual violence and harassment policies that include training, prevention, complaint procedures and response protocols. |
Increased Legal Aid Eligibility
To ensure low-income families and vulnerable groups have the legal supports they need, the government is continuing to expand access to legal aid by raising the income eligibility threshold.
The income eligibility threshold is the income level below which a person qualifies for legal aid assistance. |
Before November 1, 2014, when the first scheduled increase took place, the income eligibility threshold had not been increased since the 1990s. The next increase took place on April 1, 2015. This plan, when fully implemented, would allow over one million more people to qualify for legal aid services — more than doubling the number of low-income individuals with access to legal aid.
Seniors Community Grant Program
Ontario is providing more opportunities for seniors to participate in their communities by doubling the Seniors Community Grant Program to $2 million per year. The Seniors Community Grant Program is focused on encouraging initiatives and projects in the non-profit sector that promote greater social inclusion, volunteerism, education and community engagement for seniors. Since its creation in the fall of 2013, more than 40,000 seniors across the province have benefited from this program.
Seniors Community Grant Program: Community Engagement Projects
The Seniors Community Grant Program has already supported 179 projects. Recipient organizations located across the province have been working to increase financial literacy, provide education about health and wellness issues, and promote activities that allowed seniors to volunteer in the community and interact with other seniors and young people. These programs included: ● The Somali Centre for Family Services in Ottawa engaged marginalized and isolated, multicultural seniors and provided them with a chance to volunteer within their own culture and language, and establish support networks that decreased their isolation and engaged them as active participants in their own community; ● Crisis Homes in Thunder Bay planned a one-day Senior Women Connecting for Life conference on self-care and wellness that targeted women who have been, or are currently, in an abusive relationship; ● The Parkdale Golden Age Foundation in Toronto helped youth train computer-savvy seniors to become volunteer peer trainers on new technologies; and ● Connecting Miles of Smiles in Ottawa offered technology training between local seniors and foreign students seeking to improve their spoken English in order to foster greater social involvement and intergenerational opportunities. |
Community Hubs
The government recently announced the creation of the Community Hub Framework Advisory Group to develop a strategic framework to better meet local residents’ needs. Karen Pitre, Special Advisor to the Premier on Community Hubs, will chair the Advisory Group.
A community hub can be a school, a neighbourhood centre or another public space that offers coordinated services such as education, health care and social services. The advisory group will review provincial policies and develop a framework for adapting existing public assets to become community hubs.
The Community Hub Framework Advisory Group will:
| › | Gather input from Ontarians; |
| › | Foster partnerships among community organizations and other groups to ensure that the framework addresses local needs; and |
| › | Examine best practices in Ontario and other jurisdictions. |
Delivering coordinated public services through community hubs will ensure these services better meet the needs of children, youth and seniors.
Fairness for Ontario Consumers
Promoting consumer protection helps people make informed choices, spend wisely and protect their hard-earned money. The government continues to address a wide variety of pressing marketplace concerns, including:
› | Taking further action to protect auto insurance consumers and ensure affordable premiums; |
| › | Keeping electricity cost-effective and efficient; |
| › | Connecting remote communities to the electricity grid; and |
| › | Increasing protection in the condominium market. |
Taking Further Action to Protect Auto Insurance Consumers and Ensure Affordable Premiums
Affordable auto insurance is important to Ontario’s 9.4 million drivers. Ontarians across the province rely on cars to get to work and school, and to participate in their communities.
Protecting Ontario’s Consumers
In November 2014, the Fighting Fraud and Reducing Automobile Insurance Rates Act, 2014, was passed. In addition to strengthening consumer protections regarding towing and vehicle storage for Ontario drivers involved in traffic collisions or in need of roadside assistance, the passage of this Act will help Ontario drivers settle disputes with insurers and get faster access to the benefits they need by transforming Ontario’s auto insurance dispute resolution system (DRS).
Based on recommendations from the Honourable J. Douglas Cunningham’s Auto Insurance Dispute Resolution System Review, the new DRS will be housed within the Ministry of the Attorney General’s Licence Appeal Tribunal and will begin accepting accident benefit dispute applications on April 1, 2016.
The government will also take additional action to increase consumer protection and help reduce auto insurance costs by:
| › | Lowering the maximum interest rate charged on monthly auto insurance premium payments to 1.3 per cent from three per cent; |
| › | Prohibiting premium increases for minor at-fault accidents that meet certain criteria (e.g., no reported injuries); and |
| › | Requiring that all insurers offer a discount for the use of winter tires. |
The government will work with stakeholders in the coming months to implement these initiatives in a timely, efficient and responsible way. The government also continues its work to ensure that insurer claims management practices are fair, protect consumers, and promote affordable premiums.
Scientific and Evidence-Based Approaches
The government will also continue to ensure, where possible, that insurance coverages reflect the most relevant scientific and medical knowledge on identifying and treating injuries from automobile accidents. This approach will provide clarity to help minimize disputes in the auto insurance system and ensure that people get the treatment they need after an automobile accident.
Accordingly, the government will amend Insurance Act regulations to update the catastrophic impairment definition consistent with more up-to-date medical information and knowledge.
Ensuring Affordable Premiums and Providing More Consumer Choice
In 2010, the government introduced a number of reforms to reduce the costs of fraud and abuse in the auto insurance system and provide more choice to consumers. These reforms worked to reduce costs in Ontario, making them closer to comparable provinces’. But in 2013, costs in Ontario’s auto insurance system began to increase again.
The August 2013 launch of the government’s Auto Insurance Cost and Rate Reduction Strategy included additional reforms to further lower auto insurance costs, which helped reduce auto insurance rates by more than six per cent on average as of last fall.
However, while progress has been made, costs in Ontario’s auto insurance system remain too high.
The government will continue to take action to further lower costs. As in the past, reforms will continue to balance the needs of injured claimants to recover and resume work and regular activity as quickly as possible, with protecting consumer interest by ensuring affordable insurance for Ontario drivers.
Ontario’s auto insurance system remains the most generous among Canadian jurisdictions with private marketplace systems. And the government’s reforms will continue to ensure the generosity of Ontario’s auto insurance accident benefits.
To further reduce costs in Ontario’s auto insurance system, bring these costs more in line with other provinces, and provide Ontario consumers with more choice in purchasing auto insurance to suit their needs, the government will amend Insurance Act regulations to:
| › | Change the standard benefit level for medical and rehabilitation benefits to $65,000 (from $50,000) and include attendant care services under this benefit limit. Consumers will also have an option to increase that coverage up to $1 million; |
| › | Include attendant care services with the $1 million medical and rehabilitation benefit for catastrophic impairments, and provide the option for additional coverage of $1 million, for $2 million in total coverage; |
| › | Reduce the standard duration of medical and rehabilitation benefits from 10 years to five years for all claimants except children; |
| › | Eliminate the six-month waiting period for non-earner benefits and limit the duration of non-earner benefits to two years after the accident; |
| › | Require goods and services not explicitly listed in the Statutory Accident Benefits Schedule (SABS) to be “essential” and agreed on by the insurer; and |
| › | Change the standard deductible for comprehensive coverage to $500 from $300. |
Working with the auto insurance industry, the government will ensure that consumers are aware of the changes to the standard auto insurance policy and can make an informed decision should they choose to take advantage of enhanced optional coverages to suit their needs.
Adjustments for Inflation
In addition, to ensure that the auto insurance system reflects the effects of inflation, the government will propose amendments to the Insurance Act and regulations to:
| › | Adjust the deductible on court awards for non-pecuniary (i.e., pain and suffering) damages to reflect inflation in Ontario since 2003, and link the deductible to future changes in inflation; |
| › | Adjust the monetary thresholds beyond which the tort deductible does not apply to reflect inflation in Ontario since 2003, and link the thresholds to future changes in inflation; and |
| › | Allow for the effect of the tort deductible to be taken into account when determining a party’s entitlement to costs in an action for damages from bodily injury or death arising directly or indirectly from the use or operation of an automobile. |
These changes will restore the policy rationale and integrity of these deductibles and thresholds to when they were last updated in 2003. Existing optional coverage to reduce tort deductible amounts will remain unchanged, and consumers will continue to have options to customize their coverages to suit their needs.
Keeping Electricity Cost-Effective and Efficient
The government has taken action to help transform Ontario’s electricity system and make it clean, reliable and affordable for all Ontarians. These efforts include measures to reduce costs for residents, particularly low-income residents.
Ontario Electricity Support Program
Low-income Ontarians spend a disproportionate share of their disposable income on electricity costs. A typical household with income under $20,000 spends about 10 per cent of its annual earnings on electricity, whereas a household earning $100,000 or more spends less than two per cent.
To address this disparity, the 2014 Budget announced that the Ontario Energy Board would be required to report back on electricity system options for a sustainable, long-term electricity support program specifically designed for low-income Ontario families. In March 2015, the government announced details of the Ontario Electricity Support Program (OESP) to provide a monthly benefit of $20 to $50 directly on the bills of Ontario’s most vulnerable citizens. The size of this benefit would be assessed based on income level and household size, and the program would begin on January 1, 2016.
Proposed amendments to the Ontario Energy Board Act, 1998, would enable the implementation of the OESP. The Ontario Energy Board is moving forward now with the detailed design and implementation that would help ensure low-income electricity consumers have continued access to clean and reliable electricity as the Ontario Clean Energy Benefit concludes on December 31, 2015.
Removing the Debt Retirement Charge from Residential Bills
As part of its commitment to reduce electricity cost pressures, the government is moving forward with removing the Debt Retirement Charge (DRC) from residential electricity users’ bills after December 31, 2015.
This would save a typical residential user about $70 each year and would mean ending the DRC earlier for these users than otherwise provided for in the Electricity Act, 1998. The charge will remain on all other electricity users’ bills until the residual stranded debt is retired — this is currently estimated to occur by the end of 2018, as published in the 2014 Ontario Economic Outlook and Fiscal Review.
The residual stranded debt has been reduced by an estimated $9.3 billion from its estimated peak of $11.9 billion as at March 31, 2004.
Aboriginal Loan Guarantee Program
The Aboriginal Loan Guarantee Program (ALGP) was launched in 2009 to facilitate Aboriginal participation in renewable energy infrastructure projects. To date, the program has leveraged significant investments, with almost $200 million in approved loan guarantees supporting the investments of 11 communities, representing more than 16,000 First Nation people. The six projects supported by the ALGP have invested more than $3.6 billion in the province. These include the recently approved loan guarantees that support a portion of the investment by the Chippewas of Saugeen First Nation and the Chippewas of Nawash First Nation in the Bruce to Milton transmission line, and a portion of the investment by Rainy River First Nations in three solar facilities.
The ALGP is aligned with other Provincial programs supporting Aboriginal participation in the electricity sector, including the Independent Electricity System Operator’s Feed-in Tariff Program, Aboriginal Renewable Energy Fund and Aboriginal Transmission Fund.
Connecting Remote Communities to the Electricity Grid
The government recognizes that connecting remote First Nation communities in northwestern Ontario to the electricity grid is an important social and economic priority. The 2013 Long-Term Energy Plan highlighted that there is a strong economic case for connecting up to 21 First Nation communities, currently supplied by unreliable and unsustainable diesel generation, to Ontario’s transmission and distribution grid. Ontario is also committed to exploring alternatives to reduce diesel use in remote First Nation communities where connection is not economically feasible.
Ontario is fully committed to moving forward with the construction of the necessary infrastructure to connect and reduce diesel use in these communities. However, the Province expects the federal government to find an equitable way to share investment costs for this transformative initiative. The Independent Electricity System Operator has estimated that these changes could save up to $1 billion, compared to the cost of supplying diesel over the next 40 years. It is essential that both orders of government work together to ensure the long-term sustainability and economic prosperity of the region.
Increasing Protection in the Condominium Market
Building on the announcement in the 2014 Budget, the Province is moving forward with reforms to the Condominium Act, 1998, including the establishment of mandatory qualifications for condominium managers. The Province will also be creating two administrative authorities to license condominium managers and improve education and dispute resolution for condominium corporation boards and owners.
Chapter II
ONTARIO'S ECONOMIC OUTLOOK AND FISCAL PLAN
Section A: A Balanced Path to a Balanced Budget
Despite global economic uncertainty, Ontario’s diversified and resilient economy is expected to continue to grow at a solid pace, boosted by a more competitive Canadian dollar, the acceleration in U.S. economic growth and lower oil prices. Ontario’s competitive business environment will continue to attract investment and boost economic activity in the province.
As part of its balanced fiscal policy, the government will continue to deliver programs and vital public services that matter to Ontarians. The government also wants to ensure that Ontarians get the best possible value for every public dollar spent.
Over the past four years, the Province has used a thoughtful and fiscally responsible approach to hold average annual growth in program spending to 1.5 per cent, below CPI inflation, without cutting critical services. Through prudent fiscal management and a rigorous approach to controlling program spending growth, Ontario was the leanest government in Canada with the lowest per capita program spending of any province in 2013–14, and is projected to remain the leanest government in 2014–15.
As outlined in the 2014 Budget, the government is moving forward with implementing its plan to balance the budget by 2017–18, which is the foundation of securing long-term fiscal sustainability of key programs and services. Ontario’s plan to eliminate the deficit builds on past success. In each fiscal year between 2009–10 and 2013–14, the government beat the deficit targets it established after the 2008–09 global recession.
As a result of progress to date on its plan to balance the budget, the government is now projecting a deficit of $10.9 billion in 2014–15 — a $1.6 billion improvement compared to the 2014 Budget forecast. This overachievement reflects an ongoing focus on managing growth in spending, which results in projected program spending being 16.5 per cent of gross domestic product (GDP) in 2014–15, lower than the 17.9 per cent reached in 2009–10.
As a result of lower projected total expense compared to the 2014 Budget, the government is now forecasting deficits of $8.5 billion in 2015–16 and $4.8 billion in 2016–17, and a return to balance in 2017–18. This reflects an improvement of $0.4 billion in 2015–16 and $0.5 billion in 2016–17, compared with the deficit targets laid out in the 2014 Budget.
Building a strong fiscal foundation will support Ontario’s economic growth, protect the integrity of Provincial revenue and assist in the creation of jobs. The government recognizes that balancing the budget by 2017–18 requires a balanced approach to making tough choices. Its plan is centred on:
| › | Program Review, Renewal and Transformation; |
| › | Managing compensation costs; |
› | Maintaining tax fairness and a level playing field for business; and |
| › | Strengthening government transparency, financial management and fiscal accountability. |
Section B: Ontario’s Plan to Eliminate the Deficit
The government has a proven track record of strong fiscal management and has made great progress in beating its deficit targets. However, achieving a balanced budget will require a relentless focus on finding smarter, better ways to deliver the best possible value for every dollar spent, while continuing to make investments that create jobs, expand opportunities and secure prosperity for all Ontarians.
Program Review, Renewal and Transformation — Managing Spending while Transforming Programs and Services
The government recognizes that across-the-board cuts would harm Ontario’s prospects for stronger economic growth and undermine programs that are providing high-quality services. That is why the government has launched Program Review, Renewal and Transformation (PRRT), a fundamentally new approach to multi-year planning and budgeting. The PRRT builds on the work of the Commission on the Reform of Ontario’s Public Services, led by Don Drummond, focusing on program objectives to assess outcomes in an effective, efficient and sustainable way.
Led by the President of the Treasury Board, and supported by a sub-committee of Treasury Board/Management Board of Cabinet, the PRRT is taking an across-government perspective and identifying both short- and longer-term opportunities to transform programs and services. At the same time, the government is making tough choices to transform or end programs that are not performing, do not link to its key priorities or no longer serve a clear public interest.
The PRRT is designed around four key principles:
| › | Examining how every government dollar is spent; |
| › | Using evidence to inform better choices and improve outcomes; |
| › | Looking across government to find the best way to deliver services; and |
| › | Taking a multi-year approach to find opportunities to transform programs and achieve savings. |
Examples of Successful Transformation Initiatives
The government has a strong track record of successfully transforming public services by improving outcomes and managing costs. Examples include:
| › | Moving from a provider-based to a patient-based health care funding model, which includes updating and rebalancing some OHIP fees to reflect advances in technology and applying the best medical evidence on patient outcomes. Government reform of the Provincial drug program has resulted in savings of $500 million per year. |
| › | Transforming the youth justice system by diverting lower-risk youth in conflict with the law to community-based programs. Expanding rehabilitation programs for approximately 11,000 youth per year has both reduced the risk of reoffending and allowed the government to shut down or repurpose many youth detention centres. Key achievements between 2003 and 2013 include a drop in the number of youth in secure custody from over 1,000 to fewer than 400, and a 43 per cent decrease in the youth crime rate. |
| › | Working with municipalities to allow for localized administration of programs for the homeless so that programs respond better to the needs of the families and individuals involved. This is being done through the Community Homelessness Prevention Initiative, which combines funding from five formerly separate housing and homelessness programs into a single, flexible and locally coordinated program. For further information, see Chapter I, Section F: A Fair Society. |
Transformation and Savings Initiatives in 2015–16
For 2015–16, the government has identified through the PRRT process a number of opportunities to improve outcomes for Ontarians while managing costs.
More Effective Investment in Education, Training and Communities
| › | The School Board Efficiencies and Modernization strategy will enable school boards to reduce the costs associated with managing underutilized school space by consolidating schools, sharing space with other boards and fostering community partnerships. The strategy will achieve savings of $58.6 million in the 2015–16 school year, and will be fully phased in by 2017–18. |
| › | To help school boards manage this process and to support the upfront costs of consolidating schools, the government launched a $750 million School Consolidation Capital funding program to support consolidations through retrofits, additions to existing schools or the construction of new facilities. This spring the government announced the first round of projects funded through the School Consolidation Capital program, including seven new replacement schools. These are part of the nearly 70 new schools being planned or under construction across the province. (See Chapter I, Section B: Building Modern Infrastructure and Transportation Networks for examples of school projects.) |
| › | Starting in 2015–16, the government will make changes to the Second Career program by removing client targets for service providers, while ensuring funding supports all eligible clients. These changes will generate up to $40 million per year in ongoing savings and will enable the government to invest in the Canada–Ontario Job Grant and the renewed Ontario Youth Jobs Strategy. |
More Effective Business Supports
| › | A competitive Canadian dollar has enabled Ontario to become an increasingly attractive location for foreign film producers. The government is proposing to reduce the rate of the Ontario Production Services Tax Credit, resulting in savings of approximately $10 million in 2015–16, growing to approximately $25 million in 2017–18. |
| › | The government proposes to narrow eligibility for the Ontario Interactive Digital Media Tax Credit and use a portion of the savings to invest $6 million in 2015–16 and $10 million starting in 2016–17 in a renewed Interactive Digital Media Fund. Realigning funding from an open-ended tax credit to a grant program will improve effectiveness. |
| › | The government proposes to return the Apprenticeship Training Tax Credit to the level of support offered prior to the global recession. This would result in savings of approximately $30 million in 2015–16, growing to approximately $95 million in 2017–18. These savings would be redirected to results-focused employment and training programs, including apprenticeship training through the renewal of the Ontario Youth Jobs Strategy. |
See Chapter IV: A Fair and Sustainable Tax System for more details.
Creating a More Modern and Efficient Government
The government continues to explore opportunities to integrate services, generate savings, and make it easier and more convenient for Ontarians to access public services — when and where they need them. Some examples include:
| › | The government is modernizing ServiceOntario by working to bundle additional routine transactions and exploring ways to connect more Provincial programs to a single business number to simplify the process for businesses. |
| › | Through the Transfer Payment Administrative Modernization initiative, the government will implement a common registration process for all transfer payment recipients that enables insight into and oversight of the full financial relationship between recipient organizations and the Province. A modern and efficient relationship between the government and service-delivery partners, including hospitals, schools, municipalities and others that carry out work on behalf of the Province, will result in less time spent on administration and more time spent on delivering services to Ontarians. |
| › | In 2015, the government is undertaking a review of its Information and Information Technology organization, benchmarking against peer organizations. This review will ensure the effective and efficient use of Information Technology (IT) to transform and modernize public services; drive IT value for money in the delivery of high-quality, optimal services; and manage potential risks inherent in a rapidly changing technological landscape. |
| › | The government is transforming the way income-based benefit programs are delivered to Ontarians as part of its broader commitment to more effective and efficient public services. The Province provides a wide range of direct and in-kind benefits across a spectrum of needs including health, dental, housing and child care. Through Ontario’s benefit transformation initiative, the delivery of these benefits is being streamlined. |
Effective Management of Government’s Real Estate Holdings
Ontario is making more efficient use of its real estate and has committed to shrinking its office footprint by 2022 by 1.3 million square feet, which is larger than 75 NHL hockey rinks. As of March 2015, the government had reduced its office footprint by over 675,000 rental square feet. That is over 50 per cent of the Province’s target, with close to $19 million per year in estimated savings.
The government will continue to drive further administrative efficiencies and maximize revenues by selling properties and demolishing buildings that are no longer required and have ongoing costs and liabilities. Ontario will also continue working with agencies to assess the revenue potential of agency-held properties.
Responsible Management of Health Care
To ensure the sustainability of the Ontario Drug Benefit (ODB) Program and patients’ access to drugs, the Province will continue to make the ODB Program more efficient and effective. These changes will enable the government to achieve savings of over $200 million annually when fully implemented. Important changes include:
| › | Optimizing the quantities of medication dispensed; |
| › | Adjusting some dispensing payments and practices; |
| › | Modernizing the coverage and reimbursement of certain products through evidence-based reviews; and |
| › | Continuing with pan-Canadian work to build better processes and coordination of coverage and pricing for new brand and generic drugs. |
The government has established a Laboratory Services Expert Panel to conduct a review and provide recommendations relating to funding reform options to shift the focus from physician-centred, volume-driven service delivery to improving patient outcomes. This modernization is expected to drive better value for money in lab services by negotiating costs down by $50 million while ensuring high quality and public access.
Through the Assistive Devices Program, the government will continue to review approved costing of funded products, such as mobility devices, to reflect evidence-based updates to pricing. These changes will generate savings of up to $20 million per year, which will result in lower costs for clients while also ensuring the sustainability of the program.
Moving Forward with PRRT
While the PRRT process has identified a number of major initiatives to transform programs, modernize government and deliver savings towards the annual program review savings target of $500 million, it has only just begun. The PRRT is a multi-year initiative and will be considering complex, cross-government opportunities that aim to modernize public services, support fiscal objectives and improve outcomes for people.
Through its Open Government initiative, new forms of in-person and online public engagement will be introduced to seek public feedback and stakeholder input on major transformational initiatives. There will also be increased focus on progress tracking and public reporting.
A new Centre of Excellence for Evidence-Based Decision Making Support will be introduced within government to build capacity to assess how programs are performing, using evidence to inform choices and lead change in critical public services. The Centre’s work will also be supported by a new Behavioural Insights Unit (BIU) in government that designs interventions to assess programs and offer low-cost ways to redesign programs for better outcomes.
Highly successful in other countries such as the United Kingdom, BIUs help government ministries and agencies improve public services by using proven behavioural science research to encourage healthier, smarter and more cost-effective choices. In addition, the government will explore opportunities to partner with external experts and academic institutions to create a network of evidence-based policy that will assist government with difficult policy challenges.
Success in Managing Compensation Costs
Overview
Ontario values its public-sector workers. These dedicated, hardworking individuals are among the best in the world. That is why the government is committed to ensuring fairness for public-sector employees while protecting the public services that Ontarians rely on.
Managing compensation costs is critical to balancing the budget, as over half of government spending goes to salaries and benefits in the Ontario Public Service (OPS) and broader public sector (BPS). Compensation costs must be addressed within Ontario’s existing fiscal framework, which does not include additional funding for wage increases. Any modest wage increases must be offset by other measures to create a net zero agreement, and all public-sector partners must continue to work together to control current and future compensation costs.
Public-Sector Bargaining Outcomes
Consistent with the government’s fiscal plan, negotiated agreements in the OPS were achieved with no new funding for compensation increases.
For example, the government reached a new four-year agreement with the Association of Management, Administrative and Professional Crown Employees of Ontario (AMAPCEO) in 2014, which produced savings of approximately $45 million in 2014–15. The agreement includes a wage freeze in the first two years and a 1.4 per cent wage increase in each of the third and fourth years. The cost of wage increases in 2016 and 2017 was offset over the four-year term through changes to benefits and entitlements, making it a net zero agreement. This agreement supports the government’s commitment to fairness to employees while protecting valued public services.
The government is also taking steps to implement its plan for the responsible management of physician service payments. Under this plan, compensation for physicians will not increase, achieving the Province’s goal of staying within its net zero compensation framework. This plan includes a modest increase in total spending for physicians’ services that will allow Ontario’s health care system to add doctors and address increasing demand due to a growing and aging population. The plan will not reduce quality of care or access to services and will help ensure that every dollar spent on health care gets the best result. Changes in physician compensation have led to $850 million in savings over the last two years, with further savings expected by the end of 2016–17.
Since the 2014 Budget, the average negotiated wage increase across Ontario’s provincial public sector continues to track below all other sectors. Since July 2012, the average annual negotiated wage increase across Ontario’s provincial public sector has been 0.6 per cent. This is lower than Ontario’s municipal public sector (1.9 per cent), the federal public sector in Ontario (1.7 per cent) and Ontario’s private sector (2.0 per cent).
Ontario’s provincial public sector includes about 787,000 unionized employees in the following sectors: ● Health (hospitals, long-term care, public health, community and home care); ● Education (school boards, colleges and universities); ● Social services (children and youth services, developmental services, and community services agencies); ● Ontario Public Service and agencies; and ● Energy (Provincial). |
Executive Compensation in the Broader Public Sector
The government will continue to manage executive compensation in the BPS through the new Broader Public Sector Executive Compensation Act, 2014, which was passed by the Ontario legislature in December 2014.
The Act allows for the establishment of sector-specific compensation frameworks for senior executives in BPS organizations. These frameworks are authorized under the Act to include all aspects of compensation, such as benefits and hard caps on salaries, and will be established based on consultation, the collection of all compensation-related information and extensive research. This approach will mean Ontarians get value for their money while making sure BPS organizations can attract and retain talented individuals.
After a framework is in place for a particular employer, it will immediately apply to new hires and executives moving to new executive positions, and will also fully apply to all existing executives after the expiry of a three-year notice period.
The Act also provides significant compliance and enforcement measures. The legislation will allow for the audit of relevant records, and employers can be required to repay any amount paid above the level that is authorized under a framework. Individuals can be fined for acts of wilful non-compliance with their attestation or the audit requirements.
Managing Public-Sector Pension Costs
Ontario is continuing to take action to reduce pension costs and enhance the affordability of public-sector pension plans. The government’s successful efforts to date to constrain public-sector wage growth, along with better-than-expected investment performance, have reduced total pension expense costs over the medium term by a further $1.6 billion since the 2014 Budget.
In 2012, the Commission on the Reform of Ontario’s Public Services forecast that pension expense would increase by $1.1 billion over the period from 2012–13 to 2017–18. The current government forecast of pension expense projects a decline of $2.3 billion over the same period, resulting in a cumulative reduction of $10.3 billion compared to the Commission’s forecast. This represents a further improvement from the 2014 government forecast, which projected a decline of $1.5 billion over the same period and a cumulative reduction of $8.7 billion compared to the Commission’s forecast.
TABLE 2.1 Difference in Projected Pension Expense versus Commission on the Reform of Ontario’s Public Services’ Forecast ($ Billions) | |
| | | | 2012–13 | | | | 2013–14 | | | | 2014–15 | | | | 2015–16 | | | | 2016–17 | | | | 2017–18 | |
| Commission Report | | | 3.1 | | | | 3.7 | | | | 3.6 | | | | 3.7 | | | | 4.0 | | | | 4.2 | |
| Current Forecast | | | 3.0 | | | | 2.9 | | | | 2.4 | | | | 1.8 | | | | 1.2 | | | | 0.7 | |
| Difference in Forecast | | | (0.1 | ) | | | (0.8 | ) | | | (1.2 | ) | | | (1.9 | ) | | | (2.8 | ) | | | (3.5 | ) |
Source: Ontario Treasury Board Secretariat. | |
Steps Taken to Maintain Tax Fairness and a Level Playing Field for Business
When businesses aggressively avoid or evade paying taxes, everyone else is left to make up the shortfall. This also puts the competitiveness of legitimate businesses at risk. A fair tax system where everyone plays by the rules is critical to sustaining public services. When everyone, including businesses, pays their share of taxes, the government is able to invest in programs and services for all Ontarians.
Since 2013–14, the Province has taken concrete measures to help ensure tax fairness and a level playing field for business. These include:
| › | Enhanced compliance activities (e.g., auditing) to address underground economic activities and aggressive corporate tax avoidance in Ontario through a multi-year agreement with the Canada Revenue Agency. This agreement is forecast to generate $700 million over the four-year life of the arrangement (2013–14 to 2016–17). In less than two years, the Province is well ahead of target, having generated an estimated $420 million in incremental revenues; |
| › | Enhanced auditing of provincially administered taxes, such as the Employer Health Tax, Land Transfer Tax and Tobacco Tax, resulting in over $180 million in additional revenues for Ontario; |
| › | Targeting areas at high risk of underground economic activity with pilot initiatives that focus on mitigating unfair and unsafe circumstances for Ontario’s workers and consumers; and |
| › | Ensuring businesses that win government contracts have met their tax obligations. To date, this enhanced process has verified compliance with tax obligations for nearly 1,000 contracts. |
The government is taking focused action in the residential roofing sector to help ensure compliance with health and safety obligations and to inform consumers and workers about the risks and liabilities associated with participation in the underground economy. By targeting firms that neglect these important regulatory obligations and working to reduce the illegitimate operations, the government is making it more difficult for businesses to operate underground and protecting Ontarians from unsafe working conditions and potential liabilities. In 2015–16, additional action will focus on the auto-body repair sector. |
In total, these efforts have generated an estimated $600 million for Ontario to date, as well as enhanced fairness and safety for Ontario’s consumers and workers.
Going forward, the Province will build on these successful initiatives with new approaches to address the underground economy.
Combating the Underground Economy
In March 2015, the government held a successful underground economy roundtable with representatives from industry, academia and other governments. The roundtable enhanced the collective understanding of the impact of the underground economy on the business community, outlined the experiences of other jurisdictions and identified further initiatives Ontario could consider implementing to effectively combat the underground economy. |
The underground economy generally refers to transactions that are undertaken with a deliberate effort to evade taxes and other legal obligations.
According to Statistics Canada, the country’s underground economy is estimated to be 2.3 per cent of annual gross domestic product (GDP), and is estimated to largely occur in the construction, retail and hospitality sectors1 where cash payments are common. Applied to Ontario, this means approximately $15 billion in annual economic activity.
| 1 | Charles Morissette, “The Underground Economy in Canada, 1992 to 2011,” Statistics Canada, Catalogue no. 13-604-M, no. 73 (2014). |
Ontario is determined to address this illicit activity. The government is proposing further measures in 2015–16 to help level the playing field for business.
Addressing Electronic Sales Suppression
When businesses use sophisticated technology or software to electronically hide or suppress sales, it creates an unfair advantage by allowing them to underreport business income, pay less tax to government and retain the taxes paid by consumers.
Electronic sales suppression is a practice that allows some businesses to use sophisticated software, commonly referred to as zappers, to break the rules by concealing sales records, including the taxes that customers have paid. This prevents tax revenue from being used for essential public services. |
To better address the challenge of electronic sales suppression, the Province is proposing to make the use, manufacture or distribution of electronic sales suppression technologies illegal under the Taxation Act, 2007. This action would align with recommendations made by the Commission on the Reform of Ontario’s Public Services in 2012 and the Organisation for Economic Co-operation and Development in 2013.
As a further measure, Ontario will actively examine options to stop sales suppression at point-of-sale terminals. The government will begin consulting with the business community and other related entities in the coming months on technology-based approaches that could ensure all businesses abide by the same tax obligations without being unnecessarily burdensome.
Better Information and Analytics to Inform Action
Targeting illegitimate business practices is best achieved by identifying areas at high risk of underground economy activity. To do this, Ontario must be in a position to facilitate better information sharing within the government, as well as with other governments and government entities, including municipalities. Examples of potentially useful information include business registration data provided to government and business compliance information generated by government (i.e., violations, fines or penalties). Accordingly, in the coming year, the Province will pursue legislative options to improve its ability to share information.
In examining these options, the government is committed to respecting the privacy of citizens and consulting with all interested parties to ensure that any proposed legislation would appropriately protect privacy.
Further Expansion of Tax Verification
When the government awards a contract to a business, that business must be compliant with its tax obligations before a contract is finalized. The Province remains committed to expanding tax verification to the broader public sector and Crown corporations, and will continue to make progress towards this goal in 2015–16. As part of that progress, Ontario will undertake pilot projects, beginning with subcontractors in targeted areas in the coming year.
First Nation Partnerships The government is committed to continuing a dialogue with First Nation communities and leaders on tobacco. This includes discussions on self-regulation of tobacco on-reserve and revenue-sharing. Such discussions are currently underway with the Chippewas of the Thames First Nation and the Mohawk Council of Akwesasne, and the government welcomes similar discussions with other First Nation communities. To date, these pilot projects have provided an excellent opportunity to establish collaborative relationships and a forum for conducting joint research and analysis to explore models for self-regulation of tobacco on-reserve and revenue-sharing. The government has launched a review of the First Nations Cigarette Allocation System that will be led by independent co-facilitators Kathleen Lickers and Peter Griffin. Over the coming months, the co-facilitators will listen to the perspectives of First Nation communities and stakeholders on improving and modernizing the allocation system. Further, the Province will seek First Nations’ advice on modernizing the Ontario Gas Card Program, focusing on improved customer service and better program integrity. |
Measures to Address Contraband Tobacco
Contraband tobacco is a significant component of Ontario’s underground economy. The presence of contraband tobacco in Ontario is a persistent and complex challenge that undermines provincial health objectives under the Smoke-Free Ontario Strategy, results in less tobacco tax revenue for critical public services and compromises public safety through links with organized crime.
Ontario’s tobacco strategy consists of a balanced approach of partnerships and compliance activities to address the issue of contraband tobacco. In the 2014 Budget, the government amended the Tobacco Tax Act to increase fines for offences related to marked tobacco products, allow for the impounding of vehicles used to transport contraband tobacco and strengthen other enforcement measures. Effective January 1, 2015, the government also took steps to impede the flow of raw leaf tobacco to contraband manufacturers through the introduction of regulations that provide for effective oversight. The government is working cooperatively with growers and others that deal with raw leaf tobacco in Ontario to ensure they are registered. The government will continue to closely monitor implementation of this important initiative and identify possible additional legislative measures to strengthen the raw leaf tobacco oversight regime. |
Building on existing measures, the government is proposing a number of additional actions, including:
| › | Examining opportunities to regulate other tobacco product components such as acetate tow, a key component of cigarette filters. This would help reduce the supply of these components to contraband tobacco manufacturers, thereby limiting their production capability; |
| › | Enhancing partnerships with key enforcement agencies by proposing legislative amendments to support those partnerships and providing resources to the Ontario Provincial Police to address the link between contraband tobacco and organized crime; |
| › | Proposing a legislative change to designate Ministry of Finance enforcement personnel as peace officers, enhancing their capacity to pursue compliance; |
| › | Moving forward to enable information-sharing under the raw leaf tobacco oversight regime; |
| › | Proposing amendments that would authorize a vehicle to be stopped, detained and searched if there are reasonable and probable grounds to believe that it contains raw leaf tobacco; |
| › | Introducing legislative amendments to make it easier to enforce the Tobacco Tax Act against those who interfere with inspections; and |
| › | Ensuring better coordination between inspections conducted by Public Health Units under the Smoke-Free Ontario Act and inspections conducted by the Ministry of Finance under the Tobacco Tax Act. This measure would optimize the effectiveness of compliance efforts and enhance the oversight of tobacco retailers. |
The Province is also proposing to improve the government’s ability to partner with, and provide grants to, external organizations in support of compliance activities related to the Tobacco Tax Act and other statutes.
Reducing Aggressive Corporate Tax Avoidance
Corporate tax avoidance is reducing or eliminating tax liability through planning techniques. Tax avoidance becomes an issue when planning techniques are used aggressively in a way that is inconsistent with, and undermines the intent of, tax legislation. Tax evasion, on the other hand, occurs where there is a deliberate and illegal effort to evade taxes, and is often found in the underground economy.
All corporations should pay their fair share of taxes. That is why Ontario, in conjunction with the federal government, has taken substantive actions to help better address aggressive corporate tax avoidance.
For example, Ontario amended the Taxation Act, 2007, to require reporting of information that could disclose aggressive tax avoidance transactions. With these disclosures, Ontario will be better positioned to effectively assess and address egregious tax practices.
Ontario will continue to focus on finding ways to ensure that tax fairness and revenue integrity are achieved for the benefit of all Ontarians. This focus must be applied globally, as well as within Canada’s borders.
Government Transparency, Financial Management and Fiscal Accountability
Ontario continues to act on opportunities to further strengthen government transparency, financial management and fiscal accountability, to help achieve its fiscal plan and deliver government programs and services.
Government Transparency
Continuing to Improve Agency Accountability, Transparency and Effectiveness
Effective agency management contributes to the efficient use of public funds. In 2014–15, the government introduced new measures to further strengthen its oversight of Provincial agencies and increase transparency and accountability across agencies and the broader public sector.
As of April 1, 2015, Provincial agencies are required to post their governance documents, including business plans, online. In addition, agency Chairs and CEOs are required to attest to their organization’s full compliance with applicable government legislation, regulations and directives.
By undertaking Mandate Reviews for all Provincial agencies, the government is working to align the activities of its agencies in shaping public administration while effectively serving the needs of Ontarians. The government is committed to reducing the number of Provincial agencies by approximately 30 per cent below the 2011 baseline (246 Provincial agencies). Since 2011, the government has taken a thoughtful approach and has eliminated 67 agencies, with additional reductions possible as the government undertakes and considers the outcomes of regular Mandate Reviews.
The government passed the Public Sector and MPP Accountability and Transparency Act, 2014, in December 2014. The Act includes a number of initiatives that will provide increased accountability and more oversight over broader public-sector entities. This will help ensure tax dollars are spent wisely as the Province delivers on its commitment to eliminate the deficit by 2017–18.
In addition, the government will dissolve three inactive adjudicative tribunals: the Chiropody, Dentistry and Optometry Review Committees. These committees have been inactive since 2003, as practitioner payment disputes are resolved through an OHIP review process.
Environmental Liabilities
The government continues to move ahead with more transparent, consistent reporting, to be prepared to address requirements as and when they are determined, under both federal and provincial environmental regulation. In line with new public-sector accounting standards, the consolidated financial impact of remediation for environmentally contaminated sites for which the government and its consolidated entities are responsible will be reflected in financial reporting, beginning with the Public Accounts of Ontario 2014–2015. The Province will propose legislative amendments to support reporting of these financial obligations.
Recent Developments in Public Sector Accounting Standards
The government continues to work with the Public Sector Accounting Board (PSAB) regarding implementation of new standards on financial instruments and foreign currency translation, which are effective April 1, 2016, for senior governments. The PSAB recently requested feedback from stakeholders on clarification of the scope of application, and new guidance on transitional provisions. The government will work with PSAB to ensure its reporting requirements are properly addressed for implementing these new standards.
Financial Management
Effective Toll Revenue Management
The Highway 407 East project will help relieve congestion and support the efficient movement of people and goods through the eastern Greater Toronto Area and beyond. The government will propose legislative amendments to support integrated management of toll revenues by its tolling services provider. Customers travelling on both Highway 407 East and the 407 Express Toll Route (ETR) will experience a seamless and integrated experience as only one transponder will be required and the consumer will receive only one bill. To protect drivers from unreasonable rates, initial toll fees on Highway 407 East will be lower than those charged by the existing 407 ETR.
Financial Management and Business Modernization
The government is developing enhanced strategic financial management and business analysis tools and processes that will support transformational improvements in ministries’ operations and lead to improved interactions with business partners and the public.
Interim Appropriation Act
The government will introduce an Interim Appropriation Act for 2015–16. If approved by the legislature, this would provide legal spending authority for anticipated 2015–16 spending, pending completion of the supply process. This would enable the government to continue operations until the Legislative Assembly has approved the Expenditure Estimates and a Supply Act is enacted.
Fiscal Accountability
The government plans to propose amendments to the Financial Administration Act to support implementation of the enhanced role for the Treasury Board Secretariat in strengthening oversight and fiscal management, as well as other technical amendments to enhance legislative clarity.
Financial Accountability Officer
Passage of the Financial Accountability Officer Act, 2013, in the fall of 2013, established a Financial Accountability Officer (FAO) as an independent officer of the legislature. The FAO has a mandate to provide independent analysis to the legislature about the state of the Province’s finances, including the Ontario Budget, as well as to examine trends in the provincial and national economies.
In February 2015, the legislature announced the appointment of Stephen LeClair as Ontario’s first FAO. Ontario is the first province in Canada to introduce this oversight office.
The establishment of the FAO’s office moves forward the government’s commitment to enhance accountability and transparency of the Province’s finances.
Modernizing Government Advertising
The government will propose amendments to the Government Advertising Act, 2004, that would modernize and broaden the scope of the Act to ensure greater transparency about how the government communicates through advertisements and improve the process by which government advertisements are reviewed.
The proposed amendments would:
| › | Add online and digital advertising to the Auditor General’s scope of review; |
| › | Require the government to submit preliminary versions of advertisements for review by the Auditor General, as well as a final version; |
| › | Define what “partisan” means in relation to government advertising; and |
| › | Legislate the long-standing practice of restricting government advertising during provincial general elections. |
The proposed amendments support the government’s commitment to openness, transparency and accountability in the way government conducts business, including public advertising.
Informed by the report of the Chief Electoral Officer, the Province will also move to strengthen rules around election-related, third-party advertising to protect the public interest.
Section C: 2014–15 Interim Fiscal Performance
The 2014 Budget outlined a plan for 2014–15 that included investing in key priorities while managing responsibly and unlocking the value of the Province’s assets. The 2015 Budget confirms that the government is making real progress.
Ontario’s deficit for 2014–15 is now projected to be $10.9 billion — a $1.6 billion improvement compared to the 2014 Budget forecast. The government’s strong performance against its deficit target is the result of sound fiscal management and a relentless focus on finding smarter and better ways to deliver services.
TABLE 2.2 2014–15 In-Year Fiscal Performance ($ Millions) | |
| | | Budget Plan | | | Interim | | | In-Year Change | |
| Revenue | | | | | | | | | |
Taxation Revenue | | | 83,365 | | | | 82,654 | | | | (711 | ) |
Government of Canada | | | 21,882 | | | | 21,713 | | | | (169 | ) |
Income from Government Business Enterprises | | | 5,026 | | | | 5,311 | | | | 285 | |
Other Non-Tax Revenue | | | 8,598 | | | | 8,839 | | | | 241 | |
| Total Revenue | | | 118,871 | | | | 118,517 | | | | (354 | ) |
| | | | | | | | | | | | | |
| Expense | | | | | | | | | | | | |
Programs | | | 119,366 | | | | 118,775 | | | | (591 | ) |
Interest on Debt | | | 11,010 | | | | 10,675 | | | | (335 | ) |
| Total Expense | | | 130,376 | | | | 129,450 | | | | (926 | ) |
| Reserve | | | 1,000 | | | | – | | | | (1,000 | ) |
| Surplus/(Deficit) | | | (12,505 | ) | | | (10,933 | ) | | | 1,572 | |
Note: Numbers may not add due to rounding. | |
Total revenue is projected to be $354 million below the 2014 Budget Plan due to lower Taxation Revenue and Government of Canada transfers. This is partially offset by higher net Income from Government Business Enterprises (GBEs) and higher Other Non-Tax Revenue.
Ontario’s program expense is projected to be $591 million lower than outlined in the 2014 Budget, the sixth year in a row that spending is expected to be lower than forecast. This success is due to an ongoing focus on managing growth in spending and working to achieve the best possible value for every dollar spent. In fact, over the past four years, the Province has managed to hold average annual growth in program spending to 1.5 per cent, below CPI inflation, without cutting services that people rely on.
Program expense: all expenses except interest on debt. |
Total expense in 2014–15 is projected to be $926 million lower than forecast in the 2014 Budget. This includes the impact of a lower interest on debt expense projection, resulting primarily from lower-than-forecast interest rates and a one-time gain from the sale of asset-backed commercial paper that was written down in prior fiscal years.
The fiscal plan outlined in the 2014 Budget included a $1.0 billion reserve to protect the fiscal outlook against adverse changes in the Province’s revenue and expense forecasts. This prudence helped mitigate the impact of the projected revenue decline on the Province’s fiscal performance.
Given the preliminary nature of these estimates, the interim forecast is subject to change as actual Provincial revenue and expense are finalized in the Public Accounts of Ontario 2014–2015 this coming summer.
In-Year Revenue Performance
Total revenue in 2014–15 is estimated to be $118,517 million. This is $354 million, or 0.3 per cent, below the amount projected in the 2014 Budget. The decrease is largely due to weaker Taxation Revenue in 2014–15, including adjustments with respect to prior tax years, and lower-than-expected Government of Canada transfers. These lower revenue sources are partially offset by higher Income from GBEs and higher Other Non-Tax Revenue.
TABLE 2.3 Summary of Revenue Changes since the 2014 Budget ($ Millions) | |
| | | | | | Interim 2014–15 | |
| Taxation Revenue | | | | | | |
Sales Tax | | | (197 | ) | | | |
Land Transfer Tax | | | 154 | | | | |
Personal Income Tax | | | (144 | ) | | | |
Employer Health Tax | | | (121 | ) | | | |
Corporations Tax | | | (106 | ) | | | |
All Other Taxes | | | (297 | ) | | | |
| | | | | | | | (711 | ) |
| Government of Canada | | | (169 | ) | | | | |
| | | | | | | | (169 | ) |
| Income from Government Business Enterprises | | | | | | | | |
Ontario Power Generation Inc./Hydro One Inc. | | | 371 | | | | | |
Ontario Lottery and Gaming Corporation | | | (118 | ) | | | | |
Liquor Control Board of Ontario | | | 32 | | | | | |
| | | | | | | | 285 | |
| Other Non-Tax Revenue | | | 241 | | | | | |
| | | | | | | | 241 | |
Total Revenue Changes since the 2014 Budget | | | | | | | (354 | ) |
Note: Numbers may not add due to rounding. | |
Revenue Changes
Highlights of key 2014–15 revenue changes from the 2014 Budget forecast are as follows:
| › | Sales Tax revenues are estimated to be $197 million lower, largely reflecting one-time adjustments to estimates of Ontario’s Harmonized Sales Tax entitlements for 2012 and 2013. |
| › | Land Transfer Tax revenues are estimated to be $154 million higher due to continued strength in the Ontario housing market. |
| › | Personal Income Tax revenues are estimated to be $144 million lower, largely because of lower-than-expected tax assessments for 2013 and lower growth in wages and salaries.1 |
| › | Employer Health Tax revenues are estimated to be $121 million lower, reflecting lower growth in wages and salaries. |
| › | Corporations Tax revenues are estimated to be $106 million lower, mainly due to one-time reductions in tax assessments in respect of years prior to 2013, partially offset by the impact of stronger growth in net operating surplus of corporations in 2014. |
| › | All Other Tax revenues combined are estimated to be $297 million lower, mainly due to lower payments in lieu of taxes from electricity-sector companies and lower Tobacco Tax revenue. |
| › | Government of Canada transfers are estimated to be $169 million lower, mainly due to lower infrastructure transfers as a result of revised timelines in the Building Canada Fund and lower transfers to consolidated Ontario government agencies. These reductions are largely offset by corresponding lower spending. |
| › | The combined net incomes of Ontario Power Generation Inc. (OPG) and Hydro One Inc. (Hydro One) are estimated to be $371 million higher than the 2014 Budget forecast, mainly reflecting lower operating costs, better financial market performance of OPG’s nuclear funds, and higher Hydro One transmission revenue. |
| 1 | Wages and salaries account for about 85 per cent of employee compensation reported in Statistics Canada’s Provincial Economic Accounts. The remainder is accounted for by employers’ social contributions. |
| › | Net income from the Liquor Control Board of Ontario is projected to be slightly higher, reflecting stronger sales, while net income from the Ontario Lottery and Gaming Corporation is projected to be lower, reflecting lower-than-anticipated sales, primarily in the lottery business. |
| › | Other Non-Tax Revenue is projected to be $241 million higher, mainly reflecting $200 million higher-than-projected revenue on the sale of the Province’s shares of General Motors Company, as well as higher recoveries of prior-year expenditures by government ministries. |
In-Year Expense Performance
Total expense in 2014–15 is currently projected to be $926 million lower than the 2014 Budget forecast. The revised projection is primarily the result of the government’s ongoing efforts to make responsible choices and lower-than-projected interest on debt expense.
For 2014–15, 14 out of 24 ministries are projected to spend below their total expense allocation.
The 2014 Budget included a $1.1 billion year-end savings target in addition to a $250 million program review savings target. The government has once again overachieved on its savings targets by taking action to produce results. The government is on track to exceed the year-end savings target by more than 50 per cent.
TABLE 2.4 Summary of Expense Changes since the 2014 Budget ($ Millions) | |
| | | Interim 2014–15 | |
Savings Targets Included in the 2014 Budget | | | |
Year-End Savings Target | | | 1,100 | |
Program Review Savings Target | | | 250 | |
Total Savings Targets Included in the 2014 Budget | | | 1,350 | |
| | | | | |
Increase/(Decrease) since the 2014 Budget1 | | | | |
Health Sector | | | 93 | |
Education Sector2 | | | (248 | ) |
Postsecondary and Training Sector | | | (85 | ) |
Children’s and Social Services Sector | | | (243 | ) |
Justice Sector | | | 38 | |
Other Programs | | | (1,496 | ) |
Total Increase/(Decrease) since the 2014 Budget | | | (1,941 | ) |
| | | | | |
Net Program Expense Increase/(Decrease) after Applying Savings to Meet Total Savings Targets Included in the 2014 Budget | | | (591 | ) |
Interest on Debt | | | (335 | ) |
Total Expense Changes since the 2014 Budget | | | (926 | ) |
1 Expense change by sector, restated for fiscally neutral transfers of programs between sectors. 2 Excludes Teachers’ Pension Plan. Teachers’ Pension Plan expense is included in Other Programs. Note: Numbers may not add due to rounding. | |
Expense Changes
Key expense changes since the 2014 Budget include the following:
| › | Health sector expense is projected to increase by $93 million, due to additional demand for physician services, new cancer medications, and increased utilization in drug programs. |
| › | Education sector expense is projected to decrease by $248 million, primarily due to lower-than-expected school board expense and savings in ministry administration. School board expense savings are mainly due to lower-than-projected student enrolment and lower-than-expected spending on school operating costs. |
| › | Postsecondary and training sector expense is projected to decrease by $85 million, mainly due to lower-than-forecast enrolment in postsecondary institutions and lower-than-projected spending on employment and training programs due to improving job opportunities, offset by higher expense on tax credits to employers to support training. |
| › | Children’s and social services sector expense is projected to decrease by $243 million, due in part to lower-than-expected take-up of low-income benefits such as Ontario Works and the Ontario Child Benefit, reflecting improvements in the economy. |
| › | Justice sector expense is expected to increase by $38 million, primarily due to capital repair and rehabilitation upgrades to facilities across the province to address health and safety issues, additional programming and training requirements at correctional facilities, and settlements under the Proceedings Against the Crown Act. |
| › | Other programs expense is projected to decrease by $1,496 million, due to implementation delays related to the Building Canada Fund; lower demand in agricultural Business Risk Management Programs; continued restraint in collective bargaining that has resulted in savings in benefits and entitlements; and a variety of administrative savings across government such as reduced spending on information technology and lower fees paid to the Canada Revenue Agency for the administration of the Ontario Trillium Benefit. |
Interest on debt expense is projected to be $335 million lower than forecast in the 2014 Budget, mainly resulting from lower‐than‐forecast interest rates and a one‐time gain from the sale of asset‐backed commercial paper that was written down in prior fiscal years.
Achieving the 2014–15 Savings Target
The government has consistently demonstrated that it can meet its savings targets. For 2014–15, a $250 million program review savings target was met through a number of initiatives that identified efficiencies, lowered costs or reduced administrative overhead without impacting front-line services.
Achieving the 2014–15 Program Review Savings Target The government met its $250 million program review savings target through initiatives such as: ● Negotiating lower prices for goods and services, achieving savings of approximately $40 million through lower contract costs for vaccines and telehealth services, as well as approximately $7 million in savings from contracts related to government cellular phone plans and 1-800 lines; ● Achieving approximately $15 million in annual savings in information technology, through internal efficiencies such as data centre, desktop and service management operations; ● Modernizing the delivery of natural resources management programs, achieving savings of $15 million in 2014–15 as a result of streamlining program delivery, automating business processes and realigning programs to focus on core priorities; ● Restraining compensation growth in line with the government’s “net zero” policy, including an agreement with the Association of Management, Administrative and Professional Crown Employees of Ontario (AMAPCEO), saving approximately $45 million in 2014–15 through changes to benefits and entitlements, while providing modest salary increases (see Chapter II, Section B: Ontario’s Plan to Eliminate the Deficit for more details); and ● Achieving approximately $150 million in savings through operational and administrative efficiencies across government, including through a reduction in the government’s office footprint and prudent management of discretionary costs, such as supplies and travel. |
Section D: Ontario’s Economic Outlook
Ontario’s economy is expected to grow at a solid pace. This is despite continued slow growth in most advanced economies following the global economic recession, as well as volatility in global financial and commodity markets. Most forecasters are predicting Ontario will be among the provincial leaders in economic growth over the next two years, with growth outpacing the national average.
This is a time for strong business confidence in Ontario as the combination of stronger U.S. growth, lower oil prices and a more competitively valued Canadian dollar will support stronger growth for the province. The ongoing transition of Ontario’s economy to more export- and investment-led growth is expected to continue and gain momentum as businesses seize the improved economic conditions.
The Ministry of Finance is forecasting that growth in real gross domestic product (GDP) will rise from 2.2 per cent in 2014 to 2.7 per cent in 2015, and then average 2.2 per cent between 2016 and 2018.1
TABLE 2.5 Ontario Economic Outlook (Per Cent) |
| | 2012 | 2013 | 2014 | 2015p | 2016p | 2017p | 2018p |
| Real GDP Growth | 1.7 | 1.3 | 2.2 | 2.7 | 2.4 | 2.2 | 2.1 |
| Nominal GDP Growth | 3.2 | 2.4 | 3.6 | 4.2 | 4.2 | 4.2 | 4.1 |
| Employment Growth | 0.7 | 1.8 | 0.8 | 1.1 | 1.3 | 1.4 | 1.3 |
| CPI Inflation | 1.4 | 1.0 | 2.4 | 1.2 | 2.0 | 2.0 | 2.0 |
p = Ontario Ministry of Finance planning projection. Sources: Statistics Canada and Ontario Ministry of Finance. |
As part of the government’s prudent fiscal management, the economic growth outlook used in this Budget is slightly below the average of private-sector forecasts. However, the Province believes its economic plan, which includes investments in skills and knowledge, in infrastructure and in business, will pay real economic dividends and lead to even higher economic growth.
| 1 | Based on information available to March 31, 2015. |
Ontario’s Economy Gaining Momentum
Economic indicators have demonstrated a resumption of more robust growth for Ontario in 2014, which is expected to continue. The sharp decline in oil prices, a lower Canadian dollar and a strengthening U.S. economy will support higher growth over the outlook.
This will be a boost from Ontario’s modest economic growth in 2013 when real GDP rose by 1.3 per cent — the slowest pace of growth since the global recession. That slow pace of growth reflected lower residential construction, weaker business investment and an easing of export growth.
In 2014, the Ontario economy grew by a solid 2.2 per cent, supported by strong gains in net trade and consumer spending.
Ontario’s economic expansion gained momentum in 2014, with the economy now 8.6 percentage points above its pre-recession level.
The view among private-sector economists, supported by recent economic data, suggests Ontario’s economy is well positioned for continued growth.
Employment Gains Continue
Ontario’s employment recovery from the recession has been faster than in the United States and the average for member countries in the Organisation for Economic Co-operation and Development (OECD).
Since the recessionary low in June 2009, over 500,000 net new jobs have been created, primarily in the private sector. Not only has Ontario recovered all the jobs lost since the 2008 recession, but the majority of net new jobs are in industries paying above-average wages.
Ontario’s unemployment rate continues to improve, falling from 7.6 per cent in 2013 to 7.3 per cent in 2014 — the lowest rate since 2008.
Global Economic Developments and Outlook
Economic growth remains moderate but uneven across the world. Interest rates and currency valuations have been volatile in many countries. Oil prices have also declined dramatically, boosting growth prospects for oil-importing economies such as the United States and Europe. The global economy expanded by 3.3 per cent in 2014, matching its growth in 2013. In the United States, economic growth rebounded strongly following a weather-induced contraction in the first quarter of 2014. In Europe, economic growth remains weak, mainly due to slow growth in domestic demand. In emerging market economies, growth has moderated, due in large part to lower commodity prices and modest growth in China.
Global economic growth is set to improve in 2015, led by stronger growth in the United States. Europe is in the midst of a modest and uneven recovery, but should benefit from recent policy measures and low oil prices.
Economic growth in China, while expected to remain relatively robust, is projected to soften as the country transitions from rapid credit- and investment-led growth towards more balanced and sustainable consumption-led growth. Other emerging markets are expected to strengthen in 2015, although oil-producing countries will be adversely impacted by the drop in oil prices and will be vulnerable to capital outflows and currency depreciations.
Ontario’s relatively solid growth, combined with a stable banking sector, sound fiscal policy and competitive business environment, will help attract business investment against this challenging global backdrop.
U.S. Economy
With more than 160 million U.S. consumers located within a day’s drive of southern Ontario, the United States remains Ontario’s largest trading partner. The U.S. market is particularly important for many Ontario industries, including motor vehicles, mechanical equipment, plastics and steel, and pharmaceuticals.
U.S. real GDP rose by 2.4 per cent in 2014, up from a 2.2 per cent gain in 2013. U.S. real GDP is projected to increase 3.1 per cent in 2015 and 2.9 per cent in 2016, the strongest two-year period of economic growth since 2005–06.
U.S. employment gains averaged 260,000 jobs per month in 2014, up from 199,000 in 2013, lowering the U.S. unemployment rate from 6.6 per cent in January 2014 to 5.6 per cent by year-end.
The U.S. Federal Reserve, which ended its quantitative easing program in the fall of 2014, is expected to raise short-term interest rates later this year. Long-term interest rates, which have remained at historically low levels due to the relative safety of U.S. government assets, are expected to rise gradually over the outlook.
The U.S. dollar continues to strengthen, reflecting the relative improvement in the U.S. economy and the expectation of higher interest rates in comparison to other major economies. The stronger currency, coupled with lower oil prices, steady employment gains and higher wages, will provide support for consumption expenditures, which are expected to be a major driver of U.S. economic growth in 2015.
Oil Prices
The price of West Texas Intermediate (WTI) crude oil declined sharply by about 60 per cent from its June 2014 peak of $108 US per barrel. In March 2015, WTI oil was trading below $50 US per barrel, the lowest price in six years. Oil production in the United States surged to its highest level in almost three decades, with significant new output from shale formations. At the same time, the Organization of the Petroleum Exporting Countries (OPEC) maintained production levels, putting additional downward pressure on oil prices.
Crude oil production is expected to remain elevated over the first half of 2015, keeping downward pressure on prices. However, in the medium term, oil prices are expected to begin recovering as high-cost producers cut output.
In 2015, the price of WTI oil is expected to average $55 US per barrel, with private-sector forecasts ranging from $45 US to $70 US per barrel. On average, forecasters expect the price of oil to gradually increase over the medium term, rising to $84 US by 2018. As an oil-importing jurisdiction, lower-priced oil reduces input costs for Ontario industry and puts money into consumers’ pockets.
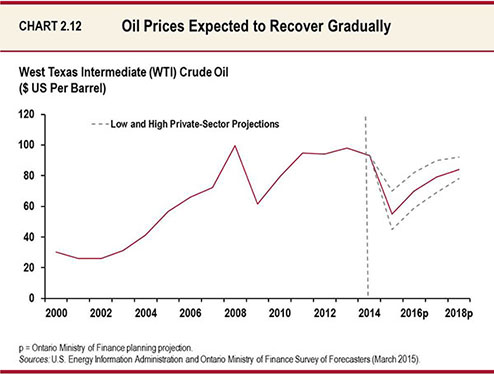
Lower Oil Prices Will Provide Savings to Consumers and Businesses The price of West Texas Intermediate (WTI) crude oil is expected to average $55 US per barrel in 2015, down from an average of $93 US in 2014. This 40 per cent drop in the average annual price of oil will translate into lower retail prices for gasoline, diesel and other refined products in 2015, benefiting consumers and businesses in Ontario. Assuming relatively stable demand for gasoline and other oil products, Ontario consumers and businesses could save about $5.1 billion in 2015. Of this, about $2.6 billion would accrue to firms and $2.4 billion to households.* The average Ontario household could expect to save almost $500 from lower fuel costs in 2015. A portion of this will be saved or used to pay down debt and the rest will be spent on goods and services. Savings accruing to Ontario businesses will lower input costs and increase cash flow, which could also help boost investment. A similar positive effect from lower oil prices is expected for the province’s major trading partner, the United States, which will support demand for Ontario exports. * These shares are based on Statistics Canada’s 2011 Ontario Input–Output Tables. A small share of savings ($140 million) would also accrue to government and the non-profit sector. |
The Canadian Dollar
The Canadian dollar averaged 91 cents US in 2014, down from 97 cents US in 2013. Recently, the dollar has traded around 80 cents US, its lowest level since early 2009. Sharp declines in oil prices since June 2014 have put downward pressure on the dollar and lowered the growth outlook for Canada. This has prompted the Bank of Canada to cut interest rates, adding further downward pressure on the currency.
The lower Canadian dollar will help improve Ontario business competitiveness and encourage stronger export growth. However, the lower value of the Canadian dollar will raise prices for imported goods, affecting both businesses and consumers.
The Canadian dollar is expected to average 80 cents US in 2015 and then rise gradually over the outlook to 89 cents US by 2018.
Financial Markets
In January, the Bank of Canada cut the target for the overnight rate to 0.75 per cent from 1.0 per cent, where it had been since September 2010. The Bank indicated that it had lowered interest rates in response to the sharp drop in oil prices and the corresponding risks for Canadian economic growth and inflation.
In Europe, the European Central Bank announced a significant new quantitative easing program in January, to purchase approximately $1.2 trillion US in government bonds, in an attempt to stimulate the European economy. In the United States, the Federal Reserve ended its quantitative easing program in October 2014, reflecting strong signs of a sustained improvement in the U.S. economy. While many market participants had expected the U.S. Federal Reserve to begin increasing its policy interest rate by mid-2015, softening global growth, a strong U.S. dollar and weak CPI inflation may delay the announcement.
The yield on a three-month Canadian treasury bill is expected to average 0.6 per cent in 2015 and rise to 1.1 per cent in 2016. Yields are forecast to reach 3.4 per cent by 2018.
Long-term interest rates have been declining in many advanced countries, reflecting weak global growth and inflation prospects. The yield on 10-year Government of Canada bonds averaged 2.2 per cent in 2014, down from 2.3 per cent in 2013. Long-term Government of Canada bond yields are expected to decline to 1.8 per cent in 2015 and then rise to 2.7 per cent in 2016, 3.8 per cent in 2017 and 4.2 per cent in 2018.
Forecasts for key external factors are summarized in the table below. These are used as the basis for the Ministry of Finance’s forecast for Ontario’s economic growth.
| TABLE 2.6 Outlook for External Factors | |
| | | 2012 | | | 2013 | | | 2014 | | | | 2015 | p | | | 2016 | p | | | 2017 | p | | | 2018 | p |
| World Real GDP Growth(Per Cent) | | | 3.4 | | | | 3.3 | | | | 3.3 | e | | | 3.5 | | | | 3.7 | | | | 4.1 | | | | 4.0 | |
| U.S. Real GDP Growth (Per Cent) | | | 2.3 | | | | 2.2 | | | | 2.4 | | | | 3.1 | | | | 2.9 | | | | 2.7 | | | | 2.6 | |
| West Texas Intermediate Crude Oil ($US/bbl.) | | | 94 | | | | 98 | | | | 93 | | | | 55 | | | | 70 | | | | 79 | | | | 84 | |
| Canadian Dollar (Cents US) | | | 100.1 | | | | 97.1 | | | | 90.5 | | | | 79.5 | | | | 80.0 | | | | 85.0 | | | | 89.0 | |
Three-Month Treasury Bill Rate1 (Per Cent) | | | 0.9 | | | | 1.0 | | | | 0.9 | | | | 0.6 | | | | 1.1 | | | | 2.5 | | | | 3.4 | |
10-Year Government Bond Rate1 (Per Cent) | | | 1.9 | | | | 2.3 | | | | 2.2 | | | | 1.8 | | | | 2.7 | | | | 3.8 | | | | 4.2 | |
e = estimate. p = Ontario Ministry of Finance planning projection based on external sources. 1 Government of Canada interest rates. Sources: IMF World Economic Outlook (October 2014 and January 2015), U.S. Bureau of Economic Analysis, Blue Chip Economic Indicators (March 2015), U.S. Energy Information Administration, Bank of Canada, Ontario Ministry of Finance Survey of Forecasters (March 2015) and Ontario Ministry of Finance. | |
Table 2.7 provides current estimates of the impact of sustained changes in key external factors on the growth of Ontario’s real GDP, assuming other external factors are unchanged. The relatively wide range for the impacts reflects uncertainty regarding how the economy would be expected to respond to these changes in external conditions.
TABLE 2.7 Impacts of Sustained Changes in Key External Factors on Ontario’s Real GDP Growth (Percentage Point Change) |
| | First Year | Second Year |
| Canadian Dollar Depreciates by Five Cents US | +0.1 to +0.7 | +0.2 to +0.8 |
| Crude Oil Prices Decrease by $10 US per Barrel | +0.1 to +0.3 | +0.1 to +0.3 |
| U.S. Real GDP Growth Increases by One Percentage Point | +0.2 to +0.6 | +0.3 to +0.7 |
| Canadian Interest Rates Increase by One Percentage Point | –0.1 to –0.5 | –0.2 to –0.6 |
Source: Ontario Ministry of Finance. |
Outlook for Ontario’s Economic Growth
The Ministry of Finance is forecasting Ontario’s real GDP to increase by a solid 2.7 per cent in 2015, followed by 2.4 per cent in 2016, 2.2 per cent in 2017 and 2.1 per cent in 2018.
While a forecast for sustained moderate growth is a reasonable basis for planning, there is always the potential for stronger growth as well as a risk that the economy could underperform. On the upside, lower oil prices, a more competitively valued Canadian dollar and stronger U.S. growth could boost Ontario exports more than expected. On the downside, volatility in commodity and financial markets along with moderating growth in important emerging market economies represent key risks for the world economy.
For Ontario, the transition of growth away from government spending and residential investment towards exports and business investment is expected to gain momentum. Export growth nearly doubled in 2014 and is expected to increase significantly again in 2015, reflecting the resurgent U.S. economy, a lower dollar and improved competitiveness. Lower interest rates and solid employment gains will also support consumer spending, allowing for more balanced economic expansion.
Lower oil prices and a more competitively valued Canadian dollar are giving the Ontario economy a boost, but the government is not counting on these developments alone, which can be temporary. That is why Ontario is continuing to invest in advanced manufacturing and encouraging businesses to become more efficient, innovative and competitive.
Ontario’s Consumer Price Index (CPI) increased by 2.4 per cent in 2014, rising from a 1.0 per cent increase in 2013. The increase in CPI inflation was partly due to higher import prices, reflecting the decline in the Canadian dollar. Lower fuel prices are expected to help CPI inflation moderate to 1.2 per cent in 2015. Over the medium term, CPI inflation is expected to return to its long-run trend, averaging 2.0 per cent per year.
Ontario’s labour market is expected to continue strengthening in 2015, and grow at a steady pace over the forecast period. Employment is forecast to increase by 1.1 per cent or 78,000 net new jobs in 2015, and rise by an average of 1.4 per cent per year over the 2016 to 2018 period. Steady gains in employment will lower Ontario’s unemployment rate from an annual average rate of 7.3 per cent in 2014 to 6.3 per cent in 2018.
Household income increased by 3.4 per cent in 2014 and is projected to grow by an average rate of 4.2 per cent annually over the 2015 to 2018 period. Real household spending growth is expected to average 2.4 per cent per year over the 2015 to 2018 period.
There were 59,100 housing starts in Ontario in 2014, down modestly from 61,100 starts in 2013. Existing home sales rose by 3.7 per cent in 2014, while the average price of an Ontario resale home increased by 7.0 per cent.
Demand for new homes in Ontario will continue to be supported by steady growth in the number of new households. Housing starts are expected to average 66,300 units per year between 2015 and 2018.
The relatively strong gains in house prices in Ontario and Canada over the past few years have been supported by record-low interest rates and continued gains in employment. Though private-sector economists expect interest rates to rise from current historically low levels, rising employment, higher incomes and continued growth in the number of Ontario families will support demand for housing, keeping house prices relatively stable over the outlook.
Canada’s household debt-to-income ratio increased to 163.3 per cent in the fourth quarter of 2014, rising for the third consecutive quarter. Despite relatively moderate year-over-year increases, the level of household debt in Canada remains elevated.
Debt service costs as a per cent of household disposable income, a measure of the affordability of interest payments, declined from a high of 9.2 per cent in the fourth quarter of 2007 to 6.9 per cent in the fourth quarter of 2014, remaining close to an all-time low for the past three quarters, a reflection of historically low interest rates.
Despite solid profit levels, business investment has been disappointing over the last three years. However, gains in machinery and equipment investment in the second half of 2014 provide encouraging evidence that business confidence and investment are gaining momentum. To support stronger economic growth, business needs to increase investment to take advantage of the opportunities provided by strong corporate profits and healthy credit markets.
Business investment in machinery and equipment is expected to increase by 5.1 per cent in 2015 and by an average of 5.9 per cent annually over the next three years. Low interest rates, a more competitive exchange rate and a stronger U.S. economy provide compelling reasons why this is a time for confidence in the Ontario economy.
The net operating surplus of corporations rose by 8.0 per cent in 2014, and is projected to grow by an average of 4.7 per cent annually over the 2015 to 2018 period. As a share of Ontario GDP, the net operating surplus of corporations increased to 12.5 per cent in 2014, its highest share since 2011.
Ontario’s export performance has been challenged since the Canadian dollar began to appreciate in the early 2000s, and, more recently, since global growth slowed. However, despite these challenges, the share of Ontario’s exports to non-U.S. destinations has more than doubled over the last 10 years. Export diversification is allowing Ontario companies to reach new markets, boosting economic growth and job creation.
Although markets for Ontario exports have become more diversified in recent years, the United States remains by far Ontario’s largest trading partner. Over the 2011–14 period, Ontario exports to the United States increased by 17.5 per cent. A resurgent U.S. economy and, in particular, a rebound in U.S. consumer demand, including motor vehicle sales, will support stronger growth in Ontario’s exports. U.S. motor vehicle sales are expected to rise 3.0 per cent in 2015.
The recent decline in the Canadian dollar is beneficial for Ontario exporters and the province’s import-competing industries, such as tourism and hospitality. However, to take full advantage of the strengthening U.S. economy and the lower Canadian dollar, higher investment spending will be needed to boost the capacity of Ontario exporters.
Overall, Ontario’s total exports in real terms are projected to slow from 5.0 per cent in 2015 to 3.3 per cent per year, on average, between 2016 and 2018 — mostly the result of more moderate U.S. growth and a rising Canadian dollar.
Details of the Ontario Economic Outlook
The following table provides details of the Ministry of Finance’s economic outlook for 2015 to 2018.
TABLE 2.8 The Ontario Economy, 2013 to 2018 (Per Cent Change) | |
| | | Actual | | | Projection | |
| | | 2013 | | | 2014 | | | 2015 | | | 2016 | | | 2017 | | | 2018 | |
| Real Gross Domestic Product | | | 1.3 | | | | 2.2 | | | | 2.7 | | | | 2.4 | | | | 2.2 | | | | 2.1 | |
Household Consumption | | | 2.1 | | | | 2.5 | | | | 2.6 | | | | 2.4 | | | | 2.3 | | | | 2.2 | |
Residential Construction | | | (2.3 | ) | | | 0.7 | | | | 1.8 | | | | 1.6 | | | | 2.0 | | | | 2.4 | |
Non-residential Construction | | | (5.2 | ) | | | (1.8 | ) | | | 4.5 | | | | 3.1 | | | | 3.5 | | | | 2.8 | |
| Machinery and Equipment | | | (8.2 | ) | | | 0.7 | | | | 5.1 | | | | 6.0 | | | | 5.6 | | | | 6.1 | |
Exports | | | 1.8 | | | | 3.5 | | | | 5.0 | | | | 3.5 | | | | 3.2 | | | | 3.2 | |
Imports | | | 0.1 | | | | 2.1 | | | | 2.9 | | | | 2.5 | | | | 2.1 | | | | 2.7 | |
| Nominal Gross Domestic Product | | | 2.4 | | | | 3.6 | | | | 4.2 | | | | 4.2 | | | | 4.2 | | | | 4.1 | |
| Other Economic Indicators | | | | | | | | | | | | | | | | | | | | | | | | |
Retail Sales | | | 2.3 | | | | 4.8 | | | | 4.2 | | | | 4.2 | | | | 4.0 | | | | 3.6 | |
Housing Starts (000s) | | | 61.1 | | | | 59.1 | | | | 61.0 | | | | 65.0 | | | | 69.0 | | | | 70.0 | |
Home Resales | | | 0.5 | | | | 3.7 | | | | 1.1 | | | | (2.5 | ) | | | 1.4 | | | | 2.0 | |
Primary Household Income | | | 2.9 | | | | 3.4 | | | | 3.9 | | | | 4.3 | | | | 4.4 | | | | 4.2 | |
Compensation of Employees | | | 2.8 | | | | 3.1 | | | | 4.0 | | | | 4.3 | | | | 4.4 | | | | 4.5 | |
Net Operating Surplus — Corporations | | | 0.0 | | | | 8.0 | | | | 5.0 | | | | 4.8 | | | | 4.7 | | | | 4.4 | |
Consumer Price Index | | | 1.0 | | | | 2.4 | | | | 1.2 | | | | 2.0 | | | | 2.0 | | | | 2.0 | |
Employment | | | 1.8 | | | | 0.8 | | | | 1.1 | | | | 1.3 | | | | 1.4 | | | | 1.3 | |
Job Creation (000s) | | | 121 | | | | 55 | | | | 78 | | | | 93 | | | | 99 | | | | 96 | |
Unemployment Rate (Per Cent) | | | 7.6 | | | | 7.3 | | | | 6.9 | | | | 6.7 | | | | 6.5 | | | | 6.3 | |
| Key External Variables | | | | | | | | | | | | | | | | | | | | | | | | |
U.S. Real Gross Domestic Product | | | 2.2 | | | | 2.4 | | | | 3.1 | | | | 2.9 | | | | 2.7 | | | | 2.6 | |
WTI Crude Oil ($ US per Barrel) | | | 98 | | | | 93 | | | | 55 | | | | 70 | | | | 79 | | | | 84 | |
Canadian Dollar (Cents US) | | | 97.1 | | | | 90.5 | | | | 79.5 | | | | 80.0 | | | | 85.0 | | | | 89.0 | |
3-month Treasury Bill Rate1 | | | 1.0 | | | | 0.9 | | | | 0.6 | | | | 1.1 | | | | 2.5 | | | | 3.4 | |
10-year Government Bond Rate1 | | | 2.3 | | | | 2.2 | | | | 1.8 | | | | 2.7 | | | | 3.8 | | | | 4.2 | |
1 Government of Canada interest rates (per cent). Sources: Statistics Canada, Canada Mortgage and Housing Corporation, Canadian Real Estate Association, Bank of Canada, U.S. Bureau of Economic Analysis, Blue Chip Economic Indicators (March 2015), U.S. Energy Information Administration and Ontario Ministry of Finance. | |
Private-Sector Forecasts
The Ministry of Finance consults with private-sector economists and tracks their forecasts to inform the government’s planning assumptions. In the process of preparing the 2015 Ontario Budget, the Minister of Finance met with private-sector economists to discuss their views on the economy. Additionally, members of the Ontario Economic Forecast Council, established under the Fiscal Transparency and Accountability Act, 2004, reviewed the Ministry of Finance’s economic assumptions in February 2015. All Council members found the assumptions to be reasonable.
Private-sector economists are projecting continued growth for Ontario over the forecast horizon. On average, private-sector economists are calling for real GDP growth of 2.8 per cent in 2015, 2.5 per cent in 2016, 2.3 per cent in 2017 and 2.2 per cent in 2018. For prudent fiscal planning, the Ministry of Finance’s real GDP growth projections are slightly below the average private-sector forecast.
TABLE 2.9 Private-Sector Forecasts for Ontario Real GDP Growth (Per Cent) |
| | 2015 | 2016 | 2017 | 2018 |
| BMO Capital Markets (March) | 2.5 | 2.3 | – | – |
| Central 1 Credit Union (March) | 2.8 | 3.2 | – | – |
| Centre for Spatial Economics (January) | 2.7 | 2.4 | 2.3 | 2.3 |
| CIBC World Markets (February) | 2.8 | 2.8 | – | – |
| Conference Board of Canada (February) | 2.9 | 2.6 | 2.1 | 2.1 |
| Desjardins Group (March/January) | 2.9 | 2.4 | 1.9 | 1.6 |
| IHS Global Insight (January) | 2.5 | 2.1 | 2.6 | 2.5 |
| Laurentian Bank Securities (March) | 2.6 | 2.6 | – | – |
| National Bank (February) | 2.8 | 2.1 | – | – |
| RBC Financial Group (March) | 3.3 | 2.7 | – | – |
| Scotiabank Group (February) | 2.7 | 2.4 | – | – |
| TD Bank Financial Group (January) | 2.8 | 2.5 | – | – |
| University of Toronto (February) | 2.8 | 2.9 | 2.8 | 2.4 |
| Private-Sector Survey Average | 2.8 | 2.5 | 2.3 | 2.2 |
| Ontario’s Planning Assumption | 2.7 | 2.4 | 2.2 | 2.1 |
Source: Ontario Ministry of Finance Survey of Forecasters (March 31, 2015). |
Compared to forecasts at the time of the 2014 Budget, the current average private-sector outlook for Ontario real GDP growth is stronger for 2015, and lower for 2016 and 2017. Over the medium term, rising interest rates and oil prices, coupled with easing U.S. economic growth, are expected to contribute to more moderate economic growth in Ontario.
Comparison to the 2014 Budget
The estimate of Ontario real GDP growth in 2014 is slightly higher than the 2014 Budget forecast. Economic growth in 2014 was supported by strong U.S. demand, a lower Canadian dollar and lower oil prices.
Key changes since the 2014 Budget include:
| › | Higher real GDP growth in 2015, followed by lower growth in 2016 and 2017; |
| › | Higher CPI inflation in 2014, followed by lower inflation in 2015; |
| › | Weaker-than-expected employment growth from 2014 through 2016; and |
| › | Higher nominal GDP growth in 2014, but slightly lower growth from 2015 through 2017. |
TABLE 2.10 Changes in Ministry of Finance Key Economic Forecast Assumptions: 2014 Budget Compared to 2015 Budget (Per Cent Change) 2014 2015p 2016p 2017p | |
| | | 2014 Budget | | | Actual | | | 2014 Budget | | | 2015 Budget | | | 2014 Budget | | | 2015 Budget | | | 2014 Budget | | | 2015 Budget | |
| Real Gross Domestic Product | | | 2.1 | | | | 2.2 | | | | 2.5 | | | | 2.7 | | | | 2.5 | | | | 2.4 | | | | 2.6 | | | | 2.2 | |
| Nominal Gross Domestic Product | | | 3.5 | | | | 3.6 | | | | 4.4 | | | | 4.2 | | | | 4.4 | | | | 4.2 | | | | 4.6 | | | | 4.2 | |
| Retail Sales | | | 4.1 | | | | 4.8 | | | | 4.0 | | | | 4.2 | | | | 4.4 | | | | 4.2 | | | | 4.4 | | | | 4.0 | |
| Housing Starts (000s) | | | 58.0 | | | | 59.1 | | | | 60.0 | | | | 61.0 | | | | 67.0 | | | | 65.0 | | | | 69.0 | | | | 69.0 | |
| Primary Household Income | | | 3.3 | | | | 3.4 | | | | 4.4 | | | | 3.9 | | | | 4.7 | | | | 4.3 | | | | 4.7 | | | | 4.4 | |
| Compensation of Employees | | | 3.5 | | | | 3.1 | | | | 4.6 | | | | 4.0 | | | | 4.6 | | | | 4.3 | | | | 4.7 | | | | 4.4 | |
| Net Operating Surplus — Corporations | | | 4.4 | | | | 8.0 | | | | 4.2 | | | | 5.0 | | | | 5.0 | | | | 4.8 | | | | 4.7 | | | | 4.7 | |
| Employment | | | 1.1 | | | | 0.8 | | | | 1.5 | | | | 1.1 | | | | 1.6 | | | | 1.3 | | | | 1.4 | | | | 1.4 | |
| Job Creation (000s) | | | 73 | | | | 55 | | | | 107 | | | | 78 | | | | 110 | | | | 93 | | | | 102 | | | | 99 | |
| Consumer Price Index | | | 1.5 | | | | 2.4 | | | | 1.9 | | | | 1.2 | | | | 2.0 | | | | 2.0 | | | | 2.0 | | | | 2.0 | |
| Key External Variables | | | | | | | | | | | | | | | | | | | | | | | | | | | | | | | | |
| U.S. Real Gross Domestic Product | | | 2.7 | | | | 2.4 | | | | 3.0 | | | | 3.1 | | | | 2.9 | | | | 2.9 | | | | 2.8 | | | | 2.7 | |
| WTI Crude Oil ($ US per Barrel) | | | 97 | | | | 93 | | | | 96 | | | | 55 | | | | 96 | | | | 70 | | | | 98 | | | | 79 | |
| Canadian Dollar (Cents US) | | | 90.0 | | | | 90.5 | | | | 91.0 | | | | 79.5 | | | | 92.0 | | | | 80.0 | | | | 93.0 | | | | 85.0 | |
3-month Treasury Bill Rate1 (Per Cent) | | | 1.0 | | | | 0.9 | | | | 1.3 | | | | 0.6 | | | | 2.4 | | | | 1.1 | | | | 3.3 | | | | 2.5 | |
10-year Government Bond Rate1 (Per Cent) | | | 2.8 | | | | 2.2 | | | | 3.5 | | | | 1.8 | | | | 3.9 | | | | 2.7 | | | | 4.3 | | | | 3.8 | |
p = Ontario Ministry of Finance planning projection. 1Government of Canada interest rates. Sources: Statistics Canada, Canada Mortgage and Housing Corporation, Bank of Canada, U.S. Energy Information Administration, U.S. Bureau of Economic Analysis, Blue Chip Economic Indicators (March 2015) and Ontario Ministry of Finance. | |
Section E: Ontario’s Fiscal Plan
Ontario’s Recovery Plan
The 2014 Budget outlined a plan to eliminate the deficit by 2017–18 based on managing growth in program spending while maintaining the integrity of Provincial revenues. The government is making progress on this plan and is building on its proven track record of strong fiscal management.
TABLE 2.11 Ontario’s Recovery Plan ($ Billions) | |
| | | Plan | | | Outlook | |
| | | | 2015–16 | | | | 2016–17 | | | | 2017–18 | |
| Total Revenue | | | 124.4 | | | | 129.4 | | | | 134.4 | |
| Expense | | | | | | | | | | | | |
Programs | | | 120.5 | | | | 120.6 | | | | 120.0 | |
Interest on Debt1 | | | 11.4 | | | | 12.4 | | | | 13.2 | |
| Total Expense | | | 131.9 | | | | 133.0 | | | | 133.2 | |
| Reserve | | | 1.0 | | | | 1.2 | | | | 1.2 | |
| Surplus/(Deficit) | | | (8.5 | ) | | | (4.8 | ) | | | – | |
1 Interest on debt expense is net of interest capitalized during construction of tangible capital assets of $0.2 billion in each of 2015–16, 2016–17 and 2017–18. Note: Numbers may not add due to rounding. | |
Key Changes since the 2014 Budget
As a result of lower projected total expense compared to the 2014 Budget, the government is now forecasting deficits of $8.5 billion in 2015–16, $4.8 billion in 2016–17, and a return to balance in 2017–18. This reflects an improvement of $0.4 billion in 2015–16 and $0.5 billion in 2016–17, compared with the deficit targets laid out in the 2014 Budget.
Total revenue is projected to grow from $124.4 billion to $134.4 billion over the 2015–16 to 2017–18 period. The medium-term revenue outlook is largely in line with the 2014 Budget outlook in 2015–16 and 2016–17, and is below the 2014 Budget outlook in 2017–18. Lower Taxation Revenues in 2015–16 and 2016–17 are largely offset by higher Other Non-Tax Revenues, which primarily reflect the asset optimization strategy discussed in Chapter I, Section C: Unlocking the Value of Provincial Assets. In 2017–18, lower revenues relative to the 2014 Budget are mainly the result of lower taxation revenues and major Government of Canada transfers, as well as lower net income from the Ontario Lottery and Gaming Corporation.
Over the 2015–16 to 2017–18 period, total expense is projected to increase from $131.9 billion to $133.2 billion. Total expense is projected to be lower than forecast at the time of the 2014 Budget, due to lower interest on debt expense, leading to lower-than-forecast deficits over the path to balance.
The program expense outlook over the medium term is projected to be higher in each of 2015–16, 2016–17 and 2017–18, compared with the medium-term forecast in the 2014 Budget. This increase reflects the government’s continued investment in priority areas and implementation of its plan to support economic growth and prosperity.
It also reflects the Province’s commitment to manage spending while transforming programs and services. Program expense growth will be held to an average of 0.9 per cent between 2013–14 and 2017–18, somewhat below the 1.5 per cent average annual growth in program spending over the past four years.
The fiscal plan also includes a reserve of $1.0 billion in 2015–16. The reserve has been set at $1.2 billion in each of 2016–17 and 2017–18, unchanged from the 2014 Budget.
TABLE 2.12 Change in Medium-Term Fiscal Outlook since the 2014 Budget ($ Billions) | |
| | | | 2015–16 | | | | 2016–17 | | | | 2017–18 | |
Surplus/(Deficit) from the 2014 Budget | | | (8.9 | ) | | | (5.3 | ) | | | – | |
| | | | | | | | | | | | | |
| Revenue Changes | | | | | | | | | | | | |
| Revenue Forecast | | | (0.1 | ) | | | 0.0 | | | | (0.4 | ) |
| Total Revenue Changes | | | (0.1 | ) | | | 0.0 | | | | (0.4 | ) |
| | | | | | | | | | | | | |
| Expense Changes | | | | | | | | | | | | |
| Net Program Expense Changes | | | 0.4 | | | | 0.3 | | | | 0.6 | |
| Interest on Debt | | | (0.6 | ) | | | (0.8 | ) | | | (1.0 | ) |
| Total Expense Changes | | | (0.2 | ) | | | (0.5 | ) | | | (0.4 | ) |
| Change in Reserve | | | (0.2 | ) | | | – | | | | – | |
| | | | | | | | | | | | | |
| Fiscal Improvement/(Deterioration) | | | 0.4 | | | | 0.5 | | | | – | |
| | | | | | | | | | | | | |
2015 Budget Surplus/(Deficit) | | | (8.5 | ) | | | (4.8 | ) | | | – | |
Note: Numbers may not add due to rounding. | |
Ontario’s Revenue Outlook
Ontario’s revenues rely heavily on the level of economic activity in the province, growing roughly in line with nominal gross domestic product (GDP). For example, taxes are collected on the incomes and spending of Ontarians, and on the profits generated by businesses operating in Ontario.
However, there are important qualifications to this general rule.
Growth in several tax revenue sources, such as volume-based gasoline and fuel taxes, is more closely aligned to real GDP. These revenue sources are less influenced by changes in prices. Similarly, some revenues, such as vehicle and driver registration fees, tend to more closely track demographic factors such as growth in the driving-age population.
Growth in some revenue sources, such as the Corporations Tax and Mining Tax, can diverge significantly from economic growth in any given year, due to the inherent volatility of business profits, as well as the use of tax provisions such as the option to carry losses forward or backward across different tax years.
The revenue forecast also often includes significant one-time adjustments, usually due to lags between the period in which revenues are earned and when the actual amounts are finally reported. For example, the Ministry of Finance will use the latest available information on Personal Income Tax (PIT) revenue earned by the Province for the 2014 tax year as the basis for the 2014–15 PIT revenue estimate to be published later this year in the Public Accounts of Ontario 2014–2015. Actual PIT revenue entitlements for 2014 and 2015, however, will not be known until early 2016 and 2017, respectively, after the majority of PIT returns for those tax years have been filed and assessed by the Canada Revenue Agency.
Moreover, additional tax information continues to arrive for years following the actual tax year due to late tax assessments and reassessments. The result is that even after the Public Accounts of Ontario 2014–2015 are released, new, updated tax assessment information will lead to revisions of the estimate for 2014–15 PIT revenues. Under Public Sector Accounting Board standards, revenue estimates already published in the Public Accounts are not restated for updated assessment information. Instead, these revisions are reported as “prior-year” adjustments in the current open year.
Medium-Term Revenue Outlook
The Province’s revenues are projected to grow at an average annual rate of 4.3 per cent over the forecast period, largely reflecting the Ministry of Finance’s outlook for economic growth (see Section D: Ontario’s Economic Outlook in this chapter).
TABLE 2.13 Summary of Medium-Term Outlook ($ Billions) | |
| | Interim 2014–15 | | Plan 2015–16 | | Outlook | |
| Revenue | 2016–17 | | 2017–18 | |
Personal Income Tax | 29.0 | | 30.4 | | 32.1 | | 34.0 | |
Sales Tax | 21.7 | | 23.0 | | 24.0 | | 25.0 | |
Corporations Tax | 10.1 | | 11.3 | | 12.1 | | 12.6 | |
Ontario Health Premium | 3.4 | | 3.5 | | 3.6 | | 3.8 | |
Education Property Tax | 5.6 | | 5.7 | | 5.8 | | 5.8 | |
All Other Taxes | 12.8 | | 13.5 | | 14.0 | | 14.4 | |
| Total Taxation Revenue | 82.7 | | 87.4 | | 91.7 | | 95.6 | |
| Government of Canada | 21.7 | | 22.9 | | 24.0 | | 24.8 | |
| Income from Government Business Enterprises | 5.3 | | 4.8 | | 5.2 | | 5.5 | |
| Other Non-Tax Revenue | 8.8 | | 9.3 | | 8.5 | | 8.4 | |
| Total Revenue | 118.5 | | 124.4 | | 129.4 | | 134.4 | |
Note: Numbers may not add due to rounding. | |
TABLE 2.14 Personal Income Tax Revenue Outlook ($ Billions) | |
| | | Interim 2014–15 | | | Plan 2015–16 | | | Outlook | |
| Revenue | | | 2016–17 | | | | 2017–18 | |
| Total Projected Revenue | | | 29.0 | | | | 30.4 | | | | 32.1 | | | | 34.0 | |
Tax Measures1 | | | 0.8 | | | | 0.8 | | | | 0.9 | | | | 1.0 | |
| Adjustments for Prior Years | | | 0.2 | | | | – | | | | – | | | | – | |
Base Revenue2 | | | 28.1 | | | | 29.5 | | | | 31.2 | | | | 33.0 | |
| Base Revenue Growth (Per Cent) | | | – | | | | 5.2 | | | | 5.7 | | | | 5.8 | |
Compensation of Employees3 (Per Cent Change) | | | – | | | | 4.0 | | | | 4.3 | | | | 4.4 | |
1 Represents the revenue impact of all tax measures, announced previously or proposed in this Budget. 2 Total Projected Revenue less the impact of tax measures or other one-time factors such as prior-year adjustments. Base Revenue reflects the impact of underlying macroeconomic factors. 3 Includes wages and salaries and employers’ social contributions. Note: Numbers may not add due to rounding. | |
The primary economic driver of the forecast for Personal Income Tax (PIT) revenue is the outlook for growth in the compensation of employees. Total Projected Revenue includes impacts of tax measures and adjustments related to prior tax years. Tax Measures include those proposed in the current and past budgets (see Chapter IV: A Fair and Sustainable Tax System) as well as the impact of past federal measures including, and up to, those announced in the fall of 2014. Adjustments for Prior Years of $0.2 billion in 2014–15 reflect a slight underestimation of PIT revenues in the Public Accounts of Ontario 2013–2014. After accounting for the impacts of tax measures and prior-year adjustments, the PIT revenue base is projected to grow at an average annual rate of 5.5 per cent over the forecast period. This compares to average annual growth of 4.2 per cent in compensation of employees over this period. Personal Income Tax revenue tends to grow at a faster rate than incomes due to the progressive structure of the PIT system.
TABLE 2.15 Sales Tax Revenue Outlook ($ Billions) | |
| | | Interim 2014–15 | | | Plan 2015–16 | | | Outlook | |
| Revenue | | | 2016–17 | | | | 2017–18 | |
Total Projected Sales Tax Revenue1 | | | 21.7 | | | | 23.0 | | | | 24.0 | | | | 25.0 | |
Tax Measures2 | | | 0.5 | | | | 0.4 | | | | 0.3 | | | | 0.2 | |
| Other Adjustments | | | (0.3 | ) | | | – | | | | – | | | | – | |
Base Revenue3 | | | 21.6 | | | | 22.6 | | | | 23.7 | | | | 24.8 | |
| Base Revenue Growth (Per Cent) | | | – | | | | 4.7 | | | | 5.1 | | | | 4.6 | |
| Nominal Consumption Growth (Per Cent) | | | – | | | | 4.2 | | | | 4.2 | | | | 4.1 | |
1 Beginning July 1, 2010, most of the Retail Sales Tax was replaced with a value-added tax and combined with the federal Goods and Services Tax to create a federally administered Harmonized Sales Tax. Sales Tax Revenue is reported net of both the Ontario Sales Tax Credit and the energy component of the Ontario Energy and Property Tax Credit. 2 Represents the revenue impact of all tax measures, announced previously or proposed in this Budget. 3 Total Projected Revenue less the impact of tax measures or other one-time factors such as prior-year adjustments. Base Revenue reflects the impact of underlying macroeconomic factors. Note: Numbers may not add due to rounding. | |
The Sales Tax revenue projection is based primarily on growth in consumer spending. The Sales Tax revenue projection also reflects the impact of tax measures, as well as prior-year and other adjustments. Tax Measures primarily reflect the impact of transition measures such as input tax credits, which are being phased out starting in 2015–16. Other Adjustments reflect a one-time adjustment of $0.3 billion in 2014–15 related to a variance from Sales Tax revenue reported in the Public Accounts of Ontario 2013–2014. After accounting for the impacts of measures and other adjustments, the Sales Tax revenue base is projected to grow at an average annual rate of 4.8 per cent, roughly consistent with the average annual growth rate in nominal consumption of 4.2 per cent over this period.
TABLE 2.16 Corporations Tax Revenue Outlook ($ Billions) | |
| | | Interim 2014–15 | | | Plan 2015–16 | | | Outlook | |
| Revenue | | 2016–17 | | | 2017–18 | |
| Total Projected Revenue | | 10.1 | | | 11.3 | | | 12.1 | | | 12.6 | |
Tax Measures1 | | 0.1 | | | 0.2 | | | 0.2 | | | 0.4 | |
Other Adjustments2 | | (1.1 | ) | | (0.3 | ) | | – | | | – | |
Base Revenue3 | | 11.1 | | | 11.5 | | | 11.9 | | | 12.3 | |
| Base Revenue Growth (Per Cent) | | – | | | 3.1 | | | 3.5 | | | 3.3 | |
| Net Operating Surplus – Corporations Growth (Per Cent) | | – | | | 5.0 | | | 4.8 | | | 4.7 | |
1 Represents the revenue impact of all tax measures, announced previously or proposed in this Budget. 2 Other Adjustments include net timing of payments adjustments due to the difference between projected Corporations Tax (CT) revenue entitlements and projected federal CT remittances. 3 Total Projected Revenue less the impact of tax measures or other one-time factors such as prior-year adjustments. Base Revenue reflects the impact of underlying macroeconomic factors. Note: Numbers may not add due to rounding. | |
The forecast for Corporations Tax (CT) revenue is based on annual growth in the net operating surplus of corporations. The CT revenue outlook also reflects the impact of tax measures and prior-year and other adjustments. Tax Measures include those proposed in the current and past budgets (see Chapter IV: A Fair and Sustainable Tax System) as well as the impact of past federal measures including, and up to, those announced in the fall of 2014. Other Adjustments in 2014–15 and 2015–16 are due to the difference between projected CT revenue entitlements and federal CT remittances. One-time refunds related to prior-year assessments also lower revenues in 2014–15. After accounting for tax measures and other adjustments, the CT revenue base grows at an average annual rate of 3.3 per cent over the forecast period, compared to 4.8 per cent average annual growth in the net operating surplus of corporations. Corporations Tax revenue tends to grow more slowly than corporate profits due to tax provisions, including the carry-forward of losses for up to 20 years.
Ontario Health Premium revenue is based on the outlook for the growth in the compensation of employees. Ontario Health Premium revenue is projected to increase at an average annual rate of 4.4 per cent over the forecast period.
Education Property Tax revenue is projected to increase at an average annual rate of 1.2 per cent over the forecast period, largely due to growth in the property assessment base resulting from new construction activities. The forecast also reflects the ongoing impact of the measure announced in the 2012 Budget to freeze the Business Education Tax reduction plan.
Revenues from All Other Taxes are projected to increase at an average annual rate of 4.0 per cent over the forecast period. This includes revenues from volume-based taxes such as Gasoline Tax, Fuel Tax, Tobacco Tax, and Beer and Wine Tax, as well as other taxes such as Land Transfer Tax, electricity payments in lieu of taxes and the Mining Tax.
The forecast for Government of Canada transfers is based on existing federal–provincial funding arrangements. Revenues are projected to grow at an average annual rate of 4.6 per cent over the forecast period, largely reflecting growth in major ongoing federal funding programs such as the Canada Health Transfer, Canada Social Transfer and Equalization.
The forecast for Income from Government Business Enterprises (GBEs) is based on information provided by the individual enterprises. Overall revenue from GBEs is projected to increase by $0.2 billion between 2014–15 and 2017–18, or at an average annual rate of 1.4 per cent. The projected increase over the medium term is primarily due to higher projected net incomes from the Liquor Control Board of Ontario and the Ontario Lottery and Gaming Corporation.
The forecast for Other Non-Tax Revenue is based on information provided by government ministries and provincial agencies. The forecast includes the projected net impacts of the Province’s asset optimization strategy as discussed in Chapter I, Section C: Unlocking the Value of Provincial Assets. Between 2014–15 and 2017–18, Other Non-Tax Revenues are projected to decrease by $0.5 billion, largely reflecting declining electricity sector-related revenues such as the debt retirement charge and fiscally neutral power-supply contract recoveries.
Key Changes in the Medium-Term Revenue Outlook since the 2014 Budget
Compared to the 2014 Budget, revenues are lower in 2014–15 but close to budget projections in both 2015–16 and 2016–17.
TABLE 2.17 Summary of Medium-Term Revenue Changes since the 2014 Budget ($ Billions) | |
| | | 2014–15 | | | 2015–16 | | | 2016–17 | |
| Lower Tax Revenue Base | | (0.5 | ) | | (0.5 | ) | | (0.5 | ) |
| Economic Growth | | 0.7 | | | 0.2 | | | 0.2 | |
| One-Time Impacts | | (0.9 | ) | | (0.4 | ) | | 0.0 | |
| Government of Canada Transfers | | (0.2 | ) | | 0.2 | | | (0.0 | ) |
| Government Business Enterprises | | 0.3 | | | (0.1 | ) | | (0.3 | ) |
| Other Non-Tax Revenue | | 0.2 | | | 0.7 | | | 0.6 | |
| Subtotal Revenue Changes | | (0.4 | ) | | (0.1 | ) | | (0.0 | ) |
2015 Budget Tax Revenue Measures | | 0.0 | | | 0.0 | | | 0.1 | |
| Total Revenue Changes | | (0.4 | ) | | (0.1 | ) | | 0.0 | |
Note: Numbers may not add due to rounding. | |
Tax data received during 2014 lowered the tax revenue base upon which growth is applied. In particular, Personal Income Tax, Corporations Tax and Sales Tax revenues were lower than projected in the 2014 Budget. Also, tax receipts for provincially administered taxes in 2014–15 were lower than projected in the 2014 Budget.
The medium-term taxation revenue outlook is boosted in 2014–15 as a result of stronger economic growth in 2014. Lower nominal GDP growth in 2015 and 2016, however, results in more moderate revenue growth thereafter.
Lower revenues from one-time impacts in 2014–15 largely reflect prior-year adjustments related to ongoing corporate income tax assessments, during 2014 and for 2013 and prior years. The one-time decrease in 2015–16 mainly reflects a repayment to the federal government due to a projected overpayment of corporate tax to the Province by the Canada Revenue Agency for the 2014 tax year.
Government of Canada Transfers are projected to be lower in 2014–15, largely reflecting lower transfers for infrastructure projects due to revised timelines in the Building Canada Fund and lower transfers to government agencies. The 2015–16 change reflects higher Ontario Equalization payments based on updated economic information from the federal Department of Finance. Lower Government of Canada Transfers in 2016–17 largely reflect the impact of a lower population share on Ontario’s Canada Health Transfer and Canada Social Transfer payments.
Income from Government Business Enterprises (GBEs) is higher in 2014–15 due to stronger performance by Ontario Power Generation Inc., Hydro One Inc. and the Liquor Control Board of Ontario (LCBO). The decline in 2015–16 and 2016–17 reflects lower projected net income from the Ontario Lottery and Gaming Corporation (OLG).
The increase in Other Non-Tax Revenue over the forecast period is largely due to higher projected impacts under the asset optimization strategy announced in the 2014 Budget. For a more detailed discussion, see Chapter I, Section C: Unlocking the Value of Provincial Assets.
The 2015 Budget Tax Revenue Measures include proposals to parallel federal changes to the tax treatment of trusts and estates, changes to the Provincial Land Tax, and elimination of the Ontario Resource Tax Credit and the Additional Tax on Crown Royalties. For more details, see Chapter IV: A Fair and Sustainable Tax System.
Risks to Revenue Outlook
Ontario’s revenue outlook is based on reasonable assumptions about the pace of growth in Ontario’s economy. There are both positive and negative risks to the economic projections underlying the revenue forecast. Some of these risks are discussed in Section D: Ontario’s Economic Outlook in this chapter.
This section highlights some of the key sensitivities and risks to the fiscal plan that could arise from unexpected changes in economic conditions. These estimates are only guidelines and actual results will vary depending on the composition and interaction of the various factors. The risks are those that could have the most material impact on the largest revenue sources. A broader range of additional risks are not included because they are either less material or difficult to quantify. For example, the outlook for Government of Canada transfers is subject to changes in economic variables that affect federal funding, as well as changes by the federal government to the funding arrangements themselves.
TABLE 2.18 Selected Economic and Revenue Risks and Sensitivities |
| Item/Key Components | 2015–16 Assumption | 2015–16 Sensitivities |
| Total Revenues |
Nominal GDP | 4.2 per cent growth in 2015 | $885 million revenue change for each percentage point change in nominal GDP growth. Can vary significantly, depending on composition and source of changes in GDP growth. |
| Total Taxation Revenues |
Revenue Base1 | 3.8 per cent growth in 2015–16 | |
Nominal GDP | 4.2 per cent growth in 2015 | $585 million revenue change for each percentage point change in nominal GDP growth. Can vary significantly, depending on composition and source of changes in GDP growth. |
| Personal Income Tax (PIT) Revenues |
Revenue Base | 5.2 per cent growth in 2015–16 | |
Compensation of Employees | 4.0 per cent growth in 2015 | $336 million revenue change for each percentage point change in compensation of employees growth. |
2014 Tax-Year Assessments2 | $27.9 billion | $279 million revenue change for each percentage point change in 2014 PIT assessments.2 |
2013 Tax-Year and Prior Assessments | $1.4 billion | $14 million revenue change for each percentage point change in 2013 and prior-year PIT assessments.2 |
TABLE 2.18 Selected Economic and Revenue Risks and Sensitivities (cont’d) |
| Item/Key Components | 2015–16 Assumption | 2015–16 Sensitivities |
| Sales Tax Revenues |
Revenue Base | 4.7 per cent growth in 2015–16 | |
Nominal Household Consumption | 4.2 per cent growth in 2015 | $195 million revenue change for each percentage point change in nominal household consumption growth. |
2013 Gross Revenue Pool3 | $23.3 billion | $233 million revenue change for each percentage point change in 2013 gross revenue pool. |
2014 Gross Revenue Pool3 | $24.7 billion | $247 million revenue change for each percentage point change in 2014 gross revenue pool. |
2015 Gross Revenue Pool3 | $25.5 billion | $255 million revenue change for each percentage point change in 2015 gross revenue pool. |
| Corporations Tax Revenues | |
Revenue Base | 3.1 per cent growth in 2015–16 | |
Net Operating Surplus — Corporations | 5.0 per cent growth in 2015 | $90 million change in revenue for each percentage point change in net operating surplus — corporations growth. |
2014 Tax Assessments2 | $9.0 billion | $90 million change in revenue for each percentage point change in 2014 Tax Assessments. |
2015 Canada Corporate Taxable Income | $287.2 billion | $125 million change in revenue for each percentage point change in the federal estimate of 2015 Canada Corporate Taxable Income. |
2016 Canada Corporate Taxable Income | $303.7 billion | $32 million change in revenue for each percentage point change in 2016 Canada Corporate Taxable Income. |
TABLE 2.18 Selected Economic and Revenue Risks and Sensitivities (cont’d) |
| Item/Key Components | 2015–16 Assumption | 2015–16 Sensitivities |
| Employer Health Tax Revenues |
Revenue Base | 3.9 per cent growth in 2015–16 | |
Compensation of Employees | 4.0 per cent growth in 2015 | $57 million revenue change for each percentage point change in compensation of employees growth. |
| Ontario Health Premium (OHP) Revenues |
Revenue Base | 4.7 per cent growth in 2015–16 | |
Compensation of Employees | 4.0 per cent growth in 2015 | $22 million revenue change for each percentage point change in compensation of employees growth. |
2014 Tax-Year Assessments | $3.1 billion | $31 million revenue change for each percentage point change in 2014 OHP assessments. |
TABLE 2.18 Selected Economic and Revenue Risks and Sensitivities (cont’d) |
| Item/Key Components | 2015–16 Assumption | 2015–16 Sensitivities |
| Gasoline Tax Revenues |
Revenue Base | 0.7 per cent growth in 2015–16 | |
Gasoline Pump Prices | 106.5 cents per litre in 2015 | $3 million revenue decrease (increase) for each cent per litre increase (decrease) in gasoline pump prices. |
| Fuel Tax Revenues |
Revenue Base | 2.3 per cent growth in 2015–16 | |
Real GDP | 2.7 per cent growth in 2015 | $11 million revenue change for each percentage point change in real GDP growth. |
| Land Transfer Tax Revenues |
Revenue Base | 1.5 per cent increase in 2015–16 | |
Housing Resales | 1.6 per cent decline in 2015–16 | $18 million revenue change for each percentage point change in both the number and prices of housing resales. |
Resale Prices | 2.8 per cent increase in 2015–16 | |
| Canada Health Transfer |
Ontario Population Share | 38.4 per cent in 2015–16 | $34 million revenue change for each tenth of a percentage point change in Ontario’s population share. |
| Canada Social Transfer |
Ontario Population Share | 38.4 per cent in 2015–16 | $13 million revenue change for each tenth of a percentage point change in Ontario’s population share. |
TABLE 2.18 Selected Economic and Revenue Risks and Sensitivities (cont’d) | |
| Item/Key Components | 2016–17 Assumption | 2016–17 Sensitivities |
| Equalization Entitlements |
| Three-Year Weighted-Average Population | 1.0 per cent growth over 2015–16 | 1.0 per cent relative increase (decrease) in the three-year weighted-average population for Ontario will result in $0.5 billion higher (lower) Equalization entitlement for Ontario. |
| Three-Year Weighted-Average Fiscal Capacity | 3.0 per cent growth over 2015–16 | 1.0 per cent relative increase (decrease) in Ontario’s three-year weighted average fiscal capacity will result in $0.5 billion lower (higher) Equalization entitlement for Ontario. |
1 Revenue Base is revenue excluding the impact of measures, adjustments for past Public Accounts estimate variances and other one-time factors. 2 Ontario 2014 Personal Income Tax and Corporations Tax are estimates because 2014 tax returns are yet to be assessed by the Canada Revenue Agency. 3 The Gross Revenue Pool is a federal Department of Finance estimate and excludes the impact of Ontario measures. |
User Fees and Other Non-Tax Revenue
Where a government program or service has a direct benefit to an end-user, user fees provide a means of ensuring that the costs of providing that program or service are borne by the end-user of that program or service, rather than taxpayers generally. When user fees are not increased in line with the costs of providing these programs and services, an increased proportion of funding must be provided through taxation revenue, impacting the government’s ability to direct spending towards priority areas such as health care and education.
Other Non-Tax Revenue (NTR) Other Non-Tax Revenue includes user fees, fines and penalties, property rental revenues and other forms of revenue that are not derived from taxation, Government of Canada transfers, or income from Government Business Enterprises (e.g., Liquor Control Board of Ontario or Ontario Lottery and Gaming Corporation). |
As noted by the Auditor General in 2009, Ontario’s user fees, per capita, are among the lowest in Canada. Ontario is also one of the only jurisdictions in Canada that does not regularly review user fees or index them to inflation. To bring Ontario’s user-fee policies in line with those of other Canadian jurisdictions, the government is implementing a strategy that will increase fees while balancing end-user needs, with the objective of sustaining Ontario’s public services.
Both the Commission on the Reform of Ontario’s Public Services and the Auditor General recommended a revised approach to user-fee rates. Where the Province charges a user fee for a service, both recommended that the fee should recover the full cost of providing the service where it is reasonable and practical to do so. The Commission also suggested that the ideal approach would be a blend of full-cost recovery and indexation.
The federal government and the Province of Quebec have implemented measures to regularly review user fees and, where appropriate, index fees to the rate of inflation. For example, in 2013, Parks Canada began the indexation of all annual fees, as well as some seasonal fees, based on Statistics Canada’s Consumer Price Index (CPI). In 2012, the Government of Quebec began to systematically review the costs of services for which existing or potential user fees apply, determine self-financing targets for each fee-based service, and index increases in fees annually at the same rate as any increase to the personal taxation system. |
In line with these recommendations, the government is continuing to implement incremental increases to existing user fees, such as driver and vehicle fees, hazardous waste fees, and family court fees, and will also be moving forward with a multi-year, full-cost recovery and indexation strategy, based on clearly articulated principles.
The implementation of this strategy will begin in 2015 with a comprehensive review of all user fees the government currently charges and will be done in an open and transparent way. This review will inform a detailed multi-year implementation plan on full-cost recovery and user-fee indexation for the 2016 Budget. The strategy will carefully consider factors such as adverse social and economic impacts on stakeholder groups, including vulnerable Ontarians, who could face financial challenges, and deterring or encouraging behaviour in line with public policy objectives.
User Fees
User fees are charges collected to defray the costs of a specific good or service provided by the government or to regulate conduct using a regulatory scheme. Examples of user fees charged in Ontario include fees charged for driver and vehicle licensing, business registration, camping in Ontario parks, fishing and hunting licences, court applications, liquor licences and event permits. |
Moving forward with the full-cost recovery and indexation of user fees will help sustain Ontario’s public services, while aligning its user-fee policies with other Canadian jurisdictions that have introduced user-fee indexation and policies to regularly review fee rates to ensure cost recovery.
In 2013–14, Other Non-Tax Revenue in Ontario represented approximately $8.3 billion, or seven per cent, of all Provincial revenue. Of this, approximately $2.0 billion, or 24 per cent, was derived from user fees. The following chart provides a detailed breakdown of non-tax revenue in Ontario.
Medium-Term Expense Outlook
The Province’s program expense outlook is projected to grow at an average annual rate of 0.9 per cent between 2013–14 and 2017–18.
While the government continues to invest in priority areas and implement its plan to support economic growth and prosperity, it is also committed to managing program expense growth over the medium term to support a balanced and thoughtful approach to eliminating the deficit.
To deliver on this plan, the government launched Program Review, Renewal and Transformation (PRRT), a fundamentally new approach to multi-year planning and budgeting that will result in improved outcomes and the best possible value for every dollar spent.
TABLE 2.19 Summary of Medium-Term Expense Outlook ($ Billions) | |
| | | | | | | | | | | | | | | | | | Average Annual Growth | |
| | | Actual | | | Interim | | | Plan | | | Outlook | | | | 2013–14 | |
| | | 2013–14 | | | 2014–15 | | | 2015–16 | | | 2016–17 | | | 2017–18 | | | to 2017–18 | |
| Programs | | | | | | | | | | | | | | | | | | | |
Health Sector | | 48.9 | | | 50.2 | | | 50.8 | | | 51.7 | | | 52.7 | | | | 1.9 | % |
Education Sector1 | | 23.6 | | | 24.6 | | | 25.2 | | | 25.6 | | | 25.6 | | | | 2.0 | % |
Postsecondary and Training Sector | | 7.6 | | | 7.7 | | | 7.8 | | | 7.8 | | | 7.6 | | | | 0.1 | % |
Children’s and Social Services Sector | | 14.0 | | | 14.7 | | | 15.4 | | | 15.7 | | | 15.7 | | | | 2.9 | % |
Justice Sector | | 4.2 | | | 4.3 | | | 4.4 | | | 4.4 | | | 4.4 | | | | 1.5 | % |
Other Programs | | 17.5 | | | 17.2 | | | 16.8 | | | 15.4 | | | 14.0 | | | | –5.5 | % |
| Total Programs | | 115.8 | | | 118.8 | | | 120.5 | | | 120.6 | | | 120.0 | | | | 0.9 | % |
| Interest on Debt | | 10.6 | | | 10.7 | | | 11.4 | | | 12.4 | | | 13.2 | | | | 5.7 | % |
| Total Expense | | 126.4 | | | 129.5 | | | 131.9 | | | 133.0 | | | 133.2 | | | | 1.3 | % |
1 Excludes Teachers’ Pension Plan. Teachers’ Pension Plan expense is included in Other Programs. Note: Numbers may not add due to rounding. | |
Highlights of the program expense outlook over the medium term include the following:
| › | Total health sector expense is projected to grow on average by 1.9 per cent per year between 2013–14 and 2017–18. Growth will be managed by implementation of the plan for physician services; a continued shift in the hospital funding model from a provider-centred, global funding approach to an activity-based funding approach; and continued emphasis on the sustainability of the Ontario Drug Benefit Program. These measures would allow for investments in other areas of the health care sector that are critical to the Patients First: Action Plan for Health Care, such as ongoing investments in home and community care. |
| › | Total education sector expense is projected to grow on average by 2.0 per cent per year between 2013–14 and 2017–18, mainly due to increased funding to school boards to support growth in student enrolment and full implementation of full-day kindergarten; increased capital expenses associated with completed school projects; and higher funding for the child care sector to support child care modernization and wage increases for front-line child care workers as announced in the 2014 Budget. The growth rate reflects actions being taken to modernize and transform the education system and manage costs, including through more efficient use of school space by consolidating schools, sharing space with other school boards and fostering community partnerships. |
| › | Total postsecondary and training sector expense is projected to be largely unchanged between 2013–14 and 2017–18, as funding to support growth in postsecondary enrolment and student financial assistance programs is offset by actions being taken to control costs. Measures to manage expenses in the sector include integrating Ontario’s employment and training programs and redirecting funding from programs and services across government that are no longer effective to new or renewed initiatives, including the Canada–Ontario Job Grant and extension of the Ontario Youth Jobs Strategy. |
| › | Total children’s and social services sector expense is projected to grow on average by 2.9 per cent between 2013–14 and 2017–18, primarily due to transformation and service-delivery modernization of programs such as social assistance, developmental services and child welfare to improve the programs’ financial sustainability while providing better outcomes for Ontario’s most vulnerable people. |
| › | Total justice sector expense is projected to grow on average by 1.5 per cent between 2013–14 and 2017–18, mainly due to the continuing upload of court security costs from municipalities and the expansion of access to legal aid services for low-income Ontarians. The sector continues to manage its spending through operational efficiencies and cost-effective delivery of infrastructure projects, and is exploring long-term transformation opportunities to modernize the justice system. |
| › | Other programs expense is projected to decrease on average by 5.5 per cent per year between 2013–14 and 2017–18, largely as a result of finding ways to deliver the best possible value for every dollar spent, lower pension expenses (including in the Teachers’ Pension Plan), and lower planned expenses due to the legislated sunsetting of the Ontario Clean Energy Benefit. |
Similar to last year, the outlook for program spending includes a program review savings target for each of 2015–16, 2016–17 and 2017–18, set at $500 million annually.
The total expense outlook includes interest on debt expense, which is projected to increase on average by 5.7 per cent between 2013–14 and 2017–18. This increase is mainly due to the forecast increase in interest rates and additional borrowing required to fund deficits and investment in capital assets.
Risks to Expense Outlook
Given continued global economic uncertainty and its potential impact on Ontario’s economic growth as well as other unforeseen circumstances, risks may emerge that could impact the Province’s medium-term expense projections.
The government has proven to be a strong fiscal manager, having held average annual growth in program spending to 1.5 per cent, below CPI inflation, from 2010–11 through 2014–15. It will manage risks prudently to ensure it can continue to invest in key priorities, while also taking a thoughtful and fiscally responsible approach to balancing the budget by 2017–18.
The following table provides a summary of key expense risks and sensitivities that could result from unexpected changes in economic conditions and program demands. A change in these factors could impact total expense, causing variances in the overall fiscal forecast. These sensitivities are illustrative and can vary, depending on the nature and composition of potential risks.
TABLE 2.20 Selected Expense Sensitivities |
| Program/Sector | 2015–16 Assumption | 2015–16 Sensitivity |
| Health Sector | Annual growth of 1.2 per cent. | One per cent change in health spending: $508 million. |
| Hospitals’ Sector Expense | Annual growth of 1.4 per cent. | One per cent change in hospitals’ sector expense: $222 million. |
| Drug Programs Utilization | Annual growth of approximately 4.0 per cent. | One per cent change in program expenditure of drug programs: $38 million. |
| Long-Term Care Homes | 77,600 long-term care home beds. Average Provincial annual operating cost per bed in a long-term care home is $51,000. | One per cent change in number of beds: approximately $40 million. |
| Home Care | Approximately 26 million hours of homemaking and support services. Approximately 7 million nursing and professional visits. | One per cent change in hours of homemaking and support services: approximately $7.8 million. One per cent change in nursing and professional visits: approximately $5.5 million. |
| Elementary and Secondary Schools | Approximately 1,960,000 average daily pupil enrolment. | One per cent enrolment change: approximately $150 million. |
| University Students | 372,000 full-time undergraduate and graduate students. | One per cent enrolment change: $32 million. |
| College Students | 191,000 full-time students. | One per cent enrolment change: $13 million. |
| Ontario Works | 245,461 average annual caseload. | One per cent caseload change: $25 million. |
| Ontario Disability Support Program | 337,780 average annual caseload. | One per cent caseload change: $47 million. |
| Interest on Debt | Average cost of 10-year borrowing in 2015–16 is forecast to be approximately 3.4 per cent. | The 2015–16 impact of a 100 basis-point change in borrowing rates is forecast to be approximately $400 million. |
Contingent Liabilities
In addition to the key demand sensitivities and economic risks to the fiscal plan, there are risks stemming from the government’s contingent liabilities. Whether these contingencies will result in actual liabilities for the Province is beyond the direct control of the government. Losses could result from legal settlements, defaults on projects, and loan and funding guarantees. Provisions for losses that are likely to occur and can be reasonably estimated are expensed and reported as liabilities in the Province’s financial statements. Any significant contingent liabilities were disclosed as part of the 2013–2014 Annual Report and Consolidated Financial Statements, released in September 2014.
Fiscal Prudence
The government continues to maintain a balanced approach to managing the fiscal plan and making responsible choices about strategic investments to support the economic prosperity of the province. The Province has also included prudence as part of the fiscal plan to help ensure it meets future fiscal targets as it moves towards a balanced budget in 2017–18.
As required by the Fiscal Transparency and Accountability Act, 2004 (FTAA), the fiscal plan continues to incorporate prudence in the form of a reserve to protect the fiscal outlook against adverse changes in the Province’s revenue and expense, including those resulting from changes in Ontario’s economic performance. The reserve has been set at $1.0 billion in 2015–16, and has been set at $1.2 billion in each of 2016–17 and 2017–18, unchanged from the 2014 Budget.
The fiscal plan also includes contingency funds to help mitigate expense risks — particularly in cases where health and safety may be compromised or services to the most vulnerable are jeopardized — that may otherwise negatively impact Ontario’s fiscal performance.
In keeping with sound fiscal practices, the Province’s revenue outlook is based on prudent economic assumptions. The Ontario Economic Forecast Council, established under the FTAA, reviewed the Ministry of Finance’s economic assumptions in February 2015. All council members found the assumptions to be reasonable.
Section F: Details of Ontario’s Finances
Fiscal Tables and Charts
This section provides information on the Province’s historical financial performance, key fiscal indicators, and details of Ontario’s fiscal plan and outlook.
TABLE 2.21 Medium-Term Fiscal Plan and Outlook ($ Billions) | |
| | | Interim | | | Plan | | | Outlook | |
| | 2014–15 | | | 2015–16 | | | 2016–17 | | | 2017–18 | |
| Revenue | | 118.5 | | | 124.4 | | | 129.4 | | | 134.4 | |
| Expense | | | | | | | | | | | | |
Programs | | 118.8 | | | 120.5 | | | 120.6 | | | 120.0 | |
Interest on Debt1 | | 10.7 | | | 11.4 | | | 12.4 | | | 13.2 | |
| Total Expense | | 129.5 | | | 131.9 | | | 133.0 | | | 133.2 | |
| Reserve | | – | | | 1.0 | | | 1.2 | | | 1.2 | |
| Surplus/(Deficit) | | (10.9 | ) | | (8.5 | ) | | (4.8 | ) | | – | |
| Net Debt | | 284.1 | | | 298.9 | | | 311.5 | | | 319.5 | |
| Accumulated Deficit | | 186.3 | | | 194.8 | | | 199.7 | | | 199.7 | |
1 Interest on debt expense is net of interest capitalized during construction of tangible capital assets of $0.2 billion in each of 2014–15, 2015–16, 2016–17 and 2017–18. Note: Numbers may not add due to rounding. | |
TABLE 2.22 Revenue ($ Millions) | |
| | | 2012–13 | | | Actual 2013–14 | | | Interim 2014–15 | | | Plan 2015–16 | |
| Taxation Revenue | | | | | | | | | | | | |
| Personal Income Tax | | 25,574 | | | 26,929 | | | 29,028 | | | 30,377 | |
Sales Tax1 | | 20,957 | | | 20,481 | | | 21,740 | | | 22,982 | |
| Corporations Tax | | 12,093 | | | 11,423 | | | 10,148 | | | 11,342 | |
Education Property Tax2 | | 5,511 | | | 5,457 | | | 5,632 | | | 5,715 | |
| Employer Health Tax | | 5,137 | | | 5,283 | | | 5,430 | | | 5,680 | |
| Ontario Health Premium | | 3,067 | | | 3,128 | | | 3,350 | | | 3,458 | |
| Gasoline Tax | | 2,390 | | | 2,363 | | | 2,383 | | | 2,457 | |
| Land Transfer Tax | | 1,484 | | | 1,614 | | | 1,758 | | | 1,782 | |
| Tobacco Tax | | 1,142 | | | 1,110 | | | 1,163 | | | 1,262 | |
| Fuel Tax | | 710 | | | 718 | | | 738 | | | 752 | |
| Beer and Wine Tax | | 560 | | | 557 | | | 566 | | | 575 | |
| Electricity Payments-In-Lieu of Taxes | | 324 | | | 543 | | | 209 | | | 524 | |
| Other Taxes | | 469 | | | 360 | | | 509 | | | 491 | |
| | | 79,418 | | | 79,966 | | | 82,654 | | | 87,397 | |
| Government of Canada | | | | | | | | | | | | |
| Canada Health Transfer | | 11,315 | | | 11,940 | | | 12,413 | | | 13,065 | |
| Canada Social Transfer | | 4,591 | | | 4,689 | | | 4,847 | | | 4,976 | |
| Equalization | | 3,261 | | | 3,169 | | | 1,988 | | | 2,363 | |
| Infrastructure Programs | | 116 | | | 123 | | | 149 | | | 308 | |
| Labour Market Programs | | 897 | | | 909 | | | 909 | | | 914 | |
| Social Housing | | 483 | | | 474 | | | 458 | | | 448 | |
| Wait Times Reduction Fund | | 97 | | | 96 | | | – | | | – | |
| Other Federal Payments | | 901 | | | 877 | | | 949 | | | 816 | |
| | | 21,661 | | | 22,277 | | | 21,713 | | | 22,890 | |
| Government Business Enterprises | | | | | | | | | | | | |
| Ontario Lottery and Gaming Corporation | | 1,816 | | | 2,009 | | | 1,935 | | | 1,920 | |
| Liquor Control Board of Ontario | | 1,721 | | | 1,723 | | | 1,811 | | | 1,880 | |
| Ontario Power Generation Inc./Hydro One Inc. | | 932 | | | 1,605 | | | 1,565 | | | 1,012 | |
| | | 4,469 | | | 5,337 | | | 5,311 | | | 4,812 | |
| Other Non-Tax Revenue | | | | | | | | | | | | |
| Reimbursements | | 932 | | | 962 | | | 989 | | | 980 | |
| Vehicle and Driver Registration Fees | | 1,125 | | | 1,248 | | | 1,442 | | | 1,592 | |
| Electricity Debt Retirement Charge | | 939 | | | 954 | | | 948 | | | 865 | |
| Power Supply Contract Recoveries | | 1,323 | | | 1,296 | | | 920 | | | 793 | |
| Sales and Rentals | | 1,188 | | | 1,160 | | | 2,260 | | | 2,803 | |
| Other Fees and Licences | | 760 | | | 759 | | | 914 | | | 979 | |
| Net Reduction of Power Purchase Contract Liability | | 263 | | | 243 | | | 217 | | | 172 | |
| Royalties | | 226 | | | 242 | | | 248 | | | 262 | |
Miscellaneous Other Non-Tax Revenue3 | | 1,065 | | | 1,467 | | | 901 | | | 845 | |
| | | 7,821 | | | 8,331 | | | 8,839 | | | 9,291 | |
| Total Revenue | | 113,369 | | | 115,911 | | | 118,517 | | | 124,390 | |
1 Sales Tax revenue is net of the Ontario Sales Tax Credit and the energy component of the Ontario Energy and Property Tax Credit. 2 Education Property Tax revenue is net of the property tax credit component of the Ontario Energy and Property Tax Credit and the Ontario Senior Homeowners’ Property Tax Grant. 3 Relatively high Miscellaneous Other Non-Tax Revenue in 2013–14 reflects the gain on the sale of the Province’s shares of General Motors Company and higher recoveries of prior-year expenditures. Note: Numbers may not add due to rounding. | |
TABLE 2.23 Total Expense ($ Millions) | |
| Ministry Expense | | 2012–13 | | | Actual 2013–14 | | | Interim 2014–15 | | | Plan 2015–16 | |
Aboriginal Affairs1 | | 65 | | | 63 | | | 68.6 | | | 74.5 | |
Agriculture, Food and Rural Affairs1 | | 1,016 | | | 864 | | | 924.9 | | | 1,028.8 | |
| Attorney General | | 1,683 | | | 1,813 | | | 1,780.3 | | | 1,779.8 | |
Board of Internal Economy2 | | 197 | | | 199 | | | 300.9 | | | 210.5 | |
| Children and Youth Services | | 3,911 | | | 3,997 | | | 4,173.9 | | | 4,315.7 | |
| Citizenship, Immigration and International Trade | | 161 | | | 152 | | | 155.9 | | | 158.6 | |
| Community and Social Services | | 9,696 | | | 9,977 | | | 10,568.6 | | | 11,114.9 | |
Community Safety and Correctional Services1 | | 2,309 | | | 2,380 | | | 2,496.1 | | | 2,466.6 | |
Economic Development, Employment and Infrastructure / Research and Innovation1 | | 998 | | | 992 | | | 1,111.6 | | | 1,219.9 | |
Education1 | | 23,142 | | | 23,645 | | | 24,594.2 | | | 25,230.7 | |
Energy1 | | 340 | | | 311 | | | 316.9 | | | 322.9 | |
Environment and Climate Change1 | | 485 | | | 480 | | | 485.6 | | | 503.3 | |
| Executive Offices | | 30 | | | 30 | | | 44.6 | | | 33.8 | |
Finance1 | | 806 | | | 845 | | | 821.3 | | | 860.9 | |
| Francophone Affairs, Office of | | 5 | | | 5 | | | 5.6 | | | 8.4 | |
| Government and Consumer Services | | 596 | | | 594 | | | 596.6 | | | 601.9 | |
| Health and Long-Term Care | | 47,594 | | | 48,933 | | | 50,172.7 | | | 50,770.9 | |
| Labour | | 281 | | | 303 | | | 307.7 | | | 310.5 | |
Municipal Affairs and Housing1 | | 830 | | | 845 | | | 884.5 | | | 920.0 | |
Natural Resources and Forestry1 | | 694 | | | 720 | | | 724.4 | | | 720.2 | |
| Northern Development and Mines | | 718 | | | 719 | | | 757.4 | | | 756.7 | |
Tourism, Culture and Sport1 | | 1,424 | | | 1,337 | | | 1,256.5 | | | 1,274.3 | |
| Training, Colleges and Universities | | 7,337 | | | 7,572 | | | 7,741.6 | | | 7,809.7 | |
| Transportation | | 2,478 | | | 2,823 | | | 2,965.6 | | | 3,456.8 | |
Treasury Board Secretariat1 | | 588 | | | 232 | | | 424.1 | | | 490.2 | |
Interest on Debt3 | | 10,341 | | | 10,572 | | | 10,675.0 | | | 11,410.1 | |
Other Expense1 | | 4,863 | | | 5,962 | | | 5,094.9 | | | 5,541.5 | |
| Program Review Savings Target | | – | | | – | | | – | | | (490.0 | ) |
Year-End Savings4 | | – | | | – | | | – | | | (1,000.0 | ) |
| Total Expense | | 122,589 | | | 126,364 | | | 129,450.1 | | | 131,902.0 | |
1 Details on other ministry expense can be found in Table 2.24, Details of Other Expense. 2 The 2014–15 amount includes projected expenses for the 2014 general election. 3 Interest on debt is net of interest capitalized during construction of tangible capital assets of $232 million in 2012–13, $134 million in 2013–14, $193 million in 2014–15 and $170 million in 2015–16. 4 As in past years, the Year-End Savings provision reflects anticipated underspending that has historically arisen at year-end due to factors such as program efficiencies, and changes in project startups and implementation plans. Note: Numbers may not add due to rounding. | |
TABLE 2.24 Details of Other Expense ($ Millions) | |
| Ministry Expense | | 2012–13 | | | Actual 2013–14 | | | Interim 2014–15 | | | Plan 2015–16 | |
| Aboriginal Affairs | | | | | | | | | | | | |
One-Time Investments Including Settlements | | – | | | 12 | | | 3.3 | | | – | |
| Agriculture, Food and Rural Affairs | | | | | | | | | | | | |
Time-Limited Investments in Infrastructure | | 19 | | | 132 | | | 40.5 | | | 12.5 | |
Time-Limited Assistance | | – | | | 17 | | | 6.5 | | | – | |
| Community Safety and Correctional Services | | | | | | | | | | | | |
Time-Limited Support for 2015 Pan/Parapan American Games Security | | 1 | | | 5 | | | 45.6 | | | 182.7 | |
| Economic Development, Employment and Infrastructure / Research and Innovation | | | | | | | | | | | | |
Federal–Provincial Infrastructure Programs | | – | | | – | | | – | | | 235.2 | |
| Education | | | | | | | | | | | | |
Teachers’ Pension Plan1 | | 895 | | | 873 | | | 571.0 | | | 71.0 | |
One-Time Savings — Labour Savings | | (1,296 | ) | | – | | | – | | | – | |
| Energy | | | | | | | | | | | | |
Ontario Clean Energy Benefit | | 994 | | | 1,006 | | | 1,080.0 | | | 860.0 | |
| Environment and Climate Change | | | | | | | | | | | | |
Time-Limited Investments | | 78 | | | – | | | – | | | – | |
| Finance | | | | | | | | | | | | |
Ontario Municipal Partnership Fund | | 592 | | | 569 | | | 541.5 | | | 512.5 | |
Power Supply Contract Costs | | 1,323 | | | 1,296 | | | 920.0 | | | 793.0 | |
| Municipal Affairs and Housing | | | | | | | | | | | | |
Time-Limited Investments in Municipal Social and Affordable Housing | | 158 | | | 155 | | | 153.3 | | | 160.3 | |
Time-Limited Investments | | 42 | | | 208 | | | 7.3 | | | – | |
| Natural Resources and Forestry | | | | | | | | | | | | |
Emergency Forest Firefighting | | 180 | | | 92 | | | 79.4 | | | 69.8 | |
| Tourism, Culture and Sport | | | | | | | | | | | | |
Time-Limited Investments to Support 2015 Pan/ Parapan American Games | | 358 | | | 332 | | | 468.6 | | | 904.6 | |
| Treasury Board Secretariat | | | | | | | | | | | | |
Operating Contingency Fund | | – | | | – | | | 50.0 | | | 550.0 | |
Capital Contingency Fund | | – | | | – | | | – | | | 100.0 | |
Pension and Other Employee Future Benefits | | 1,519 | | | 1,265 | | | 1,128.0 | | | 1,090.0 | |
| Total Other Expense | | 4,863 | | | 5,962 | | | 5,094.9 | | | 5,541.5 | |
1 Numbers reflect Public Sector Accounting Board pension expense. Ontario’s matching contributions to the plan grow from $1,393 million in 2012–13 to $1,593 million in 2015–16. Note: Numbers may not add due to rounding. | |
TABLE 2.25 2015–16 Infrastructure Expenditures ($ Millions) | |
| Sector | | Total Infrastructure Expenditures 2014–15 Interim1 | | | 2015–16 Plan | |
| | Investment in Capital Assets2,3(i) | | | Transfers and Other Infrastructure Expenditures4 | | | Total Infrastructure Expenditures3(ii) | |
| Transportation | | | | | | | | | | | | |
Transit | | 2,919 | | | 2,659 | | | 546 | | | 3,205 | |
Provincial Highways | | 2,361 | | | 2,466 | | | – | | | 2,466 | |
| Other Transportation, Property and Planning | | 863 | | | 751 | | | 120 | | | 871 | |
| Health | | | | | | | | | | | | |
Hospitals | | 3,575 | | | 2,425 | | | 243 | | | 2,668 | |
Other Health | | 359 | | | 70 | | | 206 | | | 276 | |
| Education | | 1,904 | | | 1,885 | | | 57 | | | 1,941 | |
| Postsecondary | | | | | | | | | | | | |
Colleges and Other | | 380 | | | 347 | | | 15 | | | 362 | |
Universities | | 168 | | | – | | | 214 | | | 214 | |
| Social | | 241 | | | 27 | | | 315 | | | 342 | |
| Justice | | 220 | | | 91 | | | 152 | | | 243 | |
Other Sectors5 | | 689 | | | 418 | | | 861 | | | 1,279 | |
| Subtotal | | 13,680 | | | 11,138 | | | 2,728 | | | 13,866 | |
| Less: Federal and Municipal Contributions | | 348 | | | 75 | | | 255 | | | 330 | |
| Total | | 13,332 | | | 11,063 | | | 2,473 | | | 13,536 | |
1 Includes Provincial investment in capital assets of approximately $9.5 billion. 2 Includes $170 million in interest capitalized during construction. 3 Includes approximately $2 billion in third-party investments in hospitals, colleges and schools. Excluding this amount: (i) provincially funded investment in capital assets is approximately $9.1 billion; and (ii) total infrastructure expenditure is approximately $11.9 billion. 4 Includes transfers to municipalities, universities and non-consolidated agencies. 5 Includes government administration, natural resources, culture and tourism sectors. Note: Numbers may not add due to rounding. | |
TABLE 2.26 Ten-Year Review of Selected Financial and Economic Statistics1 ($ Millions) | |
| | | 2006–07 | | | 2007–08 | | | 2008–09 | |
| Revenue | | 97,120 | | | 104,115 | | | 97,532 | |
| Expense | | | | | | | | | |
Programs | | 86,020 | | | 94,601 | | | 95,375 | |
Interest on Debt3 | | 8,831 | | | 8,914 | | | 8,566 | |
| Total Expense | | 94,851 | | | 103,515 | | | 103,941 | |
| Reserve | | – | | | – | | | – | |
| Surplus/(Deficit) | | 2,269 | | | 600 | | | (6,409 | ) |
Net Debt4 | | 153,742 | | | 156,616 | | | 169,585 | |
| Accumulated Deficit | | 106,776 | | | 105,617 | | | 113,238 | |
| Gross Domestic Product (GDP) at Market Prices | | 574,292 | | | 597,803 | | | 604,282 | |
| Primary Household Income | | 382,688 | | | 401,978 | | | 413,032 | |
| Population — July (000s) | | 12,662 | | | 12,764 | | | 12,883 | |
| Net Debt per Capita (dollars) | | 12,142 | | | 12,270 | | | 13,164 | |
| Household Income per Capita (dollars) | | 30,224 | | | 31,493 | | | 32,061 | |
| Interest on Debt as a per cent of Revenue | | 9.1 | | | 8.6 | | | 8.8 | |
| Net Debt as a per cent of GDP | | 26.8 | | | 26.2 | | | 28.1 | |
| Accumulated Deficit as a per cent of GDP | | 18.6 | | | 17.7 | | | 18.7 | |
1 Revenue and expense have been restated to reflect a fiscally neutral accounting change for the revised presentation of education property taxes, as described in the 2010 Ontario Budget; a fiscally neutral accounting change related to the reclassification of government agencies and organizations as described in the 2011 Ontario Economic Outlook and Fiscal Review; and a fiscally neutral reclassification of a number of tax measures that are transfers or grants, as described in the 2012 Ontario Budget. 2 Starting in 2009–10, investments in minor tangible capital assets owned by the Province were capitalized and amortized to expense. All capital assets owned by consolidated organizations are being accounted for in a similar manner. 3 Interest on debt is net of interest capitalized during construction of tangible capital assets of $232 million in 2012–13, $134 million in 2013–14, $193 million in 2014–15 and $170 million in 2015–16. 4 Starting in 2009–10, Net Debt includes the net debt of hospitals, school boards and colleges, consistent with Public Sector Accounting Board standards. For comparative purposes, Net Debt has been restated from 2006–07 to 2008–09 to conform with this revised presentation. Sources: Statistics Canada and Ontario Ministry of Finance. | |
| |
2009–102 | 2010–11 | 2011–12 | 2012–13 | Actual 2013–14 | Interim 2014–15 | Plan 2015–16 |
| 96,313 | 107,175 | 109,773 | 113,369 | 115,911 | 118,517 | 124,390 |
| | | | | | | |
| 106,856 | 111,706 | 112,660 | 112,248 | 115,792 | 118,775 | 120,492 |
| 8,719 | 9,480 | 10,082 | 10,341 | 10,572 | 10,675 | 11,410 |
| 115,575 | 121,186 | 122,742 | 122,589 | 126,364 | 129,450 | 131,902 |
| – | – | – | – | – | – | 1,000 |
| (19,262) | (14,011) | (12,969) | (9,220) | (10,453) | (10,933) | (8,512) |
| 193,589 | 214,511 | 235,582 | 252,088 | 267,190 | 284,137 | 298,864 |
| 130,957 | 144,573 | 158,410 | 167,132 | 176,634 | 186,336 | 194,848 |
| 595,433 | 629,500 | 658,635 | 679,616 | 695,705 | 720,981 | 751,287 |
| 413,152 | 425,140 | 444,343 | 460,133 | 473,702 | 489,987 | 509,079 |
| 12,998 | 13,135 | 13,264 | 13,410 | 13,551 | 13,679 | 13,810 |
| 14,894 | 16,331 | 17,762 | 18,798 | 19,717 | 20,772 | 21,642 |
| 31,787 | 32,367 | 33,501 | 34,312 | 34,957 | 35,821 | 36,864 |
| 9.1 | 8.8 | 9.2 | 9.1 | 9.1 | 9.0 | 9.2 |
| 32.5 | 34.1 | 35.8 | 37.1 | 38.4 | 39.4 | 39.8 |
| 22.0 | 23.0 | 24.1 | 24.6 | 25.4 | 25.8 | 25.9 |
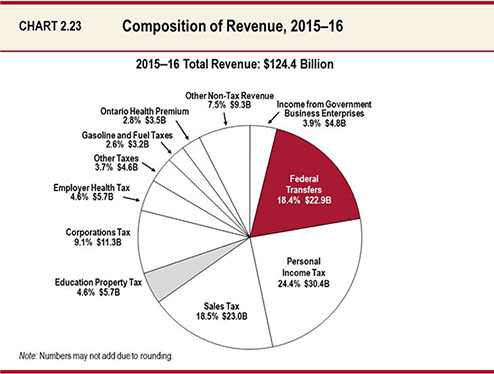
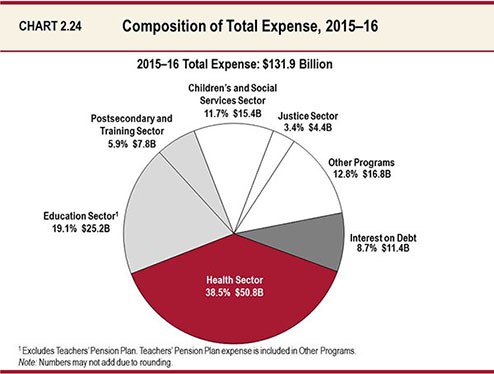
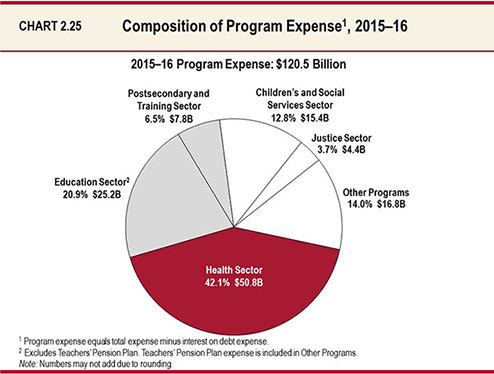
Support from Gaming
Proceeds from gaming activities in Ontario continue to support Provincial priorities. The Ontario Lottery and Gaming Corporation Act, 1999, requires that net Provincial revenue generated from lotteries, Ontario Lottery and Gaming Corporation (OLG) operated casinos, slot facilities and resort casinos support services, organizations and provincial priorities, such as the operation of hospitals, municipalities, amateur sports, Ontario First Nations, problem gambling prevention, treatment and research, and funding for charitable and not-for-profit organizations.
TABLE 2.27 Support for Health Care, Charities, Problem Gambling and Related Programs, Municipalities and Ontario First Nations ($ Millions) | |
| | | Interim 2014–15 | | | Plan 2015–16 | |
| Revenue for Provincial Purposes | | | | | | |
Operation of Hospitals | | 1,640 | | | 1,638 | |
Ontario Trillium Foundation | | 115 | | | 115 | |
Problem Gambling Prevention, Treatment and Research | | 38 | | | 38 | |
Ontario Amateur Sports | | 10 | | | 10 | |
General Government Priorities, Including Horseracing Support | | 131 | | | 119 | |
| Subtotal — Net Profit to Province from OLG | | 1,935 | | | 1,920 | |
Support for Municipalities and Ontario First Nations1 | | | | | | |
Municipalities and First Nations Host Payments2 | | 114 | | | 114 | |
Ontario First Nations3 | | 122 | | | 121 | |
| Total Support from Gaming | | 2,171 | | | 2,155 | |
1 Operating expenses of the Ontario Lottery and Gaming Corporation (OLG) include payments to host municipalities and Ontario First Nations payments under the Gaming Revenue Sharing and Financial Agreement. 2 Includes Ontario Lottery and Gaming Corporation (OLG) operated casinos, slot facilities and resort casinos municipality host payments, the Rama First Nations Fee for Casino Rama and the Mississaugas of Scugog Island First Nation for Great Blue Heron Casino. 3 Revenues paid to First Nations resulting from the Gaming Revenue Sharing and Financial Agreement. Note: Numbers may not add due to rounding. | |
Chapter III
NATIONAL LEADERSHIP – STRONG ONTARIO, STRONG CANADA
Intergovernmental Partnerships that Address 21st Century Challenges
Ontarians, like all Canadians, expect their governments to work together to improve everyone’s economic well-being and quality of life. To do this, Canada needs to address the challenges of today’s world: globalization, the rise of new economic superpowers, the accelerating revolution in technology, and climate change.
A strong Canadian economic union requires strong intergovernmental partnerships. The Province is doing its part by building Ontario up. The government continues to work to expand the economy by investing in people’s talents and skills, building modern infrastructure and transportation networks, creating an innovative and dynamic business environment, and strengthening retirement security. But Ontario cannot do all this alone. To make the most of limited resources, Ontario needs the federal government’s cooperation, as well as collaboration with other provinces and territories.
Ontario is showing national leadership by working with its municipalities, as well as other provinces and territories, to build stronger economies across the country. The government is partnering with municipalities on priorities such as solving congestion and improving public transit, planning for growth and infrastructure, and promoting economic growth across all regions of Ontario. Through the Council of the Federation, Canada’s Premiers are working together to promote international trade, reduce internal trade barriers, and develop a Canadian Energy Strategy that includes equal focus on energy innovation and climate change. Ontario and Quebec are partnering to exchange electricity capacity to make power more affordable for residents and businesses in each province.
The challenges facing the Canadian federation cannot be tackled by one order of government alone. The federal government must play a role in building a stronger economic union. The time is right for a new era of intergovernmental partnerships that focus on investments in areas such as public infrastructure, skills development and training, national pharmacare, energy and climate change strategies, and resource development. This would enhance competitiveness and prosperity for Ontario and the Canadian federation. When Ontario is strong, Canada is strong.
Need for Responsible Federal Action
The Fiscal Imbalance in the Federation
The current mismatch between revenue resources and responsibilities, called the vertical fiscal imbalance, puts provinces and territories at a fiscal disadvantage compared to the federal government. By constitutional design, Ontario — like other provinces in the federation — is responsible for delivering key public services such as health care, education and social services. However, the federal government collects most of the tax revenues. Even in the face of current challenges, such as falling oil prices and lower-than-anticipated economic growth, the federal government is expected to be in a position to realize large and increasing fiscal surpluses in the future.
This vertical fiscal imbalance is expected to worsen over time, partially due to the federal decision to reduce Canada Health Transfer annual growth from six per cent to the rate of nominal gross domestic product (GDP) growth. This measure will take effect in 2017–18 and is expected to remove an estimated $21 billion from health care nationally — $8 billion in Ontario alone — by 2023–24. In addition, according to the federal Parliamentary Budget Officer, the paths of fiscal sustainability of the two orders of government are expected to diverge over time.
Left unaddressed, the vertical fiscal imbalance in the federation could have profound effects on the federation’s future. It could limit provinces and territories from making the necessary investments that strengthen their economies and maintain the public services that Canadians expect and deserve.
The current set of federal–provincial fiscal arrangements is shaped by dated assumptions and works against, not for, Ontarians. The Mowat Centre estimates that, in 2009–10, the shortfall between what the people of Ontario paid in federal taxes versus what they received in federal transfers and services was roughly $11 billion.1 This represents $850 per Ontarian or $3,400 for a family of four.
1 Noah Zon, “Filling the Gap: Measuring Ontario’s Balance with the Federation,” Mowat Centre (2013).
Even the Equalization program works against Ontario. In 2015–16, Ontarians will contribute approximately $6.7 billion to Equalization while the Province will only receive approximately $2.4 billion in return. Ontario’s net contribution to the program is a symptom of a broader problem that requires federal and provincial collaboration.
The Equalization Program The principle of Equalization is enshrined in the Constitution to “ensure that provincial governments have sufficient revenues to provide reasonably comparable levels of public services at reasonably comparable levels of taxation,” as per section 36(2) of the Constitution Act, 1982. |
Fiscal Arrangements Need to Be Modernized
The primary focus of the country’s fiscal arrangements has traditionally been on supporting the high‐quality social services delivered by provinces and territories that Canadians across the nation rely on. To strengthen Canada’s economic union and respond to 21st century realities and challenges, the federal government needs to collaborate with provinces and territories to modernize fiscal arrangements. Modernizing Canada’s fiscal relationships would create a more effective and efficient alignment of resources to responsibilities across orders of government in the federation — for instance, implementing federal funding for pharmacare to strengthen universal health care or a dedicated federal transfer for public infrastructure to boost long-term economic growth.
This work requires intergovernmental partnerships rooted in mutual understanding and ongoing consultation. It will entail all orders of government achieving their goals while avoiding unilateral actions that have lasting negative effects on others. Going forward, the federal government should model its fiscal relations with provinces and territories on past collaborative efforts that have proven successful, such as harmonization of the sales tax system in some provinces, including Ontario.
Unilateral Federal Actions In February 2014, Ontario released a report listing over 110 federal actions negatively impacting Ontarians. The Province called on the federal government to be fair to Ontario and work collaboratively on mutual priorities.2 The Province has taken measures to protect Ontarians from some of these actions including: ● Stepping in with $63.5 million annually to address the gap left by the elimination of the Early Learning and Child Care Agreement; ● Providing support to refugees by filling in gaps in health care coverage for refugees left by the scaling down of the Interim Federal Health Program; and ● Providing $4 million a year to fund the 40 First Nation police officers previously supported by the federal government under the Police Officer Recruitment Fund. The Province cannot step in every time the federal government abandons its responsibilities. |
2 See the list of Federal Actions Negatively Impacting Ontarians here: http://bit.ly/1BnbPR5 (accessed in April 2015).
Building Blocks of a Strong Economic Union
Building a stronger economic union requires complementary federal–provincial efforts towards long-term, sustained and coordinated investments. The federal government is showing willingness in some areas to work with provinces in a way that expands Canada’s economy. For example, the partnership on the Cooperative Capital Markets Regulatory System and the renminbi trading hub are laudable examples of federal–provincial collaboration that attract investment and improve Canada’s competitive advantage internationally. But more collaboration is needed to build the national economy.
Canadian Infrastructure Partnership
Investments in public infrastructure create jobs, enhance productivity and competitiveness, and boost long-term economic growth and prosperity. At the January 2015 Council of the Federation meeting, Canada’s Premiers expressed their commitment to continue investing in strategically important public infrastructure and called for a stronger commitment from the federal government and greater federal funding.
The Economic Case for Investing in Public Infrastructure in Canada Is Strong
| Public Infrastructure Investments Improve Economic Growth | Public Infrastructure Investments Boost Productivity |
The federal Department of Finance’s analysis shows that investments in public infrastructure increase Canada’s production capacity — real gross domestic product (GDP) was boosted by $1.60 in the fourth quarter of 2010 for each dollar invested in infrastructure.1 | Statistics Canada estimates that growth in public infrastructure contributed to roughly 50 per cent of Canada’s multifactor productivity growth, representing about 10 per cent of labour productivity growth overall, in the private sector on average between 1962 and 2006.2 |
3 Finance Canada, “Canada’s Economic Action Plan (Year 2) – Built to Keep Our Economy Growing, A Seventh Report to Canadians,” Catalogue no. F2-189/7-2011E (2011). Reproduced with the permission of the Minister of Finance Canada, 2015.
In Canada, provinces and territories are investing three times as much as the federal government on infrastructure. Provincial and territorial spending makes up 46 per cent of total government infrastructure spending, and municipal spending represents 40 per cent. This means that federal spending represents only 14 per cent, even after taking into account federal transfers to other orders of government.
Provinces, territories and their municipal partners fund the majority of infrastructure projects across Canada, which include building hospitals, schools, colleges, public transit networks and roads. However, the federal government collects roughly the same amount of revenues derived from the economic growth associated with these infrastructure investments as do provinces and territories combined. A pan-Canadian infrastructure partnership is needed to balance this misalignment between investments and benefits.
Ontario is investing more than $130 billion in public infrastructure over 10 years, including $31.5 billion in dedicated funds available for public transit, transportation and other priority infrastructure projects under Moving Ontario Forward. Other provinces have announced similar multi-year capital plans, recognizing the importance of public infrastructure investments. Projects such as completing the twinning of segments of Highway 11/17 and Highway 69 enhance parts of the existing Trans-Canada Highway network that links Ontario to neighbouring provinces.
See Chapter I, Section B: Building Modern Infrastructure and Transportation Networks for details on Ontario’s public infrastructure priorities.
Infrastructure Investment Is a Key Priority Among Provinces ● The 2015–2025 Quebec Infrastructure Plan included in the 2015 Quebec budget proposes to invest $88.4 billion, including 19 per cent of the investments dedicated to road networks, 16 per cent to the health and social services sector, 10 per cent to the education sector, and eight per cent to public transit. ● New Brunswick’s 2015 capital budget announced a four-year capital plan that outlines $2.6 billion in investments, including almost $600 million dedicated to the rehabilitation of roads, bridges and other provincial priorities under the strategic infrastructure initiative. ● British Columbia’s current infrastructure spending on hospitals, schools, postsecondary facilities, transit and roads will total $10.7 billion over three years, according to its 2015 budget. ● Announced in the 2015 Saskatchewan budget, the four-year Saskatchewan Builds Capital Plan is expected to provide $5.8 billion of capital investment in infrastructure, including $3.2 billion in transportation infrastructure. |
The federal government has the capacity to commit to a greater amount of infrastructure investments. According to the Parliamentary Budget Officer, the federal government has considerable room for increasing its capital spending without putting at risk its current fiscal targets.
“The [federal] government has fiscal room for one‐time capital investment of $50 billion in 2015–16, or $10 billion annually over the medium-term. This investment can be undertaken while still achieving balanced budgets and achieving the government’s 25 per cent debt‐to‐GDP ratio target in 2021.”5 |
Higher levels of investment by the federal government would strengthen the economic union by generating considerable economic benefits. This includes boosting revenue at all orders of government, which could be used to maintain vital public services for Canadians. The federal government should partner with the provinces and territories to increase investments in public infrastructure and improve Canada’s economic competitiveness.
Ring of Fire
Ontario’s Ring of Fire area, located about 540 kilometres northeast of Thunder Bay, has the potential to drive the creation of good, high-paying jobs in northern Ontario. The Ring of Fire holds significant deposits of minerals, including the largest deposit of chromite ever discovered in North America, as well as nickel and other minerals. Chromite is the key ingredient of stainless steel.
Ontario has taken a leadership role in driving progress in the Ring of Fire region. The Province has committed up to $1 billion for strategic transportation infrastructure development in the region. The Province calls the federal government to the table as a willing and active partner to match Ontario’s investments and seize the opportunities in the Ring of Fire.
The Province continues to make progress in the Ring of Fire region. In the spring of 2014, a landmark Regional Framework Agreement was signed with Matawa-member First Nations to discuss and negotiate an approach for development in the First Nations’ traditional territories. This process will help ensure that First Nations participate in and benefit from Ring of Fire developments, and that regional environmental impacts are considered.
In the summer of 2014, the Province established the Ring of Fire Infrastructure Development Corporation to move forward in a smart, sustainable and collaborative way with First Nations, the private sector and communities on infrastructure development in the region.
Recently, Ontario and the federal government announced more than $785,000 for a joint study in the region. Funding is being provided to remote Matawa communities to examine the benefits of developing an all-season transportation corridor connecting First Nation communities in the area with existing roadways. Ontario is in a position to move forward with partners on this important project in the north that will create jobs, provide opportunities for First Nation communities, and boost the northern economy.
See Chapter I, Section B: Building Modern Infrastructure and Transportation Networks for more details on Ontario’s plan for the Ring of Fire region.
First Nation Communities
A strong economic union is founded on the provision of the basic necessities of life and good health for all Canadians. Too many First Nation reserves in Ontario are without access to safe drinking water. Some of the longest-standing drinking water advisories in Canada are found in First Nation communities within Ontario. Increasing access to water suitable for drinking and bathing is essential for improving economic and health outcomes on reserves.
Drinking Water Advisories in First Nation Communities As of March 2015, in Ontario alone, there were 60 public water systems across 30 First Nations impacted by a drinking water advisory.6 |
Significant infrastructure, training and capacity gaps persist in the provision of water and wastewater services on reserves. A long-term, sustainable and comprehensive approach is needed to address these pervasive and long-standing issues and make substantive progress.
Although the federal government is primarily responsible for the provision of safe drinking water on reserves, Ontario is committed to working collaboratively with the federal government and First Nations to ensure First Nation communities in Ontario have access to safe, clean and reliable drinking water.
6 Ontario Ministry of the Environment and Climate Change estimates based on drinking water advisories in First Nation communities published by Health Canada.
Developing a vision and long-term plan for improving drinking water on First Nation reserves through multilateral collaboration can lead to substantive progress. This plan should be supported by using existing resources in the most efficient way possible. The federal government brings its knowledge of First Nation water issues and existing funding allocated for communities in Ontario. Ontario has expertise in drinking water management, watershed planning, water technologies, system design, operations, maintenance and training. A pilot partnership project between the governments of Ontario and Canada, as well as four First Nation communities, called the Canada–Ontario First Nations Drinking Water Improvement Initiative, has led to the removal of two long-term boil water advisories to date.
Ontario is proposing to build on previous efforts with the federal government and First Nations to find effective and sustainable solutions to provide safe drinking water to First Nation communities and use existing resources as efficiently as possible.
Support for Advanced Manufacturing
A strong manufacturing sector is a pillar of a diversified national economy. For example, Ontario is a leader in automotive manufacturing — a sector that provides well-paying jobs for Canadians. Since 2004, Ontario has invested over $1 billion in strengthening the productive capacity of the automotive sector, leveraging more than $10 billion in total automotive industry investment.
The federal government has been a key partner of the Province in supporting the automotive sector. Working together, the Province and the federal government have secured major investments in Ontario’s motor vehicle and parts manufacturing sector.
| TABLE 3.1 Recent Examples of Investments in the Automotive Sector |
| Company | Total Investment | Including Contributions from | Jobs Created/Retained |
Government of Ontario | Government of Canada |
| Linamar | Over $500 million | $50.3 million | $50.7 million | 8,000 jobs in Guelph |
| Ford | Over $700 million | $70.9 million | $71.6 million | 2,800 jobs in Oakville |
| Toyota | Over $120 million | $16.9 million | $16.9 million | 400 jobs in Cambridge |
Continued support for key manufacturing sectors, such as the automotive industry, will reinforce Canada’s competitive edge and build a stronger economic union. Ontario will continue to collaborate with the federal government to build on successful past partnerships and strengthen this vital part of Canada’s economy.
See Chapter I, Section D: Creating an Innovative and Dynamic Business Environment for details on Ontario’s support for the manufacturing sector, including the automotive sector.
Labour Market Development Agreement
A strong economic union requires investments in people’s skills and talents to foster a culture of innovation and generate high productivity. The Labour Market Development Agreement (LMDA) is the largest of the four Canada–Ontario labour market fiscal agreements. The LMDA funding helps support programs and services such as Second Career, the Employment Service and apprenticeship training.
The federal government has indicated its intention to renegotiate LMDAs with provinces and territories. A modernized LMDA needs to address Ontario’s long-standing concerns and must work for Ontarians.
The Current Labour Market Development Agreement (LMDA) Is Not Working for Ontarians
| Limited client eligibility | Most LMDA-funded training is available only to active and former Employment Insurance (EI) recipients. In 2014, only 27 per cent of unemployed Ontario workers received EI regular benefits, compared to an average of 44 per cent in other provinces. This means that relatively few unemployed Ontarians were eligible for LMDA-funded training. |
| Unfair funding | Ontario receives only 29 per cent of the national LMDA funding, despite accounting for 39 per cent of Canada’s population. |
Ontario, along with other provinces and territories, is calling on the federal government to:
| › | Expand eligibility so that more unemployed Canadians can receive the skills training they need; and |
| › | Increase federal funding for the LMDA to meet the needs of all of Canada’s unemployed and to address the lack of any funding increase since 1996, despite a nearly 30 per cent increase in Canada’s labour force. |
Through the Council of the Federation, Ontario is leading the collective engagement with the federal government on proposed federal changes to the LMDA. Provinces and territories expect to work with the federal government to ensure that the new agreement provides stable, predictable and adequate funding for employment and training.
See Chapter I, Section A: Investing in People’s Talents and Skills for more details on Ontario’s plan to improve education and skills training for Ontarians.
Canadian Energy Strategy
Capitalizing on energy resources remains an enormous opportunity for Ontario and Canada. To achieve this potential on behalf of all Canadians, resources must continue to be developed responsibly, with an equal focus on energy innovation measures and actions to address climate change.
In this spirit, Canada’s Premiers are developing a Canadian Energy Strategy (CES). They released the revised CES Vision and Principles last summer, and anticipate the release of the CES this year.
Canadian Energy Strategy
| Vision | Canada is a global leader in providing a secure, sustainable and reliable supply of energy that is delivered with a high standard of environmental and social responsibility, consistent with efforts to reduce greenhouse gas emissions, and contributes to continued economic growth and prosperity for all Canadians. |
Principles | Collaboration and Transparency Climate Change and Social and Environmental Responsibility Energy Security and Stability |
“Council of the Federation Communiqué,” Canadian Energy Strategy (August 2014).
Support for Clean Energy
Ontario has become a North American leader in clean energy. However, an active federal partner is needed to collaborate on a Canada-wide framework for climate action to ensure Canada’s contribution to an ambitious international climate change agreement is more than a tally of provincial programs.
Ontario calls on the federal government to support clean energy by:
| › | Facilitating greater regional integration of electricity grids to encourage the development of new, larger‐scale renewable projects that would benefit the economy and the environment — both in Ontario and elsewhere in the country; |
| › | Providing federal funding support and the appropriate regulatory environment for an east–west transmission grid that would carry electricity across provincial borders; and |
| › | Enhancing collaboration on the criteria used by the National Energy Board to assess interprovincial pipeline projects. |
See Chapter I, Section D: Creating an Innovative and Dynamic Business Environment for details on Ontario’s plan to tackle climate change.
Support for Natural Disaster Response, Assistance and Mitigation
The frequency of extreme weather-related events is expected to increase due to climate change. A strong federal partnership with provinces and territories is needed to provide an adequate response and help with assistance costs when natural disasters occur — and help mitigate the risks of natural disasters.
The federal government offers financial support to provinces and territories through the Disaster Financial Assistance Arrangements program for eligible disaster response and recovery costs when a natural disaster occurs. However, recent federal changes to this program will result in a lower federal share of future disaster assistance costs.
Unilateral Federal Changes to Disaster Financial Assistance Arrangements Effective February 2015, the federal government raised the threshold for provinces and territories to be eligible for disaster financial assistance — from $1 to $3 per capita.7 This means that for a province the size of Ontario, the minimum eligible expenses for responding to and recovering from a disaster in 2015 increased from $13.8 million to $41.4 million. |
Offloading emergency support and recovery responsibilities onto provinces and territories without providing adequate federal support is a unilateral federal action that works against the spirit of building and maintaining collaborative partnerships in the federation. The federal government must reconsider its decision and provide adequate assistance for natural disaster response and recovery.
Proactive and coordinated action by all orders of government in disaster prevention and risk mitigation is also necessary to protect Canadians from the impact of natural disasters. The development of a new National Disaster Mitigation Program is an opportunity for the federal government to work meaningfully with provinces and territories to ensure that adequate and flexible funding meets the needs of all provinces and territories.
7 Public Safety Canada, “Guidelines for the Disaster Financial Assistance Arrangements,” (2015), http://bit.ly/1aNE5Wy (accessed in April 2015).
Chapter IV
A FAIR AND SUSTAINABLE TAX SYSTEM
Introduction
Ontario’s tax reforms have positioned the province as one of the most attractive jurisdictions in the industrialized world for business investment. Tax reforms have also increased the progressivity of the Personal Income Tax (PIT) system and enhanced tax support for low- to moderate-income individuals and families.
Since 2009, the government has taken several steps to improve the fairness of the PIT system. The rate on the first bracket was cut from 6.05 per cent to 5.05 per cent, resulting in Ontario having the lowest provincial first bracket rate and nine out of 10 Ontario income tax payers receiving a tax cut.
To make the PIT system more progressive, Ontario increased PIT rates for people with higher incomes in 2012, 2013 and 2014. These combined changes affect only the top two per cent of Ontario tax filers.
The government has also enhanced tax credits for lower-income individuals and families, and introduced several targeted credits. Over $1.5 billion annually in additional relief is now provided through the Ontario Trillium Benefit compared to the 2009 Ontario Property and Sales Tax Credits. The Children’s Activity Tax Credit helps parents with the cost of enrolling their children in extracurricular activities; the Healthy Homes Renovation Tax Credit helps with the cost of making seniors’ homes safer and more accessible; and the Community Food Program Donation Tax Credit provides tax relief to farmers who donate agricultural products to community food programs in Ontario, including food banks.
Since 2009, the government has reduced Ontario’s Corporate Income Tax (CIT) rates for large and small businesses, eliminated the Capital Tax, and moved to the Harmonized Sales Tax (HST). As a result, the marginal effective tax rate (METR) on new business investment in Ontario has been cut in half, placing it below the average METR of Organisation for Economic Co-operation and Development countries, and well below the average METR in the United States.
Through these changes, Ontario has significantly improved its tax competitiveness and made the province a more attractive location for business investment. The government also partners with businesses to leverage private investment through programs such as the Jobs and Prosperity Fund and regional funds such as the Northern Ontario Heritage Fund Corporation and the Southwestern and Eastern Ontario Development Funds.
Ontario, like many other governments, is making difficult but strategic decisions to ensure that investments are effective, efficient and fiscally sustainable. This Budget announces measures to better target supports for business, including tax credits and grants, while ensuring that Ontario remains one of the most attractive and competitive locations for business investment.
Business Tax Supports
The government remains committed to supporting Ontario businesses through various tax credits and direct program spending. The recently announced Jobs and Prosperity Fund is one example of a program aimed at directly supporting businesses in Ontario.
The government is taking a balanced approach to ensure that support provided to Ontario businesses contributes to economic growth and job creation, and promotes investment in key industries.
Tax credits can be a valuable and effective tool to support economic growth. Over the last decade, enhancements to various tax credits made sense in the context of an economic downturn and a high Canadian dollar. For example, Ontario’s tax credits have played a key contributing role in the success of emerging industries such as digital media.
However, the government must continue to respond to the evolving conditions of today’s economy. Recent reviews of Ontario’s business support programs emphasized that support should be effective and fiscally sustainable.
“The level of support provided through tax credits may have made sense at a time when provincial tax rates were high and credits could help make Ontario more competitive for business investment. It makes less sense when Ontario’s tax system is already competitive for business investment because of major tax reforms.” Don Drummond, Commission on the Reform of Ontario’s Public Services, Public Services for Ontarians: A Path to Sustainability and Excellence, (2012), 313. |
Between 2004–05 and 2014–15, refundable business tax credits have grown at an average annual rate of approximately 11 per cent, while overall program spending has grown at an average rate of 4.5 per cent per year.
As part of Ontario’s Program Review, Renewal and Transformation (PRRT) process, the government proposes the following measures to ensure that supports provided to businesses are effective, efficient and sustainable. These supports will also continue to foster economic growth, job creation, and a dynamic and globally competitive business environment, while respecting taxpayers’ dollars.
Apprenticeship Training Tax Credit
The government has demonstrated a strong commitment to Ontario’s apprenticeship system by providing supports to employers, apprentices and training institutions. The renewal of the Ontario Youth Jobs Strategy, as described in Chapter I, Section A: Investing in People’s Talents and Skills, includes $23 million over two years for the Apprenticeship Enhancement Fund and $13 million over two years for pre-apprenticeship programs that help potential entrants develop their job skills and readiness to work as apprentices.
In addition, colleges and other training organizations funded by Ontario will receive an additional $19 million over three years to support equipment upgrades and more lab time during in-school apprenticeship sessions.
These investments deliver on the government’s priority of supporting apprenticeship training by building on the $164.5 million in grants and loans provided to the apprenticeship system in 2014–15.
The Province is also committed to finding smarter, better ways to deliver the best possible value for every dollar spent. Through the government’s PRRT process, the Apprenticeship Training Tax Credit (ATTC) was recognized as a program that could be made more effective.
The ATTC is a tax incentive available to businesses that hire and train apprentices. This credit was introduced in 2004 to encourage registrations in apprenticeship programs and is based on the salaries and wages paid to eligible apprentices in designated construction, industrial, motive power and certain service trades. The ATTC provides a 35 per cent refundable tax credit (45 per cent for small businesses) on salaries and wages paid during the first 48 months of an apprenticeship program, up to an annual limit of $10,000 per apprentice.
In 2009, as part of the strategy to support the recovery from the global economic crisis, the ATTC was enhanced to provide an additional incentive to employers to hire and train apprentices. However, this has resulted in very modest growth in annual apprenticeship registrations in trades eligible for the ATTC.
In addition, the overall completion rate of apprenticeships has remained at approximately 50 per cent. Completion of apprenticeship programs is important for developing a skilled workforce, as it contributes to labour force mobility, higher earnings and entrepreneurship. Apprentices who obtain certification have higher hourly wages than those who completed an apprenticeship but did not obtain certification.
The government proposes the following changes to the ATTC, effective for eligible expenditures related to apprentices who commenced an apprenticeship program after April 23, 2015:
| › | Decreasing the general tax credit rate from 35 per cent to 25 per cent and the rate for small businesses with salaries or wages under $400,000 per year from 45 per cent to 30 per cent; |
| › | Decreasing the annual maximum per apprentice from $10,000 to $5,000; and |
| › | Reducing the eligibility period from the first 48 months of an apprenticeship program to the first 36 months of an apprenticeship program. |
With these proposed changes, the ATTC would return to the level of support offered prior to the 2009 enhancements, and Ontario’s tax support for employers hiring and training apprentices would remain among the most generous in Canada.
The savings associated with these changes would be used to fund the Canada–Ontario Job Grant and a number of targeted initiatives that support youth employment through the renewal of the Ontario Youth Jobs Strategy, as described in Chapter I, Section A: Investing in People’s Talents and Skills.
The Province will continue to review the ATTC to ensure it is encouraging businesses to help apprentices gain the certifications and skills they need to maximize their earnings, improve their labour market mobility, and contribute effectively to the economy. The Province will engage with stakeholders to ensure that employer support for apprenticeship training reflects the diverse needs of apprentices, employers, and other key employment and training partners.
Ontario Interactive Digital Media Tax Credit
The Ontario Interactive Digital Media Tax Credit (OIDMTC) is a refundable tax credit available to qualifying corporations for expenditures related to the creation, marketing and distribution of eligible interactive digital media products.
The credit was introduced in 1998 with broad eligibility criteria to support an emerging industry. Since 2009, OIDMTC rates have increased from 30 per cent to 40 per cent for companies that develop their own products, and from 25 per cent to 35 per cent for companies that develop products under a fee-for-service contract. Ontario’s 40 per cent tax credit rate under the OIDMTC is higher than the credit rates offered by the Province’s key competitors.
In recent years, as interactive digital media products have become mainstream, tax support through the OIDMTC has grown at an unsustainable rate. Between 2003–04 and 2014–15, the OIDMTC is estimated to have grown by over 40 per cent annually. The broad eligibility criteria of the OIDMTC limit the ability of the credit to target innovative products. Ontario announced a review of the OIDMTC in the 2014 Ontario Economic Outlook and Fiscal Review. Further to this announcement, the government has held discussions with key industry stakeholders on ways to contain costs and modernize support to the industry.
The government proposes to amend the OIDMTC by focusing the credit on entertainment products and on educational products for children under the age of 12. Certain products would be specifically excluded, such as search engines, real estate databases, or news and public affairs. The government also proposes to strengthen the rule that excludes promotional products.
The changes would apply to expenditures incurred after April 23, 2015. However, products started before April 24, 2015, that would no longer be eligible for the credit would be eligible for relief in respect of expenditures incurred before April 24, 2015. Information about the proposed changes and examples of products that would be eligible for the credit will be provided in a bulletin.
The Province also proposes to improve the certification process by amending the requirement that all or substantially all (at least 90 per cent) of a product be developed in Ontario by the company claiming the credit. To provide certainty to applicants and reduce processing times for product certification, the requirement would be replaced by a rule based on the labour costs of the company developing the product. The proposed rule would require that 80 per cent of total labour costs for eligible products be attributable to qualifying wages and qualifying remuneration paid to individuals or corporations that carry on a personal services business. As well, 25 per cent of total labour costs for eligible products would be required to be attributable to qualifying wages of employees of the qualifying corporation. The new rule would apply to all products, including those awaiting certification. However, the new rule would not apply to products that were certified before April 24, 2015.
Ontario’s renewed investment in the Interactive Digital Media Fund, as described in Chapter 1, Section D: Creating an Innovative and Dynamic Business Environment, will help support some co-production opportunities and activities that would no longer be eligible for the OIDMTC.
Film and Television Tax Credits
Ontario provided significant support of approximately $335 million in 2014–15 to the film and television industry through the Ontario Film and Television Tax Credit (OFTTC), the Ontario Production Services Tax Credit (OPSTC) and the Ontario Computer Animation and Special Effects Tax Credit (OCASE). Ontario also provides support to the industry through a variety of grants including the Ontario Media Development Corporation Film Fund, Export Fund and Industry Development Program, as well as the Northern Business Opportunity Program provided by the Northern Ontario Heritage Fund Corporation. In addition, film productions are eligible to claim film tax credits and other assistance from the federal government.
A lower Canadian dollar is making Ontario an increasingly attractive location for productions and is increasing foreign investment in the film and television sector. Foreign productions have benefited significantly from the drop in the Canadian dollar relative to the U.S. dollar because their Ontario production costs are paid in Canadian dollars. For example, when the Canadian dollar fell by seven per cent to $0.94 US in December 2013, foreign production activity in Ontario rose by 35 per cent to $504 million in 2014 (from $373 million in 2013). As a result, there is a reduced need for government support of foreign productions.
Ontario Production Services Tax Credit (OPSTC)
The OPSTC is currently a 25 per cent refundable tax credit available to qualifying corporations on eligible expenditures for Ontario labour, service contracts and tangible property in respect of eligible film and television productions. This credit is available to both foreign and domestic productions.
Ontario proposes to reduce the rate of this credit from 25 per cent to 21.5 per cent for qualifying production expenditures incurred after April 23, 2015. The OPSTC would remain competitive compared with other Canadian jurisdictions.
Ontario also proposes to amend the OPSTC to ensure the credit fosters employment opportunities for Ontarians. The following changes would be effective for taxation years that begin after April 23, 2015:
| › | To ensure that salaries and wages paid to Ontario-based individuals for services provided in the Province represent more than a nominal amount of a corporation’s total eligible expenditures, a qualifying corporation’s Ontario labour expenditures (including labour under a service contract) would have to amount to at least 25 per cent of total expenditures. |
| › | Ontario also proposes to limit expenditures incurred by a qualifying corporation pursuant to contracts with non-arm’s-length parties to amounts that would have been eligible for the credit if the corporation had incurred the expenditures directly. |
It is also proposed that the OPSTC be clarified to ensure that only expenditures incurred after the final script stage to the end of the post-production stage would be eligible for the credit. This amendment would apply to expenditures incurred after June 30, 2009.
Ontario Computer Animation and Special Effects Tax Credit (OCASE)
The OCASE is currently a 20 per cent refundable tax credit available to qualifying corporations on Ontario labour for eligible computer animation and special effects activities. Productions are allowed to combine the OCASE with the OFTTC or OPSTC. Ontario proposes to reduce the rate of the OCASE from 20 per cent to 18 per cent for expenditures incurred after April 23, 2015. After this rate reduction, the OCASE would remain competitive with other jurisdictions in Canada. In addition, to better target the credit, Ontario proposes to require that productions started after April 23, 2015, must also receive the OFTTC or the OPSTC in order to claim the OCASE.
The proposed changes to Ontario’s film and television tax credits strike a balance between cultural support and fiscal responsibility. Ontario will continue to attract production activity through a combination of world-class infrastructure, talent and skills, diverse locations, and stable and competitive financial incentives.
Ontario Film and Television Tax Credit (OFTTC)
The federal government has amended the Canadian Film or Video Production Tax Credit to treat a government equity investment in a production in the same manner as other forms of assistance. Eligible expenditures under the tax credit are generally reduced by the amount of assistance received. The OFTTC would automatically parallel this federal change.
To encourage production activity in Ontario, the Province’s long-standing administrative position has been to not treat government equity investments as assistance for the purposes of the OFTTC. The government will file a regulation, effective after December 31, 2008, to enable this treatment to continue. This will benefit the industry by approximately $7 million in 2016–17.
Ontario Sound Recording Tax Credit
With the Ontario Music Fund (OMF) successfully in place and meeting the needs of Ontario’s music industry, the government is committing to the continuation of the fund at $15 million per year, while proposing to eliminate the Ontario Sound Recording Tax Credit (OSRTC). An expenditure incurred after April 23, 2015, will only qualify for the credit if the eligible sound recording was commenced before April 23, 2015, the expenditure was incurred before May 1, 2016, and an OMF grant is not received in respect of the expenditure.
The government will continue to work with its partners in the music industry to obtain the best return on investment from the OMF by supporting activities that contribute to a sustainable, expanding music sector.
Paralleling Federal Measures
Taxation of Trusts and Estates
Ontario proposes to change the way it taxes trusts, including estates, by paralleling the federal approach of applying the highest PIT rate to all trusts, with some exceptions, beginning in 2016. The federal approach will limit tax planning opportunities and improve tax fairness and neutrality.
As announced in the 2014 federal budget, all trusts, with certain exceptions, will pay the federal top marginal PIT rate of 29 per cent on all of their taxable income.
Graduated federal rates will continue to apply for the first 36 months of eligible estates (Graduated Rate Estates, or GREs) and to trusts created as a consequence of the death of an individual that have beneficiaries eligible for the federal Disability Tax Credit (Qualified Disability Trusts, or QDTs).
The Ontario government proposes that graduated Ontario rates and the Ontario surtax would continue to apply to GREs and QDTs taxable in Ontario. All other trusts (top-rate trusts) taxable in Ontario would pay the province’s top marginal PIT rate of 20.53 per cent on all of their taxable income.
The Ontario tax credit rate for charitable donations over $200 would be raised to 17.41 per cent for top-rate trusts. This higher rate is consistent with the maximum benefit of the credit for individuals who pay the Ontario surtax.
The government will introduce legislative amendments to implement these measures that, if passed, would take effect for taxation years ending after December 31, 2015.
Ontario Resource Tax Credit and the Additional Tax on Crown Royalties
The resource allowance in the Corporate Income Tax system, calculated as 25 per cent of adjusted resource profits, acts as a proxy for actual royalties and mining taxes paid to a province. It was introduced by the federal government in 1976, primarily to put a ceiling on deductions of then-increasing provincial royalties and mining taxes. The original policy rationale is no longer relevant as increased competition for exploration and development capital has pressured provinces to levy royalties and mining taxes at lower rates.
The federal resource allowance was fully eliminated in 2007 and replaced with a deduction for actual royalties and mining taxes paid. Ontario is now the only province that provides a resource allowance in lieu of a deduction for royalties and mining taxes. This is done through the Ontario Resource Tax Credit and the Additional Tax on Crown Royalties, which apply for taxation years ending after 2008.
The Province is proposing to harmonize with the federal government and other provinces by eliminating the Ontario Resource Tax Credit and the Additional Tax on Crown Royalties and providing a deduction for royalties and mining taxes paid, effective April 23, 2015. Elimination of the Ontario Resource Tax Credit and the Additional Tax on Crown Royalties would fulfil a recommendation by the Commission on the Reform of Ontario’s Public Services.
Accrued but unused Ontario Resource Tax Credit amounts would be eligible for carry-forward to offset Ontario income tax payable in the first five taxation years beginning after April 23, 2015.
Supporting Consolidation of the Electricity Distribution Sector
A modern and reliable electricity sector is an integral part of Ontario’s economy. It is important that local distribution companies have the capacity and resources to adopt modern technologies and deliver power in a reliable and cost-effective manner. Ontario remains committed to spurring consolidation and encouraging efficiencies in the electricity distribution sector.
In October 2009, the government announced a permanent exemption from the transfer tax on transfers of electricity assets within the public sector.
Municipal electricity utilities (MEUs) are subject to a transfer tax of 33 per cent on the fair market value of the electricity assets sold to the private sector, less any payments in lieu of taxes (PILs) or Ontario CIT paid up to the time of the transfer.
| › | An MEU, as well as Hydro One Inc., Ontario Power Generation Inc. and their subsidiaries, that is exempt from regular federal and Ontario income tax must make PILs under the Electricity Act, 1998, to the Ontario Electricity Financial Corporation (OEFC), which help service and pay down the stranded debt of the electricity sector. Payments in lieu of taxes are equal to the federal and Ontario income tax the MEU would pay if it were a taxable corporation. |
| › | An MEU that ceases to be exempt from federal and Ontario income tax (in other words, when it is no longer 90 per cent owned by municipal shareholders and would no longer pay PILs to OEFC) is deemed to dispose of all of its assets for fair market value, with any tax gain arising on the deemed disposition being subject to PILs (the “PILs Deemed Disposition Rules”). Hydro One Inc., Ontario Power Generation Inc. and their subsidiaries are also subject to the PILs Deemed Disposition Rules. |
The government recognizes that consolidation can improve efficiency and the capacity of MEUs to meet key priorities, including upgrading aging infrastructure, and that private capital can play an important role in facilitating consolidation. The Province is proposing additional time-limited relief on taxes pertaining to transfers of electricity assets for all MEUs, including transfers to the private sector, for the period beginning January 1, 2016, and ending December 31, 2018, by:
| › | Reducing the transfer tax rate from 33 to 22 per cent; |
| › | Exempting MEUs with fewer than 30,000 customers from the transfer tax; and |
| › | Exempting capital gains arising under the PILs Deemed Disposition Rules. |
The 2012 federal budget made a number of changes to section 100 of the Income Tax Act (Canada) with respect to the taxation of capital gains on the disposition of partnership interests to specified persons. This section is intended to prevent the conversion of recapture and other income gains on the assets of a partnership into capital gains. The Province is proposing to amend the regulations made under the Electricity Act, 1998, to adopt the federal measures effective April 23, 2015. The amendments would prevent the avoidance of PILs through dispositions of partnership interests made directly, or indirectly as part of a series of transactions, to a person who is not subject to PILs or a partnership whose members are not all subject to PILs.
Other Measures
Registration Requirements for Certain Road-Building Machines
The 2014 Budget announced that the Province would propose amendments to the Highway Traffic Act that would modernize, by 2016, the treatment of certain unregistered road-building machines that use public roads and highways.
These vehicles are currently exempt from Ontario fuel tax and many requirements tied to vehicle registration. The proposed changes would provide fuel tax revenue to support public transit, transportation infrastructure and other priority projects across the province.
The government is currently reviewing potential registration and licensing requirements to be imposed on some of these vehicles, developing a registration process and meeting with various stakeholders to receive input on this measure.
The Province engaged the National Research Council (NRC) to facilitate formal stakeholder consultations and complete a report. Two consultations were held in March 2015 to cover both northern and southern Ontario.
Property Tax Measures
Provincial Land Tax
The Provincial Land Tax (PLT) is the property tax paid in unincorporated areas of northern Ontario outside municipal boundaries. Provincial Land Tax rates have not been updated to increase revenues since the 1950s.
The government announced a review of the PLT in 2013 in response to serious concerns raised by northern municipalities about inequities between their property tax rates and the PLT. The Province committed to address the concerns of northerners in a fair and balanced way.
The review has involved extensive consultations, including 21 sessions with unincorporated area representatives held across the north, and discussions with northern municipalities.
The consultation findings formed the basis of a summary paper, “Provincial Land Tax Review: A Summary of Stakeholder Consultations,” released in December 2014.
Inequities among Northern Taxpayers
Northern municipalities have long-standing concerns about inequities between their property tax rates and PLT rates:
| › | The average residential PLT is $164, compared to the average residential northern municipal tax of $2,200. |
| › | Almost half of all property owners in unincorporated areas pay PLT of less than $50 a year. |
During the consultations, concerns were also raised that businesses have much lower property tax rates in unincorporated areas than in municipalities.
In addition to inequities between unincorporated areas and municipalities, there are inequities among property owners in unincorporated areas. The PLT for a residential property inside a school board area is six times higher than for a similarly assessed property outside a school board area.
Understanding Tax Differences in the North
The difference between taxes paid in unincorporated areas and northern municipalities partially reflects the levies that many unincorporated area residents pay to local roads and services boards, and the fact that they have fewer services than municipalities. However, even when these factors are taken into account, there is still a significant discrepancy.
The balance of the difference between property taxes in unincorporated areas and northern municipalities is largely due to differences in how important services are paid for. The Province pays the entire cost of providing services including policing, land ambulance and public health in unincorporated areas, while northern municipalities fully fund services such as policing, or share the costs of services such as land ambulance and public health, with the Province. There is a significant gap between PLT revenue and the funding that the Province provides for these services — over and above the amount it would contribute under municipal cost-sharing arrangements.
A First Step towards a More Equitable and Modern Tax System
The inequities identified in the review underscore the need to reform the PLT system. There was broad agreement that all taxpayers should pay their fair share, but there was also recognition that PLT reform must proceed at a manageable pace. A staged approach to reform will focus on engaging northern Ontarians in ongoing discussions.
Proposals outlined in this Budget would reduce PLT inequities beginning in 2015, and form an important first stage in building a fair and modern PLT system:
| › | For residential taxpayers, the PLT rate would be adjusted by $10 per $100,000 of assessed value in 2015 and an additional $40 per $100,000 of assessed value in 2016; |
| › | Unincorporated area businesses would make a proportionate contribution; and |
| › | The minimum per property PLT would be set at $50 annually in 2016 to ensure that all property owners make a basic contribution towards the cost of important services. |
Necessary legislative amendments to facilitate these changes will be introduced.
The government will ensure that provisions are in place for property tax relief to make changes more manageable for low-income seniors and low-income residents with disabilities.
Provincial Land Tax reform is not just about addressing tax inequities. The Province values the views of unincorporated area residents on how to improve the PLT system. In response to suggestions made through the consultations, the Province is proposing to introduce measures that would support better information sharing with local boards and will continue to seek input on additional system improvements.
Continuing to Work with Northern Ontarians on PLT Reform
The proposed measures announced today would be fully implemented by 2016, but the PLT review will not end with these changes. The Province will continue discussions on ways to further address tax inequities in the north and support the work of local roads and services boards.
To initiate the next phase of discussions, the government will launch a new series of consultations with northern Ontarians. The Province is committed to continuing along the path of reform and to ensuring that the PLT is transformed into a fair and modern property tax system.
Power Dam Special Payment Program
The Power Dam Special Payment Program provides municipalities with mitigation related to the former property tax on hydro-electric generating stations (power dams). These facilities became exempt from property taxation in 2001 when the gross revenue charge was introduced.
The 2014 Budget announced a plan to phase down the program’s funding by approximately 25 per cent over three years, starting with a three per cent reduction in 2015.
The Province committed to work with municipalities to explore ways to implement the phase-down in a manner that is fair and manageable. To support these consultations, a working group with municipal representatives was formed.
Subsequent to the 2014 Budget, it was determined that the consultations will also explore the option of reintroducing property taxation for power dams. Recognizing that it was impossible to complete the property tax aspect of this project before the 2015 municipal budget year, it was announced in the 2014 Ontario Economic Outlook and Fiscal Review that the planned reduction to the program for 2015 will be deferred.
This allows time to conduct further analysis and hold consultations with municipal and electricity sector representatives, as well as the Municipal Property Assessment Corporation (MPAC), to fully explore various options, including reintroducing property taxation.
Through this process, the Province is working with stakeholders to strike a balance between predictability for municipal revenues and stability for ratepayers and electricity generators. The outcome will be communicated before the 2016 taxation year.
Strengthening the Property Assessment System
The Province, in partnership with MPAC, municipalities and stakeholders, is working to improve the property assessment system in time for the next province-wide reassessment in 2016.
The key focus of this work is the implementation of the Special Purpose Business Property Assessment Review (the Assessment Review) report recommendations.
The objectives of the Assessment Review recommendations are to improve the transparency, accuracy and predictability of the property assessment system. The Province is proposing changes that would support these objectives by helping to resolve disputes about assessed values before the return of the assessment roll.
Currently underway is a new advance disclosure process for special purpose business properties, which are unique or complex business properties that are particularly challenging to assess. The Municipal Property Assessment Corporation’s consultation on guides that detail the assessment methodologies for these properties was completed in early 2015. The next phase will entail a discussion of market factors and analytics that go into the assessment of properties. Stage three, the release of property-specific preliminary values, is targeted for early 2016, well in advance of roll return.
Municipalities, taxpayers and assessment professionals have expressed support for this proposed approach, which has been designed to reduce the need for the appeal system to resolve concerns with property assessments.
To support full participation in the advance disclosure process, the Province is proposing to strengthen protections for commercial proprietary information shared by taxpayers with MPAC as part of the valuation process. The Province is also proposing changes that would bolster MPAC’s ability to obtain additional information about properties to facilitate the determination of accurate assessed values.
The Province and its partners are also moving forward with implementing other Assessment Review recommendations to improve data integrity, streamline assessment appeals, and better inform municipalities about assessments at risk, as well as property-specific assessment recommendations.
In addition, the Province is working closely with its partners to clarify the roles and responsibilities of the various parties, including through the establishment of policies, procedures and standards for the provision of assessment services by MPAC. As well, to better reflect historic policy intent, the Province is proposing to clarify the tenure of future MPAC board of director appointments and ensure consistency with other key corporations created by Provincial statute.
The Province is committed to transparency and public reporting. Regular updates on implementation of the Assessment Review recommendations will continue to be posted on the Ministry of Finance website.
Summary of Measures
Table 4.1 2015 Budget Tax Measures ($ Millions) | |
| | | 2015–16 | | | 2016–17 | | | 2017–18 | |
Savings from Business Tax Measures (Reductions in Expense) | | | | | | | | | |
| Apprenticeship Training Tax Credit | | 30 | | | 70 | | | 95 | |
| Ontario Interactive Digital Media Tax Credit | | 35 | | | 55 | | | 55 | |
| Ontario Production Services Tax Credit | | 10 | | | 25 | | | 25 | |
| Ontario Computer Animation and Special Effects Tax Credit | | 5 | | | 8 | | | 8 | |
| Ontario Sound Recording Tax Credit | | 1 | | | 1 | | | 1 | |
| Paralleling Federal Tax Measures | | | | | | | | | |
| Taxation of Trusts and Estates | | 10 | | | 35 | | | 40 | |
| Ontario Resource Tax Credit and the Additional Tax on Crown Royalties | | 7 | | | 6 | | | 6 | |
| Tax Relief for Municipal Electricity Utilities | | – | | | – | | | – | |
| Property Tax Measures | | | | | | | | | |
| Provincial Land Tax | | 4 | | | 10 | | | 10 | |
| Total | | 100 | | | 205 | | | 240 | |
Notes: All measures represent reductions in government expenditures, except for the Provincial Land Tax, Taxation of Trusts and Estates, and the Ontario Resource Tax Credit and Additional Tax on Crown Royalties measures, which represent increases in government revenue. Numbers may not add due to rounding. “–” Indicates a nil amount, a small amount (less than $1 million) or an amount that cannot be determined. | |
Technical Amendments
To improve administrative effectiveness and enforcement, maintain the integrity and equity of Ontario’s tax and revenue collection system, and enhance legislative clarity and regulatory flexibility to preserve policy intent, amendments will be proposed to various statutes, including:
| › | Alcohol and Gaming Regulation and Public Protection Act, 1996 |
| › | Canadian Public Accountability Board Act (Ontario), 2006 |
| › | Co-operative Corporations Act |
| › | Credit Unions and Caisses Populaires Act, 1994 |
| › | Employer Health Tax Act |
| › | Estate Administration Tax Act, 1998 |
| › | Financial Administration Act |
› | Financial Services Commission of Ontario Act, 1997 |
| › | Freedom of Information and Protection of Privacy Act |
| › | Health System Improvements Act, 2007 |
| › | Loan and Trust Corporations Act |
| › | Ministry of Revenue Act |
| › | Mortgage Brokerages, Lenders and Administrators Act, 2006 |
| › | Motor Vehicle Accident Claims Act |
| › | Municipal Property Assessment Corporation Act, 1997 |
| › | Provincial Land Tax Act, 2006 |
| › | Registered Insurance Brokers Act |
| › | Regulated Health Professions Statute Law Amendment Act, 2009 |
These proposed amendments will include:
| › | Changes to the Tile Drainage Act that would enhance and clarify the administration of the Tile Loan Program and the Northern Ontario Tile Drainage Loan Program; |
| › | Measures to improve public accessibility of various fees established by the Minister of Finance; and |
› Amendments to the Financial Administration Act to improve the administration of section 28 of the Act, including providing for potential changes to the application of the section under certain conditions.
Chapter V
BORROWING AND DEBT MANAGEMENT
Introduction
Ontario conducts a robust and responsible borrowing program that protects the public interest. The government successfully completed its annual borrowing program in 2014–15, borrowing $39.8 billion. This is up from the $35.0 billion forecast in the 2014 Budget, as the Province capitalized on the continuing low interest rate environment and strong demand for Ontario bonds to prefund $4.8 billion of the 2015–16 requirement.
The Province’s interim total funding requirement in 2014–15 has decreased by $3.9 billion compared to the 2014 Budget forecast. Net debt as of March 31, 2015, is forecast to be $284.1 billion, $5.1 billion lower than forecast in the 2014 Budget, $6.0 billion lower than forecast in the 2013 Budget and $11.4 billion lower than forecast in the 2012 Budget.
Strong global investor demand for Canadian-dollar assets, the liquidity of Ontario benchmark bonds and continuing confidence in the Province allowed Ontario to borrow 79 per cent in Canadian dollars in 2014–15. This was well above the target of at least 70 per cent set out in the 2014 Budget. The Province completed 82 per cent of its borrowing in Canadian dollars in 2013–14 and 72 per cent in 2012–13.
Given the strength of demand in the Canadian-dollar market for Ontario bonds, the Province is raising its Canadian-dollar borrowing target to at least 75 per cent in 2015–16. This represents a continuing decline in the reliance on foreign markets that was seen during the financial crisis. At the peak of the crisis in 2009–10, only 49 per cent of the Province’s bond issues were in Canadian dollars.
Term of Borrowing
Given the low interest rates experienced in recent years, Ontario has been proactive in extending the term of its borrowing program. Extending the term to maturity allows the Province to lock in low interest rates for a longer period, which reduces refinancing risks and helps offset the impact of expected higher interest rates on the Province’s future interest on debt (IOD) costs.
Over the past five years, Ontario has issued $45.4 billion of bonds longer than 30 years to lock in low rates. As a result, the weighted-average term to maturity of long-term Provincial debt issued has been extended significantly.
2014–15 Borrowing Details and Green Bonds
Canadian-dollar borrowing was completed primarily through 33 syndicated issues, but also included floating rate notes, a bond auction, Ontario Savings Bonds and a $500 million Green Bond issue. Foreign currency borrowing was completed through several issues in U.S. dollars, euros and Australian dollars.
In the 2013 Ontario Economic Outlook and Fiscal Review, the Minister of Finance announced that Ontario intended to be the first province in Canada to issue Green Bonds.
On October 2, 2014, Ontario successfully launched a Green Bond program, with an inaugural global Canadian-dollar bond of $500 million. Ontario’s inaugural Green Bond was oversubscribed, with orders of $2.4 billion that far surpassed the size of the bond issue by $1.9 billion. Green investors in Canada as well as in the United States, Europe and Asia participated in the deal, bringing new international buyers to the Canadian-dollar market.
As the first Canadian province to issue Green Bonds, Ontario is leading the way to establish and develop a Canadian-dollar Green Bond market with investor participation from around the world.
Green Bonds will be an important tool to help Ontario finance transit and other environmentally friendly projects across the province. The Eglinton Crosstown Light Rail Transit (LRT) was selected as the first green project to receive funding through the initiative.
The Province plans to issue its second Green Bond during fiscal 2015–16.
Borrowing Program Results
TABLE 5.1 2014–15 Borrowing Program: Province and Ontario Electricity Financial Corporation ($ Billions) | |
| | | 2014 Budget | | | Interim | | | In-Year Change | |
| Deficit/(Surplus) | | 12.5 | | | 10.9 | | | (1.6 | ) |
| Investment in Capital Assets | | 10.2 | | | 9.5 | | | (0.7 | ) |
| Non-Cash Adjustments | | (4.5 | ) | | (4.6 | ) | | (0.1 | ) |
| Loans to Infrastructure Ontario | | 1.8 | | | 0.8 | | | (1.0 | ) |
| Other Net Loans/Investments | | (0.5 | ) | | (0.8 | ) | | (0.3 | ) |
| Debt Maturities | | 21.7 | | | 21.6 | | | (0.1 | ) |
| Debt Redemptions | | 0.3 | | | 0.1 | | | (0.2 | ) |
| Total Funding Requirement | | 41.5 | | | 37.6 | | | (3.9 | ) |
| Canada Pension Plan Borrowing | | – | | | – | | | – | |
| Decrease/(Increase) in Short-Term Borrowing | | (2.4 | ) | | – | | | 2.4 | |
| Increase/(Decrease) in Cash and Cash Equivalents | | (1.4 | ) | | – | | | 1.4 | |
| Preborrowing from 2013–14 | | (2.6 | ) | | (2.6 | ) | | – | |
| Preborrowing in 2014–15 | | – | | | 4.8 | | | 4.8 | |
| Total Long-Term Public Borrowing | | 35.0 | | | 39.8 | | | 4.8 | |
Note: Numbers may not add due to rounding. | |
The Province’s deficit for 2014–15 is now projected to be $10.9 billion — compared to the 2014 Budget forecast of $12.5 billion. The total funding requirement for 2014–15 is now forecast to be $3.9 billion lower than the 2014 Budget forecast.
The Province capitalized on the continuing low interest rate environment and strong demand for Ontario bonds to maintain short-term funding and cash levels, and prefund $4.8 billion of the 2015–16 requirement. As a result, total long-term public borrowing was $4.8 billion higher than forecast in the 2014 Budget in spite of the decline in the total funding requirement.
Borrowing Program Outlook
TABLE 5.2 Medium-Term Borrowing Outlook: Province and Ontario Electricity Financial Corporation ($ Billions) | |
| | | 2015–16 | | | 2016–17 | | | 2017–18 | |
| Deficit/(Surplus) | | 8.5 | | | 4.8 | | | – | |
| Investment in Capital Assets | | 9.1 | | | 11.3 | | | 11.8 | |
| Non-Cash Adjustments | | (4.9 | ) | | (5.5 | ) | | (5.6 | ) |
| Loans to Infrastructure Ontario | | 1.1 | | | 0.5 | | | 0.4 | |
| Other Net Loans/Investments | | 1.0 | | | 0.3 | | | 0.1 | |
| Debt Maturities | | 21.0 | | | 21.4 | | | 17.5 | |
| Debt Redemptions | | 0.2 | | | 0.2 | | | 0.2 | |
| Total Funding Requirement | | 35.9 | | | 33.0 | | | 24.4 | |
| Canada Pension Plan Borrowing | | – | | | (0.1 | ) | | – | |
| Decrease/(Increase) in Short-Term Borrowing | | – | | | (2.5 | ) | | – | |
| Increase/(Decrease) in Cash and Cash Equivalents | | – | | | – | | | – | |
| Preborrowing in 2014–15 | | (4.8 | ) | | – | | | – | |
| Total Long-Term Public Borrowing | | 31.1 | | | 30.4 | | | 24.4 | |
Note: Numbers may not add due to rounding. | |
The Province’s total long-term public borrowing in 2015–16 is forecast to be $31.1 billion, $8.7 billion lower than the amount borrowed in 2014–15, and $6.5 billion less than forecast for 2015–16 in the 2014 Budget.
The Province plans to borrow $85.9 billion over the three-year period in the medium-term borrowing outlook, down from the forecast $105.5 billion over the three-year period contained in the 2014 Budget. This $19.6 billion decline in borrowing reflects the impact of lower deficits, prefunding and the Province’s asset optimization activities.
Given the strength of demand Ontario has experienced in the Canadian-dollar market, the Province is raising its Canadian-dollar borrowing target to at least 75 per cent in 2015–16. This is an increase from the previous target of 70 per cent, which the Province has consistently exceeded over the past four years. The 75 per cent target is well within reach, as in 2014–15 Ontario borrowed $31.4 billion in Canadian dollars alone, larger than the total long-term public borrowing forecast of $31.1 billion for 2015–16.
In the past, Infrastructure Ontario (IO) borrowed from the markets to provide loans for infrastructure development to the broader public sector, including municipalities. From 2014–15 onwards, IO’s borrowing was undertaken directly by the Province through the Ontario Financing Authority. This centralization allowed borrowing to be conducted in a more cost-effective manner, resulting in overall interest savings. While the Province’s funding requirement increased to fund IO’s loans, net debt will not be affected as IO’s borrowing in the public markets was reduced by an identical amount.
The government will seek approval from the Legislature for borrowing authority to meet the Province’s requirement, and will propose amendments to streamline the administration of the Province’s borrowing program.
Interest on Debt Savings and Affordability
Interest on debt (IOD) expense is projected to be $10,675 million for 2014–15, which is $335 million lower than forecast in the 2014 Budget, reflecting lower-than-forecast interest rates, the lower forecast deficit for 2014–15, cost-effective debt management and a one-time gain from the sale of asset-backed commercial paper that was written down in prior fiscal years. This decline is projected to continue into 2015–16, with IOD expense forecast to be $11,410 million, $618 million lower than forecast in the 2014 Budget.
These savings continue a trend that has been in place since 2010, through a combination of lower deficits and borrowing requirements and lower-than-forecast interest rates. Chart 5.4 shows that IOD expense in 2015–16 is now forecast to be $4.0 billion lower than the forecast for 2015–16 contained in the 2010 Budget. Interest on debt savings over the period to balance now total $20.6 billion relative to the 2010 Budget forecast.
Chart 5.5 illustrates how the savings on IOD have lowered a key measure of the affordability of debt. The 2010 Budget forecast that, by 2015–16, the Province would have to spend 11.9 cents of every revenue dollar received on interest. The current forecast is 23 per cent lower, at only 9.2 cents of interest costs for every dollar of revenue. This ratio is lower than it was in the 14 fiscal years from 1992–93 to 2005–06, and is forecast to remain lower through the period to balance in 2017–18.
Ensuring Preferred Market Access
Ontario continues to have preferred access to the bond and money markets, both domestically and internationally. The Province uses a variety of tools to ensure that it will continue to have unhindered access to capital as needed, whether this is in receptive markets, such as in 2014–15, or in difficult conditions, such as in 2009–10.
In 2014–15, the Province was able to take advantage of a robust domestic market to complete 79 per cent of its long-term borrowing requirement through syndicated bonds, floating rate notes, a bond auction, Ontario Savings Bonds and a $500 million Green Bond issue. This ability to issue debt targeted at a variety of buyers allows the Province to borrow cost-effectively and have access to markets even during difficult conditions.
The Province has also been very successful in reopening existing syndicated bond issues and is able to accommodate investors demanding significant amounts of Ontario debt through its large order procedure. This allows the Province to raise cash cost-effectively over a short period.
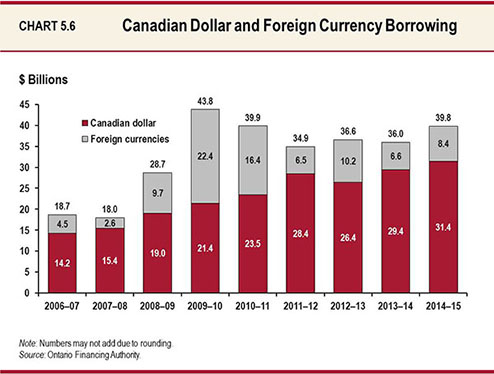
While access remained particularly strong during 2014–15 in the Canadian-dollar market, where the Province has traditionally done most of its borrowing, the U.S.-dollar market continued to provide an excellent platform to complete nine per cent of the 2014–15 borrowing requirement. The Province regularly accesses the U.S.-dollar market, having borrowed $26.6 billion in U.S. dollars over the past four years. Ontario’s most recent U.S.-dollar issuance was a successful seven-year benchmark bond for $2.2 billion in September 2014, which attracted over 90 investors and had strong interest from investors in North America and Europe. Ontario’s U.S.-dollar bonds tend to be large benchmark issues that are actively traded and highly liquid.
The Province also returned to the euro market, issuing there for the first time since 2010. Ontario’s two new 10-year euro issues totalled $4.4 billion and were both oversubscribed. Given the success of these issues, the Province will likely return to the euro market in 2015–16.
The Province’s remaining foreign currency borrowing was completed in Australian dollars.
The Province continues to remain vigilant for cost-effective borrowing opportunities in other currencies. The purpose of borrowing in currencies other than Canadian dollars is to continue to diversify the Province’s investor base. This helps reduce Ontario’s overall borrowing costs and ensures that the Province will continue to have access to capital if market conditions become more challenging.
Ontario also works to strengthen its diverse investor base through its investor relations initiatives. It maintains strong working relationships with global investment dealers, issuers and other industry experts. In addition, the Province provides up-to-date investor information products and regular updates on the status of Ontario’s borrowing program through the Ontario Financing Authority’s website at www.ofina.on.ca.
This vigilance, combined with attention to international markets and investors, has been rewarded during times of challenging market conditions, such as in 2009–10 at the peak of the financial crisis, when borrowing in the domestic market was difficult. Ontario completed 51 per cent of its 2009–10 borrowing requirement of $43.8 billion in international markets through global issues in U.S. dollars, euros, Swiss francs and Hong Kong dollars. Overall, the Province maintains a diverse international investor base, having issued bonds in 10 currencies over the past decade and attracting investors from around the globe.
The Province will remain flexible in its borrowing approach by monitoring all major markets and seeking the most cost-effective means, over the long term, to finance Ontario’s borrowing program. This will include continuing to reach out to investors and investment banks, domestically and globally, to ensure that Ontario bond issues remain highly attractive, liquid and sought after, as they have been since Ontario began accessing public markets almost 25 years ago.
Ensuring Adequate Liquidity Levels
Ontario actively manages its financial obligations through the maintenance of a liquid reserve portfolio and the use of short-term borrowing. The Province has consistently maintained high levels of unrestricted liquid reserves since the financial crisis, averaging $23.5 billion for 2014–15, $24.9 billion for 2013–14 and $23.3 billion for 2012–13.
The Province’s short-term borrowing program in the Canadian- and U.S.-dollar money markets is relatively small, accounting for only seven per cent of Ontario’s debt. The unused short-term borrowing capacity that this leaves, combined with the high levels of unrestricted liquid reserves, ensures that the Province will always have adequate liquidity to meet its financial obligations.
Reducing Ontario’s Stranded Debt
Interim 2014–15 results for the Ontario Electricity Financial Corporation (OEFC) show an estimated excess of revenue over expense of $1.5 billion, reducing the OEFC’s unfunded liability (or “stranded debt of the electricity sector”) from $9.8 billion as of March 31, 2014, to $8.3 billion as of March 31, 2015. This is the eleventh consecutive year of stranded debt reduction.
As published in the 2014 Ontario Economic Outlook and Fiscal Review, the Minister of Finance determined the residual stranded debt to be $2.6 billion as of March 31, 2014. Under Ontario Regulation 89/12, the determination of residual stranded debt as of March 31, 2015, will be made by the Minister of Finance after the OEFC submits to the Minister its annual report, including the audited financial statements, and by no later than March 31, 2016.
The government dedicates revenues it receives from the electricity sector to OEFC. All OEFC revenues, including the debt retirement charge (DRC) paid by electricity users, are used to service and retire its debt and other obligations, as provided for under the Electricity Act, 1998.
As included in the 2014 Budget, the government is moving forward with removing the DRC cost from residential electricity users’ electricity bills, after December 31, 2015. This would save a typical residential user about $70 per year.
The charge will remain on all other electricity users’ bills until the residual stranded debt is retired — it is estimated this will occur by the end of 2018, as published in the 2014 Ontario Economic Outlook and Fiscal Review.
The estimated timing for residual stranded debt retirement is subject to uncertainty in forecasting future OEFC results and dedicated revenues to OEFC, which depend on the financial performance of Ontario Power Generation, Hydro One and municipal electricity utilities, as well as other factors such as interest rates and electricity consumption.
Impact of Proposed Hydro One Initial Public Offering on Residual Stranded Debt
The government recognizes its commitment to electricity ratepayers under section 50.3 of the Electricity Act, 1998, and is proposing steps to clarify and ensure that the benefits of selling shares in Hydro One are recognized by OEFC to contribute to the continuing reduction of its unfunded liability. Doing so would also help to offset impacts on residual stranded debt from a reduction in the projected present value of future dedicated revenues to OEFC related to Hydro One.
Following the completion of any share sales, the Minister of Finance would assess associated impacts as part of the annual determination of residual stranded debt and the estimated timing of its retirement.
Net Debt
Ontario’s net debt is the difference between total liabilities and total financial assets. It is projected to be $284.1 billion as of March 31, 2015 (March 31, 2014, $267.2 billion). This includes the broader public sector’s net debt of $15.3 billion (March 31, 2014, $14.1 billion). The net debt projection for March 31, 2015, is $5.1 billion below the forecast of $289.3 billion in the 2014 Budget. It is also lower than the forecast of $290.1 billion in the 2013 Budget and $295.5 billion in the 2012 Budget.
The Province’s net debt-to-GDP ratio is projected to be 39.4 per cent at the end of fiscal 2014–15, compared to 40.3 per cent forecast in the 2014 Budget, 40.2 per cent forecast in the 2013 Budget and 41.3 per cent forecast in the 2012 Budget. This ratio is expected to peak at 39.8 per cent in 2015–16, lower than the 40.8 per cent forecast in the 2014 Budget, the 40.4 per cent forecast in the 2013 Budget and the 41.3 per cent forecast in the 2012 Budget.
Ontario’s net debt-to-GDP and accumulated deficit-to-GDP ratios are levelling off and the government continues to maintain a target of reducing the net debt-to-GDP ratio to its pre-recession level of 27 per cent.
The difference between the net debt-to-GDP ratio and accumulated deficit-to-GDP ratio is due to the Province’s consistent level of investment in infrastructure as shown by the increase in tangible capital assets. By 2017–18, the net tangible capital assets of the Province are forecast to be approximately equal to the estimated program spending for that year.
Cost of Debt
The interest rate that Ontario pays on its debt has been in steady decline since 1990–91, when the effective interest rate (on a weighted-average basis) on total debt was 10.9 per cent. As of March 31, 2015, it is estimated to be 3.8 per cent, compared to 3.9 per cent on March 31, 2014, and 4.1 per cent on March 31, 2013.
The global decline in interest rates over the last 25 years cannot continue indefinitely. To protect itself from an increase in interest rates, the Province has continued to extend the term of its debt.
For 2015–16, the impact of a one percentage point change in interest rates on IOD is approximately $400 million for the Province.
Total Debt Composition
Total debt consists of bonds issued in the public capital markets, non-public debt, treasury bills and U.S. commercial paper. Total debt is projected to be $314.5 billion as of March 31, 2015, compared to $295.8 billion as of March 31, 2014, and a forecast of $310.5 billion in the 2014 Budget. The increase over the 2014 Budget forecast is primarily due to the $4.8 billion in prefunding for 2015–16 completed before March 31, 2015.
As of March 31, 2015, Canadian-dollar denominated debt represented 79 per cent of total debt outstanding.
Public debt, as of March 31, 2015, totalled $302.2 billion, primarily consisting of bonds issued in the domestic and international public markets in 10 currencies. Ontario also has $12.3 billion outstanding in non-public debt issued in Canadian dollars. Non-public debt consists of debt instruments issued mainly to the Canada Pension Plan Investment Board. This debt is not marketable and cannot be traded.
Limiting Risk Exposure
The Province continues to take a very prudent approach to managing the risks associated with its borrowing program. Liquid reserves averaged $23.5 billion in 2014–15, ensuring that the Province continues to have adequate liquidity to meet its financial obligations, even in the event of an unexpected and prolonged disruption in global capital markets. Ontario has also been proactive in extending the term of its borrowing to reduce refinancing risk and exposure to changes in interest rates. The average term of borrowing in 2014–15 was 14.1 years.
Ontario limits itself to a maximum net interest rate resetting exposure of 35 per cent of debt issued for Provincial purposes and a maximum foreign exchange exposure of five per cent of debt issued for Provincial purposes. As of February 27, 2015, the values for net interest rate resetting exposure and foreign exchange exposure were 10.3 per cent and 0.3 per cent, respectively. All exposures remained well below policy limits in 2014–15.
The Province’s Use of Derivatives
To seek the most cost-effective means of meeting its borrowing requirements, Ontario issues debt in foreign currencies, as well as floating rate debt in both domestic and international markets. To mitigate the risk arising from foreign exchange and interest rate movements, the Province uses derivatives, a type of financial contract, to limit its exposure to both of these variables. Foreign currency swaps and forwards are used to convert foreign currency exposure into Canadian-dollar exposure, while interest rate swaps ensure interest payments on the Province’s floating rate debt remain constant.
The Province’s consolidated derivative portfolio for 2014–15 (as of March 31, 2015) had a notional value of $195.9 billion (2014, $200.4 billion), which consisted of $110.6 billion (2014, $117.5 billion) in interest rate swaps, $53.0 billion (2014, $54.6 billion) in cross-currency swaps, $31.7 billion (2014, $27.7 billion) in forward foreign exchange contracts, and $0.5 billion (2014, $0.7 billion) in swaptions. Notional amounts represent the volume of outstanding derivative contracts and are not indicative of credit risk, market risk or actual cash flows.
New Standard on Financial Instruments
The Public Sector Accounting Board’s (PSAB) new standard on Financial Instruments, if implemented in its current form, would have a significant impact on how the Province uses derivatives to convert its current exposure in foreign currency debt into Canadian-dollar obligations. The proposed standard, which does not allow for hedge accounting, would introduce significant and difficult-to-forecast volatility in the accounting treatment of the Province’s IOD, net debt and deficit. This is contrary to the current PSAB standard, comparable international and U.S. accounting standards, and Canadian private-sector accounting standards, all of which allow for hedge accounting.
As of December 31, 2014, the Province used derivatives to hedge approximately 99 per cent of its $70 billion in foreign currency debt into Canadian dollars. While $52 billion of this hedging would remain unaffected under the new standards, IOD and the deficit would become subject to significant swings entirely due to the type of derivative used on the remaining $18 billion.
The derivative instruments used to hedge this $18 billion currently provide savings of up to 30 basis points, or over $50 million annually, relative to the cost of instruments that would otherwise have to be used under the new standard to eliminate volatility. However, the Province would no longer be able to continue to use these more economically efficient instruments to hedge its foreign currency exposure, as the volatility on its reported financial results would become too great. For example, in January 2015, the Canadian dollar depreciated by 11 cents against the U.S. dollar. Under the new standard, this would have resulted in a $1.2 billion accounting change in the Province’s IOD and deficit, even though, from an economic perspective, the foreign exchange risk would have remained hedged. As a result, accounting rules, rather than efficient business practices, would determine the Province’s use of derivatives for hedging, since the Province would be unable to accept such volatility in its financial statements.
Ontario, supported by the borrowing communities of the majority of the provinces, has communicated its outstanding concerns with the standard to PSAB. It has requested that PSAB consider hedge accounting as an option, in line with comparable international, U.S. and Canadian private-sector accounting standards. This approach would eliminate the potential accounting swings in IOD, the deficit and net debt. This would allow Ontario to continue to use the most economically efficient means of hedging its foreign exchange exposure and also ensure that the Province’s financial results reflect the economic substance underlying its use of derivative instruments.
Consolidated Financial Tables
TABLE 5.3 Net Debt and Accumulated Deficit ($ Millions) | |
| | | 2010–11 | | | 2011–12 | | | | | 2013–14 | | | Interim 2014–15 | | | Plan 2015–16 | |
Debt1 | | | | | | | | | | | | | | | | | |
| Publicly Held Debt | | | | | | | | | | | | | | | | | |
Bonds2 | | 201,074 | | | 223,468 | | | | | 259,933 | | | 279,948 | | | 290,133 | |
Treasury Bills | | 13,925 | | | 11,925 | | | | | 12,297 | | | 13,288 | | | 13,288 | |
U.S. Commercial Paper2 | | 3,242 | | | 4,701 | | | | | 8,657 | | | 7,666 | | | 7,666 | |
Infrastructure Ontario (IO)3 | | 1,989 | | | 1,854 | | | | | 1,603 | | | 950 | | | 300 | |
Other | | 353 | | | 347 | | | | | 345 | | | 309 | | | 300 | |
| | | 220,583 | | | 242,295 | | | | | 282,835 | | | 302,161 | | | 311,687 | |
| Non-Public Debt | | | | | | | | | | | | | | | | | |
Canada Pension PlanInvestment Fund | | 10,233 | | | 10,233 | | | | | 10,233 | | | 10,233 | | | 10,233 | |
Ontario Immigrant InvestorCorporation | | 1,063 | | | 1,185 | | | | | 1,139 | | | 927 | | | 661 | |
55 School Board Trust | | 779 | | | 759 | | | | | 718 | | | 704 | | | 681 | |
Public Service Pension Fund | | 1,403 | | | 1,048 | | | | | 225 | | | – | | | – | |
Canada Mortgage andHousing Corporation | | 696 | | | 635 | | | | | 501 | | | 431 | | | 357 | |
Ontario Public ServiceEmployees’ Union PensionFund (OPSEU) | | 667 | | | 498 | | | | | 107 | | | – | | | – | |
Ontario Teachers’ PensionFund | | 1,205 | | | 625 | | | | | – | | | – | | | – | |
| | | 16,046 | | | 14,983 | | | | | 12,923 | | | 12,295 | | | 11,932 | |
| | | | | | | | | | | | | | | | | | |
| Total Debt | | 236,629 | | | 257,278 | | | | | 295,758 | | | 314,456 | | | 323,619 | |
TABLE 5.3 Net Debt and Accumulated Deficit (cont’d) ($ Millions) | |
| | | 2010–11 | | | 2011–12 | | | 2012–13 | | | 2013–14 | | | Interim 2014–15 | | | Plan 2015–16 | |
| Total Debt | | 236,629 | | | 257,278 | | | 281,065 | | | 295,758 | | | 314,456 | | | 323,619 | |
| Cash and Temporary Investments | | (22,416 | ) | | (21,180 | ) | | (29,037 | ) | | (24,303 | ) | | (26,582 | ) | | (21,748 | ) |
| Total Debt Net of Cash and Temporary Investments | | 214,213 | | | 236,098 | | | 252,028 | | | 271,455 | | | 287,874 | | | 301,871 | |
Other Net (Assets)/Liabilities4 | | (13,261 | ) | | (14,862 | ) | | (13,839 | ) | | (18,354 | ) | | (19,085 | ) | | (17,864 | ) |
Broader Public Sector (BPS) Net Debt | | 13,559 | | | 14,346 | | | 13,899 | | | 14,089 | | | 15,348 | | | 14,857 | |
| Net Debt | | 214,511 | | | 235,582 | | | 252,088 | | | 267,190 | | | 284,137 | | | 298,864 | |
Non-Financial Assets5 | | (69,938 | ) | | (77,172 | ) | | (84,956 | ) | | (90,556 | ) | | (97,801 | ) | | (104,016 | ) |
| Accumulated Deficit | | 144,573 | | | 158,410 | | | 167,132 | | | 176,634 | | | 186,336 | | | 194,848 | |
1 Includes debt issued by the Province and Government Organizations, including the OEFC. 2 All balances are expressed in Canadian dollars. The balances above reflect the effect of related derivative contracts. 3 Infrastructure Ontario’s (IO) interim 2014–15 debt is composed of Infrastructure Renewal Bonds ($950 million). IO’s debt is not guaranteed by the Province. 4 Other Net (Assets)/Liabilities include accounts receivable, loans receivable, advances and investments in government business enterprises, accounts payable, accrued liabilities, deferred revenue and capital contributions, pensions and other employee future benefits, and other liabilities. 5 Non-financial assets include the tangible capital assets of the Province and broader public sector. Source: Ontario Ministry of Finance. | |
TABLE 5.4 Medium-Term Outlook: Net Debt and Accumulated Deficit ($ Billions) | |
| | | 2016–17 | | | 2017–18 | |
| Total Debt | | 334.8 | | | 341.4 | |
| Cash and Temporary Investments | | (21.7 | ) | | (21.7 | ) |
| Total Debt Net of Cash and Temporary Investments | | 313.1 | | | 319.7 | |
| Other Net (Assets)/Liabilities | | (15.9 | ) | | (13.8 | ) |
| Broader Public Sector (BPS) Net Debt | | 14.3 | | | 13.7 | |
| Net Debt | | 311.5 | | | 319.5 | |
| Non-Financial Assets | | (111.8 | ) | | (119.8 | ) |
| Accumulated Deficit | | 199.7 | | | 199.7 | |
Note: Numbers may not add due to rounding. | |
TABLE 5.5 Debt Maturity Schedule ($ Millions) | |
| Currency | |
| | | Canadian Dollar | | | U.S. Dollar | | | Japanese Yen | | | Euro | | | Other Currencies1 | | | Interim 2014–15 Total | | | 2013–14 Total | |
| Fiscal Year Payable | |
| Year 1 | | 21,769 | | | 18,275 | | | 916 | | | – | | | 1,806 | | | 42,766 | | | 43,324 | |
| Year 2 | | 11,188 | | | 9,887 | | | – | | | – | | | 494 | | | 21,569 | | | 21,397 | |
| Year 3 | | 12,243 | | | 5,011 | | | – | | | 385 | | | – | | | 17,639 | | | 21,485 | |
| Year 4 | | 11,402 | | | 5,233 | | | 75 | | | – | | | 594 | | | 17,304 | | | 17,521 | |
| Year 5 | | 15,327 | | | 3,853 | | | – | | | 4,747 | | | 532 | | | 24,459 | | | 16,004 | |
| 1–5 years | | 71,929 | | | 42,259 | | | 991 | | | 5,132 | | | 3,426 | | | 123,737 | | | 119,731 | |
| 6–10 years | | 65,010 | | | 6,774 | | | 386 | | | 6,365 | | | 1,382 | | | 79,917 | | | 74,080 | |
| 11–15 years | | 19,368 | | | – | | | – | | | – | | | 121 | | | 19,489 | | | 20,548 | |
| 16–20 years | | 10,196 | | | – | | | – | | | – | | | – | | | 10,196 | | | 9,513 | |
| 21–25 years | | 34,653 | | | – | | | – | | | – | | | – | | | 34,653 | | | 22,769 | |
26–50 years2 | | 46,464 | | | – | | | – | | | – | | | – | | | 46,464 | | | 49,117 | |
Total3 | | 247,620 | | | 49,033 | | | 1,377 | | | 11,497 | | | 4,929 | | | 314,456 | | | 295,758 | |
Debt Issued for Provincial Purposes | | 223,559 | | | 48,664 | | | 1,377 | | | 11,318 | | | 4,195 | | | 289,113 | | | 269,612 | |
| OEFC Debt | | 24,061 | | | 369 | | | – | | | 179 | | | 734 | | | 25,343 | | | 26,146 | |
| Total | | 247,620 | | | 49,033 | | | 1,377 | | | 11,497 | | | 4,929 | | | 314,456 | | | 295,758 | |
1 Other currencies include Australian dollar, New Zealand dollar, Norwegian kroner, Swiss franc, Hong Kong dollar and South African rand. 2 The longest term to maturity is to June 2, 2062. 3 The foreign currency denominated debt for Interim 2014–15 is $66.8 billion (2013–14, $67.8 billion). Of that, $65.9 billion or 98.6 per cent (2013–14, $66.4 billion or 98.0 per cent) was fully hedged to Canadian dollars. | |