Ontario Finances 2015–16 First Quarter Update | MINISTRY OF FINANCE August 2015 |
Contents A. 2015–16 Fiscal Outlook ............................ 1 B. Details of In-Year Changes ........................ 3 C. Ontario's Economic Outlook ...................... 5 D. Economic Performance .............................. 6 E. Details of Ontario's Finances ...................... 8 F. Ontario's 2015–16 Financing Program ...... 13 | Introduction The Ontario Quarterly Finances contains updated information about Ontario's 2015–16 fiscal outlook, including updated information about the major components of revenue and expense as set out in the 2015 Budget. |
Section A: 2015–16 Fiscal Outlook
The government is projecting a deficit of $8.5 billion in 2015–16, unchanged from the 2015 Ontario Budget. This deficit outlook, if achieved, would be the lowest deficit level since the 2008–09 global recession.
The 2015 Ontario Budget reaffirmed the government's commitment to take a deliberate and thoughtful approach to eliminating the deficit by 2017–18. The government's path to a balanced budget is based on managing growth in program spending and maintaining the integrity of Provincial revenues, while continuing to make investments that grow the economy and create jobs.
The Ontario economy continues to grow in a challenging global environment. Since the 2015 Ontario Budget, the forecasts for 2015 growth in Ontario, the rest of Canada and the United States have been reduced. Most of the downgrade in growth prospects is due to a weak start in 2015. Forecasters remain generally optimistic about future Ontario growth, in line with the 2015 Budget assumptions.
2015–16 In-Year Fiscal Performance
| ($ Millions) | | | 2015–16 | |
| | 2014–15 Interim | Budget
Plan | Current
Outlook | In-Year
Change |
| Revenue | 118,517 | 124,390 | 124,390 | – |
| Expense | | | | |
| Programs | 118,775 | 120,492 | 120,492 | – |
| Interest on Debt | 10,675 | 11,410 | 11,410 | – |
| Total Expense | 129,450 | 131,902 | 131,902 | – |
| Reserve | – | 1,000 | 1,000 | – |
| Surplus / (Deficit) | (10,933) | (8,512) | (8,512) | – |
Note: Numbers may not add due to rounding. |
The outlook for Provincial program expense, at $120.5 billion, is unchanged from the 2015 Budget Plan — reflecting the government's commitment to manage growth in spending. The 2015–16 outlook continues to include a program review savings target of $500 million, which will be delivered through the government's efforts to transform programs and modernize government.
The Province's interest on debt expense forecast, at $11.4 billion, is unchanged from the 2015 Budget forecast.
The 2015–16 outlook also maintains a $1.0 billion reserve along with contingency funds to protect the fiscal outlook against adverse changes in the Province's revenue and expense, including those resulting from changes in Ontario's economic performance.
Ontario's net debt-to-GDP ratio is expected to peak at 39.8 per cent in 2015–16, consistent with the forecast in the 2015 Ontario Budget and lower than the 40.8 per cent forecast in the 2014 Ontario Budget.
Further details on the Province's fiscal plan, including final results for 2014–15, will be provided in future fiscal updates.
Section B: Details of In-Year Changes
Revenue
The 2015–16 revenue outlook, at $124,390 million, remains unchanged from the 2015 Budget.
There are downside risks around the revenue outlook related to the weak start to economic growth in 2015. There are both upside and downside risks around the revenue outlook related to personal and corporate income tax assessments for past years and related to continued uncertainty over global economic growth. The government will continue to monitor economic and revenue developments and will provide further details in future fiscal updates.
Total Expense
The 2015–16 total expense outlook, at $131,902 million, is unchanged from the projection in the 2015 Budget. Key changes to ministry expense projections since the 2015 Budget are all fiscally neutral and they include:
| ♦ | A transfer of $3.0 million from Treasury Board Secretariat to the Ministry of Citizenship, Immigration and International Trade for advertising and media buying expenses for the 2015 Action Plan to Stop Sexual Violence and Harassment. |
| ♦ | A transfer totaling $1.2 million from the Ministry of Tourism, Culture and Sport to the Ministry of Citizenship, Immigration and International Trade, Ministry of Aboriginal Affairs, Ministry of Transportation, Ministry of Education and Ministry of Economic Development, Employment and Infrastructure for promotion, celebration and legacy initiatives for the Pan/Parapan American Games. Funding supports the development of the volunteer program, implementation of the Aboriginal Communities Youth Project, cycling skills training programs, school-based programs and a North South Business Forum. |
| ♦ | A transfer totaling $1.9 million from the Ministry of Children and Youth Services to the Ministry of Education, the Ministry of Citizenship, Immigration and International Trade, and the Ministry of Tourism, Culture and Sport to support the next phase of Ontario's Youth Action Plan. |
| ♦ | A transfer of $1.0 million from the operating contingency fund to Cabinet Office for Ontario's contribution to the Red Cross to support relief efforts following the earthquake in Nepal. |
Interest on debt expense is unchanged. The projected cost of borrowing is consistent with the 2015 Ontario Budget, as interest rates remain in line with the Budget forecast.
Fiscal Prudence
The 2015 Budget included a $1.0 billion reserve in 2015–16 to protect the fiscal outlook against adverse changes in the Province's revenue and expense, including those resulting from changes in Ontario's economic performance. The current fiscal outlook maintains the full reserve.
The current outlook also maintains contingency funds to help mitigate expense risks — particularly in cases where health and safety may be compromised or services to the most vulnerable are jeopardized — that may otherwise negatively impact Ontario's fiscal performance.
Section C: Ontario's Economic Outlook
The Ontario economy continues to grow in a challenging global environment. Expectations for global economic growth remain moderate, but uneven. In July, the International Monetary Fund's World Economic Outlook Update projected growth for the world economy of 3.3 per cent, slightly below the forecast at the time of the Budget. The average forecast for 2015 real GDP growth in the United States, Ontario's largest trading partner, has declined from 3.1 per cent at the time of the 2015 Budget to 2.4 per cent.
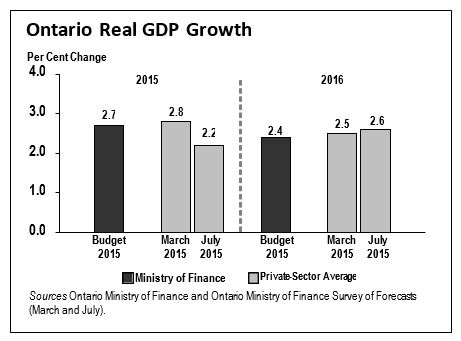
As of July 31, 2015, private-sector forecasters, on average, project Ontario real GDP will increase by 2.2 per cent in 2015, down from a 2.8 per cent increase expected at the time of the 2015 Budget. Private-sector forecasts for Ontario real GDP growth in 2016 have increased slightly, averaging 2.6 per cent, up from 2.5 per cent at the time of the Budget.
Section D: Economic Performance
Ontario Real GDP
| ♦ | In the first (calendar) quarter of 2015, Ontario's real GDP edged down 0.1 per cent, or 0.2 per cent annualized, following a 0.6 per cent increase, or 2.3 per cent annualized, in the fourth quarter of 2014. Ontario's real GDP in the quarter was 8.5 per cent above its pre-recession level. |
Labour Market
| ♦ | Ontario employment increased 0.4 per cent in the second quarter of 2015, following a 0.1 per cent decline in the first quarter. As of June 2015, Ontario employment increased by 295,600 net jobs, or 4.4 per cent, above the pre-recession peak reached in October 2008. |
| ♦ | The unemployment rate was 6.5 per cent in June 2015, the lowest rate since September 2008. |
Retail Sales
| ♦ | Ontario retail sales over the first two months of the second quarter grew 2.4 per cent above the first quarter average. On a year-to-date basis, retail sales were up 4.1 per cent over the first five months of 2015, compared to the same period in 2014. |
Inflation
| ♦ | The Ontario Consumer Price Index (CPI) rose 0.9 per cent (year-over-year) in the second quarter of 2015. Lower energy prices contributed to the modest pace of inflation in the quarter. |
Housing Market
| ♦ | Ontario home resales advanced by 9.7 per cent in the second quarter of 2015, after edging down 0.8 per cent in the previous quarter. On a year-to-date basis, Ontario home resales were up 12.2 per cent over the first six months of 2015, compared to the same period in 2014. |
| ♦ | Ontario housing starts increased 22.0 per cent in the second quarter, following a decline of 3.7 per cent in the previous quarter. |
Manufacturing Sales and International Exports
| ♦ | Ontario manufacturing sales over the first two months of the second quarter edged down 0.1 per cent compared to the first quarter average. On a year-to-date basis, manufacturing sales were down 0.5 per cent over the first five months of 2015, compared to the same period in 2014. |
| ♦ | Ontario international goods exports (on a customs basis) increased 0.9 per cent in the second quarter of 2015. On a year-to-date basis, international goods exports advanced 8.7 per cent over the first six months of 2015, compared to the same period in 2014. |
Ontario Key Economic Indicators
| (Seasonally adjusted per cent change from previous period, unless indicated otherwise) |
| | Monthly 2015 | Quarterly | Annual |
| | Apr | May | June | 2015Q1 | 2015Q2 | 2014 |
| Gross Domestic Product | | | | | | |
| Real GDP | N/A | N/A | N/A | -0.1 | N/A | 2.2 |
| Nominal GDP | N/A | N/A | N/A | 0.3 | N/A | 3.6 |
Labour Market | | | | | | |
| Labour Force (Change in 000s) | -20.4 | 23.9 | 10.7 | -12.7 | 4.5 | 34.8 |
| Employment (Change in 000s) | -14.3 | 43.9 | 14.0 | -7.6 | 25.6 | 54.5 |
| Unemployment Rate (%) | 6.8 | 6.5 | 6.5 | 6.9 | 6.6 | 7.3 |
Household Sector | | | | | | |
| Retail Sales | 0.3 | 1.2 | N/A | -0.8 | N/A | 5.0 |
Housing Starts1 | 0.7 | 31.3 | -29.9 | -3.7 | 22.0 | -3.2 |
| MLS Home Resales | 4.8 | 3.4 | 0.4 | -0.8 | 9.7 | 3.7 |
Manufacturing Sales | -0.6 | -1.1 | N/A | -2.8 | N/A | 6.1 |
| Transportation Equipment | 1.4 | -1.1 | N/A | -5.2 | N/A | 8.7 |
Consumer Price Index2 | 0.8 | 0.9 | 1.0 | 1.5 | 0.9 | 2.4 |
1 Monthly and quarterly housing starts are expressed at a seasonally adjusted annual rate. 2 Per cent change from a year earlier, data not seasonally adjusted. N/A = Data not available. Sources: Statistics Canada, Ontario Ministry of Finance, Canada Mortgage and Housing Corporation, and Canadian Real Estate Association. |
Section E: Details of Ontario's Finances
Revenue
| ($ Millions) | | 2015–16 |
| | Interim 2014–15 | Budget
Plan | Current Outlook | In-Year Change |
| Taxation Revenue | | | | |
| Personal Income Tax | 29,028 | 30,377 | 30,377 | – |
Sales Tax1 | 21,740 | 22,982 | 22,982 | – |
| Corporations Tax | 10,148 | 11,342 | 11,342 | – |
Education Property Tax2 | 5,632 | 5,715 | 5,715 | – |
| Employer Health Tax | 5,430 | 5,680 | 5,680 | – |
| Ontario Health Premium | 3,350 | 3,458 | 3,458 | – |
| Gasoline Tax | 2,383 | 2,457 | 2,457 | – |
| Land Transfer Tax | 1,758 | 1,782 | 1,782 | – |
| Tobacco Tax | 1,163 | 1,262 | 1,262 | – |
| Fuel Tax | 738 | 752 | 752 | – |
| Beer and Wine Tax | 566 | 575 | 575 | – |
| Electricity Payments-In-Lieu of Taxes | 209 | 524 | 524 | – |
| Other Taxes | 509 | 491 | 491 | – |
| | 82,654 | 87,397 | 87,397 | – |
| Government of Canada | | | | |
| Canada Health Transfer | 12,413 | 13,065 | 13,065 | – |
| Canada Social Transfer | 4,847 | 4,976 | 4,976 | – |
| Equalization | 1,988 | 2,363 | 2,363 | – |
| Infrastructure Programs | 149 | 308 | 308 | – |
| Labour Market Programs | 909 | 914 | 914 | – |
| Social Housing | 458 | 448 | 448 | – |
| Wait Times Reduction Fund | – | – | – | – |
| Other Federal Payments | 949 | 816 | 816 | – |
| | 21,713 | 22,890 | 22,890 | – |
| Government Business Enterprises | | | | |
| Ontario Lottery and Gaming Corporation | 1,935 | 1,920 | 1,920 | – |
| Liquor Control Board of Ontario | 1,811 | 1,880 | 1,880 | – |
| Ontario Power Generation Inc./Hydro One Inc. | 1,565 | 1,012 | 1,012 | – |
| | 5,311 | 4,812 | 4,812 | – |
| Other Non-Tax Revenue | | | | |
| Reimbursements | 989 | 980 | 980 | – |
| Vehicle and Driver Registration Fees | 1,442 | 1,592 | 1,592 | – |
| Electricity Debt Retirement Charge | 948 | 865 | 865 | – |
| Power Supply Contract Recoveries | 920 | 793 | 793 | – |
| Sales and Rentals | 2,260 | 2,803 | 2,803 | – |
| Other Fees and Licences | 914 | 979 | 979 | – |
| Net Reduction of Power Purchase Contract Liability | 217 | 172 | 172 | – |
| Royalties | 248 | 262 | 262 | – |
| Miscellaneous Other Non-Tax Revenue | 901 | 845 | 845 | – |
| | 8,839 | 9,291 | 9,291 | – |
| Total Revenue | 118,517 | 124,390 | 124,390 | – |
1 Sales Tax revenue is net of the Ontario Sales Tax Credit and the energy component of the Ontario Energy and Property Tax Credit. 2 Education Property Tax revenue is net of the property tax credit component of the Ontario Energy and Property Tax Credit and the Ontario Senior Homeowners' Property Tax Grant. Note: Numbers may not add due to rounding. |
Total Expense
| ($ Millions) | | | 2015–16 | |
| | Interim
2014–15 | Budget
Plan | Current Outlook | In-Year Change |
| Ministry Expense | | | | |
Aboriginal Affairs1 | 68.6 | 74.5 | 74.8 | 0.3 |
Agriculture, Food and Rural Affairs1 | 924.9 | 1,028.8 | 1,028.8 | – |
| Attorney General | 1,780.3 | 1,779.8 | 1,779.8 | – |
Board of Internal Economy2 | 300.9 | 210.5 | 210.5 | – |
| Children and Youth Services | 4,173.9 | 4,315.7 | 4,313.8 | (1.9) |
| Citizenship, Immigration and International Trade | 155.9 | 158.6 | 162.6 | 4.1 |
| Community and Social Services | 10,568.6 | 11,114.9 | 11,114.9 | – |
Community Safety and Correctional Services1 | 2,496.1 | 2,466.6 | 2,466.6 | – |
Economic Development, Employment and Infrastructure / Research and Innovation1 | 1,111.6 | 1,219.9 | 1,219.9 | 0.1 |
Education1 | 24,594.2 | 25,230.7 | 25,231.7 | 1.1 |
Energy1 | 316.9 | 322.9 | 322.9 | – |
| Environment and Climate Change | 485.6 | 503.3 | 503.3 | – |
| Executive Offices | 44.6 | 33.8 | 34.8 | 1.0 |
Finance1 | 821.3 | 860.9 | 860.9 | – |
| Francophone Affairs, Office of | 5.6 | 8.4 | 8.4 | – |
| Government and Consumer Services | 596.6 | 601.9 | 601.9 | – |
| Health and Long-Term Care | 50,172.7 | 50,770.9 | 50,770.9 | – |
| Labour | 307.7 | 310.5 | 310.5 | – |
Municipal Affairs and Housing1 | 884.5 | 920.0 | 920.0 | – |
Natural Resources and Forestry1 | 724.4 | 720.2 | 720.2 | – |
| Northern Development and Mines | 757.4 | 756.7 | 756.7 | – |
Tourism, Culture and Sport1 | 1,256.5 | 1,274.3 | 1,274.7 | 0.4 |
| Training, Colleges and Universities | 7,741.6 | 7,809.7 | 7,809.7 | – |
| Transportation | 2,965.6 | 3,456.8 | 3,456.9 | 0.2 |
Treasury Board Secretariat1 | 424.1 | 490.2 | 487.3 | (3.0) |
Interest on Debt3 | 10,675.0 | 11,410.1 | 11,410.1 | – |
Other Expense1 | 5,094.9 | 5,541.5 | 5,539.3 | (2.2) |
| Program Review Savings Target | – | (490.0) | (490.0) | – |
Year-End Savings4 | – | (1,000.0) | (1,000.0) | – |
| Total Expense | 129,450.1 | 131,902.0 | 131,902.0 | – |
1 Details on other ministry expense can be found in the Details of Other Expense table. 2 The 2014–15 amount includes projected expenses for the 2014 general election. 3 Interest on debt expense is net of interest capitalized during construction of tangible capital assets of $193 million in 2014–15 and
$170 million in 2015–16. 4 As in past years, the Year-End Savings provision reflects anticipated underspending that has historically arisen at year-end due to factors such as program efficiencies, and changes in project startups and implementation plans. Note: Numbers may not add due to rounding. |
Details of Other Expense
| ($ Millions) | | | 2015–16 | |
| | Interim 2014–15 | Budget Plan | Current Outlook | In-Year Change |
| Ministry Expense | | | | |
| Aboriginal Affairs | | | | |
| One-Time Investments Including Settlements | 3.3 | – | – | – |
| Agriculture, Food and Rural Affairs | | | | |
| Time-Limited Investments in Infrastructure | 40.5 | 12.5 | 12.5 | – |
| Time-Limited Assistance | 6.5 | – | – | – |
| Community Safety and Correctional Services | | | | |
| Time-Limited Support for 2015 Pan/Parapan American Games Security | 45.6 | 182.7 | 182.7 | – |
| Economic Development, Employment and Infrastructure / Research and Innovation | | | | |
| Federal-Provincial Infrastructure Programs | – | 235.2 | 235.2 | – |
| Education | | | | |
Teachers' Pension Plan1 | 571.0 | 71.0 | 71.0 | – |
| Energy | | | | |
| Ontario Clean Energy Benefit | 1,080.0 | 860.0 | 860.0 | – |
| Finance | | | | |
| Ontario Municipal Partnership Fund | 541.5 | 512.5 | 512.5 | – |
| Power Supply Contract Costs | 920.0 | 793.0 | 793.0 | – |
| Municipal Affairs and Housing | | | | |
| Time-Limited Investments in Municipal Social and Affordable Housing | 153.3 | 160.3 | 160.3 | – |
| Time-Limited Investments | 7.3 | – | – | – |
| Natural Resources and Forestry | | | | |
| Emergency Forest Firefighting | 79.4 | 69.8 | 69.8 | – |
| Tourism, Culture and Sport | | | | |
| Time-Limited Investments to Support 2015 Pan/Parapan American Games | 468.6 | 904.6 | 903.4 | (1.2) |
| Treasury Board Secretariat | | | | |
| Operating Contingency Fund | 50.0 | 550.0 | 549.0 | (1.0) |
| Capital Contingency Fund | – | 100.0 | 100.0 | – |
| Pension and Other Employee Future Benefits | 1,128.0 | 1,090.0 | 1,090.0 | – |
| Total Other Expense | 5,094.9 | 5,541.5 | 5,539.3 | (2.2) |
1 Numbers reflect Public Sector Accounting Board pension expense. Ontario's matching contributions to the plan are $1,531 million
in 2014–15 and $1,593 million in 2015–16. Note: Numbers may not add due to rounding. |
2015–16 Infrastructure Expenditures| ($ Millions) | | 2015–16 Plan |
| Sector | Total Infrastructure Expenditures 2014–15 Interim1 | Investment in Capital Assets2,3(i) | Transfers and Other Infrastructure Expenditures4 | Total Infrastructure Expenditures3(ii) |
| Transportation | | | | |
| Transit | 2,919 | 2,659 | 546 | 3,205 |
| Provincial Highways | 2,361 | 2,466 | – | 2,466 |
Other Transportation,
Property and Planning | 863 | 751 | 120 | 871 |
| Health | | | | |
| Hospitals | 3,575 | 2,425 | 243 | 2,668 |
| Other Health | 359 | 70 | 206 | 276 |
| Education | 1,904 | 1,885 | 57 | 1,941 |
| Postsecondary | | | | |
| Colleges and Other | 380 | 347 | 15 | 362 |
| Universities | 168 | – | 214 | 214 |
| Social | 241 | 27 | 315 | 342 |
| Justice | 220 | 91 | 152 | 243 |
Other Sectors5 | 689 | 418 | 861 | 1,279 |
| Subtotal | 13,680 | 11,138 | 2,728 | 13,866 |
| Less: Federal and Municipal Contributions | 348 | 75 | 255 | 330 |
| Total | 13,332 | 11,063 | 2,473 | 13,536 |
1 Includes Provincial investment in capital assets of approximately $9.5 billion. 2 Includes $170 million in interest capitalized during construction. 3 Includes approximately $2 billion in third party investments in hospitals, colleges and schools. Excluding this amount: (i) provincially funded investment in capital assets is approximately $9.1 billion; and (ii) total infrastructure expenditure is approximately $11.9 billion. 4 Includes transfers to municipalities, universities and non-consolidated agencies. 5 Includes government administration, natural resources, culture and tourism sectors. Note: Numbers may not add due to rounding. |
Review of Selected Financial and Economic Statistics1
($ Millions) | 2011–12 | 2012–13 | 2013–14 | Interim 2014–15 | Current Outlook 2015–16 |
| Revenue | 109,773 | 113,369 | 115,911 | 118,517 | 124,390 |
| Expense | | | | | |
| Programs | 112,660 | 112,248 | 115,792 | 118,775 | 120,492 |
Interest on Debt2 | 10,082 | 10,341 | 10,572 | 10,675 | 11,410 |
| Total Expense | 122,742 | 122,589 | 126,364 | 129,450 | 131,902 |
| Reserve | – | – | – | – | 1,000 |
| Surplus / (Deficit) | (12,969) | (9,220) | (10,453) | (10,933) | (8,512) |
| Net Debt | 235,582 | 252,088 | 267,190 | 284,137 | 298,864 |
| Accumulated Deficit | 158,410 | 167,132 | 176,634 | 186,336 | 194,848 |
| Gross Domestic Product (GDP) at Market Prices | 658,635 | 679,616 | 695,705 | 720,938 | 751,242 |
| Primary Household Income | 444,343 | 460,133 | 473,702 | 490,211 | 509,311 |
| Population – July (000s) | 13,264 | 13,410 | 13,551 | 13,679 | 13,810 |
| Net Debt per Capita (dollars) | 17,762 | 18,798 | 19,717 | 20,772 | 21,642 |
| Household Income per Capita (dollars) | 33,501 | 34,312 | 34,957 | 35,837 | 36,881 |
| Interest on Debt as a per cent of Revenue | 9.2 | 9.1 | 9.1 | 9.0 | 9.2 |
| Net Debt as a per cent of GDP | 35.8 | 37.1 | 38.4 | 39.4 | 39.8 |
| Accumulated Deficit as a per cent of GDP | 24.1 | 24.6 | 25.4 | 25.8 | 25.9 |
1 Revenue and expense have been restated to reflect a fiscally neutral accounting change for the revised presentation of education property taxes, as described in the 2010 Ontario Budget, a fiscally neutral accounting change related to the reclassification of government agencies and organizations as described in the 2011 Ontario Economic Outlook and Fiscal Review, and a fiscally neutral reclassification of a number of tax measures that are transfers or grants, as described in the 2012 Ontario Budget. 2 Interest on debt is net of interest capitalized during construction of tangible capital assets of $232 million in 2012–13, $134 million in 2013–14, $193 million in 2014–15 and $170 million in 2015–16. Sources: Ontario Ministry of Finance and Statistics Canada. |
Section F: Ontario's 2015–16 Financing Program
Province and Ontario Electricity Financial Corporation
| ($ Millions) | Interim
2014–15 | 2015–16 |
Budget
Plan | Current Outlook | In-Year Change |
| Deficit / (Surplus) | 10,933 | 8,512 | 8,512 | – |
| Investment in Capital Assets | 9,507 | 9,079 | 9,079 | – |
| Non-Cash Adjustments | (4,607) | (4,912) | (4,912) | – |
| Loans to Infrastructure Ontario | 840 | 1,058 | 1,058 | – |
| Other Net Loans / Investments | (760) | 1,012 | 1,009 | (3) |
| Debt Maturities | 21,572 | 20,981 | 21,072 | 91 |
| Debt Redemptions | 87 | 200 | 100 | (100) |
| Total Funding Requirement | 37,573 | 35,930 | 35,919 | (11) |
| Canada Pension Plan Borrowing | – | (42) | (42) | – |
| Decrease / (Increase) in Short-Term Borrowing | – | – | – | – |
| Increase / (Decrease) in Cash and Cash Equivalents | 45 | – | – | – |
Preborrowing from 2013–14 | (2,603) | – | – | – |
Preborrowing in 2014–15 | 4,834 | (4,834) | (4,834) | – |
| Total Long-Term Public Borrowing Requirement | 39,849 | 31,054 | 31,043 | (11) |
Note: Numbers may not add due to rounding. |
Borrowing Program Status (as at June 30, 2015)
| ($ Billions) | Completed | Remaining | Total |
| Province | 6.3 | 22.7 | 29.0 |
| Ontario Electricity Financial Corporation | 0.4 | 1.6 | 2.0 |
| Total | 6.7 | 24.3 | 31.0 |
Note: Numbers may not add due to rounding. |
Long-Term Public Borrowing completed as at June 30, 2015 totalled $6.7 billion, as follows:
| | ($ Billions) |
| Domestic Issues | 4.2 |
| Global/ US Dollar/ Other Issues | 2.5 |
| | 6.7 |
Given the strength of demand in the Canadian-dollar market for Ontario bonds, the Province has raised its Canadian-dollar borrowing target to at least 75 per cent in 2015–16. As of June 30, 2015, approximately 63 per cent of this year's borrowing had been completed in Canadian dollars.
Ministry of Finance www.fin.gov.on.ca
For general inquiries regarding the Ontario Finances 2015–16 First Quarter Update, please call:
Toll-free English & French inquiries: 1-800-337-7222
Teletypewriter (TTY): 1-800-263-7776
© Queen's Printer for Ontario, 2015