Exhibit 99.13
Treasury Board Secretariat PUBLIC ACCOUNTS OF ONTARIO Annual Report and Consolidated Financial Statements 2015-2016

Treasury Board Secretariat
PUBLIC ACCOUNTS OF ONTARIO
| | |
Annual Report and Consolidated Financial Statements 2015-2016 | |  |
| | | | | | | | |
Treasury Board Secretariat Office of the Minister | | Ministry of Finance Office of the Minister | | Secrétariat du Conseil du
Trésor Bureau du ministre | | Ministère des Finances Bureau du ministre | | 
|
| 99 Wellesley Street West | | 7th Floor, Frost Building South | | 99, rue Wellesley Ouest | | 7 étage, Édifice Frost Sud | |
| Room 4320, Whitney Block | | 7 Queen’s Park Crescent | | Édifice Whitney, bureau 4320 | | 7 Queen’s Park Crescent | |
| Toronto, ON M7A 1W3 | | Toronto ON M7A 1Y7 | | Toronto (Ontario) M7A 1W3 | | Toronto ON M7A 1Y7 | |
| Tel.: 416-327-2333 | | Telephone: 416-325-0400 | | Tél. : 416 327-2333 | | Téléphone: 416-325-0400 | |
| Fax: 416-327-3790 | | Facsimile: 416-325-0374 | | Téléc. : 416 327-3790 | | Télécopieur: 416-325-0374 | |
The Honourable Elizabeth Dowdeswell, OC, OOnt
Lieutenant Governor of Ontario
Legislative Building
Queen’s Park
Toronto, ON M7A 1A1
May It Please Your Honour:
The undersigned have the privilege to present the Public Accounts of the Province of Ontario for the fiscal year ended March 31, 2016, in accordance with the requirements of the Financial Administration Act.
Respectfully submitted,
| | |
| Original signed by | | Original signed by |
| |
| The Honourable Liz Sandals | | The Honourable Charles Sousa |
| President of the Treasury Board | | Minister of Finance |
| Toronto, October 2016 | | Toronto, October 2016 |
Contents
| | | | |
Foreword | | | iii | |
Introduction | | | 1 | |
Guide to the Public Accounts | | | 2 | |
Financial Statement Discussion and Analysis | | | 2 | |
The Consolidated Financial Statements | | | 2 | |
Other elements of the Annual Report | | | 4 | |
Supporting volumes | | | 4 | |
Statement of Responsibility | | | 5 | |
| |
FINANCIAL STATEMENT DISCUSSION AND ANALYSIS | | | | |
Highlights | | | 9 | |
Analysis of 2015–16 Results | | | 12 | |
Revenue | | | 12 | |
Expense | | | 17 | |
Statement of Financial Position analysis | | | 23 | |
Infrastructure expenditures | | | 26 | |
Liabilities | | | 27 | |
Risks and risk management | | | 29 | |
Key Financial Ratios | | | 31 | |
Responsible Fiscal Management | | | 34 | |
Non-Financial Activities | | | 37 | |
Health care | | | 37 | |
Education | | | 38 | |
Post-secondary education and training | | | 38 | |
Condition of provincial tangible capital assets | | | 38 | |
Transparency and Accountability | | | 40 | |
Recent developments in public sector accounting standards | | | 40 | |
The C.D. Howe Institute Fiscal Accountability Report | | | 40 | |
Trillium Trust | | | 41 | |
Data visualization | | | 41 | |
| | | | |
| Financial Statement Discussion and Analysis, 2015–2016 | | | i | |
| | | | |
CONSOLIDATED FINANCIAL STATEMENTS | | | | |
| |
Auditor’s Report | | | 45 | |
Consolidated Statement of Operations | | | 47 | |
Consolidated Statement of Financial Position | | | 48 | |
Consolidated Statement of Change in Net Debt | | | 49 | |
Consolidated Statement of Change in Accumulated Deficit | | | 50 | |
Consolidated Statement of Cash Flow | | | 51 | |
Notes to the Consolidated Financial Statements | | | 52 | |
Schedules to the Consolidated Financial Statements | | | 87 | |
Glossary | | | 106 | |
Sources of Additional Information | | | 112 | |
| | |
| ii | | Financial Statement Discussion and Analysis, 2015–2016 |
Foreword
Each year, the Province releases the Public Accounts to update Ontarians on our end-of-year financial position. The Annual Report that accompanies the financial statements provides transparency and accountability for the dollars we spend. Ontario is a recognized leader in financial reporting. The C.D. Howe Institute, an independent research organization that focuses on support for economically sound public policy practices, has acknowledged the consistent basis used by Ontario for our Budget, Estimates and Public Accounts as a best practice for supporting transparency and accountability.
I am pleased to present the Public Accounts for the year 2015–16, which confirm that our government’s plan to achieve fiscal balance by 2017–18 is working.
At $5.0 billion, Ontario’s deficit is $3.5 billion lower than projected in the 2015 Budget. This marks the seventh year in a row that Ontario has beaten its deficit target.
When the global economic recession hit, our government made a deliberate choice to invest in our economy and stimulate growth. Since then, Ontario has created almost 600,000 net new jobs and the unemployment rate declined to an eight-year low of 6.4 per cent in July 2016. Ontario’s economy continues to grow and is expected to remain one of the fastest growing in Canada over the next two years.
Although we have made considerable progress since the recession, there is still hard work ahead to eliminate the deficit. Our government will make the tough but necessary decisions needed to ensure our province continues to grow. As President of the Treasury Board, it is my role to lead this effort and to help create a modern and open government — one that is fiscally responsible, uses evidence to track performance and is focused on results.
In the spirit of openness and increased transparency, this year we have created new visualization tools to help Ontarians understand the Province’s finances. To access these new tools, and to see the full Public Accounts online, visit Ontario.ca/publicaccounts.
Making every dollar count
In 2014, we implemented a new fiscal planning and expenditure management approach. Through the Program Review, Renewal, and Transformation (PRRT) process, we are looking across ministries to achieve better value for money.
We have deliberately taken a fair and equitable approach, allowing us to continue to make strategic investments in physical infrastructure such as roads and transit, as well as in social capital through the talents and skills of Ontarians, all while protecting the services on which Ontarians rely.
By prioritizing cross-ministry collaboration in our planning and policy development, we are undertaking major transformation and efficiency initiatives that will help free up resources and allow us to invest in key priorities. This means asking tough questions and making tough choices about services that are not linked to government priorities, serve no clear public interest or fail to achieve their desired outcomes.
| | | | |
| Financial Statement Discussion and Analysis, 2015–2016 | | | iii | |
For example, transfer payments to organizations including consolidated broader public sector organizations account for approximately 82 per cent of the government’s expenditures. The Transfer Payment Administration Modernization (TPAM) project will streamline government transfers to hospitals, school boards, municipalities, non-profits and all other transfer payment recipients. It will not only improve the way we work with these organizations, but will also make their jobs easier by reducing their administrative burdens. TPAM will also help us get better value for our money by emphasizing data and evidence when making funding decisions.
Making services simpler, faster and easier
Through Ontario’s Digital Government strategy, we are modernizing government for the digital age, using technology to make services simpler, easier and more convenient for people. This work will improve citizens’ online experience with government and deliver better value for public money.
We are also finding innovative ways to support how we drive change across the government. In 2015, we established the Centre of Excellence for Evidence-Based Decision Making. The centre is setting standards for the use of evidence. Its mandate is to build capacity to assess program performance, using evidence to inform choices and lead change in critical public services.
Modern infrastructure and a dynamic business climate
Ontario must build and maintain its infrastructure to remain economically strong and competitive.
The Province is continuing to pursue opportunities to unlock economic value from its assets. Unlocking value from provincial assets is providing resources to invest in new transit and transportation infrastructure, and is helping to expand the economy and improve competitiveness and productivity. In short, it will help to create jobs for Ontarians.
We’re investing more than $137 billion over the next 10 years in public infrastructure such as roads, bridges, public transit, hospitals and schools. This investment builds on previous commitments, resulting in a total of approximately $160 billion in public infrastructure investments over 12 years, starting in 2014–15. This is the largest investment in public infrastructure in the Province’s history. Planned investments will support more than 110,000 jobs, on average, each year.
The government is building the infrastructure that is needed today and tomorrow. These investments will help manage congestion, connect people, and improve the economy and Ontarians’ quality of life.
In addition, our government continues to create a dynamic and innovative business climate. As of August 31, 2016, the 10-year, $2.7 billion Jobs and Prosperity Fund is helping to create and retain more than 22,000 jobs and is attracting more than $2.2 billion in investments. Our government is reducing business costs, keeping tax rates competitive, building strategic partnerships, helping businesses go global, strengthening the financial services sector and investing in training and education.
| | |
| iv | | Financial Statement Discussion and Analysis, 2015–2016 |
We have an ambitious agenda to Build Ontario Up. Our balanced budget plan is vitally important, and Public Accounts is the tool by which we report our progress. Working to eliminate the deficit and taking a balanced and disciplined approach to our fiscal plan over the last three and a half years has allowed us to deliver better services and outcomes to Ontarians, and help people in their everyday lives. We are striving to build a province that is the best place to live, from childhood to retirement — a place where everyone has the opportunity to realize their full potential.
Original signed by
The Honourable Liz Sandals
President of the Treasury Board
| | | | |
| Financial Statement Discussion and Analysis, 2015–2016 | | | v | |
| | |
| vi | | Financial Statement Discussion and Analysis, 2015–2016 |
Introduction
The Annual Report is a key element of the Public Accounts of the Province of Ontario and is central to demonstrating the Province’s transparency in reporting its financial activities and position as well as its accountability for financial resources.
This Annual Report presents Ontario’s financial results and position for the year ending March 31, 2016, against the approved 2015 Budget. Specifically, it compares the Province’s actual financial results for the 2015–16 fiscal year to the Budget plan presented in April 2015 and explains major variances.
This year, in addition to providing a comparison of actual to planned results, the Annual Report has been enhanced in several areas to further support transparency and accountability for readers:
| | • | | It expands the comparison of the current year’s results to those of the prior year, and includes analysis of the trends over a five-year period as related to several financial items, including an expanded discussion on balance sheet items. |
| | • | | It provides a description of the Province’s capital assets, reflecting their importance in service delivery and their impact on the Province’s financial condition. |
| | • | | It includes a discussion of key risks that could impact the Province’s financial results. |
As in previous years, the Annual Report sets out and analyzes trends in a number of key financial ratios over the past several years.
The additional discussion and analysis included in this year’s Annual Report will help users of the Consolidated Financial Statements better understand the impacts of economic conditions and government decisions on the Province’s financial results and position.
Producing the Public Accounts of Ontario requires the teamwork and collaboration of many stakeholders across Ontario’s public sector. The Office of the Auditor General plays a critical role in auditing and reporting on the Province’s financial statements, and the Standing Committee on the Public Accounts also plays an important role in providing legislative oversight and guidance. I would like to thank everyone for their contributions.
We welcome your comments on the Public Accounts. Please share your thoughts by email at infoTBS@ontario.ca, or by writing to the Office of the Provincial Controller, Re: Annual Report, Treasury Board Secretariat, Second Floor, Frost Building South, 7 Queen’s Park Crescent, Toronto, Ontario M7A 1Y7.
Original signed by
Nadine Petsche, MBA, CPA, CA
Director, Accounting Policy and Financial Reporting
Treasury Board Secretariat
| | | | |
| Financial Statement Discussion and Analysis, 2015–2016 | | | 1 | |
Guide to the Public Accounts
The Public Accounts of the Province of Ontario comprise this Annual Report and three supporting volumes.
The Annual Report includes a Financial Statement Discussion and Analysis, the Consolidated Financial Statements of the Province and other supporting schedules and disclosures.
Financial Statement Discussion and Analysis
The first section of the Annual Report is the Financial Statement Discussion and Analysis section, which:
| | • | | Compares the Province’s financial results to both the approved Budget for the year and results for the previous year; |
| | • | | Shows trends in key financial items and indicators of financial condition; |
| | • | | Sets out key potential risks to financial results and explains how the government manages them; |
| | • | | Includes descriptions of various assets and liabilities on the statement of financial position; and |
| | • | | Presents non-financial activities results and discusses important initiatives related to enhancing transparency and accountability. |
The Consolidated Financial Statements
The Consolidated Financial Statements show the Province’s financial position at the end of the previous fiscal year, its financial activities during the reporting period and its financial position at the end of the fiscal year. The statements are linked, and figures that appear in one statement may affect another.
The Province’s financial statements are presented on a consolidated basis, meaning that the Province’s statement of financial position and statement of operations reflect the combination of ministry results as well as financial results for entities that are controlled by the government. Therefore, reported revenues and expenses of the Province can be affected directly by the activities of ministries as well as the performance of controlled entities such as government business enterprises (GBEs) and broader public sector (BPS) organizations such as hospitals, school boards and colleges. In addition, the Province’s results are also affected by transfer payments made to non-consolidated entities, such as municipalities and universities.
| | |
| 2 | | Financial Statement Discussion and Analysis, 2015–2016 |
The financial statements comprise:
| | • | | The Consolidated Statement of Operations, which provides a summary of the government’s revenue for the period less its expenses, and shows whether the government incurred an operating deficit or surplus for the year, in comparison to its approved Budget plan as presented on April 23, 2015, as well as the financial results for the prior fiscal period. The annual surplus/deficit has an impact on the Province’s financial position. |
| | • | | The Consolidated Statement of Financial Position, which reports the Province’s assets and liabilities and is also known as the balance sheet. The Province’s total liabilities include debt and other long-term financing. Financial assets include cash, short-term investments and investment in GBEs. The difference between total liabilities and financial assets is the Province’s net debt, which provides a measure of the future government revenues that will be required to pay for the government’s past transactions. Non-financial assets, mainly tangible capital assets such as highways, bridges and buildings, are subtracted from net debt to arrive at the accumulated deficit. An operating deficit in the year increases the accumulated deficit. |
| | • | | The Consolidated Statement of Change in Net Debt, which shows how the Province’s net debt position changed during the year. The main factors increasing net debt are the annual deficit and additions to tangible capital assets, which increase liabilities. |
| | • | | The Consolidated Statement of Change in Accumulated Deficit, which is a cumulative total of all the Province’s annual deficits and surpluses to date. It is mainly impacted by the annual surplus or deficit in a year. |
| | • | | The Consolidated Statement of Cash Flow, which shows the sources and uses of cash and cash equivalents over the year. Two major sources of cash are revenues and borrowings. Uses of cash include funding for operating costs, investments in capital assets and debt repayment. The statement is presented in what is referred to as the indirect method, meaning that it starts with the annual surplus or deficit and reconciles that to the cash flow from operations by adding or subtracting non-cash items, such as amortization of tangible capital assets. As well, it also shows cash used to acquire tangible capital assets and investments, as well as cash generated from financing activities. |
When reading the Consolidated Financial Statements, it is essential to also read the accompanying notes and schedules, which summarize the Province’s significant accounting policies and give more information on underlying financial activities, market value of investments, contractual obligations and risks. Commentary is also provided on possible future changes to accounting standards.
| | | | |
| Financial Statement Discussion and Analysis, 2015–2016 | | | 3 | |
Other elements of the Annual Report
| | • | | In management’s Statement of Responsibility, the government acknowledges its responsibility for the Consolidated Financial Statements and the Financial Statement Discussion and Analysis. The Statement, which appears on page 5, outlines the accounting policies and practices used in preparing the financial statements and acknowledges the government’s responsibility for financial management systems and controls. |
| | • | | For the 2015–16 Public Accounts, the government legislated the accounting treatment for pension assets of its jointly sponsored pension plans. Note 18 to the Consolidated Financial Statements includes additional information about this change. |
| | • | | The Auditor General’s Report, which appears on page 45, expresses an opinion under the Auditor General Act as to whether the statements present fairly the annual financial results and financial position of the government in accordance with Canadian Public Sector Accounting Standards. |
Supporting volumes
Volume 1 contains ministry statements and detailed schedules of debt and other items. Individual ministry statements compare actual expenses to the amounts appropriated by the Legislative Assembly. Appropriations are made through the Estimates, Supplementary Estimates and annual Supply Act (as modified by any Treasury Board Orders), other statutes and any special warrants. The ministry statements include amounts appropriated to fund certain provincial organizations, including hospitals, school boards and colleges. The financial results of all provincial organizations included in the government reporting entity in accordance with Public Sector Accounting Standards are consolidated with those of the Province to produce the Consolidated Financial Statements in accordance with the accounting policies described in Note 1 to the statements.
Volume 2 contains the individual financial statements of significant provincial corporations, boards and commissions that are part of the government’s reporting entity, as well as other miscellaneous financial statements.
Volume 3 contains the details of payments made by ministries to vendors (including sales tax) and transfer payment recipients that exceed certain thresholds, including payments to suppliers of temporary help services; payments made directly to a supplier by the ministry for employee benefits; travel payments for employees; total payments for grants, subsidies or assistance to persons, businesses, non-commercial institutions and other government bodies; other payments to suppliers of goods and services; and statutory payments.
| | |
| 4 | | Financial Statement Discussion and Analysis, 2015–2016 |
Statement of Responsibility
The Consolidated Financial Statements are prepared by the Government of Ontario in accordance with legislation and the accounting principles for governments recommended by the Public Sector Accounting Board (PSAB) of the Chartered Professional Accountants of Canada (CPA Canada).
The government accepts responsibility for the objectivity and integrity of these Consolidated Financial Statements and the Financial Statement Discussion and Analysis.
The government is also responsible for maintaining systems of financial management and internal control to provide reasonable assurance that transactions recorded in the Consolidated Financial Statements are within statutory authority, assets are properly safeguarded and reliable financial information is available for preparation of these Consolidated Financial Statements.
The Consolidated Financial Statements have been audited by the Auditor General of Ontario in accordance with the Auditor General Act and Canadian Auditing Standards. Her report appears on page 45 of this document.
| | | | |
Original signed by | | Original signed by | | Original signed by |
| Scott Thompson | | Greg Orencsak | | Nadine Petsche |
| Deputy Minister | | Deputy Minister, Treasury | | Director, Accounting |
| Ministry of Finance | | Board Secretariat and | | Policy and Financial |
| | Secretary of Treasury | | Reporting |
| | Board and Management | | Treasury Board |
| | Board of Cabinet | | Secretariat |
| | |
| October 5, 2016 | | October 5, 2016 | | October 5, 2016 |
| | | | |
| Financial Statement Discussion and Analysis, 2015–2016 | | | 5 | |
| | |
| 6 | | Financial Statement Discussion and Analysis, 2015–2016 |
FINANCIAL STATEMENT DISCUSSION AND ANALYSIS
| | | | |
| Financial Statement Discussion and Analysis, 2015–2016 | | | 7 | |
| | |
| 8 | | Financial Statement Discussion and Analysis, 2015–2016 |
Highlights
| | |
| 2015–16 Financial Highlights | | Table 1 |
| ($ Billions) | | |
Consolidated Statement of Operations
For the fiscal year ended March 31
| | | | | | | | | | | | | | | | | | | | |
| | | | | | | | | | | | Change from | |
| | | 2015 | | | 2015–16 | | | 2014–15 | | | 2015 | | | 2014–15 | |
| | | Budget | | | Actual | | | Actual | | | Budget | | | Actual | |
Total Revenue | | | 124.4 | | | | 128.4 | | | | 118.5 | | | | 4.0 | | | | 9.8 | |
Expense | | | | | | | | | | | | | | | | | | | | |
Programs | | | 120.5 | | | | 122.4 | | | | 118.2 | | | | 1.9 | | | | 4.2 | |
Interest on debt | | | 11.4 | | | | 11.0 | | | | 10.6 | | | | (0.4 | ) | | | 0.4 | |
| | | | | | | | | | | | | | | | | | | | |
Total Expense | | | 131.9 | | | | 133.4 | | | | 128.8 | | | | 1.5 | | | | 4.6 | |
Reserve | | | 1.0 | | | | — | | | | — | | | | (1.0 | ) | | | — | |
| | | | | | | | | | | | | | | | | | | | |
Annual Deficit | | | (8.5 | ) | | | (5.0 | ) | | | (10.3 | ) | | | (3.5 | ) | | | (5.3 | ) |
| | | | | | | | | | | | | | | | | | | | |
Consolidated Statement of Financial Position | | | | | | | | | | | | | | | | | | | | |
As at March 31 | | | | | | | | | | | | | | | | | | | | |
Financial Assets | | | | | | | 83.5 | | | | 82.5 | | | | | | | | 1.0 | |
Liabilities | | | | | | | 388.7 | | | | 367.1 | | | | | | | | 21.6 | |
| | | | | | | | | | | | | | | | | | | | |
Net Debt | | | | | | | (305.2 | ) | | | (284.6 | ) | | | | | | | 20.6 | |
Non-Financial Assets | | | | | | | 102.5 | | | | 97.1 | | | | | | | | 5.4 | |
| | | | | | | | | | | | | | | | | | | | |
Accumulated Deficit | | | | | | | (202.7 | ) | | | (187.5 | ) | | | | | | | 15.2 | |
| | | | | | | | | | | | | | | | | | | | |
Note: Numbers may not add due to rounding. | | | | | | | | | | | | | | | | | | | | |
Comparison to the 2015 Budget plan
The Province of Ontario recorded a deficit of $5.0 billion for the 2015–16 fiscal year, an improvement of $3.5 billion from the $8.5 billion projected in the 2015 Budget plan (see Table 1).
The improvement over plan was due to revenues that were $4.0 billion above forecast, at $128.4 billion. This was largely due to higher-than-expected taxation revenues and net revenues from the first phase of broadening Hydro One ownership.
Despite the challenges stemming from an uncertain global economic setting, Ontario’s economy grew, with real gross domestic product (GDP) increasing by 2.6 per cent in 2015, slightly below the forecast of 2.7 per cent in the 2015 Budget.
Total spending for 2015–16 came in at $133.4 billion, which was $1.5 billion higher than forecast in the 2015 Budget plan. This increase from plan was due mainly to the change in the Province’s accounting treatment for pension assets of jointly sponsored pension plans.
| | | | |
| Financial Statement Discussion and Analysis, 2015–2016 | | | 9 | |
The government identified and acted on a number of initiatives in the 2015 Budget to modernize public services, improve outcomes for Ontarians and support the Province’s fiscal objectives. Savings from these and other initiatives identified through Program Review, Renewal and Transformation (PRRT) are reflected in all of the program expense lines in the 2015–16 results.
Comparison to the 2014–15 fiscal year
Provincial revenues were up $9.8 billion, or 8.3 per cent, from the previous year (see Table 1). This increase was due in part to nominal GDP growth of 3.5 per cent, which contributed to higher taxation revenues. Higher transfers from the federal government, particularly Canada Health Transfer, Canada Social Transfer and Equalization payments, also increased revenues.
Also contributing to year-over-year revenue growth was the completion of the first phase of Hydro One share sales in 2015–16 through an initial public offering (IPO). This transaction and its fiscal impacts are discussed in more detail in “Broadening Hydro One ownership” on page 14.
Year-over-year, total spending rose by $4.6 billion, or 3.5 per cent, going from $128.8 billion to $133.4 billion. Increases in the health care, children’s and social services, and justice sectors, as well as other program areas, accounted for most of the increase. Interest on debt rose by 3.1 per cent, from $10.6 billion to $11.0 billion, reflecting financing costs for the Province’s debt. In addition, the change in the Province’s accounting treatment for pension assets accounted for $1.5 billion of the year-over-year variance.
As a result of stronger relative growth in revenue than in spending, the annual deficit fell from $10.3 billion in 2014–15 to $5.0 billion in 2015–16, reflecting an improvement of 51.2 per cent.
For the 2015-16 Public Accounts, the Province’s opening pension asset balance was adjusted to reflect a legislated change in accounting treatment for pension assets of jointly sponsored pension plans1. As a result, net debt — the difference between the Province’s liabilities and financial assets — grew by $20.6 billion during the year. Excluding the $10.7 billion impact of this change in accounting treatment for pension assets related to jointly sponsored pension plans, total liabilities increased by $10.9 billion which was partially offset by a $1.0 billion increase in financial assets.
The net book value of capital assets such as roads and bridges owned by the Province grew by $5.4 billion during the year, reflecting new capital investments. The accumulated deficit rose by $6.1 billion, mainly as a result of the annual deficit of $5.0 billion and other adjustments.
| 1 | See Note 18 to the Consolidate Financial Statement. |
| | |
| 10 | | Financial Statement Discussion and Analysis, 2015–2016 |
Cash flow during the year was used to fund the annual deficit of $5.0 billion, provide $10.9 billion for investment in capital assets, repay maturing debt of $21.9 billion and cover other cash items. These needs were partially covered with funds borrowed before the end of 2014–15, including pre-borrowing for 2015–16, for a total of $12.4 billion in new financing.
| | | | |
| Financial Statement Discussion and Analysis, 2015–2016 | | | 11 | |
Analysis of 2015–16 Results
| | |
| Details of 2015–16 Actual Results1 | | Table 2 |
| ($ Billions) | | |
| | | | | | | | | | | | | | | | | | | | |
| | | | | | | | | | | | Change from | |
| | | 2015 | | | 2015–16 | | | 2014–15 | | | 2015 | | | 2014–15 | |
| | | Budget | | | Actual | | | Actual | | | Budget | | | Actual | |
Revenue | | | | | | | | | | | | | | | | | | | | |
Taxation | | | 87.4 | | | | 91.8 | | | | 82.3 | | | | 4.4 | | | | 9.5 | |
Government of Canada | | | 22.9 | | | | 22.9 | | | | 21.6 | | | | — | | | | 1.2 | |
Income from government business enterprises | | | 4.8 | | | | 4.9 | | | | 5.6 | | | | 0.1 | | | | (0.7 | ) |
Other non-tax revenue | | | 9.3 | | | | 8.8 | | | | 9.0 | | | | (0.5 | ) | | | (0.2 | ) |
| | | | | | | | | | | | | | | | | | | | |
Total Revenue | | | 124.4 | | | | 128.4 | | | | 118.5 | | | | 4.0 | | | | 9.8 | |
| | | | | | | | | | | | | | | | | | | | |
Expense | | | | | | | | | | | | | | | | | | | | |
Health sector | | | 50.8 | | | | 51.1 | | | | 50.0 | | | | 0.3 | | | | 1.1 | |
Education sector2 | | | 25.2 | | | | 25.0 | | | | 24.6 | | | | (0.2 | ) | | | 0.4 | |
Post-secondary and training sector | | | 7.8 | | | | 7.6 | | | | 7.7 | | | | (0.2 | ) | | | (0.1 | ) |
Children’s and social services sector | | | 15.4 | | | | 15.6 | | | | 14.7 | | | | 0.1 | | | | 0.9 | |
Justice | | | 4.4 | | | | 4.5 | | | | 4.3 | | | | 0.1 | | | | 0.2 | |
Other programs3 | | | 16.8 | | | | 18.6 | | | | 16.9 | | | | 1.8 | | | | 1.7 | |
| | | | | | | | | | | | | | | | | | | | |
Total Program Expense | | | 120.5 | | | | 122.4 | | | | 118.2 | | | | 1.9 | | | | 4.2 | |
Interest on debt | | | 11.4 | | | | 11.0 | | | | 10.6 | | | | (0.4 | ) | | | 0.4 | |
| | | | | | | | | | | | | | | | | | | | |
Total Expense | | | 131.9 | | | | 133.4 | | | | 128.8 | | | | 1.5 | | | | 4.6 | |
| | | | | | | | | | | | | | | | | | | | |
Reserve | | | 1.0 | | | | — | | | | — | | | | (1.0 | ) | | | — | |
| | | | | | | | | | | | | | | | | | | | |
Annual Deficit | | | (8.5 | ) | | | (5.0 | ) | | | (10.3 | ) | | | (3.5 | ) | | | (5.3 | ) |
| | | | | | | | | | | | | | | | | | | | |
Notes:
| 1 | Numbers may not add due to rounding. |
| 2 | Teachers’ Pension Plan expense is included in Other programs. In the Consolidated Financial Statements, this expense item appears under the Ministry of Education. Schedule 4 to the financial statements provides details. |
| 3 | The 2015 Budget included a Program Review Savings Target of $490 million and Year End Savings of $1.0 billion. |
Revenue
Comparison to the 2015 Budget plan
In the 2015 calendar year, Ontario’s real GDP grew by a solid 2.6 per cent, driven by a boost from exports, business investments and sustained growth in household spending. Growth was very close to the 2.7 per cent forecast in the 2015 Budget.
The robust growth was supported by solid economic expansion in the United States and favourable shifts in key external factors, including reduced oil prices, a more competitive Canadian dollar and low interest rates.
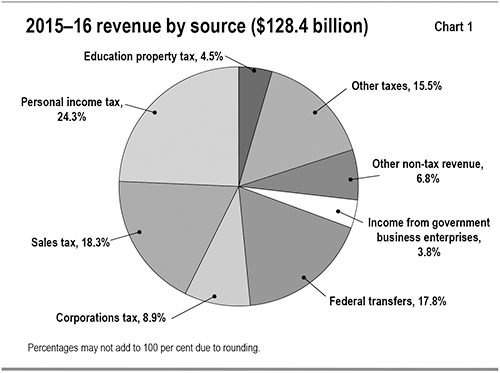
Revenues for 2015–16 came in at $128.4 billion, or 3.2 per cent higher than forecast in the 2015 Budget. See Chart 1 for a breakdown of revenues by source.
| | |
| 12 | | Financial Statement Discussion and Analysis, 2015–2016 |
Excluding the impacts of the sale of Hydro One shares, as discussed on page 14:
| | • | | Taxation revenues were $1.7 billion, or 2.0 per cent higher than projected in the 2015 Budget. Personal income tax revenues were $0.8 billion higher, reflecting stronger-than-projected 2015 tax assessments. The strong housing market in 2015 contributed to a $0.8 billion increase in combined sales tax and land transfer tax revenues. |
| | • | | Income from GBEs was $0.6 billion higher, reflecting higher-than-projected returns from Ontario Power Generation Inc., the Ontario Lottery and Gaming Corporation and the Liquor Control Board of Ontario. |
| | • | | Other non-tax revenues were $0.3 billion higher on a net basis, mainly reflecting higher recoveries of prior year expenditures and higher fiscally neutral Power Supply Contract Recoveries. |
Another factor was an increase from plan of $1.5 billion in net revenues arising from the completion of the first phase of broadening Hydro One ownership.
Transfers from the Government of Canada were close to the 2015 Budget estimate.
| | | | |
| Financial Statement Discussion and Analysis, 2015–2016 | | | 13 | |
Comparison to prior year and earlier years
Total revenues were up $9.8 billion, or 8.3 per cent, from the previous year.
Excluding the impacts of the sale of Hydro One shares, as discussed below:
| | • | | Taxation revenues grew by $6.8 billion, or 8.3 per cent, reflecting economic growth, including a strong 2015 housing market. Prior year adjustments that lowered 2014–15 corporations tax revenues and boosted 2015–16 Harmonized Sales Tax (HST) revenues also contributed to stronger year-over-year growth. |
| | • | | Net income from GBEs declined in 2015–16 by $0.2 billion, mainly due to lower net income from Ontario Power Generation after a one-time gain from 2014–15. This was partially offset by higher net income growth from the Ontario Lottery and Gaming Corporation and the Liquor Control Board of Ontario. |
Higher net revenues from asset optimization arising from the first phase of broadening Hydro One ownership accounted for $2.0 billion of the increase in Provincial revenues.
Higher transfers under the Canada Health Transfer, Canada Social Transfer and Equalization programs accounted for most of the $1.2 billion year-over-year increase in Government of Canada transfers.
Broadening Hydro One ownership
In November 2015, the Province completed the first phase of its plan to broaden Hydro One ownership. It sold approximately 16 per cent of the Province’s outstanding Hydro One common shares at a price of $20.50 per share through an IPO and through related share sales to electricity sector union trusts. As a result, as at March 31, 2016, the Province owned about 84 per cent of the outstanding common shares in Hydro One.
The Province reported a gain of $0.8 billion from the sale of Hydro One shares as well as a deferred gain of $48 million in connection with sales to electricity sector union trusts.
The Hydro One IPO had additional impacts. Prior to the IPO, Hydro One was exempt from taxation under the federal Income Tax Act and the provincial Taxation Act, 2007, and instead made payments in lieu of corporate taxes (corporate PILs) to the Province.
Hydro One’s tax-exempt status ended as a result of the IPO, and it exited the corporate PILs regime to become subject to federal and provincial taxes. Immediately before that occurred, the entity was deemed to have disposed of its assets for proceeds equal to the assets’ fair market value.
| | |
| 14 | | Financial Statement Discussion and Analysis, 2015–2016 |
As a result of this deemed disposition, before exiting the corporate PILs regime Hydro One had to make a payment to the Province through the Ontario Electricity Financial Corporation under the Electricity Act, 1998, related to the income and capital gains arising from the difference between the assets’ fair value and tax value. This one-time payment to the Province, referred to as the departure tax, was $2.6 billion. Hydro One also paid the Province $0.2 billion in additional corporate PILs in connection with leaving the corporate PILs regime.
These one-time payments did not affect the Province’s annual deficit, as the additional revenue was offset by an equal reduction in Hydro One’s net income, which is consolidated in the Province’s financial statements. The Province continues to consolidate Hydro One according to its proportionate share ownership.
Hydro One is now subject to corporate income taxes. The transition into the corporate income tax regime also resulted in Hydro One recognizing a deferred tax recovery based on the fair market value of its assets that increased the Province’s reported revenues by $2.4 billion. The deferred tax asset reflects the fact that cash taxes payable by Hydro One, including those payable to the Province, will be reduced for some period into the future.
Under the Trillium Trust Act, 2014, net revenue gains from the disposition of Hydro One shares are allocated to the Trillium Trust. See “Transparency and Accountability” on page 40, and Volume 1 of the Public Accounts for more details.
Revenue trend
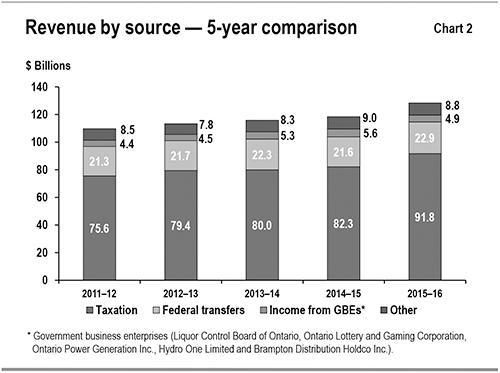
Chart 2 shows the recent trends in revenue for the Province’s major revenue sources.
| | | | |
| Financial Statement Discussion and Analysis, 2015–2016 | | | 15 | |
Taxation revenue
Between 2011–12 and 2015–16, taxation revenue grew at an annual average rate of 5.0 per cent, higher than the average annual nominal GDP growth of 3.2 per cent over the same period.
Although economic growth and increases in taxation revenue are clearly linked, the relationship is affected by several factors. Growth in some revenue sources, such as corporations tax and mining tax, can diverge significantly from economic growth in any given year, due to the inherent volatility of business profits as well as the use of tax provisions such as the option to carry losses forward or backward. The impact of housing completions and re-sales on HST and Land Transfer Tax revenue is proportionately greater than their contribution to GDP. As well, changes in such sources as volume-based gasoline and fuel taxes are more closely aligned to growth in real as opposed to nominal GDP, as these revenue sources are less influenced by price changes.
Much of the rising trend in taxation revenues between 2011–12 and 2015–16 reflects a growing economy and the impact of tax measures, as well as measures aimed at tax fairness and addressing the underground economy.
Other taxation revenues increased significantly in 2015–16 compared to the prior year. The increase largely reflects one-time payments in lieu of taxes from Hydro One associated with the Hydro One IPO. This transition resulted in a one-time $2.6 billion departure tax payment, in addition to $0.2 billion in one-time payments in lieu of taxes from Hydro One to the Province. These one-time payments were revenue neutral to the Province, as they also reduced the Province’s revenues from Hydro One’s net income by an equal amount. The Province’s relative share of Hydro One’s net income is reported in the Consolidated Financial Statements as income from GBEs.
Federal government transfers
Government of Canada transfers are based on existing federal–provincial funding arrangements and formulas. These include major federal transfer programs such as the Canada Health Transfer, Canada Social Transfer and Equalization programs, as well as transfers for social housing, infrastructure and labour market programs. There are also a number of smaller federal transfers to the Province, which are largely program-specific. Some transfers are ongoing, while others are time-limited.
Between 2011–12 and 2015–16, Government of Canada transfers grew at an annual average rate of 1.8 per cent. Higher entitlements under the Canada Health Transfer, Canada Social Transfer and Equalization payments were partially offset by several time-limited transfers that wound down over that time period.
| | |
| 16 | | Financial Statement Discussion and Analysis, 2015–2016 |
Income from government business enterprises
Revenues for the Province include the net income of five GBEs: the Ontario Lottery and Gaming Corporation, the Liquor Control Board of Ontario, Ontario Power Generation Inc., Hydro One Limited and Brampton Distribution Holdco Inc. (Before August 31, 2015, Hydro One Brampton Networks Inc., a subsidiary of Brampton Distribution Holdco Inc., was a subsidiary of Hydro One and its results were included in those of Hydro One on the Province’s financial reports.)
After growing between 2011–12 and 2014–15, net income from GBEs declined in 2015–16. This was mainly due to the impact on Hydro One’s net income from the one-time, final payments in lieu of taxes to the Province triggered by the Hydro One IPO.
Other non-tax revenues
Other non-tax revenues arise from a number of sources, including vehicle and driver registration fees; sales and rentals of goods and services; other fees, licences and permits; reimbursements of provincial expenditures in delivering certain services; royalties for the use of Crown resources; and such revenue sources from the electricity sector as the Debt Retirement Charge, Power Supply Contract Recoveries and Net Reduction of Power Purchase Contract Liability.
Other non-tax revenues grew moderately, at an annual average rate of 1.0 per cent, between 2011–12 and 2015–16. Two major factors were responsible for most of the growth in revenues:
| | • | | Increases in licensing and vehicle validation fees to maintain and expand provincial roads and highways; and |
| | • | | The Province’s asset-optimization strategy, particularly the gain on the sale and redemption of General Motors shares in 2013–14 and 2014–15 and the gain on the sale of Hydro One common shares in 2015–16. |
These gains were partially offset by lower non-tax revenues from the electricity sector.
Expense
Comparison to the 2015 Budget plan
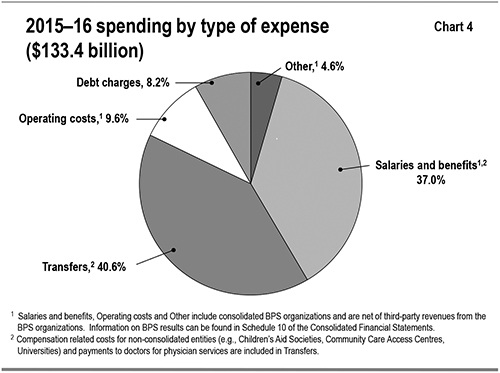
Total expense in 2015–16 was $133.4 billion, which was higher than forecast in the 2015 Budget plan. Program spending was $122.4 billion, up $1.9 billion from a planned spending of $120.5 billion. Spending in the health, children’s and social services, and justice sectors, as well as in other programs, was higher than planned (see Table 2). See Chart 3 for a breakdown of program expense by sector.
| | | | |
| Financial Statement Discussion and Analysis, 2015–2016 | | | 17 | |
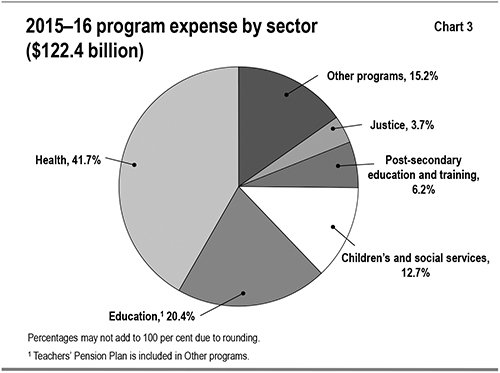
Total program spending was $1.9 billion higher than the Budget plan, resulting in actual program expense of $122.4 billion. The increases were attributable to:
| | • | | Health sector expense that was $294 million, or about 0.6 per cent, above plan. Higher spending resulted from increased drug costs as well as higher hospital sector expense, which was partially offset by underspending in agencies. |
| | • | | Children’s and social services sector expense that was $124 million higher than planned, due mainly to additional spending to address demand for the Ontario Disability Support Program, and the cost of prescription drugs for social assistance recipients. |
| | • | | Justice sector expense increases of $120 million, mainly due to settlements under the Proceedings Against the Crown Act and higher-than-expected bad debt provisions related to unpaid fines. |
| | • | | Other programs expense was $1.8 billion higher than expected, mainly due to a change in the accounting treatment for pension assets of jointly sponsored pension plans, higher-than-anticipated expense for the Ontario Production Services Tax Credit and costs related to the Hydro One IPO. |
Increases in these sectors and programs were partially offset by:
| | • | | Education sector expense that was $233 million lower than expected, due in part to a higher share of funding spent on capital projects that are capitalized and amortized instead of expensed, higher-than-forecasted revenues from education development charges and slightly lower-than-projected enrolment. |
| | |
| 18 | | Financial Statement Discussion and Analysis, 2015–2016 |
| | • | | Post-secondary and training sector expense that was $176 million lower than expected, mainly due to lower spending on post-secondary operating grants and lower student financial assistance as a result of lower-than-forecast enrolment. As well, spending on employment and training programs was below plan, partially offset by higher expense on tax credits to employers to support training. |
As noted in the footnote to Table 2, the 2015 Budget included two savings targets that together totalled $1.49 billion as part of other programs expense. Ministries achieved $1.1 billion in savings against these targets which were reallocated to the ministries that achieved savings — notably in both the education and post-secondary and training sectors, as highlighted above. Program expense was $1.9 billion higher than planned as a result of $0.4 billion higher ministry spending and the impact of the change in accounting treatment for pension assets in jointly sponsored pension plans, which increased other program expense by $1.5 billion for the year.
Chart 4 shows spending by type of expense instead of spending by sector. A significant share of government spending goes directly to salaries and benefits across ministries in the Ontario Public Service and BPS organizations, including hospitals, school boards and colleges that are consolidated in its accounts. Note that the share labelled “Transfers” in Chart 4 includes payments to doctors for physician services, but does not include transfers to consolidated BPS organizations; these are reflected in the other expense types.
| | | | |
| Financial Statement Discussion and Analysis, 2015–2016 | | | 19 | |
The transfers category reflects payments to a variety of third parties, mainly in the public sector, to support the delivery of public services. These third parties include, for example, child care providers, social service agencies and health care professionals. As service providers, a large share of the spending of these third parties typically goes to salaries and benefits.
Comparison to prior year and earlier years
Year-over-year, program spending grew by 3.6 per cent in 2015–16.
Health care represents the largest share of government program spending. Transformation efforts to make the sector more effective and sustainable are vital to managing overall spending growth and to achieving better outcomes for patients in a better integrated system. These continuing efforts moderated the year-over-year growth in health sector spending to 2.1 per cent in 2015–16. Prior to this transformation, the sector had been experiencing an average annual growth rate of over 6.0 per cent.
Chart 5 shows the recent trends in spending for major program areas.
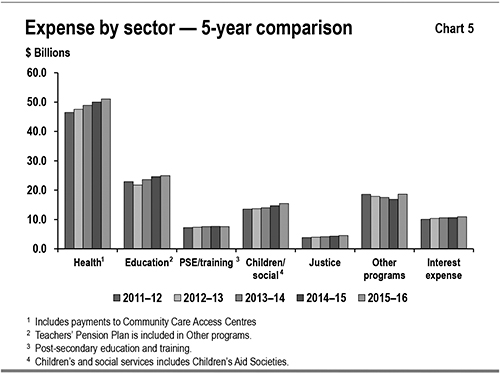
| | • | | Health sector expense increased from $46.5 billion in 2011–12 to $51.1 billion in 2015–16, or on average by 2.4 per cent per year between 2011–12 and 2015–16. These increases are due in part to increasing demands for health care services from an aging and growing population, along with other factors. Increases also include new investments in home and community care as well as specialized services such as cancer care. Expense increases in the health sector have been moderated by ongoing transformation of the sector to focus on patients while reducing costs such as the prices of generic prescription drugs. |
| | |
| 20 | | Financial Statement Discussion and Analysis, 2015–2016 |
| | • | | Education sector expense increased from $22.9 billion in 2011–12 to $25.0 billion in 2015–16, or on average by 2.2 per cent per year between 2011–12 and 2015–16. The increase is mainly due to the introduction of full-day kindergarten, which has been made available to every four- and five-year-old in Ontario since September 2014. Expense was lower in 2012–13 due to the impact of $1.3 billion in one-time savings from reducing liabilities carried by school boards for sick-day banking and retirement gratuities. |
| | • | | Post-secondary education and training sector expense increased from $7.3 billion in 2011–12 to $7.6 billion in 2015–16, or on average by 1.3 per cent per year between 2011–12 and 2015–16. The increase is mainly due to continued funding to support enrolment growth in post-secondary institutions, growth in student financial assistance programs and support for employment and training programs. |
| | • | | Children’s and social services sector expense increased from $13.5 billion in 2011–12 to $15.6 billion in 2015–16, or on average by 3.5 per cent per year between 2011–12 and 2015–16. This increase reflects annual social assistance rate increases, caseload growth in the Ontario Disability Support Program and investments in developmental services and the Ontario Child Benefit. |
| | • | | Justice sector expense increased from $3.9 billion in 2011–12 to $4.5 billion in 2015–16, or on average by 4.1 per cent per year between 2011–12 and 2015–16. These increases are mainly due to the provincial upload of court security costs from municipalities, costs incurred mainly in 2015–16 for the security services for the 2015 Pan/Parapan American Games and improved access to legal aid for low-income Ontarians. |
| | • | | Other programs expense was $18.6 billion in 2015–16, including a $1.5 billion increase in pension expense. This brought other programs expense back to about where it was in 2011–12. Excluding the increase in pension expense, other programs expense for 2015–16 would have been $17.1 billion, contributing to an average decrease of 2.0 per cent per year between 2011–12 and 2015–16. |
| | | | |
| Financial Statement Discussion and Analysis, 2015–2016 | | | 21 | |
Interest costs
Interest on debt expense was $0.4 billion below plan in 2015–16, as a result mainly of lower-than-forecast interest rates, the lower-than-planned deficit and cost-effective borrowing and debt management.
Interest expense grew from $10.6 billion in 2014–15 to $11.0 billion in 2015–16 (see Table 2).
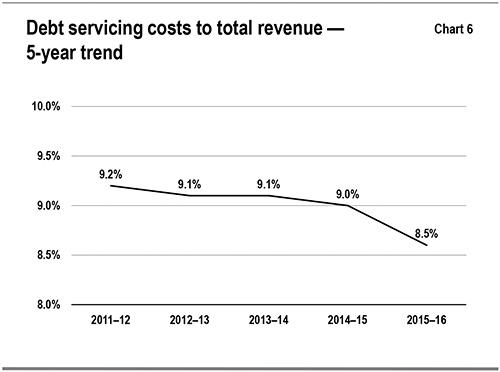
Between 2011–12 and 2015–16, interest expense has trended upward, reflecting higher borrowings required to fund the deficit and investments in infrastructure. Chart 6 shows that although interest costs have grown in absolute terms, they have steadily fallen as a percentage of the Province’s revenues. The interest on debt-to-revenue ratio is now at its lowest level since 1990–91. This is mainly due to historically low interest rates, coupled with cost-effective debt management.
| | |
| 22 | | Financial Statement Discussion and Analysis, 2015–2016 |
Statement of Financial Position analysis
Financial assets
| | | | |
| Financial Assets | | | Table 3 | |
($ Billions) | | | | |
| | | | | | | | | | | | | | | | | | | | |
| | | 2015–16
Actual | | | % of Total | | | 2014–15
Actual | | | % of Total | | | Variance
Increase
(Decrease) | |
Cash and cash equivalents | | | 13.6 | | | | 16.3 | % | | | 15.2 | | | | 18.4 | % | | | (1.6 | ) |
Investments | | | 21.8 | | | | 26.1 | % | | | 20.4 | | | | 24.7 | % | | | 1.4 | |
Accounts receivable | | | 11.1 | | | | 13.3 | % | | | 10.3 | | | | 12.5 | % | | | 0.8 | |
Loans receivable | | | 11.5 | | | | 13.8 | % | | | 11.1 | | | | 13.5 | % | | | 0.4 | |
Other assets | | | 1.9 | | | | 2.3 | % | | | 2.0 | | | | 2.4 | % | | | (0.1 | ) |
Investment in government business enterprises | | | 23.6 | | | | 28.2 | % | | | 23.5 | | | | 28.5 | % | | | 0.1 | |
| | | | | | | | | | | | | | | | | | | | |
Total Financial Assets | | | 83.5 | | | | 100.0 | % | | | 82.5 | | | | 100.0 | % | | | 1.0 | |
| | | | | | | | | | | | | | | | | | | | |
Financial assets consist of items such as cash and cash equivalents, and investments that are available to the Province to meet its expenditure needs; accounts and loans receivable, which are amounts it expects to receive from third parties; and other items, including investment in GBEs.
The Province’s financial assets increased by $1.0 billion in 2015–16 over the prior year to $83.5 billion. This increase was mainly due to a $1.4 billion increase in investments and a $0.8 billion increase in accounts receivable, which was offset by a $1.6 billion decrease in cash and cash equivalents (see Table 3):
| | • | | Investments went up by $1.4 billion, mainly due to the pre-borrowing at year-end for 2016–17 spending requirements. |
| | • | | Accounts receivable, which shows amounts owing to the Province by third parties, increased by $0.8 billion, mainly due to an increase in tax receivable at year-end. |
| | • | | Cash and cash equivalents, which are financial instruments that can be easily converted to cash, decreased by $1.6 billion as a result of operating, investing, capital and financing activities. |
| | | | |
| Financial Statement Discussion and Analysis, 2015–2016 | | | 23 | |
Chart 7 shows the recent trends in financial assets for the Province.
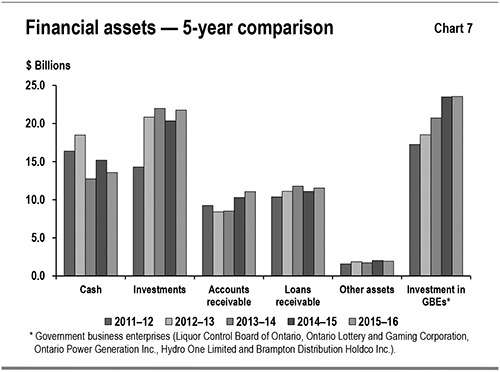
The five-year trend shows a steady gain in investment in GBEs from 2011–12 to 2014–15, reflecting an increase in net assets reported for these entities. The same upward trend did not continue in 2015–16, mainly due to the Province’s decreased ownership interest in Hydro One.
The level of other financial assets, including cash, accounts receivable and investments, tends to be more variable, since these assets often reflect specific circumstances at year-end, such as pre-borrowing for the following period’s needs.
Tangible capital assets
The government is responsible for a large portfolio of non-financial assets, which is almost entirely made up of tangible capital assets.
Tangible capital assets owned by the Province and its consolidated entities represent the largest component of the Province’s infrastructure investments. These assets include those it owns directly, such as provincial highways, as well as the assets of school boards, hospitals, colleges and agencies that are consolidated in its financial statements. The assets of GBEs are reflected in the Province’s statement of financial position as an investment in government business enterprises.
| | |
| 24 | | Financial Statement Discussion and Analysis, 2015–2016 |
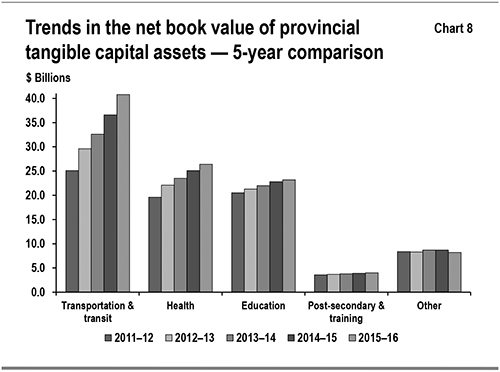
The reported net book value of Ontario’s tangible capital assets exceeded $102.5 billion in 2015–16, increasing by $5.4 billion over the prior year. Buildings, including schools, hospitals and college facilities, made up the single largest share, at $53.4 billion. The total also includes assets under construction, whether these are being built using the Alternative Financing Procurement (AFP) model, which the private sector finances during construction, or by other means. The balance sheet includes AFP assets under construction in accordance with the Province’s accounting policy. The impacts of AFPs on balance sheet liabilities are discussed in “Other long-term financing” on page 28.
Growth in the net book value of capital assets has averaged 7.4 per cent annually over the past five years. Most of the growth has been in new and renewed buildings and in transportation infrastructure, including provincial highways, bridges and the transit network owned by Metrolinx, an agency of the Government of Ontario. See Chart 8 for the recent trends in provincial tangible capital assets.
| | | | |
| Financial Statement Discussion and Analysis, 2015–2016 | | | 25 | |
Infrastructure expenditures
One of the goals of investing in capital is to improve the economic growth of the province. A 2015 report from The Centre for Spatial Economics, entitled The Economic Benefits of Public Infrastructure Spending in Canada, found that, on average, investing $1.00 in public infrastructure in Canada raises GDP by $1.43 in the short term and up to $3.83 in the long term. The full report is available at www.broadbentinstitute.ca/infrastructure.
The Province’s infrastructure spending in 2015–16 was $12.8 billion (see Table 4). This included $10.4 billion invested in assets owned by the Province and its consolidated entities, as discussed in “Tangible capital assets” on page 24 and $2.4 billion provided to non-consolidated partners such as universities and municipalities, and other infrastructure expenditures. The total was slightly less than the $13.9 billion set out in the 2015 Budget plan because of lower-than-forecast construction activity for the period.
| | |
| Infrastructure expenditures, 2015–161 | | Table 4 |
| ($ Billions) | | |
| | | | | | | | | | | | |
Sector | | Investment in Capital
Assets2 | | | Transfers and Other
Infrastructure
Expenditures3 | | | Total Infrastructure
Expenditures | |
Transportation and transit | | | 5.7 | | | | 0.6 | | | | 6.3 | |
Health | | | 2.8 | | | | 0.4 | | | | 3.2 | |
Education | | | 1.5 | | | | 0.0 | | | | 1.6 | |
Post-secondary and training | | | 0.4 | | | | 0.2 | | | | 0.6 | |
Other sectors4 | | | (0.1 | ) | | | 1.1 | | | | 1.0 | |
| | | | | | | | | | | | |
Totals5 | | | 10.4 | | | | 2.4 | | | | 12.8 | |
| | | | | | | | | | | | |
Notes:
| | 1 | Numbers may not add due to rounding. |
| | 2 | Includes adjustments for the net book value of assets disposed during the year, as well as changes in valuation. |
| | 3 | Mainly transfers for capital purposes to municipalities and universities and expenditure for capital repairs. Transfers for capital-related purposes and other infrastructure expenditures are recorded as expenses in the Province’s Consolidated Statement of Operations. |
| | 4 | Includes government administration, natural resources, and culture and tourism sectors. A negative investment in capital assets is due to the transfer of Pan/Parapan American Games assets to third parties. |
| | 5 | Includes third-party investments in consolidated entities such as hospitals, colleges and schools. |
| | |
| 26 | | Financial Statement Discussion and Analysis, 2015–2016 |
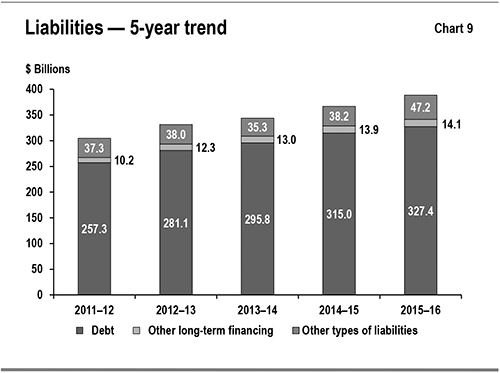
Liabilities
The Province’s liabilities consist of debt and other financial obligations, including accounts payable, funds it has received from the federal government but not yet spent and the estimated cost of future payments, including net pension liabilities, owing to current and former employees (see Table 5).
| | |
| Liabilities | | Table 5 |
| ($ Billions) | | |
| | | | | | | | | | | | | | | | | | | | |
| | | 2015–16
Actual | | | % of
Total | | | 2014–15
Actual | | | % of
Total | | | Variance
Increase
(Decrease) | |
Accounts payable and accrued liabilities | | | 19.4 | | | | 5.0 | % | | | 20.1 | | | | 5.5 | % | | | (0.7 | ) |
Debt | | | 327.4 | | | | 84.2 | % | | | 315.0 | | | | 85.8 | % | | | 12.4 | |
Other long-term financing | | | 14.1 | | | | 3.6 | % | | | 13.9 | | | | 3.8 | % | | | 0.2 | |
Deferred revenue and capital contributions | | | 10.8 | | | | 2.8 | % | | | 10.1 | | | | 2.8 | % | | | 0.7 | |
Pensions and other employee future benefits liability | | | 12.1 | | | | 3.1 | % | | | 3.2 | | | | 0.9 | % | | | 9.0 | |
Other liabilities | | | 4.9 | | | | 1.3 | % | | | 4.9 | | | | 1.3 | % | | | 0.0 | |
| | | | | | | | | | | | | | | | | | | | |
Total Liabilities | | | 388.7 | | | | 100.0 | % | | | 367.1 | | | | 100.0 | % | | | 21.6 | |
| | | | | | | | | | | | | | | | | | | | |
Debt
Debt and other long-term financing make up the largest share of liabilities. Debt grew by $12.4 billion in 2015–16 to $327.4 billion by year-end, primarily to finance the operating deficit and to invest in infrastructure. The change in Province’s accounting treatment for pensions, while increasing net debt, had no impact on the Province’s borrowing requirements. Hence total debt remained unchanged by this adjustment.
Net debt as at March 31, 2016, was $305.2 billion, $6.3 billion higher than forecast in the 2015 Budget. Table 6 summarizes how the Province used its net new financing in 2015–16.
| | |
| Use of new financing by the Province, 2015–16 | | Table 6 |
| ($ Billions) | | |
| | | | |
Operating deficit and other transactions1 | | | 1.4 | |
Cash invested in capital assets owned by the Province and its consolidated organizations,including hospitals, school boards and colleges2 | | | 10.7 | |
Increase in the Province’s cash and investments | | | 0.5 | |
| | | | |
| | | 12.6 | |
Increase in other long-term financing3 | | | (0.2 | ) |
| | | | |
Net new financing | | | 12.4 | |
| | | | |
| 1 | The Province’s operating deficit of $5.0 billion was offset by a net $3.6 billion in changes to assets and liabilities that provided cash for operating purposes. See the Consolidated Statement of Cash Flow. |
| 2 | New investments of $10.9 billion less proceeds of $0.2 billion from the sale of tangible capital assets. |
| 3 | Including net increase in financing of capital projects through AFP. See Note 4 to the Consolidated Financial Statements. |
The government completed an annual borrowing program of $32.1 billion in 2015–16. This yielded net new financing of $12.4 billion after adjustments and repayment of $21.9 billion in existing debt that matured.
| | | | |
| Financial Statement Discussion and Analysis, 2015–2016 | | | 27 | |
Other long-term financing
This category includes debt incurred to finance construction for public assets, including those procured through the AFP model and other means. All assets that are owned by the Province and its consolidated entities, and the associated financing liabilities, are reflected on the Province’s balance sheet as the assets are constructed and the liabilities incurred. For information on asset investments, refer to “Tangible capital assets” on page 24.
Other types of liabilities
Other types of liabilities include accounts payable, pensions and other employee future benefits, transfers received from the federal government representing deferred revenues, and other liabilities. This category increased by $9.0 billion in 2015–16 over the prior year, mainly due to an adjustment to the opening pension asset balance.
Chart 9 shows the recent trends in liabilities for the Province. This trend over the period between 2011–12 and 2015–16 shows public debt rising, mainly to fund capital investments and the annual deficit, as well as the impact in 2015-16 of the change in accounting treatment for pension assets of jointly sponsored pension plans. The upward trend in other long-term financing indicates increased capital related activities through AFPs. Other types of liabilities, including accounts payable and deferred revenue, tend to be more variable, since they often reflect specific circumstances at year-end, such as accrued liabilities for goods and services.
| | |
| 28 | | Financial Statement Discussion and Analysis, 2015–2016 |
Risks and risk management
The Province’s financial results and financial reporting are subject to risks and uncertainties over which the government has limited or no control. These include:
| | • | | Actual economic and/or revenue growth that differs from forecast; |
| | • | | Significant changes in financial statement items, especially taxation revenues, arising from actual results that differ from accounting estimates; |
| | • | | Unforeseen changes in transfer payments from the federal government; |
| | • | | Demand for entitlement-based public services or a change in other expense, including pension expense, that reflects actual experience that is significantly different than forecast; |
| | • | | Unusual weather patterns, extreme weather events and natural disasters with major financial impacts; |
| | • | | Security breaches or other malicious behaviour that could interrupt services, result in loss of information, compromise privacy and/or damage equipment or facilities; |
| | • | | The outcomes of legal settlements, arbitration and negotiations, and possible defaults on projects and potential defaults affecting loan and funding guarantees; |
| | • | | Financial market conditions, including access to capital markets, currency exchange rates and interest rates, that differ from expectations; and |
| | • | | Changes in accounting standards. |
Ontario manages risks to the revenue forecast by consulting with private sector economists and tracking their forecasts to inform the government’s planning assumptions. For prudent fiscal planning, the Ministry of Finance’s real GDP growth projections are slightly below the average private sector forecast.
The Province monitors information flows about revenues on an ongoing basis to assess potential risks to its finances. It also works constantly to enhance information flows for the same purpose. Collaboration with the Canada Revenue Agency, which administers roughly 75 per cent of Ontario’s taxation revenues, is essential to achieving this. As well, Ontario is currently leading a federal, provincial and territorial working group that is exploring ways to enhance corporate income tax revenue forecasting and monitoring.
The possible impacts on tax revenue of actual growth in the economy and other parameters differing from the assumptions used in the Budget is disclosed on pages 273–277 of the 2015 Budget, which is available at: http://www.fin.gov.on.ca/en/budget/ontariobudgets/2015/papers_all.pdf.
| | | | |
| Financial Statement Discussion and Analysis, 2015–2016 | | | 29 | |
There are also risks arising from other sources of revenue, such as federal transfers and income from GBEs. Because these represent a smaller share of total revenue, the risks they present are generally less material to the revenue forecast and, in any event, are difficult or impossible to predict or quantify. Note 1 to the Consolidated Financial Statements provides additional details on measurement uncertainty.
On the expense side, the fiscal plan includes contingency funds to help mitigate risks. In the 2015 Budget, these totalled $650 million: $550 million for operating risks and $100 million for capital. Funds were used to support initiatives such as emergency forest firefighting and supporting social assistance recipients.
Provisions for losses that are likely to occur as a result of contingent liabilities, such as ongoing litigation, and that can be reasonably estimated, are expensed and reported as liabilities. Note 13 to the Consolidated Financial Statements provide further details.
Note 3 to the Consolidated Financial Statements explains the Province’s risk management strategies, which are intended to ensure that exposure to borrowing-related risk is managed in a prudent and cost-effective manner.
Changes in Canadian generally accepted accounting principles for the public sector made by the Public Sector Accounting Board (PSAB) can have an impact on the Province’s budgets, estimates and actual results. Treasury Board Secretariat actively monitors proposed changes and provides input to standard setters to support development of standards that support sound public policy decision-making and transparency and accountability in reporting.
As required under the Fiscal Transparency and Accountability Act, 2004, a reserve is included in the projected surplus/deficit each year to guard against unforeseen revenue and expense changes that could have a negative impact on the Province’s fiscal performance. The 2015 Budget plan included a $1.0 billion reserve for 2015–16. Excluding this reserve, the 2015 Budget projected a deficit of $7.5 billion. Because the reserve is a forecast provision, and the fiscal results for 2015–16 are now finalized, a reserve is not reflected in the Province’s financial statements. The final deficit for the 2015–16 fiscal year is $5.0 billion, a $3.5 billion improvement compared with the 2015 Budget projection of $8.5 billion, which included the reserve.
| | |
| 30 | | Financial Statement Discussion and Analysis, 2015–2016 |
Key Financial Ratios
The use of key measures of financial position helps readers of the Annual Report assess the financial position of the Province. Through the levels and trends of these measures, readers are able to gauge the impacts of economic and other events on the Province’s finances, as well as how the government has responded.
The Public Sector Accounting Board recommends a series of ratios that help financial statement users better understand the sustainability, flexibility and vulnerability of a reporting entity.
For greater transparency and accountability, the Province has expanded the number of ratios on which it reports. The ratio, and the level of each, over the past five years are outlined in Table 7.
| | |
| Key Financial Ratios | | Table 7 |
| as at the end of the fiscal period | | |
| | | | | | | | | | | | | | | | | | | | | | |
| | | | | 2011–12 | | | 2012–13 | | | 2013–14 | | | 2014–15 | | | 2015–16 | |
| | Net Debt to GDP (%) | | | 35.7 | % | | | 37.1 | % | | | 38.5 | % | | | 39.4 | % | | | 40.9 | % |
Sustainability | | Net Debt to Total Revenue (%) | | | 214.6 | % | | | 222.4 | % | | | 230.5 | % | | | 240.1 | % | | | 237.8 | % |
| | Net Debt per Capita ($) | | $ | 17,626 | | | $ | 18,667 | | | $ | 19,591 | | | $ | 20,693 | | | $ | 21,926 | |
Flexibility | | Debt Charges to Total Revenue (%) | | | 9.2 | % | | | 9.1 | % | | | 9.1 | % | | | 9.0 | % | | | 8.5 | % |
| | Own-Source Revenue to GDP (%) | | | 13.4 | % | | | 13.5 | % | | | 13.5 | % | | | 13.4 | % | | | 14.1 | % |
| | Federal Transfers to Total Revenue (%) | | | 19.4 | % | | | 19.1 | % | | | 19.2 | % | | | 18.2 | % | | | 17.8 | % |
Vulnerability | | Foreign Currency Debt to Total Debt (%) | | | 25.4 | % | | | 24.3 | % | | | 22.9 | % | | | 20.9 | % | | | 18.8 | % |
| | Unhedged Foreign Currency Debt (%) | | | 0.9 | % | | | 0.7 | % | | | 0.5 | % | | | 0.3 | % | | | 0.3 | % |
Measures of sustainability
Net debt provides a measure of the future government revenues that will be required to pay for the government’s past transactions. Net debt as a percentage of the Province’s GDP shows the financial demands on the economy resulting from the government’s spending and taxation policies. A lower ratio of net debt-to-GDP indicates higher sustainability.
The Province’s net debt-to-GDP ratio was 40.9 per cent at the end of fiscal year 2015–16. In 2011–12, it was 35.7 per cent. Over this period, the deficit and other adjustments, including the 2015–16 legislated change in the Province’s accounting treatment for pension assets of jointly sponsored pension plans, contributed to 64 per cent of the increase in net debt, with investments in capital assets accounting for the balance. Between 2011–12 and 2014–15, because net debt grew more quickly than GDP, the ratio increased from 35.7 per cent to 39.4 per cent. The ratio increased to 40.9 per cent in 2015–16, mainly as a result of the change in accounting treatment for pension assets of jointly sponsored pension plans. If not for this change, this ratio would have remained level.
| | | | |
| Financial Statement Discussion and Analysis, 2015–2016 | | | 31 | |
The government continues to maintain a target of returning net debt to GDP to the pre-recession level of 27 per cent. The first key step in achieving this is to balance the budget. Debt is incurred for two main reasons: to finance deficits and to invest in capital assets. The government plans to invest $137 billion in capital over 10 years. These capital investments will be amortized over a period of time that corresponds to the useful life of the assets. After balancing the budget, increases in debt will be limited to the difference between the cash investment to build the assets and the amortization, which is a non-cash amount.
The government’s plan to reduce the ratio of net debt to GDP therefore hinges on both balancing the budget and investing in capital assets to help the economy grow, both of which will help achieve the 27 per cent target.
The ratio of net debt to total revenue is another measure of sustainability, since it shows the future revenue that is required to pay for past transactions and events. A lower net debt-to-revenue ratio indicates higher sustainability. In 2011–12, the ratio was 214.6 per cent. It rose to 240.1 per cent in 2014–15, as net debt grew more quickly than revenue. Even with the change in the accounting treatment for pension assets, the ratio fell to 237.8 per cent in 2015–16, indicating that total revenues increased at a greater rate than did net debt.
Measures of flexibility
The ratio of interest on debt to total revenue shows the share of provincial revenue that is being used to pay borrowing costs and is thus not available for programs. A lower ratio indicates that a government has more flexibility to direct its revenues to programs. The ratio has steadily fallen for Ontario over the past five years, from a high of 9.2 per cent in 2011–12 to the current level of 8.5 per cent. The Province’s strategy of extending the term of its borrowing program and locking in low interest rates for a longer period has also contributed to lower interest costs. This strategy has extended the weighted average term to maturity of provincially issued debt from approximately 8 years in 2009–10 to 14 years in 2015–16.
Own-source revenue as a share of the provincial GDP shows the extent to which the government is using funds from the provincial economy collected through taxation, user fees and other revenue sources it controls. Too high a taxation burden makes a jurisdiction uncompetitive, so increases in the ratio can reduce future revenue flexibility. Ontario’s ratio was stable between 2011–12 and 2014–15. The increase from 13.4 per cent in 2014–15 to 14.1 per cent in 2015–16 was largely due to the strong growth in tax and other revenues. This caused own-source revenues to increase more sharply than GDP.
| | |
| 32 | | Financial Statement Discussion and Analysis, 2015–2016 |
Measures of vulnerability
Transfers from the federal government as a percentage of total revenue are an indicator of the degree to which the Province relies on the federal government for revenue. A very high ratio shows that a provincial government is very reliant on federal transfers, a source of revenue over which it has limited or no control, and therefore vulnerable to shifts in federal policy on transfers. Ontario’s highest share of revenue from federal transfers in the past five years was 19.4 per cent, in 2011–12. The lowest was 17.8 per cent, in 2015–16. The gradual decline largely represents the expiration of time-limited federal transfers, including the HST transition payment, and the maturing of federal stimulus programs put in place following the global economic crisis in 2008.
Foreign currency debt to total debt is a measure of vulnerability to changes in foreign currency exchange rates. Accessing borrowing opportunities in foreign currencies allows Ontario to diversify its investor base and take advantage of lower borrowing costs. It also ensures that the Province will continue to have access to capital in the event that domestic market conditions become more challenging. Ontario manages foreign currency risk by hedging its exposure to Canadian dollars through the use of financial instruments, which is called hedging. Effective hedging has allowed the Province to consistently limit its exposure to foreign currency fluctuations to 0.9 per cent of debt issued for provincial purposes in 2011–12, declining to 0.3 per cent in 2015–16.
| | | | |
| Financial Statement Discussion and Analysis, 2015–2016 | | | 33 | |
Responsible Fiscal Management
The 2015–16 annual deficit of $5.0 billion was an improvement of $3.5 billion from the $8.5 billion deficit target laid out in the 2015 Budget. As a result, Ontario has achieved better-than-planned results in each of the last seven years.
The government’s record of strong fiscal management is due to an ongoing focus on managing growth in spending, as well as stimulating the economy and protecting revenue.
After declines in revenue in 2008–09 and 2009–10, paralleled by poor economic conditions in those years, Ontario’s economic and revenue performance have shown steady gains. Ontario’s economic recovery from the global recession has been driven by solid economic fundamentals, supported by long-term job recovery efforts such as significant infrastructure investments. Over the past four years, revenue has grown at an average annual rate of 4.0 per cent, while nominal GDP has grown at an average annual rate of 3.2 per cent.
To protect provincial revenues, better support consumer and work safety, and provide a level playing field for legitimate businesses, the government has focused on fighting underground economic activities. As noted in the 2016 Budget, Ontario has generated over $930 million since 2013–14 through ongoing enhanced compliance-focused measures.
Government action to manage growth in spending has achieved results. Program expense fell to 16.4 per cent of GDP in 2015–16, lower than the 17.9 per cent reached in 2009–10. Ontario also consistently has the lowest per-capita program spending among all Canadian provinces, and is projected to remain the lowest in 2015–16.
Program Review, Renewal and Transformation
Part of the reason for this success has been the Program Review, Renewal and Transformation initiative, the government’s ongoing fiscal planning and expenditure management approach and a continuous review of programs. PRRT is helping the government achieve better program outcomes while also lowering costs.
To improve programs, PRRT focuses on evidence-based decision-making, gathering and analyzing the best available information to improve how planned outcomes are identified and achieved across government. This may mean redesigning policies to support greater efficiency and cooperation within government, modernizing program delivery and changing or ending programs that do not meet people’s needs. The government met the $490 million program review savings target for 2015–16. To meet this target, the government achieved a number of efficiencies to make programs more sustainable, such as negotiating lower prices for goods and services and managing compensation.
| | |
| 34 | | Financial Statement Discussion and Analysis, 2015–2016 |
Some examples of program transformation from PRRT that have resulted in savings include:
| | • | | Making changes to the Ontario Drug Benefit Program to improve program efficiency, effectiveness and sustainability. This has enabled the government to achieve savings of approximately $100 million in 2015–16 and will enable over $200 million in annual savings when fully implemented. Changes include optimizing the quantities of medication dispensed and maximizing the use of generic drugs. Savings are reflected in the Ministry of Health and Long-Term Care and Ministry of Community and Social Services expense lines for 2015–16 results. |
| | • | | Continuing to reduce the government’s office footprint, to optimize the use of government real estate and drive government-wide cost reductions, achieving savings of approximately $24 million in 2015–16. Savings are reflected in various ministry expense lines for 2015–16 results. |
| | • | | Undertaking a series of initiatives that are lowering information technology (IT) costs and improving how technology supports the delivery of government programs and services, based most recently on a 2015 third-party independent benchmarking review of the government’s IT capability. Savings in the amount of $56 million (including consolidation of data centres, early vendor payments and lower contract costs, including for software and IT consulting services, laboratory supplies and security services) are reflected in various ministry expense lines for 2015–16 results. |
| | • | | Reduced costs associated with managing under-utilized schools, by encouraging school boards to consolidate schools, share space with other boards and foster community partnerships. |
| | • | | Better targeted funding through business support programs such as the Ontario Interactive Digital Media Tax Credit, in which the government narrowed the broad eligibility criteria to improve the ability of the credit to support innovative products. |
| | • | | Changes to the Second Career program by removing client targets for service providers, while ensuring that funding supports all eligible clients. These changes are generating approximately $40 million per year in ongoing savings and will enable the government to invest in the Canada–Ontario Job Grant and the renewed Ontario Youth Jobs Strategy. |
The government has also established a new Centre of Excellence for Evidence-Based Decision Making to build capacity to assess how programs are performing, using evidence to inform choices and lead change in critical public services.
| | | | |
| Financial Statement Discussion and Analysis, 2015–2016 | | | 35 | |
Managing compensation
With a significant share of resources going to salaries and benefits, managing compensation costs is critical to balancing the budget.
The 2015 Budget stated that compensation costs must be addressed within Ontario’s fiscal framework, which does not include additional funding for wage increases. Collective bargaining during this fiscal year continued to be subject to the principles of the net-zero compensation framework, in which any modest wage increases were required to be offset.
Chart 10 shows that the average percentage annual wage increase of the Provincial public sector has trended lower than increases in the municipal and federal public sectors and the private sector.
In addition, the interest on debt expense of $11.0 billion reported for 2015–16 was an improvement of $0.4 billion over the forecast in the 2015 Budget. Through a combination of lower deficits and borrowing requirements, lower-than-forecast interest rates and cost-effective debt management, interest on debt has consistently come in below forecast in each year since the 2010 Budget.
With the economy expected to continue to grow, and the government’s ongoing commitment to transform programs and services, Ontario remains committed to balancing the budget by 2017–18 and remaining balanced in 2018–19.
| | |
| 36 | | Financial Statement Discussion and Analysis, 2015–2016 |
Non-Financial Activities
This section discusses key non-financial performance in major sectors. The purpose is to allow readers of the Annual Report to understand how the government is using the funds available to it to achieve specific outcomes.
Health care
The government is committed to transforming Ontario’s health care system to become more patient-centred and focused on better access to care, quality and value. Ontario’s Patients First: Action Plan for Health Care, launched in 2015, aims to achieve four goals: increase access to health care, improve care coordination, better inform Ontarians to support their health care decisions, and protect patients and the Province’s health care system for the future.
In 2015–16, the Province made progress toward all four goals.
| | • | | Access: The Province has continued to reduce wait times for key service areas such as surgeries and diagnostic imaging. |
| | • | | Connect: To improve access to integrated primary, home and community care, the government has begun planning to implement an expanded role for the Province’s 14 Local Health Integration Networks, pending legislation. Ontario has increased investment in home and community care by 5 per cent annually, amounting to $250 million in 2015–16, for a total of $750 million over three years. It has also increased the hourly wages of publicly funded personal support workers caring for patients at home and in the community by $1.50 per hour in 2015–16 to at least $15.50 per hour, in the second of three annual increases totalling up to $4.00 over three years to at least $16.50 per hour by April 1, 2016. |
| | • | | Inform: The government passed the Healthy Menu Choices Act, 2015, requiring calorie information to be posted in numerous food service locations, to inform Ontarians about healthier food choices. Ontario has also passed regulations to help reduce smoking rates by making it harder for youth to obtain tobacco products and by banning the sale of electronic cigarettes to anyone under the age of 19. |
| | • | | Protect: Ontario is funding a nasal spray flu vaccine to better protect young children against the flu, made prescription refills more convenient and less expensive for people with chronic conditions, and helped ensure that Ontarians get good value for drug costs now and in the future through the efforts of the pan-Canadian Pharmaceutical Alliance (pCPA). The government appointed Ontario’s first-ever Patient Ombudsman to help address patients’ otherwise unresolved concerns about their care by a health organization. |
| | | | |
| Financial Statement Discussion and Analysis, 2015–2016 | | | 37 | |
Education
Ontario’s publicly funded early years and education system is focused on ensuring that Ontarians have the education and skills needed to lead in the global economy.
Outcomes reported in 2015–16 included the following:
| | • | | More high school students graduating. In 2015, 85.5 per cent of students graduated from high school, compared to 68 per cent in 2004. This is an increase of more than 17 percentage points. |
| | • | | Improving child care. Through the introduction of the Child Care and Early Years Act, 2014, which came into effect in August 2015, the government is modernizing the legislative and regulatory framework for child care. |
Post-secondary education and training
Post-secondary education and training play a critical role in preparing people for the workforce. This will be increasingly important as Ontario moves further toward a more knowledge-based economy. Besides having better employment prospects, Ontarians with higher levels of education and skills earn higher wages and have better health and longevity.
Outcomes reported in 2015–16 included:
| | • | | Helping people in Ontario achieve higher levels of education. In 2015, the most recent year for which information is available, 67 per cent of adults in Ontario aged 25 to 64 had a post-secondary degree, diploma or certificate. This is higher than the average of any country in the Organisation for Economic Co-operation and Development. This positions Ontario well to meet or exceed its 70 per cent target by 2020. |
| | • | | Investments in student financial assistance between 2009–10 and 2014–15 resulted in a 50 per cent increase in the number of students qualifying for aid (approximately 125,000 additional students). During this same time period, enrolment increased by 8 per cent. Rates of participation in post-secondary education among Ontario’s young people are higher than for the rest of Canada. |
Condition of provincial tangible capital assets
As part of the annual budgeting process, each ministry that owns and operates infrastructure is required to prepare and update a plan to properly maintain its assets. Examples of recent asset management practices include:
| | • | | In the transportation sector, over the last five years, there has been a significant improvement in highway pavement and bridge conditions throughout the province as a result of continued investments in these assets. |
| | |
| 38 | | Financial Statement Discussion and Analysis, 2015–2016 |
| | • | | In the health sector, the Facility Condition Assessment Program has been conducting standardized technical audits of hospital infrastructure to provide comparable and reliable data about the current stock and condition of public hospital assets. This allows the Province to better target renewal funding and develop a long-term outlook for capital investment requirements. |
| | • | | In the education sector, the School Condition Improvement Program addresses renewal needs, focusing on ensuring that facilities are in good condition, energy efficient, accessible and meet modern service standards. |
| | • | | Since 2011, the Province has been working with colleges to create a comprehensive space inventory, develop space standards and assess the condition of their facilities. With improved inventory and facilities condition data, the Province is better able to support asset management initiatives, including forecasting needs and developing a provincial infrastructure asset inventory. |
| | • | | Other provincially owned capital assets include buildings within the government’s General Real Estate Portfolio, which consists of offices and special-purpose buildings such as courthouses and detention centres. Facility condition index targets are set for the buildings, and most buildings are currently within the acceptable ranges. |
Going forward, the Infrastructure for Jobs and Prosperity Act, 2015, which came into force on May 1, 2016, requires that the Province publish a long-term infrastructure plan within three years and that subsequent plans be tabled at least once every five years. The Act also:
| | • | | Establishes principles that must be considered by the government and broader public sector entities when making infrastructure decisions, as well as prioritization criteria to be used by the government when considering infrastructure projects. |
| | • | | Creates regulatory authorities related to broader public sector asset management plans, supporting the use of apprentices on provincial infrastructure projects and promoting design excellence in public works. |
| | • | | Emphasizes the importance of minimizing environmental impacts and ensuring climate change resiliency in infrastructure planning and investment. |
The Act aligns infrastructure investments with Ontario’s economic development priorities through long-term planning, while strengthening the Province’s competitive edge globally.
| | | | |
| Financial Statement Discussion and Analysis, 2015–2016 | | | 39 | |
Transparency and Accountability
Recent developments in public sector accounting standards
The Province’s financial reports are in accordance with the accounting principles for governments recommended by the Public Sector Accounting Board of the Chartered Professional Accountants of Canada (CPA Canada).
PSAB’s project on concepts underlying financial performance remains a work in progress. Ontario, along with the federal, territorial and other provincial governments, continues to monitor the work of the project’s task force and to provide input to support high-quality Canadian public sector accounting standards, which are integral to achieving the Province’s transparency and accountability reporting objectives. As described in Note 16 to the Consolidated Financial Statements, additional future changes in accounting standards may affect how assets, liabilities, revenues and expenses are reported in the Province’s future financial reports.
The Province will continue to work with standard setters, other jurisdictions, the Auditor General’s Office and the accounting community on matters related to transparency and accountability in public sector financial reporting.
The C.D. Howe Institute Fiscal Accountability Report
Each year, the C.D. Howe Institute, an independent research organization that focuses on support for economically sound public policies, assesses the fiscal planning and reporting of governments in Canada.
Consistency and comparability of planned and actual results in the Budget, Estimates and summary financial statements of the Province are essential to allow users to compare performance against the approved Budget and to understand longer-term trends. The institute has again recognized that Ontario’s practices, which align the Budget, Estimates and financial reporting, demonstrate a high level of accountability and transparency.
In the most recent C.D. Howe report on Canadian provinces, territories and the federal government, Ontario also scored consistently highly on the general accuracy of its spending plans and for not over-estimating its revenue forecast. See https://www.cdhowe.org/sites/default/files/attachments/research_papers/mixed/commentary _448.pdf.
| | |
| 40 | | Financial Statement Discussion and Analysis, 2015–2016 |
Trillium Trust
The Trillium Trust Act, 2014, provides for an account to be maintained in the Public Accounts that records the prescribed amounts of financial benefits to Ontario from the disposition of qualifying assets under the Act. The Act also requires the account to record all expenditures made under the Act to support infrastructure investments. A report on the financial activities of the Trillium Trust is included as a schedule in Volume 1 of the Public Accounts.
Volume 1 shows that $1.35 billion was allocated to the Trillium Trust as at March 31, 2016, in relation to the sale and redemption of the Province’s shares in General Motors in earlier years.
Subsequent to year end, in August 2016, the Province filed a regulation crediting an additional $3.2 billion to the Trillium Trust related to the sale of Hydro One common shares which occurred in 2015–16.
Data visualization
Last year, the government created its first interactive data visualization tool to graphically present details on the information contained in Volume 1 of the 2014–15 Public Accounts. This year, additional data visualization tools and data tables have been created and are now available on the Ontario.ca website. The government has also increased the number of Public Accounts open data sets available for download from two to seven.
| | | | |
| Financial Statement Discussion and Analysis, 2015–2016 | | | 41 | |
| | |
| 42 | | Financial Statement Discussion and Analysis, 2015–2016 |
CONSOLIDATED
FINANCIAL STATEMENTS
| | | | |
| Consolidated Financial Statements, 2015–2016 | | | 43 | |
| | |
| 44 | | Consolidated Financial Statements, 2015–2016 |
| | |
 | | Office of the Auditor General of Ontario Bureau du vérificateur général de I’Ontario |
Box 105.15th Floor 20 Dundas Street West Toronto, Ontario M5G 2C2 416-327-2381 fax 416-327-9862 tty 416-327-6123 B.P. 105,15e étage 20, rue Dundas ouest Toronto (Ontario) M5G 2C2 416-327-2381 télécopieur 416-327-9862 ats 416-327-6123 www.auditor.on.ca | | Independent Auditor’s Report To the Legislative Assembly of the Province of Ontario I have audited the accompanying consolidated financial statements of the Province of Ontario, which comprise the consolidated statement of financial position as at March 31, 2016, and the consolidated statements of operations, change in net debt, change in accumulated deficit and cash flow for the year then ended, and a summary of significant accounting policies and other explanatory information. Management’s Responsibility for the Consolidated Financial Statements The Government of Ontario (Government) is responsible for the preparation and fair presentation of these consolidated financial statements in accordance with Canadian public sector accounting standards, and for such internal control as the Government determines is necessary to enable the preparation of consolidated financial statements that are free from material misstatement, whether due to fraud or error. Auditor’s Responsibility My responsibility is to express an opinion on these consolidated financial statements based on my audit. I conducted my audit in accordance with Canadian generally accepted auditing standards. Those standards require that I comply with ethical requirements and plan and perform the audit to obtain reasonable assurance about whether the consolidated financial statements are free from material misstatement. An audit involves performing procedures to obtain audit evidence about the amounts and disclosures in the consolidated financial statements. The procedures selected depend on the auditor’s judgment, including the assessment of the risks of material misstatement of the consolidated financial statements, whether due to fraud or error. In making those risk assessments, the auditor considers internal control relevant to the entity’s preparation and fair presentation of the consolidated financial statements in order to design audit procedures that are appropriate in the circumstances, but not for the purpose of expressing an opinion on the effectiveness of the entity’s internal control. An audit also includes evaluating the appropriateness of accounting policies used and the reasonableness of accounting estimates made by the Government, as well as evaluating the overall presentation of the consolidated financial statements. I believe that the audit evidence I have obtained is sufficient and appropriate to provide a basis for my qualified audit opinion. |
.../2
| | | | |
| Consolidated Financial Statements, 2015–2016 | | | 45 | |
| | |
| | Basis for Qualified Opinion As at April 1, 2015, the Province increased the opening accumulated deficit by $9.154 billion to correct for an error in prior periods in its valuation allowance for an accrued benefit pension asset included in the liability for pensions and other employee future benefits. As reflected in the consolidated financial statements and described in Note 18, the Province has not restated its 2015 comparative period to reflect the correction of the error which constitutes a departure from Public Sector Accounting Standards. Accordingly, in the comparative period, opening accumulated deficit would have increased by $8.201 billion, education expense would have increased by $956 million, general government and other expense would have decreased by $3 million, annual deficit would have increased by $953 million and ending accumulated deficit would have increased by $9.154 billion. Qualified Opinion In my opinion, except for the effects of the matter described in the Basis for Qualified Opinion paragraph, the consolidated financial statements present fairly, in all material respects, the consolidated financial position of the Province of Ontario as at March 31, 2016, and the consolidated results of its operations, change in its net debt, change in its accumulated deficit and its cash flows for the year then ended in accordance with Canadian public sector accounting standards. Other Matter I draw attention to the Province’s Financial Statement Discussion and Analysis that has also not been restated for the effects on the comparative periods of the error in the valuation allowance for an accrued benefit pension asset included in the liability for pensions and other employee future benefits, as discussed in the Basis for Qualified Opinion paragraph above. |
| | | | |
| | | |  |
| | Toronto, Ontario October 5, 2016 | | Bonnie Lysyk, MBA, CPA, CA, LPA Auditor General |
| | |
| 46 | | Consolidated Financial Statements, 2015–2016 |
Province of Ontario
Consolidated Statement of Operations
| | | | | | | | | | | | |
| | | 2015–16 | | | 2015–16 | | | 2014–15 | |
($ Millions) | | Budget1 | | | Actual | | | Actual | |
Revenue (Schedules 1 and 2) | | | | | | | | | | | | |
Personal Income Tax | | | 30,377 | | | | 31,141 | | | | 29,313 | |
Sales Tax | | | 22,982 | | | | 23,455 | | | | 21,689 | |
Corporations Tax | | | 11,342 | | | | 11,428 | | | | 9,557 | |
Education Property Tax | | | 5,715 | | | | 5,839 | | | | 5,561 | |
Employer Health Tax | | | 5,680 | | | | 5,649 | | | | 5,415 | |
Ontario Health Premium | | | 3,458 | | | | 3,453 | | | | 3,366 | |
Gasoline and Fuel Taxes | | | 3,209 | | | | 3,210 | | | | 3,186 | |
Other Taxes (Note 11) | | | 4,634 | | | | 7,643 | | | | 4,188 | |
| | | | | | | | | | | | |
Total Taxation | | | 87,397 | | | | 91,818 | | | | 82,275 | |
Transfers from Government of Canada | | | 22,890 | | | | 22,857 | | | | 21,615 | |
Income from Investment in Government Business Enterprises (Schedule 9 and Note 11) | | | 4,812 | | | | 4,909 | | | | 5,615 | |
Other | | | 9,291 | | | | 8,793 | | | | 9,041 | |
| | | | | | | | | | | | |
| | | 124,390 | | | | 128,377 | | | | 118,546 | |
Expense (Schedules 3 and 4) | | | | | | | | | | | | |
Health | | | 50,773 | | | | 51,067 | | | | 50,039 | |
Education2 | | | 25,302 | | | | 26,588 | | | | 25,194 | |
Children’s and Social Services | | | 15,431 | | | | 15,555 | | | | 14,683 | |
Environment, Resources and Economic Development | | | 12,987 | | | | 12,612 | | | | 11,682 | |
Interest on Debt | | | 11,410 | | | | 10,967 | | | | 10,635 | |
Post-Secondary Education and Training | | | 7,810 | | | | 7,634 | | | | 7,660 | |
Justice | | | 4,429 | | | | 4,549 | | | | 4,351 | |
General Government and Other | | | 3,760 | | | | 4,434 | | | | 4,617 | |
| | | | | | | | | | | | |
| | | 131,902 | | | | 133,406 | | | | 128,861 | |
Reserve | | | 1,000 | | | | — | | | | — | |
| | | | | | | | | | | | |
Annual Deficit | | | (8,512 | ) | | | (5,029 | ) | | | (10,315 | ) |
| | | | | | | | | | | | |
| 1 | Amounts reported as “Plan” in 2015 Budget. |
| 2 | Teachers’ Pension Plan expense is included in Education (Schedule 4). |
See accompanying Notes and Schedules to the Consolidated Financial Statements.
| | | | |
| Consolidated Financial Statements, 2015–2016 | | | 47 | |
Province of Ontario
Consolidated Statement of Financial Position
| | | | | | | | |
As at March 31 ($ Millions) | | 2016 | | | 2015 | |
Liabilities | | | | | | | | |
Accounts Payable and Accrued Liabilities (Schedule 5) | | | 19,361 | | | | 20,055 | |
Debt (Note 2) | | | 327,413 | | | | 314,960 | |
Other Long-Term Financing (Note 4) | | | 14,145 | | | | 13,935 | |
Deferred Revenue and Capital Contributions (Note 5) | | | 10,779 | | | | 10,110 | |
Pensions and Other Employee Future Benefits (Note 6) | | | 12,107 | | | | 3,151 | |
Other Liabilities (Note 7) | | | 4,905 | | | | 4,878 | |
| | | | | | | | |
| | | 388,710 | | | | 367,089 | |
| | | | | | | | |
Financial Assets | | | | | | | | |
Cash and Cash Equivalents | | | 13,600 | | | | 15,193 | |
Investments (Note 8) | | | 21,765 | | | | 20,366 | |
Accounts Receivable (Schedule 6) | | | 11,059 | | | | 10,306 | |
Loans Receivable (Schedule 7) | | | 11,545 | | | | 11,125 | |
Other Assets | | | 1,936 | | | | 2,021 | |
Investment in Government Business Enterprises (Schedule 9) | | | 23,572 | | | | 23,502 | |
| | | | | | | | |
| | | 83,477 | | | | 82,513 | |
| | | | | | | | |
Net Debt | | | (305,233 | ) | | | (284,576 | ) |
Non-Financial Assets | | | | | | | | |
Tangible Capital Assets (Note 9) | | | 102,536 | | | | 97,065 | |
| | | | | | | | |
Accumulated Deficit | | | (202,697 | ) | | | (187,511 | ) |
| | | | | | | | |
Contingent Liabilities (Note 13) and Contractual Obligations (Note 14).
See accompanying Notes and Schedules to the Consolidated Financial Statements.
| | |
| 48 | | Consolidated Financial Statements, 2015–2016 |
Province of Ontario
Consolidated Statement of Change in Net Debt
| | | | | | | | |
| For the year ended March 31 | | | | | | |
($ Millions) | | 2016 | | | 2015 | |
Annual Deficit | | | (5,029 | ) | | | (10,315 | ) |
Acquisition of Tangible Capital Assets (Note 9) | | | (10,922 | ) | | | (11,183 | ) |
Amortization of Tangible Capital Assets (Note 9) | | | 4,913 | | | | 4,544 | |
Proceeds on Sale of Tangible Capital Assets | | | 175 | | | | 140 | |
Loss/(Gain) on Sale of Tangible Capital Assets | | | 363 | | | | (10 | ) |
| | | | | | | | |
| | | (5,471 | ) | | | (6,509 | ) |
(Decrease)/Increase in Fair Value of Ontario Nuclear Funds (Note 10) | | | (1,003 | ) | | | 1,121 | |
| | | | | | | | |
Increase in Net Debt | | | (11,503 | ) | | | (15,703 | ) |
| | | | | | | | |
Net Debt at Beginning of Year | | | (284,576 | ) | | | (268,873 | ) |
Pension Asset Valuation Allowance (Note 18) | | | (9,154 | ) | | | — | |
| | | | | | | | |
Restated Net Debt at Beginning of Year | | | (293,730 | ) | | | (268,873 | ) |
| | | | | | | | |
Net Debt at End of Year | | | (305,233 | ) | | | (284,576 | ) |
| | | | | | | | |
See accompanying Notes and Schedules to the Consolidated Financial Statements.
| | | | |
| Consolidated Financial Statements, 2015–2016 | | | 49 | |
Province of Ontario
Consolidated Statement of Change in Accumulated Deficit
| | | | | | | | |
| For the year ended March 31 | | | | | | |
($ Millions) | | 2016 | | | 2015 | |
Accumulated Deficit at Beginning of Year | | | (187,511 | ) | | | (178,317 | ) |
Pension Asset Valuation Allowance (Note 18) | | | (9,154 | ) | | | — | |
| | | | | | | | |
Restated Accumulated Deficit at Beginning of Year | | | (196,665 | ) | | | (178,317 | ) |
Annual Deficit | | | (5,029 | ) | | | (10,315 | ) |
(Decrease)/Increase in Fair Value of Ontario Nuclear Funds (Note 10) | | | (1,003 | ) | | | 1,121 | |
| | | | | | | | |
Accumulated Deficit at End of Year | | | (202,697 | ) | | | (187,511 | ) |
| | | | | | | | |
See accompanying Notes and Schedules to the Consolidated Financial Statements.
| | |
| 50 | | Consolidated Financial Statements, 2015–2016 |
Province of Ontario
Consolidated Statement of Cash Flow
| | | | | | | | |
| For the year ended March 31 | | | | | | |
($ Millions) | | 2016 | | | 2015 | |
Operating Transactions | | | | | | | | |
Annual Deficit | | | (5,029 | ) | | | (10,315 | ) |
Non-Cash Items: | | | | | | | | |
Amortization of Tangible Capital Assets (Note 9) | | | 4,913 | | | | 4,544 | |
Loss/(Gain) on Sale of Tangible Capital Assets | | | 363 | | | | (10 | ) |
Gain on Sale of Shares of Hydro One Limited (Note 11) | | | (783 | ) | | | — | |
Income from Investment in Government Business Enterprises (Schedule 9) | | | (4,909 | ) | | | (5,615 | ) |
PSAB Adjustment for Liabilities for Contaminated Sites | | | — | | | | (1,683 | ) |
Increase in Pension Asset Valuation Allowance (Note 6) | | | 1,514 | | | | — | |
Cash Items: | | | | | | | | |
Increase in Accounts Receivable (Schedule 6) | | | (753 | ) | | | (1,793 | ) |
(Increase)/Decrease in Loans Receivable (Schedule 7) | | | (420 | ) | | | 1 | |
(Decrease)/Increase in Accounts Payable and Accrued Liabilities (Schedule 5) | | | (694 | ) | | | 1,460 | |
Decrease in Liability for Pensions and Other Employee Future Benefits (Note 6) | | | (1,712 | ) | | | (752 | ) |
Increase in Other Liabilities (Note 7) | | | 27 | | | | 1,604 | |
Increase in Deferred Revenue and Capital Contributions (Note 5) | | | 669 | | | | 629 | |
Remittances from Investment in Government Business Enterprises (Schedule 9) | | | 5,365 | | | | 3,964 | |
Decrease/(Increase) in Other Assets | | | 85 | | | | (280 | ) |
| | | | | | | | |
Cash Applied to Operating Transactions | | | (1,364 | ) | | | (8,246 | ) |
| | | | | | | | |
Capital Transactions | | | | | | | | |
Acquisition of Tangible Capital Assets (Note 9) | | | (10,922 | ) | | | (11,183 | ) |
Proceeds from Sale of Tangible Capital Assets | | | 175 | | | | 140 | |
| | | | | | | | |
Cash Applied to Capital Transactions | | | (10,747 | ) | | | (11,043 | ) |
| | | | | | | | |
Investing Transactions | | | | | | | | |
(Increase)/Decrease in Investments (Note 8) | | | (1,399 | ) | | | 1,623 | |
Capital Contribution to Hydro One Limited (Schedule 9) | | | (2,600 | ) | | | — | |
Net Proceeds from Sale of Shares of Hydro One Limited (Note 11) | | | 1,854 | | | | — | |
| | | | | | | | |
Cash (Applied)/Provided by Investing Transactions | | | (2,145 | ) | | | 1,623 | |
| | | | | | | | |
Financing Transactions | | | | | | | | |
Long-Term Debt Issued | | | 34,362 | | | | 41,543 | |
Long-Term Debt Retired | | | (21,882 | ) | | | (22,322 | ) |
Net Change in Short-Term Debt | | | (27 | ) | | | (19 | ) |
Increase in Other Long-Term Financing (Note 4) | | | 210 | | | | 913 | |
| | | | | | | | |
Cash Provided by Financing Transactions | | | 12,663 | | | | 20,115 | |
| | | | | | | | |
Net (Decrease)/Increase in Cash and Cash Equivalents | | | (1,593 | ) | | | 2,449 | |
Cash and Cash Equivalents at Beginning of Year | | | 15,193 | | | | 12,744 | |
| | | | | | | | |
Cash and Cash Equivalents at End of Year | | | 13,600 | | | | 15,193 | |
| | | | | | | | |
See accompanying Notes and Schedules to the Consolidated Financial Statements.
| | | | |
| Consolidated Financial Statements, 2015–2016 | | | 51 | |
NOTES TO THE CONSOLIDATED FINANCIAL STATEMENTS
1. Summary of Significant Accounting Policies
(a) Basis of Accounting
The Consolidated Financial Statements are prepared by the Government of Ontario in accordance with legislation and the accounting standards for governments recommended by the Public Sector Accounting Board (PSAB) of the Chartered Professional Accountants of Canada (CPA Canada).
(b) Reporting Entity
These financial statements report the activities of the Consolidated Revenue Fund combined with those organizations that are controlled by the Province.
Government business enterprises (GBEs), broader public sector (BPS) organizations (i.e., hospitals, school boards and colleges) and other government organizations controlled by the Province are included in these financial statements. Controlled organizations are consolidated if they meet one of the following criteria: i) their revenues, expenses, assets or liabilities are greater than $50 million; or ii) their outside sources of revenue, deficit or surplus are greater than $10 million. In accordance with PSAB, the Province also applies the “benefit versus cost constraint” in determining which organizations should be consolidated in the Province’s financial statements. A listing of consolidated government organizations is provided in Schedule 8. For those organizations that do not meet the PSAB benefit versus cost constraint standard, such as Children’s Aid Societies and Community Care Access Centres, they are reflected as government transfer payment expense in these financial statements through the accounts of the ministries responsible for them.
Trusts administered by the Province on behalf of other parties are excluded from the reporting entity, but are disclosed in Note 15.
| | |
| 52 | | Consolidated Financial Statements, 2015–2016 |
(c) Principles of Consolidation
Government business enterprises are defined as those government organizations that i) are separate legal entities with the power to contract in their own name and that can sue and be sued; ii) have the financial and operating authority to carry on a business; iii) have as their principal activity and source of revenue the selling of goods and services to individuals and non-government organizations; and iv) are able to maintain their operations and meet their obligations from revenues generated outside the government reporting entity. The activities of GBEs are recorded in the financial statements using the modified equity method. Under this method, GBEs are reported in accordance with the accounting principles generally accepted for government business enterprises. Their combined net assets are included in the financial statements as Investment in Government Business Enterprises on the Consolidated Statement of Financial Position, and their net income is shown as a separate item, Income from Investment in Government Business Enterprises (GBEs), on the Consolidated Statement of Operations. Less than wholly owned GBEs (e.g., Hydro One Limited) are reflected using the modified equity method based on the percentage of ownership government held during the fiscal year.
The assets and liabilities of the BPS organizations are consolidated with those of the Province on a line-by-line basis on the Consolidated Statement of Financial Position. As such, the net debt of hospitals, school boards and colleges is included in the consolidated net debt of the Province. The total annual expenses of these BPS organizations, net of third party revenues they receive directly from the public, such as tuition fees, patient fees, donations and other recoveries, are included in the consolidated expenses of the Province. The expenses of hospitals are included in Health expenses, school boards in Education expenses, and colleges in Post-Secondary Education and Training expenses on the Consolidated Statement of Operations. Where appropriate, adjustments are made to present the accounts of these organizations on a basis consistent with the accounting policies of the Province to eliminate significant inter-organizational accounts on the Consolidated Statement of Financial Position and to remove inter-organizational gains/losses from the Consolidated Statement of Operations.
Other government organizations controlled by the Province are consolidated on a line-by-line basis with the assets, liabilities, revenues and expenses of the Province based on the percentage of ownership the government held as at the end of the fiscal year. Where appropriate, adjustments are also made to present the accounts of these organizations on a basis consistent with the accounting policies of the Province, and to eliminate significant inter-organizational accounts and transactions.
(d) Measurement Uncertainty
The preparation of financial statements requires the Province to make estimates and assumptions that affect the amounts of assets, liabilities, revenues and expenses during the reporting period. Uncertainty in the determination of the amounts at which an item is recognized or disclosed in the financial statements is known as measurement uncertainty.
| | | | |
| Consolidated Financial Statements, 2015–2016 | | | 53 | |
Measurement uncertainty that is material to these financial statements exists in the valuation of pensions and other employee future benefits obligations, the value of tangible capital assets, the estimation of personal income tax, corporations tax and harmonized sales tax revenue accruals, the valuation of the Canada Health Transfer, Canada Social Transfer Equalization Payment entitlements, and the estimation of liabilities for contaminated sites.
Pensions and other employee future benefits liability of $12,107 million (2015, $3,151 million), see Note 6, is subject to measurement uncertainty because actual results may differ significantly from the Province’s best long-term estimate of expected results (for example, the difference between actual results and actuarial assumptions regarding return on investment of pension fund assets and health care cost trend rates for retiree benefits).
The net book value of tangible capital assets of $102,536 million (2015, $97,065 million), see Note 9, is subject to uncertainty because of differences between estimated useful lives of the assets and their actual useful lives.
Personal income tax revenue estimate of $31,141 million (2015, $29,313 million), see Schedule 1, may be subject to subsequent revisions based on information available in the future related to past-year tax return processing. Corporations tax revenues of $11,428 million (2015, $9,557 million), see Schedule 1, and Harmonized Sales Tax revenues of $23,455 million (2015, $21,689 million), are also subject to uncertainty for similar reasons.
The estimation of the Canada Health Transfer of $13,089 million (2015, $12,408 million) and Canada Social Transfer of $4,984 million (2015, $4,847 million), and Equalization Payments entitlements of $2,363 million (2015, $1,988 million), see Schedule 1, is subject to uncertainty because of variances between the estimated and actual Ontario shares of the Canada-wide personal income and corporations tax base and population.
There is measurement uncertainty surrounding the estimation of liabilities for contaminated sites of $1,751 million as at March 31, 2016 (2015, $1,792 million), see Note 7. The Province may be responsible for cleanup costs that cannot be reasonably estimated due to several factors, including: insufficient information related to the nature and extent of contamination, timing of costs well into the future (e.g., unknown impacts of future technological advancements), the challenges of remote locations and unique contaminations.
Estimates are based on the best information available at the time of preparation of the financial statements and are reviewed annually to reflect new information as it becomes available. By their very nature, estimates are subject to measurement uncertainty. Therefore, actual results may differ materially from the Province’s estimates.
| | |
| 54 | | Consolidated Financial Statements, 2015–2016 |
(e) Significant Accounting Policies
Revenue
Revenues are recognized in the fiscal year that the events giving rise to the revenues occur and they are earned. Amounts received prior to the end of the year, which relate to revenues that will be earned in a subsequent fiscal year, are deferred and reported as liabilities.
Expense
Expenses are recognized in the fiscal year that the events giving rise to the expenses occur and resources are consumed.
Transfer payments are recognized in the year that the transfer is authorized and all eligibility criteria have been met by the recipient. Any transfers paid in advance are deemed to have met all eligibility criteria.
Interest on debt includes: i) interest on outstanding debt net of interest income on investments and loans; ii) amortization of foreign exchange gains or losses; iii) amortization of debt discounts, premiums and commissions; iv) amortization of deferred hedging gains and losses; and v) debt servicing costs and other costs. Interest income earned on investments and loans is netted with interest expense incurred on debt.
Employee future benefits, such as pensions, other retirement benefits and entitlements upon termination, are recognized as expenses over the years in which the benefits are earned by employees. These expenses are the government’s share of the current year’s cost of benefits, interest on the net benefits’ liability or asset, amortization of actuarial gains or losses, cost/gain on plan amendments and other adjustments.
Other employee future benefits are recognized in the period when the event that obligates the government occurs or in the period when the benefits are earned by employees.
The costs of buildings, transportation infrastructure, vehicles, aircraft, leased assets, machinery, equipment and information technology infrastructure and systems owned by the Province and its consolidated organizations are amortized and recognized as expenses over their estimated useful lives on a straight-line basis.
Liabilities
Liabilities are recorded to the extent that they represent present obligations of the government to outside parties as a result of events and transactions occurring prior to the end of the fiscal year. The settlement of liabilities will result in the sacrifice of economic benefits in the future.
Liabilities include obligations to make transfer payments to organizations and individuals, present obligations for environmental costs, probable losses on loan guarantees issued by the government and contingencies when it is likely that a loss will be realized and the amount can be reasonably determined.
| | | | |
| Consolidated Financial Statements, 2015–2016 | | | 55 | |
Liabilities also include obligations to GBEs.
Deferred revenue represents unspent externally restricted receipts from the federal government or other third parties. Amounts received prior to year-end that relate to funding for a subsequent fiscal year are reported as deferred revenue. Deferred revenues are recorded into revenue in the period in which the amounts received are used for the purposes specified or all external restrictions are satisfied. Deferred capital contributions represent the unamortized amount of contributions received from the federal government and other third parties to construct or acquire tangible capital assets. These contributions are recognized as deferred capital contributions and recorded into revenue over the useful life of the tangible capital assets based on the relevant stipulations of the contributions taken together with the actions and communications of the Province.
Alternative Financing and Procurement (AFP) refers to the Province using private-sector partners to procure and finance infrastructure assets. Assets procured via AFP are recognized as tangible capital assets and the related obligations are recognized as other long-term financing liabilities in these financial statements as the assets are constructed.
Debt
Debt consists of treasury bills, commercial paper, medium- and long-term notes, savings bonds, debentures and loans.
Debt denominated in foreign currencies that has been hedged is recorded at the Canadian dollar equivalent using the rates of exchange established by the terms of the hedge agreements. Other foreign currency-denominated debt is translated to Canadian dollars at year-end rates of exchange and any exchange gains or losses are amortized over the remaining term to maturity.
Derivatives are financial contracts, the value of which is derived from underlying instruments. The Province uses derivatives for the purpose of managing risk associated with interest cost. The Province does not use derivatives for speculative purposes. Gains or losses arising from derivative transactions are deferred and amortized over the remaining life of the related debt issue.
Pensions and Other Employee Future Benefits
The liabilities for pensions and other employee future benefits are calculated on an actuarial basis using the government’s best estimates of future inflation rates, investment returns, employee salary levels and other underlying assumptions, and, where applicable, the government’s borrowing rate. When actual plan experience of pensions, other retirement benefits and termination pay differs from that expected, or when assumptions are revised, actuarial gains and losses arise. These gains and losses are amortized over the expected average remaining service life of plan members for each respective plan.
| | |
| 56 | | Consolidated Financial Statements, 2015–2016 |
Liabilities for selected employee future benefits (such as pensions, other retirement benefits and termination pay) represent the government’s share of the actuarial present values of benefits attributed to services rendered by employees and former employees, less its share of the assets of the plans. In addition, the liability includes the Province’s share of the unamortized balance of actuarial gains or losses, and other adjustments primarily for differences between the fiscal year-end of the pension plans and that of the Province.
The Province has legislated the accounting required when a pension plan is in an asset position on the financial statements such that the asset is determined to have NIL value (see Note 18).
Assets
Assets are resources controlled by the government from which it has reasonable expectation of deriving future benefit. Assets are recognized in the year the transaction or event gives rise to the government’s control of the benefit.
Financial Assets
Financial assets are resources that can be used to discharge existing liabilities or finance future operations. They include cash and cash equivalents, investments, accounts receivable, loans receivable, advances and investments in government business enterprises.
Investments include temporary investments and portfolio investments. Temporary investments are recorded at the lower of cost or market value. Portfolio investments are recorded at the lower of cost or their estimated net realizable value.
Accounts receivables are recorded at cost. A valuation allowance is recorded when collection of the receivable is considered doubtful.
Loans receivable include loans to GBEs and loans under the student loans program and advanced manufacturing investment program. Loans receivable with significant concessionary terms are considered in part to be grants and are recorded on the date of issuance at face value discounted by the amount of the grant portion. The grant portion is recognized as an expense at the date of issuance of the loan or when the concession is provided. The amount of the loan discount is amortized to revenue over the term of the loan.
Investment in GBEs represents the net assets of GBEs recorded on the modified equity basis as described under Principles of Consolidation.
Tangible Capital Assets
Tangible capital assets are recorded at historical cost less accumulated amortization. Historical cost includes the costs directly related to the acquisition, design, construction, development, improvement or betterment of tangible capital assets. Cost includes overheads directly attributable to construction and development, as well as interest related to financing during construction. Tangible capital assets, except land, are amortized over the estimated useful lives of the assets on a straight-line basis.
| | | | |
| Consolidated Financial Statements, 2015–2016 | | | 57 | |
Maintenance and repair costs are recognized as an expense when incurred. Betterments or improvements that significantly increase or prolong the service life or capacity of a tangible capital asset are capitalized. External contributions for acquisition of tangible capital assets are recorded as deferred capital contributions and amortized to revenue consistent with the amortization to expense of the related tangible capital assets, reflecting the intent of the external contributors that the grants be used to construct or acquire assets that will provide public services over the useful lives of the underlying assets.
2. Debt
The Province borrows in both domestic and international markets. Debt of $327.4 billion, as at March 31, 2016 (2015, $315.0 billion), is composed mainly of bonds and debentures issued in the short- and long-term domestic- and international-public capital markets and non-public debt held by certain federal and provincial public-sector pension funds. Debt comprises Debt Issued for Provincial Purposes of $303.1 billion (2015, $289.6 billion) and Ontario Electricity Financial Corporation (OEFC) Debt of $24.4 billion (2015, $25.3 billion). The following table presents the maturity schedule of the Province’s outstanding debt, by currency of repayment, expressed in Canadian dollars, and reflects the effects of related derivative contracts.
| | |
| 58 | | Consolidated Financial Statements, 2015–2016 |
| | | | | | | | | | | | | | | | | | | | | | | | | | | | |
| Debt | | | | | | | | | | | | | | | | | | | | | |
| As at March 31 | | | | | | | | | | | | | | | | | | | | | |
($ Millions) | | | | | | | | | | | | | | | | | 2016 | | | 2015 | |
| | | Canadian | | | U.S. | | | Japanese | | | | | | Other | | | | | | | |
Currency | | Dollar | | | Dollar | | | Yen | | | Euro | | | Currencies1 | | | Total | | | Total | |
Maturing in: | | | | | | | | | | | | | | | | | | | | | | | | | | | | |
2016 | | | — | | | | — | | | | — | | | | — | | | | — | | | | — | | | $ | 42,819 | |
2017 | | | 25,167 | | | | 17,086 | | | | — | | | | — | | | | 499 | | | $ | 42,752 | | | | 21,583 | |
2018 | | | 12,227 | | | | 5,183 | | | | — | | | | 385 | | | | — | | | | 17,795 | | | | 17,648 | |
2019 | | | 12,144 | | | | 9,556 | | | | 76 | | | | — | | | | 576 | | | | 22,352 | | | | 17,683 | |
2020 | | | 15,312 | | | | 3,746 | | | | — | | | | 4,811 | | | | 532 | | | | 24,401 | | | | 24,280 | |
2021 | | | 14,138 | | | | 4,662 | | | | 425 | | | | 1,651 | | | | 1,046 | | | | 21,922 | | | | — | |
| | | | | | | | | | | | | | | | | | | | | | | | | | | | |
1–5 years | | | 78,988 | | | | 40,233 | | | | 501 | | | | 6,847 | | | | 2,653 | | | | 129,222 | | | | 124,013 | |
6–10 years | | | 71,248 | | | | 5,160 | | | | — | | | | 5,326 | | | | 604 | | | | 82,338 | | | | 78,886 | |
11–15 years | | | 14,598 | | | | — | | | | — | | | | — | | | | — | | | | 14,598 | | | | 20,739 | |
16–20 years | | | 17,732 | | | | — | | | | — | | | | — | | | | — | | | | 17,732 | | | | 10,210 | |
21–25 years | | | 27,879 | | | | — | | | | — | | | | — | | | | — | | | | 27,879 | | | | 34,648 | |
26–502 years | | | 55,564 | | | | — | | | | — | | | | 80 | | | | — | | | | 55,644 | | | | 46,464 | |
| | | | | | | | | | | | | | | | | | | | | | | | | | | | |
Total3, 4 | | | 266,009 | | | | 45,393 | | | | 501 | | | | 12,253 | | | | 3,257 | | | $ | 327,413 | | | $ | 314,960 | |
| | | | | | | | | | | | | | | | | | | | | | | | | | | | |
Debt Issued for Provincial Purposes5 | | | 242,837 | | | | 45,024 | | | | 501 | | | | 12,074 | | | | 2,619 | | | | 303,055 | | | | 289,619 | |
OEFC Debt | | | 23,172 | | | | 369 | | | | — | | | | 179 | | | | 638 | | | | 24,358 | | | | 25,341 | |
| | | | | | | | | | | | | | | | | | | | | | | | | | | | |
Total | | | 266,009 | | | | 45,393 | | | | 501 | | | | 12,253 | | | | 3,257 | | | $ | 327,413 | | | $ | 314,960 | |
| | | | | | | | | | | | | | | | | | | | | | | | | | | | |
Effective Interest Rates (Weighted Average) | | | | | | | | | | | | | | | | | | | | | | | | | | | | |
2016 | | | 3.92 | % | | | 1.98 | % | | | 2.06 | % | | | 3.37 | % | | | 3.71 | % | | | 3.62 | % | | | — | |
2015 | | | 4.03 | % | | | 2.28 | % | | | 1.99 | % | | | 3.48 | % | | | 3.80 | % | | | — | | | | 3.73 | % |
| 1 | Other currencies comprise the Australian dollar, Swiss franc and South African rand. |
| 2 | The longest term to maturity is to June 2, 2062. |
| 3 | Total foreign currency-denominated debt as at March 31, 2016, was $61.4 billion (2015, $66.0 billion). Of that, $60.4 billion or 98.4 per cent (2015, $65.0 billion or 98.6 per cent) was fully hedged to Canadian dollars. The remaining 1.6 per cent (2015, 1.4 per cent) of foreign debt was unhedged as follows: $425 million (2015, $389 million) Japanese yen-denominated debt, $540 million (2015, $547 million) Swiss franc-denominated debt and $2 million (2015, nil) Euro-denominated debt. Unhedged foreign currency debt as a percentage of total debt was 0.3% (2015, 0.3%). |
| 4 | Total debt includes issues totalling $0.5 billion (2015, $0.5 billion), which have embedded options exercisable by either the Province or the bondholder under specific conditions. |
| 5 | As at March 31, 2016, debt issued for provincial purposes purchased and held by the Province denominated in Canadian and U.S. dollars at its Canadian dollar equivalent, includes long-term debt of $4.3 billion (2015, $2.2 billion) and $1.3 billion (2015, $0.5 billion), and short-term debt of $2.0 billion (2015, $1.2 billion) and nil (2015, nil). |
| | | | |
| Consolidated Financial Statements, 2015–2016 | | | 59 | |
| | | | | | | | |
| Debt | | | | |
| As at March 31 | | | | |
($ Millions) | | 2016 | | | 2015 | |
Debt Payable to/of: | | | | | | | | |
Public Investors | | $ | 315,443 | | | $ | 302,644 | |
Canada Pension Plan Investment Board | | | 10,233 | | | | 10,233 | |
Ontario Immigrant Investor Corporation | | | 709 | | | | 959 | |
School Board Trust Debt | | | 674 | | | | 696 | |
Canada Mortgage and Housing Corporation | | | 354 | | | | 428 | |
| | | | | | | | |
Total | | $ | 327,413 | | | $ | 314,960 | |
| | | | | | | | |
Fair value of debt outstanding approximates the amounts at which debt instruments could be exchanged in a current transaction between willing parties. In valuing the Province’s debt, fair value is estimated using discounted cash flows and other valuation techniques and is compared to public market quotations where available. These estimates are affected by the assumptions made concerning discount rates and the amount and timing of future cash flows.
The estimated fair value of debt as at March 31, 2016, was $375.6 billion (2015, 374.8 billion). This is higher than the book value of $327.4 billion (2015, $315.0 billion) because current interest rates are generally lower than the interest rates at which some of the debt was issued. The fair value of debt does not reflect the effect of related derivative contracts.
School Board Trust Debt
A School Board Trust was created in June 2003 to permanently refinance debt incurred by 55 school boards. The Trust issued 30-year sinking fund debentures amounting to $891 million, and provided $882 million of the proceeds to the 55 school boards in exchange for the irrevocable right to receive future transfer payments from the Province related to this debt. An annual transfer payment is made by the Ministry of Education to the Trust’s sinking fund under the School Board Operating Grant program to retire the debt over 30 years. This debt, recorded net of the sinking fund, is reflected in the Province’s debt.
3. Risk Management and Derivative Financial Instruments
The Province employs various risk management strategies and operates within strict risk exposure limits to ensure that exposure to financial risk is managed in a prudent and cost-effective manner. A variety of strategies are used, including the use of derivative financial instruments (“derivatives”).
| | |
| 60 | | Consolidated Financial Statements, 2015–2016 |
Derivatives are financial contracts, the value of which is derived from underlying instruments. The Province uses derivatives to hedge and to minimize interest cost volatility. Hedges are created primarily through swaps, which are legal contracts under which the Province agrees with another party to exchange cash flows based on one or more notional amounts using stipulated reference interest rates for a specified period. Swaps allow the Province to offset its existing obligations and thereby effectively convert them into obligations with more cost-effective characteristics. Other derivative instruments used by the Province include forward foreign exchange contracts, forward rate agreements, futures and options.
Foreign exchange or currency risk is the risk that foreign currency debt principal and interest payments and foreign currency transactions will vary in Canadian dollar terms due to fluctuations in foreign exchange rates. To manage currency risk, the Province uses derivative contracts including forward foreign exchange contracts, futures, options and swaps to convert foreign currency cash flows into Canadian dollar cash flows. Most of the derivative contracts hedge the underlying debt by matching all the critical terms to achieve effectiveness. In instances where the term of forward foreign exchange contracts used for hedging is shorter than the term of the underlying debt, hedge effectiveness is maintained by continuously rolling the forward foreign exchange contract over the remaining term of the underlying debt, or until replaced with a long-term derivative contract.
The current market risk policy allows the amount of unhedged foreign currency debt principal net of foreign currency holdings to reach a maximum of 5 per cent of Total Debt Issued for Provincial Purposes and OEFC. At March 31, 2016, the respective unhedged levels were 0.3 and nil per cent (2015, 0.3 and nil per cent). As of March 31, 2016, unhedged debt was limited to debt issued in Japanese yen, Swiss francs and Euros. A one-Japanese yen appreciation of the Japanese currency, relative to the Canadian dollar, would result in unhedged debt denominated in Japanese yen increasing by $5.0 million (2015, $4.2 million) and a corresponding increase in interest on debt of $1.3 million (2015, $1.0 million). A one-Swiss rappen appreciation of the Swiss currency, relative to the Canadian dollar, would result in unhedged debt denominated in Swiss francs increasing by $7.4 million (2015, $7.2 million) and a corresponding increase in interest on debt of $2.1 million (2015, $1.8 million). Total foreign exchange gains/losses recognized in the Statement of Operations for 2015–16 were losses of $5.1 million (2014–15, gains of $63.9 million).
Interest on debt expense may also vary as a result of changes in interest rates. In respect of Debt Issued for Provincial Purposes and OEFC debt, the risk is measured as interest rate resetting risk, which is the floating rate exposure plus fixed rate debt maturing within the next 12-month period net of liquid reserves as a percentage of Debt Issued for Provincial Purposes and OEFC debt, respectively.
| | | | |
| Consolidated Financial Statements, 2015–2016 | | | 61 | |
The current market risk policy limits net interest rate resetting risk for Debt Issued for Provincial Purposes and OEFC debt to a maximum of 35 per cent. At March 31, 2016, the net interest rate resetting risk for Debt Issued for Provincial Purposes and OEFC debt was 10.9 per cent and 7.6 per cent, respectively (2015, 11.0 per cent and 20.4 per cent). Based on net floating rate exposure at March 31, 2016, plus planned refinancing of maturing fixed rate debt to March 31, 2017, a one per cent (100 basis point) increase in interest rates would result in an increase in interest on debt of approximately $350 million (2015, $377 million).
Liquidity risk is the risk that the Province will not be able to meet its current short-term financial obligations. To reduce liquidity risk, the Province maintains liquid reserves: that is, cash and temporary investments (Note 8), adjusted for collateral (Note 13), at levels that are expected to meet future cash requirements and give the Province flexibility in the timing of issuing debt. Pledged assets are considered encumbered for liquidity purposes while collateral held that can be sold or repledged is a source of liquidity. In addition, the Province has short-term note programs as alternative sources of liquidity.
The table below presents a maturity schedule of the Province’s derivatives, by type, outstanding as at March 31, 2016, based on the notional amounts of the contracts. Notional amounts represent the volume of outstanding derivative contracts and are not indicative of credit risk, market risk or actual cash flows.
| | | | | | | | | | | | | | | | | | | | | | | | | | | | | | | | | | | | | | | | | | | | |
| Derivative Portfolio Notional Value and Fair Value of Derivatives | | | | | | | | | | |
| As at March 31 | | | | | | | | | | | | | | | | | | Notional Value | | | Fair Value | |
($ Millions) | | | | | | | | | | | | | | | | | | | | | | | 2016 | | | 2015 | | | 2016 | | | 2015 | |
Maturity in Fiscal Year | | 2017 | | | 2018 | | | 2019 | | | 2020 | | | 2021 | | | 6–10
Years | | | Over
10
Years | | | Total | | | Total | | | Total | | | Total | |
Swaps: | | | | | | | | | | | | | | | | | | | | | | | | | | | | | | | | | | | | | | | | | | | | |
Interest Rate1 | | | 27,955 | | | | 12,131 | | | | 16,311 | | | | 13,482 | | | | 8,958 | | | | 14,380 | | | | 7,582 | | | | 100,799 | | | | 112,466 | | | | (2,589 | ) | | | (2,747 | ) |
Cross Currency | | | 10,036 | | | | 4,567 | | | | 4,528 | | | | 11,998 | | | | 8,096 | | | | 8,320 | | | | 80 | | | | 47,625 | | | | 53,214 | | | | 6,366 | | | | 6,196 | |
Forward Foreign Exchange Contracts | | | 31,027 | | | | — | | | | — | | | | — | | | | — | | | | — | | | | — | | | | 31,027 | | | | 31,958 | | | | (1,776 | ) | | | 362 | |
Swaptions2 | | | 500 | | | | — | | | | — | | | | — | | | | — | | | | — | | | | — | | | | 500 | | | | 500 | | | | — | | | | 2 | |
| | | | | | | | | | | | | | | | | | | | | | | | | | | | | | | | | | | | | | | | | | | | |
Total | | $ | 69,518 | | | $ | 16,698 | | | $ | 20,839 | | | $ | 25,480 | | | $ | 17,054 | | | $ | 22,700 | | | $ | 7,662 | | | $ | 179,951 | | | $ | 198,138 | | | $ | 2,001 | | | $ | 3,813 | |
| | | | | | | | | | | | | | | | | | | | | | | | | | | | | | | | | | | | | | | | | | | | |
| 1 | Includes $4.0 billion (2015, $4.3 billion) of interest rate swaps related to loans receivable held by a consolidated entity and $4.9 billion (2015, $2.0 billion) related to short-term investments held by the Province. |
| 2 | See glossary for definition. |
The use of derivatives introduces credit risk, which is the risk of a counterparty defaulting on contractual derivative obligations in which the Province has an unrealized gain. The table below presents the credit risk associated with the derivative financial instrument portfolio, measured through the replacement value of derivative contracts, as at March 31, 2016.
| | |
| 62 | | Consolidated Financial Statements, 2015–2016 |
| | | | | | | | |
| Credit Risk Exposure | | | | | | |
| As at March 31 | | | | | | |
($ Millions) | | 2016 | | | 2015 | |
Gross Credit Risk Exposure | | $ | 9,774 | | | $ | 10,861 | |
Less: Netting | | | (7,252 | ) | | | (6,739 | ) |
| | | | | | | | |
Net Credit Risk Exposure | | | 2,522 | | | | 4,122 | |
| | | | | | | | |
Less: Collateral Received (Note 13) | | | (1,712 | ) | | | (3,277 | ) |
| | | | | | | | |
Net Credit Risk Exposure (Net of Collateral) | | $ | 810 | | | $ | 845 | |
| | | | | | | | |
The Province manages its credit risk exposure from derivatives by, among other things, dealing only with high-credit-quality counterparties and regularly monitoring compliance to credit limits. In addition, the Province enters into contractual agreements (“master agreements”) that provide for termination netting and, if applicable, payment netting with most of its counterparties. Gross Credit Risk Exposure represents the loss that the Province would incur if every counterparty to which the Province had credit risk exposure were to default at the same time, and the contracted netting provisions were not exercised or could not be enforced. Net Credit Risk Exposure is the loss including the mitigating impact of these netting provisions. Net Credit Risk Exposure (Net of Collateral) is the potential loss to the Province further mitigated by the collateral received from counterparties.
4. Other Long-Term Financing
Other long-term financing comprises the total debt of the BPS organizations and obligations under AFP arrangements.
Other Long-Term Financing of $14.1 billion, as at March 31, 2016 (2015, $13.9 billion) includes BPS debt of $5.0 billion (2015, $5.5 billion), BPS AFP obligations of $5.4 billion (2015, $5.5 billion) and direct provincial AFP obligations of $3.7 billion (2015, $2.9 billion).
| | | | |
| Consolidated Financial Statements, 2015–2016 | | | 63 | |
5. Deferred Revenue and Capital Contributions
In 2010–11, the Province renewed its long-standing business partnership with Teranet Inc. by extending Teranet’s exclusive licences to provide electronic land registration and writs services in Ontario for an additional 50 years. The Province received approximately a $1.0 billion upfront payment for the transaction, which is amortized into revenue over the life of the contract.
The Province provides a two-year vehicle licence plate renewal option and multi-year driver licence renewals (two years for seniors and five years for all others). Amounts received under these multi-year renewals are recognized as revenue over the periods covered by the licences.
Deferred capital contributions represent the unamortized portion of tangible capital assets or liabilities to construct or acquire tangible capital assets from specific-purpose funding received from the Government of Canada, municipalities or third parties. Deferred capital contributions are recorded in revenue over the estimated useful life of the underlying tangible capital asset when the tangible capital asset is placed in service.
| | | | | | | | |
| Deferred Revenue and Capital Contributions | | | | | | |
| As at March 31 | | | | | | |
($ Millions) | | 2016 | | | 2015 | |
Deferred Revenue: | | | | | | | | |
Teranet | | $ | 923 | | | $ | 956 | |
Vehicle and Driver Licences | | | 972 | | | | 908 | |
Other | | | 1,973 | | | | 1,917 | |
| | | | | | | | |
Total Deferred Revenue | | | 3,868 | | | | 3,781 | |
| | | | | | | | |
Deferred Capital Contributions1 | | | 6,911 | | | | 6,329 | |
| | | | | | | | |
Total | | $ | 10,779 | | | $ | 10,110 | |
| | | | | | | | |
| 1 | Federal transfers have been reclassified to deferred capital contributions. |
| | |
| 64 | | Consolidated Financial Statements, 2015–2016 |
6. Pensions and Other Employee Future Benefits
| | | | | | | | | | | | | | | | |
| Pensions and Other Employee Future Benefits Liability (Asset) | | | | | | | |
| As at March 31 | | | | | | | | | | | | |
($ Millions) | | 2016 | | | 2016 | | | 2016 | | | 2015 | |
| | | Pensions | | | Other Employee
Future Benefits | | | Total | | | Total | |
Obligation for benefits | | $ | 117,542 | | | $ | 10,999 | | | $ | 128,541 | | | $ | 124,726 | |
Less: plan fund assets | | | (141,749 | ) | | | (562 | ) | | | (142,311 | ) | | | (129,880 | ) |
Unamortized actuarial gains | | | 12,649 | | | | 305 | | | | 12,954 | | | | 6,084 | |
Adjustments1 | | | 2,246 | | | | 9 | | | | 2,255 | | | | 2,221 | |
| | | | | | | | | | | | | | | | |
Accrued liability (asset) | | | (9,312 | ) | | | 10,751 | | | | 1,439 | | | | 3,151 | |
Valuation Allowance2 | | | 10,668 | | | | — | | | | 10,668 | | | | — | |
| | | | | | | | | | | | | | | | |
Total | | $ | 1,356 | | | $ | 10,751 | | | $ | 12,107 | | | $ | 3,151 | |
| | | | | | | | | | | | | | | | |
| 1 | Adjustments for pensions consist of: |
| | i) | differences for amounts reported by the pension plans at December 31, instead of the Province’s year-end of March 31; |
| | ii) | unamortized difference between employer and employee contributions for jointly sponsored pension plans; and |
| | iii) | amounts payable by the Province that are reflected as contributions in the pension plan assets. |
| 2 | Valuation allowances are related to the pension assets for the Ontario Teachers’ Pension Plan and for the OPSEU Pension Plan (Note 18). |
Information on pension plans with accrued benefit obligation in excess of plan fund assets is as follows:
| | | | | | | | |
| Pensions Benefit Plans | | | | | | |
| As at March 31 | | | | | | |
($ Millions) | | 2016 | | | 2015 | |
Obligation for benefits | | $ | 26,607 | | | $ | 25,547 | |
Less: plan fund assets | | | (25,919 | ) | | | (24,144 | ) |
| | | | | | | | |
Plan Liability | | $ | 688 | | | $ | 1,403 | |
| | | | | | | | |
| | | | |
| Consolidated Financial Statements, 2015–2016 | | | 65 | |
| | | | | | | | | | | | | | | | |
| Pensions and Other Employee Future Benefits Expense | | | | | | | |
| For the year ended March 31 | | | | | | | | | | | | |
($ Millions) | | 2016 | | | 2016 | | | 2016 | | | 2015 | |
| | | Pensions | | | Other Employee
Future Benefits | | | Total | | | Total | |
Cost of benefits | | $ | 2,265 | | | $ | 240 | | | $ | 2,505 | | | $ | 2,542 | |
Amortization of actuarial (gains) losses | | | (145 | ) | | | (2 | ) | | | (147 | ) | | | 106 | |
Employee contributions | | | (318 | ) | | | — | | | | (318 | ) | | | (310 | ) |
Gain on plan amendment or curtailment | | | — | | | | (98 | ) | | | (98 | ) | | | (39 | ) |
Recognition of unamortized experience gains | | | — | | | | (22 | ) | | | (22 | ) | | | (5 | ) |
Interest (income) expense | | | (870 | ) | | | 238 | | | | (632 | ) | | | (333 | ) |
Adjustments1 | | | (126 | ) | | | — | | | | (126 | ) | | | (126 | ) |
Valuation Allowance4 | | | 1,514 | | | | — | | | | 1,514 | | | | — | |
| | | | | | | | | | | | | | | | |
Total2,3 | | $ | 2,320 | | | $ | 356 | | | $ | 2,676 | | | $ | 1,835 | |
| | | | | | | | | | | | | | | | |
| 1 | Adjustments for pensions consist of amortization of: |
| | i) | the difference between employer and employee contributions for jointly sponsored pension plans; and |
| | ii) | employee contribution reductions for solely sponsored plans. |
| 2 | Total Pensions and Other Employee Future Benefits Expense is reported in Schedule 3. The Teachers’ Pension expense of $1,590 million (2014–15, $564 million) is included in the Education expense in the Consolidated Statement of Operations and is disclosed separately in Schedule 4. The Public Service and OPSEU Pension expense of $730 million (2014–15, $787 million) and Other Employee Future Benefits — Retirement Benefits expense of $393 million (2014–15, $319 million) are included in the General Government and Other expense in the Consolidated Statement of Operations, and is under Employee and Pensioner Benefits in Schedule 4.The remainder of Other Employee Future Benefits expense is included in the relevant ministries’ expenses in Schedule 4. |
| 3 | The Pensions and Other Employee Future Benefits Expenses for the hospitals, school boards and colleges sectors (except for the Ontario Teachers’ Pension Plan [OTPP]) are not included in the table above. The expenses for HOOPP of $747 million (2014–15, $843 million) and CAATPP of $190 million (2014–15, $199 million) are included in the Salaries, Wages and Benefits expenses of the hospitals and colleges sectors, respectively (Schedule 10) and in the expenses of the BPS ministries (Education, Health and Long-Term Care, and Training, Colleges and Universities) in Schedule 4. |
| 4. | Valuation allowances are related to the pension assets for the Ontario Teachers’ Pension Plan and for the OPSEU Pension Plan (Note 18). |
Pensions
The Province sponsors several pension plans. It is the sole sponsor of the Public Service Pension Plan (PSPP) and joint sponsor of the Ontario Public Service Employees Union (OPSEU) Pension Plan and the Ontario Teachers’ Pension Plan (OTPP).
These three plans are contributory defined benefit plans that provide Ontario government employees and elementary and secondary school teachers and administrators with a guaranteed amount of retirement income. Benefits are based primarily on the best five-year average salary of members and their length of service, and are indexed to changes in the Consumer Price Index to provide protection against inflation. Plan members normally contribute 7 to 11 per cent of their salaries to these plans. The Province matches these contributions.
| | |
| 66 | | Consolidated Financial Statements, 2015–2016 |
The Province is also responsible for sponsoring the Public Service Supplementary Benefits Plan and the Ontario Teachers’ Retirement Compensation Arrangement. Expenses and liabilities of these plans are included in the Pensions Expense and Pensions Liability reported in the above tables.
In addition to the Provincial sponsored plans, pension benefits for employees in the hospital and colleges sectors are provided by the Healthcare of Ontario Pension Plan (HOOPP) and the Colleges of Applied Arts and Technology Pension Plan (CAATPP) respectively, and are included in these financial statements.
HOOPP is a multi-employer pension plan covering employees of Ontario’s health care community. CAATPP is a multi-employer pension plan covering employees of the Colleges of Applied Arts and Technology in Ontario, the Board of Trustees, the Ontario College Application Services and the Ontario College Library Services. Both of these plans are accounted for as joint contributory defined benefit plans that provide eligible members with a retirement income based on a formula that takes into account a member’s earnings history and length of service in the plan. The plans are financed by contributions from participating members and employers, and by investment earnings. Because organizations covered under these plans are in the government’s reporting entity, the Province includes 56 per cent of BPS organizations’ portion1 of the net obligation of HOOPP and includes 50 per cent of the net obligation of CAATPP.
The obligation for benefits and plan fund assets of the above plans is based on actuarial accounting valuations that are performed annually. Funding of these plans is based on statutory actuarial funding valuations undertaken at least once every three years.
| 1 | BPS organizations are represented in HOOPP at 85 per cent in 2015–16 (2014–15, 84 per cent). |
| | | | |
| Consolidated Financial Statements, 2015–2016 | | | 67 | |
Information on contributory defined benefit plans is as follows:
| | | | | | | | | | | | | | | | | | | | |
| | | OTPP | | | PSPP | | | OPSEU | | | HOOPP1 | | | CAATPP | |
Government’s Best Estimates as of December 31, 2015 | | | | | | | | | | | | | |
Inflation rate | | | 2.00 | % | | | 2.00 | % | | | 2.00 | % | | | 2.00 | % | | | 2.00 | % |
Salary escalation rate | | | 3.00 | % | | | 3.00 | % | | | 3.00 | % | | | 4.25 | % | | | 3.00 | % |
Discount rate and expected rate of return on pension assets | | | 6.25 | % | | | 6.00 | % | | | 6.25 | % | | | 5.75 | % | | | 6.00 | % |
Actual return on pension assets | | | 13.00 | % | | | 6.14 | % | | | 8.00 | % | | | 5.12 | % | | | 8.10 | % |
| | | | | | | | | | | | | | | | | | | | |
Accounting Actuarial Valuation as of December 31, 2015 | | | | | | | | | | | | | | | | | | | | |
Market value of pension fund assets ($ millions) | | | 171,440 | | | | 23,075 | | | | 18,399 | | | | 63,924 | | | | 8,592 | |
Employer contributions2 ($ millions) | | | 1,600 | | | | 361 | | | | 214 | | | | 930 | | | | 202 | |
Employee contributions3 ($ millions) | | | 1,615 | | | | 318 | | | | 241 | | | | 911 | | | | 206 | |
Benefit payments (including transfers to other plans)
($ millions) | | | 5,548 | | | | 1,176 | | | | 897 | | | | 1,924 | | | | 410 | |
Number of active members (approximately) | | | 183,000 | | | | 42,000 | | | | 44,000 | | | | 196,000 | | | | 26,000 | |
Average age of active members | | | 42.5 | | | | 45.6 | | | | 46.1 | | | | 44.8 | | | | 48.0 | |
Expected remaining service life of the employees (years) | | | 15.3 | | | | 10.8 | | | | 12.2 | | | | 12.8 | | | | 13.7 | |
Number of pensioners including survivors (approximately) | | | 133,000 | | | | 36,000 | | | | 34,000 | | | | 87,000 | | | | 14,000 | |
| | | | | | | | | | | | | | | | | | | | |
Government’s Best Estimates as of December 31, 2014 | | | | | | | | | | | | | | | | | | | | |
Inflation rate | | | 2.25 | % | | | 2.25 | % | | | 2.25 | % | | | 2.25 | % | | | 2.25 | % |
Salary escalation rate | | | 3.25 | % | | | 3.25 | % | | | 3.25 | % | | | 4.50 | % | | | 3.25 | % |
Discount rate and expected rate of return on pension assets | | | 6.50 | % | | | 6.25 | % | | | 6.50 | % | | | 6.00 | % | | | 6.25 | % |
| | | | | | | | | | | | | | | | | | | | |
Accounting Actuarial Valuation as of December 31, 2014 | | | | | | | | | | | | | | | | | | | | |
Market value of pension fund assets ($ millions) | | | 154,476 | | | | 22,231 | | | | 17,481 | | | | 60,848 | | | | 7,965 | |
Employer contributions2 ($ millions) | | | 1,531 | | | | 355 | | | | 218 | | | | 899 | | | | 196 | |
Employee contributions3 ($ millions) | | | 1,578 | | | | 310 | | | | 248 | | | | 889 | | | | 202 | |
Benefit payments (including transfers to other plans)
($ millions) | | | 5,315 | | | | 1,083 | | | | 798 | | | | 1,702 | | | | 372 | |
| 1 | HOOPP employer contributions only include the BPS organizations. The market value of pension fund assets, benefit payments (including transfers to other plans), employee contributions, number of active members, average age of active members, and number of pensioners including survivors, represent the entire HOOPP plan, including non-BPS organizations. |
| 2 | Employer contributions paid during the Province’s fiscal year. Employer contributions excludes other employers’ contributions made by agencies participating in PSPP and OPSEU, and excludes other employers’ contributions to OTPP. PSPP employer contributions include special payments of $99 million (2014–15, $99 million). |
| 3 | Employee contributions paid during the calendar year. |
| | |
| 68 | | Consolidated Financial Statements, 2015–2016 |
Other Employee Future Benefits
Other Employee Future Benefits are non-pension retirement benefits, post-employment benefits, compensated absences and termination benefits.
Non-Pension Retirement Benefits
The Province provides dental, basic life insurance, supplementary health and hospital benefits to retired employees through a self-insured, unfunded defined benefit plan. Changes to eligibility criteria and premium cost-sharing terms announced in 2014 will take effect as of January 1, 2017. Certain Public Service Pension Plan members, and OPSEU Pension Plan members who do not meet the current 10-year eligibility criteria by January 1, 2017, would be required to have 20 years of pension service and retire to an immediate unreduced pension to be eligible to receive the post-retirement insured benefits. Further, any eligible members who commence receipt of a pension on or after January 1, 2017, would be required to pay 50 per cent of the premium costs in order to participate in the post-retirement insured benefits plan.
Notwithstanding the changes described in the previous paragraph, an arbitration decision resulting from the Association of Law Officers of the Crown/Ontario Crown Attorneys Associations (ALOC/OCAA) policy grievance precluded the application of these announced changes to associations’ members for the balance of the term of the current collective agreement. In addition, in 2015–16, the Province updated the OPSEU retiree’s supplementary health benefits to align with changes negotiated for active OPSEU members. These two amendments resulted in a $30 million past service cost that is included in the results for the 2015–16 fiscal year.
The liability for non-pension retirement benefits of $8.3 billion as at March 31, 2016 (2015, $8.1 billion), is included in the Other Employee Future Benefits Liability. The expense for 2015–16 of $393 million (2014–15, $319 million) (excluding the expense for BPS organizations) is included in the Other Employee Future Benefits Expense. The BPS expense of $29 million in 2015–16 (2014–15, $41 million) is included in the Salaries, Wages and Benefits expense of BPS organizations (Schedule 10) and in the expenses of the related ministries (Schedule 4).
The discount rate used in the non-pension retirement benefits calculation for 2015–16 is 3.40 per cent (2014–15, 3.70 per cent). The discount rate used by BPS organizations in the non-pension retirement benefits calculation for 2015–16 ranges from 2.35 per cent to 5.75 per cent (2014–15, 2.80 per cent to 5.75 per cent).
Post-Employment Benefits, Compensated Absences and Termination Benefits
The Province provides, on a self-insured basis, workers’ compensation benefits, long-term disability benefits and regular benefits to employees who are on long-term disability.
| | | | |
| Consolidated Financial Statements, 2015–2016 | | | 69 | |
In 2015, the Province eliminated termination pay entitlement upon retirement for the Ontario Public Service Employee Union (OPSEU) employees hired on or after January 1, 2013. For current OPSEU employees who retire after December 31, 2016, service accrued will be capped up to December 31, 2016, and any termination payments on retirement after January 1, 2016, will be paid based on salary in effect on December 31, 2016. A plan curtailment gain of $128 million and recognition of net unamortized gains of $22 million are included in the fiscal year 2015–16 Other Employee Future Benefits.
During the previous year, the Province eliminated severance entitlement upon retirement for the Association of Management, Administrative and Professional Crown Employees of Ontario (AMAPCEO) employees hired on or after April 1, 2014. For current AMAPCEO employees who retire after January 1, 2016, service accrued will be capped up to December 31, 2015, and any termination payments on retirement after January 1, 2016, will be paid based on salary in effect on December 31, 2015. A plan curtailment gain of $39 million and recognition of net unamortized gains of $5 million is included in fiscal year 2014–15 Other Employee Future Benefits.
For all other employees subject to terms set out in collective agreements, with the exception of management-excluded staff who have completed five years of service, the Province provides termination pay equal to one week’s salary for each year of service up to a maximum of 50 per cent of their annual salary. Employees who have completed one year of service but less than five years are also entitled to termination pay in the event of death, retirement or release from employment. All employees who resign are not eligible for any severance pay in respect to service after December 2011.
The total post-employment benefits liability of $2.5 billion as at March 31, 2016 (2015, $2.7 billion), is included in the Other Employee Future Benefits Liability. The total post-employment benefits recovery of $37 million in 2015–16 (2014–15, $165 million post-employment benefit expense, excluding the expense for BPS organizations) is included in the Other Employee Future Benefits Expense. The BPS post-employment benefits expense of $471 million in 2015–16 (2014–15, $527 million) is included in the Salaries, Wages and Benefits expense of BPS organizations (Schedule 10) and in the expenses of the related ministries (Schedule 4).
The discount rate used in the post-employment benefits, compensated absences and termination benefits calculations for 2015–16 is 2.70 per cent (2014–15, 3.15 per cent). The discount rate used by BPS organizations in the post-employment benefits for 2015–16 ranges from 2.35 per cent to 6.75 per cent (2014–15, 2.75 per cent to 8.00 per cent).
| | |
| 70 | | Consolidated Financial Statements, 2015–2016 |
7. Other Liabilities
| | | | | | | | |
Other Liabilities As at March 31 | | | | | | |
($ Millions) | | 2016 | | | 2015 | |
Power Purchase Contracts | | $ | 307 | | | $ | 479 | |
Liabilities for Contaminated Sites | | | 1,751 | | | | 1,792 | |
Other Funds and Liabilities | | | 2,847 | | | | 2,607 | |
| | | | | | | | |
Total | | $ | 4,905 | | | $ | 4,878 | |
| | | | | | | | |
Power Purchase Contracts
Power supply contracts include both power purchase contracts and power supply support agreements. Power purchase contracts and related loan agreements were entered into by the former Ontario Hydro with non-utility generators (NUGs) located in Ontario. As the legal continuation of Ontario Hydro, Ontario Electricity Financial Corporation (OEFC), a consolidated government organization, is the counterparty to these contracts. The contracts, expiring on various dates to 2048, provided for the purchase of power at prices that were expected to be in excess of the future market price. Accordingly, a liability was recorded at $4.3 billion on a discounted cash-flow basis when Ontario Hydro was continued as OEFC on April 1, 1999.
Under legislated reforms to the electricity market, OEFC began receiving actual contract prices for power from ratepayers effective January 1, 2005, and no longer incurs losses on these contracts. At that time, the Ministry of Finance estimated the bulk of the liability would be eliminated over 12 years as existing electricity contracts expire. As a result, the OEFC is amortizing the bulk of the liability to revenue over that period. The decrease in the liability for power purchase contracts was $172 million (2014–15, $217 million), resulting in a liability of $307 million as at March 31, 2016 (2015, $479 million).
In addition, effective January 1, 2009, OEFC entered into a support contract, the Contingency Support Agreement (CSA), with Ontario Power Generation Inc. (OPG), whereby OPG agreed to maintain the reliability and availability of Lambton and Nanticoke coal-fired stations following implementation of a greenhouse gas emissions-reduction strategy. Under the contract, OEFC agreed to ensure OPG would recover the actual costs of operating the stations after implementing this strategy. Any costs to OEFC under this agreement are fully recovered from electricity ratepayers. As at December 31, 2013, OEFC triggered an early termination clause in the CSA to reflect the advanced closure of these plants by one year to the end of 2013. OPG is allowed to recover actual costs that cannot reasonably be avoided or mitigated, during the period from the early shutdown date until December 31, 2014, consistent with the original end date of the CSA.
During the year ended March 31, 2016, OEFC’s cost under power supply contracts totalled $875 million (2014–15, $950 million), including purchases of power from NUGs of $865 million (2014–15, $902 million) and OPG support contract costs of $10 million (2014–15, $48 million). These costs were recovered from electricity ratepayers (as shown in Schedules 1, 3 and 4).
| | | | |
| Consolidated Financial Statements, 2015–2016 | | | 71 | |
Liabilities for Contaminated Sites
The Province reports environmental liabilities related to the management and remediation of contaminated sites where the Province is obligated or likely obligated to incur such costs. A contaminated sites liability of $1,751 million (2015, $1,792 million) has been recorded based on environmental assessments or estimations for those sites where an assessment has not been conducted.
The Province’s ongoing efforts to assess contaminated sites may result in additional environmental remediation liabilities related to newly identified sites, or changes in the assessments or intended use of existing sites, including mine sites. Any changes to the Province’s liabilities for contaminated sites will be accrued in the year in which they are assessed as likely and reasonably estimable.
Other Funds and Liabilities
Other funds and liabilities include pension and benefit funds related to the Provincial Judges’ Pension Fund, the Public Service and the Deputy Ministers’ Supplementary Benefit Accounts, externally restricted funds and other long-term liabilities.
| | |
| 72 | | Consolidated Financial Statements, 2015–2016 |
8. Investments
| | | | | | | | |
Investments As at March 31 | | | | | | |
($ Millions) | | 2016 | | | 2015 | |
Temporary Investments | | $ | 16,112 | | | $ | 14,743 | |
Add: Assets Purchased under Resale Agreements | | | 4,657 | | | | 5,942 | |
Less: Assets Sold under Repurchase Agreements | | | (1,008 | ) | | | (1,994 | ) |
Total Temporary Investments | | $ | 19,761 | | | $ | 18,691 | |
Other Investments | | | 2,004 | | | | 1,675 | |
| | | | | | | | |
Total Investments | | $ | 21,765 | | | $ | 20,366 | |
| | | | | | | | |
Temporary Investments
Temporary investments primarily consist of investments in government bonds. The fair value of temporary investments, including assets purchased and sold under resale and repurchase agreements at March 31, 2016, is $19.8 billion (2015, $18.7 billion). Fair value is determined using quoted market prices.
A resale agreement is an agreement between two parties where the Province purchases and subsequently resells a security at a specified price on a specified date. A repurchase agreement is an agreement between two parties where the Province sells and subsequently repurchases a security at a specified price on a specified date.
Other Investments
Other investments represent the investments held by BPS organizations. These investments primarily consist of fixed-income securities. The fair value of these investments approximates book value.
| | | | |
| Consolidated Financial Statements, 2015–2016 | | | 73 | |
9. Tangible Capital Assets
| | | | | | | | | | | | | | | | | | | | | | | | | | | | | | | | |
Tangible Capital Assets As at March 31 | | | | | | | | | | | | | | | | | | | | | | | | |
| ($ Millions) | | | | | | | | | | | | | | | | | | | | | | | | |
| | | | | | | | | | | | Machinery | | | | | | | | | | | | | |
| | | | | | | | | Transportation | | | and | | | Information | | | | | | | | | | |
| | | Land | | | Buildings | | | Infrastructure | | | Equipment | | | Technology | | | Other | | | 2016 | | | 2015 | |
Cost | | | | | | | | | | | | | | | | | | | | | | | | | | | | | | | | |
Opening Balance | | | 13,801 | | | | 73,621 | | | | 30,740 | | | | 11,630 | | | | 5,483 | | | | 5,781 | | | | 141,056 | | | | 131,299 | |
Additions | | | 896 | | | | 3,965 | | | | 3,439 | | | | 874 | | | | 763 | | | | 985 | | | | 10,922 | | | | 11,183 | |
Disposals | | | 46 | | | | 672 | | | | 1,410 | | | | 340 | | | | 149 | | | | 19 | | | | 2,636 | | | | 1,426 | |
| | | | | | | | | | | | | | | | | | | | | | | | | | | | | | | | |
Closing Balance | | | 14,651 | | | | 76,914 | | | | 32,769 | | | | 12,164 | | | | 6,097 | | | | 6,747 | | | | 149,342 | | | | 141,056 | |
| | | | | | | | | | | | | | | | | | | | | | | | | | | | | | | | |
Accumulated Amortization | | | | | | | | | | | | | | | | | | | | | | | | | | | | | | | | |
Opening Balance | | | — | | | | 21,496 | | | | 9,100 | | | | 8,771 | | | | 2,992 | | | | 1,632 | | | | 43,991 | | | | 40,743 | |
Additions | | | — | | | | 2,189 | | | | 1,217 | | | | 721 | | | | 547 | | | | 239 | | | | 4,913 | | | | 4,544 | |
Disposals | | | — | | | | 201 | | | | 1,410 | | | | 321 | | | | 147 | | | | 19 | | | | 2,098 | | | | 1,296 | |
| | | | | | | | | | | | | | | | | | | | | | | | | | | | | | | | |
Closing Balance | | | — | | | | 23,484 | | | | 8,907 | | | | 9,171 | | | | 3,392 | | | | 1,852 | | | | 46,806 | | | | 43,991 | |
| | | | | | | | | | | | | | | | | | | | | | | | | | | | | | | | |
Net Book Value | | | | | | | | | | | | | | | | | | | | | | | | | | | | | | | | |
2016 | | | 14,651 | | | | 53,430 | | | | 23,862 | | | | 2,993 | | | | 2,705 | | | | 4,895 | | | | 102,536 | | | | — | |
2015 | | | 13,801 | | | | 52,125 | | | | 21,640 | | | | 2,859 | | | | 2,491 | | | | 4,149 | | | | — | | | | 97,065 | |
Land includes land acquired for transportation infrastructure, parks, buildings and other program use, and land improvements that have an indefinite life and are not being amortized. Land excludes Crown lands acquired by right.
Buildings include administrative and service structures, and dams and engineering structures.
Transportation Infrastructure includes provincial highways, railways, bridges and related structures and facilities, but excludes land and buildings.
Machinery and Equipment consists mainly of hospital equipment.
Information Technology consists of computer hardware and software.
Other includes leased assets, vehicles, aircraft and other miscellaneous tangible capital assets owned by the government and its consolidated organizations.
Works of art and historical treasures are excluded from tangible capital assets.
| | |
| 74 | | Consolidated Financial Statements, 2015–2016 |
Assets under construction have been included within the various asset categories presented above. The total value of assets under construction as at March 31, 2016, is $11.8 billion (2015, $14.2 billion).
All tangible capital assets, except assets under construction, land and land improvements with an indefinite life, are being amortized on a straight-line basis over their estimated useful lives. Amortization expense for the fiscal year 2015–16 totalled $4.9 billion (2014-15, $4.5 billion) of which $2.0 billion (2014–15, $1.8 billion) relates to the Province and $2.9 billion (2014–15, $2.7 billion) relates to the BPS. The latter expense is included under the BPS expense reported on Schedule 10. The useful lives of the Province’s tangible capital assets have been estimated as:
| | | | |
Buildings | | | 20 to 40 years | |
Dams and Engineering Structures | | | 20 to 80 years | |
Transportation Infrastructure | | | 10 to 75 years | |
Machinery and Equipment | | | 3 to 20 years | |
Information Technology | | | 3 to 15 years | |
Other | | | 3 to 30 years | |
10. Changes in the Fair Value of Ontario Nuclear Funds
The Ontario Nuclear Funds Agreement (ONFA) Funds were established by Ontario Power Generation Inc. (OPG) and the Province to ensure that sufficient funds will be available to pay for the costs of nuclear station decommissioning and nuclear used fuel waste management.
Since April 1, 2007, the fair value of ONFA Funds has been reflected in the Province’s Consolidated Financial Statements. Unrealized gains and losses of ONFA Funds are included in Investment in Government Business Enterprises and recorded as an Increase (Decrease) in Fair Value of Ontario Nuclear Funds in the Consolidated Statement of Change in Net Debt and the Consolidated Statement of Change in Accumulated Deficit. Realized gains and losses of ONFA Funds are included in Income from Investment in Government Business Enterprises. Inter-organizational balances related to ONFA Funds are eliminated.
ONFA Funds incurred unrealized losses in 2015–16 of $1,003 million (2014–15, unrealized gain of $1,121 million) that resulted in a decrease in Investment in Government Business Enterprises and a corresponding increase in Net Debt and Accumulated Deficit.
| | | | |
| Consolidated Financial Statements, 2015–2016 | | | 75 | |
11. Sale of Hydro One Common Shares
In November 2015, the Province sold approximately 16 per cent of Hydro One’s common shares at a price of $20.50 per common share, through a public offering and through related share sales. As of March 31, 2016, the Province owned approximately 84 per cent of Hydro One’s common shares.
In August 2015, prior to the sale of Hydro One common shares, Hydro One transferred all of the issued and outstanding shares of Hydro One Brampton to the Province as a dividend-in-kind. Hydro One also transferred all of the long-term intercompany debt plus accrued interest owed by Hydro One Brampton to Hydro One as a return of stated capital. The transfers were made to the newly formed Brampton Distribution Holdco Inc., creating a new government business enterprise. Also, prior to the sale of the Hydro One Shares, Hydro One declared and paid a special dividend to the Province of $800 million. This amount is reported in the Remittances to Consolidated Fund in Schedule 9 and was considered in the book value calculation of the shares sold.
An accounting gain of $783 million was recognized in the 2015–16 financial results in connection with the sale of Hydro One shares. An additional gain of $48 million was deferred in connection with a sale of shares to electricity sector union trusts during the year and will be recognized as revenue as the loans provided to the trusts to purchase the shares are repaid.
In conjunction with the disposition of Hydro One shares, Hydro One exited the Province’s payments in lieu of corporate income tax regime (corporate PILs regime) and is now subject to federal and provincial corporate income taxes. Immediately before exiting the corporate PILs regime, Hydro One was deemed to have disposed of its assets for proceeds equal to the assets’ fair market value. As a result of this deemed disposition, before exiting the corporate PILs regime Hydro One had to make a payment under the Electricity Act, 1998, related to the income and capital gains arising from the difference between the assets’ fair value and tax value. This one-time payment to the Province, referred to as the “departure tax,” was $2.6 billion. Hydro One also paid the Province $191 million in additional corporate PILs in connection with leaving the corporate PILs regime. These one-time payments did not affect the Province’s annual deficit as the additional revenue recognized by the Province was offset by an equal reduction in Hydro One’s net income, which is consolidated in the Province’s financial statements.
The transition into the federal and provincial corporate income tax regime also resulted in Hydro One eliminating a deferred tax liability and recognizing a deferred tax asset in 2015–16, which reflects reduced cash taxes payable by Hydro One for some period in the future. The Province’s proportionate share of the deferred tax benefit increased the Province’s revenues by $2.4 billion, and is reflected in Income from Government Business Enterprises.
| | |
| 76 | | Consolidated Financial Statements, 2015–2016 |
A summary of key direct components of the Hydro One transactions include:
| | | | |
($ Millions) | | | |
Total proceeds from the sale of shares | | $ | 1,945 | |
Deferred gain on sale of shares to electricity union trusts | | ($ | 48 | ) |
Transaction costs | | ($ | 43 | ) |
| | | | |
Net Proceeds from sale of Hydro One shares (Net of transaction cost and gain on sale of shares to electricity union trusts) | | $ | 1,854 | |
Book value of shares sold (Schedule 9) | | ($ | 1,071 | ) |
| | | | |
Gain on sale of shares recognized in 2015–16 | | $ | 783 | |
Electricity PILs Revenue (Schedule 1) | | $ | 2,791 | |
Hydro One departure tax expense and one-time PILs payment (offset to PILs Revenue) reflected in Income from GBEs | | ($ | 2,791 | ) |
Portion of Hydro One deferred tax benefit recorded by the Province through HOL consolidation, reflected in Income from GBEs | | $ | 2,392 | |
| | | | |
Net impact on annual deficit | | $ | 3,175 | |
| | | | |
12. Hydro One and Ontario Power Generation use of US GAAP
Hydro One Limited and Ontario Power Generation Inc. prepare their stand-alone financial statements on a US GAAP basis as permitted under current securities legislation. The entities are consolidated on the Province’s books, using the modified equity method, on the same basis on which they report their stand-alone financial reports. As government business enterprises, in the Introduction to the Public Sector Accounting Standards, for purposes of consolidation, Hydro One Limited and Ontario Power Generation Inc. are directed to prepare their financial statements in accordance with accounting standards used by publicly accountable enterprises, which under Part I of the Accounting Standards Handbook would be International Financial Reporting Standards (IFRS). If the results for Hydro One Limited and Ontario Power Generation Inc. were consolidated with those of the Province using IFRS, Financial Assets would be $473 million lower, Income from Investment in Government Business Enterprises would be $34 million lower and Opening Accumulated Deficit would be $439 million higher.
13. Contingent Liabilities
Obligations Guaranteed by the Province
The authorized limit for loans guaranteed by the Province as at March 31, 2016, was $1.4 billion (2015, $2.0 billion). The outstanding loans guaranteed and other contingencies amounted to $1.0 billion as at March 31, 2016 (2015, $1.4 billion). A provision of $3.4 million (2015, $4.0 million), based on an estimate of the likely loss arising from guarantees under the Student Support Programs, has been reflected in these financial statements.
| | | | |
| Consolidated Financial Statements, 2015–2016 | | | 77 | |
Ontario Nuclear Funds Agreement
Under ONFA, the Province is liable to make payments should the cost estimate for nuclear used fuel waste management rise above specified thresholds, for a fixed volume of used fuel. The likelihood and amount by which the cost estimate could rise above these thresholds cannot be determined at this time. The cost estimate will be updated periodically to reflect new developments in the management of nuclear used fuel waste.
As well, under ONFA, the Province guarantees a return of 3.25 per cent over the Ontario Consumer Price Index for the portion of the nuclear used fuel waste management segregated fund related to the fixed volume of used fuel. If the earnings on assets in that fund related to the fixed volume exceed the guaranteed rate, the Province is entitled to the excess.
Two agreements are in place to satisfy the Canadian Nuclear Safety Commission (CNSC) licensing requirements for financial guarantees in respect of OPG’s nuclear station decommissioning and nuclear waste management obligations. One agreement gives the CNSC access (in prescribed circumstances) to the segregated funds established under ONFA. The other agreement between the Province and the CNSC provides a direct provincial guarantee to the CNSC on behalf of OPG. This guarantee relates to the portion of the decommissioning and waste management obligations not funded by the estimated value of ONFA funds as at January 1, 2013. In return, the Province receives from OPG an annual fee equal to 0.5 per cent of the value of the guarantee. The provincial guarantee, for up to $1,551 million, is in effect from January 1, 2013, through the end of 2017, when the next reference plan for the CNSC is planned to be approved. In each of January 2015 and 2016, OPG paid a guarantee fee of $8 million to the Province based on the guarantee amount of $1,551 million.
Social Housing — Loan Insurance Agreements
For all non-profit housing projects in the provincial portfolio, the Province is liable to indemnify and reimburse the Canada Mortgage and Housing Corporation (CMHC) for any net costs, including any environmental liabilities, incurred as a result of project defaults through the Ministry of Municipal Affairs and Housing or the Ontario Mortgage and Housing Corporation.
At March 31, 2016, there were $5.0 billion (2015, $5.4 billion) of mortgage loans outstanding. As operating subsidies provided by the Province are sufficient to ensure that all mortgage payments can be made when due, default is unlikely. To date, there have been no claims for defaults on insured mortgage loans.
| | |
| 78 | | Consolidated Financial Statements, 2015–2016 |
Claims Against the Crown
There are claims outstanding against the Crown, of which 70 (2015, 58) are for amounts over $50 million. These claims arise from legal action, either in progress or threatened, in respect of Aboriginal land claims, breach of contract, damages to persons and property, and like items. The cost to the Province, if any, cannot be determined because the financial outcome of these actions is uncertain. For a detailed listing of claims against the ministries, refer to Public Accounts Volume 1, “Claims Against the Crown.”
Subsequent to year end, on April 20, 2016, the Ontario Superior Court determined that Bill 115, the Putting Students First Act, 2012, was in contravention of the unions’ right to collective bargaining under the Charter of Rights and Freedoms. The Court did not impose a penalty on the Province, and directed that the parties attempt to negotiate a remedy. The impact on the March 31, 2016, consolidated financial statements of the related accrual is based on the Province’s best estimation of the remedy amount on information available, the extent of which is not disclosed given that an agreement has not been reached.
Canadian Blood Services
The provincial and territorial governments of Canada have entered into a Canadian Blood Services Excess Insurance Captive Support Agreement (the “Captive Support Agreement”) with Canadian Blood Services (CBS) and Canadian Blood Services Captive Insurance Company Limited (CBSI), a wholly owned subsidiary of CBS. Under the Captive Support Agreement, each government indemnifies CBSI for its pro-rata share of any payments that CBSI becomes obliged to make under a comprehensive blood risks insurance policy it provides to CBS. The policy has an overall limit of $750 million, which may cover settlements, judgments and defence costs. The policy is in excess of, and secondary to, a $250 million comprehensive insurance policy underwritten by CBS Insurance Company Limited, a subsidiary of CBS. Given current populations, Ontario’s maximum potential liability under the Captive Support Agreement is approximately $376 million. The Province is not aware of any proceedings that could lead to a claim against it under the Captive Support Agreement.
Legal Aid Ontario — Certificates
Legal Aid Ontario (LAO) issues certificates to individuals seeking legal aid assistance. Each certificate issued authorizes legal services to be performed within the tariff guidelines. At March 31, 2016, a potential $51.9 million (2015, $55.6 million) could still be incurred on certificates issued on or before March 31, 2016, over and above the billings received to date.
Contaminated Sites
The Province has identified contingent liabilities related to 125 sites (2015, 76 sites) that may have potential liabilities of $365 million (2015, $383 million). A liability has not been recorded for these sites because either the likelihood of the government becoming responsible for the site is not determinable, the amount of the liability cannot be estimated, or both.
| | | | |
| Consolidated Financial Statements, 2015–2016 | | | 79 | |
General Real Estate Portfolio — Lease Obligation
Prior to the amalgamation of Stadium Corporation of Ontario Limited (STADCO) with Infrastructure Ontario and the Ontario Realty Corporation on June 6, 2011, all assets, liabilities and operations of STADCO were transferred to the General Real Estate Portfolio (GREP), including ground leases dated June 3, 1989, with Canada Lands Company (CLC) for the SkyDome Lands and the sublease to Rogers Stadium Limited Partnership (sub-tenant). Under the terms of the ground lease, GREP is responsible for base rent, realty taxes, utilities and certain operating costs, which are assumed by the sub-tenant under the terms of the sub-lease. In the event of a default by the sub-tenant, the potential financial impact to GREP is estimated to be the base rent, in the range of $300 million to $400 million annually, plus realty taxes, utilities and certain operating costs.
Collateral
The Province has entered into securities repurchase agreements and collateralized swap agreements with certain counterparties. Under the terms of those agreements, the Province may be required to pledge and/or receive assets relating to obligations to the counterparties. In the normal course of business, these pledged securities will be returned to the pledgor when there are no longer any outstanding obligations.
As at March 31, 2016, the Province pledged assets in the carrying amount of $33 million (2015, $35 million), which are included in Investments and/or Cash and Cash Equivalents.
| | |
| 80 | | Consolidated Financial Statements, 2015–2016 |
14. Contractual Obligations
| | | | | | | | | | | | | | | | | | | | | | | | | | | | | | | | |
| Contractual Obligations | | | | | | | | Minimum Payments to be made in: | |
| as at March 31 | | | | | | | | | | | | | | | | | | | | | | | 2022 and | |
($ Millions) | | 2016 | | | 2015 | | | 2017 | | | 2018 | | | 2019 | | | 2020 | | | 2021 | | | thereafter | |
Transfer Payments | | $ | 10,965 | | | $ | 7,872 | | | $ | 6,701 | | | $ | 2,777 | | | $ | 732 | | | $ | 364 | | | $ | 139 | | | $ | 252 | |
Alternative Financing Contracts | | | 27,528 | | | | 24,210 | | | | 11,715 | | | | 773 | | | | 849 | | | | 651 | | | | 548 | | | | 12,992 | |
Ontario Power Generation | | | 6,499 | | | | 5,286 | | | | 1,982 | | | | 538 | | | | 504 | | | | 505 | | | | 293 | | | | 2,677 | |
Leases | | | 4,391 | | | | 4,139 | | | | 670 | | | | 557 | | | | 491 | | | | 421 | | | | 358 | | | | 1,894 | |
Construction Contracts | | | 4,980 | | | | 4,654 | | | | 1,800 | | | | 848 | | | | 453 | | | | 302 | | | | 256 | | | | 1,321 | |
Other | | | 8,987 | | | | 7,204 | | | | 1,573 | | | | 1,179 | | | | 983 | | | | 823 | | | | 664 | | | | 3,765 | �� |
| | | | | | | | | | | | | | | | | | | | | | | | | | | | | | | | |
Total Contractual Obligations | | $ | 63,350 | | | $ | 53,365 | | | $ | 24,441 | | | $ | 6,672 | | | $ | 4,012 | | | $ | 3,066 | | | $ | 2,258 | | | $ | 22,901 | |
| | | | | | | | | | | | | | | | | | | | | | | | | | | | | | | | |
Ontario Power Generation Inc.’s contractual obligations include future contributions under ONFA of $3.2 billion and fuel-supply agreements of $783 million.
The Province has entered into a number of multiple-year alternative financing contracts for the construction of assets and delivery of services. The contractual obligations represent the unperformed capital and operating portion of the contracts and will become liabilities in the future when the terms of the contracts are met.
| | | | |
| Consolidated Financial Statements, 2015–2016 | | | 81 | |
15. Trust Funds Under Administration
Summary financial information from the most recent financial statements of trust funds under administration is provided below.
Workplace Safety and Insurance Board (WSIB)1
| | | | | | | | |
| As at December 31 | | | | | | |
($ Millions) | | 2015 | | | 20142 | |
Assets | | $ | 28,305 | | | $ | 25,779 | |
Liabilities | | | 32,102 | | | | 31,025 | |
| | | | | | | | |
Deficiency of Assets | | | (3,797 | ) | | | (5,246 | ) |
Unfunded Liability attributable to WSIB stakeholders | | ($ | 6,599 | ) | | ($ | 7,890 | ) |
| | | | | | | | |
| 1 | The financial statements have been prepared in accordance with International Financial Reporting Standards (IFRS). |
| 2 | The 2014 results were restated by WSIB in March 2016. |
| | | | | | | | | | | | | | | | |
| Other Trust Funds | | | | | | | | | | | | |
| As at March 31 | | | | | | | | | | | | |
($ Millions) | | | | | | | | 2016 | | | 2015 | |
| | | Assets | | | Liabilities | | | Fund Balance
(Unfunded Liability) | | | Fund Balance
(Unfunded Liability) | |
The Public Guardian and Trustee for Province of Ontario | | $ | 1,734 | | | $ | 54 | | | $ | 1,680 | | | $ | 1,623 | |
| | | | | | | | | | | | | | | | |
Motor Vehicle Accident Claims Fund | | | 64 | | | | 230 | | | | (166 | ) | | | (161 | ) |
| | | | | | | | | | | | | | | | |
Pension Benefits Guarantee Fund | | | 600 | | | | 159 | | | | 441 | | | | 372 | |
| | | | | | | | | | | | | | | | |
| | | | |
As at December 31 | | Assets | | | Liabilities | | | 2015
Fund Balance | | | 2014
Fund Balance | |
Deposit Insurance Corporation of Ontario | | $ | 219 | | | $ | 13 | | | $ | 206 | | | $ | 185 | |
| | | | | | | | | | | | | | | | |
Unfunded liabilities of trusts under administration are not included in the Province’s consolidated financial statements as it is intended that they will be discharged by external parties. The most recent financial statements of these trusts are reproduced in Volume 2 of the Public Accounts of Ontario.
| | |
| 82 | | Consolidated Financial Statements, 2015–2016 |
16. Future Changes in Accounting Standards
PSAB 3450 — Financial Instruments and PSAB 2601 — Foreign Currency Translation
PSAB has introduced new sections on Financial Instruments and Foreign Currency Translation that categorize items to be accounted for at either fair value, cost or amortized cost. Fair value measurement applies to derivatives and portfolio investments in equity instruments that are quoted in an active market. Other financial assets and financial liabilities will generally be measured at cost or amortized cost. Until an item is derecognized (for example, through disposition), any gains and losses arising due to changes in fair value (remeasurements) will be reported in the Statement of Remeasurement Gains and Losses. PSAB has agreed to further explore the views of the stakeholders in the areas of hedge accounting and linkage to the Concepts Underlying Financial Performance project. PSAB has extended the effective date of these standards until fiscal year 2019–20.
PSAB 2200 — Related Party Disclosures
PSAB has issued a new standard on Related Party Disclosures. This standard requires disclosure of related party transactions if they have a material financial effect on the Consolidated Financial Statements and only if those transactions occur at a value different from what would have been arrived at if the parties were unrelated. Transactions involving key management personnel and their close family members may be required to be disclosed if they meet certain criteria. The standard is effective in fiscal year 2017–18 or earlier. The Province is currently assessing the impact of this standard on its Consolidated Financial Statements.
PSAB 3420 — Inter-Entity Transactions
PSAB has issued a new standard on Inter-Entity Transactions. It establishes standards on how to account for and report transactions between public-sector entities that comprise a government’s reporting entity from both a provider and recipient perspective. This standard covers recognition and measurement and references disclosure of information about Inter-Entity Transactions, in accordance with the Related Party Disclosure, Section PS 2200. The standard is effective in fiscal year 2017–18 or earlier. The Province is currently assessing the impact of this standard on its Consolidated Financial Statements.
Concepts Underlying Financial Performance
PSAB is currently in the process of revisiting its conceptual framework, which establishes principles for the development of standards used for financial reporting by the public–sector entities in Canada. The conceptual framework is important to ensure public–sector standards appropriately reflect the economic substance of government transactions and to support transparency and accountability in public-sector reporting. PSAB continues with stakeholder communication activities and is currently deliberating on comments received on their latest consultation paper.
| | | | |
| Consolidated Financial Statements, 2015–2016 | | | 83 | |
Asset Retirement Obligations
PSAB is currently developing an exposure draft for a new accounting standard that addresses the reporting of legal obligations associated with the retirement of long-lived tangible capital assets currently in productive use. The Province will be responding to the exposure draft, which is expected in the first quarter of 2017.
Revenue
PSAB is currently developing an exposure draft for revenue recognition principles that apply to revenues of governments and government organizations other than government transfers and tax revenue. The Province will be responding to the exposure draft, which is expected in the first quarter of 2017.
17. Subsequent Event
Subsequent to the Province’s fiscal year end, on April 14, 2016, the Province sold 72,434,800 common shares of Hydro One Limited at $23.65 per share through a secondary share offering, generating approximately $1.7 billion in gross proceeds.
The Province also granted an over-allotment option to the underwriters to purchase up to an additional 10,865,200 common shares, under the same terms and conditions as the base offering. The underwriters exercised this over-allotment option in full on April 29, 2016. Including the over-allotment option, the Province generated approximately $2 billion in gross proceeds from the offering.
Subsequent to this sale, the Province owns approximately 70 per cent of the outstanding, common shares of Hydro One Limited.
18. Change in Accounting for Pension Assets of Jointly Sponsored Pension Plans
For the 2015–16 Public Accounts, the government legislated the accounting treatment for pension assets of its jointly sponsored pension plans. The legislation impacts the accounting for both the Ontario Teachers’ Pension Plan and the Ontario Public Service Employees’ Union Pension Plan. The legislation requires a full valuation allowance be recorded against the pension assets, therefore writing off the value of the assets.
As described in Public Sector Accounting Standards (PSAS), a pension asset arises when the government’s total contributions to a plan, including income earned thereon, are greater than the cumulative retirement benefit expense recognized since the start of the plan. Contributions reflect the funding objectives of the plan. The benefit expense reflects the estimated cost of the pensions earned during the year that will be paid out to retirees in the future. In prior years, the government recorded pension assets to the extent the government expected to benefit from the asset through future reductions in contributions to the plan.
| | |
| 84 | | Consolidated Financial Statements, 2015–2016 |
These plans are now accounted for in accordance with PSAS and legislation requiring a full valuation allowance be recorded. The change was made to reflect the Auditor General of Ontario’s view that a full valuation allowance is required if the government does not have the legally enforceable right to unilaterally access the assets of the jointly sponsored pension plans, or in absence of that right, an irrevocable agreement in place at year-end with the joint sponsors of the plans to reduce contributions.
19. Comparative Figures
The comparative figures have been reclassified as necessary to conform to the 2016 presentation.
| | | | |
| Consolidated Financial Statements, 2015–2016 | | | 85 | |
| | |
| 86 | | Consolidated Financial Statements, 2015–2016 |
SCHEDULES TO THE CONSOLIDATED FINANCIAL STATEMENTS
| | | | | | |
Schedule 1 | | Revenue by Source | | | 88 | |
| | |
Schedule 2 | | Revenue by Sector | | | 90 | |
| | |
Schedule 3 | | Expense by Sector | | | 92 | |
| | |
Schedule 4 | | Expense by Ministry | | | 94 | |
| | |
Schedule 5 | | Accounts Payable and Accrued Liabilities | | | 95 | |
| | |
Schedule 6 | | Accounts Receivable | | | 95 | |
| | |
Schedule 7 | | Loans Receivable | | | 96 | |
| | |
Schedule 8 | | Government Organizations | | | 98 | |
| | |
Schedule 9 | | Government Business Enterprises | | | 103 | |
| | |
Schedule 10 | | Broader Public Sector Organizations | | | 105 | |
| | | | |
| Consolidated Financial Statements, 2015–2016 | | | 87 | |
Province of Ontario
Schedule 1: Revenue by Source
| | | | | | | | | | | | |
($ Millions) | | 2015–16
Budget1 | | | 2015–16
Actual | | | 2014–15
Actual | |
Taxation | | | | | | | | | | | | |
Personal Income Tax | | | 30,377 | | | | 31,141 | | | | 29,313 | |
Sales Tax | | | 22,982 | | | | 23,455 | | | | 21,689 | |
Corporations Tax | | | 11,342 | | | | 11,428 | | | | 9,557 | |
Education Property Tax | | | 5,715 | | | | 5,839 | | | | 5,561 | |
Employer Health Tax | | | 5,680 | | | | 5,649 | | | | 5,415 | |
Ontario Health Premium | | | 3,458 | | | | 3,453 | | | | 3,366 | |
Electricity Payments-In-Lieu of Taxes (Note 11) | | | 524 | | | | 3,247 | | | | 180 | |
Gasoline Tax | | | 2,457 | | | | 2,459 | | | | 2,447 | |
Land Transfer Tax | | | 1,782 | | | | 2,118 | | | | 1,765 | |
Tobacco Tax | | | 1,262 | | | | 1,226 | | | | 1,163 | |
Fuel Tax | | | 752 | | | | 751 | | | | 739 | |
Beer and Wine Tax | | | 575 | | | | 582 | | | | 560 | |
Other Taxes | | | 491 | | | | 470 | | | | 520 | |
| | | | | | | | | | | | |
| | | 87,397 | | | | 91,818 | | | | 82,275 | |
| | | | | | | | | | | | |
Transfers from Government of Canada | | | | | | | | | | | | |
Canada Health Transfer | | | 13,065 | | | | 13,089 | | | | 12,408 | |
Canada Social Transfer | | | 4,976 | | | | 4,984 | | | | 4,847 | |
Equalization Payments | | | 2,363 | | | | 2,363 | | | | 1,988 | |
Labour Market Development Agreement | | | 632 | | | | 632 | | | | 628 | |
Social Housing | | | 448 | | | | 455 | | | | 465 | |
Indian Welfare Services Agreement | | | 243 | | | | 259 | | | | 246 | |
Job Fund Agreement | | | 192 | | | | 205 | | | | 179 | |
Infrastructure Programs | | | 308 | | | | 146 | | | | 137 | |
Bilingualism Development | | | 83 | | | | 85 | | | | 86 | |
Labour Market Agreement for Persons with Disabilities | | | 76 | | | | 76 | | | | 76 | |
Youth Criminal Justice | | | 52 | | | | 52 | | | | 52 | |
Legal Aid Criminal | | | 51 | | | | 51 | | | | 53 | |
Other | | | 401 | | | | 460 | | | | 450 | |
| | | | | | | | | | | | |
| | | 22,890 | | | | 22,857 | | | | 21,615 | |
| | | | | | | | | | | | |
| | |
| 88 | | Consolidated Financial Statements, 2015–2016 |
Province of Ontario
Schedule 1: Revenue by Source (cont’d)
| | | | | | | | | | | | |
($ Millions) | | 2015–16
Budget1 | | | 2015–16
Actual | | | 2014–15
Actual | |
Income from Investment in Government Business | | | | | | | | | | | | |
Enterprises (Schedule 9) | | | 4,812 | | | | 4,909 | | | | 5,615 | |
Other | | | | | | | | | | | | |
Sales and Rentals | | | 2,803 | | | | 2,102 | | | | 2,336 | |
Vehicle and Driver Registration Fees | | | 1,592 | | | | 1,565 | | | | 1,433 | |
Electricity Debt Retirement Charge | | | 865 | | | | 859 | | | | 956 | |
Power Supply Contract Recoveries (Note 7) | | | 793 | | | | 875 | | | | 950 | |
Other Fees and Licences | | | 745 | | | | 743 | | | | 693 | |
Royalties | | | 262 | | | | 274 | | | | 275 | |
Independent Electricity System Operation Revenue | | | 234 | | | | 221 | | | | 240 | |
Net Reduction of Power Purchase Contracts (Note 7) | | | 172 | | | | 172 | | | | 217 | |
Local Services Realignment | | | 117 | | | | 125 | | | | 106 | |
Miscellaneous | | | 1,708 | | | | 1,857 | | | | 1,835 | |
| | | | | | | | | | | | |
| | | 9,291 | | | | 8,793 | | | | 9,041 | |
| | | | | | | | | | | | |
Total Revenue | | | 124,390 | | | | 128,377 | | | | 118,546 | |
| | | | | | | | | | | | |
| 1 | Amounts reported as “Plan” in 2015 Budget. |
| | | | |
| Consolidated Financial Statements, 2015–2016 | | | 89 | |
Province of Ontario
Schedule 2: Revenue by Sector
| | | | | | | | | | | | | | | | | | | | | | | | | | | | | | | | |
Sectors | | Health1 | | | Education2 | | | Children’s and
Social Services3 | | | Environment,
Resources and
Economic
Development4 | |
For the year ended March 31 ($ Millions) | | 2016 | | | 2015 | | | 2016 | | | 2015 | | | 2016 | | | 2015 | | | 2016 | | | 2015 | |
Revenue | | | | | | | | | | | | | | | | | | | | | | | | | | | | | | | | |
Taxation (Schedule 1) | | | — | | | | — | | | | — | | | | — | | | | — | | | | — | | | | 1 | | | | 2 | |
Transfers from Government of Canada (Schedule 1) | | | 49 | | | | 55 | | | | 79 | | | | 80 | | | | 360 | | | | 346 | | | | 883 | | | | 913 | |
Income from Investment in Government Business Enterprises | | | — | | | | — | | | | — | | | | — | | | | — | | | | — | | | | 719 | | | | 1,963 | |
Other (Schedule 1) | | | 232 | | | | 229 | | | | 32 | | | | 26 | | | | 88 | | | | 64 | | | | 4,020 | | | | 3,748 | |
| | | | | | | | | | | | | | | | | | | | | | | | | | | | | | | | |
Total | | | 281 | | | | 284 | | | | 111 | | | | 106 | | | | 448 | | | | 410 | | | | 5,623 | | | | 6,626 | |
| | | | | | | | | | | | | | | | | | | | | | | | | | | | | | | | |
| 1 | Includes the activities of the Ministry of Health and Long-Term Care. |
| 2 | Includes the activities of the Ministry of Education. |
| 3 | Includes the activities of the Ministries of Children and Youth Services, and Community and Social Services. |
| 4 | Includes the activities of the Ministries of Aboriginal Affairs; Agriculture, Food and Rural Affairs; Citizenship, Immigration and International Trade; Economic Development, Employment and Infrastructure/Research and Innovation; Energy; Environment and Climate Change; Labour; Municipal Affairs and Housing; Natural Resources and Forestry; Northern Development and Mines; Tourism, Culture and Sport; and Transportation. |
| | |
| 90 | | Consolidated Financial Statements, 2015–2016 |
| | | | | | | | | | | | | | | | | | | | | | | | | | | | |
Post-Secondary Education
and Training5 | | | Justice6 | | | General Government
and Other7 | | | Total | |
2016 | | 2015 | | | 2016 | | | 2015 | | | 2016 | | | 2015 | | | 2016 | | | 2015 | |
| — | | | — | | | | — | | | | — | | | | 91,817 | | | | 82,273 | | | | 91,818 | | | | 82,275 | |
| 909 | | | 868 | | | | 103 | | | | 100 | | | | 20,474 | | | | 19,253 | | | | 22,857 | | | | 21,615 | |
| — | | | — | | | | — | | | | — | | | | 4,190 | | | | 3,652 | | | | 4,909 | | | | 5,615 | |
| 55 | | | 54 | | | | 735 | | | | 727 | | | | 3,631 | | | | 4,193 | | | | 8,793 | | | | 9,041 | |
| | | | | | | | | | | | | | | | | | | | | | | | | | | | |
| 964 | | | 922 | | | | 838 | | | | 827 | | | | 120,112 | | | | 109,371 | | | | 128,377 | | | | 118,546 | |
| | | | | | | | | | | | | | | | | | | | | | | | | | | | |
| 5 | Includes the activities of the Ministry of Training, Colleges and Universities. |
| 6 | Includes the activities of the Ministries of Attorney General, and Community Safety and Correctional Services. |
| 7 | Includes the activities of the Ministries of Government and Consumer Services, Finance, the Board of Internal Economy, Executive Offices, the Office of Francophone Affairs and Treasury Board Secretariat. |
| | | | |
| Consolidated Financial Statements, 2015–2016 | | | 91 | |
Province of Ontario
Schedule 3: Expense by Sector1
| | | | | | | | | | | | | | | | | | | | | | | | | | | | | | | | |
Sectors | | Health2 | | | Education3 | | | Children’s and
Social Services4 | | | Environment,
Resources and
Economic
Development5 | |
For the year ended March 31 ($ Millions) | | 2016 | | | 2015 | | | 2016 | | | 2015 | | | 2016 | | | 2015 | | | 2016 | | | 2015 | |
Expense | | | | | | | | | | | | | | | | | | | | | | | | | | | | | | | | |
Transfer Payments | | | 48,299 | 10 | | | 47,912 | 10 | | | 24,974 | | | | 24,909 | | | | 14,692 | | | | 13,899 | 11 | | | 6,045 | | | | 5,436 | |
Interest on Debt | | | — | | | | — | | | | — | | | | — | | | | — | | | | — | | | | — | | | | — | |
Salaries and Wages | | | 654 | | | | 639 | | | | 212 | | | | 204 | | | | 444 | | | | 429 | | | | 1,820 | | | | 1,802 | |
Services | | | 1,877 | | | | 1,740 | | | | 153 | | | | 138 | | | | 230 | | | | 186 | | | | 1,499 | | | | 1,238 | |
Pensions and Employee Future Benefits (Note 6) | | | 5 | | | | 6 | | | | 1,590 | | | | 565 | | | | 6 | | | | 7 | | | | 9 | | | | 11 | |
Power Supply Contract Costs | | | — | | | | — | | | | — | | | | — | | | | — | | | | — | | | | — | | | | — | |
Amortization of Tangible Capital Assets | | | 63 | | | | 54 | | | | 9 | | | | 9 | | | | 36 | | | | 23 | | | | 1,868 | | | | 1,678 | |
Employee Benefits | | | 124 | | | | 120 | | | | 34 | | | | 33 | | | | 69 | | | | 69 | | | | 346 | | | | 349 | |
Supplies and Equipment | | | 422 | | | | 396 | | | | 7 | | | | 8 | | | | 9 | | | | 9 | | | | 228 | | | | 231 | |
Transportation and Communication | | | 61 | | | | 60 | | | | 14 | | | | 15 | | | | 19 | | | | 20 | | | | 130 | | | | 116 | |
Net Impact of Broader Public Sector Organizations on Provincial Expenses (Schedule 10) | | | (495 | ) | | | (1,042 | ) | | | (436 | ) | | | (717 | ) | | | — | | | | — | | | | — | | | | — | |
Other | | | 57 | | | | 154 | | | | 31 | | | | 30 | | | | 50 | | | | 41 | | | | 667 | | | | 821 | |
| | | | | | | | | | | | | | | | | | | | | | | | | | | | | | | | |
Total12 | | | 51,067 | | | | 50,039 | | | | 26,588 | | | | 25,194 | | | | 15,555 | | | | 14,683 | | | | 12,612 | | | | 11,682 | |
| | | | | | | | | | | | | | | | | | | | | | | | | | | | | | | | |
| 1 | The information in the sectors’ columns represents activities of ministries and consolidated agencies after adjustments to eliminate transactions between sectors. |
| 2 | Includes the activities of the Ministry of Health and Long-Term Care. |
| 3 | Includes the activities of the Ministry of Education. |
| 4 | Includes the activities of the Ministries of Children and Youth Services, and Community and Social Services. |
| 5 | Includes the activities of the Ministries of Aboriginal Affairs; Agriculture, Food and Rural Affairs; Citizenship, Immigration and International Trade; Economic Development, Employment and Infrastructure/Research and Innovation; Energy; Environment and Climate Change; Labour; Municipal Affairs and Housing; Natural Resources and Forestry; Northern Development and Mines; Tourism, Culture and Sport; and Transportation. |
| | |
| 92 | | Consolidated Financial Statements, 2015–2016 |
| | | | | | | | | | | | | | | | | | | | | | | | | | | | | | | | | | | | | | |
Post-Secondary
Education and
Training6 | | | Justice7 | | | General
Government
and Other8 | | | Interest on Debt9 | | | Total | |
2016 | | | 2015 | | | 2016 | | | 2015 | | | 2016 | | | 2015 | | | 2016 | | | 2015 | | | 2016 | | | 2015 | |
| | 7,515 | | | | 7,521 | | | | 446 | | | | 391 | | | | 720 | | | | 789 | | | | — | | | | — | | | | 102,691 | | | | 100,857 | |
| | — | | | | — | | | | — | | | | — | | | | — | | | | — | | | | 10,967 | | | | 10,635 | | | | 10,967 | | | | 10,635 | |
| | 93 | | | | 91 | | | | 2,321 | | | | 2,246 | | | | 948 | | | | 917 | | | | — | | | | — | | | | 6,492 | | | | 6,328 | |
| | 62 | | | | 65 | | | | 978 | | | | 962 | | | | 380 | | | | 366 | | | | — | | | | — | | | | 5,179 | | | | 4,695 | |
| | — | | | | — | | | | 20 | | | | 18 | | | | 1,046 | | | | 1,228 | | | | — | | | | — | | | | 2,676 | | | | 1,835 | |
| | — | | | | — | | | | — | | | | — | | | | 875 | | | | 950 | | | | — | | | | — | | | | 875 | | | | 950 | |
| | 5 | | | | 2 | | | | 15 | | | | 12 | | | | 61 | | | | 63 | | | | — | | | | — | | | | 2,057 | | | | 1,841 | |
| | 15 | | | | 14 | | | | 306 | | | | 299 | | | | 122 | | | | 101 | | | | — | | | | — | | | | 1,016 | | | | 985 | |
| | 1 | | | | 1 | | | | 165 | | | | 171 | | | | 38 | | | | 37 | | | | — | | | | — | | | | 870 | | | | 853 | |
| | 4 | | | | 4 | | | | 96 | | | | 93 | | | | 43 | | | | 44 | | | | — | | | | — | | | | 367 | | | | 352 | |
| | (120 | ) | | | (102 | ) | | | — | | | | — | | | | — | | | | — | | | | — | | | | — | | | | (1,051 | ) | | | (1,861 | ) |
| | 59 | | | | 64 | | | | 202 | | | | 159 | | | | 201 | | | | 122 | | | | — | | | | — | | | | 1,267 | | | | 1,391 | |
| | | | | | | | | | | | | | | | | | | | | | | | | | | | | | | | | | | | | | |
| | 7,634 | | | | 7,660 | | | | 4,549 | | | | 4,351 | | | | 4,434 | | | | 4,617 | | | | 10,967 | | | | 10,635 | | | | 133,406 | | | | 128,861 | |
| | | | | | | | | | | | | | | | | | | | | | | | | | | | | | | | | | | | | | |
| 6 | Includes the activities of the Ministry of Training, Colleges and Universities. |
| 7 | Includes the activities of the Ministries of Attorney General, and Community Safety and Correctional Services. |
| 8 | Includes the activities of the Ministries of Government Services and Consumer Services, Finance, the Board of Internal Economy, Executive Offices, the Office of Francophone Affairs and Treasury Board Secretariat. |
| 9 | Includes the activities related to the management of the debt of the Province. |
| 10 | Includes transfers of $2,587 million (2014–15, $2,495 million) to Community Care Access Centres. |
| 11 | Includes transfers of $1,504 million (2014–15, $1,490 million) to Children’s Aid Societies. |
| 12 | The comparative figures have been reclassified to conform to the 2015–2016 presentation. |
| | | | |
| Consolidated Financial Statements, 2015–2016 | | | 93 | |
Province of Ontario
Schedule 4: Expense by Ministry
| | | | | | | | | | | | |
($ Millions) | | 2015–16
Budget1 | | | 2015–16
Actual | | | 2014–15
Actual | |
Aboriginal Affairs | | | 74 | | | | 79 | | | | 71 | |
Agriculture, Food and Rural Affairs | | | 1,041 | | | | 1,026 | | | | 943 | |
Attorney General | | | 1,780 | | | | 1,860 | | | | 1,783 | |
Board of Internal Economy | | | 210 | | | | 205 | | | | 264 | |
Children and Youth Services | | | 4,316 | | | | 4,260 | | | | 4,132 | |
Citizenship, Immigration and International Trade | | | 159 | | | | 169 | | | | 157 | |
Community and Social Services | | | 11,115 | | | | 11,295 | | | | 10,551 | |
Community Safety and Correctional Services | | | 2,649 | | | | 2,689 | | | | 2,568 | |
Economic Development, Employment and Infrastructure/Research and Innovation | | | 1,453 | | | | 1,134 | | | | 1,076 | |
Education | | | 25,231 | | | | 24,998 | | | | 24,630 | |
Teachers’ Pension (Note 6) | | | 71 | | | | 1,590 | | | | 564 | |
Energy | | | 1,183 | | | | 1,232 | | | | 1,404 | |
Environment and Climate Change | | | 503 | | | | 503 | | | | 486 | |
Executive Offices | | | 34 | | | | 37 | | | | 43 | |
Finance | | | 860 | | | | 951 | | | | 827 | |
Interest on Debt | | | 11,410 | | | | 10,967 | | | | 10,635 | |
Municipal Partnership Fund | | | 513 | | | | 513 | | | | 542 | |
Power Supply Contract Costs | | | 793 | | | | 875 | | | | 950 | |
Government Services and Consumer Services | | | 602 | | | | 608 | | | | 573 | |
Health and Long-Term Care | | | 50,773 | | | | 51,067 | | | | 50,039 | |
Labour | | | 311 | | | | 304 | | | | 305 | |
Municipal Affairs and Housing | | | 1,080 | | | | 1,088 | | | | 1,050 | |
Natural Resources and Forestry | | | 790 | | | | 819 | | | | 792 | |
Northern Development and Mines | | | 757 | | | | 701 | | | | 804 | |
Office of Francophone Affairs | | | 8 | | | | 8 | | | | 5 | |
Tourism, Culture and Sport | | | 2,179 | | | | 2,270 | | | | 1,650 | |
Training, Colleges and Universities | | | 7,810 | | | | 7,634 | | | | 7,660 | |
Transportation | | | 3,457 | | | | 3,287 | | | | 2,944 | |
Treasury Board Secretariat | | | 291 | | | | 216 | | | | 227 | |
Contingency Fund2 | | | 650 | | | | — | | | | — | |
Employee and Pensioner Benefits | | | 1,289 | | | | 1,021 | | | | 1,186 | |
Program Review Savings Target3 | | | (490 | ) | | | — | | | | — | |
Year-End Savings3 | | | (1,000 | ) | | | — | | | | — | |
| | | | | | | | | | | | |
Total Expense | | | 131,902 | | | | 133,406 | | | | 128,861 | |
| | | | | | | | | | | | |
| 1 | Amounts reported as “Plan” in 2015 Budget. |
| 2 | See glossary for definition. |
| 3 | For Budget purposes, these items were not allocated to individual ministries. |
| | |
| 94 | | Consolidated Financial Statements, 2015–2016 |
Province of Ontario
Schedule 5: Accounts Payable and Accrued Liabilities
| | | | | | | | |
As at March 31 ($ Millions) | | 2016 | | | 2015 | |
Transfer Payments | | | 4,825 | | | | 4,094 | |
Interest on Debt | | | 3,610 | | | | 3,874 | |
Salaries, Wages and Benefits | | | 2,917 | | | | 2,788 | |
Other | | | 8,009 | | | | 9,299 | |
| | | | | | | | |
Total Accounts Payable and Accrued Liabilities | | | 19,361 | | | | 20,055 | |
| | | | | | | | |
Province of Ontario
Schedule 6: Accounts Receivable
| | | | | | | | |
As at March 31 ($ Millions) | | 2016 | | | 2015 | |
Taxes | | | 6,579 | | | | 5,552 | |
Transfer Payments1 | | | 597 | | | | 573 | |
Other Accounts Receivable2 | | | 4,337 | | | | 4,335 | |
| | | | | | | | |
| | | 11,513 | | | | 10,460 | |
Less: Allowance for Doubtful Accounts3 | | | (1,226 | ) | | | (1,298 | ) |
| | | | | | | | |
| | | 10,287 | | | | 9,162 | |
Government of Canada | | | 772 | | | | 1,144 | |
| | | | | | | | |
Total Accounts Receivable | | | 11,059 | | | | 10,306 | |
| | | | | | | | |
| 1 | The Transfer Payment receivable consists primarily of recoverables of $573 million (2015, $612 million) for the Ontario Disability Support Program — Financial Assistance. |
| 2 | Other Accounts Receivable includes trade receivables. |
| 3 | The Allowance for Doubtful Accounts includes a provision of $493 million (2015, $532 million) for the Ontario Disability Support Program — Financial Assistance. |
| | | | |
| Consolidated Financial Statements, 2015–2016 | | | 95 | |
Province of Ontario
Schedule 7: Loans Receivable
| | | | | | | | |
As at March 31 ($ Millions) | | 2016 | | | 2015 | |
Government Business Enterprises1 | | | 3,499 | | | | 3,695 | |
Municipalities2 | | | 5,407 | | | | 5,067 | |
Students3 | | | 2,655 | | | | 2,521 | |
Industrial and Commercial4 | | | 554 | | | | 492 | |
Pension Benefit Guarantee Fund5 | | | 198 | | | | 209 | |
Universities6 | | | 14 | | | | 22 | |
Other7 | | | 508 | | | | 402 | |
| | | | | | | | |
| | | 12,835 | | | | 12,408 | |
Unamortized Concession Discounts8 | | | (262 | ) | | | (277 | ) |
Allowance for Doubtful Accounts9 | | | (1,028 | ) | | | (1,006 | ) |
| | | | | | | | |
Total Loans Receivable | | | 11,545 | | | | 11,125 | |
| | | | | | | | |
| 1 | Loans to government business enterprises bear interest at rates of 2.32 per cent to 6.33 per cent (2015, 2.32 per cent to 6.33 per cent). |
| 2 | Loans to municipalities bear interest at rates of up to 10.00 per cent (2015, 10.52 per cent). |
| 3 | Loans to students bear interest at rates of 0.99 per cent to 3.85 per cent (2015, 1.23 per cent to 4.00 per cent). |
| 4 | Loans to industrial and commercial enterprises bear interest at rates of up to 6.30 per cent (2015, 6.56 per cent). |
| 5 | The loan to the Pension Benefit Guarantee Fund is interest-free. |
| 6 | Loans to universities are mortgages bearing interest at rates of 2.77 per cent to 7.00 per cent (2015, 2.77 per cent to 7.00 per cent). |
| 7 | Loans to other include loan for MaRS Phase 2 of $290 million (2015, $294 million) and loans to electricity sector union trusts of $111 million (2015, nil). |
| 8 | Unamortized concession discounts related to loans made to municipalities of $75 million (2015, $71 million), loans to the Pension Benefit Guarantee Fund of $97 million (2015, $102 million) and loans to industrial and commercial enterprises and other of $90 million (2015, 104 million). |
| 9 | Allowance for doubtful accounts related to loans made to students of $616 million (2015, $604 million), municipalities of $69 million (2015, $158 million), industrial and commercial enterprises and other of $242 million (2015, $137 million) and the Pension Benefit Guarantee Fund of $101 million (2015, $107 million). |
| | |
| 96 | | Consolidated Financial Statements, 2015–2016 |
| | | | | | | | |
| Repayment Terms | | Principal Repayment | |
| As at March 31 | | | | | | |
($ Millions) | | | | | | |
Years to Maturity | | 2016 | | | 2015 | |
1 year | | | 1,511 | | | | 1,284 | |
2 years | | | 1,639 | | | | 799 | |
3 years | | | 820 | | | | 1,601 | |
4 years | | | 1,211 | | | | 761 | |
5 years | | | 915 | | | | 1,164 | |
| | | | | | | | |
1–5 years | | | 6,096 | | | | 5,609 | |
6–10 years | | | 2,542 | | | | 2,831 | |
11–15 years | | | 1,512 | | | | 1,305 | |
16–20 years | | | 585 | | | | 513 | |
21–25 years | | | 352 | | | | 282 | |
Over 25 years | | | 1,591 | | | | 1,618 | |
| | | | | | | | |
Subtotal | | | 12,678 | | | | 12,158 | |
No fixed maturity | | | 157 | | | | 250 | |
| | | | | | | | |
Total | | | 12,835 | | | | 12,408 | |
| | | | | | | | |
| | | | |
| Consolidated Financial Statements, 2015–2016 | | | 97 | |
| | |
| Province of Ontario | | |
Schedule 8: Government Organizations1 | | |
Government Business Enterprises2 | | Responsible Ministry |
| |
| Brampton Distribution Holdco Inc. | | Energy |
| |
| Hydro One Limited | | Energy |
| |
| Liquor Control Board of Ontario | | Finance |
| |
| Ontario Lottery and Gaming Corporation | | Finance |
| |
| Ontario Power Generation Inc. | | Energy |
| |
| Other Government Organizations2 | | Responsible Ministry |
| |
| Agricorp | | Agriculture, Food and Rural Affairs |
| |
| Agricultural Research Institute of Ontario | | Agriculture, Food and Rural Affairs |
| |
| Algonquin Forestry Authority | | Natural Resources and Forestry |
| |
| Cancer Care Ontario | | Health and Long-Term Care |
| |
| Education Quality and Accountability Office | | Education |
| |
| eHealth Ontario | | Health and Long-Term Care |
| |
| Forest Renewal Trust | | Natural Resources and Forestry |
| |
| General Real Estate Portfolio | | Economic Development, Employment and Infrastructure/Research and Innovation |
| |
| Independent Electricity System Operator | | Energy |
| |
| Legal Aid Ontario | | Attorney General |
| |
| Local Health Integration Networks | | |
| |
Central East Local Health Integration Network | | Health and Long-Term Care |
| |
Central Local Health Integration Network | | Health and Long-Term Care |
| |
Central West Local Health Integration Network | | Health and Long-Term Care |
| |
Champlain Local Health Integration Network | | Health and Long-Term Care |
| |
Erie St. Clair Local Health Integration Network | | Health and Long-Term Care |
| |
Hamilton Niagara Haldimand Brant Local Health Integration Network | | Health and Long-Term Care |
| |
Mississauga Halton Local Health Integration Network | | Health and Long-Term Care |
| |
North East Local Health Integration Network | | Health and Long-Term Care |
| |
North Simcoe Muskoka Local Health Integration Network | | Health and Long-Term Care |
| |
North West Local Health Integration Network | | Health and Long-Term Care |
| |
South East Local Health Integration Network | | Health and Long-Term Care |
| |
South West Local Health Integration Network | | Health and Long-Term Care |
| |
Toronto Central Local Health Integration Network | | Health and Long-Term Care |
| |
Waterloo Wellington Local Health Integration Network | | Health and Long-Term Care |
| |
| Metrolinx | | Transportation |
| |
| Metropolitan Toronto Convention Centre Corporation | | Tourism, Culture and Sport |
| |
| Niagara Parks Commission | | Tourism, Culture and Sport |
| |
| Northern Ontario Heritage Fund Corporation | | Northern Development and Mines |
| |
| Ontario Agency for Health Protection and Promotion (Public Health Ontario) | | Health and Long-Term Care |
| |
| Ontario Capital Growth Corporation | | Economic Development, Employment and Infrastructure/Research and Innovation |
| |
| Ontario Clean Water Agency | | Environment and Climate Change |
| |
| Ontario Educational Communications Authority (TVO) | | Education |
| |
| Ontario Electricity Financial Corporation | | Finance |
| |
| Ontario Energy Board | | Energy |
| |
| Ontario Financing Authority | | Finance |
| |
Ontario French-Language Educational Communications Authority (TFO) | | Education |
| |
| Ontario Immigrant Investor Corporation | | Economic Development, Employment and Infrastructure/Research and Innovation |
| 1 | The schedule of government organizations is updated on an annual basis to reflect any amalgamations or dissolutions of consolidated organizations in the year. This listing represents all consolidated organizations included in the Province’s financial statements as at March 31, 2016. Other controlled organizations that do not meet the consolidation threshold of materiality and cost-benefit (per PSAB standards), such as Children’s Aid Societies and Community Care Access Centres, are instead reflected as government transfer payment expense in these financial statements through the accounts of the ministries responsible for them. |
| 2 | The most recent audited financial statements of these organizations are included in Public Accounts of Ontario, Volume 2. |
| | |
| 98 | | Consolidated Financial Statements, 2015–2016 |
Province of Ontario
Schedule 8: Government Organizations1
| | |
| Other Government Organizations2 (cont’d) | | Responsible Ministry (cont’d) |
| |
Ontario Infrastructure and Lands Corporation (Infrastructure Ontario) | | Economic Development, Employment and Infrastructure/Research and Innovation |
| |
| Ontario Mortgage and Housing Corporation | | Municipal Affairs and Housing |
| |
| Ontario Northland Transportation Commission | | Northern Development and Mines |
| |
| Ontario Place Corporation | | Tourism, Culture and Sport |
| |
| Ontario Racing Commission | | Agriculture, Food and Rural Affairs |
| |
| Ontario Securities Commission | | Finance |
| |
| Ontario Tourism Marketing Partnership Corporation | | Tourism, Culture and Sport |
| |
| Ontario Trillium Foundation | | Tourism, Culture and Sport |
| |
| Ornge | | Health and Long-Term Care |
| |
| Ottawa Convention Centre Corporation | | Tourism, Culture and Sport |
| |
Province of Ontario Council for the Arts (Ontario Arts Council) | | Tourism, Culture and Sport |
| |
The Centennial Centre of Science and Technology (Ontario Science Centre) | | Tourism, Culture and Sport |
| |
The Royal Ontario Museum | | Tourism, Culture and Sport |
| |
Toronto Organizing Committee for the 2015 Pan American and Parapan American Games (Toronto 2015) | | Tourism, Culture and Sport |
| |
Toronto Waterfront Revitalization Corporation (Waterfront Toronto)3 | | Economic Development, Employment and Infrastructure/Research and Innovation |
| |
Transmission Corridor Program | | Economic Development, Employment and Infrastructure/Research and Innovation |
| |
| Broader Public Sector Organizations | | |
| |
| Public Hospitals — Ministry of Health and Long-Term Care | | |
| |
| Alexandra Hospital Ingersoll | | Groves Memorial Community Hospital |
| |
| Alexandra Marine & General Hospital | | Guelph General Hospital |
| |
| Almonte General Hospital | | Haldimand War Memorial Hospital |
| |
| Anson General Hospital | | Haliburton Highlands Health Services Corporation |
| |
| Arnprior Regional Health | | Halton Healthcare Services Corporation |
| |
| Atikokan General Hospital | | Hamilton Health Sciences Corporation |
| |
| Baycrest Centre for Geriatric Care | | Hanover & District Hospital |
| |
| Bingham Memorial Hospital | | Headwaters Health Care Centre |
| |
| Blind River District Health Centre | | Health Sciences North |
| |
| Bluewater Health | | Holland Bloorview Kids Rehabilitation Hospital |
| |
| Brant Community Healthcare System | | Hôpital Général de Hawkesbury and District General Hospital Inc. |
| |
| Brockville General Hospital | | Hôpital Glengarry Memorial Hospital |
| |
| Bruyère Continuing Care Inc. | | Hôpital Montfort |
| |
| Cambridge Memorial Hospital | | Hôpital Notre Dame Hospital (Hearst) |
| |
| Campbellford Memorial Hospital | | Hornepayne Community Hospital |
| |
| Carleton Place and District Memorial Hospital | | Hospital for Sick Children |
| |
| Casey House Hospice | | Hôtel-Dieu Grace Healthcare |
| |
| Chatham-Kent Health Alliance | | Hôtel-Dieu Hospital, Cornwall |
| |
| Children’s Hospital of Eastern Ontario | | Humber River Regional Hospital |
| |
| Clinton Public Hospital | | Joseph Brant Hospital |
| |
| Collingwood General and Marine Hospital | | Kemptville District Hospital |
| |
| Cornwall Community Hospital | | Kingston General Hospital |
| |
| Deep River and District Hospital Corporation | | Kirkland and District Hospital |
| |
| Dryden Regional Health Centre | | Lady Dunn Health Centre |
| |
| Englehart and District Hospital Inc. | | Lady Minto Hospital at Cochrane |
| |
| Espanola General Hospital | | Lake of the Woods District Hospital |
| |
| Four Counties Health Services | | Lakeridge Health |
| |
| Georgian Bay General Hospital | | Leamington District Memorial Hospital |
| |
| Geraldton District Hospital | | Lennox and Addington County General Hospital |
| 3 | Toronto Waterfront Revitalization Corporation (Waterfront Toronto) is a government partnership with the Province having one-third interest. |
| | | | |
| Consolidated Financial Statements, 2015–2016 | | | 99 | |
Province of Ontario
Schedule 8: Government Organizations1
| | |
| Public Hospitals — Ministry of Health and Long-Term Care (cont’d) |
| |
| Grand River Hospital | | Sinai Health System |
| |
| Grey Bruce Health Services | | Sioux Lookout Meno-Ya-Win Health Centre |
| |
| Listowel Memorial Hospital | | Smooth Rock Falls Hospital |
| |
| London Health Sciences Centre | | South Bruce Grey Health Centre |
| |
| Mackenzie Health | | South Huron Hospital Association |
| |
| Manitoulin Health Centre | | Southlake Regional Health Centre |
| |
| Manitouwadge General Hospital | | St. Francis Memorial Hospital |
| |
| Markham Stouffville Hospital | | St. Joseph’s Care Group |
| |
| Mattawa General Hospital | | St. Joseph’s Continuing Care Centre of Sudbury |
| |
| McCausland Hospital | | St. Joseph’s General Hospital, Elliot Lake |
| |
| Muskoka Algonquin Healthcare | | St. Joseph’s Health Care, London |
| |
| Niagara Health System | | St. Joseph’s Health Centre (Guelph) |
| |
| Nipigon District Memorial Hospital | | St. Joseph’s Health Centre (Toronto) |
| |
| Norfolk General Hospital | | St. Joseph’s Healthcare Hamilton |
| |
| North Bay Regional Health Centre | | St. Mary’s General Hospital |
| |
| North Wellington Health Care Corporation | | St. Mary’s Memorial Hospital |
| |
| North York General Hospital | | St. Michael’s Hospital |
| |
| Northumberland Hills Hospital | | St. Thomas—Elgin General Hospital |
| |
| Orillia Soldiers’ Memorial Hospital | | Stevenson Memorial Hospital |
| |
| Ottawa Hospital | | Stratford General Hospital |
| |
| Pembroke Regional Hospital Inc. | | Strathroy Middlesex General Hospital |
| |
| Perth and Smiths Falls District Hospital | | Sunnybrook Health Sciences Centre |
| |
| Peterborough Regional Health Centre | | Temiskaming Hospital |
| |
| Providence Care Centre (Kingston) | | Thunder Bay Regional Health Sciences Centre |
| |
Providence Healthcare | | Tillsonburg District Memorial Hospital |
| |
Queensway-Carleton Hospital | | Timmins and District Hospital |
| |
Quinte Healthcare Corporation | | Toronto East General Hospital |
| |
Red Lake Margaret Cochenour Memorial Hospital Corporation | | Trillium Health Partners |
| |
Religious Hospitallers of St. Joseph of the Hôtel Dieu of Kingston | | University Health Network |
| |
Religious Hospitallers of St. Joseph of the Hotel Dieu of St. Catharines | | University of Ottawa Heart Institute |
| |
Renfrew Victoria Hospital | | Weeneebayko Area Health Authority |
| |
Riverside Health Care Facilities Inc. | | West Haldimand General Hospital |
| |
Ross Memorial Hospital | | West Nipissing General Hospital |
| |
Rouge Valley Health System | | West Park Healthcare Centre |
| |
Royal Victoria Regional Health Centre | | West Parry Sound Health Centre |
| |
Runnymede Healthcare Centre | | William Osler Health System |
| |
| Salvation Army Toronto Grace Health Centre | | Wilson Memorial General Hospital |
| |
| Sault Area Hospital | | Winchester District Memorial Hospital |
| |
| Scarborough Hospital | | Windsor Regional Hospital |
| |
| Seaforth Community Hospital | | Wingham and District Hospital |
| |
| Sensenbrenner Hospital | | Women’s College Hospital |
| |
| Services de santé de Chapleau Health Services | | Woodstock General Hospital Trust |
|
| Specialty Psychiatric Hospitals — Ministry of Health and Long-Term Care |
| |
| Centre for Addiction and Mental Health | | Royal Ottawa Health Care Group |
| |
| Ontario Shores Centre for Mental Health Sciences | | Waypoint Centre for Mental Health Care |
| | |
| 100 | | Consolidated Financial Statements, 2015–2016 |
| | |
| Province of Ontario | | |
Schedule 8: Government Organizations1 | | |
| School Boards — Ministry of Education | | |
| |
| Algoma District School Board | | Lambton Kent District School Board |
| |
| Algonquin and Lakeshore Catholic District School Board | | Limestone District School Board |
| |
| Avon Maitland District School Board | | London District Catholic School Board |
| |
| Bloorview MacMillan School Authority | | Moose Factory Island District School Area Board |
| |
| Bluewater District School Board | | Moosonee District School Area Board |
| |
| Brant Haldimand Norfolk Catholic District School Board | | Near North District School Board |
| |
| Bruce-Grey Catholic District School Board | | Niagara Catholic District School Board |
| |
| Campbell Children’s School Authority | | Niagara Peninsula Children’s Centre School Authority |
| |
| Catholic District School Board of Eastern Ontario | | Nipissing-Parry Sound Catholic District School Board |
| |
| Conseil des écoles publiques de l’Est de l’Ontario | | Northeastern Catholic District School Board |
| |
| Conseil scolaire catholique Providence | | Northwest Catholic District School Board |
| |
Conseil scolaire de district catholique Centre-Sud | | Ottawa Catholic District School Board |
| |
Conseil scolaire de district catholique de l’Est ontarien | | Ottawa Children’s Treatment Centre School Authority |
| |
Conseil scolaire de district catholique des Aurores boréales | | Ottawa-Carleton District School Board |
| |
Conseil scolaire de district catholique des Grandes Rivières | | Peel District School Board |
| |
Conseil scolaire de district catholique du Centre-Est de l’Ontario | | Penetanguishene Protestant Separate School Board |
| |
Conseil scolaire de district catholique du Nouvel-Ontario | | Peterborough Victoria Northumberland and |
| |
Conseil scolaire de district catholique Franco-Nord | | Clarington Catholic District School Board |
| |
| Conseil scolaire de district du Grand Nord de l’Ontario | | Rainbow District School Board |
| |
| Conseil scolaire de district du Nord-Est de l’Ontario | | Rainy River District School Board |
| |
| Conseil scolaire Viamonde | | Renfrew County Catholic District School Board |
| |
| District School Board of Niagara | | Renfrew County District School Board |
| |
| District School Board Ontario North East | | Simcoe County District School Board |
| |
| Dufferin-Peel Catholic District School Board | | Simcoe Muskoka Catholic District School Board |
| |
| Durham Catholic District School Board | | St. Clair Catholic District School Board |
| |
| Durham District School Board | | Sudbury Catholic District School Board |
| |
| Grand Erie District School Board | | Superior North Catholic District School Board |
| |
| Greater Essex County District School Board | | Superior-Greenstone District School Board |
| |
| Halton Catholic District School Board | | Thames Valley District School Board |
| |
| Halton District School Board | | Thunder Bay Catholic District School Board |
| |
| Hamilton-Wentworth Catholic District School Board | | Toronto Catholic District School Board |
| |
| Hamilton-Wentworth District School Board | | Toronto District School Board |
| |
| Hastings and Prince Edward District School Board | | Trillium Lakelands District School Board |
| |
| Huron-Perth Catholic District School Board | | Upper Canada District School Board |
| |
| Huron-Superior Catholic District School Board | | Upper Grand District School Board |
| |
| James Bay Lowlands Secondary School Board | | Waterloo Catholic District School Board |
| |
| John McGivney Children’s Centre School Authority | | Waterloo Region District School Board |
| |
| Kawartha Pine Ridge District School Board | | Wellington Catholic District School Board |
| |
| Keewatin-Patricia District School Board | | Windsor-Essex Catholic District School Board |
| |
| Kenora Catholic District School Board | | York Catholic District School Board |
| |
| KidsAbility School Authority | | York Region District School Board |
| |
| Lakehead District School Board | | |
| | | | |
| Consolidated Financial Statements, 2015–2016 | | | 101 | |
| | |
Province of Ontario Schedule 8: Government Organizations1 | | |
| |
| Colleges — Ministry of Training, Colleges and Universities | | |
| |
| Algonquin College of Applied Arts and Technology | | Humber College Institute of Technology and Advanced Learning |
| |
| Cambrian College of Applied Arts and Technology | | Lambton College of Applied Arts and Technology |
| |
| Canadore College of Applied Arts and Technology | | Loyalist College of Applied Arts and Technology |
| |
| Centennial College of Applied Arts and Technology | | Mohawk College of Applied Arts and Technology |
| |
Collčge Boréal d’arts appliqués et de technologie | | Niagara College of Applied Arts and Technology |
| |
Collčge d’arts appliqués et de technologie La Cité collégiale | | Northern College of Applied Arts and Technology |
| |
Conestoga College Institute of Technology and Advanced Learning | | Sault College of Applied Arts and Technology |
| |
Confederation College of Applied Arts and Technology | | Seneca College of Applied Arts and Technology |
| |
| | Sheridan College Institute of Technology and Advanced Learning |
| |
Durham College of Applied Arts and Technology | | Sir Sandford Fleming College of Applied Arts and Technology |
| |
Fanshawe College of Applied Arts and Technology | | St. Clair College of Applied Arts and Technology |
| |
| George Brown College of Applied Arts and Technology | | St. Lawrence College of Applied Arts and Technology |
| |
| Georgian College of Applied Arts and Technology | | |
| | |
| 102 | | Consolidated Financial Statements, 2015–2016 |
Province of Ontario
Schedule 9: Government Business Enterprises
Summary financial information of Government Business Enterprises is provided below.
| | | | | | | | | | | | | | | | | | | | | | | | |
| | | | | | | | | Liquor | | | Ontario | | | Ontario | | | | |
| For the year ended | | Brampton | | | | | | Control | | | Lottery and | | | Power | | | | |
| March 31, 2016 | | Distribution | | | Hydro One | | | Board of | | | Gaming | | | Generation | | | | |
($ Millions) | | Holdco Inc.1 | | | Limited2, 3 | | | Ontario1 | | | Corporation1 | | | Inc.2 | | | Total | |
Assets | | | | | | | | | | | | | | | | | | | | | | | | |
Cash and Temporary Investments | | | 47 | | | | 213 | | | | 273 | | | | 489 | | | | 540 | | | | 1,562 | |
Accounts Receivable | | | 70 | | | | 715 | | | | 61 | | | | 157 | | | | 549 | | | | 1,552 | |
Inventories | | | — | | | | — | | | | 433 | | | | 30 | | | | 428 | | | | 891 | |
Prepaid Expenses | | | — | | | | — | | | | 9 | | | | 56 | | | | — | | | | 65 | |
Fixed Assets | | | 365 | | | | 15,269 | | | | 388 | | | | 1225 | | | | 20,778 | | | | 38,025 | |
Other Assets | | | 99 | | | | 4,409 | | | | 8 | | | | 2 | | | | 25,221 | | | | 29,739 | |
| | | | | | | | | | | | | | | | | | | | | | | | |
Total Assets | | | 581 | | | | 20,606 | | | | 1,172 | | | | 1,959 | | | | 47,516 | | | | 71,834 | |
| | | | | | | | | | | | | | | | | | | | | | | | |
Liabilities | | | | | | | | | | | | | | | | | | | | | | | | |
Accounts Payable | | | 71 | | | | 782 | | | | 628 | | | | 307 | | | | 1,291 | | | | 3,079 | |
Deferred Revenue | | | — | | | | — | | | | — | | | | 16 | | | | 271 | | | | 287 | |
Long-Term Debt | | | — | | | | 8,028 | | | | 105 | | | | 66 | | | | 5,459 | | | | 13,658 | |
Other Liabilities | | | 39 | | | | 3,449 | | | | 2 | | | | 258 | | | | 27,490 | | | | 31,238 | |
| | | | | | | | | | | | | | | | | | | | | | | | |
Total Liabilities | | | 110 | | | | 12,259 | | | | 735 | | | | 647 | | | | 34,511 | | | | 48,262 | |
| | | | | | | | | | | | | | | | | | | | | | | | |
Net Assets (liabilities) | | | 471 | | | | 8,347 | | | | 437 | | | | 1,312 | | | | 13,005 | | | | 23,572 | |
| | | | | | | | | | | | | | | | | | | | | | | | |
Revenue | | | 345 | | | | 5,707 | | | | 5,620 | | | | 7,779 | | | | 5,526 | | | | 24,977 | |
| | | | | | | | | | | | | | | | | | | | | | | | |
Expenses | | | 325 | | | | 5,471 | 4 | | | 3,664 | | | | 5,545 | | | | 5,063 | | | | 20,068 | |
| | | | | | | | | | | | | | | | | | | | | | | | |
Net Income (loss) | | | 20 | | | | 236 | | | | 1,956 | | | | 2,234 | | | | 463 | | | | 4,909 | |
| | | | | | | | | | | | | | | | | | | | | | | | |
Net Assets at Beginning of Year | | | — | | | | 8,072 | | | | 416 | | | | 1,469 | | | | 13,545 | | | | 23,502 | |
Decrease in Fair Value of Ontario Nuclear Funds (Note 10) | | | — | | | | — | | | | — | | | | — | | | | (1,003 | ) | | | (1,003 | ) |
Hydro One Brampton transfer (Note 11) | | | 451 | | | | (451 | ) | | | — | | | | — | | | | — | | | | — | |
Capital Contribution to Hydro One | | | — | | | | 2,600 | | | | — | | | | — | | | | — | | | | 2,600 | |
Book value of Hydro One Shares Sold
(Note 11) | | | — | | | | (1,071 | ) | | | — | | | | — | | | | — | | | | (1,071 | ) |
Remittances (to) Consolidated Revenue Fund | | | — | | | | (1,039 | ) | | | (1,935 | ) | | | (2,391 | ) | | | — | | | | (5,365 | ) |
| | | | | | | | | | | | | | | | | | | | | | | | |
Net Assets | | | 471 | | | | 8,347 | | | | 437 | | | | 1,312 | | | | 13,005 | | | | 23,572 | |
| | | | | | | | | | | | | | | | | | | | | | | | |
| 1 | Amounts reported using IFRS. |
| 2 | Amounts reported in the standalone financial statements of Hydro One Limited and Ontario Power Generation are prepared in accordance with US GAAP. |
| | The differences between US GAAP and IFRS are not material to the consolidated financial statements of the Province (Note 12). |
| 3 | As at March 31, 2016, the Province owned approximately 84 per cent of Hydro One Limited. |
| 4 | Reflects the amount of the revaluation of the tax basis of the assets of formerly Hydro One Inc. and its subsidiaries to fair market value, which resulted in a net deferred tax recovery of $2.6 billion recorded in 2015 by Hydro One Ltd. |
| | | | |
| Consolidated Financial Statements, 2015–2016 | | | 103 | |
Province of Ontario
Schedule 9: Government Business Enterprises
Brampton Distribution Holdco Inc.
The principal business of Brampton Distribution Holdco Inc. is the ownership, operation and management of electricity distribution systems and facilities. It is regulated by the Ontario Energy Board.
Hydro One Limited
The principal business of Hydro One Limited is the transmission and distribution of electricity to customers within Ontario. It is regulated by the Ontario Energy Board.
Liquor Control Board of Ontario
The Liquor Control Board of Ontario regulates the purchase, sale and distribution of liquor for home consumption and liquor sales to licensed establishments through Liquor Control Board stores, Brewers Retail stores and winery retail stores throughout Ontario. The Board buys wine and liquor products for resale to the public, tests all products sold and establishes prices for beer, wine and spirits.
Ontario Lottery and Gaming Corporation
The Corporation conducts lottery games and operates commercial casinos, charity casinos and slot machines at Ontario racetracks.
Ontario Power Generation Inc.
The principal business of Ontario Power Generation Inc. is the generation and sale of electricity in the Ontario wholesale market and in the interconnected markets of Quebec, Manitoba and the northeast and midwest United States.
| | |
| 104 | | Consolidated Financial Statements, 2015–2016 |
Province of Ontario
Schedule 10: Broader Public Sector Organizations
Summary financial information of Broader Public Sector Organizations is provided below.
| | | | | | | | | | | | | | | | |
| For the year ended March 31, 2016 | | | | | | | | | | | | |
($ Millions) | | Hospitals | | | School Boards | | | Colleges | | | Total | |
Expense | | | | | | | | | | | | | | | | |
Salaries, Wages and Benefits | | | 17,684 | | | | 19,016 | | | | 2,465 | | | | 39,165 | |
Amortization Expense | | | 1,531 | | | | 1,054 | | | | 273 | | | | 2,858 | |
Interest Expense1 | | | 220 | | | | 386 | | | | 15 | | | | 621 | |
Other Expense | | | 7,349 | | | | 4,034 | | | | 1,178 | | | | 12,561 | |
Fees, Donations and Other Revenues | | | (4,143 | ) | | | (1,374 | ) | | | (2,263 | ) | | | (7,780 | ) |
| | | | | | | | | | | | | | | | |
Total Sector Expense | | | 22,641 | | | | 23,116 | | | | 1,668 | | | | 47,425 | |
| | | | | | | | | | | | | | | | |
Transfers from the Province | | | (23,136 | ) | | | (23,552 | ) | | | (1,788 | ) | | | (48,476 | ) |
| | | | | | | | | | | | | | | | |
Net Impact on Provincial Expense – (Decrease) | | | (495 | ) | | | (436 | ) | | | (120 | ) | | | (1,051 | ) |
| | | | | | | | | | | | | | | | |
| 1 | Interest Revenue of $156 million is netted with Interest Expense. |
| | | | |
| Consolidated Financial Statements, 2015–2016 | | | 105 | |
GLOSSARY
Note: The descriptions of the terms in the glossary are provided for the purpose of assisting readers of the 2015–16 Public Accounts. The descriptions do not affect or alter the meaning of any term under law. The glossary does not form part of the audited consolidated financial statements.
Accumulated Amortization: the total amortization that has been recorded over the life of an asset to date. The asset’s total cost less the accumulated amortization gives the asset’s net book value.
Accumulated Deficit: the difference between liabilities and assets. It represents the total of all past annual deficits minus all past annual surpluses, including prior-period adjustments.
Amortization: expensing a portion of an asset’s cost in an accounting period by allocating its cost over its estimated useful life. This is applicable to tangible capital assets and items such as expenses relating to a debt issue.
Appropriation: an authority of the Legislative Assembly to pay money out of the Consolidated Revenue Fund or to incur a non-cash expense.
Broader Public Sector (BPS): public hospitals, specialty psychiatric hospitals, school boards and colleges. For financial statement purposes, universities and other organizations such as municipalities are excluded because they do not meet the criteria of government organizations as recommended by the Public Sector Accounting Board of the Chartered Professional Accountants of Canada.
Canada Health Transfer (CHT): a federal transfer provided to each province and territory in support of health care.
Canada Social Transfer (CST): a federal transfer provided to each province and territory in support of post-secondary education, social assistance and social services, including early childhood development, early learning and child care.
Capital Gain: the profit arising from the sale or transfer of capital assets or investments. For accounting purposes, it is the proceeds or market value received less the net book value of the capital asset or investment.
Capital Lease: a lease that, from the point of view of the lessee, transfers substantially all the benefits and risks incident to ownership of property to the lessee.
Cash and Cash Equivalents: cash or other short-term liquid low-risk instruments that are readily convertible to cash, typically within three months or less.
Consolidated Revenue Fund (CRF): the aggregate of all public monies on deposit to the credit of the Minister of Finance or in the name of any agency of the Crown approved by the Lieutenant Governor in Council. Payments made from the CRF must be appropriated by a statute. See Appropriation.
| | |
| 106 | | Consolidated Financial Statements, 2015–2016 |
Consolidation: the inclusion of the financial results of government-controlled organizations in the Province’s consolidated financial statements.
Consumer Price Index (CPI): a broad measure of the cost of living. Through the monthly CPI, Statistics Canada tracks the retail price of a representative shopping basket of goods and services from an average household’s expenditure: food, housing, transportation, furniture, clothing, and recreation. The percentage of the total basket that any item occupies is termed the “weight” and reflects typical consumer spending patterns. Since people tend to spend more on food than clothing, changes in the price of food have a bigger impact on the index than, for example, changes in the price of clothing and footwear.
Contingency Fund: an amount of expense that is approved by the Legislative Assembly at the beginning of the year to cover higher spending due to unforeseen events. This approved spending limit is allocated during the year to ministries for their programs and activities. The actual costs incurred are charged to the respective programs and activities and not to the contingency fund. Therefore, the contingency fund as at the end of the Province’s fiscal year is nil. See Reserve.
Contingent Liabilities: possible obligations that may result in the future sacrifice of economic benefits arising from existing conditions or situations involving uncertainty, which will ultimately be resolved when one or more future events not wholly within the government’s control occur or fail to occur. Resolution of the uncertainty will confirm the incurrence or non-incurrence of a liability.
Contractual Obligations: obligations of a government to others that will become liabilities when the terms of any contract or agreement, which the government had entered into, are met.
Debenture: a debt instrument where the issuer promises to pay interest and repay the principal by the maturity date. It is unsecured, meaning there is no lien on any specific asset.
Debt: an obligation resulting from the borrowing of money.
Deferred Capital Contribution: the unamortized portion of tangible capital assets or liabilities to construct or acquire tangible capital assets from specific funding received from other levels of government or third parties. Deferred capital contribution is recorded in revenue over the estimated useful life of the underlying tangible capital assets once constructed or acquired by the Province.
Deferred Revenue: unspent externally restricted grants from other levels of government and third parties for operating activities. Deferred revenues are recorded into revenue in the period in which the amount received is used for the purposes specified.
Deficit: the amount by which government expenses exceed revenues in any given year. On a forecast basis, a reserve may be included.
| | | | |
| Consolidated Financial Statements, 2015–2016 | | | 107 | |
Derivatives: financial contracts that derive their value from other underlying instruments. The Province uses derivatives including swaps, forward foreign exchange contracts, forward rate agreements, futures and options to hedge and minimize interest costs.
Expected Average Remaining Service Life: total number of years of future services expected to be rendered by that group of employees divided by the number of employees in the group.
Fair Value: the price that would be agreed upon in an arm’s-length transaction and in an open market between knowledgeable, willing parties who are under no compulsion to act. It is not the effect of a forced or liquidation sale.
Financial Assets: assets that could be used to discharge existing liabilities or finance future operations and are not for consumption in the normal course of operations. Financial assets include cash; an asset that is convertible to cash; a contractual right to receive cash or another financial asset from another party; a temporary or portfolio investment; a financial claim on an outside organization or individual; and inventory.
Financial Instrument: liquid asset, equity security in an entity, or a contract that gives rise to a financial asset of one contracting party and a financial liability or equity instrument of the other contracting party.
Fiscal Plan: an outline of the government’s consolidated revenue and expense plan for the upcoming fiscal year and the medium term, including information on the projected surplus/deficit. The plan is formally presented in the Budget, which the government presents in the spring of each year and is updated, as required, during the year. The fiscal plan numbers can be different from the expenditures outlined in the Printed Estimates.
Fiscal Year: the Province of Ontario’s fiscal year runs from April 1 of a year to March 31 of the following year.
Floating Rate Notes (FRNs): debt instruments that bear a variable rate of interest.
Forgivable Loan: advances where the terms and conditions of the loan agreement allow for the non-repayment of the principal or accrued interest when certain conditions are met.
Forward Contract: a contract that obligates one party to buy, and another party to sell, a specified amount of a particular asset at a specified price, on a given date in the future.
Forward Rate Agreement: a forward contract that specifies the rate of interest, usually short term, to be paid or received on an obligation beginning at a future start date.
Fund: fiscal and accounting entity segregated for the purpose of carrying on specific activities, or attaining certain objectives in accordance with special regulations, restrictions or limitations.
| | |
| 108 | | Consolidated Financial Statements, 2015–2016 |
Futures: an exchange-traded contract that confers an obligation to buy or sell a physical or financial commodity at a specified price and amount on a future date.
Gross Domestic Product (GDP): the total unduplicated value of the goods and services produced in the economy of a country or region during a given period, such as a quarter or a year. Gross domestic product can be measured three ways: as total income earned in current production, as total final expenditures or as total net value added in current production.
Hedging: a strategy to minimize the risk of loss on an asset (or a liability) from market fluctuations such as interest rate or foreign exchange rate changes. This is accomplished by entering into offsetting commitments with the expectation that a future change in the value of the hedging instrument will offset the change in the value of the asset (or the liability).
Indemnity: an agreement whereby one party agrees to compensate another party for any loss suffered by that party. The Province can either seek or provide indemnification.
Infrastructure: the facilities, systems and equipment required to provide public services and support private-sector economic activity including network infrastructure (e.g., roads, bridges, water and wastewater systems, large information technology systems), buildings (e.g., hospitals, schools, courts), and machinery and equipment (e.g., medical equipment, research equipment).
Liquid Reserve: comprises cash and short-term investments managed before consolidation with other government entities. It includes cash in the Province’s bank accounts, money market securities and long-term bonds which have not been lent out through a sale and re-purchase agreement, adjusted for net pledged collateral.
Loan Guarantee: an agreement to pay all or part of the amount due on a debt obligation in the event of default by the borrower.
Net Book Value of Tangible Capital Assets: historical cost of tangible capital assets less both the accumulated amortization and the amount of any write-downs.
Net Debt: the difference between the Province’s total liabilities and financial assets. It represents the Province’s future revenue requirements to pay for past transactions and events.
Nominal: an amount expressed in dollar terms without adjusting for changes in prices due to inflation or deflation. It is not a good basis for comparing values of GDP in different years, for which a “real” value expressed in constant dollars (i.e., adjusted for price changes) is needed. See Real GDP.
Non-Financial Assets: assets that normally do not generate cash capable of being used to repay existing debts. The non-financial assets of the Province are tangible capital assets.
| | | | |
| Consolidated Financial Statements, 2015–2016 | | | 109 | |
Non-Tax Revenue: revenue received by the government from external sources. This also includes revenues from the sale of goods and services, fines and penalties associated with the enforcement of government regulations and laws; fees and licence; royalties; profits from a self-sustaining Crown agency; and asset sales.
Ontario Disability Support Program (ODSP): a program designed to meet the unique needs of people with disabilities who are in financial need, or who want and are able to work and need support. Ontarians aged 65 years or older who are ineligible for Old Age Security may also qualify for ODSP supports if they are in financial need.
Option: a contract that confers the right, but not the obligation, to buy or sell a specific amount of a commodity, currency or security at a specific price, on a certain future date.
Pension Actuarial Accounting Valuation: a valuation performed by an actuary to measure the pension benefit obligations at the end of the period or a point in time. The valuation attributes the cost of the pension benefit obligations to the period the related services are rendered by the members.
Pension Statutory Actuarial Funding Valuation: a valuation performed by an actuary to determine whether a pension plan has sufficient money to pay for its obligations when they become due. The valuation determines the contributions required to meet the pension benefit obligations.
Present Value: the current worth of one or more future cash payments, determined by discounting the payments using a given rate of interest.
Program Expense: total expense excluding interest on debt.
Public Accounts: the Consolidated Financial Statements of the Province along with supporting statements and schedules as required by the Financial Administration Act.
Real GDP: gross domestic product measured to exclude the impact of changing prices.
Recognition: the process of including an item in the financial statements of an entity.
Reserve: an amount included in the fiscal plan to protect the plan against unforeseen adverse changes in the economic outlook, or in the Provincial revenue and expense. Actual costs incurred by the ministry, which pertain to the reserve, are recorded as expenses of that ministry. See Contingency Fund.
Segment: a distinguishable activity or group of activities of a government for which it is appropriate to separately report financial information to help users of the financial statements identify the resources allocated to support the major activities of the government.
Sinking Fund Debenture: a debenture that is secured by periodic payments into a fund established to retire long-term debt.
| | |
| 110 | | Consolidated Financial Statements, 2015–2016 |
Straight-Line Basis of Amortization: a method whereby the annual amortization expense is computed by dividing i) the historical cost of the asset by ii) the number of years the asset is expected to be used.
Surplus: the amount by which revenues exceed government expenses in any given year. On a forecast basis, a reserve may be included.
Swaption: an option granting its owner the right but not the obligation to enter into an underlying swap. Although options can be traded on a variety of swaps, the term swaption typically refers to options on interest rate swaps.
Tangible Capital Assets: physical assets including land, buildings, transportation infrastructure, vehicles, leased assets, machinery, furniture, equipment and information technology infrastructure and systems, and construction in progress.
Temporary Investments: investments that are transitional or current in nature and generally capable of reasonably prompt liquidation.
Total Debt: the Province’s total borrowings outstanding.
Total Expense: sum of program expense and interest on debt expense.
Transfer Payments: grants to individuals, organizations or other levels of government for which the government making the transfer does not:
| | • | | receive any goods or services directly in return, as would occur in a purchase or sale transaction; |
| | • | | expect to be repaid, as would be expected in a loan; or |
| | • | | expect a financial return, as would be expected in an investment. |
Treasury Bills: short-term debt instrument issued by governments on a discount basis.
Unrealized Gain or Loss: an increase or decrease in the fair value of an asset accruing to the holder. Once the asset is disposed of or written off, the gain or loss is realized.
| | | | |
| Consolidated Financial Statements, 2015–2016 | | | 111 | |
SOURCES OF ADDITIONAL INFORMATION
The Ontario Budget
The Ontario government presents a Budget each year, usually in the early spring. This document outlines expected expense and revenue for the upcoming fiscal year. For an electronic copy of the Ontario Budget, visit the Ministry of Finance website at www.fin.gov.on.ca.
The Estimates of the Province of Ontario
The government’s spending Estimates for the fiscal year commencing April 1 are presented to members of the Legislative Assembly following the presentation of the Ontario Budget by the Minister of Finance. The Estimates outline the spending plans of each ministry and are submitted for approval to the Legislative Assembly according to the Supply Act. For electronic access, go to: www.fin.gov.on.ca.
Ontario Finances
This is a quarterly report on the performance of the government’s Budget for the fiscal year. It covers developments during a quarter and provides a revised outlook for the remainder of the year. For electronic access, go to: www.fin.gov.on.ca.
Ontario Economic Accounts
This quarterly report contains data on Ontario’s economic activity. For electronic access, go to: www.fin.gov.on.ca.
| | |
| 112 | | Consolidated Financial Statements, 2015–2016 |

Please address your comments on this report to: The Honourable Liz Sandals President of the Treasury Board Room 4320, Fourth Floor, Whitney Block 99 Wellesley Street West Toronto, Ontario M7A 1W3 You can also send your comments to the Minister by electronic mail to: infotbs@ontario.ca To access this document online, visit Ontario.ca/publicaccounts © Queen’s Printer for Ontario, 2016 ISSN 0381-2375 (Print) ISSN 1913-5556 (Online)