Exhibit 99.2
ADDITIONAL INFORMATION RELATING TO THE PROVINCE 1
| | | | |
| | | Page Number | |
| |
Map of Ontario | | | 1 | |
| |
Overview | | | 2 | |
| |
Area and Population | | | 2 | |
| |
Government | | | 2 | |
| |
Constitutional Framework | | | 2 | |
| |
Operational Framework | | | 2 | |
| |
Implications for Provincial Financial Statements | | | 2 | |
| |
Foreign Relations | | | 3 | |
| |
The Budget and Quarterly Reporting | | | 3 | |
| |
Public Finance | | | 4 | |
| |
Revenue | | | 4 | |
| |
Taxation | | | 4 | |
| |
Non-tax | | | 8 | |
| |
Public Debt | | | 15 | |
| |
Publicly Held Debt Summary | | | 15 | |
| |
Debt Issuances Since 2016-17 Fiscal Year End | | | 16 | |
| |
Outstanding Debt Tables as at Fiscal Year End | | | 19 | |
| |
SEC Registered Debt | | | 43 | |
| |
Ontario Electricity Industry | | | 45 | |
| |
Contingent Liabilities | | | 47 | |
| |
Obligations Guaranteed by the Province of Ontario | | | 47 | |
| |
Economic Data Tables | | | 49 | |
| |
Ontario Economy | | | | |
| |
Ontario, Gross Domestic Product, 2003–2016 | | | 50 | |
| |
Ontario, Growth in Gross Domestic Product, 2003–2016 | | | 51 | |
| |
Ontario, Real Gross Domestic Product by Industry at Basic Prices, 2013–2016 | | | 52 | |
| |
Ontario, Growth in Real Gross Domestic Product by Industry at Basic Prices, 2013–2016 | | | 53 | |
| |
Ontario, Real Gross Domestic Product at Basic Prices in Selected Manufacturing Industries, 2013–2016 | | | 54 | |
| |
Ontario, Growth in Real Gross Domestic Product at Basic Prices in Selected Manufacturing Industries, 2013–2016 | | | 54 | |
| |
Ontario, Housing Market Indicators, 2013–2016 | | | 55 | |
| |
Selected Financial Indicators, 2003–2016 | | | 56 | |
| 1 | Any dollar amounts in Exhibit 99.2 are expressed in Canadian dollars ($) unless otherwise specified or the context otherwise requires. |
| | | | |
Ontario, International Merchandise Trade | | | | |
| |
Ontario, International Merchandise Exports by Major Commodity, 2016 | | | 57 | |
| |
Ontario, International Merchandise Imports by Major Commodity, 2016 | | | 58 | |
| |
Ontario, International Merchandise Exports by Top 25 Trading Partners, 2016 | | | 59 | |
| |
Ontario, International Merchandise Imports by Top 25 Trading Partners, 2016 | | | 60 | |
| |
Demographic Characteristics | | | | |
| |
Ontario, Selected Demographic Characteristics, 2009–2017 | | | 61 | |
| |
Ontario, Components of Population Growth, 2007–08 to 2016–17 | | | 62 | |
| |
Ontario Labour Markets | | | | |
| |
Ontario, Labour Force, 2003–2016 | | | 63 | |
| |
Ontario, Employment, 2003–2016 | | | 64 | |
| |
Ontario, Unemployment, 2003–2016 | | | 65 | |
| |
Employment Insurance (EI), 2003–2016 | | | 66 | |
| |
Ontario, Labour Compensation, 2003–2016 | | | 67 | |
| |
Ontario, Employment by Occupation, 2003–2016 | | | 68 | |
| |
Ontario, Distribution of Employment by Occupation, 2003–2016 | | | 69 | |
| |
Ontario, Employment by Industry, 2007–2016 | | | 70 | |
| |
Ontario, Growth in Employment by Industry, 2007–2016 | | | 72 | |
| |
Ontario, Employment Level by Economic Regions, 2006–2016 | | | 74 | |
| |
Ontario, Employment Level by Industry for Economic Regions, 2016 | | | 75 | |
| |
Ontario Economic Regions | | | 77 | |
(Note: Data in the tables may not add to totals due to rounding.)
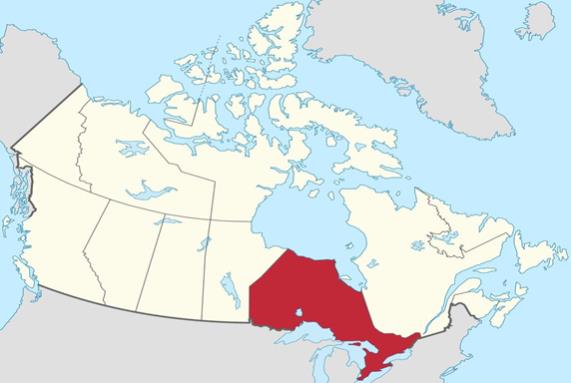
Province of Ontario’s Location in Canada

Province of Ontario’s Location in the World
1
OVERVIEW
Area and Population
The Province of Ontario covers an area of approximately 1,076,395 square kilometres (415,598 square miles), about 10.8% of Canada, and is about 11% as large as the United States. The estimated population of Ontario on July 1, 2017 was 14.2 million, or 38.7% of Canada’s population of 36.7 million. Since 1997, the populations of Ontario and Canada have increased at average annual rates of 1.2% and 1%, respectively. Although it constitutes only 12% of the area of the Province, southern Ontario is home to approximately 94.3% of its population (as of July 1, 2016). The population of the Greater Toronto Area, the largest metropolitan area in Canada, was estimated to be 6.7 million on July 1, 2016.
Government
Canada is a federation with a parliamentary system of government. Constitutional responsibilities are divided between the federal government, the 10 provinces and the 3 territories.
The Premier of the Province of Ontario (the “Premier”) is traditionally the leader of the political party with the greatest number of members elected to the Legislative Assembly. The Cabinet through the Lieutenant Governor, who represents the Crown, formally exercises executive power. Cabinet ministers are usually nominated from among members of the Premier’s party. The Legislative Assembly consists of 107 seats, each representing a specified territorial division of the Province, and is elected for a four-year term. A dissolution of the Legislative Assembly prior to the end of the four-year term may be requested by the Premier at the Premier’s own volition or if the government loses the confidence of the Legislative Assembly by being defeated on an important vote.
The last Provincial election was held on June 12, 2014. The Ontario Liberal Party currently has 56 seats in the Legislative Assembly, the Progressive Conservative Party of Ontario has 29 seats, the New Democratic Party of Ontario has 19 seats. The current government of the Province is formed by the Ontario Liberal Party.
Constitutional Framework
Canada is a federation and its constitution (“Constitution”) establishes the division of responsibilities between the federal and provincial levels of government. Each provincial government and the federal government has supremacy within its respective sphere of assigned responsibilities. Jurisdiction over the establishment and operation of municipalities is granted exclusively to the provinces.
The federal government is empowered to raise money by any mode or system of taxation. It has exclusive jurisdiction over such matters as the regulation of trade and commerce, currency and coinage, banks and banking, national defence, foreign affairs, postal services, railways and navigation, as well as those areas not exclusively assigned to the provinces. Each province has authority to raise revenue through direct taxation within the province. Areas of provincial constitutional authority include health care, education, social services, municipal institutions, property and civil rights, and natural resources.
Operational Framework
Ontario administers its constitutional responsibilities through government ministries and provincially created bodies such as government-owned corporations (“Crown corporations”), agencies, boards, commissions, municipalities, school boards and hospital boards. The use of these quasi-independent bodies decentralizes the administration of provincial responsibilities. However, the Province has elected to centralize the financing of these bodies by retaining the major taxing and borrowing powers at the provincial level. Some municipalities borrow in their own names in various capital markets as did Ontario Hydro prior to its restructuring in April 1999.
Implications for Provincial Financial Statements
The provincial governments’ delivery of services in areas such as health, postsecondary education and social assistance has been supported by transfer payments from the federal government, often established through federal-provincial agreements. In fiscal year 2016-17, approximately 17.4% of the Province’s revenue came from federal transfers.
Federal-provincial funding arrangements can be complex and extensive, involving financial relationships between the Province, the federal government and provincially-created bodies. These financial interrelationships are important in understanding the revenue, expense and financing activity of the Province. Investing in provincially-created bodies has an impact on the reporting of assets. As at March 31, 2017, approximately 23.7% (2016, 25.2%) of the Financial Assets of the Province could be attributed to these intermediary activities.
2
Foreign Relations
The Province has no direct diplomatic relations with foreign countries, but has developed a high degree of international activity in order to facilitate investment in Ontario.
The Budget and Quarterly Reporting
The Fiscal Transparency and Accountability Act, 2004 (the FTAA) sets out guidelines for public reporting of the fiscal plan. It requires that the Ontario Minister of Finance (“Minister”) release an annual budget that outlines a multi-year fiscal plan. In addition, it requires the Minister to release a mid-year review of the fiscal plan, known as the Ontario Economic Outlook and Fiscal Review. Each year, the Minister must release interim updates in the Summer and Winter on Ontario’s revenues and expenses for the current year. Finally, the FTAA, among other things, also requires that quarterly information about Ontario’s economic accounts be released to the public.
3
PUBLIC FINANCE
Revenue – Taxation
For the year ended March 31, 2017
This schedule summarizes the sources of the Province’s revenue by main classification.
| | | | | | | | |
| | | 2017 $ | | | 2016 $ | |
TAXATION | | | | | | | | |
Personal Income Tax | | | 30,670,658,803 | | | | 31,140,531,121 | |
Sales Tax | | | 24,750,027,309 | | | | 23,455,554,526 | |
Corporations Tax | | | 14,871,809,565 | | | | 11,427,707,512 | |
Employer Health Tax | | | 5,908,191,460 | | | | 5,648,931,985 | |
Education Property Tax | | | 5,868,148,185 | | | | 5,839,244,688 | |
Ontario Health Premium | | | 3,575,016,709 | | | | 3,452,922,027 | |
Land Transfer Tax | | | 2,727,892,187 | | | | 2,118,025,670 | |
Gasoline Tax | | | 2,625,622,226 | | | | 2,458,654,606 | |
Tobacco Tax | | | 1,230,443,838 | | | | 1,225,621,601 | |
Fuel Tax | | | 742,234,805 | | | | 751,441,968 | |
Beer and Wine Tax | | | 588,519,952 | | | | 582,392,616 | |
Electricity Payments-In-Lieu of Tax | | | 333,694,315 | | | | 3,247,000,000 | |
Corporation Preferred Share Dividend Tax | | | 205,785,929 | | | | 226,699,786 | |
Estate Administration Tax | | | 181,473,765 | | | | 169,470,033 | |
Mining Profits Tax | | | 37,263,192 | | | | 42,176,204 | |
Provincial Land Tax | | | 17,460,705 | | | | 11,846,092 | |
Gross Revenue Charge – Property Tax Component | | | 4,886,165 | | | | 14,717,204 | |
Race Tracks Tax | | | 4,459,444 | | | | 4,320,377 | |
Mining Land Tax – Mining Act | | | 2,165,526 | | | | 930,951 | |
| | | | | | | | |
TOTAL TAXATION | | | 94,345,754,080 | | | | 91,818,189,685 | |
| | | | | | | | |
Source: Ontario Ministry of Finance
Personal Income Tax revenue is collected by the federal government on behalf of the Province. The amount reported by the Province in 2016-17 is net of $6,951,411 in Ontario tax credits, excluding tax credits reported as expenses.
For 2018, the Ontario Personal Income Tax rates are: 5.05% for taxable income of up to $42,960; 9.15% for taxable income over $42,960 and up to $85,923; 11.16% for taxable income over $85,923 and up to $150,000; 12.16% for taxable income over $150,000 and up to $220,000; and 13.16% for taxable income over $220,000. For 2017, the Ontario Personal Income Tax rates are: 5.05% for taxable income of up to $42,201; 9.15% for taxable income over $42,201 and up to $84,404; 11.16% for taxable income over $84,404 and up to $150,000; 12.16% for taxable income over $150,000 and up to $220,000; and 13.16% for taxable income over $220,000. For 2016, the Ontario Personal Income Tax rates are: 5.05% for taxable income of up to $41,536; 9.15% for taxable income over $41,536 and up to $83,075; 11.16% for taxable income over $83,075 and up to $150,000; 12.16% for taxable income over $150,000 and up to $220,000; and 13.16% for taxable income over $220,000. Ontario non-refundable tax credits are provided for individual and family circumstances (e.g., basic amount, spouse, medical expenses) at the rate of 5.05% (11.16% for charitable donations in excess of $200), before calculating the provincial surtax and Ontario Tax Reduction. Ontario non-refundable tax credit amounts are indexed annually. The Ontario Dividend Tax Credits are calculated after the provincial surtax and before the Ontario Tax Reduction. For 2016 and 2017, the credits were provided at a rate of 10% for eligible dividends and at a rate of 4.2863% for non-eligible dividends.
4
Higher-income earners are subject to a surtax. For 2018, the surtax is equal to 20% of Ontario income tax in excess of $4,638, plus 36% of Ontario income tax in excess of $5,936. For 2017, the surtax is equal to 20% of Ontario income tax in excess of $4,556, plus 36% of Ontario income tax in excess of $5,831. For 2016, the surtax is equal to 20% of Ontario income tax in excess of $4,484, plus 36% of Ontario income tax in excess of $5,739.
Ontario income tax is eliminated by the Ontario Tax Reduction if Ontario tax is below a threshold amount. If Ontario tax exceeds the taxfiler’s threshold amount, the Ontario Tax Reduction may reduce the taxfiler’s Ontario tax. For 2018, the basic threshold amount is $239 and the additional amount for each dependent child age 18 and under, and each disabled or infirm dependant, is $442. For 2017, the basic threshold amount is $235 and the additional amount for each dependent, child age 18 and under and each disabled or infirm dependant is $434. For 2016, the basic threshold amount is $231 and the additional amount for each dependent child age 18 and under and each disabled or infirm dependant is $427.
Sales Tax revenue includes revenue from the provincial portion of the Harmonized Sales Tax (HST) and the Retail Sales Tax (RST). The HST is a single value-added tax based on the federal Goods and Services Tax. The provincial portion of the HST is 8% and the federal portion is 5%, for a combined HST rate of 13%. The federal government is responsible for the collection and administration of HST, with revenues distributed to the Province based on a revenue allocation formula. Ontario also maintains RST of 8% on certain insurance premiums and 13% on private transfers of specified vehicles. RST is collected and administered by the Province. Sales Tax revenue reported by the Province is net of sales tax credits of $1,775,409,956 in 2016-17 and $1,718,816,342 in 2015-16.
Corporations Tax is comprised of three types of taxes levied on corporations: income tax, insurance premiums tax and special additional tax on life insurance corporations. Details of these taxes follow.
Income Tax: The general statutory Corporate Income Tax (CIT) rate is 11.5% (reduced from 14% to 12% on July 1, 2010 and from 12% to 11.5% on July 1, 2011). Active business income from manufacturing and processing (M&P), mining, logging, fishing and farming is subject to a lower CIT rate of 10% (reduced from 12% effective July 1, 2010). Small Canadian-controlled private corporations (CCPCs) are also eligible for a lower CIT rate of 4.5% (reduced from 5.5% effective July 1, 2010) on the first $500,000 of active business income. Effective May 2, 2014, and prorated for taxation years that straddle that date, the small business CIT rate is phased out for large CCPCs, and associated groups of CCPCs, with more than $10 million (fully eliminated with more than $15 million) of taxable capital employed in Canada in the previous year. The Province also levies a Corporate Minimum Tax (CMT) that effectively acts as a pre-payment of regular CIT. CMT is calculated as the amount by which 2.7% (reduced from 4% effective July 1, 2010) of adjusted net income for accounting purposes exceeds CIT payable.
Insurance Premiums Tax: Insurance companies are subject to a 2% insurance premiums tax on life, accident and sickness insurance premiums, 3.5% on property insurance premiums and 3% on other (e.g. casualty) insurance premiums.
Special Additional Tax: Life insurance corporations pay a Special Additional Tax at a rate of 1.25% of taxable capital employed in Ontario that exceeds a minimum capital allowance of $10 million, with CIT and CMT creditable against this tax.
Education property taxes are collected by municipalities and transferred to school boards for the purposes of funding education. Education property tax rates are set annually by the Minister of Finance for each class of real property. The tax is levied on the assessed value of property at a uniform rate of 0.179% for residential properties in 2017. Rates for commercial, industrial and pipeline properties vary across the Province. These rates are regulated under the Education Act. The Education Property Tax amounts shown are net of $1,054,196,837 in property tax credits and grants in 2016-17 and $1,060,400,794 in 2015-16. The amounts also reflect a number of rebates, reductions and exemptions available across the province.
The Employer Health Tax is paid by employers on their Ontario payroll. Employers with annual Ontario payroll of $200,000 or less calculate tax payable at 0.98% of their taxable annual Ontario payroll; employers with annual Ontario payroll over $200,000 and up to $400,000 calculate tax payable at graduated rates that apply to their taxable annual Ontario payroll starting at 1.101% through to 1.829%; and employers with annual Ontario payroll in excess of $450,000 calculate tax payable at 1.95% of their taxable annual Ontario payroll. A tax exemption is provided for the first $450,000 of annual Ontario payroll paid by private sector employers, including their associated entities. Employers normally cannot claim the exemption if their Ontario payroll for the year (including the payroll of any associated employers) is over $5,000,000. Registered charities continue to claim the tax exemption at all payroll sizes and are eligible for a separate exemption for each qualifying location.
Gasoline Tax is levied on gasoline, propane used in a licensed motor vehicle, and aviation fuel used to power aircraft. The tax rate for gasoline is 14.7 cents per litre. The tax rate for propane used in licensed motor vehicles is 4.3 cents per litre. The tax rate for aviation fuel used in powering aircraft increased from 4.7 cents per litre to 5.7 cents per litre on April 1, 2016, and increased by a further one cent per litre on April 1, 2017 to 6.7 cents per litre. The majority of tax is collected for the Province by Ministry-designated gasoline, propane, and aviation fuel wholesalers.
5
Land Transfer Tax (LTT) is collected on the transfer of land and is payable on the value of the consideration, which is generally the purchase price. Up to December 31, 2016, the LTT rates were 0.5% on the amount up to and including $55,000; 1% on the amount over $55,000 up to and including $250,000; 1.5% on the amount over $250,000; and 2% on the amount over $400,000 for land with one or two single-family residences. Effective January 1, 2017, for land with one or two single-family residences, the tax rate on the amount over $2,000,000 increased from 2% to 2.5%. For all other types of property, the tax rate on the amount over $400,000 increased from 1.5% to 2%. In addition, first-time homebuyers may be eligible to receive a refund of LTT. The maximum amount of the refund increased from $2,000 to $4,000, effective January 1, 2017. Effective April 21, 2017, a 15% Non-Resident Speculation Tax (NRST) is imposed on the purchase or acquisition of an interest in residential property located in the Greater Golden Horseshoe Region by individuals who are not citizens or permanent residents of Canada or by foreign corporations and taxable trustees. The NRST applies in addition to the general LTT in Ontario.
Tobacco Tax covers all forms of tobacco products. The specific tax rate per cigarette and per gram or part gram of fine cut tobacco and all other tobacco products except cigars was 15.475 cents. This rate increased from 15.475 cents to 16.475 cents on April 28, 2017. The rate of tax on cigars is 56.6% of the taxable price of the cigar. The majority of tax is collected for the Province by Ministry-designated tobacco and cigar wholesalers.
Fuel Tax is levied on every purchaser of clear middle distillate fuel used in internal combustion engines. The fuel tax rate is 14.3 cents per litre, unless the fuel is used in railway equipment, in which case the rate is 4.5 cents per litre. The majority of tax is collected for the Province by Ministry-designated wholesalers.
Beer and Wine Taxes were effective July 1, 2010. These taxes replaced certain alcohol charges and were revenue neutral for the Ontario Government. Taxes apply on purchasers of beer from a beer manufacturer’s on-site store, The Beer Store, or a licensed establishment. Taxes are also imposed on purchasers of draft beer made by a brew pub and wine and wine coolers from a winery retail store.
Payments-in-Lieu of Tax (PILs): PILs under the Electricity Act, 1998 (Ontario) are made by Ontario Power Generation Inc. (OPG) and municipal electricity utilities to the Ontario Electricity Financial Corporation (OEFC). OEFC is the Ontario Hydro successor company that is responsible for servicing and retiring the debt and certain other liabilities of the former Ontario Hydro. All PILs received by OEFC are used to service and retire its obligations. The amount of PILs replicates the amount of tax that would be payable under the Income Tax Act (Canada), the Corporations Tax Act (Ontario) and the Taxation Act, 2007 (Ontario) if these publicly-owned corporations were not exempt from federal and provincial corporate taxes. In the 2015 Ontario Budget, the Province announced its intention to sell up to 60 per cent of Hydro One by way of public offerings. As a result of the broadening of Hydro One ownership, Hydro One ceased to be exempt from federal and provincial corporate income taxes and is, therefore, no longer subject to PILs. The Minister of Finance, by statute, is to make payments to the OEFC equal to the amount of provincial income tax payable by Hydro One Inc. under the Taxation Act, 2007 (Ontario).
OPG, Hydro One and municipal electricity utilities also make payments in lieu of additional property taxes to the OEFC. The Gross Revenue Charge portion payable to OEFC is also recorded under electricity PILs.
The federal government remits to the Province 35 per cent of the net taxes that it collects with respect to preferred share dividends paid by corporations with operations in Ontario.
The Estate Administration Tax is payable by the estate of a deceased person on the issuance of a certificate of appointment of an estate trustee by an Ontario court. The amount of tax is equal to $5 for each $1,000, or part thereof, of the first $50,000 of the value of the estate and $15 for each $1,000, or part thereof, of the value of the estate exceeding $50,000. If the value of the estate does not exceed $1,000, the estate is exempt from this tax.
Effective January 1, 2001, the existing property taxes and water rental charges paid by hydro-electric generating station owners and water power leaseholders were replaced with taxes and charges on the gross revenues of hydro-electric generating stations. The Property Tax component is payable to the OEFC and is included as PILs on consolidation to the Province. The Water Rental component of the GRC is payable to the Minister of Finance and is included under Other Revenue – Royalties.
Provincial Land Tax is levied on land in areas without municipal organization at the rates prescribed by regulation. The rate that applies depends on which property class the land is classified and whether the land is in a locality as defined by the Assessment Act.
6
Mining Tax: Ontario levies a Mining Tax on profits in excess of $500,000 derived from the extraction of mineral substances raised and sold by operators of Ontario mines. The $500,000 annual deduction must be shared by associated corporations. The tax rate on taxable profit that is subject to Mining Tax is 10% for non-remote mines and 5% for remote mines. A mining tax exemption on up to $10 million of profit during an exempt period is available for each new mine. The exempt period for a new non-remote mine is three years and the exempt period for a new remote mine is 10 years. The mining tax exemption is also available for a major expansion of an existing non-remote mine.
Diamond Royalty: The Mining Tax does not apply to diamond mining. Diamonds are subject to a Diamond Royalty calculated as a percentage on the value of output (net of deductions) of a diamond mine. The Diamond Royalty rate is the lesser of 13% of the value of the output of the mine and the amount calculated on the value of output according to a graduated royalty rate scale.
The Race Tracks Tax is levied at the rate of 0.5% on all wagers, and is collected and remitted to the Province by track operators.
The Mining Land Tax (previously called the Acreage Tax) is levied under the Mining Act at a rate of $4.00 per hectare in municipalities and territories without municipal organization.
The introduction of the Ontario Health Premium (OHP) has helped to ensure the government’s ability to make much needed investments in the province’s health care system. Every penny of the OHP goes toward improving Ontario’s health services. In 2016-17, OHP revenue increased by $122 million to $3,575 million, up from $3,453 million in 2015-16. During the same period, expenses in the health sector increased by $1.025 million to $56,026 million, up from $55,001 million in 2015-16.
Ontario Health Premium revenue supports expenditures in all areas of the health sector and is not earmarked by program area. In 2016-17, revenue from the health premium was $3,575 million, or 6.4 per cent of the $56,026 million in total expenses for the health sector. This compares to $3,453 million or 6.3 per cent of $55,001 million in 2015-16. Below is a table that shows an example of how the health premium revenue supports major investments in the health care sector and also the level of support each sector would receive if the percentage shares in 2015-16 and 2016-17 were allocated proportionately across each expense area.
Example of How the Health Premium Supports Investments in the
Health Care Sector: OHP Revenue as a Share of Total Health
Expenditures Applied Proportionately Across Expense Areas
| | | | | | | | |
($ Millions) | | 2016-17
6.4% | | | 2015-16
6.3% | |
Hospitals | | | 1,071 | | | | 1,108 | |
OHIP | | | 903 | | | | 940 | |
Home Care, Community and Mental Health Services | | | 338 | | | | 342 | |
Long–Term Care Homes | | | 257 | | | | 267 | |
Ontario Drug Programs | | | 245 | | | | 266 | |
Public Health, Health Promotion and Other | | | 761 | | | | 530 | |
| | | | | | | | |
Total | | | 3,575 | | | | 3,453 | |
The Ontario Health Premium is paid by individuals resident in Ontario on the last day of the taxation year. An individual’s Ontario Health Premium liability is: $0 for taxable income of up to $20,000; 6% of taxable income over $20,000 for taxable income over $20,000 up to $25,000; $300 for taxable income over $25,000 up to $36,000; $300 plus 6% of taxable income over $36,000 for taxable income over $36,000 up to $38,500; $450 for taxable income over $38,500 up to $48,000; $450 plus 25% of taxable income over $48,000 for taxable income over $48,000 up to $48,600; $600 for taxable income over $48,600 up to $72,000; $600 plus 25% of taxable income over $72,000 for taxable income over $72,000 up to $72,600; $750 for taxable income over $72,600 up to $200,000; $750 plus 25% of taxable income over $200,000 for taxable income over $200,000 up to $200,600; and $900 for taxable income over $200,600.
7
Revenue – Non-tax
For the year ended March 31, 2017
| | | | | | | | |
| | | 2017 | | | 2016 | |
| | | $ | | | $ | |
GOVERNMENT OF CANADA | | | | | | | | |
Canada Health Transfer | | | 13,910,300,000 | | | | 13,088,767,000 | |
Canada Social Transfer | | | 5,145,950,000 | | | | 4,984,014,000 | |
Equalization | | | 2,304,190,000 | | | | 2,363,014,000 | |
Infrastructure Programs | | | 731,643,077 | | | | 145,524,377 | |
Labour Market Development Agreement | | | 677,836,833 | | | | 631,902,211 | |
Social Housing Agreement | | | 440,855,680 | | | | 454,541,337 | |
Indian Welfare Services Agreement | | | 277,349,806 | | | | 259,026,026 | |
Job Fund Agreement | | | 211,364,628 | | | | 205,116,954 | |
Bilingualism Development | | | 87,737,829 | | | | 84,647,772 | |
Labour Market Agreement for Persons with Disabilities | | | 76,411,477 | | | | 76,411,477 | |
Legal Aid – Criminal | | | 59,212,989 | | | | 50,980,005 | |
Youth Criminal Justice Act | | | 51,923,050 | | | | 51,837,596 | |
Growing Forward 2 | | | 48,737,499 | | | | 46,813,596 | |
Student Assistance | | | 25,314,242 | | | | 35,852,802 | |
Immigration Holds Agreement | | | 13,722,551 | | | | 21,527,391 | |
Targeted Initiative for Older Workers | | | 7,810,043 | | | | 8,285,894 | |
Bridge Training Program | | | 3,000,000 | | | | 5,119,938 | |
Interoperable Electronic Health Record Project (iEHR/HIAL) | | | 0 | | | | 4,573,665 | |
Electronic Medical Record (EMR) Project | | | 0 | | | | 1,873,500 | |
Other | | | 470,595,735 | | | | 620,603,913 | |
| | | | | | | | |
TOTAL GOVERNMENT OF CANADA | | | 24,543,955,439 | | | | 23,140,433,099 | |
| | | | | | | | |
8
The Canada Health Transfer (CHT) is a federal block transfer that supports health care spending in the provinces and territories. Beginning in 2014-15, the CHT has been allocated to provinces and territories on an equal per capita basis. To receive CHT transfers, provinces and territories must comply with the principles of the Canada Health Act.
The Canada Social Transfer (CST) is a federal block transfer that supports provincial and territorial expenditures on post-secondary education, social assistance and social services, including early childhood development, and early learning and child care services. Beginning in 2007-08, the CST has been allocated to provinces and territories on an equal per capita basis. To receive CST transfers, provinces and territories cannot impose residency requirements in determining eligibility for social assistance to Canadian citizens, permanent residents, persons with a temporary resident permit, and refugee claimants waiting to receive permanent resident status.
Equalization is the federal government’s transfer program for addressing fiscal disparities among provinces. The Equalization program aims to ensure that provincial governments have sufficient revenues to provide reasonably comparable levels of public services at reasonably comparable levels of taxation. Equalization payments are unconditional – receiving provinces are free to spend the funds according to their own priorities.
Infrastructure funding to Ontario is provided through the Post-Secondary Institutions Strategic Investment Fund, Public Transit Infrastructure Fund, the agreement for Investment in Affordable Housing, the Building Canada Fund and other agreements. These agreements support the construction, renewal, improvement and expansion of the Province’s physical capital, including roads, bridges, public transit and water systems.
The Labour Market Development Agreement (LMDA) provides for the transfer to Ontario of labour market development programs and services previously run by the federal government. LMDA funding supports Ontario’s skills and employment training programs, particularly for those who are eligible for Employment Insurance (EI) benefits. The LMDA is funded under the legislative authority of Part II of the Employment Insurance Act.
Social Housing Agreement reimbursements are the federal portion of the cost of subsidizing low-rental housing programs. The Province receives funding from the Canada Mortgage and Housing Corporation (CMHC) to administer social housing in Ontario.
The Indian Welfare Services Agreement is a unique bilateral (Ontario-Canada) cost-sharing agreement to support eligible social services provision on reserve. The Agreement recognizes a shared Ontario-Canada commitment to deliver to members of First Nations living on reserve, provincial welfare programs available to the population of the province not living on reserve, and those living off reserve for up to one year, and outlines a formula to determine Canada’s financial contribution.
The Canada-Ontario Job Fund Agreement (JFA) provides funding for labour market programs and services that focus on skills development for unemployed individuals who are not Employment Insurance clients and employed individuals who require further training such as those who do not have a high school diploma, or recognized certification or who have low levels of literacy and essential skills. The JFA also makes provision for the support of employer-sponsored training for certain eligible training costs provided by an eligible third-party institution. On April 1, 2014, the JFA replaced the Canada-Ontario Labour Market Agreement (LMA).
Bilingualism Development reimbursements are the federal government’s portion of the cost of providing services in both official languages and of providing adequate educational facilities for teaching the second official language. The federal government also contributes to Ontario’s initiatives in French-language schools, such as the establishment of administrative structures in new French-language school boards, and initiatives designed to improve the achievements of French-language students.
Under the Labour Market Agreement for Persons with Disabilities (LMAPD), the federal government provides contributions to Ontario to support measures to enhance the employability of persons with disabilities, and increase the employment opportunities available to persons with disabilities by addressing employer needs and encouraging employers to remove barriers faced by persons with disabilities.
Legal Aid payments are the federal government’s contribution to assist in providing legal aid services to economically disadvantaged people in serious criminal matters and proceedings under the Youth Criminal Justice Act. They also help ensure that certain minimum standards of legal aid are maintained in accordance with the Agreement Respecting Legal Aid in Criminal Law, the Youth Criminal Justice Act and immigration and refugee matters.
Youth justice transfer payment programs are ongoing, and mandated under the Youth Criminal Justice Act. The federal government cost-shares a portion of the Youth Justice Services expenditures.
9
Growing Forward 2 is a federal-provincial initiative that encourages innovation, competitiveness and market development in Canada’s agri-food and agri-products sector. In Ontario, Growing Forward 2 offers resources, tools and cost-shared funding assistance to eligible producers, processors, organizations and collaborations to grow their profits, expand markets and manage shared risks.
Student Assistance includes Canada Study Grants and the administration of Canada Student Loans. Canada Study Grants are provided to students with dependants, high-need part-time students, students with disabilities, and women in doctoral studies.
The Immigration Holds Agreement represents reimbursement by the federal government for the cost of detaining people awaiting an immigration examination, inquiry or removal.
The Targeted Initiative for Older Workers (TIOW) is a federal-provincial cost-shared program that helps unemployed workers aged 55 to 64. TIOW is available in communities of fewer than 250,000 people that have high unemployment or rely to a large extent on single industries. The initiative helps older workers find programs and services that increase their ability to find work, reintegrate back into employment and ensure that they remain active and productive workers while their communities undergo adjustment.
Federal government funding for the Ontario Bridge Training Program supports programs for skilled immigrants who are facing barriers to workforce integration and retention in the Ontario labour market.
Canada Health Infoway’s Interoperable Electronic Health Record (iEHR) investment program supported jurisdictional projects that built interoperable EHR systems. Federal funding to Ontario was provided under the Interoperable Electronic Health Record/Health Information Access Layer (iEHR/HIAL) Agreement. These solutions enabled authorized health care providers to view and, in some cases, update a patient’s essential health information. 2015-16 is the last year Ontario expects to receive revenue under this transfer.
Funding was received from Canada Health Infoway to support efforts to increase the number of clinicians adopting and using an electronic medical record (EMR) system. 2015-16 is the last year Ontario expects to receive revenue under this transfer.
Other payments from the federal government included, among others:
| | a) | Funding to support sector-specific services covered under different agreements, such as the First Nation Policing Agreement, Biology Casework Analysis Contribution Program Agreement for DNA testing, and Supporting Families Fund agreement for family law services; |
| | b) | Annual subsidies under the Constitution Act, 1907; |
| | c) | Interest on the Common School Fund. |
10
| | | | | | | | |
FEES, DONATIONS AND OTHER REVENUES FROM HOSPITALS,
SCHOOL BOARDS AND COLLEGES (BPS) | | 2017 $ | | | 2016 $ | |
Hospitals | | | 4,070,845,194 | | | | 3,913,579,171 | |
School Boards | | | 1,389,254,467 | | | | 1,341,474,269 | |
Colleges | | | 2,497,409,330 | | | | 2,238,385,192 | |
| | | | | | | | |
TOTAL FEES, DONATIONS AND OTHER REVENUES FROM HOSPITALS, SCHOOL BOARDS AND COLLEGES (BPS) | | | 7,957,508,991 | | | | 7,493,438,632 | |
| | | | | | | | |
Fees, Donations and Other Revenues from Hospitals, School Boards and Colleges (BPS Organizations) represent third-party revenues that BPS Organizations received from the public such as patient fees, tuition fees, ancillary services, donations and other revenues from non-provincial sources.
| | | | | | | | |
| | | 2017 | | | 2016 | |
| INCOME FROM GOVERNMENT ENTERPRISES | | $ | | | $ | |
Ontario Lottery and Gaming Corporation | | | 2,358,450,000 | | | | 2,233,101,000 | |
Liquor Control Board of Ontario | | | 2,349,118,000 | | | | 1,957,168,000 | |
Hydro One Limited | | | 499,674,000 | | | | 236,000,000 | |
Ontario Power Generation Incorporated | | | 342,000,000 | | | | 463,000,000 | |
Brampton Distribution Holdco. Incorporated | | | 18,000,000 | | | | 20,000,000 | |
| | | | | | | | |
TOTAL INCOME FROM GOVERNMENT ENTERPRISES | | | 5,567,242,000 | | | | 4,909,269,000 | |
| | | | | | | | |
Source: Ontario Ministry of Finance
Income from Government Enterprises represents amounts received by the Province from government business enterprises.
The Ontario Lottery and Gaming Corporation (OLG) conducts and manages gaming on behalf of the Province of Ontario, including lottery, casinos and slots, e-Bingo halls, and internet Gaming. OLG also administers funding to the horse racing industry. Ontario’s gaming industry employs thousands of Ontarians and contributes to local economic development across the province.
OLG is modernizing lottery and gaming in Ontario to optimize the revenue from its business in a socially responsible manner. Modernizing the OLG will enhance the funding available to pay for important public services such as healthcare and education by broadening the role of the private sector in OLG day-to-day lottery and gaming site operations and encouraging capital investments and job creation.
The OLG also continues to integrate horse racing into its gaming strategy and is working to establish a future long-term funding arrangement with the industry. The arrangement would be subject to government approvals.
Liquor Control Board of Ontario (LCBO) profits are generated from the sale of beer, wine, coolers, and spirits.
Hydro One Inc. (now a subsidiary of Hydro One Limited) and Ontario Power Generation Incorporated (OPG) were created as part of the restructuring of the former Ontario Hydro. The Province’s proportional share of net income from Hydro One Limited (and previously Hydro One Inc.) and the net income from OPG are consolidated in the Province’s finances. OPG revenue is derived primarily from the sale of electricity from its generating stations. Hydro One revenue is derived primarily from the transmission and distribution of electricity.
Prior to February 28, 2017, Brampton Distribution Holdco Incorporated revenue was derived primarily from its 100% interest in Hydro One Brampton Networks Inc., an electricity distribution company. On February 28, 2017, the Province completed the sale of Hydro One Brampton Networks Inc. to Alectra Utilities. Following the sale, Brampton Distribution Holdco Incorporated is no longer treated as a government business enterprise.
11
| | | | | | | | |
| | | 2017 $ | | | 2016 $ | |
OTHER REVENUE | | | | | | | | |
Sales and Rentals | | | 1,999,499,365 | | | | 2,101,578,040 | |
| | | | | | | | |
Fees, Licences and Permits: | | | | | | | | |
Vehicle and Driver Registration Fees | | | 1,726,641,586 | | | | 1,564,758,627 | |
Other fees and licences: Local registrars | | | 50,131,898 | | | | 51,964,891 | |
Local registrars | | | 56,912,039 | | | | 50,771,718 | |
Personal Property Security Act | | | 50,667,456 | | | | 47,622,071 | |
Drive Clean | | | 14,632,857 | | | | 14,652,155 | |
Companies – Incorporations | | | 25,917,039 | | | | 23,060,376 | |
Gaming Revenues | | | 15,624,513 | | | | 15,840,618 | |
Other | | | 598,848,019 | | | | 590,998,588 | |
| | | | | | | | |
Total Fees, Licences and Permits | | | 2,489,243,509 | | | | 2,307,704,153 | |
| | | | | | | | |
Royalties: | | | | | | | | |
Gross Revenue Charge – Water Rental Component | | | 118,167,941 | | | | 124,359,634 | |
Teranet – Polaris Royalties | | | 33,004,877 | | | | 33,000,000 | |
Crown Charges – Forestry | | | 42,271,613 | | | | 34,986,310 | |
Other | | | 78,350,889 | | | | 82,086,397 | |
| | | | | | | | |
Total Royalties | | | 271,795,320 | | | | 274,432,341 | |
| | | | | | | | |
Recovery of Prior Years’ Expenditures | | | 523,351,657 | | | | 661,853,741 | |
| | | | | | | | |
Reimbursement of Expenditures | | | 987,914,385 | | | | 991,158,707 | |
| | | | | | | | |
Fines and Penalties | | | 66,755,851 | | | | 46,611,634 | |
| | | | | | | | |
Miscellaneous: | | | | | | | | |
Electricity Debt Retirement Charge | | | 621,000,000 | | | | 859,000,000 | |
Power Supply Contract Recoveries | | | 838,000,000 | | | | 875,000,000 | |
Net Reduction of Power Purchase Contracts | | | 129,000,000 | | | | 172,000,000 | |
Independent Electricity System Operator Revenue | | | 210,999,354 | | | | 220,928,591 | |
Other | | | 182,154,373 | | | | 276,001,422 | |
| | | | | | | | |
Total Miscellaneous | | | 1,981,153,727 | | | | 2,402,930,013 | |
| | | | | | | | |
TOTAL OTHER REVENUE | | | 8,319,713,814 | | | | 8,786,268,629 | |
| | | | | | | | |
Source: Ontario Ministry of Finance
12
Sales and Rentals includes proceeds from the disposal of real property, supplies and equipment, rental of real property, leasing of Crown land and sales of goods and services provided by Provincial institutions.
Vehicle and Driver Registration fees include vehicle registration, carrier, and driver fees. Vehicle registration fees are for the authorization to operate a motor vehicle on a public road. For commercial vehicles the current fee ranges from $188.75-$4693.00. Current fees for passenger vehicles and light commercial vehicles weighing 3,000 kilograms or less used for personal purposes are $120.00 per year in Southern Ontario and $60.00 per year in Northern Ontario. Fees for motorcycles and mopeds are $42 and $12 per year respectively in Southern Ontario and $21 and $12 per year respectively in Northern Ontario. Driver fees consist primarily of driver license renewals.
The registrar’s fees consist of fees collected by the Ontario Court (General Division) in estates matters as set by O.Reg. 393/90 made under the Administration of Justice Act and the issuing, signing and filing fees for court related documents in civil matters.
Personal Property registration service fees are remittances for the registration and searches of personal property pledged as collateral to secure a loan. The fees are collected at the time of registration or search.
The modernized Drive Clean program was implemented effective January 1st 2013. Fees for the program were chargeable to the public for vehicle emissions testing, known as a “Drive Clean Emissions test.” As announced in the 2016 Ontario budget, the $30 emissions test fee for initial tests on light duty vehicles for registration renewal purposes was eliminated as of April 1, 2017 to make everyday life easier for Ontarians.
Companies’ service fees are remittances for registration, searches and certificates pertaining to incorporations, limited partnerships and business names. The fees are collected at the time of registration or search.
Gaming-related fees collected by the Alcohol and Gaming Commission of Ontario include fees for registering commercial suppliers and gaming employees of charitable gaming events, casinos, charity casinos and slot machine facilities. Also included are fees for issuing licences to conduct and manage lottery schemes such as raffles.
Effective January 1, 2001, persons who by virtue of an agreement, lease or other writing are entitled to occupy public lands are required to pay a water rental charge calculated at a rate of 9.5 % on gross revenues from the annual generation from hydro-electric-generating stations.
Crown Charges – Timber royalties are remittances for the harvesting of Crown timber on Crown land or when timber rights are reserved to the Crown on patent land. Crown charges are typically charged on a per cubic metre basis related to the tree species, end products produced and harvest volume. A base price per cubic metre, adjusted annually, is established as a minimum price. The minimum price for most harvested timber during 2016-2017 was set at zero (bioproducts only), $4.48, or $0.59 per cubic metre depending on the tree species and commodity group. The $0.59 per cubic metre reflects the rate for several underutilized species and the economic volatility in the forest industry. A residual value price, based on a percentage of the difference between the cost of manufacturing and the selling price of the forest product, is also assessed. This component based on commodity market prices is adjusted monthly and varied from $0.00 to $13.77 per cubic metre.
Beginning in 2006, funds for the Forest Resource Inventory (FRI) have been collected through the stumpage system. In 2016-2017 the FRI rate was set at either $2.50 or $0.59, depending on species group and end-use, and set aside in the Forestry Futures Trust fund account for FRI expenses until a $10 million balance in the FRI account was achieved. After reaching the $10 million level, the FRI charge is set to zero1, which occurred for this fiscal year in September 2016. The FRI collection results in no net effect to the forest industry with respect to stumpage charges, as the minimum price is reduced an equivalent amount to FRI charges, while FRI charges are being collected.
Teranet – Polaris Royalties - The Province completed the sale of its 50% ownership in Teranet in 2003-04. As part of this transaction, the Province agreed to suspend royalties from Teranet for a period of 13.67 years to March 31, 2017 in exchange for a lump sum payment of $205 million. The $205 million represents deferred royalties to be earned by the Province in future years and have been recognized in the Province’s accounts as deferred revenue. The deferred revenue is amortized to revenue over the life of the royalty suspension agreement. The annual amortization is $15 million throughout 2016-17.
In 2010-11 the Province negotiated an extension to the original Teranet agreement, resulting in a 50 year extension beyond the original amortization schedule. $1 billion in cash was received in 2010-11, and this amount represents deferred royalties to be amortized over a 56 year period from fiscal 2011-12 to 2066-67. The annual amortization for the extension is $18 million, for a combined total of $33 million per year for the years 2011-12 through 2016-17.
| 1 | The only exception to this rule is bioproducts sector, for which FRI is collected at the rate of $0.59/m3 throughout the fiscal year. |
13
Recovery of Prior Years’ Expenditures represents monies recovered subsequent to the fiscal year-end in which the related expenditures were made. These receipts represent amounts, which, except for the timing of the recovery, would have been classified as expenditure refunds.
Reimbursements of expenditures are repayments of expenses incurred by the government under formal agreement, understanding or arrangement that the expenses will be recovered in whole or in part.
Fines and Penalties are remittances for infractions of laws, regulations and rules.
The Debt Retirement Charge (DRC) is paid by electricity consumers based on consumption of electricity. The Electricity Act, 1998, allowed for the DRC to be in place until the residual stranded debt is retired. Residual stranded debt originated from the restructuring of the old Ontario Hydro and restructuring of the electricity sector. The Electricity Act, 1998 was amended by the Budget Measures Act, 2015 to provide for a legislated fixed end-date for the DRC of March 31, 2018 and is no longer linked to the residual stranded debt. Therefore, as part of the legislative amendments, and effective December 10, 2015, the “residual stranded debt” concept and requirements, including the requirement to determine the residual stranded debt from time-to-time, were removed from the Electricity Act, 1998. Ontario has removed the Debt Retirement Charge (DRC) from residential electricity users’ bills as of January 1, 2016. The residential rate class accounts for about a third of electricity load subject to the DRC with the remainder of electricity load used by commercial, institutional, industrial and other consumers. As a further step to mitigate electricity cost pressures for commercial, industrial and other users, the Budget Measures Act, 2015 amended the Electricity Act, 1998 to end the DRC on April 1, 2018, nine months earlier than previously estimated.
Revenues under “Power Supply Contract Recoveries” arise from the reselling of power and recovery from electricity consumers of the cost of power supply agreements of the Ontario Electricity Financial Corporation (OEFC), the legal continuation of the former Ontario Hydro.
Power purchase contracts were entered into by the former Ontario Hydro with non-utility generators (NUGs) located in Ontario. As the legal continuation of Ontario Hydro, as of April 1, 1999, the OEFC is the counterparty to these contracts. The contracts provide for the purchase of power at prices that were expected to be in excess of market prices. Accordingly, a power purchase contract liability was recorded on a discounted cash-flow basis. Under legislated reforms to the electricity market, OEFC began receiving actual contract prices for power from ratepayers, effective January 1, 2005, and no longer incurs losses on these power purchase contracts. At that time, the decision was made to amortize the liability to revenue over the period when most existing electricity contracts expire with the liability fully eliminated in fiscal 2021–22.
The Reduction of Power Purchase Contracts represents the effective elimination over time of the power purchase contract liability. The amount of change reflects the deduction for estimated in-year losses used to calculate the liability prior to the legislated reforms to the electricity market that effectively eliminated over time the power purchase liability.
The Independent Electricity System Operator (IESO) was established by the Electricity Act, 1998. It operates independently as a non-profit corporation without share capital. Licensed by the Ontario Energy Board (OEB), it reports to the legislature through the Ministry of Energy. The IESO directs the operation and maintains the reliability of the province’s power system. The IESO balances demand for electricity against available supply through the wholesale market and directs the flow of electricity across the transmission system. IESO’s revenue is derived primarily from OEB-approved fees for each megawatt of electricity withdrawn from the IESO-controlled grid.
Pursuant to amendments to the Electricity Act, 1998, as part of the Building Opportunity and Securing Our Future Act, 2014, the Ontario Power Authority – created to ensure adequate long term supply of electricity – and the IESO amalgamated into a new entity also called the IESO, effective January 1, 2015. The new amalgamated entity continues to fulfill the mandates of both predecessor organizations.
| | | | | | | | |
| | | 2017 | | | 2016 | |
| | | $ | | | $ | |
TOTAL REVENUES | | | 140,734,174,324 | | | | 136,147,599,045 | |
| | | | | | | | |
14
PUBLIC DEBT
Publicly Held Debt Summary
Publicly held debt is debt issued to the general public. As at March 31, 2017, the total publicly held debt issued was $321,442 million, $265,884 million of which was issued in Canadian dollars (includes $16,120 million of treasury bills), $40,106 million in U.S. dollars (includes $5,369 million in U.S. commercial paper), $11,890 million in euros, $1,642 million in Swiss francs and $1,920 million in other currencies.
From April 1, 2017 through November 30, 2017, the Province announced public offerings of bonds and notes totaling approximately CAD 26.2 billion, of which CAD 25.6 billion were for provincial purposes and CAD 0.6 billion was debt incurred for the OEFC. The tables below provide a summary of the publicly held debt issued by the Province from April 1, 2017 through November 30, 2017.
15
Debt Issuances Since 2016-17 Fiscal Year End
(from April 1, 2017 to November 30, 2017)
DEBT ISSUED BY THE PROVINCE FOR PROVINCIAL PURPOSES
| | | | | | | | | | | | | | | | |
Series | | Date of Issue | | Date of Maturity | | Interest Rate | | Funds | | Principal | | | References | |
| | | | | | | % | | | | (in millions) | | | | |
DMTN231 | | April 13, 2017 | | June 2, 2048 | | 2.800 | | Canadian$ | | | 600.0 | | | | (2) (4) | |
EMTN113 | | May 10, 2017 | | November 10, 2020 | | Libor 3m BBA+9.0 3m+9bp | | GBP | | | 400.0 | | | | (1) (5) | |
G76 | | May 18, 2017 | | May 18, 2022 | | 2.250 | | US$ | | | 2,000.0 | | | | (1) (6) | |
DMTN231 | | May 24, 2017 | | June 2, 2048 | | 2.800 | | Canadian$ | | | 600.0 | | | | (2) (4) | |
ADI5 | | May 24, 2017 | | January 27, 2027 | | 3.500 | | AUD | | | 60.0 | | | | (2) (7) | |
DMTN231 | | May 29, 2017 | | June 2, 2048 | | 2.800 | | Canadian$ | | | 750.0 | | | | (2) (4) | |
EMTN113 | | June 6, 2017 | | November 10, 2020 | | Libor 3m BBA+9.0 3m+9bp | | GBP | | | 100.0 | | | | (1) (5) | |
DMTN231 | | June 7, 2017 | | June 2, 2048 | | 2.800 | | Canadian$ | | | 600.0 | | | | (2) (4) | |
EMTN114 | | June 14, 2017 | | June 14, 2024 | | 0.375 | | EUR | | | 1,500.0 | | | | (3) (8) | |
DMTN231 | | June 19, 2017 | | June 2, 2048 | | 2.800 | | Canadian$ | | | 497.0 | | | | (2) (4) | |
OSB2017 | | June 21, 2017 | | Various | | Various | | Canadian$ | | | 64.0 | | | | (9) | |
DMTN232 | | June 26, 2017 | | March 8, 2022 | | 1.350 | | Canadian$ | | | 1,000.0 | | | | (2) (10) | |
DMTN235 | | June 27, 2017 | | June 27, 2022 | | 3 CBA*+15.0 | | Canadian$ | | | 1,602.0 | | | | (1) (11) | |
EMTN115 | | June 28, 2017 | | June 28, 2029 | | 0.250 | | CHF | | | 300.0 | | | | (3) (12) | |
DMTN234 | | June 30, 2017 | | June 2, 2027 | | 2.600 | | Canadian$ | | | 1,000.0 | | | | (2) (13) | |
DMTN231 | | July 24, 2017 | | June 2, 2048 | | 2.800 | | Canadian$ | | | 600.0 | | | | (2) (4) | |
DMTN232 | | July 28, 2017 | | March 8, 2022 | | 1.350 | | Canadian$ | | | 1,000.0 | | | | (2) (10) | |
DMTN234 | | August 8, 2017 | | June 2, 2027 | | 2.600 | | Canadian$ | | | 1,000.0 | | | | (2) (13) | |
EMTN115 | | August 18, 2017 | | June 28, 2029 | | 0.250 | | CHF | | | 100.0 | | | | (3) (12) | |
DMTN231 | | August 25, 2017 | | June 2, 2048 | | 2.800 | | Canadian$ | | | 492.0 | | | | (2) (4) | |
ADI5 | | September 6, 2017 | | January 27, 2027 | | 3.500 | | AUD | | | 30.0 | | | | (2) (7) | |
DMTN231 | | September 14, 2017 | | June 2, 2048 | | 2.800 | | Canadian$ | | | 360.0 | | | | (2) (4) | |
DMTN234 | | September 19, 2017 | | June 2, 2027 | | 2.600 | | Canadian$ | | | 750.0 | | | | (2) (13) | |
DMTN231 | | September 27, 2017 | | June 2, 2048 | | 2.800 | | Canadian$ | | | 1,500.0 | | | | (2) (4) | |
ADI5 | | September 27, 2017 | | January 27, 2027 | | 3.500 | | AUD | | | 25.0 | | | | (2) (7) | |
G75 | | October 3, 2017 | | October 3, 2022 | | 2.200 | | US$ | | | 2,000.0 | | | | (2) (14) | |
DMTN234 | | October 17, 2017 | | June 2, 2027 | | 2.600 | | Canadian$ | | | 750.0 | | | | (2) (13) | |
DMTN232 | | October 25, 2017 | | March 8, 2022 | | 1.350 | | Canadian$ | | | 1,000.0 | | | | (2) (10) | |
DMTN234 | | November 2, 2017 | | June 2, 2027 | | 2.600 | | Canadian$ | | | 900.0 | | | | (2) (13) | |
DMTN234 | | November 23, 2017 | | June 2, 2027 | | 2.600 | | Canadian$ | | | 750.0 | | | | (2) (13) | |
DMTN236 | | November 30, 2017 | | June 2, 2049 | | 2.900 | | Canadian$ | | | 750.0 | | | | (2) (15) | |
| * | 3 CBA is 3-month Canadian Bankers’ Acceptance Rate. |
References:
| (1) | Interest is paid quarterly. |
| (2) | Interest is paid semi-annually. |
| (3) | Interest is paid annually. |
| (4) | DMTN231: During the fiscal year 2017-18, the Series DMTN231 was re-opened, bringing the total issue size to $12,700 million, including $651 million for OEFC. |
| (5) | EMTN113: The Province entered into currency exchange agreements that effectively converted 500 million of these Great Britain pound obligations to Canadian dollar obligations at an exchange rate of 1.7651. |
16
| (6) | G76: The Province entered into currency exchange agreements that effectively converted 2,000 million of these US dollar obligations to Canadian dollar obligations at an exchange rate of 1.26214. |
| (7) | ADI5: The Province entered into currency exchange agreements that effectively converted 115 million of these Australian dollar obligations to Canadian dollar obligations at an exchange rate of 1.0007. |
| (8) | EMTN114: The Province entered into currency exchange agreements that effectively converted 1,500 million of these Euro obligations to Canadian dollar obligations at an exchange rate of 1.4376. |
| (9) | Ontario Savings Bonds Series 2017 were available in various types, maturities and interest rates. This was the 23rd issue of provincial savings bonds. The total proceeds from this issue were $64 million. |
| (10) | DMTN232: During the fiscal year 2017-18, the Series DMTN232 was re-opened, bringing the total issue size to $5,000 million. |
| (11) | DMTN235: During the fiscal year 2017-18, the Series DMTN235 was issued for a total of $1,602 million. |
| (12) | EMTN115: The Province entered into currency exchange agreements that effectively converted 400 million of these Swiss Franc obligations to Canadian dollar obligations at an exchange rate of 1.2921. |
| (13) | DMTN234: During the fiscal year 2017-18, the Series DMTN234 was re-opened, bringing the total issue size to $6,900 million. |
| (14) | G75: The Province entered into currency exchange agreements that effectively converted 2,000 million of these US dollar obligations to Canadian dollar obligations at an exchange rate of 1.24367. |
| (15) | DMTN236: During the fiscal year 2017-18, the Series DMTN236 was issued for a total of $750 million. |
17
DEBT ISSUED BY THE PROVINCE FOR ONTARIO ELECTRICITY FINANCIAL CORPORATION (OEFC)
| | | | | | | | | | | | | | | | | | |
Series | | Date of Issue | | Date of Maturity | | Interest Rate | | | Funds | | Principal | | | References | |
| | | | | | | % | | | | | (in millions) | | | | |
DMTN231 | | June 19, 2017 | | June 2, 2048 | | | 2.800 | | | Canadian$ | | | 103.0 | | | | (2) (4) | |
DMTN231 | | August 25, 2017 | | June 2, 2048 | | | 2.800 | | | Canadian$ | | | 108.0 | | | | (2) (4) | |
DMTN231 | | September 14, 2017 | | June 2, 2048 | | | 2.800 | | | Canadian$ | | | 440.0 | | | | (2) (4) | |
References:
| (2) | Interest is paid semi-annually. |
| (4) | DMTN231: During the fiscal year 2017-18, the Series DMTN231 was re-opened, bringing the total issue size to $12,700 million, including $651 million for OEFC. |
18
Outstanding Debt as at March 31, 2017 Fiscal Year End
| | | | | | | | | | | | | | | | |
Date of Maturity | | Date of
Issue | | | Series | | Interest Rate | | Outstanding | | | Reference | |
| | | | | | | | % | | $ | | | | |
| DEBT ISSUED FOR PROVINCIAL PURPOSES | |
NON-PUBLIC DEBT | |
| PAYABLE IN CANADA IN CANADIAN DOLLARS | |
To Canada Pension Plan Investment Board: | |
Year ending March 31 | |
2019 | | | 1999 | | | CPP | | 5.81 to 5.84 | | | 45,270,000 | | | | | |
2020 | | | 2000 | | | CPP | | 5.50 to 6.91 | | | 869,889,000 | | | | | |
2021 | | | 2001 | | | CPP | | 6.33 to 6.67 | | | 609,834,000 | | | | | |
2022 | | | 2002 | | | CPP | | 6.22 to 6.47 | | | 330,994,000 | | | | | |
2024 | | | 2004 | | | CPP | | 5.26 to 5.97 | | | 688,007,000 | | | | | |
2025 | | | 2005 | | | CPP | | 5.15 to 5.79 | | | 1,133,182,000 | | | | | |
2026 | | | 2006 | | | CPP | | 4.67 to 5.19 | | | 574,612,000 | | | | | |
2031 | | | 2009 | | | CPP | | 4.79 | | | 43,880,000 | | | | | |
2032 | | | 2009 | | | CPP | | 4.75 | | | 52,000,000 | | | | | |
2036 | | | 2006-2014 | | | CPP | | 3.41 to 4.73 | | | 725,953,000 | | | | | |
2037 | | | 2007 | | | CPP | | 4.50 to 4.76 | | | 351,269,000 | | | | | |
2038 | | | 2008-2017 | | | CPP | | 2.64 to 4.68 | | | 375,952,000 | | | | | |
2039 | | | 2009 | | | CPP | | 4.70 to 5.48 | | | 493,439,000 | | | | | |
2040 | | | 2010-2012 | | | CPP | | 4.36 to 5.03 | | | 1,179,395,000 | | | | | |
2041 | | | 2011 | | | CPP | | 4.20 to 4.86 | | | 799,613,000 | | | | | |
2042 | | | 2012 | | | CPP | | 4.23 to 4.56 | | | 954,179,000 | | | | | |
2043 | | | 2013 | | | CPP | | 3.36 to 3.62 | | | 775,272,000 | | | | | |
| | | | | | | | | | | | | | | | |
| | | | | | | | | | | 10,002,740,000 | | | | (3) | |
| | | | | | | | | | | | | | | | |
19
| | | | | | | | | | | | | | | | |
Date of Maturity | | Date of
Issue | | | Series | | Interest Rate | | Outstanding | | | Reference | |
| | | | | | | | % | | $ | | | | |
To Ontario Immigrant Investor Corporation: | |
Year ending March 31 | |
2018 | | | 2013 | | | OIIC144-145 | | 2.04 to 2.21 | | | 14,277,402 | | | | | |
2019 | | | 2014 | | | OIIC146-156 | | 2.02 to 2.53 | | | 57,095,610 | | | | | |
2020 | | | 2015 | | | OIIC157-168 | | 1.11 to 2.18 | | | 33,734,574 | | | | | |
2021 | | | 2016 | | | OIIC169-180 | | 1.30 to 1.62 | | | 6,992,917 | | | | | |
2021 | | | 2017 | | | OIIC181 | | 1.40 | | | 139,935 | | | | | |
2022 | | | 2017 | | | OIIC182-188 | | 1.212 to 1.709 | | | 1,827,947 | | | | | |
| | | | | | | | | | | | | | | | |
| | | | | | | | | | | 114,068,385 | | | | (4) | |
| | | | | | | | | | | | | | | | |
To Canada Mortgage and Housing Corporation: | |
Year ending March 31 | |
2018 | | | 1977-1979 | | | CMHC | | 7.625 to 13.00 | | | 3,190,910 | | | | | |
2019 | | | 1977-1980 | | | CMHC | | 7.625 to 15.25 | | | 7,210,044 | | | | | |
2020 | | | 1977-1980 | | | CMHC | | 7.625 to 15.75 | | | 15,832,033 | | | | | |
2021 | | | 1979-1981 | | | CMHC | | 9.50 to 15.75 | | | 9,746,541 | | | | | |
2022 | | | 1982 | | | CMHC | | 9.75 to 15.75 | | | 477,142 | | | | | |
| | | | | | | | | | | | | | | | |
| | | | | | | | | | | 36,456,670 | | | | (5) | |
| | | | | | | | | | | | | | | | |
TOTAL NON-PUBLIC DEBT | | | 10,153,265,055 | | | | | |
| | | | | | | | | | | | | | | | |
20
| | | | | | | | | | | | | | |
Date of Maturity | | Date of Issue | | Series | | Interest Rate | | Outstanding | | | Reference | |
| | | | | | | % | | $ | | | | |
PUBLICLY HELD DEBT | | | | | | | | | | | | | | |
| PAYABLE IN CANADA IN CANADIAN DOLLARS | |
| September 8, 2017 | | January 20, 2012 | | DMTN213 | | 1.90 | | | 6,350,000,000 | | | | | |
September 22, 2017 | | February 22, 2013 | | DMTN219 | | 3M CBA + 0.19 | | | 1,119,500,000 | | | | (6) | |
November 23, 2017 | | November 23, 2012 | | DMTN217 | | 3M CBA + 0.25 | | | 750,000,000 | | | | (6) | |
| March 8, 2018 | | March 10, 2008 | | DMTN183 | | 4.20 | | | 1,560,000,000 | | | | | |
May 30, 2018 | | May 30, 2013 | | DMTN221 | | 3M CBA + 0.12 | | | 775,000,000 | | | | (6) | |
June 2, 2018 | | August 28, 2003 | | DMTN79 | | 5.50 | | | 605,000,000 | | | | (6) | |
August 28, 2018 | | August 28, 2013 | | DMTN222 | | 3M CBA + 0.16 | | | 600,800,000 | | | | (6) | |
| September 8, 2018 | | January 15, 2013 | | DMTN218 | | 2.10 | | | 7,628,000,000 | | | | | |
December 3, 2018 | | December 3, 2013 | | DMTN224 | | 3M CBA + 0.15 | | | 937,000,000 | | | | (6) | |
June 2, 2019 | | April 19, 2004 | | DMTN105 | | 5.35 | | | 100,000,000 | | | | (6) | |
June 2, 2019 | | April 17, 2009 | | DMTN195 | | 4.40 | | | 7,050,000,000 | | | | (6) | |
August 26, 2019 | | August 26, 2014 | | DMTN226 | | 3M CBA + 0.09 | | | 1,921,000,000 | | | | (6) | |
| September 8, 2019 | | June 5, 2014 | | DMTN225 | | 2.10 | | | 4,150,000,000 | | | | | |
| June 2, 2020 | | February 22, 2005 | | DMTN140 | | 4.85 | | | 562,000,000 | | | | | |
| June 2, 2020 | | February 23, 2010 | | DMTN200 | | 4.20 | | | 10,025,000,000 | | | | | |
| September 4, 2020 | | September 4, 1998 | | LY | | 6.30 | | | 15,000,000 | | | | | |
March 16, 2021 | | March 16, 2016 | | DMTN230 | | 3M CBA + 0.44 | | | 1,364,600,000 | | | | (6) | |
June 2, 2021 | | December 27, 2007 | | DMTN180 | | 4.50 | | | 75,000,000 | | | | (6) | |
| June 2, 2021 | | January 12, 2011 | | DMTN207 | | 4.00 | | | 8,915,000,000 | | | | | |
October 27, 2021 | | October 27, 2016 | | DMTN233 | | 3M CBA + 0.26 | | | 1,200,000,000 | | | | (6) | |
| March 8, 2022 | | August 23, 2016 | | DMTN232 | | 1.35 | | | 2,000,000,000 | | | | | |
| June 2, 2022 | | November 8, 2011 | | DMTN212 | | 3.15 | | | 11,771,700,000 | | | | | |
21
| | | | | | | | | | | | | | |
Date of Maturity | | Date of Issue | | Series | | Interest Rate | | Outstanding | | | Reference | |
| | | | | | | % | | $ | | | | |
PUBLICLY HELD DEBT (Cont’d) | | | | | | | | |
| PAYABLE IN CANADA IN CANADIAN DOLLARS (Cont’d) | |
| July 13, 2022 | | July 13, 1992 | | HC | | 9.50 | | | 1,590,438,000 | | | | | |
| June 2, 2023 | | November 6, 2012 | | DMTN215 | | 2.85 | | | 9,322,700,000 | | | | | |
| September 8, 2023 | | September 8, 1993 | | HP | | 8.10 | | | 940,570,000 | | | | | |
| September 8, 2023 | | July 31, 2007 | | DMTN177 | | 4.95 | | | 75,000,000 | | | | | |
| June 2, 2024 | | November 25, 2013 | | DMTN223 | | 3.50 | | | 10,000,000,000 | | | | | |
| June 2, 2025 | | December 20, 1994 | | JE | | 9.50 | | | 460,000,000 | | | | | |
| June 2, 2025 | | January 9, 2015 | | DMTN227 | | 2.60 | | | 12,550,000,000 | | | | | |
| December 2, 2025 | | October 5, 1995 | | JQ | | 8.50 | | | 1,000,000,000 | | | | | |
| February 6, 2026 | | February 6, 1996 | | JY | | 8.00 | | | 12,500,000 | | | | | |
| June 2, 2026 | | December 21, 1995 | | JU | | 8.00 | | | 1,000,000,000 | | | | | |
| June 2, 2026 | | February 3, 2016 | | DMTN229 | | 2.40 | | | 7,500,000,000 | | | | | |
| December 2, 2026 | | February 13, 1997 | | KR | | 8.00 | | | 386,500,000 | | | | | |
| December 2, 2026 | | January 20, 1999 | | MH | | 7.00 | | | 124,584,000 | | | | (7) | |
| February 3, 2027 | | August 5, 1997 | | KN | | 7.50 | | | 58,220,000 | | | | | |
| February 3, 2027 | | August 5, 1997 | | KT | | 6.95 | | | 8,726,000 | | | | | |
| February 3, 2027 | | April 1, 1998 | | KY | | 7.50 | | | 11,549,000 | | | | | |
| February 3, 2027 | | December 4, 1998 | | LA | | 7.50 | | | 5,507,000 | | | | | |
| February 4, 2027 | | February 4, 1998 | | KQ | | 7.375 | | | 990,000 | | | | | |
| June 2, 2027 | | February 9, 2017 | | DMTN234 | | 2.60 | | | 1,750,000,000 | | | | | |
| June 2, 2027 | | October 17, 1996 | | KJ | | 7.60 | | | 4,734,700,000 | | | | | |
| August 25, 2028 | | February 25, 1998 | | LQ | | 6.25 | | | 2,020,000 | | | | | |
22
| | | | | | | | | | | | | | |
Date of Maturity | | Date of Issue | | Series | | Interest Rate | | Outstanding | | | Reference | |
| | | | | | | % | | $ | | | | |
PUBLICLY HELD DEBT (Cont’d) | | | | | | | | |
| PAYABLE IN CANADA IN CANADIAN DOLLARS (Cont’d) | |
| March 8, 2029 | | January 8, 1998 | | LK | | 6.50 | | | 4,727,000,000 | | | | | |
| January 13, 2031 | | September 8, 1995 | | JN | | 9.50 | | | 125,000,000 | | | | | |
| June 2, 2031 | | March 27, 2000 | | NF | | 6.20 | | | 3,000,000,000 | | | | | |
| June 2, 2031 | | November 25, 2010 | | DMTN206 | | 5.20 | | | 133,300,000 | | | | | |
| March 8, 2033 | | February 17, 2003 | | DMTN61 | | 5.85 | | | 4,674,610,000 | | | | | |
| March 8, 2033 | | April 29, 2004 | | DMTN110 | | 5.85 | | | 188,000,000 | | | | | |
| March 8, 2033 | | July 23, 2004 | | DMTN116 | | 5.85 | | | 100,000,000 | | | | (6) | |
| July 13, 2034 | | September 21, 2005 | | DMTN157 | | 5.00 | | | 47,500,000 | | | | (8) | |
| November 3, 2034 | | November 3, 1994 | | HY | | 9.75 | | | 248,800,000 | | | | | |
January 10, 1995 to
January 10, 2035 | | November 30, 1994 | | HZ | | 9.4688 | | | 2,315,904 | | | | (10) | |
| “ | | “ | | JA | | 9.4688 | | | 3,480,199 | | | | (10) | |
| “ | | “ | | JB | | 9.4688 | | | 8,482,324 | | | | (10) | |
| “ | | “ | | JC | | 9.4688 | | | 4,764,354 | | | | (10) | |
| “ | | “ | | JD | | 9.4688 | | | 3,171,134 | | | | (10) | |
| January 12, 2035 | | January 12, 2007 | | JG | | 9.50 | | | 110,950,000 | | | | | |
| February 8, 2035 | | February 8, 1995 | | JJ | | 9.875 | | | 32,000,000 | | | | | |
| June 2, 2035 | | August 25, 2004 | | DMTN119 | | 5.60 | | | 7,338,509,000 | | | | (6) (9) | |
| June 2, 2035 | | January 12, 2005 | | DMTN133 | | 5.35 | | | 150,000,000 | | | | | |
| June 20, 2036 | | June 20, 1996 | | KC | | 8.25 | | | 98,984,000 | | | | | |
| December 1, 2036 | | March 8, 2006 | | DMTN158 | | 2.00 Real Return | | | 2,589,694,721 | | | | (11) | |
| June 2, 2037 | | February 22, 2006 | | DMTN164 | | 4.70 | | | 8,700,000,000 | | | | | |
| December 2, 2037 | | February 1, 2005 | | DMTN138 | | 5.20 | | | 100,000,000 | | | | | |
23
| | | | | | | | | | | | | | |
Date of Maturity | | Date of Issue | | Series | | Interest Rate | | Outstanding | | | Reference | |
| | | | | | | % | | $ | | | | |
PUBLICLY HELD DEBT (Cont’d) | | | | | | | | |
| PAYABLE IN CANADA IN CANADIAN DOLLARS (Cont’d) | |
| June 2, 2038 | | July 28, 2004 | | DMTN117 | | 10.00 | | | 75,000,000 | | | | (12) | |
| June 20, 2038 | | September 16, 1996 | | KG | | 8.10 | | | 120,000,000 | | | | | |
| July 13, 2038 | | July 29, 1998 | | LS | | 5.75 | | | 50,000,000 | | | | | |
| August 25, 2038 | | August 17, 1998 | | LT | | 6.00 | | | 86,500,000 | | | | | |
| June 2, 2039 | | January 15, 2008 | | DMTN182 | | 4.60 | | | 9,600,000,000 | | | | | |
| July 13, 2039 | | February 2, 1999 | | MK | | 5.65 | | | 223,858,000 | | | | | |
| December 2, 2039 | | February 25, 2000 | | NE | | 5.70 | | | 1,489,000,000 | | | | | |
| July 13, 2040 | | April 18, 2002 | | DMTN44 | | 6.20 | | | 100,000,000 | | | | | |
| June 2, 2041 | | June 15, 2010 | | DMTN204 | | 4.65 | | | 11,368,000,000 | | | | | |
| December 2, 2041 | | August 15, 2001 | | DMTN10 | | 6.20 | | | 340,000,000 | | | | | |
| March 8, 2042 | | December 4, 2001 | | DMTN29 | | 6.00 | | | 41,000,000 | | | | | |
| June 2, 2042 | | January 18, 2002 | | DMTN33 | | 6.00 | | | 240,000,000 | | | | | |
| June 2, 2043 | | February 24, 2003 | | DMTN62 | | 5.75 | | | 75,000,000 | | | | | |
| June 2, 2043 | | January 31, 2012 | | DMTN214 | | 3.50 | | | 11,000,000,000 | | | | | |
| June 2, 2044 | | September 13, 2006 | | DMTN169 | | 4.60 | | | 27,000,000 | | | | | |
| January 10, 2045 | | May 25, 1995 | | JL | | 8.435 | | | 35,531,176 | | | | (13) | |
| March 1, 2045 | | March 1, 1995 | | JK | | 9.50 | | | 150,000,000 | | | | | |
| June 2, 2045 | | August 31, 2005 | | DMTN153 | | 4.50 | | | 175,000,000 | | | | | |
| June 2, 2045 | | May 10, 2013 | | DMTN220 | | 3.45 | | | 15,525,000,000 | | | | | |
| June 2, 2046 | | May 24, 2006 | | DMTN166 | | 4.85 | | | 154,700,000 | | | | | |
| December 2, 2046 | | February 2, 2015 | | DMTN228 | | 2.90 | | | 14,550,250,000 | | | | | |
| June 2, 2047 | | February 28, 2007 | | DMTN176 | | 4.50 | | | 158,000,000 | | | | | |
| June 2, 2048 | | May 6, 2008 | | DMTN184 | | 4.70 | | | 50,000,000 | | | | | |
24
| | | | | | | | | | | | | | |
Date of Maturity | | Date of Issue | | Series | | Interest Rate | | Outstanding | | | Reference | |
| | | | | | | % | | $ | | | | |
PUBLICLY HELD DEBT (Cont’d) | | | | | | | | |
| PAYABLE IN CANADA IN CANADIAN DOLLARS | |
| June 2, 2048 | | June 21, 2016 | | DMTN231 | | 2.80 | | | 6,050,000,000 | | | | | |
| June 2, 2054 | | July 22, 2008 | | DMTN185 | | 4.60 | | | 40,000,000 | | | | | |
| June 2, 2062 | | November 8, 2012 | | DMTN216 | | 3.25 | | | 475,000,000 | | | | | |
| | | | | | | | | | | | | | |
| | | | | | | | | 225,594,004,812 | | | | | |
| CPI adjustment to Real Return Swap | | | | | (59,092,614 | ) | | | (11) | |
| | | | | | | | | | | | | | |
| | | | | | | | | 225,534,912,198 | | | | | |
| | | | | | | | | | | | | | |
25
| | | | | | | | | | | | | | |
Date of Maturity | | Date of Issue | | Series | | Interest Rate | | Outstanding | | | Reference | |
| | | | | | | % | | $ | | | | |
PUBLICLY HELD DEBT (Cont’d) | | | | | | | | |
| ONTARIO SAVINGS BONDS | |
| June 21, 2017 | | June 21, 2010 | | Annual | | 3.75 | | | 9,789,400 | | | | | |
| June 21, 2017 | | June 21, 2010 | | Compound | | 3.75 | | | 8,571,600 | | | | | |
| June 21, 2017 | | June 21, 2012 | | Annual | | Step-up | | | 338,261,000 | | | | | |
| June 21, 2017 | | June 21, 2012 | | Compound | | Step-up | | | 212,326,700 | | | | | |
| June 21, 2017 | | June 21, 2014 | | Annual | | Variable | | | 2,372,600 | | | | | |
| June 21, 2017 | | June 21, 2014 | | Compound | | Variable | | | 7,142,600 | | | | | |
| June 21, 2017 | | June 21, 2014 | | Annual | | 1.35 | | | 3,422,000 | | | | | |
| June 21, 2017 | | June 21, 2014 | | Compound | | 1.35 | | | 3,253,300 | | | | | |
| June 21, 2018 | | June 21, 2011 | | Annual | | 3.20 | | | 6,479,100 | | | | | |
| June 21, 2018 | | June 21, 2011 | | Compound | | 3.20 | | | 6,202,700 | | | | | |
| June 21, 2018 | | June 21, 2013 | | Annual | | Step-up | | | 199,822,900 | | | | | |
| June 21, 2018 | | June 21, 2013 | | Compound | | Step-up | | | 78,022,200 | | | | | |
| June 21, 2018 | | June 21, 2015 | | Annual | | Variable | | | 2,241,600 | | | | | |
| June 21, 2018 | | June 21, 2015 | | Compound | | Variable | | | 2,165,700 | | | | | |
| June 21, 2018 | | June 21, 2015 | | Annual | | 0.90 | | | 2,137,400 | | | | | |
| June 21, 2018 | | June 21, 2015 | | Compound | | 0.90 | | | 1,184,900 | | | | | |
| June 21, 2019 | | June 21, 2014 | | Annual | | Step-up | | | 294,011,400 | | | | | |
| June 21, 2019 | | June 21, 2014 | | Compound | | Step-up | | | 159,291,900 | | | | | |
| June 21, 2019 | | June 21, 2016 | | Annual | | Variable | | | 2,936,500 | | | | | |
| June 21, 2019 | | June 21, 2016 | | Compound | | Variable | | | 2,706,000 | | | | | |
| June 21, 2019 | | June 21, 2016 | | Annual | | 1.00 | | | 2,552,400 | | | | | |
| June 21, 2019 | | June 21, 2016 | | Compound | | 1.00 | | | 2,658,700 | | | | | |
| June 21, 2020 | | June 21, 2010 | | Annual | | 4.25 | | | 41,858,000 | | | | | |
26
| | | | | | | | | | | | | | |
Date of Maturity | | Date of Issue | | Series | | Interest Rate | | Outstanding | | | Reference | |
| | | | | | | % | | $ | | | | |
PUBLICLY HELD DEBT (Cont’d) | | | | | | | | |
| ONTARIO SAVINGS BONDS (Cont’d) | |
| June 21, 2020 | | June 21, 2010 | | Compound | | 4.25 | | | 30,518,800 | | | | | |
| June 21, 2020 | | June 21, 2015 | | Annual | | Step-up | | | 27,823,700 | | | | | |
| June 21, 2020 | | June 21, 2015 | | Compound | | Step-up | | | 11,131,100 | | | | | |
| June 21, 2021 | | June 21, 2011 | | Annual | | 3.80 | | | 11,636,500 | | | | | |
| June 21, 2021 | | June 21, 2011 | | Compound | | 3.80 | | | 12,889,200 | | | | | |
| June 21, 2021 | | June 21, 2016 | | Annual | | Step-up | | | 22,796,200 | | | | | |
| June 21, 2021 | | June 21, 2016 | | Compound | | Step-up | | | 9,224,900 | | | | | |
| June 21, 2022 | | June 21, 2012 | | Annual | | 2.80 | | | 3,983,60 | | | | | |
| June 21, 2022 | | June 21, 2012 | | Compound | | 2.80 | | | 5,100,100 | | | | | |
| June 21, 2023 | | June 21, 2013 | | Annual | | 3.10 | | | 10,578,100 | | | | | |
| June 21, 2023 | | June 21, 2013 | | Compound | | 3.10 | | | 7,091,200 | | | | | |
| June 21, 2024 | | June 21, 2014 | | Annual | | 3.10 | | | 18,944,400 | | | | | |
| June 21, 2024 | | June 21, 2014 | | Compound | | 3.10 | | | 9,434,100 | | | | | |
| June 21, 2025 | | June 21, 2015 | | Annual | | 2.35 | | | 3,961,600 | | | | | |
| June 21, 2025 | | June 21, 2015 | | Compound | | 2.35 | | | 3,184,500 | | | | | |
| June 21, 2026 | | June 21, 2016 | | Annual | | 2.20 | | | 4,795,100 | | | | | |
| June 21, 2026 | | June 21, 2016 | | Compound | | 2.20 | | | 6,355,800 | | | | | |
| | | | | | | | | | | | | | |
| Active Series | | | | | 1,588,859,500 | | | | (14) | |
| Matured Series | | | | | | | 55,392,800 | | | | (15) | |
| | | | | | | | | | | | | | |
| TOTAL ONTARIO SAVINGS BONDS | | | | | 1,644,252,300 | | | | | |
| | | | | | | | | | | | | | |
| TOTAL PAYABLE IN CANADA IN CANADIAN DOLLARS | | | | | 227,179,164,498 | | | | | |
| | | | | | | | | | | | | | |
27
| | | | | | | | | | | | | | |
Date of Maturity | | Date of Issue | | Series | | Interest Rate | | Outstanding | | | Reference | |
| | | | | | | % | | $ | | | | |
PUBLICLY HELD DEBT (Cont’d) | | | | | | | | |
| PAYABLE IN GLOBAL MARKET IN CANADIAN DOLLARS | |
| October 9, 2018 | | October 9, 2014 | | G68 | | 1.75 | | | 500,000,000 | | | | | |
| January 27, 2023 | | January 29, 2016 | | G72 | | 1.95 | | | 1,550,000,000 | | | | | |
| February 7, 2024 | | February 7, 1994 | | HS | | 7.50 | | | 1,106,700,000 | | | | | |
| TOTAL PAYABLE IN GLOBAL MARKET IN CANADIAN DOLLARS | | | 3,156,700,000 | | | | | |
| | | | | | | | | | | | | | |
| PAYABLE IN EUROPE IN CANADIAN DOLLARS | |
| July 13, 2034 | | July 13, 1994 | | EMTN5 | | 9.40 | | | | | | | | |
| TOTAL PAYABLE IN EUROPE IN CANADIAN DOLLARS | | | 300,000,000 | | | | | |
| | | | | | | | | | | | | | |
| Foreign Currency Debt | | | | | | | (16) | |
| PAYABLE IN AUSTRALIA IN AUSTRALIAN DOLLARS | |
| September 29, 2020 | | September 29, 2010 | | ADI2 | | 6.25 | | | 500,000,000 | | | | | |
| August 22, 2024 | | August 26, 2025 | | ADI3 | | 4.25 | | | 350,000,000 | | | | | |
| August 26, 2025 | | February 26, 2015 | | ADI4 | | 3.10 | | | 265,000,000 | | | | | |
| January 27, 2027 | | January 27, 2017 | | ADI5 | | 3.50 | | | 200,000,000 | | | | | |
| | | | | | | | | | | | | | |
| TOTAL PAYABLE IN AUSTRALIA IN AUSTRALIAN DOLLARS | | | 1,415,000,000 | | | | | |
| | | | | | | | | | | | | | |
| CANADIAN DOLLAR EQUIVALENT EXCHANGE RATE OF $ 0.99380 | | | 1,406,230,220 | | | | (16a) | |
| | | | | | | | | | | | | | |
28
| | | | | | | | | | | | | | |
Date of Maturity | | Date of Issue | | Series | | Interest Rate | | Outstanding | | | Reference | |
| | | | | | | % | | $ | | | | |
PUBLICLY HELD DEBT (Cont’d) | | | | | | | | |
| PAYABLE IN EUROPE IN EURO | |
| April 23, 2019 | | April 23, 2009 | | EMTN97 | | 4.75 | | | 1,500,000,000 | | | | | |
| December 3, 2019 | | December 3, 2009 | | EMTN100 | | 4.00 | | | 1,750,000,000 | | | | | |
| September 28, 2020 | | September 28, 2010 | | EMTN107 | | 3.00 | | | 1,250,000,000 | | | | | |
| May 21, 2024 | | May 21, 2014 | | EMTN110 | | 1.875 | | | 1,750,000,000 | | | | | |
| January 21, 2025 | | January 21, 2015 | | EMTN111 | | 0.875 | | | 1,250,000,000 | | | | | |
| June 28, 2041 | | January 29, 2016 | | EMTN112 | | 1.82 | | | 52,000,000 | | | | | |
| | | | | | | | | | | | | | |
| TOTAL PAYABLE IN EUROPE IN EURO | | | 7,552,000,000 | | | | | |
| | | | | | | | | | | | | | |
| CANADIAN DOLLAR EQUIVALENT EXCHANGE RATE OF $ 1.52338 | | | 11,504,578,795 | | | | (16b) | |
| | | | | | | | | | | | | | |
| PAYABLE IN GLOBAL MARKET IN EURO | |
| January 9, 2018 | | January 9, 2009 | | PU | | 3M Euribor + 1.39 | | | 120,000,000 | | | | | |
| | | | | | | | | | | | | | |
| TOTAL PAYABLE IN GLOBAL MARKET IN EURO | | | 120,000,000 | | | | | |
| | | | | | | | | | | | | | |
| CANADIAN DOLLAR EQUIVALENT EXCHANGE RATE OF $ 1.7180 | | | 206,160,000 | | | | (16c) | |
| | | | | | | | | | | | | | |
29
| | | | | | | | | | | | | | |
Date of Maturity | | Date of Issue | | Series | | Interest Rate | | Outstanding | | | Reference | |
| | | | | | | % | | $ | | | | |
PUBLICLY HELD DEBT (Cont’d) | | | | | | | | |
| PAYABLE IN JAPAN IN JAPANESE YEN | |
| August 8, 2018 | | August 8, 2008 | | YL016 | | 1.675 | | | 8,000,000,000 | | | | | |
| | | | | | | | | | | | | | |
| TOTAL PAYABLE IN JAPAN IN JAPANESE YEN | | | 8,000,000,000 | | | | | |
| | | | | | | | | | | | | | |
| CANADIAN DOLLAR EQUIVALENT EXCHANGE RATE OF $ 0.009444 | | | 75,550,891 | | | | (16d) | |
| | | | | | | | | | | | | | |
| PAYABLE IN EUROPE IN JAPANESE YEN | |
| June 8, 2020 | | June 7, 2010 | | EMTN105 | | 1.65 | | | | | | | | |
| TOTAL PAYABLE IN EUROPE IN JAPANESE YEN | | | 36,900,000,000 | | | | | |
| | | | | | | | | | | | | | |
| CANADIAN DOLLAR EQUIVALENT EXCHANGE RATE OF $ 0.011885 | | | 438,543,243 | | | | | |
| | | | | | | | | | | | | | |
30
| | | | | | | | | | | | | | |
Date of Maturity | | Date of Issue | | Series | | Interest Rate | | Outstanding | | | Reference | |
| | | | | | | % | | $ | | | | |
PUBLICLY HELD DEBT (Cont’d) | | | | | | | | |
| PAYABLE IN EUROPE IN SWISS FRANCS | |
| July 30, 2018 | | July 30, 2008 | | EMTN82 | | 3.75 | | | 225,000,000 | | | | | |
| July 30, 2018 | | August 14, 2009 | | PY | | 2.525 | | | 100,000,000 | | | | | |
| December 14, 2018 | | August 14, 2009 | | PZ | | 2.59 | | | 100,000,000 | | | | | |
| April 29, 2019 | | April 29, 2009 | | EMTN95 | | 3.375 | | | 225,000,000 | | | | | |
| December 4, 2019 | | December 4, 2009 | | EMTN99 | | 2.50 | | | 275,000,000 | | | | | |
| May 7, 2020 | | May 7, 2010 | | EMTN101 | | 2.375 | | | 400,000,000 | | | | | |
| | | | | | | | | | | | | | |
| TOTAL PAYABLE IN EUROPE IN SWISS FRANCS | | | 1,325,000,000 | | | | | |
| | | | | | | | | | | | | | |
| CANADIAN DOLLAR EQUIVALENT EXCHANGE RATE OF $ 1.12130 | | | 1,485,725,372 | | | | (16e) | |
| PAYABLE IN UNITED STATES IN U.S. DOLLARS | |
| November 23, 2017 | | November 23, 2012 | | USMTN2 | | 3M Libor + 0.25 | | | 250,000,000 | | | | | |
| | | | | | | | | | | | | | |
| TOTAL PAYABLE IN THE UNITED STATES IN U.S. DOLLARS | | | 250,000,000 | | | | | |
| | | | | | | | | | | | | | |
| CANADIAN DOLLAR EQUIVALENT EXCHANGE RATE OF $ 1.01600 | | | 254,000,000 | | | | (16f) | |
| | | | | | | | | | | | | | |
31
| | | | | | | | | | | | | | |
Date of Maturity | | Date of Issue | | Series | | Interest Rate | | Outstanding | | | Reference | |
| | | | | | | % | | $ | | | | |
PUBLICLY HELD DEBT (Cont’d) | | | | | | | | |
| PAYABLE IN GLOBAL MARKET IN U.S. DOLLARS | |
| October 25, 2017 | | October 25, 2012 | | G60 | | 1.10 | | | 2,250,000,000 | | | | | |
| December 15, 2017 | | December 15, 2010 | | G52 | | 3.15 | | | 1,250,000,000 | | | | | |
| February 14, 2018 | | February 14, 2013 | | G62 | | 1.20 | | | 705,000,000 | | | | | |
| July 16, 2018 | | July 14, 2011 | | G55 | | 3.00 | | | 1,000,000,000 | | | | | |
| September 27, 2018 | | September 27, 2013 | | G63 | | 2.00 | | | 1,750,000,000 | | | | | |
| January 18, 2019 | | January 21, 2016 | | G71 | | 1.625 | | | 2,500,000,000 | | | | | |
| January 30, 2019 | | January 30, 2014 | | G65 | | 2.00 | | | 2,000,000,000 | | | | | |
| June 17, 2019 | | June 17, 2016 | | G73 | | 1.25 | | | 1,750,000,000 | | | | | |
| September 27, 2019 | | September 27, 2012 | | G59 | | 1.65 | | | 1,250,000,000 | | | | | |
| October 7, 2019 | | October 7, 2009 | | G44 | | 4.00 | | | 2,000,000,000 | | | | | |
| April 14, 2020 | | April 14, 2010 | | G48 | | 4.40 | | | 2,000,000,000 | | | | | |
| May 21, 2020 | | May 21, 2015 | | G70 | | 1.875 | | | 2,000,000,000 | | | | | |
| September 10, 2021 | | September 11, 2014 | | G67 | | 2.50 | | | 2,000,000,000 | | | | | |
| February 8, 2022 | | February 8, 2017 | | G74 | | 2.40 | | | 2,500,000,000 | | | | | |
| June 29, 2022 | | June 29, 2012 | | G58 | | 2.45 | | | 1,000,000,000 | | | | | |
| May 16, 2024 | | May 16, 2014 | | G66 | | 3.20 | | | 1,250,000,000 | | | | | |
| April 27, 2026 | | April 27, 2016 | | G69 | | 2.50 | | | 1,000,000,000 | | | | | |
| | | | | | | | | | | | | | |
| TOTAL PAYABLE IN GLOBAL MARKET IN U.S. DOLLARS | | | 28,205,000,000 | | | | | |
| | | | | | | | | | | | | | |
| CANADIAN DOLLAR EQUIVALENT EXCHANGE RATE OF $ 1.20949 | | | 34,113,747,000 | | | | (16g) | |
| | | | | | | | | | | | | | |
32
| | | | | | | | | | | | | | |
Date of Maturity | | Date of Issue | | Series | | Interest Rate | | Outstanding | | | Reference | |
| | | | | | | % | | $ | | | | |
PUBLICLY HELD DEBT (Cont’d) | | | | | | | | |
TOTAL BONDS | | | 280,120,400,019 | | | | | |
| UNAMORTIZED FOREIGN EXCHANGE GAINS/ (LOSSES) | | | (75,382,150 | ) | | | | |
| | | | | | | | | | | | | | |
TOTAL BONDS NET OF UNAMORTIZED | | | | | | | | |
FOREIGN EXCHANGE GAIN/(LOSS) | | | 280,045,017,869 | | | | | |
TREASURY BILLS | | | 15,804,071,000 | | | | | |
| | | | | | | | | | | | | | |
U.S. COMMERCIAL PAPER (in U.S. Dollars) | | | 4,050,770,000 | | | | (17) | |
| | | | | | | | | | | | | | |
| CANADIAN DOLLAR EQUIVALENT EXCHANGE RATE OF $ 1.32547 | | | 5,369,154,211 | | | | | |
| | | | | | | | | | | | | | |
TOTAL PUBLICLY HELD DEBT | | | 301,218,243,080 | | | | | |
| | | | | | | | | | | | | | |
TOTAL NON-PUBLIC AND PUBLIC DEBT | | | 311,371,508,135 | | | | | |
| | | | | | | | | | | | | | |
SCHOOL BOARD TRUST DEBT | | | | | | | | |
| Year ending March 31 | | | | | | | | |
| 2034 | | 2004 | | | | 5.90 | | | 891,000,000 | | | | | |
| Less: Sinking Fund | | | (238,810,810 | ) | | | | |
| | | | | | | | | | | | | | |
| | | 652,189,190 | | | | (18) | |
| | | | | | | | | | | | | | |
33
| | | | | | | | | | | | | | |
Date of Maturity | | Date of Issue | | Series | | Interest Rate | | Outstanding | | | Reference | |
| | | | | | | % | | $ | | | | |
PUBLICLY HELD DEBT (Cont’d) | | | | | | | | |
TOTAL DEBT ISSUED FOR PROVINCIAL PURPOSES | | | 312,023,697,325 | | | | | |
| | | | | | | | | | | | | | |
CONSOLIDATION ADJUSTMENTS – OTHER GOVERNMENT ORGANIZATIONS | | | | | | | | |
NON-PUBLIC DEBT ISSUED BY AGENCIES: | | | | | | | | |
| Ontario Mortgage and Housing Corporation | | | 246,941,384 | | | | | |
| Ontario Immigrant Investor Corporation | | | 491,661,000 | | | | (4) | |
PUBLIC DEBT ISSUED BY AGENCIES: | | | | | | | | |
| Infrastructure Ontario | | | 300,000,000 | | | | | |
| Niagara Parks Commission | | | 21,942,099 | | | | | |
| ORNGE | | | 272,837,243 | | | | | |
| Ottawa Convention Centre | | | 1,687,252 | | | | | |
ONTARIO SECURITIES HELD BY AGENCIES: | | | | | | | | |
| Bonds | | | (341,718,385 | ) | | | | |
| Treasury Bills | | | (337,914,984 | ) | | | | |
| | | | | | | | | | | | | | |
TOTAL CONSOLIDATION ADJUSTMENTS | | | 655,435,609 | | | | (19) | |
| | | | | | | | | | | | | | |
TOTAL PROVINCIAL PURPOSE DEBT AFTER CONSOLIDATION ADJUSTMENTS | | | 312,679,132,934 | | | | | |
| | | | | | | | | | | | | | |
34
| | | | | | | | | | | | | | |
Date of Maturity | | Date of Issue | | Series | | Interest Rate | | Outstanding | | | Reference | |
| | | | | | | % | | $ | | | | |
| DEBT ISSUED FOR ONTARIO ELECTRICITY FINANCIAL CORPORATION (OEFC) | |
NON-PUBLIC DEBT | | | | | | | | |
| PAYABLE IN CANADA IN CANADIAN DOLLARS | |
Canada Pension Plan Investment Board: | | | | | | | | |
| 2021 | | 2001 | | CPP | | 6.08 | | | 19,375,000 | | | | | |
| 2022 | | 2002 | | CPP | | 6.17 to 6.29 | | | 172,961,000 | | | | | |
| 2023 | | 2003 | | CPP | | 6.16 | | | 38,130,000 | | | | | |
| | | | | | | | | | | | | | |
TOTAL NON-PUBLIC DEBT | | | 230,466,000 | | | | (3) | |
| | | | | | | | | | | | | | |
35
| | | | | | | | | | | | | | |
Date of Maturity | | Date of Issue | | Series | | Interest Rate | | Outstanding | | | Reference | |
| | | | | | | % | | $ | | | | |
PUBLICLY HELD DEBT | | | | | | | | |
| PAYABLE IN CANADA IN CANADIAN DOLLARS | |
| November 23, 2017 | | November 23, 2012 | | DMTN217 | | 3M CBA + 0.25 | | | 205,000,000 | | | | | |
| March 8, 2018 | | March 10, 2008 | | DMTN183 | | 4.20 | | | 1,440,000,000 | | | | | |
| June 2, 2018 | | June 6, 2005 | | DMTN79 | | 5.50 | | | 110,000,000 | | | | | |
| September 8, 2018 | | July 22, 2013 | | DMTN218 | | 2.10 | | | 372,000,000 | | | | | |
| June 2, 2019 | | April 27, 2009 | | DMTN195 | | 4.40 | | | 800,000,000 | | | | | |
| September 9, 2019 | | June 5, 2014 | | DMTN225 | | 2.10 | | | 100,000,000 | | | | | |
| June 2, 2020 | | February 22, 2005 | | DMTN140 | | 4.85 | | | 29,000,000 | | | | | |
| June 2, 2020 | | April 22, 2010 | | DMTN200 | | 4.20 | | | 775,000,000 | | | | | |
| June 2, 2021 | | April 15, 2011 | | DMTN207 | | 4.00 | | | 85,000,000 | | | | | |
| June 2, 2022 | | May 3, 2012 | | DMTN212 | | 3.15 | | | 478,300,000 | | | | | |
| June 2, 2023 | | November 6, 2012 | | DMTN215 | | 2.85 | | | 2,777,300,000 | | | | | |
| September 8, 2023 | | November 29, 2004 | | HP | | 8.10 | | | 50,000,000 | | | | | |
| June 2, 2024 | | November 25, 2013 | | DMTN223 | | 3.50 | | | 1,550,000,000 | | | | | |
| June 2, 2025 | | January 9, 2015 | | DMTN227 | | 2.60 | | | 1,050,000,000 | | | | | |
| June 2, 2027 | | February 11, 2000 | | KJ | | 7.60 | | | 100,500,000 | | | | | |
| August 25, 2028 | | April 13, 1999 | | LQ | | 6.25 | | | 78,600,000 | | | | | |
| December 1, 2036 | | October 4, 2005 | | DMTN158 | | 2.00 Real Return | | | 845,516,000 | | | | (11) | |
| June 2, 2037 | | September 1, 2006 | | DMTN164 | | 4.70 | | | 400,000,000 | | | | | |
| June 2, 2039 | | July 10, 2009 | | DMTN182 | | 4.60 | | | 100,000,000 | | | | | |
| June 2, 2041 | | March 9, 2011 | | DMTN204 | | 4.65 | | | 282,000,000 | | | | | |
| June 2, 2043 | | May 15, 2012 | | DMTN214 | | 3.50 | | | 200,000,000 | | | | | |
| June 2, 2045 | | October 1, 2013 | | DMTN220 | | 3.45 | | | 525,000,000 | | | | | |
| December 2, 2046 | | February 2, 2015 | | DMTN228 | | 2.90 | | | 149,750,000 | | | | | |
| | | | | | | | | | | | | | |
| TOTAL PAYABLE IN CANADA IN CANADIAN DOLLARS | | | 12,502,966,000 | | | | | |
| | | | | | | | | | | | | | |
36
| | | | | | | | | | | | | | |
Date of Maturity | | Date of Issue | | Series | | Interest Rate | | Outstanding | | | Reference | |
| | | | | | | % | | $ | | | | |
PUBLIC HELD DEBT (Cont’d) | | | | | | | | |
Foreign Currency Debt | | | | | | | (16) | |
| PAYABLE IN GLOBAL MARKET IN EURO | |
| October 9, 2017 | | January 9, 2009 | | PU | | 3M Euribor + 1.39 | | | 105,000,000 | | | | | |
| | | | | | | | | | | | | | |
| TOTAL PAYABLE IN GLOBAL MARKET IN EURO | | | 105,000,000 | | | | | |
| | | | | | | | | | | | | | |
| CANADIAN DOLLAR EQUIVALENT EXCHANGE RATE OF $1.70800 | | | 179,340,000 | | | | (16h) | |
| | | | | | | | | | | | | | |
| PAYABLE IN EUROPE IN SWISS FRANCS | |
| July 30, 2018 | | December 29, 2008 | | EMTN82 | | 3.75 | | | 125,000,000 | | | | | |
| | | | | | | | | | | | | | |
| TOTAL PAYABLE IN EUROPE IN SWISS FRANCS | | | 125,000,000 | | | | | |
| | | | | | | | | | | | | | |
| CANADIAN DOLLAR EQUIVALENT EXCHANGE RATE OF $ 1. 1.25023 | | | 156,278,353 | | | | (16h) | |
| | | | | | | | | | | | | | |
37
| | | | | | | | | | | | | | |
Date of Maturity | | Date of Issue | | Series | | Interest Rate | | Outstanding | | | Reference | |
| | | | | | | % | | $ | | | | |
PUBLIC HELD DEBT (Cont’d) | | | | | | | | |
| PAYABLE IN EUROPE IN U.S. DOLLARS | |
| December 18, 2018 | | December 18, 2008 | | EMTN93 | | 4.28 | | | 60,000,000 | | | | | |
| | | | | | | | | | | | | | |
| TOTAL PAYABLE IN EUROPE IN U.S. DOLLARS | | | 60,000,000 | | | | | |
| | | | | | | | | | | | | | |
| CANADIAN DOLLAR EQUIVALENT EXCHANGE RATE OF $ 1.22750 | | | 73,650,000 | | | | (16h) | |
| | | | | | | | | | | | | | |
| PAYABLE IN GLOBAL MARKET IN U.S. DOLLARS | |
| February 14, 2018 | | February 14, 2013 | | G62 | | 1.20 | | | 295,000,000 | | | | | |
| | | | | | | | | | | | | | |
| TOTAL PAYABLE IN GLOBAL MARKET IN U.S. DOLLARS | | | 295,000,000 | | | | | |
| | | | | | | | | | | | | | |
| CANADIAN DOLLAR EQUIVALENT EXCHANGE RATE OF $ 1.00000 | | | 295,000,000 | | | | (16h) | |
| | | | | | | | | | | | | | |
TOTAL BONDS | | | 13,207,234,353 | | | | | |
| UNAMORTIZED FOREIGN EXCHANGE GAINS/(LOSSES) | | | 21,280,127 | | | | | |
| | | | | | | | | | | | | | |
TOTAL BONDS NET OF UNAMORTIZED FOREIGN EXCHANGE GAIN/ (LOSS) | | | 13,228,514,480 | | | | | |
38
| | | | | | | | | | | | | | |
Date of Maturity | | Date of Issue | | Series | | Interest Rate | | Outstanding | | | Reference | |
| | | | | | | % | | $ | | | | |
PUBLIC HELD DEBT (Cont’d) | | | | | | | | |
TREASURY BILLS | | | 654,046,000 | | | | | |
| | | | | | | | | | | | | | |
TOTAL PUBLICLY HELD DEBT | | | 13,882,560,480 | | | | | |
| | | | | | | | | | | | | | |
TOTAL DEBT ISSUED BY THE PROVINCE FOR OEFC | | | 14,113,026,480 | | | | | |
| | | | | | | | | | | | | | |
| DIRECT OEFC DEBT | | | 6,309,619,000 | | | | | |
| | | | | | | | | | | | | | |
TOTAL OEFC DEBT | | | 20,422,645,480 | | | | | |
| | | | | | | | | | | | | | |
TOTAL CONSOLIDATED DEBT | | | 333,101,778,414 | | | | | |
| | | | | | | | | | | | | | |
39
| | | | | | | | | | | | | | |
Date of Maturity | | Date of Issue | | Series | | Interest Rate | | Outstanding | | | Reference | |
| | | | | | | % | | $ | | | | |
DEBT ISSUED FOR INVESTMENT PURPOSES* | | | | | | | | |
| ONTARIO POWER GENERATION INC | | | 5,126,000,000 | | | | | |
| HYDRO ONE INC | | | 2,636,835,272 | | | | | |
| | | | | | | | | | | | | | |
TOTAL DEBT ISSUED FOR INVESTMENT PURPOSES | | | 7,762,835,272 | | | | | |
| | | | | | | | | | | | | | |
| * | Debt for Investment Purposes, as a result of a debt for equity swap between the Province and Ontario Power Generation Inc. and Hydro One Inc., is eliminated upon consolidation. |
40
References:
| 1. | All debt issues are non-callable, except as stated in the notes below. Debt is payable at a fixed rate, or a floating rate with reference to a stated index, reset usually every three months (3M). These floating rate indices are CBA - Canadian Bankers’ Acceptance Rate, Euribor - Euro Interbank Offered Rate, and Libor - London Interbank Offered Rate. |
| 2. | The following debt series are issued for Provincial purposes and for OEFC: DMTN217, DMTN183, DMTN79, DMTN218, DMTN195, DMTN225, DMTN140, DMTN200, DMTN207, DMTN212, DMTN215, HP, DMTN223, DMTN227, KJ, LQ, DMTN158, DMTN164, DMTN182, DMTN204, DMTN214, DMTN220, DMTN228, PU, EMTN82 and G62. |
| 3. | The Canada Pension Plan Investment Board (CPPIB) invests funds in the Province of Ontario’s non-marketable securities. Effective July 1, 2005, under a side-letter agreement signed between the CPPIB and the Province, CPPIB offered the Province upon maturity of the debentures held to the credit of the Canada Pension Plan Investment Fund (CPPIF) that were issued before January 1, 1998, an option of issuing new replacement debentures to the CPPIB with a maximum term of 30 years (minimum term of 5 years and with subsequent roll over options subject to the 30 years maximum from the date of issue of the first replacement debenture) at a rate based on the capital market rates at the time of roll over. These debentures are not negotiable or transferable and are assignable only to a wholly-owned subsidiary of the Canada Pension Plan Investment Board. On April 1, 2007, all debentures held to the credit of the CPPIF or purchased by the Minister of Finance of Canada in accordance with Section 110 of the Canada Pension Plan were transferred to the CPPIB. |
| 4. | OIIC: Total outstanding amount is $492 million which is invested directly with the Province of Ontario and Infrastructure Ontario. |
| 5. | CMHC: The terms of these debentures require that equal payments be made each year until their maturity. Each payment consists of blended principal and interest. |
| 6. | The Province entered into interest rate agreements for certain Canadian bonds to effectively convert their interest rate obligations according to the Province’s risk management strategy. These bonds and effective rates are: DMTN219 1.95%, DMTN217 1.88%, DMTN221 2.19% ($475 million), DMTN79 3M CBA – 0.018% ($125 million), DMTN222 2.52% ($531 million), DMTN224 2.14%, DMTN105 3M CBA rate, DMTN195 3M CBA rate + 0.58%($600 million), DMTN226 1.91%, DMTN230 1.41%, DMTN180 4.52%, DMTN233 1.31%, DMTN116 4.22%, and DMTN119 4.75% ($257 million). |
| 7. | MH: The terms of these debentures require that a special one-time interest payment of 25% of the principal amount outstanding be made at maturity. |
| 8. | DMTN157: Interest is payable semi-annually at 15.0% until January 13, 2006 and thereafter at 5.0%. |
| 9. | DMTN119: Extendible bonds DMTN149 and DMTN152 were exercised and exchanged for DMTN119 in June 2016 and December 2016 respectively. The execution of the options resulted in an increase in the face value of the bonds by $456 million ($183m DMTN149 and $273m DMTN152). |
| 10. | Series HZ, JA, JB, JC, JD: These are zero coupon bonds which require unequal payments consisting of principal and interest to be made at predetermined irregular intervals with final payment on January 10, 2035. During the fiscal year 2016-17, principal repaid was $0.1 million. The total principal and interest to be payable over the life of these bonds is $1,092 million. |
| 11. | DMTN158: This Real Return Bond bears interest to the index adjusted principal in relation to All-Items Consumer Price Index for Canada (the “CPI”), issued with a base index of 127.54839 on October 4, 2005. Consequent to the change of official time base reference period from 1992 to 2002 by the Bank of Canada on June 19, 2007, the base index has been changed to 107.18352. Total issue size is $2,844 million in principal, of which $700 million has been on-lent to OEFC, and $300 million has been swapped effectively to a nominal debt paying a fixed rate of 4.22%. The amount outstanding represents the indexed value of the principal. |
| 12. | DMTN117: The bond was issued at a high premium in 2004 to offer a yield of 5.74%. |
| 13. | JL: The terms of these debentures require unequal payments, consisting of both principal and interest, to be made at predetermined irregular intervals with the final payment on January 10, 2045. The total principal and interest to be payable over the life of the debenture is $1,325 million. |
41
| 14. | OSB: Ontario Savings Bonds are redeemable at the option of the holders on June 21 and December 21 and for 14 calendar days following the redemption date of June 21 and December 21, with the exception of Fixed-Rate bonds which are redeemable at maturity only. Starting in 2009, Variable Rate Bonds are redeemable annually only on June 21. All current outstanding OSBs may be redeemed upon the death of the beneficial owner. |
OSB - Fixed Rate:
In 2009, fixed rate bonds were issued for a term of two, three and five years. In 2010 and 2011, fixed rate bonds were issued for a term of three, seven and ten years. In 2012, 2013, 2014, 2015 and 2016, fixed-rate bonds were issued for a term of three and ten years only.
OSB - Step-up Rate:
2012 Series: Interest is payable at 1.25%, 1.5%, 1.75%, 2.0%, and 2.25%,
2013 Series: Interest is payable at 1.25%, 1.5%, 1.75%, 2.0%, and 2.25%,
2014 Series: Interest is payable at 1.25%, 1.5%, 2.0%, 2.25% and 2.5%,
2015 Series: Interest is payable at 0.75%, 0.9%, 1.05%, 1.2% and 1.35%,
2016 Series: Interest is payable at 0.60%, 0.75%, 1.0%, 1.25%, and 1.5%,
in year 1, 2, 3, 4 and 5 respectively.
OSB – Variable Rate:
Starting in 2009, the interest rate on the Variable Rate Bond is reset yearly, on June 21 only.
| 15. | OSB: The outstanding amount represent bonds matured but not yet presented for redemption. Interest is payable on these bonds only up to the maturity date. |
| 16. | All foreign currency debt has been converted into Canadian dollar equivalents at the rates of the currency exchange agreements if the debt was hedged, or at year end exchange rates if unhedged. 98.6 per cent of foreign currency debt is hedged as at March 31, 2017. The exchange rates of foreign currencies to Canadian dollars as at March 31, 2017 are: Australian dollar 1.016128, euro 1.41871, Japanese yen 0.011946, Swiss franc 1.32756, United States dollar 1.32975. |
In addition, the Province entered into interest rate agreements that effectively converted these interest rate obligations in accordance with the Province’s risk management strategies. These bonds and effective rates are:
| | (a) | Australia in AUD 3.04% |
| | (b) | EMTN in Euro: 3.66% ($9,731 million), 3M CBA + 1.42% ($1,774 million) |
| | (d) | Japan in Yen: 4.34% ($76 million), EMTN in Yen 2.20% ($439 million) |
| | (e) | EMTN in CHF: 4.45% ($955 million), $531 million unhedged at 2.26% |
| | (f) | US in USD: 1.84% ($254 million) |
| | (g) | Global in USD: 3.00% ($16,226 million), 3M CBA + 0.33% ($8,616 million), 1.02% ($7,997 million), 1.91%(1,274 million) |
The OEFC also entered into interest rate agreements that effectively converted these interest rate obligations in accordance with the OEFC’s risk management strategies. These bonds and effective rates are:
| | (h) | Global in Euro 4.0%, EMTN in CHF 1.20%, EMTN in USD 4.22%, Global in USD 3M CBA + 0.32%. |
| 17. | U.S. Commercial Paper issues are discount notes with maturities up to 270 days. |
| 18. | SBT: A School Board Trust was created in June 2003 to permanently refinance debt incurred by 55 school boards. The Trust issued 30-year sinking fund debentures amounting to $891 million and $882 million of the proceeds was provided to the 55 school boards in exchange for the irrevocable right to receive future transfer payments from the Province. An annual transfer payment is made by the Ministry of Education to the Trust’s sinking fund under the School Board Operating Grant program to retire the debt over 30 years. |
| 19. | Total consolidation adjustments include third party debt issued by other government organizations and the elimination of provincial debt held by these organizations. The following are the provincial debt held by other government organizations (in millions): |
Ontario Bonds:
Forest Renewal Trust: $3m DMTN207 and $3m DMTN215.
Infrastructure Ontario: $17m DMTN195, $62m DMTN218, $88m DMTN223 and $6m DMTN225.
Ontario Trillium Foundation: $6m DMTN200, $12m DMTN213, $12m DMTN218, $7m DMTN219 and $12m DMTN225.
Ontario Immigrant Investor Corporation: $114m OIIC 144-188.
Treasury Bills:
Northern Ontario Heritage Fund Corporation: $201m, Ontario Capital Growth Corporation: $88m, Ontario Immigrant Investor Corporation: $15m, Forest Renewal Trust: $3m and Ontario Trillium Foundation: $30m.
42
SEC Registered Debt Outstanding for Province of Ontario
| | | | | | | | | | | | |
Date of Maturity | | Date of Issue | | Series | | Interest Rate (%) | | Issuing
Currency | | Outstanding | |
January 9, 2018 | | January 9, 2009 | | PU | | 3M EURIBOR + 1.39 | | EUR | | | 120,000,000 | |
February 14, 2018 | | February 14, 2013 | | G62 | | 1.20 | | USD | | | 705,000,000 | |
July 16, 2018 | | July 14, 2011 | | G55 | | 3.00 | | USD | | | 1,000,000,000 | |
September 27, 2018 | | September 27, 2013 | | G63 | | 2.00 | | USD | | | 1,750,000,000 | |
October 9, 2018 | | October 9, 2014 | | G68 | | 1.75 | | CAD | | | 500,000,000 | |
January 18, 2019 | | January 21, 2016 | | G71 | | 1.625 | | USD | | | 2,500,000,000 | |
January 30, 2019 | | January 30, 2014 | | G65 | | 2.00 | | USD | | | 2,000,000,000 | |
June 17, 2019 | | June 17, 2016 | | G73 | | 1.25 | | USD | | | 1,750,000,000 | |
September 27, 2019 | | September 27, 2012 | | G59 | | 1.65 | | USD | | | 1,250,000,000 | |
October 7, 2019 | | October 7, 2009 | | G44 | | 4.00 | | USD | | | 2,000,000,000 | |
April 14, 2020 | | April 14, 2010 | | G48 | | 4.40 | | USD | | | 2,000,000,000 | |
May 21, 2020 | | May 21, 2015 | | G70 | | 1.875 | | USD | | | 2,000,000,000 | |
September 10, 2021 | | September 11, 2014 | | G67 | | 2.50 | | USD | | | 2,000,000,000 | |
February 8, 2022 | | February 8, 2017 | | G74 | | 2.40 | | USD | | | 2,500,000,000 | |
May 18, 2022 | | May 18, 2017 | | G76 | | 2.25 | | USD | | | 2,000,000,000 | |
June 29, 2022 | | June 29, 2012 | | G58 | | 2.45 | | USD | | | 1,000,000,000 | |
October 3, 2022 | | October 3, 2017 | | G75 | | 2.20 | | USD | | | 2,000,000,000 | |
January 27, 2023 | | January 29, 2016 | | G72 | | 1.95 | | CAD | | | 750,000,000 | |
January 27, 2023 | | February 2, 2017 | | G72 (1st Re-opening) | | 1.95 | | CAD | | | 800,000,000 | |
February 7, 2024 | | February 7, 1994 | | HS | | 7.50 | | CAD | | | 1,106,700,000 | |
May 16, 2024 | | May 16, 2014 | | G66 | | 3.20 | | USD | | | 1,250,000,000 | |
April 27, 2026 | | April 27, 2016 | | G69 | | 2.50 | | USD | | | 1,000,000,000 | |
43
SEC Registered Debt Outstanding Issued by the Province for Ontario Electricity Financial Corporation (OEFC)
| | | | | | | | | | | | |
Date of Maturity | | Date of Issue | | Series | | Interest Rate (%) | | Issuing
Currency | | Outstanding | |
February 14, 2018 | | February 14, 2013 | | G62 | | 1.20 | | USD | | | 295,000,000 | |
44
Ontario Electricity Industry
Ontario Electricity Financial Corporation (OEFC), a Crown agency, is the legal continuation of Ontario Hydro and is responsible for the management of that corporation’s debt and other liabilities that were not transferred to successor companies as part of the restructuring of Ontario Hydro in 1999, including the administration of certain power purchase agreements with non-utility generators. As at March 31, 2017, OEFC had total debt of $20.4 billion (2016, $24.3 billion). $14 billion of OEFC’s debt as at March 31, 2017 (2016, $18 billion) is held by the Province and included in total debt and other liabilities.
Ontario Hydro’s successor companies include Ontario Power Generation Inc. (OPG), a generation business wholly owned by the Province, and Hydro One Inc., a transmission and distribution business. Hydro One Inc. is now a subsidiary of Hydro One Limited (“Hydro One”) and following an initial public offering on November 5, 2015, and secondary offerings in April 2016 and May 2017, the Province’s ownership was reduced to about 49.9% of the common shares in Hydro One. On July 19, 2017, Hydro One announced an offer to acquire Avista Corporation (Avista), for $6.7 billion CAD (USD $5.3 billion). On November 21, 2017, Hydro One announced that Avista shareholders voted 98 per cent in favour of the proposed acquisition by Hydro One, and that the transaction is expected to close in the second half of 2018, pending regulatory approval. The potential acquisition would dilute the Province’s ownership by approximately 5 percentage points. Legislation restricts the Province from selling shares such that it would own less than 40% of the voting securities in Hydro One. Other Ontario Hydro successor companies are the Independent Electricity System Operator (IESO), the electricity system and market operator and the Electrical Safety Authority, which is responsible for electricity safety inspection.
Pursuant to various transfer orders (“Transfer Orders”), assets of the former Ontario Hydro were transferred to OPG, Hydro One Inc. and the IESO in exchange for debt. The Province assumed a portion of OPG’s and Hydro One Inc.’s debt in exchange for equity, in order to provide them with commercially acceptable capital structures. As of March 31, 2017, OEFC held notes receivable in the amount of $3.4 billion from OPG, $90 million from the IESO and $7.8 billion from the Province. OEFC provided indemnities, guaranteed by the Province, to OPG and Hydro One Inc. in connection with the Transfer Orders; those indemnities were terminated as of May 31, 2006 and October 31, 2015 respectively.
As of April 1, 1999, the Ministry of Finance estimated the amount of OEFC’s debt and other liabilities that, in the opinion of the Minister of Finance, could not reasonably be serviced and retired in a competitive electricity market (the “stranded debt”) to be approximately $20.9 billion. OEFC’s unfunded liability is the net deficiency of OEFC’s assets over its liabilities. The opening unfunded liability of $19.4 billion as at April 1, 1999 represented the stranded debt adjusted for $1.5 billion of additional assets transferred to OEFC. OEFC’s unfunded liability as at March 31, 2017 was $3.2 billion.
As part of the restructuring of the electricity sector, a long-term plan provides for certain dedicated revenue streams to service and retire OEFC’s debt and other liabilities. These revenue streams are established under the Electricity Act, 1998 (“Electricity Act”) and include payments-in-lieu of property taxes and federal and provincial corporate income taxes currently paid by OPG and the municipal electricity utilities. As a result of the initial public offering on November 5, 2015, Hydro One is no longer subject to payments-in-lieu of federal and provincial corporate income taxes and is subject to normal corporate income taxes. The Minister of Finance has legislative authority and is required to make payments to the OEFC equal to the amount of provincial corporate tax payable by Hydro One Inc. under the Taxation Act, 2007.
The Province, as shareholder, is eligible to receive dividend payments on its shares in OPG and Hydro One. Pursuant to the government’s commitment to keep electricity income in the electricity sector, the Province’s proportionate share of the cumulative combined net income of OPG and Hydro One in excess of the Province’s cumulative interest expenditure on its investment in the companies is allocated to OEFC for purposes of debt retirement (“electricity sector dedicated income”).
Under the Electricity Act, 1998, a Debt Retirement Charge (DRC) of 0.7 cents per kilowatt hour is levied on most Ontario electricity users and payable to OEFC. Prior to January 1, 2016, the DRC was payable by most electricity consumers. As of January 1, 2016, residential electricity users will be exempted from paying the DRC. The government introduced legislation, passed on December 10, 2015, the Budget Measures Act, 2015 to legislate a fixed end-date for the DRC of April 1, 2018, for commercial, industrial and all other users.
The Electricity Act and the Ontario Energy Board Act, 1998 set out the legislative framework for Ontario’s electricity market and restructuring of Ontario Hydro. Open, non-discriminatory access to transmission and distribution systems commenced May 1, 2002. Since 2005, electricity prices payable by consumers reflect a blend of contract prices, regulated prices for OPG’s output from its price-regulated nuclear and hydroelectric plants, and market prices. Regulated prices for OPG are approved by the Ontario Energy Board (OEB). The OEB also sets the commodity price payable by low volume and certain other specified consumers under the Regulated Price Plan (RPP). The IESO finances any differences between prices under the RPP and the actual supply cost of electricity, with any shortfall or surplus to be recovered or returned through the setting of RPP prices in the following period.
45
The government announced Ontario’s Fair Hydro Plan in March 2017. This plan includes refinancing the cost of capital investments in electricity generating infrastructure to ensure that electricity system costs are more equitably distributed over time between present and future electricity consumers reflecting the expected longer life cycle and ongoing benefits of existing facilities. In the early years, a portion of the electricity system costs covered by the Global Adjustment (GA) will be paid through an arms-length financing entity to reduce pressure on current, eligible electricity consumers. In later years, the cost of such financing would be recovered from specified consumers. The GA is a component of electricity bills and is paid to electricity generators for investments in electricity supply and conservation.
In June 2017, the Province enacted the Ontario Fair Hydro Plan Act, 2017 (the Act). Electricity consumers have seen an average 25 per cent reduction in their electricity bills. In addition to the reallocation of GA costs, this reduction also reflects a number of other components that are government funded, including providing an eight per cent rebate on electricity bills, equal to the provincial portion of the Harmonized Sales Tax under the Ontario Rebate for Electricity Consumers (OREC), which was effective January 1, 2017; and funding the cost of the Ontario Electricity Support Program and most of the Rural or Remote Rate Protection program from general government funds instead of from ratepayers. The government has estimated the cost of these government-funded components of the Fair Hydro Plan, including the earlier announced OREC, at about $1.4 billion in 2017-18. The GA financing plan is structured to be financed and paid for by electricity ratepayers rather than taxpayers and does not have a net impact on the Province’s fiscal plan. The GA financing is being administered through the Independent Electricity System Operator, Ontario Power Generation Inc., and a financing entity established by OPG (the OPG Trust). The OPG Trust will finance the GA shortfall, raising funds 51% from its own borrowings and 49% from OPG (5% by OPG borrowing and 44% from an equity injection by the Province into OPG). The 2017 Budget fiscal plan reflects a provincial equity injection that is fiscally neutral, as the equity injection (OPG share purchase) is an investment with no net impact on the budget balance or net debt, and as the Province’s cost of borrowing for the equity injection is assumed to be offset through OPG and its interest revenues from lending to the OPG Trust.
The Province, OPG and certain subsidiaries of OPG are parties to the Ontario Nuclear Funds Agreement (ONFA), which governs the establishment, funding and management of segregated funds to ensure sufficient funds are available to pay the costs of nuclear station decommissioning, low and intermediate level nuclear waste management and nuclear used fuel waste management.
Under ONFA, the Province is liable to make payments should the cost estimate for nuclear used fuel waste management rise above specified thresholds, for a fixed volume of used fuel. The likelihood and amount by which the cost estimate could rise above these thresholds cannot be determined at this time. The cost estimate will be updated periodically to reflect new developments in the management of nuclear used fuel waste.
As well, under ONFA, the Province guarantees a return of 3.25% over the Ontario Consumer Price Index for the portion of the nuclear used fuel waste management segregated fund related to the fixed volume of used fuel. If the earnings on assets in that fund related to the fixed volume exceed the guaranteed rate, the Province is entitled to the excess.
To the end of 2017, two agreements satisfy the Canadian Nuclear Safety Commission (CNSC) licensing requirements for financial guarantees in respect of OPG’s nuclear station decommissioning and nuclear waste management obligations. One agreement gives the CNSC access (in prescribed circumstances) to the segregated funds established under ONFA. The other agreement between the Province and the CNSC, in place to the end of 2017, provides a direct provincial guarantee to the CNSC on behalf of OPG. This guarantee, for up to $1,551 million, effective January 1, 2013 to December 31, 2017, relates to the portion of the decommissioning and waste management obligations not funded by the estimated value of ONFA funds as at January 1, 2013. In return, the Province receives from OPG an annual fee equal to 0.5% of the value of the guarantee. In the fourth quarter of 2017, OPG submitted to the CNSC for approval its proposed revised financial guarantee for the 2018 – 2022 period. OPG’s submission estimated that its financial guarantee requirement could be fully satisfied through the value of the ONFA funds. As such, it proposed that the CNSC approve that the financial guarantee requirement be satisfied by the value of the ONFA funds, without the need for a direct provincial guarantee to the CNSC. On November 28, 2017, the CNSC announced that it accepted OPG’s proposed revised financial guarantee.
46
CONTINGENT LIABILITIES –
OBLIGATIONS GUARANTEED BY THE PROVINCE OF ONTARIO
As at March 31, 2017
LOANS GUARANTEED
| | | | | | | | | | | | |
| | | Year of Issue | | Rate of Interest | | Outstanding
March 31, 2017 | | | References | |
| | | | | % | | $ | | | | |
MINISTRY OF AGRICULTURE AND FOOD / RURAL AFFAIRS | | | | | | | | | | |
Commodity Loan Guarantee Program | | Ongoing | | Prime | | | 15,431,863 | | | | (1) | |
Feeder Cattle Loan Guarantee Program | | Ongoing | | Various | | | 21,490,655 | | | | (2) | |
FarmPlus Rural Loan Pool Program | | Pre-2006 | | Various | | | 19,726 | | | | | |
| | | | | | | | | | | | |
TOTAL MINISTRY OF AGRICULTURE AND FOOD / RURAL AFFAIRS | | | | | 36,942,244 | | | | | |
| | | | | | | | | | | | |
MINISTRY OF TRAINING, COLLEGES AND UNIVERSITIES | | | | | | | | | | |
Ontario Student Loan Plan: | | | | | | | | | | | | |
Class “A” | | Various | | Prime | | | 878,651 | | | | | |
Class “B” | | Various | | Prime + 1 | | | 65,573 | | | | | |
Class “C” | | Various | | Prime + 1 | | | 17,839,127 | | | | | |
| | | | | | | | | | | | |
TOTAL MINISTRY OF TRAINING, COLLEGES AND UNIVERSITIES | | | | | 18,783,351 | | | | | |
| | | | | | | | | | | | |
TOTAL LOANS GUARANTEED | | | | | | | 55,725,595 | | | | | |
| | | | | | | | | | | | |
47
CONTINGENT LIABILITIES –
OBLIGATIONS GUARANTEED BY THE PROVINCE OF ONTARIO – Concluded
As at March 31, 2017
OTHER GUARANTEES
| | | | | | | | | | |
| | | Year of Issue | | Rate of Interest | | Outstanding
March 31, 2017 | | | References |
| | | | | % | | $ | | | |
MINISTRY OF FINANCE | | | | | | | | | | |
Loan Facility by United Communities Credit Union Ltd. to Pelee Island Co-operative Association | | 2010 | | 4.75 | | | 493,625 | | | (3) |
Loan Guarantees under Aboriginal Loan Guarantee Program | | 2011 | | Various | | | 204,700,000 | | | (4) |
| | | | | | | | | | |
TOTAL MINISTRY OF FINANCE | | | | | | | 205,193,625 | | | |
| | | | | | | | | | |
TOTAL OTHER GUARANTEES | | | | | | | 205,193,625 | | | |
| | | | | | | | | | |
TOTAL LOANS AND OTHER GUARANTEES | | | | | | | 260,919,220 | | | |
| | | | | | | | | | |
FINANCIAL GUARANTEES – MINISTRY OF FINANCE:
To the end of 2017, two agreements satisfy the Canadian Nuclear Safety Commission (CNSC) licensing requirements for financial guarantees in respect of OPG’s nuclear station decommissioning and nuclear waste management obligations. One agreement gives the CNSC access (in prescribed circumstances) to the segregated funds established under ONFA. The other agreement between the Province and the CNSC, in place to the end of 2017, provides a direct provincial guarantee to the CNSC on behalf of OPG. This guarantee, for up to $1,551 million, effective January 1, 2013, to December 31, 2017, relates to the portion of the decommissioning and waste management obligations not funded by the estimated value of ONFA funds as at January 1, 2013. In return, the Province receives from OPG an annual fee equal to 0.5% of the value of the guarantee. In each of January 2014, 2015, 2016 and 2017, OPG paid a guarantee fee of $7.76 million to the Province based on the guarantee amount of $1,551 million.
In the fourth quarter of 2017, OPG submitted to the CNSC for approval its proposed revised financial guarantee for the 2018 – 2022 period. OPG’s submission estimated that its financial guarantee requirement could be fully satisfied through the value of the ONFA funds. As such, it proposed that the CNSC approve that the financial guarantee requirement be satisfied by the value of the ONFA funds, without the need for a direct provincial guarantee to the CNSC. On November 28, 2017, the CNSC announced that it accepted OPG’s proposed revised financial guarantee.
References:
| 1. | The Province’s maximum liability for the program is $15,431,863. |
| 2. | The Province’s maximum liability for the program is $21,490,655. |
| 3. | The Province has guaranteed the repayment of loan facility made by United Communities Credit Union Limited to Pelee Island Cooperative Association for a period beginning May 11, 2010 and ending at the earliest of April 1, 2015 or repayment of all the amounts borrowed. The guarantee shall be extended accordingly but not to extend beyond April 1, 2035. The maximum amount guaranteed is $ 0.6 million plus any unpaid interest, costs and expenses thereon. |
| 4. | The Province has provided eight loan guarantees under the Aboriginal Loan Guarantee Program: two in fiscal 2011-12, two in fiscal 2013-14, one in fiscal 2014-15, two in fiscal 2015-16, and one in fiscal 2016-2017 for a combined total of $236.1 million. These guarantees will mature between 2026/27 and 2039/40. Borrowers pay the Province an annual loan guarantee fee of 0.15% of the outstanding guaranteed amount. The Aboriginal Loan Guarantee Program provides loan guarantees to support Aboriginal equity participation in renewable energy generation and transmission projects and has a maximum program envelope of $650 million. As of March 31, 2017, the maximum amount authorized per Order in Council for guarantees in place is $240.1 million. As a subsequent event, one guarantee has been issued to date in 2017/2018 for $18.2 million under an Order in Council for up to $20 million. |
48
Economic Data Tables
The following tables present a comprehensive review of Ontario’s economy including, GDP information, imports and exports, demographics and labour markets between 2003-2016.
49
| | | | | | | | | | | | | | | | | | | | | | | | | | | | |
Ontario, Gross Domestic Product, 2003–2016 | | | | | | | | | | | | | | | | | | | | Table 1 | |
| | | ($ Billions) | |
| | | 2003 | | | 2004 | | | 2005 | | | 2006 | | | 2007 | | | 2008 | | | 2009 | |
Real GDP (chained $2007) | | | 552.2 | | | | 567.7 | | | | 586.0 | | | | 596.9 | | | | 601.7 | | | | 601.7 | | | | 582.9 | |
Household Consumption | | | 287.4 | | | | 295.3 | | | | 306.3 | | | | 316.1 | | | | 328.2 | | | | 336.2 | | | | 335.9 | |
Residential Construction | | | 36.9 | | | | 38.7 | | | | 39.4 | | | | 39.7 | | | | 40.7 | | | | 38.8 | | | | 36.5 | |
Non-residential Construction | | | 13.5 | | | | 13.4 | | | | 13.6 | | | | 15.3 | | | | 16.3 | | | | 15.4 | | | | 14.5 | |
Machinery and Equipment | | | 21.3 | | | | 23.1 | | | | 26.0 | | | | 28.2 | | | | 28.0 | | | | 28.3 | | | | 21.7 | |
Exports | | | 311.9 | | | | 327.6 | | | | 334.9 | | | | 337.3 | | | | 338.3 | | | | 316.6 | | | | 274.4 | |
Imports | | | 261.5 | | | | 279.6 | | | | 288.4 | | | | 299.8 | | | | 311.2 | | | | 303.7 | | | | 269.2 | |
Nominal Gross Domestic Product | | | 509.5 | | | | 533.3 | | | | 556.6 | | | | 578.2 | | | | 601.7 | | | | 608.4 | | | | 597.9 | |
Primary Household Income | | | 332.9 | | | | 349.1 | | | | 364.9 | | | | 381.9 | | | | 403.4 | | | | 414.7 | | | | 412.8 | |
Compensation of Employees | | | 263.3 | | | | 276.9 | | | | 289.6 | | | | 302.9 | | | | 319.0 | | | | 328.2 | | | | 323.2 | |
Net Operating Surplus | | | 68.4 | | | | 70.5 | | | | 74.9 | | | | 74.3 | | | | 73.3 | | | | 66.0 | | | | 56.0 | |
| |
Table 1 (continued) | | ($ Billions) | |
| | | 2010 | | | 2011 | | | 2012 | | | 2013 | | | 2014 | | | 2015 | | | 2016 | |
Real GDP (chained $2007) | | | 600.1 | | | | 614.6 | | | | 622.7 | | | | 631.9 | | | | 648.8 | | | | 667.7 | | | | 685.0 | |
Household Consumption | | | 348.2 | | | | 354.1 | | | | 359.4 | | | | 366.9 | | | | 376.8 | | | | 387.3 | | | | 398.7 | |
Residential Construction | | | 39.4 | | | | 40.9 | | | | 42.8 | | | | 42.0 | | | | 42.2 | | | | 45.4 | | | | 48.8 | |
Non-residential Construction | | | 14.8 | | | | 18.1 | | | | 19.6 | | | | 18.7 | | | | 20.8 | | | | 22.4 | | | | 20.1 | |
Machinery and Equipment | | | 23.8 | | | | 24.6 | | | | 24.3 | | | | 21.6 | | | | 25.1 | | | | 26.9 | | | | 24.8 | |
Exports | | | 297.0 | | | | 312.7 | | | | 320.2 | | | | 330.7 | | | | 338.8 | | | | 350.0 | | | | 358.9 | |
Imports | | | 300.8 | | | | 316.5 | | | | 319.5 | | | | 322.2 | | | | 332.7 | | | | 343.1 | | | | 343.1 | |
Nominal Gross Domestic Product | | | 631.0 | | | | 659.7 | | | | 680.1 | | | | 695.4 | | | | 726.1 | | | | 762.0 | | | | 794.8 | |
Primary Household Income | | | 424.3 | | | | 444.1 | | | | 459.1 | | | | 472.9 | | | | 489.4 | | | | 512.6 | | | | 528.4 | |
Compensation of Employees | | | 333.7 | | | | 349.0 | | | | 360.5 | | | | 372.0 | | | | 384.5 | | | | 402.1 | | | | 415.7 | |
Net Operating Surplus | | | 74.4 | | | | 83.4 | | | | 85.9 | | | | 84.8 | | | | 94.3 | | | | 101.0 | | | | 108.4 | |
Source: Statistics Canada.
50
| | | | | | | | | | | | | | | | | | | | | | | | | | | | |
Ontario, Growth in Gross Domestic Product, 2003–2016 | | | | | | | | | | | | | | | | | | | | Table 2 | |
| | | (Per Cent Change) | |
| | | 2003 | | | 2004 | | | 2005 | | | 2006 | | | 2007 | | | 2008 | | | 2009 | |
Real GDP (chained $2007) | | | 1.1 | | | | 2.8 | | | | 3.2 | | | | 1.9 | | | | 0.8 | | | | 0.0 | | | | (3.1 | ) |
Household Consumption | | | 2.9 | | | | 2.7 | | | | 3.7 | | | | 3.2 | | | | 3.8 | | | | 2.4 | | | | (0.1 | ) |
Residential Construction | | | 1.3 | | | | 5.0 | | | | 1.7 | | | | 0.9 | | | | 2.5 | | | | (4.7 | ) | | | (6.0 | ) |
Non-residential Construction | | | (2.8 | ) | | | (1.2 | ) | | | 2.1 | | | | 11.9 | | | | 6.9 | | | | (5.3 | ) | | | (5.9 | ) |
Machinery and Equipment | | | 7.0 | | | | 8.3 | | | | 12.5 | | | | 8.5 | | | | (0.8 | ) | | | 1.3 | | | | (23.4 | ) |
Exports | | | 0.2 | | | | 5.0 | | | | 2.2 | | | | 0.7 | | | | 0.3 | | | | (6.4 | ) | | | (13.3 | ) |
Imports | | | 3.3 | | | | 7.0 | | | | 3.1 | | | | 3.9 | | | | 3.8 | | | | (2.4 | ) | | | (11.4 | ) |
Nominal Gross Domestic Product | | | 3.0 | | | | 4.7 | | | | 4.4 | | | | 3.9 | | | | 4.1 | | | | 1.1 | | | | (1.7 | ) |
Primary Household Income | | | 3.0 | | | | 4.9 | | | | 4.5 | | | | 4.6 | | | | 5.6 | | | | 2.8 | | | | (0.5 | ) |
Compensation of Employees | | | 3.9 | | | | 5.2 | | | | 4.6 | | | | 4.6 | | | | 5.3 | | | | 2.9 | | | | (1.5 | ) |
Net Operating Surplus | | | 4.2 | | | | 3.0 | | | | 6.3 | | | | (0.9 | ) | | | (1.4 | ) | | | (9.9 | ) | | | (15.2 | ) |
| |
Table 2 (continued) | | (Per Cent Change) | |
| | | 2010 | | | 2011 | | | 2012 | | | 2013 | | | 2014 | | | 2015 | | | 2016 | |
Real GDP (chained $2007) | | | 2.9 | | | | 2.4 | | | | 1.3 | | | | 1.5 | | | | 2.7 | | | | 2.9 | | | | 2.6 | |
Household Consumption | | | 3.6 | | | | 1.7 | | | | 1.5 | | | | 2.1 | | | | 2.7 | | | | 2.8 | | | | 3.0 | |
Residential Construction | | | 8.1 | | | | 3.6 | | | | 4.7 | | | | (1.9 | ) | | | 0.5 | | | | 7.7 | | | | 7.5 | |
Non-residential Construction | | | 1.6 | | | | 22.7 | | | | 8.0 | | | | (4.4 | ) | | | 11.2 | | | | 7.7 | | | | (10.1 | ) |
Machinery and Equipment | | | 9.7 | | | | 3.2 | | | | (0.9 | ) | | | (11.1 | ) | | | 16.0 | | | | 7.3 | | | | (7.8 | ) |
Exports | | | 8.2 | | | | 5.3 | | | | 2.4 | | | | 3.3 | | | | 2.4 | | | | 3.3 | | | | 2.5 | |
Imports | | | 11.8 | | | | 5.2 | | | | 0.9 | | | | 0.8 | | | | 3.3 | | | | 3.2 | | | | 0.0 | |
Nominal Gross Domestic Product | | | 5.5 | | | | 4.6 | | | | 3.1 | | | | 2.2 | | | | 4.4 | | | | 5.0 | | | | 4.3 | |
Primary Household Income | | | 2.8 | | | | 4.7 | | | | 3.4 | | | | 3.0 | | | | 3.5 | | | | 4.7 | | | | 3.1 | |
Compensation of Employees | | | 3.2 | | | | 4.6 | | | | 3.3 | | | | 3.2 | | | | 3.4 | | | | 4.6 | | | | 3.4 | |
Net Operating Surplus | | | 32.9 | | | | 12.1 | | | | 3.0 | | | | (1.2 | ) | | | 11.2 | | | | 7.1 | | | | 7.3 | |
Source: Statistics Canada.
51
| | | | | | | | | | | | | | | | |
Ontario, Real Gross Domestic Product by Industry at Basic Prices, 2013–2016 | | | | | | | | | | | Table 3 | |
| | | ($2007 Chained Millions) | |
| | | 2013 | | | 2014 | | | 2015 | | | 2016 | |
Goods Producing Industries | | | 136,622 | | | | 139,858 | | | | 142,405 | | | | 144,581 | |
Primary | | | 13,720 | | | | 13,279 | | | | 13,015 | | | | 12,820 | |
Utilities | | | 11,510 | | | | 12,088 | | | | 11,728 | | | | 11,918 | |
Construction | | | 35,065 | | | | 35,848 | | | | 37,466 | | | | 38,002 | |
Manufacturing1 | | | 75,766 | | | | 78,051 | | | | 79,390 | | | | 81,005 | |
Services Producing Industries | | | 449,954 | | | | 461,136 | | | | 475,248 | | | | 489,240 | |
Wholesale Trade | | | 40,144 | | | | 41,077 | | | | 42,783 | | | | 43,976 | |
Retail Trade | | | 31,074 | | | | 31,059 | | | | 32,602 | | | | 34,024 | |
Transportation and Warehousing | | | 22,351 | | | | 23,826 | | | | 24,697 | | | | 25,539 | |
Information and Cultural (incl. Telecommunications) | | | 21,310 | | | | 22,418 | | | | 22,402 | | | | 22,708 | |
Finance and Insurance | | | 54,991 | | | | 57,063 | | | | 59,943 | | | | 62,765 | |
Real Estate and Leasing | | | 78,825 | | | | 80,068 | | | | 83,032 | | | | 85,999 | |
Professional and Administrative Services | | | 54,796 | | | | 57,341 | | | | 59,206 | | | | 60,800 | |
Management of Companies and Enterprises | | | 4,831 | | | | 4,494 | | | | 4,606 | | | | 4,493 | |
Education | | | 34,475 | | | | 35,132 | | | | 35,673 | | | | 36,207 | |
Health Care and Social Services | | | 39,074 | | | | 39,561 | | | | 40,451 | | | | 41,887 | |
Arts, Entertainment and Recreation | | | 4,370 | | | | 4,628 | | | | 4,969 | | | | 5,247 | |
Accommodation and Food | | | 11,436 | | | | 12,123 | | | | 12,509 | | | | 12,971 | |
Other Services | | | 11,521 | | | | 12,016 | | | | 12,059 | | | | 11,941 | |
Public Administration | | | 41,227 | | | | 40,816 | | | | 41,122 | | | | 41,698 | |
Total Production | | | 586,913 | | | | 601,344 | | | | 618,051 | | | | 634,258 | |
| 1 | See Table 5 for detailed manufacturing industries. |
Source: Statistics Canada.
52
| | | | | | | | | | | | | | | | |
Ontario, Growth in Real Gross Domestic Product by Industry at Basic Prices, 2013–2016 | | | | | | | | | | | Table 4 | |
| | | (Per Cent Change) | |
| | | 2013 | | | 2014 | | | 2015 | | | 2016 | |
Goods Producing Industries | | | 0.4 | | | | 2.4 | | | | 1.8 | | | | 1.5 | |
Primary | | | 8.2 | | | | (3.2 | ) | | | (2.0 | ) | | | (1.5 | ) |
Utilities | | | (0.3 | ) | | | 5.0 | | | | (3.0 | ) | | | 1.6 | |
Construction | | | 0.7 | | | | 2.2 | | | | 4.5 | | | | 1.4 | |
Manufacturing1 | | | (1.0 | ) | | | 3.0 | | | | 1.7 | | | | 2.0 | |
Services Producing Industries | | | 1.7 | | | | 2.5 | | | | 3.1 | | | | 2.9 | |
Wholesale Trade | | | 3.8 | | | | 2.3 | | | | 4.2 | | | | 2.8 | |
Retail Trade | | | 5.1 | | | | 0.0 | | | | 5.0 | | | | 4.4 | |
Transportation and Warehousing | | | 2.0 | | | | 6.6 | | | | 3.7 | | | | 3.4 | |
Information and Cultural (incl. Telecommunications) | | | (1.2 | ) | | | 5.2 | | | | (0.1 | ) | | | 1.4 | |
Finance and Insurance | | | 4.2 | | | | 3.8 | | | | 5.0 | | | | 4.7 | |
Real Estate and Leasing | | | 2.1 | | | | 1.6 | | | | 3.7 | | | | 3.6 | |
Professional and Administrative Services | | | 0.6 | | | | 4.6 | | | | 3.3 | | | | 2.7 | |
Management of Companies and Enterprises | | | 6.0 | | | | (7.0 | ) | | | 2.5 | | | | (2.5 | ) |
Education | | | 1.5 | | | | 1.9 | | | | 1.5 | | | | 1.5 | |
Health Care and Social Services | | | (1.4 | ) | | | 1.2 | | | | 2.3 | | | | 3.5 | |
Arts, Entertainment and Recreation | | | 0.0 | | | | 5.9 | | | | 7.4 | | | | 5.6 | |
Accommodation and Food | | | 5.3 | | | | 6.0 | | | | 3.2 | | | | 3.7 | |
Other Services | | | 3.6 | | | | 4.3 | | | | 0.4 | | | | (1.0 | ) |
Public Administration | | | (1.2 | ) | | | (1.0 | ) | | | 0.7 | | | | 1.4 | |
Total Production | | | 1.4 | | | | 2.5 | | | | 2.8 | | | | 2.6 | |
| 1 | See Table 6 for detailed manufacturing industries. |
Source: Statistics Canada.
53
| | | | | | | | | | | | | | | | |
Ontario, Real Gross Domestic Product at Basic Prices in Selected Manufacturing Industries, 2013–2016 | | | | | | | | | | | Table 5 | |
| | | ($2007 Chained Millions) | |
| | | 2013 | | | 2014 | | | 2015 | | | 2016 | |
Manufacturing | | | 75,766 | | | | 78,051 | | | | 79,390 | | | | 81,005 | |
Food, Beverage and Tobacco Products | | | 11,375 | | | | 11,932 | | | | 12,006 | | | | 12,468 | |
Textile, Clothing and Leather Products | | | 846 | | | | 886 | | | | 907 | | | | 895 | |
Wood Products and Furniture | | | 3,116 | | | | 3,171 | | | | 3,381 | | | | 3,634 | |
Paper Products and Printing | | | 4,638 | | | | 4,499 | | | | 4,637 | | | | 4,547 | |
Chemical and Petroleum Products | | | 8,118 | | | | 7,905 | | | | 8,103 | | | | 8,192 | |
Plastic and Rubber Products | | | 4,328 | | | | 4,572 | | | | 4,770 | | | | 5,118 | |
Primary Metal and Fabricated Metal Products | | | 11,195 | | | | 11,783 | | | | 11,247 | | | | 11,238 | |
Machinery | | | 5,792 | | | | 6,023 | | | | 6,537 | | | | 6,521 | |
Electrical and Electronic Products | | | 4,929 | | | | 4,760 | | | | 4,760 | | | | 4,722 | |
Transportation Equipment | | | 17,492 | | | | 19,030 | | | | 19,376 | | | | 20,002 | |
Other Manufacturing | | | 4,101 | | | | 3,982 | | | | 4,058 | | | | 4,141 | |
Source: Statistics Canada.
| | | | | | | | | | | | | | | | |
| | | | |
Ontario, Growth in Real Gross Domestic Product at Basic Prices in Selected Manufacturing Industries, 2013–2016 | | | | | | | | | | | Table 6 | |
| | | (Per Cent Change) | |
| | | 2013 | | | 2014 | | | 2015 | | | 2016 | |
Manufacturing | | | (1.0 | ) | | | 3.0 | | | | 1.7 | | | | 2.0 | |
Food, Beverage and Tobacco Products | | | (0.4 | ) | | | 4.9 | | | | 0.6 | | | | 3.8 | |
Textile, Clothing and Leather Products | | | (9.4 | ) | | | 4.7 | | | | 2.4 | | | | (1.3 | ) |
Wood Products and Furniture | | | 6.7 | | | | 1.8 | | | | 6.6 | | | | 7.5 | |
Paper Products and Printing | | | (3.8 | ) | | | (3.0 | ) | | | 3.1 | | | | (2.0 | ) |
Chemical and Petroleum Products | | | 2.5 | | | | (2.6 | ) | | | 2.5 | | | | 1.1 | |
Plastic and Rubber Products | | | 2.1 | | | | 5.6 | | | | 4.3 | | | | 7.3 | |
Primary Metal and Fabricated Metal Products | | | 0.6 | | | | 5.3 | | | | (4.6 | ) | | | (0.1 | ) |
Machinery | | | (0.5 | ) | | | 4.0 | | | | 8.5 | | | | (0.3 | ) |
Electrical and Electronic Products | | | (9.5 | ) | | | (3.4 | ) | | | 0.0 | | | | (0.8 | ) |
Transportation Equipment | | | (3.1 | ) | | | 8.8 | | | | 1.8 | | | | 3.2 | |
Other Manufacturing | | | 2.0 | | | | (2.9 | ) | | | 1.9 | | | | 2.0 | |
Source: Statistics Canada.
54
| | | | | | | | | | | | | | | | |
| | | | |
Ontario, Housing Market Indicators, 2013–2016 | | | | | | | | | | | Table 7 | |
| | | 2013 | | | 2014 | | | 2015 | | | 2016 | |
New Housing Market | | | | | | | | | | | | | | | | |
Residential Construction, Current $ Millions | | | 50,204 | | | | 52,622 | | | | 58,574 | | | | 66,259 | |
Per Cent Change | | | 0.2 | | | | 4.8 | | | | 11.3 | | | | 13.1 | |
Real Residential Construction ($2007 Millions) | | | 41,966 | | | | 42,270 | | | | 45,318 | | | | 48,867 | |
Per Cent Change | | | (1.9 | ) | | | 0.7 | | | | 7.2 | | | | 7.8 | |
Housing Starts (Units) | | | 61,085 | | | | 59,134 | | | | 70,156 | | | | 74,952 | |
Per Cent Change | | | (20.4 | ) | | | (3.2 | ) | | | 18.6 | | | | 6.8 | |
Of which: Single-detached, urban areas (Units) | | | 21,312 | | | | 21,352 | | | | 23,446 | | | | 27,190 | |
Per Cent Change | | | (9.6 | ) | | | 0.2 | | | | 9.8 | | | | 16.0 | |
Multiple, urban areas (Units) | | | 37,303 | | | | 34,813 | | | | 44,845 | | | | 44,670 | |
Per Cent Change | | | (26.6 | ) | | | (6.7 | ) | | | 28.8 | | | | (0.4 | ) |
New Housing Price Index (2007 = 100) | | | 88.9 | | | | 90.4 | | | | 92.7 | | | | 97.2 | |
Per Cent Change | | | 2.1 | | | | 1.7 | | | | 2.5 | | | | 4.9 | |
Resale Market | | | | | | | | | | | | | | | | |
Home Resales (Units) | | | 195,026 | | | | 202,478 | | | | 221,713 | | | | 242,720 | |
Per Cent Change | | | 0.2 | | | | 3.8 | | | | 9.5 | | | | 9.5 | |
Average Resale Price ($) | | | 401,979 | | | | 429,771 | | | | 463,455 | | | | 534,848 | |
Per Cent Change | | | 4.8 | | | | 6.9 | | | | 7.8 | | | | 15.4 | |
| Sources: | Statistics Canada, Canada Mortgage and Housing Corporation and Canadian Real Estate Association and Ontario Ministry of Finance. |
55
| | | | | | | | | | | | | | | | | | | | | | | | | | | | |
Selected Financial Indicators, 2003–2016 | | | | | | | | | | | | | | | | | | | | Table 8 | |
| | | (Per Cent) | |
| | | 2003 | | | 2004 | | | 2005 | | | 2006 | | | 2007 | | | 2008 | | | 2009 | |
Interest Rates | | | | | | | | |
Bank Rate | | | 3.2 | | | | 2.5 | | | | 2.9 | | | | 4.3 | | | | 4.6 | | | | 3.2 | | | | 0.6 | |
Prime Rate | | | 4.7 | | | | 4.0 | | | | 4.4 | | | | 5.8 | | | | 6.1 | | | | 4.7 | | | | 2.4 | |
10-Year Government Bonds | | | 4.8 | | | | 4.6 | | | | 4.1 | | | | 4.2 | | | | 4.3 | | | | 3.6 | | | | 3.3 | |
Three-month T-Bills | | | 2.9 | | | | 2.2 | | | | 2.7 | | | | 4.0 | | | | 4.1 | | | | 2.3 | | | | 0.3 | |
Mortgage Rates | | | | | | | | |
5-Year Rate | | | 6.4 | | | | 6.2 | | | | 6.0 | | | | 6.7 | | | | 7.1 | | | | 7.1 | | | | 5.6 | |
1-Year Rate | | | 4.8 | | | | 4.6 | | | | 5.1 | | | | 6.3 | | | | 6.9 | | | | 6.7 | | | | 4.0 | |
Canadian Household Debt Burden1 | | | | | | | | |
Consumer | | | 39.9 | | | | 42.7 | | | | 45.7 | | | | 46.5 | | | | 49.0 | | | | 50.5 | | | | 53.4 | |
Mortgage | | | 74.2 | | | | 77.8 | | | | 82.2 | | | | 84.3 | | | | 91.4 | | | | 95.1 | | | | 98.3 | |
Bank Loans | | | 6.7 | | | | 6.7 | | | | 7.2 | | | | 7.8 | | | | 8.3 | | | | 8.5 | | | | 8.1 | |
Other Loans | | | 2.4 | | | | 1.6 | | | | 1.9 | | | | 1.9 | | | | 2.0 | | | | 2.2 | | | | 2.2 | |
Total | | | 123.2 | | | | 128.8 | | | | 136.9 | | | | 140.4 | | | | 150.8 | | | | 156.3 | | | | 161.9 | |
| |
Table 8 (continued) | | (Per Cent) | |
| | | 2010 | | | 2011 | | | 2012 | | | 2013 | | | 2014 | | | 2015 | | | 2016 | |
Interest Rates | | | | | | | | |
Bank Rate | | | 0.9 | | | | 1.3 | | | | 1.3 | | | | 1.3 | | | | 1.3 | | | | 0.9 | | | | 0.8 | |
Prime Rate | | | 2.6 | | | | 3.0 | | | | 3.0 | | | | 3.0 | | | | 3.0 | | | | 2.8 | | | | 2.7 | |
10-Year Government Bonds | | | 3.2 | | | | 2.8 | | | | 1.9 | | | | 2.3 | | | | 2.2 | | | | 1.5 | | | | 1.3 | |
Three-month T-Bills | | | 0.6 | | | | 0.9 | | | | 0.9 | | | | 1.0 | | | | 0.9 | | | | 0.5 | | | | 0.5 | |
Mortgage Rates | | | | | | | | |
5-Year Rate | | | 5.6 | | | | 5.4 | | | | 5.3 | | | | 5.2 | | | | 4.9 | | | | 4.7 | | | | 4.7 | |
1-Year Rate | | | 3.5 | | | | 3.5 | | | | 3.2 | | | | 3.1 | | | | 3.1 | | | | 3.0 | | | | 3.1 | |
Canadian Household Debt Burden1 | | | | | | | | |
Consumer | | | 52.7 | | | | 52.6 | | | | 52.2 | | | | 51.6 | | | | 51.4 | | | | 50.3 | | | | 50.2 | |
Mortgage | | | 101.2 | | | | 104.1 | | | | 106.5 | | | | 106.3 | | | | 108.1 | | | | 109.7 | | | | 112.2 | |
Bank Loans | | | 7.9 | | | | 7.8 | | | | 7.8 | | | | 7.8 | | | | 8.0 | | | | 8.6 | | | | 8.7 | |
Other Loans | | | 2.3 | | | | 2.3 | | | | 2.2 | | | | 2.2 | | | | 2.3 | | | | 2.2 | | | | 2.2 | |
Total | | | 164.2 | | | | 166.9 | | | | 168.7 | | | | 168.0 | | | | 169.8 | | | | 170.7 | | | | 173.3 | |
| 1 | Household debt as a share of household disposable income. |
Note: All data are annual averages, except Canadian Household Debt Burden (year-end).
Sources: Statistics Canada’s National Balance Sheet Accounts and Bank of Canada.
56
| | | | | | | | | | | | | | |
Ontario, International Merchandise Exports1 by Major Commodity2, 2016 | | | | | | | | Table 9 | |
| | | Value
($ Millions) | | | 2016 Growth
(Per Cent) | | | Per Cent
of Total | |
1 | | Motor vehicles and parts | | | 75,193 | | | | 9.5 | | | | 36.6 | |
2 | | Precious metals & stones | | | 21,119 | | | | 3.9 | | | | 10.3 | |
3 | | Mechanical equipment | | | 19,859 | | | | 2.3 | | | | 9.7 | |
4 | | Electrical machinery | | | 7,687 | | | | 3.7 | | | | 3.7 | |
5 | | Plastic products | | | 7,403 | | | | 0.6 | | | | 3.6 | |
6 | | Pharmaceutical products | | | 7,063 | | | | 2.5 | | | | 3.4 | |
7 | | Iron and steel | | | 4,709 | | | | 2.3 | | | | 2.3 | |
8 | | Furniture and accessories | | | 4,245 | | | | 8.3 | | | | 2.1 | |
9 | | Scientific, photo & med eqmt | | | 3,435 | | | | 5.0 | | | | 1.7 | |
10 | | Cereal and baked products | | | 3,363 | | | | 7.7 | | | | 1.6 | |
11 | | Aircraft and parts | | | 2,812 | | | | -5.9 | | | | 1.4 | |
12 | | Iron and steel products | | | 2,761 | | | | -1.0 | | | | 1.3 | |
13 | | Nickel & articles thereof | | | 2,759 | | | | -25.4 | | | | 1.3 | |
14 | | Oils & other petroleum products | | | 2,632 | | | | -18.0 | | | | 1.3 | |
15 | | Aluminium & articles | | | 2,616 | | | | 2.5 | | | | 1.3 | |
16 | | Paper products | | | 2,424 | | | | 3.2 | | | | 1.2 | |
17 | | Inorganic chemicals | | | 1,796 | | | | -2.6 | | | | 0.9 | |
18 | | Wood products | | | 1,700 | | | | 16.2 | | | | 0.8 | |
19 | | Seeds and miscellaneous grains | | | 1,658 | | | | 10.2 | | | | 0.8 | |
20 | | Miscellaneous chemical products | | | 1,655 | | | | 1.5 | | | | 0.8 | |
21 | | Rubber products | | | 1,621 | | | | -2.3 | | | | 0.8 | |
22 | | Organic chemicals | | | 1,344 | | | | -12.6 | | | | 0.7 | |
23 | | Vegetables | | | 1,313 | | | | 8.5 | | | | 0.6 | |
24 | | Perfumes and cosmetics | | | 1,211 | | | | 6.9 | | | | 0.6 | |
25 | | Miscellaneous base metal articles | | | 1,148 | | | | 5.8 | | | | 0.6 | |
| | All other commodities | | | 21,980 | | | | 2.6 | | | | 10.7 | |
| | Total Exports | | | 205,508 | | | | 10.0 | | | | 100.0 | |
| 1 | International merchandise exports exclude re-exports and are reported on a customs basis. |
| 2 | Product groupings based on two-digit Harmonized System codes. |
Sources: Statistics Canada and Ontario Ministry of Finance.
57
| | | | | | | | | | | | | | |
Ontario, International Merchandise Imports by Major Commodity1, 2016 | | | | | | | | Table 10 | |
| | | Value
($ Millions) | | | 2016 Growth
(Per Cent) | | | Per Cent
of Total | |
1 | | Motor vehicles and parts | | | 73,721 | | | | 6.9 | | | | 22.1 | |
2 | | Mechanical equipment | | | 49,307 | | | | 0.4 | | | | 14.8 | |
3 | | Electrical machinery | | | 36,947 | | | | -0.9 | | | | 11.1 | |
4 | | Plastic products | | | 13,045 | | | | 7.7 | | | | 3.9 | |
5 | | Pharmaceutical products | | | 12,231 | | | | -0.4 | | | | 3.7 | |
6 | | Precious metals & stones | | | 11,291 | | | | -4.9 | | | | 3.4 | |
7 | | Scientific, photo & med eqmt | | | 10,578 | | | | 2.5 | | | | 3.2 | |
8 | | Furniture and accessories | | | 6,968 | | | | 10.0 | | | | 2.1 | |
9 | | Oils & other petroleum products | | | 6,274 | | | | 14.6 | | | | 1.9 | |
10 | | Iron and steel products | | | 6,110 | | | | -0.1 | | | | 1.8 | |
11 | | Iron and steel | | | 5,315 | | | | 0.2 | | | | 1.6 | |
12 | | Organic chemicals | | | 4,872 | | | | -8.3 | | | | 1.5 | |
13 | | Paper products | | | 4,316 | | | | 2.5 | | | | 1.3 | |
14 | | Rubber products | | | 4,231 | | | | 1.2 | | | | 1.3 | |
15 | | Aircraft and parts | | | 4,001 | | | | -6.6 | | | | 1.2 | |
16 | | Perfumes and cosmetics | | | 3,448 | | | | 7.4 | | | | 1.0 | |
17 | | Aluminium & articles | | | 3,171 | | | | -3.5 | | | | 1.0 | |
18 | | Fruit and nuts | | | 3,068 | | | | 4.7 | | | | 0.9 | |
19 | | Toys and sporting goods | | | 3,060 | | | | 1.0 | | | | 0.9 | |
20 | | Miscellaneous chemical products | | | 2,935 | | | | 1.4 | | | | 0.9 | |
21 | | Cereal and baked products | | | 2,740 | | | | 0.6 | | | | 0.8 | |
22 | | Beverages | | | 2,611 | | | | 7.8 | | | | 0.8 | |
23 | | Miscellaneous food products | | | 2,606 | | | | 6.7 | | | | 0.8 | |
24 | | Non-knitted clothes | | | 2,499 | | | | 3.0 | | | | 0.7 | |
25 | | Knitted clothes | | | 2,437 | | | | 3.8 | | | | 0.7 | |
| | All other commodities | | | 53,708 | | | | 2.3 | | | | 16.1 | |
| | Domestic Imports | | | 331,490 | | | | 2.5 | | | | 99.3 | |
| | Re-imports2 | | | 2,174 | | | | 7.5 | | | | 0.7 | |
| | Total Imports | | | 333,664 | | | | 2.5 | | | | 100.0 | |
| 1 | Product groupings based on two-digit Harmonized System codes. Data reported on a customs basis. Domestic imports exclude re-imports. Total imports are the sum of domestic imports and re-imports. |
| 2 | These are goods re-entering (returned to) Ontario after having been exported abroad without having been materially altered or enhanced in value while abroad. |
Sources: Statistics Canada and Ontario Ministry of Finance.
58
| | | | | | | | | | | | | | |
Ontario, International Merchandise Exports1 by Top 25 Trading Partners, 2016 | | | | | | | | Table 11 | |
| | | Exports
($ Millions) | | | 2016 Growth
(Per Cent) | | | Per Cent
of Total | |
1 | | United States | | | 166,178 | | | | 4.8 | | | | 80.9 | |
2 | | United Kingdom | | | 13,721 | | | | 9.4 | | | | 6.7 | |
3 | | Mexico | | | 3,445 | | | | 21.0 | | | | 1.7 | |
4 | | China | | | 2,828 | | | | 16.8 | | | | 1.4 | |
5 | | Japan | | | 1,752 | | | | 23.0 | | | | 0.9 | |
6 | | Germany | | | 1,656 | | | | 25.4 | | | | 0.8 | |
7 | | Norway | | | 1,128 | | | | -23.6 | | | | 0.5 | |
8 | | Hong Kong | | | 1,020 | | | | -59.6 | | | | 0.5 | |
9 | | Italy | | | 959 | | | | 0.9 | | | | 0.5 | |
10 | | Netherlands | | | 824 | | | | 0.8 | | | | 0.4 | |
11 | | France | | | 807 | | | | -7.3 | | | | 0.4 | |
12 | | Saudi Arabia | | | 797 | | | | 38.7 | | | | 0.4 | |
13 | | South Korea | | | 743 | | | | 24.0 | | | | 0.4 | |
14 | | Brazil | | | 597 | | | | 15.8 | | | | 0.3 | |
15 | | Switzerland | | | 588 | | | | -23.7 | | | | 0.3 | |
16 | | Australia | | | 583 | | | | 5.4 | | | | 0.3 | |
17 | | Belgium | | | 577 | | | | -22.4 | | | | 0.3 | |
18 | | India | | | 450 | | | | -10.7 | | | | 0.2 | |
19 | | United Arab Emirates | | | 375 | | | | -32.4 | | | | 0.2 | |
20 | | Botswana | | | 364 | | | | -10.9 | | | | 0.2 | |
21 | | Thailand | | | 353 | | | | 60.8 | | | | 0.2 | |
22 | | Singapore | | | 333 | | | | -36.3 | | | | 0.2 | |
23 | | Taiwan | | | 271 | | | | -3.9 | | | | 0.1 | |
24 | | Ireland | | | 267 | | | | -29.5 | | | | 0.1 | |
25 | | Malaysia | | | 230 | | | | 3.6 | | | | 0.1 | |
| | All other countries | | | 4,664 | | | | 6.2 | | | | 2.3 | |
| | Total | | | 205,508 | | | | 4.3 | | | | 100.0 | |
| 1 | International merchandise exports exclude re-exports and are reported on a customs basis. |
Sources: Statistics Canada and Ontario Ministry of Finance.
59
| | | | | | | | | | | | | | |
Ontario, International Merchandise Imports1 by Top 25 Trading Partners, 2016 | | | | | | | | Table 12 | |
| | | Imports
($ Millions) | | | 2016 Growth
(Per Cent) | | | Per Cent
of Total | |
1 | | United States | | | 189,068 | | | | 3.8 | | | | 56.7 | |
2 | | China | | | 38,982 | | | | -1.2 | | | | 11.7 | |
3 | | Mexico | | | 26,737 | | | | 7.6 | | | | 8.0 | |
4 | | Japan | | | 11,387 | | | | 10.5 | | | | 3.4 | |
5 | | Germany | | | 8,673 | | | | 1.0 | | | | 2.6 | |
6 | | South Korea | | | 5,437 | | | | 1.2 | | | | 1.6 | |
7 | | Italy | | | 3,864 | | | | 3.5 | | | | 1.2 | |
8 | | Switzerland | | | 3,524 | | | | -2.7 | | | | 1.1 | |
9 | | Vietnam | | | 2,964 | | | | 28.7 | | | | 0.9 | |
10 | | United Kingdom | | | 2,775 | | | | -36.2 | | | | 0.8 | |
11 | | Taiwan | | | 2,725 | | | | -5.0 | | | | 0.8 | |
12 | | France | | | 2,362 | | | | -19.2 | | | | 0.7 | |
13 | | India | | | 2,057 | | | | 6.7 | | | | 0.6 | |
14 | | Thailand | | | 1,877 | | | | 1.0 | | | | 0.6 | |
15 | | Malaysia | | | 1,711 | | | | -1.9 | | | | 0.5 | |
16 | | Peru | | | 1,578 | | | | -36.2 | | | | 0.5 | |
17 | | Brazil | | | 1,427 | | | | -6.7 | | | | 0.4 | |
18 | | Argentina | | | 1,345 | | | | -9.4 | | | | 0.4 | |
19 | | Spain | | | 1,173 | | | | -2.3 | | | | 0.4 | |
20 | | Ireland | | | 1,155 | | | | 9.3 | | | | 0.3 | |
21 | | Dominican Republic | | | 1,119 | | | | 21.8 | | | | 0.3 | |
22 | | Belgium | | | 1,117 | | | | 5.5 | | | | 0.3 | |
23 | | Netherlands | | | 994 | | | | 11.9 | | | | 0.3 | |
24 | | Egypt | | | 970 | | | | 40.4 | | | | 0.3 | |
25 | | Sweden | | | 968 | | | | -4.6 | | | | 0.3 | |
| | All other countries | | | 15,503 | | | | 4.3 | | | | 5.3 | |
| | Domestic Imports | | | 331,490 | | | | 2.5 | | | | 99.3 | |
| | Re-imports | | | 2,174 | | | | 7.5 | | | | 0.7 | |
| | Total | | | 333,664 | | | | 2.5 | | | | 100.0 | |
| 1 | Data reported on a customs basis. Domestic imports exclude re-imports. Total imports are the sum of domestic imports and re-imports. |
Sources: Statistics Canada and Ontario Ministry of Finance.
60
| | | | | | | | | | | | | | | | | | | | | | | | | | | | | | | | | | | | |
Ontario, Selected Demographic Characteristics, 2009–20171 | | | | | | | | | | | | | | | Table 13 | |
| | | 2009 | | | 2010 | | | 2011 | | | 2012 | | | 2013 | | | 2014 | | | 2015 | | | 2016 | | | 2017 | |
Total Population (000s) | | | 12,998 | | | | 13,135 | | | | 13,264 | | | | 13,414 | | | | 13,556 | | | | 13,680 | | | | 13,790 | | | | 13,976 | | | | 14,193 | |
Annual Average Growth Over Preceding Year (%) | | | 0.9 | | | | 1.1 | | | | 1.0 | | | | 1.1 | | | | 1.1 | | | | 0.9 | | | | 0.8 | | | | 1.4 | | | | 1.6 | |
Median Age (Years) | | | 39.3 | | | | 39.6 | | | | 39.8 | | | | 40.0 | | | | 40.2 | | | | 40.4 | | | | 40.6 | | | | 40.7 | | | | 40.6 | |
Age Group Shares (%) | | | | | | | | | | | | | | | | | | | | | | | | | | | | | |
0–4 | | | 5.4 | | | | 5.4 | | | | 5.4 | | | | 5.3 | | | | 5.3 | | | | 5.2 | | | | 5.2 | | | | 5.2 | | | | 5.1 | |
5–14 | | | 11.7 | | | | 11.4 | | | | 11.2 | | | | 11.0 | | | | 10.9 | | | | 10.8 | | | | 10.7 | | | | 10.7 | | | | 10.6 | |
15–24 | | | 13.7 | | | | 13.7 | | | | 13.7 | | | | 13.7 | | | | 13.6 | | | | 13.4 | | | | 13.2 | | | | 13.1 | | | | 13.0 | |
25–44 | | | 27.8 | | | | 27.4 | | | | 27.1 | | | | 27.0 | | | | 26.8 | | | | 26.7 | | | | 26.7 | | | | 26.8 | | | | 26.9 | |
45–64 | | | 27.7 | | | | 28.1 | | | | 28.4 | | | | 28.3 | | | | 28.2 | | | | 28.2 | | | | 28.1 | | | | 28.0 | | | | 27.7 | |
65–74 | | | 7.3 | | | | 7.4 | | | | 7.6 | | | | 8.0 | | | | 8.4 | | | | 8.7 | | | | 9.0 | | | | 9.2 | | | | 9.4 | |
75+ | | | 6.4 | | | | 6.5 | | | | 6.6 | | | | 6.7 | | | | 6.8 | | | | 7.0 | | | | 7.1 | | | | 7.2 | | | | 7.3 | |
Total Fertility Rate2 | | | 1.6 | | | | 1.6 | | | | 1.6 | | | | 1.6 | | | | 1.5 | | | | — | | | | — | | | | — | | | | — | |
Life Expectancy at Birth (Years)3 | | | | | | | | | | | | | | | | | | | | | | | | | | | | | |
Female | | | 83.5 | | | | 83.8 | | | | 84.0 | | | | 84.2 | | | | 84.3 | | | | — | | | | — | | | | — | | | | — | |
Male | | | 79.2 | | | | 79.5 | | | | 79.8 | | | | 80.1 | | | | 80.2 | | | | — | | | | — | | | | — | | | | — | |
Families (000s) | | | — | | | | — | | | | 3,723 | | | | — | | | | — | | | | — | | | | — | | | | 3,897 | | | | — | |
Households (000s)4 | | | — | | | | — | | | | 4,888 | | | | — | | | | — | | | | — | | | | — | | | | 5,169 | | | | — | |
| 1 | Population estimates are for July 1. |
| 3 | For three-year periods with the reference year as the middle year. |
| 4 | Households are from Census enumeration. |
Source: Statistics Canada.
61
| | | | | | | | | | | | | | | | | | | | |
Ontario, Components of Population Growth, 2007–08 to 2016–171 | | | | | | | | | | | | | | Table 14 | |
| | | (Thousands) | |
| | | 2007–08 | | | 2008–09 | | | 2009–10 | | | 2010–11 | | | 2011–12 | |
Population at Beginning of Period | | | 12,764 | | | | 12,883 | | | | 12,998 | | | | 13,135 | | | | 13,264 | |
Births | | | 141 | | | | 140 | | | | 140 | | | | 139 | | | | 141 | |
Deaths | | | 88 | | | | 88 | | | | 88 | | | | 91 | | | | 88 | |
Immigrants | | | 115 | | | | 105 | | | | 117 | | | | 105 | | | | 101 | |
Net Emigrants2 | | | 21 | | | | 18 | | | | 15 | | | | 15 | | | | 17 | |
Net Change in Non-permanent Residents | | | 11 | | | | 16 | | | | 13 | | | | 15 | | | | 24 | |
Interprovincial Arrivals | | | 62 | | | | 57 | | | | 60 | | | | 58 | | | | 60 | |
Interprovincial Departures | | | 76 | | | | 73 | | | | 64 | | | | 62 | | | | 71 | |
Population Growth During Period | | | 118 | | | | 115 | | | | 137 | | | | 128 | | | | 150 | |
Population at End of Period3 | | | 12,883 | | | | 12,998 | | | | 13,135 | | | | 13,264 | | | | 13,414 | |
Population Growth (%) | | | 0.9 | | | | 0.9 | | | | 1.1 | | | | 1.0 | | | | 1.1 | |
| | | | | |
Table 14 (continued) | | | | | | | | | | | | | | (Thousands) | |
| | | 2012-13 | | | 2013-14 | | | 2014-15 | | | 2015-16 | | | 2016-17 | |
Population at Beginning of Period | | | 13,414 | | | | 13,556 | | | | 13,680 | | | | 13,790 | | | | 13,976 | |
Births | | | 141 | | | | 141 | | | | 142 | | | | 144 | | | | 147 | |
Deaths | | | 93 | | | | 95 | | | | 98 | | | | 102 | | | | 105 | |
Immigrants | | | 106 | | | | 102 | | | | 90 | | | | 120 | | | | 98 | |
Net Emigrants2 | | | 16 | | | | 19 | | | | 18 | | | | 18 | | | | 18 | |
Net Change in Non-permanent Residents | | | 19 | | | | 11 | | | | 2 | | | | 33 | | | | 69 | |
Interprovincial Arrivals | | | 55 | | | | 57 | | | | 63 | | | | 72 | | | | 84 | |
Interprovincial Departures | | | 69 | | | | 72 | | | | 72 | | | | 63 | | | | 58 | |
Population Growth During Period | | | 142 | | | | 125 | | | | 109 | | | | 187 | | | | 217 | |
Population at End of Period3 | | | 13,556 | | | | 13,680 | | | | 13,790 | | | | 13,976 | | | | 14,193 | |
Population Growth (%) | | | 1.1 | | | | 0.9 | | | | 0.8 | | | | 1.4 | | | | 1.6 | |
| 1 | Data are from July 1 to June 30 (Census year). |
| 2 | Net Emigrants = Emigrants plus net change in temporary emigrants minus returning emigrants. |
| 3 | The sum of the components does not equal the total change in population due to residual deviation. |
Source: Statistics Canada.
62
| | | | | | | | | | | | | | | | | | | | | | | | | | | | |
Ontario, Labour Force, 2003–2016 | | | | | | | | | | | | | | | | | | | | Table 15 | |
| | | 2003 | | | 2004 | | | 2005 | | | 2006 | | | 2007 | | | 2008 | | | 2009 | |
Labour Force (000s) | | | 6,677 | | | | 6,772 | | | | 6,834 | | | | 6,887 | | | | 6,992 | | | | 7,074 | | | | 7,080 | |
Annual Labour Force Growth (%) | | | 2.8 | | | | 1.4 | | | | 0.9 | | | | 0.8 | | | | 1.5 | | | | 1.2 | | | | 0.1 | |
Participation Rate (%) | | | | | | | | | | | | | | | | | | | | | | | | | | | | |
Male | | | 74.3 | | | | 74.1 | | | | 73.5 | | | | 72.6 | | | | 72.5 | | | | 72.5 | | | | 71.5 | |
Female | | | 62.9 | | | | 62.9 | | | | 62.6 | | | | 62.6 | | | | 63.2 | | | | 63.1 | | | | 62.6 | |
Share of Labour Force (%) | | | | | | | | | | | | | | | | | | | | | | | | | | | | |
Youth (15–24) | | | 16.4 | | | | 16.3 | | | | 16.1 | | | | 16.1 | | | | 16.2 | | | | 16.0 | | | | 15.5 | |
Older Workers (45+) | | | 34.8 | | | | 35.5 | | | | 36.4 | | | | 37.5 | | | | 38.4 | | | | 39.7 | | | | 40.9 | |
| | | | | | | |
Table 15 (continued) | | | | | | | | | | | | | | | | | | | | | |
| | | 2010 | | | 2011 | | | 2012 | | | 2013 | | | 2014 | | | 2015 | | | 2016 | |
Labour Force (000s) | | | 7,161 | | | | 7,227 | | | | 7,276 | | | | 7,384 | | | | 7,419 | | | | 7,426 | | | | 7,490 | |
Annual Labour Force Growth (%) | | | 1.1 | | | | 0.9 | | | | 0.7 | | | | 1.5 | | | | 0.5 | | | | 0.1 | | | | 0.9 | |
Participation Rate (%) | | | | | | | | | | | | | | | | | | | | | | | | | | | | |
Male | | | 71.1 | | | | 71.1 | | | | 70.7 | | | | 70.5 | | | | 70.3 | | | | 70.0 | | | | 69.5 | |
Female | | | 62.8 | | | | 62.3 | | | | 61.9 | | | | 62.2 | | | | 61.6 | | | | 60.7 | | | | 60.7 | |
Share of Labour Force (%) | | | | | | | | | | | | | | | | | | | | | | | | | | | | |
Youth (15–24) | | | 15.1 | | | | 15.3 | | | | 14.9 | | | | 15.0 | | | | 15.1 | | | | 14.8 | | | | 14.4 | |
Older Workers (45+) | | | 41.8 | | | | 42.3 | | | | 42.6 | | | | 42.7 | | | | 43.0 | | | | 43.2 | | | | 43.4 | |
Source: Statistics Canada.
63
| | | | | | | | | | | | | | | | | | | | | | | | | | | | |
Ontario, Employment, 2003–2016 | | | | | | | | | | | | | | | | | | | | Table 16 | |
| | | 2003 | | | 2004 | | | 2005 | | | 2006 | | | 2007 | | | 2008 | | | 2009 | |
Total Employment (000s) | | | 6,213 | | | | 6,314 | | | | 6,381 | | | | 6,452 | | | | 6,546 | | | | 6,610 | | | | 6,433 | |
Male | | | 3,302 | | | | 3,352 | | | | 3,385 | | | | 3,400 | | | | 3,411 | | | | 3,445 | | | | 3,301 | |
Female | | | 2,911 | | | | 2,962 | | | | 2,996 | | | | 3,053 | | | | 3,135 | | | | 3,165 | | | | 3,132 | |
Annual Employment Growth (%) | | | 3.0 | | | | 1.6 | | | | 1.1 | | | | 1.1 | | | | 1.4 | | | | 1.0 | | | | (2.7 | ) |
Net Job Creation (000s) | | | 179 | | | | 101 | | | | 67 | | | | 71 | | | | 93 | | | | 65 | | | | (178 | ) |
Public-sector Employment (000s) | | | 1,051 | | | | 1,110 | | | | 1,137 | | | | 1,163 | | | | 1,196 | | | | 1,261 | | | | 1,233 | |
Private-sector Employment (000s) | | | 4,245 | | | | 4,267 | | | | 4,309 | | | | 4,351 | | | | 4,366 | | | | 4,346 | | | | 4,195 | |
Self-employment (000s) | | | 916 | | | | 937 | | | | 935 | | | | 939 | | | | 983 | | | | 1,004 | | | | 1,005 | |
Manufacturing Employment (% of total) | | | 17.6 | | | | 17.5 | | | | 16.7 | | | | 15.5 | | | | 14.3 | | | | 13.4 | | | | 12.0 | |
Services Employment (% of total) | | | 73.7 | | | | 73.9 | | | | 74.3 | | | | 75.4 | | | | 76.6 | | | | 77.3 | | | | 78.8 | |
Part-time (% of total) | | | 18.5 | | | | 18.2 | | | | 18.2 | | | | 17.9 | | | | 18.2 | | | | 18.8 | | | | 19.6 | |
Average Hours Worked Per Week1 | | | 36.6 | | | | 37.1 | | | | 37.2 | | | | 36.8 | | | | 37.1 | | | | 36.7 | | | | 35.9 | |
| | | | | | | |
Table 16 (continued) | | | | | | | | | | | | | | | | | | | | | |
| | | 2010 | | | 2011 | | | 2012 | | | 2013 | | | 2014 | | | 2015 | | | 2016 | |
Total Employment (000s) | | | 6,538 | | | | 6,658 | | | | 6,703 | | | | 6,823 | | | | 6,878 | | | | 6,923 | | | | 7,000 | |
Male | | | 3,364 | | | | 3,450 | | | | 3,472 | | | | 3,523 | | | | 3,567 | | | | 3,607 | | | | 3,636 | |
Female | | | 3,174 | | | | 3,208 | | | | 3,231 | | | | 3,301 | | | | 3,311 | | | | 3,316 | | | | 3,364 | |
Annual Employment Growth (%) | | | 1.6 | | | | 1.8 | | | | 0.7 | | | | 1.8 | | | | 0.8 | | | | 0.7 | | | | 1.1 | |
Net Job Creation (000s) | | | 105 | | | | 121 | | | | 44 | | | | 121 | | | | 55 | | | | 45 | | | | 76 | |
Public-sector Employment (000s) | | | 1,255 | | | | 1,294 | | | | 1,286 | | | | 1,314 | | | | 1,305 | | | | 1,294 | | | | 1,306 | |
Private-sector Employment (000s) | | | 4,268 | | | | 4,340 | | | | 4,373 | | | | 4,447 | | | | 4,517 | | | | 4,541 | | | | 4,597 | |
Self-employment (000s) | | | 1,015 | | | | 1,024 | | | | 1,044 | | | | 1,063 | | | | 1,056 | | | | 1,088 | | | | 1,096 | |
Manufacturing Employment (% of total) | | | 11.7 | | | | 11.6 | | | | 11.6 | | | | 11.2 | | | | 10.9 | | | | 10.8 | | | | 10.7 | |
Services Employment (% of total) | | | 78.9 | | | | 78.8 | | | | 78.9 | | | | 79.5 | | | | 79.9 | | | | 79.8 | | | | 79.7 | |
Part-time (% of total) | | | 19.6 | | | | 19.3 | | | | 19.3 | | | | 19.6 | | | | 19.5 | | | | 18.8 | | | | 19.0 | |
Average Hours Worked Per Week1 | | | 36.0 | | | | 36.3 | | | | 36.5 | | | | 36.3 | | | | 35.8 | | | | 36.3 | | | | 36.3 | |
| 1 | Average actual hours worked per week at all jobs, excluding persons not at work, in reference week. |
Source: Statistics Canada.
64
| | | | | | | | | | | | | | | | | | | | | | | | | | | | |
Ontario, Unemployment, 2003–2016 | | | | | | | | | | | | | | | | | | | | Table 17 | |
| | | 2003 | | | 2004 | | | 2005 | | | 2006 | | | 2007 | | | 2008 | | | 2009 | |
Total Unemployment (000s) | | | 464 | | | | 458 | | | | 453 | | | | 435 | | | | 446 | | | | 464 | | | | 648 | |
Unemployment Rate (%) | | | 6.9 | | | | 6.8 | | | | 6.6 | | | | 6.3 | | | | 6.4 | | | | 6.6 | | | | 9.1 | |
Male | | | 7.1 | | | | 6.9 | | | | 6.7 | | | | 6.4 | | | | 6.8 | | | | 6.9 | | | | 10.5 | |
Female | | | 6.8 | | | | 6.6 | | | | 6.6 | | | | 6.3 | | | | 6.0 | | | | 6.2 | | | | 7.7 | |
Toronto CMA1 | | | 7.7 | | | | 7.5 | | | | 7.0 | | | | 6.6 | | | | 6.8 | | | | 6.9 | | | | 9.6 | |
Northern Ontario | | | 7.4 | | | | 7.8 | | | | 7.0 | | | | 7.4 | | | | 6.9 | | | | 6.7 | | | | 9.0 | |
Youth (15–24) | | | 14.4 | | | | 14.1 | | | | 13.9 | | | | 13.2 | | | | 12.9 | | | | 13.8 | | | | 17.6 | |
Older Workers (45+) | | | 4.7 | | | | 4.5 | | | | 4.7 | | | | 4.3 | | | | 4.5 | | | | 4.9 | | | | 6.8 | |
Share of Total Unemployment (%) | | | | | | | | |
Long-term Unemployed (27 weeks+) | | | 16.2 | | | | 15.5 | | | | 15.1 | | | | 14.3 | | | | 13.0 | | | | 13.7 | | | | 18.8 | |
Youth (15–24) | | | 34.0 | | | | 34.2 | | | | 33.8 | | | | 33.7 | | | | 32.8 | | | | 33.5 | | | | 29.8 | |
Older Workers (45+) | | | 23.6 | | | | 23.5 | | | | 26.0 | | | | 25.6 | | | | 27.2 | | | | 29.8 | | | | 30.4 | |
Average Duration (weeks) | | | 17.0 | | | | 16.1 | | | | 16.0 | | | | 15.8 | | | | 14.6 | | | | 14.8 | | | | 18.4 | |
Youth (15–24) | | | 9.4 | | | | 8.8 | | | | 8.7 | | | | 8.7 | | | | 8.1 | | | | 8.4 | | | | 11.1 | |
Older Workers (45+) | | | 27.3 | | | | 24.3 | | | | 23.9 | | | | 23.7 | | | | 22.4 | | | | 20.9 | | | | 26.3 | |
|
Table 17 (continued) | |
| | | 2010 | | | 2011 | | | 2012 | | | 2013 | | | 2014 | | | 2015 | | | 2016 | |
Total Unemployment (000s) | | | 623 | | | | 569 | | | | 574 | | | | 560 | | | | 541 | | | | 503 | | | | 490 | |
Unemployment Rate (%) | | | 8.7 | | | | 7.9 | | | | 7.9 | | | | 7.6 | | | | 7.3 | | | | 6.8 | | | | 6.5 | |
Male | | | 9.4 | | | | 8.2 | | | | 8.3 | | | | 8.0 | | | | 7.5 | | | | 7.0 | | | | 6.8 | |
Female | | | 8.0 | | | | 7.6 | | | | 7.5 | | | | 7.2 | | | | 7.1 | | | | 6.5 | | | | 6.3 | |
Toronto CMA1 | | | 9.1 | | | | 8.4 | | | | 8.7 | | | | 8.1 | | | | 8.0 | | | | 7.0 | | | | 7.0 | |
Northern Ontario | | | 8.3 | | | | 7.8 | | | | 7.2 | | | | 7.4 | | | | 6.6 | | | | 7.2 | | | | 7.1 | |
Youth (15–24) | | | 17.4 | | | | 15.9 | | | | 17.0 | | | | 16.2 | | | | 15.7 | | | | 14.7 | | | | 14.0 | |
Older Workers (45+) | | | 6.6 | | | | 5.9 | | | | 5.8 | | | | 5.5 | | | | 5.3 | | | | 4.9 | | | | 4.9 | |
Share of Total Unemployment (%) | | | | | | | | |
Long-term Unemployed (27 weeks+) | | | 24.9 | | | | 24.1 | | | | 22.7 | | | | 22.9 | | | | 22.8 | | | | 20.0 | | | | 19.9 | |
Youth (15–24) | | | 30.3 | | | | 30.9 | | | | 32.1 | | | | 32.1 | | | | 32.4 | | | | 32.1 | | | | 30.9 | |
Older Workers (45+) | | | 31.8 | | | | 31.6 | | | | 31.3 | | | | 31.2 | | | | 31.1 | | | | 31.1 | | | | 32.5 | |
Average Duration (weeks) | | | 22.0 | | | | 22.4 | | | | 22.2 | | | | 21.8 | | | | 22.4 | | | | 20.0 | | | | 19.9 | |
Youth (15–24) | | | 11.4 | | | | 12.2 | | | | 12.7 | | | | 12.7 | | | | 13.4 | | | | 12.4 | | | | 11.2 | |
Older Workers (45+) | | | 31.3 | | | | 32.8 | | | | 32.0 | | | | 29.5 | | | | 31.7 | | | | 28.6 | | | | 28.2 | |
| 1 | CMA is Census Metropolitan Area. Toronto CMA includes the city of Toronto; the regions of York, Peel and Halton (excluding Burlington); Uxbridge, Pickering, Ajax, Mono, Orangeville, New Tecumseth and Bradford West Gwillimbury. |
Source: Statistics Canada.
65
| | | | | | | | | | | | | | | | | | | | | | | | | | | | |
Employment Insurance (EI), 2003–2016 | | | | | | | | | | | | | | | | | | | | Table 18 | |
| | | 2003 | | | 2004 | | | 2005 | | | 2006 | | | 2007 | | | 2008 | | | 2009 | |
EI Regular Beneficiaries1 (000s) | | | | | | | | | | | | | | | | | | | | | | | | | | | | |
Ontario | | | 142 | | | | 137 | | | | 132 | | | | 129 | | | | 131 | | | | 142 | | | | 246 | |
Canada | | | 561 | | | | 539 | | | | 514 | | | | 492 | | | | 477 | | | | 484 | | | | 731 | |
EI Total Benefit Payments2 ($ millions) | | | | | | | | | | | | | | | | | | | | | | | | | | | | |
Ontario | | | 3,795 | | | | 3,828 | | | | 3,799 | | | | 3,839 | | | | 4,045 | | | | 4,369 | | | | 6,721 | |
Canada | | | 12,926 | | | | 12,884 | | | | 12,696 | | | | 12,425 | | | | 12,425 | | | | 13,015 | | | | 18,684 | |
EI Contributions ($ millions) | | | | | | | | | | | | | | | | | | | | | | | | | | | | |
Ontario3 | | | 7,219 | | | | 6,895 | | | | 7,108 | | | | 6,975 | | | | 6,921 | | | | 6,718 | | | | 6,745 | |
Canada4 | | | 17,724 | | | | 16,578 | | | | 17,161 | | | | 15,884 | | | | 16,709 | | | | 16,737 | | | | 16,502 | |
EI Premium Rate5 (% insured earnings) | | | | | | | | | | | | | | | | | | | | | | | | | | | | |
Employer | | | 2.94 | | | | 2.77 | | | | 2.73 | | | | 2.62 | | | | 2.52 | | | | 2.42 | | | | 2.42 | |
Employee | | | 2.10 | | | | 1.98 | | | | 1.95 | | | | 1.87 | | | | 1.80 | | | | 1.73 | | | | 1.73 | |
|
Table 18 (continued) | |
| | | 2010 | | | 2011 | | | 2012 | | | 2013 | | | 2014 | | | 2015 | | | 2016 | |
EI Regular Beneficiaries1 (000s) | | | | | | | | | | | | | | | | | | | | | | | | | | | | |
Ontario | | | 216 | | | | 175 | | | | 159 | | | | 155 | | | | 147 | | | | 145 | | | | 137 | |
Canada | | | 681 | | | | 580 | | | | 532 | | | | 501 | | | | 487 | | | | 513 | | | | 541 | |
EI Total Benefit Payments2 ($ millions) | | | | | | | | | | | | | | | | | | | | | | | | | | | | |
Ontario | | | 6,117 | | | | 5,330 | | | | 5,180 | | | | 5,213 | | | | 5,321 | | | | 5,444 | | | | 5,493 | |
Canada | | | 17,881 | | | | 16,050 | | | | 15,662 | | | | 15,365 | | | | 15,869 | | | | 17,094 | | | | 18,542 | |
EI Contributions ($ millions) | | | | | | | | | | | | | | | | | | | | | | | | | | | | |
Ontario3 | | | 6,919 | | | | 7,288 | | | | 7,776 | | | | 8,404 | | | | 8,608 | | | | 8,983 | | | | 9,054 | |
Canada4 | | | 17,227 | | | | 18,221 | | | | 19,558 | | | | 21,492 | | | | 22,141 | | | | 22,874 | | | | 23,054 | |
EI Premium Rate5 (% insured earnings) | | | | | | | | | | | | | | | | | | | | | | | | | | | | |
Employer | | | 2.42 | | | | 2.49 | | | | 2.56 | | | | 2.63 | | | | 2.63 | | | | 2.63 | | | | 2.63 | |
Employee | | | 1.73 | | | | 1.78 | | | | 1.83 | | | | 1.88 | | | | 1.88 | | | | 1.88 | | | | 1.88 | |
| 1 | Figures are reported by Statistics Canada (Regular beneficiaries only, year-to-date average, unadjusted). |
| 2 | Figures for Ontario and Canada EI Benefit Payments are Ontario Ministry of Finance estimates based on Statistics Canada CANSIM Table 276-0018. EI Total Benefit Payments do not include amounts related to Employment Benefits and Support Measures, delivered under Part II of the Employment Insurance Act. |
| 3 | Figures for Ontario EI Contributions are Ontario Ministry of Finance estimates based on data from provincial and territorial economic accounts and data reported by the federal Department of Finance. |
| 4 | Figures for Canada EI Contributions are reported by the federal Department of Finance as part of the Fiscal Monitor. |
| 5 | EI premiums are collected on total earnings from the first dollar earned to the maximum insurable earnings. |
| Note: | In 2017, the EI maximum weekly benefit is $542, which is equal to 55 per cent of EI maximum insurable earnings of $51,300. |
| Sources: | Statistics Canada, Employment and Social Development Canada, Department of Finance Canada and Ontario Ministry of Finance. |
66
| | | | | | | | | | | | | | | | | | | | | | | | | | | | |
Ontario, Labour Compensation, 2003–2016 | | | | | | | | | | | | | | | | | | | | Table 19 | |
| | | 2003 | | | 2004 | | | 2005 | | | 2006 | | | 2007 | | | 2008 | | | 2009 | |
Average Weekly Earnings ($)1 | | | 728.71 | | | | 748.99 | | | | 776.33 | | | | 788.80 | | | | 819.19 | | | | 838.34 | | | | 848.91 | |
Increase (%) | | | 2.4 | | | | 2.8 | | | | 3.7 | | | | 1.6 | | | | 3.9 | | | | 2.3 | | | | 1.3 | |
CPI Inflation (%) | | | 2.7 | | | | 1.9 | | | | 2.2 | | | | 1.8 | | | | 1.8 | | | | 2.3 | | | | 0.4 | |
AWE Increase Less CPI Inflation (%) | | | (0.3 | ) | | | 0.9 | | | | 1.5 | | | | (0.2 | ) | | | 2.0 | | | | 0.1 | | | | 0.9 | |
AWE – Manufacturing ($) | | | 907.50 | | | | 935.19 | | | | 960.35 | | | | 961.33 | | | | 997.47 | | | | 999.72 | | | | 950.13 | |
Increase (%) | | | 2.4 | | | | 3.1 | | | | 2.7 | | | | 0.1 | | | | 3.8 | | | | 0.2 | | | | (5.0 | ) |
Increase Less CPI Inflation (%) | | | (0.3 | ) | | | 1.2 | | | | 0.5 | | | | (1.7 | ) | | | 1.9 | | | | (2.0 | ) | | | (5.3 | ) |
Wage Settlement Increases (%)2 | | | | |
All Sectors | | | 3.1 | | | | 2.9 | | | | 2.7 | | | | 2.5 | | | | 3.0 | | | | 2.7 | | | | 2.2 | |
Public | | | 3.5 | | | | 3.1 | | | | 2.7 | | | | 3.0 | | | | 3.1 | | | | 3.1 | | | | 2.4 | |
Private | | | 1.9 | | | | 2.7 | | | | 2.4 | | | | 1.8 | | | | 2.9 | | | | 2.0 | | | | 1.2 | |
Person Days Lost Due to Strikes and Lockouts (000s) | | | 495 | | | | 487 | | | | 403 | | | | 395 | | | | 389 | | | | 282 | | | | 1,550 | |
Minimum Wage at Year-end ($/hour) | | | 6.85 | | | | 7.15 | | | | 7.45 | | | | 7.75 | | | | 8.00 | | | | 8.75 | | | | 9.50 | |
|
Table 19 (continued) | |
| | | 2010 | | | 2011 | | | 2012 | | | 2013 | | | 2014 | | | 2015 | | | 2016 | |
Average Weekly Earnings ($)1 | | | 881.44 | | | | 893.44 | | | | 906.17 | | | | 920.03 | | | | 938.3 | | | | 962.94 | | | | 973.56 | |
Increase (%) | | | 3.8 | | | | 1.4 | | | | 1.4 | | | | 1.5 | | | | 2.0 | | | | 2.6 | | | | 1.1 | |
CPI Inflation (%) | | | 2.5 | | | | 3.1 | | | | 1.4 | | | | 1.0 | | | | 2.4 | | | | 1.2 | | | | 1.8 | |
AWE Increase Less CPI Inflation (%) | | | 1.4 | | | | (1.7 | ) | | | 0.0 | | | | 0.5 | | | | (0.4 | ) | | | 1.4 | | | | (0.7 | ) |
AWE – Manufacturing ($) | | | 999.23 | | | | 1,006.42 | | | | 1,036.99 | | | | 1,050.59 | | | | 1,071.73 | | | | 1,107.09 | | | | 1,119.28 | |
Increase (%) | | | 5.2 | | | | 0.7 | | | | 3.0 | | | | 1.3 | | | | 2.0 | | | | 3.3 | | | | 1.1 | |
Increase Less CPI Inflation (%) | | | 2.7 | | | | (2.4 | ) | | | 1.6 | | | | 0.3 | | | | (0.3 | ) | | | 2.1 | | | | (0.7 | ) |
Wage Settlement Increases (%)2 | | | | |
All Sectors | | | 2.0 | | | | 1.7 | | | | 1.3 | | | | 1.0 | | | | 1.5 | | | | 1.0 | | | | 1.6 | |
Public | | | 1.9 | | | | 1.6 | | | | 1.4 | | | | 0.5 | | | | 1.4 | | | | 0.8 | | | | 1.4 | |
Private | | | 2.0 | | | | 1.9 | | | | 1.2 | | | | 2.3 | | | | 1.9 | | | | 1.7 | | | | 1.8 | |
Person Days Lost Due to Strikes and Lockouts (000s) | | | 705 | | | | 352 | | | | 201 | | | | 288 | | | | 132 | | | | 337 | | | | 245 | |
Minimum Wage at Year-end ($/hour) | | | 10.25 | | | | 10.25 | | | | 10.25 | | | | 10.25 | | | | 11.00 | | | | 11.25 | | | | 11.40 | |
| 1 | Average Weekly Earnings (AWE) includes overtime. |
| 2 | Wage settlement increases are for collective agreements covering 200 or more employees for data prior to 2010 and 150+ employees from 2010 onwards, Ontario Ministry of Labour. |
Sources: Statistics Canada, Ontario Ministry of Labour and Ontario Ministry of Finance.
67
| | | | | | | | | | | | | | | | | | | | | | | | | | | | |
Ontario, Employment by Occupation, 2003–2016 | | | | | | | | | | | | | | | | | | | | Table 20 | |
| | | | | | | | | | | | | | | | | | | | | (Thousands) | |
| | | | |
| | | 2003 | | | 2004 | | | 2005 | | | 2006 | | | 2007 | | | 2008 | | | 2009 | |
Management | | | 633 | | | | 665 | | | | 676 | | | | 707 | | | | 688 | | | | 710 | | | | 689 | |
Business, Finance and Administration | | | 1066 | | | | 1105 | | | | 1080 | | | | 1090 | | | | 1091 | | | | 1145 | | | | 1111 | |
Natural and Applied Sciences | | | 448 | | | | 434 | | | | 464 | | | | 463 | | | | 479 | | | | 493 | | | | 465 | |
Health | | | 333 | | | | 342 | | | | 345 | | | | 353 | | | | 368 | | | | 383 | | | | 394 | |
Education, Law and Social, Community and Government Services | | | 574 | | | | 574 | | | | 633 | | | | 638 | | | | 685 | | | | 704 | | | | 719 | |
Art, Culture, Recreation and Sport | | | 178 | | | | 187 | | | | 182 | | | | 186 | | | | 198 | | | | 208 | | | | 203 | |
Sales and Service | | | 1454 | | | | 1451 | | | | 1471 | | | | 1529 | | | | 1601 | | | | 1562 | | | | 1559 | |
Trades, Transport and Equipment Operators | | | 867 | | | | 880 | | | | 889 | | | | 883 | | | | 877 | | | | 901 | | | | 860 | |
Natural Resources, Agriculture and Related Production | | | 87 | | | | 92 | | | | 94 | | | | 108 | | | | 104 | | | | 89 | | | | 87 | |
Manufacturing and Utilities | | | 575 | | | | 584 | | | | 547 | | | | 495 | | | | 457 | | | | 417 | | | | 346 | |
Total | | | 6213 | | | | 6314 | | | | 6381 | | | | 6452 | | | | 6546 | | | | 6610 | | | | 6433 | |
| | | | | | | |
Table 20 (continued) | | | | | | | | | | | | | | | | | | | | (Thousands) | |
| | | | |
| | | 2010 | | | 2011 | | | 2012 | | | 2013 | | | 2014 | | | 2015 | | | 2016 | |
Management | | | 681 | | | | 660 | | | | 684 | | | | 660 | | | | 635 | | | | 619 | | | | 634 | |
Business, Finance and Administration | | | 1113 | | | | 1161 | | | | 1146 | | | | 1156 | | | | 1150 | | | | 1169 | | | | 1159 | |
Natural and Applied Sciences | | | 495 | | | | 506 | | | | 499 | | | | 509 | | | | 555 | | | | 566 | | | | 574 | |
Health | | | 400 | | | | 429 | | | | 430 | | | | 444 | | | | 457 | | | | 462 | | | | 478 | |
Education, Law and Social, Community and Government Services | | | 735 | | | | 723 | | | | 748 | | | | 769 | | | | 761 | | | | 802 | | | | 833 | |
Art, Culture, Recreation and Sport | | | 215 | | | | 216 | | | | 200 | | | | 222 | | | | 216 | | | | 224 | | | | 232 | |
Sales and Service | | | 1601 | | | | 1601 | | | | 1639 | | | | 1700 | | | | 1726 | | | | 1704 | | | | 1697 | |
Trades, Transport and Equipment Operators | | | 853 | | | | 886 | | | | 891 | | | | 894 | | | | 895 | | | | 911 | | | | 908 | |
Natural Resources, Agriculture and Related Production | | | 88 | | | | 97 | | | | 90 | | | | 87 | | | | 101 | | | | 95 | | | | 100 | |
Manufacturing and Utilities | | | 358 | | | | 379 | | | | 376 | | | | 382 | | | | 382 | | | | 371 | | | | 385 | |
Total | | | 6538 | | | | 6658 | | | | 6703 | | | | 6823 | | | | 6878 | | | | 6923 | | | | 7000 | |
Note: Occupation estimates are based on the 2016 National Occupational Classification (NOC).
Source: Statistics Canada.
68
| | | | | | | | | | | | | | | | | | | | | | | | | | | | |
Ontario, Distribution of Employment by Occupation, 2003–2016 | | | | | | | | | | | | | | | | | | | | Table 21 | |
| | | (Per Cent) | |
| | | 2003 | | | 2004 | | | 2005 | | | 2006 | | | 2007 | | | 2008 | | | 2009 | |
Management | | | 10.2 | | | | 10.5 | | | | 10.6 | | | | 11.0 | | | | 10.5 | | | | 10.7 | | | | 10.7 | |
Business, Finance and Administration | | | 17.2 | | | | 17.5 | | | | 16.9 | | | | 16.9 | | | | 16.7 | | | | 17.3 | | | | 17.3 | |
Natural and Applied Sciences | | | 7.2 | | | | 6.9 | | | | 7.3 | | | | 7.2 | | | | 7.3 | | | | 7.5 | | | | 7.2 | |
Health | | | 5.4 | | | | 5.4 | | | | 5.4 | | | | 5.5 | | | | 5.6 | | | | 5.8 | | | | 6.1 | |
Education, Law and Social, Community and Government Services | | | 9.2 | | | | 9.1 | | | | 9.9 | | | | 9.9 | | | | 10.5 | | | | 10.6 | | | | 11.2 | |
Art, Culture, Recreation and Sport | | | 2.9 | | | | 3.0 | | | | 2.9 | | | | 2.9 | | | | 3.0 | | | | 3.1 | | | | 3.2 | |
Sales and Service | | | 23.4 | | | | 23.0 | | | | 23.1 | | | | 23.7 | | | | 24.5 | | | | 23.6 | | | | 24.2 | |
Trades, Transport and Equipment Operators | | | 13.9 | | | | 13.9 | | | | 13.9 | | | | 13.7 | | | | 13.4 | | | | 13.6 | | | | 13.4 | |
Natural Resources, Agriculture and Related Production | | | 1.4 | | | | 1.5 | | | | 1.5 | | | | 1.7 | | | | 1.6 | | | | 1.3 | | | | 1.4 | |
Manufacturing and Utilities | | | 9.2 | | | | 9.2 | | | | 8.6 | | | | 7.7 | | | | 7.0 | | | | 6.3 | | | | 5.4 | |
Total | | | 100.0 | | | | 100.0 | | | | 100.0 | | | | 100.0 | | | | 100.0 | | | | 100.0 | | | | 100.0 | |
| |
Table 21 (continued) | | (Per Cent) | |
| | | 2010 | | | 2011 | | | 2012 | | | 2013 | | | 2014 | | | 2015 | | | 2016 | |
Management | | | 10.4 | | | | 9.9 | | | | 10.2 | | | | 9.7 | | | | 9.2 | | | | 8.9 | | | | 9.1 | |
Business, Finance and Administration | | | 17.0 | | | | 17.4 | | | | 17.1 | | | | 16.9 | | | | 16.7 | | | | 16.9 | | | | 16.6 | |
Natural and Applied Sciences | | | 7.6 | | | | 7.6 | | | | 7.4 | | | | 7.5 | | | | 8.1 | | | | 8.2 | | | | 8.2 | |
Health | | | 6.1 | | | | 6.4 | | | | 6.4 | | | | 6.5 | | | | 6.6 | | | | 6.7 | | | | 6.8 | |
Education, Law and Social, Community and Government Services | | | 11.2 | | | | 10.9 | | | | 11.2 | | | | 11.3 | | | | 11.1 | | | | 11.6 | | | | 11.9 | |
Art, Culture, Recreation and Sport | | | 3.3 | | | | 3.2 | | | | 3.0 | | | | 3.3 | | | | 3.1 | | | | 3.2 | | | | 3.3 | |
Sales and Service | | | 24.5 | | | | 24.0 | | | | 24.5 | | | | 24.9 | | | | 25.1 | | | | 24.6 | | | | 24.2 | |
Trades, Transport and Equipment Operators | | | 13.1 | | | | 13.3 | | | | 13.3 | | | | 13.1 | | | | 13.0 | | | | 13.2 | | | | 13.0 | |
Natural Resources, Agriculture and Related Production | | | 1.3 | | | | 1.4 | | | | 1.3 | | | | 1.3 | | | | 1.5 | | | | 1.4 | | | | 1.4 | |
Manufacturing and Utilities | | | 5.5 | | | | 5.7 | | | | 5.6 | | | | 5.6 | | | | 5.6 | | | | 5.4 | | | | 5.5 | |
Total | | | 100.0 | | | | 100.0 | | | | 100.0 | | | | 100.0 | | | | 100.0 | | | | 100.0 | | | | 100.0 | |
Note: Occupation estimates are based on the 2016 National Occupational Classification (NOC).
Source: Statistics Canada.
69
| | | | | | | | | | | | | | | | | | | | |
Ontario, Employment by Industry, 2007–2016 | | | | | | | | | | | | | | Table 22 | |
| | | (Thousands) | |
| | | 2007 | | | 2008 | | | 2009 | | | 2010 | | | 2011 | |
Goods Producing Industries | | | 1,534 | | | | 1,502 | | | | 1,365 | | | | 1,381 | | | | 1,409 | |
Primary Industries | | | 131 | | | | 123 | | | | 121 | | | | 121 | | | | 129 | |
Manufacturing | | | 939 | | | | 883 | | | | 774 | | | | 764 | | | | 773 | |
Construction | | | 406 | | | | 433 | | | | 415 | | | | 442 | | | | 455 | |
Utilities | | | 57 | | | | 63 | | | | 56 | | | | 54 | | | | 52 | |
Services Producing Industries | | | 5,011 | | | | 5,108 | | | | 5,068 | | | | 5,157 | | | | 5,250 | |
Trade | | | 1,018 | | | | 1,017 | | | | 1,007 | | | | 1,009 | | | | 1,006 | |
Transportation and Warehousing | | | 302 | | | | 321 | | | | 318 | | | | 311 | | | | 323 | |
Finance, Insurance, Real Estate and Leasing | | | 469 | | | | 469 | | | | 480 | | | | 481 | | | | 497 | |
Professional, Scientific and Technical Services | | | 470 | | | | 489 | | | | 480 | | | | 512 | | | | 530 | |
Business, Building and Other Support | | | 292 | | | | 307 | | | | 280 | | | | 291 | | | | 296 | |
Educational Services | | | 463 | | | | 473 | | | | 451 | | | | 456 | | | | 459 | |
Health Care and Social Assistance | | | 668 | | | | 683 | | | | 703 | | | | 730 | | | | 751 | |
Information, Culture and Recreation | | | 328 | | | | 311 | | | | 312 | | | | 320 | | | | 335 | |
Accommodation and Food Services | | | 404 | | | | 397 | | | | 384 | | | | 393 | | | | 403 | |
Public Administration | | | 331 | | | | 356 | | | | 354 | | | | 357 | | | | 363 | |
Other Services | | | 267 | | | | 286 | | | | 299 | | | | 298 | | | | 288 | |
Total Employment | | | 6,546 | | | | 6,610 | | | | 6,433 | | | | 6,538 | | | | 6,658 | |
70
| | | | | | | | | | | | | | | | | | | | |
Table 22 (continued) | | Ontario, Employment by Industry, 2007–2016 | |
| | | (Thousands) | |
| | | 2012 | | | 2013 | | | 2014 | | | 2015 | | | 2016 | |
Goods Producing Industries | | | 1,415 | | | | 1,398 | | | | 1,382 | | | | 1,401 | | | | 1,418 | |
Primary Industries | | | 126 | | | | 120 | | | | 115 | | | | 120 | | | | 114 | |
Manufacturing | | | 779 | | | | 767 | | | | 749 | | | | 745 | | | | 751 | |
Construction | | | 458 | | | | 459 | | | | 467 | | | | 487 | | | | 504 | |
Utilities | | | 52 | | | | 52 | | | | 51 | | | | 49 | | | | 50 | |
Services Producing Industries | | | 5,287 | | | | 5,426 | | | | 5,496 | | | | 5,522 | | | | 5,581 | |
Trade | | | 1,007 | | | | 1,019 | | | | 1,047 | | | | 1,042 | | | | 1,033 | |
Transportation and Warehousing | | | 313 | | | | 336 | | | | 329 | | | | 321 | | | | 327 | |
Finance, Insurance, Real Estate and Leasing | | | 496 | | | | 510 | | | | 512 | | | | 544 | | | | 555 | |
Professional, Scientific and Technical Services | | | 530 | | | | 543 | | | | 560 | | | | 580 | | | | 595 | |
Business, Building and Other Support | | | 296 | | | | 328 | | | | 335 | | | | 333 | | | | 326 | |
Educational Services | | | 465 | | | | 483 | | | | 495 | | | | 515 | | | | 503 | |
Health Care and Social Assistance | | | 769 | | | | 791 | | | | 798 | | | | 813 | | | | 838 | |
Information, Culture and Recreation | | | 320 | | | | 312 | | | | 317 | | | | 310 | | | | 318 | |
Accommodation and Food Services | | | 432 | | | | 441 | | | | 450 | | | | 444 | | | | 457 | |
Public Administration | | | 366 | | | | 372 | | | | 367 | | | | 344 | | | | 353 | |
Other Services | | | 295 | | | | 292 | | | | 287 | | | | 276 | | | | 276 | |
Total Employment | | | 6,703 | | | | 6,823 | | | | 6,878 | | | | 6,923 | | | | 7,000 | |
Note: Industrial groupings based on North American Industry Classification System (NAICS).
Source: Statistics Canada.
71
| | | | | | | | | | | | | | | | | | | | |
Ontario, Growth in Employment by Industry, 2007–2016 | | | | | | | | | | | | | | Table 23 | |
| | | (Per Cent Change) | |
| | | 2007 | | | 2008 | | | 2009 | | | 2010 | | | 2011 | |
Goods Producing Industries | | | (3.3 | ) | | | (2.1 | ) | | | (9.1 | ) | | | 1.1 | | | | 2.0 | |
Primary Industries | | | (5.7 | ) | | | (6.0 | ) | | | (2.2 | ) | | | 0.5 | | | | 6.3 | |
Manufacturing | | | (5.8 | ) | | | (6.0 | ) | | | (12.4 | ) | | | (1.3 | ) | | | 1.2 | |
Construction | | | 0.7 | | | | 6.5 | | | | (4.1 | ) | | | 6.5 | | | | 2.9 | |
Utilities | | | 20.1 | | | | 9.4 | | | | (10.8 | ) | | | (3.0 | ) | | | (3.7 | ) |
Services Producing Industries | | | 3.0 | | | | 1.9 | | | | (0.8 | ) | | | 1.8 | | | | 1.8 | |
Trade | | | 0.6 | | | | (0.1 | ) | | | (1.0 | ) | | | 0.2 | | | | (0.3 | ) |
Transportation and Warehousing | | | 2.2 | | | | 6.3 | | | | (1.0 | ) | | | (2.0 | ) | | | 3.6 | |
Finance, Insurance, Real Estate and Leasing | | | (0.8 | ) | | | 0.1 | | | | 2.4 | | | | 0.1 | | | | 3.4 | |
Professional, Scientific and Technical Services | | | 4.6 | | | | 4.0 | | | | (1.8 | ) | | | 6.6 | | | | 3.5 | |
Business, Building and Other Support | | | 0.3 | | | | 5.1 | | | | (8.8 | ) | | | 3.9 | | | | 1.8 | |
Educational Services | | | 3.9 | | | | 2.1 | | | | (4.7 | ) | | | 1.2 | | | | 0.5 | |
Health Care and Social Assistance | | | 5.7 | | | | 2.2 | | | | 3.0 | | | | 3.8 | | | | 2.9 | |
Information, Culture and Recreation | | | 3.5 | | | | (5.2 | ) | | | 0.3 | | | | 2.5 | | | | 4.7 | |
Accommodation and Food Services | | | 7.1 | | | | (1.7 | ) | | | (3.2 | ) | | | 2.3 | | | | 2.3 | |
Public Administration | | | 5.9 | | | | 7.5 | | | | (0.5 | ) | | | 0.8 | | | | 1.8 | |
Other Services | | | 2.5 | | | | 7.1 | | | | 4.6 | | | | (0.4 | ) | | | (3.3 | ) |
Total Employment | | | 1.4 | | | | 1.0 | | | | (2.7 | ) | | | 1.6 | | | | 1.8 | |
72
| | | | | | | | | | | | | | | | | | | | |
Table 23 (continued) | | Ontario, Growth in Employment by Industry, 2007–2016 | |
| | | (Per Cent Change) | |
| | | 2012 | | | 2013 | | | 2014 | | | 2015 | | | 2016 | |
Goods Producing Industries | | | 0.5 | | | | (1.3 | ) | | | (1.1 | ) | | | 1.4 | | | | 1.2 | |
Primary Industries | | | (2.6 | ) | | | (4.6 | ) | | | (3.9 | ) | | | 4.5 | | | | (5.6 | ) |
Manufacturing | | | 0.8 | | | | (1.6 | ) | | | (2.4 | ) | | | (0.5 | ) | | | 0.9 | |
Construction | | | 0.8 | | | | 0.2 | | | | 1.8 | | | | 4.3 | | | | 3.4 | |
Utilities | | | 0.0 | | | | (1.0 | ) | | | (1.4 | ) | | | (3.3 | ) | | | 0.2 | |
Services Producing Industries | | | 0.7 | | | | 2.6 | | | | 1.3 | | | | 0.5 | | | | 1.1 | |
Trade | | | 0.1 | | | | 1.2 | | | | 2.7 | | | | (0.4 | ) | | | (0.9 | ) |
Transportation and Warehousing | | | (3.1 | ) | | | 7.6 | | | | (2.2 | ) | | | (2.3 | ) | | | 1.8 | |
Finance, Insurance, Real Estate and Leasing | | | (0.3 | ) | | | 2.9 | | | | 0.4 | | | | 6.1 | | | | 2.2 | |
Professional, Scientific and Technical Services | | | 0.1 | | | | 2.3 | | | | 3.2 | | | | 3.5 | | | | 2.6 | |
Business, Building and Other Support | | | 0.2 | | | | 10.6 | | | | 2.1 | | | | (0.4 | ) | | | (2.2 | ) |
Educational Services | | | 1.4 | | | | 3.9 | | | | 2.3 | | | | 4.1 | | | | (2.3 | ) |
Health Care and Social Assistance | | | 2.3 | | | | 2.9 | | | | 0.9 | | | | 1.8 | | | | 3.2 | |
Information, Culture and Recreation | | | (4.5 | ) | | | (2.5 | ) | | | 1.6 | | | | (2.2 | ) | | | 2.7 | |
Accommodation and Food Services | | | 7.2 | | | | 2.1 | | | | 2.2 | | | | (1.3 | ) | | | 2.8 | |
Public Administration | | | 0.7 | | | | 1.6 | | | | (1.3 | ) | | | (6.2 | ) | | | 2.6 | |
Other Services | | | 2.4 | | | | (1.0 | ) | | | (1.7 | ) | | | (3.7 | ) | | | (0.1 | ) |
Total Employment | | | 0.7 | | | | 1.8 | | | | 0.8 | | | | 0.7 | | | | 1.1 | |
Note: Industrial groupings based on North American Industry Classification System (NAICS).
Source: Statistics Canada.
73
| | | | | | | | | | | | | | | | | | | | | | | | |
Ontario, Employment Level by Economic Regions, 2006–2016 | | | | | | | | | | | | | | | | | Table 24 | |
| | | (Thousands) | |
| | | 2006 | | | 2007 | | | 2008 | | | 2009 | | | 2010 | | | 2011 | |
Ontario | | | 6,452 | | | | 6,545 | | | | 6,610 | | | | 6,433 | | | | 6,538 | | | | 6,658 | |
Region: 1 | | | | | | | | | | | | | | | | | | | | | | | | |
East | | | 843 | | | | 873 | | | | 898 | | | | 879 | | | | 880 | | | | 897 | |
Ottawa (510) | | | 641 | | | | 658 | | | | 678 | | | | 666 | | | | 676 | | | | 679 | |
Kingston-Pembroke (515) | | | 203 | | | | 215 | | | | 220 | | | | 213 | | | | 203 | | | | 218 | |
Greater Toronto Area (530)2 | | | 2,910 | | | | 2,977 | | | | 3,023 | | | | 2,963 | | | | 3,035 | | | | 3,078 | |
Central | | | 1,522 | | | | 1,526 | | | | 1,530 | | | | 1,488 | | | | 1,508 | | | | 1,552 | |
Muskoka-Kawarthas (520) | | | 181 | | | | 180 | | | | 180 | | | | 171 | | | | 173 | | | | 176 | |
Kitchener-Waterloo-Barrie (540) | | | 658 | | | | 655 | | | | 653 | | | | 636 | | | | 651 | | | | 676 | |
Hamilton-Niagara Peninsula (550) | | | 683 | | | | 691 | | | | 697 | | | | 681 | | | | 685 | | | | 700 | |
Southwest | | | 813 | | | | 800 | | | | 791 | | | | 752 | | | | 762 | | | | 771 | |
London (560) | | | 334 | | | | 336 | | | | 329 | | | | 316 | | | | 319 | | | | 320 | |
Windsor-Sarnia (570) | | | 324 | | | | 311 | | | | 309 | | | | 290 | | | | 293 | | | | 294 | |
Stratford-Bruce Peninsula (580) | | | 156 | | | | 153 | | | | 153 | | | | 146 | | | | 150 | | | | 158 | |
North | | | 364 | | | | 369 | | | | 367 | | | | 351 | | | | 354 | | | | 360 | |
Northeast (590) | | | 259 | | | | 263 | | | | 265 | | | | 251 | | | | 254 | | | | 261 | |
Northwest (595) | | | 105 | | | | 106 | | | | 102 | | | | 100 | | | | 100 | | | | 100 | |
| | |
Table 24 (continued) | | | | | (Thousands) | |
| | | | | | 2012 | | | 2013 | | | 2014 | | | 2015 | | | 2016 | |
Ontario | | | | | | | 6,703 | | | | 6,823 | | | | 6,878 | | | | 6,923 | | | | 7,000 | |
Region: 1 | | | | | | | | | | | | | | | | | | | | | | | | |
East | | | | | | | 909 | | | | 898 | | | | 908 | | | | 889 | | | | 905 | |
Ottawa (510) | | | | | | | 695 | | | | 685 | | | | 698 | | | | 688 | | | | 692 | |
Kingston-Pembroke (515) | | | | | | | 214 | | | | 214 | | | | 210 | | | | 201 | | | | 212 | |
Greater Toronto Area (530)2 | | | | | | | 3,112 | | | | 3,240 | | | | 3,241 | | | | 3,320 | | | | 3,373 | |
Central | | | | | | | 1,551 | | | | 1,559 | | | | 1,597 | | | | 1,597 | | | | 1,598 | |
Muskoka-Kawarthas (520) | | | | | | | 171 | | | | 168 | | | | 186 | | | | 168 | | | | 171 | |
Kitchener-Waterloo-Barrie (540) | | | | | | | 675 | | | | 694 | | | | 705 | | | | 711 | | | | 706 | |
Hamilton-Niagara Peninsula (550) | | | | | | | 706 | | | | 697 | | | | 706 | | | | 719 | | | | 721 | |
Southwest | | | | | | | 773 | | | | 769 | | | | 775 | | | | 770 | | | | 776 | |
London (560) | | | | | | | 323 | | | | 324 | | | | 325 | | | | 330 | | | | 331 | |
Windsor-Sarnia (570) | | | | | | | 297 | | | | 295 | | | | 299 | | | | 295 | | | | 299 | |
Stratford-Bruce Peninsula (580) | | | | | | | 153 | | | | 151 | | | | 151 | | | | 145 | | | | 145 | |
North | | | | | | | 357 | | | | 356 | | | | 357 | | | | 346 | | | | 348 | |
Northeast (590) | | | | | | | 255 | | | | 254 | | | | 257 | | | | 248 | | | | 248 | |
Northwest (595) | | | | | | | 102 | | | | 102 | | | | 100 | | | | 97 | | | | 100 | |
| 1 | Standard deviations vary significantly across regions, decreasing as the size of the region increases. |
| 2 | Economic Region 530 closely matches the GTA, the main exception being that it excludes the city of Burlington. |
Note: All figures are average annual employment levels.
Source: Statistics Canada.
74
| | | | | | | | | | | | | | | | |
Ontario, Employment Level by Industry for Economic Regions, 2016 | | | | | | | | | | | Table 25 | |
| | | (Thousands) | |
| | | All Industries | | | Agriculture | | | Resources1 | | | Manufacturing | |
Ontario | | | 7,000 | | | | 78 | | | | 36 | | | | 751 | |
Region: | | | | | | | | | | | | | | | | |
East | | | 905 | | | | 8 | | | | — | | | | 46 | |
Ottawa (510) | | | 692 | | | | 5 | | | | — | | | | 31 | |
Kingston-Pembroke (515) | | | 212 | | | | 4 | | | | — | | | | 15 | |
Greater Toronto Area (530) | | | 3,373 | | | | 8 | | | | 6 | | | | 340 | |
Central | | | 1,598 | | | | 28 | | | | 4 | | | | 215 | |
Muskoka-Kawarthas (520) | | | 171 | | | | 3 | | | | — | | | | 11 | |
Kitchener-Waterloo-Barrie (540) | | | 706 | | | | 11 | | | | 2 | | | | 119 | |
Hamilton-Niagara Peninsula (550) | | | 721 | | | | 14 | | | | 2 | | | | 86 | |
Southwest | | | 776 | | | | 31 | | | | 3 | | | | 130 | |
London (560) | | | 331 | | | | 11 | | | | — | | | | 50 | |
Windsor-Sarnia (570) | | | 299 | | | | 10 | | | | — | | | | 60 | |
Stratford-Bruce Peninsula (580) | | | 145 | | | | 10 | | | | 2 | | | | 19 | |
North | | | 348 | | | | 3 | | | | 21 | | | | 21 | |
Northeast (590) | | | 248 | | | | 2 | | | | 18 | | | | 16 | |
Northwest (595) | | | 100 | | | | — | | | | 4 | | | | 6 | |
| |
Table 25 (continued) | | (Thousands) | |
| | | Construction | | | Distributive2 | | | Finance, Prof.
& Mgmt.3 | | | Info., Culture &
Recreation4 | |
Ontario | | | 504 | | | | 656 | | | | 1,476 | | | | 318 | |
Region: | | | | | | | | | | | | | | | | |
East | | | 57 | | | | 63 | | | | 165 | | | | 39 | |
Ottawa (510) | | | 41 | | | | 49 | | | | 131 | | | | 33 | |
Kingston-Pembroke (515) | | | 15 | | | | 14 | | | | 34 | | | | 7 | |
Greater Toronto Area (530) | | | 223 | | | | 347 | | | | 906 | | | | 173 | |
Central | | | 137 | | | | 144 | | | | 255 | | | | 72 | |
Muskoka-Kawarthas (520) | | | 21 | | | | 16 | | | | 26 | | | | 7 | |
Kitchener-Waterloo-Barrie (540) | | | 56 | | | | 63 | | | | 114 | | | | 31 | |
Hamilton-Niagara Peninsula (550) | | | 59 | | | | 64 | | | | 114 | | | | 34 | |
Southwest | | | 60 | | | | 70 | | | | 107 | | | | 28 | |
London (560) | | | 24 | | | | 28 | | | | 53 | | | | 13 | |
Windsor-Sarnia (570) | | | 22 | | | | 26 | | | | 37 | | | | 11 | |
Stratford-Bruce Peninsula (580) | | | 14 | | | | 16 | | | | 16 | | | | 5 | |
North | | | 27 | | | | 32 | | | | 38 | | | | 10 | |
Northeast (590) | | | 19 | | | | 23 | | | | 28 | | | | 7 | |
Northwest (595) | | | 8 | | | | 9 | | | | 10 | | | | 3 | |
75
| | | | | | | | | | | | |
Table 25 (continued) | | (Thousands) | |
| | | Retail Trade | | | Personal Services5 | | | Education | |
Ontario | | | 754 | | | | 733 | | | | 503 | |
Region: | | | | | | | | | | | | |
East | | | 96 | | | | 91 | | | | 80 | |
Ottawa (510) | | | 67 | | | | 67 | | | | 58 | |
Kingston-Pembroke (515) | | | 28 | | | | 24 | | | | 22 | |
Greater Toronto Area (530) | | | 353 | | | | 340 | | | | 219 | |
Central | | | 180 | | | | 175 | | | | 122 | |
Muskoka-Kawarthas (520) | | | 16 | | | | 23 | | | | 11 | |
Kitchener-Waterloo-Barrie (540) | | | 78 | | | | 71 | | | | 58 | |
Hamilton-Niagara Peninsula (550) | | | 85 | | | | 82 | | | | 52 | |
Southwest | | | 81 | | | | 88 | | | | 54 | |
London (560) | | | 32 | | | | 36 | | | | 26 | |
Windsor-Sarnia (570) | | | 31 | | | | 32 | | | | 20 | |
Stratford-Bruce Peninsula (580) | | | 18 | | | | 19 | | | | 8 | |
North | | | 46 | | | | 38 | | | | 28 | |
Northeast (590) | | | 33 | | | | 26 | | | | 19 | |
Northwest (595) | | | 13 | | | | 13 | | | | 9 | |
| | | | | | | | |
Table 25 (continued) | | (Thousands) | |
| | | Health & Soc. Assistance | | | Public Administration | |
Ontario | | | 838 | | | | 353 | |
Region: | | | | | | | | |
East | | | 130 | | | | 128 | |
Ottawa (510) | | | 95 | | | | 115 | |
Kingston-Pembroke (515) | | | 36 | | | | 13 | |
Greater Toronto Area (530) | | | 343 | | | | 116 | |
Central | | | 203 | | | | 64 | |
Muskoka-Kawarthas (520) | | | 27 | | | | 7 | |
Kitchener-Waterloo-Barrie (540) | | | 75 | | | | 29 | |
Hamilton-Niagara Peninsula (550) | | | 101 | | | | 28 | |
Southwest | | | 104 | | | | 21 | |
London (560) | | | 49 | | | | 8 | |
Windsor-Sarnia (570) | | | 39 | | | | 9 | |
Stratford-Bruce Peninsula (580) | | | 16 | | | | 4 | |
North | | | 58 | | | | 24 | |
Northeast (590) | | | 40 | | | | 17 | |
Northwest (595) | | | 19 | | | | 6 | |
All figures are average annual employment levels.
Sub-regional figures may not add up to regional totals due to rounding.
Employment numbers under 1,500 are suppressed because they are statistically unreliable.
See standard deviation and GTA note for Table 24.
Industrial groupings based on North American Industry Classification System (NAICS).
| 1 | Includes Forestry, Fishing, Mining, Oil and Gas. |
| 2 | Includes Transportation and Warehousing, Utilities and Wholesale Trade. |
| 3 | Includes Finance, Insurance, Real Estate and Leasing; Management of Companies, Administrative and Support Services; and Professional, Scientific and Technical Services. |
| 4 | Includes industries such as Publishing, Motion Picture and Sound Recording, Broadcasting and Telecommunications, Information Services and Data Processing Services, Performing Arts, Spectator Sports and Related Industries, Heritage Institutions and Amusement, Gambling and Recreation. |
| 5 | Includes Accommodation and Food Services and Other Services (such as Repair and Maintenance, Personal and Laundry, Religious, Grant-making, Civic, Professional and Similar Organizations). |
Source: Statistics Canada.
76
| | |
Ontario Economic Regions1 | | Table 26 |
East |
| |
| Ottawa (510) | | The united counties of Stormont, Dundas and Glengarry, Prescott and Russell, Leeds and Grenville, Lanark County and the Ottawa Division |
| |
| Kingston-Pembroke (515) | | The counties of Lennox and Addington, Hastings, Renfrew and Frontenac and the Prince Edward Division |
|
Central |
| |
| Muskoka-Kawarthas (520) | | The counties of Northumberland, Peterborough, Haliburton, the Muskoka District Municipality and the Kawartha Lakes Division |
| |
| Kitchener-Waterloo-Barrie (540) | | The counties of Dufferin, Wellington and Simcoe and the Waterloo Regional Municipality |
| |
| Hamilton-Niagara Peninsula (550) | | The divisions of Brant, Haldimand-Norfolk and Hamilton, the Niagara Regional Municipality and the city of Burlington |
|
Greater Toronto Area2 |
| |
| Toronto (530) | | The Toronto Division and the regional municipalities of Durham, York, Peel and Halton (excluding the city of Burlington) |
| |
Southwest | | |
| |
| London (560) | | The counties of Oxford, Elgin and Middlesex |
| |
| Windsor-Sarnia (570) | | The counties of Lambton and Essex and the Chatham-Kent Division |
| |
| Stratford-Bruce Peninsula (580) | | The counties of Perth, Huron, Bruce and Grey |
|
North |
| |
| Northeast (590) | | The districts of Nipissing, Parry Sound, Manitoulin, Sudbury, Timiskaming, Cochrane, Algoma and the Greater Sudbury Division |
| |
| Northwest (595) | | The districts of Thunder Bay, Rainy River and Kenora |
| 1 | As defined by Statistics Canada, Standard Geographical Classification SGC 2011. |
| 2 | Economic Region 530 closely matches the GTA, the main exception being that it excludes the city of Burlington. |
77