UNITED STATES
SECURITIES AND EXCHANGE COMMISSION
Washington, D.C. 20549
FORM N-CSR
CERTIFIED SHAREHOLDER REPORT OF REGISTERED
MANAGEMENT INVESTMENT COMPANIES
Investment Company Act file number 811-04023
Dryden Municipal Series Fund
(Exact name of registrant as specified in charter)
Gateway Center 3,
100 Mulberry Street,
Newark, New Jersey 07102
(Address of principal executive offices)
Marguerite E. H. Morrison
Gateway Center 3,
100 Mulberry Street,
Newark, New Jersey 07102
(Name and address of agent for service)
Registrant’s telephone number, including area code: 973-367-7525
Date of fiscal year end: 8/31/2004
Date of reporting period: 2/29/2004
| Item 1 | – | Reports to Stockholders – [ INSERT REPORT ] | ||
Dryden Municipal Series Fund/
New Jersey Series
| FEBRUARY 29, 2004 | SEMIANNUAL REPORT | |

FUND TYPE
Municipal bond
OBJECTIVE
Maximize current income that is exempt from New Jersey state income tax and federal income tax, consistent with the preservation of capital
This report is not authorized for distribution to prospective investors unless preceded or accompanied by a current prospectus.
The views expressed in this report and information about the Series’ portfolio holdings are for the period covered by this report and are subject to change thereafter.
JennisonDryden is a registered trademark of The Prudential Insurance Company of America.

Dear Shareholder,
April 19, 2004
As the stock market slowed in the first quarter of 2004 following its particularly strong performance in 2003, some investors still seemed to be watching developments from the sidelines. Though the economy appears sound, given the unsettled global political climate and uncertain job growth in the United States, we can understand that some investors may want to remain cautious. For those with long-term goals, however, keeping assets in short-term savings and money market accounts may be a losing proposition as meager yields will be eroded by taxes, and even low annual inflation will reduce purchasing power. A broadly diversified asset allocation can help protect you against inflation and increase your chances of participating in economic growth.
We recommend that you develop a diversified asset allocation strategy in consultation with a financial professional who knows you and who understands your reasons for investing, the time you have to reach your goals, and the amount of risk you are comfortable assuming. JennisonDryden mutual funds offer a wide range of investment choices, and your financial professional can help you choose the appropriate funds to implement your strategy.
Whether you are investing for your retirement, your children’s education, or some other purpose, JennisonDryden mutual funds offer the experience, resources, and professional discipline of three leading asset managers that can make a difference for you. JennisonDryden funds are managed by Prudential Investment Management’s public equity and fixed income asset management businesses. The equity funds are managed by Jennison Associates and Quantitative Management. Prudential Fixed Income manages the JennisonDryden fixed income and money market funds.
Thank you for your confidence in JennisonDryden mutual funds.
Sincerely,

Judy A. Rice, President
Dryden Municipal Series Fund/New Jersey Series
| Dryden Municipal Series Fund/New Jersey Series | 1 |
Your Series’ Performance
Series objective
The investment objective of the Dryden Municipal Series Fund/New Jersey Series (the Series) is to maximize current income that is exempt from New Jersey state income tax and federal income tax, consistent with the preservation of capital. There can be no assurance that the Series will achieve its investment objective.
Performance data quoted represents past performance and is not indicative of future results. The investment return and principal value of an investment will fluctuate so that an investor’s shares, when redeemed, may be worth more or less than their original cost. Current performance may be lower or higher than the performance data quoted. An investor may obtain current performance data to the most recent month-end by visiting our website at www.jennisondryden.com or by calling us at (800) 225-1852.
| Cumulative Total Returns1 as of 2/29/04 | |||||||||||||||
| Six Months | One Year | Five Years | Ten Years | Since Inception2 | |||||||||||
Class A | 5.71 | % | 4.79 | % | 29.63 | % | 71.49 | % | 150.67 | % | |||||
Class B | 5.58 | 4.44 | 28.03 | 66.07 | 181.90 | ||||||||||
Class C | 5.45 | 4.18 | 26.46 | N/A | 65.73 | ||||||||||
Class Z | 5.82 | 4.96 | 31.92 | N/A | 53.19 | ||||||||||
Lehman Brothers Municipal Bond Index3 | 6.52 | 6.30 | 34.50 | 86.00 | *** | ||||||||||
Lipper NJ Muni Debt Funds Avg.4 | 6.42 | 5.83 | 26.39 | 67.60 | **** | ||||||||||
| Average Annual Total Returns1 as of 3/31/04 | |||||||||||||||
| One Year | Five Years | Ten Years | Since Inception2 | ||||||||||||
Class A | –0.04 | % | 4.31 | % | 5.46 | % | 6.33 | % | |||||||
Class B | –1.08 | 4.76 | 5.57 | 6.61 | |||||||||||
Class C | 2.62 | 4.67 | N/A | 5.29 | |||||||||||
Class Z | 4.29 | 5.54 | N/A | 5.89 | |||||||||||
Lehman Brothers Municipal Bond Index3 | 5.86 | 6.00 | 6.81 | *** | |||||||||||
Lipper NJ Muni Debt Funds Avg.4 | 5.42 | 4.65 | 5.71 | **** | |||||||||||
| Distributions and Yields1 as of 2/29/04 | ||||||||||||
Total Distributions | 30-Day | Taxable Equivalent 30-Day Yield5 at Tax Rates of | ||||||||||
| 33% | 35% | |||||||||||
Class A | $ | 0.34 | 2.17 | % | 3.46 | % | 3.57 | % | ||||
Class B | $ | 0.33 | 2.00 | 3.19 | 3.29 | |||||||
Class C | $ | 0.32 | 1.75 | 2.79 | 2.88 | |||||||
Class Z | $ | 0.36 | 2.49 | 3.97 | 4.09 | |||||||
| 2 | Visit our website at www.jennisondryden.com |
1Source: Prudential Investments LLC and Lipper Inc. The cumulative total returns do not take into account applicable sales charges. If reflected, the applicable sales charges would reduce the cumulative total returns performance quoted. The average annual total returns do take into account applicable sales charges. Without the distribution and service (12b-1) fee waiver of 0.05% and 0.25% for Class A and Class C shares respectively, the returns for these classes would have been lower. During the period ended February 29, 2004, the Series charged a maximum front-end sales charge of 3% for Class A shares and a 12b-1 fee of up to 0.30% annually. Effective March 15, 2004, Class A shares are subject to a maximum front-end sales charge of 4.00%, a 12b-1 fee of up to 0.30% annually, and all investors who purchase Class A shares in an amount of $1 million or more and sell these shares within 12 months of purchase are subject to a contingent deferred sales charge (CDSC) of 1%. Class B shares are subject to a declining CDSC of 5%, 4%, 3%, 2%, 1%, and 1% for the first six years respectively after purchase and a 12b-1 fee of up to 0.50% annually. Approximately seven years after purchase, Class B shares will automatically convert to Class A shares on a quarterly basis. During the period ended February 29, 2004, Class C shares were subject to a front-end sales charge of 1%, a CDSC of 1% for shares redeemed within 18 months of purchase, and a 12b-1 fee of up to 1% annually. Class C shares purchased on or after February 2, 2004 are not subject to a front-end sales charge, the CDSC of 1% for Class C shares purchased on or after that date will apply for 12 months from the date of purchase, and the annual 12b-1 fee will remain up to 1%. Class Z shares are not subject to a sales charge or 12b-1 fee. The returns in the tables do not reflect the deduction of taxes that a shareholder would pay on fund distributions or following the redemption of fund shares. 2Inception dates: Class A, 1/22/90; Class B, 3/4/88; Class C, 8/1/94; and Class Z, 12/6/96. 3The Lehman Brothers Municipal Bond Index is an unmanaged index of over 39,000 long-term investment-grade municipal bonds. It gives a broad look at how long-term investment-grade municipal bonds have performed. Investors cannot invest directly in an index. 4The Lipper New Jersey (NJ) Muni Debt Funds Average (Lipper Average) represents returns based on an average return of all funds in the Lipper NJ Muni Debt Funds category for the periods noted. Funds in the Lipper Average limit their assets to those securities that are exempt from taxation in New Jersey. 5Taxable equivalent yields reflect federal and applicable state tax rates. The returns for the Lehman Brothers Municipal Bond Index would be lower if they included the effects of sales charges, operating expenses of a mutual fund, or taxes. Returns for the Lipper Average reflect the deduction of operating expenses, but not sales charges or taxes. ***Lehman Brothers Municipal Bond Index Closest Month-End to Inception cumulative total returns as of 2/29/04 are 170.67% for Class A, 214.15% for Class B, 88.34% for Class C, and 56.88% for Class Z. Lehman Brothers Municipal Bond Index Closest Month-End to Inception average annual total returns as of 3/31/04 are 7.26% for Class A, 7.35% for Class B, 6.73% for Class C, and 6.28% for Class Z. ****Lipper Average Closest Month-End to Inception cumulative total returns as of 2/29/04 are 152.84% for Class A, 195.40% for Class B, 71.59% for Class C, and 44.82% for Class Z. Lipper Average Closest Month-End to Inception average annual total returns as of 3/31/04 are 6.72% for Class A, 6.92% for Class B, 5.67% for Class C, and 5.09% for Class Z.
| Dryden Municipal Series Fund/New Jersey Series | 3 |
| Five Largest Issuers expressed as a percentage of net assets as of 2/29/04 | |||
New Jersey State | 13.2 | % | |
New Jersey Trans. Trust Fund Auth. | 8.1 | ||
Port Auth. New York & New Jersey | 7.2 | ||
New Jersey State Turnpike Authority | 5.6 | ||
New Jersey EDA Kapkowski Rd. Landfill | 5.4 | ||
Issuers are subject to change.
| Portfolio Composition expressed as a percentage of net assets as of 2/29/04 | |||
Prerefunded | 24.0 | % | |
Transportation | 15.3 | ||
Healthcare | 12.9 | ||
Other | 10.9 | ||
General Obligation | 9.0 | ||
Corporate-Backed IDB & PCR | 8.4 | ||
Special Tax/Assessment District | 7.0 | ||
Lease-Backed Certificate of Participation | 5.2 | ||
Education | 4.6 | ||
Water & Sewer | 0.6 | ||
Solid Waste/Resource Recovery | 0.4 | ||
Cash & Equivalents | 1.7 | ||
Portfolio composition is subject to change.
| Credit Quality expressed as a percentage of net assets as of 2/29/04 | |||
Aaa | 62.7 | % | |
Aa | 3.1 | ||
A | 14.2 | ||
Baa | 6.6 | ||
Ba | 0.8 | ||
NR | 10.9 | ||
Cash & Equivalents | 1.7 | ||
Source: Moody’s rating, defaulting to S&P when not rated. Credit quality is subject to change.
| 4 | Visit our website at www.jennisondryden.com |
Portfolio of Investments
| FEBRUARY 29, 2004 | SEMI-ANNUAL REPORT | |
Dryden Municipal Series Fund
New Jersey Series
Portfolio of Investments
as of February 29, 2004 (Unaudited)
| Description (a) | Moody’s Rating | Interest Rate | Maturity Date | Principal Amount (000) | Value (Note 1) | ||||||||
LONG-TERM INVESTMENTS 89.7% | |||||||||||||
Municipal Bonds | |||||||||||||
Bergen Cnty., Util. Auth., Wtr. Poll. Ctrl. Rev., Ser. B, F.G.I.C. | Aaa | 5.75% | 12/15/05 | $ | 1,000 | $ | 1,080,520 | ||||||
Cape May Cnty. Ind. Poll. Ctrl., Fin. Auth. Rev., Atlantic City Elec. Co., Ser. A, M.B.I.A. | Aaa | 6.80 | 3/01/21 | 2,615 | 3,472,119 | ||||||||
Clearview Reg. High Sch. Dist., F.G.I.C. | Aaa | 5.375 | 8/01/15 | 1,205 | 1,399,162 | ||||||||
Delaware River Port Auth., Penn. & NJ Port Dist. Proj., Ser. B, F.S.A. | Aaa | 5.625 | 1/01/26 | 5,000 | 5,583,100 | ||||||||
Essex Cnty. Impvt. Auth. Proj. Rev., F.S.A. | Aaa | 5.125 | 12/15/18 | 3,000 | 3,345,960 | ||||||||
Essex Cnty. Impvt. Auth., Lease-Cogen Facs. Proj. Rev., F.G.I.C. | Aaa | 5.25 | 1/01/19 | 1,110 | 1,225,362 | ||||||||
Gloucester Cnty. Impvt. Auth., Solid Wste. Recov. Rev. Wste. Mgmt. Proj., Ser. A | BBB(d) | 6.85 | 12/01/29 | 3,000 | 3,545,790 | ||||||||
Hudson Cnty. Impvt. Auth., Solid Wste. Sys. Rev., Ser. A | AAA(d) | 6.10 | 7/01/20 | 1,500 | (e) | 1,556,595 | |||||||
Jackson Twnshp. Sch. Dist., | |||||||||||||
G.O., F.G.I.C. | Aaa | 6.60 | 6/01/04 | 1,020 | 1,034,984 | ||||||||
G.O., F.G.I.C. | Aaa | 6.60 | 6/01/05 | 940 | 1,005,067 | ||||||||
G.O., F.G.I.C. | Aaa | 6.60 | 6/01/10 | 1,600 | 1,976,784 | ||||||||
G.O., F.G.I.C. | Aaa | 6.60 | 6/01/11 | 1,600 | 2,003,952 | ||||||||
Jersey City, G.O., Ser. A, F.S.A. | Aaa | 9.25 | 5/15/04 | 4,310 | 4,385,425 | ||||||||
Middle Twnshp. Sch. Dist., F.G.I.C. | Aaa | 7.00 | 7/15/05 | 1,200 | (f) | 1,296,432 | |||||||
New Jersey Bldg. Auth. St. Rev., Rfdg., Ser. B, A.M.B.A.C. | Aaa | 5.25 | 12/15/09 | 4,000 | 4,614,840 | ||||||||
New Jersey Econ. Dev. Auth. Rev., | |||||||||||||
Sch. Facs. Constrs., Ser. A, A.M.B.A.C. | Aaa | 5.125 | 6/15/14 | 3,000 | 3,382,410 | ||||||||
Sch. Facs. Constrs., Ser. A, A.M.B.A.C. | Aaa | 5.25 | 6/15/18 | 4,500 | 5,014,080 | ||||||||
Sch. Facs. Constrs., Ser. F | Aa3 | 5.00 | 6/15/09 | 2,000 | 2,255,680 | ||||||||
New Jersey Econ. Dev. Auth., | |||||||||||||
Masonic Charity Fdn. Proj. | A+(d) | 5.875 | 6/01/18 | 250 | 285,235 | ||||||||
Masonic Charity Fdn. Proj. | A+(d) | 6.00 | 6/01/25 | 1,150 | 1,296,096 | ||||||||
See Notes to Financial Statements.
| 6 | Visit our website at www.jennisondryden.com |
| Description (a) | Moody’s Rating | Interest Rate | Maturity Date | Principal Amount (000) | Value (Note 1) | ||||||||
New Jersey Econ. Dev. Auth., Dist. Heating & Cooling Rev., Trigen-Trenton Proj., Ser. A | BBB-(d) | 6.20% | 12/01/10 | $ | 600 | $ | 613,290 | ||||||
New Jersey Econ. Dev. Auth., Econ. Dev. Rev., | |||||||||||||
Kapkowski Rd. Landfill, Rfdg. | Baa3 | 6.50 | 4/01/28 | 1,000 | 1,139,410 | ||||||||
Kapkowski Rd. Landfill, Ser. A | Aaa | 6.375 | 4/01/31 | 5,800 | (e) | 7,329,982 | |||||||
Kapkowski Rd. Landfill, Ser. A, C.A.B.S., E.T.M. | Aaa | Zero | 4/01/08 | 1,020 | 928,455 | ||||||||
New Jersey Econ. Dev. Auth., Natural Gas Facs. Rev., NUI Corp. Proj., Ser. A, M.B.I.A., A.M.T. | Aaa | 5.70 | 6/01/32 | 1,500 | 1,595,940 | ||||||||
New Jersey Econ. Dev. Auth., Rev., | |||||||||||||
First Mtge.—Franciscan Oaks | NR | 5.70 | 10/01/17 | 2,040 | 1,885,348 | ||||||||
First Mtge.—Keswick Pines | NR | 5.75 | 1/01/24 | 1,750 | 1,738,187 | ||||||||
First Mtge.—The Evergreens | NR | 5.875 | 10/01/12 | 1,200 | 1,200,636 | ||||||||
First Mtge.—The Evergreens | NR | 6.00 | 10/01/17 | 1,425 | 1,461,095 | ||||||||
First Mtge.—The Evergreens | NR | 6.00 | 10/01/22 | 1,400 | 1,416,982 | ||||||||
Trans. Proj. Sublease, Ser. A, F.S.A. | Aaa | 6.00 | 5/01/16 | 1,350 | (e) | 1,596,294 | |||||||
New Jersey Econ. Dev. Auth., Wtr. Facs. Rev., R.I.T.E.S., PA-98, F.G.I.C., A.M.T. | AAA(d) | 10.76(c) | 11/01/29 | 5,000 | 5,799,200 | ||||||||
New Jersey Hlth. Care Facs. Fin. Auth. Rev., | |||||||||||||
Atlantic City Med. Ctr. | A3 | 6.25 | 7/01/17 | 1,750 | 1,992,287 | ||||||||
Englewood Hosp. & Med. Ctr. | Baa3 | 6.75 | 7/01/24 | 1,230 | (e) | 1,277,995 | |||||||
Jersey Shore Med. Ctr., A.M.B.A.C. | AAA(d) | 6.00 | 7/01/09 | 835 | (e) | 866,129 | |||||||
Jersey Shore Med. Ctr., A.M.B.A.C. | Aaa | 6.00 | 7/01/09 | 630 | 652,403 | ||||||||
Jersey Shore Med. Ctr., A.M.B.A.C. | AAA(d) | 6.25 | 7/01/21 | 850 | (e) | 882,419 | |||||||
Jersey Shore Med. Ctr., A.M.B.A.C. | Aaa | 6.25 | 7/01/21 | 650 | (f) | 673,341 | |||||||
Pascack Valley Hosp. Assoc. | BB+(d) | 5.125 | 7/01/28 | 1,500 | 1,323,585 | ||||||||
South Jersey Hosp. | Baa1 | 6.00 | 7/01/26 | 1,000 | 1,060,470 | ||||||||
South Jersey Hosp. | Baa1 | 6.00 | 7/01/32 | 1,000 | 1,056,290 | ||||||||
St. Joseph’s Hosp. & Med. Ctr., Ser. A, CONNIE LEE | AAA(d) | 5.70 | 7/01/11 | 4,375 | 4,722,944 | ||||||||
St. Peters Univ. Hosp., Ser. A | Baa1 | 6.875 | 7/01/30 | 1,750 | 1,957,095 | ||||||||
See Notes to Financial Statements.
| Dryden Municipal Series Fund/New Jersey Series | 7 |
Portfolio of Investments
as of February 29, 2004 (Unaudited) Cont’d.
| Description (a) | Moody’s Rating | Interest Rate | Maturity Date | Principal Amount (000) | Value (Note 1) | ||||||||
New Jersey St. Ed. Facs. Auth. Rev., | |||||||||||||
Coll. of New Jersey, Ser. C, F.G.I.C. | Aaa | 5.375% | 7/01/17 | $ | 1,000 | $ | 1,130,760 | ||||||
Felician College of Lodi, Ser. D | NR | 7.375 | 11/01/22 | 1,180 | 1,137,638 | ||||||||
Princeton Theological, Ser. B | Aaa | 5.90 | 7/01/26 | 2,500 | (e) | 2,788,900 | |||||||
New Jersey St. Hwy. Auth., Garden St. Pkwy., | |||||||||||||
Gen. Rev. | A1 | 5.75 | 1/01/14 | 2,500 | (e) | 2,972,800 | |||||||
Gen. Rev. | A1 | 5.625 | 1/01/30 | 1,650 | (e) | 1,950,877 | |||||||
Gen. Rev., E.T.M. | A1 | 6.20 | 1/01/10 | 3,035 | 3,562,180 | ||||||||
New Jersey St. Tpke. Auth., Tpke. Rev., | |||||||||||||
Ser. A, M.B.I.A. | Aaa | 5.75 | 1/01/18 | 7,500 | 8,628,150 | ||||||||
Ser. C, M.B.I.A., E.T.M. | Aaa | 6.50 | 1/01/09 | 1,000 | 1,196,030 | ||||||||
New Jersey St. Trans. Corp. Ctfs., Federal Trans. Admin. Grants, Ser. B, C.O.P., A.M.B.A.C. | Aaa | 6.00 | 9/15/15 | 2,000 | (e) | 2,417,660 | |||||||
New Jersey St. Trans. Trust Fund Auth. Rev., | |||||||||||||
R.I.T.E.S., PA-646, M.B.I.A. | NR | 17.61(c) | 12/15/08 | 2,475 | 4,264,970 | ||||||||
Trans. Sys., Ser. B, M.B.I.A. | Aaa | 6.50 | 6/15/10 | 1,540 | 1,883,358 | ||||||||
Trans. Sys., Ser. B, M.B.I.A. | Aaa | 5.75 | 6/15/14 | 1,315 | (e) | 1,420,095 | |||||||
Trans. Sys., Ser. B, M.B.I.A. | Aaa | 6.00 | 12/15/14 | 3,425 | 4,143,702 | ||||||||
Trans. Sys., Ser. B, M.B.I.A. | Aaa | 6.00 | 12/15/19 | 2,000 | (e) | 2,446,200 | |||||||
North Bergen Twnshp. Mun. Util. Auth. Swr. Rev., M.B.I.A. | Aaa | 5.25 | 12/15/17 | 1,800 | 2,048,112 | ||||||||
North Brunswick Twnshp., | |||||||||||||
Brd. of Ed., G.O. | Aa3 | 6.80 | 6/15/06 | 350 | 392,189 | ||||||||
Brd. of Ed., G.O. | Aa3 | 6.80 | 6/15/07 | 350 | 406,045 | ||||||||
Port Auth. of New York & New Jersey, | |||||||||||||
Cons. Ser. 127, A.M.B.A.C., A.M.T. | Aaa | 5.50 | 12/15/15 | 3,000 | 3,391,050 | ||||||||
Ser. 96, F.G.I.C., A.M.T. | Aaa | 6.60 | 10/01/23 | 2,750 | 2,864,125 | ||||||||
Puerto Rico Elec. Pwr. Auth., Rfdg., Ser. X, M.B.I.A. | Aaa | 6.00 | 7/01/12 | 3,295 | (e) | 3,576,162 | |||||||
Puerto Rico Pub. Fin. Corp., Comnwlth. Approp., Ser. A, M.B.I.A. | Aaa | 5.50 | 8/01/17 | 1,500 | 1,726,440 | ||||||||
Rutgers—The St. Univ. of New Jersey, Ser. A | Aa3 | 6.40 | 5/01/13 | 2,000 | 2,440,000 | ||||||||
See Notes to Financial Statements.
| 8 | Visit our website at www.jennisondryden.com |
| Description (a) | Moody’s Rating | Interest Rate | Maturity Date | Principal Amount (000) | Value (Note 1) | ||||||||
Sparta Twnshp. Sch. Dist., G.O., M.B.I.A. | Aaa | 5.75% | 9/01/14 | $ | 1,000 | (e) | $ | 1,108,700 | |||||
Union City Sch. Impvt., G.O., F.S.A. | Aaa | 6.375 | 11/01/08 | 1,545 | 1,840,481 | ||||||||
Union Cnty. Impvt. Auth. Rev., Plainfield Brd. of Ed. Proj., | |||||||||||||
F.G.I.C. | AAA(d) | 6.25 | 8/01/14 | 1,175 | (e) | 1,365,632 | |||||||
F.G.I.C. | AAA(d) | 6.25 | 8/01/15 | 1,250 | (e) | 1,452,800 | |||||||
F.G.I.C. | AAA(d) | 6.25 | 8/01/16 | 1,330 | (e) | 1,545,779 | |||||||
F.G.I.C. | AAA(d) | 6.25 | 8/01/17 | 1,415 | (e) | 1,644,570 | |||||||
Virgin Islands Pub. Fin. Auth. Rev., Ser. A | BBB(d) | 6.50 | 10/01/24 | 750 | 859,725 | ||||||||
Total long-term investments | 159,534,500 | ||||||||||||
SHORT-TERM INVESTMENTS 7.4% | |||||||||||||
Mun. Secs. Trust Cert., G.O., Ser. 2001-174 Cert. Class A, F.R.D.D. | A-1(d) | 0.97 | 3/01/04 | 6,500 | 6,500,000 | ||||||||
New Jersey Econ. Dev. Auth., Wtr. Facs. Rev., United Wtr. Proj., Ser. C, A.M.B.A.C., F.R.D.D., A.M.T. | VMIG1 | 1.02 | 3/01/04 | 215 | 215,000 | ||||||||
Port Auth. of New York & New Jersey, SPL Oblig. Rev., | |||||||||||||
Versatile Structure Oblig., Ser. 4, F.R.D.D., A.M.T. | VMIG1 | 1.02 | 3/01/04 | 4,600 | 4,600,000 | ||||||||
Versatile Structure Oblig., Ser. 6, F.R.D.D., A.M.T. | VMIG1 | 1.02 | 3/01/04 | 1,900 | 1,900,000 | ||||||||
Total short-term investments | 13,215,000 | ||||||||||||
Total Investments 97.1% | 172,749,500 | ||||||||||||
Other assets in excess of liabilities 2.9% | 5,170,796 | ||||||||||||
Net Assets 100% | $ | 177,920,296 | |||||||||||
See Notes to Financial Statements.
| Dryden Municipal Series Fund/New Jersey Series | 9 |
Portfolio of Investments
as of February 29, 2004 (Unaudited) Cont’d.
| (a) | The following abbreviations are used in portfolio descriptions: |
A.M.B.A.C.—American Municipal Bond Assurance Corporation.
A.M.T.—Alternative Minimum Tax.
C.A.B.S.—Capital Appreciation Bonds.
CONNIE LEE—College Construction Loan Insurance Association.
C.O.P.—Certificates of Participation.
E.T.M.—Escrowed to Maturity.
F.G.I.C.—Financial Guaranty Insurance Company.
F.R.D.D.—Floating Rate (Daily) Demand Note(b).
F.S.A.—Financial Security Assurance.
G.O.—General Obligation.
M.B.I.A.—Municipal Bond Insurance Corporation.
R.I.T.E.S.—Residual Interest Tax Exempt Securities Receipts.
| (b) | For purposes of amortized cost valuation, the maturity date of Floating Rate Demand Notes are considered to be the later of the next date on which the security can be redeemed at par, or the next date on which the rate of interest is adjusted. |
| (c) | Inverse floating rate bond. The coupon is inversely indexed to a floating interest rate. The rate shown is the rate at period end. |
| (d) | Standard & Poor’s Rating. |
| (e) | All or partial prerefunded issues are secured by escrowed cash and/or direct U.S. guaranteed obligations. |
| (f) | Partial principal amount pledged as collateral for financial futures contracts. |
NR—Not Rated by Moody’s or Standard & Poor’s.
The Fund’s current Statement of Additional Information contains a description of Moody’s and Standard & Poor’s ratings.
See Notes to Financial Statements.
| 10 | Visit our website at www.jennisondryden.com |
This Page Intentionally Left Blank
Statement of Assets and Liabilities
as of February 29, 2004 (Unaudited)
Assets | ||||
Investments, at value (cost $157,949,357) | $ | 172,749,500 | ||
Cash | 58,656 | |||
Receivable for investments sold | 3,362,577 | |||
Interest receivable | 2,239,965 | |||
Receivable for Series shares sold | 72,001 | |||
Prepaid Expenses | 4,984 | |||
Total assets | 178,487,683 | |||
Liabilities | ||||
Payable for Series shares reacquired | 184,428 | |||
Accrued expenses | 79,425 | |||
Dividends payable | 79,051 | |||
Unrealized depreciation on interest rate swaps | 73,656 | |||
Management fee payable | 70,438 | |||
Distribution fee payable | 43,044 | |||
Due to broker—variation margin | 27,441 | |||
Deferred trustees’ fees | 9,904 | |||
Total liabilities | 567,387 | |||
Net Assets | $ | 177,920,296 | ||
Net assets were comprised of: | ||||
Shares of beneficial interest, at par | $ | 157,498 | ||
Paid-in capital in excess of par | 162,199,132 | |||
| 162,356,630 | ||||
Accumulated net investment loss | (26,954 | ) | ||
Accumulated net realized loss on investments | 923,118 | |||
Net unrealized appreciation on investments | 14,667,502 | |||
Net assets, February 29, 2004 | $ | 177,920,296 | ||
See Notes to Financial Statements
| 12 | Visit our website at www.jennisondryden.com |
Class A | |||
Net asset value and redemption price per share | $ | 11.29 | |
Maximum sales charge (3% of offering price) | 0.35 | ||
Maximum offering price to public | $ | 11.64 | |
Class B | |||
Net asset value, offering price and redemption price per share | $ | 11.30 | |
Class C | |||
Net asset value and redemption price per share | $ | 11.30 | |
Sales charge (1% of offering price) | 0.11 | ||
Offering price to public | $ | 11.41 | |
Class Z | |||
Net asset value, offering price and redemption price per share | $ | 11.38 | |
See Notes to Financial Statements
| Dryden Municipal Series Fund/New Jersey Series | 13 |
Statement of Operations
Six Months Ended February 29, 2004 (Unaudited)
Net Investment Income | ||||
Income | ||||
Interest | $ | 4,421,907 | ||
Expenses | ||||
Management fee | 444,018 | |||
Distribution fee—Class A | 169,724 | |||
Distribution fee—Class B | 79,495 | |||
Distribution fee—Class C | 23,091 | |||
Custodian’s fees and expenses | 61,000 | |||
Transfer agent’s fees and expenses | 35,000 | |||
Reports to shareholders | 30,000 | |||
Registration fees | 18,000 | |||
Legal fees and expenses | 16,000 | |||
Audit fee | 10,000 | |||
Trustees’ fees | 6,000 | |||
Miscellaneous expenses | 4,555 | |||
Total expenses | 896,883 | |||
Net investment income | 3,525,024 | |||
Realized And Unrealized Gain (Loss) On Investments | ||||
Net realized gain (loss) on: | ||||
Investment transactions | 1,276,659 | |||
Financial futures transactions | (64,149 | ) | ||
Interest rate swap transactions | (11,775 | ) | ||
Written option transactions | 21,618 | |||
| 1,222,353 | ||||
Net change in unrealized appreciation (depreciation) on: | ||||
Investments | 5,091,490 | |||
Financial futures contracts | (5,881 | ) | ||
Interest rate swap | (73,656 | ) | ||
| 5,011,953 | ||||
Net gain on investments | 6,234,306 | |||
Net Increase In Net Assets Resulting From Operations | $ | 9,759,330 | ||
See Notes to Financial Statements
| 14 | Visit our website at www.jennisondryden.com |
Statement of Changes in Net Assets
(Unaudited)
Six Months Ended February 29, 2004 | Year Ended August 31, 2003 | |||||||
Increase (Decrease) In Net Assets | ||||||||
Operations | ||||||||
Net investment income | $ | 3,525,024 | $ | 7,609,416 | ||||
Net realized gain on investment transactions | 1,222,353 | 1,427,652 | ||||||
Net change in unrealized appreciation on investments | 5,011,953 | (4,386,695 | ) | |||||
Net increase in net assets resulting from operations | 9,759,330 | 4,650,373 | ||||||
Dividends and distributions (Note 1) | ||||||||
Dividends from net investment income | ||||||||
Class A | (2,725,123 | ) | (5,837,798 | ) | ||||
Class B | (599,300 | ) | (1,416,222 | ) | ||||
Class C | (107,838 | ) | (221,597 | ) | ||||
Class Z | (82,280 | ) | (108,256 | ) | ||||
| (3,514,541 | ) | (7,583,873 | ) | |||||
Distributions from net realized gains | ||||||||
Class A | (1,422,239 | ) | (552,564 | ) | ||||
Class B | (337,523 | ) | (147,238 | ) | ||||
Class C | (65,597 | ) | (23,661 | ) | ||||
Class Z | (43,378 | ) | (5,835 | ) | ||||
| (1,868,737 | ) | (729,298 | ) | |||||
Series share transactions (Net of share conversions) (Note 6) | ||||||||
Net proceeds from shares sold | 8,066,733 | 19,643,365 | ||||||
Net asset value of shares issued in reinvestment of dividends and distributions | 3,244,467 | 4,809,055 | ||||||
Cost of shares reacquired | (14,117,662 | ) | (28,562,205 | ) | ||||
Net decrease in net assets from Series share transactions | (2,806,462 | ) | (4,109,785 | ) | ||||
Total increase (decrease) | 1,569,590 | (7,772,583 | ) | |||||
Net Assets | ||||||||
Beginning of period | 176,350,706 | 184,123,289 | ||||||
End of period | $ | 177,920,296 | $ | 176,350,706 | ||||
See Notes to Financial Statements
| Dryden Municipal Series Fund/New Jersey Series | 15 |
Notes to Financial Statements
(Unaudited)
Dryden Municipal Series Fund (the “Fund”), is registered under the Investment Company Act of 1940, as an open-end management investment company. The Fund was organized as a Massachusetts business trust on May 18, 1984, and consists of six series. These financial statements relate only to New Jersey Series (the “Series”). The financial statements of the other series are not presented herein. The assets of each series are invested in separate, independently managed portfolios. The Series commenced investment operations in March 1988.
The Series is diversified and seeks to achieve its investment objective of obtaining the maximum amount of income exempt from federal and New Jersey state income taxes with the minimum of risk by investing in “investment grade” tax-exempt securities whose ratings are within the four highest ratings categories by a nationally recognized statistical rating organization or, if not rated, are of comparable quality. The ability of the issuers of the securities held by the Series to meet their obligations may be affected by economic or political developments in a specific state, industry or region.
Note 1. Accounting Policies
The following is a summary of significant accounting policies followed by the Fund, and the Series, in the preparation of its financial statements.
Securities Valuations: The Fund values municipal securities (including commitments to purchase such securities on a “when-issued” basis) as of the close of trading on the New York Stock Exchange, on the basis of prices provided by a pricing service which uses information with respect to transactions in comparable securities and various relationships between securities in determining values. Securities listed on a securities exchange (other than options on securities and indices) are valued at the last sale price on such exchange on the day of valuation or, if there was no sale on such day, at the mean between the last reported bid and asked prices, or at the last bid price on such day in the absence of an asked price. Securities that are actively traded in the over-the-counter market, including listed securities for which the primary market is believed by Prudential Investments LLC (“PI” or “Manager”) in consultation with the subadvisor, to be over-the-counter, are valued at market value using prices provided, by an independent pricing agent or principal market maker. Futures contracts and options thereon traded on a commodities exchange or board of trade are valued at the last sale price at the close of trading on such exchange or board of trade or, if there was no sale on the applicable commodities exchange or board of trade on such
| 16 | Visit our website at www.jennisondryden.com |
day, at the mean between the most recently quoted prices on such exchange or board of trade or at the last bid price in the absence of an asked price. Securities for which reliable market quotations are not readily available or for which the pricing service does not provide a valuation methodology, or does not present fair value, are valued at fair value in accordance with Board of Trustees’ approved fair valuation procedures.
Short-term securities which mature in sixty days or less are valued at amortized cost, which approximates market value. The amortized cost method involves valuing a security at its cost on the date of purchase and thereafter assuming a constant amortization to maturity of the difference between the principal amount due at maturity and cost. Short-term securities which mature in more than sixty days are valued at current market quotations.
Financial Futures Contracts: A financial futures contract is an agreement to purchase (long) or sell (short) an agreed amount of securities at a set price for delivery on a future date. Upon entering into a financial futures contract, the Series is required to pledge to the broker an amount of cash and/or other assets equal to a certain percentage of the contract amount. This amount is known as the “initial margin.” Subsequent payments, known as “variation margin,” are made or received by the Series each day, depending on the daily fluctuations in the value of the underlying security. Such variation margin is recorded for financial statement purposes on a daily basis as unrealized gain or loss. When the contract expires or is closed, the gain or loss is realized and is presented in the Statement of Operations as net realized gain or loss on financial futures contracts.
The Series invests in financial futures contracts in order to hedge its existing portfolio securities, or securities the Series intends to purchase, against fluctuations in value caused by changes in prevailing interest rates or market conditions. Should interest rates move unexpectedly, the Series may not achieve the anticipated benefits of the financial futures contracts and may realize a loss. The use of futures transactions involves the risk of imperfect correlation in movements in the price of futures contracts, interest rates and the underlying hedged assets.
Options: The Series may either purchase or write options in order to hedge against adverse market movements or fluctuations in value caused by changes in prevailing interest rates with respect to securities which the Series currently owns or intends to purchase. The Series’ principal reason for writing options is to realize, through receipt of premiums, a greater current return than would be realized on the underlying security alone. When the Series purchases an option, it pays a premium and an
| Dryden Municipal Series Fund/New Jersey Series | 17 |
Notes to Financial Statements
(Unaudited) Cont’d
amount equal to that premium is recorded as an asset. When the Series writes an option, it receives a premium and an amount equal to that premium is recorded as a liability. The asset or liability is adjusted daily to reflect the current market value of the option.
If an option expires unexercised, the Series realizes a gain or loss to the extent of the premium received or paid. If an option is exercised, the premium received or paid is recorded as an adjustment to the proceeds from the sale or the cost of the purchase in determining whether the Series has realized a gain or loss. The difference between the premium and the amount received or paid on effecting a closing purchase or sale transaction is also treated as a realized gain or loss. Gain or loss on purchased options is included in net realized gain or loss on investment transactions. Gain or loss on written options is presented separately as net realized gain or loss on written option transactions.
The Series, as writer of an option, may have no control over whether the underlying securities may be sold (called) or purchased (put). As a result, the Series bears the market risk of an unfavorable change in the price of the security underlying the written option. The Series, as purchaser of an option, bears the risk of the potential inability of the counterparties to meet the terms of their contracts.
Interest Rate Swaps: The Series may enter into interest rate swaps. In a simple interest rate swap, one investor pays a floating rate of interest on a notional principal amount and receives a fixed rate of interest on the same notional principal amount for a specified period of time. Alternatively, an investor may pay a fixed rate and receive a floating rate. Net interest payments/receipt are included in interest income in the Statement of Operations. Interest rate swaps were conceived as asset/liability management tools. In more complex swaps, the notional principal amount may decline (or amortize) over time.
During the term of the swap, changes in the value of the swap are recorded as unrealized gains or losses by “marking-to-market” to reflect the market value of the swap. When the swap is terminated, the Series will record a realized gain or loss equal to the difference between the proceeds from (or cost of) the closing transaction and the Series’ basis in the contract, if any.
The Series is exposed to credit loss in the event of non-performance by the other party to the interest rate swap. However, the Series does not anticipate non-performance by any counterparty.
| 18 | Visit our website at www.jennisondryden.com |
Written options, future contracts and swap contracts involve elements of both market and credit risk in excess of the amounts reflected on the Statement of Assets and Liabilities.
Inverse Floaters: The Series invests in variable rate securities commonly called “inverse floaters”. The interest rates on these securities have an inverse relationship to the interest rate of other securities or the value of an index. Changes in interest rate on the other security or index inversely affect the rate paid on the inverse floater, and the inverse floater’s price will be more volatile than that of a fixed-rate bond. Additionally, some of these securities contain a “leverage factor” whereby the interest rate moves inversely by a “factor” to the benchmark rate. Certain interest rate movements and other market factors can substantially affect the liquidity of inverse floating rate notes.
When-Issued/Delayed Delivery Securities: Securities purchased or sold on a when-issued or delayed-delivery basis may be settled a month or more after trade date; interest income is not accrued until settlement date. At the time the Series enters into such transactions, it instructs the custodian to segregate assets with a current value at least equal to the amount of its when-issued or delayed-delivery purchase commitments.
Securities Transactions and Net Investment Income: Securities transactions are recorded on the trade date. Realized gains or losses on sales of securities are calculated on the identified cost basis. Interest income, including amortization of premium and accretion of discount on debt securities, as required, is recorded on the accrual basis. Expenses are recorded on the accrual basis.
Net investment income or loss (other than distribution fees, which are charged directly to the respective class) and realized and unrealized gains or losses are allocated daily to each class of shares based upon the relative proportion of net assets of each class at the beginning of the day.
Federal Income Taxes: For federal income tax purposes, each series in the Fund is treated as a separate taxpaying entity. It is the Series’ policy to continue to meet the requirements of the Internal Revenue Code applicable to regulated investment companies and to distribute all of its taxable net income and capital gains, if any, to its shareholders. Therefore, no federal income tax provision is required.
Dividends and Distributions: The Series declares daily dividends from net investment income. Payment of dividends is made monthly. Distributions of net capital gains, if any, are made annually. Dividends and distributions to shareholders, which are
| Dryden Municipal Series Fund/New Jersey Series | 19 |
Notes to Financial Statements
(Unaudited) Cont’d
determined in accordance with federal income tax regulations and which may differ from generally accepted accounting principles, are recorded on ex-dividend date. Permanent book/tax differences relating to income and gains are reclassified amongst undistributed net investment income, accumulated realized gain or loss and paid-in capital in excess of par, when appropriate.
Custody Fee Credits: The Fund has an arrangement with its custodian bank, whereby uninvested cash earn credits which reduce the fees charged by the custodian. Such custody fee credits are presented as a reduction of gross expenses in the accompanying Statement of Operations.
Estimates: The preparation of the financial statements requires management to make estimates and assumptions that affect the reported amounts and disclosures in the financial statements. Actual results could differ from those estimates.
Note 2. Agreements
The Fund has a management agreement with PI on behalf of the Series. Pursuant to this agreement, PI has responsibility for all investment advisory services and supervises the subadviser’s performance of such services. PI has entered into a subadvisory agreement with Prudential Investment Management, Inc. (“PIM”). The subadvisory agreement provides that PIM furnishes investment advisory services in connection with the management of the Series. In connection therewith, PIM is obligated to keep certain books and records of the Series. PI pays for the services of PIM, the cost of compensation of officers of the Series, occupancy and certain clerical and bookkeeping costs of the Series. The Series bears all other costs and expenses.
The management fee paid to PI is computed daily and payable monthly, at an annual rate of .50 of 1% of the average daily net assets of the Series.
The Series has a distribution agreement with Prudential Investment Management Services LLC (“PIMS”) which acts as distributor of the Series. The Series compensates PIMS for distributing and servicing the Series’ Class A, Class B and Class C shares pursuant to plans of distribution, (the “Class A, B and C Plans”), regardless of expenses actually incurred by PIMS. The distribution fees are accrued daily and payable monthly. No distribution or service fees are paid to PIMS as distributor of the Class Z shares of the Series.
| 20 | Visit our website at www.jennisondryden.com |
Pursuant to the Class A, B and C Plans, the Series compensates PIMS for distribution-related activities at an annual rate of up to .30 of 1%, .50% of 1% and up to 1% of the average daily net assets of the Class A, B and C shares, respectively. For the period ended February 29, 2004, PIMS contractually agreed to limit such fees to .25 of 1% and .75 of 1% of the Class A shares and Class C shares, respectively.
PIMS advised the Series that it has received approximately $21,600 and $5,300 in front-end sales charges resulting from sales of Class A and Class C shares, respectively, during the six months ended February 29, 2004. From these fees, PIMS paid such sales charges to affiliated broker-dealers, which in turn paid commissions to salespersons and incurred other distribution costs.
PIMS has advised the Series that during the six months ended February 29, 2004, it received approximately $25,800 and $100 in contingent deferred sales charges imposed upon certain redemptions by Class B and Class C shareholders, respectively.
PI, PIMS and PIM are indirect, wholly-owned subsidiaries of Prudential Financial, Inc. (“Prudential”).
The Series, along with other affiliated registered investment companies (the “Funds”), is a party to a syndicated credit agreement (“SCA”) with a group of banks. The SCA provides for a commitment of $800 million and allows the Funds to increase the commitment to $1 billion, if necessary. Interest on any borrowings under the SCA will be incurred at market rates. The Funds pay a commitment fee of .08 of 1% of the unused portion of the SCA. The commitment fee is accrued daily and paid quarterly and is allocated to the Funds pro rata, based on net assets. The purpose of the SCA is to serve as an alternative source of funding for capital share redemptions. The expiration date of the SCA is April 30, 2004. Effective May 1, 2004, the commitment will be reduced to $500 million. All other terms and conditions will remain the same. The expiration of the renewed SCA will be October 29, 2004. The Fund did not borrow any amounts pursuant to the SCA during the six months ended February 29, 2004.
Note 3. Other Transactions with Affiliates
Prudential Mutual Fund Services LLC (“PMFS”), an affiliate of PI and an indirect, wholly-owned subsidiary of Prudential, serves as the Fund’s transfer agent. During the six months ended February 29, 2004, the Series incurred fees of approximately $24,500 for the services of PMFS. As of February 29, 2004, approximately $4,000 of such fees were due to PMFS. Transfer agent fees and expenses in the Statement of
| Dryden Municipal Series Fund/New Jersey Series | 21 |
Notes to Financial Statements
(Unaudited) Cont’d
Operations include certain out-of-pocket expenses paid to nonaffiliates, where applicable.
The Series pays networking fees to affiliated and unaffiliated broker/dealers. These networking fees are payments made to broker/dealers that clear mutual fund transactions through a national clearing system. The Series incurred approximately $4,300 in total networking fees, of which the amount relating to the services of Wachovia Securities, LLC (“Wachovia”), an affiliate of PI, was approximately $4,100 for the six months ended February 29, 2004. As of February 29, 2004, approximately $600 of such fees were due to Wachovia. These amounts are included in transfer agent’s fees and expenses in the Statement of Operations.
Note 4. Portfolio Securities
Purchases and sales of portfolio securities of the Series, excluding short-term investments, for the six months ended February 29, 2004, were $23,822,944 and $41,452,059, respectively.
During the six months ended February 29, 2004, the Series entered into financial futures contracts. Details of outstanding contracts at February 29, 2004 were as follows:
| Number of Contracts | Type | Expiration Date | Value at February 29, | Value at Trade Date | Unrealized Depreciation | |||||||||||
| Short Positions: | ||||||||||||||||
| 88 | U.S. Treasury | |||||||||||||||
| 2 Yr Notes | March 2004 | $ | (18,976,375 | ) | $ | (18,923,459 | ) | $ | (52,916 | ) | ||||||
| 22 | U.S. Treasury | |||||||||||||||
| 10 Yr Notes | June 2004 | (2,505,250 | ) | (2,499,181 | ) | (6,069 | ) | |||||||||
| $ | (58,985 | ) | ||||||||||||||
| 22 | Visit our website at www.jennisondryden.com |
Transactions in options written during the six months ended February 29, 2004 were as follows:
| Number of Contracts | Premiums Received | ||||||
Options outstanding as of August 31, 2003 | — | $ | — | ||||
Options written | 51 | 21,618 | |||||
Options expired | (51 | ) | (21,618 | ) | |||
Options outstanding as of February 29, 2004 | — | $ | — | ||||
During the six months ended February 29, 2004, the Series entered into interest rate swap agreements. Details of the swap agreements outstanding as of February 29, 2004 are as follows:
Counterparty | Termination Date | Notional Amount | Fixed Rate | Floating Rate | Unrealized Depreciation | ||||||||
Morgan Stanley Capital Services, Inc.(a) | 04/27/2014 | USD 5,000,000 | 3.491 | % | BMA Municipal Swap Index | $ | (19,254 | ) | |||||
Morgan Stanley Capital Services, Inc.(a) | 04/27/2014 | USD 3,500,000 | 3.571 | % | BMA Municipal Swap Index | (36,100 | ) | ||||||
Morgan Stanley Capital Services, Inc.(a) | 04/27/2014 | USD 3,400,000 | 3.543 | % | BMA Municipal Swap Index | (18,302 | ) | ||||||
| $ | (73,656 | ) | |||||||||||
| (a) | Portfolio pays the fixed rate and receives the floating rate. |
Note 5. Distributions and Tax Information
The United States federal income tax basis of the Series’ investments and the net unrealized appreciation as of February 29, 2004 were as follows:
Tax Basis | Appreciation | Depreciation | Net Unrealized | |||
| $157,885,530 | $14,923,400 | $59,430 | $14,863,970 |
The difference between book and tax basis was primarily attributable to the difference in the treatment of accretion of market discount.
Note 6. Capital
The Series offers Class A, Class B, Class C, and Class Z shares. Class A shares are sold with a front-end sales charge of up to 3%. Class A shares purchased on or after March 15, 2004 will be subject to a maximum initial sales charge of 4%. Effective March 15, 2004, all investors who purchase Class A shares in an amount of $1 million or more
| Dryden Municipal Series Fund/New Jersey Series | 23 |
Notes to Financial Statements
(Unaudited) Cont’d
and sell these shares within 12 months of purchase are subject to a contingent deferred sales charge (CDSC) of 1%, including investors who purchase their shares through broker-dealers affiliated with Prudential. Class B Shares are sold with a CDSC which declines from 5% to zero depending on the period of the time the shares are held. Prior to February 2, 2004 Class C shares were sold with a front-end sales charge of 1% and a CDSC of 1% during the first 18 months. Class C shares purchased on or after February 2, 2004 are not subject to an initial sales charge and the CDSC for Class C shares will be 12 months from the date of purchase. Class B shares automatically convert to Class A shares on a quarterly basis approximately seven years after purchase. A special exchange privilege is also available for shareholders who qualified to purchase Class A shares at net asset value. Class Z shares are not subject to any sales or redemption charge and are offered exclusively for sale to a limited group of investors.
The Series has authorized an unlimited number of shares of beneficial interest of each class at $.01 par value per share.
Transactions in shares of beneficial interest were as follows:
Class A | Shares | Amount | |||||
Six months ended February 29, 2004: | |||||||
Shares sold | 476,891 | $ | 5,339,039 | ||||
Shares issued in reinvestment of dividends and distributions | 220,885 | 2,472,006 | |||||
Shares reacquired | (944,571 | ) | (10,560,039 | ) | |||
Net increase (decrease) in shares outstanding before conversion | (246,795 | ) | (2,748,994 | ) | |||
Shares issued upon conversion from Class B | 135,676 | 1,512,185 | |||||
Net increase (decrease) in shares outstanding | (111,119 | ) | $ | (1,236,809 | ) | ||
Year ended August 31, 2003: | |||||||
Shares sold | 842,096 | $ | 9,551,086 | ||||
Shares issued in reinvestment of dividends and distributions | 325,312 | 3,649,211 | |||||
Shares reacquired | (1,870,865 | ) | (21,125,741 | ) | |||
Net increase (decrease) in shares outstanding before conversion | (703,457 | ) | (7,925,444 | ) | |||
Shares issued upon conversion from Class B | 428,977 | 4,884,211 | |||||
Net increase (decrease) in shares outstanding | (274,480 | ) | $ | (3,041,233 | ) | ||
| 24 | Visit our website at www.jennisondryden.com |
Class B | Shares | Amount | |||||
Six months ended February 29, 2004: | |||||||
Shares sold | 68,768 | $ | 766,901 | ||||
Shares issued in reinvestment of dividends and distributions | 49,099 | 549,771 | |||||
Shares reacquired | (259,420 | ) | (2,895,877 | ) | |||
Net increase (decrease) in shares outstanding before conversion | (141,553 | ) | (1,579,205 | ) | |||
Shares reacquired upon conversion into Class A | (135,554 | ) | (1,512,185 | ) | |||
Net increase (decrease) in shares outstanding | (277,107 | ) | $ | (3,091,390 | ) | ||
Year ended August 31, 2003: | |||||||
Shares sold | 476,802 | $ | 5,360,213 | ||||
Shares issued in reinvestment of dividends and distributions | 81,589 | 915,329 | |||||
Shares reacquired | (420,686 | ) | (4,747,136 | ) | |||
Net increase (decrease) in shares outstanding before conversion | 137,705 | 1,528,406 | |||||
Shares reacquired upon conversion into Class A | (428,874 | ) | (4,884,211 | ) | |||
Net increase (decrease) in shares outstanding | (291,169 | ) | $ | (3,355,805 | ) | ||
Class C | |||||||
Six months ended February 29, 2004: | |||||||
Shares sold | 54,905 | $ | 614,733 | ||||
Shares issued in reinvestment of dividends and distributions | 11,373 | 127,310 | |||||
Shares reacquired | (32,274 | ) | (361,896 | ) | |||
Net increase (decrease) in shares outstanding | 34,004 | $ | 380,147 | ||||
Year ended August 31, 2003: | |||||||
Shares sold | 110,696 | $ | 1,251,580 | ||||
Shares issued in reinvestment of dividends and distributions | 14,718 | 165,064 | |||||
Shares reacquired | (90,758 | ) | (1,019,547 | ) | |||
Net increase (decrease) in shares outstanding | 34,656 | $ | 397,097 | ||||
Class Z | |||||||
Six months ended February 29, 2004: | |||||||
Shares sold | 120,155 | $ | 1,346,060 | ||||
Shares issued in reinvestment of dividends and distributions | 8,457 | 95,380 | |||||
Shares reacquired | (26,565 | ) | (299,850 | ) | |||
Net increase (decrease) in shares outstanding | 102,047 | $ | 1,141,590 | ||||
Year ended August 31, 2003: | |||||||
Shares sold | 306,808 | $ | 3,480,486 | ||||
Shares issued in reinvestment of dividends and distributions | 7,015 | 79,451 | |||||
Shares reacquired | (144,944 | ) | (1,669,781 | ) | |||
Net increase (decrease) in shares outstanding | 168,879 | $ | 1,890,156 | ||||
| Dryden Municipal Series Fund/New Jersey Series | 25 |
Note 7. Change in Independent Auditors
PricewaterhouseCoopers LLP was previously the independent auditors for the Series. The decision to change the independent auditors was approved by the Audit Committee and by the Board of Trustees in a meeting held on September 2, 2003, resulting in KPMG LLP’s appointment as independent auditors of the Fund.
The reports on the financial statements of the Series audited by PricewaterhouseCoopers LLP through the year ended August 31, 2003 did not contain an adverse opinion or disclaimer of opinion, and were not qualified or modified as to uncertainty, audit scope or accounting principles. There were no disagreements between the Series and PricewaterhouseCoopers LLP on any matter of accounting principles or practices, financial statement disclosure, or auditing scope or procedures.
| 26 | Visit our website at www.jennisondryden.com |
This Page Intentionally Left Blank
Financial Highlights
(Unaudited)
| Class A | ||||
| Six Months Ended February 29, 2004 | ||||
Per Share Operating Performance: | ||||
Net Asset Value, Beginning Of Period | $ | 11.02 | ||
Income from investment operations | ||||
Net investment income | .22 | |||
Net realized and unrealized gain (loss) on investment transactions | .39 | |||
Total from investment operations | .61 | |||
Less Distributions | ||||
Dividends from net investment income | (.22 | ) | ||
Distributions in excess of net investment income | — | |||
Tax return of capital distributions | — | |||
Distributions from net realized gains on investment transactions | (.12 | ) | ||
Total distributions | (.34 | ) | ||
Net asset value, end of period | $ | 11.29 | ||
Total Return(a): | 5.71 | % | ||
Ratios/Supplemental Data: | ||||
Net assets, end of period (000) | $ | 136,372 | ||
Average net assets (000) | $ | 136,525 | ||
Ratios to average net assets: | ||||
Expenses, including distribution and service (12b-1) fees(c) | .95 | %(e) | ||
Expenses, excluding distribution and service (12b-1) fees | .70 | %(e) | ||
Net investment income | 4.03 | %(e) | ||
For Class A, B, C and Z shares: | ||||
Portfolio turnover rate | 15 | %(f) | ||
| (a) | Total return does not consider the effects of sales loads. Total return is calculated assuming a purchase of shares on the first day and a sale on the last day of each period reported, and includes reinvestment of dividends and distributions. Total returns for periods of less than one full year are not annualized. |
| (b) | Less than $.005 per share. |
| (c) | The distributor of the Series contractually agreed to limit its distribution and service (12b-1) fees to .25 of 1% on the average daily net assets of the Class A shares. |
| (d) | Effective September 1, 2001, the Series has adopted the provisions of the AICPA Audit and Accounting Guide for Investment Companies and began accreting market discount on debt securities. The effect of this change for the year ended August 31, 2003 was to increase net investment income and decrease net realized and unrealized gains per share by less than $0.005 and increase the ratio of net investment income from 4.80% to 4.81%. Per share amounts and ratios for the years ended prior to August 31, 2002 have not been restated to reflect this change in presentation. |
| (e) | Annualized. |
| (f) | Not annualized. |
See Notes to Financial Statements.
| 28 | Visit our website at www.jennisondryden.com |
| Class A | ||||||||||||||||||
| Year Ended August 31, | ||||||||||||||||||
| 2003 | 2002(d) | 2001 | 2000 | 1999 | ||||||||||||||
| $ | 11.25 | $ | 11.23 | $ | 10.65 | $ | 10.67 | $ | 11.31 | |||||||||
| .47 | .53 | .52 | .52 | .52 | ||||||||||||||
| (.18 | ) | .04 | .58 | .03 | (.55 | ) | ||||||||||||
| .29 | .57 | 1.10 | .55 | (.03 | ) | |||||||||||||
| (.47 | ) | (.53 | ) | (.52 | ) | (.52 | ) | (.52 | ) | |||||||||
| — | — | — | — | — | (b) | |||||||||||||
| — | — | — | — | (b) | — | |||||||||||||
| (.05 | ) | (.02 | ) | — | (.05 | ) | (.09 | ) | ||||||||||
| (.52 | ) | (.55 | ) | (.52 | ) | (.57 | ) | (.61 | ) | |||||||||
| $ | 11.02 | $ | 11.25 | $ | 11.23 | $ | 10.65 | $ | 10.67 | |||||||||
| 2.57 | % | 5.24 | % | 10.67 | % | 5.39 | % | (.40 | )% | |||||||||
| $ | 134,271 | $ | 140,190 | $ | 140,608 | $ | 122,664 | $ | 123,692 | |||||||||
| $ | 139,372 | $ | 137,516 | $ | 132,389 | $ | 122,573 | $ | 125,547 | |||||||||
| .94 | % | .91 | % | .95 | % | .92 | % | .84 | % | |||||||||
| .69 | % | .66 | % | .70 | % | .67 | % | .64 | % | |||||||||
| 4.20 | % | 4.81 | % | 4.77 | % | 4.95 | % | 4.66 | % | |||||||||
| 42 | % | 25 | % | 22 | % | 28 | % | 15 | % | |||||||||
See Notes to Financial Statements.
| Dryden Municipal Series Fund/New Jersey Series | 29 |
Financial Highlights
(Unaudited) Cont’d
| Class B | ||||
| Six Months Ended February 29, 2004 | ||||
Per Share Operating Performance: | ||||
Net Asset Value, Beginning Of Period | $ | 11.02 | ||
Income from investment operations | ||||
Net investment income | .21 | |||
Net realized and unrealized gain (loss) on investment transactions | .40 | |||
Total from investment operations | .61 | |||
Less Distributions | ||||
Dividends from net investment income | (.21 | ) | ||
Distributions in excess of net investment income | — | |||
Tax return of capital distributions | — | |||
Distributions from net realized gains on investment transactions | (.12 | ) | ||
Total distributions | (.33 | ) | ||
Net asset value, end of period | $ | 11.30 | ||
Total Return(a): | 5.58 | % | ||
Ratios/Supplemental Data: | ||||
Net assets, end of period (000) | $ | 30,918 | ||
Average net assets (000) | $ | 31,973 | ||
Ratios to average net assets: | ||||
Expenses, including distribution and service (12b-1) fees | 1.20 | %(d) | ||
Expenses, excluding distribution and service (12b-1) fees | .70 | %(d) | ||
Net investment income | 3.78 | %(d) | ||
| (a) | Total return does not consider the effects of sales loads. Total return is calculated assuming a purchase of shares on the first day and a sale on the last day of each period reported, and includes reinvestment of dividends and distributions. Total returns for periods of less than one full year are not annualized. |
| (b) | Less than $.005 per share. |
| (c) | Effective September 1, 2001, the Series has adopted the provisions of the AICPA Audit and Accounting Guide for Investment Companies and began accreting market discount on debt securities. The effect of this change for the year ended August 31, 2003 was to increase net investment income and decrease net realized and unrealized gains per share by less than $0.005 and increase the ratio of net investment income from 4.55% to 4.56%. Per share amounts and ratios for the years ended prior to August 31, 2002 have not been restated to reflect this change in presentation. |
| (d) | Annualized. |
See Notes to Financial Statements.
| 30 | Visit our website at www.jennisondryden.com |
| Class B | ||||||||||||||||||
| Year Ended August 31, | ||||||||||||||||||
| 2003 | 2002(c) | 2001 | 2000 | 1999 | ||||||||||||||
| $ | 11.25 | $ | 11.24 | $ | 10.66 | $ | 10.67 | $ | 11.31 | |||||||||
| .44 | .50 | .49 | .49 | .49 | ||||||||||||||
| (.18 | ) | .03 | .58 | .04 | (.55 | ) | ||||||||||||
| .26 | .53 | 1.07 | .53 | (.06 | ) | |||||||||||||
| (.44 | ) | (.50 | ) | (.49 | ) | (.49 | ) | (.49 | ) | |||||||||
| — | — | — | — | — | (b) | |||||||||||||
| — | — | — | — | (b) | — | |||||||||||||
| (.05 | ) | (.02 | ) | — | (.05 | ) | (.09 | ) | ||||||||||
| (.49 | ) | (.52 | ) | (.49 | ) | (.54 | ) | (.58 | ) | |||||||||
| $ | 11.02 | $ | 11.25 | $ | 11.24 | $ | 10.66 | $ | 10.67 | |||||||||
| 2.31 | % | 4.98 | % | 10.29 | % | 5.23 | % | (.71 | )% | |||||||||
| $ | 33,217 | $ | 37,188 | $ | 37,621 | $ | 49,995 | $ | 79,598 | |||||||||
| $ | 35,925 | $ | 35,743 | $ | 40,214 | $ | 61,647 | $ | 96,542 | |||||||||
| 1.19 | % | 1.16 | % | 1.20 | % | 1.17 | % | 1.14 | % | |||||||||
| .69 | % | .66 | % | .70 | % | .67 | % | .64 | % | |||||||||
| 3.96 | % | 4.56 | % | 4.52 | % | 4.69 | % | 4.35 | % | |||||||||
See Notes to Financial Statements.
| Dryden Municipal Series Fund/New Jersey Series | 31 |
Financial Highlights
(Unaudited) Cont’d
| Class C | ||||
| Six Months Ended February 29, 2004 | ||||
Per Share Operating Performance: | ||||
Net Asset Value, Beginning Of Period | $ | 11.02 | ||
Income from investment operations | ||||
Net investment income | .20 | |||
Net realized and unrealized gain (loss) on investment transactions | .40 | |||
Total from investment operations | .60 | |||
Less Distributions | ||||
Dividends from net investment income | (.20 | ) | ||
Distributions in excess of net investment income | — | |||
Tax return of capital distributions | — | |||
Distributions from net realized gains on investment transactions | (.12 | ) | ||
Total distributions | (.32 | ) | ||
Net asset value, end of period | $ | 11.30 | ||
Total Return(a): | 5.45 | % | ||
Ratios/Supplemental Data: | ||||
Net assets, end of period (000) | $ | 6,396 | ||
Average net assets (000) | $ | 6,191 | ||
Ratios to average net assets: | ||||
Expenses, including distribution and service (12b-1) fees(d) | 1.45 | %(c) | ||
Expenses, excluding distribution and service (12b-1) fees | .70 | %(c) | ||
Net investment income | 3.52 | %(c) | ||
| (a) | Total return does not consider the effects of sales loads. Total return is calculated assuming a purchase of shares on the first day and a sale on the last day of each period reported, and includes reinvestment of dividends and distributions. Total returns for periods of less than one full year are not annualized. |
| (b) | Less than $.005 per share. |
| (c) | Effective September 1, 2001, the Series has adopted the provisions of the AICPA Audit and Accounting Guide for Investment Companies and began accreting market discount on debt securities. The effect of this change for the year ended August 31, 2003 was to increase net investment income and decrease net realized and unrealized gains per share by less than $0.005 and increase the ratio of net investment income from 4.30% to 4.31%. Per share amounts and ratios for the years ended prior to August 31, 2002 have not been restated to reflect this change in presentation. |
| (c) | Annualized. |
| (d) | The distributor of the Series contractually agreed to limit its distribution and service (12b-1) fees to .75 of 1% on the average daily net assets of the Class C shares. |
See Notes to Financial Statements.
| 32 | Visit our website at www.jennisondryden.com |
| Class C | ||||||||||||||||||
| Year Ended August 31, | ||||||||||||||||||
| 2003 | 2002(c) | 2001 | 2000 | 1999 | ||||||||||||||
| $ | 11.25 | $ | 11.24 | $ | 10.66 | $ | 10.67 | $ | 11.31 | |||||||||
| .42 | .47 | .47 | .47 | .46 | ||||||||||||||
| (.18 | ) | .03 | .58 | .04 | (.55 | ) | ||||||||||||
| .24 | .50 | 1.05 | .51 | (.09 | ) | |||||||||||||
| (.42 | ) | (.47 | ) | (.47 | ) | (.47 | ) | (.46 | ) | |||||||||
| — | — | — | — | — | (b) | |||||||||||||
| — | — | — | — | (b) | — | |||||||||||||
| (.05 | ) | (.02 | ) | — | (.05 | ) | (.09 | ) | ||||||||||
| (.47 | ) | (.49 | ) | (.47 | ) | (.52 | ) | (.55 | ) | |||||||||
| $ | 11.02 | $ | 11.25 | $ | 11.24 | $ | 10.66 | $ | 10.67 | |||||||||
| 2.05 | % | 4.73 | % | 10.02 | % | 4.96 | % | (.95 | )% | |||||||||
| $ | 5,865 | $ | 5,598 | $ | 2,956 | $ | 2,385 | $ | 1,825 | |||||||||
| $ | 6,015 | $ | 4,101 | $ | 2,390 | $ | 2,077 | $ | 1,622 | |||||||||
| 1.44 | % | 1.41 | % | 1.45 | % | 1.42 | % | 1.39 | % | |||||||||
| .69 | % | .66 | % | .70 | % | .67 | % | .64 | % | |||||||||
| 3.70 | % | 4.31 | % | 4.27 | % | 4.45 | % | 4.13 | % | |||||||||
See Notes to Financial Statements.
| Dryden Municipal Series Fund/New Jersey Series | 33 |
Financial Highlights
(Unaudited) Cont’d
| Class Z | ||||
| Six Months Ended February 29, 2004 | ||||
Per Share Operating Performance: | ||||
Net Asset Value, Beginning Of Period | $ | 11.10 | ||
Income from investment operations | ||||
Net investment income | .24 | |||
Net realized and unrealized gain (loss) on investment transactions | .40 | |||
Total from investment operations | .64 | |||
Less Distributions | ||||
Dividends from net investment income | (.24 | ) | ||
Distributions in excess of net investment income | — | |||
Tax return of capital distributions | — | |||
Distributions from net realized gains on investment transactions | (.12 | ) | ||
Total distributions | (.36 | ) | ||
Net asset value, end of period | $ | 11.38 | ||
Total Return(a): | 5.82 | % | ||
Ratios/Supplemental Data: | ||||
Net assets, end of period (000) | $ | 4,234 | ||
Average net assets (000) | $ | 3,894 | ||
Ratios to average net assets: | ||||
Expenses, including distribution and service (12b-1) fees | .70 | %(d) | ||
Expenses, excluding distribution and service (12b-1) fees | .70 | %(d) | ||
Net investment income | 4.26 | %(d) | ||
| (a) | Total return is calculated assuming a purchase of shares on the first day and a sale on the last day of each period reported, and includes reinvestment of dividends and distributions. Total returns for periods of less than on full year are not annualized. |
| (b) | Less than $.005 per share. |
| (c) | Effective September 1, 2001, the Series has adopted the provisions of the AICPA Audit and Accounting Guide for Investment Companies and began accreting market discount on debt securities. The effect of this change for the year ended August 31, 2002 was to increase net investment income and decrease net realized and unrealized gains per share by less than $0.005 and increase the ratio of net investment income from 5.03% to 5.04%. Per share amounts and ratios for the years ended prior to August 31, 2002 have not been restated to reflect this change in presentation. |
| (d) | Annualized. |
See Notes to Financial Statements.
| 34 | Visit our website at www.jennisondryden.com |
| Class Z | ||||||||||||||||||
| Year Ended August 31, | ||||||||||||||||||
| 2003 | 2002(c) | 2001 | 2000 | 1999 | ||||||||||||||
| $ | 11.33 | $ | 11.31 | $ | 10.73 | $ | 10.75 | $ | 11.32 | |||||||||
| .50 | .56 | .55 | .55 | .54 | ||||||||||||||
| (.18 | ) | .04 | .58 | .03 | (.48 | ) | ||||||||||||
| .32 | .60 | 1.13 | .58 | .06 | ||||||||||||||
| (.50 | ) | (.56 | ) | (.55 | ) | (.55 | ) | (.54 | ) | |||||||||
| — | — | — | — | — | (b) | |||||||||||||
| — | — | — | — | (b) | — | |||||||||||||
| (.05 | ) | (.02 | ) | — | (.05 | ) | (.09 | ) | ||||||||||
| (.55 | ) | (.58 | ) | (.55 | ) | (.60 | ) | (.63 | ) | |||||||||
| $ | 11.10 | $ | 11.33 | $ | 11.31 | $ | 10.73 | $ | 10.75 | |||||||||
| 2.84 | % | 5.58 | % | 10.80 | % | 5.66 | % | .45 | % | |||||||||
| $ | 2,998 | $ | 1,147 | $ | 312 | $ | 111 | $ | 62 | |||||||||
| $ | 2,463 | $ | 598 | $ | 194 | $ | 72 | $ | 77 | |||||||||
| .69 | % | .66 | % | .70 | % | .67 | % | .64 | % | |||||||||
| .69 | % | .66 | % | .70 | % | .67 | % | .64 | % | |||||||||
| 4.41 | % | 5.04 | % | 5.03 | % | 5.22 | % | 4.86 | % | |||||||||
See Notes to Financial Statements.
| Dryden Municipal Series Fund/New Jersey Series | 35 |
Supplemental Proxy Information
(Unaudited)
A Special Meeting of Shareholders was held on July 17, 2003, and adjourned to August 21, 2003 and further adjourned to September 12, 2003, October 10, 2003, November 7, 2003, November 21, 2003, December 5, 2003 and January 6, 2004. At such meetings the following proposal was submitted to shareholders for approval:
| (1) | To approve amendments to the Fund’s Declaration of Trust. |
Not approved
| 36 | Visit our website at www.jennisondryden.com |
This Page Intentionally Left Blank
This Page Intentionally Left Blank
| n MAIL | n TELEPHONE | n WEBSITE | ||
Gateway Center Three 100 Mulberry Street Newark, NJ 07102 | (800) 225-1852 | www.jennisondryden.com | ||
PROXY VOTING
The Board of Trustees of the Fund has delegated to the Series’ investment manager the responsibility for voting any proxies and maintaining proxy record keeping with respect to the Series. A description of these proxy voting policies and procedures is available without charge, upon request, by calling (800) 225-1852 or by visiting the SEC’s website at http://www.sec.gov.
TRUSTEES
David E.A. Carson • Robert F. Gunia • Robert E. La Blanc • Douglas H. McCorkindale • Richard A. Redeker • Judy A. Rice • Robin B. Smith • Stephen D. Stoneburn • Clay T. Whitehead
OFFICERS
Judy A. Rice, President • Robert F. Gunia, Vice President • Grace C. Torres, Treasurer and Principal Financial and Accounting Officer • Marguerite E.H. Morrison, Chief Legal Officer and Assistant Secretary • Deborah A. Docs, Secretary • Maryanne Ryan, Anti-Money Laundering Compliance Officer • Lee D. Augsburger, Chief Compliance Officer
| MANAGER | Prudential Investments LLC | Gateway Center Three 100 Mulberry Street Newark, NJ 07102 | ||
| INVESTMENT ADVISER | Prudential Investment Management, Inc. | Gateway Center Two 100 Mulberry Street Newark, NJ 07102 | ||
| DISTRIBUTOR | Prudential Investment Management Services LLC | Gateway Center Three 14th Floor 100 Mulberry Street Newark, NJ 07102 | ||
| CUSTODIAN | State Street Bank and Trust Company | One Heritage Drive North Quincy, MA 02171 | ||
| TRANSFER AGENT | Prudential Mutual Fund Services LLC | PO Box 8098 Philadelphia, PA 19101 | ||
| INDEPENDENT AUDITORS | KPMG LLP | 757 Third Avenue New York, NY 10017 | ||
| FUND COUNSEL | Shearman & Sterling LLP | 599 Lexington Avenue New York, NY 10022 | ||
| Dryden Municipal Series Fund/New Jersey Series | ||||||||||||
| Share Class | A | B | C | Z | ||||||||
NASDAQ | PRNJX | PBNJX | PCNJX | PZNJX | ||||||||
CUSIP | 262468804 | 262468887 | 262468879 | 262468861 | ||||||||
An investor should consider the investment objectives, risks, and charges and expenses of the Series carefully before investing. The prospectus for the Series contains this and other information about the Series. An investor may obtain a prospectus by visiting our website at www.jennisondryden.com or by calling us at (800) 225-1852. The prospectus should be read carefully before investing.
The views expressed in this report and information about the Series’ portfolio holdings are for the period covered by this report and are subject to change thereafter. The accompanying financial statements as of February 29, 2004 were not audited and, accordingly, no auditor’s opinion is expressed on them.
Quantitative Management and Prudential Fixed Income are units of Prudential Investment Management, Inc (PIM). Jennison Associates and PIM are Registered Investment Advisors and Prudential Financial Companies.
Mutual Funds:
| ARE NOT INSURED BY THE FDIC OR ANY FEDERAL GOVERNMENT AGENCY | MAY LOSE VALUE | ARE NOT A DEPOSIT OF OR GUARANTEED BY ANY BANK OR ANY BANK AFFILIATE |
| Dryden Municipal Series Fund/New Jersey Series | ||||||||||||
| Share Class | A | B | C | Z | ||||||||
NASDAQ | PRNJX | PBNJX | PCNJX | PZNJX | ||||||||
CUSIP | 262468804 | 262468887 | 262468879 | 262468861 | ||||||||
MF138E2 IFS-A090100 Ed. 04/2004
Dryden Municipal Series Fund/ New Jersey Money Market Series
| FEBRUARY 29, 2004 | SEMIANNUAL REPORT | |

FUND TYPE
Money market
OBJECTIVE
The highest level of current income that is exempt from New Jersey state and federal income taxes, consistent with liquidity and the preservation of capital
This report is not authorized for distribution to prospective investors unless preceded or accompanied by a current prospectus.
The views expressed in this report and information about the Series’ portfolio holdings are for the period covered by this report and are subject to change thereafter.
JennisonDryden is a registered trademark of The Prudential Insurance Company of America.

Dear Shareholder,
April 19, 2004
As the stock market slowed in the first quarter of 2004 following its particularly strong performance in 2003, some investors still seemed to be watching developments from the sidelines. Though the economy appears sound, given the unsettled global political climate and uncertain job growth in the United States, we can understand that some investors may want to remain cautious. A broadly diversified asset allocation strategy can help protect you against inflation and increase your chances of participating in economic growth. As part of such a strategy, holding a cash reserve in a money market fund can help you meet short-term obligations or deal with emergencies without having to liquidate longer-term assets at what may be an inappropriate time.
We recommend that you develop a diversified asset allocation strategy in consultation with a financial professional who knows you and who understands your reasons for investing, the time you have to reach your goals, and the amount of risk you are comfortable assuming. JennisonDryden mutual funds offer a wide range of investment choices, and your financial professional can help you choose the appropriate funds to implement your strategy.
Whether you are investing for your retirement, your children’s education, or some other purpose, JennisonDryden mutual funds offer the experience, resources, and professional discipline of three leading asset managers that can make a difference for you. JennisonDryden funds are managed by Prudential Investment Management’s public equity and fixed income asset management businesses. The equity funds are managed by Jennison Associates and Quantitative Management. Prudential Fixed Income manages the JennisonDryden fixed income and money market funds.
Thank you for your confidence in JennisonDryden mutual funds.
Sincerely,

Judy A. Rice, President
Dryden Municipal Series Fund/New Jersey Money Market Series
| Dryden Municipal Series Fund/New Jersey Money Market Series | 1 |
Your Series’ Performance
Series objective
The investment objective of the Dryden Municipal Series Fund/New Jersey Money Market Series (the Series) is to provide the highest level of current income that is exempt from New Jersey state and federal income taxes, consistent with liquidity and the preservation of capital. There can be no assurance that the Series will achieve its investment objective.
Yields will fluctuate from time to time, and past performance is not indicative of future results. Current performance may be lower or higher than the performance quoted. An investment in the Series is not insured or guaranteed by the Federal Deposit Insurance Corporation or any other government agency. Although the Series seeks to preserve the value of your investment at $1.00 per share, it is possible to lose money by investing in the Series.
| Series Facts as of 2/29/04 | ||||||||||||||||||||
| 7-Day Current Yield | Net Asset Value (NAV) | Taxable Equivalent Yield* | Weighted Avg. Maturity (WAM) | Net Assets (Millions) | ||||||||||||||||
| @28% | @33% | @35% | ||||||||||||||||||
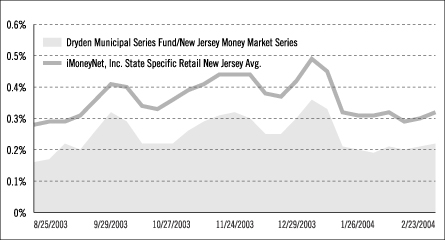
New Jersey Money Market Series | 0.23 | % | $ | 1.00 | 0.34 | % | 0.37 | % | 0.38 | % | 65 Days | $ | 178 | |||||||
iMoneyNet, Inc. State Specific Retail New Jersey Avg.** | 0.32 | % | N/A | 0.47 | % | 0.51 | % | 0.53 | % | 46 Days | N/A | |||||||||
| * | Some investors may be subject to the federal alternative minimum tax and/or state and local taxes. Taxable equivalent yields reflect federal and applicable state tax rates. |
| ** | iMoneyNet, Inc. reports a 7-day current yield and WAM on Mondays for state-specific retail money funds. This is the data of all funds in the iMoneyNet, Inc. State Specific Retail New Jersey Average category as of February 23, 2004, the closest date to the end of our reporting period. |
| 2 | Visit our website at www.jennisondryden.com |
State Specific Money Market Fund Yield Comparison
Weighted Average Maturity Comparison
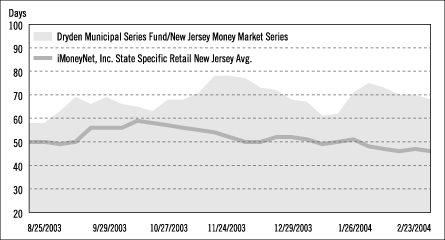
Past performance is not indicative of future results. The graphs portray weekly 7-day current yields and weekly WAMs for the Dryden Municipal Series Fund/New Jersey Money Market Series and the iMoneyNet, Inc. State Specific Retail New Jersey Average every Monday from August 25, 2003 to February 23, 2004, the closest dates to the beginning and end of the Series’ reporting period. The data portrayed for the Series at the end of the reporting period in the graph may not match the data portrayed in the Series Facts table as of February 29, 2004.
| Dryden Municipal Series Fund/New Jersey Money Market Series | 3 |
This Page Intentionally Left Blank
Portfolio of Investments
| FEBRUARY 29, 2004 | SEMIANNUAL REPORT | |
Dryden Municipal Series Fund
New Jersey Money Market Series
Portfolio of Investments
as of February 29, 2004 (Unaudited)
| Description (a) | Moody’s Rating | Interest Rate | Maturity Date | Principal Amount (000) | Value (Note 1) | |||||||
Allendale Brd. Ed., Temp. Nts. | NR | 1.20% | 9/03/04 | $ | 2,391 | $ | 2,392,194 | |||||
Allendale, G.O., Gen., Impvt., M.B.I.A. | Aaa(e) | 2.50 | 7/15/04 | 200 | 201,106 | |||||||
Burlington Cnty., G.O., B.A.N., | NR | 1.12 | 10/29/04 | 4,190 | 4,190,262 | |||||||
Delaware River Port Auth. Pennsylvania & New Jersey Rev., M.E.R.L.O.T., Ser. B4, | VMIG1 | 0.97 | 3/03/04 | 4,000 | 4,000,000 | |||||||
M.E.R.L.O.T., Ser. K, | VMIG1 | 0.97 | 3/03/04 | 3,000 | 3,000,000 | |||||||
Mun. Secs. Trust Rcpts., | A-1+(c) | 1.00 | 3/01/04 | 2,000 | 2,000,000 | |||||||
Galloway Twnshp., B.A.N. | NR | 1.90 | 3/05/04 | 923 | 922,965 | |||||||
Gloucester Cnty. Ind. Poll. | VMIG1 | 0.90 | 3/01/04 | 8,500 | 8,500,000 | |||||||
Hoboken G.O., B.A.N., Ser. A | NR | 2.00 | 12/15/04 | 6,255 | 6,294,121 | |||||||
Hudson Cnty. Impvt. Auth. | A-1+(c) | 0.90 | 3/04/04 | 4,300 | 4,300,000 | |||||||
Irvington Twnshp., | NR | 1.875 | 3/19/04 | 828 | 828,543 | |||||||
G.O., B.A.N. | NR | 1.60 | 10/29/04 | 2,008 | 2,013,394 | |||||||
Lawrence Twnshp., G.O., B.A.N. | NR | 1.375 | 7/15/04 | 4,000 | 4,003,736 | |||||||
Middlesex Cnty. Impvt. Auth. | NR | 2.00 | 1/26/05 | 2,635 | 2,654,779 | |||||||
Montclair, G.O., B.A.N. | NR | 1.25 | 6/25/04 | 4,000 | 4,001,584 | |||||||
Mun. Secs. Trust Cert., G.O., | A-1(c) | 0.97 | 3/01/04 | 1,100 | 1,100,000 | |||||||
New Jersey Hlth. Care Facs. | VMIG1 | 0.92 | 3/04/04 | 1,900 | 1,900,000 | |||||||
Hosp. Cap. Asset Fin., | VMIG1 | 0.92 | 3/04/04 | 4,000 | 4,000,000 | |||||||
Meridian Hlth. Sys., | VMIG1 | 0.90 | 3/04/04 | 6,500 | 6,500,000 | |||||||
Ser. 833, F.R.W.D. | NR | 0.97 | 3/04/04 | 4,000 | 4,000,000 | |||||||
See Notes to Financial Statements.
| 6 | Visit our website at www.jennisondryden.com |
| Description (a) | Moody’s Rating | Interest Rate | Maturity Date | Principal Amount (000) | Value (Note 1) | |||||||
New Jersey St. Econ. Dev. Auth., | A-1(c) | 0.94% | 3/03/04 | $ | 2,400 | $ | 2,400,000 | |||||
AIRIS Newark LLC Proj., F.R.W.D., A.M.B.A.C., A.M.T., | VMIG1 | 0.92 | 3/04/04 | 3,500 | �� | 3,500,000 | ||||||
Alpha Assocs. & Avallone, | A-1(c) | 0.94 | 3/03/04 | 2,140 | 2,140,000 | |||||||
Chambers Cogen, A.M.T., T.E.C.P. | VMIG1 | 0.95 | 5/03/04 | 6,100 | 6,100,000 | |||||||
Commerce Ctr. Proj., Mfg. Facs. | A-1(c) | 0.90 | 3/04/04 | 5,700 | 5,700,000 | |||||||
Dock Facs. Rev., Bayonne/IMTT Proj., Ser. C, F.R.D.D. | VMIG1 | 0.97 | 3/01/04 | 1,600 | 1,600,000 | |||||||
Encap Golf Holdings LLC, | VMIG1(c) | 0.90 | 3/04/04 | 5,000 | 5,000,000 | |||||||
Kent Place Proj., Ser. L, F.R.W.D. | VMIG1 | 0.95 | 3/04/04 | 1,295 | 1,295,000 | |||||||
Keystone Proj., A.M.T., T.E.C.P. | VMIG1 | 0.95 | 5/03/04 | 6,400 | 6,400,000 | |||||||
Oak Hill Academy Proj., | NR | 1.01 | 3/04/04 | 2,135 | 2,135,000 | |||||||
Office Court Assoc. Proj., | A-1(c) | 0.95 | 3/03/04 | 2,300 | 2,300,000 | |||||||
Putters, Ser. 219Z, F.R.W.D. | A-1+(c) | 0.96 | 3/04/04 | 4,570 | 4,570,000 | |||||||
Republic Svcs., Inc. Proj., | A-1+(c) | 0.94 | 3/03/04 | 2,000 | 2,000,000 | |||||||
Rev., El Dorado Terminals, | VMIG1 | 0.97 | 3/01/04 | 2,600 | 2,600,000 | |||||||
SPL Facs. Rev., Port Newark | VMIG1 | 0.99 | 3/03/04 | 8,900 | 8,900,000 | |||||||
Sr. Care Bayshore Hlth., | VMIG1 | 0.90 | 3/04/04 | 1,585 | 1,585,000 | |||||||
Wtr. Facs. Rev., Utd. Wtr. Proj. Inc., Ser. C, F.R.D.D., A.M.B.A.C., A.M.T. | VMIG1 | 1.02 | 3/01/04 | 4,400 | 4,400,000 | |||||||
New Jersey St. Edl. Facs. Auth. Rev., Princeton Univ., | VMIG1 | 0.93 | 3/01/04 | 500 | 500,000 | |||||||
New Jersey St. Hsg. & Mtg. Fin. Agcy. Rev., Home Buyer, | MIG1 | 1.10 | 4/01/04 | 3,000 | 3,000,000 | |||||||
Sngl. Fam. Hsg., Ser. B, A.M.T. | MIG1 | 1.10 | 10/01/04 | 3,000 | 3,000,000 | |||||||
See Notes to Financial Statements.
| Dryden Municipal Series Fund/New Jersey Money Market Series | 7 |
Portfolio of Investments
as of February 29, 2004 (Unaudited) Cont’d.
| Description (a) | Moody’s Rating | Interest Rate | Maturity Date | Principal Amount (000) | Value (Note 1) | |||||||
New Jersey St. Tpke. Auth. | VMIG1 | 0.97% | 3/03/04 | $ | 3,400 | $ | 3,400,000 | |||||
New Jersey St. Trans. Trust Fd. | VMIG1 | 0.97 | 3/03/04 | 2,275 | 2,275,000 | |||||||
Passaic Cnty., G.O., B.A.N. | MIG1 | 1.75 | 6/11/04 | 4,000 | 4,007,712 | |||||||
Paterson Pkg. Auth. Rev., | Aaa(e) | 2.00 | 10/01/04 | 350 | 351,827 | |||||||
Ser. B, F.S.A. | Aaa(e) | 2.00 | 10/01/04 | 160 | 160,835 | |||||||
Ser. C, F.S.A. | Aaa(e) | 2.00 | 10/01/04 | 115 | 115,600 | |||||||
Port Auth. of New York & New Jersey, | VMIG1 | 1.02 | 3/04/04 | 4,000 | 4,000,000 | |||||||
Ser. 93-2, F.R.W.D. | NR | 0.94 | 3/04/04 | 7,000 | 7,000,000 | |||||||
SPL Oblig. Rev., Versatile Structure Oblig., | VMIG1 | 1.02 | 3/01/04 | 1,400 | 1,400,000 | |||||||
SPL Oblig. Rev., Versatile Structure Oblig., | VMIG1 | 1.02 | 3/01/04 | 300 | 300,000 | |||||||
Puerto Rico Elec. Pwr. Auth. | A-1+(c) | 0.91 | 3/03/04 | 2,500 | 2,500,000 | |||||||
Puerto Rico Pub. Fin. Corp., Putters, Ser. 363, A.M.B.A.C. | A-1+(c) | 1.00 | 7/29/04 | 5,000 | 5,000,000 | |||||||
Somerville, G.O., B.A.N. | NR | 1.75 | 8/10/04 | 2,700 | 2,707,681 | |||||||
Tewksbury Twnshp., G.O., B.A.N. | NR | 2.00 | 11/18/04 | 5,760 | 5,793,821 | |||||||
Washington Twnshp. Morris Cnty., B.A.N. | NR | 1.75 | 7/30/04 | 2,250 | 2,256,721 | |||||||
Total short-term investments | 177,196,881 | |||||||||||
Total Investments 99.5% | 177,196,881 | |||||||||||
Other assets in excess of liabilities 0.5% | 914,168 | |||||||||||
Net Assets 100% | $ | 178,111,049 | ||||||||||
See Notes to Financial Statements.
| 8 | Visit our website at www.jennisondryden.com |
| (a) | The following abbreviations are used in the portfolio descriptions: |
A.M.B.A.C.—American Municipal Bond Assurance Corporation.
A.M.T.—Alternative Minimum Tax.
B.A.N.—Bond Anticipation Note.
F.G.I.C.—Financial Guaranty Insurance Company.
F.R.D.D.—Floating Rate (Daily) Demand Note (b).
F.R.W.D.—Floating Rate (Weekly) Demand Note (b).
F.S.A.—Financial Security Assurance.
G.O.—General Obligation.
M.B.I.A.—Municipal Bond Insurance Corporation.
M.E.R.L.O.T.—Municipal Exempt Receipt—Liquid Optional Tender.
T.E.C.P.—Tax-Exempt Commercial Paper.
| (b) | For purposes of amortized cost valuation, the maturity date of Floating Rate Demand Notes is considered to be the later of the next date on which the security can be redeemed at par, or the next date on which the rate of interest is adjusted. |
| (c) | Standard & Poor’s Rating. |
| (d) | The cost of securities for federal income tax purposes is substantially the same as for financial statement purposes. |
| (e) | Long-Term Rating. |
NR—Not Rated by Moody’s or Standard & Poor’s.
The Fund’s current Statement of Additional Information contains a description of Moody’s and Standard & Poor’s ratings.
See Notes to Financial Statements.
| Dryden Municipal Series Fund/New Jersey Money Market Series | 9 |
Statement of Assets and Liabilities
as of February 29, 2004 (Unaudited)
Assets | |||
Investments, at amortized cost which approximates market value | $ | 177,196,881 | |
Cash | 42,034 | ||
Receivable for investments sold | 1,900,000 | ||
Receivable for Series shares sold | 1,853,487 | ||
Interest receivable | 485,919 | ||
Prepaid expenses and other assets | 3,796 | ||
Total assets | 181,482,117 | ||
Liabilities | |||
Payable for Series shares reacquired | 3,232,500 | ||
Management fee payable | 71,643 | ||
Accrued expenses | 34,204 | ||
Distribution fee payable | 17,911 | ||
Deferred trustees’ fees | 10,239 | ||
Dividends payable | 4,571 | ||
Total liabilities | 3,371,068 | ||
Net Assets | $ | 178,111,049 | |
Net assets were comprised of: | |||
Shares of beneficial interest, at $.01 par value | $ | 1,781,110 | |
Paid-in capital in excess of par | 176,329,939 | ||
Net assets, February 29, 2004 | $ | 178,111,049 | |
Net asset value, offering price and redemption price per share | $1.00 | ||
See Notes to Financial Statements.
| 10 | Visit our website at www.jennisondryden.com |
Statement of Operations
Six Months Ended February 29, 2004 (Unaudited)
Net Investment Income | |||
Income | |||
Interest | $ | 936,163 | |
Expenses | |||
Management fee | 444,309 | ||
Distribution fee | 111,077 | ||
Custodian’s fees and expenses | 47,000 | ||
Reports to shareholders | 33,000 | ||
Transfer agent’s fees and expenses | 25,000 | ||
Legal fees and expenses | 20,000 | ||
Registration fees | 15,000 | ||
Audit fee | 7,000 | ||
Trustees’ fees | 6,000 | ||
Miscellaneous | 3,180 | ||
Total expenses | 711,566 | ||
Net investment income | 224,597 | ||
Net realized gain on investment transactions | 18,676 | ||
Net Increase In Net Assets Resulting From Operations | $ | 243,273 | |
See Notes to Financial Statements.
| Dryden Municipal Series Fund/New Jersey Money Market Series | 11 |
Statement of Changes in Net Assets
(Unaudited)
Six Months Ended | Year Ended | |||||||
Increase (Decrease) In Net Assets | ||||||||
Operations | ||||||||
Net investment income | $ | 224,597 | $ | 1,043,742 | ||||
Net realized gain on investment transactions | 18,676 | 22,410 | ||||||
Net increase in net assets resulting from operations | 243,273 | 1,066,152 | ||||||
Dividends and distributions paid to shareholders (Note 1) | (243,273 | ) | (1,066,152 | ) | ||||
Series share transactions (at $1 per share) | ||||||||
Net proceeds from shares sold | 290,214,656 | 620,002,026 | ||||||
Net asset value of shares issued in reinvestment of dividends and distributions | 232,124 | 1,050,580 | ||||||
Cost of shares reacquired | (288,049,341 | ) | (662,702,129 | ) | ||||
Net increase (decrease) in net assets from Series share transactions | 2,397,439 | (41,649,523 | ) | |||||
Total increase (decrease) | 2,397,439 | (41,649,523 | ) | |||||
Net Assets | ||||||||
Beginning of period | 175,713,610 | 217,363,133 | ||||||
End of period | $ | 178,111,049 | $ | 175,713,610 | ||||
See Notes to Financial Statements.
| 12 | Visit our website at www.jennisondryden.com |
Notes to Financial Statements
(Unaudited)
Dryden Municipal Series Fund (the “Fund”), is registered under the Investment Company Act of 1940 as an open-end management investment company. The Fund was organized as a Massachusetts business trust on May 18, 1984 and consists of six series. These financial statements relate to only New Jersey Money Market Series (the “Series”). The financial statements of the other series are not presented herein. The assets of each series are invested in separate, independently managed portfolios. The Series commenced investment operations on December 3, 1990. The Series is non-diversified and seeks to achieve its investment objective of providing the highest level of income that is exempt from New Jersey state and federal income taxes with a minimum of risk by investing in “investment grade” tax-exempt securities maturing within 13 months or less and whose ratings are within the two highest ratings categories by a nationally recognized statistical rating organization, or if not rated, are of comparable quality. The ability of the issuers of the securities held by the Series to meet their obligations may be affected by economic developments in a specific state, industry or region.
Note 1. Accounting Policies
The following is a summary of significant accounting policies followed by the Fund, and the Series, in the preparation of its financial statements.
Securities Valuations: Portfolio securities of the Series are valued at amortized cost, which approximates market value. The amortized cost method involves valuing a security at its cost on the date of purchase and thereafter assuming a constant amortization to maturity of any discount or premium. If the amortized cost method is determined not to represent fair value, the value shall be determined by or under the direction of the Board of Trustees.
Securities Transactions and Net Investment Income: Securities transactions are recorded on the trade date. Realized gains or losses on sales of securities are calculated on the identified cost basis. The Series amortizes premiums and accretes discounts on portfolio securities as adjustments to interest income. Interest income is recorded on the accrual basis.
Federal Income Taxes: For federal income tax purposes, each series in the Fund is treated as a separate taxpaying entity. It is the Series’ policy to continue to meet the requirements of the Internal Revenue Code applicable to regulated investment
| Dryden Municipal Series Fund/New Jersey Money Market Series | 13 |
Notes to Financial Statements
(Unaudited) Cont’d
companies and to distribute all of its net income to shareholders. Therefore, no federal income tax provision is required.
Dividends and distributions: The Series declares daily dividends from net investment income and net realized short-term gains. Payment of dividends is made monthly. Income distributions and capital gain distributions are determined in accordance with income tax regulations which may differ from generally accepted accounting principles.
Custody Fee Credits: The Fund has an arrangement with its custodian bank, whereby uninvested cash earn credits which reduce the fees charged by the custodian. Such custody fee credits are presented as a reduction of gross expenses in the accompanying Statement of Operations.
Estimates: The preparation of the financial statements requires management to make estimates and assumptions that affect the reported amounts and disclosures in the financial statements. Actual results could differ from those estimates.
Note 2. Agreements
The Fund has a management agreement with Prudential Investments LLC (“PI”). Pursuant to this agreement, PI has responsibility for all investment advisory services and supervises the subadviser’s performance of such services. PI has entered into a subadvisory agreement with Prudential Investment Management, Inc. (“PIM”). The subadvisory agreement provides that PIM furnishes investment advisory services in connection with the management of the Series. In connection therewith, PIM is obligated to keep certain books and records of the Series. PI pays for the services of PIM, the cost of compensation of officers of the Series, occupancy and certain clerical and bookkeeping costs of the Series. The Series bears all other costs and expenses.
The management fee paid to PI is computed daily and payable monthly, at an annual rate of .50 of 1% of the average daily net assets of the Series.
| 14 | Visit our website at www.jennisondryden.com |
The Series has a distribution agreement with Prudential Investment Management Services LLC (“PIMS”), which acts as the distributor of the Series. The Series compensates PIMS for distributing and servicing the Series’ shares pursuant to a plan of distribution regardless of expenses actually incurred by PIMS. The Series pays PIMS for distributing and servicing the Series shares pursuant to the plan of distribution at an annual rate of .125 of 1% of the Series’ average daily net assets. The distribution fee is accrued daily and payable monthly.
PI, PIM and PIMS are indirect, wholly-owned subsidiaries of Prudential Financial, Inc. (“Prudential”).
Note 3. Other Transactions with Affiliates
Prudential Mutual Fund Services LLC (“PMFS”), an affiliate of PI and an indirect wholly-owned subsidiary of Prudential, serves as the Series transfer agent and during the six months ended February 29, 2004, the Series incurred fees of approximately $21,000 for the services of PMFS. As of February 29, 2004, approximately $3,400 of such fees were due to PMFS. Transfer agent fees and expenses in the Statement of Operations include certain out-of-pocket expenses paid to non-affiliates, where applicable.
Note 4. Capital
The Series offers Class A shares. The Series may also offer Class S shares. There are no Class S shares currently issued and outstanding.
Note 5. Change in Independent Auditors
PricewaterhouseCoopers LLP was previously the independent auditors for the Fund. The decision to change the independent auditors was approved by the Audit Committee and by the Board of Trustees in a meeting held on September 2, 2003, resulting in KPMG LLP’s appointment as independent auditors of the Fund.
The reports on the financial statements of the Fund audited by PricewaterhouseCoopers LLP through the year ended August 31, 2003 did not contain an adverse opinion or disclaimer of opinion, and were not qualified or modified as to uncertainty, audit scope or accounting principles. There were no disagreements between the Fund and PricewaterhouseCoopers LLP on any matter of accounting principles or practices, financial statement disclosure, or auditing scope or procedures.
| Dryden Municipal Series Fund/New Jersey Money Market Series | 15 |
Financial Highlights
(Unaudited)
| Class A | ||||
| Six Months Ended February 29, 2004 | ||||
Per Share Operating Performance: | ||||
Net Asset Value, Beginning Of Period | $ | 1.00 | ||
Net investment income and net realized gains | 0.00 | (c) | ||
Dividends and distributions | 0.00 | (c) | ||
Net asset value, end of period | $ | 1.00 | ||
Total Return(a): | .14 | % | ||
Ratios/Supplemental Data: | ||||
Net assets, end of period (000) | $ | 178,111 | ||
Average net assets (000) | $ | 178,700 | ||
Ratios to average net assets: | ||||
Expenses, including distribution fee and service (12b-1) fees | .80 | %(b) | ||
Expenses, excluding distribution fee and service (12b-1) fees | .68 | %(b) | ||
Net investment income | .25 | %(b) | ||
| (a) | Total return is calculated assuming a purchase of shares on the first day and a sale on the last day of each period reported and includes reinvestment of dividends and distributions. Total returns for periods less than a full year are not annualized. |
| (b) | Annualized. |
| (c) | Less than $.005 per share. |
See Notes to Financial Statements.
| 16 | Visit our website at www.jennisondryden.com |
| Class A | ||||||||||||||||||
| Year Ended August 31, | ||||||||||||||||||
| 2003 | 2002 | 2001 | 2000 | 1999 | ||||||||||||||
| $ | 1.00 | $ | 1.00 | $ | 1.00 | $ | 1.00 | $ | 1.00 | |||||||||
| .01 | .01 | .03 | .03 | .03 | ||||||||||||||
| (.01 | ) | (.01 | ) | (.03 | ) | (.03 | ) | (.03 | ) | |||||||||
| $ | 1.00 | $ | 1.00 | $ | 1.00 | $ | 1.00 | $ | 1.00 | |||||||||
| .54 | % | 1.10 | % | 2.95 | % | 3.12 | % | 2.52 | % | |||||||||
| $ | 175,714 | $ | 217,363 | $ | 208,550 | $ | 195,460 | $ | 207,004 | |||||||||
| $ | 199,544 | $ | 223,219 | $ | 212,370 | $ | 204,697 | $ | 209,479 | |||||||||
| .77 | % | .74 | % | .73 | % | .72 | % | .72 | % | |||||||||
| .64 | % | .62 | % | .60 | % | .59 | % | .59 | % | |||||||||
| .52 | % | 1.08 | % | 2.87 | % | 3.07 | % | 2.49 | % | |||||||||
See Notes to Financial Statements.
| Dryden Municipal Series Fund/New Jersey Money Market Series | 17 |
Supplemental Proxy Information
(Unaudited)
A special meeting of shareholders was held on July 17, 2003, and adjourned to August 21, 2003 and further adjourned to September 12, 2003, October 12, 2003, November 7, 2003, November 21, 2003 and December 5, 2003. At such meetings the following proposal was submitted to shareholders for approval:
| (5) | To approve amendments to the Company’s Declaration of Trust. |
The results of the proxy solicitation on the preceding matter was:
Not approved.
| 18 | Visit our website at www.jennisondryden.com |
| n MAIL | n TELEPHONE | n WEBSITE | ||
Gateway Center Three 100 Mulberry Street Newark, NJ 07102 | (800) 225-1852 | www.jennisondryden.com | ||
PROXY VOTING
The Board of Trustees of the Fund has delegated to the Series’ investment manager the responsibility for voting any proxies and maintaining proxy recordkeeping with respect to the Series. A description of these proxy voting policies and procedures is available without charge, upon request, by calling (800) 225-1852 or by visiting the SEC’s website at http://www.sec.gov.
TRUSTEES
David E.A. Carson•Robert F. Gunia•Robert E. La Blanc•Douglas H. McCorkindale•Richard A. Redeker•Judy A. Rice•Robin B. Smith•Stephen D. Stoneburn•Clay T. Whitehead
OFFICERS
Judy A. Rice, President•Robert F. Gunia, Vice President•Grace C. Torres, Treasurer and Principal Financial and Accounting Officer•Marguerite E.H. Morrison, Chief Legal Officer and Assistant Secretary•Deborah A. Docs, Secretary•Maryanne Ryan, Anti-Money Laundering Compliance Officer•Lee D. Augsburger, Chief Compliance Officer
| MANAGER | Prudential Investments LLC | Gateway Center Three 100 Mulberry Street Newark, NJ 07102 | ||
| INVESTMENT ADVISER | Prudential Investment Management, Inc. | Gateway Center Two 100 Mulberry Street Newark, NJ 07102 | ||
| DISTRIBUTOR | Prudential Investment Management Services LLC | Gateway Center Three 14th Floor 100 Mulberry Street Newark, NJ 07102 | ||
| CUSTODIAN | State Street Bank and Trust Company | One Heritage Drive North Quincy, MA 02171 | ||
| TRANSFER AGENT | Prudential Mutual Fund Services LLC | PO Box 8098 Philadelphia, PA 19101 | ||
| INDEPENDENT AUDITORS | KPMG LLP | 757 Third Avenue New York, NY 10017 | ||
| FUND COUNSEL | Shearman & Sterling LLP | 599 Lexington Avenue New York, NY 10022 | ||
| Dryden Municipal Series Fund/New Jersey Money Market Series | ||||||||||||
NASDAQ | PNJXX | |||||||||||
CUSIP | 262468606 | |||||||||||
An investor should consider the investment objectives, risks, and charges and expenses of the Series carefully before investing. The prospectus for the Series contains this and other information about the Series. An investor may obtain a prospectus by visiting our website at www.jennisondryden.com or by calling us at (800) 225-1852. The prospectus should be read carefully before investing.
The views expressed in this report and information about the Series’ portfolio holdings are for the period covered by this report and are subject to change thereafter. The accompanying financial statements as of February 29, 2004 were not audited and, accordingly, no auditor’s opinion is expressed on them.
Quantitative Management and Prudential Fixed Income are units of Prudential Investment Management, Inc (PIM). Jennison Associates and PIM are Registered Investment Advisors and Prudential Financial Companies.
Mutual Funds:
| ARE NOT INSURED BY THE FDIC OR ANY FEDERAL GOVERNMENT AGENCY | MAY LOSE VALUE | ARE NOT A DEPOSIT OF OR GUARANTEED BY ANY BANK OR ANY BANK AFFILIATE |
| Dryden Municipal Series Fund/New Jersey Money Market Series | ||||||||
NASDAQ | PNJXX | |||||||
CUSIP | 262468606 | |||||||
MF147E2 IFS-A090103 Ed. 04/2004
Dryden Municipal Series Fund/ New York Series
| FEBRUARY 29, 2004 | SEMIANNUAL REPORT | |

FUND TYPE
Municipal bond
OBJECTIVE
Maximize current income that is exempt from New York State, New York City, and federal income taxes, consistent with the preservation of capital
This report is not authorized for distribution to prospective investors unless preceded or accompanied by a current prospectus.
The views expressed in this report and information about the Series’ portfolio holdings are for the period covered by this report and are subject to change thereafter.
JennisonDryden is a registered trademark of The Prudential Insurance Company of America.

Dear Shareholder,
April 19, 2004
As the stock market slowed in the first quarter of 2004 following its particularly strong performance in 2003, some investors still seemed to be watching developments from the sidelines. Though the economy appears sound, given the unsettled global political climate and uncertain job growth in the United States, we can understand that some investors may want to remain cautious. For those with long-term goals, however, keeping assets in short-term savings and money market accounts may be a losing proposition as meager yields will be eroded by taxes, and even low annual inflation will reduce purchasing power. A broadly diversified asset allocation can help protect you against inflation and increase your chances of participating in economic growth.
We recommend that you develop a diversified asset allocation strategy in consultation with a financial professional who knows you and who understands your reasons for investing, the time you have to reach your goals, and the amount of risk you are comfortable assuming. JennisonDryden mutual funds offer a wide range of investment choices, and your financial professional can help you choose the appropriate funds to implement your strategy.
Whether you are investing for your retirement, your children’s education, or some other purpose, JennisonDryden mutual funds offer the experience, resources, and professional discipline of three leading asset managers that can make a difference for you. JennisonDryden funds are managed by Prudential Investment Management’s public equity and fixed income asset management businesses. The equity funds are managed by Jennison Associates and Quantitative Management. Prudential Fixed Income manages the JennisonDryden fixed income and money market funds.
Thank you for your confidence in JennisonDryden mutual funds.
Sincerely,

Judy A. Rice, President
Dryden Municipal Series Fund/New York Series
| Dryden Municipal Series Fund/New York Series | 1 |
Your Series’ Performance
Series objective
The investment objective of the Dryden Municipal Series Fund/New York Series (the Series) is to maximize current income that is exempt from New York State, New York City, and federal income taxes, consistent with the preservation of capital. There can be no assurance that the Series will achieve its investment objective.
Performance data quoted represents past performance and is not indicative of future results. The investment return and principal value of an investment will fluctuate so that an investor’s shares, when redeemed, may be worth more or less than their original cost. Current performance may be lower or higher than the performance data quoted. An investor may obtain current performance data to the most recent month-end by visiting our website at www.jennisondryden.com or by calling us at (800) 225-1852.
| Cumulative Total Returns1 as of 2/29/04 | |||||||||||||
| Six Months | One Year | Five Years | Ten Years | Since Inception2 | |||||||||
Class A | 5.63 | % | 4.77 | % | 28.78 | % | 72.24% (71.95) | 151.49% (151.07) | |||||
Class B | 5.50 | 4.51 | 27.19 | 66.92 (66.65) | 290.89 (289.59) | ||||||||
Class C | 5.37 | 4.25 | 25.63 | N/A | 66.88 (66.60) | ||||||||
Class Z | 5.76 | 5.03 | 30.49 | N/A | 52.46 (52.33) | ||||||||
Lehman Brothers Municipal Bond Index3 | 6.52 | 6.30 | 34.50 | 86.00 | *** | ||||||||
Lipper NY Muni Debt Funds Avg.4 | 6.42 | 5.95 | 27.78 | 70.39 | **** | ||||||||
| Average Annual Total Returns1 as of 3/31/04 | |||||||||||||
| One Year | Five Years | Ten Years | Since Inception2 | ||||||||||
Class A | 0.21 | % | 4.26 | % | 5.53% | 6.37% | |||||||
Class B | –0.76 | 4.69 | 5.63 | 7.19 | |||||||||
Class C | 2.89 | 4.60 | N/A | 5.37 | |||||||||
Class Z | 4.64 | 5.38 | N/A | 5.85 | |||||||||
Lehman Brothers Municipal Bond Index3 | 5.86 | 6.00 | 6.81 | *** | |||||||||
Lipper NY Muni Debt Funds Avg.4 | 5.45 | 4.89 | 5.89 | **** | |||||||||
| 2 | Visit our website at www.jennisondryden.com |
| Distributions and Yields1 as of 2/29/04 | |||||||||||
| Total Distributions Paid for Six Months | 30-Day SEC Yield | Taxable Equivalent 30-Day Yield5 at Tax Rates of | |||||||||
| 33% | 35% | ||||||||||
Class A | $0.57 | 2.29 | % | 3.70 | % | 3.82 | % | ||||
Class B | $0.55 | 2.11 | 3.41 | 3.52 | |||||||
Class C | $0.54 | 1.86 | 3.01 | 3.10 | |||||||
Class Z | $0.58 | 2.61 | 4.22 | 4.35 | |||||||
1Source: Prudential Investments LLC and Lipper Inc. The cumulative total returns do not take into account applicable sales charges. If reflected, the applicable sales charges would reduce the cumulative total returns performance quoted. The average annual total returns do take into account applicable sales charges. Without the distribution and service (12b-1) fee waiver of 0.05% and 0.25% for Class A and Class C shares respectively, the returns for these classes would have been lower. During the period ended February 29, 2004, the Series charged a maximum front-end sales charge of 3% for Class A shares and a 12b-1 fee of up to 0.30% annually. Effective March 15, 2004, Class A shares are subject to a maximum front-end sales charge of 4.00%, a 12b-1 fee of up to 0.30% annually, and all investors who purchase Class A shares in an amount of $1 million or more and sell these shares within 12 months of purchase are subject to a contingent deferred sales charge (CDSC) of 1%. Class B shares are subject to a declining CDSC of 5%, 4%, 3%, 2%, 1%, and 1% for the first six years respectively after purchase and a 12b-1 fee of up to 0.50% annually. Approximately seven years after purchase, Class B shares will automatically convert to Class A shares on a quarterly basis. During the period ended February 29, 2004, Class C shares were subject to a front-end sales charge of 1%, a CDSC of 1% for shares redeemed within 18 months of purchase, and a 12b-1 fee of up to 1% annually. Class C shares purchased on or after February 2, 2004 are not subject to a front-end sales charge, the CDSC of 1% for Class C shares purchased on or after that date will apply for 12 months from the date of purchase, and the annual 12b-1 fee will remain up to 1%. Class Z shares are not subject to a sales charge or 12b-1 fee. The returns in the tables do not reflect the deduction of taxes that a shareholder would pay on fund distributions or following the redemption of fund shares. Without waiver of fees and/or expense subsidization, the Series’ returns would have been lower, as indicated in parentheses. 2Inception dates: Class A, 1/22/90; Class B, 9/13/84; Class C, 8/1/94; and Class Z, 12/6/96. 3The Lehman Brothers Municipal Bond Index is an unmanaged index of over 39,000 long-term investment-grade municipal bonds. It gives a broad look at how long-term investment-grade municipal bonds have performed. 4Investors cannot invest directly in an index. The Lipper New York (NY) Muni Debt Funds Average (Lipper Average) represents returns based on an average return of all funds in the Lipper NY Muni Debt Funds category for the periods noted. Funds in the Lipper Average limit their assets to those securities that are exempt from taxation in New York.5Taxable equivalent yields reflect federal and applicable state tax rates. The returns for the Lehman Brothers Municipal Bond Index would be lower if they included the effects of sales charges, operating expenses of a mutual fund, or taxes. Returns for the Lipper Average reflect the deduction of operating expenses, but not sales charges or taxes. ***Lehman Brothers Municipal Bond Index Closest Month-End to Inception cumulative total returns as of 2/29/04 are 170.67% for Class A, 396.91% for Class B, 88.34% for Class C, and 56.88% for Class Z. Lehman Brothers Municipal Bond Index Closest Month-End to Inception average annual total returns as of 3/31/04 are 7.26% for Class A, 8.51% for Class B, 6.73% for Class C, and 6.28% for Class Z. ****Lipper Average Closest Month-End to Inception cumulative total returns as of 2/29/04 are 150.63% for Class A, 343.22% for Class B, 75.01% for Class C, and 47.63% for Class Z. Lipper Average Closest Month-End to Inception average annual total returns as of 3/31/04 are 6.63% for Class A, 7.87% for Class B, 5.87% for Class C, and 5.35% for Class Z.
| Dryden Municipal Series Fund/New York Series | 3 |
| Five Largest Issuers expressed as a percentage of net assets as of 2/29/04 | |||
New York State Dorm. Auth. | 8.4 | % | |
New York City TFA | 6.8 | ||
New York City | 6.6 | ||
Metropolitan Trans. Auth. NY | 6.5 | ||
New York State Urban Dev. Corp. | 6.4 | ||
Issuers are subject to change.
| Portfolio Composition expressed as a percentage of net assets as of 2/29/04 | |||
Lease-Backed Certificate of Participation | 25.6 | % | |
Prerefunded | 17.1 | ||
Special Tax/Assessment District | 11.0 | ||
Transportation | 9.1 | ||
General Obligation | 8.3 | ||
Education | 7.5 | ||
Tobacco | 3.9 | ||
Power | 3.0 | ||
Water & Sewer | 2.7 | ||
Other | 2.7 | ||
Healthcare | 2.5 | ||
Corporate-Backed IDB & PCR | 1.6 | ||
Other Muni | 1.6 | ||
Housing | 1.3 | ||
Solid Waste/Resource Recovery | 1.1 | ||
Cash & Equivalents | 1.0 | ||
Portfolio composition is subject to change.
| Credit Quality expressed as a percentage of net assets as of 2/29/04 | |||
Aaa | 34.7 | % | |
Aa | 20.1 | ||
A | 36.9 | ||
Baa | 1.7 | ||
NR | 5.6 | ||
Cash & Equivalents | 1.0 | ||
Source: Moody’s rating, defaulting to S&P when not rated.
Credit quality is subject to change.
| 4 | Visit our website at www.jennisondryden.com |
Portfolio of Investments
| FEBRUARY 29, 2004 | SEMI-ANNUAL REPORT | |
Dryden Municipal Series Fund
New York Series
Portfolio of Investments
as of February 29, 2004 (Unaudited)
| Description (a) | Moody’s Rating | Interest Rate | Maturity Date | Principal Amount (000) | Value (Note 1) | ||||||||
LONG-TERM INVESTMENTS 89.7% | |||||||||||||
Municipal Bonds | |||||||||||||
Brookhaven Ind. Dev. Agcy. Civic Fac. Rev., Mem. Hosp. Med. Ctr., Inc., Ser. A | NR | 8.125% | 11/15/20 | $ | 1,500 | $ | 1,588,500 | ||||||
City of Buffalo, Sch., G.O., | Aaa | 6.00 | 12/01/16 | 1,100 | (e) | 1,328,426 | |||||||
Dutchess Cnty. Ind. Dev. Agcy. Civic Fac. Rev., Bard Coll. | A3 | 5.75 | 8/01/30 | 3,500 | 3,806,810 | ||||||||
Erie Cnty. Ind Dev. Agcy., Sch. Fac. Rev., City of Buffalo Proj., F.S.A. | Aaa | 5.75 | 5/01/24 | 3,000 | 3,403,260 | ||||||||
Islip Res. Rec., Rev., Ser. B, A.M.B.A.C., A.M.T. | Aaa | 7.20 | 7/01/10 | 1,745 | 2,172,647 | ||||||||
Metro. Trans. Auth. Facs. Rev., | |||||||||||||
Commuter Facs., Ser. A, F.G.I.C. | Aaa | 5.60 | 7/01/09 | 500 | (c) | 576,555 | |||||||
Commuter Facs., Ser. A, F.G.I.C. | Aaa | 5.70 | 7/01/10 | 1,000 | (c) | 1,157,260 | |||||||
Trans. Facs. Rev., Ser. A, F.S.A. | Aaa | 5.60 | 7/01/09 | 2,900 | (c) | 3,344,019 | |||||||
Metro. Trans. Auth., New York Svc. Contract, | |||||||||||||
C.A.B.S., Ser. 7, M.B.I.A., E.T.M. | Aaa | Zero | 7/01/08 | 4,500 | 4,099,005 | ||||||||
Ser. A, F.S.A. | Aaa | 5.00 | 11/15/30 | 2,000 | 2,091,860 | ||||||||
Ser. A, M.B.I.A. | Aaa | 5.50 | 7/01/20 | 3,000 | 3,392,850 | ||||||||
Ser. B, M.B.I.A. | Aaa | 5.50 | 7/01/23 | 5,000 | 5,565,250 | ||||||||
Nassau Cnty. New York Interim Fin. Auth., Sales Tax Sec., Ser. A-1, A.M.B.A.C. | Aaa | 5.375 | 11/15/16 | 1,000 | 1,138,830 | ||||||||
New York City Ind. Dev. Agcy., | |||||||||||||
Civic. Fac. Rev., United States Tennis Assoc., Nat’l. Tennis Ctr. Proj., F.S.A. | Aaa | 6.375 | 11/15/14 | 1,000 | 1,056,420 | ||||||||
LaGuardia Assoc., Ltd. Partnership Proj. | NR | 6.00 | 11/01/28 | 2,000 | (g) | 1,297,000 | |||||||
New York City Mun. Fin. Auth., | |||||||||||||
Wtr. & Swr. Sys. Rev., Ser. B | Aa2 | 6.00 | 6/15/33 | 1,615 | (c) | 1,963,081 | |||||||
Wtr. & Swr. Sys. Rev., Ser. B | Aa2 | 6.00 | 6/15/33 | 985 | 1,172,603 | ||||||||
See Notes to Financial Statements.
| 6 | Visit our website at www.jennisondryden.com |
| Description (a) | Moody’s Rating | Interest Rate | Maturity Date | Principal Amount (000) | Value (Note 1) | ||||||||
New York City Mun. Wtr. Auth. Rev., Ser. F | Aa2 | 5.00% | 6/15/29 | $ | 4,000 | $ | 4,155,800 | ||||||
New York City Trans. Auth., Triborough Bridge & Tunnel Auth., A.M.B.A.C. | Aaa | 5.75 | 1/02/20 | 4,760 | 5,457,864 | ||||||||
New York City Trans. Fin. Auth. Rev., Future Tax Sec., | |||||||||||||
Ser. A | Aa2 | 5.50 | 11/01/26 | 2,650 | 3,081,473 | ||||||||
Ser. B | Aa2 | 5.50 | 2/01/17 | 1,920 | 2,156,851 | ||||||||
Ser. B | Aa2 | 5.25 | 8/01/20 | 4,000 | 4,422,480 | ||||||||
Ser. B | Aa2 | 5.25 | 2/01/29 | 2,500 | 2,841,075 | ||||||||
Ser. B | Aa2 | 6.00 | 11/15/29 | 1,000 | (c) | 1,213,400 | |||||||
New York City, G.O., | |||||||||||||
Ser. A | A2 | 6.00 | 5/15/30 | 820 | (c) | 994,988 | |||||||
Ser. A | A2 | 6.00 | 5/15/30 | 180 | 200,466 | ||||||||
Ser. G | A2 | 5.875 | 10/15/14 | 2,500 | 2,832,950 | ||||||||
Ser. I | Aaa | 6.10 | 4/15/10 | 565 | (c) | 648,586 | |||||||
Ser. I | A2 | 6.10 | 4/15/10 | 1,435 | 1,610,257 | ||||||||
Ser. I | Aaa | 6.25 | 4/15/27 | 4,305 | (c) | 4,958,671 | |||||||
Ser. I | A2 | 6.25 | 4/15/27 | 1,695 | 1,894,552 | ||||||||
New York St. Dorm. Auth. Lease Rev., Ser. B | AA-(d) | 5.25 | 7/01/29 | 3,000 | 3,417,030 | ||||||||
New York St. Dorm. Auth. Rev., | |||||||||||||
City Univ. Sys. Cons., F.S.A. | Aaa | 5.50 | 7/01/29 | 2,500 | (c) | 2,936,000 | |||||||
City Univ. Sys. Cons., Ser. B | A3 | 6.00 | 7/01/14 | 4,000 | 4,747,760 | ||||||||
City Univ. Sys. Cons., Ser. D, E.T.M. | A3 | 7.00 | 7/01/09 | 1,880 | 2,119,606 | ||||||||
Coll. & Univ. Ed., M.B.I.A., A.M.T., C.A.B.S. | Aaa | Zero | 7/01/04 | 2,045 | 2,035,675 | ||||||||
Mental Hlth. Svcs. Facs. Impvt., Ser. B | A3 | 6.50 | 8/15/11 | 3,000 | 3,667,140 | ||||||||
Ser. B | A3 | 5.25 | 11/15/23 | 3,000 | 3,406,080 | ||||||||
St. Personal Income-Tax Ed., Ser. A | AA(d) | 5.375 | 3/15/22 | 2,000 | 2,200,660 | ||||||||
New York St. Engy. Res. & Dev. Auth. Rev., Brooklyn Union Gas Co., Ser. B, M.B.I.A., A.M.T. | Aaa | 6.75 | 2/01/24 | 1,825 | (e) | 1,860,788 | |||||||
New York St. Environ. Facs. Corp., | |||||||||||||
Poll. Ctrl. Rev., Ser. E | Aaa | 6.50 | 6/15/14 | 35 | 35,153 | ||||||||
Wtr. Proj., Ser. K | Aaa | 5.25 | 6/15/22 | 3,000 | 3,271,320 | ||||||||
See Notes to Financial Statements.
| Dryden Municipal Series Fund/New York Series | 7 |
Portfolio of Investments
as of February 29, 2004 (Unaudited) Cont’d.
| Description (a) | Moody’s Rating | Interest Rate | Maturity Date | Principal Amount (000) | Value (Note 1) | ||||||||
New York St. Hsg. Fin. Agcy. Rev., | |||||||||||||
Multi-Fam. Hsg., Sec. Mtge., Ser. A, A.M.T. | Aa1 | 7.05% | 8/15/24 | $ | 1,000 | $ | 1,009,290 | ||||||
St. Univ. Constr., Ser. A, E.T.M. | Aaa | 8.00 | 5/01/11 | 3,600 | 4,587,444 | ||||||||
New York St. Local Gov’t. Assist. Corp., | |||||||||||||
C.A.B.S., Ser. C | A1 | Zero | 4/01/14 | 5,882 | 4,090,872 | ||||||||
Ser. E | A1 | 6.00 | 4/01/14 | 3,000 | 3,644,460 | ||||||||
New York St. Med. Care Facs. Fin. Agcy. Rev., New York Hosp., Ser. A, A.M.B.A.C., F.H.A. | Aaa | 6.50 | 8/15/29 | 3,000 | (c) | 3,216,210 | |||||||
New York St. Mtge. Agcy. Rev., Homeowner Mtge., Ser. 70 | Aa1 | 5.375 | 10/01/17 | 1,500 | 1,586,520 | ||||||||
New York St. Mun. Bond Bank Agcy. Spec. Sch. Purp. Rev. Ser. C | A+(d) | 5.50 | 12/01/13 | 5,070 | 5,871,111 | ||||||||
New York St. Pwr. Auth., | |||||||||||||
Ser. A | Aa2 | 5.25 | 11/15/16 | 3,000 | 3,376,920 | ||||||||
Ser. A | Aa2 | 5.00 | 11/15/19 | 2,500 | 2,718,750 | ||||||||
New York St. Thrwy. Auth., | |||||||||||||
Hwy. & Bridge Trust Fund, | Aaa | 6.00 | 4/01/16 | 2,200 | (c) | 2,662,726 | |||||||
St. Pers. Income Tax Rev., Trans., Ser. A | A1 | 5.50 | 3/15/20 | 1,000 | 1,129,350 | ||||||||
Svc. Contract Rev., Local Hwy. & Bridge | A3 | 5.50 | 4/01/15 | 6,000 | 6,789,600 | ||||||||
New York St. Urban Dev. Corp. Corr. & Youth Facs. Svcs., | |||||||||||||
Ser. A | AA-(d) | 5.25 | 1/02/21 | 3,000 | 3,366,540 | ||||||||
Ser. A | A3 | 5.00 | 1/02/09 | 2,000 | 2,236,420 | ||||||||
New York St. Urban Dev. Corp. Rev., Correctional Cap. Facs., A.M.B.A.C. | Aaa | Zero | 1/02/08 | 8,000 | 7,362,960 | ||||||||
Puerto Rico Comnwlth., | |||||||||||||
Pub. Impvt. Rfdg., M.B.I.A. | Aaa | 7.00 | 7/01/10 | 1,250 | 1,572,213 | ||||||||
Rites P.A. 625, A.M.B.A.C., T.C.R.S. | NR | 12.98(f) | 7/01/10 | 3,250 | 4,925,505 | ||||||||
Puerto Rico Pub. Fin. Corp., Comnwlth. Approp., Ser. E | Baa3 | 5.70 | 8/01/25 | 2,000 | 2,207,900 | ||||||||
See Notes to Financial Statements.
| 8 | Visit our website at www.jennisondryden.com |
| Description (a) | Moody’s Rating | Interest Rate | Maturity Date | Principal Amount (000) | Value (Note 1) | |||||||
Tobacco Settlement Fin. Corp. | ||||||||||||
Ser. A-1 | A3 | 5.50% | 6/01/14 | $ | 4,000 | $ | 4,421,600 | |||||
Ser. C-1 | A3 | 5.50 | 6/01/14 | 1,000 | 1,105,400 | |||||||
Ser. C-1 | A3 | 5.50 | 6/01/15 | 2,000 | 2,200,600 | |||||||
United Nations Dev. Corp. NY Rev., Ser. A | A3 | 5.25 | 7/01/13 | 2,320 | 2,477,667 | |||||||
Virgin Islands Pub. Fin. Auth. Rev., Ser. A | BBB(d) | 6.50 | 10/01/24 | 1,000 | 1,146,300 | |||||||
Watervliet Hsg. Auth. Sen. Res., Beltrone Living. Ctr. Proj., Ser. A | NR | 6.125 | 6/01/38 | 4,000 | 3,468,640 | |||||||
Total long-term investments | 182,495,999 | |||||||||||
SHORT-TERM INVESTMENTS 8.4% | ||||||||||||
Mun. Secs. Trust Cert., Ser. 2000-109, Class A, Ctf. 144A, F.R.D.D. | VMIG1 | 0.97 | 3/01/04 | 3,500 | 3,500,000 | |||||||
New York St. Local Govt. Assist. Corp., Mun. Secs. Trust Rcpts., Ser. SGA 59, F.R.D.D. | A-1+(d) | 0.97 | 3/01/04 | 1,800 | 1,800,000 | |||||||
Port Auth. of New York & New Jersey, Spec. Oblig. Rev., Versatile Structure Oblig., Rev., Ser. 4, F.R.D.D., A.M.T. | VMIG1 | 1.02 | 3/01/04 | 8,700 | 8,700,000 | |||||||
Port Auth. of New York And New Jersey, Spec. Oblig. Rev., Versatile Structure Oblig., Rev., Ser. 6, F.R.D.D., A.M.T. | VMIG1 | 1.02 | 3/01/04 | 3,000 | 3,000,000 | |||||||
Total short-term investments | 17,000,000 | |||||||||||
Total Investments 98.1% | 199,495,999 | |||||||||||
Other assets in excess of liabilities 1.9% | 3,894,564 | |||||||||||
Net Assets 100% | $ | 203,390,563 | ||||||||||
See Notes to Financial Statements.
| Dryden Municipal Series Fund/New York Series | 9 |
Portfolio of Investments
as of February 29, 2004 (Unaudited) Cont’d.
| (a) | The following abbreviations are used in portfolio descriptions: |
A.M.B.A.C.—American Municipal Bond Assurance Corporation.
A.M.T.—Alternative Minimum Tax.
C.A.B.S.—Capital Appreciation Bonds.
E.T.M.—Escrowed to Maturity.
F.G.I.C.—Financial Guaranty Insurance Company.
F.H.A.—Federal Housing Administration.
F.R.D.D.—Floating Rate (Daily) Demand Note (b).
F.S.A.—Financial Security Assurance.
G.O.—General Obligation.
M.B.I.A.—Municipal Bond Insurance Corporation.
T.C.R.S.—Transferable Custodial Receipts.
| (b) | For purposes of amortized cost valuation, the maturity date of Floating Rate Demand Notes is considered to be the later of the next date on which the security can be redeemed at par, or the next date on which the rate of interest is adjusted. |
| (c) | Prerefunded issues are secured by escrowed cash and/or direct U.S. guaranteed obligations. |
| (d) | Standard & Poor’s Rating. |
| (e) | Pledged as initial margin for financial futures contracts. |
| (f) | Inverse floating rate bond. The coupon is inversely indexed to a floating interest rate. The rate shown is the rate at period end. |
| (g) | Issuer in default on interest payments, non-income producing security. |
NR—Not Rated by Moody’s or Standard & Poor’s.
The Fund’s current Statement of Additional Information contains a description of Moody’s and Standard & Poor’s ratings.
See Notes to Financial Statements.
| 10 | Visit our website at www.jennisondryden.com |
Financial Statements
| FEBRUARY 29, 2004 | SEMI-ANNUAL REPORT | |
Dryden Municipal Series Fund
New York Series
Statement of Assets and Liabilities
as of February 29, 2004 (Unaudited)
Assets | ||||
Investments, at value (cost $184,111,697) | $ | 199,495,999 | ||
Cash | 59,157 | |||
Receivable for investments sold | 20,365,311 | |||
Interest receivable | 2,167,962 | |||
Receivable for Series shares sold | 13,657 | |||
Other assets | 5,656 | |||
Total assets | 222,107,742 | |||
Liabilities | ||||
Payable for investments purchased | 18,100,000 | |||
Payable for Series shares reacquired | 160,526 | |||
Unrealized depreciation on interest rate swaps | 129,814 | |||
Dividends payable | 81,688 | |||
Management fee payable | 80,400 | |||
Accrued expenses | 76,185 | |||
Distribution fee payable | 46,254 | |||
Due to broker—variation margin | 31,982 | |||
Deferred trustees’ fees | 10,330 | |||
Total liabilities | 18,717,179 | |||
Net Assets | $ | 203,390,563 | ||
Net assets were comprised of: | ||||
Shares of beneficial interest, at par | $ | 169,616 | ||
Paid-in capital in excess of par | 184,973,501 | |||
| 185,143,117 | ||||
Overdistribution of net investment income | (58,345 | ) | ||
Accumulated net realized gain on investments | 3,119,023 | |||
Net unrealized appreciation on investments | 15,186,768 | |||
Net assets, February 29, 2004 | $ | 203,390,563 | ||
See Notes to Financial Statements.
| 12 | Visit our website at www.jennisondryden.com |
Class A | |||
Net asset value and redemption price per share | $ | 11.99 | |
Maximum sales charge (3% of offering price)* | 0.37 | ||
Maximum offering price to public | $ | 12.36 | |
Class B | |||
Net asset value, offering price and redemption price per share | $ | 12.00 | |
Class C | |||
Net asset value and redemption price per share | $ | 12.00 | |
Sales charge (1% of offering price) | 0.12 | ||
Offering price to public | $ | 12.12 | |
Class Z | |||
Net asset value, offering price and redemption price per share | $ | 12.01 | |
| * | Effective March 15, 2004 the maximum sales charge was changed to 4.00% of offering price. |
See Notes to Financial Statements.
| Dryden Municipal Series Fund/New York Series | 13 |
Statement of Operations
Six Months Ended February 29, 2004 (Unaudited)
Net Investment Income | ||||
Income | ||||
Interest | $ | 4,717,769 | ||
Expenses | ||||
Management fee | 513,877 | |||
Distribution fee—Class A | 215,307 | |||
Distribution fee—Class B | 68,210 | |||
Distribution fee—Class C | 12,590 | |||
Custodian’s fees and expenses | 53,000 | |||
Transfer agent’s fees and expenses | 49,000 | |||
Reports to shareholders | 27,000 | |||
Registration fees | 16,000 | |||
Legal fees and expenses | 13,000 | |||
Audit fee | 7,000 | |||
Trustees’ fees | 6,000 | |||
Miscellaneous | 5,486 | |||
Total expenses | 986,470 | |||
Net investment income | 3,731,299 | |||
Realized And Unrealized Gain (Loss) On Investments | ||||
Net realized gain (loss) on: | ||||
Investment transactions | 3,668,833 | |||
Financial futures transactions | 8,952 | |||
Interest rate swaps | (10,467 | ) | ||
Options written | 24,161 | |||
| 3,691,479 | ||||
Net change in unrealized appreciation (depreciation) on: | ||||
Investments transactions | 3,980,579 | |||
Financial futures contracts | (10,980 | ) | ||
Interest rate swaps | (129,814 | ) | ||
| 3,839,785 | ||||
Net gain on investments | 7,531,264 | |||
Net Increase In Net Assets Resulting From Operations | $ | 11,262,563 | ||
See Notes to Financial Statements.
| 14 | Visit our website at www.jennisondryden.com |
Statement of Changes in Net Assets
(Unaudited)
Six Months Ended | Year Ended August 31, 2003 | |||||||
Increase (Decrease) In Net Assets | ||||||||
Operations | ||||||||
Net investment income | $ | 3,731,299 | $ | 8,569,253 | ||||
Net realized gain on investment transactions | 3,691,479 | 5,287,032 | ||||||
Net change in unrealized appreciation (depreciation) on investments | 3,839,785 | (8,882,846 | ) | |||||
Net increase in net assets resulting from operations | 11,262,563 | 4,973,439 | ||||||
Dividends and distributions (Note 1): | ||||||||
Dividends from net investment income | ||||||||
Class A | (3,149,495 | ) | (6,981,339 | ) | ||||
Class B | (465,115 | ) | (1,230,525 | ) | ||||
Class C | (52,946 | ) | (118,783 | ) | ||||
Class Z | (51,992 | ) | (116,951 | ) | ||||
| (3,719,548 | ) | (8,447,598 | ) | |||||
Distributions from net realized gains | ||||||||
Class A | (5,006,915 | ) | (1,825,242 | ) | ||||
Class B | (788,775 | ) | (364,257 | ) | ||||
Class C | (95,966 | ) | (37,637 | ) | ||||
Class Z | (76,835 | ) | (27,200 | ) | ||||
| (5,968,491 | ) | (2,254,336 | ) | |||||
Series share transactions (net of share conversions) (Note 6): | ||||||||
Net proceeds from shares sold | 4,704,249 | 12,827,321 | ||||||
Net asset value of shares issued in reinvestment of dividends and distributions | 6,213,555 | 6,507,736 | ||||||
Cost of shares reacquired | (16,014,692 | ) | (31,056,991 | ) | ||||
Net decrease in net assets from Series share transactions | (5,096,888 | ) | (11,721,934 | ) | ||||
Total decrease | (3,522,364 | ) | (17,450,429 | ) | ||||
Net Assets | ||||||||
Beginning of period | 206,912,927 | 224,363,356 | ||||||
End of period | $ | 203,390,563 | $ | 206,912,927 | ||||
See Notes to Financial Statements.
| Dryden Municipal Series Fund/New York Series | 15 |
Notes to Financial Statements
(Unaudited)
Dryden Municipal Series Fund (the “Fund”), is registered under the Investment Company Act of 1940 as an open-end management investment company. The Fund was organized as a Massachusetts business trust on May 18, 1984 and consists of six series. These financial statements relate only to New York Series (the “Series”). The financial statements of the other series are not presented herein. The assets of each series are invested in separate, independently managed portfolios. The Series commenced investment operations in September 1984. The Series is diversified and its investment objective is to maximize current income that is exempt from New York State, New York City and federal income taxes consistent with the preservation of capital, and in conjunction therewith, the Series may invest in debt securities with the potential for capital gain. The Series seeks to achieve the objective by investing primarily in New York State, municipal and local government obligations and obligations of other qualifying issuers. The ability of the issuers of the securities held by the Series to meet their obligations may be affected by economic developments in a specific state, industry or region.
Note 1. Accounting Policies
The following is a summary of significant accounting policies followed by the Fund, and the Series, in the preparation of its financial statements.
Securities Valuation: The Fund values municipal securities (including commitments to purchase such securities on a “when-issued” basis) as of the close of trading on the New York Stock Exchange, on the basis of prices provided by a pricing service which uses information with respect to transactions in comparable securities and various relationships between securities in determining values. Securities listed on a securities exchange (other than options on securities and indices) are valued at the last sale price on such exchange on the day of valuation or, if there was no sale on such day, at the mean between the last reported bid and asked prices, or at the last bid price on such day in the absence of an asked price. Securities that are actively traded in the over-the-counter market, including listed securities for which the primary market is believed by Prudential Investments LLC (“PI” or “Manager”) in consultation with the subadviser, to be over-the-counter, are valued at market value using prices provided, by an independent pricing agent or principal market maker. Futures contracts and options thereon traded on a commodities exchange or board of trade are valued at the last sale price at the close of trading on such exchange or board of trade or, if there was no sale on the applicable commodities exchange or board of trade on such
��
| 16 | Visit our website at www.jennisondryden.com |
day, at the mean between the most recently quoted prices on such exchange or board of trade or at the last bid price in the absence of an asked price. Securities for which reliable market quotations are not readily available or for which the pricing agent or market maker does not provide a valuation or methodology, or provides a valuation or methodology that, in the judgement of the subadviser, does not represent fair value, are valued at fair value in accordance with Board of Trustee’s approved fair valuation procedures.
Short-term securities which mature in sixty days or less are valued at amortized cost, which approximates market value. The amortized cost method involves valuing a security at its cost on the date of purchase and thereafter assuming a constant amortization to maturity of the difference between the principal amount due at maturity and cost. Short-term securities which mature in more than sixty days are valued at current market quotations.
Financial Futures Contracts: A financial futures contract is an agreement to purchase (long) or sell (short) an agreed amount of securities at a set price for delivery on a future date. Upon entering into a financial futures contract, the Series is required to pledge to the broker an amount of cash and/or other assets equal to a certain percentage of the contract amount. This amount is known as the “initial margin.” Subsequent payments, known as “variation margin,” are made or received by the Series each day, depending on the daily fluctuations in the value of the underlying security. Such variation margin is recorded for financial statement purposes on a daily basis as unrealized gain or loss. When the contract expires or is closed, the gain or loss is realized and is presented in the Statement of Operations as net realized gain or loss on financial futures transactions.
The Series invests in financial futures contracts in order to hedge its existing portfolio securities, or securities the Series intends to purchase, against fluctuations in value caused by changes in prevailing interest rates or market conditions. Should interest rates move unexpectedly, the Series may not achieve the anticipated benefits of the financial futures contracts and may realize a loss. The use of futures transactions involves the risk of imperfect correlation in movements in the price of futures contracts, interest rates and the underlying hedged assets.
Options: The Series may either purchase or write options in order to hedge against adverse market movements or fluctuations in value caused by changes in prevailing interest rates with respect to securities which the Series currently owns or intends to purchase. The Series’ principal reason for writing options is to realize, through receipt of premiums, a greater current return than would be realized on the underlying security alone. When the Series purchases an option, it pays a premium and an
| Dryden Municipal Series Fund/New York Series | 17 |
Notes to Financial Statements
(Unaudited) Cont’d
amount equal to that premium is recorded as an asset. When the Series writes an option, it receives a premium and an amount equal to that premium is recorded as a liability. The asset or liability is adjusted daily to reflect the current market value of the option. If an option expires unexercised, the Series realizes a gain or loss to the extent of the premium received or paid. If an option is exercised, the premium received or paid is recorded as an adjustment to the proceeds from the sale or the cost of the purchase in determining whether the Series has realized a gain or loss. The difference between the premium and the amount received or paid on effecting a closing purchase or sale transaction is also treated as a realized gain or loss. Gain or loss on purchased options is included in net realized gain or loss on investment transactions. Gain or loss on written options is presented separately as net realized gain or loss on written option transactions.
The Series, as writer of an option, may have no control over whether the underlying securities may be sold (called) or purchased (put). As a result, the Series bears the market risk of an unfavorable change in the price of the security underlying the written option. The Series, as purchaser of an option, bears the risk of the potential inability of the counterparties to meet the terms of their contracts.
Interest Rate Swaps: The Series may enter into interest rate swaps. In a simple interest rate swap, one investor pays a floating rate of interest on a notional principal amount and receives a fixed rate of interest on the same notional principal amount for a specified period of time. Alternatively, an investor may pay a fixed rate and receive a floating rate. Net interest payments/receipts are included in interest income in the Statement of Operations. Interest rate swaps were conceived as asset/liability management tools. In more complex swaps, the notional principal amount may decline (or amortize) over time.
During the term of the swap, changes in the value of the swap are recorded as unrealized gains or losses by “marking-to-market” to reflect the market value of the swap. When the swap is terminated, the Series will record a realized gain or loss equal to the difference between the proceeds from (or cost of) the closing transaction and the Series’ basis in the contract, if any.
The Series is exposed to credit risk in the event of non-performance by the other party to the interest rate swap. However, the Series does not anticipate non-performance by any counterparty.
| 18 | Visit our website at www.jennisondryden.com |
Written options, future contracts and swap contracts involve elements of both market and credit risk in excess of the amounts reflected in the Statement of Assets and Liabilities.
Inverse Floaters: The Series invests in variable rate securities commonly called “inverse floaters”. The interest rates on these securities have an inverse relationship to the interest rate of other securities or the value of an index. Changes in interest rates on the other security or index inversely affect the rate paid on the inverse floater, and the inverse floater’s price will be more volatile than that of a fixed-rate bond. Additionally, some of these securities contain a “leverage factor” whereby the interest rate moves inversely by a “factor” to the benchmark rate. Certain interest rate movements and other market factors can substantially affect the liquidity of inverse floating rate notes.
Securities Transactions and Net Investment Income: Securities transactions are recorded on the trade date. Realized gains or losses on sales of securities are calculated on the identified cost basis. Interest income, including amortization of premium and accretion of discount on debt securities, as required, is recorded on the accrual basis. Expenses are recorded on the accrual basis which may require the use of certain estimates by management.
Net investment income (loss) (other than distribution fees, which are charged directly to the respective class) and unrealized and realized gains or losses are allocated daily to each class of shares based upon the relative proportion of net assets of each class at the beginning of the day.
Federal Income Taxes: For federal income tax purposes, each series in the Fund is treated as a separate taxpaying entity. It is the Series’ policy to continue to meet the requirements of the Internal Revenue Code applicable to regulated investment companies and to distribute all of its net income and capital gains, if any, to its shareholders. Therefore, no federal income tax provision is required.
Dividends and Distributions: The Series declares daily dividends from net investment income. Payment of dividends is made monthly. Distributions of net capital gains, if any, are made annually. Dividends and distributions to shareholders, which are determined in accordance with federal income tax regulations which may differ from generally accepted accounting principles, are recorded on the ex-dividend date. Permanent book/tax differences relating to income and gains are reclassified amongst undistributed net investment income, accumulated net realized gain or loss and paid in capital in excess of par, as appropriate.
| Dryden Municipal Series Fund/New York Series | 19 |
Notes to Financial Statements
(Unaudited) Cont’d
Custody Fee Credits: The Fund has an arrangement with its custodian bank, whereby uninvested assets earn credits which reduce the fees charged by the custodian. Such custody fee credits are presented as a reduction of gross expenses in the accompanying Statement of Operations.
Estimates: The preparation of the financial statements requires management to make estimates and assumptions that affect the reported amounts and disclosures in the financial statements. Actual results could differ from those estimates.
Note 2. Agreements
The Fund has a management agreement with PI. Pursuant to this agreement, PI has responsibility for all investment advisory services and supervises the subadviser’s performance of such services. PI has entered into a subadvisory agreement with Prudential Investment Management, Inc. (“PIM”). The subadvisory agreement provides that PIM furnishes investment advisory services in connection with the management of the Series. In connection therewith, PIM is obligated to keep certain books and records of the Series. PI pays for the services of PIM, the cost of compensation of officers of the Series, occupancy and certain clerical and bookkeeping costs of the Series. The Series bears all other costs and expenses.
The management fee paid PI is computed daily and payable monthly, at an annual rate of ..50 of 1% of the average daily net assets of the Series.
The Series has a distribution agreement with Prudential Investment Management Services LLC (“PIMS”), which acts as the distributor of the Series. The Series compensates PIMS for distributing and servicing the Series’ Class A, Class B and Class C shares, pursuant to a plan of distribution, (the “Class A, B and C Plans”), regardless of expenses actually incurred by PIMS. The distribution fees are accrued daily and payable monthly. No distribution or service fees are paid to PIMS as distributor of the Class Z shares of the Series.
Pursuant to the Class A, B and C Plans, the Series compensates PIMS for distribution-related activities at an annual rate of up to .30 of 1%, .50 of 1% and up to 1% of the average daily net assets of the Class A, B and C shares, respectively. PIMS contractually agreed to limit such fees to .25 of 1% and .75 of 1% Class A and Class C shares, respectively.
| 20 | Visit our website at www.jennisondryden.com |
PIMS has advised the Series that it received approximately $11,300 and $1,500 in front-end sales charges resulting from sales of Class A and Class C shares, respectively, for the six months ended February 29, 2004. From these fees, PIMS paid such sales charges to dealers, which in turn paid commissions to salespersons and incurred other distribution costs.
PIMS has advised the Series that for the six months ended February 29, 2004, it received approximately $35,000 and $1,300 in contingent deferred sales charges imposed upon certain redemptions by Class B and C shareholders, respectively.
PI, PIM and PIMS are indirect, wholly-owned subsidiaries of Prudential Financial, Inc. (“Prudential”).
The Series, along with other affiliated registered investment companies (the “Funds”), is a party to a syndicated credit agreement (“SCA”) with a group of banks. For the six months ended February 29, 2004 the SCA provides for a commitment of $800 million and allows the Funds to increase the commitment to $1 billion, if necessary. Interest on any borrowings under the SCA will be incurred at market rates. The Funds pay a commitment fee of .08 of 1% of the unused portion of the SCA. The commitment fee is accrued daily and paid quarterly and is allocated to the Funds pro rata, based on net assets. The purpose of the SCA is to serve as an alternative source of funding to facilitate capital share redemptions. The expiration date of the SCA is April 30, 2004. Effective May 1, 2004, the commitment will be reduced to $500 million. All other terms and conditions will remain the same. The expiration of the renewed SCA will be October 29, 2004. The Series did not borrow any amounts pursuant to the SCA during the six months ended February 29, 2004.
Note 3. Other Transactions with Affiliates
Prudential Mutual Fund Services LLC (“PMFS”), an affiliate of PI and an indirect, wholly-owned subsidiary of Prudential, serves as the Fund’s transfer agent. During the six months ended February 29, 2004, the Series incurred fees of approximately $32,400 for the services of PMFS. As of February 29, 2004, approximately $5,200 of such fees were due to PMFS. Transfer agent fees and expenses in the Statement of Operations include certain out-of-pocket expenses paid to nonaffiliates, where applicable.
The Fund pays networking fees to affiliated and unaffiliated broker/dealers. These networking fees are payments made to broker/dealers that clear mutual fund transactions through a national clearing system. The Series incurred approximately $4,000 in total networking fees, of which the amount relating to the services of
| Dryden Municipal Series Fund/New York Series | 21 |
Notes to Financial Statements
(Unaudited) Cont’d
Wachovia Securities, LLC (“Wachovia”), an affiliate of PI, was approximately $3,200 for the six months ended February 29, 2004. As of February 29, 2004 approximately $600 of such fees were due to Wachovia. These amounts are included in transfer agent’s fees and expenses in the Statement of Operations.
Note 4. Portfolio Securities
Purchases and sales of investment securities, other than short-term investments for the six months ended February 29, 2004, aggregated $59,673,012 and $88,004,299, respectively.
During the six months ended February 29, 2004, the Series entered into financial futures contracts. Details of outstanding contracts at February 29, 2004 were as follows:
| Number of Contracts | Type | Expiration Date | Value at February | Value at Trade Date | Unrealized (Depreciation) | |||||||||
| Short Position: | ||||||||||||||
| 100 | U.S. Treasury 2 Yr Notes | Mar. 04 | $ | 21,564,063 | $ | 21,504,111 | $ | (59,952 | ) | |||||
| 27 | U.S. Treasury 10 Yr Notes | Jun. 04 | 3,074,625 | 3,066,857 | (7,768 | ) | ||||||||
| $ | (67,720 | ) | ||||||||||||
Transactions in options written during the six months ended February 29, 2004 were as follows:
| Number of Contracts | Premiums Received | ||||||
Options outstanding as of August 31, 2003 | — | $ | — | ||||
Options written | 57 | 24,161 | |||||
Options expired | (57 | ) | (24,161 | ) | |||
Options outstanding as of February 29, 2004 | — | $ | — | ||||
| 22 | Visit our website at www.jennisondryden.com |
During the six months ended February 29, 2004, the Series entered into interest rate swap agreements. Details of the swap agreements outstanding as of February 29, 2004 were as follows:
Counterparty | Termination Date | Notional Amount | Fixed Rate | Floating Rate | Unrealized Depreciation | |||||||||
| Morgan Stanley Capital Services, Inc.(a) | 04/27/14 | $ | 8,400,000 | 3.571 | % | BMA Municipal Swap Index | $ | (86,639 | ) | |||||
| Morgan Stanley Capital Services, Inc.(a) | 04/27/14 | $ | 5,900,000 | 3.491 | % | BMA Municipal Swap Index | (22,720 | ) | ||||||
| Morgan Stanley Capital Services, Inc.(a) | 05/27/14 | $ | 3,800,000 | 3.543 | % | BMA Municipal Swap Index | (20,455 | ) | ||||||
| $ | (129,814 | ) | ||||||||||||
| (a) | Portfolio pays the fixed rate and receives the floating rate. |
Note 5. Tax Information
The United States federal income tax basis of the Series’ investments and unrealized appreciation as of February 29, 2004 were as follows:
Tax Basis of Investments | Appreciation | Depreciation | Net Unrealized | |||
| $183,993,522 | $16,698,496 | $1,196,019 | $15,502,477 |
The difference between book basis and tax basis is primarily attributable to the difference in the treatment of market discount for book and tax purposes.
Note 6. Capital
The Series offers Class A, Class B, Class C and Class Z shares. Class A shares are sold with a front-end sales charge of up to 3%. Class A shares purchased on or after March 15, 2004 will be subject to a maximum front-end sales charge of 4%. Effective on March 15, 2004, all investors who purchase Class A shares in an amount of $1 million or more and sell these shares within 12 months of purchase are subject to a contingent deferred sales charge (CDSC) of 1%, including investors who purchase their shares through broker-dealers affiliated with Prudential Class B shares are sold with a CDSC which declines from 5% to zero depending on the period of time shares are held. Prior to February 2, 2004, Class C shares were sold with a front-end sales charge of 1% and a CDSC of 1% during the first 18 months. Class C shares purchased on or after February 2, 2004 are not subject to an initial sales charge and the CDSC for Class C shares will be 12 months from the date of purchase. Class B shares automatically convert to Class A shares on a quarterly basis approximately seven
| Dryden Municipal Series Fund/New York Series | 23 |
Notes to Financial Statements
(Unaudited) Cont’d
years after purchase. Class Z shares are not subject to any sales or redemption charge and are offered exclusively for sale to a limited group of investors.
The Series has authorized an unlimited number of shares of beneficial interest of each class at $.01 par value per share.
Transactions in shares of beneficial interest were as follows:
Class A | Shares | Amount | |||||
Six months ended February 29, 2004: | |||||||
Shares sold | 268,018 | $ | 3,217,669 | ||||
Shares issued in reinvestment of dividends and distributions | 442,743 | 5,256,359 | |||||
Shares reacquired | (1,081,675 | ) | (12,917,124 | ) | |||
Net increase (decrease) in shares outstanding before conversion | (370,914 | ) | (4,443,096 | ) | |||
Shares issued upon conversion from Class B | 192,340 | 2,298,379 | |||||
Net increase (decrease) in shares outstanding | (178,574 | ) | $ | (2,144,717 | ) | ||
Year ended August 31, 2003: | |||||||
Shares sold | 486,607 | $ | 5,923,412 | ||||
Shares issued in reinvestment of dividends and distributions | 441,595 | 5,342,907 | |||||
Shares reacquired | (1,883,674 | ) | (22,889,663 | ) | |||
Net increase (decrease) in shares outstanding before conversion | (955,472 | ) | (11,623,344 | ) | |||
Shares issued upon conversion from Class B | 480,744 | 5,928,403 | |||||
Net increase (decrease) in shares outstanding | (474,728 | ) | $ | (5,694,941 | ) | ||
Class B | |||||||
Six months ended February 29, 2004: | |||||||
Shares sold | 70,879 | $ | 846,846 | ||||
Shares issued in reinvestment of dividends and distributions | 63,909 | 759,469 | |||||
Shares reacquired | (212,498 | ) | (2,549,933 | ) | |||
Net increase (decrease) in shares outstanding before conversion | (77,710 | ) | (943,618 | ) | |||
Shares reacquired upon conversion into Class A | (192,179 | ) | (2,298,379 | ) | |||
Net increase (decrease) in shares outstanding | (269,889 | ) | $ | (3,241,997 | ) | ||
Year ended August 31, 2003: | |||||||
Shares sold | 369,021 | $ | 4,504,517 | ||||
Shares issued in reinvestment of dividends and distributions | 79,333 | 960,518 | |||||
Shares reacquired | (425,816 | ) | (5,178,267 | ) | |||
Net increase (decrease) in shares outstanding before conversion | 22,538 | 286,768 | |||||
Shares reacquired upon conversion into Class A | (480,355 | ) | (5,928,403 | ) | |||
Net increase (decrease) in shares outstanding | (457,817 | ) | $ | (5,641,635 | ) | ||
| 24 | Visit our website at www.jennisondryden.com |
Class C | Shares | Amount | |||||
Six months ended February 29, 2004: | |||||||
Shares sold | 15,445 | $ | 184,295 | ||||
Shares issued in reinvestment of dividends and distributions | 9,433 | 112,068 | |||||
Shares reacquired | (13,382 | ) | (159,715 | ) | |||
Net increase (decrease) in shares outstanding | 11,496 | $ | 136,648 | ||||
Year ended August 31, 2003: | |||||||
Shares sold | 66,803 | $ | 816,081 | ||||
Shares issued in reinvestment of dividends and distributions | 9,151 | 110,704 | |||||
Shares reacquired | (82,174 | ) | (1,001,598 | ) | |||
Net increase (decrease) in shares outstanding | (6,220 | ) | $ | (74,813 | ) | ||
Class Z | |||||||
Six months ended February 29, 2004: | |||||||
Shares sold | 38,284 | $ | 455,439 | ||||
Shares issued in reinvestment of dividends and distributions | 7,201 | 85,659 | |||||
Shares reacquired | (32,604 | ) | (387,920 | ) | |||
Net increase (decrease) in shares outstanding | 12,881 | $ | 153,178 | ||||
Year ended August 31, 2003: | |||||||
Shares sold | 129,684 | $ | 1,583,311 | ||||
Shares issued in reinvestment of dividends and distributions | 7,720 | 93,607 | |||||
Shares reacquired | (163,487 | ) | (1,987,463 | ) | |||
Net increase (decrease) in shares outstanding | (26,083 | ) | $ | (310,545 | ) | ||
Note 7. Change in Independent Auditors
PricewaterhouseCoopers LLP was previously the independent auditors for the Fund. The decision to change the independent auditors was approved by the Audit Committee and by the Board of Trustees in a meeting held on September 2, 2003, resulting in KPMG LLP’s appointment as independent auditors of the Fund.
The reports on the financial statements of the Fund audited by PricewaterhouseCoopers LLP through the year ended August 31, 2003 did not contain an adverse opinion or disclaimer of opinion, and were not qualified or modified as to uncertainty, audit scope or accounting principles. There were no disagreements between the Fund and PricewaterhouseCoopers LLP on any matter of accounting principles or practices, financial statement disclosure, or auditing scope or procedures.
| Dryden Municipal Series Fund/New York Series | 25 |
Financial Highlights
(Unaudited)
| Class A | ||||
| Six Months Ended February 29, 2004 | ||||
Per Share Operating Performance: | ||||
Net Asset Value, Beginning Of Period | $ | 11.90 | ||
Income from investment operations | ||||
Net investment income | .22 | |||
Net realized and unrealized gain (loss) on investment transactions | .44 | |||
Total from investment operations | .66 | |||
Less Distributions | ||||
Dividends from net investment income | (.22 | ) | ||
Distributions from net realized gains | (.35 | ) | ||
Distributions in excess of net realized gains | — | |||
Total distributions | (.57 | ) | ||
Net asset value, end of period | $ | 11.99 | ||
Total Return(a): | 5.63 | % | ||
Ratios/Supplemental Data: | ||||
Net assets, end of period (000) | $ | 170,730 | ||
Average net assets (000) | $ | 173,192 | ||
Ratios to average net assets: | ||||
Expenses, including distribution and service (12b-1) fees (c) | .92 | %(d) | ||
Expenses, excluding distribution and service (12b-1) fees | .67 | %(d) | ||
Net investment income | 3.67 | %(d) | ||
For Class A, B, C and Z shares: | ||||
Portfolio turnover rate | 32 | %(e) | ||
| (a) | Total return does not consider the effects of sales loads. Total return is calculated assuming a purchase of shares on the first day and a sale on the last day of each period reported, and includes reinvestment of dividends and distributions. Total returns for periods of less than one full year are not annualized. |
| (b) | Effective September 1, 2001 the Series has adopted the provisions of the AICPA Audit and Accounting Guide for Investment Companies and began accreting market discount on debt securities. The effect of this change for the year ended August 31, 2002 was to increase net investment income and decrease net realized and unrealized gains per share by less than $.005 and increase the ratio of net investment income from 4.38% to 4.39%. Per share amounts and ratios for the years ended prior to August 31, 2002 have not been restated to reflect this change in presentation. |
| (c) | The distributor of the Series has contractually agreed to limit its distribution and service (12b-1) fees to .25 of 1% of the average daily net assets of Class A shares. |
| (d) | Annualized. |
| (e) | Not annualized. |
See Notes to Financial Statements.
| 26 | Visit our website at www.jennisondryden.com |
| Class A | ||||||||||||||||||
| Year Ended August 31, | ||||||||||||||||||
| 2003 | 2002(b) | 2001 | 2000 | 1999 | ||||||||||||||
| $ | 12.22 | $ | 12.24 | $ | 11.60 | $ | 11.50 | $ | 12.30 | |||||||||
| .48 | .53 | .56 | .58 | .57 | ||||||||||||||
| (.21 | ) | .03 | .64 | .10 | (.69 | ) | ||||||||||||
| .27 | .56 | 1.20 | .68 | (.12 | ) | |||||||||||||
| (.47 | ) | (.53 | ) | (.56 | ) | (.58 | ) | (.57 | ) | |||||||||
| (.12 | ) | (.05 | ) | — | — | (.09 | ) | |||||||||||
| — | — | — | — | (.02 | ) | |||||||||||||
| (.59 | ) | (.58 | ) | (.56 | ) | (.58 | ) | (.68 | ) | |||||||||
| $ | 11.90 | $ | 12.22 | $ | 12.24 | $ | 11.60 | $ | 11.50 | |||||||||
| 2.31 | % | 4.76 | % | 10.65 | % | 6.17 | % | (1.07 | )% | |||||||||
| $ | 171,573 | $ | 182,062 | $ | 191,678 | $ | 182,602 | $ | 175,307 | |||||||||
| $ | 179,559 | $ | 182,312 | $ | 189,204 | $ | 178,303 | $ | 181,951 | |||||||||
| .91 | % | .91 | % | .89 | % | .90 | % | .84 | % | |||||||||
| .66 | % | .66 | % | .64 | % | .65 | % | .64 | % | |||||||||
| 3.94 | % | 4.39 | % | 4.77 | % | 5.10 | % | 4.76 | % | |||||||||
| 39 | % | 23 | % | 27 | % | 32 | % | 11 | % | |||||||||
See Notes to Financial Statements.
| Dryden Municipal Series Fund/New York Series | 27 |
Financial Highlights
(Unaudited) Cont’d
| Class B | ||||
Six Months Ended February 29, 2004 | ||||
Per Share Operating Performance: | ||||
Net Asset Value, Beginning Of Period | $ | 11.91 | ||
Income from investment operations | ||||
Net investment income | .20 | |||
Net realized and unrealized gain (loss) on investment transactions | .44 | |||
Total from investment operations | .64 | |||
Less Distributions | ||||
Dividends from net investment income | (.20 | ) | ||
Distributions from net realized gains | (.35 | ) | ||
Distributions in excess of net realized gains | — | |||
Total distributions | (.55 | ) | ||
Net asset value, end of period | $ | 12.00 | ||
Total Return(a): | 5.50 | % | ||
Ratios/Supplemental Data: | ||||
Net assets, end of period (000) | $ | 26,440 | ||
Average net assets (000) | $ | 27,434 | ||
Ratios to average net assets: | ||||
Expenses, including distribution and service (12b-1) fees | 1.17 | %(c) | ||
Expenses, excluding distribution and service (12b-1) fees | .67 | %(c) | ||
Net investment income | 3.42 | %(c) | ||
| (a) | Total return does not consider the effects of sales loads. Total return is calculated assuming a purchase of shares on the first day and a sale on the last day of each period reported, and includes reinvestment of dividends and distributions. Total returns for periods of less than one full year are not annualized. |
| (b) | Effective September 1, 2001 the Series has adopted the provisions of the AICPA Audit and Accounting Guide for Investment Companies and began accreting market discount on debt securities. The effect of this change for the year ended August 31, 2002 was to increase net investment income and decrease net realized and unrealized gains per share by less than $.005 and increase the ratio of net investment income from 4.13% to 4.15%. Per share amounts and ratios for the years ended prior to August 31, 2002 have not been restated to reflect this change in presentation. |
| (c) | Annualized. |
See Notes to Financial Statements.
| 28 | Visit our website at www.jennisondryden.com |
| Class B | ||||||||||||||||||
| Year Ended August 31, | ||||||||||||||||||
| 2003 | 2002(b) | 2001 | 2000 | 1999 | ||||||||||||||
| $ | 12.23 | $ | 12.24 | $ | 11.61 | $ | 11.50 | $ | 12.30 | |||||||||
| .45 | .50 | .53 | .55 | .54 | ||||||||||||||
| (.21 | ) | .04 | .63 | .11 | (.69 | ) | ||||||||||||
| .24 | .54 | 1.16 | .66 | (.15 | ) | |||||||||||||
| (.44 | ) | (.50 | ) | (.53 | ) | (.55 | ) | (.54 | ) | |||||||||
| (.12 | ) | (.05 | ) | — | — | (.09 | ) | |||||||||||
| — | — | — | — | (.02 | ) | |||||||||||||
| (.56 | ) | (.55 | ) | (.53 | ) | (.55 | ) | (.65 | ) | |||||||||
| $ | 11.91 | $ | 12.23 | $ | 12.24 | $ | 11.61 | $ | 11.50 | |||||||||
| 2.05 | % | 4.59 | % | 10.28 | % | 5.99 | % | (1.37 | )% | |||||||||
| $ | 29,456 | $ | 35,863 | $ | 38,829 | $ | 51,051 | $ | 76,929 | |||||||||
| $ | 33,825 | $ | 35,927 | $ | 42,212 | $ | 59,879 | $ | 88,626 | |||||||||
| 1.16 | % | 1.16 | % | 1.14 | % | 1.15 | % | 1.13 | % | |||||||||
| .66 | % | .66 | % | .64 | % | .65 | % | .63 | % | |||||||||
| 3.69 | % | 4.15 | % | 4.53 | % | 4.85 | % | 4.45 | % | |||||||||
See Notes to Financial Statements.
| Dryden Municipal Series Fund/New York Series | 29 |
Financial Highlights
(Unaudited) Cont’d
| Class C | ||||
Six Months Ended February 29, 2004 | ||||
Per Share Operating Performance: | ||||
Net Asset Value, Beginning Of Period | $ | 11.91 | ||
Income from investment operations | ||||
Net investment income | .19 | |||
Net realized and unrealized gain (loss) on investment transactions | .44 | |||
Total from investment operations | .63 | |||
Less Distributions | ||||
Dividends from net investment income | (.19 | ) | ||
Distributions from net realized gains | (.35 | ) | ||
Distributions in excess of net realized gains | — | |||
Total distributions | (.54 | ) | ||
Net asset value, end of period | $ | 12.00 | ||
Total Return(a): | 5.37 | % | ||
Ratios/Supplemental Data: | ||||
Net assets, end of period (000) | $ | 3,452 | ||
Average net assets (000) | $ | 3,376 | ||
Ratios to average net assets: | ||||
Expenses, including distribution and service (12b-1) fees (d) | 1.42 | %(c) | ||
Expenses, excluding distribution and service (12b-1) fees | .67 | %(c) | ||
Net investment income | 3.17 | %(c) | ||
| (a) | Total return does not consider the effects of sales loads. Total return is calculated assuming a purchase of shares on the first day and a sale on the last day of each period reported, and includes reinvestment of dividends and distributions. Total returns for periods of less than one full year are not annualized. |
| (b) | Effective September 1, 2001 the Series has adopted the provisions of the AICPA Audit and Accounting Guide for Investment Companies and began accreting market discount on debt securities. The effect of this change for the year ended August 31, 2002 was to increase net investment income and decrease net realized and unrealized gains per share by less than $.005 and increase the ratio of net investment income from 3.88% to 3.89%. Per share amounts and ratios for the years ended prior to August 31, 2002 have not been restated to reflect this change in presentation. |
| (c) | Annualized. |
| (d) | The distributor of the Series has contractually agreed to litmit its distribution and service (12b-1) fees to .75 of 1% of the average daily net assets of Class C Shares. |
See Notes to Financial Statements.
| 30 | Visit our website at www.jennisondryden.com |
| Class C | ||||||||||||||||||
| Year Ended August 31, | ||||||||||||||||||
| 2003 | 2002(b) | 2001 | 2000 | 1999 | ||||||||||||||
| $ | 12.23 | $ | 12.24 | $ | 11.61 | $ | 11.50 | $ | 12.30 | |||||||||
| .42 | .47 | .50 | .52 | .51 | ||||||||||||||
| (.21 | ) | .04 | .63 | .11 | (.69 | ) | ||||||||||||
| .21 | .51 | 1.13 | .63 | (.18 | ) | |||||||||||||
| (.41 | ) | (.47 | ) | (.50 | ) | (.52 | ) | (.51 | ) | |||||||||
| (.12 | ) | (.05 | ) | — | — | (.09 | ) | |||||||||||
| — | — | — | — | (.02 | ) | |||||||||||||
| (.53 | ) | (.52 | ) | (.50 | ) | (.52 | ) | (.62 | ) | |||||||||
| $ | 11.91 | $ | 12.23 | $ | 12.24 | $ | 11.61 | $ | 11.50 | |||||||||
| 1.80 | % | 4.34 | % | 10.01 | % | 5.73 | % | (1.62 | )% | |||||||||
| $ | 3,289 | $ | 3,455 | $ | 2,766 | $ | 1,884 | $ | 1,830 | |||||||||
| $ | 3,503 | $ | 2,992 | $ | 2,171 | $ | 1,812 | $ | 1,566 | |||||||||
| 1.41 | % | 1.41 | % | 1.39 | % | 1.40 | % | 1.39 | % | |||||||||
| .66 | % | .66 | % | .64 | % | .65 | % | .64 | % | |||||||||
| 3.45 | % | 3.89 | % | 4.26 | % | 4.60 | % | 4.23 | % | |||||||||
See Notes to Financial Statements.
| Dryden Municipal Series Fund/New York Series | 31 |
Financial Highlights
(Unaudited) Cont’d
| Class Z | ||||
Six Months Ended February 29, 2004 | ||||
Per Share Operating Performance: | ||||
Net Asset Value, Beginning Of Period | $ | 11.92 | ||
Income from investment operations | ||||
Net investment income | .23 | |||
Net realized and unrealized gain (loss) on investments transactions | .44 | |||
Total from investment operations | .67 | |||
Less Distributions | ||||
Dividends from net investment income | (.23 | ) | ||
Distributions from net realized gains | (.35 | ) | ||
Distributions in excess of net realized gains | — | |||
Total distributions | (.58 | ) | ||
Net asset value, end of period | $ | 12.01 | ||
Total Return(a): | 5.76 | % | ||
Ratios/Supplemental Data: | ||||
Net assets, end of period (000) | $ | 2,769 | ||
Average net assets (000) | $ | 2,678 | ||
Ratios to average net assets: | ||||
Expenses, including distribution and service (12b-1) fees | .67 | %(c) | ||
Expenses, excluding distribution and service (12b-1) fees | .67 | %(c) | ||
Net investment income | 3.92 | %(c) | ||
| (a) | Total return is cacluated assuming a purchase of shares on the first day and a sale on the last day of each period reported, and includes reinvestment of dividends and distributions. Total returns for periods of less than one full year are not annualized. |
| (b) | Effective September 1, 2001 the Series has adopted the provisions of the AICPA Audit and Accounting Guide for Investment Companies and began accreting market discount on debt securities. The effect of this change for the year ended August 31, 2002 was to increase net investment income and decrease net realized and unrealized gains per share by less than $.005. There was no effect of this change to the ratio of net investment income. Per share amounts and ratios for the years ended prior to August 31, 2002 have not been restated to reflect this change in presentation. |
| (c) | Annualized. |
See Notes to Financial Statements.
| 32 | Visit our website at www.jennisondryden.com |
| Class Z | ||||||||||||||||||
| Year Ended August 31, | ||||||||||||||||||
| 2003 | 2002(b) | 2001 | 2000 | 1999 | ||||||||||||||
| $ | 12.24 | $ | 12.25 | $ | 11.62 | $ | 11.51 | $ | 12.31 | |||||||||
| .52 | .56 | .59 | .61 | .60 | ||||||||||||||
| (.21 | ) | .04 | .63 | .11 | (.69 | ) | ||||||||||||
| .31 | .60 | 1.22 | .72 | (.09 | ) | |||||||||||||
| (.51 | ) | (.56 | ) | (.59 | ) | (.61 | ) | (.60 | ) | |||||||||
| (.12 | ) | (.05 | ) | — | — | (.09 | ) | |||||||||||
| — | — | — | — | (.02 | ) | |||||||||||||
| (.63 | ) | (.61 | ) | (.59 | ) | (.61 | ) | (.71 | ) | |||||||||
| $ | 11.92 | $ | 12.24 | $ | 12.25 | $ | 11.62 | $ | 11.51 | |||||||||
| 2.56 | % | 5.10 | % | 10.82 | % | 6.53 | % | (0.87 | )% | |||||||||
| $ | 2,595 | $ | 2,984 | $ | 1,775 | $ | 400 | $ | 464 | |||||||||
| $ | 2,828 | $ | 2,385 | $ | 1,008 | $ | 330 | $ | 496 | |||||||||
| .66 | % | .66 | % | .64 | % | .65 | % | .63 | % | |||||||||
| .66 | % | .66 | % | .64 | % | .65 | % | .63 | % | |||||||||
| 4.19 | % | 4.62 | % | 4.98 | % | 5.35 | % | 4.96 | % | |||||||||
See Notes to Financial Statements.
| Dryden Municipal Series Fund/New York Series | 33 |
Supplemental Proxy Information
(Unaudited)
A special meeting of shareholders was held on July 17, 2003, and adjourned to August 21, 2003 and further adjourned to September 12, 2003, October 12, 2003, November 7, 2003, November 21, 2003 and December 5, 2003. At such meetings the following proposal was submitted to shareholders for approval:
| (5) | To approve amendments to the Company’s Declaration of Trust. |
The results of the proxy solicitation on the preceding matter was:
Not approved.
| 34 | Visit our website at www.jennisondryden.com |
| nMAIL | nTELEPHONE | nWEBSITE | ||
Gateway Center Three 100 Mulberry Street Newark, NJ 07102 | (800) 225-1852 | www.jennisondryden.com | ||
PROXY VOTING
The Board of Trustees of the Fund has delegated to the Series’ investment manager the responsibility for voting any proxies and maintaining proxy recordkeeping with respect to the Series. A description of these proxy voting policies and procedures is available without charge, upon request, by calling (800) 225-1852 or by visiting the SEC’s website at http://www.sec.gov.
TRUSTEES
David E.A. Carson•Robert F. Gunia•Robert E. La Blanc•Douglas H. McCorkindale•Richard A. Redeker•Judy A. Rice•Robin B. Smith•Stephen D. Stoneburn•Clay T. Whitehead
OFFICERS
Judy A. Rice, President•Robert F. Gunia, Vice President•Grace C. Torres, Treasurer and Principal Financial and Accounting Officer•Marguerite E.H. Morrison, Chief Legal Officer and Assistant Secretary•Deborah A. Docs, Secretary•Maryanne Ryan, Anti-Money Laundering Compliance Officer•Lee D. Augsburger, Chief Compliance Officer
| MANAGER | Prudential Investments LLC | Gateway Center Three 100 Mulberry Street Newark, NJ 07102 | ||
| INVESTMENT ADVISER | Prudential Investment Management, Inc. | Gateway Center Two 100 Mulberry Street Newark, NJ 07102 | ||
| DISTRIBUTOR | Prudential Investment Management Services LLC | Gateway Center Three 14th Floor 100 Mulberry Street Newark, NJ 07102 | ||
| CUSTODIAN | State Street Bank and Trust Company | One Heritage Drive North Quincy, MA 02171 | ||
| TRANSFER AGENT | Prudential Mutual Fund Services LLC | PO Box 8098 Philadelphia, PA 19101 | ||
| INDEPENDENT AUDITORS | KPMG LLP | 757 Third Avenue New York, NY 10017 | ||
| FUND COUNSEL | Shearman & Sterling LLP | 599 Lexington Avenue New York, NY 10022 | ||
| Dryden Municipal Series Fund/New York Series | ||||||||||||
| Share Class | A | B | C | Z | ||||||||
NASDAQ | PMNYX | PBNYX | PCNYX | PNYZX | ||||||||
CUSIP | 262468812 | 262468796 | 262468788 | 262468770 | ||||||||
An investor should consider the investment objectives, risks, and charges and expenses of the Series carefully before investing. The prospectus for the Series contains this and other information about the Series. An investor may obtain a prospectus by visiting our website at www.jennisondryden.com or by calling us at (800) 225-1852. The prospectus should be read carefully before investing.
The views expressed in this report and information about the Series’ portfolio holdings are for the period covered by this report and are subject to change thereafter. The accompanying financial statements as of February 29, 2004 were not audited and, accordingly, no auditor’s opinion is expressed on them.
Quantitative Management and Prudential Fixed Income are units of Prudential Investment Management, Inc. (PIM). Jennison Associates and PIM are Registered Investment Advisors and Prudential Financial Companies.
Mutual Funds:
| ARE NOT INSURED BY THE FDIC OR ANY FEDERAL GOVERNMENT AGENCY | MAY LOSE VALUE | ARE NOT A DEPOSIT OF OR GUARANTEED BY ANY BANK OR ANY BANK AFFILIATE |
| Dryden Municipal Series Fund/New York Series | ||||||||||||
| Share Class | A | B | C | Z | ||||||||
NASDAQ | PMNYX | PBNYX | PCNYX | PNYZX | ||||||||
CUSIP | 262468812 | 262468796 | 262468788 | 262468770 | ||||||||
MF122E2 IFS-A090101 Ed. 04/2004
Dryden Municipal Series Fund/
New York Money Market Series
| FEBRUARY 29, 2004 | SEMIANNUAL REPORT | |

FUND TYPE
Money market
OBJECTIVE
The highest level of current income that is exempt from New York State, New York City, and federal income taxes, consistent with liquidity and the preservation of capital
This report is not authorized for distribution to prospective investors unless preceded or accompanied by a current prospectus.
The views expressed in this report and information about the Series’ portfolio holdings are for the period covered by this report and are subject to change thereafter.
JennisonDryden is a registered trademark of The Prudential Insurance Company of America.

Dear Shareholder,
April 19, 2004
As the stock market slowed in the first quarter of 2004 following its particularly strong performance in 2003, some investors still seemed to be watching developments from the sidelines. Though the economy appears sound, given the unsettled global political climate and uncertain job growth in the United States, we can understand that some investors may want to remain cautious. A broadly diversified asset allocation strategy can help protect you against inflation and increase your chances of participating in economic growth. As part of such strategy, holding a cash reserve in a money market fund can help you meet short-term obligations or deal with emergencies without having to liquidate longer-term assets as what may be an inappropriate time.
We recommend that you develop a diversified asset allocation strategy in consultation with a financial professional who knows you and who understands your reasons for investing, the time you have to reach your goals, and the amount of risk you are comfortable assuming. JennisonDryden mutual funds offer a wide range of investment choices, and your financial professional can help you choose the appropriate funds to implement your strategy.
Whether you are investing for your retirement, your children’s education, or some other purpose, JennisonDryden mutual funds offer the experience, resources, and professional discipline of three leading asset managers that can make a difference for you. JennisonDryden funds are managed by Prudential Investment Management’s public equity and fixed income asset management businesses. The equity funds are managed by Jennison Associates and Quantitative Management. Prudential Fixed Income manages the JennisonDryden fixed income and money market funds.
Thank you for your confidence in JennisonDryden mutual funds.
Sincerely,

Judy A. Rice, President
Dryden Municipal Series Fund/New York Money Market Series
| Dryden Municipal Series Fund/New York Money Market Series | 1 |
Your Series’ Performance
Series objective
The investment objective of the Dryden Municipal Series Fund/New York Money Market Series (the Series) is to provide the highest level of current income that is exempt from New York State, New York City, and federal income taxes, consistent with liquidity and the preservation of capital. There can be no assurance that the Series will achieve its investment objective.
Yields will fluctuate from time to time, and past performance is not indicative of future results. Current performance may be lower or higher than the performance quoted. An investment in the Series is not insured or guaranteed by the Federal Deposit Insurance Corporation or any other government agency. Although the Series seeks to preserve the value of your investment at $1.00 per share, it is possible to lose money by investing in the Series.
| Series Facts as of 2/29/04 | ||||||||||||||
| 7-Day Current Yield | Net Asset Value (NAV) | Taxable | Equivalent | Yield* | Weighted Avg. Maturity (WAM) | Net Assets (Millions) | ||||||||
| @28% | @33% | @35% | ||||||||||||
New York Money Market Series | 0.31% | $1.00 | 0.46% | 0.50% | 0.51% | 32 Days | $36 | |||||||
iMoneyNet, Inc. State Specific Retail New York Avg.** | 0.33% | N/A | 0.49% | 0.53% | 0.55% | 37 Days | N/A | |||||||
| * | Some investors may be subject to the federal alternative minimum tax and/or state and local taxes. Taxable equivalent yields reflect federal and applicable state tax rates. |
| ** | iMoneyNet, Inc. reports a 7-day current yield and WAM on Mondays for state-specific retail money funds. This is the data of all funds in the iMoneyNet, Inc. State Specific Retail New York Average category as of February 23, 2004, the closest date to the end of our reporting period. |
| 2 | Visit our website at www.jennisondryden.com |
State Specific Money Market Fund Yield Comparison
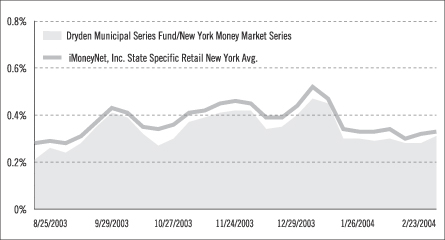
Weighted Average Maturity Comparison
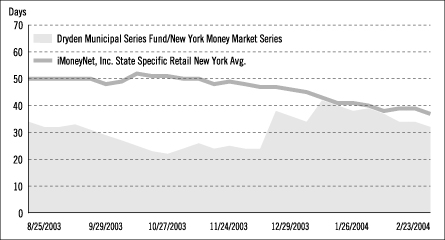
Past performance is not indicative of future results. The graphs portray weekly 7-day current yields and weekly WAMs for the Dryden Municipal Series Fund/New York Money Market Series and the iMoneyNet, Inc. State Specific Retail New York Average every Monday from August 25, 2003 to February 23, 2004, the closest dates to the beginning and end of the Series’ reporting period. The data portrayed for the Series at the end of the reporting period in the graph may not match the data portrayed in the Fund Facts table as of February 29, 2004.
| Dryden Municipal Series Fund/New York Money Market Series | 3 |
This Page Intentionally Left Blank
Portfolio of Investments
| FEBRUARY 29, 2004 | SEMIANNUAL REPORT | |
Dryden Municipal Series Fund
New York Money Market Series
Portfolio of Investments
as of February 29, 2004 (Unaudited)
| Description (a) | Moody’s Rating | Interest Rate | Maturity Date | Principal Amount (000) | Value (Note 1) | |||||||
Battery Park City Auth. Hsg. Rev., | VMIG1 | 0.95% | 3/04/04 | $ | 2,820 | $ | 2,820,000 | |||||
Ser. MT2, F.R.W.D. | VMIG1 | 0.95 | 3/04/04 | 7,360 | 7,360,000 | |||||||
Chemung Cnty. Ind. Dev. Agcy. Rev., Hathorn Redev. Proj., Ser. B, F.R.W.D., A.M.T. | VMIG1 | 0.95 | 3/04/04 | 4,000 | 4,000,000 | |||||||
Columbia Cnty. Ind. Dev. Agcy. Rev., Rual Mfg. Co. Inc. Proj., Ser. A, F.R.W.D., A.M.T. | A-1(d) | 0.94 | 3/03/04 | 4,570 | 4,570,000 | |||||||
Dutchess Cnty. Ind. Dev. Agcy. Civic Fac. Rev., Trinity Pawling Sch. Corp., F.R.W.D. | VMIG1 | 0.95 | 3/04/04 | 3,500 | 3,500,000 | |||||||
East Farmingdale Volunteer Fire Co. Inc. Rev., F.R.W.D. | A-1+(d) | 0.94 | 3/04/04 | 5,650 | 5,650,000 | |||||||
East Rochester Hsg. Auth. Rev., Daniels Creek at Baytown, Ser. 01, F.R.W.D., A.M.T. | VMIG1 | 0.98 | 3/04/04 | 3,750 | 3,750,000 | |||||||
Erie Cnty. Ind. Dev. Agcy. Rev., Colad Group Inc., Ser. A, F.R.W.D., A.M.T. | A-1+(d) | 0.96 | 3/03/04 | 555 | 555,000 | |||||||
Glens Falls Ind. Dev. Agcy. Rev., Namic Proj., F.R.W.D. | A-1(d) | 0.94 | 3/03/04 | 1,210 | 1,210,000 | |||||||
Goshen NY Central Sch. Dist., G.O., Ser. A, F.G.I.C. | Aaa(e) | 5.38 | 6/15/04 | 325 | 329,030 | |||||||
Hauppauge Union Free Sch. Dist., G.O., T.A.N. | NR | 1.50 | 6/29/04 | 3,000 | 3,003,356 | |||||||
Jefferson Cnty. NY Ind. Dev. Agcy. Rev., Fisher Gauge Ltd. Fac., F.R.W.D., A.M.T. | A-1(d) | 0.96 | 3/03/04 | 1,725 | 1,725,000 | |||||||
Metro. Trans. Auth. Rev., | A2(e) | 3.00 | 11/15/04 | 9,800 | 9,926,591 | |||||||
Metro. Trans. Auth., Commuter Fac. Rev., | VMIG1 | 0.98 | 3/03/04 | 3,975 | 3,975,000 | |||||||
Ser. F, F.R.W.D., M.E.R.L.O.T. | VMIG1 | 0.98 | 3/03/04 | 1,000 | 1,000,000 | |||||||
Ser. H, F.R.W.D., F.S.A. | VMIG1 | 0.97 | 3/04/04 | 5,490 | 5,490,000 | |||||||
See Notes to Financial Statements.
| 6 | Visit our website at www.jennisondryden.com |
| Description (a) | Moody’s Rating | Interest Rate | Maturity Date | Principal Amount (000) | Value (Note 1) | |||||||
Middletown City Sch. Dist., G.O., Ser. A, A.M.B.A.C. | Aaa(e) | 4.63% | 11/15/04 | $ | 350 | $ | 358,529 | |||||
Monroe Cnty. Ind. Dev. Agy. Rev., | VMIG1 | 1.01 | 3/04/04 | 1,910 | 1,910,000 | |||||||
Jada Precision Proj., F.R.W.D., A.M.T. | A-1(d) | 0.94 | 3/03/04 | 3,810 | 3,810,000 | |||||||
Mun. Secs. Trust Cert. Rev., Class A, Ser. 7000, F.R.W.D., A.M.B.A.C. | VMIG1 | 0.95 | 3/04/04 | 4,995 | 4,995,000 | |||||||
Class A, Ser. 2000-89, F.R.D.D., A.M.T. | VMIG1 | 1.02 | 3/01/04 | 400 | 400,000 | |||||||
Class A, Ser. 2001-109, F.R.D.D. | VMIG1 | 0.97 | 3/01/04 | 2,600 | 2,600,000 | |||||||
Nassau Cnty. Interm. Fin. Auth. Rev., Mun. Secs. Trust, SGA108, F.R.W.D. | A-1+(d) | 0.95 | 3/03/04 | 7,500 | 7,500,000 | |||||||
Nassau Cnty., | MIG1 | 2.00 | 4/15/04 | 2,000 | 2,002,329 | |||||||
G.O., Ser. B, T.A.N. | MIG1 | 2.00 | 10/15/04 | 4,175 | 4,196,872 | |||||||
New York City Hsg. Dev. Corp. Multi-Fam. Rent Hsg. Rev., 100 Jane Str. Dev., Ser. A, F.R.W.D., F.N.M.A., A.M.T. | A-1+(d) | 0.94 | 3/03/04 | 6,525 | 6,525,000 | |||||||
New York City Hsg. Dev. Corp. Multi-Fam. Rev., Atlantic Court Apts., | A-1+(d) | 0.93 | 3/03/04 | 5,000 | 5,000,000 | |||||||
Mtge. 2 Gold St., Ser. A, F.R.W.D. | A-1(d) | 0.93 | 3/03/04 | 20,000 | 20,000,000 | |||||||
New York City Ind. Dev. Agcy. Civic Fac. Rev., Hewitt Sch. Proj., F.R.W.D. | VMIG1 | 1.00 | 3/04/04 | 1,550 | 1,550,000 | |||||||
Vlge. Cmnty. Sch. Proj., F.R.W.D. | VMIG1 | 1.10 | 3/04/04 | 1,270 | 1,270,000 | |||||||
New York City Ind. Dev. Agcy. Rev., Ser. G, A.M.T., A.N.N.O.T. | Aa3(e) | 1.20 | 11/1/04 | 1,260 | 1,260,000 | |||||||
New York City Ind. Dev., USA Wste. Svcs. NYC Proj., F.R.W.D., A.M.T. | A-1+(d) | 0.97 | 3/04/04 | 3,000 | 3,000,000 | |||||||
See Notes to Financial Statements.
| Dryden Municipal Fund Series/New York Money Market Series | 7 |
Portfolio of Investments
as of February 29, 2004 (Unaudited) Cont’d.
| Description (a) | Moody’s Rating | Interest Rate | Maturity Date | Principal Amount (000) | Value (Note 1) | ||||||||
New York City Muni. Wtr., Ser. 6, T.E.C.P. | P-1 | 0.98% | 6/10/04 | $ | 10,000 | $ | 10,000,000 | ||||||
New York City Transitional Fin. Auth. Rev., | VMIG1 | 0.97 | 3/04/04 | 4,970 | 4,970,000 | ||||||||
Future Tax Secured, | VMIG1 | 0.91 | 3/03/04 | 1,715 | 1,715,000 | ||||||||
NYC Recov., Ser. 1, Subser. 1-C, F.R.D.D. | VMIG1 | 0.97 | 3/01/04 | 400 | 400,000 | ||||||||
Putters, Ser. 386, F.R.W.D. | VMIG1 | 0.99 | 3/04/04 | 2,500 | 2,500,000 | ||||||||
Putters, Ser. 387, M.B.I.A., F.R.W.D. | VMIG1 | 0.97 | 3/04/04 | 5,000 | 5,000,000 | ||||||||
New York City Tricultural, Res., M.S.T.R., | A-1+(d) | 0.97 | 3/01/04 | 6,385 | 6,385,000 | ||||||||
New York City, G.O., Ser. B1 | Aaa(e) | 7.30 | 8/15/04 | 350 | (f) | 363,200 | |||||||
G.O., Ser. J, Subser. J-2, F.R.W.D. | VMIG1 | 0.93 | 3/03/04 | 2,100 | 2,100,000 | ||||||||
New York St. Dorm. Auth. Lease Rev., Mun. Hlth. Facs. Impvt. Prog., Ser. 1, F.S.A. | Aaa(e) | 5.00 | 1/15/05 | 450 | 465,018 | ||||||||
New York St. Dorm. Auth. Rev., | VMIG1 | 0.97 | 3/04/04 | 2,995 | 2,995,000 | ||||||||
Cert. Ser. 341, F.R.W.D., M.B.I.A. | VMIG1 | 0.97 | 3/04/04 | 3,495 | 3,495,000 | ||||||||
Mental Hlth. Svcs., Subser. D-2F, F.R.W.D. | A-1+(d) | 0.94 | 3/04/04 | 8,000 | 8,000,000 | ||||||||
Mental Hlth. Svcs., Subser. D-2H, F.R.W.D. | A1+(d) | 0.91 | 3/04/04 | 2,500 | 2,500,000 | ||||||||
Ser. 00G, F.R.W.D., M.E.R.L.O.T. | VMIG1 | 0.98 | 3/03/04 | 10,000 | 10,000,000 | ||||||||
Ser. 00X, M.B.I.A., M.E.R.L.O.T. F.R.W.D., | VMIG1 | 0.98 | 3/03/04 | 2,065 | 2,065,000 | ||||||||
Ser. A30, F.R.W.D., A.M.B.A.C. | VMIG1 | 0.98 | 3/03/04 | 1,385 | 1,385,000 | ||||||||
Ser. SGA 132, F.R.W.D. | A-1+(d) | 0.95 | 3/03/04 | 1,805 | 1,805,000 | ||||||||
Svc. Contract, Ser. A | AA-(d)(e) | 4.50 | 4/01/04 | 3,040 | 3,049,128 | ||||||||
New York St. Dorm. Auth., Mt. Sinai Sch. Med., Ser. 2000 | P-1 | 1.00 | 3/05/04 | 1,000 | 1,000,000 | ||||||||
New York St. Engy. Res. & Dev. Auth., | VMIG1 | 0.95 | 3/03/04 | 1,400 | 1,400,000 | ||||||||
Ser. 85A, A.N.N.O.T. | A-1+(d) | 1.10 | 3/15/04 | 1,500 | 1,500,000 | ||||||||
See Notes to Financial Statements.
| 8 | Visit our website at www.jennisondryden.com |
| Description (a) | Moody’s Rating | Interest Rate | Maturity Date | Principal Amount (000) | Value (Note 1) | ||||||||
New York St. Environ. Fac. Corp., Clean Wtr. Drinking, Ser. 652, F.R.W.D. | A-1(d) | 0.97% | 3/04/04 | $ | 6,285 | $ | 6,285,000 | ||||||
New York St. Hsg. Fin. Agcy. Rev., | VMIG1 | 0.94 | 3/03/04 | 11,000 | 11,000,000 | ||||||||
Talleyrand Cres., Ser. 99A, F.R.W.D., A.M.T. | VMIG1 | 0.96 | 3/03/04 | 5,000 | 5,000,000 | ||||||||
New York St. Local Govt. Assist. Corp., Ser. SGA 59, F.R.D.D. | A-1+(d) | 0.97 | 3/01/04 | 3,200 | 3,200,000 | ||||||||
New York St. Mtge. Agcy. Rev., | VMIG1 | 1.13 | 4/02/04 | 6,000 | 6,000,000 | ||||||||
Ser. A11, F.R.W.D., M.E.R.L.O.T. | VMIG1 | 0.98 | 3/03/04 | 1,325 | 1,325,000 | ||||||||
New York St. Thrwy. Auth. Rev., | VMIG1 | 0.97 | 3/04/04 | 1,000 | 1,000,000 | ||||||||
Mun. Trust, Ser. SGA 66, F.R.W.D. | A-1+(d) | 0.95 | 3/03/04 | 7,855 | 7,855,000 | ||||||||
Ser. A, B.A.N. | MIG1 | 1.13 | 3/25/04 | 3,000 | 3,000,000 | ||||||||
Svcs. Contract Rev., | A3(e) | 5.30 | 4/01/04 | 70 | (f) | 70,245 | |||||||
Svcs. Contract Rev., | A3(e) | 5.30 | 4/01/04 | 930 | 933,257 | ||||||||
Svcs. Contract Rev., | A3(e) | 5.50 | 4/01/04 | 2,065 | 2,072,557 | ||||||||
New York St. Urban Dev. Corp. Rev., | A1(e) | 4.50 | 12/15/04 | 2,000 | 2,053,020 | ||||||||
Ser. A25, F.R.W.D., F.G.I.C., T.C.R.S., M.E.R.L.O.T. | VMIG1 | 0.98 | 3/03/04 | 6,375 | 6,375,000 | ||||||||
New York St., Trust Rcpts., | VMIG1 | 0.94 | 3/04/04 | 6,600 | 6,600,000 | ||||||||
Oneida Indian Nation, F.R.W.D. | VMIG1 | 0.92 | 3/03/04 | 5,300 | 5,300,000 | ||||||||
Pelham Union Free Sch. Dist., G.O., T.A.N. | NR | 1.50 | 6/24/04 | 2,000 | 2,002,140 | ||||||||
Pittsford Cent. Sch. Dist., G.O., B.A.N. | NR | 2.00 | 12/17/04 | 5,929 | 5,967,629 | ||||||||
See Notes to Financial Statements.
| Dryden Municipal Fund Series/New York Money Market Series | 9 |
Portfolio of Investments
as of February 29, 2004 (Unaudited) Cont’d.
| Description (a) | Moody’s Rating | Interest Rate | Maturity Date | Principal Amount (000) | Value (Note 1) | |||||||
Port Auth. New York & New Jersey, | VMIG1 | 1.02% | 3/01/04 | $ | 2,300 | $ | 2,300,000 | |||||
Ser. 93-1, F.R.W.D. | NR | 0.94 | 3/04/04 | 12,000 | 12,000,000 | |||||||
Versatile Structure Oblig., | VMIG1 | 1.02 | 3/01/04 | 500 | 500,000 | |||||||
Power Authority New York, | P-1 | 0.95 | 3/05/04 | 5,800 | 5,800,000 | |||||||
Ser. 1, T.E.C.P. | P-1 | 0.95 | 3/08/04 | 6,000 | 6,000,000 | |||||||
Ser. 1, T.E.C.P. | P-1 | 0.95 | 3/09/04 | 6,000 | 6,000,000 | |||||||
Puerto Rico Comwlth. Hwy. & Trans. Auth. Rev., Ser. 771, M.B.I.A., A.N.N.M.T. | VMIG1 | 1.00 | 6/17/04 | 9,015 | 9,015,000 | |||||||
Ramapo Hsg. Auth. Rev., Fountainview Proj., Ser. 98, F.R.W.D., A.M.T. | VMIG1 | 1.04 | 3/04/04 | 10,985 | 10,985,000 | |||||||
Rockland Cnty. Ind. Dev. Agcy., | VMIG1 | 1.04 | 3/04/04 | 4,980 | 4,980,000 | |||||||
Northern Manor Multicare, Ser. 02, F.R.W.D. | VMIG1 | 1.04 | 3/04/04 | 2,610 | 2,610,000 | |||||||
Syracuse Ind. Dev. Agcy., Civic Fac. Rev., Crouse Hlth. Hosp., Inc. Proj., F.R.W.D. | VMIG1 | 1.00 | 3/03/04 | 4,200 | 4,200,000 | |||||||
Triborough Bridge & Tunnel Auth. Rev., Ser. A, F.R.W.D. | VMIG1 | 0.91 | 3/03/04 | 11,800 | 11,800,000 | |||||||
Ulster Cnty., B.A.N. | SP-1+(d) | 1.75 | 6/11/04 | 6,500 | 6,513,441 | |||||||
Unadilla Etc. Central Sch. Dist., No. 002, G.O., F.G.I.C. | Aaa(e) | 4.50 | 6/15/04 | 400 | 403,969 | |||||||
Westchester Cnty. Ind. Dev. Agcy. Civic Fac. Rev., Masters School, F.R.W.D. | VMIG1 | 1.00 | 3/04/04 | 3,110 | 3,110,000 | |||||||
Total Investments 98.1% | 360,590,311 | |||||||||||
Other assets in excess of liabilities 1.9% | 7,109,893 | |||||||||||
Net Assets 100% | $ | 367,700,204 | ||||||||||
See Notes to Financial Statements.
| 10 | Visit our website at www.jennisondryden.com |
| (a) | The following abbreviations are used in the portfolio descriptions: |
A.M.B.A.C.—American Municipal Bond Assurance Corporation.
A.M.T.—Alternative Minimum Tax.
A.N.N.M.T.—Annual Mandatory Tender.
A.N.N.O.T.—Annual Optional Tender.
B.A.N.—Bond Anticipation Note.
E.T.M.—Escrow to Maturity.
F.G.I.C.—Financial Guaranty Insurance Company.
F.N.M.A.—Federal National Mortgage Association.
F.R.D.D.—Floating Rate (Daily) Demand Note (b).
F.R.W.D.—Floating Rate (Weekly) Demand Note (b).
F.S.A.—Financial Security Assurance.
G.O.—General Obligation.
M.B.I.A.—Municipal Bond Insurance Corporation.
M.E.R.L.O.T.—Municipal Exempt Receipt—Liquid Optional Tender.
T.A.N.—Tax Anticipation Note.
T.C.R.S.—Transferable Custodial Receipts.
T.E.C.P.—Tax Exempt Commercial Paper.
| (b) | For purposes of amortized cost valuation, the maturity date of Floating Rate Demand Notes is considered to be the later of the next date on which the security can be redeemed at par, or the next date on which the rate of interest is adjusted. |
| (c) | The cost of securities for federal income tax purposes is substantially the same as for financial reporting purposes. |
| (d) | Standard & Poor’s Rating. |
| (e) | Long-term ratings. |
| (f) | Prerefunded issues are secured by escrowed cash and/or direct U.S. guaranteed obligations. |
NR—Not Rated by Moody’s or Standard & Poor’s.
The Fund’s current Statement of Additional Information contains a description of Moody’s and Standard & Poor’s ratings.
See Notes to Financial Statements.
| Dryden Municipal Fund Series/New York Money Market Series | 11 |
Statement of Assets and Liabilities
as of February 29, 2004 (Unaudited)
Assets | |||
Investments, at amortized cost which approximates market value | $ | 360,590,311 | |
Cash | 85,622 | ||
Receivable for Series shares sold | 5,522,114 | ||
Receivable for investments sold | 5,000,128 | ||
Interest receivable | 959,493 | ||
Prepaid assets | 7,440 | ||
Total assets | 372,165,108 | ||
Liabilities | |||
Payable for Series shares reacquired | 4,169,095 | ||
Management fee payable | 144,999 | ||
Accrued expenses | 90,692 | ||
Distribution fee payable | 36,250 | ||
Dividends payable | 12,419 | ||
Deferred trustees’ fees | 11,449 | ||
Total liabilities | 4,464,904 | ||
Net Assets | $ | 367,700,204 | |
Net assets were comprised of: | |||
Shares of beneficial interest, at $.01 par value | $ | 3,677,002 | |
Paid-in capital in excess of par | 364,023,202 | ||
Net assets, February 29, 2004 | $ | 367,700,204 | |
Net asset value, offering price and redemption price per share | $1.00 | ||
See Notes to Financial Statements.
| 12 | Visit our website at www.jennisondryden.com |
Statement of Operations
Six Months Ended February 29, 2004
Net Investment Income | |||
Income | |||
Interest | $ | 1,960,119 | |
Expenses | |||
Management fee | 923,349 | ||
Distribution fee | 230,837 | ||
Custodian’s fees and expenses | 53,000 | ||
Transfer agent’s fees and expenses | 37,000 | ||
Reports to shareholders | 25,000 | ||
Registration fees | 19,000 | ||
Legal fees and expenses | 18,000 | ||
Trustees’ fees | 7,000 | ||
Audit fee | 6,000 | ||
Miscellaneous | 5,854 | ||
Total expenses | 1,325,040 | ||
Net investment income | 635,079 | ||
Net realized gain on investments | 288,001 | ||
Net Increase In Net Assets Resulting From Operations | $ | 923,080 | |
See Notes to Financial Statements.
| Dryden Municipal Fund Series/New York Money Market Series | 13 |
Statement of Changes in Net Assets
(Unaudited)
| Six Months Ended February 29, 2004 | Year Ended August 31, 2003 | |||||||
Increase (Decrease) In Net Assets | ||||||||
Operations | ||||||||
Net investment gain | $ | 635,079 | $ | 2,642,671 | ||||
Net realized gain on investment transactions | 288,001 | 228,880 | ||||||
Net increase in net assets resulting from operations | 923,080 | 2,871,551 | ||||||
Dividends and distributions paid to shareholders (Note 1) | (923,080 | ) | (2,871,551 | ) | ||||
Series share transactions (at $1 per share) | ||||||||
Net proceeds from shares sold | 519,761,218 | 1,186,257,467 | ||||||
Net asset value of shares issued in reinvestment of dividends and distributions | 894,983 | 2,823,122 | ||||||
Cost of shares reacquired | (544,967,977 | ) | (1,268,848,822 | ) | ||||
Net decrease in net assets from Series share transactions | (24,311,776 | ) | (79,768,233 | ) | ||||
Total decrease | (24,311,776 | ) | (79,768,233 | ) | ||||
Net Assets | ||||||||
Beginning of period | 392,011,980 | 471,780,213 | ||||||
End of period | $ | 367,700,204 | $ | 392,011,980 | ||||
See Notes to Financial Statements.
| 14 | Visit our website at www.jennisondryden.com |
Notes to Financial Statements
(Unaudited)
Dryden Municipal Series Fund (the “Fund”), is registered under the Investment Company Act of 1940 as an open-end management investment company. The Fund was organized as a Massachusetts business trust on May 18, 1984 and consists of six series. These financial statements relate only to New York Money Market Series (the “Series”). The financial statements of the other series are not presented herein. The assets of each series are invested in separate, independently managed portfolios. The Series commenced investment operations in April 1985.
The Series is diversified and seeks to achieve its investment objective of providing the highest level of income that is exempt from New York State, New York City and federal income taxes with a minimum of risk by investing in “investment grade” tax-exempt securities having a maturity of 13 months or less whose ratings are within the two highest ratings categories by two nationally recognized statistical rating organizations, or if not rated, are of comparable quality. The ability of the issuers of the securities held by the Series to meet their obligations may be affected by economic developments in a specific state, industry or region.
Note 1. Accounting Policies
The following is a summary of significant accounting policies followed by the Fund, and the Series, in the preparation of its financial statements.
Securities Valuations: Portfolio securities of the Series are valued at amortized cost, which approximates market value. The amortized cost method involves valuing a security at its cost on the date of purchase and thereafter assuming a constant amortization to maturity of any discount or premium. If the amortized cost method is determined not to represent fair value, the value shall be determined by or under the direction of the Board of Trustees.
Securities Transactions and Net Investment Income: Securities transactions are recorded on the trade date. Realized gains or losses from security transactions are calculated on the identified cost basis. The Series amortizes premiums and accretes discounts on debt securities as adjustments to interest income. Interest income is recorded on the accrual basis. Expenses are recorded on the accrual basis.
| Dryden Municipal Fund Series/New York Money Market Series | 15 |
Notes to Financial Statements
(Unaudited) Cont’d
Federal Income Taxes: For federal income tax purposes, each Series in the Fund is treated as a separate tax-paying entity. It is each Series’ policy to continue to meet the requirements of the Internal Revenue Code applicable to regulated investment companies and to distribute all of its taxable net investment income and capital gains, if any, to shareholders. Therefore, no federal income tax provision is required.
Dividends and Distributions: The Series declares daily dividends from net investment income and net realized short-term capital gains. Payment of dividends is made monthly. Income distributions and capital gain distributions are determined in accordance with income tax regulations, which may differ from generally accepted accounting principles.
Estimates: The preparation of the financial statements requires management to make estimates and assumptions that affect the reported amounts and disclosures in the financial statements. Actual results could differ from those estimates.
Note 2. Agreements
The Fund has a management agreement with Prudential Investments LLC (“PI” or “Manager”). Pursuant to a subadvisory agreement between PI and Prudential Investment Management, Inc. (“PIM” or “Subadviser”), PIM furnishes investment advisory services in connection with the management of the Fund. Under the subadvisory agreement, PIM, subject to the supervision of PI, is responsible for managing the assets of the Fund in accordance with its investment objective and policies. PI pays for the services of PIM, the cost of compensation of officers of the Fund, occupancy and certain clerical and bookkeeping costs of the Fund. The Fund bears all other costs and expenses.
The management fee paid to PI is computed daily and payable monthly at an annual rate of .50% of the average daily net assets of the Series.
The Series has a distribution agreement with Prudential Investment Management Services LLC (“PIMS”), which acts as the distributor of the Series. The Series compensates PIMS for distributing and servicing the Series’ shares, pursuant to a plan of distribution, regardless of expenses actually incurred by it. The Series pays PIMS for distributing and servicing the Series’ shares pursuant to the plan of distribution at an annual rate of .125 of 1% of the Series’ average daily net assets. The distribution fee is accrued daily and payable monthly.
| 16 | Visit our website at www.jennisondryden.com |
PI, PIM and PIMS are indirect wholly-owned subsidiaries of Prudential Financial, Inc. (“Prudential”).
Note 3. Other Transactions with Affiliates
Prudential Mutual Fund Services LLC (“PMFS”), an affiliate of PI and an indirect, wholly-owned subsidiary of Prudential, serves as the Fund's transfer agent. During the six months ended February 29, 2004, the Series incurred fees of approximately $31,900 for the services of PMFS. As of February 29, 2004, approximately $5,200 of such fees were due to PMFS. Transfer agent fees and expenses in the Statement of Operations include certain out-of-pocket expenses paid to non-affiliates, where applicable.
Note 4. Capital
The Series offers Class A shares. The Series may also offer Class S shares. There are no Class S shares currently issued and outstanding.
Note 5. Change in Independent Auditors
PricewaterhouseCoopers LLP was previously the independent auditors for the Series. The decision to change the independent auditors was approved by the Audit Committee and by the Board of Trustees in a meeting held on September 2, 2003, resulting in KPMG LLP’s appointment as independent auditors of the Fund.
The reports on the financial statements of the Series audited by PricewaterhouseCoopers LLP through the year ended August 31, 2003 did not contain an adverse opinion or disclaimer of opinion, and were not qualified or modified as to uncertainty, audit scope or accounting principles. There were no disagreements between the Series and PricewaterhouseCoopers LLP on any matter of accounting principles or practices, financial statement disclosure, or auditing scope or procedures.
| Dryden Municipal Fund Series/New York Money Market Series | 17 |
Financial Highlights
(Unaudited)
| Six Months Ended February 29, 2004 | ||||
Per Share Operating Performance: | ||||
Net Asset Value, Beginning Of Period | $ | 1.00 | ||
Net investment income and net realized gains | — | (b) | ||
Dividends and distributions to shareholders | — | (b) | ||
Net asset value, end of period | $ | 1.00 | ||
Total Return(a): | 0.25 | % | ||
Ratios/Supplemental Data: | ||||
Net assets, end of period (000) | $ | 367,700 | ||
Average net assets (000) | $ | 371,369 | ||
Ratios to average net assets: | ||||
Expenses, including distribution and service (12b-1) fees | .72 | %(c) | ||
Expenses, excluding distribution and service (12b-1) fees | .59 | %(c) | ||
Net investment income | .34 | %(c) | ||
| (a) | Total return is calculated assuming a purchase of shares on the first day and a sale on the last day of each period reported and includes reinvestment of dividends and distributions. Total returns for periods less than a full year are not annualized. |
| (b) | Less than $.005 per share. |
| (c) | Annualized. |
See Notes to Financial Statements.
| 18 | Visit our website at www.jennisondryden.com |
Year Ended August 31, | ||||||||||||||||||
| 2003 | 2002 | 2001 | 2000 | 1999 | ||||||||||||||
| $ | 1.00 | $ | 1.00 | $ | 1.00 | $ | 1.00 | $ | 1.00 | |||||||||
| .01 | .01 | .03 | .03 | .02 | ||||||||||||||
| (.01 | ) | (.01 | ) | (.03 | ) | (.03 | ) | (.02 | ) | |||||||||
| $ | 1.00 | $ | 1.00 | $ | 1.00 | $ | 1.00 | $ | 1.00 | |||||||||
| .64 | % | 1.13 | % | 2.91 | % | 3.18 | % | 2.49 | % | |||||||||
| $ | 392,012 | $ | 471,780 | $ | 449,606 | $ | 361,875 | $ | 358,556 | |||||||||
| $ | 444,015 | $ | 449,597 | $ | 403,930 | $ | 369,017 | $ | 375,650 | |||||||||
| .71 | % | .69 | % | .70 | % | .70 | % | .70 | % | |||||||||
| .58 | % | .57 | % | .58 | % | .57 | % | .57 | % | |||||||||
| .60 | % | 1.04 | % | 2.80 | % | 3.15 | % | 2.46 | % | |||||||||
See Notes to Financial Statements.
| Dryden Municipal Fund Series/New York Money Market Series | 19 |
Supplemental Proxy Information
(Unaudited)
A Special Meeting of Shareholders was held on July 17, 2003, and adjourned to August 21, 2003 and further adjourned to September 12, 2003, October 10, 2003, November 7, 2003, November 21, 2003, December 5, 2003 and January 6, 2004. At such meetings the following proposals were submitted to shareholders for approval:
| 2) | To permit the manager to enter into, or make material changes to, subadvisory agreements without shareholder approval. |
Not approved
| 4a) | To approve changes to fundamental investments restrictions or policies, relating to: fund diversification. |
Not approved
| 4b) | To approve changes to fundamental investments restrictions or policies, relating to: issuing senior securities, borrowing money or pledging assets. |
Not approved
| 4c) | To approve changes to fundamental investments restrictions or policies, relating to: buying and selling real estate |
Not approved
| 4d) | To approve changes to fundamental investments restrictions or policies, relating to: buying and selling commodities and commodity contracts. |
Not approved
| 4e) | To approve changes to fundamental investments restrictions or policies, relating to: making loans. |
Not approved
| 4f) | To approve changes to fundamental investments restrictions or policies, relating to: other investment restriction, including investing in securities of other investment companies. |
Not approved
| 5) | To approve amendments to the Fund's Declaration of Trust. |
Not approved
| n MAIL | n TELEPHONE | n WEBSITE | ||
Gateway Center Three 100 Mulberry Street Newark, NJ 07102 | (800) 225-1852 | www.jennisondryden.com | ||
| PROXY VOTING |
| The Board of Trustees of the Fund has delegated to the Series’ investment manager the responsibility for voting any proxies and maintaining proxy recordkeeping with respect to the Series. A description of these proxy voting policies and procedures is available without charge, upon request, by calling (800) 225-1852 or by visiting the SEC’s website at http://www.sec.gov. |
| TRUSTEES |
| David E.A. Carson • Robert F. Gunia • Robert E. La Blanc • Douglas H. McCorkindale • Richard A. Redeker • Judy A. Rice • Robin B. Smith • Stephen D. Stoneburn • Clay T. Whitehead |
| OFFICERS |
| Judy A. Rice, President•Robert F. Gunia, Vice President •Grace C. Torres, Treasurer and Principal Financial and Accounting Officer•Marguerite E.H. Morrison, Chief Legal Officer and Assistant Secretary •Deborah A. Docs, Secretary•Maryanne Ryan, Anti-Money Laundering Compliance Officer•Lee D. Augsburger, Chief Compliance Officer |
| MANAGER | Prudential Investments LLC | Gateway Center Three 100 Mulberry Street Newark, NJ 07102 | ||
| INVESTMENT ADVISER | Prudential Investment Management, Inc. | Gateway Center Two 100 Mulberry Street Newark, NJ 07102 | ||
| DISTRIBUTOR | Prudential Investment Management Services LLC | Gateway Center Three 14th Floor 100 Mulberry Street Newark, NJ 07102 | ||
| CUSTODIAN | State Street Bank and Trust Company | One Heritage Drive North Quincy, MA 02171 | ||
| TRANSFER AGENT | Prudential Mutual Fund Services LLC | PO Box 8098 Philadelphia, PA 19101 | ||
| INDEPENDENT AUDITORS | KPMG LLP | 757 Third Avenue New York, NY 10017 | ||
| FUND COUNSEL | Shearman & Sterling LLP | 599 Lexington Avenue New York, NY 10022 | ||
| Dryden Municipal Series Fund/New York Money Market Series | ||||||||||||
NASDAQ | PBNXX | |||||||||||
CUSIP | 262468838 | |||||||||||
An investor should consider the investment objectives, risks, and charges and expenses of the Series carefully before investing. The prospectus for the Series contains this and other information about the Series. An investor may obtain a prospectus by visiting our website at www.jennisondryden.com or by calling us at (800) 225-1852. The prospectus should be read carefully before investing. |
The views expressed in this report and information about the Series’ portfolio holdings are for the period covered by this report and are subject to change thereafter. The accompanying financial statements as of February 29, 2004 were not audited and, accordingly, no auditor’s opinion is expressed on them. |
Quantitative Management and Prudential Fixed Income are units of Prudential Investment Management, Inc. (PIM). Jennison Associates and PIM are Registered Investment Advisors and Prudential Financial Companies. |
Mutual Funds:
| ARE NOT INSURED BY THE FDIC OR ANY FEDERAL GOVERNMENT AGENCY | MAY LOSE VALUE | ARE NOT A DEPOSIT OF OR GUARANTEED BY ANY BANK OR ANY BANK AFFILIATE |
| Dryden Municipal Series Fund/New York Money Market Series | ||||||||
NASDAQ | PBNXX | |||||||
CUSIP | 262468838 | |||||||
MF127E2 IFS-A090102 Ed. 04/2004
Dryden Municipal Series Fund/Pennsylvania Series
| FEBRUARY 29, 2004 | SEMIANNUAL REPORT | |

FUND TYPE
Municipal bond
OBJECTIVE
Maximize current income that is exempt from the Commonwealth of Pennsylvania personal income tax and federal income tax, consistent with the preservation of capital
This report is not authorized for distribution to prospective investors unless preceded or accompanied by a current prospectus.
The views expressed in this report and information about the Series’ portfolio holdings are for the period covered by this report and are subject to change thereafter.
JennisonDryden is a registered trademark of The Prudential Insurance Company of America.

Dear Shareholder,
April 19, 2004
As the stock market slowed in the first quarter of 2004 following its particularly strong performance in 2003, some investors still seemed to be watching developments from the sidelines. Though the economy appears sound, given the unsettled global political climate and uncertain job growth in the United States, we can understand that some investors may want to remain cautious. For those with long-term goals, however, keeping assets in short-term savings and money market accounts may be a losing proposition as meager yields will be eroded by taxes, and even low annual inflation will reduce purchasing power. A broadly diversified asset allocation can help protect you against inflation and increase your chances of participating in economic growth.
We recommend that you develop a diversified asset allocation strategy in consultation with a financial professional who knows you and who understands your reasons for investing, the time you have to reach your goals, and the amount of risk you are comfortable assuming. JennisonDryden mutual funds offer a wide range of investment choices, and your financial professional can help you choose the appropriate funds to implement your strategy.
Whether you are investing for your retirement, your children’s education, or some other purpose, JennisonDryden mutual funds offer the experience, resources, and professional discipline of three leading asset managers that can make a difference for you. JennisonDryden funds are managed by Prudential Investment Management’s public equity and fixed income asset management businesses. The equity funds are managed by Jennison Associates and Quantitative Management. Prudential Fixed Income manages the JennisonDryden fixed income and money market funds.
Thank you for your confidence in JennisonDryden mutual funds.
Sincerely,

Judy A. Rice, President
Dryden Municipal Series Fund/Pennsylvania Series
| Dryden Municipal Series Fund/Pennsylvania Series | 1 |
Your Series’ Performance
Series objective
The investment objective of the Dryden Municipal Series Fund/Pennsylvania Series (the Series) is to maximize current income that is exempt from Commonwealth of Pennsylvania personal income tax and federal income tax, consistent with the preservation of capital. There can be no assurance that the Series will achieve its investment objective.
Performance data quoted represents past performance and is not indicative of future results. The investment return and principal value of an investment will fluctuate so that an investor’s shares, when redeemed, may be worth more or less than their original cost. Current performance may be lower or higher than the performance data quoted. An investor may obtain current performance data to the most recent month-end by visiting our website at www.jennisondryden.com or by calling us at (800) 225-1852.
| Cumulative Total Returns1 as of 2/29/04 | |||||||||||||
| Six Months | One Year | Five Years | Ten Years | Since Inception2 | |||||||||
Class A | 6.43 | % | 6.12 | % | 28.82 | % | 69.99% (69.67) | 144.59% (143.65) | |||||
Class B | 6.29 | 5.75 | 27.10 | 64.46 (64.14) | 177.00 (169.55) | ||||||||
Class C | 6.16 | 5.49 | 25.51 | N/A | 63.87 (63.55) | ||||||||
Lehman Brothers Municipal Bond Index3 | 6.52 | 6.30 | 34.50 | 86.00 | *** | ||||||||
Lipper PA Muni Debt Funds Avg.4 | 6.14 | 5.79 | 26.72 | 68.64 | **** | ||||||||
| Average Annual Total Returns1 as of 3/31/04 | |||||||||||||
| One Year | Five Years | Ten Years | Since Inception2 | ||||||||||
Class A | 1.05 | % | 4.21 | % | 5.37% (5.35) | 6.15% (6.12) | |||||||
Class B | 0.11 | 4.64 | 5.45 (5.43) | 6.13 (5.95) | |||||||||
Class C | 3.75 | 4.54 | N/A | 5.16 (5.14) | |||||||||
Lehman Brothers Municipal Bond Index3 | 5.86 | 6.00 | 6.81 | *** | |||||||||
Lipper PA Muni Debt Funds Avg.4 | 5.24 | 4.71 | 5.78 | **** | |||||||||
| Distributions and Yields1 as of 2/29/04 | ||||||||||||
| Taxable Equivalent 30-Day Yield5 at Tax Rates of | ||||||||||||
| Total Distributions Paid for Six Months | 30-Day SEC Yield | 33% | 35% | |||||||||
Class A | $ | 0.19 | 2.47 | % | 3.80 | % | 3.92 | % | ||||
Class B | $ | 0.17 | 2.30 | 3.54 | 3.65 | |||||||
Class C | $ | 0.16 | 2.05 | 3.16 | 3.25 | |||||||
1Source: Prudential Investments LLC and Lipper Inc. The cumulative total returns do not take into account applicable sales charges. If reflected, the applicable sales charges would reduce the cumulative total returns performance quoted. The average annual total returns do take into account applicable sales charges. Without the distribution and service (12b-1) fee waiver of 0.05% and 0.25% for Class A and Class C shares respectively,
| 2 | Visit our website at www.jennisondryden.com |
the returns for these classes would have been lower. During the period ended February 29, 2004, the Series charged a maximum front-end sales charge of 3% for Class A shares and a 12b-1 fee of up to 0.30% annually. Effective March 15, 2004, Class A shares are subject to a maximum front-end sales charge of 4.00%, a 12b-1 fee of up to 0.30% annually, and all investors who purchase Class A shares in an amount of $1 million or more and sell these shares within 12 months of purchase are subject to a contingent deferred sales charge (CDSC) of 1%. Class B shares are subject to a declining CDSC of 5%, 4%, 3%, 2%, 1%, and 1% for the first six years respectively after purchase and a 12b-1 fee of up to 0.50% annually. Approximately seven years after purchase, Class B shares will automatically convert to Class A shares on a quarterly basis. During the period ended February 29, 2004, Class C shares were subject to a front-end sales charge of 1%, a CDSC of 1% for shares redeemed within 18 months of purchase, and a 12b-1 fee of up to 1% annually. Class C shares purchased on or after February 2, 2004 are not subject to a front-end sales charge, the CDSC of 1% for Class C shares purchased on or after that date will apply for 12 months from the date of purchase, and the annual 12b-1 fee will remain up to 1%. The returns in the tables do not reflect the deduction of taxes that a shareholder would pay on fund distributions or following the redemption of fund shares. Without waiver of fees and/or expense subsidization, the Series’ returns would have been lower, as indicated in parentheses. 2Inception dates: Class A, 1/22/90; Class B, 4/3/87; and Class C, 8/1/94. 3The Lehman Brothers Municipal Bond Index is an unmanaged index of over 39,000 long-term investment-grade municipal bonds. It gives a broad look at how long-term investment-grade municipal bonds have performed. Investors cannot invest directly in an index. 4The Lipper Pennsylvania (PA) Muni Debt Funds Average (Lipper Average) represents returns based on an average return of all funds in the Lipper PA Muni Debt Funds category for the periods noted. Funds in the Lipper Average limit their assets to those securities that are exempt from taxation in Pennsylvania. 5Taxable equivalent yields reflect federal and applicable state tax rates. The returns for the Lehman Brothers Municipal Bond Index would be lower if they included the effects of sales charges, operating expenses of a mutual fund, or taxes. Returns for the Lipper Average reflect the deduction of operating expenses, but not sales charges or taxes. ***Lehman Brothers Municipal Bond Index Closest Month-End to Inception cumulative total returns as of 2/29/04 are 170.67% for Class A, 225.84% for Class B, and 88.34% for Class C. Lehman Brothers Municipal Bond Index Closest Month-End to Inception average annual total returns as of 3/31/04 are 7.26% for Class A, 7.17% for Class B, and 6.73% for Class C. ****Lipper Average Closest Month-End to Inception cumulative total returns as of 2/29/04 are 149.54% for Class A, 192.38% for Class B, and 72.04% for Class C. Lipper Average Closest Month-End to Inception average annual total returns as of 3/31/04 are 6.62% for Class A, 6.47% for Class B, and 5.70% for Class C.
| Five Largest Issuers expressed as a percentage of net assets as of 2/29/04 | |||
Schuylkill Cnty. Pennsylvania IDA Northeastern Pwr. | 7.1 | % | |
Pennsylvania State | 6.2 | ||
Allegheny County Pennsylvania San. Auth. Swr. | 5.4 | ||
Pennsylvania State IDA EDA | 4.9 | ||
Central Bucks Pennsylvania Sch. Dist. | 4.0 | ||
Issuers are subject to change.
| Dryden Municipal Series Fund/Pennsylvania Series | 3 |
| Portfolio Composition expressed as a percentage of net assets as of 2/29/04 | |||
General Obligation | 28.2 | % | |
Corporate-Backed IDB & PCR | 15.7 | ||
Healthcare | 11.4 | ||
Water & Sewer | 9.9 | ||
Education | 8.5 | ||
Transportation | 7.2 | ||
Prerefunded | 5.4 | ||
Other Muni | 4.9 | ||
Other | 3.4 | ||
Lease-Backed Certificate of Participation | 2.9 | ||
Solid Waste/Resource Recovery | 1.4 | ||
Special Tax/Assessment District | 0.7 | ||
Housing | 0.6 | ||
Cash & Equivalents | –0.2 | ||
Portfolio composition is subject to change.
| Credit Quality expressed as a percentage of net assets as of 2/29/04 | |||
Aaa | 60.0 | % | |
Aa | 13.2 | ||
A | 11.9 | ||
Baa | 9.4 | ||
NR | 5.7 | ||
Cash & Equivalents | –0.2 | ||
Source: Moody’s rating, defaulting to S&P when not rated.
Credit quality is subject to change.
| 4 | Visit our website at www.jennisondryden.com |
Portfolio of Investments
| FEBRUARY 29, 2004 | SEMI-ANNUAL REPORT | |
Dryden Municipal Series Fund
Pennsylvania Series
Portfolio of Investments
as of February 29, 2004 (Unaudited)
| Description (a) | Moody’s Rating | Interest Rate | Maturity Date | Principal Amount (000) | Value (Note1) | ||||||||
LONG-TERM INVESTMENTS 88.1% | |||||||||||||
Municipal Bonds | |||||||||||||
Allegheny Cnty. Hosp. Dev. | Aaa | 6.25% | 9/01/20 | $ | 1,750 | (c) | $ | 2,022,597 | |||||
Allegheny Cnty. Ind. Dev. | Baa1 | 6.70 | 12/01/20 | 1,500 | 1,547,940 | ||||||||
Allegheny Cnty. San. Auth. | |||||||||||||
M.B.I.A. | Aaa | 5.375 | 12/01/17 | 2,000 | 2,268,280 | ||||||||
M.B.I.A. | Aaa | 5.50 | 12/01/20 | 2,500 | 2,833,050 | ||||||||
M.B.I.A. | Aaa | 5.50 | 12/01/30 | 3,000 | 3,314,310 | ||||||||
Allentown Area Hosp. Auth. Rev., Sacred Heart Hosp. of Allentown, Ser. B | Baa3 | 6.75 | 11/15/15 | 890 | (c) | 897,209 | |||||||
Armstrong Cnty., G.O., M.B.I.A. | AAA(d) | 5.40 | 6/01/31 | 2,000 | 2,144,080 | ||||||||
Berks Cnty. Mun. Auth. Hosp. Rev., Reading Hosp. Med. Ctr. Proj., M.B.I.A. | Aaa | 5.70 | 10/01/14 | 1,250 | 1,489,938 | ||||||||
Bucks Cnty. Wtr. & Swr. Auth. Rev., Ser. A, A.M.B.A.C. | Aaa | 5.375 | 6/01/16 | 1,080 | 1,229,494 | ||||||||
Butler Cnty., G.O., F.G.I.C. | Aaa | 5.25 | 7/15/22 | 1,000 | 1,096,130 | ||||||||
Canon McMillan Sch. Dist., | Aaa | 5.50 | 12/01/29 | 3,000 | (f) | 3,313,080 | |||||||
Central Bucks Sch. Dist., G.O., | |||||||||||||
M.B.I.A. | Aaa | 5.00 | 5/15/15 | 3,600 | 4,022,100 | ||||||||
M.B.I.A. | Aaa | 5.00 | 5/15/16 | 2,000 | 2,219,520 | ||||||||
Dauphin Cnty., G.O., Ser. 2, A.M.B.A.C. | Aaa | 5.50 | 11/15/15 | 1,295 | 1,474,772 | ||||||||
Delaware Cnty. Auth. Rev., | A-(d) | 6.25 | 4/01/30 | 1,000 | 1,056,860 | ||||||||
Delaware Cnty. Ind. Dev. | |||||||||||||
Res. Recov. Facs., Ser. A | Baa3 | 6.00 | 1/01/09 | 500 | 545,365 | ||||||||
Res. Recov. Facs., Ser. A | Baa3 | 6.10 | 7/01/13 | 2,500 | 2,699,825 | ||||||||
Delaware River Port Auth. | |||||||||||||
F.G.I.C. | Aaa | 5.40 | 1/01/16 | 2,750 | 2,979,845 | ||||||||
Port Dist. Proj., Ser. B, F.S.A. | Aaa | 5.70 | 1/01/22 | 1,000 | 1,134,690 | ||||||||
Easton Area Sch. Dist., G.O., F.G.I.C. | Aaa | 5.00 | 3/15/15 | 2,360 | 2,632,533 | ||||||||
See Notes to Financial Statements.
| 6 | Visit our website at www.jennisondryden.com |
| Description (a) | Moody’s Rating | Interest Rate | Maturity Date | Principal Amount (000) | Value (Note 1) | ||||||||
Erie Parking Auth. Facs. Rev. Gtd., F.S.A. | Aaa | 5.00% | 9/01/26 | $ | 1,000 | $ | 1,056,570 | ||||||
Greater Johnstown Sch. Dist., G.O., Ser. B, M.B.I.A. | Aaa | 5.50 | 8/01/17 | 1,250 | 1,433,475 | ||||||||
Greencastle Antrim Sch. Dist., Rev., M.B.I.A., C.A.B.S., | Aaa | Zero | 1/01/12 | 1,000 | 761,130 | ||||||||
Hazleton Hlth. Svcs. Auth. Hosp. Rev., Hazleton | Ba2 | 5.625 | 7/01/17 | 1,000 | 885,860 | ||||||||
Kennett Cons. Sch. Dist., G.O., Ser. A, F.G.I.C. | Aaa | 5.50 | 2/15/16 | 1,035 | 1,186,793 | ||||||||
Lancaster Cnty. Hosp. Auth. Rev., Gen. Hosp. Proj. | A-(d) | 5.50 | 3/15/26 | 1,500 | 1,554,045 | ||||||||
Lancaster Ind. Dev. Auth. Rev., Garden Spot Vlge. | NR | 7.625 | 5/01/31 | 1,650 | 1,713,558 | ||||||||
Lebanon Cnty. Hlth. Facs. | Baa1 | 6.00 | 11/15/35 | 1,000 | 1,035,250 | ||||||||
Monroe Cnty. Hosp. Auth. Rev., Pocono Med. Ctr. | BBB+(d) | 6.00 | 1/01/43 | 750 | 787,050 | ||||||||
Montgomery Cnty., G.O. | Aaa | 5.25 | 9/15/16 | 2,895 | 3,264,547 | ||||||||
Mount Pleasant Bus. Dist. Auth. Hosp. Rev., Frick Hosp. | BBB(d) | 5.75 | 12/01/27 | 1,000 | 981,610 | ||||||||
Northampton Cnty. Gen. Purp. Auth. Rev., F.S.A. | Aaa | 5.75 | 10/01/18 | 3,910 | (c) | 4,719,174 | |||||||
Northampton Cnty. Higher Ed. Auth. Rev., Moravian Coll., A.M.B.A.C. | Aaa | 6.25 | 7/01/11 | 2,195 | 2,686,307 | ||||||||
Northumberland Cnty. Ind. Dev. Auth. Rev., Roaring Creek Wtr., A.M.T. | AA-(d) | 6.375 | 10/15/23 | 1,000 | 1,023,910 | ||||||||
Owen J. Roberts Sch. Dist., G.O., F.S.A. | Aaa | 5.50 | 8/15/19 | 1,520 | 1,726,325 | ||||||||
Penn Hills Twnshp., G.O., Ser. A, A.M.B.A.C. | Aaa | Zero | 6/01/10 | 1,535 | 1,277,765 | ||||||||
Pennridge Sch. Dist., G.O., M.B.I.A. | Aaa | 5.125 | 2/15/19 | 1,610 | 1,773,496 | ||||||||
Pennsylvania Econ. Dev. Auth., Wste. Wtr. Treatment Rev., Sun Co., R & M Proj., Ser. A, A.M.T. | Baa2 | 7.60 | 12/01/24 | 2,000 | 2,119,780 | ||||||||
See Notes to Financial Statements.
| Dryden Municipal Series Fund/Pennsylvania Series | 7 |
Portfolio of Investments
as of February 29, 2004 (Unaudited) Cont’d.
| Description (a) | Moody’s Rating | Interest Rate | Maturity Date | Principal Amount (000) | Value (Note 1) | ||||||||
Pennsylvania Econ. Dev. Fin. Auth., Exempt Facs. Rev., Amtrak Proj., Ser. A, A.M.T. | A3 | 6.25% | 11/01/31 | $ | 2,000 | $ | 2,032,500 | ||||||
Pennsylvania St. Higher Edl. Facs. Auth. Rev., | |||||||||||||
Drexel Univ. | A2 | 6.00 | 5/01/29 | 2,500 | 2,708,500 | ||||||||
Philadelphia Univ. | AA(d) | 6.10 | 6/01/30 | 195 | 220,939 | ||||||||
Temple Univ., 1st Ser., M.B.I.A. | Aaa | 5.00 | 4/01/21 | 2,265 | 2,415,735 | ||||||||
Thomas Jefferson Univ. | A1 | 5.50 | 1/01/17 | 1,000 | 1,117,080 | ||||||||
Ursinus Coll., Ser. A | A-(d) | 5.90 | 1/01/27 | 1,925 | (c) | 2,191,016 | |||||||
Pennsylvania St. Ind. Dev. Auth. Rev., Econ. Dev., | |||||||||||||
A.M.B.A.C. | Aaa | 5.50 | 7/01/17 | 4,000 | 4,585,560 | ||||||||
A.M.B.A.C. | Aaa | 5.50 | 7/01/20 | 2,750 | 3,112,120 | ||||||||
Pennsylvania St. Tpke. Comn. Oil Franchise Tax Rev., | |||||||||||||
Ser. A, A.M.B.A.C. | Aaa | 5.25 | 12/01/18 | 1,065 | 1,185,781 | ||||||||
Ser. A, A.M.B.A.C., E.T.M. | Aaa | 5.25 | 12/01/18 | 1,435 | (c) | 1,628,266 | |||||||
Pennsylvania St. Tpke. Comn. Tpke. Rev., Rfdg., Ser. S | Aa3 | 5.50 | 6/01/15 | 1,000 | 1,141,190 | ||||||||
Pennsylvania St., G.O., Ser. 2 | Aa2 | 5.00 | 8/01/17 | 4,000 | 4,360,120 | ||||||||
Philadelphia Auth. Ind. Dev. Arpt., Rev., A.M.T. | NR | 5.50 | 1/01/24 | 2,500 | 2,018,475 | ||||||||
Philadelphia Auth. Ind. Dev. Lease Rev., Ser. B, F.S.A. | Aaa | 5.50 | 10/01/18 | 2,000 | 2,281,460 | ||||||||
Philadelphia Gas Wks. Rev., 16th Ser., F.S.A. | Aaa | 5.25 | 7/01/07 | 4,000 | 4,458,280 | ||||||||
Philadelphia Hosps. & Higher Ed. Facs. Auth. Hosp. Rev., Grad. Hlth. Sys. | Ca | 7.25 | 7/01/18 | 1,807 | (e) | 18 | |||||||
Philadelphia Mun. Auth. Rev., Lease, Ser. A, F.S.A. | Aaa | 5.25 | 5/15/13 | 4,000 | 4,603,320 | ||||||||
Philadelphia Parking Auth. Rev., Arpt., F.S.A. | Aaa | 5.625 | 9/01/19 | 2,500 | 2,844,675 | ||||||||
Philadelphia, G.O., F.G.I.C. | Aaa | 5.125 | 5/15/14 | 1,800 | 2,013,228 | ||||||||
Pittsburgh Urban Redev. Auth., Mtge. Rev., Ser. A, A.M.T. | Aa1 | 6.25 | 10/01/28 | 820 | 865,740 | ||||||||
Pittsburgh Wtr. & Swr. Auth., Wtr. & Swr. Sys. Rev., Ser. A, F.G.I.C. | Aaa | 6.50 | 9/01/13 | 4,000 | 4,998,440 | ||||||||
See Notes to Financial Statements.
| 8 | Visit our website at www.jennisondryden.com |
| Description (a) | Moody’s Rating | Interest Rate | Maturity Date | Principal Amount (000) | Value (Note 1) | |||||||
Puerto Rico Comnwlth., | ||||||||||||
Pub. Impvt. Rfdg., M.B.I.A. | Aaa | 7.00% | 7/01/10 | $ | 720 | $ | 905,594 | |||||
Rites, PA 625, A.M.B.A.C. | NR | 12.98(b) | 7/01/10 | 2,015 | 3,053,813 | |||||||
Rites, PA 642A, M.B.I.A. | NR | 10.50(b) | 7/01/10 | 1,500 | 2,068,620 | |||||||
Schuylkill Cnty. Ind. Dev. Auth. Rev., Pine Grove Landfill, Inc., A.M.T. | BBB(d) | 5.10 | 10/01/19 | 2,000 | 2,159,620 | |||||||
Springfield Sch. Dist., Delaware Cnty., G.O., F.S.A. | Aaa | 5.50 | 3/15/17 | 2,450 | 2,801,942 | |||||||
Union Cnty. Higher Ed. Facs. Fin. Auth. Univ. Rev., Bucknell Univ., Ser. A | Aa3 | 5.25 | 4/01/20 | 1,080 | 1,195,052 | |||||||
Unity Twnshp. Mun. Auth., Gtd. Swr. Rev., A.M.B.A.C., C.A.B.S. | Aaa | Zero | 11/01/12 | 1,035 | 762,516 | |||||||
Virgin Islands Pub. Fin. Auth. Rev., Gross Rcpts. Taxes Ln. Nts., F.S.A. | Aaa | 5.00 | 10/01/22 | 1,000 | 1,080,250 | |||||||
Washington Cnty. Hosp. Auth. Rev., Monongahela Valley Hosp. | A3 | 6.25 | 6/01/22 | 2,400 | 2,651,040 | |||||||
Westmoreland Cnty. Ind. Rev. Gtd., Valley Landfill Proj., A.M.T. | BBB(d) | 5.10 | 5/01/18 | 1,000 | 1,080,380 | |||||||
Total long-term investments | 139,449,533 | |||||||||||
SHORT-TERM INVESTMENTS 11.0% | ||||||||||||
Allegheny Cnty. Hosp. Dev. Auth. Rev., Presbyterian Univ. Hosp., Ser. B1, F.R.W.D. | VMIG1 | 0.98 | 3/04/04 | 1,065 | 1,065,000 | |||||||
Geisinger Auth. Hlth. Sys., Geisinger Hlth. Sys., F.R.D.D. | VMIG1 | 0.98 | 3/01/04 | 2,500 | 2,500,000 | |||||||
Mun. Secs. Trust Certs., G.O., Ser. 2000-110, Class A, F.R.D.D. | A-1(d) | 1.00 | 3/01/04 | 650 | 650,000 | |||||||
Pennsylvania St. Higher Edl. Facs. Auth. Rev., Carnegie Mellon Univ., Ser. B, F.R.D.D | A-1+(d) | 0.98 | 3/01/04 | 700 | 700,000 | |||||||
Philadelphia Hosps. & Higher Ed. Facs. Auth. Hosp. Rev., Children’s Hosp. Proj., Ser. A, F.R.D.D. | VMIG1 | 0.98 | 3/01/04 | 1,200 | 1,200,000 | |||||||
See Notes to Financial Statements.
| Dryden Municipal Series Fund/Pennsylvania Series | 9 |
Portfolio of Investments
as of February 29, 2004 (Unaudited) Cont’d.
| Description (a) | Moody’s Rating | Interest Rate | Maturity Date | Principal Amount (000) | Value (Note 1) | |||||||
Schuylkill Cnty. Ind. Dev. Auth. Res. Recov. Rev., | ||||||||||||
Northeastern Pwr. Co., Ser. A, F.R.D.D. | A-1+(d) | 0.98% | 3/01/04 | $ | 8,680 | $ | 8,680,000 | |||||
Northeastern Pwr., Ser. B, A.M.T., F.R.D.D. | A-1+(d) | 1.08 | 3/01/04 | 2,600 | 2,600,000 | |||||||
Total short-term investments (cost $17,395,000) | 17,395,000 | |||||||||||
Total Investments 99.1% | 156,844,533 | |||||||||||
Other assets in excess of liabilities 0.9% | 1,366,377 | |||||||||||
Net Assets 100% | $ | 158,210,910 | ||||||||||
| (a) | The following abbreviations are used in portfolio descriptions: |
A.M.B.A.C.—American Municipal Bond Assurance Corporation.
A.M.T.—Alternative Minimum Tax.
C.A.B.S.—Capital Appreciation Bonds.
E.T.M.—Escrowed to Maturity.
F.G.I.C.—Financial Guaranty Insurance Company.
F.R.D.D.—Floating Rate (Daily) Demand Note (g).
F.R.W.D.—Floating Rate (Weekly) Demand Note (g).
F.S.A.—Financial Security Assurance.
G.O.—General Obligation.
M.B.I.A.—Municipal Bond Insurance Corporation.
| (b) | Inverse floating rate bond. The coupon is inversely indexed to a floating interest rate. The rate shown is the rate at period end. |
| (c) | Prerefunded issues are secured by escrowed cash and/or direct U.S. guaranteed obligations. |
| (d) | Standard & Poor’s Rating. |
| (e) | Issuer in default on interest payments. Non-income producing security. |
| (f) | Partial principal amount pledged as collateral for financial futures contracts. |
| (g) | For purposes of amortized cost valuation, the maturity date of Floating Rate Demand Notes are considered to be the later of the next date on which the security can be redeemed at par, or the next date on which the rate of interest is adjusted. |
NR—Not Rated by Moody’s or Standard & Poor’s.
The Fund’s current Statement of Additional Information contains a description of Moody’s and Standard & Poor’s ratings.
See Notes to Financial Statements.
| 10 | Visit our website at www.jennisondryden.com |
Financial Statements
| FEBRUARY 29, 2004 | SEMI-ANNUAL REPORT | |
Dryden Municipal Series Fund
Pennsylvania Series
Statement of Assets and Liabilities
as of February 29, 2004 (Unaudited)
Assets | |||
Investments, at value (cost $148,472,834) | $ | 156,844,533 | |
Interest receivable | 1,963,337 | ||
Receivable for Series shares sold | 39,933 | ||
Prepaid expenses | 4,338 | ||
Total assets | 158,852,141 | ||
Liabilities | |||
Payable for Series shares reacquired | 207,813 | ||
Unrealized depreciation on interest rate swaps | 139,713 | ||
Accrued expenses | 66,985 | ||
Management fee payable | 62,518 | ||
Dividends payable | 59,988 | ||
Distribution fee payable | 38,824 | ||
Payable to custodian | 28,188 | ||
Due to broker-variation margin | 27,275 | ||
Deferred trustees’ fees | 9,927 | ||
Total liabilities | 641,231 | ||
Net Assets | $ | 158,210,910 | |
Net assets were comprised of: | |||
Shares of beneficial interest, at par | $ | 151,888 | |
Paid-in capital in excess of par | 149,137,875 | ||
| 149,289,763 | |||
Accumulated net investment loss | 102,847 | ||
Accumulated net realized gain on investments | 640,088 | ||
Net unrealized appreciation on investments | 8,178,212 | ||
Net assets, February 29, 2004 | $ | 158,210,910 | |
See Notes to Financial Statements
| 12 | Visit our website at www.jennisondryden.com |
Class A | |||
Net asset value and redemption price per share | |||
($121,149,859 ÷ 11,629,972 shares of beneficial interest issued and outstanding) | $ | 10.42 | |
Maximum sales charge (3% of offering price)* | 0.32 | ||
Maximum offering price to public | $ | 10.74 | |
Class B | |||
Net asset value, offering price and redemption price per share | $ | 10.41 | |
Class C | |||
Net asset value, offering price and redemption price per share | $ | 10.41 | |
| * | Effective March 15, 2004 the maximum sales charge was changed to 4% of offering price. |
See Notes to Financial Statements
| Dryden Municipal Series Fund/Pennsylvania Series | 13 |
Statement of Operations
Six Months Ended February 29, 2004 (Unaudited)
Net Investment Income | ||||
Income | ||||
Interest | $ | 3,620,908 | ||
Expenses | ||||
Management fee | 395,247 | |||
Distribution fee—Class A | 151,359 | |||
Distribution fee—Class B | 89,548 | |||
Distribution fee—Class C | 4,472 | |||
Custodian’s fees and expenses | 54,000 | |||
Transfer agent’s fees and expenses | 41,000 | |||
Reports to shareholders | 35,000 | |||
Registration fees | 17,000 | |||
Legal fees and expenses | 12,000 | |||
Audit fee | 11,000 | |||
Trustees’ fees | 6,000 | |||
Miscellaneous | 4,062 | |||
Total expenses | 820,688 | |||
Less: Custodian fee credit (Note 1) | (176 | ) | ||
Net expenses | 820,512 | |||
Net investment income | 2,800,396 | |||
Realized And Unrealized Gain (Loss) On Investments | ||||
Net realized gain (loss) on: | ||||
Investment transactions | 1,321,357 | |||
Financial futures transactions | (85,299 | ) | ||
Interest rate swaps | (9,158 | ) | ||
Options written | 19,075 | |||
| 1,245,975 | ||||
Net change in unrealized appreciation (depreciation) on: | ||||
Investments | 5,944,272 | |||
Financial futures contracts | (5,726 | ) | ||
Interest rate swaps | (139,713 | ) | ||
| 5,798,833 | ||||
Net gain on investments | 7,044,808 | |||
Net Increase In Net Assets Resulting From Operations | $ | 9,845,204 | ||
See Notes to Financial Statements
| 14 | Visit our website at www.jennisondryden.com |
Statement of Changes in Net Assets
(Unaudited)
Six Months Ended February 29, 2004 | Year Ended August 31, 2003 | |||||||
Increase (Decrease) In Net Assets | ||||||||
Operations | ||||||||
Net investment income | $ | 2,800,396 | $ | 6,669,997 | ||||
Net realized gain on investment transactions | 1,245,975 | 5,168,558 | ||||||
Net change in unrealized appreciation (depreciation) on investments | 5,798,833 | (7,711,472 | ) | |||||
Net increase in net assets resulting from operations | 9,845,204 | 4,127,083 | ||||||
Dividends and distributions (Note 1) | ||||||||
Dividends from net investment income | ||||||||
Class A | (2,339,158 | ) | (5,085,982 | ) | ||||
Class B | (647,256 | ) | (1,482,488 | ) | ||||
Class C | (19,851 | ) | (39,632 | ) | ||||
| (3,006,265 | ) | (6,608,102 | ) | |||||
Distributions from net realized gains | ||||||||
Class A | (4,490,929 | ) | (259,633 | ) | ||||
Class B | (1,333,635 | ) | (83,960 | ) | ||||
Class C | (42,249 | ) | (2,175 | ) | ||||
| (5,866,813 | ) | (345,768 | ) | |||||
Series share transactions (Net of share conversions) (Note 6) | ||||||||
Net proceeds from shares sold | 5,280,906 | 13,641,605 | ||||||
Net asset value of shares issued in reinvestment of dividends and distributions | 5,511,651 | 3,912,676 | ||||||
Cost of shares reacquired | (13,037,488 | ) | (23,269,103 | ) | ||||
Net decrease in net assets from Series share transactions | (2,244,931 | ) | (5,714,822 | ) | ||||
Total decrease | (1,272,805 | ) | (8,541,609 | ) | ||||
Net Assets | ||||||||
Beginning of period | 159,483,715 | 168,025,324 | ||||||
End of period(a) | $ | 158,210,910 | $ | 159,483,715 | ||||
(a) Includes undistributed net investment income of: | $ | 102,847 | $ | 308,716 | ||||
See Notes to Financial Statements
| Dryden Municipal Series Fund/Pennsylvania Series | 15 |
Notes to Financial Statements
(Unaudited)
Dryden Municipal Series Fund (the “Fund”), is registered under the Investment Company Act of 1940, as an open-end management investment company. The Fund was organized as a Massachusetts business trust on May 18, 1984 and consists of six series. These financial statements relate only to Pennsylvania Series (the “Series”). The financial statements of the other series are not presented herein. The assets of each are invested in separate, independently managed portfolios. The Series commenced investment operations on April 3, 1987. The Series’ investment objective is to maximize current income that is exempt from Commonwealth of Pennsylvania personal income tax and federal income tax, consistent with the preservation of capital. This means the Series invests at least 80% of the Series’ investments in Pennsylvania state and local municipal bonds, which are debt obligations or fixed income securities, including notes, commercial paper and other securities, as well as obligations of other issuer (such as issuers located in Puerto Rico, the Virgin Islands and Guam) that pay interest income that is tax exempt from those taxes. The ability of the issuers of the securities held by the Series to meet their obligations may be affected by economic or political developments in a specific state, industry or region.
Note 1. Accounting Policies
The following is a summary of significant accounting policies followed by the Fund and the Series, in the preparation of its financial statements.
Securities Valuations: The Series values municipal securities (including commitments to purchase such securities on a “when-issued” basis) as of the close of trading on the New York Stock Exchange, on the basis of prices provided by a pricing service which uses information with respect to transactions in comparable securities and various relationships between securities in determining values. Securities listed on a securities exchange (other than options on securities and indices) are valued at the last sale price on such exchange on the day of valuation or, if there was no sale on such day, at the mean between the last reported bid and asked prices, or at the last bid price on such day in the absence of an asked price. Securities that are actively traded in the over-the-counter market, including listed securities for which the primary market is believed by Prudential Investments LLC (“PI” or “Manager”) in consultation with the subadvisor, to be over-the-counter, are valued at market value using prices provided by an independent pricing agent or principal market maker. Futures contracts and options thereon traded on a commodities exchange or board of trade are valued at the last sale price at the close of trading on such exchange or board of trade or, if
| 16 | Visit our website at www.jennisondryden.com |
there was no sale on the applicable commodities exchange or board of trade on such day, at the mean between the most recently quoted prices on such exchange or board of trade or at the last bid price in the absence of an asked price. Securities for which reliable market quotations are not readily available or for which the pricing service does not provide a valuation methodology, or does not present fair value, are valued at fair value in accordance with Board of Trustee’s approved fair valuation procedures.
Short-term securities which mature in sixty days or less are valued at amortized cost, which approximates market value. The amortized cost method involves valuing a security at its cost on the date of purchase and thereafter assuming a constant amortization to maturity of the difference between the principal amount due at maturity and cost. Short-term securities which mature in more than sixty days are valued at current market quotations.
Financial Futures Contracts: A financial futures contract is an agreement to purchase (long) or sell (short) an agreed amount of securities at a set price for delivery on a future date. Upon entering into a financial futures contract, the Series is required to pledge to the broker an amount of cash and/or other assets equal to a certain percentage of the contract amount. This amount is known as the “initial margin.” Subsequent payments, known as “variation margin,” are made or received by the Series each day, depending on the daily fluctuations in the value of the underlying security. Such variation margin is recorded for financial statement purposes on a daily basis as unrealized gain or loss. When the contract expires or is closed, the gain or loss is realized and is presented in the Statement of Operations as net realized gain or loss on financial futures transactions.
The Series invests in financial futures contracts in order to hedge its existing portfolio securities, or securities the Series intends to purchase, against fluctuations in value caused by changes in prevailing interest rates or market conditions. Should interest rates move unexpectedly, the Series may not achieve the anticipated benefits of the financial futures contracts and may realize a loss. The use of futures transactions involves the risk of imperfect correlation in movements in the price of futures contracts, interest rates and the underlying hedged assets.
Options: The Series may either purchase or write options in order to hedge against adverse market movements or fluctuations in value caused by changes in prevailing interest rates with respect to securities which the Series currently owns or intends to purchase. The Series’ principal reason for writing options is to realize, through receipt of premiums, a greater current return than would be realized on the underlying security alone. When the Series purchases an option, it pays a premium and an
| Dryden Municipal Series Fund/Pennsylvania Series | 17 |
amount equal to that premium is recorded as an asset. When the Series writes an option, it receives a premium and an amount equal to that premium is recorded as a liability. The asset or liability is adjusted daily to reflect the current market value of the option.
If an option expires unexercised, the Series realizes a gain or loss to the extent of the premium received or paid. If an option is exercised, the premium received or paid is recorded as an adjustment to the proceeds from the sale or the cost of the purchase in determining whether the Series has realized a gain or loss. The difference between the premium and the amount received or paid on effecting a closing purchase or sale transaction is also treated as a realized gain or loss. Gain or loss on purchased options is included in net realized gain or loss on investment transactions. Gain or loss on written options is presented separately as net realized gain or loss on options written.
The Series, as writer of an option, may have no control over whether the underlying securities may be sold (called) or purchased (put). As a result, the Series bears the market risk of an unfavorable change in the price of the security underlying the written option. The Series, as purchaser of an option, bears the risk of the potential inability of the counterparties to meet the terms of their contracts.
Interest Rate Swaps: The Series may enter into interest rate swaps. In a simple interest rate swap, one investor pays a floating rate of interest on a notional principal amount and receives a fixed rate of interest on the same notional principal amount for a specified period of time. Alternatively, an investor may pay a fixed rate and receive a floating rate. Net interest payments/receipts are included in interest income in the Statement of Operations. Interest rate swaps were conceived as asset /liability management tools. In more complex swaps, the notional principal amount may decline (or amortize) over time.
During the term of the swap, changes in the value of the swap are recorded as unrealized gains or losses by “marking-to-market” to reflect the market value of the swap. When the swap is terminated, the Series will record a realized gain or loss equal to the difference between the proceeds from (or cost of) the closing transaction and the Series’ basis in the contract, if any.
The Series is exposed to credit loss in the event of non-performance by the other party to the interest rate swap. However, the Series does not anticipate non-performance by any counterparty.
Written options, future contracts and swap contracts involve elements of both market and credit risk in excess of the amounts reflected on the Statement of Assets and Liabilities.
| 18 | Visit our website at www.jennisondryden.com |
Inverse Floaters: The Series invests in variable rate securities commonly called “inverse floaters”. The interest rates on these securities have an inverse relationship to the interest rate of other securities or the value of an index. Changes in interest rates on the other security or index inversely affect the rate paid on the inverse floater, and the inverse floater’s price will be more volatile than that of a fixed-rate bond. Additionally, some of these securities contain a “leverage factor” whereby the interest rate moves inversely by a “factor” to the benchmark rate. Certain interest rate movements and other market factors can substantially affect the liquidity of inverse floating rate notes.
Securities Transactions and Net Investment Income: Securities transactions are recorded on the trade date. Realized gains or losses from investment on sales of portfolio securities are calculated on the identified cost basis. Interest income, including amortization of premium and accretion of discount on debt securities, as required, is recorded on the accrual basis. Expenses are recorded on the accrual basis.
Net investment income or loss (other than distribution fees which are charged directly to respective class) and unrealized and realized gains or losses are allocated daily to each class of shares based upon the relative proportion of net assets of each class at the beginning of the day.
Federal Income Taxes: For federal income tax purposes, each series in the Fund is treated as a separate taxpaying entity. It is the Series’ policy to continue to meet the requirements of the Internal Revenue Code applicable to regulated investment companies and to distribute all of its taxable net income and capital gains, if any, to its shareholders. Therefore, no federal income tax provision is required.
Dividends and Distributions: The Series declares daily dividends from net investment income. Payment of dividends is made monthly. Distributions of net capital gains, if any, are made annually. Dividends and distributions to shareholders, which are determined in accordance with federal income tax regulations and which may differ from generally accepted accounting principles, are recorded on the ex-dividend date. Permanent book/tax differences relating to income and gains are reclassified amongst undistributed net investment income, accumulated net realized gain or loss and paid-in capital in excess of par, as appropriate.
Custody Fee Credits: The Fund has an arrangement with its custodian bank, whereby uninvested monies earn credits which reduce the fees charged by the custodian. Such custody fee credits are presented as a reduction of gross expenses in the accompanying Statement of Operations.
| Dryden Municipal Series Fund/Pennsylvania Series | 19 |
Estimates: The preparation of the financial Statements requires management to make estimates and assumptions that affect the reported amounts and disclosures in the financial statements. Actual results could differ from those estimates.
Note 2. Agreements
The Fund has a management agreement with PI. Pursuant to this agreement, PI has responsibility for all investment advisory services and supervises the subadvisor’s performance of such services. PI has entered into a subadvisory agreement with Prudential Investment Management, Inc. (“PIM”). The subadvisory agreement provides that PIM furnishes investment advisory services in connection with the management of the Series. In connection therewith, PIM is obligated to keep certain books and records of the Series. PI pays for the services of PIM, the cost of compensation of officers of the Series, occupancy and certain clerical and bookkeeping costs of the Series. The Series bears all other costs and expenses.
The management fee paid PI is computed daily and payable monthly, at an annual rate of .50 of 1% of the average daily net assets of the Series.
The Series has a distribution agreement with Prudential Investment Management Services LLC (“PIMS”), which acts as the distributor of the Series. The Series compensated PIMS for distributing and servicing the Series’ Class A, Class B and Class C shares, pursuant to plans of distribution (the “Class A, B and C Plans”), regardless of expenses actually incurred by PIMS. The distribution fees are accrued daily and payable monthly. No distribution or service fees were paid to PIMS as distributor of the Class Z shares of the Series.
Pursuant to the Class A, B and C Plans, the Series compensates PIMS for distribution-related activities at an annual rate of up to .30 of 1%, .50 of 1% and up to 1%, of the average daily net assets of the Class A, B and C shares, respectively. PIMS contractually agreed to limit such fees to .25 of 1% and .75 of 1% of the Class A shares and Class C shares, respectively.
PIMS has advised the Series that they have received approximately $24,500 and $1,800 in front-end sales charges resulting from sales of Class A and Class C shares, respectively during the six months ended February 29, 2004. From these fees, PIMS paid such sales charges to affiliated broker-dealers, which in turn paid commissions to salespersons and incurred other distribution costs.
| 20 | Visit our website at www.jennisondryden.com |
PIMS has advised the Series that for the six months ended February 29, 2004, they received approximately $19,900 and $0 in contingent deferred sales charges imposed upon certain redemptions by Class B and Class C shareholders, respectively.
PI, PIM and PIMS are indirect, wholly-owned subsidiaries of Prudential Financial, Inc. (“Prudential”).
The Series, along with other affiliated registered investment companies (the “Funds”), is a party to a syndicated credit agreement (“SCA”) with a group of banks. For the six months ended February 29, 2004, the SCA provides for a commitment of $800 million and allows the Funds to increase the commitment to $1 billion, if necessary. Interest on any borrowings under the SCA will be incurred at market rates. The Funds pay a commitment fee of .08 of 1% of the unused portion of the SCA. The commitment fee is accrued daily and paid quarterly and is allocated to the Funds pro rata based on net assets. The purpose of the SCA is to serve as an alternative source of funding for capital share redemptions. The expiration date of the SCA is April 30, 2004. Effective May 1, 2004, the commitment will be reduced to $500 million. All other terms and conditions will remain the same. The expiration of the renewed SCA will be October 29, 2004. The Series did not borrow any amounts pursuant to the SCA during the six months ended February 29, 2004.
Note 3. Other Transactions with Affiliates
Prudential Mutual Fund Services LLC (“PMFS”), an affiliate of PI and an indirect, wholly-owned subsidiary of Prudential, serves as the Fund’s transfer agent. During the six months ended February 29, 2004, the Series incurred fees of approximately $31,000 for the services of PMFS. As of February 29, 2004, approximately $5,100 of such fees were due to PMFS. Transfer agent fees and expenses in the Statement of Operations include certain out-of-pocket expenses paid to nonaffiliates, where applicable.
The Series pays networking fees to affiliated and unaffiliated broker/dealers. These networking fees are payments made to broker/dealers that clear mutual fund transactions through a national clearing system. The Series incurred approximately $2,100 in total networking fees, of which the amount relating to the services of Wachovia Securities, LLC (“Wachovia”), an affiliate of PI, was approximately $2,000 for the six months ended February 29, 2004. As of February 29, 2004, approximately $800 of such fees were due to Wachovia. These amounts are included in transfer agent’s fees and expenses in the Statement of Operations.
| Dryden Municipal Series Fund/Pennsylvania Series | 21 |
Note 4. Portfolio Securities
Purchases and sales of portfolio securities of the Series, excluding short-term investments, for the six months ended February 29, 2004, were $31,642,624 and $48,562,581 respectively.
During the six months ended February 29, 2004, the Series entered into financial futures contracts. Details of outstanding contracts at period end are as follows:
Number of Contracts | Type | Expiration Date | Value at February 29, 2004 | Value at Trade Date | Unrealized Depreciation | |||||||||||
| Short Positions: | ||||||||||||||||
| 76 | 2 yr. T-Note | March 2004 | $ | (16,388,688 | ) | $ | (16,343,370 | ) | $ | (45,318 | ) | |||||
| 27 | 10 yr. T-Note | June 2004 | (3,074,625 | ) | (3,066,169 | ) | (8,456 | ) | ||||||||
| $ | (53,774 | ) | ||||||||||||||
Transactions in options written during the six months ended February 29, 2004 were as follows:
Number of Contracts | Premiums Received | ||||||
Options outstanding as of August 31, 2003 | — | $ | — | ||||
Options written | 45 | 19,075 | |||||
Options expired | (45 | ) | (19,075 | ) | |||
Options outstanding as of February 29, 2004 | — | $ | — | ||||
The Series entered into interest rate swap agreements during the six months ended February 29, 2004. The Series paid a transaction fee for entering into the agreements. Details of the swap agreements outstanding as of February 29, 2004, were as follows:
Counterparty | Termination Date | Notional Amount (000) | Fixed Rate | Floating | Unrealized (Depreciation) | |||||||||
| Morgan Stanley & Co. Inc.(a) | 4/27/2014 | $ | 10,300 | 3.57 | % | BMA* LIBOR | $ | (106,236 | ) | |||||
| Morgan Stanley & Co. Inc.(a) | 4/27/2014 | 4,500 | 3.49 | % | BMA* LIBOR | (17,329 | ) | |||||||
| Morgan Stanley & Co. Inc.(a) | 5/27/2014 | 3,000 | 3.54 | % | BMA* LIBOR | (16,148 | ) | |||||||
| $ | (139,713 | ) | ||||||||||||
| (a) | Fund pays the fixed rate and receives the floating rate. |
| * | Bond Market Association™ |
| 22 | Visit our website at www.jennisondryden.com |
Note 5. Distributions and Tax Information
Distributions to shareholders, which are determined in accordance with federal income tax regulations and which may differ from generally accepted accounting principles, are recorded on the ex-dividend date.
The United States federal income tax basis of the Series’ investments and the net unrealized appreciation as of February 29, 2004 were as follows:
Tax Basis of Investments | Appreciation | Depreciation | Net Unrealized Appreciation | |||
| $148,434,441 | $10,672,301 | $2,262,209 | $8,410,092 |
The difference between book basis and tax basis is primarily attributable to the difference in the treatment of market discount for book and tax purposes.
Note 6. Capital
The Series offers Class A, Class B and Class C. Class A shares are sold with a front-end sales charge of up to 3%. Class A shares purchased on or after March 15, 2004 will be subject to a maximum initial sales charge of 4%. Effective on March 15, 2004, all investors who purchase Class A shares in an amount of $1 million or more and sell these shares within 12 months of purchase are subject to a contingent deferred sales charge (CDSC) of 1%, including investors who purchase their shares through broker-dealers affiliated with Prudential. Class B shares are sold with a contingent deferred sales charge which declines from 5% to zero depending on the period of time the shares are held. Prior to February 2, Class C shares were sold with a front-end sales charge of 1% and a contingent deferred sales charge of 1% during the first 18 months. Class C shares purchased on or after February 2, 2004 are not subject to an initial sales charge and the contingent deferred sales charge (CDSC) for Class C shares will be 12 months from the date of purchase. Class B shares automatically convert to Class A shares on a quarterly basis approximately seven years after purchase. A special exchange privilege is also available for shareholders who qualified to purchase Class A shares at net asset value.
The Series has authorized an unlimited number of shares of beneficial interest of each class at $.01 par value per share.
| Dryden Municipal Series Fund/Pennsylvania Series | 23 |
Transactions in shares of beneficial interest were as follows:
Class A | Shares | Amount | |||||
Six months ended February 29, 2004: | |||||||
Shares sold | 366,027 | $ | 3,808,782 | ||||
Shares issued in reinvestment of dividends and distributions | 413,562 | 4,255,182 | |||||
Shares reacquired | (1,070,987 | ) | (11,117,175 | ) | |||
Net increase (decrease) in shares outstanding before conversion | (291,398 | ) | (3,053,211 | ) | |||
Shares issued upon conversion from Class B | 162,720 | 1,693,374 | |||||
Net increase (decrease) in shares outstanding | (128,678 | ) | $ | (1,359,837 | ) | ||
Year ended August 31, 2003: | |||||||
Shares sold | 577,472 | $ | 6,114,262 | ||||
Shares issued in reinvestment of dividends and distributions | 289,529 | 3,046,813 | |||||
Shares reacquired | (1,672,133 | ) | (17,646,674 | ) | |||
Net increase (decrease) in shares outstanding before conversion | (805,132 | ) | (8,485,599 | ) | |||
Shares issued upon conversion from Class B | 568,514 | 6,059,699 | |||||
Net increase (decrease) in shares outstanding | (236,618 | ) | $ | (2,425,900 | ) | ||
Class B | |||||||
Six months ended February 29, 2004: | |||||||
Shares sold | 121,639 | $ | 1,272,360 | ||||
Shares issued in reinvestment of dividends and distributions | 118,077 | 1,214,284 | |||||
Shares reacquired | (180,652 | ) | (1,879,763 | ) | |||
Net increase (decrease) in shares outstanding before conversion | 59,064 | 606,881 | |||||
Shares issued upon conversion into Class A | (162,720 | ) | (1,693,374 | ) | |||
Net increase (decrease) in shares outstanding | (103,656 | ) | $ | (1,086,493 | ) | ||
Year ended August 31, 2003: | |||||||
Shares sold | 659,795 | $ | 6,960,180 | ||||
Shares issued in reinvestment of dividends and distributions | 79,835 | 839,644 | |||||
Shares reacquired | (493,507 | ) | (5,191,759 | ) | |||
Net increase (decrease) in shares outstanding before conversion | 246,123 | 2,608,065 | |||||
Shares issued upon conversion into Class A | (568,938 | ) | (6,059,699 | ) | |||
Net increase (decrease) in shares outstanding | (322,815 | ) | $ | (3,451,634 | ) | ||
Class C | |||||||
Six months ended February 29, 2004: | |||||||
Shares sold | 19,423 | $ | 199,764 | ||||
Shares issued in reinvestment of dividends and distributions | 4,100 | 42,185 | |||||
Shares reacquired | (3,926 | ) | (40,550 | ) | |||
Net increase (decrease) in shares outstanding | 19,597 | $ | 201,399 | ||||
Year ended August 31, 2003: | |||||||
Shares sold | 53,483 | $ | 567,163 | ||||
Shares issued in reinvestment of dividends and distributions | 2,492 | 26,219 | |||||
Shares reacquired | (40,576 | ) | (430,670 | ) | |||
Net increase (decrease) in shares outstanding | 15,399 | $ | 162,712 | ||||
| 24 | Visit our website at www.jennisondryden.com |
Note 7. Change in Independent Auditors
PricewaterhouseCoopers LLP was previously the independent auditors for the Fund. The decision to change the independent auditors was approved by the Audit Committee and by the Board of Trustees in a meeting held on September 2, 2003, resulting in KPMG LLP’s appointment as independent auditors of the Fund.
The reports on the financial statements of the Fund audited by PricewaterhouseCoopers LLP through the year ended August 31, 2003 did not contain an adverse opinion or disclaimer of opinion, and were not qualified or modified as to uncertainty, audit scope or accounting principles. There were no disagreements between the Fund and PricewaterhouseCoopers LLP on any matter of accounting principles or practices, financial statement disclosure, or auditing scope or procedures.
| Dryden Municipal Series Fund/Pennsylvania Series | 25 |
This Page Intentionally Left Blank
Financial Highlights
| FEBRUARY 29, 2004 | SEMI-ANNUAL REPORT | |
Dryden Municipal Series Fund
Pennsylvania Series
Financial Highlights
(Unaudited)
| Class A | ||||
Six Months Ended February 29, 2004 | ||||
Per Share Operating Performance: | ||||
Net Asset Value, Beginning Of Period | $ | 10.36 | ||
Income from investment operations | ||||
Net investment income | .19 | |||
Net realized and unrealized gain (loss) on investment transactions | .46 | |||
Total from investment operations | .65 | |||
Less Distributions | ||||
Dividends from net investment income | (.20 | ) | ||
Distributions from net realized gains | (.39 | ) | ||
Total distributions | (.59 | ) | ||
Net asset value, end of period | $ | 10.42 | ||
Total Investment Return(a): | 6.43 | % | ||
Ratios/Supplemental Data: | ||||
Net assets, end of period (000) | $ | 121,150 | ||
Average net assets (000) | $ | 121,753 | ||
Ratios to average net assets: | ||||
Expenses, including distribution and service (12b-1) fees(c) | .98 | %(e) | ||
Expenses, excluding distribution and service (12b-1) fees | .73 | %(e) | ||
Net investment income | 3.60 | %(e) | ||
For Class A, B, and C shares: | ||||
Portfolio turnover rate | 22 | %(f) | ||
| (a) | Total investment return does not consider the effects of sales loads. Total investment return is calculated assuming a purchase of shares on the first day and a sale on the last day of each year reported and includes reinvestment of dividends and distributions. Total returns for periods of less than one full year are not annualized. |
| (b) | Less than $.005 per share. |
| (c) | The distributor of the Fund contractually agreed to limit its distribution and service (12b-1) fees to .25 of 1% on the average daily net assets of the Class A shares. |
| (d) | Effective September 1, 2001, the Series has adopted the provisions of the AICPA Audit and Accounting Guide for Investment Companies and began accreting market discount on debt securities. The effect of this change for the year ended August 31, 2002 was to increase net investment income and decrease net realized and unrealized gains per share by less than $0.005 and increase the ratio of net investment income from 4.70% to 4.73%. Per share amounts and ratios for the years ended prior to August 31, 2002 have not been restated to reflect this change in presentation. |
| (e) | Annualized. |
| (f) | Not annualized. |
See Notes to Financial Statements.
| 28 | Visit our website at www.jennisondryden.com |
| Class A | ||||||||||||||||||
| Year Ended August 31, | ||||||||||||||||||
| 2003 | 2002(d) | 2001 | 2000 | 1999 | ||||||||||||||
| $ | 10.54 | $ | 10.52 | $ | 10.05 | $ | 10.13 | $ | 10.92 | |||||||||
| .43 | .49 | .51 | .53 | .53 | ||||||||||||||
| (.16 | ) | .02 | .47 | (.05 | ) | (.67 | ) | |||||||||||
| .27 | .51 | .98 | .48 | (.14 | ) | |||||||||||||
| (.43 | ) | (.49 | ) | (.51 | ) | (.53 | ) | (.53 | ) | |||||||||
| (.02 | ) | — | — | (b) | (.03 | ) | (.12 | ) | ||||||||||
| (.45 | ) | (.49 | ) | (.51 | ) | (.56 | ) | (.65 | ) | |||||||||
| $ | 10.36 | $ | 10.54 | $ | 10.52 | $ | 10.05 | $ | 10.13 | |||||||||
| 2.57 | % | 5.03 | % | 10.07 | % | 4.98 | % | (1.35 | )% | |||||||||
| $ | 121,771 | $ | 126,410 | $ | 123,254 | $ | 109,068 | $ | 104,210 | |||||||||
| $ | 125,733 | $ | 123,971 | $ | 116,925 | $ | 106,181 | $ | 104,460 | |||||||||
| .97 | % | .96 | % | .93 | % | .90 | % | .84 | % | |||||||||
| .72 | % | .71 | % | .68 | % | .65 | % | .64 | % | |||||||||
| 4.08 | % | 4.73 | % | 4.97 | % | 5.31 | % | 5.00 | % | |||||||||
| 45 | % | 31 | % | 35 | % | 21 | % | 23 | % | |||||||||
See Notes to Financial Statements.
| Dryden Municipal Series Fund/Pennsylvania Series | 29 |
Financial Highlights
(Unaudited) Cont’d
| Class B | ||||
Six Months Ended February 29, 2004 | ||||
Per Share Operating Performance: | ||||
Net Asset Value, Beginning Of Period | $ | 10.35 | ||
Income from investment operations | ||||
Net investment income | .17 | |||
Net realized and unrealized gain (loss) on investment transactions | .47 | |||
Total from investment operations | .64 | |||
Less Distributions | ||||
Dividends from net investment income | (.19 | ) | ||
Distributions from net realized gains | (.39 | ) | ||
Total distributions | (.58 | ) | ||
Net asset value, end of period | $ | 10.41 | ||
Total Investment Return(a): | 6.29 | % | ||
Ratios/Supplemental Data: | ||||
Net assets, end of period (000) | $ | 35,745 | ||
Average net assets (000) | $ | 36,016 | ||
Ratios to average net assets: | ||||
Expenses, including distribution and service (12b-1) fees | 1.23 | %(d) | ||
Expenses, excluding distribution and service (12b-1) fees | .73 | %(d) | ||
Net investment income | 3.35 | %(d) | ||
| (a) | Total investment return does not consider the effects of sales loads. Total investment return is calculated assuming a purchase of shares on the first day and a sale on the last day of each year reported and includes reinvestment of dividends and distributions. Total returns for periods of less than one full year are not annualized. |
| (b) | Less than $.005 per share. |
| (c) | Effective September 1, 2001, the Series has adopted the provisions of the AICPA Audit and Accounting Guide for Investment Companies and began accreting market discount on debt securities. The effect of this change for the year ended August 31, 2002 was to increase net investment income and decrease net realized and unrealized gains per share by less than $0.005 and increase the ratio of net investment income from 4.46% to 4.49%. Per share amounts and ratios for the years ended prior to August 31, 2002 have not been restated to reflect this change in presentation. |
| (d) | Annualized. |
See Notes to Financial Statements.
| 30 | Visit our website at www.jennisondryden.com |
| Class B | ||||||||||||||||||
| Year Ended August 31, | ||||||||||||||||||
| 2003 | 2002(c) | 2001 | 2000 | 1999 | ||||||||||||||
| $ | 10.53 | $ | 10.52 | $ | 10.05 | $ | 10.13 | $ | 10.92 | |||||||||
| .40 | .46 | .48 | .50 | .50 | ||||||||||||||
| (.16 | ) | .01 | .47 | (.05 | ) | (.67 | ) | |||||||||||
| .24 | .47 | .95 | .45 | (.17 | ) | |||||||||||||
| (.40 | ) | (.46 | ) | (.48 | ) | (.50 | ) | (.50 | ) | |||||||||
| (.02 | ) | — | — | (b) | (.03 | ) | (.12 | ) | ||||||||||
| (.42 | ) | (.46 | ) | (.48 | ) | (.53 | ) | (.62 | ) | |||||||||
| $ | 10.35 | $ | 10.53 | $ | 10.52 | $ | 10.05 | $ | 10.13 | |||||||||
| 2.32 | % | 4.68 | % | 9.79 | % | 4.72 | % | (1.65 | )% | |||||||||
| $ | 36,607 | $ | 40,653 | $ | 41,638 | $ | 54,665 | $ | 88,519 | |||||||||
| $ | 39,012 | $ | 39,674 | $ | 44,507 | $ | 68,309 | $ | 104,860 | |||||||||
| 1.22 | % | 1.21 | % | 1.18 | % | 1.15 | % | 1.14 | % | |||||||||
| .72 | % | .71 | % | .68 | % | .65 | % | .64 | % | |||||||||
| 3.84 | % | 4.49 | % | 4.74 | % | 5.06 | % | 4.70 | % | |||||||||
See Notes to Financial Statements.
| Dryden Municipal Series Fund/Pennsylvania Series | 31 |
Financial Highlights
(Unaudited) Cont’d
| Class C | ||||
Six Months Ended February 29, 2004 | ||||
Per Share Operating Performance: | ||||
Net Asset Value, Beginning Of Period | $ | 10.35 | ||
Income from investment operations | ||||
Net investment income | .16 | |||
Net realized and unrealized gain (loss) on investment transactions | .46 | |||
Total from investment operations | .62 | |||
Less Distributions | ||||
Dividends from net investment income | (.17 | ) | ||
Distributions from net realized gains | (.39 | ) | ||
Total distributions | (.56 | ) | ||
Net asset value, end of period | $ | 10.41 | ||
Total Investment Return(a): | 6.16 | % | ||
Ratios/Supplemental Data: | ||||
Net assets, end of period (000) | $ | 1,316 | ||
Average net assets (000) | $ | 1,199 | ||
Ratios to average net assets: | ||||
Expenses, including distribution and service (12b-1) fees(c) | 1.48 | %(e) | ||
Expenses, excluding distribution and service (12b-1) fees | .73 | %(e) | ||
Net investment income | 3.08 | %(e) | ||
| (a) | Total investment return does not consider the effects of sales loads. Total investment return is calculated assuming a purchase of shares on the first day and a sale on the last day of each year reported and includes reinvestment of dividends and distributions. Total returns for periods of less than one full year are not annualized. |
| (b) | Less than $.005 per share. |
| (c) | The distributor of the Fund contractually agreed to limit its distribution and service (12b-1) fees to .75 of 1% on the average daily net assets of the Class C shares. |
| (d) | Effective September 1, 2001, the Series has adopted the provisions of the AICPA Audit and Accounting Guide for Investment Companies and began accreting market discount on debt securities. The effect of this change for the year ended August 31, 2002 was to increase net investment income and decrease net realized and unrealized gains per share by less than $0.005 and increase the ratio of net investment income from 4.20% to 4.23%. Per share amounts and ratios for the years ended prior to August 31, 2002 have not been restated to reflect this change in presentation. |
| (e) | Annualized. |
See Notes to Financial Statements.
| 32 | Visit our website at www.jennisondryden.com |
| Class C | ||||||||||||||||||
| Year Ended August 31, | ||||||||||||||||||
| 2003 | 2002(d) | 2001 | 2000 | 1999 | ||||||||||||||
| $ | 10.54 | $ | 10.52 | $ | 10.05 | $ | 10.13 | $ | 10.92 | |||||||||
| .38 | .44 | .46 | .48 | .47 | ||||||||||||||
| (.17 | ) | .02 | .47 | (.05 | ) | (.67 | ) | |||||||||||
| .21 | .46 | .93 | .43 | (.20 | ) | |||||||||||||
| (.38 | ) | (.44 | ) | (.46 | ) | (.48 | ) | (.47 | ) | |||||||||
| (.02 | ) | — | — | (b) | (.03 | ) | (.12 | ) | ||||||||||
| (.40 | ) | (.44 | ) | (.46 | ) | (.51 | ) | (.59 | ) | |||||||||
| $ | 10.35 | $ | 10.54 | $ | 10.52 | $ | 10.05 | $ | 10.13 | |||||||||
| 2.06 | % | 4.42 | % | 9.52 | % | 4.46 | % | (1.91 | )% | |||||||||
| $ | 1,105 | $ | 963 | $ | 664 | $ | 479 | $ | 882 | |||||||||
| $ | 1,119 | $ | 885 | $ | 493 | $ | 655 | $ | 1,075 | |||||||||
| 1.47 | % | 1.46 | % | 1.43 | % | 1.40 | % | 1.39 | % | |||||||||
| .72 | % | .71 | % | .68 | % | .65 | % | .64 | % | |||||||||
| 3.58 | % | 4.23 | % | 4.47 | % | 4.79 | % | 4.46 | % | |||||||||
See Notes to Financial Statements.
| Dryden Municipal Series Fund/Pennsylvania Series | 33 |
Supplemental Proxy Information
(Unaudited)
A special meeting of shareholders was held on July 17, 2003, and adjourned to August 21, 2003 and further adjourned to September 12, 2003, October 12, 2003, November 7, 2003, November 21, 2003 and December 5, 2003. At such meetings the following proposal was submitted to shareholders for approval:
| (5) | To approve amendments to the Company’s Declaration of Trust. |
| Not approved. |
| 34 | Visit our website at www.jennisondryden.com |
| n MAIL | n TELEPHONE | n WEBSITE | ||
Gateway Center Three 100 Mulberry Street Newark, NJ 07102 | (800) 225-1852 | www.jennisondryden.com | ||
PROXY VOTING
The Board of Trustees of the Fund has delegated to the Series’ investment manager the responsibility for voting any proxies and maintaining proxy recordkeeping with respect to the Series. A description of these proxy voting policies and procedures is available without charge, upon request, by calling (800) 225-1852 or by visiting the SEC’s website at http://www.sec.gov.
TRUSTEES
David E.A. Carson • Robert F. Gunia • Robert E. La Blanc • Douglas H. McCorkindale • Richard A. Redeker • Judy A. Rice • Robin B. Smith • Stephen D. Stoneburn • Clay T. Whitehead
OFFICERS
Judy A. Rice, President • Robert F. Gunia, Vice President • Grace C. Torres, Treasurer and Principal Financial and Accounting Officer • Marguerite E.H. Morrison, Chief Legal Officer and Assistant Secretary • Deborah A. Docs, Secretary • Maryanne Ryan, Anti-Money Laundering Compliance Officer • Lee D. Augsburger, Chief Compliance Officer
| MANAGER | Prudential Investments LLC | Gateway Center Three 100 Mulberry Street Newark, NJ 07102 | ||
| INVESTMENT ADVISER | Prudential Investment Management, Inc. | Gateway Center Two 100 Mulberry Street Newark, NJ 07102 | ||
| DISTRIBUTOR | Prudential Investment Management Services LLC | Gateway Center Three 14th Floor 100 Mulberry Street Newark, NJ 07102 | ||
| CUSTODIAN | State Street Bank and Trust Company | One Heritage Drive North Quincy, MA 02171 | ||
| TRANSFER AGENT | Prudential Mutual Fund Services LLC | PO Box 8098 Philadelphia, PA 19101 | ||
| INDEPENDENT AUDITORS | KPMG LLP | 757 Third Avenue New York, NY 10017 | ||
| FUND COUNSEL | Shearman & Sterling LLP | 599 Lexington Avenue New York, NY 10022 | ||
| Dryden Municipal Series Fund/Pennsylvania Series | ||||||||||
| Share Class | A | B | C | |||||||
NASDAQ | PMPAX | PBPAX | PPNCX | |||||||
CUSIP | 262468762 | 262468754 | 262468747 | |||||||
An investor should consider the investment objectives, risks, and charges and expenses of the Series carefully before investing. The prospectus for the Series contains this and other information about the Series. An investor may obtain a prospectus by visiting our website at www.jennisondryden.com or by calling us at (800) 225-1852. The prospectus should be read carefully before investing.
The views expressed in this report and information about the Series’ portfolio holdings are for the period covered by this report and are subject to change thereafter. The accompanying financial statements as of February 29, 2004 were not audited and, accordingly, no auditor’s opinion is expressed on them.
Quantitative Management and Prudential Fixed Income are units of Prudential Investment Management, Inc (PIM). Jennison Associates and PIM are Registered Investment Advisors and Prudential Financial Companies.
Mutual Funds:
| ARE NOT INSURED BY THE FDIC OR ANY FEDERAL GOVERNMENT AGENCY | MAY LOSE VALUE | ARE NOT A DEPOSIT OF OR GUARANTEED BY ANY BANK OR ANY BANK AFFILIATE |
| Dryden Municipal Series Fund/Pennsylvania Series | ||||||||||
| Share Class | A | B | C | |||||||
NASDAQ | PMPAX | PBPAX | PPNCX | |||||||
CUSIP | 262468762 | 262468754 | 262468747 | |||||||
MF132E2 IFS-A090104 Ed. 04/2004
Dryden Municipal Series Fund/ Florida Series
| FEBRUARY 29, 2004 | SEMIANNUAL REPORT | |

FUND TYPE
Municipal bond
OBJECTIVE
Maximize current income that is exempt from federal income taxes consistent with the preservation of capital and invest in securities which will enable its shares to be exempt from the Florida intangibles tax
This report is not authorized for distribution to prospective investors unless preceded or accompanied by a current prospectus.
The views expressed in this report and information about the Series’ portfolio holdings are for the period covered by this report and are subject to change thereafter.
JennisonDryden is a registered trademark of The Prudential Insurance Company of America.

Dear Shareholder,
April 19, 2004
As the stock market slowed in the first quarter of 2004 following its particularly strong performance in 2003, some investors still seemed to be watching developments from the sidelines. Though the economy appears sound, given the unsettled global political climate and uncertain job growth in the United States, we can understand that some investors may want to remain cautious. For those with long-term goals, however, keeping assets in short-term savings and money market accounts may be a losing proposition as meager yields will be eroded by taxes, and even low annual inflation will reduce purchasing power. A broadly diversified asset allocation can help protect you against inflation and increase your chances of participating in economic growth.
We recommend that you develop a diversified asset allocation strategy in consultation with a financial professional who knows you and who understands your reasons for investing, the time you have to reach your goals, and the amount of risk you are comfortable assuming. JennisonDryden mutual funds offer a wide range of investment choices, and your financial professional can help you choose the appropriate funds to implement your strategy.
Whether you are investing for your retirement, your children’s education, or some other purpose, JennisonDryden mutual funds offer the experience, resources, and professional discipline of three leading asset managers that can make a difference for you. JennisonDryden funds are managed by Prudential Investment Management’s public equity and fixed income asset management businesses. The equity funds are managed by Jennison Associates and Quantitative Management. Prudential Fixed Income manages the JennisonDryden fixed income and money market funds.
Thank you for your confidence in JennisonDryden mutual funds.
Sincerely,

Judy A. Rice, President
Dryden Municipal Series Fund/Florida Series
| Dryden Municipal Series Fund/Florida Series | 1 |
Your Series’ Performance
Series objective
The investment objective of the Dryden Municipal Series Fund/Florida Series (the Series) is to maximize current income that is exempt from federal income taxes consistent with the preservation of capital and to invest in securities which will enable its shares to be exempt from the Florida intangibles tax. There can be no assurance that the Series will achieve its investment objective.
Performance data quoted represents past performance and is not indicative of future results. The investment return and principal value of an investment will fluctuate so that an investor’s shares, when redeemed, may be worth more or less than their original cost. Current performance may be lower or higher than the performance data quoted. An investor may obtain current performance data to the most recent month-end by visiting our website at www.jennisondryden.com or by calling us at (800) 225-1852.
| Cumulative Total Returns1 as of 2/29/04 | |||||||||||||
| Six Months | One Year | Five Years | Ten Years | Since Inception2 | |||||||||
Class A | 5.83 | % | 4.79 | % | 28.30 | % | 72.24% (67.54) | 136.49% (121.57) | |||||
Class B | 5.59 | 4.53 | 26.72 | N/A | 70.84 (67.14) | ||||||||
Class C | 5.46 | 4.27 | 25.16 | 62.59 (58.15) | 68.02 (62.00) | ||||||||
Class Z | 5.96 | 5.15 | 30.14 | N/A | 50.30 (52.02) | ||||||||
Lehman Brothers Municipal Bond Index3 | 6.52 | 6.30 | 34.50 | 86.00 | *** | ||||||||
Lipper FL Muni Debt Funds Avg.4 | 5.67 | 5.24 | 25.96 | 70.00 | **** | ||||||||
| Average Annual Total Returns1 as of 3/31/04 | |||||||||||||
| One Year | Five Years | Ten Years | Since Inception2 | ||||||||||
Class A | 0.00 | % | 4.20 | % | 5.63% (5.35) | 6.34% (5.81) | |||||||
Class B | –0.99 | 4.62 | N/A | 5.64 (5.40) | |||||||||
Class C | 2.67 | 4.53 | 5.46 (5.17) | 4.92 (4.56) | |||||||||
Class Z | 4.42 | 5.33 | N/A | 5.64 (5.62) | |||||||||
Lehman Brothers |
| 5.86 | 6.00 | 6.81 | *** | ||||||||
Lipper FL Muni Debt Funds Avg.4 |
| 4.62 | 4.62 | 5.90 | **** | ||||||||
| 2 | Visit our website at www.jennisondryden.com |
| Distributions and Yields1 as of 2/29/04 | ||||||||||||
| Total Distributions Paid for Six Months | 30-Day SEC Yield | Taxable Equivalent 30-Day Yield5 at Tax Rates of | ||||||||||
| 33% | 35% | |||||||||||
Class A | $ | 0.47 | 2.24 | % | 3.34 | % | 3.45 | % | ||||
Class B | $ | 0.46 | 2.07 | 3.09 | 3.18 | |||||||
Class C | $ | 0.44 | 1.82 | 2.72 | 2.80 | |||||||
Class Z | $ | 0.48 | 2.56 | 3.82 | 3.94 | |||||||
1Source: Prudential Investments LLC and Lipper Inc. The cumulative total returns do not take into account applicable sales charges. If reflected, the applicable sales charges would reduce the cumulative total returns performance quoted. The average annual total returns do take into account applicable sales charges. Without the distribution and service (12b-1) fee waiver of 0.05% and 0.25% for Class A and Class C shares respectively, the returns for these classes would have been lower. During the period ended February 29, 2004, the Series charged a maximum front-end sales charge of 3% for Class A shares and a 12b-1 fee of up to 0.30% annually. Effective March 15, 2004, Class A shares are subject to a maximum front-end sales charge of 4.00%, a 12b-1 fee of up to 0.30% annually, and all investors who purchase Class A shares in an amount of $1 million or more and sell these shares within 12 months of purchase are subject to a contingent deferred sales charge (CDSC) of 1%. Class B shares are subject to a declining CDSC of 5%, 4%, 3%, 2%, 1%, and 1% for the first six years respectively after purchase and a 12b-1 fee of up to 0.50% annually. Approximately seven years after purchase, Class B shares will automatically convert to Class A shares on a quarterly basis. During the period ended February 29, 2004, Class C shares were subject to a front-end sales charge of 1%, a CDSC of 1% for shares redeemed within 18 months of purchase, and a 12b-1 fee of up to 1% annually. Class C shares purchased on or after February 2, 2004 are not subject to a front-end sales charge, the CDSC of 1% for Class C shares purchased on or after that date will apply for 12 months from the date of purchase, and the annual 12b-1 fee will remain up to 1%. Class Z shares are not subject to a sales charge or 12b-1 fee. The returns in the tables do not reflect the deduction of taxes that a shareholder would pay on fund distributions or following the redemption of fund shares. Without waiver of fees and/or expense subsidization, the Series’ returns would have been lower, as indicated in parentheses. 2Inception dates: Class A, 12/28/90; Class B, 8/1/94; Class C, 7/26/93; and Class Z, 12/6/96. 3The Lehman Brothers Municipal Bond Index is an unmanaged index of over 39,000 long-term investment-grade municipal bonds. It gives a broad look at how long-term investment-grade municipal bonds have performed. Investors cannot invest directly in an index. 4The Lipper Florida (FL) Muni Debt Funds Average (Lipper Average) represents returns based on an average return of all funds in the Lipper FL Muni Debt Funds category for the periods noted. Funds in the Lipper Average limit their assets to those securities that are exempt from taxation in Florida. 5Taxable equivalent yields reflect federal and applicable state tax rates. The returns for the Lehman Brothers Municipal Bond Index would be lower if they included the effects of sales charges, operating expenses of a mutual fund, or taxes. Returns for the Lipper Average reflect the deduction of operating expenses, but not sales charges or taxes. ***Lehman Brothers Municipal Bond Index Closest Month-End to Inception cumulative total returns as of 2/29/04 are 151.09% for Class A, 88.34% for Class B, 91.86% for Class C, and 56.88% for Class Z. Lehman Brothers Municipal Bond Index Closest Month-End to Inception average annual total returns as of 3/31/04 are 7.17% for Class A, 6.73% for Class B, 6.26% for Class C, and 6.28% for Class Z. ****Lipper Average Closest Month-End to Inception cumulative total returns as of 2/29/04 are 129.48% for Class A, 73.45% for Class B, 74.62% for Class C, and 44.95% for Class Z. Lipper Average Closest Month-End to Inception average annual total returns as of 3/31/04 are 6.43% for Class A, 5.79% for Class B, 5.31% for Class C, and 5.11% for Class Z.
| Dryden Municipal Series Fund/Florida Series | 3 |
| Five Largest Issuers expressed as a percentage of net assets as of 2/29/04 | |||
Florida State | 8.3 | % | |
Florida Board of Education | 4.2 | ||
Palm Beach County Florida Convention Ctr. | 3.8 | ||
Jacksonville Florida Elec. Auth. | 3.4 | ||
Puerto Rico Comwlth. | 3.4 | ||
Issuers are subject to change.
| Portfolio Composition expressed as a percentage of net assets as of 2/29/04 | |||
Special Tax/Assessment District | 21.1 | % | |
General Obligation | 12.3 | ||
Other | 10.6 | ||
Prerefunded | 9.1 | ||
Healthcare | 7.9 | ||
Water & Sewer | 7.5 | ||
Transportation | 7.4 | ||
Lease-Backed Certificate of Participation | 7.2 | ||
Power | 7.1 | ||
Tobacco | 2.8 | ||
Housing | 2.6 | ||
Education | 1.9 | ||
Solid Waste/Resource Recovery | 1.4 | ||
Corporate-Backed IDB & PCR | 1.3 | ||
Cash & Equivalents | –0.2 | ||
Portfolio composition is subject to change.
| Credit Quality expressed as a percentage of net assets as of 2/29/04 | |||
Aaa | 55.6 | % | |
Aa | 22.6 | ||
A | 9.6 | ||
Baa | 2.0 | ||
NR | 10.4 | ||
Cash & Equivalents | –0.2 | ||
Source: Moody’s rating, defaulting to S&P when not rated. Credit quality is subject to change.
| 4 | Visit our website at www.jennisondryden.com |
Portfolio of Investments
| FEBRUARY 29, 2004 | SEMI-ANNUAL REPORT | |
Dryden Municipal Series Fund
Florida Series
Portfolio of Investments
as of February 29, 2004 (Unaudited)
| Description (a) | Moody’s Rating | Interest Rate | Maturity Date | Principal Amount (000) | Value (Note 1) | ||||||||
LONG-TERM INVESTMENTS 89.4% | |||||||||||||
Arbor Greene Cmnty. Dev. Dist., | |||||||||||||
Florida Assmt. Rev. | NR | 5.75% | 5/01/06 | $ | 86 | $ | 86,358 | ||||||
Florida Assmt. Rev. | NR | 6.50 | 5/01/07 | 85 | 85,979 | ||||||||
Florida Assmt. Rev. | NR | 6.30 | 5/01/19 | 315 | 323,199 | ||||||||
Bayside Impvt. Cmnty. Dev. Dist., Florida Cap. Impvt. Rev., Ser. A | NR | 6.30 | 5/01/18 | 995 | 1,022,502 | ||||||||
Broward Cnty. Florida Apt. Sys. Rev., Pass. Facs., Conv. Lien, Ser. H1, A.M.T., A.M.B.A.C. | Aaa | 5.25 | 10/01/10 | 1,730 | 1,905,837 | ||||||||
Broward Cnty. Florida Sch. Brd. Certs., M.B.I.A. | Aaa | 5.25 | 7/01/15 | 2,000 | 2,280,240 | ||||||||
Broward Cnty. Res. Recov. Rev., Rfdg., Wheelabrator, Ser. A | A3 | 5.50 | 12/01/08 | 1,000 | 1,130,760 | ||||||||
Collier Cnty. Sch. Brd., C.O.P., F.S.A. | Aaa | 5.375 | 2/16/21 | 1,000 | 1,101,600 | ||||||||
Cuyahoga Cnty. Rev., Rfdg., Ser. A | A1 | 6.00 | 1/03/17 | 1,000 | 1,127,160 | ||||||||
Dade Cnty. Aviation Dept. Rev., | Aaa | 6.00 | 10/01/24 | 1,500 | (b) | 1,616,895 | |||||||
Dade Cnty. Hlth. Facs. Auth. Rev., Baptist Hosp. of Miami Proj., | Aaa | 6.75 | 5/01/08 | 430 | (d) | 478,139 | |||||||
Florida Hsg. Fin. Corp. Rev., Westchase Apts., Ser. B, A.M.T. | NR | 6.61 | 7/01/38 | 1,370 | 1,220,396 | ||||||||
Florida St. Brd. Ed. Cap. Outlay, Pub. Ed., Ser. C, F.G.I.C., G.O. | Aaa | 5.50 | 6/01/16 | 1,000 | 1,137,040 | ||||||||
Florida St. Brd. Ed. Lottery Rev., | Aaa | 5.75 | 7/01/19 | 1,500 | 1,744,245 | ||||||||
Florida St. Dept. Environ. Protection Preservation Rev., Florida Forever, Ser. A, M.B.I.A. | Aaa | 5.25 | 7/03/17 | 2,950 | 3,286,270 | ||||||||
Florida St. Mun. Pwr. Agcy. Rev., Rfdg., Stanton II Proj., A.M.B.A.C. | Aaa | 5.50 | 10/02/17 | 1,120 | 1,285,917 | ||||||||
Greyhawk Landing Cmnty. Dev. Dist. Rev., Spec. Assmt. Rev., Ser. B | NR | 6.25 | 5/01/09 | 1,235 | 1,250,623 | ||||||||
Highlands Cnty. Florida Hlth. Facs. Auth. Rev., Hosp. Adventist/Sunbelt, Ser. A | A3 | 6.00 | 11/17/31 | 1,000 | 1,078,180 | ||||||||
Hillsborough Cnty. Florida Aviation Auth. Rev., Tampa Intl. Arpt., Ser. A, A.M.T., M.B.I.A | Aaa | 5.50 | 10/01/15 | 2,000 | 2,269,420 | ||||||||
See Notes to Financial Statements.
| 6 | Visit our website at www.jennisondryden.com |
| Description (a) | Moody’s Rating | Interest Rate | Maturity Date | Principal Amount (000) | Value (Note 1) | ||||||||
Hillsborough Cnty. Florida Ind. Dev. Auth. Hosp. Rev., Tampa Gen. Hosp. Proj., Ser. A | Baa1 | 5.00% | 10/01/18 | $ | 1,000 | $ | 1,032,270 | ||||||
Hillsborough Cnty. Florida Ind. Dev. Auth., Cigarette Tax Alloc., H Lee Moffitt Cancer Proj., | Aaa | 5.50 | 9/01/16 | 1,840 | 2,113,222 | ||||||||
Indigo Cmnty. Dev. Dist. Cap. Impvt. Rev., Ser. B | NR | 6.40 | 5/01/06 | 1,220 | 1,221,086 | ||||||||
Jacksonville Elec. Auth. Rev., | |||||||||||||
Elec. Sys., Ser. A | Aa2 | 6.00 | 10/01/30 | 1,000 | 1,063,710 | ||||||||
St. Johns Rvr. Pwr. | Aa2 | Zero | 10/01/10 | 2,000 | 1,645,020 | ||||||||
Jacksonville Sales Tax Rev., | |||||||||||||
A.M.B.A.C. | Aaa | 5.50 | 10/01/18 | 1,000 | 1,140,730 | ||||||||
F.G.I.C. | Aaa | 5.375 | 10/01/18 | 1,000 | 1,128,600 | ||||||||
Jacksonville Swr. & Solid Wste. Disp. Facs. Rev., Anheuser Busch Proj., A.M.T. | A1 | 5.875 | 2/01/36 | 1,000 | 1,051,070 | ||||||||
Jacksonville Wtr. & Swr. Dev. Rev., United Wtr. Proj., A.M.T., A.M.B.A.C. | Aaa | 6.35 | 8/01/25 | 1,500 | 1,621,680 | ||||||||
Jea Wtr. & Swr. Sys. Rev., Ser. C | Aa3 | 5.00 | 10/01/41 | 2,000 | 2,033,620 | ||||||||
Lakeland Elec. & Wtr. Rev. | AA-(c) | 5.625 | 10/01/36 | 2,000 | (b) | 2,255,860 | |||||||
Maryland St. Hlth. & Higher Ed., Facs., Auth. Rev. | A3 | 6.75 | 7/01/30 | 500 | 569,675 | ||||||||
Miami Dade Cnty. Florida Sch. Brd., Ser. A, F.S.A. | Aaa | 6.00 | 10/02/17 | 1,000 | 1,171,110 | ||||||||
Miami Homeland Defense/Neighborhood, M.B.I.A., G.O. | Aaa | 5.50 | 1/02/20 | 2,000 | 2,251,420 | ||||||||
Miami Spec. Oblig., Admn. Bldg., Acquis. Proj., F.G.I.C. | Aaa | 6.00 | 2/01/16 | 1,000 | (b) | 1,089,060 | |||||||
Miramar Wste. Wtr. Impvt. Assmt. Rev., F.G.I.C. | Aaa | 6.75 | 10/01/16 | 1,590 | (b) | 1,660,373 | |||||||
New York St. Urban Dev. Corp., Ser. A | AA-(c) | 5.25 | 1/02/09 | 1,000 | 1,122,180 | ||||||||
North Carolina Mun. Pwr. Agcy., No. 1 Catawba Elec. Rev., | Aaa | 5.125 | 1/03/17 | 1,440 | 1,577,909 | ||||||||
Oakstead Cmnty. Dev. Dist. Cap., Impvt., Ser. B | NR | 6.50 | 5/01/07 | 250 | 252,678 | ||||||||
See Notes to Financial Statements.
| Dryden Municipal Series Fund/Florida Series | 7 |
Portfolio of Investments
as of February 29, 2004 (Unaudited) Cont’d.
| Description (a) | Moody’s Rating | Interest Rate | Maturity Date | Principal Amount (000) | Value (Note 1) | ||||||||
Okaloosa Cnty. Cap. Impvt. Rev., M.B.I.A., C.A.B.S. | Aaa | Zero% | 12/01/06 | $ | 450 | $ | 429,876 | ||||||
Orange Cnty. Tourist Dev. Tax Rev., A.M.B.A.C. | Aaa | 5.25 | 10/03/16 | 1,425 | 1,593,236 | ||||||||
Orlando Util. Cmnty., Wtr. & Elec. Rev., Ser. C | Aa1 | 5.25 | 10/01/21 | 2,000 | 2,189,380 | ||||||||
Osceola Cnty., Infrastructure Sales Surtax, A.M.B.A.C. | Aaa | 5.375 | 10/02/17 | 1,995 | 2,259,417 | ||||||||
Palm Beach Cnty. Pub. Impvt. Rev., Convention Ctr. Proj., F.G.I.C. | Aaa | 5.50 | 11/03/14 | 1,055 | 1,251,800 | ||||||||
Palm Beach Cnty. Pub., | Aaa | 5.00 | 11/01/11 | 1,500 | 1,717,590 | ||||||||
Pasco Cnty. Sales Tax Rev., | Aaa | 5.00 | 12/01/15 | 1,180 | 1,327,299 | ||||||||
Pembroke Pines Pub. Impvt. Rev., A.M.B.A.C. | Aaa | 5.50 | 10/03/16 | 1,360 | 1,553,351 | ||||||||
Pensacola Hlth. Facs. Auth. Rev., Daughters of Charity, M.B.I.A. | Aaa | 5.25 | 1/01/11 | 1,600 | (b) | 1,621,360 | |||||||
Puerto Rico Comnwlth., | BAA1(c) | 5.75 | 7/01/12 | 1,500 | (d)(f) | 2,109,810 | |||||||
Puerto Rico Pub. Fin. Corp., Comnwlth. Approp., Ser. E | Baa3 | 5.70 | 8/01/25 | 500 | 551,975 | ||||||||
Tobacco Settlement Fin. Corp., Ser A-1 | A3 | 5.50 | 6/01/16 | 2,000 | 2,187,740 | ||||||||
Utah St. Hsg. Fin. Agcy., | Aa2 | 6.125 | 1/04/27 | 765 | 815,941 | ||||||||
Virgin Islands Pub. Fin. Auth. Rev., Gross Rcpts. Taxes Ln. Nts., F.S.A. | Aaa | 5.25 | 10/01/18 | 1,000 | 1,143,290 | ||||||||
Vista Lakes Cmnty. Dev. Dist. Cap. Impvt., Rev. | NR | 6.35 | 5/02/05 | 45 | 45,202 | ||||||||
Total long-term investments | 71,229,300 | ||||||||||||
SHORT-TERM INVESTMENTS 9.5% | |||||||||||||
Florida Higher Edl. Facs. Fin. Auth. Rev., St. Thomas Univ. Proj., F.R.D.D. | A-1+(c) | 0.99 | 3/01/04 | 1,000 | 1,000,000 | ||||||||
Florida St. Brd. of Pub. Ed., Mun. Secs. Trust Rcpts., Ser. | A-1+(c) | 1.00 | 3/01/04 | 3,300 | 3,300,000 | ||||||||
See Notes to Financial Statements.
| 8 | Visit our website at www.jennisondryden.com |
| Description (a) | Moody’s Rating | Interest Rate | Maturity Date | Principal Amount (000) | Value (Note 1) | |||||||
Fort Lauderdale Rev., Pine Crest Prepratory Sch. Proj., F.S.A., F.R.W.D. | NR | 0.95% | 3/04/04 | $ | 500 | $ | 500,000 | |||||
Jacksonville Hth. Facs. Auth. Hosp. Rev., Ser. A, F.R.D.D | A-1+(c) | 0.99 | 3/01/04 | 2,395 | 2,395,000 | |||||||
Mun. Secs. Trust Cert., | ||||||||||||
Ser. 2001-131, Trust Cert., Class A, G.O., F.R.D.D. | A-1(c) | 1.00 | 3/01/04 | 100 | 100,000 | |||||||
Ser. 2001-160, Trust Cert., Class A, F.G.I.C., F.R.D.D. | A-1(c) | 1.00 | 3/01/04 | 300 | 300,000 | |||||||
Total short-term investments (cost $7,595,000) | 7,595,000 | |||||||||||
Total Investments 98.9% | 78,824,300 | |||||||||||
Other assets in excess of liabilities 1.1% | 877,478 | |||||||||||
Net Assets 100% | $ | 79,701,778 | ||||||||||
| (a) | The following abbreviations are used in portfolio descriptions: |
A.M.B.A.C.—American Municipal Bond Assurance Corporation.
A.M.T.—Alternative Minimum Tax.
C.A.B.S.—Capital Appreciation Bonds.
C.O.P.—Certificates of Participation.
E.T.M.—Escrowed to Maturity.
F.G.I.C.—Financial Guaranty Insurance Company.
F.R.D.D.—Floating Rate (Daily) Demand Note (e).
F.R.W.D—Floating Rate (Weekly) Demand Note (e).
F.S.A.—Financial Security Assurance.
G.O.—General Obligation.
M.B.I.A.—Municipal Bond Insurance Association.
| (b) | All or partial prerefunded issues are secured by escrowed cash and/or direct U.S. guaranteed obligations. |
| (c) | Standard & Poor’s Rating. |
| (d) | Partial principal amount pledged as collateral for financial futures contracts. |
| (e) | For purposes of amortized cost valuation, the maturity date of Floating Rate Demand Notes is considered to be the later of the next date on which the security can be redeemed at par, or the next date on which the rate of interest is adjusted. |
| (f) | Inverse floating rate bond. The coupon is inversely indexed to a floating interest rate. The rate shown is the rate at period end. |
NR—Not Rated by Moody’s or Standard & Poor’s.
The Fund’s current Statement of Additional Information contains a description of Moody’s and Standard & Poor’s ratings.
See Notes to Financial Statements.
| Dryden Municipal Series Fund/Florida Series | 9 |
Statement of Assets and Liabilities
as of February 29, 2004 (Unaudited)
Assets | |||
Investments, at value (cost $74,078,788) | $ | 78,824,300 | |
Cash | 24,756 | ||
Receivable for investments sold | 5,400,000 | ||
Interest receivable | 1,084,252 | ||
Receivable for Series shares sold | 14,628 | ||
Prepaid expenses | 2,313 | ||
Total assets | 85,350,249 | ||
Liabilities | |||
Payable for investments purchased | 5,400,000 | ||
Payable for Series shares reacquired | 56,786 | ||
Accrued expenses | 56,784 | ||
Unrealized depreciation on interest rate swaps | 33,434 | ||
Management fee payable | 31,555 | ||
Dividends payable | 30,164 | ||
Distribution fee payable | 20,763 | ||
Deferred trustees’ fees | 9,509 | ||
Due to broker—variation margin | 9,476 | ||
Total liabilities | 5,648,471 | ||
Net Assets | $ | 79,701,778 | |
Net assets were comprised of: | |||
Shares of beneficial interest, at par | $ | 75,033 | |
Paid-in capital in excess of par | 73,869,137 | ||
| 73,944,170 | |||
Undistributed net investment income | 29,213 | ||
Accumulated net realized gain on investments | 1,041,240 | ||
Net unrealized appreciation on investments | 4,687,155 | ||
Net assets, February 29, 2004 | $ | 79,701,778 | |
See Notes to Financial Statements.
| 10 | Visit our website at www.jennisondryden.com |
Class A | |||
Net asset value and redemption price per share | |||
($58,154,701 ÷ 5,475,042 shares of beneficial interest issued and outstanding) | $ | 10.62 | |
Maximum sales charge (3% of offering price)* | 0.33 | ||
Maximum offering price to public | $ | 10.95 | |
Class B | |||
Net asset value, offering price and redemption price per share | |||
($15,044,274 ÷ 1,416,189 shares of beneficial interest issued and outstanding) | $ | 10.62 | |
Class C | |||
Net asset value and redemption price per share | |||
($5,553,991 ÷ 522,763 shares of beneficial interest issued and outstanding) | $ | 10.62 | |
Sales charge (1% of offering price) | 0.11 | ||
Offering price to public | $ | 10.73 | |
Class Z | |||
Net asset value, offering price and redemption price per share | |||
($948,812 ÷ 89,277 shares of beneficial interest issued and outstanding) | $ | 10.63 | |
| * | Effective March 15, 2004 the maximum sales charge was changed to 4% of offering price. |
See Notes to Financial Statements.
| Dryden Municipal Series Fund/Florida Series | 11 |
Statement of Operations
Six Months Ended February 29, 2004 (Unaudited)
Net Investment Income | ||||
Income | ||||
Interest | $ | 1,881,071 | ||
Expenses | ||||
Management fee | 203,281 | |||
Distribution fee—Class A | 73,593 | |||
Distribution fee—Class B | 39,061 | |||
Distribution fee—Class C | 21,260 | |||
Custodian’s fees and expenses | 54,000 | |||
Reports to shareholders | 23,000 | |||
Legal fees and expenses | 19,000 | |||
Registration fees | 17,000 | |||
Transfer agent’s fees and expenses | 12,000 | |||
Audit fee | 11,000 | |||
Trustees’ fees | 4,000 | |||
Miscellaneous | 3,356 | |||
Total operating expenses | 480,551 | |||
Less: Custodian fee credit (Note 1) | (36 | ) | ||
Total expenses | 480,515 | |||
Net investment income | 1,400,556 | |||
Realized And Unrealized Gain (Loss) On Investments | ||||
Net realized gain (loss) on: | ||||
Investment transactions | 867,171 | |||
Financial futures transactions | 52,114 | |||
Interest rate swap | (6,541 | ) | ||
Options written | 10,173 | |||
| 922,917 | ||||
Net change in unrealized appreciation (depreciation) on: | ||||
Investments transactions | 2,286,565 | |||
Financial futures contracts | 1,153 | |||
Interest rate swap | (33,434 | ) | ||
| 2,254,284 | ||||
Net gain on investments | 3,177,201 | |||
Net Increase In Net Assets Resulting From Operations | $ | 4,577,757 | ||
See Notes to Financial Statements.
| 12 | Visit our website at www.jennisondryden.com |
Statement of Changes in Net Assets
For the Six Months and Year Ended Periods (Unaudited)
| Six Months Ended February 29, 2004 | Year Ended August 31, 2003 | |||||||
Increase (Decrease) In Net Assets | ||||||||
Operations | ||||||||
Net investment income | $ | 1,400,556 | $ | 3,493,449 | ||||
Net realized gain on investments transactions | 922,917 | 2,302,608 | ||||||
Net change in unrealized appreciation (depreciation) on investments | 2,254,284 | (3,598,500 | ) | |||||
Net increase in net assets resulting from operations | 4,577,757 | 2,197,557 | ||||||
Dividends and distributions (Note 1) | ||||||||
Dividends from net investment income | ||||||||
Class A | (1,059,030 | ) | (2,476,198 | ) | ||||
Class B | (261,638 | ) | (722,585 | ) | ||||
Class C | (87,898 | ) | (206,275 | ) | ||||
Class Z | (22,021 | ) | (64,548 | ) | ||||
| (1,430,587 | ) | (3,469,606 | ) | |||||
Distributions from net realized gains | ||||||||
Class A | (1,555,969 | ) | (102,866 | ) | ||||
Class B | (418,973 | ) | (34,657 | ) | ||||
Class C | (153,271 | ) | (9,964 | ) | ||||
Class Z | (27,670 | ) | (2,191 | ) | ||||
| (2,155,883 | ) | (149,678 | ) | |||||
Series share transactions (Net of share conversions) (Note 6) | ||||||||
Net proceeds from shares sold | 4,874,467 | 18,136,282 | ||||||
Net asset value of shares issued in reinvestment of dividends and distributions | 1,662,371 | 1,576,929 | ||||||
Cost of shares reacquired | (10,949,352 | ) | (28,764,561 | ) | ||||
Net decrease in net assets from Series share transactions | (4,412,514 | ) | (9,051,350 | ) | ||||
Total decrease | (3,421,227 | ) | (10,473,077 | ) | ||||
Net Assets | ||||||||
Beginning of period | 83,123,005 | 93,596,082 | ||||||
End of period (a) | $ | 79,701,778 | $ | 83,123,005 | ||||
(a) Includes undistributed net investment income of: | $ | 29,213 | $ | 59,244 | ||||
See Notes to Financial Statements.
| Dryden Municipal Series Fund/Florida Series | 13 |
Notes to Financial Statements
(Unaudited)
Dryden Municipal Series Fund (the “Fund”) is registered under the Investment Company Act of 1940, as an open-end management investment company. The Fund was organized as a Massachusetts business trust on May 18, 1984 and consists of six series. These financial statements relate only to Florida Series (the “Series”). The financial statements of the other series are not present herein. The assets of each are invested in separate, independently managed portfolios. The Series commenced investment operations on December 28, 1990. The Series is non-diversified and seeks to achieve its investment objective of providing the maximum amount of income that is exempt from federal income taxes with the minimum of risk, and investing in securities which will enable its shares to be exempt from the Florida intangibles tax by investing in “investment grade” tax-exempt securities whose ratings are within the four highest ratings categories by a nationally recognized statistical rating organization or, if not rated, are of comparable quality. The ability of the issuers of the securities held by the Series to meet their obligations may be affected by economic developments in a specific state, industry or region.
Note 1. Accounting Policies
The following is a summary of significant accounting policies followed by the Series, in the preparation of its financial statements.
Securities Valuation: The Series values municipal securities (including commitments to purchase such securities on a “when-issued” basis) as of the close of trading on the New York Stock Exchange, on the basis of prices provided by a pricing service which uses information with respect to transactions in comparable securities and various relationships between securities in determining values. Securities listed on a securities exchange (other than options on securities and indices) are valued at the last sale price on such exchange on the day of valuation or, if there was no sale on such day, at the mean between the last reported bid and asked prices, or at the last bid price on such day in the absence of an asked price. Securities that are actively traded in the over-the-counter market, including listed securities for which the primary market is believed by Prudential Investments LLC (“PI” or “Manager”) in consultation with the subadvisor, to be over-the-counter, are valued at market value using prices provided, by an independent pricing agent or principal market maker. Futures contracts and options thereon traded on a commodities exchange or board of trade are valued at the last sale price at the close of trading on such exchange or board of trade or, if there was no sale on the applicable commodities exchange or board of trade on such
| 14 | Visit our website at www.jennisondryden.com |
day, at the mean between the most recently quoted prices on such exchange or board of trade or at the last bid price in the absence of an asked price. Securities for which reliable market quotations are not readily available or for which the pricing service does not provide a valuation methodology, or does not present fair value, are valued at fair value in accordance with Board of Trustees’ approved fair valuation procedures.
Short-term securities which mature in sixty days or less are valued at amortized cost, which approximates market value. The amortized cost method involves valuing a security at its cost on the date of purchase and thereafter assuming a constant amortization to maturity of the difference between the principal amount due at maturity and cost. Short-term securities which mature in more than sixty days are valued at current market quotations.
Financial Futures Contracts: A financial futures contract is an agreement to purchase (long) or sell (short) an agreed amount of securities at a set price for delivery on a future date. Upon entering into a financial futures contract, the Series is required to pledge to the broker an amount of cash and/or other assets equal to a certain percentage of the contract amount. This amount is known as the “initial margin”. Subsequent payments, known as “variation margin”, are made or received by the Series each day, depending on the daily fluctuations in the value of the underlying security. Such variation margin is recorded for financial statement purposes on a daily basis as unrealized gain or loss. When the contract expires or is closed, the gain or loss is realized and is presented in the Statement of Operations as net realized gain or loss on financial futures transactions.
The Series invests in financial futures contracts in order to hedge existing portfolio securities, or securities the Series intends to purchase, against fluctuations in value caused by changes in prevailing interest rates or market conditions. Should interest rates move unexpectedly, the Series may not achieve the anticipated benefits of the financial futures contracts and may realize a loss. The use of futures transactions involves the risk of imperfect correlation in movements in the price of futures contracts, interest rates and the underlying hedged assets.
Interest Rate Swaps: The Series may enter into interest rate swaps. In a simple interest rate swap, one investor pays a floating rate of interest on a notional principal amount and receives a fixed rate of interest on the same notional principal amount for a specified period of time. Alternatively, an investor may pay a fixed rate and receive a floating rate. Net interest payments/receipts are included in interest income in the Statement of Operations. Interest rate swaps were conceived as asset/liability
| Dryden Municipal Series Fund/Florida Series | 15 |
Notes to Financial Statements
(Unaudited) Cont’d
management tools. In more complex swaps, the notional principle amount may decline (or amortize) over time.
During the term of the swap, changes in the value of the swap are recorded as unrealized gains or losses by “marking-to-market” to reflect the market value of the swap. When the swap is terminated, the Series will record a realized gain or loss equal to the difference between the proceeds from (or cost of) the closing transaction and the Series’ basis in the contract, if any.
The Series is exposed to market credit risk in the event of non-performance by the other party to the interest rate swap. However, the Series does not anticipate non-performance by any counterparty.
Inverse Floaters: The Series invests in variable rate securities commonly called “inverse floaters”. The interest rates on these securities have an inverse relationship to the interest rate of other securities or the value of an index. Changes in interest rates on the other security or index inversely affect the rate paid on the inverse floater, and the inverse floater’s price will be more volatile than that of a fixed-rate bond. Additionally, some of these securities contain a “leverage factor” whereby the interest rate moves inversely by a “factor” to the benchmark rate. Certain interest rate movements and other market factors can substantially affect the liquidity of inverse floating rate notes.
Options: The Series may either purchase or write options in order to hedge against adverse market movements or fluctuations in value caused by changes in prevailing interest rates with respect to securities which the Series currently owns or intends to purchase. The Series’ principal reason for writing options is to realize, through receipt of premiums, a greater current return than would be realized on the underlying security alone. When the Series purchases an option, it pays a premium and an amount equal to that premium is recorded as an asset. When the Series writes an option, it receives a premium and an amount equal to that premium is recorded as a liability. The asset or liability is adjusted daily to reflect the current market value of the option.
If an option expires unexercised, the Series realizes a gain or loss to the extent of the premium received or paid. If an option is exercised, the premium received or paid is recorded as an adjustment to the proceeds from the sale or the cost of the purchase in determining whether the Series has realized a gain or loss. The difference between the
| 16 | Visit our website at www.jennisondryden.com |
premium and the amount received or paid on effecting a closing purchase or sale transaction is also treated as a realized gain or loss. Gain or loss on purchased options is included in net realized gain or loss on investment transactions. Gain or loss on written options is presented separately as net realized gain or loss on written option transactions.
The Series, as writer of an option, may have no control over whether the underlying securities may be sold (called) or purchased (put). As a result, the Series bears the market risk of an unfavorable change in the price of the security underlying the written option. The Series, as purchaser of an option, bears the risk of the potential inability of the counterparties to meet the terms of their contracts.
Written options, financial future contracts and swap contracts involve elements of both market and credit risk in excess of the amounts reflected in the Statement of Assets and Liabilities.
Securities Transactions and Net Investment Income: Securities transactions are recorded on the trade date. Realized gains or losses from investment on sales of portfolio securities are calculated on the identified cost basis. Interest income, including amortization of premium and accretion of discount on debt securities, as required, is recorded on the accrual basis.
Net investment income or loss (other than distribution fees which are charged directly to the respective class) and unrealized and realized gains or losses are allocated daily to each class of shares based upon the relative proportion of net assets of each class at the beginning of the day.
Federal Income Taxes: For federal income tax purposes, each series in the Fund is treated as a separate taxpaying entity. It is the Series’ policy to continue to meet the requirements of the Internal Revenue Code applicable to regulated investment companies and to distribute all of its taxable net income and capital gains, if any, to its shareholders. Therefore, no federal income tax provision is required.
Dividends and Distributions: The Series declares daily dividends from net investment income. Payment of dividends is made monthly. Distributions of net capital gains, if any, are made annually. Dividends and distributions to shareholders, which are determined in accordance with federal income tax regulations and which may differ from generally accepted accounting principles, are recorded on the ex-dividend date. Permanent book/tax differences relating to income and gains are reclassified amongst undistributed net investment income, accumulated net realized gain or loss and paid-in capital in excess of par, as appropriate.
| Dryden Municipal Series Fund/Florida Series | 17 |
Notes to Financial Statements
(Unaudited) Cont’d
Custody Fee Credits: The Fund has an arrangement with its custodian bank, whereby uninvested assets earn credits which reduce the fees charged by the custodian. Such custody fee credits are presented as reduction of gross expenses in the accompanying Statements of Operations.
Estimates: The preparation of the financial statements requires management to make estimates and assumptions that effect the reported amounts and disclosures in the financial statements. Actual results could differ from those estimates.
Note 2. Agreements
The Fund has a management agreement with PI. Pursuant to this agreement, PI has responsibility for all investment advisory services and supervises the subadviser’s performance of such services. PI has entered into a subadvisory agreement with Prudential Investment Management, Inc. (“PIM”). The subadvisory agreement provides that PIM furnishes investment advisory services in connection with the management of the Series. In connection therewith, PIM is obligated to keep certain books and records of the Series. PI pays for the services of PIM, the cost of compensation of officers of the Series, occupancy and certain clerical and bookkeeping costs of the Series. The Series bears all other costs and expenses.
The management fee paid to PI is computed daily and payable monthly, at an annual rate of .50 of 1% of the average daily net assets of the Series.
The Series has a distribution agreement with Prudential Investment Management Services LLC (“PIMS”), which acts as the distributor of the Series. The Series compensates PIMS for distributing and servicing the Series’ Class A, Class B and Class C shares, pursuant to plans of distribution (the “Class A, B and C Plans”) regardless of expenses actually incurred by it. The distribution fees are accrued daily and payable monthly. No distribution or service fees were paid to PIMS as distributor of the Class Z shares of the Series.
Pursuant to the Class A, B and C Plans, the Series compensates PIMS for distribution-related activities at an annual rate of up to .30 of 1%, .50 of 1% and up to 1% of the average daily net assets of the Class A, B and C shares, respectively. PIMS has contractually agreed to limit such fees to .25 of 1%, and .75 of 1% of the average daily net assets of the Class A and Class C shares, respectively.
| 18 | Visit our website at www.jennisondryden.com |
PIMS has advised the Series that they have received approximately $6,600 and $1,100 in front-end sales charges resulting from sales of Class A and C shares, respectively during the six months ended February 29, 2004. From these fees, PIMS paid such sales charges to affiliated broker-dealers, which in turn paid commissions to salespersons and incurred other distribution costs.
PIMS has advised the Series that for the six months ended February 29, 2004, they received approximately $13,200 and $1,000 in contingent deferred sales charges imposed upon certain redemptions by Class B and Class C shareholders, respectively.
PI, PIM and PIMS are indirect, wholly-owned subsidiaries of Prudential Financial, Inc. (“Prudential”).
The Series, along with other affiliated registered investment companies (the “Funds”), is a party to a syndicated credit agreement (“SCA”) with a group of banks. For the six months ended February 29, 2004, the SCA provides for a commitment of $800 million and allows the Funds to increase the commitment to $1 billion, if necessary. Interest on any borrowings under the SCA will be incurred at market rates. The Funds pay a commitment of .08 of 1% of the unused portion of the SCA. The commitment fee is accrued daily and paid quarterly and is allocated to the Funds pro rata, based on net assets. The purpose of the SCA is to serve as an alternative source of funding for capital share redemptions. The expiration date of the SCA is April 30, 2004. Effective May 1, 2004, the commitment will be reduced to $500 million. All other terms and conditions will remain the same. The expiration of the renewed SCA will be October 29, 2004. The Series did not borrow any amounts pursuant to the SCA during the six months ended February 29, 2004.
Note 3. Other Transactions with Affiliates
Prudential Mutual Fund Services LLC (“PMFS”) an affiliate of PI and an indirect, wholly-owned subsidiary of Prudential, serves as the Fund’s transfer agent. During the six months ended February 29, 2004, the Series incurred fees of approximately $9,300 for the services of PMFS. As of February 29, 2004, approximately $1,500 of such fees were due to PMFS. Transfer agent fees and expenses in the Statement of Operations include certain out-of-pocket expenses paid to non-affiliates, where applicable.
The Series pays networking fees to affiliated and unaffiliated broker/dealers. These networking fees are payments made to broker/dealers that clear mutual fund transactions through a national clearing system. The Series incurred approximately $2,000 in total networking fees, of which the amount relating to the services of
| Dryden Municipal Series Fund/Florida Series | 19 |
Notes to Financial Statements
(Unaudited) Cont’d
Wachovia Securities, LLC (“Wachovia”), an affiliate of PI, was approximately $1,400 for the six months ended February 29, 2004.
As of February 29, 2004, approximately $300 of such fees were due to Wachovia. These amounts are included in transfer agent’s fees and expenses in the Statement of Operations.
Note 4. Portfolio Securities
Purchases and sales of portfolio securities of the Series, excluding short-term investments, for the six months ended February 29, 2004 were $16,378,243 and $27,624,931, respectively.
During the six months ended February 29, 2004, the Series entered into financial futures contracts. Details of financial futures contracts open at period end are as follows:
| Number of Contracts | Type | Expiration Date | Value at February 29, 2004 | Value at Trade Date | Unrealized Appreciation (Depreciation) | |||||||||||
| Short Position: | ||||||||||||||||
| 40 | U.S. Treasury 2 Yr Notes | March 2004 | $ | (8,625,625 | ) | $ | (8,601,413 | ) | $ | (24,212 | ) | |||||
| 3 | U.S. Treasury 10 Yr Notes | June 2004 | (341,625 | ) | (340,914 | ) | (711 | ) | ||||||||
| $ | (24,923 | ) | ||||||||||||||
Transactions in options written during the six months ended February 29, 2004 were as follows:
| Number of Contracts | Premiums Received | ||||||
Options outstanding as of August 31, 2003 | — | — | |||||
Options written | 24 | $ | 10,173 | ||||
Options expired | (24 | ) | (10,173 | ) | |||
Options outstanding as of February 29, 2004 | — | — | |||||
| 20 | Visit our website at www.jennisondryden.com |
During the six months ended February 29, 2004, the Series entered into interest rate swap agreements. Details of the swap agreements outstanding as of February 29, 2004 are as follows:
Counterparty | Termination Date | Notional Amount | Fixed Rate | Floating Rate | Unrealized Depreciation | ||||||
Morgan Stanley Capital Services, Inc.(a) | 04/27/2014 | USD 1,600,000 | 3.571% | BMA Municipal Swap Index | $ | (16,503) | |||||
Morgan Stanley Capital Services, Inc.(a) | 04/27/2014 | USD 2,300,000 | 3.491% | BMA Municipal Swap Index | (8,857) | ||||||
Morgan Stanley Capital Services, Inc.(a) | 05/27/2014 | USD 1,500,000 | 3.543% | BMA Municipal Swap Index | (8,074) | ||||||
| $ | (33,434) | ||||||||||
| (a) | Series pays the fixed rate and receives the floating rate. |
Note 5. Tax Information
The United States federal income tax basis of the Series’ investments and the net unrealized appreciation as of February 29, 2004 were as follows:
Tax Basis | Appreciation | Depreciation | Net Unrealized | |||
| $73,974,410 | $4,999,494 | $149,604 | $4,849,890 |
Note 6. Capital
The Series offers Class A, Class B, Class C and Class Z shares. Class A shares are sold with a front-end sales charge of up to 3%. Class A shares purchased on or after March 15, 2004 will be subject to a minimum initial sales charge of 4%. Effective on March 15, 2004, all investors who purchase Class A shares in an amount of $1 million or more and sell these shares within 12 months of purchase are subject to a contingent deferred sales charge (CDSC) of 1%, including investors who purchase their shares through broker-dealers affiliated with Prudential Financial, Inc. Class B shares are sold with a contingent deferred sales charge which declines from 5% to zero depending on the period of time the shares are held. Prior to February 2, 2004 Class C shares were sold with a front-end sales charge of 1% and a contingent deferred sales charge of 1% during the first 18 months. Class C shares purchased on or after February 2, 2004 are not subject to an initial sales charge and the contingent deferred sales charge (CDSC) for Class C shares will be 12 months from the date of purchase. Class B shares automatically convert to Class A shares on a quarterly basis approximately seven years after purchase. A special exchange privilege is also available for shareholders who qualified to purchase Class A shares at net asset value. Class Z shares are not
| Dryden Municipal Series Fund/Florida Series | 21 |
Notes to Financial Statements
(Unaudited) Cont’d
subject to any sales or redemption charge and are offered exclusively for sale to a limited group of investors.
Transactions in shares of beneficial interest were as follows:
Class A | Shares | Amount | |||||
Six months ended February 29, 2004: | |||||||
Shares sold | 230,258 | $ | 2,449,901 | ||||
Shares issued in reinvestment of dividends and distributions | 111,958 | 1,178,231 | |||||
Shares reacquired | (634,805 | ) | (6,728,475 | ) | |||
Net increase (decrease) in shares outstanding before conversion | (292,589 | ) | (3,100,343 | ) | |||
Shares issued upon conversion from Class B | 98,325 | 1,039,993 | |||||
Net increase (decrease) in shares outstanding | (194,264 | ) | $ | (2,060,350 | ) | ||
Year ended August 31, 2003: | |||||||
Shares sold | 717,155 | $ | 7,741,133 | ||||
Shares issued in reinvestment of dividends and distributions | 103,737 | 1,109,555 | |||||
Shares reacquired | (1,428,054 | ) | (15,377,187 | ) | |||
Net increase (decrease) in shares outstanding before conversion | (607,162 | ) | (6,526,499 | ) | |||
Shares issued upon conversion from Class B | 336,317 | 3,632,607 | |||||
Net increase (decrease) in shares outstanding | (270,845 | ) | $ | (2,893,892 | ) | ||
Class B | |||||||
Six months ended February 29, 2004: | |||||||
Shares sold | 26,707 | $ | 282,309 | ||||
Shares issued in reinvestment of dividends and distributions | 27,231 | 286,425 | |||||
Shares reacquired | (124,454 | ) | (1,312,847 | ) | |||
Net increase (decrease) in shares outstanding before conversion | (70,516 | ) | (744,113 | ) | |||
Shares issued upon conversion into Class A | (98,325 | ) | (1,039,993 | ) | |||
Net increase (decrease) in shares outstanding | (168,841 | ) | $ | (1,784,106 | ) | ||
Year ended August 31, 2003: | |||||||
Shares sold | 205,498 | $ | 2,196,149 | ||||
Shares issued in reinvestment of dividends and distributions | 26,856 | 287,080 | |||||
Shares reacquired | (463,322 | ) | (4,953,523 | ) | |||
Net increase (decrease) in shares outstanding before conversion | (230,968 | ) | (2,470,294 | ) | |||
Shares issued upon conversion into Class A | (336,317 | ) | (3,632,607 | ) | |||
Net increase (decrease) in shares outstanding | (567,285 | ) | $ | (6,102,901 | ) | ||
| 22 | Visit our website at www.jennisondryden.com |
Class C | Shares | Amount | |||||
Six months ended February 29, 2004: | |||||||
Shares sold | 12,629 | �� | $ | 134,130 | |||
Shares issued in reinvestment of dividends and distributions | 15,369 | 161,723 | |||||
Shares reacquired | (47,597 | ) | (500,333 | ) | |||
Net increase (decrease) in shares outstanding | (19,599 | ) | $ | (204,480 | ) | ||
Year ended August 31, 2003: | |||||||
Shares sold | 62,877 | $ | 675,473 | ||||
Shares issued in reinvestment of dividends and distributions | 13,107 | 140,212 | |||||
Shares reacquired | (80,922 | ) | (873,079 | ) | |||
Net increase (decrease) in shares outstanding | (4,938 | ) | $ | (57,394 | ) | ||
Class Z | |||||||
Six months ended February 29, 2004: | |||||||
Shares sold | 190,840 | $ | 2,008,127 | ||||
Shares issued in reinvestment of dividends and distributions | 3,418 | 35,992 | |||||
Shares reacquired | (228,548 | ) | (2,407,697 | ) | |||
Net increase (decrease) in shares outstanding | (34,290 | ) | $ | (363,578 | ) | ||
Year ended August 31, 2003: | |||||||
Shares sold | 703,002 | $ | 7,523,527 | ||||
Shares issued in reinvestment of dividends and distributions | 3,740 | 40,082 | |||||
Shares reacquired | (703,865 | ) | (7,560,772 | ) | |||
Net increase (decrease) in shares outstanding | 2,877 | $ | 2,837 | ||||
Note 7. Change in Independent Auditors
PricewaterhouseCoopers LLP was previously the independent auditors for the Fund. The decision to change the independent auditors was approved by the Audit Committee and by the Board of Trustees in a meeting held on September 2, 2003, resulting in KPMG LLP’s appointment as independent auditors of the Fund.
The reports on the financial statements of the Fund audited by PricewaterhouseCoopers LLP through the year ended August 31, 2003 did not contain an adverse opinion or disclaimer of opinion, and were not qualified or modified as to uncertainty, audit scope or accounting principles. There were no disagreements between the Fund and PricewaterhouseCoopers LLP on any matter of accounting principles or practices, financial statement disclosure, or auditing scope or procedures.
| Dryden Municipal Series Fund/Florida Series | 23 |
Financial Highlights
(Unaudited)
| Class A | ||||
| Six Months Ended February 29, 2004 | ||||
Per Share Operating Performance: | ||||
Net Asset Value, Beginning Of Period | $ | 10.49 | ||
Income from investment operations: | ||||
Net investment income | .19 | |||
Net realized and unrealized gain (loss) on investments transactions | .41 | |||
Total from investment operations | .60 | |||
Less Distributions | ||||
Dividends from net investment income | (.19 | ) | ||
Distributions in excess of net investment income | — | |||
Distributions from net realized gains | (.28 | ) | ||
Total distributions | (.47 | ) | ||
Net asset value, end of period | $ | 10.62 | ||
Total Return(a): | 5.83 | % | ||
Ratios/Supplemental Data: | ||||
Net assets, end of period (000) | $ | 58,155 | ||
Average net assets (000) | $ | 59,197 | ||
Ratios to average net assets: | ||||
Expenses, including distribution fee and service (12b-1) fees(d) | 1.10 | %(e) | ||
Expenses, excluding distribution fee and service (12b-1) fees | .85 | %(e) | ||
Net investment income | 3.52 | %(e) | ||
For Class A, B, C and Z shares: | ||||
Portfolio turnover rate | 22 | % | ||
| (a) | Total return does not consider the effects of sales loads. Total return is calculated assuming a purchase of shares on the first day and a sale on the last day of each period reported and includes reinvestment of dividends and distributions. Total returns for periods of less than one full year are not annualized. |
| (b) | Less than $.005 per share. |
| (c) | Effective September 1, 2001, the Series has adopted the provisions of the AICPA Audit and Accounting Guide for Investment Companies and began accreting market discount on debt securities. The effect of this change for the year ended August 31, 2002 was to increase net investment income and decrease net realized and unrealized gains per share by less than $0.005 and increase the ratio of net investment income from 4.69% to 4.71%. Per share amounts and ratios for the years ended prior to August 31, 2002 have not been restated to reflect this change in presentation. |
| (d) | The distributor of the Series has contractually agreed to limit its distribution and service (12b-1) fees to .25 of 1% of the average daily net assets of Class A shares. |
| (e) | Annualized. |
See Notes to Financial Statements.
| 24 | Visit our website at www.jennisondryden.com |
| Class A | ||||||||||||||||||
| Year Ended August 31, | ||||||||||||||||||
| 2003 | 2002(c) | 2001 | 2000 | 1999 | ||||||||||||||
| $ | 10.68 | $ | 10.70 | $ | 10.23 | $ | 10.18 | $ | 10.74 | |||||||||
| .42 | .49 | .51 | .51 | .50 | ||||||||||||||
| (.17 | ) | (.02 | ) | .47 | .05 | (.56 | ) | |||||||||||
| .25 | .47 | .98 | .56 | (.06 | ) | |||||||||||||
| (.42 | ) | (.49 | ) | (.51 | ) | (.51 | ) | (.50 | ) | |||||||||
| — | — | — | (b) | — | — | (b) | ||||||||||||
| (.02 | ) | — | — | — | — | (b) | ||||||||||||
| (.44 | ) | (.49 | ) | (.51 | ) | (.51 | ) | (.50 | ) | |||||||||
| $ | 10.49 | $ | 10.68 | $ | 10.70 | $ | 10.23 | $ | 10.18 | |||||||||
| 2.32 | % | 4.49 | % | 9.91 | % | 5.73 | % | (.61 | )% | |||||||||
| $ | 59,498 | $ | 63,463 | $ | 67,712 | $ | 68,701 | $ | 77,398 | |||||||||
| $ | 63,290 | $ | 64,601 | $ | 68,365 | $ | 71,083 | $ | 84,810 | |||||||||
| 1.07 | % | 1.01 | % | .98 | % | .98 | % | .89 | % | |||||||||
| .82 | % | .76 | % | .73 | % | .73 | % | .69 | % | |||||||||
| 3.94 | % | 4.71 | % | 4.89 | % | 5.06 | % | 4.72 | % | |||||||||
| 60 | % | 41 | % | 36 | % | 41 | % | 13 | % | |||||||||
See Notes to Financial Statements.
| Dryden Municipal Series Fund/Florida Series | 25 |
Financial Highlights
(Unaudited) Cont’d
| Class B | ||||
| Six Months Ended February 29, 2004 | ||||
Per Share Operating Performance: | ||||
Net Asset Value, Beginning Of Period | $ | 10.50 | ||
Income from investment operations: | ||||
Net investment income | .17 | |||
Net realized and unrealized gain (loss) on investments transactions | .41 | |||
Total from investment operations | .58 | |||
Less Distributions | ||||
Dividends from net investment income | (.18 | ) | ||
Distributions in excess of net investment income | — | |||
Distributions from net realized gains | (.28 | ) | ||
Total distributions | (.46 | ) | ||
Net asset value, end of period | $ | 10.62 | ||
Total Return(a): | 5.59 | % | ||
Ratios/Supplemental Data: | ||||
Net assets, end of period (000) | $ | 15,044 | ||
Average net assets (000) | $ | 15,710 | ||
Ratios to average net assets: | ||||
Expenses, including distribution fee and service (12b-1) fees | 1.35 | %(d) | ||
Expenses, excluding distribution fee and service (12b-1) fees | .85 | %(d) | ||
Net investment income | 3.27 | %(d) | ||
| (a) | Total return does not consider the effects of sales loads. Total return is calculated assuming a purchase of shares on the first day and a sale on the last day of each period reported and includes reinvestment of dividends and distributions. Total returns for periods of less than one full year are not annualized. |
| (b) | Less than $.005 per share. |
| (c) | Effective September 1, 2001, the Series has adopted the provisions of the AICPA Audit and Accounting Guide for Investment Companies and began accreting market discount on debt securities. The effect of this change for the year ended August 31, 2002 was to increase net investment income and decrease net realized and unrealized gains per share by less than $0.005 and increase the ratio of net investment income from 4.45% to 4.47%. Per share amounts and ratios for the years ended prior to August 31, 2002 have not been restated to reflect this change in presentation. |
| (d) | Annualized. |
See Notes to Financial Statements.
| 26 | Visit our website at www.jennisondryden.com |
| Class B | ||||||||||||||||||
| Year Ended August 31, | ||||||||||||||||||
| 2003 | 2002(c) | 2001 | 2000 | 1999 | ||||||||||||||
| $ | 10.68 | $ | 10.71 | $ | 10.23 | $ | 10.18 | $ | 10.74 | |||||||||
| .40 | .47 | .48 | .48 | .47 | ||||||||||||||
| (.17 | ) | (.03 | ) | .48 | .05 | (.56 | ) | |||||||||||
| .23 | .44 | .96 | .53 | (.09 | ) | |||||||||||||
| (.39 | ) | (.47 | ) | (.48 | ) | (.48 | ) | (.47 | ) | |||||||||
| — | — | — | (b) | — | — | (b) | ||||||||||||
| (.02 | ) | — | — | — | — | (b) | ||||||||||||
| (.41 | ) | (.47 | ) | (.48 | ) | (.48 | ) | (.47 | ) | |||||||||
| $ | 10.50 | $ | 10.68 | $ | 10.71 | $ | 10.23 | $ | 10.18 | |||||||||
| 2.16 | % | 4.24 | % | 9.64 | % | 5.46 | % | (.91 | )% | |||||||||
| $ | 16,635 | $ | 22,996 | $ | 25,551 | $ | 22,875 | $ | 24,626 | |||||||||
| $ | 19,636 | $ | 23,430 | $ | 24,655 | $ | 23,191 | $ | 24,665 | |||||||||
| 1.32 | % | 1.26 | % | 1.23 | % | 1.23 | % | 1.19 | % | |||||||||
| .82 | % | .76 | % | .73 | % | .73 | % | .69 | % | |||||||||
| 3.70 | % | 4.47 | % | 4.64 | % | 4.81 | % | 4.43 | % | |||||||||
See Notes to Financial Statements.
| Dryden Municipal Series Fund/Florida Series | 27 |
Financial Highlights
(Unaudited) Cont’d
| Class C | ||||
| Six Months Ended February 29, 2004 | ||||
Per Share Operating Performance: | ||||
Net Asset Value, Beginning Of Period | $ | 10.50 | ||
Income from investment operations: | ||||
Net investment income | .16 | |||
Net realized and unrealized gain (loss) on investments transactions | .40 | |||
Total from investment operations | .56 | |||
Less Distributions | ||||
Dividends from net investment income | (.16 | ) | ||
Distributions in excess of net investment income | — | |||
Distributions from net realized gains | (.28 | ) | ||
Total distributions | (.44 | ) | ||
Net asset value, end of period | $ | 10.62 | ||
Total Return(a): | 5.46 | % | ||
Ratios/Supplemental Data: | ||||
Net assets, end of period (000) | $ | 5,554 | ||
Average net assets (000) | $ | 5,701 | ||
Ratios to average net assets: | ||||
Expenses, including distribution fee and service (12b-1) fees(d) | 1.60 | %(e) | ||
Expenses, excluding distribution fee and service (12b-1) fees | .85 | %(e) | ||
Net investment income | 3.03 | %(e) | ||
| (a) | Total return does not consider the effects of sales loads. Total return is calculated assuming a purchase of shares on the first day and a sale on the last day of each period reported and includes reinvestment of dividends and distributions. Total returns for periods of less than one full year are not annualized. |
| (b) | Less than $.005 per share. |
| (c) | Effective September 1, 2001, the Series has adopted the provisions of the AICPA Audit and Accounting Guide for Investment Companies and began accreting market discount on debt securities. The effect of this change for the year ended August 31, 2002 was to increase net investment income and decrease net realized and unrealized gains per share by less than $0.005 and increase the ratio of net investment income from 4.20% to 4.22%. Per share amounts and ratios for the years ended prior to August 31, 2002 have not been restated to reflect this change in presentation. |
| (d) | The distributor of the Series has contractually agreed to limit its distribution and service (12b-1) fees to .75 of 1% of the average daily net assets of Class A shares. |
| (e) | Annualized. |
See Notes to Financial Statements.
| 28 | Visit our website at www.jennisondryden.com |
| Class C | ||||||||||||||||||
| Year Ended August 31, | ||||||||||||||||||
| 2003 | 2002(c) | 2001 | 2000 | 1999 | ||||||||||||||
| $ | 10.68 | $ | 10.70 | $ | 10.23 | $ | 10.18 | $ | 10.74 | |||||||||
| .38 | .44 | .46 | .46 | .44 | ||||||||||||||
| (.17 | ) | (.02 | ) | .47 | .05 | (.56 | ) | |||||||||||
| .21 | .42 | .93 | .51 | (.12 | ) | |||||||||||||
| (.37 | ) | (.44 | ) | (.46 | ) | (.46 | ) | (.44 | ) | |||||||||
| — | — | — | (b) | — | — | (b) | ||||||||||||
| (.02 | ) | — | — | — | — | (b) | ||||||||||||
| (.39 | ) | (.44 | ) | (.46 | ) | (.46 | ) | (.44 | ) | |||||||||
| $ | 10.50 | $ | 10.68 | $ | 10.70 | $ | 10.23 | $ | 10.18 | |||||||||
| 1.91 | % | 3.99 | % | 9.37 | % | 5.20 | % | (1.16 | )% | |||||||||
| $ | 5,693 | $ | 5,848 | $ | 5,857 | $ | 5,456 | $ | 6,833 | |||||||||
| $ | 6,045 | $ | 5,806 | $ | 5,756 | $ | 5,885 | $ | 7,420 | |||||||||
| 1.57 | % | 1.51 | % | 1.48 | % | 1.48 | % | 1.44 | % | |||||||||
| .82 | % | .76 | % | .73 | % | .73 | % | .69 | % | |||||||||
| 3.44 | % | 4.22 | % | 4.39 | % | 4.56 | % | 4.17 | % | |||||||||
See Notes to Financial Statements.
| Dryden Municipal Series Fund/Florida Series | 29 |
Financial Highlights
(Unaudited) Cont’d
| Class Z | ||||
| Six Months Ended February 29, 2004 | ||||
Per Share Operating Performance: | ||||
Net Asset Value, Beginning Of Period | $ | 10.50 | ||
Income from investment operations: | ||||
Net investment income | .20 | |||
Net realized and unrealized gain (loss) on investments transactions | .41 | |||
Total from investment operations | .61 | |||
Less Distributions | ||||
Dividends from net investment income | (.20 | ) | ||
Distributions in excess of net investment income | — | |||
Distributions from net realized gains | (.28 | ) | ||
Total distributions | (.48 | ) | ||
Net asset value, end of period | $ | 10.63 | ||
Total Return(a): | 5.96 | % | ||
Ratios/Supplemental Data: | ||||
Net assets, end of period (000) | $ | 949 | ||
Average net assets (000) | $ | 1,151 | ||
Ratios to average net assets: | ||||
Expenses, including distribution fee and service (12b-1) fees | .85 | %(d) | ||
Expenses, excluding distribution fee and service (12b-1) fees | .85 | %(d) | ||
Net investment income | 3.78 | %(d) | ||
| (a) | Total return is calculated assuming a purchase of shares on the first day and a sale on the last day of each period reported and includes reinvestment of dividends and distributions. Total returns for periods of less than one full year are not annualized. |
| (b) | Less than $.005 per share. |
| (c) | Effective September 1, 2001, the Series has adopted the provisions of the AICPA Audit and Accounting Guide for Investment Companies and began accreting market discount on debt securities. The effect of this change for the year ended August 31, 2002 was to increase net investment income and decrease net realized and unrealized gains per share by less than $0.005 and increase the ratio of net investment income from 4.93% to 4.96%. Per share amounts and ratios for the years ended prior to August 31, 2002 have not been restated to reflect this change in presentation. |
| (d) | Annualized. |
See Notes to Financial Statements.
| 30 | Visit our website at www.jennisondryden.com |
| Class Z | ||||||||||||||||||
| Year Ended August 31, | ||||||||||||||||||
| 2003 | 2002(c) | 2001 | 2000 | 1999 | ||||||||||||||
| $ | 10.68 | $ | 10.70 | $ | 10.22 | $ | 10.17 | $ | 10.73 | |||||||||
| .46 | .52 | .53 | .53 | .52 | ||||||||||||||
| (.17 | ) | (.02 | ) | .48 | .05 | (.56 | ) | |||||||||||
| .29 | .50 | 1.01 | .58 | (.04 | ) | |||||||||||||
| (.45 | ) | (.52 | ) | (.53 | ) | (.53 | ) | (.52 | ) | |||||||||
| — | — | — | (b) | — | — | (b) | ||||||||||||
| (.02 | ) | — | — | — | — | (b) | ||||||||||||
| (.47 | ) | (.52 | ) | (.53 | ) | (.53 | ) | (.52 | ) | |||||||||
| $ | 10.50 | $ | 10.68 | $ | 10.70 | $ | 10.22 | $ | 10.17 | |||||||||
| 2.68 | % | 4.85 | % | 10.18 | % | 5.99 | % | (.42 | )% | |||||||||
| $ | 1,297 | $ | 1,289 | $ | 788 | $ | 463 | $ | 377 | |||||||||
| $ | 1,567 | $ | 1,012 | $ | 579 | $ | 307 | $ | 413 | |||||||||
| .82 | % | .76 | % | .73 | % | .73 | % | .69 | % | |||||||||
| .82 | % | .76 | % | .73 | % | .73 | % | .69 | % | |||||||||
| 4.14 | % | 4.96 | % | 5.13 | % | 5.31 | % | 4.93 | % | |||||||||
See Notes to Financial Statements.
| Dryden Municipal Series Fund/Florida Series | 31 |
Supplemental Proxy Information
(Unaudited)
A special meeting of shareholders was held on July 17, 2003, and adjourned to August 21, 2003 and further adjourned to September 12, 2003, October 12, 2003, November 7, 2003, November 21, 2003 and December 5, 2003. At such meetings the following proposal was submitted to shareholders for approval:
| (5) | To approve amendments to the Company’s Declaration of Trust. |
| Not approved. |
| 32 | Visit our website at www.jennisondryden.com |
| n MAIL | n TELEPHONE | n WEBSITE | ||
Gateway Center Three 100 Mulberry Street Newark, NJ 07102 | (800) 225-1852 | www.jennisondryden.com | ||
| PROXY VOTING |
| The Board of Directors of the Fund has delegated to the Series’ investment manager the responsibility for voting any proxies and maintaining proxy recordkeeping with respect to the Series. A description of these proxy voting policies and procedures is available without charge, upon request, by calling (800) 225-1852 or by visiting the SEC’s website at http://www.sec.gov. |
| TRUSTEES |
| David E.A. Carson•Robert F. Gunia•Robert E. La Blanc•Douglas H. McCorkindale•Richard A. Redeker•Judy A. Rice•Robin B. Smith•Stephen D. Stoneburn•Clay T. Whitehead |
| OFFICERS |
| Judy A. Rice, President•Robert F. Gunia, Vice President•Grace C. Torres, Treasurer and Principal Financial and Accounting Officer•Marguerite E.H. Morrison, Chief Legal Officer and Assistant Secretary•Deborah A. Docs, Secretary•Maryanne Ryan, Anti-Money Laundering Compliance Officer•Lee D. Augsburger, Chief Compliance Officer |
| MANAGER | Prudential Investments LLC | Gateway Center Three 100 Mulberry Street Newark, NJ 07102 | ||
| INVESTMENT ADVISER | Prudential Investment Management, Inc. | Gateway Center Two 100 Mulberry Street Newark, NJ 07102 | ||
| DISTRIBUTOR | Prudential Investment Management Services LLC | Gateway Center Three 14th Floor 100 Mulberry Street Newark, NJ 07102 | ||
| CUSTODIAN | State Street Bank and Trust Company | One Heritage Drive North Quincy, MA 02171 | ||
| TRANSFER AGENT | Prudential Mutual Fund Services LLC | PO Box 8098 Philadelphia, PA 19101 | ||
| INDEPENDENT AUDITORS | KPMG LLP | 757 Third Avenue New York, NY 10017 | ||
| FUND COUNSEL | Shearman & Sterling LLP | 599 Lexington Avenue New York, NY 10022 | ||
| Dryden Municipal Series Fund/Florida Series | ||||||||||||
| Share Class | A | B | C | Z | ||||||||
NASDAQ | PFLAX | PFABX | PFLCX | PFLZX | ||||||||
CUSIP | 262468101 | 262468200 | 262468309 | 262468408 | ||||||||
An investor should consider the investment objectives, risks, and charges and expenses of the Fund carefully before investing. The prospectus for the Fund contains this and other information about the Fund. An investor may obtain a prospectus by visiting our website at www.jennisondryden.com or by calling us at (800) 225-1852. The prospectus should be read carefully before investing. |
| The views expressed in this report and information about the Fund’s portfolio holdings are for the period covered by this report and are subject to change thereafter. The accompanying financial statements as of March 31, 2004 were not audited and, accordingly, no auditor’s opinion is expressed on them. |
| Quantitative Management and Prudential Fixed Income are units of Prudential Investment Management, Inc (PIM). Jennison Associates and PIM are Registered Investment Advisors and Prudential Financial Companies. |
Mutual Funds:
| ARE NOT INSURED BY THE FDIC OR ANY FEDERAL GOVERNMENT AGENCY | MAY LOSE VALUE | ARE NOT A DEPOSIT OF OR GUARANTEED BY ANY BANK OR ANY BANK AFFILIATE |
| Dryden Municipal Series Fund/Florida Series | ||||||||||||
| Share Class | A | B | C | Z | ||||||||
NASDAQ | PFLAX | PFABX | PFLCX | PFLZX | ||||||||
CUSIP | 262468101 | 262468200 | 262468309 | 262468408 | ||||||||
MF148E2 IFS-A090098 Ed. 04/2004
| Item 2 | – | Code of Ethics—Not required as this is not an annual filing. | ||
| Item 3 | – | Audit Committee Financial Expert – Not applicable with semi-annual filing. | ||
| Item 4 | – | Principal Accountant Fees and Services – Not applicable with semi-annual filing. | ||
| Item 5 | – | Audit Committee of Listed Registrants – Not applicable. | ||
| Item 6 | – | Schedule of Investments – The schedule is included as part of the report to shareholders filed under Item 1 of this Form. | ||
| Item 7 | – | Disclosure of Proxy Voting Policies and Procedures for Closed-End Management Investment Companies – Not applicable. | ||
| Item 8 | – | Purchases of Equity Securities by Closed-End Management Investment Company and Affiliated Purchasers – Not applicable. | ||
| Item 9 | – | Submission of Matters to a Vote of Security Holders: None. | ||
| Item 10 | – | Controls and Procedures | ||
| (a) | It is the conclusion of the registrant’s principal executive officer and principal financial officer that the effectiveness of the registrant’s current disclosure controls and procedures (such disclosure controls and procedures having been evaluated within 90 days of the date of this filing) provide reasonable assurance that the information required to be disclosed by the registrant has been recorded, processed, summarized and reported within the time period specified in the Commission’s rules and forms and that the information required to be disclosed by the registrant has been accumulated and communicated to the registrant’s principal executive officer and principal financial officer in order to allow timely decisions regarding required disclosure. | |||
| (b) | There have been no significant changes in the registrant’s internal controls or in other factors that could significantly affect these controls subsequent to the date of their evaluation, including any corrective actions with regard to significant deficiencies and material weaknesses. | |||
| Item 11 | – | Exhibits | ||
| (a) | Code of Ethics – Not applicable with semi-annual filing. | |||
| (b) | Certifications pursuant to Section 302 and 906 of the Sarbanes-Oxley Act – Attached hereto | |||
SIGNATURES
Pursuant to the requirements of the Securities Exchange Act of 1934 and the Investment Company Act of 1940, the registrant has duly caused this report to be signed on its behalf by the undersigned, thereunto duly authorized.
(Registrant) | Dryden Municipal Series Fund | |
By (Signature and Title)* | /s/ Marguerite E.H. Morrison | |
Marguerite E.H. Morrison Assistant Secretary | ||
Date | April 27, 2004 | |
Pursuant to the requirements of the Securities Exchange Act of 1934 and the Investment Company Act of 1940, this report has been signed below by the following persons on behalf of the registrant and in the capacities and on the dates indicated.
By (Signature and Title)* | /s/ Judy A. Rice | |
Judy A. Rice President and Principal Executive Officer | ||
Date | April 27, 2004 | |
By (Signature and Title)* | /s/ Grace C. Torres | |
Grace C. Torres Treasurer and Principal Financial Officer | ||
Date | April 27, 2004 | |
* Print the name and title of each signing officer under his or her signature.