UNITED STATES
SECURITIES AND EXCHANGE COMMISSION
Washington, D.C. 20549
FORM N-CSR
CERTIFIED SHAREHOLDER REPORT OF REGISTERED
MANAGEMENT INVESTMENT COMPANIES
Investment Company Act file number 811-4025
----------------------------------------------
AMERICAN CENTURY MUNICIPAL TRUST
- --------------------------------------------------------------------------------
(Exact name of registrant as specified in charter)
4500 MAIN STREET, KANSAS CITY, MISSOURI 64111
- --------------------------------------------------------------------------------
(Address of principal executive offices) (Zip code)
DAVID C. TUCKER, ESQ., 4500 MAIN STREET, 9TH FLOOR, KANSAS CITY, MISSOURI 64111
- --------------------------------------------------------------------------------
(Name and address of agent for service)
Registrant's telephone number, including area code: 816-531-5575
- --------------------------------------------------------------------------------
Date of fiscal year end: MAY 31
-------------------------------------------------------
Date of reporting period: MAY 31, 2005
-------------------------------------------------------
ITEM 1. REPORTS TO STOCKHOLDERS.
[front cover]
American Century Investments
ANNUAL REPORT
[photo of boy]
MAY 31, 2005
Tax-Free Money Market Fund
Tax-Free Bond Fund
[american century investments logo and text logo]
Table of Contents
Our Message to You . . . . . . . . . . . . . . . . . . . . . . . . . . . . . . 1
TAX-FREE MONEY MARKET
Performance . . . . . . . . . . . . . . . . . . . . . . . . . . . . . . . . . .2
Portfolio Composition by Credit Rating . . . . . . . . . . . . . . . . . . .3
Portfolio Composition by Maturity . . . . . . . . . . . . . . . . . . . . . 3
Yields . . . . . . . . . . . . . . . . . . . . . . . . . . . . . . . . . . .3
Portfolio Commentary . . . . . . . . . . . . . . . . . . . . . . . . . . . . . 4
Schedule of Investments . . . . . . . . . . . . . . . . . . . . . . . . . . . .5
TAX-FREE BOND
Performance . . . . . . . . . . . . . . . . . . . . . . . . . . . . . . . . . .9
Portfolio Commentary . . . . . . . . . . . . . . . . . . . . . . . . . . . . .11
Yields . . . . . . . . . . . . . . . . . . . . . . . . . . . . . . . . . . 11
Portfolio Composition by Credit Rating . . . . . . . . . . . . . . . . . . 12
Top Five States . . . . . . . . . . . . . . . . . . . . . . . . . . . . . .12
Schedule of Investments . . . . . . . . . . . . . . . . . . . . . . . . . . . 13
Shareholder Fee Examples 23
FINANCIAL STATEMENTS
Statement of Assets and Liabilities . . . . . . . . . . . . . . . . . . . . . 25
Statement of Operations . . . . . . . . . . . . . . . . . . . . . . . . . . . 26
Statement of Changes in Net Assets . . . . . . . . . . . . . . . . . . . . . .27
Notes to Financial Statements . . . . . . . . . . . . . . . . . . . . . . . . 28
Financial Highlights . . . . . . . . . . . . . . . . . . . . . . . . . . . . .32
Report of Independent Registered Public Accounting Firm . . . . . . . . . . . 35
OTHER INFORMATION
Management . . . . . . . . . . . . . . . . . . . . . . . . . . . . . . . . . .36
Approval of Management Agreements for
Tax-Free Money Market and Tax-Free Bond . . . . . . . . . . . . . . . . . . . 40
Share Class Information . . . . . . . . . . . . . . . . . . . . . . . . . . . 45
Additional Information . . . . . . . . . . . . . . . . . . . . . . . . . . . .46
The opinions expressed in each of the Portfolio Commentaries reflect those of
the portfolio management team as of the date of the report, and do not
necessarily represent the opinions of American Century or any other person in
the American Century organization. Any such opinions are subject to change at
any time based upon market or other conditions and American Century disclaims
any responsibility to update such opinions. These opinions may not be relied
upon as investment advice and, because investment decisions made by American
Century funds are based on numerous factors, may not be relied upon as an
indication of trading intent on behalf of any American Century fund. Security
examples are used for representational purposes only and are not intended as
recommendations to purchase or sell securities. Performance information for
comparative indices and securities is provided to American Century by third
party vendors. To the best of American Century's knowledge, such information is
accurate at the time of printing.
Our Message to You
[photo of James E. Stowers III and James E. Stowers, Jr.]
JAMES E. STOWERS III WITH JAMES E. STOWERS, JR.
We are pleased to provide you with the annual report for the Tax-Free Money
Market and Tax-Free Bond funds for the year ended May 31, 2005.
This report contains information that can help you monitor your investment.
You'll find details about your fund's return and holdings as well as data and
commentary that provide insight into the market conditions that affected the
fund's performance.
In addition, through our americancentury.com Web site, we provide quarterly
commentaries on all portfolios managed by our investment teams, the views of our
senior investment officers, and other communications about investing, portfolio
strategy, and the markets. We also have many resources available in the
Education & Planning section of our site to help you meet your goals.
Your next shareholder report for these funds will be the semiannual report dated
November 30, 2005, available in approximately six months.
As always, we deeply appreciate your investment with American Century
Investments.
Sincerely,
/s/James E. Stowers, Jr.
James E. Stowers, Jr.
FOUNDER
AMERICAN CENTURY COMPANIES, INC.
/s/James E. Stowers III
James E. Stowers III
CHAIRMAN OF THE BOARD
AMERICAN CENTURY COMPANIES, INC.
- ------
1
Tax-Free Money Market - Performance
TOTAL RETURNS AS OF MAY 31, 2005
---------------------------------
AVERAGE ANNUAL RETURNS
- --------------------------------------------------------------------------------
SINCE INCEPTION
1 YEAR 5 YEARS 10 YEARS(1) INCEPTION(1) DATE
- --------------------------------------------------------------------------------
INVESTOR CLASS 1.33% 1.67% 2.46% 3.35% 7/31/84
- --------------------------------------------------------------------------------
AVERAGE RETURN OF
LIPPER'S TAX-EXEMPT
MONEY MARKET FUNDS(2) 1.00% 1.36% 2.19% 3.18%(3) --
- --------------------------------------------------------------------------------
Fund's Lipper Ranking
as of 5/31/05(2) 6 of 125 7 of 105 7 of 87 5 of 32(3) --
- --------------------------------------------------------------------------------
Fund's Lipper Ranking
as of 6/30/05(2) 8 of 121 7 of 103 7 of 86 5 of 32(3) --
- --------------------------------------------------------------------------------
(1) Fund returns and rankings would have been lower if management fees had not
been waived from 8/1/97 to 7/31/98. Beginning on 8/1/98, management fees
were phased in at a rate of 0.10% each month until 12/1/98.
(2) (c)2005 Reuters. All rights reserved. Any copying, republication or
redistribution of Lipper content, including by caching, framing or similar
means, is expressly prohibited without the prior written consent of Lipper.
Lipper shall not be liable for any errors or delays in the content, or for
any actions taken in reliance thereon.
Lipper Fund Performance -- Performance data is total return, and is
preliminary and subject to revision.
Lipper Rankings -- Rankings are based only on the universe shown. This
listing might not represent the complete universe of funds tracked by Lipper
Inc.
The data contained herein has been obtained from company reports, financial
reporting services, periodicals and other resources believed to be reliable.
Although carefully verified, data on compilations is not guaranteed by
Lipper Inc. - A Reuters Company and may be incomplete. No offer or
solicitations to buy or sell any of the securities herein is being made by
Lipper.
(3) Since 8/31/84, the date nearest the fund's inception for which data are
available.
Data presented reflect past performance. Past performance is no guarantee of
future results. Current performance may be higher or lower than the performance
shown. To obtain performance data current to the most recent month end, please
call 1-800-345-2021 or visit americancentury.com. Investment income may be
subject to certain state and local taxes and, depending on your tax status, the
federal alternative minimum tax (AMT). Capital gains are not exempt from state
and federal income tax.
An investment in the fund is not insured or guaranteed by the Federal Deposit
Insurance Corporation or any other government agency. Although the fund seeks to
preserve the value of your investment at $1.00 per share, it is possible to lose
money by investing in the fund.
The 7-day current yield more closely reflects the current earnings of the fund
than the total return.
(continued)
- ------
2
Tax-Free Money Market - Performance
PORTFOLIO COMPOSITION BY CREDIT RATING
- --------------------------------------------------------------------------------
% OF FUND % OF FUND
INVESTMENTS INVESTMENTS
AS OF AS OF
5/31/05 11/30/04
- --------------------------------------------------------------------------------
A-1+ 68% 67%
- --------------------------------------------------------------------------------
A-1 32% 33%
- --------------------------------------------------------------------------------
Ratings provided by independent research companies. These ratings are listed in
Standard & Poor's format even if they were provided by other sources.
PORTFOLIO COMPOSITION BY MATURITY
- --------------------------------------------------------------------------------
% OF FUND % OF FUND
INVESTMENTS INVESTMENTS
AS OF AS OF
5/31/05 11/30/04
- --------------------------------------------------------------------------------
1-30 days 88% 77%
- --------------------------------------------------------------------------------
31-90 days 3% --
- --------------------------------------------------------------------------------
91-180 days 8% 5%
- --------------------------------------------------------------------------------
More than 180 days 1% 18%
- --------------------------------------------------------------------------------
YIELDS AS OF MAY 31, 2005
- --------------------------------------------------------------------------------
7-DAY CURRENT YIELD
- --------------------------------------------------------------------------------
2.41%
- --------------------------------------------------------------------------------
7-DAY EFFECTIVE YIELD
- --------------------------------------------------------------------------------
2.44%
- --------------------------------------------------------------------------------
7-DAY TAX-EQUIVALENT CURRENT YIELDS*
- --------------------------------------------------------------------------------
25.0% Tax Bracket 3.21%
- --------------------------------------------------------------------------------
28.0% Tax Bracket 3.35%
- --------------------------------------------------------------------------------
33.0% Tax Bracket 3.60%
- --------------------------------------------------------------------------------
35.0% Tax Bracket 3.71%
- --------------------------------------------------------------------------------
*The tax brackets indicated are for federal taxes only. Actual tax-equivalent
yields may be lower, if alternative minimum tax is applicable.
Data presented reflect past performance. Past performance is no guarantee of
future results. Current performance may be higher or lower than the performance
shown. To obtain performance data current to the most recent month end, please
call 1-800-345-2021 or visit americancentury.com. Investment income may be
subject to certain state and local taxes and, depending on your tax status, the
federal alternative minimum tax (AMT). Capital gains are not exempt from state
and federal income tax.
An investment in the fund is not insured or guaranteed by the Federal Deposit
Insurance Corporation or any other government agency. Although the fund seeks to
preserve the value of your investment at $1.00 per share, it is possible to lose
money by investing in the fund.
The 7-day current yield more closely reflects the current earnings of the fund
than the total return.
- ------
3
Tax-Free Money Market - Portfolio Commentary
PORTFOLIO MANAGER: ALAN KRUSS
PERFORMANCE SUMMARY
Tax-Free Money Market returned 1.33% for the year ended May 31, 2005,
outperforming the 1.00% average return of the 125 funds in Lipper's "Tax-Exempt
Money Market Funds" category, and ranking the fund in the top 5% (6 of 125) of
the Lipper peers. Tax-Free Money Market also ranks in the top 7% for the 5-year
period, and the top 9% for the 10-year period ended May 31 (see pages 2 and 3
for performance numbers.)
ECONOMIC & MARKET PERSPECTIVE
The U.S. economy grew at a moderate rate during the fiscal year as energy
prices, inflation, and short-term interest rates rose. The annualized real rate
of GDP growth ranged from 3.3% to 4%, while crude oil averaged $47 a barrel and
jumped as high as $57. The 12-month percentage change of "core" CPI (excluding
food and energy) climbed from 1.7% in May 2004 to 2.4% in February 2005, its
fastest growth rate since August 2002. To keep inflation from escalating, the
Federal Reserve raised its target rate, in eight quarter-point increments, from
1% in June 2004 to 3% in May 2005.
PORTFOLIO POSITIONING & STRATEGY
Tax-Free Money Market's 7-day current yield rose from 0.71% on May 31, 2004, to
2.41% by May 31, 2005. Part of this increase was the result of the Federal
Reserve's eight interest rate hikes. In addition, tax-free money market
securities saw a significant jump in yield in April. This seasonal phenomenon
results as investors make withdrawals from money-market funds to pay their
taxes. Demand for money market securities dries up, and yields are pushed
higher.
Managers kept most of Tax-Free Money Market's assets in variable rate demand
notes (VRDNs). These are short-term, floating-rate municipal notes. The
advantage of these securities is that most have weekly yield resets (though some
are daily or monthly). This is beneficial when interest rates are rising, as
they were during the fiscal year, or when demand for money-market securities
falls, as it did in April. VRDNs can capture higher yields more quickly than
other short-term securities, giving Tax-Free Money Market's yield a boost. As of
May 31, 2005, VRDNs made up about 84% of the portfolio's holdings. The remainder
was invested in municipal notes and bonds, municipal mandatory put bonds, and
municipal commercial paper.
OUR COMMITMENT
We remain committed to pursuing Tax-Free Money Market's objective: seeking
safety of principal along with high levels of federal tax-exempt current income
by investing in high-quality, very short-term debt securities issued by cities,
counties, and other municipalities.
- ------
4
Tax-Free Money Market - Schedule of Investments
MAY 31, 2005
Principal Amount ($ IN THOUSANDS) Value
- --------------------------------------------------------------------------------
MUNICIPAL SERURITIES -- 101.8%
ALABAMA -- 2.2%
- --------------------------------------------------------------------------------
$ 4,105 Brundidge Combined Utilities Rev.,
Series 2002 A, VRDN, 3.06%,
6/2/05 (LOC: SouthTrust
Bank N.A.) $ 4,105
- --------------------------------------------------------------------------------
2,145 Tuscaloosa Health Care Auth. Rev.,
(Pine Valley), VRDN, 3.08%,
6/2/05 (LOC: AmSouth Bank) 2,145
- --------------------------------------------------------------------------------
6,250
- --------------------------------------------------------------------------------
ARIZONA -- 4.5%
- --------------------------------------------------------------------------------
6,750 Maricopa County Industrial
Development Auth. Rev., (Michael
Pylman Dairies), VRDN, 3.21%,
6/2/05 (LOC: Wells Fargo
Bank N.A) 6,750
- --------------------------------------------------------------------------------
2,825 Phoenix Civic Improvement Corp.
Rev. Bond, Series 2003 B, 2.95%,
6/24/05 (Acquired 5/26/05, Cost
$2,825) (LOC: Dexia Credit Local)(1) 2,825
- --------------------------------------------------------------------------------
3,325 Pinal County Industrial
Development Auth. Solid Waste
Disposal Rev., (S & T Dairy LLC),
VRDN, 3.21%, 6/2/05 (LOC: Wells
Fargo Bank N.A.) 3,325
- --------------------------------------------------------------------------------
12,900
- --------------------------------------------------------------------------------
CALIFORNIA -- 4.7%
- --------------------------------------------------------------------------------
1,499 Alameda County Industrial
Development Auth. Rev., (Design
Workshops), VRDN, 3.24%, 6/2/05
(LOC: Wells Fargo Bank N.A.) 1,499
- --------------------------------------------------------------------------------
12,000 San Bernardino County Housing
Auth. Rev., Series 2002 C, VRDN,
3.08%, 6/1/05 12,000
- --------------------------------------------------------------------------------
13,499
- --------------------------------------------------------------------------------
COLORADO -- 3.9%
- --------------------------------------------------------------------------------
3,235 Arvada Water Enterprise Rev.,
VRDN, 2.95%, 6/1/05 (FSA)
(SBBPA: Dexia Credit Local) 3,235
- --------------------------------------------------------------------------------
2,100 Colorado Health Facilities Auth.
Rev., (Boulder Community
Hospital), VRDN, 3.10%, 6/1/05
(LOC: Bank One Colorado N.A.) 2,100
- --------------------------------------------------------------------------------
5,800 Colorado Housing & Finance Auth.
Rev., (Kroger Co.), VRDN, 3.08%,
6/2/05 (LOC: U.S. Bank Trust N.A.) 5,800
- --------------------------------------------------------------------------------
11,135
- --------------------------------------------------------------------------------
FLORIDA -- 6.3%
- --------------------------------------------------------------------------------
7,110 Broward County Health Facilities
Auth. Rev., (John Knox Village),
VRDN, 3.10%, 6/1/05 (RADIAN)
(SBBPA: SunTrust Bank) 7,110
- --------------------------------------------------------------------------------
4,955 Florida Housing Finance Agency
Rev., VRDN, 3.09%, 6/2/05
(SBBPA: Merrill Lynch Capital
Services) (Acquired 2/6/04-
4/19/04, Cost $4,955)(1) 4,955
- --------------------------------------------------------------------------------
Principal Amount ($ IN THOUSANDS) Value
- --------------------------------------------------------------------------------
$ 5,000 Jacksonville Health Rev., Series
2004 A, 1.93%, 7/27/05 (LOC:
Bank of America N.A.) (Acquired
11/4/04, Cost $5,000)(1) $ 5,000
- --------------------------------------------------------------------------------
900 Seminole County Industrial
Development Auth. Rev., VRDN,
3.16%, 6/2/05 (LOC: Bank of
America N.A.) 900
- --------------------------------------------------------------------------------
17,965
- --------------------------------------------------------------------------------
GEORGIA -- 1.0%
- --------------------------------------------------------------------------------
2,725 Fulton County Development Auth.
Rev., (Automatic Data Processing),
VRDN, 2.95%, 6/15/05 2,725
- --------------------------------------------------------------------------------
HAWAII -- 1.8%
- --------------------------------------------------------------------------------
3,000 Hawaii Pacific Health Rev., Series
2004 B, (Department Budget &
Finance), VRDN, 3.05%, 6/1/05
(RADIAN) (SBBPA: Bank of
Nova Scotia) 3,000
- --------------------------------------------------------------------------------
2,000 Hawaii Pacific Health Rev., Series
2004 B-2, (Department Budget &
Finance), VRDN, 3.05%, 6/1/05
(RADIAN) (SBBPA: Bank of
Nova Scotia) 2,000
- --------------------------------------------------------------------------------
5,000
- --------------------------------------------------------------------------------
IDAHO -- 2.8%
- --------------------------------------------------------------------------------
5,000 Idaho Tax Anticipation Notes GO,
3.00%, 6/30/05 5,005
- --------------------------------------------------------------------------------
3,000 Lincoln County Industrial
Development Corp. Rev., (Double A
Dairy), VRDN, 3.21%, 6/2/05
(LOC: Bank of America N.A.) 3,000
- --------------------------------------------------------------------------------
8,005
- --------------------------------------------------------------------------------
ILLINOIS -- 0.9%
- --------------------------------------------------------------------------------
2,600 Illinois Finance Auth. Rev.,
(Institutional Gas Technology),
VRDN, 3.03%, 6/2/05 (LOC: Harris
Trust & Savings Bank) 2,600
- --------------------------------------------------------------------------------
INDIANA -- 9.9%
- --------------------------------------------------------------------------------
1,545 Elkhart County Rev., (Corrections
Complex), 2.00%, 6/1/05 (MBIA) 1,545
- --------------------------------------------------------------------------------
2,800 Jasper County Industrial
Development Rev., (Newberry
Farms LLC), VRDN, 3.21%, 6/2/05
(LOC: Bank of the West) 2,800
- --------------------------------------------------------------------------------
6,130 La Porte Industrial Development
Rev., (KKO Realty), VRDN, 3.21%,
6/2/05 (LOC: Bank of New York) 6,130
- --------------------------------------------------------------------------------
1,610 Morgan County Rev., Series
2002 A, (Morgan Hospital &
Medical Center), VRDN, 3.11%,
6/2/05 (LOC: Fifth Third Bank) 1,610
- --------------------------------------------------------------------------------
12,075 Morgan County Rev., Series
2002 B, (Morgan Hospital &
Medical Center), VRDN, 3.11%,
6/2/05 (LOC: Fifth Third Bank) 12,075
- --------------------------------------------------------------------------------
See Notes to Financial Statements. (continued)
- ------
5
Tax-Free Money Market - Schedule of Investments
MAY 31, 2005
Principal Amount ($ IN THOUSANDS) Value
- --------------------------------------------------------------------------------
$ 4,000 Vincennes Economic Development
Rev., (Grandview Care Inc.), VRDN,
3.16%, 6/2/05 (LOC: Bank
One N.A.) $ 4,000
- --------------------------------------------------------------------------------
28,160
- --------------------------------------------------------------------------------
KENTUCKY -- 0.7%
- --------------------------------------------------------------------------------
1,000 Murray Industrial Building Rev.,
(Kroger Co.), VRDN, 3.08%, 6/2/05
(LOC: U.S. Bank N.A.) 1,000
- --------------------------------------------------------------------------------
1,000 Winchester Industrial Building Rev.,
(Kroger Co.), VRDN, 3.08%, 6/2/05
(LOC: U.S. Bank N.A.) 1,000
- --------------------------------------------------------------------------------
2,000
- --------------------------------------------------------------------------------
LOUISIANA -- 1.0%
- --------------------------------------------------------------------------------
2,800 Louisiana Local Government
Environmental Facilities &
Community Development Auth.
Rev., (Trinity Episcopal School),
VRDN, 3.07%, 6/1/05 (LOC:
SunTrust Bank) 2,800
- --------------------------------------------------------------------------------
MARYLAND -- 0.4%
- --------------------------------------------------------------------------------
1,000 Maryland Economic Development
Corp. Rev., Series 2002 B,
(Federation of American Societies),
VRDN, 3.07%, 6/1/05 (LOC:
SunTrust Bank) 1,000
- --------------------------------------------------------------------------------
MICHIGAN -- 1.1%
- --------------------------------------------------------------------------------
3,000 Michigan State Housing
Development Auth. Rev., (Limited
Obligation Revenue - Shoal Creek),
VRDN, 3.00%, 6/1/05 (LOC:
Bank One Michigan) 3,000
- --------------------------------------------------------------------------------
MINNESOTA -- 2.5%
- --------------------------------------------------------------------------------
7,140 Dakota County Community
Development Agency Rev.,
(Catholic Finance Corp.), VRDN,
3.10%, 6/1/05 (LOC: U.S.
Bank N.A.) 7,140
- --------------------------------------------------------------------------------
MISSISSIPPI -- 1.5%
- --------------------------------------------------------------------------------
1,750 De Soto County School District GO,
3.50%, 5/1/06 (FGIC)(2) 1,760
- --------------------------------------------------------------------------------
2,570 Mississippi Business Finance Corp.
Rev., Series 2004 B, VRDN, 3.10%,
6/2/05 (LOC: Wells Fargo
Bank N.A.) 2,570
- --------------------------------------------------------------------------------
4,330
- --------------------------------------------------------------------------------
MISSOURI -- 6.8%
- --------------------------------------------------------------------------------
2,610 Kansas City Industrial Development
Auth. Rev., (Plaza Manor Nursing),
VRDN, 3.11%, 6/2/05 (LOC:
Comerica Bank) 2,610
- --------------------------------------------------------------------------------
7,195 Kansas City Tax Allocation Rev.,
Series 2003 A, (Chouteau I-35),
VRDN, 3.16%, 6/2/05 (MBIA)
(SBBPA: JPMorgan Chase Bank) 7,195
- --------------------------------------------------------------------------------
Principal Amount ($ IN THOUSANDS) Value
- --------------------------------------------------------------------------------
$ 9,550 Missouri State Health &
Educational Facilities Auth. COP,
(Pembroke Hill School), VRDN,
3.12%, 6/2/05 (LOC: Commerce
Bank N.A.) $ 9,550
- --------------------------------------------------------------------------------
19,355
- --------------------------------------------------------------------------------
MULTI-STATE -- 7.3%
- --------------------------------------------------------------------------------
13,849 Koch Floating Rate Trust Rev.,
Series 2000-1, VRDN, 3.16%,
6/2/05 (Ambac) (SBBPA: State
Street Bank & Trust Co.) (Acquired
5/2/00-3/10/05, Cost $13,849)(1)(3) 13,849
- --------------------------------------------------------------------------------
6,924 Koch Floating Rate Trust Various
States Rev., Series 2001-1, VRDN,
3.16%, 6/2/05 (Ambac) (SBBPA:
State Street Bank & Trust Co.)
(Acquired 11/4/02-7/2/04,
Cost $6,924)(1) 6,924
- --------------------------------------------------------------------------------
20,773
- --------------------------------------------------------------------------------
NEVADA -- 2.3%
- --------------------------------------------------------------------------------
3,600 Clark County Economic
Development Rev., (Lutheran
Secondary School Association),
VRDN, 3.15%, 6/2/05 (LOC: Allied
Irish Bank plc) 3,600
- --------------------------------------------------------------------------------
2,895 Clark County School District GO,
4.00%, 6/15/05 (FSA) 2,898
- --------------------------------------------------------------------------------
6,498
- --------------------------------------------------------------------------------
NEW HAMPSHIRE -- 0.5%
- --------------------------------------------------------------------------------
1,390 New Hampshire Health & Education
Facilities Auth. Rev., Series 2004 B,
(South New Hampshire Medical
Center), VRDN, 3.06%, 6/2/05
(RADIAN) (SBBPA: Fleet National
Bank) 1,390
- --------------------------------------------------------------------------------
NEW YORK -- 1.3%
- --------------------------------------------------------------------------------
3,600 Erie County GO, (Revenue
Anticipation Notes), 3.00%,
7/13/05 (LOC: Citigroup Global
Markets) 3,606
- --------------------------------------------------------------------------------
NORTH CAROLINA -- 7.2%
- --------------------------------------------------------------------------------
6,000 North Carolina COP, Series 2004 B,
(Repair & Renovation), 2.00%,
6/1/05 6,000
- --------------------------------------------------------------------------------
11,900 North Carolina Medical Care
Commission Retirement Facilities
First Mortgage Rev., Series 2001 C,
(Village at Brookwood), VRDN,
3.05%, 6/1/05 (LOC: Branch
Banking & Trust) 11,900
- --------------------------------------------------------------------------------
1,580 North Carolina Medical Care
Commission Rev., (Aldersgate),
VRDN, 3.05%, 6/1/05 (LOC:
Branch Banking & Trust) 1,580
- --------------------------------------------------------------------------------
See Notes to Financial Statements. (continued)
- ------
6
Tax-Free Money Market - Schedule of Investments
MAY 31, 2005
Principal Amount ($ IN THOUSANDS) Value
- --------------------------------------------------------------------------------
$ 1,000 North Carolina Medical Care
Commission Rev., (Carol Woods),
VRDN, 2.95%, 6/1/05 (RADIAN)
(SBBPA: Branch Banking & Trust) $ 1,000
- --------------------------------------------------------------------------------
20,480
- --------------------------------------------------------------------------------
OHIO -- 0.9%
- --------------------------------------------------------------------------------
2,650 State of Ohio Rev., (Ashland
University), VRDN, 3.01%, 6/2/05
(LOC: Keybank N.A.) 2,650
- --------------------------------------------------------------------------------
OREGON -- 4.6%
- --------------------------------------------------------------------------------
13,100 Port of Portland Public Grain
Elevator Rev., (Columbia Grain Inc.),
VRDN, 3.31%, 6/2/05 (LOC:
Wachovia Bank, N.A.) 13,100
- --------------------------------------------------------------------------------
PENNSYLVANIA -- 0.3%
- --------------------------------------------------------------------------------
900 Delaware County Industrial
Development Auth. Rev., (Exelon),
VRDN, 3.05%, 6/1/05 (LOC:
Wachovia Bank N.A.) 900
- --------------------------------------------------------------------------------
SOUTH DAKOTA -- 1.1%
- --------------------------------------------------------------------------------
3,000 South Dakota Value Added Finance
Auth. Rev., (Rex Nederend Family
Trust), VRDN, 3.21%, 6/2/05 (LOC:
Keybank N.A.) 3,000
- --------------------------------------------------------------------------------
TENNESSEE -- 6.7%
- --------------------------------------------------------------------------------
7,880 Bradley County Industrial
Development Board Rev., (Kroger
Co.), VRDN, 3.08%, 6/2/05 (LOC:
U.S. Bank N.A.) 7,880
- --------------------------------------------------------------------------------
700 Cookeville Industrial Development
Board Rev., Series 2001 A,
(Advocacy & Resources Project),
VRDN, 3.08%, 6/2/05 (LOC:
AmSouth Bank) 700
- --------------------------------------------------------------------------------
2,300 Knox County Industrial
Development Board Rev., (Kroger
Co.), VRDN, 3.06%, 6/2/05 (LOC:
U.S. Bank Trust N.A.) 2,300
- --------------------------------------------------------------------------------
8,200 Shelby County Health Educational
& Housing Facilities Board Rev.,
(Kings Daughter & Sons), VRDN,
3.08%, 6/2/05 (LOC: AmSouth
Bank) 8,200
- --------------------------------------------------------------------------------
19,080
- --------------------------------------------------------------------------------
TEXAS -- 13.4%
- --------------------------------------------------------------------------------
10,000 Crawford Education Facilities Corp.
Rev., (University Package
System A), VRDN, 3.05%, 6/2/05
(LOC: BNP Paribas) 10,000
- --------------------------------------------------------------------------------
Principal Amount ($ IN THOUSANDS) Value
- --------------------------------------------------------------------------------
$ 5,500 Gulf Coast Industrial Development
Auth. Rev., (Petrounited Term Inc.),
VRDN, 3.06%, 6/2/05 (LOC: BNP
Paribas) $ 5,500
- --------------------------------------------------------------------------------
3,000 Hale County Industrial Development
Corp. Rev., (Struikmans), VRDN,
3.21%, 6/2/05 (LOC: Bank of the
West) 3,000
- --------------------------------------------------------------------------------
4,000 Hale County Industrial Development
Corp. Rev., (White River Ranch),
VRDN, 3.21%, 6/2/05 (LOC: Wells
Fargo Bank N.A) 4,000
- --------------------------------------------------------------------------------
3,920 San Antonio Education Facilities
Corp. Rev., Series 2004 A, (Phase 1
Dormitory), VRDN, 3.09%, 6/2/05
(LOC: Allied Irish Bank plc) 3,920
- --------------------------------------------------------------------------------
12,000 Texas Tax and Rev. Anticipation
Notes, 3.00%, 8/31/05 12,041
- --------------------------------------------------------------------------------
38,461
- --------------------------------------------------------------------------------
VERMONT -- 0.8%
- --------------------------------------------------------------------------------
2,375 Vermont Educational & Health
Buildings Financing Agency Rev.,
Series 2004 B, (Landmark
College), VRDN, 3.06%, 6/2/05
(RADIAN) (LOC: SunTrust Bank) 2,375
- --------------------------------------------------------------------------------
VIRGINIA -- 3.1%
- --------------------------------------------------------------------------------
2,465 Bristol Industrial Development
Auth. Rev., (Bristol Health Care
Center Inc.), VRDN, 3.15%, 6/1/05
(LOC: Regions Bank) 2,465
- --------------------------------------------------------------------------------
6,400 Suffolk Industrial Development
Auth. Rev., (Lake Prince Center),
VRDN, 3.10%, 6/1/05 (LOC:
Branch Banking & Trust) 6,400
- --------------------------------------------------------------------------------
8,865
- --------------------------------------------------------------------------------
WASHINGTON -- 0.3%
- --------------------------------------------------------------------------------
965 Pierce County Economic
Development Corporate Rev., (K &
M Holdings II), VRDN, 3.27%,
6/1/05 (LOC: Wells Fargo Bank,
N.A.) (Acquired 11/17/97, Cost
$965)(1) 965
- --------------------------------------------------------------------------------
TOTAL INVESTMENT SECURITIES -- 101.8% 290,007
- --------------------------------------------------------------------------------
OTHER ASSETS AND LIABILITIES -- (1.8)% (5,156)
- --------------------------------------------------------------------------------
TOTAL NET ASSETS -- 100.0% $284,851
================================================================================
See Notes to Financial Statements. (continued)
- ------
7
Tax-Free Money Market - Schedule of Investments
MAY 31, 2005
NOTES TO SCHEDULE OF INVESTMENTS
Ambac = Ambac Assurance Corporation
COP = Certificates of Participation
FGIC = Financial Guaranty Insurance Co.
FSA = Financial Security Assurance, Inc.
GO = General Obligation
LOC = Letter of Credit
MBIA = MBIA Insurance Corporation
RADIAN = Radian Asset Assurance, Inc.
SBBPA = Standby Bond Purchase Agreement
VRDN = Variable Rate Demand Note. Interest reset date is indicated. Rate shown
is effective May 31, 2005.
(1) Security was purchased under Rule 144A of the Securities Act of 1933 or is
a private placement and, unless registered under the Act or exempted from
registration, may only be sold to qualified institutional investors. The
aggregate value of restricted securities at May 31, 2005, was $34,518 (in
thousands), which represented 12.1% of net assets. None of the restricted
securities are considered to be illiquid.
(2) When-issued security.
(3) Security, or a portion thereof, has been segregated for a when-issued
security.
See Notes to Financial Statements.
- ------
8
Tax-Free Bond - Performance
TOTAL RETURNS AS OF MAY 31, 2005
------------------------------
AVERAGE ANNUAL RETURNS
- --------------------------------------------------------------------------------
SINCE INCEPTION
1 YEAR 5 YEARS 10 YEARS INCEPTION DATE
- --------------------------------------------------------------------------------
INVESTOR CLASS 5.16% 6.10% 5.29% 5.63% 3/2/87
- --------------------------------------------------------------------------------
LEHMAN BROTHERS
MUNICIPAL
5-YEAR GO INDEX 4.47% 5.83% 5.23% 5.80%(1) --
- --------------------------------------------------------------------------------
AVERAGE RETURN OF
LIPPER'S INTERMEDIATE
MUNICIPAL DEBT FUNDS(2) 4.83% 5.74% 4.97% 5.78%(3) --
- --------------------------------------------------------------------------------
Fund's Lipper Ranking
as of 5/31/05(2) 65 of 156 26 of 95 15 of 68 8 of 12(3) --
- --------------------------------------------------------------------------------
Fund's Lipper Ranking
as of 6/30/05(2) 60 of 151 26 of 96 17 of 69 8 of 12(3) --
- --------------------------------------------------------------------------------
Institutional Class 5.37%% -- -- 3.70% 4/15/03
- --------------------------------------------------------------------------------
(1) Since 2/28/87, the date nearest the Investor Class's inception for which
data are available.
(2) (c)2005 Reuters. All rights reserved. Any copying, republication or
redistribution of Lipper content, including by caching, framing or similar
means, is expressly prohibited without the prior written consent of Lipper.
Lipper shall not be liable for any errors or delays in the content, or for
any actions taken in reliance thereon.
Lipper Fund Performance -- Performance data is total return, and is
preliminary and subject to revision.
Lipper Rankings -- Rankings are based only on the universe shown. This
listing might not represent the complete universe of funds tracked by Lipper
Inc.
The data contained herein has been obtained from company reports, financial
reporting services, periodicals and other resources believed to be reliable.
Although carefully verified, data on compilations is not guaranteed by
Lipper Inc. - A Reuters Company and may be incomplete. No offer or
solicitations to buy or sell any of the securities herein is being made by
Lipper.
(3) Since 3/31/87, the date nearest the Investor Class's inception for which
data are available.
Data presented reflect past performance. Past performance is no guarantee of
future results. Current performance may be higher or lower than the performance
shown. Investment return and principal value will fluctuate, and redemption
value may be more or less than original cost. To obtain performance data current
to the most recent month end, please call 1-800-345-2021 or visit
americancentury.com. As interest rates rise, bond values will decline.
Investment income may be subject to certain state and local taxes and, depending
on your tax status, the federal alternative minimum tax (AMT). Capital gains are
not exempt from state and federal income tax.
Unless otherwise indicated, performance reflects Investor Class shares;
performance for other share classes will vary due to differences in fee
structure. For information about other share classes available, please consult
the prospectus. Data assumes reinvestment of dividends and capital gains, and
none of the charts reflect the deduction of taxes that a shareholder would pay
on fund distributions or the redemption of fund shares. Returns for the index
are provided for comparison. The fund's total returns include operating expenses
(such as transaction costs and management fees) that reduce returns, while the
total returns of the index do not.
(continued)
- ------
9
Tax-Free Bond - Performance
GROWTH OF $10,000 OVER 10 YEARS
$10,000 investment made May 31, 1995
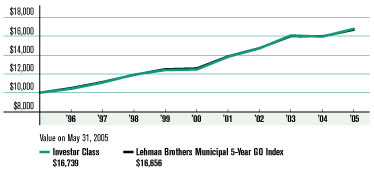
ONE-YEAR RETURNS OVER 10 YEARS
Periods ended May 31
- ------------------------------------------------------------------------------------------------
1996 1997 1998 1999 2000 2001 2002 2003 2004 2005
- ------------------------------------------------------------------------------------------------
Investor Class 4.12% 6.29% 7.60% 4.07% 0.44% 10.77% 6.45% 9.31% -0.79% 5.16%
- ------------------------------------------------------------------------------------------------
Lehman Brothers
Municipal 5-Year
GO Index 4.74% 6.08% 6.95% 4.90% 0.65% 10.17% 6.33% 8.72% -0.22% 4.47%
- ------------------------------------------------------------------------------------------------
Data presented reflect past performance. Past performance is no guarantee of
future results. Current performance may be higher or lower than the performance
shown. Investment return and principal value will fluctuate, and redemption
value may be more or less than original cost. To obtain performance data current
to the most recent month end, please call 1-800-345-2021 or visit
americancentury.com. As interest rates rise, bond values will decline.
Investment income may be subject to certain state and local taxes and, depending
on your tax status, the federal alternative minimum tax (AMT). Capital gains are
not exempt from state and federal income tax.
Unless otherwise indicated, performance reflects Investor Class shares;
performance for other share classes will vary due to differences in fee
structure. For information about other share classes available, please consult
the prospectus. Data assumes reinvestment of dividends and capital gains, and
none of the charts reflect the deduction of taxes that a shareholder would pay
on fund distributions or the redemption of fund shares. Returns for the index
are provided for comparison. The fund's total returns include operating expenses
(such as transaction costs and management fees) that reduce returns, while the
total returns of the index do not.
- ------
10
Tax-Free Bond - Portfolio Commentary
PORTFOLIO MANAGER: KENNETH SALINGER
PERFORMANCE SUMMARY
Tax-Free Bond returned 5.16%* for the fiscal year ended May 31, 2005, reflecting
a respectable performance by municipal bonds that occurred in spite of eight
consecutive short-term interest rate increases by the Federal Reserve. By
comparison, the average return of the 156 Intermediate Municipal Debt Funds
tracked by Lipper was 4.83%. And based on five- and 10-year performances,
Tax-Free Bond ranked among the top 30% of its Lipper peers. (Please see pages 9
and 10.)
YIELD SUMMARY & PERSPECTIVE
The fund's key investment objective is to seek safety of principal and high
current income that is exempt from federal income tax. Along those lines,
Tax-Free Bond's 30-day SEC yield was 3.08% as of May 31, 2005, compared with the
Lipper average 30-day SEC yield of 2.86%. All else being equal, a higher yield
can boost performance.
Tax-Free Bond's 30-day SEC yield translated into a tax-equivalent yield of 4.11%
for investors in a 25% federal tax bracket, while equating to 4.74% for
investors in a 35% bracket. (Please see the table at bottom right.)
ECONOMIC REVIEW
The U.S. economy grew at a moderate rate during the fiscal year as energy
prices, inflation, and short-term interest rates rose. The annualized real rate
of GDP growth ranged from 3.3% to 4%, while crude oil averaged $47 a barrel and
jumped as high as $57. The 12-month percentage change of "core" CPI (excluding
food and energy) climbed from 1.7% in May 2004 to 2.4% in February 2005, its
fastest growth rate since August 2002. To keep inflation from escalating, the
Federal Reserve raised its target rate, in eight quarter-point increments, from
1% in June 2004 to 3% in May 2005.
BROAD BOND MARKET REVIEW
Though core inflation rose, it remained at relatively low levels, and stopped
accelerating after the first quarter of 2005. And while economic growth was
moderate, it declined after reaching 4% in the third quarter of 2004. That
helped longer-term interest rates and bond yields fall, and bond prices rise.
Lower longer-maturity yields, combined with higher yields for shorter-maturity
securities (which rose with the Fed's rate hikes) created a "flatter" Treasury
yield curve and helped longer-maturity/duration notes and bonds generally
outperform shorter-maturity/duration notes.
YIELDS AS OF MAY 31, 2005
- --------------------------------------------------------------------------------
30-DAY SEC YIELD
- --------------------------------------------------------------------------------
Investor Class 3.08%
- --------------------------------------------------------------------------------
Institutional Class 3.28%
- --------------------------------------------------------------------------------
INVESTOR CLASS 30-DAY TAX-EQUIVALENT YIELDS(1)
- --------------------------------------------------------------------------------
25.0% Tax Bracket 4.11%
- --------------------------------------------------------------------------------
28.0% Tax Bracket 4.28%
- --------------------------------------------------------------------------------
33.0% Tax Bracket 4.60%
- --------------------------------------------------------------------------------
35.0% Tax Bracket 4.74%
- --------------------------------------------------------------------------------
(1) The tax brackets indicated are for federal taxes only. Actual tax-equivalent
yields may be lower, if alternative minimum tax is applicable.
*All fund returns and yields referenced in this commentary are for Investor
Class shares.
(continued)
- ------
11
Tax-Free Bond - Portfolio Commentary
MUNICIPAL MARKET REVIEW
The Lehman Brothers Municipal Bond Index returned 7.96% for the fiscal year,
outperforming its taxable counterpart, the Lehman Brothers U.S. Aggregate. The
municipal yield curve also flattened, causing long-term municipal bonds to
outperform shorter-term notes. But the municipal yield curve did not flatten as
much as the Treasury curve, making municipal bond yields attractive compared
with Treasury yields. In fact, as of May 31, 2005, 30-year AAA-rated general
obligation municipal bonds yielded more than 30-year Treasury bonds! Credit
quality also affected performance--lower-quality, higher-yielding bonds tended
to outperform investment-grade debt.
PORTFOLIO POSITIONING & STRATEGY
During the fiscal year, we primarily bought municipal bonds rated AAA and AA,
which represented 82% of the portfolio at the end of May. In addition to those
top-quality securities, we kept a conservatively small slice of the portfolio in
lower-rated investment-grade bonds. As a tradeoff for their slightly increased
credit risk, these securities tend to offer higher yields than like-maturity
bonds with better credit ratings.
We also attempted to add value by trying to take advantage of seasonal supply
and demand fluctuations within and between the various states. Over the last six
months, for example, we increased the portfolio's holdings of bonds from states
such as California, Texas, and Arizona (due to expectations for these securities
to perform well going forward), while selling bonds from Illinois and
Washington, among others.
OUR COMMITMENT
We remain committed to seeking safety of principal while providing a high level
of federal tax-exempt current income by investing at least 80% of Tax-Free
Bond's assets in debt securities that are exempt from federal income tax.
PORTFOLIO COMPOSITION BY CREDIT RATING
- --------------------------------------------------------------------------------
% OF FUND % OF FUND
INVESTMENTS INVESTMENTS
AS OF AS OF
5/31/05 11/30/04
- --------------------------------------------------------------------------------
AAA 77% 74%
- --------------------------------------------------------------------------------
AA 5% 9%
- --------------------------------------------------------------------------------
A 8% 8%
- --------------------------------------------------------------------------------
BBB 10% 9%
- --------------------------------------------------------------------------------
Ratings provided by independent research companies. These ratings are listed in
Standard & Poor's format even if they were provided by other sources.
TOP FIVE STATES
AS OF MAY 31, 2005
- --------------------------------------------------------------------------------
% OF NET % OF NET
ASSETS ASSETS
AS OF AS OF
5/31/05 11/30/04
- --------------------------------------------------------------------------------
California 12.9% 7.8%
- --------------------------------------------------------------------------------
Texas 10.5% 8.5%
- --------------------------------------------------------------------------------
Arizona 9.4% 8.2%
- --------------------------------------------------------------------------------
Illinois 7.3% 9.6%
- --------------------------------------------------------------------------------
Washington 6.3% 7.3%
- --------------------------------------------------------------------------------
- ------
12
Tax-Free Bond - Schedule of Investments
MAY 31, 2005
Principal Amount ($ IN THOUSANDS) Value
- --------------------------------------------------------------------------------
MUNICIPAL SECURITIES -- 101.3%
ALABAMA -- 1.7%
- --------------------------------------------------------------------------------
$ 1,410 Alabama Board of Education Rev.,
(Calhoun Community College),
5.00%, 5/1/20 (Ambac) $ 1,535
- --------------------------------------------------------------------------------
1,635 Alabama Board of Education Rev.,
(Jefferson State Community
College), 5.00%, 10/1/23 (Ambac) 1,763
- --------------------------------------------------------------------------------
865 Alabama Water Pollution Control
Auth. GO, 5.75%, 8/15/18 (Ambac) 963
- --------------------------------------------------------------------------------
190 East Central Industrial Development
Auth. Rev., 5.25%, 9/1/08,
Prerefunded at 100% of Par
(Ambac)(1) 203
- --------------------------------------------------------------------------------
810 East Central Industrial Development
Auth. Rev., 5.25%, 9/1/13,
Prerefunded at 100% of Par
(Ambac)(1) 863
- --------------------------------------------------------------------------------
1,875 Helena Utilities Board Water &
Sewer Rev., 5.75%, 4/1/20 (MBIA) 2,126
- --------------------------------------------------------------------------------
1,435 Helena Utilities Board Water &
Sewer Rev., 5.75%, 4/1/22 (MBIA) 1,627
- --------------------------------------------------------------------------------
1,250 Huntsville Health Care Auth. Rev.,
Series 2002 A, 3.80%, 6/1/06
(MBIA) 1,260
- --------------------------------------------------------------------------------
10,340
- --------------------------------------------------------------------------------
ALASKA -- 0.2%
- --------------------------------------------------------------------------------
1,000 Alaska Energy Auth. Power Rev.,
Series 2000-4, (Bradley Lake),
5.50%, 7/1/05 (FSA) 1,002
- --------------------------------------------------------------------------------
ARIZONA -- 8.9%
- --------------------------------------------------------------------------------
1,275 Arizona Health Facilities Auth. Rev.,
(Blood Systems Incorporated),
4.00%, 4/1/12 1,292
- --------------------------------------------------------------------------------
1,175 Arizona Health Facilities Auth. Rev.,
(Blood Systems Incorporated),
4.50%, 4/1/16 1,188
- --------------------------------------------------------------------------------
1,000 Arizona Tourism & Sports Auth.
Rev., (Baseball Training Facilities),
5.00%, 7/1/11 1,063
- --------------------------------------------------------------------------------
1,000 Arizona Tourism & Sports Auth.
Rev., (Baseball Training Facilities),
5.00%, 7/1/12 1,064
- --------------------------------------------------------------------------------
2,925 Chandler Water & Sewer Rev.,
4.50%, 7/1/06 (FSA) 2,977
- --------------------------------------------------------------------------------
2,130 Energy Management Services LLC
Rev., (Arizona State University -
Main Campus), 4.50%, 7/1/12
(MBIA) 2,285
- --------------------------------------------------------------------------------
1,930 Gilbert Water Resource Municipal
Property Corp. Rev., (Development
Fee & Sub Lien), 4.25%, 4/1/11 1,931
- --------------------------------------------------------------------------------
3,000 Gilbert Water Resource Municipal
Property Corp. Rev., (Development
Fee & Sub-Lien), 4.90%, 4/1/19 3,008
- --------------------------------------------------------------------------------
1,000 Glendale Water & Sewer Rev.,
5.00%, 7/1/06 (FGIC) 1,023
- --------------------------------------------------------------------------------
Principal Amount ($ IN THOUSANDS) Value
- --------------------------------------------------------------------------------
$ 4,000 Maricopa County Community
College District GO, Series 1997 B,
5.00%, 7/1/06(2) $ 4,130
- --------------------------------------------------------------------------------
1,155 Maricopa County Gilbert Unified
School District No. 41 GO, 5.75%,
7/1/11 (FSA) 1,318
- --------------------------------------------------------------------------------
2,415 Maricopa County Saddle Mountain
Unified School District No. 90 GO,
Series 2003 A, 5.25%, 7/1/11 2,610
- --------------------------------------------------------------------------------
2,000 Maricopa County Saddle Mountain
Unified School District No. 90 GO,
Series 2003 A, 5.25%, 7/1/12 2,169
- --------------------------------------------------------------------------------
1,000 Maricopa County Unified School
District No. 11 Peoria GO, (School
Improvement), 4.25%, 7/1/18
(Ambac) 1,029
- --------------------------------------------------------------------------------
1,000 Mohave County Community College
District Rev., (State Board of
Directors), 6.00%, 3/1/20 (MBIA) 1,113
- --------------------------------------------------------------------------------
4,490 Mohave County Industrial
Development Auth. COP, Series
2004 A, (Mohave Prison), 5.00%,
4/1/13 (XLCA)(2) 4,908
- --------------------------------------------------------------------------------
1,655 Mohave County Industrial
Development Auth. GO, Series
2004 A, (Mohave Prison), 5.00%,
4/1/14 (XLCA) 1,813
- --------------------------------------------------------------------------------
1,200 Pima County Indian
Oasis-Baboquivari Unified School
District No. 40 GO, Series 2002 A,
4.60%, 7/1/13 (MBIA) 1,287
- --------------------------------------------------------------------------------
2,600 Pima County Tucson Unified
School District No. 1 GO, 4.625%,
7/1/13 (FSA) 2,796
- --------------------------------------------------------------------------------
3,135 Pima County Unified School
District No. 10 GO, 5.00%, 7/1/10
(FSA)(3) 3,415
- --------------------------------------------------------------------------------
3,970 Pinal County COP, 5.00%, 12/1/25(2) 4,130
- --------------------------------------------------------------------------------
1,425 Pinal County COP, 5.00%, 12/1/26 1,483
- --------------------------------------------------------------------------------
3,085 South Tucson Municipal Property
Corp. Rev., 5.50%, 6/1/24 3,237
- --------------------------------------------------------------------------------
1,845 West Campus Housing Student
Housing Rev., (Arizona State
University), 5.00%, 7/1/30
(Ambac)(3) 1,958
- --------------------------------------------------------------------------------
2,000 West Campus Housing Student
Housing Rev., (Arizona State
University), 4.50%, 7/1/35
(Ambac)(3) 1,984
- --------------------------------------------------------------------------------
55,211
- --------------------------------------------------------------------------------
ARKANSAS -- 0.3%
- --------------------------------------------------------------------------------
1,630 Fort Smith Sales and Use Tax Rev.,
Series 2001 A, 4.375%, 12/1/11 1,647
- --------------------------------------------------------------------------------
CALIFORNIA -- 12.9%
- --------------------------------------------------------------------------------
1,000 California Public Works Board
Lease COP, Series 1994 A, (Various
University of California Projects),
6.20%, 10/1/08 1,023
- --------------------------------------------------------------------------------
See Notes to Financial Statements. (continued)
- ------
13
Tax-Free Bond - Schedule of Investments
MAY 31, 2005
Principal Amount ($ IN THOUSANDS) Value
- --------------------------------------------------------------------------------
$ 3,890 California Public Works Board
Lease COP, Series 2004 E,
(Department of Corrections),
3.00%, 6/1/05 $ 3,890
- --------------------------------------------------------------------------------
7,855 California Rev., Series 2004 A,
3.00%, 6/30/05 7,856
- --------------------------------------------------------------------------------
20,000 California Rev., Series 2004 B,
(Revenue Anticipation Notes),
4.50%, 6/30/05 20,028
- --------------------------------------------------------------------------------
890 California Special Districts
Association Finance Corp. COP,
Series 2005 RR, 5.00%, 8/1/35
(XLCA) 934
- --------------------------------------------------------------------------------
1,000 California Statewide Communities
Development Auth. Rev., Series
2002 E, (Kaiser Permanente),
4.70%, 6/1/09 1,045
- --------------------------------------------------------------------------------
1,075 California Statewide Communities
Development Auth. Water & Waste
Rev., Series 2004 A, (Pooled
Financing Program), 5.00%,
10/1/12 (FSA) 1,189
- --------------------------------------------------------------------------------
2,000 California Statewide Communities
Development Auth. Water & Waste
Rev., Series 2004 A, (Pooled
Financing Program), 5.25%,
10/1/19 (FSA) 2,215
- --------------------------------------------------------------------------------
1,615 Campbell COP, (Civic Center),
5.83%, 10/1/31 (Ambac)(4) 441
- --------------------------------------------------------------------------------
1,615 Campbell COP, (Civic Center),
5.83%, 10/1/32 (Ambac)(4) 420
- --------------------------------------------------------------------------------
2,000 Coachella Financing Auth. Tax
Allocation Rev., Series 2004 B,
(Redevelopment Project No. 4),
5.25%, 9/1/34 (XLCA) 2,154
- --------------------------------------------------------------------------------
3,000 Imperial Irrigation District COP,
(Water Systems), 5.50%, 7/1/29
(Ambac) 3,298
- --------------------------------------------------------------------------------
5,000 Los Angeles Department of Water
& Power Rev., Series 2001 AA3,
(Power Systems), 5.25%, 7/1/24(2) 5,109
- --------------------------------------------------------------------------------
2,200 Manteca Unified School District
GO, 5.25%, 8/1/23 (FSA) 2,424
- --------------------------------------------------------------------------------
1,125 Menifee Union School District GO,
Series 2005 B, 5.00%, 8/1/27
(FGIC)(3) 1,199
- --------------------------------------------------------------------------------
3,915 Riverside County Redevelopment
Agency Tax Allocation Rev., Series
2004 A, (Housing), 5.00%,
10/1/37 (XLCA)(2) 4,091
- --------------------------------------------------------------------------------
1,120 San Diego Public Water Facilities
Financing Auth. Rev., 5.00%,
8/1/24 (MBIA) 1,192
- --------------------------------------------------------------------------------
2,145 San Francisco Uptown Parking
Corporation Rev., (Union Square),
5.50%, 7/1/15 (MBIA) 2,398
- --------------------------------------------------------------------------------
1,000 San Francisco Uptown Parking
Corporation Rev., (Union Square),
6.00%, 7/1/20 (MBIA) 1,137
- --------------------------------------------------------------------------------
Principal Amount ($ IN THOUSANDS) Value
- --------------------------------------------------------------------------------
$ 2,000 San Francisco Uptown Parking
Corporation Rev., (Union Square),
6.00%, 7/1/31 (MBIA) $ 2,272
- --------------------------------------------------------------------------------
4,430 San Marcos Public Facilities Auth.
Rev. Tax Allocation, Series 2005 A,
(Areas No. 1 & 3), 5.00%, 8/1/34
(Ambac) 4,732
- --------------------------------------------------------------------------------
2,970 San Mateo County Joint Powers
Auth. Lease Rev., (Capital Projects
Program), 6.50%, 7/1/16 (MBIA)(2) 3,673
- --------------------------------------------------------------------------------
3,400 Santa Barbara Redevelopment
Agency Tax Allocation Rev., Series
1995 A, (Central City), 6.00%,
3/1/08 (Ambac)(2) 3,597
- --------------------------------------------------------------------------------
2,195 South Tahoe Joint Powers
Financing Auth. Rev., Series
2005 A, (Redevelopment Area
No. 1), 5.00%, 10/1/35 (Ambac)(3) 2,310
- --------------------------------------------------------------------------------
2,000 University of California Rev., Series
2002 O, (Multiple Purpose
Projects), 4.50%, 9/1/15 (FGIC) 2,115
- --------------------------------------------------------------------------------
80,742
- --------------------------------------------------------------------------------
COLORADO -- 2.5%
- --------------------------------------------------------------------------------
1,100 Arapahoe County Water &
Wastewater Public Improvement
District GO, Series 2002 B, 5.75%,
12/1/17 (MBIA) 1,258
- --------------------------------------------------------------------------------
325 Colorado Health Facilities Auth.
Rev., (Vail Valley Medical Center),
4.00%, 1/15/06 326
- --------------------------------------------------------------------------------
500 Colorado Health Facilities Auth.
Rev., (Vail Valley Medical Center),
4.00%, 1/15/07 505
- --------------------------------------------------------------------------------
685 Colorado Health Facilities Auth.
Rev., (Vail Valley Medical Center),
4.50%, 1/15/09 704
- --------------------------------------------------------------------------------
1,500 Colorado Health Facilities Auth.
Rev., Series 2004 B, (Evangelical
Lutheran), 3.75%, 6/1/09 1,490
- --------------------------------------------------------------------------------
450 Colorado Water Resources &
Power Development Auth. Rev.,
Series 2000 A, 6.25%, 9/1/10,
Prerefunded at 100% of Par(1) 518
- --------------------------------------------------------------------------------
50 Colorado Water Resources &
Power Development Auth. Rev.,
Series 2000 A, 6.25%, 9/1/16 57
- --------------------------------------------------------------------------------
1,430 Denver West Metropolitan District
GO, 5.25%, 12/1/24 1,458
- --------------------------------------------------------------------------------
1,000 Douglas & Elbert Counties School
District No. Re-1 GO, 5.50%,
12/15/14 (FGIC/State Aid
Withholding) 1,159
- --------------------------------------------------------------------------------
1,000 Douglas & Elbert Counties School
District No. Re-1 GO, Series
2002 B, 5.75%, 12/15/12,
Prerefunded at 100% of Par
(FSA/State Aid Withholding)(1) 1,161
- --------------------------------------------------------------------------------
1,100 Eagle Bend Metropolitan District
No. 2 GO, 5.25%, 12/1/23
(RADIAN) 1,179
- --------------------------------------------------------------------------------
See Notes to Financial Statements. (continued)
- ------
14
Tax-Free Bond - Schedule of Investments
MAY 31, 2005
Principal Amount ($ IN THOUSANDS) Value
- --------------------------------------------------------------------------------
$ 5,000 University of Colorado Regents
COP, 6.00%, 12/1/22 (MBIA-IBC)(2) $ 5,610
- --------------------------------------------------------------------------------
15,425
- --------------------------------------------------------------------------------
CONNECTICUT -- 0.8%
- --------------------------------------------------------------------------------
2,150 City of Bridgeport GO, Series
2004 A, 5.25%, 8/15/22 (MBIA) 2,363
- --------------------------------------------------------------------------------
2,215 New Haven Air Rights Package
Facility Rev., 5.00%, 12/1/10
(Ambac) 2,422
- --------------------------------------------------------------------------------
4,785
- --------------------------------------------------------------------------------
DISTRICT OF COLUMBIA -- 0.4%
- --------------------------------------------------------------------------------
1,385 District of Columbia GO, Series
1999 B, 5.50%, 6/1/09 (FSA) 1,510
- --------------------------------------------------------------------------------
1,155 District of Columbia Rev., (Gonzaga
College High School), 5.20%,
7/1/12 (FSA) 1,249
- --------------------------------------------------------------------------------
2,759
- --------------------------------------------------------------------------------
FLORIDA -- 1.1%
- --------------------------------------------------------------------------------
2,585 Greater Orlando Aviation Auth.
Rev., Series 2003 A, 5.00%,
10/1/13 (FSA) 2,855
- --------------------------------------------------------------------------------
1,465 Martin County Health Facilities
Auth. Rev., Series 2002 A, (Martin
Memorial Medical Center), 3.60%,
11/15/05 1,467
- --------------------------------------------------------------------------------
1,500 Martin County Health Facilities
Auth. Rev., Series 2002 A, (Martin
Memorial Medical Center), 4.00%,
11/15/06 1,512
- --------------------------------------------------------------------------------
1,000 Orlando Utilities Commission
Water & Electric Rev., Series
1989 D, 6.75%, 10/1/17(1) 1,235
- --------------------------------------------------------------------------------
7,069
- --------------------------------------------------------------------------------
GEORGIA -- 0.9%
- --------------------------------------------------------------------------------
255 Georgia Municipal Electric Power
Auth. Rev., Series 1991 V, 6.50%,
1/1/09, Prerefunded at 100% of
Par (MBIA-IBC)(1) 281
- --------------------------------------------------------------------------------
110 Georgia Municipal Electric Power
Auth. Rev., Series 1991 V, 6.50%,
1/1/12 (MBIA-IBC)(1) 128
- --------------------------------------------------------------------------------
635 Georgia Municipal Electric Power
Auth. Rev., Series 1991 V, 6.50%,
1/1/12 (MBIA-IBC) 726
- --------------------------------------------------------------------------------
2,570 Gwinnett County Water & Sewer
Auth. Rev., 4.00%, 8/1/14 2,677
- --------------------------------------------------------------------------------
1,510 Gwinnett County Water & Sewer
Auth. Rev., 4.00%, 8/1/15 1,565
- --------------------------------------------------------------------------------
5,377
- --------------------------------------------------------------------------------
HAWAII -- 0.1%
- --------------------------------------------------------------------------------
500 Maui County GO, Series 2000 A,
6.50%, 3/1/10, Prerefunded at
101% of Par (FGIC)(1) 580
- --------------------------------------------------------------------------------
Principal Amount ($ IN THOUSANDS) Value
- --------------------------------------------------------------------------------
IDAHO -- 0.2%
- --------------------------------------------------------------------------------
$ 1,000 Blaine County Hailey School
District No. 61 GO, 5.00%,
7/30/10 (Ambac) $ 1,089
- --------------------------------------------------------------------------------
ILLINOIS -- 7.3%
- --------------------------------------------------------------------------------
2,000 Bedford Park GO, Series 2004 A,
5.25%, 12/15/20 (FSA) 2,219
- --------------------------------------------------------------------------------
4,000 Chicago O'Hare International
Airport Rev., Series 1993 A,
(Senior Lien), 5.00%, 1/1/12
(MBIA-IBC)(2) 4,378
- --------------------------------------------------------------------------------
1,000 Chicago O'Hare International
Airport Rev., Series 2004 A, 5.00%,
1/1/26 (MBIA) 1,060
- --------------------------------------------------------------------------------
2,000 Illinois Dedicated Tax Rev., (Civic
Center), 6.25%, 12/15/20 (Ambac) 2,463
- --------------------------------------------------------------------------------
595 Illinois Development Finance Auth.
Rev., Series 2001 B, (Midwestern
University), 5.00%, 5/15/08 621
- --------------------------------------------------------------------------------
655 Illinois Development Finance Auth.
Rev., Series 2001 B, (Midwestern
University), 5.125%, 5/15/10 698
- --------------------------------------------------------------------------------
400 Illinois Development Finance Auth.
Rev., Series 2001 B, (Midwestern
University), 5.75%, 5/15/16 434
- --------------------------------------------------------------------------------
1,155 Illinois Finance Auth. Rev., Series
2005 A, (Depaul University),
5.00%, 10/1/14 1,250
- --------------------------------------------------------------------------------
1,000 Illinois Finance Auth. Rev., Series
2005 A, (Depaul University),
5.00%, 10/1/15 1,082
- --------------------------------------------------------------------------------
1,140 Illinois Health Facilities Auth. Rev.,
Series 1992 C, (Evangelical
Hospital), 6.75%, 4/15/12(1) 1,327
- --------------------------------------------------------------------------------
1,100 Illinois Health Facilities Auth. Rev.,
Series 2002 A, (Lake Forest
Hospital), 5.00%, 7/1/05 1,102
- --------------------------------------------------------------------------------
1,000 Illinois Regional Transportation
Auth. Rev., Series 1990 A, 7.20%,
11/1/20 (Ambac) 1,292
- --------------------------------------------------------------------------------
930 Kane County Geneva Community
Unit School District No. 304 GO,
6.20%, 1/1/24 (FSA) 1,110
- --------------------------------------------------------------------------------
1,105 Ogle Lee & De Kalb Counties
Township High School District
No. 212 GO, 6.00%, 12/1/17
(MBIA) 1,267
- --------------------------------------------------------------------------------
1,220 Ogle Lee & De Kalb Counties
Township High School District
No. 212 GO, 6.00%, 12/1/18
(MBIA) 1,397
- --------------------------------------------------------------------------------
1,295 Town of Cicero GO, Series 2005 A,
5.00%, 1/1/14 (XLCA) 1,425
- --------------------------------------------------------------------------------
4,985 Town of Cicero GO, Series 2005 A,
5.00%, 1/1/15 (XLCA)(2) 5,494
- --------------------------------------------------------------------------------
1,250 Town of Cicero GO, Series 2005 A,
5.25%, 1/1/20 (XLCA) 1,377
- --------------------------------------------------------------------------------
See Notes to Financial Statements. (continued)
- ------
15
Tax-Free Bond - Schedule of Investments
MAY 31, 2005
Principal Amount ($ IN THOUSANDS) Value
- --------------------------------------------------------------------------------
$ 1,000 Town of Cicero GO, Series 2005 A,
5.25%, 1/1/21 (XLCA) $ 1,098
- --------------------------------------------------------------------------------
1,000 University of Illinois COP, (Utility
Infrastructure), 5.75%, 8/15/08
(MBIA) 1,082
- --------------------------------------------------------------------------------
2,000 Will County Community
Consolidated School District
No. 30-C Troy Township GO, Series
2005 B, 5.25%, 2/1/21 (FSA) 2,188
- --------------------------------------------------------------------------------
3,350 Will County Community
Consolidated School District
No. 30-C Troy Township GO, Series
2005 B, 5.25%, 2/1/22 (FSA) 3,655
- --------------------------------------------------------------------------------
2,250 Will County Community School
District No. 161 GO, 5.00%,
1/1/24 (FGIC)(3) 2,406
- --------------------------------------------------------------------------------
2,250 Will County Community School
District No. 161 GO, 5.00%,
1/1/25 (FGIC)(3) 2,399
- --------------------------------------------------------------------------------
2,075 Will County School District No. 88
GO, Series 2005 A, 5.25%, 1/1/24
(FSA)(3) 2,275
- --------------------------------------------------------------------------------
45,099
- --------------------------------------------------------------------------------
INDIANA -- 1.3%
- --------------------------------------------------------------------------------
1,900 Indiana Health Facilities Financing
Auth. Hospital Rev., (Holy Cross
Health System Corp.), 5.375%,
12/1/12 (MBIA) 2,029
- --------------------------------------------------------------------------------
780 Indiana Transportation Finance
Auth. Rev., Series 1990 A, 7.25%,
6/1/15 977
- --------------------------------------------------------------------------------
220 Indiana Transportation Finance
Auth. Rev., Series 1990 A, 7.25%,
6/1/15(1) 262
- --------------------------------------------------------------------------------
1,500 Mount Vernon of Hancock County
Multi-School Building Corp. Rev.,
Series 2001 B, (First Mortgage),
5.75%, 7/15/11 (Ambac) 1,710
- --------------------------------------------------------------------------------
1,650 Valparaiso Middle Schools Building
Corp. Rev., (First Mortgage),
5.75%, 7/15/11, Prerefunded at
100% of Par (FGIC)(1) 1,881
- --------------------------------------------------------------------------------
1,000 Zionsville Community Schools
Building Corp. GO, (First
Mortgage), 5.75%, 7/15/15
(FGIC/State Aid Withholding) 1,123
- --------------------------------------------------------------------------------
7,982
- --------------------------------------------------------------------------------
IOWA -- 0.6%
- --------------------------------------------------------------------------------
3,350 Coralville GO, Series 2005 K-2,
5.00%, 6/1/07 3,455
- --------------------------------------------------------------------------------
KANSAS -- 0.4%
- --------------------------------------------------------------------------------
1,280 Wichita Hospital Facilities Rev.,
Series 2001 III, 5.25%, 11/15/13 1,383
- --------------------------------------------------------------------------------
1,195 Wichita Hospital Facilities Rev.,
Series 2001 III, 5.50%, 11/15/16 1,292
- --------------------------------------------------------------------------------
2,675
- --------------------------------------------------------------------------------
Principal Amount ($ IN THOUSANDS) Value
- --------------------------------------------------------------------------------
LOUISIANA -- 0.5%
- --------------------------------------------------------------------------------
$ 1,740 Louisiana Local Government
Environmental Facilities &
Community Development Auth.
Rev., (Ascension Parish Library),
5.25%, 4/1/23 (Ambac) $ 1,912
- --------------------------------------------------------------------------------
1,215 Louisiana Local Government
Environmental Facilities &
Community Development Auth.
Rev., (Ascension Parish Library),
5.25%, 4/1/35 (Ambac) 1,323
- --------------------------------------------------------------------------------
3,235
- --------------------------------------------------------------------------------
MASSACHUSSETTS -- 0.2%
- --------------------------------------------------------------------------------
1,000 Massachusetts Health &
Educational Facilities Auth. Rev.,
Series 1992 F, 6.25%, 7/1/12
(Ambac) 1,114
- --------------------------------------------------------------------------------
MICHIGAN -- 3.4%
- --------------------------------------------------------------------------------
3,500 Detroit GO, Series 2004 A-1,
5.25%, 4/1/23 (Ambac) 3,830
- --------------------------------------------------------------------------------
1,485 Grand Valley State University Rev.,
5.75%, 12/1/15 (FGIC) 1,668
- --------------------------------------------------------------------------------
2,440 Michigan Building Auth. Rev.,
(State Police Communications
System), 2.50%, 10/1/05(1) 2,438
- --------------------------------------------------------------------------------
2,345 Michigan Higher Education
Facilities Auth. Rev., (Limited
Obligation - Hillsdale College),
5.00%, 3/1/26 2,441
- --------------------------------------------------------------------------------
1,000 Michigan Hospital Finance Auth.
Rev., Series 1999 A, (Ascension
Health Credit), 5.25%, 11/15/05
(MBIA) 1,011
- --------------------------------------------------------------------------------
575 Taylor GO, 5.00%, 9/1/11 (MBIA) 632
- --------------------------------------------------------------------------------
1,400 Taylor GO, 5.00%, 9/1/14 (MBIA) 1,561
- --------------------------------------------------------------------------------
2,010 Wayne Charter County Airport
Rev., Series 2002 C, 5.00%,
12/1/11 (FGIC) 2,201
- --------------------------------------------------------------------------------
2,215 Wayne Charter County Airport
Rev., Series 2002 C, 5.375%,
12/1/13 (FGIC) 2,482
- --------------------------------------------------------------------------------
2,335 Wayne Charter County Airport
Rev., Series 2002 C, 5.375%,
12/1/14 (FGIC) 2,605
- --------------------------------------------------------------------------------
20,869
- --------------------------------------------------------------------------------
MINNESOTA -- 0.1%
- --------------------------------------------------------------------------------
800 City of Chaska Rev., Series 2005 A,
(Generating Facilities), 5.00%,
10/1/30 837
- --------------------------------------------------------------------------------
MISSOURI -- 1.9%
- --------------------------------------------------------------------------------
1,200 Camdenton Reorganized School
District No. R-III GO, 5.25%,
3/1/22 (FSA) 1,332
- --------------------------------------------------------------------------------
400 City of Riverside Tax Allocation
Rev., (L-385 Levee), 3.25%, 5/1/06 398
- --------------------------------------------------------------------------------
See Notes to Financial Statements. (continued)
- ------
16
Tax-Free Bond - Schedule of Investments
MAY 31, 2005
Principal Amount ($ IN THOUSANDS) Value
- --------------------------------------------------------------------------------
$ 855 City of Riverside Tax Allocation
Rev., (L-385 Levee), 4.00%, 5/1/09 $ 860
- --------------------------------------------------------------------------------
880 City of Riverside Tax Allocation
Rev., (L-385 Levee), 4.00%, 5/1/10 883
- --------------------------------------------------------------------------------
500 Des Peres GO, 5.25%, 2/1/19
(Ambac) 558
- --------------------------------------------------------------------------------
1,145 Jackson County Public Building
Corp. COP, Series 2000 A, 6.00%,
11/1/18 1,240
- --------------------------------------------------------------------------------
2,775 Missouri Development Finance
Board COP, Series 2000 A,
(Midtown Redevelopment), 5.75%,
4/1/22 (MBIA) 3,063
- --------------------------------------------------------------------------------
2,875 Missouri Health & Educational
Facilities Auth. Rev., Series 1998 A,
(Park Lane Medical Center),
5.60%, 1/1/15 (MBIA) 3,192
- --------------------------------------------------------------------------------
11,526
- --------------------------------------------------------------------------------
NEVADA -- 1.3%
- --------------------------------------------------------------------------------
1,000 Clark County School District GO,
Series 1997 B, (Building &
Renovation), 5.25%, 6/15/07,
Prerefunded at 101% of Par
(FGIC)(1) 1,056
- --------------------------------------------------------------------------------
3,295 Las Vegas Redevelopment Agency
Tax Increment Rev., Series 2003 A,
(Fremont Street), 4.50%, 6/15/10 3,389
- --------------------------------------------------------------------------------
1,550 Reno Sales and Room Tax Rev.,
(ReTrac-Reno Transportation Rail
Access Corridor), (Senior Lien),
5.50%, 6/1/19 (Ambac) 1,733
- --------------------------------------------------------------------------------
1,865 Reno Sales and Room Tax Rev.,
(ReTrac-Reno Transportation Rail
Access Corridor), (Senior Lien),
5.50%, 6/1/20 (Ambac) 2,063
- --------------------------------------------------------------------------------
8,241
- --------------------------------------------------------------------------------
NEW HAMPSHIRE -- 1.4%
- --------------------------------------------------------------------------------
540 New Hampshire Health & Education
Facilities Auth. Rev., Series 2004 A,
(Kendal at Hanover), 2.50%,
10/1/05 539
- --------------------------------------------------------------------------------
675 New Hampshire Health & Education
Facilities Auth. Rev., Series 2004 A,
(Kendal at Hanover), 3.00%,
10/1/06 670
- --------------------------------------------------------------------------------
765 New Hampshire Health & Education
Facilities Auth. Rev., Series 2004 A,
(Kendal at Hanover), 3.25%,
10/1/07 760
- --------------------------------------------------------------------------------
1,660 New Hampshire Health & Education
Facilities Auth. Rev., Series 2004 A,
(Kendal at Hanover), 5.00%,
10/1/11 1,747
- --------------------------------------------------------------------------------
680 New Hampshire Health & Education
Facilities Auth. Rev., Series 2004 A,
(Kendal at Hanover), 5.00%,
10/1/12 717
- --------------------------------------------------------------------------------
Principal Amount ($ IN THOUSANDS) Value
- --------------------------------------------------------------------------------
$ 1,030 New Hampshire Health & Education
Facilities Auth. Rev., Series 2004 A,
(Kendal at Hanover), 5.00%,
10/1/13 $ 1,081
- --------------------------------------------------------------------------------
3,000 New Hampshire Health & Education
Facilities Auth. Rev., Series 2004 A,
(Kendal at Hanover), 5.00%,
10/1/18 3,085
- --------------------------------------------------------------------------------
8,599
- --------------------------------------------------------------------------------
NEW JERSEY -- 1.7%
- --------------------------------------------------------------------------------
4,235 New Jersey Transit Corporation
COP, 5.00%, 10/1/12 (FSA)(2) 4,655
- --------------------------------------------------------------------------------
5,595 New Jersey Transit Corporation
COP, 5.00%, 10/1/13 (FSA)(2) 6,168
- --------------------------------------------------------------------------------
10,823
- --------------------------------------------------------------------------------
NEW MEXICO -- 1.1%
- --------------------------------------------------------------------------------
5,090 Los Alamos County Utilities System
Rev., Series 2004 A, 4.00%,
7/1/07 (FSA)(2) 5,201
- --------------------------------------------------------------------------------
1,415 San Juan County Gross Receipts
Tax Rev., Series 2001 A, 5.75%,
9/15/21 (Ambac) 1,598
- --------------------------------------------------------------------------------
6,799
- --------------------------------------------------------------------------------
NEW YORK -- 3.0%
- --------------------------------------------------------------------------------
2,975 City of New York GO, Series
2002 B, 5.25%, 8/1/09 (CIFG) 3,232
- --------------------------------------------------------------------------------
2,885 City of New York GO, Series
2002 C, 5.25%, 8/1/09 (CIFG) 3,135
- --------------------------------------------------------------------------------
5,000 City of New York GO, Series
2003 I, 5.75%, 3/1/20(2) 5,599
- --------------------------------------------------------------------------------
1,000 New York Dormitory Auth. COP,
Series 1995 A, (State University
Educational Facilities), 6.50%,
5/15/06 1,033
- --------------------------------------------------------------------------------
1,100 New York Dormitory Auth. COP,
Series 2002 A, (United Cerebral
Palsy Affiliate No. 1), 5.75%,
7/1/18 (Ambac) 1,261
- --------------------------------------------------------------------------------
1,440 New York Dormitory Auth. Rev.,
Series 1990 A, (UNIC Educational
Facilities), 7.50%, 5/15/13
(MBIA-IBC) 1,841
- --------------------------------------------------------------------------------
1,160 New York Thruway Auth. Service
Contract COP, 5.50%, 4/1/06 1,184
- --------------------------------------------------------------------------------
1,000 Niagara Falls Bridge Commission
Toll Rev., Series 1993 B, 5.25%,
10/1/15 (FGIC) 1,120
- --------------------------------------------------------------------------------
18,405
- --------------------------------------------------------------------------------
NORTH CAROLINA -- 2.5%
- --------------------------------------------------------------------------------
1,300 Charlotte Airport Rev., Series
2004 A, 5.25%, 7/1/24 (MBIA) 1,420
- --------------------------------------------------------------------------------
1,020 City of Raleigh Rev., 5.00%, 3/1/13 1,134
- --------------------------------------------------------------------------------
1,000 City of Raleigh Rev., 5.00%, 3/1/14 1,117
- --------------------------------------------------------------------------------
1,500 City of Raleigh Rev., 5.00%, 3/1/15 1,679
- --------------------------------------------------------------------------------
See Notes to Financial Statements. (continued)
- ------
17
Tax-Free Bond - Schedule of Investments
MAY 31, 2005
Principal Amount ($ IN THOUSANDS) Value
- --------------------------------------------------------------------------------
$ 2,000 North Carolina Eastern Municipal
Power Agency System Rev., Series
1993 B, 6.00%, 1/1/06 (FSA) $ 2,036
- --------------------------------------------------------------------------------
2,500 North Carolina Medical Care
Commission Rev., Series 2004 A,
(Health Care Housing - ARC
Projects), 5.50%, 10/1/24 2,538
- --------------------------------------------------------------------------------
1,000 North Carolina Municipal Power
Agency No. 1 Catawba Electric
Rev., 6.00%, 1/1/10 (MBIA) 1,120
- --------------------------------------------------------------------------------
2,000 North Carolina Municipal Power
Agency No. 1 Catawba Electric
Rev., Series 2003 A, 5.50%, 1/1/13 2,234
- --------------------------------------------------------------------------------
1,100 University of North Carolina at
Chapel Hill Rev., Series 2005 A,
5.00%, 2/1/08 1,150
- --------------------------------------------------------------------------------
1,000 University of North Carolina at
Chapel Hill Rev., Series 2005 A,
5.00%, 2/1/09 1,058
- --------------------------------------------------------------------------------
15,486
- --------------------------------------------------------------------------------
NORTH DAKOTA -- 0.3%
- --------------------------------------------------------------------------------
1,500 Grand Forks Health Care System
Rev., (Altru Health System
Obligation Group), 7.125%,
8/15/24 1,671
- --------------------------------------------------------------------------------
OHIO -- 1.9%
- --------------------------------------------------------------------------------
500 Erie County Hospital Facilities Rev.,
Series 2002 A, (Firelands Regional
Medical Center), 4.50%, 8/15/07 513
- --------------------------------------------------------------------------------
1,150 Mad River Local School District GO,
(Classroom Facilities), 5.75%,
12/1/19 (FGIC) 1,313
- --------------------------------------------------------------------------------
1,700 Milford Exempt Village School
District GO, (School Improvement),
6.00%, 12/1/18 (FSA) 1,953
- --------------------------------------------------------------------------------
750 Ohio Higher Educational Facility
Commission Rev., Series 1990 B,
(Case Western Reserve University),
6.50%, 10/1/20 942
- --------------------------------------------------------------------------------
3,320 Ohio Water Development Auth.
Pollution Control Facilities Rev.,
6.00%, 6/1/05, Prerefunded at
101% of Par (MBIA)(1) 3,354
- --------------------------------------------------------------------------------
1,505 Summit County GO, 5.75%,
12/1/12, Prerefunded at 101% of
Par (FGIC)(1) 1,753
- --------------------------------------------------------------------------------
1,550 Tri Valley Local School District GO,
5.75%, 12/1/21 (FGIC) 1,743
- --------------------------------------------------------------------------------
11,571
- --------------------------------------------------------------------------------
OKLAHOMA -- 0.8%
- --------------------------------------------------------------------------------
1,000 Comanche County Hospital Auth.
Rev., 5.00%, 7/1/11 (RADIAN) 1,072
- --------------------------------------------------------------------------------
1,525 Comanche County Hospital Auth.
Rev., 5.00%, 7/1/12 (RADIAN) 1,639
- --------------------------------------------------------------------------------
1,730 Durant Community Facilities Auth.
GO, 5.75%, 11/1/24 (XLCA) 1,991
- --------------------------------------------------------------------------------
4,702
- --------------------------------------------------------------------------------
Principal Amount ($ IN THOUSANDS) Value
- --------------------------------------------------------------------------------
OREGON -- 5.9%
- --------------------------------------------------------------------------------
$ 1,000 Clackamas County School District
No. 86 GO, (Canby), 5.00%,
6/15/24 (FSA) $ 1,082
- --------------------------------------------------------------------------------
1,475 Clackamas County School District
No. 108 GO, (Estacada), 5.25%,
6/15/19 (FSA) 1,693
- --------------------------------------------------------------------------------
2,135 Clackamas County School District
No. 108 GO, (Estacada), 5.50%,
6/15/23 (FSA) 2,536
- --------------------------------------------------------------------------------
1,200 Clackamas County School District
No. 108 GO, (Estacada), 5.50%,
6/15/24 (FSA) 1,430
- --------------------------------------------------------------------------------
1,805 Lane County School District No. 19
Springfield GO, 6.375%, 10/15/05
(MBIA) 1,829
- --------------------------------------------------------------------------------
1,000 Linn County Community School
District No. 9 Lebanon GO, 5.50%,
6/15/30 (FGIC) 1,199
- --------------------------------------------------------------------------------
400 Oregon State Facilities Auth. Rev.,
Series 2005 A, (Linfield College),
5.00%, 10/1/13 429
- --------------------------------------------------------------------------------
925 Oregon State Facilities Auth. Rev.,
Series 2005 A, (Linfield College),
5.00%, 10/1/14 992
- --------------------------------------------------------------------------------
2,000 Oregon State Facilities Auth. Rev.,
Series 2005 A, (Linfield College),
5.00%, 10/1/20 2,098
- --------------------------------------------------------------------------------
1,250 Oregon State Facilities Auth. Rev.,
Series 2005 A, (Linfield College),
5.00%, 10/1/25 1,289
- --------------------------------------------------------------------------------
22,050 State of Oregon Tax Anticipation
Notes, Series 2004 A, 3.00%,
6/30/05 22,052
- --------------------------------------------------------------------------------
36,629
- --------------------------------------------------------------------------------
PENNSYLVANIA -- 3.2%
- --------------------------------------------------------------------------------
2,000 Ephrata Area School District GO,
5.00%, 3/1/21 (FGIC) 2,163
- --------------------------------------------------------------------------------
1,000 Ephrata Area School District GO,
5.00%, 3/1/22 (FGIC) 1,078
- --------------------------------------------------------------------------------
1,675 Hatboro-Horsham School District
GO, 4.50%, 9/15/13 (FSA) 1,792
- --------------------------------------------------------------------------------
1,750 Hatboro-Horsham School District
GO, 4.50%, 9/15/14 (FSA) 1,874
- --------------------------------------------------------------------------------
1,000 Oxford Area School District GO,
Series 2001 A, 5.50%, 2/15/17
(FGIC/State Aid Withholding) 1,116
- --------------------------------------------------------------------------------
2,975 Philadelphia School District GO,
Series 2002 A, 5.25%, 2/1/11
(FSA/State Aid Withholding) 3,280
- --------------------------------------------------------------------------------
1,500 Pittsburgh School District GO,
5.25%, 9/1/09 (FSA) 1,627
- --------------------------------------------------------------------------------
3,240 Upper Darby School District GO,
4.00%, 5/1/14 (FGIC)(3) 3,356
- --------------------------------------------------------------------------------
3,375 Upper Darby School District GO,
4.00%, 5/1/15 (FGIC)(3) 3,480
- --------------------------------------------------------------------------------
19,766
- --------------------------------------------------------------------------------
See Notes to Financial Statements. (continued)
- ------
18
Tax-Free Bond - Schedule of Investments
MAY 31, 2005
Principal Amount ($ IN THOUSANDS) Value
- --------------------------------------------------------------------------------
PUERTO RICO -- 5.3%
- --------------------------------------------------------------------------------
$20,000 Commonwealth of Puerto Rico Tax
& Rev. Anticipation Notes, 3.00%,
7/29/05 $ 19,994
- --------------------------------------------------------------------------------
10,000 Government Development Bank
Puerto Rico, 3.35%, 6/7/05
(Acquired 5/31/05, Cost $10,000)(5) 10,000
- --------------------------------------------------------------------------------
2,500 Puerto Rico Highway &
Transportation Auth. Rev., 5.00%,
7/1/08 (CIFG) 2,658
- --------------------------------------------------------------------------------
32,652
- --------------------------------------------------------------------------------
RHODE ISLAND -- 0.8%
- --------------------------------------------------------------------------------
1,000 Cranston GO, 6.375%, 11/15/17
(FGIC) 1,147
- --------------------------------------------------------------------------------
2,000 Rhode Island Depositors Economic
Protection Corp. Special Obligation
Rev., Series 1993 A, 6.25%,
8/1/16 (MBIA)(1) 2,479
- --------------------------------------------------------------------------------
1,300 Rhode Island Depositors Economic
Protection Corp. Special Obligation
Rev., Series 1993 B, 6.00%,
8/1/17 (MBIA)(1) 1,428
- --------------------------------------------------------------------------------
5,054
- --------------------------------------------------------------------------------
SOUTH CAROLINA -- 3.9%
- --------------------------------------------------------------------------------
1,700 Florence Water & Sewer Rev.,
7.50%, 3/1/18 (Ambac) 2,028
- --------------------------------------------------------------------------------
1,170 Greenwood County Hospital
Facilities Rev., Series 2004 A,
(Self Regional Healthcare), 4.00%,
10/1/10 (FSA) 1,215
- --------------------------------------------------------------------------------
1,000 Greenwood County Hospital
Facilities Rev., Series 2004 A,
(Self Regional Healthcare), 4.00%,
10/1/11 (FSA) 1,041
- --------------------------------------------------------------------------------
2,300 Lancaster Educational Assistance
Program Inc. Rev., (School District
Lancaster County), 5.00%, 12/1/26 2,361
- --------------------------------------------------------------------------------
3,500 Laurens County School District
No. 55 Rev., 5.25%, 12/1/30(3) 3,636
- --------------------------------------------------------------------------------
625 Piedmont Municipal Power Agency
Rev., 6.75%, 1/1/19 (FGIC)(1) 817
- --------------------------------------------------------------------------------
875 Piedmont Municipal Power Agency
Rev., 6.75%, 1/1/19 (FGIC) 1,119
- --------------------------------------------------------------------------------
375 Piedmont Municipal Power Agency
Rev., Series 1991 A, 6.50%,
1/1/16 (FGIC) 459
- --------------------------------------------------------------------------------
625 Piedmont Municipal Power Agency
Rev., Series 1991 A, 6.50%,
1/1/16 (FGIC)(1) 782
- --------------------------------------------------------------------------------
3,115 Piedmont Municipal Power Agency
Rev., Series 2002 A, 4.00%,
1/1/07 (FGIC) 3,117
- --------------------------------------------------------------------------------
3,035 South Carolina Jobs Economic
Development Auth. Hospital
Facilities Rev., Series 2003 C,
(Palmetto Health), 5.00%, 8/1/08
(ACA)(2) 3,169
- --------------------------------------------------------------------------------
Principal Amount ($ IN THOUSANDS) Value
- --------------------------------------------------------------------------------
$ 3,195 South Carolina Jobs Economic
Development Auth. Hospital
Facilities Rev., Series 2003 C,
(Palmetto Health), 5.50%, 8/1/09
(ACA)(2) $ 3,423
- --------------------------------------------------------------------------------
1,095 Spartanburg County Health
Services District Inc. Hospital Rev.,
5.50%, 4/15/16 (FSA) 1,209
- --------------------------------------------------------------------------------
24,376
- --------------------------------------------------------------------------------
SOUTH DAKOTA -- 0.2%
- --------------------------------------------------------------------------------
1,025 Aberdeen School District No. 6-1
GO, 4.30%, 1/1/21 (FSA) 1,037
- --------------------------------------------------------------------------------
TENNESSEE -- 1.0%
- --------------------------------------------------------------------------------
3,000 Chattanooga Health Educational &
Housing Facility Board Rev., Series
2005 A, (Campus Development
Foundation, Inc. Phase I LLC),
5.00%, 10/1/15 3,124
- --------------------------------------------------------------------------------
1,050 Clarksville Water Sewer & Gas
Rev., 4.25%, 2/1/07 (FSA) 1,074
- --------------------------------------------------------------------------------
1,685 Clarksville Water Sewer & Gas
Rev., 4.85%, 2/1/15 (FSA) 1,792
- --------------------------------------------------------------------------------
5,990
- --------------------------------------------------------------------------------
TEXAS -- 10.5%
- --------------------------------------------------------------------------------
2,035 Cash Special Utility District Rev.,
5.25%, 9/1/24 (MBIA) 2,231
- --------------------------------------------------------------------------------
1,000 City of Tyler Rev., 5.25%, 9/1/24
(MBIA) 1,100
- --------------------------------------------------------------------------------
1,815 Clint Independent School District
GO, 6.00%, 2/15/17 (PSF) 2,058
- --------------------------------------------------------------------------------
2,635 Collin County GO, 5.00%, 2/15/24 2,825
- --------------------------------------------------------------------------------
1,000 Corpus Christi Utility System Rev.,
5.50%, 7/15/07 (FSA) 1,053
- --------------------------------------------------------------------------------
1,000 Dallas-Fort Worth Regional Airport
Rev., Series 1994 A, 5.90%,
11/1/08 (MBIA) 1,002
- --------------------------------------------------------------------------------
770 Denison Hospital Auth. Rev.,
(Texoma Medical Center), 5.90%,
8/15/07 (ACA) 810
- --------------------------------------------------------------------------------
1,000 Denton Utility System Rev., Series
1996 A, 5.95%, 12/1/06,
Prerefunded at 100% of Par
(MBIA)(1) 1,045
- --------------------------------------------------------------------------------
2,000 Donna Independent School District
GO, 5.00%, 2/15/15 (PSF-GTD) 2,210
- --------------------------------------------------------------------------------
1,115 Edcouch-Elsa Independent School
District GO, 5.00%, 2/15/14
(PSF-GTD) 1,231
- --------------------------------------------------------------------------------
2,025 Flower Mound GO, 5.00%, 3/1/14
(Ambac) 2,243
- --------------------------------------------------------------------------------
1,560 Flower Mound GO, Series 2005 A,
5.00%, 3/1/23 (Ambac) 1,678
- --------------------------------------------------------------------------------
945 Flower Mound Rev., 4.00%, 3/1/18
(Ambac) 947
- --------------------------------------------------------------------------------
1,240 Harris County Housing Finance
Corporation Rev., (Las Americas
Apartments), 4.90%, 3/1/11
(FNMA) 1,293
- --------------------------------------------------------------------------------
See Notes to Financial Statements. (continued)
- ------
19
Tax-Free Bond - Schedule of Investments
MAY 31, 2005
Principal Amount ($ IN THOUSANDS) Value
- --------------------------------------------------------------------------------
$ 3,000 Hays Consolidated Independent
School District GO, 5.20%, 8/15/11
(PSF-GTD)(1)(4) $ 2,400
- --------------------------------------------------------------------------------
1,295 Hidalgo County GO, 5.50%,
8/15/19 (FGIC) 1,447
- --------------------------------------------------------------------------------
1,750 Hidalgo County GO, 5.50%,
8/15/21 (FGIC) 1,930
- --------------------------------------------------------------------------------
574 Houston Participation Interest COP,
6.40%, 6/1/27 625
- --------------------------------------------------------------------------------
500 Houston Water & Sewer System
Rev., Series 1992 C, (Junior Lien),
5.90%, 12/1/05 (MBIA) 508
- --------------------------------------------------------------------------------
1,500 Houston Water & Sewer System
Rev., Series 1997 C, (Junior Lien),
5.375%, 12/1/07 (FGIC) 1,602
- --------------------------------------------------------------------------------
1,630 Live Oak GO, 5.25%, 8/1/22 (MBIA) 1,790
- --------------------------------------------------------------------------------
1,000 Lubbock Health Facilities
Development Corp. Rev., (Lutheran
Retirement), 6.00%, 3/20/29
(GNMA) 1,105
- --------------------------------------------------------------------------------
1,590 Mabank Independent School
District GO, 5.25%, 8/15/21
(PSF-GTD) 1,716
- --------------------------------------------------------------------------------
1,335 Mabank Independent School
District GO, 5.25%, 8/15/25
(PSF-GTD) 1,432
- --------------------------------------------------------------------------------
1,740 Montgomery County GO, 5.50%,
3/1/24 (Ambac) 1,944
- --------------------------------------------------------------------------------
550 Pasadena Independent School
District GO, Series 2001 A, 6.05%,
2/15/16 (PSF) 658
- --------------------------------------------------------------------------------
1,500 Pearland Independent School
District GO, 6.00%, 2/15/09 (PSF) 1,657
- --------------------------------------------------------------------------------
2,000 San Antonio Electric and Gas Rev.,
7.10%, 2/1/09 (FGIC)(1)(4) 1,777
- --------------------------------------------------------------------------------
1,715 San Benito Consolidated
Independent School District GO,
5.00%, 2/15/24 (PSF-GTD) 1,833
- --------------------------------------------------------------------------------
1,800 San Benito Consolidated
Independent School District GO,
5.00%, 2/15/25 (PSF-GTD) 1,917
- --------------------------------------------------------------------------------
1,915 San Felipe-Del Rio Consolidated
Independent School District GO,
5.00%, 2/15/23 2,039
- --------------------------------------------------------------------------------
2,025 San Felipe-Del Rio Consolidated
Independent School District GO,
5.00%, 2/15/24 2,152
- --------------------------------------------------------------------------------
1,505 Seguin Independent School District
GO, 5.25%, 4/1/23 (PSF-GTD)(3) 1,653
- --------------------------------------------------------------------------------
2,120 Southside Independent School
District GO, Series 2004 A, 5.25%,
8/15/25 (PSF) 2,308
- --------------------------------------------------------------------------------
2,345 Texas Municipal Power Agency
COP, (Sub-Lien), 4.00%, 9/1/09
(FGIC) 2,390
- --------------------------------------------------------------------------------
1,500 Texas Public Finance Auth.
Building Rev., (Technical College),
6.25%, 8/1/09 (MBIA) 1,607
- --------------------------------------------------------------------------------
Principal Amount ($ IN THOUSANDS) Value
- --------------------------------------------------------------------------------
$ 1,000 Texas Technical University Rev.,
5.00%, 8/15/08 (MBIA) $ 1,062
- --------------------------------------------------------------------------------
1,000 Travis County Health Facilities
Development Corp. Rev., Series
1999 A, (Ascension Health Credit),
5.875%, 11/15/09, Prerefunded at
101% of Par (Ambac)(1) 1,123
- --------------------------------------------------------------------------------
1,000 Tyler Health Facilities Development
Corp. Rev., (Mother Frances
Hospital), 4.50%, 7/1/06 1,014
- --------------------------------------------------------------------------------
2,000 Tyler Health Facilities Development
Corp. Rev., (Mother Frances
Hospital), 5.00%, 7/1/08 2,094
- --------------------------------------------------------------------------------
1,265 West Oso Independent School
District GO, 5.50%, 8/15/26 (PSF) 1,400
- --------------------------------------------------------------------------------
64,909
- --------------------------------------------------------------------------------
U.S. VIRGIN ISLANDS -- 0.3%
- --------------------------------------------------------------------------------
2,000 Virgin Islands Public Finance Auth.
Rev., Series 1998 A, (Senior Lien),
5.20%, 10/1/09 2,123
- --------------------------------------------------------------------------------
UTAH -- 1.9%
- --------------------------------------------------------------------------------
1,000 Salt Lake City Hospital Rev., Series
1988 A, (Intermountain Health
Corporation), 8.125%, 5/15/15(1) 1,253
- --------------------------------------------------------------------------------
1,000 Utah County Municipal Building
Auth. Lease COP, 4.00%, 11/1/05
(Ambac) 1,005
- --------------------------------------------------------------------------------
1,495 Utah County Municipal Building
Auth. Lease COP, 5.00%, 11/1/09
(Ambac) 1,608
- --------------------------------------------------------------------------------
1,820 Utah County Municipal Building
Auth. Lease COP, 5.25%, 11/1/13
(Ambac) 2,016
- --------------------------------------------------------------------------------
1,915 Utah County Municipal Building
Auth. Lease COP, 5.25%, 11/1/14
(Ambac) 2,120
- --------------------------------------------------------------------------------
1,000 Utah County Municipal Building
Auth. Lease COP, 5.50%, 11/1/16
(Ambac) 1,114
- --------------------------------------------------------------------------------
1,130 West Valley City Municipal Building
Auth. COP, Series 2002 A, 5.00%,
8/1/10 (Ambac) 1,227
- --------------------------------------------------------------------------------
1,305 West Valley City Utility Sales Tax
Rev., Series 2001 A, 5.50%,
7/15/16 (MBIA) 1,450
- --------------------------------------------------------------------------------
11,793
- --------------------------------------------------------------------------------
VIRGINIA -- 0.6%
- --------------------------------------------------------------------------------
1,500 Fairfax County COP, 5.30%,
4/15/23 1,634
- --------------------------------------------------------------------------------
1,000 Hampton Industrial Development
Auth. Rev., Series 1994 A, (Sentara
General Hospital), 6.50%, 11/1/06,
Prerefunded at 100% of Par(1) 1,050
- --------------------------------------------------------------------------------
1,115 Pittsylvania County GO, Series
2001 B, 5.75%, 3/1/18 (MBIA) 1,273
- --------------------------------------------------------------------------------
3,957
- --------------------------------------------------------------------------------
See Notes to Financial Statements. (continued)
- ------
20
Tax-Free Bond - Schedule of Investments
MAY 31, 2005
Principal Amount ($ IN THOUSANDS) Value
- --------------------------------------------------------------------------------
WASHINGTON -- 6.3%
- --------------------------------------------------------------------------------
$ 1,000 Benton County Public Utility
District No. 1 Rev., Series 2001 A,
5.625%, 11/1/19 (FSA) $ 1,119
- --------------------------------------------------------------------------------
1,000 Cowlitz County Kelso School
District No. 458 GO, 5.75%,
12/1/18 (FSA) 1,132
- --------------------------------------------------------------------------------
500 Energy Northwest Rev., 5.00%,
7/1/10 (MBIA) 542
- --------------------------------------------------------------------------------
1,000 Energy Northwest Rev., 5.00%,
7/1/11 (MBIA) 1,093
- --------------------------------------------------------------------------------
1,750 Energy Northwest Rev., 4.75%,
7/1/20 (MBIA) 1,829
- --------------------------------------------------------------------------------
3,500 Energy Northwest Rev., Series
2002 A, (Columbia Generating),
5.75%, 7/1/18 (MBIA)(2) 3,959
- --------------------------------------------------------------------------------
9,000 Energy Northwest Rev., Series
2002 B, (Columbia Generating),
6.00%, 7/1/18 (Ambac)(2) 10,348
- --------------------------------------------------------------------------------
2,000 King County GO, Series 1997 D,
5.75%, 12/1/07 2,172
- --------------------------------------------------------------------------------
1,555 King County Lake Washington
School District No. 414 GO, 5.75%,
12/1/15 1,778
- --------------------------------------------------------------------------------
1,260 Mason County Shelton School
District No. 309 GO, 5.625%,
12/1/17 (FGIC) 1,414
- --------------------------------------------------------------------------------
1,120 Metropolitan Park District of
Tacoma GO, 6.00%, 12/1/16
(Ambac) 1,286
- --------------------------------------------------------------------------------
1,000 Metropolitan Park District of
Tacoma GO, 6.00%, 12/1/18
(Ambac) 1,147
- --------------------------------------------------------------------------------
305 Tacoma Electrical Systems Rev.,
6.10%, 1/1/07 (FGIC) 309
- --------------------------------------------------------------------------------
1,720 University of Washington Rev.,
(Student Facilities Fee), 5.875%,
6/1/18 (FSA) 1,932
- --------------------------------------------------------------------------------
1,000 Washington GO, Series 1990 A,
6.75%, 2/1/15 1,216
- --------------------------------------------------------------------------------
1,000 Washington Public Power Supply
System Rev., Series 1996 A,
(Nuclear Project No. 1), 5.75%,
7/1/12 (MBIA) 1,049
- --------------------------------------------------------------------------------
4,570 Washington Public Power Supply
System Rev., Series 1998 A,
(Nuclear Project No. 2), 5.00%,
7/1/12 (FSA)(2) 4,897
- --------------------------------------------------------------------------------
1,500 Whitman County Pullman School
District No. 267 GO, 5.625%,
12/1/16 (FSA) 1,691
- --------------------------------------------------------------------------------
38,913
- --------------------------------------------------------------------------------
WISCONSIN -- 1.7%
- --------------------------------------------------------------------------------
1,320 Sheboygan Area School District
GO, 5.00%, 3/1/25 (FSA) 1,411
- --------------------------------------------------------------------------------
Principal Amount ($ IN THOUSANDS) Value
- --------------------------------------------------------------------------------
$ 1,180 Winneconne Community School
District GO, 6.75%, 4/1/06,
Prerefunded at 100% of Par
(FGIC)(1) $ 1,218
- --------------------------------------------------------------------------------
1,990 Wisconsin Clean Water Rev.,
6.875%, 6/1/11 2,320
- --------------------------------------------------------------------------------
2,590 Wisconsin Health & Educational
Facilities Auth. Rev., (Aurora
Medical Group), 6.00%, 11/15/10
(FSA) 2,931
- --------------------------------------------------------------------------------
500 Wisconsin Health & Educational
Facilities Auth. Rev., (Blood Center
Southeastern), 5.50%, 6/1/24 531
- --------------------------------------------------------------------------------
750 Wisconsin Health & Educational
Facilities Auth. Rev., (Blood Center
Southeastern), 5.75%, 6/1/34 805
- --------------------------------------------------------------------------------
1,225 Wisconsin Health & Educational
Facilities Auth. Rev., (Wheaton
Franciscan Services), 4.00%,
8/15/06 1,238
- --------------------------------------------------------------------------------
10,454
- --------------------------------------------------------------------------------
TOTAL MUNICIPAL SECURITIES
(Cost $602,489) 626,768
- --------------------------------------------------------------------------------
SHORT-TERM MUNICIPAL SECURITIES -- 2.2%
ALABAMA -- 1.5%
- --------------------------------------------------------------------------------
9,500 Birmingham Baptist Medical
Centers Special Care Facilities
Financing Auth. Rev., Series
2000 C, (Baptist Health System),
VRDN, 4.35%, 7/1/05 9,500
- --------------------------------------------------------------------------------
ARIZONA -- 0.5%
- --------------------------------------------------------------------------------
2,200 Pima County Industrial
Development Auth. Rev., (Tucson
Electric), VRDN, 2.98%, 6/1/05
(LOC: Bank of New York) 2,200
- --------------------------------------------------------------------------------
1,115 Pima County Industrial
Development Auth. Rev., VRDN,
3.08%, 6/2/05 (SBBPA: Societe
Generale) 1,115
- --------------------------------------------------------------------------------
3,315
- --------------------------------------------------------------------------------
NORTH CAROLINA -- 0.2%
- --------------------------------------------------------------------------------
1,025 North Carolina Medical Care
Commission Rev., (Carol Woods),
VRDN, 2.95%, 6/1/05 (RADIAN) 1,025
- --------------------------------------------------------------------------------
TOTAL SHORT-TERM MUNICIPAL SECURITIES
(Cost $13,840) 13,840
- --------------------------------------------------------------------------------
TOTAL INVESTMENT SECURITIES -- 103.5%
(Cost $616,329) 640,608
- --------------------------------------------------------------------------------
OTHER ASSETS AND LIABILITIES -- (3.5)% (21,392)
- --------------------------------------------------------------------------------
TOTAL NET ASSETS -- 100.0% $619,216
================================================================================
See Notes to Financial Statements. (continued)
- ------
21
Tax-Free Bond - Schedule of Investments
MAY 31, 2005
FUTURES CONTRACTS*
($ IN THOUSANDS)
Expiration Underlying Face
Contracts Sold Date Amount at Value Unrealized Loss
- --------------------------------------------------------------------------------
525 U.S. Treasury
10-Year Notes September 2005 $59,464 $(271)
====================================
*FUTURES CONTRACTS typically are based on an index or specific securities and
tend to track the performance of the index or specific securities while
remaining very liquid (easy to buy and sell). By selling futures, the fund
hedges its investments against price fluctuations.
NOTES TO SCHEDULE OF INVESTMENTS
ACA = American Capital Access
Ambac = Ambac Assurance Corporation
CIFG = CDC IXIS Financial Guaranty North America
COP = Certificates of Participation
FGIC = Financial Guaranty Insurance Co.
FNMA = Federal National Mortgage Association
FSA = Financial Security Assurance, Inc.
GNMA = Government National Mortgage Association
GO = General Obligation
LOC = Letter of Credit
MBIA = MBIA Insurance Corporation
MBIA-IBC = MBIA Insured Bond Certificates
PSF = Permanent School Fund
PSF-GTD = Permanent School Fund - Guaranteed
RADIAN = Radian Asset Assurance, Inc.
SBBPA = Standby Bond Purchase Agreement
VRDN = Variable Rate Demand Note. Interest reset date is indicated. Rate shown
is effective May 31, 2005.
XLCA = XL Capital Ltd.
(1) Escrowed to maturity in U.S. government securities or state and local
government securities.
(2) Security, or a portion thereof, has been segregated for a when-issued
security and/or futures contracts.
(3) When-issued security.
(4) Security is a zero-coupon municipal bond. The rate indicated is the yield
to maturity at purchase. Zero-coupon securities are issued at a substantial
discount from their value at maturity.
(5) Security was purchased under Rule 144A of the Securities Act of 1933 or is
a private placement and, unless registered under the Act or exempted from
registration, may only be sold to qualified institutional investors. The
aggregate value of restricted securities at May 31, 2005, was $10,000 (in
thousands), which represented 1.6% of net assets.
See Notes to Financial Statements.
- ------
22
Shareholder Fee Examples (Unaudited)
Fund shareholders may incur two types of costs: (1) transaction costs, including
sales charges (loads) on purchase payments and redemption/exchange fees; and (2)
ongoing costs, including management fees; distribution and service (12b-1) fees;
and other fund expenses. This example is intended to help you understand your
ongoing costs (in dollars) of investing in your fund and to compare these costs
with the ongoing cost of investing in other mutual funds.
The example is based on an investment of $1,000 made at the beginning of the
period and held for the entire period from December 1, 2004 to May 31, 2005.
ACTUAL EXPENSES
The table provides information about actual account values and actual expenses
for each class. You may use the information, together with the amount you
invested, to estimate the expenses that you paid over the period. First,
identify the share class you own. Then simply divide your account value by
$1,000 (for example, an $8,600 account value divided by $1,000 = 8.6), then
multiply the result by the number under the heading "Expenses Paid During
Period" to estimate the expenses you paid on your account during this period.
If you hold Investor Class shares of any American Century fund, or Institutional
Class shares of the American Century Diversified Bond Fund, in an American
Century account (i.e., not a financial intermediary or retirement plan account),
American Century may charge you a $12.50 semiannual account maintenance fee if
the value of those shares is less than $10,000. We will redeem shares
automatically in one of your accounts to pay the $12.50 fee. In determining your
total eligible investment amount, we will include your investments in all
PERSONAL ACCOUNTS (including American Century Brokerage accounts) registered
under your Social Security number. PERSONAL ACCOUNTS include individual
accounts, joint accounts, UGMA/UTMA accounts, personal trusts, Coverdell
Education Savings Accounts and IRAs (including traditional, Roth, Rollover,
SEP-, SARSEP- and SIMPLE-IRAs), and certain other retirement accounts. If you
have only business, business retirement, employer-sponsored or American Century
Brokerage accounts, you are currently not subject to this fee. We will not
charge the fee as long as you choose to manage your accounts exclusively online.
If you are subject to the Account Maintenance Fee, your account value could be
reduced by the fee amount.
HYPOTHETICAL EXAMPLE FOR COMPARISON PURPOSES
The table also provides information about hypothetical account values and
hypothetical expenses based on the actual expense ratio of each class of your
fund and an assumed rate of return of 5% per year before expenses, which is not
the actual return of a fund's share class. The hypothetical account values and
expenses may not be used to estimate the actual ending account balance or
expenses you paid for the period. You may use this information to compare the
ongoing costs of investing in your fund and other funds. To do so, compare this
5% hypothetical example with the 5% hypothetical examples that appear in the
shareholder reports of the other funds.
(continued)
- ------
23
Shareholder Fee Examples (Unaudited)
Please note that the expenses shown in the table are meant to highlight your
ongoing costs only and do not reflect any transactional costs, such as sales
charges (loads) or redemption/exchange fees. Therefore, the table is useful in
comparing ongoing costs only, and will not help you determine the relative total
costs of owning different funds. In addition, if these transactional costs were
included, your costs would have been higher.
- --------------------------------------------------------------------------------
EXPENSES PAID
BEGINNING ENDING DURING PERIOD* ANNUALIZED
ACCOUNT VALUE ACCOUNT VALUE 12/1/04 - EXPENSE
12/1/04 5/31/05 5/31/05 RATIO*
- --------------------------------------------------------------------------------
TAX-FREE MONEY MARKET SHAREHOLDER FEE EXAMPLE
- --------------------------------------------------------------------------------
ACTUAL
- --------------------------------------------------------------------------------
Investor Class $1,000 $1,008.30 $2.55 0.51%
- --------------------------------------------------------------------------------
HYPOTHETICAL
- --------------------------------------------------------------------------------
Investor Class $1,000 $1,022.39 $2.57 0.51%
- --------------------------------------------------------------------------------
TAX-FREE BOND SHAREHOLDER FEE EXAMPLE
- --------------------------------------------------------------------------------
ACTUAL
- --------------------------------------------------------------------------------
Investor Class $1,000 $1,023.30 $2.52 0.50%
- --------------------------------------------------------------------------------
Institutional Class $1,000 $1,024.30 $1.51 0.30%
- --------------------------------------------------------------------------------
HYPOTHETICAL
- --------------------------------------------------------------------------------
Investor Class $1,000 $1,022.44 $2.52 0.50%
- --------------------------------------------------------------------------------
Institutional Class $1,000 $1,023.44 $1.51 0.30%
- --------------------------------------------------------------------------------
*Expenses are equal to the class's annualized expense ratio listed in the table
above, multiplied by the average account value over the period, multiplied by
182, the number of days in the most recent fiscal half-year, divided by 365, to
reflect the one-half year period.
- ------
24
Statement of Assets and Liabilities
MAY 31, 2005
- --------------------------------------------------------------------------------
TAX-FREE
(AMOUNTS IN THOUSANDS EXCEPT PER-SHARE AMOUNTS) MONEY MARKET TAX-FREE BOND
- --------------------------------------------------------------------------------
ASSETS
- --------------------------------------------------------------------------------
Investment securities, at value (cost of
$290,007 and $616,329, respectively) $290,007 $640,608
- -----------------------------------------------
Cash 796 --
- -----------------------------------------------
Receivable for capital shares sold 37 191
- -----------------------------------------------
Interest receivable 1,512 9,076
- -----------------------------------------------
Prepaid portfolio insurance 32 --
- --------------------------------------------------------------------------------
292,384 649,875
- --------------------------------------------------------------------------------
LIABILITIES
- --------------------------------------------------------------------------------
Disbursements in excess of demand deposit cash -- 33
- -----------------------------------------------
Payable for investments purchased 7,412 29,732
- -----------------------------------------------
Payable for variation margin
on futures contracts -- 232
- -----------------------------------------------
Accrued management fees 115 254
- -----------------------------------------------
Dividends payable 6 408
- --------------------------------------------------------------------------------
7,533 30,659
- --------------------------------------------------------------------------------
NET ASSETS $284,851 $619,216
================================================================================
NET ASSETS CONSIST OF:
- --------------------------------------------------------------------------------
Capital paid in $284,910 $596,569
- -----------------------------------------------
Undistributed net investment income -- 29
- -----------------------------------------------
Accumulated net realized loss
on investment transactions (59) (1,390)
- -----------------------------------------------
Net unrealized appreciation on investments -- 24,008
- --------------------------------------------------------------------------------
$284,851 $619,216
================================================================================
INVESTOR CLASS ($ AND SHARES IN FULL)
- --------------------------------------------------------------------------------
Net assets $284,850,685 $610,419,830
- -----------------------------------------------
Shares outstanding 284,909,990 56,130,358
- -----------------------------------------------
Net asset value per share $1.00 $10.88
- --------------------------------------------------------------------------------
INSTITUTIONAL CLASS ($ AND SHARES IN FULL)
- --------------------------------------------------------------------------------
Net assets N/A $8,795,892
- -----------------------------------------------
Shares outstanding N/A 808,814
- -----------------------------------------------
Net asset value per share N/A $10.88
- --------------------------------------------------------------------------------
See Notes to Financial Statements.
- ------
25
Statement of Operations
YEAR ENDED MAY 31, 2005
- --------------------------------------------------------------------------------
TAX-FREE
(AMOUNTS IN THOUSANDS) MONEY MARKET TAX-FREE BOND
- --------------------------------------------------------------------------------
INVESTMENT INCOME
- --------------------------------------------------------------------------------
INCOME:
- -----------------------------------------------
Interest $4,967 $23,798
- --------------------------------------------------------------------------------
EXPENSES:
- -----------------------------------------------
Management fees 1,336 2,938
- -----------------------------------------------
Trustees' fees and expenses 15 30
- -----------------------------------------------
Portfolio insurance 48 --
- -----------------------------------------------
Other expenses -- 3
- --------------------------------------------------------------------------------
1,399 2,971
- --------------------------------------------------------------------------------
NET INVESTMENT INCOME 3,568 20,827
- --------------------------------------------------------------------------------
REALIZED AND UNREALIZED GAIN (LOSS)
- --------------------------------------------------------------------------------
Net realized loss on investment transactions (1) (374)
- -----------------------------------------------
Change in net unrealized
appreciation on investments -- 9,574
- --------------------------------------------------------------------------------
NET REALIZED AND UNREALIZED GAIN (LOSS) (1) 9,200
- --------------------------------------------------------------------------------
NET INCREASE IN NET ASSETS
RESULTING FROM OPERATIONS $3,567 $30,027
================================================================================
See Notes to Financial Statements.
- ------
26
Statement of Changes in Net Assets
YEARS ENDED MAY 31, 2005 AND MAY 31, 2004
- --------------------------------------------------------------------------------
(AMOUNTS IN THOUSANDS) TAX-FREE MONEY MARKET TAX-FREE BOND
- --------------------------------------------------------------------------------
INCREASE (DECREASE) IN NET ASSETS 2005 2004 2005 2004
- --------------------------------------------------------------------------------
OPERATIONS
- --------------------------------------------------------------------------------
Net investment income $ 3,568 $ 1,684 $ 20,827 $ 20,646
- ---------------------------------
Net realized loss (1) (4) (374) (1,078)
- ---------------------------------
Change in net
unrealized appreciation -- -- 9,574 (26,026)
- --------------------------------------------------------------------------------
Net increase (decrease) in net
assets resulting from operations 3,567 1,680 30,027 (6,458)
- --------------------------------------------------------------------------------
DISTRIBUTIONS TO SHAREHOLDERS
- --------------------------------------------------------------------------------
From net investment income:
- ---------------------------------
Investor Class (3,568) (1,684) (20,531) (20,395)
- ---------------------------------
Institutional Class -- -- (299) (251)
- ---------------------------------
From net realized gains:
- ---------------------------------
Investor Class -- -- -- (1,450)
- ---------------------------------
Institutional Class -- -- -- (16)
- --------------------------------------------------------------------------------
Decrease in net assets
from distributions (3,568) (1,684) (20,830) (22,112)
- --------------------------------------------------------------------------------
CAPITAL SHARE TRANSACTIONS
- --------------------------------------------------------------------------------
Net increase (decrease)
in net assets from capital
share transactions 8,607 3,993 18,619 (7,639)
- --------------------------------------------------------------------------------
NET INCREASE (DECREASE)
IN NET ASSETS 8,606 3,989 27,816 (36,209)
NET ASSETS
- --------------------------------------------------------------------------------
Beginning of period 276,245 272,256 591,400 627,609
- --------------------------------------------------------------------------------
End of period $284,851 $276,245 $619,216 $591,400
================================================================================
Undistributed net
investment income -- -- $29 $3
================================================================================
See Notes to Financial Statements.
- ------
27
Notes to Financial Statements
MAY 31, 2005 (AMOUNTS IN THOUSANDS)
1. ORGANIZATION AND SUMMARY OF SIGNIFICANT ACCOUNTING POLICIES
ORGANIZATION -- American Century Municipal Trust (the trust), is registered
under the Investment Company Act of 1940 (the 1940 Act) as an open-end
management investment company. Tax-Free Money Market Fund (Tax-Free Money
Market) and Tax-Free Bond Fund (Tax-Free Bond) (collectively, the funds) are two
funds in a series issued by the trust. The funds are diversified under the 1940
Act. The funds' investment objective is to seek safety of principal and high
current income that is exempt from federal income tax. Tax-Free Money Market
invests primarily in cash-equivalent, high-quality municipal obligations.
Tax-Free Bond invests primarily in high-quality municipal obligations. The
following is a summary of the funds' significant accounting policies.
MULTIPLE CLASS -- Tax-Free Money Market is authorized to issue the Investor
Class. Tax-Free Bond is authorized to issue the Investor Class and the
Institutional Class. The share classes differ principally in their respective
shareholder servicing and distribution expenses and arrangements. All shares of
each fund represent an equal pro rata interest in the assets of the class to
which such shares belong, and have identical voting, dividend, liquidation and
other rights and the same terms and conditions, except for class specific
expenses and exclusive rights to vote on matters affecting only individual
classes. Income, non-class specific expenses, and realized and unrealized
capital gains and losses of the funds are allocated to each class of shares
based on their relative net assets.
SECURITY VALUATIONS -- Debt securities maturing in greater than 60 days are
valued at current market value as provided by a commercial pricing service or at
the mean of the most recent bid and asked prices. Debt securities maturing
within 60 days may be valued at cost, plus or minus any amortized discount or
premium. If the funds determine that the market price of a portfolio security is
not readily available, or that the valuation methods mentioned above do not
reflect the security's fair value, such security is valued at its fair value as
determined by, or in accordance with procedures adopted by, the Board of
Trustees or its designee if such fair value determination would materially
impact a fund's net asset value. Circumstances that may cause the fund to fair
value a security include: an event occurred after the close of the exchange on
which a portfolio security principally trades (but before the close of the New
York Stock Exchange) that was likely to have changed the value of the security;
a security has been declared in default; or trading in a security has been
halted during the trading day.
SECURITY TRANSACTIONS -- Security transactions are accounted for as of the trade
date. Net realized gains and losses are determined on the identified cost basis,
which is also used for federal income tax purposes.
INVESTMENT INCOME -- Interest income is recorded on the accrual basis and
includes accretion of discounts and amortization of premiums.
WHEN-ISSUED AND FORWARD COMMITMENTS -- The funds may engage in securities
transactions on a when-issued or forward commitment basis. Under these
arrangements, the securities' prices and yields are fixed on the date of the
commitment, but payment and delivery are scheduled for a future date. During
this period, securities are subject to market fluctuations. The funds will
segregate cash, cash equivalents or other appropriate liquid securities on their
records in amounts sufficient to meet the purchase price.
FUTURES CONTRACTS -- Tax-Free Bond may enter into futures contracts in order to
manage the funds' exposure to changes in market conditions. One of the risks of
entering into futures contracts is the possibility that the change in value of
the contract may not correlate with the changes in value of the underlying
securities. Upon entering into a futures contract, the fund is required to
deposit either cash or securities in an amount equal to a certain percentage of
the contract value (initial margin). Subsequent payments (variation margin) are
made or received daily, in cash, by the fund. The variation margin is equal to
the daily change in the contract value and is recorded as unrealized gains and
losses. The fund recognizes a realized gain or loss when the contract is closed
or expires. Net realized and unrealized gains or losses occurring during the
holding period of futures contracts are a component of realized gain (loss) on
investment transactions and unrealized appreciation (depreciation) on
investments, respectively.
INCOME TAX STATUS -- It is each fund's policy to distribute substantially all
net investment income and net realized gains to shareholders and to otherwise
qualify as a regulated investment company under provisions of the Internal
Revenue Code. Accordingly, no provision has been made for federal or state
income taxes.
DISTRIBUTIONS TO SHAREHOLDERS -- Distributions from net investment income are
declared daily and paid monthly. Distributions from net realized gains, if any,
are generally declared and paid annually. Tax-Free Money Market does not expect
to realize any long-term capital gains, and accordingly, does not expect to pay
any capital gains distributions.
(continued)
- ------
28
Notes to Financial Statements
MAY 31, 2005 (AMOUNTS IN THOUSANDS)
1. ORGANIZATION AND SUMMARY OF SIGNIFICANT ACCOUNTING POLICIES (CONTINUED)
INDEMNIFICATIONS -- Under the trust's organizational documents, its officers and
trustees are indemnified against certain liabilities arising out of the
performance of their duties to the funds. In addition, in the normal course of
business, the funds enter into contracts that provide general indemnifications.
The funds maximum exposure under these arrangements is unknown as this would
involve future claims that may be made against the funds. The risk of material
loss from such claims is considered by management to be remote.
USE OF ESTIMATES -- The financial statements are prepared in conformity with
accounting principles generally accepted in the United States of America, which
may require management to make certain estimates and assumptions at the date of
the financial statements. Actual results could differ from these estimates.
2. FEES AND TRANSACTIONS WITH RELATED PARTIES
MANAGEMENT FEES -- The trust has entered into a Management Agreement with
American Century Investment Management Inc. (ACIM) (investment advisor), under
which ACIM provides the funds with investment advisory and management services
in exchange for a single, unified management fee (the fee) per class. The
Agreement provides that all expenses of the funds, except brokerage commissions,
taxes, portfolio insurance, interest, fees and expenses of those trustees who
are not considered "interested persons" as defined in the 1940 Act (including
counsel fees) and extraordinary expenses, will be paid by ACIM. The fee is
computed and accrued daily based on the daily net assets of each specific class
of shares of each fund and paid monthly in arrears. The fee consists of (1) an
Investment Category Fee based on the daily net assets of the funds and certain
other accounts managed by the investment advisor that are in the same broad
investment category as each fund and (2) a Complex Fee based on the assets of
all the funds in the American Century family of funds. The rates for the
Investment Category Fee range from 0.1570% to 0.2700% for Tax-Free Money Market.
The rates for the Investment Category Fee range from 0.1625% to 0.2800% for
Tax-Free Bond. The rates for the Complex Fee range from 0.2500% to 0.3100% for
the Investor Class. The Institutional Class is 0.2000% less at each point within
the Complex Fee Range. For the year ended May 31, 2005, the effective annual
management fee for the Investor Class of Tax-Free Money Market and Tax-Free Bond
were 0.49% and 0.49%, respectively. For the year ended May 31, 2005, the
effective annual management fee for the Institutional Class of Tax-Free Bond was
0.29%.
MONEY MARKET INSURANCE -- Effective February 1, 2005, Tax-Free Money Market,
along with other money market funds managed by ACIM, have entered into an
insurance agreement with Ambac Assurance Corporation (Ambac). Ambac provides
limited coverage for certain loss events including issuer defaults as to payment
of principal or interest and insolvency of a credit enhancement provider. The
fund pays annual premiums to Ambac, which are amortized daily over one year.
Through January 31, 2005, Tax-Free Money Market, along with other money market
funds managed by ACIM, had entered into an insurance agreement with MBIA
Insurance Corporation. For the year ended May 31, 2005, the annualized ratio of
money market insurance expense to average net assets was 0.02% for Tax-Free
Money Market.
RELATED PARTIES -- Certain officers and trustees of the trust are also officers
and/or directors, and, as a group, controlling stockholders of American Century
Companies, Inc. (ACC), the parent of the trust's investment advisor, ACIM, the
distributor of the trust, American Century Investment Services, Inc., and the
trust's transfer agent, American Century Services, LLC (formerly American
Century Services Corporation).
Tax-Free Bond has a bank line of credit agreement with JPMorgan Chase Bank
(JPMCB). JPMCB is a custodian of the funds and a wholly owned subsidiary of J.P.
Morgan Chase & Co. (JPM). JPM is an equity investor in ACC.
3. INVESTMENT TRANSACTIONS
Purchases and sales of investment securities for Tax-Free Bond, excluding
short-term investments, for the year ended May 31, 2005, were $436,515 and
$471,741, respectively. All investment transactions for Tax-Free Money Market
were considered short-term during the year ended May 31, 2005.
(continued)
- ------
29
Notes to Financial Statements
MAY 31, 2005 (AMOUNTS IN THOUSANDS)
4. CAPITAL SHARE TRANSACTIONS
Transactions in shares of the funds were as follows (unlimited number of shares
authorized):
- --------------------------------------------------------------------------------
TAX-FREE MONEY MARKET TAX-FREE BOND
- --------------------------------------------------------------------------------
SHARES AMOUNT SHARES AMOUNT
- --------------------------------------------------------------------------------
INVESTOR CLASS
- --------------------------------------------------------------------------------
YEAR ENDED MAY 31, 2005
- --------------------------
Sold 189,979 $ 189,979 13,170 $ 142,894
- --------------------------
Issued in reinvestment
of distributions 3,493 3,493 1,443 15,658
- --------------------------
Redeemed (184,865) (184,865) (13,004) (140,935)
- --------------------------------------------------------------------------------
Net increase 8,607 $ 8,607 1,609 $ 17,617
================================================================================
YEAR ENDED MAY 31, 2004
- --------------------------
Sold 218,652 $ 218,652 20,630 $ 226,578
- --------------------------
Issued in reinvestment
of distributions 1,634 1,634 1,525 16,643
- --------------------------
Redeemed (216,293) (216,293) (23,030) (251,285)
- --------------------------------------------------------------------------------
Net increase (decrease) 3,993 $ 3,993 (875) $ (8,064)
================================================================================
INSTITUTIONAL CLASS
- --------------------------------------------------------------------------------
YEAR ENDED MAY 31, 2005
- --------------------------
Sold N/A N/A 455 $ 4,953
- --------------------------
Issued in reinvestment
of distributions 27 298
- --------------------------
Redeemed (393) (4,249)
- --------------------------------------------------------------------------------
Net increase 89 $ 1,002
================================================================================
YEAR ENDED MAY 31, 2004
- --------------------------
Sold N/A N/A 138 $ 1,492
- --------------------------
Issued in reinvestment
of distributions 24 267
- --------------------------
Redeemed (122) (1,334)
- --------------------------------------------------------------------------------
Net increase 40 $ 425
================================================================================
5. BANK LINE OF CREDIT
Tax-Free Bond, along with certain other funds managed by ACIM or American
Century Global Investment Management, Inc. (ACGIM), have a $575 million
unsecured bank line of credit agreement with JPMCB, which was renewed from $650
million effective December 15, 2004. The fund may borrow money for temporary or
emergency purposes to fund shareholder redemptions. Borrowings under the
agreement bear interest at the Federal Funds rate plus 0.50%. The fund did not
borrow from the line during the year ended May 31, 2005.
6. RISK FACTORS
The funds may concentrate their investments in certain states and therefore may
have more exposure to credit risk related to those states than a fund with a
broader geographical diversification. Income may be subject to state and local
taxes and, if applicable, the alternative minimum tax.
(continued)
- ------
30
Notes to Financial Statements
MAY 31, 2005 (AMOUNTS IN THOUSANDS)
7. FEDERAL TAX INFORMATION
The tax character of distributions paid during the years ended May 31, 2005 and
May 31, 2004 were as follows:
- --------------------------------------------------------------------------------
TAX-FREE MONEY MARKET TAX-FREE BOND
- --------------------------------------------------------------------------------
2005 2004 2005 2004
- --------------------------------------------------------------------------------
DISTRIBUTIONS PAID FROM
- --------------------------------------------------------------------------------
Ordinary income $3,568 $1,684 $20,830 $21,503
- --------------------------------------------------------------------------------
Long-term capital gains -- -- -- $609
- --------------------------------------------------------------------------------
The character of distributions made during the year from net investment income
or net realized gains may differ from their ultimate characterization for
federal income tax purposes. These differences reflect the differing character
of certain income items and net realized gains and losses for financial
statement and tax purposes, and may result in reclassification among certain
capital accounts on the financial statements.
As of May 31, 2005, the components of distributable earnings on a tax-basis and
the federal tax cost of investments were as follows:
- --------------------------------------------------------------------------------
TAX-FREE
MONEY MARKET TAX-FREE BOND
- --------------------------------------------------------------------------------
COMPONENTS OF DISTRIBUTABLE EARNINGS AND TAX COST
- --------------------------------------------------------------------------------
Federal tax cost of investments $290,007 $616,329
================================================================================
Gross tax appreciation of investments -- $24,512
- --------------------------------------------------
Gross tax depreciation of investments -- (233)
- --------------------------------------------------------------------------------
Net tax appreciation (depreciation) of investments -- $24,279
================================================================================
Undistributed ordinary income -- $29
- --------------------------------------------------
Accumulated capital losses $(59) $(1,661)
- --------------------------------------------------------------------------------
The cost of investments for federal income tax purposes was the same as the cost
for financial reporting purposes.
The accumulated capital losses listed above represent net capital loss
carryovers that may be used to offset future realized capital gains for federal
income tax purposes. The capital loss carryovers expire as follows:
- --------------------------------------------------------------------------------
2008 2009 2010 2011 2012 2013
- --------------------------------------------------------------------------------
Tax-Free Money Market $(6) $(39) $(9) -- $(4) $(1)
- --------------------------------------------------------------------------------
Tax-Free Bond -- -- -- -- $(663) $(998)
- --------------------------------------------------------------------------------
8. OTHER TAX INFORMATION (UNAUDITED)
The following information is provided pursuant to provisions of the Internal
Revenue Code.
The funds designate exempt interest and capital gain dividends for the fiscal
year ended May 31, 2005, as follows:
(DOLLARS IN FULL)
- --------------------------------------------------------------------------------
TAX-FREE
MONEY MARKET TAX-FREE BOND
- --------------------------------------------------------------------------------
Exempt interest dividends $3,564,115 $20,759,169
- --------------------------------------------------------------------------------
Long-term capital gain -- --
- --------------------------------------------------------------------------------
- ------
31
Tax-Free Money Market - Financial Highlights
FOR A SHARE OUTSTANDING THROUGHOUT THE YEARS ENDED MAY 31
- --------------------------------------------------------------------------------
INVESTOR CLASS
- --------------------------------------------------------------------------------
2005 2004 2003 2002 2001
- --------------------------------------------------------------------------------
PER-SHARE DATA
- --------------------------------------------------------------------------------
Net Asset Value,
Beginning of Period $1.00 $1.00 $1.00 $1.00 $1.00
- --------------------------------------------------------------------------------
Income From
Investment Operations
- -------------------------
Net Investment Income 0.01 0.01 0.01 0.02 0.04
- --------------------------------------------------------------------------------
Distributions
- -------------------------
From Net
Investment Income (0.01) (0.01) (0.01) (0.02) (0.04)
- --------------------------------------------------------------------------------
Net Asset Value,
End of Period $1.00 $1.00 $1.00 $1.00 $1.00
================================================================================
TOTAL RETURN(1) 1.33% 0.64% 1.05% 1.64% 3.71%
RAITOS/SUPPLEMENTAL DATA
- --------------------------------------------------------------------------------
Ratio of Operating
Expenses to Average
Net Assets 0.51% 0.51% 0.51% 0.51% 0.50%
- -------------------------
Ratio of Net Investment
Income to Average
Net Assets 1.31% 0.65% 1.04% 1.62% 3.64%
- -------------------------
Net Assets, End of Period
(in thousands) $284,851 $276,245 $272,256 $250,035 $249,461
- --------------------------------------------------------------------------------
(1) Total return assumes reinvestment of net investment income and capital gains
distributions, if any.
See Notes to Financial Statements.
- ------
32
Tax-Free Bond - Financial Highlights
FOR A SHARE OUTSTANDING THROUGHOUT THE YEARS ENDED MAY 31
- --------------------------------------------------------------------------------
INVESTOR CLASS
- --------------------------------------------------------------------------------
2005 2004 2003 2002 2001
- --------------------------------------------------------------------------------
PER-SHARE DATA
- --------------------------------------------------------------------------------
Net Asset Value,
Beginning of Period $10.71 $11.19 $10.63 $10.50 $9.93
- --------------------------------------------------------------------------------
Income From
Investment Operations
- ----------------------------
Net Investment Income 0.38 0.37 0.39 0.44 0.48
- ----------------------------
Net Realized and
Unrealized Gain (Loss) 0.17 (0.45) 0.58 0.22 0.57
- --------------------------------------------------------------------------------
Total From
Investment Operations 0.55 (0.08) 0.97 0.66 1.05
- --------------------------------------------------------------------------------
Distributions
- -------------------------
From Net
Investment Income (0.38) (0.37) (0.39) (0.44) (0.48)
- ----------------------------
From Net
Realized Gains -- (0.03) (0.02) (0.09) --
- --------------------------------------------------------------------------------
Total Distributions (0.38) (0.40) (0.41) (0.53) (0.48)
- --------------------------------------------------------------------------------
Net Asset Value,
End of Period $10.88 $10.71 $11.19 $10.63 $10.50
================================================================================
TOTAL RETURN(1) 5.16% (0.79)% 9.31% 6.45% 10.77%
RAITOS/SUPPLEMENTAL DATA
- --------------------------------------------------------------------------------
Ratio of Operating
Expenses to Average
Net Assets 0.50% 0.51% 0.51% 0.51% 0.51%
- -------------------------
Ratio of Net Investment
Income to Average
Net Assets 3.46% 3.34% 3.62% 4.14% 4.65%
- -------------------------
Portfolio Turnover Rate 77% 60% 57% 86% 106%
- -------------------------
Net Assets, End of Period
(in thousands) $610,420 $583,689 $620,000 $382,447 $188,186
- --------------------------------------------------------------------------------
(1) Total return assumes reinvestment of net investment income and capital gains
distributions, if any. The total return of the classes may not precisely
reflect the class expense differences because of the impact of calculating
values to two decimal places. If net asset values were calculated to three
decimal places, the total return differences would more closely reflect the
class expense differences. The calculation of net asset values to two
decimal places is made in accordance with SEC guidelines and does not result
in any gain or loss of value between one class and another.
See Notes to Financial Statements.
- ------
33
Tax-Free Bond - Financial Highlights
FOR A SHARE OUTSTANDING THROUGHOUT THE YEARS ENDED MAY 31 (EXCEPT AS NOTED)
- --------------------------------------------------------------------------------
INSTITUTIONAL CLASS
- --------------------------------------------------------------------------------
2005 2004 2003(1)
- --------------------------------------------------------------------------------
PER-SHARE DATA
- --------------------------------------------------------------------------------
Net Asset Value, Beginning of Period $10.71 $11.19 $10.90
- --------------------------------------------------------------------------------
Income From Investment Operations
- ---------------------------------------------
Net Investment Income 0.40 0.39 0.05
- ---------------------------------------------
Net Realized and Unrealized
Gain (Loss) 0.17 (0.45) 0.29
- --------------------------------------------------------------------------------
Total From Investment Operations 0.57 (0.06) 0.34
- --------------------------------------------------------------------------------
Distributions
- ---------------------------------------------
From Net Investment Income (0.40) (0.39) (0.05)
- ---------------------------------------------
From Net Realized Gains -- (0.03) --
- --------------------------------------------------------------------------------
Total Distributions (0.40) (0.42) (0.05)
- --------------------------------------------------------------------------------
Net Asset Value, End of Period $10.88 $10.71 $11.19
================================================================================
TOTAL RETURN(2) 5.37% (0.60)% 3.14%
RAITOS/SUPPLEMENTAL DATA
- --------------------------------------------------------------------------------
Ratio of Operating Expenses
to Average Net Assets 0.30% 0.31% 0.30%(3)
- ---------------------------------------------
Ratio of Net Investment Income
to Average Net Assets 3.66% 3.54% 3.68%(3)
- ---------------------------------------------
Portfolio Turnover Rate 77% 60% 57%(4)
- ---------------------------------------------
Net Assets, End of Period
(in thousands) $8,796 $7,711 $7,609
- --------------------------------------------------------------------------------
(1) April 15, 2003 (commencement of sale) through May 31, 2003.
(2) Total return assumes reinvestment of net investment income and capital gains
distributions, if any. Total returns for periods less than one year are not
annualized. The total return of the classes may not precisely reflect the
class expense differences because of the impact of calculating values to two
decimal places. If net asset values were calculated to three decimal places,
the total return differences would more closely reflect the class expense
differences. The calculation of net asset values to two decimal places is
made in accordance with SEC guidelines and does not result in any gain or
loss of value between one class and another.
(3) Annualized.
(4) Portfolio turnover is calculated at the fund level. Percentage indicated was
calculated for the year ended May 31, 2003.
See Notes to Financial Statements.
- ------
34
Report of Independent Registered Public Accounting Firm
To the Trustees of the American Century Municipal Trust and Shareholders of
Tax-Free Money Market Fund and Tax-Free Bond Fund:
In our opinion, the accompanying statements of assets and liabilities, including
the schedules of investments, and the related statements of operations and of
changes in net assets and the financial highlights present fairly, in all
material respects, the financial position of the Tax-Free Money Market Fund and
the Tax-Free Bond Fund (two of the five funds in the American Century Municipal
Trust hereafter referred to as the "Funds") at May 31, 2005, the results of
their operations for the year then ended, the changes in each of their net
assets for each of the two years in the period then ended and the financial
highlights for each of the periods presented, in conformity with accounting
principles generally accepted in the United States of America. These financial
statements and financial highlights (hereafter referred to as "financial
statements") are the responsibility of the Funds' management; our responsibility
is to express an opinion on these financial statements based on our audits. We
conducted our audits of these financial statements in accordance with the
standards of the Public Company Accounting Oversight Board (United States).
Those standards require that we plan and perform the audit to obtain reasonable
assurance about whether the financial statements are free of material
misstatement. An audit includes examining, on a test basis, evidence supporting
the amounts and disclosures in the financial statements, assessing the
accounting principles used and significant estimates made by management, and
evaluating the overall financial statement presentation. We believe that our
audits, which included confirmation of securities at May 31, 2005 by
correspondence with the custodian and brokers, provide a reasonable basis for
our opinion.
PricewaterhouseCoopers LLP
Kansas City, Missouri
July 20, 2005
- ------
35
Management
The individuals listed below serve as trustees or officers of the funds. Each
trustee serves until his or her successor is duly elected and qualified or until
he or she retires. Effective March 2004, mandatory retirement age for
independent trustees is 73. However, the mandatory retirement age may be
extended for a period not to exceed two years with the approval of the remaining
independent trustees. Mr. Scott may serve until age 77 based on an extension
granted under retirement guidelines in effect prior to March 2004. Those listed
as interested trustees are "interested" primarily by virtue of their engagement
as officers of American Century Companies, Inc. (ACC) or its wholly-owned,
direct or indirect, subsidiaries, including the funds' investment advisor,
American Century Investment Management, Inc. (ACIM); the funds' principal
underwriter, American Century Investment Services, Inc. (ACIS); and the funds'
transfer agent, American Century Services, LLC (ACS LLC).
The other trustees (more than three-fourths of the total number) are
independent; that is, they have never been employees or officers of, and have no
financial interest in, ACC or any of its wholly-owned, direct or indirect,
subsidiaries, including ACIM, ACIS, and ACS LLC. The trustees serve in this
capacity for eight registered investment companies in the American Century
family of funds.
All persons named as officers of the funds also serve in similar capacities for
the other 13 investment companies advised by ACIM or American Century Global
Investment Management, Inc. (ACGIM), a wholly owned subsidiary of ACIM, unless
otherwise noted. Only officers with policy-making functions are listed. No
officer is compensated for his or her service as an officer of the funds. The
listed officers are interested persons of the funds and are appointed or
re-appointed on an annual basis.
INDEPENDENT TRUSTEES
- --------------------------------------------------------------------------------
ANTONIO CANOVA, 1665 Charleston Road, Mountain View, CA 94043
YEAR OF BIRTH: 1961
POSITION(S) HELD WITH FUND: Trustee
LENGTH OF TIME SERVED (YEARS): Less than one year
PRINCIPAL OCCUPATION(S) DURING PAST 5 YEARS: Chief Financial Officer, Brocade
Communications Systems, Inc. (May 2001 to present); Vice
President-Administration, Brocade Communications Systems, Inc. (November 2004 to
present); Vice President-Finance, Brocade Communications Systems, Inc. (November
2000 to November 2004); Vice President, Chief Financial Officer and Secretary,
Wireless Inc. (April 2000 to November 2000)
NUMBER OF PORTFOLIOS IN FUND COMPLEX OVERSEEN BY TRUSTEE: 34
OTHER DIRECTORSHIPS HELD BY TRUSTEE: None
- --------------------------------------------------------------------------------
JOHN FREIDENRICH, 1665 Charleston Road, Mountain View, CA 94043
YEAR OF BIRTH: 1937
POSITION(S) HELD WITH FUND: Trustee
LENGTH OF TIME SERVED (YEARS): Less than 1 year
PRINCIPAL OCCUPATION(S) DURING PAST 5 YEARS: Member and Manager, Regis
Management Company, LLC (April 2004 to present); Partner and Founder, Bay
Partners (Venture capital firm, 1976 to present); Partner and Founder, Ware &
Freidenrich (1968 to present)
NUMBER OF PORTFOLIOS IN FUND COMPLEX OVERSEEN BY TRUSTEE: 34
OTHER DIRECTORSHIPS HELD BY TRUSTEE: None
- --------------------------------------------------------------------------------
(continued)
- ------
36
Management
INDEPENDENT TRUSTEES (CONTINUED)
- --------------------------------------------------------------------------------
RONALD J. GILSON, 1665 Charleston Road, Mountain View, CA 94043
YEAR OF BIRTH: 1946
POSITION(S) HELD WITH FUND: Trustee, Chairman of the Board
LENGTH OF TIME SERVED (YEARS): 9
PRINCIPAL OCCUPATION(S) DURING PAST 5 YEARS: Charles J. Meyers Professor of Law
and Business, Stanford Law School (1979 to present); Marc and Eva Stern
Professor of Law and Business, Columbia University School of Law (1992 to
present);
NUMBER OF PORTFOLIOS IN FUND COMPLEX OVERSEEN BY TRUSTEE: 34
OTHER DIRECTORSHIPS HELD BY TRUSTEE: None
- --------------------------------------------------------------------------------
KATHRYN A. HALL, 1665 Charleston Road, Mountain View, CA 94043
YEAR OF BIRTH: 1957
POSITION(S) HELD WITH FUND: Trustee
LENGTH OF TIME SERVED (YEARS): 3
PRINCIPAL OCCUPATION(S) DURING PAST 5 YEARS: Co-Chief Executive Officer and
Chief Investment Officer, Offit Hall Capital Management, LLC (April 2002 to
present); President and Managing Director, Laurel Management Company, L.L.C.
(1996 to April 2002)
NUMBER OF PORTFOLIOS IN FUND COMPLEX OVERSEEN BY TRUSTEE: 34
OTHER DIRECTORSHIPS HELD BY TRUSTEE: None
- --------------------------------------------------------------------------------
MYRON S. SCHOLES, 1665 Charleston Road, Mountain View, CA 94043
YEAR OF BIRTH: 1941
POSITION(S) HELD WITH FUND: Trustee
LENGTH OF TIME SERVED (YEARS): 24
PRINCIPAL OCCUPATION(S) DURING PAST 5 YEARS: Chairman, Oak Hill Platinum
Partners, and a Partner, Oak Hill Capital Management (1999 to present); Frank E.
Buck Professor of Finance-Emeritus, Stanford Graduate School of Business (1981
to present)
NUMBER OF PORTFOLIOS IN FUND COMPLEX OVERSEEN BY TRUSTEE: 34
OTHER DIRECTORSHIPS HELD BY TRUSTEE: Director, Dimensional Fund Advisors
(investment advisor, 1982 to present); Director, Chicago Mercantile Exchange
(2000 to present)
- --------------------------------------------------------------------------------
KENNETH E. SCOTT, 1665 Charleston Road, Mountain View, CA 94043
YEAR OF BIRTH: 1928
POSITION(S) HELD WITH FUND: Trustee
LENGTH OF TIME SERVED (YEARS): 33
PRINCIPAL OCCUPATION(S) DURING PAST 5 YEARS: Ralph M. Parsons Professor of Law
and Business, Stanford Law School (1972 to present)
NUMBER OF PORTFOLIOS IN FUND COMPLEX OVERSEEN BY TRUSTEE: 34
OTHER DIRECTORSHIPS HELD BY TRUSTEE: None
- --------------------------------------------------------------------------------
JOHN B. SHOVEN, 1665 Charleston Road, Mountain View, CA 94043
YEAR OF BIRTH: 1947
POSITION(S) HELD WITH FUND: Trustee
LENGTH OF TIME SERVED (YEARS): 2
PRINCIPAL OCCUPATION(S) DURING PAST 5 YEARS: Professor of Economics, Stanford
University (1977 to present)
NUMBER OF PORTFOLIOS IN FUND COMPLEX OVERSEEN BY TRUSTEE: 34
OTHER DIRECTORSHIPS HELD BY TRUSTEE: Director, Cadence Design Systems (1992 to
present); Director, Watson Wyatt Worldwide (2002 to present); Director,
Palmsource Inc. (2002 to present)
- --------------------------------------------------------------------------------
JEANNE D. WOHLERS, 1665 Charleston Road, Mountain View, CA 94043
YEAR OF BIRTH: 1945
POSITION(S) HELD WITH FUND: Trustee
LENGTH OF TIME SERVED (YEARS): 20
PRINCIPAL OCCUPATION(S) DURING PAST 5 YEARS: Retired, Director and Partner,
Windy Hill Productions, LP (educational software, 1994 to 1998)
NUMBER OF PORTFOLIOS IN FUND COMPLEX OVERSEEN BY TRUSTEE: 34
OTHER DIRECTORSHIPS HELD BY TRUSTEE: Director, Quintus Corporation (automation
solutions, 1995 to present)
- --------------------------------------------------------------------------------
(continued)
- ------
37
Management
INTERESTED TRUSTEE
- --------------------------------------------------------------------------------
WILLIAM M. LYONS, 4500 Main Street, Kansas City, MO 64111
YEAR OF BIRTH: 1955
POSITION(S) HELD WITH FUND: Trustee
LENGTH OF TIME SERVED (YEARS): 7
PRINCIPAL OCCUPATION(S) DURING PAST 5 YEARS: Chief Executive Officer, ACC
(September 2000 to present); President, ACC (June 1997 to present); Chief
Operating Officer, ACC (June 1996 to September 2000); Also serves as: Chief
Executive Officer and President, ACIS, ACGIM, ACIM and other ACC subsidiaries;
Executive Vice President, ACS LLC; Director, ACC, ACGIM, ACIM, ACIS, ACS LLC and
other ACC subsidiaries
NUMBER OF PORTFOLIOS IN FUND COMPLEX OVERSEEN BY TRUSTEE: 34
OTHER DIRECTORSHIPS HELD BY TRUSTEE: None
- --------------------------------------------------------------------------------
OFFICERS
- --------------------------------------------------------------------------------
WILLIAM M. LYONS, 4500 Main Street, Kansas City, MO 64111
YEAR OF BIRTH: 1955
POSITION(S) HELD WITH FUND: President
LENGTH OF TIME SERVED (YEARS): 4
PRINCIPAL OCCUPATION(S) DURING PAST 5 YEARS: See entry under "Interested
Trustee."
- --------------------------------------------------------------------------------
ROBERT T. JACKSON, 4500 Main Street, Kansas City, MO 64111
YEAR OF BIRTH: 1946
POSITION(S) HELD WITH FUND: Executive Vice President
LENGTH OF TIME SERVED (YEARS): 9
PRINCIPAL OCCUPATION(S) DURING PAST 5 YEARS: Chief Administrative Officer, ACC
(August 1997 to present); Chief Financial Officer, ACC (May 1995 to October
2002); Executive Vice President, ACC (May 1995 to present); Also serves as:
Chief Executive Officer, Chief Financial Officer and President, ACS LLC; Chief
Financial Officer and Executive Vice President, ACGIM, ACIM, ACIS and other ACC
subsidiaries; Treasurer, ACGIM, ACIM and other ACC subsidiaries; Director, ACC
and other ACC subsidiaries
- --------------------------------------------------------------------------------
MARYANNE ROEPKE, 4500 Main Street, Kansas City, MO 64111
YEAR OF BIRTH: 1956
POSITION(S) HELD WITH FUND: Senior Vice President, Treasurer and Chief
Accounting Officer
LENGTH OF TIME SERVED (YEARS): 4
PRINCIPAL OCCUPATION(S) DURING PAST 5 YEARS: Assistant Treasurer, ACC (January
1995 to present); Also serves as: Senior Vice President, ACS LLC; Assistant
Treasurer, ACGIM, ACIM, ACIS, ACS LLC and other ACC subsidiaries
- --------------------------------------------------------------------------------
DAVID C. TUCKER, 4500 Main Street, Kansas City, MO 64111
YEAR OF BIRTH: 1958
POSITION(S) HELD WITH FUND: Senior Vice President and General Counsel
LENGTH OF TIME SERVED (YEARS): 6
PRINCIPAL OCCUPATION(S) DURING PAST 5 YEARS: Vice President, ACC (February 2001
to present); General Counsel, ACC (June 1998 to present); Also serves as: Senior
Vice President and General Counsel, ACGIM, ACIM, ACIS, ACS LLC and ACC
subsidiaries
- --------------------------------------------------------------------------------
CHARLES C.S. PARK, 4500 Main Street, Kansas City, MO 64111
YEAR OF BIRTH: 1967
POSITION(S) HELD WITH FUND: Vice President and Chief Compliance Officer
LENGTH OF TIME SERVED (YEARS): 4 and less than 1 year
PRINCIPAL OCCUPATION(S) DURING PAST 5 YEARS: Chief Compliance Officer, ACS LLC,
ACIM and ACGIM (March 2005 to present); Vice President, ACS LLC (February 2000
to present); Assistant General Counsel, ACS LLC (January 1998 to March 2005)
- --------------------------------------------------------------------------------
ROBERT LEACH, 4500 Main Street, Kansas City, MO 64111
YEAR OF BIRTH: 1966
POSITION(S) HELD WITH FUND: Controller
LENGTH OF TIME SERVED (YEARS): 8
PRINCIPAL OCCUPATION(S) DURING PAST 5 YEARS: Vice President, ACS LLC (February
2000 to present); Controller-Fund Accounting, ACS LLC (June 1997 to present)
- --------------------------------------------------------------------------------
(continued)
- ------
38
Management
OFFICERS (CONTINUED)
- --------------------------------------------------------------------------------
C. JEAN WADE, 4500 Main Street, Kansas City, MO 64111
YEAR OF BIRTH: 1964
POSITION(S) HELD WITH FUND: Controller(1)
LENGTH OF TIME SERVED (YEARS): 8
PRINCIPAL OCCUPATION(S) DURING PAST 5 YEARS: Vice President, ACS LLC (February
2000 to present); Controller-Fund Accounting, ACS LLC (June 1997 to present)
- --------------------------------------------------------------------------------
JON ZINDEL, 4500 Main Street, Kansas City, MO 64111
YEAR OF BIRTH: 1967
POSITION(S) HELD WITH FUND: Tax Officer
LENGTH OF TIME SERVED (YEARS): 7
PRINCIPAL OCCUPATION(S) DURING PAST 5 YEARS: Vice President, ACC (October 2001
to present); Vice President, Corporate Tax, ACS LLC (April 1998 to present);
Also serves as: Vice President, ACGIM, ACIM, ACIS and other ACC subsidiaries
- --------------------------------------------------------------------------------
(1) Ms. Wade serves in a similar capacity for seven other investment companies
advised by ACIM.
The SAI has additional information about the funds' trustees and is available
without charge upon request by calling 1-800-345-2021.
- ------
39
Approval of Management Agreements for Tax-Free Money Market and Tax-Free Bond
Under Section 15(c) of the Investment Company Act, contracts for investment
advisory services are required to be reviewed, evaluated and approved by a
majority of a fund's independent directors or trustees (the "Directors") each
year. At American Century, this process -- referred to as the "15(c) Process" --
involves at least two board meetings spanning a 30 to 60 day period each year,
as well as meetings of the Corporate Governance Committee (comprised solely of
independent directors), which coordinates the board's 15(c) Process. In addition
to this annual review, the board and its committees oversee and evaluate at
quarterly meetings the nature and quality of significant services performed by
the advisor on behalf of the funds. At these meetings the board reviews fund
performance, provision of shareholder services, audit and compliance
information, and a variety of other reports from the advisor concerning fund
operations. The board, or committees of the board, also holds special meetings,
as needed.
ANNUAL CONTRACT REVIEW PROCESS
As part of the annual 15(c) Process undertaken during this half-year period, the
Directors requested and received extensive data and information compiled by the
advisor and certain independent providers of evaluative data (the "15(c)
Providers") concerning Tax-Free Money Market and Tax-Free Bond (the "funds") and
the services provided to such funds under the management agreement. The
information included:
* the nature, extent and quality of investment management, shareholder services
and other services provided to the funds under the management agreement;
* reports on the advisor's activities relating to the wide range of programs and
services the advisor provides to the funds and their shareholders on a routine
and non-routine basis;
* data comparing the cost of owning the funds to the cost of owning similar
funds;
* data comparing the funds' performance to appropriate benchmarks and/or a peer
group of other mutual funds with similar investment objectives and strategies;
* financial data showing the profitability of the funds to the advisor and the
overall profitability of the advisor; and
* data comparing services provided and charges to clients of the advisor other
than the funds.
In addition, the board also reviewed information provided by an independent
consultant retained by the board in connection with the 15(c) Process.
In keeping with its practice, the funds' board held two regularly scheduled
meetings and one special meeting to review and discuss the information provided
by the advisor and to complete its negotiations with the advisor regarding the
renewal of the management agreement, including the setting of the applicable
advisory fee. In addition, the independent directors and the Corporate
Governance Committee met to review and discuss the information provided and
evaluate the advisor's performance as manager of the funds. Working through the
Corporate Governance Committee, the board also retained a consultant to assist
it in its evaluation of the profitability of the funds and the advisor, and in
formulating the
(continued)
- ------
40
Approval of Management Agreements for Tax-Free Money Market and Tax-Free Bond
board's fee proposals. The board also had the benefit of the advice of its
independent counsel throughout the period.
FACTORS CONSIDERED
The Directors considered all of the information provided by the advisor, the
15(c) Providers, the board's consultant and its independent counsel, and
evaluated such information for each fund for which the board has responsibility.
The Directors did not identify any single factor as being all-important or
controlling, and each Director may have attributed different levels of
importance to different factors. In deciding to renew the agreement under the
terms ultimately determined by the board to be appropriate, the Directors'
decision was based on the following factors.
NATURE, EXTENT AND QUALITY OF SERVICES -- GENERALLY. Under the management
agreement, the advisor is responsible for providing or arranging for all
services necessary for the operation of the funds. The board noted that under
the management agreement, the advisor provides or arranges at its own expense a
wide variety of services including
* fund construction and design
* portfolio security selection
* initial capitalization/funding
* securities trading
* custody of fund assets
* daily valuation of the funds' portfolio
* shareholder servicing and transfer agency, including shareholder
confirmations, recordkeeping and communications
* legal services
* regulatory and portfolio compliance
* financial reporting
* marketing and distribution
The Directors noted that many of these services have expanded over time both in
terms of quantity and complexity in response to shareholder demands, competition
in the industry and the changing regulatory environment. In performing their
evaluation, the Directors considered information received in connection with the
annual review, as well as information provided on an ongoing basis at their
regularly scheduled board and committee meetings.
INVESTMENT MANAGEMENT SERVICES. The nature of the investment management services
provided is quite complex and allows fund shareholders access to professional
money management, instant diversification of their investments within an asset
class, the opportunity to easily diversify among asset classes, and liquidity.
In evaluating investment performance, the board expects the advisor to manage
the funds in accordance with their investment objectives and approved
strategies. In providing these services, the advisor utilizes teams of
investment professionals (portfolio managers, analysts, research assistants, and
securities traders) who require extensive information technology, research,
training, compliance and other systems to conduct their business. At each
quarterly meeting the board and the Portfolio Committee review investment
performance information for the funds, together with comparative information for
appropriate benchmarks and peer groups of funds managed similarly to the fund.
Further, the Portfolio Committee reports its assessment to the board. If
performance concerns are
(continued)
- ------
41
Approval of Management Agreements for Tax-Free Money Market and Tax-Free Bond
identified, the Directors discuss with the advisor and its portfolio managers
the reasons for such results (e.g., market conditions, security selection) and
any efforts being undertaken to improve performance. Tax-Free Bond's performance
fell below the median for both one and three year periods during part of the
past year. The board discussed Tax-Free Bond's performance with the advisor and
was satisfied with the efforts being undertaken by the advisor.
SHAREHOLDER AND OTHER SERVICES. The advisor provides the funds with a
comprehensive package of transfer agency, shareholder, and other services. The
Quality of Service Committee reviews reports and evaluations of such services at
its regular quarterly meetings, including the annual meeting concerning contract
review, and reports to the board. The Quality of Service Committee reviews
interim reports between regularly scheduled meetings. These reports include, but
are not limited to, information regarding the operational efficiency and
accuracy of the shareholder and transfer agency services provided, staffing
levels, shareholder satisfaction (as measured by external as well as internal
sources), technology support, new products and services offered to fund
shareholders, securities trading activities, portfolio valuation services,
auditing services, and legal and operational compliance activities. Certain
aspects of shareholder and transfer agency service level efficiency and the
quality of securities trading activities are measured by independent third party
providers and are presented in comparison to other fund groups not managed by
the advisor.
COSTS OF SERVICES PROVIDED AND PROFITABILITY TO THE ADVISOR. The advisor
provides detailed information concerning its cost of providing various services
to the funds, its profitability in managing the funds, its overall
profitability, and its financial condition. The Directors have reviewed with the
advisor the methodology used to prepare this financial information. This
financial information regarding the advisor is considered in order to evaluate
the advisor's financial condition, its ability to continue to provide services
under the management agreement, and the reasonableness of the current management
fee. The board has retained a consultant to assist it in this review.
ETHICS OF THE ADVISOR. The Directors generally consider the advisor's commitment
to providing quality services to shareholders and to conducting its business
ethically. They noted that the advisor's practices generally meet or exceed
industry best practices and that the advisor was not implicated in the industry
scandals of 2003 and 2004.
ECONOMIES OF SCALE. The Directors review reports provided by the advisor on
economies of scale for the complex as a whole and the year-over-year changes in
revenue, costs, and profitability. The Directors concluded that economies of
scale are difficult to measure with precision, particularly on a fund-by-fund
basis. This analysis is also complicated by the additional services and content
provided by the advisor and its reinvestment in its ability to provide and
expand those services. Accordingly, the Directors also seek to evaluate
economies of scale by reviewing other information, such as
(continued)
- ------
42
Approval of Management Agreements for Tax-Free Money Market and Tax-Free Bond
year-over-year profitability of the advisor generally, the profitability of its
management of the funds specifically, the expenses incurred by the advisor in
providing various functions to the funds, and the fee breakpoints of competitive
funds not managed by the advisor. The Directors believe the advisor is
appropriately sharing economies of scale through a competitive fee structure,
through breakpoints that reduce fees as the fund complex and the funds increase
in size and through reinvestment in its business to provide shareholders
additional content and services. In particular, separate breakpoint schedules
based on the size of the entire fund complex and on the size of a particular
fund reflect the complexity of assessing economies of scale.
COMPARISON TO OTHER FUNDS' FEES. Each fund pays the advisor a single,
all-inclusive (or unified) management fee for providing all services necessary
for the management and operation of the fund, other than brokerage expenses,
taxes, interest, extraordinary expenses, and the fees and expenses of the fund's
independent directors (including their independent legal counsel). Under the
unified fee structure, the advisor is responsible for providing all investment
advisory, custody, audit, administrative, compliance, recordkeeping, marketing
and shareholder services, or arranging and supervising third parties to provide
such services. By contrast, most other fund groups are charged a variety of
fees, including an investment advisory fee, a transfer agency fee, an
administrative fee, distribution charges and other expenses. Other than their
investment advisory fees and Rule 12b-1 distribution fees, all other components
of the total fees charged by these other fund groups may be increased without
shareholder approval. The board believes the unified fee structure is a benefit
to fund shareholders because it clearly discloses to shareholders the cost of
owning fund shares, and, since the unified fee cannot be increased without a
vote of fund shareholders, it shifts to the advisor the increased costs of
operating the funds and the risk of administrative inefficiencies. Part of the
Directors' analysis of fee levels involves comparing the fund's unified fee to
the total expense ratio of other funds in the funds' peer groups. The Directors
seek as a general rule to have total expense ratios of fixed income and money
market funds in the lowest quartile of the fees of comparable funds. The unified
fees charged to shareholders of the funds were in the lowest quartile of the
total expense ratios of their respective peer group.
COMPARISON TO FEES AND SERVICES PROVIDED TO OTHER CLIENTS OF THE ADVISOR. The
Directors also requested and received information from the advisor concerning
the nature of the services, fees, and profitability of its advisory services to
advisory clients other than the funds. They observed that these varying types of
client accounts require different services and involve different regulatory and
entrepreneurial risks than the management of the funds. The Directors analyzed
this information and concluded that the fees charged and services provided to
the advisor's other clients did not suggest that the funds' fees were
unreasonable by comparison.
(continued)
- ------
43
Approval of Management Agreements for Tax-Free Money Market and Tax-Free Bond
COLLATERAL BENEFITS DERIVED BY THE ADVISOR. The Directors reviewed information
from the advisor concerning collateral benefits it receives as a result of its
relationship with the fund. They concluded that the advisor's primary business
is managing mutual funds and it generally does not use the fund or shareholder
information to generate profits in other lines of business, and therefore does
not derive any significant collateral benefits from them. The Directors noted
that the advisor receives proprietary research from broker dealers that execute
fund portfolio transactions and concluded that this research is likely to
benefit fund shareholders. The Directors also determined that the advisor is
able to provide investment management services to clients other than the funds,
at least in part, due to its existing infrastructure built to serve the fund
complex. The Directors concluded, however, that the assets of those other
clients are not significant and that, in any event, the addition of such other
assets to the assets of the funds that use substantially the same investment
management team and strategy to determine whether breakpoints have been achieved
captures for the shareholders a portion of any benefit that exists.
CONCLUSIONS OF THE DIRECTORS
As a result of this process, the Directors concluded that the investment
management agreement between the funds and the advisor is fair and reasonable in
light of the services provided and should be renewed.
(continued)
- ------
44
Share Class Information
One class of shares is authorized for sale by Tax-Free Money Market: Investor
Class. Two classes of shares are authorized for sale by Tax-Free Bond: Investor
Class and Institutional Class. The total expense ratio for Institutional Class
shares is lower than that of Investor Class shares.
INVESTOR CLASS shares are available for purchase in two ways: 1) directly from
American Century without any commissions or other fees; or 2) through a
broker-dealer, which may require payment of a transaction fee to the broker.
INSTITUTIONAL CLASS shares are available to large investors such as endowments,
foundations, and retirement plans, and to financial intermediaries serving these
investors. This class recognizes the relatively lower cost of serving
institutional customers and others who invest at least $5 million ($3 million
for endowments and foundations) in an American Century fund or at least $10
million in multiple funds. In recognition of the larger investments and account
balances and comparatively lower transaction costs, the total expense ratio of
Institutional Class shares is 0.20% less than the total expense ratio of
Investor Class shares.
All classes of shares represent a pro rata interest in the funds and generally
have the same rights and preferences.
- ------
45
Additional Information
INDEX DEFINITIONS
The following indices are used to illustrate investment market, sector, or style
performance or to serve as fund performance comparisons. They are not investment
products available for purchase.
The LEHMAN BROTHERS MUNICIPAL 5-YEAR GENERAL OBLIGATION (GO) INDEX is composed
of investment-grade U.S. municipal securities, with maturities of four to six
years, that are general obligations of a state or local government.
The LEHMAN BROTHERS MUNICIPAL BOND INDEX is a market value-weighted index
designed for the long-term tax-exempt bond market.
The LEHMAN BROTHERS U.S. AGGREGATE INDEX represents securities that are taxable,
registered with the Securities and Exchange Commission, and U.S.
dollar-denominated. The index covers the U.S. investment-grade fixed-rate bond
market, with index components for government and corporate securities, mortgage
pass-through securities, and asset-backed securities.
QUARTERLY PORTFOLIO DISCLOSURE
The funds file their complete schedule of portfolio holdings with the Securities
and Exchange Commission (SEC) for the first and third quarters of each fiscal
year on Form N-Q. The funds' Forms N-Q are available on the SEC's Web site at
sec.gov, and may be reviewed and copied at the SEC's Public Reference Room in
Washington, DC. Information on the operation of the Public Reference Room may be
obtained by calling 1-800-SEC-0330. The funds also make their complete schedule
of portfolio holdings for the most recent quarter of their fiscal year available
on their Web site at americancentury.com and, upon request, by calling
1-800-345-2021.
- ------
46
Notes
- ------
47
Notes
- ------
48
[inside back cover - blank]
[back cover]
CONTACT US
AMERICANCENTURY.COM
AUTOMATED INFORMATION LINE:
1-800-345-8765
INVESTOR SERVICES REPRESENTATIVE:
1-800-345-2021 or 816-531-5575
BUSINESS, NOT-FOR-PROFIT,
EMPLOYER-SPONSORED RETIREMENT PLANS:
1-800-345-3533
BANKS AND TRUST COMPANIES, BROKER-DEALERS,
FINANCIAL ADVISORS, INSURANCE COMPANIES:
1-800-345-6488
TELECOMMUNICATIONS DEVICE FOR THE DEAF:
1-800-634-4113 or 816-444-3485
AMERICAN CENTURY MUNICIPAL TRUST
INVESTMENT ADVISOR:
American Century Investment Management, Inc.
Kansas City, Missouri
THIS REPORT AND THE STATEMENTS IT CONTAINS ARE SUBMITTED FOR THE GENERAL
INFORMATION OF OUR SHAREHOLDERS. THE REPORT IS NOT AUTHORIZED FOR DISTRIBUTION
TO PROSPECTIVE INVESTORS UNLESS PRECEDED OR ACCOMPANIED BY AN EFFECTIVE
PROSPECTUS.
The American Century Investments logo, American Century and American Century
Investments are service marks of American Century Proprietary Holdings, Inc.
American Century Investment Services, Inc., Distributor
0507 (c)2005 American Century Proprietary Holdings, Inc.
SH-ANN-44210N All rights reserved.
[front cover]
American Century Investments
ANNUAL REPORT
[photo of boy]
MAY 31, 2005
Arizona Municipal Bond Fund
Florida Municipal Bond Fund
High-Yield Municipal Fund
[american century investments logo and text logo]
Table of Contents
Our Message to You . . . . . . . . . . . . . . . . . . . . . . . . . . . . . . 1
ARIZONA MUNICIPAL BOND
Performance . . . . . . . . . . . . . . . . . . . . . . . . . . . . . . . . . .2
Portfolio Commentary . . . . . . . . . . . . . . . . . . . . . . . . . . . . . 4
Portfolio at a Glance and Yields . . . . . . . . . . . . . . . . . . . . . .4
Portfolio Composition by Credit Rating . . . . . . . . . . . . . . . . . . .5
Top Five Sectors . . . . . . . . . . . . . . . . . . . . . . . . . . . . . .5
Schedule of Investments . . . . . . . . . . . . . . . . . . . . . . . . . . . .6
FLORIDA MUNICIPAL BOND
Performance . . . . . . . . . . . . . . . . . . . . . . . . . . . . . . . . . .8
Portfolio Commentary . . . . . . . . . . . . . . . . . . . . . . . . . . . . .10
Portfolio at a Glance and Yields . . . . . . . . . . . . . . . . . . . . . 10
Portfolio Composition by Credit Rating . . . . . . . . . . . . . . . . . . 11
Top Five Sectors . . . . . . . . . . . . . . . . . . . . . . . . . . . . . 11
Schedule of Investments . . . . . . . . . . . . . . . . . . . . . . . . . . . 12
HIGH-YIELD MUNICIPAL
Performance . . . . . . . . . . . . . . . . . . . . . . . . . . . . . . . . . 15
Portfolio Commentary . . . . . . . . . . . . . . . . . . . . . . . . . . . . .17
Portfolio at a Glance and Yields . . . . . . . . . . . . . . . . . . . . . 17
Portfolio Composition by Credit Rating . . . . . . . . . . . . . . . . . . 18
Top Five Sectors . . . . . . . . . . . . . . . . . . . . . . . . . . . . . 18
Schedule of Investments . . . . . . . . . . . . . . . . . . . . . . . . . . . 19
Shareholder Fee Examples . . . . . . . . . . . . . . . . . . . . . . . . . . .24
FINANCIAL STATEMENTS
Statement of Assets and Liabilities . . . . . . . . . . . . . . . . . . . . . 27
Statement of Operations . . . . . . . . . . . . . . . . . . . . . . . . . . . 28
Statement of Changes in Net Assets . . . . . . . . . . . . . . . . . . . . . .29
Notes to Financial Statements . . . . . . . . . . . . . . . . . . . . . . . . 31
Financial Highlights . . . . . . . . . . . . . . . . . . . . . . . . . . . . .38
Report of Independent Registered Public Accounting Firm . . . . . . . . . . . 50
OTHER INFORMATION
Management . . . . . . . . . . . . . . . . . . . . . . . . . . . . . . . . . .51
Approval of Management Agreements for Arizona Municipal Bond,
Florida Municipal Bond and High Yield Municipal Bond . . . . . . . . . . . . .55
Share Class Information . . . . . . . . . . . . . . . . . . . . . . . . . . . 60
Additional Information . . . . . . . . . . . . . . . . . . . . . . . . . . . .61
Index Definitions . . . . . . . . . . . . . . . . . . . . . . . . . . . . . . 62
The opinions expressed in each of the Portfolio Commentaries reflect those of
the portfolio management team as of the date of the report, and do not
necessarily represent the opinions of American Century or any other person in
the American Century organization. Any such opinions are subject to change at
any time based upon market or other conditions and American Century disclaims
any responsibility to update such opinions. These opinions may not be relied
upon as investment advice and, because investment decisions made by American
Century funds are based on numerous factors, may not be relied upon as an
indication of trading intent on behalf of any American Century fund. Security
examples are used for representational purposes only and are not intended as
recommendations to purchase or sell securities. Performance information for
comparative indices and securities is provided to American Century by third
party vendors. To the best of American Century's knowledge, such information is
accurate at the time of printing.
Our Message to You
[photo of James E. Stowers III and James E. Stowers, Jr.]
JAMES E. STOWERS III WITH JAMES E. STOWERS, JR.
We are pleased to provide you with the annual report for the Arizona Municipal
Bond, Florida Municipal Bond, and High-Yield Municipal funds for the year ended
May 31, 2005.
This report contains information that can help you monitor your investment.
You'll find details about your fund's return and holdings as well as data and
commentary that provide insight into the market conditions that affected the
fund's performance.
In addition, through our americancentury.com Web site, we provide quarterly
commentaries on all portfolios managed by our investment teams, the views of our
senior investment officers, and other communications about investing, portfolio
strategy, and the markets. We also have many resources available in the
Education & Planning section of our site to help you meet your goals.
Your next shareholder report for these funds will be the semiannual report dated
November 30, 2005, available in approximately six months.
As always, we deeply appreciate your investment with American Century
Investments.
Sincerely,
/s/James E. Stowers, Jr.
James E. Stowers, Jr.
FOUNDER
AMERICAN CENTURY COMPANIES, INC.
/s/James E. Stowers III
James E. Stowers III
CHAIRMAN OF THE BOARD
AMERICAN CENTURY COMPANIES, INC.
- ------
1
Arizona Municipal Bond - Performance
TOTAL RETURNS AS OF MAY 31, 2005
-----------------------------
AVERAGE ANNUAL RETURNS
- --------------------------------------------------------------------------------
SINCE INCEPTION
1 YEAR 5 YEARS 10 YEARS INCEPTION DATE
- --------------------------------------------------------------------------------
INVESTOR CLASS 5.21% 6.08% 5.26% 5.58% 4/11/94
- --------------------------------------------------------------------------------
LEHMAN BROTHERS
MUNICIPAL 5-YEAR
GO INDEX 4.47% 5.83% 5.23% 5.45%(1) --
- --------------------------------------------------------------------------------
LIPPER OTHER STATES
INTERMEDIATE
MUNICIPAL DEBT FUNDS
AVERAGE RETURNS(2) 4.74% 5.39% 4.55% 4.86%(3) --
- --------------------------------------------------------------------------------
Investor Class's
Lipper Ranking
as of 5/31/05(2) 36 of 123 12 of 86 3 of 63 3 of 46(3) --
- --------------------------------------------------------------------------------
Investor Class's
Lipper Ranking
as of 6/30/05(2) 37 of 123 13 of 88 4 of 63 3 of 46(3) --
- --------------------------------------------------------------------------------
A Class 2/27/04
No sales charge* 4.94% -- -- 1.53%
With sales charge* 0.22% -- -- -2.13%
- --------------------------------------------------------------------------------
B Class 2/27/04
No sales charge* 4.19% -- -- 0.80%
With sales charge* 0.19% -- -- -2.40%
- --------------------------------------------------------------------------------
C Class 4.15% -- -- 0.76% 2/27/04
- --------------------------------------------------------------------------------
*Sales charges include initial sales charges and contingent deferred sales
charges (CDSCs), as applicable. A Class shares have a 4.50% maximum initial
sales charge for fixed income funds and may be subject to a maximum CDSC of
1.00%. B Class shares redeemed within six years of purchase are subject to a
CDSC that declines from 5.00% during the first year after purchase to 0.00% the
sixth year after purchase. C Class shares redeemed within 12 months of purchase
are subject to a maximum CDSC of 1.00%. Please see the Share Class Information
pages for more about the applicable sales charges for each share class. The SEC
requires that mutual funds provide performance information net of maximum sales
charges in all cases where charges could be applied.
(1) Since 3/31/94, the date nearest the fund's inception for which data are
available.
(2) (c)2005 Reuters. All rights reserved. Any copying, republication or
redistribution of Lipper content, including by caching, framing or similar
means, is expressly prohibited without the prior written consent of Lipper.
Lipper shall not be liable for any errors or delays in the content, or for
any actions taken in reliance thereon.
Lipper Fund Performance -- Performance data is total return, and is
preliminary and subject to revision.
Lipper Rankings -- Rankings are based only on the universe shown. This
listing might not represent the complete universe of funds tracked by Lipper
Inc.
The data contained herein has been obtained from company reports, financial
reporting services, periodicals and other resources believed to be reliable.
Although carefully verified, data on compilations is not guaranteed by
Lipper Inc. - A Reuters Company and may be incomplete. No offer or
solicitations to buy or sell any of the securities herein is being made by
Lipper.
(3) Since 4/14/94, the date nearest the fund's inception for which data are
available.
(continued)
- ------
2
Arizona Municipal Bond - Performance
GROWTH OF $10,000 OVER 10 YEARS
$10,000 investment made May 31, 1995
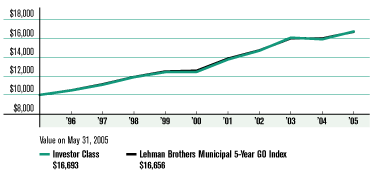
ONE-YEAR RETURNS OVER 10 YEARS
Periods ended May 31
- -------------------------------------------------------------------------------------------------
1996 1997 1998 1999 2000 2001 2002 2003 2004 2005
- -------------------------------------------------------------------------------------------------
Investor Class 4.65% 5.77% 7.19% 4.51% 0.20% 10.57% 6.74% 9.36% -1.06% 5.21%
- -------------------------------------------------------------------------------------------------
Lehman Brothers
Municipal 5-Year
GO Index 4.74% 6.08% 6.95% 4.90% 0.65% 10.17% 6.33% 8.72% -0.22% 4.47%
- -------------------------------------------------------------------------------------------------
Data presented reflect past performance. Past performance is no guarantee of
future results. Current performance may be higher or lower than the performance
shown. Investment return and principal value will fluctuate, and redemption
value may be more or less than original cost. To obtain performance data current
to the most recent month end, please call 1-800-345-2021 or visit
americancentury.com. As interest rates rise, bond values will decline.
Investment income may be subject to certain state and local taxes and, depending
on your tax status, the federal alternative minimum tax (AMT). Capital gains are
not exempt from state and federal income tax.
Unless otherwise indicated, performance reflects Investor Class shares;
performance for other share classes will vary due to differences in fee
structure. For information about other share classes available, please consult
the prospectus. Data assumes reinvestment of dividends and capital gains, and
none of the charts reflect the deduction of taxes that a shareholder would pay
on fund distributions or the redemption of fund shares. Returns for the indices
are provided for comparison. The fund's total returns include operating expenses
(such as transaction costs and management fees) that reduce returns, while the
total returns of the indices do not.
- ------
3
Arizona Municipal Bond - Portfolio Commentary
PORTFOLIO MANAGER: KENNETH SALINGER
PERFORMANCE SUMMARY
Arizona Municipal Bond returned 5.21%* for the fiscal year ended May 31, 2005,
reflecting a respectable performance by municipal bonds that occurred in spite
of eight consecutive short-term interest rate increases by the Federal Reserve.
That 12-month return ranked the fund among the top 30% of Lipper's 123 Other
States Intermediate Municipal Debt Funds, the average return of which was 4.74%.
(Please see pages 2 and 3.)
Longer-term performance was even better: Arizona Municipal Bond finished among
the top 15% of its Lipper peer group for the five years ended May 31, 2005, and
among the top 5% for the last 10 years.
YIELD SUMMARY & PERSPECTIVE
Arizona Municipal Bond's key investment objective is to seek safety of principal
and high current income that is exempt from federal and Arizona income taxes.
Along those lines, the fund's 30-day SEC yield was 3.12% as of May 31, 2005,
compared with the fund's Lipper average 30-day SEC yield of 2.54%.
On a tax-equivalent basis, Arizona Municipal Bond's 30-day SEC yield equated to
5.05% for investors in a combined federal and state tax bracket of 38.28%.
(Please see the table above.)
ECONOMIC REVIEW
The U.S. economy grew at a moderate rate during the fiscal year as energy
prices, inflation, and short-term interest rates rose. The annualized real rate
of GDP growth ranged from 3.3% to 4.0%, while crude oil averaged $47 a barrel
and jumped as high as $57. The 12-month percentage change of "core" CPI
(excluding food and energy) climbed from 1.7% in May 2004 to 2.4% in February
2005, its fastest growth rate since August 2002. To keep inflation from
escalating, the Federal Reserve raised its target rate, in eight quarter-point
increments, from 1% in June 2004 to 3% in May 2005.
BROAD BOND MARKET REVIEW
Though core inflation rose, it remained at relatively low levels, and stopped
accelerating after the first quarter of 2005. And while economic growth was
moderate, it declined after reaching 4.0%
PORTFOLIO AT A GLANCE
- --------------------------------------------------------------------------------
AS OF AS OF
5/31/05 5/31/04
- --------------------------------------------------------------------------------
Weighted Average
Maturity 8.0 yrs 7.4 yrs
- --------------------------------------------------------------------------------
Average Duration
(Modified) 4.2 yrs 4.4 yrs
- --------------------------------------------------------------------------------
YIELDS AS OF MAY 31, 2005
- --------------------------------------------------------------------------------
30-DAY SEC YIELD
- --------------------------------------------------------------------------------
Investor Class 3.12%
- --------------------------------------------------------------------------------
A Class 2.74%
- --------------------------------------------------------------------------------
B Class 2.15%
- --------------------------------------------------------------------------------
C Class 2.12%
- --------------------------------------------------------------------------------
INVESTOR CLASS 30-DAY TAX-EQUIVALENT YIELDS(1)
- --------------------------------------------------------------------------------
28.54% Tax Bracket 4.37%
- --------------------------------------------------------------------------------
31.40% Tax Bracket 4.55%
- --------------------------------------------------------------------------------
36.38% Tax Bracket 4.90%
- --------------------------------------------------------------------------------
38.28% Tax Bracket 5.05%
- --------------------------------------------------------------------------------
(1) The tax brackets indicated are combined federal and state tax brackets.
Actual tax-equivalent yields may be lower, if alternative minimum tax is
applicable.
*All fund returns and yields referenced in this commentary are for Investor
Class shares.
(continued)
- ------
4
Arizona Municipal Bond - Portfolio Commentary
in the third quarter of 2004. That helped longer-term interest rates and bond
yields fall, and bond prices rise. Lower longer-maturity yields, combined with
higher yields for shorter-maturity securities (which rose with the Fed's rate
hikes) created a "flatter" Treasury yield curve and helped
longer-maturity/duration notes and bonds generally outperform
shorter-maturity/duration notes.
MUNICIPAL MARKET REVIEW
The Lehman Brothers Municipal Bond Index returned 7.96% for the fiscal year,
outperforming its taxable counterpart, the Lehman Brothers U.S. Aggregate. The
municipal yield curve also flattened, causing long-term municipal bonds to
outperform shorter-term notes. But the municipal yield curve did not flatten as
much as the Treasury curve, making municipal bond yields attractive compared
with Treasury yields. In fact, as of May 31, 2005, 30-year AAA-rated general
obligation municipal bonds yielded more than 30-year Treasury bonds! Credit
quality also affected performance--lower-quality, higher-yielding bonds tended
to outperform investment-grade debt.
PORTFOLIO POSITIONING & STRATEGIES
During the fiscal year, we primarily invested in municipal bonds rated AAA and
AA. But we also increased the portfolio's conservatively small slice of
lower-rated investment-grade bonds. When looking for such securities, we try to
find ones that we feel enjoy solid underlying credit stories and are
attractively valued. Our seasoned municipal credit research team plays a vital
role in that process.
One big benefit of these bonds is that they tend to offer higher yields than
better-rated like-maturity equivalents as a tradeoff for their slightly
increased credit risk. So keeping a portion of the portfolio in securities rated
BBB, for example, can potentially prop up Arizona Municipal Bond's yield and
translate into a higher total return.
OUR COMMITMENT
We remain committed to seeking safety of principal while providing a high level
of Arizona and federal tax-exempt current income by investing at least 80% of
the fund's assets in municipal securities exempt from regular federal and
Arizona income taxes.
PORTFOLIO COMPOSITION BY CREDIT RATING
- --------------------------------------------------------------------------------
% OF FUND % OF FUND
INVESTMENTS INVESTMENTS
AS OF AS OF
5/31/05 11/30/04
- --------------------------------------------------------------------------------
AAA 70% 66%
- --------------------------------------------------------------------------------
AA 8% 15%
- --------------------------------------------------------------------------------
A 15% 14%
- --------------------------------------------------------------------------------
BBB 7% 5%
- --------------------------------------------------------------------------------
Ratings provided by independent research companies. These ratings are listed in
Standard & Poor's format even if they were provided by other sources.
TOP FIVE SECTORS AS OF MAY 31, 2005
- --------------------------------------------------------------------------------
% OF FUND
INVESTMENTS
- --------------------------------------------------------------------------------
General Obligation (GO) 29%
- --------------------------------------------------------------------------------
Prerefunded 16%
- --------------------------------------------------------------------------------
Water and Sewer Revenue 12%
- --------------------------------------------------------------------------------
Certificates of Participation
(COPs)/Leases 10%
- --------------------------------------------------------------------------------
Housing Revenue 10%
- --------------------------------------------------------------------------------
- ------
5
Arizona Municipal Bond - Schedule of Investments
MAY 31, 2005
Principal Amount Value
- --------------------------------------------------------------------------------
MUNICIPAL SECURITIES -- 100.1%
ARIZONA -- 91.7%
- --------------------------------------------------------------------------------
$1,000,000 Arizona Health Facilities Auth.
Rev., (Blood Systems
Incorporated), 5.00%, 4/1/21 $ 1,042,200
- --------------------------------------------------------------------------------
1,750,000 Arizona School Facilities Board
Rev., (State School
Improvement), 5.50%, 7/1/18 1,949,868
- --------------------------------------------------------------------------------
1,000,000 Arizona Student Loan
Acquisition Auth. Rev., Series
1999 A1, (Guaranteed Student
Loans), 5.65%, 5/1/14 1,085,750
- --------------------------------------------------------------------------------
1,880,000 Arizona Tourism & Sports Auth.
Tax Rev., (Baseball Training
Facilities), 5.00%, 7/1/13 2,001,335
- --------------------------------------------------------------------------------
1,910,000 Energy Management Services
LLC Rev., (Arizona State
University - Main Campus),
4.50%, 7/1/11 (MBIA) 2,045,686
- --------------------------------------------------------------------------------
1,000,000 Gilbert Water Resource
Municipal Property Corp. Rev.,
(Development Fee & Sub-Lien),
4.90%, 4/1/19 1,002,640
- --------------------------------------------------------------------------------
460,000 Glendale Industrial Development
Auth. Rev., Series 1998 A,
(Midwestern University), 5.375%,
5/15/08, Prerefunded
at 101% of Par(1) 496,041
- --------------------------------------------------------------------------------
540,000 Glendale Industrial Development
Auth. Rev., Series 1998 A,
(Midwestern University),
5.375%, 5/15/28 560,779
- --------------------------------------------------------------------------------
500,000 Glendale Industrial Development
Auth. Rev., Series 2001 A,
(Midwestern University),
5.75%, 5/15/21 547,535
- --------------------------------------------------------------------------------
1,125,000 Greater Arizona Development
Auth. Rev., Series 2004 A,
4.25%, 8/1/10 1,173,443
- --------------------------------------------------------------------------------
1,000,000 Greater Arizona Development
Auth. Rev., Series 2005 A,
5.00%, 8/1/22 (MBIA) 1,082,370
- --------------------------------------------------------------------------------
1,185,000 Greater Arizona Development
Auth. Rev., Series 2005 A,
5.00%, 8/1/23 (MBIA) 1,280,558
- --------------------------------------------------------------------------------
735,000 Maricopa County Elementary
School District No. 40 Glendale
GO, Series 2004 A, 2.00%,
7/1/05 (FSA) 734,500
- --------------------------------------------------------------------------------
1,615,000 Maricopa County Elementary
School District No. 79 GO,
Series 2000 A, (Litchfield
Elementary Projects of 1998),
4.55%, 7/1/07 (FSA) 1,669,619
- --------------------------------------------------------------------------------
1,000,000 Maricopa County Rev., (Sun
Health Corp.), 5.00%, 4/1/10 1,055,190
- --------------------------------------------------------------------------------
1,445,000 Maricopa County Unified High
School District No. 210 Phoenix
GO, 4.75%, 7/1/11 (FSA) 1,569,126
- --------------------------------------------------------------------------------
Principal Amount Value
- --------------------------------------------------------------------------------
$1,000,000 Maricopa County Unified School
District No. 1 Phoenix GO,
5.50%, 7/1/07 (MBIA) $ 1,061,900
- --------------------------------------------------------------------------------
450,000 Maricopa County Unified School
District No. 11 Peoria GO,
(School Improvement), 4.25%,
7/1/18 (Ambac) 462,825
- --------------------------------------------------------------------------------
1,040,000 Maricopa County Unified School
District No. 28 Kyrene GO,
Series 2001 B, 4.30%, 7/1/07
(MBIA)(2) 977,642
- --------------------------------------------------------------------------------
1,000,000 Maricopa County Unified School
District No. 48 Scottsdale GO,
6.60%, 7/1/12 1,205,840
- --------------------------------------------------------------------------------
1,955,000 Maricopa County Unified School
District No. 90 Saddle Mountain
GO, Series 2003 A, 5.00%,
7/1/10 2,074,977
- --------------------------------------------------------------------------------
1,265,000 Mohave County Community
College District COP, 5.75%,
3/1/14 (Ambac) 1,403,328
- --------------------------------------------------------------------------------
1,150,000 Mohave County Community
College District Rev., (State
Board of Directors), 6.00%,
3/1/20 (MBIA) 1,280,065
- --------------------------------------------------------------------------------
1,000,000 Phoenix Civic Improvement
Corp. Rev., (Senior Lien),
5.00%, 7/1/05 1,001,780
- --------------------------------------------------------------------------------
1,000,000 Phoenix Civic Improvement
Corp. Wastewater System Rev.,
(Junior Lien), 6.25%, 7/1/10,
Prerefunded at 101% of Par
(FGIC)(1) 1,155,870
- --------------------------------------------------------------------------------
1,000,000 Phoenix Civic Improvement
Corp. Water System Rev.,
(Junior Lien), 6.50%, 7/1/06 1,038,580
- --------------------------------------------------------------------------------
1,000,000 Phoenix Civic Improvement
Corp. Water System Rev.,
(Junior Lien), 5.50%, 7/1/19
(FGIC) 1,119,490
- --------------------------------------------------------------------------------
1,070,000 Phoenix GO, Series 1995 A,
6.25%, 7/1/17 1,335,660
- --------------------------------------------------------------------------------
1,000,000 Phoenix GO, Series 1995 B,
5.25%, 7/1/06 1,044,960
- --------------------------------------------------------------------------------
515,000 Phoenix Industrial Development
Auth. Single Family Mortgage
Rev., Series 1998 A, 6.60%,
12/1/29 (GNMA/FNMA/FHLMC) 522,035
- --------------------------------------------------------------------------------
1,710,000 Pima County Metropolitan
Domestic Water Improvement
District Rev., 5.25%, 7/1/18
(Ambac) 1,964,653
- --------------------------------------------------------------------------------
1,800,000 Pima County Metropolitan
Domestic Water Improvement
District Rev., 5.25%, 7/1/19
(Ambac) 2,072,988
- --------------------------------------------------------------------------------
1,000,000 Pima County Unified School
District No. 10 GO, 5.00%,
7/1/10 (FSA)(3) 1,089,430
- --------------------------------------------------------------------------------
See Notes to Financial Statements. (continued)
- ------
6
Arizona Municipal Bond - Schedule of Investments
MAY 31, 2005
Principal Amount Value
- --------------------------------------------------------------------------------
$1,550,000 Pima County Unified School
District No. 10 GO, Series
1995 B, (Amphitheater), 5.05%,
7/1/05 (MBIA) $ 1,568,368
- --------------------------------------------------------------------------------
1,000,000 Pima County Unified School
District No. 10 GO, Series
1995 B, (Amphitheater),
7.00%, 7/1/05 (MBIA) 1,003,450
- --------------------------------------------------------------------------------
1,000,000 Pima County Unified School
District No. 12 Sunnyside GO,
5.50%, 7/1/05 (MBIA) 1,012,220
- --------------------------------------------------------------------------------
1,125,000 Pima County Unified School
District No. 6 Marana GO,
5.50%, 7/1/15 (FGIC) 1,247,501
- --------------------------------------------------------------------------------
820,000 Pinal County COP, 4.75%,
6/1/13 (Ambac) 882,714
- --------------------------------------------------------------------------------
1,000,000 Pinal County COP, 5.00%,
12/1/26 1,041,050
- --------------------------------------------------------------------------------
1,100,000 Pinal County Unified School
District No. 43 Apache Junction
GO, Series 2005 A, (School
Improvement), 5.00%, 7/1/23
(MBIA) 1,190,035
- --------------------------------------------------------------------------------
1,600,000 Scottsdale GO, 6.25%, 7/1/09,
Prerefunded at 100% of Par(1) 1,798,064
- --------------------------------------------------------------------------------
1,000,000 Sedona COP, 5.75%, 7/1/09 1,111,530
- --------------------------------------------------------------------------------
1,645,000 University of Arizona COP,
Series 2002 A, 5.50%, 6/1/17
(Ambac)(4) 1,837,416
- --------------------------------------------------------------------------------
500,000 University of Arizona COP,
Series 2005 B, 5.00%, 6/1/24
(Ambac) 531,760
- --------------------------------------------------------------------------------
53,332,771
- --------------------------------------------------------------------------------
Principal Amount Value
- --------------------------------------------------------------------------------
PUERTO RICO -- 8.4%
- --------------------------------------------------------------------------------
$2,750,000 Commonwealth of Puerto Rico
Tax & Rev. Anticipation Notes,
3.00%, 7/29/05 $ 2,749,010
- --------------------------------------------------------------------------------
2,075,000 Puerto Rico Highway &
Transportation Auth. Rev.,
Series 2003 AA, 5.00%, 7/1/06(4) 2,118,637
- --------------------------------------------------------------------------------
4,867,647
- --------------------------------------------------------------------------------
TOTAL MUNICIPAL SECURITIES
(Cost $55,595,477) 58,200,418
- --------------------------------------------------------------------------------
SHORT-TERM MUNICIPAL SECURITIES -- 0.1%
ARIZONA -- 0.1%
- --------------------------------------------------------------------------------
75,000 Coconino County Pollution
Control Corp. Rev., (Arizona
Public Service Co.), VRDN,
3.02%, 6/1/05 (LOC: KBC
Bank N.V.)
(Cost $75,000) 75,000
- --------------------------------------------------------------------------------
TEMPORARY CASH INVESTMENTS(5)
19,000 Federated Arizona Municipal
Cash Trust
(Cost $19,000) 19,000
- --------------------------------------------------------------------------------
TOTAL INVESTMENT SECURITIES -- 100.2%
(Cost $55,689,477) 58,294,418
- --------------------------------------------------------------------------------
OTHER ASSETS AND LIABILITIES -- (0.2)% (99,876)
- --------------------------------------------------------------------------------
TOTAL NET ASSETS -- 100.0% $58,194,542
================================================================================
FUTURES CONTRACTS*
Expiration Underlying Face Unrealized
Contracts Sold Date Amount at Value Gain (Loss)
- --------------------------------------------------------------------------------
20 U.S. Treasury
10-Year Notes September 2005 $2,265,313 $(10,320)
================================
*FUTURES CONTRACTS typically are based on an index or specific securities and
tend to track the performance of the index or specific securities while
remaining very liquid (easy to buy and sell). By selling futures, the fund
hedges its investments against price fluctuations.
NOTES TO SCHEDULE OF INVESTMENTS
Ambac = Ambac Assurance Corporation
COP = Certificates of Participation
FGIC = Financial Guaranty Insurance Co.
FHLMC = Federal Home Loan Mortgage Corporation
FNMA = Federal National Mortgage Association
FSA = Financial Security Assurance, Inc.
GNMA = Government National Mortgage Association
GO = General Obligation
LOC = Letter of Credit
MBIA = MBIA Insurance Corporation
VRDN = Variable Rate Demand Note. Interest reset date is indicated. Rate shown
is effective May 31, 2005.
XLCA = XL Capital Ltd.
(1) Escrowed to maturity in U.S. government securities or state and local
government securities.
(2) Security is a zero-coupon municipal bond. The rate indicated is the yield to
maturity at purchase. Zero-coupon securities are issued at a substantial
discount from their value at maturity.
(3) When-issued security.
(4) Security, or a portion thereof, has been segregated for a when-issued
security and/or futures contract.
(5) Category is less than 0.05% of net assets.
See Notes to Financial Statements.
- ------
7
Florida Municipal Bond - Performance
TOTAL RETURNS AS OF MAY 31, 2005
-----------------------------
AVERAGE ANNUAL RETURNS
- --------------------------------------------------------------------------------
SINCE INCEPTION
1 YEAR 5 YEARS 10 YEARS INCEPTION DATE
- --------------------------------------------------------------------------------
INVESTOR CLASS 4.88% 5.95% 5.39% 5.66% 4/11/94
- --------------------------------------------------------------------------------
LEHMAN BROTHERS
MUNICIPAL 5-YEAR
GO INDEX 4.47% 5.83% 5.23% 5.45%(1) --
- --------------------------------------------------------------------------------
LIPPER FLORIDA
INTERMEDIATE
MUNICIPAL DEBT FUNDS
AVERAGE RETURNS(2) 4.30% 5.18% 4.41% 4.68%(3) --
- --------------------------------------------------------------------------------
Investor Class's
Lipper Ranking
as of 5/31/05(2) 5 of 22 1 of 16 1 of 11 1 of 10(3) --
- --------------------------------------------------------------------------------
Investor Class's
Lipper Ranking
as of 6/30/05(2) 5 of 22 1 of 16 1 of 11 1 of 10(3) --
- --------------------------------------------------------------------------------
A Class 2/27/04
No sales charge* 4.62% -- -- 1.10%
With sales charge* -0.06% -- -- -2.52%
- --------------------------------------------------------------------------------
B Class 2/27/04
No sales charge* 3.83% -- -- 0.34%
With sales charge* -0.17% -- -- -2.86%
- --------------------------------------------------------------------------------
C Class 3.84% -- -- 0.34% 2/27/04
- --------------------------------------------------------------------------------
*Sales charges include initial sales charges and contingent deferred sales
charges (CDSCs), as applicable. A Class shares have a 4.50% maximum initial
sales charge for fixed income funds and may be subject to a maximum CDSC of
1.00%. B Class shares redeemed within six years of purchase are subject to a
CDSC that declines from 5.00% during the first year after purchase to 0.00% the
sixth year after purchase. C Class shares redeemed within 12 months of purchase
are subject to a maximum CDSC of 1.00%. Please see the Share Class Information
pages for more about the applicable sales charges for each share class. The SEC
requires that mutual funds provide performance information net of maximum sales
charges in all cases where charges could be applied.
(1) Since 3/31/94, the date nearest the fund's inception for which data are
available.
(2) (c)2005 Reuters. All rights reserved. Any copying, republication or
redistribution of Lipper content, including by caching, framing or similar
means, is expressly prohibited without the prior written consent of Lipper.
Lipper shall not be liable for any errors or delays in the content, or for
any actions taken in reliance thereon.
Lipper Fund Performance -- Performance data is total return, and is
preliminary and subject to revision.
Lipper Rankings -- Rankings are based only on the universe shown. This
listing might not represent the complete universe of funds tracked by Lipper
Inc.
The data contained herein has been obtained from company reports, financial
reporting services, periodicals and other resources believed to be reliable.
Although carefully verified, data on compilations is not guaranteed by
Lipper Inc. - A Reuters Company and may be incomplete. No offer or
solicitations to buy or sell any of the securities herein is being made by
Lipper.
(3) Since 4/14/94, the date nearest the fund's inception for which data are
available.
(continued)
- ------
8
Florida Municipal Bond - Performance
GROWTH OF $10,000 OVER 10 YEARS
$10,000 investment made May 31, 1995
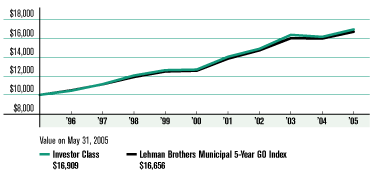
ONE-YEAR RETURNS OVER 10 YEARS Periods ended May 31 - ----------------------------------------------------------------------------------------------- 1996 1997 1998 1999 2000 2001 2002 2003 2004 2005 - ----------------------------------------------------------------------------------------------- Investor Class 4.34% 6.63% 8.20% 4.71% 0.49% 10.70% 5.98% 9.90% -1.30% 4.88% - ----------------------------------------------------------------------------------------------- Lehman Brothers Municipal 5-Year GO Index 4.74% 6.08% 6.95% 4.90% 0.65% 10.17% 6.33% 8.72% -0.22% 4.47% - ----------------------------------------------------------------------------------------------- Data presented reflect past performance. Past performance is no guarantee of future results. Current performance may be higher or lower than the performance shown. Investment return and principal value will fluctuate, and redemption value may be more or less than original cost. To obtain performance data current to the most recent month end, please call 1-800-345-2021 or visit americancentury.com. As interest rates rise, bond values will decline. Investment income may be subject to certain state and local taxes and, depending on your tax status, the federal alternative minimum tax (AMT). Capital gains are not exempt from state and federal income tax. Unless otherwise indicated, performance reflects Investor Class shares; performance for other share classes will vary due to differences in fee structure. For information about other share classes available, please consult the prospectus. Data assumes reinvestment of dividends and capital gains, and none of the charts reflect the deduction of taxes that a shareholder would pay on fund distributions or the redemption of fund shares. Returns for the indices are provided for comparison. The fund's total returns include operating expenses (such as transaction costs and management fees) that reduce returns, while the total returns of the indices do not. - ------ 9 Florida Municipal Bond - Portfolio Commentary PORTFOLIO MANAGER: KENNETH SALINGER PERFORMANCE SUMMARY Florida Municipal Bond returned 4.88%* for the fiscal year ended May 31, 2005, reflecting a respectable performance by municipal bonds that occurred in spite of eight consecutive short-term interest rate increases by the Federal Reserve. By comparison, the average return of Lipper's 22 Florida Intermediate Municipal Debt Funds was 4.30%. (Please see pages 8 and 9.) From a long-term perspective, Florida Municipal Bond's five- and 10-year returns ranked the fund as the top performer among its Lipper group. YIELD SUMMARY & PERSPECTIVE Florida Municipal Bond's key investment objective is to seek safety of principal and high current income that is exempt from federal income tax. Along those lines, the fund's 30-day SEC yield was 3.06% as of May 31, 2005, compared with the Lipper average 30-day SEC yield of 2.43%. On a tax-equivalent basis, Florida Municipal Bond's 30-day SEC yield equated to 4.08% for investors in a 25% federal tax bracket, while equating to 4.71% for investors in a 35% bracket. (Please see the table above.) ECONOMIC REVIEW The U.S. economy grew at a moderate rate during the fiscal year as energy prices, inflation, and short-term interest rates rose. The annualized real rate of GDP growth ranged from 3.3% to 4.0%, while crude oil averaged $47 a barrel and jumped as high as $57. The 12-month percentage change of "core" CPI (excluding food and energy) climbed from 1.7% in May 2004 to 2.4% in February 2005, its fastest growth rate since August 2002. To keep inflation from escalating, the Federal Reserve raised its target rate, in eight quarter-point increments, from 1% in June 2004 to 3% in May 2005. BROAD BOND MARKET REVIEW Though core inflation rose, it remained at relatively low levels, and stopped accelerating after the first quarter of 2005. And while economic growth was moderate, it declined after reaching 4.0% in the third quarter of 2004. That helped longer-term interest rates and bond PORTFOLIO AT A GLANCE - -------------------------------------------------------------------------------- AS OF AS OF 5/31/05 5/31/04 - -------------------------------------------------------------------------------- Weighted Average Maturity 8.8 yrs 7.4 yrs - -------------------------------------------------------------------------------- Average Duration (Modified) 4.0 yrs 4.5 yrs - -------------------------------------------------------------------------------- YIELDS AS OF MAY 31, 2005 - -------------------------------------------------------------------------------- 30-DAY SEC YIELD - -------------------------------------------------------------------------------- Investor Class 3.06% - -------------------------------------------------------------------------------- A Class 2.69% - -------------------------------------------------------------------------------- B Class 2.06% - -------------------------------------------------------------------------------- C Class 2.06% - -------------------------------------------------------------------------------- INVESTOR CLASS 30-DAY TAX-EQUIVALENT YIELDS(1) - -------------------------------------------------------------------------------- 25.00% Tax Bracket 4.08% - -------------------------------------------------------------------------------- 28.00% Tax Bracket 4.25% - -------------------------------------------------------------------------------- 33.00% Tax Bracket 4.57% - -------------------------------------------------------------------------------- 35.00% Tax Bracket 4.71% - -------------------------------------------------------------------------------- (1) The tax brackets indicated are for federal taxes only. Actual tax-equivalent yields may be lower, if alternative minimum tax is applicable. *All fund returns and yields referenced in this commentary are for Investor Class shares. (continued) - ------ 10 Florida Municipal Bond - Portfolio Commentary yields fall, and bond prices rise. Lower longer-maturity yields, combined with higher yields for shorter-maturity securities (which rose with the Fed's rate hikes) created a "flatter" Treasury yield curve and helped longer-maturity/duration notes and bonds generally outperform shorter-maturity/duration notes. MUNICIPAL MARKET REVIEW The Lehman Brothers Municipal Bond Index returned 7.96% for the fiscal year, outperforming its taxable counterpart, the Lehman Brothers U.S. Aggregate. The municipal yield curve also flattened, causing long-term municipal bonds to outperform shorter-term notes. But the municipal yield curve did not flatten as much as the Treasury curve, making municipal bond yields attractive compared with Treasury yields. In fact, as of May 31, 2005, 30-year AAA-rated general obligation municipal bonds yielded more than 30-year Treasury bonds! Credit quality also affected performance--lower-quality, higher-yielding bonds tended to outperform investment-grade debt. PORTFOLIO POSITIONING & STRATEGIES On the fund-specific front, we continued to focus on municipal bonds rated AAA and AA (please see the table at bottom left). But we also maintained the portfolio's conservatively small slice of lower-rated investment-grade bonds. As a tradeoff for their slightly increased credit risk, these bonds tend to offer higher yields than like-maturity securities with better credit ratings. In addition, we decreased Florida Municipal Bond's duration--a widely used gauge of interest rate sensitivity--from 4.5 years at the end of May 2004, to 4.0 years at the end of May 2005. Unfortunately, with municipal bonds performing respectably in spite of the previously described economic and bond market backdrops, that strategy didn't work out as well as we had hoped. OUR COMMITMENT We remain committed to seeking safety of principal while providing a high level of federal tax-exempt current income by investing at least 80% of the fund's assets in municipal securities that are exempt from Florida's intangibles tax. PORTFOLIO COMPOSITION BY CREDIT RATING - -------------------------------------------------------------------------------- % OF FUND % OF FUND INVESTMENTS INVESTMENTS AS OF AS OF 5/31/05 11/30/04 - -------------------------------------------------------------------------------- AAA 87% 79% - -------------------------------------------------------------------------------- AA 1% 5% - -------------------------------------------------------------------------------- A -- 5% - -------------------------------------------------------------------------------- BBB 12% 11% - -------------------------------------------------------------------------------- Ratings provided by independent research companies. These ratings are listed in Standard & Poor's format even if they were provided by other sources. TOP FIVE SECTORS AS OF MAY 31, 2005 - -------------------------------------------------------------------------------- % OF FUND INVESTMENTS - -------------------------------------------------------------------------------- Water and Sewer Revenue 16% - -------------------------------------------------------------------------------- Prerefunded 14% - -------------------------------------------------------------------------------- Certificates of Participation (COPs)/Leases 12% - -------------------------------------------------------------------------------- Transportation Revenue 10% - -------------------------------------------------------------------------------- General Obligation (GO) 8% - -------------------------------------------------------------------------------- - ------ 11 Florida Municipal Bond - Schedule of Investments MAY 31, 2005 Principal Amount Value - -------------------------------------------------------------------------------- MUNICIPAL SECURITIES -- 98.6% FLORIDA -- 95.3% - -------------------------------------------------------------------------------- $1,110,000 Broward County Airport Systems Rev., (Passenger Facility), (Conventional Lien H-1), 5.25%, 10/1/12 (Ambac) $ 1,178,820 - -------------------------------------------------------------------------------- 400,000 Broward County Educational Facilities Auth. Rev., Series 2004 B, (Nova Southeastern), 5.00%, 4/1/14 423,240 - -------------------------------------------------------------------------------- 500,000 Broward County Educational Facilities Auth. Rev., Series 2004 B, (Nova Southeastern), 5.50%, 4/1/15 543,680 - -------------------------------------------------------------------------------- 525,000 Broward County Educational Facilities Auth. Rev., Series 2004 B, (Nova Southeastern), 5.50%, 4/1/16 568,055 - -------------------------------------------------------------------------------- 500,000 Broward County School Board COP, Series 2002 B, 5.375%, 7/1/11 (FSA) 559,230 - -------------------------------------------------------------------------------- 1,230,000 Callaway/Bay County Wastewater System Rev., 5.00%, 9/1/23 (MBIA) 1,321,783 - -------------------------------------------------------------------------------- 1,475,000 Collier County School Board COP, 5.50%, 2/15/12 (FSA) 1,668,977 - -------------------------------------------------------------------------------- 250,000 Dade County Aviation Rev., Series 1995 E, 5.50%, 10/1/10 (Ambac) 256,978 - -------------------------------------------------------------------------------- 1,150,000 Duval County School Board COP, 5.75%, 7/1/16 (FSA) 1,260,228 - -------------------------------------------------------------------------------- 1,010,000 Emerald Coast Utilities System Auth. Rev., 5.00%, 1/1/25 (FGIC) 1,079,326 - -------------------------------------------------------------------------------- 100,000 Escambia County Housing Finance Auth. Single Family Mortgage Rev., Series 1998 A, (Multi-County Program), 4.80%, 4/1/06 (GNMA/FNMA) 101,274 - -------------------------------------------------------------------------------- 150,000 Escambia County Housing Finance Auth. Single Family Mortgage Rev., Series 1998 A, (Multi-County Program), 4.85%, 4/1/07 (GNMA/FNMA) 153,987 - -------------------------------------------------------------------------------- 1,050,000 Florida Board of Education Capital Outlay GO, Series 1995 C, 5.50%, 6/1/05 (MBIA) 1,060,500 - -------------------------------------------------------------------------------- 2,320,000 Florida Division of Bond Finance GO, Series 1998 B, (Environmental Protection - Preservation), 5.25%, 7/1/10 (FSA)(1) 2,486,273 - -------------------------------------------------------------------------------- 450,000 Florida Housing Finance Agency Rev., Series 1995 E, (Williamsburg Village Apartments), 5.60%, 12/1/07 (Ambac) 462,915 - -------------------------------------------------------------------------------- Principal Amount Value - -------------------------------------------------------------------------------- $ 350,000 Florida Housing Finance Corp. Rev., Series 1999-2, (Homeowner Mortgage), 4.60%, 1/1/21 (FSA) $ 350,721 - -------------------------------------------------------------------------------- 1,000,000 Florida Municipal Loan Council GO, Series 2002 C, 5.25%, 11/1/21 (MBIA) 1,097,420 - -------------------------------------------------------------------------------- 350,000 Gainesville Utilities System Rev., Series 1996 A, 5.75%, 10/1/09 387,996 - -------------------------------------------------------------------------------- 675,000 Greater Orlando Aviation Auth. Rev., Series 1999 A, 5.25%, 10/1/09 (FGIC) 726,725 - -------------------------------------------------------------------------------- 610,000 Hollywood Community Redevelopment Agency Rev., (Beach), 4.00%, 3/1/06 612,782 - -------------------------------------------------------------------------------- 635,000 Hollywood Community Redevelopment Agency Rev., (Beach), 4.50%, 3/1/07 645,687 - -------------------------------------------------------------------------------- 690,000 Hollywood Community Redevelopment Agency Rev., (Beach), 5.00%, 3/1/08 715,351 - -------------------------------------------------------------------------------- 1,235,000 Indian River County Rev., (Spring Training Facility), 5.25%, 4/1/15 (FGIC) 1,359,883 - -------------------------------------------------------------------------------- 1,565,000 Indian Trace Development District Rev., (Water Management Special Benefit), 5.00%, 5/1/24 (MBIA) 1,705,161 - -------------------------------------------------------------------------------- 295,000 Julington Creek Plantation Community Development District Assessment Rev., 2.75%, 5/1/06 (MBIA) 294,646 - -------------------------------------------------------------------------------- 295,000 Julington Creek Plantation Community Development District Assessment Rev., 3.10%, 5/1/07 (MBIA) 295,826 - -------------------------------------------------------------------------------- 330,000 Julington Creek Plantation Community Development District Assessment Rev., 3.65%, 5/1/09 (MBIA) 336,947 - -------------------------------------------------------------------------------- 350,000 Julington Creek Plantation Community Development District Assessment Rev., 3.85%, 5/1/10 (MBIA) 360,507 - -------------------------------------------------------------------------------- 625,000 Julington Creek Plantation Community Development District Assessment Rev., 4.00%, 5/1/11 (MBIA) 649,075 - -------------------------------------------------------------------------------- 850,000 Lee County Industrial Development Health Care Facilities Auth. Rev., Series 1999 A, (Shell Point Village), 5.50%, 11/15/09 898,918 - -------------------------------------------------------------------------------- 1,325,000 Martin County Health Facilities Auth. Rev., Series 2002 A, (Martin Memorial Medical Center), 4.25%, 11/15/07 1,346,452 - -------------------------------------------------------------------------------- 1,000,000 Miami Beach Stormwater Rev., 5.75%, 9/1/17 (FGIC) 1,126,350 - -------------------------------------------------------------------------------- See Notes to Financial Statements. (continued) - ------ 12 Florida Municipal Bond - Schedule of Investments MAY 31, 2005 Principal Amount Value - -------------------------------------------------------------------------------- $1,910,000 Miami Beach Water & Sewer Rev., 5.625%, 9/1/16 (Ambac) $ 2,139,906 - -------------------------------------------------------------------------------- 650,000 Miami Parking Facilities Rev., 5.25%, 10/1/15 (MBIA) 734,936 - -------------------------------------------------------------------------------- 1,000,000 Miami-Dade County School Board COP, Series 2001 C, 5.50%, 10/1/11, Prerefunded at 100% of Par (FSA)(2) 1,129,330 - -------------------------------------------------------------------------------- 1,000,000 Miami-Dade County School Board COP, Series 2001 C, 5.50%, 10/1/11, Prerefunded at 100% of Par (FSA)(2) 1,129,330 - -------------------------------------------------------------------------------- 1,000,000 Ocala Rev., Series 2005 B, 5.25%, 10/1/25 (FGIC) 1,110,710 - -------------------------------------------------------------------------------- 1,875,000 Orange County School Board COP, Series 2002 A, 5.50%, 8/1/19 (MBIA)(1) 2,096,288 - -------------------------------------------------------------------------------- 450,000 Orlando and Orange County Expressway Auth. Rev., 6.50%, 7/1/11 (FGIC) 530,258 - -------------------------------------------------------------------------------- 1,000,000 Palm Beach County Airport Systems Rev., 4.00%, 10/1/06 (MBIA) 1,014,190 - -------------------------------------------------------------------------------- 1,000,000 Palm Beach County Airport Systems Rev., 5.75%, 10/1/14 (MBIA) 1,167,800 - -------------------------------------------------------------------------------- 1,000,000 Palm Beach County School Board COP, Series 2002 A, 5.375%, 8/1/12 (FSA) 1,131,560 - -------------------------------------------------------------------------------- 1,175,000 Palm Beach County School Board COP, Series 2002 D, 5.25%, 8/1/20, Prerefunded at 100% of Par (FSA)(2) 1,320,277 - -------------------------------------------------------------------------------- 2,000,000 Pasco County Solid Waste Disposal & Resource Recovery System Rev., 6.00%, 4/1/10 (Ambac)(1) 2,208,739 - -------------------------------------------------------------------------------- 445,000 Pensacola Airport Rev., Series 1997 B, 5.40%, 10/1/07 (MBIA) 458,590 - -------------------------------------------------------------------------------- 300,000 Plantation Health Facilities Auth. Rev., (Covenant Village of Florida Inc.), 4.55%, 12/1/05 301,773 - -------------------------------------------------------------------------------- 300,000 Plantation Health Facilities Auth. Rev., (Covenant Village of Florida Inc.), 4.70%, 12/1/07 308,127 - -------------------------------------------------------------------------------- 1,000,000 Polk County Finance Auth. Multifamily Housing Rev., Series 1997 A, (Winter Oaks Apartments), 5.25%, 7/1/22 (FNMA) 1,011,670 - -------------------------------------------------------------------------------- 1,015,000 St. Lucie County Public Improvement COP, Series 2000 A, (800 MHZ Radio System), 5.50%, 4/1/10 (MBIA) 1,125,686 - -------------------------------------------------------------------------------- Principal Amount Value - -------------------------------------------------------------------------------- $1,000,000 Sumter County School Board COP, 5.50%, 1/1/21 (MBIA) $ 1,107,290 - -------------------------------------------------------------------------------- 1,000,000 Sunrise Utility System Rev., 5.20%, 10/1/22 (Ambac) 1,135,110 - -------------------------------------------------------------------------------- 1,000,000 Tampa Bay Water Utility System Rev., Series 1998 B, 5.125%, 10/1/08 (FGIC) 1,077,760 - -------------------------------------------------------------------------------- 400,000 Tampa Guaranteed Entitlement Rev., 6.00%, 10/1/18 (Ambac) 470,264 - -------------------------------------------------------------------------------- 1,000,000 Tampa Water & Sewer Rev., 6.00%, 10/1/17 (FSA) 1,217,720 - -------------------------------------------------------------------------------- 910,000 Village Center Community Development District Recreational Rev., Series 2001 A, 3.75%, 11/1/05 (MBIA) 913,622 - -------------------------------------------------------------------------------- 50,876,649 - -------------------------------------------------------------------------------- PUERTO RICO -- 2.3% - -------------------------------------------------------------------------------- 1,250,000 Commonwealth of Puerto Rico Tax & Rev. Anticipation Notes, 3.00%, 7/29/05 1,249,550 - -------------------------------------------------------------------------------- UTAH -- 1.0% - -------------------------------------------------------------------------------- 500,000 Nebo School District GO, Series 2005 A, 4.25%, 7/1/15 525,329 - -------------------------------------------------------------------------------- TOTAL MUNICIPAL SECURITIES (Cost $50,042,920) 52,651,528 - -------------------------------------------------------------------------------- SHORT-TERM MUNICIPAL SECURITIES -- 0.4% FLORIDA -- 0.4% - -------------------------------------------------------------------------------- 200,000 Broward County Health Facilities Auth. Rev., (John Knox Village), VRDN, 3.10%, 6/1/05 (RADIAN) (SBBPA: LaSalle Bank N.A.) (Cost $200,000) 200,000 - -------------------------------------------------------------------------------- TEMPORARY CASH INVESTMENTS(3) 13,000 Federated Florida Municipal Cash Trust (Cost $13,000) 13,000 - -------------------------------------------------------------------------------- TOTAL INVESTMENT SECURITIES -- 99.0% (Cost $50,255,920) 52,864,528 - -------------------------------------------------------------------------------- OTHER ASSETS AND LIABILITIES -- 1.0% 538,516 - -------------------------------------------------------------------------------- TOTAL NET ASSETS -- 100.0% $53,403,044 ================================================================================ See Notes to Financial Statements. (continued) - ------ 13 Florida Municipal Bond - Schedule of Investments MAY 31, 2005 FUTURES CONTRACTS* Expiration Underlying Face Unrealized Contracts Sold Date Amount at Value Gain (Loss) - -------------------------------------------------------------------------------- 50 U.S. Treasury 10-Year Notes September 2005 $5,663,281 $(25,800) ================================ *FUTURES CONTRACTS typically are based on an index or specific securities and tend to track the performance of the index or specific securities while remaining very liquid (easy to buy and sell). By selling futures, the fund hedges its investments against price fluctuations. NOTES TO SCHEDULE OF INVESTMENTS Ambac = Ambac Assurance Corporation COP = Certificates of Participation FGIC = Financial Guaranty Insurance Co. FNMA = Federal National Mortgage Association FSA = Financial Security Assurance, Inc. GNMA = Government National Mortgage Association GO = General Obligation MBIA = MBIA Insurance Corporation RADIAN = Radian Asset Assurance, Inc. SBBPA = Standby Bond Purchase Agreement VRDN = Variable Rate Demand Note. Interest reset date is indicated. Rate shown is effective May 31, 2005. (1) Security, or a portion thereof, has been segregated for futures contracts. (2) Escrowed to maturity in U.S. government securities or state and local government securities. (3) Category is less than 0.05% of net assets. See Notes to Financial Statements. - ------ 14 High-Yield Municipal - Performance TOTAL RETURNS AS OF MAY 31, 2005 ---------------------- AVERAGE ANNUAL RETURNS - -------------------------------------------------------------------------------- SINCE INCEPTION 1 YEAR 5 YEARS INCEPTION(1) DATE - -------------------------------------------------------------------------------- INVESTOR CLASS 9.84% 7.91% 6.18% 3/31/98 - -------------------------------------------------------------------------------- LEHMAN BROTHERS LONG-TERM MUNICIPAL BOND INDEX 13.25% 9.22% 6.51% -- - -------------------------------------------------------------------------------- LIPPER HIGH-YIELD MUNICIPAL DEBT FUNDS AVERAGE RETURNS(2) 9.68% 6.64% 4.34% -- - -------------------------------------------------------------------------------- Investor Class's Lipper Ranking as of 5/31/05(2) 36 of 78 10 of 67 4 of 48 -- - -------------------------------------------------------------------------------- Investor Class's Lipper Ranking as of 6/30/05(2) 46 of 78 10 of 67 4 of 48 -- - -------------------------------------------------------------------------------- A Class 1/31/03 No sales charge* 9.56% -- 6.84% With sales charge* 4.66% -- 4.77% - -------------------------------------------------------------------------------- B Class 1/31/03 No sales charge* 8.75% -- 6.10% With sales charge* 4.75% -- 4.90% - -------------------------------------------------------------------------------- C Class 8.74% -- 5.97% 7/24/02 - -------------------------------------------------------------------------------- *Sales charges include initial sales charges and contingent deferred sales charges (CDSCs), as applicable. A Class shares have a 4.50% maximum initial sales charge for fixed income funds and may be subject to a maximum CDSC of 1.00%. B Class shares redeemed within six years of purchase are subject to a CDSC that declines from 5.00% during the first year after purchase to 0.00% the sixth year after purchase. C Class shares redeemed within 12 months of purchase are subject to a maximum CDSC of 1.00%. Please see the Share Class Information pages for more about the applicable sales charges for each share class. The SEC requires that mutual funds provide performance information net of maximum sales charges in all cases where charges could be applied. (1) Investor Class returns and rankings would have been lower if management fees had not been waived from 3/31/98 to 4/30/99. Beginning on 5/1/99, management fees were phased in at a rate of 0.10% each month until 10/31/99. (2) (c)2005 Reuters. All rights reserved. Any copying, republication or redistribution of Lipper content, including by caching, framing or similar means, is expressly prohibited without the prior written consent of Lipper. Lipper shall not be liable for any errors or delays in the content, or for any actions taken in reliance thereon. Lipper Fund Performance -- Performance data is total return, and is preliminary and subject to revision. Lipper Rankings -- Rankings are based only on the universe shown. This listing might not represent the complete universe of funds tracked by Lipper Inc. The data contained herein has been obtained from company reports, financial reporting services, periodicals and other resources believed to be reliable. Although carefully verified, data on compilations is not guaranteed by Lipper Inc. - A Reuters Company and may be incomplete. No offer or solicitations to buy or sell any of the securities herein is being made by Lipper. Data presented reflect past performance. Past performance is no guarantee of future results. Current performance may be higher or lower than the performance shown. Investment return and principal value will fluctuate, and redemption value may be more or less than original cost. To obtain performance data current to the most recent month end, please call 1-800-345-2021 or visit americancentury.com. As interest rates rise, bond values will decline. In addition, the lower rated securities in which the fund invests are subject to greater credit risk, default risk, and liquidity risk. Investment income may be subject to certain state and local taxes and, depending on your tax status, the federal alternative minimum tax (AMT). Capital gains are not exempt from state and federal income tax. Unless otherwise indicated, performance reflects Investor Class shares; performance for other share classes will vary due to differences in fee structure. For information about other share classes available, please consult the prospectus. Data assumes reinvestment of dividends and capital gains, and none of the charts reflect the deduction of taxes that a shareholder would pay on fund distributions or the redemption of fund shares. Returns for the indices are provided for comparison. The fund's total returns include operating expenses (such as transaction costs and management fees) that reduce returns, while the total returns of the indices do not. (continued) - ------ 15 High-Yield Municipal - Performance GROWTH OF $10,000 OVER LIFE OF CLASS $10,000 investment made March 31, 1998
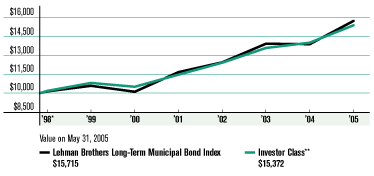
ONE-YEAR RETURNS OVER LIFE OF CLASS Periods ended May 31 - -------------------------------------------------------------------------------- 1998* 1999 2000 2001 2002 2003 2004 2005 - -------------------------------------------------------------------------------- Investor Class 1.81%** 6.18%** -2.81% 9.13% 8.25% 9.40% 3.07% 9.84% - -------------------------------------------------------------------------------- Lehman Brothers Long-Term Municipal Bond Index 1.41% 4.35% -4.45% 15.38% 6.64% 11.84% -0.26% 13.25% - -------------------------------------------------------------------------------- * From 3/31/98 (the class's inception date) to 5/31/98. Not annualized. **Investor Class returns would have been lower if management fees had not been waived from 3/31/98 to 4/30/99. Beginning on 5/1/99, management fees were phased in at a rate of 0.10% each month until 10/31/99. Data presented reflect past performance. Past performance is no guarantee of future results. Current performance may be higher or lower than the performance shown. Investment return and principal value will fluctuate, and redemption value may be more or less than original cost. To obtain performance data current to the most recent month end, please call 1-800-345-2021 or visit americancentury.com. As interest rates rise, bond values will decline. In addition, the lower rated securities in which the fund invests are subject to greater credit risk, default risk, and liquidity risk. Investment income may be subject to certain state and local taxes and, depending on your tax status, the federal alternative minimum tax (AMT). Capital gains are not exempt from state and federal income tax. Unless otherwise indicated, performance reflects Investor Class shares; performance for other share classes will vary due to differences in fee structure. For information about other share classes available, please consult the prospectus. Data assumes reinvestment of dividends and capital gains, and none of the charts reflect the deduction of taxes that a shareholder would pay on fund distributions or the redemption of fund shares. Returns for the indices are provided for comparison. The fund's total returns include operating expenses (such as transaction costs and management fees) that reduce returns, while the total returns of the indices do not. - ------ 16 High-Yield Municipal - Portfolio Commentary PORTFOLIO MANAGER: STEVEN PERMUT PERFORMANCE SUMMARY High-Yield Municipal returned 9.84%* for the fiscal year ended May 31, 2005, its highest fiscal-year performance since the fund's inception. The fund and comparative indices performed well as bonds rallied and yields fell despite eight short-term interest rate increases by the Federal Reserve. Municipal investments with longer maturities and durations generally outperformed those with shorter (outlined below), which explains why the fund trailed the Lehman Brothers Long-Term Municipal Bond Index (see page 15). ECONOMIC REVIEW The U.S. economy grew at a moderate rate during the fiscal year as energy prices, inflation, and short-term interest rates rose. The annualized real rate of GDP growth ranged from 3.3% to 4.0%, while crude oil averaged $47 a barrel and jumped as high as $57. The 12-month percentage change of "core" CPI (excluding food and energy) climbed from 1.7% in May 2004 to 2.4% in February 2005, its fastest growth rate since August 2002. To keep inflation from escalating, the Federal Reserve raised its target rate, in eight quarter-point increments, from 1% in June 2004 to 3% in May 2005. BROAD BOND MARKET REVIEW Though core inflation rose, it remained at relatively low levels, and stopped accelerating after the first quarter of 2005. And while economic growth was moderate, it declined after reaching 4.0% in the third quarter of 2004. That helped longer-term interest rates and bond yields fall, and bond prices rise. Lower longer-maturity yields, combined with higher yields for shorter-maturity securities (which rose with the Fed's rate hikes) created a "flatter" Treasury yield curve and helped longer-maturity/duration notes and bonds generally outperform shorter-maturity/duration notes. MUNICIPAL MARKET REVIEW The Lehman Brothers Municipal Bond Index returned 7.96% for the fiscal year, outperforming its taxable counterpart, the Lehman Brothers U.S. Aggregate. The municipal yield curve also flattened, causing long-term municipal bonds to outperform shorter-term notes. But the municipal yield curve did not flatten as much as the Treasury curve, making PORTFOLIO AT A GLANCE - -------------------------------------------------------------------------------- AS OF AS OF 5/31/05 5/31/04 - -------------------------------------------------------------------------------- Weighted Average Maturity 18.8 yrs 18.4 yrs - -------------------------------------------------------------------------------- Average Duration (Modified) 5.2 yrs 7.0 yrs - -------------------------------------------------------------------------------- YIELDS AS OF MAY 31, 2005 - -------------------------------------------------------------------------------- 30-DAY SEC YIELD - -------------------------------------------------------------------------------- Investor Class 4.54% - -------------------------------------------------------------------------------- A Class 4.10% - -------------------------------------------------------------------------------- B Class 3.53% - -------------------------------------------------------------------------------- C Class 3.53% - -------------------------------------------------------------------------------- INVESTOR CLASS 30-DAY TAX-EQUIVALENT YIELDS(1) - -------------------------------------------------------------------------------- 25.00% Tax Bracket 6.05% - -------------------------------------------------------------------------------- 28.00% Tax Bracket 6.31% - -------------------------------------------------------------------------------- 33.00% Tax Bracket 6.78% - -------------------------------------------------------------------------------- 35.00% Tax Bracket 6.98% - -------------------------------------------------------------------------------- (1) The tax brackets indicated are for federal taxes only. Actual tax-equivalent yields may be lower, if alternative minimum tax is applicable. *All fund returns and yields referenced in this commentary are for Investor Class shares. (continued) - ------ 17 High-Yield Municipal - Portfolio Commentary municipal bond yields attractive compared with Treasury yields. In fact, as of May 31, 2005, 30-year AAA-rated general obligation municipal bonds yielded more than 30-year Treasury bonds! Credit quality also affected performance--lower-quality, higher-yielding bonds tended to outperform investment-grade debt. PORTFOLIO STRATEGY Our investment objective is to seek high current income that is exempt from federal income tax. As of May 31, 2005, we'd invested 76% of the portfolio in below-investment-grade debt (either rated below BBB or unrated but determined by us to be of equivalent quality). These bonds offer higher yields as compensation for their perceived risk. The fund's 30-day SEC yield declined from 4.97% on May 31, 2004 to 4.54% on May 31, 2005 as the bond market rallied, but that still translated to attractive tax-equivalent yields for investors (see the yield table on page 17). We continued to focus on our approach to portfolio investing and management, the foundations of which are thorough credit reviews and careful security selection. Though past performance is no guarantee of future results, we believe our process reduces the risks of potential downgrades and defaults inherent to the high-yield sector; there have been no defaults in the portfolio since the fund's inception. Our investment approach includes techniques designed to realize capital appreciation as well as high income, including investments in land-secured bonds, which represented the portfolio's largest sector position at the beginning and end (see the table above) of the reporting period. Land-secured bonds have potential for price appreciation as the economy grows and/or the projects are developed and their finances solidify. OUR COMMITMENT We remain committed to seeking high levels of federal tax-exempt current income, as well as capital appreciation, by investing at least 80% of the fund's assets in municipal securities, including securities rated below investment-grade or that are unrated. We attempt to keep the weighted average maturity of the fund at 10 years or longer. PORTFOLIO COMPOSITION BY CREDIT RATING - -------------------------------------------------------------------------------- % OF FUND % OF FUND INVESTMENTS INVESTMENTS AS OF AS OF 5/31/05 11/30/04 - -------------------------------------------------------------------------------- AAA 12% 17% - -------------------------------------------------------------------------------- AA -- 2% - -------------------------------------------------------------------------------- A -- -- - -------------------------------------------------------------------------------- BBB 12% 6% - -------------------------------------------------------------------------------- BB 6% 3% - -------------------------------------------------------------------------------- Unrated 70% 72% - -------------------------------------------------------------------------------- Ratings provided by independent research companies. These ratings are listed in Standard & Poor's format even if they were provided by other sources. TOP FIVE SECTORS AS OF MAY 31, 2005 - -------------------------------------------------------------------------------- % OF FUND INVESTMENTS - -------------------------------------------------------------------------------- Land Secured 46% - -------------------------------------------------------------------------------- Special Tax Revenue 8% - -------------------------------------------------------------------------------- Housing Revenue 7% - -------------------------------------------------------------------------------- Tax Allocation/Tax Increment 7% - -------------------------------------------------------------------------------- Hospital Revenue 6% - -------------------------------------------------------------------------------- - ------ 18 High-Yield Municipal - Schedule of Investments MAY 31, 2005 Principal Amount Value - -------------------------------------------------------------------------------- MUNICIPAL SECURITIES -- 96.6% ALASKA -- 0.3% - -------------------------------------------------------------------------------- $ 500,000 Anchorage Schools GO, Series 2000 A, 5.75%, 12/1/10 (MBIA) $ 565,855 - -------------------------------------------------------------------------------- ARIZONA -- 6.9% - -------------------------------------------------------------------------------- 600,000 Centerra Community Facilities District GO, 5.50%, 7/15/29 606,690 - -------------------------------------------------------------------------------- 1,000,000 Gilbert Water Resource Municipal Property Corp. Rev., (Development Fee & Sub-Lien), 4.90%, 4/1/19 1,002,640 - -------------------------------------------------------------------------------- 3,015,000 Pronghorn Ranch Community Facilities District GO, 6.40%, 7/15/29(1) 3,164,363 - -------------------------------------------------------------------------------- 1,000,000 Quailwood Meadows Community Facilities District GO, 6.125%, 7/15/29 1,030,900 - -------------------------------------------------------------------------------- 1,093,000 Sundance Community Facilities Assessment District No. 2 Rev., 7.125%, 7/1/27 1,193,206 - -------------------------------------------------------------------------------- 1,025,000 Sundance Community Facilities Assessment District No. 3 Rev., 6.50%, 7/1/29 1,076,896 - -------------------------------------------------------------------------------- 395,000 Sundance Community Facilities District GO, 6.25%, 7/15/29 412,396 - -------------------------------------------------------------------------------- 1,500,000 Vistancia Community Facilities District GO, 5.50%, 7/15/20 1,534,380 - -------------------------------------------------------------------------------- 1,200,000 Vistancia Community Facilities District GO, 5.75%, 7/15/24 1,229,988 - -------------------------------------------------------------------------------- 11,251,459 - -------------------------------------------------------------------------------- CALIFORNIA -- 15.2% - -------------------------------------------------------------------------------- 2,000,000 Beaumont Financing Auth. Local Agency Rev., Series 2003 A, 6.875%, 9/1/27 2,215,200 - -------------------------------------------------------------------------------- 750,000 California Communities Development Auth. Rev., (Thomas Jefferson School of Law), 7.75%, 10/1/31 833,625 - -------------------------------------------------------------------------------- 2,000,000 California Mobilehome Park Financing Auth. Rev., Series 2003 B, (Palomar Estates E&W), 7.00%, 9/15/36(1) 2,180,020 - -------------------------------------------------------------------------------- 4,000,000 City of Vallejo COP, (Marine World Foundation), 7.00%, 2/1/17 4,209,679 - -------------------------------------------------------------------------------- 2,420,000 Golden State Tobacco Securitization Corp. Rev., Series 2003 A-1, 6.75%, 6/1/39 2,643,923 - -------------------------------------------------------------------------------- 930,000 Hawaiian Gardens COP, Series 2000 A, 8.00%, 6/1/23 997,109 - -------------------------------------------------------------------------------- 2,235,000 Independent Cities Lease Finance Auth. Rev., Series 2004 A, (Morgan Hill - Hacienda Various Projects), 5.90%, 11/15/34 2,338,235 - -------------------------------------------------------------------------------- Principal Amount Value - -------------------------------------------------------------------------------- $2,000,000 Indio Redevelopment Agency Tax Allocation Rev., Series 2004 B, (Sub-Merged Project Area), 6.50%, 8/15/34 $ 2,118,300 - -------------------------------------------------------------------------------- 1,000,000 Jurupa Community Services District Special Tax, Series 2005 A, (Community Facilities District No. 12), 5.15%, 9/1/35(2) 1,004,740 - -------------------------------------------------------------------------------- 3,000,000 Perris Public Financing Auth. Special Tax Rev., Series 2003 A, 6.25%, 9/1/33 3,238,890 - -------------------------------------------------------------------------------- 1,000,000 Soledad Special Assessment, (Diamond Ridge Assessment District No. 02-01), 6.75%, 9/2/33 1,113,280 - -------------------------------------------------------------------------------- 1,600,000 Vallejo Multifamily Housing Rev., Series 1998 B, (Solano Affordable Housing), 8.25%, 4/1/39 (Acquired 12/12/02, Cost $1,731,824)(3) 1,766,528 - -------------------------------------------------------------------------------- 24,659,529 - -------------------------------------------------------------------------------- COLORADO -- 7.6% - -------------------------------------------------------------------------------- 3,000,000 Denver Health & Hospital Auth. Healthcare Rev., Series 2004 A, 6.25%, 12/1/33 3,317,910 - -------------------------------------------------------------------------------- 640,000 Douglas County School District No. Re-1 GO, Series 2002 B, (Douglas & Elbert Counties), 5.75%, 12/15/12 (FSA/State Aid Withholding) 742,918 - -------------------------------------------------------------------------------- 3,000,000 One Horse Business Improvement District Rev., 6.00%, 6/1/24 3,155,130 - -------------------------------------------------------------------------------- 1,500,000 Plaza Metropolitan District No. 1 Rev., 8.00%, 12/1/25 1,672,425 - -------------------------------------------------------------------------------- 2,000,000 Todd Creek Farms Metropolitan District No. 1 Rev., 5.60%, 12/1/14 2,002,180 - -------------------------------------------------------------------------------- 1,500,000 Todd Creek Farms Metropolitan District No. 1 Rev., 6.125%, 12/1/19 1,504,275 - -------------------------------------------------------------------------------- 12,394,838 - -------------------------------------------------------------------------------- CONNECTICUT -- 0.7% - -------------------------------------------------------------------------------- 1,000,000 Connecticut Development Auth. Industrial Rev., (Afco Cargo BDL-LLC), 8.00%, 4/1/30 1,065,930 - -------------------------------------------------------------------------------- DISTRICT OF COLUMBIA -- 1.2% - -------------------------------------------------------------------------------- 1,000,000 District of Columbia COP, (Public Safety & Emergency), 5.50%, 1/1/19 (Ambac) 1,106,890 - -------------------------------------------------------------------------------- 750,000 Metropolitan Washington D.C. Airports Auth. General Rev., Series 2001 A, 5.50%, 10/1/18 (MBIA) 823,260 - -------------------------------------------------------------------------------- 1,930,150 - -------------------------------------------------------------------------------- See Notes to Financial Statements. (continued) - ------ 19 High-Yield Municipal - Schedule of Investments MAY 31, 2005 Principal Amount Value - -------------------------------------------------------------------------------- FLORIDA -- 17.7% - -------------------------------------------------------------------------------- $2,800,000 Anthem Park Community Development District Rev., 5.80%, 5/1/36 $ 2,846,088 - -------------------------------------------------------------------------------- 50,000 Arbor Greene Community Development District Special Assessment, 5.75%, 5/1/06 50,466 - -------------------------------------------------------------------------------- 4,000,000 Concorde Estates Community Development District Rev., Series 2004 B, 5.00%, 5/1/11 4,041,639 - -------------------------------------------------------------------------------- 1,775,000 Covington Park Community Development District Rev., Series 2004 B, (Capital Improvement), 5.30%, 11/1/09 1,817,600 - -------------------------------------------------------------------------------- 990,000 Double Branch Community Development District Special Assessment, Series 2002 A, 6.70%, 5/1/34 1,068,695 - -------------------------------------------------------------------------------- 1,125,000 Double Branch Community Development District Special Assessment, Series 2003 C, 5.125%, 5/1/08 1,141,853 - -------------------------------------------------------------------------------- 3,815,000 Dupree Lakes Community Development District Rev., 5.00%, 11/1/10 3,853,570 - -------------------------------------------------------------------------------- 520,000 Fleming Island Plantation Community Development District Special Assessment, Series 2000 B, 7.375%, 5/1/31 561,959 - -------------------------------------------------------------------------------- 975,000 Gateway Services Community Development District Special Assessment, Series 2003 B, (Sun City Center - Fort Meyers), 5.50%, 5/1/10 994,949 - -------------------------------------------------------------------------------- 730,000 Heritage Harbor South Community Development District Rev., Series 2002 B, 5.40%, 11/1/08 740,819 - -------------------------------------------------------------------------------- 935,000 Middle Village Community Development District Special Assessment, Series 2004 B, 5.00%, 5/1/09 945,724 - -------------------------------------------------------------------------------- 1,500,000 Midtown Miami Community Development District Special Assessment, Series 2004 A, 6.25%, 5/1/37 1,589,745 - -------------------------------------------------------------------------------- 1,000,000 Orange County School Board COP, Series 2002 A, 5.50%, 8/1/19 (MBIA) 1,118,020 - -------------------------------------------------------------------------------- 400,000 Reunion East Community Development District Special Assessment Rev., Series 2002 B, 5.90%, 11/1/07 408,344 - -------------------------------------------------------------------------------- 1,245,000 South-Dade Venture Community Development District Rev., 6.125%, 5/1/34 1,321,891 - -------------------------------------------------------------------------------- 2,790,000 Sterling Hill Community Development District Special Assessment, Series 2003 B, 5.50%, 11/1/10 2,860,001 - -------------------------------------------------------------------------------- Principal Amount Value - -------------------------------------------------------------------------------- $ 380,000 Stoneybrook West Community Development District Special Assessment, Series 2000 A, 7.00%, 5/1/32 $ 407,915 - -------------------------------------------------------------------------------- 965,000 Waterchase Community Development District Rev., Series 2001 A, 6.70%, 5/1/32 1,033,534 - -------------------------------------------------------------------------------- 2,000,000 Westchester Community Development District No. 1 Special Assessment, (Infrastructure), 6.125%, 5/1/35 2,107,360 - -------------------------------------------------------------------------------- 28,910,172 - -------------------------------------------------------------------------------- GEORGIA -- 1.3% - -------------------------------------------------------------------------------- 650,000 Atlanta Water & Wastewater Rev., Series 1999 A, 5.50%, 11/1/18 (FGIC) 764,160 - -------------------------------------------------------------------------------- 1,300,000 Gwinnett County Water & Sewer Auth. Rev., 4.00%, 8/1/14 1,353,859 - -------------------------------------------------------------------------------- 2,118,019 - -------------------------------------------------------------------------------- GUAM -- 0.7% - -------------------------------------------------------------------------------- 390,000 Guam International Airport Auth. Rev., Series 2003 A, 4.00%, 10/1/10 (MBIA) 405,951 - -------------------------------------------------------------------------------- 690,000 Guam International Airport Auth. Rev., Series 2003 A, 4.00%, 10/1/11 (MBIA) 718,180 - -------------------------------------------------------------------------------- 1,124,131 - -------------------------------------------------------------------------------- ILLINOIS -- 1.9% - -------------------------------------------------------------------------------- 3,000,000 Chicago Tax Increment Allocation Rev., Series 2004 B, (Pilsen Redevelopment), (Junior Lien), 6.75%, 6/1/22(1) 3,135,630 - -------------------------------------------------------------------------------- MARYLAND -- 2.4% - -------------------------------------------------------------------------------- 1,250,000 Anne Arundel County Special Obligation Rev., (Arundel Mills), 7.10%, 7/1/09, Prerefunded at 102% of Par(4) 1,465,825 - -------------------------------------------------------------------------------- 1,000,000 Anne Arundel County Special Obligation Rev., (National Business Park), 7.375%, 7/1/10, Prerefunded at 102% of Par(4) 1,213,310 - -------------------------------------------------------------------------------- 1,238,000 Prince Georges County Rev., (Woodview Village Phase II - Subdistrict), 7.00%, 7/1/32 1,301,088 - -------------------------------------------------------------------------------- 3,980,223 - -------------------------------------------------------------------------------- MISSOURI -- 0.9% - -------------------------------------------------------------------------------- 860,000 Missouri Bottom Transportation Development District Hazelwood Rev., 7.20%, 5/1/33 926,186 - -------------------------------------------------------------------------------- 470,000 Missouri Housing Development Commission Mortgage Rev., Series 1998 B2, (Single Family), 6.40%, 9/1/29 475,809 - -------------------------------------------------------------------------------- 1,401,995 - -------------------------------------------------------------------------------- See Notes to Financial Statements. (continued) - ------ 20 High-Yield Municipal - Schedule of Investments MAY 31, 2005 Principal Amount Value - -------------------------------------------------------------------------------- NEVADA -- 11.1% - -------------------------------------------------------------------------------- $1,105,000 Clark County Improvement District No. 121 Special Assessment, (Southern Highlands Area), 7.50%, 12/1/19 $ 1,209,588 - -------------------------------------------------------------------------------- 3,000,000 Clark County Improvement District No. 142 Special Assessment, 5.50%, 8/1/12 3,095,579 - -------------------------------------------------------------------------------- 715,000 Clark County Improvement Districts No. 108 & 124 Special Assessment, Series 2003 B, 5.25%, 2/1/12 736,207 - -------------------------------------------------------------------------------- 750,000 Clark County Improvement Districts No. 108 & 124 Special Assessment, Series 2003 B, 5.375%, 2/1/13 772,860 - -------------------------------------------------------------------------------- 720,000 Clark County Improvement Districts No. 108 & 124 Special Assessment, Series 2003 B, 5.40%, 2/1/14 742,306 - -------------------------------------------------------------------------------- 1,565,000 Henderson Local Improvement Districts No. T-14 Special Assessment, 5.25%, 3/1/13 1,615,299 - -------------------------------------------------------------------------------- 1,560,000 Henderson Local Improvement Districts No. T-15 Special Assessment, 6.10%, 3/1/24 1,609,936 - -------------------------------------------------------------------------------- 1,000,000 Henderson Local Improvement Districts No. T-16 Special Assessment, (The Falls at Lake Las Vegas), 5.00%, 3/1/20 1,004,240 - -------------------------------------------------------------------------------- 1,105,000 Henderson Redevelopment Agency Tax Allocation Rev., Series 2002 B, 7.10%, 10/1/22 1,219,511 - -------------------------------------------------------------------------------- 350,000 Henderson Redevelopment Agency Tax Allocation Rev., Series 2002 B, 7.20%, 10/1/25 386,509 - -------------------------------------------------------------------------------- 1,275,000 Las Vegas Improvement District No. 607 Special Assessment, 5.50%, 6/1/13 1,319,906 - -------------------------------------------------------------------------------- 495,000 Las Vegas Improvement District No. 808-Summerlin Area Special Assessment, 5.40%, 6/1/06 504,276 - -------------------------------------------------------------------------------- 495,000 Las Vegas Improvement District No. 808-Summerlin Area Special Assessment, 5.70%, 6/1/08 514,226 - -------------------------------------------------------------------------------- 1,165,000 North Las Vegas Improvement District No. 60-Aliante Special Assessment, 5.25%, 12/1/10 1,206,194 - -------------------------------------------------------------------------------- 500,000 North Las Vegas Improvement District No. 60-Aliante Special Assessment, 5.60%, 12/1/12 517,675 - -------------------------------------------------------------------------------- 755,000 Reno Special Assessment District No. 4 Rev., (Somersett Parkway), 5.20%, 12/1/10 778,382 - -------------------------------------------------------------------------------- Principal Amount Value - -------------------------------------------------------------------------------- $ 795,000 Reno Special Assessment District No. 4 Rev., (Somersett Parkway), 5.45%, 12/1/11 $ 819,661 - -------------------------------------------------------------------------------- 18,052,355 - -------------------------------------------------------------------------------- NEW JERSEY -- 5.6% - -------------------------------------------------------------------------------- 1,000,000 New Jersey Economic Development Auth. COP, Series 1999 A, (Transportation Sublease), 6.00%, 5/1/09 (FSA) 1,110,360 - -------------------------------------------------------------------------------- 4,000,000 Tobacco Settlement Financing Corp. Rev., 6.00%, 6/1/37 4,076,560 - -------------------------------------------------------------------------------- 3,835,000 Tobacco Settlement Financing Corp. Rev., 6.125%, 6/1/42 3,924,662 - -------------------------------------------------------------------------------- 9,111,582 - -------------------------------------------------------------------------------- NEW MEXICO -- 1.6% - -------------------------------------------------------------------------------- 1,490,000 Cabezon Public Improvement District Special Tax Rev., 6.30%, 9/1/34 1,506,941 - -------------------------------------------------------------------------------- 1,000,000 Ventana West Public Improvement District Special Levy Rev., 6.875%, 8/1/33 1,026,170 - -------------------------------------------------------------------------------- 2,533,111 - -------------------------------------------------------------------------------- NEW YORK -- 0.6% - -------------------------------------------------------------------------------- 1,000,000 Onondaga County Industrial Development Auth. Rev., (Air Cargo), 7.25%, 1/1/32 1,036,710 - -------------------------------------------------------------------------------- NORTHERN MARIANA ISLANDS -- 1.4% - -------------------------------------------------------------------------------- 2,000,000 Northern Mariana Islands Commonwealth GO, Series 2003 A, 6.75%, 10/1/33 2,206,600 - -------------------------------------------------------------------------------- OHIO -- 3.4% - -------------------------------------------------------------------------------- 1,160,000 Hebron Waterworks Rev., 5.875%, 12/1/25 1,210,286 - -------------------------------------------------------------------------------- 745,000 Hebron Waterworks Rev., 6.125%, 12/1/29 787,726 - -------------------------------------------------------------------------------- 1,800,000 Pinnacle Community Infrastructure Financing Facilities Auth. Rev., Series 2004 A, 6.25%, 12/1/36 1,873,674 - -------------------------------------------------------------------------------- 500,000 Plain Local School District GO, 5.50%, 12/1/19 (FGIC) 559,140 - -------------------------------------------------------------------------------- 1,100,000 Port of Greater Cincinnati Development Auth. Special Assessment, (Cooperative Public Parking Infrastructure), 6.40%, 2/15/34 1,175,053 - -------------------------------------------------------------------------------- 5,605,879 - -------------------------------------------------------------------------------- OKLAHOMA -- 0.5% - -------------------------------------------------------------------------------- 750,000 Oklahoma City Industrial & Cultural Facilities Trust Rev., 6.75%, 1/1/23 751,410 - -------------------------------------------------------------------------------- See Notes to Financial Statements. (continued) - ------ 21 High-Yield Municipal - Schedule of Investments MAY 31, 2005 Principal Amount Value - -------------------------------------------------------------------------------- PENNSYLVANIA -- 4.3% - -------------------------------------------------------------------------------- $2,750,000 Allegheny County Redevelopment Auth. Tax Allocation, (Pittsburgh Mills), 5.10%, 7/1/14 $ 2,873,695 - -------------------------------------------------------------------------------- 1,000,000 Allegheny County Redevelopment Auth. Tax Allocation, (Pittsburgh Mills), 5.60%, 7/1/23 1,054,280 - -------------------------------------------------------------------------------- 1,325,000 Chartiers Valley School District GO, Series 2004 A, 5.00%, 10/15/20 (FSA/State Aid Withholding) 1,437,903 - -------------------------------------------------------------------------------- 1,000,000 Langhorne Manor Boro Higher Education Auth. Rev., (Philadelphia Biblical University), 5.50%, 4/1/25 1,009,370 - -------------------------------------------------------------------------------- 685,000 New Morgan Municipal Auth. Office Rev., Series 1999 A, (Commonwealth Office), 5.375%, 6/1/08 677,883 - -------------------------------------------------------------------------------- 7,053,131 - -------------------------------------------------------------------------------- RHODE ISLAND -- 0.4% - -------------------------------------------------------------------------------- 500,000 Cranston GO, 6.375%, 11/15/17 (FGIC) 573,585 - -------------------------------------------------------------------------------- SOUTH CAROLINA -- 0.9% - -------------------------------------------------------------------------------- 1,425,000 South Carolina Jobs Economic Development Auth. Hospital Facilities Rev., Series 2003 C, (Palmetto Health), 4.25%, 8/1/05 1,426,967 - -------------------------------------------------------------------------------- TENNESSEE -- 3.2% - -------------------------------------------------------------------------------- 1,500,000 Chattanooga Health Educational & Housing Facility Board Rev., Series 2005 B, (Campus Development Foundation, Inc. Phase I LLC), 5.50%, 10/1/20 1,514,610 - -------------------------------------------------------------------------------- 3,565,000 Chattanooga Health Educational & Housing Facility Board Rev., Series 2005 B, (Campus Development Foundation, Inc. Phase I LLC), 6.00%, 10/1/35 3,641,184 - -------------------------------------------------------------------------------- 5,155,794 - -------------------------------------------------------------------------------- TEXAS -- 2.6% - -------------------------------------------------------------------------------- 710,000 Abia Development Corp. Airport Facilities Rev., (Aero Austin L.P.), 6.75%, 1/1/11 711,576 - -------------------------------------------------------------------------------- 400,000 Bexar County Health Facilities Development Corp. Rev., (Army Retirement Residence), 6.125%, 7/1/22 434,472 - -------------------------------------------------------------------------------- Principal Amount Value - -------------------------------------------------------------------------------- $1,000,000 Bexar County Health Facilities Development Corp. Rev., (Army Retirement Residence), 6.30%, 7/1/32 $ 1,085,550 - -------------------------------------------------------------------------------- 2,000,000 Pearland Development Auth. Rev., 5.50%, 9/1/28 2,068,680 - -------------------------------------------------------------------------------- 4,300,278 - -------------------------------------------------------------------------------- UTAH -- 1.0% - -------------------------------------------------------------------------------- 235,000 Bountiful Hospital Rev., (South Davis Community Hospital), 5.125%, 12/15/05 (Acquired 9/24/98, Cost $233,245)(3) 236,274 - -------------------------------------------------------------------------------- 1,235,000 West Valley City Rev., Series 2001 A, 5.50%, 7/15/15 (MBIA) 1,372,443 - -------------------------------------------------------------------------------- 1,608,717 - -------------------------------------------------------------------------------- VIRGINIA -- 1.2% - -------------------------------------------------------------------------------- 2,000,000 Tobacco Settlement Financing Corp. Rev., 5.625%, 6/1/37 1,997,060 - -------------------------------------------------------------------------------- WASHINGTON -- 0.8% - -------------------------------------------------------------------------------- 860,000 Cowlitz County Kelso School District No. 458 GO, 5.75%, 12/1/18 (FSA) 973,795 - -------------------------------------------------------------------------------- 250,000 Port of Seattle Rev., Series 2000 B, 6.00%, 2/1/15 (MBIA) 289,810 - -------------------------------------------------------------------------------- 1,263,605 - -------------------------------------------------------------------------------- WISCONSIN -- 1.2% - -------------------------------------------------------------------------------- 2,000,000 Wisconsin State Health & Educational Facilities Auth. Rev., Series 2004 A, (Southwest Health Center), 6.25%, 4/1/34 2,010,530 - -------------------------------------------------------------------------------- TOTAL MUNICIPAL SECURITIES (Cost $150,333,743) 157,225,245 - -------------------------------------------------------------------------------- SHORT-TERM MUNICIPAL SECURITIES -- 1.6% ARIZONA -- 0.2% - -------------------------------------------------------------------------------- 325,000 Coconino County Pollution Control Corp. Rev., (Arizona Public Service Co.), VRDN, 3.02%, 6/1/05 (LOC: KBC Bank N.V.) 325,000 - -------------------------------------------------------------------------------- FLORIDA -- 1.4% - -------------------------------------------------------------------------------- 2,250,000 Broward County Health Facilities Auth. Rev., (John Knox Village), VRDN, 3.10%, 6/1/05 (RADIAN) (SBBPA: LaSalle Bank N.A.) 2,250,000 - -------------------------------------------------------------------------------- TOTAL SHORT-TERM MUNICIPAL SECURITIES (Cost $2,575,000) 2,575,000 - -------------------------------------------------------------------------------- See Notes to Financial Statements. (continued) - ------ 22 High-Yield Municipal - Schedule of Investments MAY 31, 2005 Principal Amount Value - -------------------------------------------------------------------------------- TEMPORARY CASH INVESTMENTS -- 0.2% $ 271,000 Federated Tax-Free Obligation Fund (Cost $271,000) $ 271,000 - -------------------------------------------------------------------------------- TOTAL INVESTMENT SECURITIES -- 98.4% (Cost $153,179,743) 160,071,245 - -------------------------------------------------------------------------------- OTHER ASSETS AND LIABILITIES -- 1.6% 2,567,912 - -------------------------------------------------------------------------------- TOTAL NET ASSETS -- 100.0% $162,639,157 ================================================================================ FUTURES CONTRACTS* Expiration Underlying Face Unrealized Contracts Sold Date Amount at Value Gain (Loss) - -------------------------------------------------------------------------------- 60 U.S. Treasury 10-Year Notes September 2005 $6,795,938 $(30,960) ================================ *FUTURES CONTRACTS typically are based on an index and tend to track the performance of the index or specific securities while remaining very liquid (easy to buy and sell). By selling futures, the fund hedges its investments against price fluctuations. NOTES TO SCHEDULE OF INVESTMENTS Ambac = Ambac Assurance Corporation COP = Certificates of Participation FGIC = Financial Guaranty Insurance Co. FSA = Financial Security Assurance, Inc. GO = General Obligation LOC = Letter of Credit MBIA = MBIA Insurance Corporation RADIAN = Radian Asset Assurance, Inc. SBBPA = Standby Bond Purchase Agreement VRDN = Variable Rate Demand Note. Interest reset date is indicated. Rate shown is effective May 31, 2005. (1) Security, or a portion thereof, has been segregated for a when-issued security and/or futures contracts. (2) When-issued security. (3) Security was purchased under Rule 144A of the Securities Act of 1933 or is a private placement and, unless registered under the Act or exempted from registration, may only be sold to qualified institutional investors. The aggregate value of restricted securities at May 31, 2005, was $2,002,802, which represented 1.2% of net assets. (4) Escrowed to maturity in U.S. government securities or state and local government securities. See Notes to Financial Statements. - ------ 23 Shareholder Fee Examples (Unaudited) Fund shareholders may incur two types of costs: (1) transaction costs, including sales charges (loads) on purchase payments and redemption/exchange fees; and (2) ongoing costs, including management fees; distribution and service (12b-1) fees; and other fund expenses. This example is intended to help you understand your ongoing costs (in dollars) of investing in your fund and to compare these costs with the ongoing cost of investing in other mutual funds. The example is based on an investment of $1,000 made at the beginning of the period and held for the entire period from December 1, 2004 to May 31, 2005. ACTUAL EXPENSES The table provides information about actual account values and actual expenses for each class. You may use the information, together with the amount you invested, to estimate the expenses that you paid over the period. First, identify the share class you own. Then simply divide your account value by $1,000 (for example, an $8,600 account value divided by $1,000 = 8.6), then multiply the result by the number under the heading "Expenses Paid During Period" to estimate the expenses you paid on your account during this period. If you hold Investor Class shares of any American Century fund, or Institutional Class shares of the American Century Diversified Bond Fund, in an American Century account (i.e., not a financial intermediary or retirement plan account), American Century may charge you a $12.50 semiannual account maintenance fee if the value of those shares is less than $10,000. We will redeem shares automatically in one of your accounts to pay the $12.50 fee. In determining your total eligible investment amount, we will include your investments in all PERSONAL ACCOUNTS (including American Century Brokerage accounts) registered under your Social Security number. PERSONAL ACCOUNTS include individual accounts, joint accounts, UGMA/UTMA accounts, personal trusts, Coverdell Education Savings Accounts and IRAs (including traditional, Roth, Rollover, SEP-, SARSEP- and SIMPLE-IRAs), and certain other retirement accounts. If you have only business, business retirement, employer-sponsored or American Century Brokerage accounts, you are currently not subject to this fee. We will not charge the fee as long as you choose to manage your accounts exclusively online. If you are subject to the Account Maintenance Fee, your account value could be reduced by the fee amount. HYPOTHETICAL EXAMPLE FOR COMPARISON PURPOSES The table also provides information about hypothetical account values and hypothetical expenses based on the actual expense ratio of each class of your fund and an assumed rate of return of 5% per year before expenses, which is not the actual return of a fund's share class. The hypothetical account values and expenses may not be used to estimate the actual ending account balance or expenses you paid for the period. You may use this information to compare the ongoing costs of investing in your fund and other funds. To do so, compare this 5% hypothetical example with the 5% hypothetical examples that appear in the shareholder reports of the other funds. (continued) - ------ 24 Shareholder Fee Examples (Unaudited) Please note that the expenses shown in the table are meant to highlight your ongoing costs only and do not reflect any transactional costs, such as sales charges (loads) or redemption/exchange fees. Therefore, the table is useful in comparing ongoing costs only, and will not help you determine the relative total costs of owning different funds. In addition, if these transactional costs were included, your costs would have been higher. - -------------------------------------------------------------------------------- EXPENSES PAID BEGINNING ENDING DURING PERIOD* ANNUALIZED ACCOUNT VALUE ACCOUNT VALUE 12/1/04 - EXPENSE 12/1/04 5/31/05 5/31/05 RATIO* - -------------------------------------------------------------------------------- ARIZONA MUNICIPAL BOND SHAREHOLDER FEE EXAMPLE - -------------------------------------------------------------------------------- ACTUAL - -------------------------------------------------------------------------------- Investor Class $1,000 $1,021.90 $2.52 0.50% - -------------------------------------------------------------------------------- A Class $1,000 $1,020.60 $3.78 0.75% - -------------------------------------------------------------------------------- B Class $1,000 $1,017.00 $7.54 1.50% - -------------------------------------------------------------------------------- C Class $1,000 $1,016.70 $7.54 1.50% - -------------------------------------------------------------------------------- HYPOTHETICAL - -------------------------------------------------------------------------------- Investor Class $1,000 $1,022.44 $2.52 0.50% - -------------------------------------------------------------------------------- A Class $1,000 $1,021.19 $3.78 0.75% - -------------------------------------------------------------------------------- B Class $1,000 $1,017.45 $7.54 1.50% - -------------------------------------------------------------------------------- C Class $1,000 $1,017.45 $7.54 1.50% - -------------------------------------------------------------------------------- FLORIDA MUNICIPAL BOND SHAREHOLDER FEE EXAMPLE - -------------------------------------------------------------------------------- ACTUAL - -------------------------------------------------------------------------------- Investor Class $1,000 $1,020.30 $2.52 0.50% - -------------------------------------------------------------------------------- A Class $1,000 $1,019.10 $3.78 0.75% - -------------------------------------------------------------------------------- B Class $1,000 $1,015.10 $7.54 1.50% - -------------------------------------------------------------------------------- C Class $1,000 $1,015.30 $7.54 1.50% - -------------------------------------------------------------------------------- HYPOTHETICAL - -------------------------------------------------------------------------------- Investor Class $1,000 $1,022.44 $2.52 0.50% - -------------------------------------------------------------------------------- A Class $1,000 $1,021.19 $3.78 0.75% - -------------------------------------------------------------------------------- B Class $1,000 $1,017.45 $7.54 1.50% - -------------------------------------------------------------------------------- C Class $1,000 $1,017.45 $7.54 1.50% - -------------------------------------------------------------------------------- *Expenses are equal to the class's annualized expense ratio listed in the table above, multiplied by the average account value over the period, multiplied by 182, the number of days in the most recent fiscal half-year, divided by 365, to reflect the one-half year period. (continued) - ------ 25 Shareholder Fee Examples (Unaudited) - -------------------------------------------------------------------------------- EXPENSES PAID BEGINNING ENDING DURING PERIOD* ANNUALIZED ACCOUNT VALUE ACCOUNT VALUE 12/1/04 - EXPENSE 12/1/04 5/31/05 5/31/05 RATIO* - -------------------------------------------------------------------------------- HIGH-YIELD MUNICIPAL SHAREHOLDER FEE EXAMPLE - -------------------------------------------------------------------------------- ACTUAL - -------------------------------------------------------------------------------- Investor Class $1,000 $1,048.70 $3.17 0.62% - -------------------------------------------------------------------------------- A Class $1,000 $1,047.40 $4.44 0.87% - -------------------------------------------------------------------------------- B Class $1,000 $1,043.50 $8.25 1.62% - -------------------------------------------------------------------------------- C Class $1,000 $1,043.50 $8.25 1.62% - -------------------------------------------------------------------------------- HYPOTHETICAL - -------------------------------------------------------------------------------- Investor Class $1,000 $1,021.84 $3.13 0.62% - -------------------------------------------------------------------------------- A Class $1,000 $1,020.59 $4.38 0.87% - -------------------------------------------------------------------------------- B Class $1,000 $1,016.85 $8.15 1.62% - -------------------------------------------------------------------------------- C Class $1,000 $1,016.85 $8.15 1.62% - -------------------------------------------------------------------------------- *Expenses are equal to the class's annualized expense ratio listed in the table above, multiplied by the average account value over the period, multiplied by 182, the number of days in the most recent fiscal half-year, divided by 365, to reflect the one-half year period. - ------ 26 Statement of Assets and Liabilities MAY 31, 2005 - -------------------------------------------------------------------------------- ARIZONA FLORIDA HIGH-YIELD MUNICIPAL BOND MUNICIPAL BOND MUNICIPAL - -------------------------------------------------------------------------------- Investment securities, at value (cost of $55,689,477, $50,255,920, and $153,179,743, respectively) $58,294,418 $52,864,528 $160,071,245 - ------------------------------- Cash -- -- 276,191 - ------------------------------- Receivable for capital shares sold 58,126 88,989 945,815 - ------------------------------- Interest receivable 1,024,178 620,053 2,677,770 - -------------------------------------------------------------------------------- 59,376,722 53,573,570 163,971,021 - -------------------------------------------------------------------------------- LIABILITIES - -------------------------------------------------------------------------------- Disbursements in excess of demand deposit cash 17,634 70,715 -- - ------------------------------- Payable for investments purchased 1,088,356 -- 1,000,000 - ------------------------------- Payable for variation margin on futures contracts 8,802 22,006 26,407 - ------------------------------- Accrued management fees 24,123 22,887 82,706 - ------------------------------- Distribution fees payable 424 1,147 12,554 - ------------------------------- Service fees (and distribution fees -- A Class) payable 1,043 822 20,312 - ------------------------------- Dividends payable 41,798 52,949 189,885 - -------------------------------------------------------------------------------- 1,182,180 170,526 1,331,864 - -------------------------------------------------------------------------------- NET ASSETS $58,194,542 $53,403,044 $162,639,157 ================================================================================ NET ASSETS CONSIST OF: - -------------------------------------------------------------------------------- Capital paid in $55,501,587 $51,321,120 $158,393,312 - ------------------------------- Undistributed net investment income -- -- 11,059 - ------------------------------- Accumulated undistributed net realized gain (loss) on investment transactions 98,334 (500,884) (2,625,756) - ------------------------------- Net unrealized appreciation on investments 2,594,621 2,582,808 6,860,542 - -------------------------------------------------------------------------------- $58,194,542 $53,403,044 $162,639,157 ================================================================================ INVESTOR CLASS - -------------------------------------------------------------------------------- Net assets $53,202,782 $49,451,394 $62,945,065 - ------------------------------- Shares outstanding 4,855,867 4,573,286 5,996,767 - ------------------------------- Net asset value per share $10.96 $10.81 $10.50 - -------------------------------------------------------------------------------- A CLASS - -------------------------------------------------------------------------------- Net assets $4,270,511 $2,105,313 $79,153,807 - ------------------------------- Shares outstanding 389,774 194,700 7,540,974 - ------------------------------- Net asset value per share $10.96 $10.81 $10.50 - ------------------------------- Maximum offering price (net asset value divided by 0.955) $11.48 $11.32 $10.99 - -------------------------------------------------------------------------------- B CLASS - -------------------------------------------------------------------------------- Net assets $2,521 $19,383 $3,573,348 - ------------------------------- Shares outstanding 230 1,793 340,432 - ------------------------------- Net asset value per share $10.96 $10.81 $10.50 - -------------------------------------------------------------------------------- C CLASS - -------------------------------------------------------------------------------- Net assets $718,728 $1,826,954 $16,966,937 - ------------------------------- Shares outstanding 65,599 168,958 1,616,437 - ------------------------------- Net asset value per share $10.96 $10.81 $10.50 - -------------------------------------------------------------------------------- See Notes to Financial Statements. - ------ 27 Statement of Operations YEAR ENDED MAY 31, 2005 - -------------------------------------------------------------------------------- ARIZONA FLORIDA HIGH-YIELD MUNICIPAL BOND MUNICIPAL BOND MUNICIPAL - -------------------------------------------------------------------------------- INVESTMENT INCOME - -------------------------------------------------------------------------------- INCOME: - ------------------------------- Interest $2,587,773 $2,482,395 $ 7,046,220 - -------------------------------------------------------------------------------- EXPENSES: - ------------------------------- Management fees 291,233 300,473 787,856 - ------------------------------- Distribution Fees: - ------------------------------- B Class 18 125 23,251 - ------------------------------- C Class 3,143 11,187 92,294 - ------------------------------- Service Fees: - ------------------------------- B Class 7 41 7,750 - ------------------------------- C Class 1,048 3,729 30,764 - ------------------------------- Service and distribution fees -- A Class 8,149 3,732 131,237 - ------------------------------- Trustees' fees and expenses 5,493 5,596 8,510 - ------------------------------- Other expenses 202 169 349 - -------------------------------------------------------------------------------- 309,293 325,052 1,082,011 - ------------------------------- Amount reimbursed -- -- (14) - -------------------------------------------------------------------------------- 309,293 325,052 1,081,997 - -------------------------------------------------------------------------------- NET INVESTMENT INCOME 2,278,480 2,157,343 5,964,223 - -------------------------------------------------------------------------------- REALIZED AND UNREALIZED GAIN (LOSS) - -------------------------------------------------------------------------------- Net realized gain (loss) on investment transactions 99,571 (205,313) 190,926 - ------------------------------- Change in net unrealized appreciation on investments 603,330 977,499 5,362,877 - -------------------------------------------------------------------------------- NET REALIZED AND UNREALIZED GAIN 702,901 772,186 5,553,803 - -------------------------------------------------------------------------------- NET INCREASE IN NET ASSETS RESULTING FROM OPERATIONS $2,981,381 $2,929,529 $11,518,026 ================================================================================ See Notes to Financial Statements. - ------ 28 Statement of Changes in Net Assets YEARS ENDED MAY 31, 2005 AND MAY 31, 2004 - ------------------------------------------------------------------------------------------ DECREASE IN NET ASSETS ARIZONA MUNICIPAL BOND FLORIDA MUNICIPAL BOND - ------------------------------------------------------------------------------------------ 2005 2004 2005 2004 - ------------------------------------------------------------------------------------------ OPERATIONS - ------------------------------------------------------------------------------------------ Net investment income $ 2,278,480 $ 2,479,760 $ 2,157,343 $ 2,390,053 - ----------------------------- Net realized gain (loss) 99,571 31,189 (205,313) (295,541) - ----------------------------- Change in net unrealized appreciation 603,330 (3,334,628) 977,499 (3,291,538) - ------------------------------------------------------------------------------------------ Net increase (decrease) in net assets resulting from operations 2,981,381 (823,679) 2,929,529 (1,197,026) - ------------------------------------------------------------------------------------------ DISTRIBUTIONS TO SHAREHOLDERS - ------------------------------------------------------------------------------------------ From net investment income - ----------------------------- Investor Class (2,147,979) (2,475,048) (2,068,408) (2,383,929) - ----------------------------- A Class (118,487) (4,663) (50,159) (1,775) - ----------------------------- B Class (72) (17) (423) (55) - ----------------------------- C Class (11,942) (32) (38,353) (4,294) - ----------------------------- From net realized gains - ----------------------------- Investor Class (12,600) (232,087) -- (240,945) - ----------------------------- A Class (792) -- -- -- - ----------------------------- B Class (1) -- -- -- - ----------------------------- C Class (102) -- -- -- - ------------------------------------------------------------------------------------------ Decrease in net assets from distributions (2,291,975) (2,711,847) (2,157,343) (2,630,998) - ------------------------------------------------------------------------------------------ CAPITAL SHARE TRANSACTIONS - ------------------------------------------------------------------------------------------ Net decrease in net assets from capital share transactions (4,235,455) (10,511,290) (12,320,526) (1,298,103) - ------------------------------------------------------------------------------------------ NET DECREASE IN NET ASSETS (3,546,049) (14,046,816) (11,548,340) (5,126,127) NET ASSETS - ------------------------------------------------------------------------------------------ Beginning of period 61,740,591 75,787,407 64,951,384 70,077,511 - ------------------------------------------------------------------------------------------ End of period $58,194,542 $ 61,740,591 $ 53,403,044 $64,951,384 ========================================================================================== See Notes to Financial Statements. (continued) - ------ 29 Statement of Changes in Net Assets YEARS ENDED MAY 31, 2005 AND MAY 31, 2004 - -------------------------------------------------------------------------------- INCREASE IN NET ASSETS HIGH-YIELD MUNICIPAL - -------------------------------------------------------------------------------- 2005 2004 - -------------------------------------------------------------------------------- OPERATIONS - -------------------------------------------------------------------------------- Net investment income $ 5,964,223 $ 3,730,694 - ------------------------------------------- Net realized gain (loss) 190,926 (995,135) - ------------------------------------------- Change in net unrealized appreciation 5,362,877 (903,953) - -------------------------------------------------------------------------------- Net increase in net assets resulting from operations 11,518,026 1,831,606 - -------------------------------------------------------------------------------- DISTRIBUTIONS TO SHAREHOLDERS - -------------------------------------------------------------------------------- From net investment income - ------------------------------------------- Investor Class (2,901,842) (2,750,692) - ------------------------------------------- A Class (2,459,571) (704,142) - ------------------------------------------- B Class (121,581) (72,484) - ------------------------------------------- C Class (481,229) (203,376) - -------------------------------------------------------------------------------- Decrease in net assets from distributions (5,964,223) (3,730,694) - -------------------------------------------------------------------------------- CAPITAL SHARE TRANSACTIONS - -------------------------------------------------------------------------------- Net increase in net assets from capital share transactions 58,412,524 42,671,909 - -------------------------------------------------------------------------------- NET INCREASE IN NET ASSETS 63,966,327 40,772,821 NET ASSETS - -------------------------------------------------------------------------------- Beginning of period 98,672,830 57,900,009 - -------------------------------------------------------------------------------- End of period $162,639,157 $98,672,830 ================================================================================ Undistributed net investment income $11,059 $-- ================================================================================ See Notes to Financial Statements. - ------ 30 Notes to Financial Statements MAY 31, 2005 1. ORGANIZATION AND SUMMARY OF SIGNIFICANT ACCOUNTING POLICIES ORGANIZATION -- American Century Municipal Trust (the trust) is registered under the Investment Company Act of 1940 (the 1940 Act) as an open-end management investment company. Arizona Municipal Bond Fund (Arizona Municipal), Florida Municipal Bond Fund (Florida Municipal) and High-Yield Municipal Fund (High-Yield Municipal) (collectively, the funds) are three funds in a series issued by the trust. The funds are non-diversified under the 1940 Act. Arizona Municipal's investment objective is to seek safety of principal and high current income that is exempt from federal income tax and taxes imposed by the state of Arizona. Florida Municipal's investment objective is to seek safety of principal and high current income that is exempt from federal income tax and taxes imposed by the state of Florida. Arizona Municipal and Florida Municipal invest primarily in Arizona and Florida municipal obligations, respectively. High-Yield Municipal's investment objective is to seek high current income exempt from federal income taxes. Capital appreciation is a secondary objective. High-Yield Municipal invests primarily in lower-rated long-term and intermediate-term municipal obligations, which are subject to greater credit risk and consequently offer higher yields. The following is a summary of the funds' significant accounting policies. MULTIPLE CLASS -- The funds are authorized to issue the Investor Class, the A Class, the B Class and the C Class. The A Class may incur an initial sales charge. The A Class, B Class and C Class may be subject to a contingent deferred sales charge. The share classes differ principally in their respective sales charges and shareholder servicing and distribution expenses and arrangements. All shares of the fund represent an equal pro rata interest in the assets of the class to which such shares belong, and have identical voting, dividend, liquidation and other rights and the same terms and conditions, except for class specific expenses and exclusive rights to vote on matters affecting only individual classes. Income, non-class specific expenses, and realized and unrealized capital gains and losses of the fund are allocated to each class of shares based on their relative net assets. Arizona Municipal and Florida Municipal A Class, B Class and C Class commenced on February 27, 2004, at which time the Investor Class was no longer available to new self-directed retail investors. SECURITY VALUATIONS -- Securities are valued at current market value as provided by a commercial pricing service or at the mean of the most recent bid and asked prices. Debt securities maturing within 60 days may be valued at cost, plus or minus any amortized discount or premium. If the funds determine that the market price of a portfolio security is not readily available, or that the valuation methods mentioned above do not reflect the security's fair value, such security is valued at its fair value as determined by, or in accordance with procedures adopted by, the Board of Trustees or its designee if such fair value determination would materially impact a fund's net asset value. Circumstances that may cause the funds to fair value a security include: an event occurred after the close of the exchange on which a portfolio security principally trades (but before the close of the New York Stock Exchange) that was likely to have changed the value of the security; a security has been declared in default; or trading in a security has been halted during the trading day. SECURITY TRANSACTIONS -- Security transactions are accounted for as of the trade date. Net realized gains and losses are determined on the identified cost basis, which is also used for federal income tax purposes. INVESTMENT INCOME -- Interest income is recorded on the accrual basis and includes accretion of discounts and amortization of premiums. WHEN-ISSUED AND FORWARD COMMITMENTS -- The funds may engage in securities transactions on a when-issued or forward commitment basis. Under these arrangements, the securities' prices and yields are fixed on the date of the commitment, but payment and delivery are scheduled for a future date. During this period, securities are subject to market fluctuations. The funds will segregate cash, cash equivalents or other appropriate liquid securities on their records in amounts sufficient to meet the purchase price. FUTURES CONTRACTS -- The funds may enter into futures contracts in order to manage the funds' exposure to changes in market conditions. One of the risks of entering into futures contracts is the possibility that the change in value of the contract may not correlate with the changes in value of the underlying securities. Upon entering into a futures contract, the funds are required to deposit either cash or securities in an amount equal to a certain percentage of the contract value (initial margin). Subsequent payments (variation margin) are made or received daily, in cash, by the funds. The variation margin is equal to the daily change in the contract value and is recorded as unrealized gains and losses. The funds recognize a realized gain or loss when the contract is closed or expires. Net realized and unrealized gains or losses occurring during the holding period of futures contracts are a component of realized gain (loss) on investment transactions and unrealized appreciation (depreciation) on investments, respectively. (continued) - ------ 31 Notes to Financial Statements MAY 31, 2005 1. ORGANIZATION AND SUMMARY OF SIGNIFICANT ACCOUNTING POLICIES (CONTINUED) INCOME TAX STATUS -- It is each fund's policy to distribute substantially all net investment income and net realized gains to shareholders and to otherwise qualify as a regulated investment company under provisions of the Internal Revenue Code. Accordingly, no provision has been made for federal or state income taxes. DISTRIBUTIONS TO SHAREHOLDERS -- Distributions from net investment income are declared daily and paid monthly. Distributions from net realized gains, if any, are generally declared and paid annually. INDEMNIFICATIONS -- Under the trust's organizational documents, its officers and trustees are indemnified against certain liabilities arising out of the performance of their duties to the funds. In addition, in the normal course of business, the funds enter into contracts that provide general indemnifications. The funds maximum exposure under these arrangements is unknown as this would involve future claims that may be made against the funds. The risk of material loss from such claims is considered by management to be remote. USE OF ESTIMATES -- The financial statements are prepared in conformity with accounting principles generally accepted in the United States of America, which may require management to make certain estimates and assumptions at the date of the financial statements. Actual results could differ from these estimates. 2. FEES AND TRANSACTIONS WITH RELATED PARTIES MANAGEMENT FEES -- The trust has entered into a Management Agreement with American Century Investment Management, Inc. (ACIM) (investment advisor), under which ACIM provides the funds with investment advisory and management services in exchange for a single, unified management fee (the fee) per class. The Agreement provides that all expenses of the funds, except brokerage commissions, taxes, interest, fees and expenses of those trustees who are not considered "interested persons" as defined in the 1940 Act (including counsel fees) and extraordinary expenses, will be paid by ACIM. The fee is computed and accrued daily based on the daily net assets of each specific class of shares of each fund and paid monthly in arrears. The fee consists of (1) an Investment Category Fee based on the daily net assets of the funds and certain other accounts managed by the investment advisor that are in the same broad investment category as each fund and (2) a Complex Fee based on the assets of all the funds in the American Century family of funds. The rates for the Investment Category Fee range from 0.1625% to 0.2800% for Arizona Municipal and Florida Municipal, and from 0.2925% to 0.4100% for High-Yield. The rates for the Complex Fee range from 0.2500% to 0.3100% for all classes. For the year ended May 31, 2005, the effective annual management fee for the Investor Class, A Class, B Class and C Class of Arizona Municipal, Florida Municipal and High-Yield Municipal were 0.49%, 0.49%, and 0.62%, respectively. DISTRIBUTION AND SERVICE FEES -- The Board of Trustees has adopted a separate Master Distribution and Individual Shareholder Services Plan for each of the A Class, B Class and C Class (collectively, the plans), pursuant to Rule 12b-1 of the 1940 Act. The plans provide that the B Class and C Class will pay American Century Investment Services, Inc. (ACIS) the following annual distribution and service fees: - -------------------------------------------------------------------------------- B & C - -------------------------------------------------------------------------------- Distribution Fee 0.75% - -------------------------------------------------------------------------------- Service Fee 0.25% - -------------------------------------------------------------------------------- The plans provide that the A Class will pay ACIS an annual distribution and service fee of 0.25%. The fees are computed and accrued daily based on each class's daily net assets and paid monthly in arrears. The distribution fee provides compensation for expenses incurred in connection with distributing shares of the classes including, but not limited to, payments to brokers, dealers, and financial institutions that have entered into sales agreements with respect to shares of the funds. The service fee provides compensation for individual shareholder services rendered by broker/dealers or other independent financial intermediaries. During the year ended May 31, 2005, the A Class of High-Yield Municipal received reimbursements of $14 of its distribution and service fees. The reimbursements had no impact on the ratio of operating expenses to average net assets or the ratio of net investment income to average net assets. Fees incurred under the plans during the year ended May 31, 2005, are detailed in the Statement of Operations. RELATED PARTIES -- Certain officers and trustees of the trust are also officers and/or directors, and, as a group, controlling stockholders of American (continued) - ------ 32 Notes to Financial Statements MAY 31, 2005 2. FEES AND TRANSACTIONS WITH RELATED PARTIES (CONTINUED) Century Companies, Inc. (ACC), the parent of the trust's investment advisor, ACIM, the distributor of the trust, ACIS, and the trust's transfer agent, American Century Services, LLC (formerly American Century Services Corporation) The funds have a bank line of credit agreement with JPMorgan Chase Bank (JPMCB). JPMCB is a custodian of the funds and a wholly owned subsidiary of J.P. Morgan Chase & Co. (JPM). JPM is an equity investor in ACC. 3. INVESTMENT TRANSACTIONS Investment transactions, excluding short-term investments, for the year ended May 31, 2005, were as follows: - -------------------------------------------------------------------------------- ARIZONA FLORIDA HIGH-YIELD MUNICIPAL BOND MUNICIPAL BOND MUNICIPAL - -------------------------------------------------------------------------------- Purchases $27,163,760 $24,948,773 $88,327,544 - -------------------------------------------------------------------------------- Proceeds from sales $33,208,779 $33,597,671 $36,223,182 - -------------------------------------------------------------------------------- 4. CAPITAL SHARE TRANSACTIONS Transactions in shares of the fund were as follows (unlimited number of shares authorized): - -------------------------------------------------------------------------------------- ARIZONA MUNICIPAL BOND FLORIDA MUNICIPAL BOND - -------------------------------------------------------------------------------------- SHARES AMOUNT SHARES AMOUNT - -------------------------------------------------------------------------------------- INVESTOR CLASS - -------------------------------------------------------------------------------------- YEAR ENDED MAY 31, 2005 - -------------------------- Sold 497,128 $ 5,453,127 606,561 $ 6,566,886 - -------------------------- Issued in reinvestment of distributions 154,557 1,693,720 120,932 1,308,172 - -------------------------- Redeemed (1,354,587) (14,829,390) (2,066,559) (22,321,798) - -------------------------------------------------------------------------------------- Net decrease (702,902) $ (7,682,543) (1,339,066) $(14,446,740) ====================================================================================== YEAR ENDED MAY 31, 2004 - -------------------------- Sold 1,104,061 $ 12,270,490 2,239,701 $ 24,609,125 - -------------------------- Issued in reinvestment of distributions 194,526 2,153,394 163,544 1,785,188 - -------------------------- Redeemed (2,390,629) (26,478,887) (2,699,299) (29,538,071) - -------------------------------------------------------------------------------------- Net decrease (1,092,042) $(12,055,003) (296,054) $ (3,143,758) ====================================================================================== A CLASS - -------------------------------------------------------------------------------------- YEAR ENDED MAY 31, 2005 - -------------------------- Sold 372,585 $ 4,093,428 195,189 $2,118,110 - -------------------------- Issued in reinvestment of distributions 9,356 102,522 3,574 38,654 - -------------------------- Redeemed (132,782) (1,455,838) (75,286) (817,082) - -------------------------------------------------------------------------------------- Net increase 249,159 $ 2,740,112 123,477 $1,339,682 ====================================================================================== YEAR ENDED MAY 31, 2004(1) - -------------------------- Sold 140,335 $1,525,844 75,652 $812,437 - -------------------------- Issued in reinvestment of distributions 423 4,580 135 1,442 - -------------------------- Redeemed (143) (1,548) (4,564) (49,461) - -------------------------------------------------------------------------------------- Net increase 140,615 $1,528,876 71,223 $764,418 ====================================================================================== (1) February 27, 2004 (commencement of sale) through May 31, 2004. (continued) - ------ 33 Notes to Financial Statements MAY 31, 2005 4. CAPITAL SHARE TRANSACTIONS (CONTINUED) - -------------------------------------------------------------------------------------- ARIZONA MUNICIPAL BOND FLORIDA MUNICIPAL BOND - -------------------------------------------------------------------------------------- SHARES AMOUNT SHARES AMOUNT - -------------------------------------------------------------------------------------- B CLASS - -------------------------------------------------------------------------------------- YEAR ENDED MAY 31, 2005 - -------------------------- Sold -- -- 1,294 $ 13,963 - -------------------------- Issued in reinvestment of distributions 6 $72 29 316 - -------------------------- Redeemed -- -- (1,152) (12,511) - -------------------------------------------------------------------------------------- Net increase 6 $72 171 $ 1,768 ====================================================================================== YEAR ENDED MAY 31, 2004(1) - -------------------------- Sold 222 $2,501 1,618 $17,589 - -------------------------- Issued in reinvestment of distributions 2 17 4 44 - -------------------------------------------------------------------------------------- Net increase 224 $2,518 1,622 $17,633 ====================================================================================== C CLASS - -------------------------------------------------------------------------------------- YEAR ENDED MAY 31, 2005 - -------------------------- Sold 64,215 $704,230 119,292 $1,291,031 - -------------------------- Issued in reinvestment of distributions 244 2,674 667 7,218 - -------------------------- Redeemed -- -- (47,607) (513,485) - -------------------------------------------------------------------------------------- Net increase 64,459 $706,904 72,352 $ 784,764 ====================================================================================== YEAR ENDED MAY 31, 2004(1) - -------------------------- Sold 1,136 $12,287 96,560 $1,063,114 - -------------------------- Issued in reinvestment of distributions 4 32 46 490 - -------------------------------------------------------------------------------------- Net increase 1,140 $12,319 96,606 $1,063,604 ====================================================================================== (1) February 27, 2004 (commencement of sale) through May 31, 2004. - -------------------------------------------------------------------------------- HIGH-YIELD MUNICIPAL - -------------------------------------------------------------------------------- SHARES AMOUNT - -------------------------------------------------------------------------------- INVESTOR CLASS - -------------------------------------------------------------------------------- YEAR ENDED MAY 31, 2005 - ------------------------------------------ Sold 1,643,141 $ 16,916,130 - ------------------------------------------ Issued in reinvestment of distributions 166,485 1,714,843 - ------------------------------------------ Redeemed (1,225,232) (12,610,602) - -------------------------------------------------------------------------------- Net increase (decrease) 584,394 $ 6,020,371 ================================================================================ YEAR ENDED MAY 31, 2004 - ------------------------------------------ Sold 2,105,766 $ 21,372,933 - ------------------------------------------ Issued in reinvestment of distributions 172,654 1,748,659 - ------------------------------------------ Redeemed (2,096,608) (21,123,641) - -------------------------------------------------------------------------------- Net increase (decrease) 181,812 $ 1,997,951 ================================================================================ (continued) - ------ 34 Notes to Financial Statements MAY 31, 2005 4. CAPITAL SHARE TRANSACTIONS (CONTINUED) - -------------------------------------------------------------------------------- HIGH-YIELD MUNICIPAL - -------------------------------------------------------------------------------- SHARES AMOUNT - -------------------------------------------------------------------------------- A CLASS - -------------------------------------------------------------------------------- YEAR ENDED MAY 31, 2005 - ------------------------------------------ Sold 5,239,532 $ 54,036,738 - ------------------------------------------ Issued in reinvestment of distributions 197,779 2,042,149 - ------------------------------------------ Redeemed (1,216,527) (12,559,763) - -------------------------------------------------------------------------------- Net increase 4,220,784 $ 43,519,124 ================================================================================ YEAR ENDED MAY 31, 2004 - ------------------------------------------ Sold 3,322,531 $33,809,734 - ------------------------------------------ Issued in reinvestment of distributions 58,748 596,254 - ------------------------------------------ Redeemed (267,633) (2,706,887) - -------------------------------------------------------------------------------- Net increase 3,113,646 $31,699,101 ================================================================================ B CLASS - -------------------------------------------------------------------------------- YEAR ENDED MAY 31, 2005 - ------------------------------------------ Sold 127,879 $1,316,273 - ------------------------------------------ Issued in reinvestment of distributions 3,482 35,901 - ------------------------------------------ Redeemed (44,038) (455,285) - -------------------------------------------------------------------------------- Net increase 87,323 $ 896,889 ================================================================================ YEAR ENDED MAY 31, 2004 - ------------------------------------------ Sold 190,141 $1,926,243 - ------------------------------------------ Issued in reinvestment of distributions 1,944 19,717 - ------------------------------------------ Redeemed (8,032) (81,096) - -------------------------------------------------------------------------------- Net increase 184,053 $1,864,864 ================================================================================ C CLASS - -------------------------------------------------------------------------------- YEAR ENDED MAY 31, 2005 - ------------------------------------------ Sold 893,109 $ 9,203,406 - ------------------------------------------ Issued in reinvestment of distributions 12,105 125,038 - ------------------------------------------ Redeemed (131,081) (1,352,304) - -------------------------------------------------------------------------------- Net increase 774,133 $ 7,976,140 ================================================================================ YEAR ENDED MAY 31, 2004 - ------------------------------------------ Sold 747,335 $7,588,614 - ------------------------------------------ Issued in reinvestment of distributions 3,584 36,339 - ------------------------------------------ Redeemed (50,448) (514,960) - -------------------------------------------------------------------------------- Net increase 700,471 $7,109,993 ================================================================================ 5. BANK LINE OF CREDIT The funds, along with certain other funds managed by ACIM or American Century Global Investment Management, Inc. (ACGIM), have a $575,000,000 unsecured bank line of credit agreement with JPMCB, which was renewed from $650,000,000 effective December 15, 2004. The funds may borrow money for temporary or emergency purposes to fund shareholder redemptions. Borrowings under the agreement bear interest at the Federal Funds rate plus 0.50%. The funds did not borrow from the line during the year ended May 31, 2005. (continued) - ------ 35 Notes to Financial Statements MAY 31, 2005 6. RISK FACTORS Arizona Municipal and Florida Municipal concentrate their investments in a single state and therefore may have more exposure to credit risk related to the state of Arizona and Florida, respectively, than a fund with a broader geographical diversification. Income may be subject to state and local taxes and, if applicable, the alternative minimum tax. High-Yield Municipal may concentrate its investments in certain states and therefore may have more exposure to credit risk related to those states than a fund with a broader geographical diversification. High-Yield Municipal invests primarily in lower-rated debt securities, which are subject to substantial risks including price volatility, liquidity risk, and default risk. Income may be subject to state and local taxes and, if applicable, the alternative minimum tax. 7. FEDERAL TAX INFORMATION The tax character of distributions paid during the years May 31, 2005 and May 31, 2004 were as follows: - ---------------------------------------------------------------------------------------------------- ARIZONA MUNICIPAL BOND FLORIDA MUNICIPAL BOND HIGH-YIELD MUNICIPAL - ---------------------------------------------------------------------------------------------------- 2005 2004 2005 2004 2005 2004 - ---------------------------------------------------------------------------------------------------- DISTRIBUTIONS PAID FROM - ---------------------------------------------------------------------------------------------------- Ordinary income $2,278,480 $2,710,226 $2,157,343 $2,627,402 $5,964,223 $3,730,694 - ---------------------------------------------------------------------------------------------------- Long-term capital gains $13,495 $1,621 -- $3,596 -- -- - ---------------------------------------------------------------------------------------------------- The character of distributions made during the year from net investment income or net realized gains may differ from their ultimate characterization for federal income tax purposes. These differences reflect the differing character of certain income items and net realized gains and losses for financial statement and tax purposes, and may result in reclassification among certain capital accounts on the financial statements. As of May 31, 2005, the components of distributable earnings on a tax-basis and the federal tax cost of investments were as follows: - -------------------------------------------------------------------------------- ARIZONA FLORIDA HIGH-YIELD MUNICIPAL BOND MUNICIPAL BOND MUNICIPAL - -------------------------------------------------------------------------------- COMPONENTS OF DISTRIBUTABLE EARNINGS AND TAX COST - -------------------------------------------------------------------------------- Federal tax cost of investments $55,689,477 $50,255,920 $153,179,743 ================================================================================ Gross tax appreciation of investments $2,772,942 $2,610,225 $6,904,107 - ------------------------------ Gross tax depreciation of investments (168,001) (1,617) (12,605) - -------------------------------------------------------------------------------- Net tax appreciation of investments $2,604,941 $2,608,608 $6,891,502 ================================================================================ Undistributed ordinary income $26,938 -- $11,059 - ------------------------------ Accumulated long-term gains $61,076 -- -- - ------------------------------ Accumulated capital losses -- $(506,351) $(2,656,716) - ------------------------------ Capital loss deferral -- $(20,323) -- - -------------------------------------------------------------------------------- The cost of investments for federal income tax purposes was the same as the cost for financial reporting purposes. The accumulated capital losses listed above represent net capital loss carryovers that may be used to offset future realized capital gains for federal income tax purposes. (continued) - ------ 36 Notes to Financial Statements MAY 31, 2005 7. FEDERAL TAX INFORMATION (CONTINUED) The capital loss carryovers expire as follows: - ---------------------------------------------------------------------------------------------------- 2008 2009 2010 2011 2012 2013 - ---------------------------------------------------------------------------------------------------- Florida Municipal Bond -- -- -- -- $(144,485) $(361,866) - ---------------------------------------------------------------------------------------------------- High-Yield Municipal $(396,804) $(1,090,034) $(323,643) -- $(145,918) $(700,317) - ---------------------------------------------------------------------------------------------------- The capital loss deferrals represent net capital losses incurred in the seven-month period ended May 31, 2005. The funds have elected to treat such losses as having been incurred in the following fiscal year for federal income tax purposes. 8. OTHER TAX INFORMATION (UNAUDITED) The following information is provided pursuant to provisions of the Internal Revenue Code. The funds designate exempt interest and capital gain dividends for the fiscal year ended May 31, 2005, as follows: - -------------------------------------------------------------------------------- ARIZONA FLORIDA HIGH-YIELD MUNICIPAL BOND MUNICIPAL BOND MUNICIPAL - -------------------------------------------------------------------------------- Exempt interest dividends $2,272,885 $2,167,037 $5,892,577 - -------------------------------------------------------------------------------- Long-term capital gain $13,494 -- -- - -------------------------------------------------------------------------------- - ------ 37 Arizona Municipal Bond - Financial Highlights FOR A SHARE OUTSTANDING THROUGHOUT THE YEARS ENDED MAY 31 - -------------------------------------------------------------------------------- INVESTOR CLASS - -------------------------------------------------------------------------------- 2005 2004 2003 2002 2001 - -------------------------------------------------------------------------------- PER-SHARE DATA - -------------------------------------------------------------------------------- Net Asset Value, Beginning of Period $10.83 $11.40 $10.89 $10.69 $10.12 - -------------------------------------------------------------------------------- Income From Investment Operations - --------------------------- Net Investment Income 0.42 0.41 0.41 0.44 0.48 - --------------------------- Net Realized and Unrealized Gain (Loss) 0.13 (0.53) 0.59 0.27 0.57 - -------------------------------------------------------------------------------- Total From Investment Operations 0.55 (0.12) 1.00 0.71 1.05 - -------------------------------------------------------------------------------- Distributions - ------------------------- From Net Investment Income (0.42) (0.41) (0.41) (0.44) (0.48) - --------------------------- From Net Realized Gains --(1) (0.04) (0.08) (0.07) -- - -------------------------------------------------------------------------------- Total Distributions (0.42) (0.45) (0.49) (0.51) (0.48) - -------------------------------------------------------------------------------- Net Asset Value, End of Period $10.96 $10.83 $11.40 $10.89 $10.69 ================================================================================ TOTAL RETURN(2) 5.21% (1.06)% 9.36% 6.74% 10.57% RATIOS/SUPPLEMENTAL DATA - -------------------------------------------------------------------------------- Ratio of Operating Expenses to Average Net Assets 0.50% 0.51% 0.51% 0.51% 0.51% - ------------------------- Ratio of Net Investment Income to Average Net Assets 3.86% 3.70% 3.70% 4.04% 4.57% - ------------------------- Portfolio Turnover Rate 48% 26% 50% 77% 104% - ------------------------- Net Assets, End of Period (in thousands) $53,203 $60,203 $75,787 $66,327 $50,309 - -------------------------------------------------------------------------------- (1) Per-share amount is less than $0.005. (2) Total return assumes reinvestment of net investment income and capital gains distributions, if any. The total return of the classes may not precisely reflect the class expense differences because of the impact of calculating the net asset values to two decimal places. If net asset values were calculated to three decimal places, the total return differences would more closely reflect the class expense differences. The calculation of net asset values to two decimal places is made in accordance with SEC guidelines and does not result in any gain or loss of value between one class and another. See Notes to Financial Statements. - ------ 38 Arizona Municipal Bond - Financial Highlights FOR A SHARE OUTSTANDING THROUGHOUT THE YEARS ENDED MAY 31 (EXCEPT AS NOTED) - -------------------------------------------------------------------------------- A CLASS - -------------------------------------------------------------------------------- 2005 2004(1) - -------------------------------------------------------------------------------- PER-SHARE DATA - -------------------------------------------------------------------------------- Net Asset Value, Beginning of Period $10.83 $11.25 - -------------------------------------------------------------------------------- Income From Investment Operations - ----------------------------------------------------- Net Investment Income 0.40 0.10 - ----------------------------------------------------- Net Realized and Unrealized Gain (Loss) 0.13 (0.42) - -------------------------------------------------------------------------------- Total From Investment Operations 0.53 (0.32) - -------------------------------------------------------------------------------- Distributions - ----------------------------------------------------- From Net Investment Income (0.40) (0.10) - ----------------------------------------------------- From Net Realized Gains --(2) -- - -------------------------------------------------------------------------------- Total Distributions (0.40) (0.10) - -------------------------------------------------------------------------------- Net Asset Value, End of Period $10.96 $10.83 ================================================================================ TOTAL RETURN(3) 4.94% (2.87)% RATIOS/SUPPLEMENTAL DATA - -------------------------------------------------------------------------------- Ratio of Operating Expenses to Average Net Assets 0.75% 0.76%(4) - ----------------------------------------------------- Ratio of Net Investment Income to Average Net Assets 3.61% 3.63%(4) - ----------------------------------------------------- Portfolio Turnover Rate 48% 26%(5) - ----------------------------------------------------- Net Assets, End of Period (in thousands) $4,271 $1,523 - -------------------------------------------------------------------------------- (1) February 27, 2004 (commencement of sale) through May 31, 2004. (2) Per-share amount is less than $0.005. (3) Total return assumes reinvestment of net investment income and capital gains distributions, if any, and does not include any applicable sales charges. Total returns for periods less than one year are not annualized. The total return of the classes may not precisely reflect the class expense differences because of the impact of calculating the net asset values to two decimal places. If net asset values were calculated to three decimal places, the total return differences would more closely reflect the class expense differences. The calculation of net asset values to two decimal places is made in accordance with SEC guidelines and does not result in any gain or loss of value between one class and another. (4) Annualized. (5) Portfolio turnover is calculated at the fund level. Percentage indicated was calculated for the year ended May 31, 2004. - ------ 39 See Notes to Financial Statements. Arizona Municipal Bond - Financial Highlights FOR A SHARE OUTSTANDING THROUGHOUT THE YEARS ENDED MAY 31 (EXCEPT AS NOTED) - -------------------------------------------------------------------------------- B CLASS - -------------------------------------------------------------------------------- 2005 2004(1) - -------------------------------------------------------------------------------- PER-SHARE DATA - -------------------------------------------------------------------------------- Net Asset Value, Beginning of Period $10.83 $11.25 - -------------------------------------------------------------------------------- Income From Investment Operations - ----------------------------------------------------- Net Investment Income 0.32 0.08 - ----------------------------------------------------- Net Realized and Unrealized Gain (Loss) 0.13 (0.42) - -------------------------------------------------------------------------------- Total From Investment Operations 0.45 (0.34) - -------------------------------------------------------------------------------- Distributions - ----------------------------------------------------- From Net Investment Income (0.32) (0.08) - ----------------------------------------------------- From Net Realized Gains --(2) -- - -------------------------------------------------------------------------------- Total Distributions (0.32) (0.08) - -------------------------------------------------------------------------------- Net Asset Value, End of Period $10.96 $10.83 ================================================================================ TOTAL RETURN(3)(3) 4.19% (3.06)% RATIOS/SUPPLEMENTAL DATA - -------------------------------------------------------------------------------- Ratio of Operating Expenses to Average Net Assets 1.50% 1.51%(4) - ----------------------------------------------------- Ratio of Net Investment Income to Average Net Assets 2.86% 2.88%(4) - ----------------------------------------------------- Portfolio Turnover Rate 48% 26%(5) - ----------------------------------------------------- Net Assets, End of Period (in thousands) $3 $2 - -------------------------------------------------------------------------------- (1) February 27, 2004 (commencement of sale) through May 31, 2004. (2) Per-share amount is less than $0.005. (3) Total return assumes reinvestment of net investment income and capital gains distributions, if any, and does not include any applicable sales charges. Total returns for periods less than one year are not annualized. The total return of the classes may not precisely reflect the class expense differences because of the impact of calculating the net asset values to two decimal places. If net asset values were calculated to three decimal places, the total return differences would more closely reflect the class expense differences. The calculation of net asset values to two decimal places is made in accordance with SEC guidelines and does not result in any gain or loss of value between one class and another. (4) Annualized. (5) Portfolio turnover is calculated at the fund level. Percentage indicated was calculated for the year ended May 31, 2004. See Notes to Financial Statements. - ------ 40 Arizona Municipal Bond - Financial Highlights FOR A SHARE OUTSTANDING THROUGHOUT THE YEARS ENDED MAY 31 (EXCEPT AS NOTED) - -------------------------------------------------------------------------------- C CLASS - -------------------------------------------------------------------------------- 2005 2004(1) - -------------------------------------------------------------------------------- PER-SHARE DATA - -------------------------------------------------------------------------------- Net Asset Value, Beginning of Period $10.83 $11.25 - -------------------------------------------------------------------------------- Income From Investment Operations - ----------------------------------------------------- Net Investment Income 0.31 0.08 - ----------------------------------------------------- Net Realized and Unrealized Gain (Loss) 0.13 (0.42) - -------------------------------------------------------------------------------- Total From Investment Operations 0.44 (0.34) - -------------------------------------------------------------------------------- Distributions - ----------------------------------------------------- From Net Investment Income (0.31) (0.08) - ----------------------------------------------------- From Net Realized Gains --(2) -- - -------------------------------------------------------------------------------- Total Distributions (0.31) (0.08) - -------------------------------------------------------------------------------- Net Asset Value, End of Period $10.96 $10.83 ================================================================================ TOTAL RETURN(3) 4.15% (3.06)% RATIOS/SUPPLEMENTAL DATA - -------------------------------------------------------------------------------- Ratio of Operating Expenses to Average Net Assets 1.50% 1.51%(4) - ----------------------------------------------------- Ratio of Net Investment Income to Average Net Assets 2.86% 2.88%(4) - ----------------------------------------------------- Portfolio Turnover Rate 48% 26%(5) - ----------------------------------------------------- Net Assets, End of Period (in thousands) $719 $12 - -------------------------------------------------------------------------------- (1) February 27, 2004 (commencement of sale) through May 31, 2004. (2) Per-share amount is less than $0.005. (3) Total return assumes reinvestment of net investment income and capital gains distributions, if any, and does not include any applicable sales charges. Total returns for periods less than one year are not annualized. The total return of the classes may not precisely reflect the class expense differences because of the impact of calculating the net asset values to two decimal places. If net asset values were calculated to three decimal places, the total return differences would more closely reflect the class expense differences. The calculation of net asset values to two decimal places is made in accordance with SEC guidelines and does not result in any gain or loss of value between one class and another. (4) Annualized. (5) Portfolio turnover is calculated at the fund level. Percentage indicated was calculated for the year ended May 31, 2004. See Notes to Financial Statements. - ------ 41 Florida Municipal Bond - Financial Highlights FOR A SHARE OUTSTANDING THROUGHOUT THE YEARS ENDED MAY 31 - -------------------------------------------------------------------------------- INVESTOR CLASS - -------------------------------------------------------------------------------- 2005 2004 2003 2002 2001 - -------------------------------------------------------------------------------- PER-SHARE DATA - -------------------------------------------------------------------------------- Net Asset Value, Beginning of Period $10.68 $11.29 $10.73 $10.67 $10.08 - -------------------------------------------------------------------------------- Income From Investment Operations - ---------------------------- Net Investment Income 0.39 0.42 0.42 0.44 0.47 - ---------------------------- Net Realized and Unrealized Gain (Loss) 0.13 (0.56) 0.62 0.19 0.59 - -------------------------------------------------------------------------------- Total From Investment Operations 0.52 (0.14) 1.04 0.63 1.06 - -------------------------------------------------------------------------------- Distributions - ---------------------------- From Net Investment Income (0.39) (0.42) (0.42) (0.44) (0.47) - ---------------------------- From Net Realized Gains -- (0.05) (0.06) (0.13) -- - -------------------------------------------------------------------------------- Total Distributions (0.39) (0.47) (0.48) (0.57) (0.47) - -------------------------------------------------------------------------------- Net Asset Value, End of Period $10.81 $10.68 $11.29 $10.73 $10.67 ================================================================================ TOTAL RETURN(1) 4.88% (1.30)% 9.90% 5.98% 10.70% RATIOS/SUPPLEMENTAL DATA - -------------------------------------------------------------------------------- Ratio of Operating Expenses to Average Net Assets 0.50% 0.51% 0.51% 0.51% 0.51% - ---------------------------- Ratio of Net Investment Income to Average Net Assets 3.56% 3.82% 3.78% 4.03% 4.49% - ---------------------------- Portfolio Turnover Rate 44% 59% 45% 75% 138% - ---------------------------- Net Assets, End of Period (in thousands) $49,451 $63,142 $70,078 $54,565 $53,860 - -------------------------------------------------------------------------------- (1) Total return assumes reinvestment of net investment income and capital gains distributions, if any. The total return of the classes may not precisely reflect the class expense differences because of the impact of calculating the net asset values to two decimal places. If net asset values were calculated to three decimal places, the total return differences would more closely reflect the class expense differences. The calculation of net asset values to two decimal places is made in accordance with SEC guidelines and does not result in any gain or loss of value between one class and another. See Notes to Financial Statements. - ------ 42 Florida Municipal Bond - Financial Highlights FOR A SHARE OUTSTANDING THROUGHOUT THE YEARS ENDED MAY 31 (EXCEPT AS NOTED) - -------------------------------------------------------------------------------- A CLASS - -------------------------------------------------------------------------------- 2005 2004(1) - -------------------------------------------------------------------------------- PER-SHARE DATA - -------------------------------------------------------------------------------- Net Asset Value, Beginning of Period $10.68 $11.11 - -------------------------------------------------------------------------------- Income From Investment Operations - ----------------------------------------------------- Net Investment Income 0.36 0.09 - ----------------------------------------------------- Net Realized and Unrealized Gain (Loss) 0.13 (0.43) - -------------------------------------------------------------------------------- Total From Investment Operations 0.49 (0.34) - -------------------------------------------------------------------------------- Distributions - ----------------------------------------------------- From Net Investment Income (0.36) (0.09) - -------------------------------------------------------------------------------- Net Asset Value, End of Period $10.81 $10.68 ================================================================================ TOTAL RETURN(2) 4.62% (3.10)% RATIOS/SUPPLEMENTAL DATA - -------------------------------------------------------------------------------- Ratio of Operating Expenses to Average Net Assets 0.75% 0.76%(3) - ----------------------------------------------------- Ratio of Net Investment Income to Average Net Assets 3.31% 3.34%(3) - ----------------------------------------------------- Portfolio Turnover Rate 44% 59%(4) - ----------------------------------------------------- Net Assets, End of Period (in thousands) $2,105 $761 - -------------------------------------------------------------------------------- (1) February 27, 2004 (commencement of sale) through May 31, 2004. (2) Total return assumes reinvestment of net investment income and capital gains distributions, if any, and does not include any applicable sales charges. Total returns for periods less than one year are not annualized. The total return of the classes may not precisely reflect the class expense differences because of the impact of calculating the net asset values to two decimal places. If net asset values were calculated to three decimal places, the total return differences would more closely reflect the class expense differences. The calculation of net asset values to two decimal places is made in accordance with SEC guidelines and does not result in any gain or loss of value between one class and another. (3) Annualized. (4) Portfolio turnover is calculated at the fund level. Percentage indicated was calculated for the year ended May 31, 2004. See Notes to Financial Statements. - ------ 43 Florida Municipal Bond - Financial Highlights FOR A SHARE OUTSTANDING THROUGHOUT THE YEARS ENDED MAY 31 (EXCEPT AS NOTED) - -------------------------------------------------------------------------------- B CLASS - -------------------------------------------------------------------------------- 2005 2004(1) - -------------------------------------------------------------------------------- PER-SHARE DATA - -------------------------------------------------------------------------------- Net Asset Value, Beginning of Period $10.68 $11.11 - -------------------------------------------------------------------------------- Income From Investment Operations - ----------------------------------------------------- Net Investment Income 0.28 0.07 - ----------------------------------------------------- Net Realized and Unrealized Gain (Loss) 0.13 (0.43) - -------------------------------------------------------------------------------- Total From Investment Operations 0.41 (0.36) - -------------------------------------------------------------------------------- Distributions - ----------------------------------------------------- From Net Investment Income (0.28) (0.07) - -------------------------------------------------------------------------------- Net Asset Value, End of Period $10.81 $10.68 ================================================================================ TOTAL RETURN(2) 3.83% (3.28)% RATIOS/SUPPLEMENTAL DATA - -------------------------------------------------------------------------------- Ratio of Operating Expenses to Average Net Assets 1.50% 1.51%(3) - ----------------------------------------------------- Ratio of Net Investment Income to Average Net Assets 2.56% 2.59%(3) - ----------------------------------------------------- Portfolio Turnover Rate 44% 59%(4) - ----------------------------------------------------- Net Assets, End of Period (in thousands) $19 $17 - -------------------------------------------------------------------------------- (1) February 27, 2004 (commencement of sale) through May 31, 2004. (2) Total return assumes reinvestment of net investment income and capital gains distributions, if any, and does not include any applicable sales charges. Total returns for periods less than one year are not annualized. The total return of the classes may not precisely reflect the class expense differences because of the impact of calculating the net asset values to two decimal places. If net asset values were calculated to three decimal places, the total return differences would more closely reflect the class expense differences. The calculation of net asset values to two decimal places is made in accordance with SEC guidelines and does not result in any gain or loss of value between one class and another. (3) Annualized. (4) Portfolio turnover is calculated at the fund level. Percentage indicated was calculated for the year ended May 31, 2004. See Notes to Financial Statements. - ------ 44 Florida Municipal Bond - Financial Highlights FOR A SHARE OUTSTANDING THROUGHOUT THE YEARS ENDED MAY 31 (EXCEPT AS NOTED) - -------------------------------------------------------------------------------- C CLASS - -------------------------------------------------------------------------------- 2005 2004(1) - -------------------------------------------------------------------------------- PER-SHARE DATA - -------------------------------------------------------------------------------- Net Asset Value, Beginning of Period $10.68 $11.11 - -------------------------------------------------------------------------------- Income From Investment Operations - ----------------------------------------------------- Net Investment Income 0.28 0.07 - ----------------------------------------------------- Net Realized and Unrealized Gain (Loss) 0.13 (0.43) - -------------------------------------------------------------------------------- Total From Investment Operations 0.41 (0.36) - -------------------------------------------------------------------------------- Distributions - ----------------------------------------------------- From Net Investment Income (0.28) (0.07) - -------------------------------------------------------------------------------- Net Asset Value, End of Period $10.81 $10.68 ================================================================================ TOTAL RETURN(2) 3.84% (3.28)% RATIOS/SUPPLEMENTAL DATA - -------------------------------------------------------------------------------- Ratio of Operating Expenses to Average Net Assets 1.50% 1.51%(3) - ----------------------------------------------------- Ratio of Net Investment Income to Average Net Assets 2.56% 2.59%(3) - ----------------------------------------------------- Portfolio Turnover Rate 44% 59%(4) - ----------------------------------------------------- Net Assets, End of Period (in thousands) $1,827 $1,032 - -------------------------------------------------------------------------------- (1) February 27, 2004 (commencement of sale) through May 31, 2004. (2) Total return assumes reinvestment of net investment income and capital gains distributions, if any, and does not include any applicable sales charges. Total returns for periods less than one year are not annualized. The total return of the classes may not precisely reflect the class expense differences because of the impact of calculating the net asset values to two decimal places. If net asset values were calculated to three decimal places, the total return differences would more closely reflect the class expense differences. The calculation of net asset values to two decimal places is made in accordance with SEC guidelines and does not result in any gain or loss of value between one class and another. (3) Annualized. (4) Portfolio turnover is calculated at the fund level. Percentage indicated was calculated for the year ended May 31, 2004. - ------ 45 See Notes to Financial Statements. High-Yield Municipal - Financial Highlights FOR A SHARE OUTSTANDING THROUGHOUT THE YEARS ENDED MAY 31 - -------------------------------------------------------------------------------- INVESTOR CLASS - -------------------------------------------------------------------------------- 2005 2004 2003 2002 2001 - -------------------------------------------------------------------------------- PER-SHARE DATA - -------------------------------------------------------------------------------- Net Asset Value, Beginning of Period $10.04 $10.25 $9.87 $9.62 $9.32 - -------------------------------------------------------------------------------- Income From Investment Operations - ------------------------- Net Investment Income 0.51 0.52 0.53 0.53 0.53 - ------------------------- Net Realized and Unrealized Gain (Loss) 0.46 (0.21) 0.38 0.25 0.30 - -------------------------------------------------------------------------------- Total From Investment Operations 0.97 0.31 0.91 0.78 0.83 - -------------------------------------------------------------------------------- Distributions - ------------------------- From Net Investment Income (0.51) (0.52) (0.53) (0.53) (0.53) - -------------------------------------------------------------------------------- Net Asset Value, End of Period $10.50 $10.04 $10.25 $9.87 $9.62 ================================================================================ TOTAL RETURN(1) 9.84% 3.07% 9.40% 8.25% 9.13% RATIOS/SUPPLEMENTAL DATA - -------------------------------------------------------------------------------- Ratio of Operating Expenses to Average Net Assets 0.63% 0.64% 0.64% 0.64% 0.64% - ------------------------- Ratio of Net Investment Income to Average Net Assets 4.92% 5.06% 5.22% 5.39% 5.59% - ------------------------- Portfolio Turnover Rate 30% 27% 43% 28% 50% - ------------------------- Net Assets, End of Period (in thousands) $62,945 $54,340 $53,621 $36,162 $29,342 - -------------------------------------------------------------------------------- (1) Total return assumes reinvestment of net investment income and capital gains distributions, if any. The total return of the classes may not precisely reflect the class expense differences because of the impact of calculating the net asset values to two decimal places. If net asset values were calculated to three decimal places, the total return differences would more closely reflect the class expense differences. The calculation of net asset values to two decimal places is made in accordance with SEC guidelines and does not result in any gain or loss of value between one class and another. See Notes to Financial Statements. - ------ 46 High-Yield Municipal - Financial Highlights FOR A SHARE OUTSTANDING THROUGHOUT THE YEARS ENDED MAY 31 (EXCEPT AS NOTED) - -------------------------------------------------------------------------------- A CLASS - -------------------------------------------------------------------------------- 2005 2004 2003(1) - -------------------------------------------------------------------------------- PER-SHARE DATA - -------------------------------------------------------------------------------- Net Asset Value, Beginning of Period $10.04 $10.25 $10.06 - -------------------------------------------------------------------------------- Income From Investment Operations - ------------------------------------------ Net Investment Income 0.48 0.49 0.17 - ------------------------------------------ Net Realized and Unrealized Gain (Loss) 0.46 (0.21) 0.19 - -------------------------------------------------------------------------------- Total From Investment Operations 0.94 0.28 0.36 - -------------------------------------------------------------------------------- Distributions - ------------------------------------------ From Net Investment Income (0.48) (0.49) (0.17) - -------------------------------------------------------------------------------- Net Asset Value, End of Period $10.50 $10.04 $10.25 ================================================================================ TOTAL RETURN(2) 9.56% 2.81% 3.57% RATIOS/SUPPLEMENTAL DATA - -------------------------------------------------------------------------------- Ratio of Operating Expenses to Average Net Assets 0.88% 0.89% 0.88%(3) - ------------------------------------------ Ratio of Net Investment Income to Average Net Assets 4.67% 4.81% 5.03%(3) - ------------------------------------------ Portfolio Turnover Rate 30% 27% 43%(4) - ------------------------------------------ Net Assets, End of Period (in thousands) $79,154 $33,335 $2,117 - -------------------------------------------------------------------------------- (1) January 31, 2003 (commencement of sale) through May 31, 2003. (2) Total return assumes reinvestment of net investment income and capital gains distributions, if any, and does not include any applicable sales charges. Total returns for periods less than one year are not annualized. The total return of the classes may not precisely reflect the class expense differences because of the impact of calculating the net asset values to two decimal places. If net asset values were calculated to three decimal places, the total return differences would more closely reflect the class expense differences. The calculation of net asset values to two decimal places is made in accordance with SEC guidelines and does not result in any gain or loss of value between one class and another. (3) Annualized. (4) Portfolio turnover is calculated at the fund level. Percentage indicated was calculated for the year ended May 31, 2003. See Notes to Financial Statements. - ------ 47 High-Yield Municipal - Financial Highlights FOR A SHARE OUTSTANDING THROUGHOUT THE YEARS ENDED MAY 31 (EXCEPT AS NOTED) - -------------------------------------------------------------------------------- B CLASS - -------------------------------------------------------------------------------- 2005 2004 2003(1) - -------------------------------------------------------------------------------- PER-SHARE DATA - -------------------------------------------------------------------------------- Net Asset Value, Beginning of Period $10.04 $10.25 $10.06 - -------------------------------------------------------------------------------- Income From Investment Operations - ------------------------------------------ Net Investment Income 0.40 0.42 0.15 - ------------------------------------------ Net Realized and Unrealized Gain (Loss) 0.46 (0.21) 0.19 - -------------------------------------------------------------------------------- Total From Investment Operations 0.86 0.21 0.34 - -------------------------------------------------------------------------------- Distributions - ------------------------------------------ From Net Investment Income (0.40) (0.42) (0.15) - -------------------------------------------------------------------------------- Net Asset Value, End of Period $10.50 $10.04 $10.25 ================================================================================ TOTAL RETURN(2) 8.75% 2.05% 3.44% RATIOS/SUPPLEMENTAL DATA - -------------------------------------------------------------------------------- Ratio of Operating Expenses to Average Net Assets 1.63% 1.64% 1.63%(3) - ------------------------------------------ Ratio of Net Investment Income to Average Net Assets 3.92% 4.06% 4.35%(3) - ------------------------------------------ Portfolio Turnover Rate 30% 27% 43%(4) - ------------------------------------------ Net Assets, End of Period (in thousands) $3,573 $2,541 $708 - -------------------------------------------------------------------------------- (1) January 31, 2003 (commencement of sale) through May 31, 2003. (2) Total return assumes reinvestment of net investment income and capital gains distributions, if any, and does not include any applicable sales charges. Total returns for periods less than one year are not annualized. The total return of the classes may not precisely reflect the class expense differences because of the impact of calculating the net asset values to two decimal places. If net asset values were calculated to three decimal places, the total return differences would more closely reflect the class expense differences. The calculation of net asset values to two decimal places is made in accordance with SEC guidelines and does not result in any gain or loss of value between one class and another. (3) Annualized. (4) Portfolio turnover is calculated at the fund level. Percentage indicated was calculated for the year ended May 31, 2003. See Notes to Financial Statements. - ------ 48 High-Yield Municipal - Financial Highlights FOR A SHARE OUTSTANDING THROUGHOUT THE YEARS ENDED MAY 31 (EXCEPT AS NOTED) - -------------------------------------------------------------------------------- C CLASS - -------------------------------------------------------------------------------- 2005 2004 2003(1) - -------------------------------------------------------------------------------- PER-SHARE DATA - -------------------------------------------------------------------------------- Net Asset Value, Beginning of Period $10.04 $10.25 $10.03 - -------------------------------------------------------------------------------- Income From Investment Operations - -------------------------------------------------- Net Investment Income 0.40 0.43 0.39 - -------------------------------------------------- Net Realized and Unrealized Gain (Loss) 0.46 (0.21) 0.22 - -------------------------------------------------------------------------------- Total From Investment Operations 0.86 0.22 0.61 - -------------------------------------------------------------------------------- Distributions - -------------------------------------------------- From Net Investment Income (0.40) (0.43) (0.39) - -------------------------------------------------------------------------------- Net Asset Value, End of Period $10.50 $10.04 $10.25 ================================================================================ TOTAL RETURN(2) 8.74% 2.20% 6.15% RATIOS/SUPPLEMENTAL DATA - -------------------------------------------------------------------------------- Ratio of Operating Expenses to Average Net Assets 1.63% 1.54% 1.39%(3) - -------------------------------------------------- Ratio of Net Investment Income to Average Net Assets 3.92% 4.16% 4.55%(3) - -------------------------------------------------- Portfolio Turnover Rate 30% 27% 43%(4) - -------------------------------------------------- Net Assets, End of Period (in thousands) $16,967 $8,457 $1,454 - -------------------------------------------------------------------------------- (1) July 24, 2002 (commencement of sale) through May 31, 2003. (2) Total return assumes reinvestment of net investment income and capital gains distributions, if any, and does not include any applicable sales charges. Total returns for periods less than one year are not annualized. The total return of the classes may not precisely reflect the class expense differences because of the impact of calculating the net asset values to two decimal places. If net asset values were calculated to three decimal places, the total return differences would more closely reflect the class expense differences. The calculation of net asset values to two decimal places is made in accordance with SEC guidelines and does not result in any gain or loss of value between one class and another. (3) Annualized. (4) Portfolio turnover is calculated at the fund level. Percentage indicated was calculated for the year ended May 31, 2003. See Notes to Financial Statements. - ------ 49 Report of Independent Registered Public Accounting Firm To the Trustees of the American Century Municipal Trust and Shareholders of Arizona Municipal Bond Fund, Florida Municipal Bond Fund and High-Yield Municipal Fund: In our opinion, the accompanying statements of assets and liabilities, including the schedules of investments, and the related statements of operations and of changes in net assets and the financial highlights present fairly, in all material respects, the financial position of the Arizona Municipal Bond Fund, the Florida Municipal Bond Fund and the High-Yield Municipal Fund (three of the five funds in the American Century Municipal Trust hereafter referred to as the "Funds") at May 31, 2005, the results of each of their operations for the year then ended, the changes in each of their net assets for each of the two years in the period then ended and the financial highlights for each of the periods presented, in conformity with accounting principles generally accepted in the United States of America. These financial statements and financial highlights (hereafter referred to as "financial statements") are the responsibility of the Funds' management; our responsibility is to express an opinion on these financial statements based on our audits. We conducted our audits of these financial statements in accordance with the standards of the Public Company Accounting Oversight Board (United States). Those standards require that we plan and perform the audit to obtain reasonable assurance about whether the financial statements are free of material misstatement. An audit includes examining, on a test basis, evidence supporting the amounts and disclosures in the financial statements, assessing the accounting principles used and significant estimates made by management, and evaluating the overall financial statement presentation. We believe that our audits, which included confirmation of securities at May 31, 2005 by correspondence with the custodian and brokers, provide a reasonable basis for our opinion. PricewaterhouseCoopers LLP Kansas City, Missouri July 20, 2005 - ------ 50 Management The individuals listed below serve as trustees or officers of the funds. Each trustee serves until his or her successor is duly elected and qualified or until he or she retires. Effective March 2004, mandatory retirement age for independent trustees is 73. However, the mandatory retirement age may be extended for a period not to exceed two years with the approval of the remaining independent trustees. Mr. Scott may serve until age 77 based on an extension granted under retirement guidelines in effect prior to March 2004. Those listed as interested trustees are "interested" primarily by virtue of their engagement as officers of American Century Companies, Inc. (ACC) or its wholly-owned, direct or indirect, subsidiaries, including the funds' investment advisor, American Century Investment Management, Inc. (ACIM); the funds' principal underwriter, American Century Investment Services, Inc. (ACIS); and the funds' transfer agent, American Century Services, LLC (ACS LLC). The other trustees (more than three-fourths of the total number) are independent; that is, they have never been employees or officers of, and have no financial interest in, ACC or any of its wholly-owned, direct or indirect, subsidiaries, including ACIM, ACIS, and ACS LLC. The trustees serve in this capacity for eight registered investment companies in the American Century family of funds. All persons named as officers of the funds also serve in similar capacities for the other 13 investment companies advised by ACIM or American Century Global Investment Management, Inc. (ACGIM), a wholly owned subsidiary of ACIM, unless otherwise noted. Only officers with policy-making functions are listed. No officer is compensated for his or her service as an officer of the funds. The listed officers are interested persons of the funds and are appointed or re-appointed on an annual basis. INDEPENDENT TRUSTEES - -------------------------------------------------------------------------------- ANTONIO CANOVA, 1665 Charleston Road, Mountain View, CA 94043 YEAR OF BIRTH: 1961 POSITION(S) HELD WITH FUND: Trustee LENGTH OF TIME SERVED (YEARS): Less than one year PRINCIPAL OCCUPATION(S) DURING PAST 5 YEARS: Chief Financial Officer, Brocade Communications Systems, Inc. (May 2001 to present); Vice President-Administration, Brocade Communications Systems, Inc. (November 2004 to present); Vice President-Finance, Brocade Communications Systems, Inc. (November 2000 to November 2004); Vice President, Chief Financial Officer and Secretary, Wireless Inc. (April 2000 to November 2000) NUMBER OF PORTFOLIOS IN FUND COMPLEX OVERSEEN BY TRUSTEE: 34 OTHER DIRECTORSHIPS HELD BY TRUSTEE: None - -------------------------------------------------------------------------------- JOHN FREIDENRICH, 1665 Charleston Road, Mountain View, CA 94043 YEAR OF BIRTH: 1937 POSITION(S) HELD WITH FUND: Trustee LENGTH OF TIME SERVED (YEARS): Less than 1 year PRINCIPAL OCCUPATION(S) DURING PAST 5 YEARS: Member and Manager, Regis Management Company, LLC (April 2004 to present); Partner and Founder, Bay Partners (Venture capital firm, 1976 to present); Partner and Founder, Ware & Freidenrich (1968 to present) NUMBER OF PORTFOLIOS IN FUND COMPLEX OVERSEEN BY TRUSTEE: 34 OTHER DIRECTORSHIPS HELD BY TRUSTEE: None - -------------------------------------------------------------------------------- (continued) - ------ 51 Management INDEPENDENT TRUSTEES (CONTINUED) - -------------------------------------------------------------------------------- RONALD J. GILSON, 1665 Charleston Road, Mountain View, CA 94043 YEAR OF BIRTH: 1946 POSITION(S) HELD WITH FUND: Trustee, Chairman of the Board LENGTH OF TIME SERVED (YEARS): 9 PRINCIPAL OCCUPATION(S) DURING PAST 5 YEARS: Charles J. Meyers Professor of Law and Business, Stanford Law School (1979 to present); Marc and Eva Stern Professor of Law and Business, Columbia University School of Law (1992 to present); NUMBER OF PORTFOLIOS IN FUND COMPLEX OVERSEEN BY TRUSTEE: 34 OTHER DIRECTORSHIPS HELD BY TRUSTEE: None - -------------------------------------------------------------------------------- KATHRYN A. HALL, 1665 Charleston Road, Mountain View, CA 94043 YEAR OF BIRTH: 1957 POSITION(S) HELD WITH FUND: Trustee LENGTH OF TIME SERVED (YEARS): 3 PRINCIPAL OCCUPATION(S) DURING PAST 5 YEARS: Co-Chief Executive Officer and Chief Investment Officer, Offit Hall Capital Management, LLC (April 2002 to present); President and Managing Director, Laurel Management Company, L.L.C. (1996 to April 2002) NUMBER OF PORTFOLIOS IN FUND COMPLEX OVERSEEN BY TRUSTEE: 34 OTHER DIRECTORSHIPS HELD BY TRUSTEE: None - -------------------------------------------------------------------------------- MYRON S. SCHOLES, 1665 Charleston Road, Mountain View, CA 94043 YEAR OF BIRTH: 1941 POSITION(S) HELD WITH FUND: Trustee LENGTH OF TIME SERVED (YEARS): 24 PRINCIPAL OCCUPATION(S) DURING PAST 5 YEARS: Chairman, Oak Hill Platinum Partners, and a Partner, Oak Hill Capital Management (1999 to present); Frank E. Buck Professor of Finance-Emeritus, Stanford Graduate School of Business (1981 to present) NUMBER OF PORTFOLIOS IN FUND COMPLEX OVERSEEN BY TRUSTEE: 34 OTHER DIRECTORSHIPS HELD BY TRUSTEE: Director, Dimensional Fund Advisors (investment advisor, 1982 to present); Director, Chicago Mercantile Exchange (2000 to present) - -------------------------------------------------------------------------------- KENNETH E. SCOTT, 1665 Charleston Road, Mountain View, CA 94043 YEAR OF BIRTH: 1928 POSITION(S) HELD WITH FUND: Trustee LENGTH OF TIME SERVED (YEARS): 33 PRINCIPAL OCCUPATION(S) DURING PAST 5 YEARS: Ralph M. Parsons Professor of Law and Business, Stanford Law School (1972 to present) NUMBER OF PORTFOLIOS IN FUND COMPLEX OVERSEEN BY TRUSTEE: 34 OTHER DIRECTORSHIPS HELD BY TRUSTEE: None - -------------------------------------------------------------------------------- JOHN B. SHOVEN, 1665 Charleston Road, Mountain View, CA 94043 YEAR OF BIRTH: 1947 POSITION(S) HELD WITH FUND: Trustee LENGTH OF TIME SERVED (YEARS): 2 PRINCIPAL OCCUPATION(S) DURING PAST 5 YEARS: Professor of Economics, Stanford University (1977 to present) NUMBER OF PORTFOLIOS IN FUND COMPLEX OVERSEEN BY TRUSTEE: 34 OTHER DIRECTORSHIPS HELD BY TRUSTEE: Director, Cadence Design Systems (1992 to present); Director, Watson Wyatt Worldwide (2002 to present); Director, Palmsource Inc. (2002 to present) - -------------------------------------------------------------------------------- JEANNE D. WOHLERS, 1665 Charleston Road, Mountain View, CA 94043 YEAR OF BIRTH: 1945 POSITION(S) HELD WITH FUND: Trustee LENGTH OF TIME SERVED (YEARS): 20 PRINCIPAL OCCUPATION(S) DURING PAST 5 YEARS: Retired, Director and Partner, Windy Hill Productions, LP (educational software, 1994 to 1998) NUMBER OF PORTFOLIOS IN FUND COMPLEX OVERSEEN BY TRUSTEE: 34 OTHER DIRECTORSHIPS HELD BY TRUSTEE: Director, Quintus Corporation (automation solutions, 1995 to present) - -------------------------------------------------------------------------------- (continued) - ------ 52 Management INTERESTED TRUSTEE - -------------------------------------------------------------------------------- WILLIAM M. LYONS, 4500 Main Street, Kansas City, MO 64111 YEAR OF BIRTH: 1955 POSITION(S) HELD WITH FUND: Trustee LENGTH OF TIME SERVED (YEARS): 7 PRINCIPAL OCCUPATION(S) DURING PAST 5 YEARS: Chief Executive Officer, ACC (September 2000 to present); President, ACC (June 1997 to present); Chief Operating Officer, ACC (June 1996 to September 2000); Also serves as: Chief Executive Officer and President, ACIS, ACGIM, ACIM and other ACC subsidiaries; Executive Vice President, ACS LLC; Director, ACC, ACGIM, ACIM, ACIS, ACS LLC and other ACC subsidiaries NUMBER OF PORTFOLIOS IN FUND COMPLEX OVERSEEN BY TRUSTEE: 34 OTHER DIRECTORSHIPS HELD BY TRUSTEE: None - -------------------------------------------------------------------------------- OFFICERS - -------------------------------------------------------------------------------- WILLIAM M. LYONS, 4500 Main Street, Kansas City, MO 64111 YEAR OF BIRTH: 1955 POSITION(S) HELD WITH FUND: President LENGTH OF TIME SERVED (YEARS): 4 PRINCIPAL OCCUPATION(S) DURING PAST 5 YEARS: See entry under "Interested Trustee." - -------------------------------------------------------------------------------- ROBERT T. JACKSON, 4500 Main Street, Kansas City, MO 64111 YEAR OF BIRTH: 1946 POSITION(S) HELD WITH FUND: Executive Vice President LENGTH OF TIME SERVED (YEARS): 9 PRINCIPAL OCCUPATION(S) DURING PAST 5 YEARS: Chief Administrative Officer, ACC (August 1997 to present); Chief Financial Officer, ACC (May 1995 to October 2002); Executive Vice President, ACC (May 1995 to present); Also serves as: Chief Executive Officer, Chief Financial Officer and President, ACS LLC; Chief Financial Officer and Executive Vice President, ACGIM, ACIM, ACIS and other ACC subsidiaries; Treasurer, ACGIM, ACIM and other ACC subsidiaries; Director, ACC and other ACC subsidiaries - -------------------------------------------------------------------------------- MARYANNE ROEPKE, 4500 Main Street, Kansas City, MO 64111 YEAR OF BIRTH: 1956 POSITION(S) HELD WITH FUND: Senior Vice President, Treasurer and Chief Accounting Officer LENGTH OF TIME SERVED (YEARS): 4 PRINCIPAL OCCUPATION(S) DURING PAST 5 YEARS: Assistant Treasurer, ACC (January 1995 to present); Also serves as: Senior Vice President, ACS LLC; Assistant Treasurer, ACGIM, ACIM, ACIS, ACS LLC and other ACC subsidiaries - -------------------------------------------------------------------------------- DAVID C. TUCKER, 4500 Main Street, Kansas City, MO 64111 YEAR OF BIRTH: 1958 POSITION(S) HELD WITH FUND: Senior Vice President and General Counsel LENGTH OF TIME SERVED (YEARS): 6 PRINCIPAL OCCUPATION(S) DURING PAST 5 YEARS: Vice President, ACC (February 2001 to present); General Counsel, ACC (June 1998 to present); Also serves as: Senior Vice President and General Counsel, ACGIM, ACIM, ACIS, ACS LLC and ACC subsidiaries - -------------------------------------------------------------------------------- CHARLES C.S. PARK, 4500 Main Street, Kansas City, MO 64111 YEAR OF BIRTH: 1967 POSITION(S) HELD WITH FUND: Vice President and Chief Compliance Officer LENGTH OF TIME SERVED (YEARS): 4 and less than 1 year PRINCIPAL OCCUPATION(S) DURING PAST 5 YEARS: Chief Compliance Officer, ACS LLC, ACIM and ACGIM (March 2005 to present); Vice President, ACS LLC (February 2000 to present); Assistant General Counsel, ACS LLC (January 1998 to March 2005) - -------------------------------------------------------------------------------- ROBERT LEACH, 4500 Main Street, Kansas City, MO 64111 YEAR OF BIRTH: 1966 POSITION(S) HELD WITH FUND: Controller LENGTH OF TIME SERVED (YEARS): 8 PRINCIPAL OCCUPATION(S) DURING PAST 5 YEARS: Vice President, ACS LLC (February 2000 to present); Controller-Fund Accounting, ACS LLC (June 1997 to present) - -------------------------------------------------------------------------------- (continued) - ------ 53 Management OFFICERS (CONTINUED) - -------------------------------------------------------------------------------- C. JEAN WADE, 4500 Main Street, Kansas City, MO 64111 YEAR OF BIRTH: 1964 POSITION(S) HELD WITH FUND: Controller(1) LENGTH OF TIME SERVED (YEARS): 8 PRINCIPAL OCCUPATION(S) DURING PAST 5 YEARS: Vice President, ACS LLC (February 2000 to present); Controller-Fund Accounting, ACS LLC (June 1997 to present) - -------------------------------------------------------------------------------- JON ZINDEL, 4500 Main Street, Kansas City, MO 64111 YEAR OF BIRTH: 1967 POSITION(S) HELD WITH FUND: Tax Officer LENGTH OF TIME SERVED (YEARS): 7 PRINCIPAL OCCUPATION(S) DURING PAST 5 YEARS: Vice President, ACC (October 2001 to present); Vice President, Corporate Tax, ACS LLC (April 1998 to present); Also serves as: Vice President, ACGIM, ACIM, ACIS and other ACC subsidiaries - -------------------------------------------------------------------------------- (1) Ms. Wade serves in a similar capacity for seven other investment companies advised by ACIM. The SAI has additional information about the funds' trustees and is available without charge upon request by calling 1-800-345-2021. - ------ 54 Approval of Management Agreements for Arizona Municipal Bond, Florida Municipal Bond and High Yield Municipal Bond Under Section 15(c) of the Investment Company Act, contracts for investment advisory services are required to be reviewed, evaluated and approved by a majority of a fund's independent directors or trustees (the "Directors") each year. At American Century, this process -- referred to as the "15(c) Process" -- involves at least two board meetings spanning a 30 to 60 day period each year, as well as meetings of the Corporate Governance Committee (comprised solely of independent directors), which coordinates the board's 15(c) Process. In addition to this annual review, the board and its committees oversee and evaluate at quarterly meetings the nature and quality of significant services performed by the advisor on behalf of the funds. At these meetings the board reviews fund performance, provision of shareholder services, audit and compliance information, and a variety of other reports from the advisor concerning fund operations. The board, or committees of the board, also holds special meetings, as needed. ANNUAL CONTRACT REVIEW PROCESS As part of the annual 15(c) Process undertaken during this half-year period, the Directors requested and received extensive data and information compiled by the advisor and certain independent providers of evaluative data (the "15(c) Providers") concerning Arizona Municipal Bond, Florida Municipal Bond and High Yield Municipal Bond (the "funds") and the services provided to such funds under the management agreement. The information included: * the nature, extent and quality of investment management, shareholder services and other services provided to the funds under the management agreement; * reports on the advisor's activities relating to the wide range of programs and services the advisor provides to the funds and their shareholders on a routine and non-routine basis; * data comparing the cost of owning the funds to the cost of owning similar funds; * data comparing the funds' performance to appropriate benchmarks and/or a peer group of other mutual funds with similar investment objectives and strategies; * financial data showing the profitability of the funds to the advisor and the overall profitability of the advisor; and * data comparing services provided and charges to clients of the advisor other than the funds. In addition, the board also reviewed information provided by an independent consultant retained by the board in connection with the 15(c) Process. In keeping with its practice, the funds' board held two regularly scheduled meetings and one special meeting to review and discuss the information provided by the advisor and to complete its negotiations with the advisor regarding the renewal of the management agreement, including the setting of the applicable advisory fee. In addition, the independent directors and the (continued) - ------ 55 Approval of Management Agreements for Arizona Municipal Bond, Florida Municipal Bond and High Yield Municipal Bond Corporate Governance Committee met to review and discuss the information provided and evaluate the advisor's performance as manager of the funds. Working through the Corporate Governance Committee, the board also retained a consultant to assist it in its evaluation of the profitability of the funds and the adviser, and in formulating the board's fee proposals. The board also had the benefit of the advice of its independent counsel throughout the period. FACTORS CONSIDERED The Directors considered all of the information provided by the advisor, the 15(c) Providers, the board's consultant and its independent counsel, and evaluated such information for each fund for which the board has responsibility. The Directors did not identify any single factor as being all-important or controlling, and each Director may have attributed different levels of importance to different factors. In deciding to renew the agreement under the terms ultimately determined by the board to be appropriate, the Directors' decision was based on the following factors. NATURE, EXTENT AND QUALITY OF SERVICES -- GENERALLY. Under the management agreement, the advisor is responsible for providing or arranging for all services necessary for the operation of the funds. The board noted that under the management agreement, the advisor provides or arranges at its own expense a wide variety of services including * fund construction and design * portfolio security selection * initial capitalization/funding * securities trading * custody of fund assets * daily valuation of the funds' portfolio * shareholder servicing and transfer agency, including shareholder confirmations, recordkeeping and communications * legal services * regulatory and portfolio compliance * financial reporting * marketing and distribution The Directors noted that many of these services have expanded over time both in terms of quantity and complexity in response to shareholder demands, competition in the industry and the changing regulatory environment. In performing their evaluation, the Directors considered information received in connection with the annual review, as well as information provided on an ongoing basis at their regularly scheduled board and committee meetings. INVESTMENT MANAGEMENT SERVICES. The nature of the investment management services provided is quite complex and allows fund shareholders access to professional money management, instant diversification of their investments within an asset class, the opportunity to easily diversify among asset classes, and liquidity. In evaluating investment performance, the board expects the advisor to manage the funds in accordance with their investment objectives and approved strategies. In providing these services, the advisor utilizes teams of investment professionals (portfolio managers, analysts, research assistants, and securities traders) who require extensive information technology, research, training, compliance and other systems to conduct their business. At each quarterly (continued) - ------ 56 Approval of Management Agreements for Arizona Municipal Bond, Florida Municipal Bond and High Yield Municipal Bond meeting the board and the Portfolio Committee review investment performance information for the funds, together with comparative information for appropriate benchmarks and peer groups of funds managed similarly to the fund. Further, the Portfolio Committee reports its assessment to the board. If performance concerns are identified, the Directors discuss with the advisor and its portfolio managers the reasons for such results (e.g., market conditions, security selection) and any efforts being undertaken to improve performance. Arizona Municipal Bond's performance fell below the median for both one and three year periods during part of the past year. The board discussed Arizona Municipal Bond's performance with the advisor and was satisfied with the efforts being undertaken by the advisor. SHAREHOLDER AND OTHER SERVICES. The advisor provides the funds with a comprehensive package of transfer agency, shareholder, and other services. The Quality of Service Committee reviews reports and evaluations of such services at its regular quarterly meetings, including the annual meeting concerning contract review, and reports to the board. The Quality of Service Committee reviews interim reports between regularly scheduled meetings. These reports include, but are not limited to, information regarding the operational efficiency and accuracy of the shareholder and transfer agency services provided, staffing levels, shareholder satisfaction (as measured by external as well as internal sources), technology support, new products and services offered to fund shareholders, securities trading activities, portfolio valuation services, auditing services, and legal and operational compliance activities. Certain aspects of shareholder and transfer agency service level efficiency and the quality of securities trading activities are measured by independent third party providers and are presented in comparison to other fund groups not managed by the advisor. COSTS OF SERVICES PROVIDED AND PROFITABILITY TO THE ADVISOR. The advisor provides detailed information concerning its cost of providing various services to the funds, its profitability in managing the funds, its overall profitability, and its financial condition. The Directors have reviewed with the advisor the methodology used to prepare this financial information. This financial information regarding the advisor is considered in order to evaluate the advisor's financial condition, its ability to continue to provide services under the management agreement, and the reasonableness of the current management fee. The board has retained a consultant to assist it in this review. ETHICS OF THE ADVISOR. The Directors generally consider the advisor's commitment to providing quality services to shareholders and to conducting its business ethically. They noted that the advisor's practices generally meet or exceed industry best practices and that the advisor was not implicated in the industry scandals of 2003 and 2004. ECONOMIES OF SCALE. The Directors review reports provided by the advisor on economies of scale for the complex as a whole and the year-over-year changes in revenue, costs, and profitability. The Directors concluded that economies of scale are difficult to (continued) - ------ 57 Approval of Management Agreements for Arizona Municipal Bond, Florida Municipal Bond and High Yield Municipal Bond measure with precision, particularly on a fund-by-fund basis. This analysis is also complicated by the additional services and content provided by the advisor and its reinvestment in its ability to provide and expand those services. Accordingly, the Directors also seek to evaluate economies of scale by reviewing other information, such as year-over-year profitability of the advisor generally, the profitability of its management of the funds specifically, the expenses incurred by the advisor in providing various functions to the funds, and the fee breakpoints of competitive funds not managed by the advisor. The Directors believe the advisor is appropriately sharing economies of scale through a competitive fee structure, through breakpoints that reduce fees as the fund complex and the funds increase in size and through reinvestment in its business to provide shareholders additional content and services. In particular, separate breakpoint schedules based on the size of the entire fund complex and on the size of a particular fund reflect the complexity of assessing economies of scale. COMPARISON TO OTHER FUNDS' FEES. Each fund pay the advisor a single, all-inclusive (or unified) management fee for providing all services necessary for the management and operation of the fund, other than brokerage expenses, taxes, interest, extraordinary expenses, and the fees and expenses of the fund's independent directors (including their independent legal counsel). Under the unified fee structure, the advisor is responsible for providing all investment advisory, custody, audit, administrative, compliance, recordkeeping, marketing and shareholder services, or arranging and supervising third parties to provide such services. By contrast, most other fund groups are charged a variety of fees, including an investment advisory fee, a transfer agency fee, an administrative fee, distribution charges and other expenses. Other than their investment advisory fees and Rule 12b-1 distribution fees, all other components of the total fees charged by these other fund groups may be increased without shareholder approval. The board believes the unified fee structure is a benefit to fund shareholders because it clearly discloses to shareholders the cost of owning fund shares, and, since the unified fee cannot be increased without a vote of fund shareholders, it shifts to the advisor the increased costs of operating the funds and the risk of administrative inefficiencies. Part of the Directors' analysis of fee levels involves comparing the fund's unified fee to the total expense ratio of other funds in the funds' peer groups. The Directors seek as a general rule to have total expense ratios of fixed income and money market funds in the lowest quartile of the fees of comparable funds. The unified fees charged to shareholders of the funds were in the lowest quartile of the total expense ratios of their respective peer group. COMPARISON TO FEES AND SERVICES PROVIDED TO OTHER CLIENTS OF THE ADVISOR. The Directors also requested and received information from the advisor concerning the nature of the services, fees, and profitability of its advisory services to advisory clients other than the funds. They observed that these varying types of client accounts require different services and involve different regulatory and entrepreneurial risks than the management (continued) - ------ 58 Approval of Management Agreements for Arizona Municipal Bond, Florida Municipal Bond and High Yield Municipal Bond of the funds. The Directors analyzed this information and concluded that the fees charged and services provided to the advisor's other clients did not suggest that the funds' fees were unreasonable by comparison. COLLATERAL BENEFITS DERIVED BY THE ADVISOR. The Directors reviewed information from the advisor concerning collateral benefits it receives as a result of its relationship with the fund. They concluded that the advisor's primary business is managing mutual funds and it generally does not use the fund or shareholder information to generate profits in other lines of business, and therefore does not derive any significant collateral benefits from them. The Directors noted that the advisor receives proprietary research from broker dealers that execute fund portfolio transactions and concluded that this research is likely to benefit fund shareholders. The Directors also determined that the advisor is able to provide investment management services to clients other than the funds, at least in part, due to its existing infrastructure built to serve the fund complex. The Directors concluded, however, that the assets of those other clients are not significant and that, in any event, the addition of such other assets to the assets of the funds that use substantially the same investment management team and strategy to determine whether breakpoints have been achieved captures for the shareholders a portion of any benefit that exists. CONCLUSIONS OF THE DIRECTORS As a result of this process, the Directors concluded that the investment management agreement between the funds and the advisor is fair and reasonable in light of the services provided and should be renewed. (continued) - ------ 59 Share Class Information Four classes of shares are authorized for sale by the funds: Investor Class, A Class, B Class, and C Class. The total expense ratios of A Class, B Class, and C Class shares are higher than that of Investor Class shares. ON JANUARY 30, 2003, INVESTOR CLASS SHARES BECAME UNAVAILABLE TO NEW SELF-DIRECTED RETAIL INVESTORS OF HIGH-YIELD MUNICIPAL. ON FEBRUARY 27, 2004, INVESTOR CLASS SHARES BECAME UNAVAILABLE TO NEW SELF-DIRECTED RETAIL INVESTORS OF ARIZONA MUNCIPAL AND FLORIDA MUNICIPAL. INVESTOR CLASS shares are available for purchase in two ways: 1) by existing shareholders, directly from American Century without any commissions or other fees; or 2) through a broker-dealer, which may require payment of a transaction fee to the broker. A CLASS shares are sold primarily through institutions such as investment advisors, banks, broker-dealers, and insurance companies. A Class shares are sold at their offering price, which is net asset value plus an initial sales charge that ranges from 4.50% to 0.00% for fixed-income funds, depending on the amount invested. The initial sales charge is deducted from the purchase amount before it is invested. A Class shares may be subject to a contingent deferred sales charge (CDSC). There is no CDSC on shares acquired through reinvestment of dividends or capital gains. The prospectus contains information regarding reductions and waivers of sales charges for A Class shares. A Class shares also are subject to a 0.25% annual Rule 12b-1 service and distribution fee. B CLASS shares are sold primarily through institutions such as investment advisors, banks, broker-dealers, and insurance companies. B Class shares redeemed within six years of purchase are subject to a CDSC that declines from 5.00% during the first year after purchase to 0.00% after the sixth year. There is no CDSC on shares acquired through reinvestment of dividends or capital gains. B Class shares also are subject to a 1.00% annual Rule 12b-1 service and distribution fee. B Class shares automatically convert to A Class shares (with lower expenses) eight years after their purchase date. C CLASS shares are sold primarily through institutions such as investment advisors, banks, broker-dealers, and insurance companies. C Class shares redeemed within 12 months of purchase are subject to a CDSC of 1.00%. There is no CDSC on shares acquired through reinvestment of dividends or capital gains. C Class shares also are subject to a Rule 12b-1 service and distribution fee of 1.00%. All classes of shares represent a pro rata interest in the funds and generally have the same rights and preferences. - ------ 60 Additional Information RETIREMENT ACCOUNT INFORMATION As required by law, any distributions you receive from an IRA or certain 403(b), 457 and qualified plans [those not eligible for rollover to an IRA or to another qualified plan] are subject to federal income tax withholding, unless you elect not to have withholding apply. Tax will be withheld on the total amount withdrawn even though you may be receiving amounts that are not subject to withholding, such as nondeductible contributions. In such case, excess amounts of withholding could occur. You may adjust your withholding election so that a greater or lesser amount will be withheld. If you don't want us to withhold on this amount, you must notify us to not withhold the federal income tax. Even if you plan to roll over the amount you withdraw to another tax-deferred account, the withholding rate still applies to the withdrawn amount unless we have received notice not to withhold federal income tax prior to the withdrawal. You may notify us in writing or in certain situations by telephone or through other electronic means. You have the right to revoke your withholding election at any time and any election you make may remain in effect until revoked by filing a new election. Remember, even if you elect not to have income tax withheld, you are liable for paying income tax on the taxable portion of your withdrawal. If you elect not to have income tax withheld or you don't have enough income tax withheld, you may be responsible for payment of estimated tax. You may incur penalties under the estimated tax rules if your withholding and estimated tax payments are not sufficient. State tax will be withheld if, at the time of your distribution, your address is within one of the mandatory withholding states and you have federal income tax withheld. State taxes will be withheld from your distribution in accordance with the respective state rules. PROXY VOTING GUIDELINES American Century Investment Management, Inc., the funds' investment advisor, is responsible for exercising the voting rights associated with the securities purchased and/or held by the fund. A description of the policies and procedures the advisor uses in fulfilling this responsibility is available without charge, upon request, by calling 1-800-345-2021. It is also available on American Century's Web site at americancentury.com and on the Securities and Exchange Commission's Web site at sec.gov. Information regarding how the investment advisor voted proxies relating to portfolio securities during the most recent 12-month period ended June 30 is available on the "About Us" page at americancentury.com. It is also available at sec.gov. QUARTERLY PORTFOLIO DISCLOSURE The funds file their complete schedule of portfolio holdings with the Securities and Exchange Commission (SEC) for the first and third quarters of each fiscal year on Form N-Q. The funds Forms N-Q are available on the SEC's Web site at sec.gov, and may be reviewed and copied at the SEC's Public Reference Room in Washington, DC. Information on the operation of the Public Reference Room may be obtained by calling 1-800-SEC-0330. The funds also make their complete schedule of portfolio holdings for the most recent quarter of their fiscal year available on their Web site at americancentury.com and, upon request, by calling 1-800-345-2021. - ------ 61 Index Definitions The following indices are used to illustrate investment market, sector, or style performance or to serve as fund performance comparisons. They are not investment products available for purchase. The LEHMAN BROTHERS LONG-TERM MUNICIPAL BOND INDEX is composed of those securities included in the Lehman Brothers Municipal Bond Index that have maturities greater than 22 years. The LEHMAN BROTHERS MUNICIPAL BOND INDEX is a market value-weighted index designed for the long-term tax-exempt bond market. The LEHMAN BROTHERS MUNICIPAL 5-YEAR GENERAL OBLIGATION (GO) INDEX is composed of investment-grade U.S. municipal securities, with maturities of four to six years, that are general obligations of a state or local government. The LEHMAN BROTHERS U.S. AGGREGATE INDEX represents securities that are taxable, registered with the Securities and Exchange Commission, and U.S. dollar-denominated. The index covers the U.S. investment-grade fixed-rate bond market, with index components for government and corporate securities, mortgage pass-through securities, and asset-backed securities. - ------ 62 Notes - ------ 63 Notes - ------ 64 Notes [inside back cover - blank] [back cover] CONTACT US AMERICANCENTURY.COM AUTOMATED INFORMATION LINE: 1-800-345-8765 INVESTOR SERVICES REPRESENTATIVE: 1-800-345-2021 or 816-531-5575 INVESTORS USING ADVISORS: 1-800-378-9878 BUSINESS, NOT-FOR-PROFIT, EMPLOYER-SPONSORED RETIREMENT PLANS: 1-800-345-3533 BANKS AND TRUST COMPANIES, BROKER-DEALERS, FINANCIAL ADVISORS, INSURANCE COMPANIES: 1-800-345-6488 TELECOMMUNICATIONS DEVICE FOR THE DEAF: 1-800-634-4113 or 816-444-3485 AMERICAN CENTURY MUNICIPAL TRUST INVESTMENT ADVISOR: American Century Investment Management, Inc. Kansas City, Missouri THIS REPORT AND THE STATEMENTS IT CONTAINS ARE SUBMITTED FOR THE GENERAL INFORMATION OF OUR SHAREHOLDERS. THE REPORT IS NOT AUTHORIZED FOR DISTRIBUTION TO PROSPECTIVE INVESTORS UNLESS PRECEDED OR ACCOMPANIED BY AN EFFECTIVE PROSPECTUS. The American Century Investments logo, American Century and American Century Investments are service marks of American Century Proprietary Holdings, Inc. American Century Investment Services, Inc., Distributor 0507 (c)2005 American Century Proprietary Holdings, Inc. SH-ANN-44209N All rights reserved.
ITEM 2. CODE OF ETHICS. a. The registrant has adopted a Code of Ethics for Senior Financial Officers that applies to the registrant's principal executive officer, principal financial officer, principal accounting officer, and persons performing similar functions. b. No response required. c. None. d. None. e. Not applicable. f. The registrant's Code of Ethics for Senior Financial Officers was filed as Exhibit 10(a) to American Century Mutual Fund, Inc.'s Annual Certified Shareholder Report on Form N-CSR, File No. 811-0816, on December 23, 2003, and is incorporated herein by reference. ITEM 3. AUDIT COMMITTEE FINANCIAL EXPERT. (a)(1) The registrant's board has determined that the registrant has at least one audit committee financial expert serving on its audit committee. (a)(2) Antonio Canova is the registrant's designated audit committee financial expert. He is "independent" as defined in Item 3 of Form N-CSR. (a)(3) Not applicable. (b) No response required. (c) No response required. (d) No response required. ITEM 4. PRINCIPAL ACCOUNTANT FEES AND SERVICES. (a) Audit Fees. The aggregate fees billed for each of the last two fiscal years for professional services rendered by the principal accountant for the audit of the registrant's annual financial statements or services that are normally provided by the accountant in connection with statutory and regulatory filings or engagements for those fiscal years were as follows: FY 2004: $68,018 FY 2005: $69,555 (b) Audit-Related Fees. The aggregate fees billed in each of the last two fiscal years for assurance and related services by the principal accountant that are reasonably related to the performance of the audit of the registrant's financial statements and are not reported under paragraph (a) of this Item were as follows: For services rendered to the registrant: FY 2004: $0 FY 2005: $0 Fees required to be approved pursuant to paragraph (c)(7)(ii) of Rule 2-01 of Regulation S-X (relating to certain engagements for non-audit services with the registrant's investment adviser and its affiliates): FY 2004: $0 FY 2005: $0 (c) Tax Fees. The aggregate fees billed in each of the last two fiscal years for professional services rendered by the principal accountant for tax compliance, tax advice, and tax planning were as follows: For services rendered to the registrant: FY 2004: $22,270 FY 2005: $15,677 These services included review of federal and state income tax forms and federal excise tax forms. Fees required to be approved pursuant to paragraph (c)(7)(ii) of Rule 2-01 of Regulation S-X (relating to certain engagements for non-audit services with the registrant's investment adviser and its affiliates): FY 2004: $0 FY 2005: $0 (d) All Other Fees. The aggregate fees billed in each of the last two fiscal years for products and services provided by the principal accountant, other than the services reported in paragraphs (a) through (c) of this Item were as follows: For services rendered to the registrant: FY 2004: $0 FY 2005: $0 Fees required to be approved pursuant to paragraph (c)(7)(ii) of Rule 2-01 of Regulation S-X (relating to certain engagements for non-audit services with the registrant's investment adviser and its affiliates): FY 2004: $0 FY 2005: $0 (e)(1) In accordance with paragraph (c)(7)(i)(A) of Rule 2-01 of Regulation S-X, before the accountant is engaged by the registrant to render audit or non-audit services, the engagement is approved by the registrant's audit committee. Pursuant to paragraph (c)(7)(ii) of Rule 2-01 of Regulation S-X, the registrant's audit committee also pre-approves its accountant's engagements for non-audit services with the registrant's investment adviser, its parent company, and any entity controlled by, or under common control with the investment adviser that provides ongoing services to the registrant, if the engagement relates directly to the operations and financial reporting of the registrant. (e)(2) All services described in each of paragraphs (b) through (d) of this Item were pre-approved before the engagement by the registrant's audit committee pursuant to paragraph (c)(7)(i)(A) of Rule 2-01 of Regulation S-X. Consequently, none of such services were required to be approved by the audit committee pursuant to paragraph (c)(7)(i)(C). (f) The percentage of hours expended on the principal accountant's engagement to audit the registrant's financial statements for the most recent fiscal year that were attributed to work performed by persons other than the principal accountant's full-time, permanent employees was less than 50%. (g) The aggregate non-audit fees billed by the registrant's accountant for services rendered to the registrant, and rendered to the registrant's investment adviser (not including any sub-adviser whose role is primarily portfolio management and is subcontracted with or overseen by another investment adviser), and any entity controlling, controlled by, or under common control with the adviser that provides ongoing services to the registrant for each of the last two fiscal years of the registrant were as follows: FY 2004: $22,270 FY 2005: $170,677 (h) The registrant's investment adviser and accountant have notified the registrant's audit committee of all non-audit services that were rendered by the registrant's accountant to the registrant's investment adviser, its parent company, and any entity controlled by, or under common control with the investment adviser that provides services to the registrant, which services were not required to be pre-approved pursuant to paragraph (c)(7)(ii) of Rule 2-01 of Regulation S-X. The notification provided to the registrant's audit committee included sufficient details regarding such services to allow the registrant's audit committee to consider the continuing independence of its principal accountant. ITEM 5. AUDIT COMMITTEE OF LISTED REGISTRANTS. Not applicable. ITEM 6. SCHEDULE OF INVESTMENTS. The schedule of investments is included as part of the report to stockholders filed under Item 1 of this Form. ITEM 7. DISCLOSURE OF PROXY VOTING POLICIES AND PROCEDURES FOR CLOSED-END MANAGEMENT INVESTMENT COMPANIES. Not applicable. ITEM 8. PORTFOLIO MANAGERS OF CLOSED-END MANAGEMENT INVESTMENT COMPANIES. Not applicable. ITEM 9. PURCHASES OF EQUITY SECURITIES BY CLOSED-END MANAGEMENT INVESTMENT COMPANY AND AFFILIATED PURCHASERS. Not applicable. ITEM 10. SUBMISSION OF MATTERS TO A VOTE OF SECURITY HOLDERS. As of the end of the reporting period, the registrant did not have in place formal procedures by which shareholders may recommend nominees to the registrant's board. However, all such recommendations directed to the following address will be forwarded to the Corporate Governance Committee of the board for consideration: The Corporate Secretary, American Century Funds, P. O. Box 410141, Kansas City, Missouri 64141. ITEM 11. CONTROLS AND PROCEDURES. (a) The registrant's principal executive officer and principal financial officer have concluded that the registrant's disclosure controls and procedures (as defined in Rule 30a-3(c) under the Investment Company Act of 1940) are effective based on their evaluation of these controls and procedures as of a date within 90 days of the filing date of this report. (b) There were no changes in the registrant's internal control over financial reporting (as defined in Rule 30a-3(d) under the Investment Company Act of 1940) that occurred during the registrant's second fiscal quarter of the period covered by this report that have materially affected, or are reasonably likely to materially affect, the registrant's internal control over financial reporting. ITEM 12. EXHIBITS. (a)(1) Registrant's Code of Ethics for Senior Financial Officers, which is the subject of the disclosure required by Item 2 of Form N-CSR, was filed as Exhibit 10(a) to American Century Mutual Fund, Inc.'s Certified Shareholder Report on Form N-CSR, File No. 811-3706, on December 23, 2003. (a)(2) Separate certifications by the registrant's principal executive officer and principal financial officer, pursuant to Section 302 of the Sarbanes-Oxley Act of 2002 and Rule 30a-2(a) under the Investment Company Act of 1940, are filed and attached hereto as Exhibit 99.302CERT. (a)(3) Not applicable. (b) A certification by the registrant's chief executive officer and chief financial officer, pursuant to Section 906 of the Sarbanes-Oxley Act of 2002, is furnished and attached hereto as Exhibit 99.906CERT. SIGNATURES Pursuant to the requirements of the Securities Exchange Act of 1934 and the Investment Company Act of 1940, the registrant has duly caused this report to be signed on its behalf by the undersigned, thereunto duly authorized. Registrant: AMERICAN CENTURY MUNICIPAL TRUST By: /s/ William M. Lyons ------------------------------------------- Name: William M. Lyons Title: President Date: July 29, 2005 Pursuant to the requirements of the Securities Exchange Act of 1934 and the Investment Company Act of 1940, this report has been signed below by the following persons on behalf of the registrant and in the capacities and on the dates indicated. By: /s/ William M. Lyons ------------------------------------------- Name: William M. Lyons Title: President (principal executive officer) Date: July 29, 2005 By: /s/ Maryanne L. Roepke ------------------------------------------- Name: Maryanne L. Roepke Title: Sr. Vice President, Treasurer, and Chief Accounting Officer (principal financial officer) Date: July 29, 2005