UNITED STATES
SECURITIES AND EXCHANGE COMMISSION
Washington, D.C. 20549
FORM N-CSR
CERTIFIED SHAREHOLDER REPORT OF REGISTERED
MANAGEMENT INVESTMENT COMPANIES
| | | | | | | | | | | | | | | | | | | | |
| Investment Company Act file number | | 811-04025 | | | | |
| | | | | | |
| AMERICAN CENTURY MUNICIPAL TRUST | | | | | | |
| (Exact name of registrant as specified in charter) | | | | | | |
| | | | | | |
| 4500 MAIN STREET, KANSAS CITY, MISSOURI | | | | | | 64111 |
| (Address of principal executive offices) | | | | | | (Zip Code) |
| | | | | | |
CHARLES A. ETHERINGTON
4500 MAIN STREET, KANSAS CITY, MISSOURI 64111 | | | | | | |
| (Name and address of agent for service) | | | | | | |
| | | | | | |
| Registrant’s telephone number, including area code: | | | | | 816-531-5575 | |
| | | | | | |
| Date of fiscal year end: | 05-31 | | | | | |
| | | | | | |
| Date of reporting period: | 05-31-2020 | | | | | |
ITEM 1. REPORTS TO STOCKHOLDERS.
| | | | | |
| |
| Annual Report |
| |
| May 31, 2020 |
| |
| High-Yield Municipal Fund |
| Investor Class (ABHYX) |
| I Class (AYMIX) |
| Y Class (AYMYX) |
| A Class (AYMAX) |
| C Class (AYMCX) |
Beginning on January 1, 2021, as permitted by regulations adopted by the Securities and Exchange Commission, paper copies of the fund’s shareholder reports like this one will no longer be sent by mail, unless you specifically request paper copies of the reports from the fund or from your financial intermediary, such as a broker-dealer or bank. Instead, the reports will be made available on a website, and you will be notified by mail each time a report is posted and provided with a website link to access the report.
If you already elected to receive shareholder reports electronically, you will not be affected by this change and you need not take any action. You may elect to receive shareholder reports and other communications from the fund or your financial intermediary electronically by calling or sending an email request to your appropriate contacts as listed on the back cover of this report.
You may elect to receive all future reports in paper free of charge. You can inform the fund or your financial intermediary that you wish to continue receiving paper copies of your shareholder reports by calling or sending an email request to your appropriate contacts as listed on the back cover of this report. Your election to receive reports in paper will apply to all funds held with the fund complex/your financial intermediary.
| | | | | |
| President’s Letter | |
| Performance | |
| Portfolio Commentary | |
| Fund Characteristics | |
| Shareholder Fee Example | |
| Schedule of Investments | |
| Statement of Assets and Liabilities | |
| Statement of Operations | |
| Statement of Changes in Net Assets | |
| Notes to Financial Statements | |
| Financial Highlights | |
| Report of Independent Registered Public Accounting Firm | |
| Management | |
| |
| |
| Liquidity Risk Management Program | |
| Additional Information | |
Any opinions expressed in this report reflect those of the author as of the date of the report, and do not necessarily represent the opinions of American Century Investments® or any other person in the American Century Investments organization. Any such opinions are subject to change at any time based upon market or other conditions and American Century Investments disclaims any responsibility to update such opinions. These opinions may not be relied upon as investment advice and, because investment decisions made by American Century Investments funds are based on numerous factors, may not be relied upon as an indication of trading intent on behalf of any American Century Investments fund. Security examples are used for representational purposes only and are not intended as recommendations to purchase or sell securities. Performance information for comparative indices and securities is provided to American Century Investments by third party vendors. To the best of American Century Investments’ knowledge, such information is accurate at the time of printing.
 Jonathan Thomas
Dear Investor:
Thank you for reviewing this annual report for the period ended May 31, 2020. Annual reports help convey important information about fund returns, including market factors that affected performance during the reporting period. For additional investment insights, please visit americancentury.com.
Pandemic Rattled Markets, But Most Munis Persevered
Through the first several months of the reporting period, municipal bonds (munis) generally advanced, as U.S. bond yields declined amid dovish Federal Reserve (Fed) policy. In July 2019, growing concerns about global economic risks and U.S.-China trade disputes prompted the Fed to cut short-term interest rates for the first time in 10 years. The Fed followed up with additional rate cuts in September and October, driving bond yields lower. Munis also benefited from stable credit fundamentals and favorable supply/demand dynamics.
Market sentiment abruptly changed in late February. The COVID-19 outbreak rapidly spread throughout the world, triggering stay-at-home orders, business shutdowns and recession fears. Risk assets, including munis, sold off sharply in a global flight to the safest, highest-quality securities. The Fed and the U.S. federal government stepped in quickly and aggressively to provide financial relief to companies, municipalities and individuals. As part of its efforts to stabilize the financial system, the Fed relaunched quantitative easing and added munis to the bond-buying plan. This unprecedented move helped investment-grade munis generate their best monthly performance since January 2009. The May rally was enough to push the broad asset class back into positive-return territory for the 12-month period. High-yield munis, which suffered greater losses in the market sell-off, declined for the reporting period.
As COVID-19 infection rates are slowing, much of the U.S. economy is reopening. Nevertheless, the return to pre-pandemic life will take time and patience. In the meantime, investors likely will face periods of economic and political uncertainty and heightened market volatility. While these influences can be unsettling, they tend to be temporary.
We appreciate your confidence in us during these extraordinary times. We have a long history of helping clients weather unpredictable markets, and we’re confident we will meet today's challenges.
Sincerely,
Jonathan Thomas
President and Chief Executive Officer
American Century Investments
| | | | | | | | | | | | | | | | | | | | |
| Total Returns as of May 31, 2020 | | | | | | |
| | | | Average Annual Returns | | | |
| Ticker Symbol | 1 year | 5 years | 10 years | Since Inception | Inception Date |
| Investor Class | ABHYX | -1.64% | 3.72% | 4.84% | — | 3/31/98 |
| S&P Municipal Bond 50% Investment Grade/50% High Yield Index | — | 1.30% | 4.32% | — | — | — |
| Bloomberg Barclays Municipal Bond Index | — | 3.98% | 3.74% | 4.13% | — | — |
| I Class | AYMIX | -1.45% | 3.93% | 5.05% | — | 3/1/10 |
| Y Class | AYMYX | -1.42% | — | — | 3.85% | 4/10/17 |
| A Class | AYMAX | | | | | 1/31/03 |
| No sales charge | | -1.89% | 3.46% | 4.58% | — | |
| With sales charge | | -6.26% | 2.52% | 4.09% | — | |
| C Class | AYMCX | -2.62% | 2.72% | 3.81% | — | 7/24/02 |
Average annual returns since inception are presented when ten years of performance history is not available.
Fund returns would have been lower if a portion of the fees had not been waived.
Because the S&P Municipal Bond 50% Investment Grade/50% High Yield Index total return data is first available as of November 30, 2011, returns for the Bloomberg Barclays Municipal Bond Index are also shown to cover the 10 year period.
Sales charges include initial sales charges and contingent deferred sales charges (CDSCs), as applicable. A Class shares have a 4.50% maximum initial sales charge and may be subject to a maximum CDSC of 1.00%. C Class shares redeemed within 12 months of purchase are subject to a maximum CDSC of 1.00%. The SEC requires that mutual funds provide performance information net of maximum sales charges in all cases where charges could be applied.
Data presented reflect past performance. Past performance is no guarantee of future results. Current performance may be higher or lower than the performance shown. Total returns for periods less than one year are not annualized. Investment return and principal value will fluctuate, and redemption value may be more or less than original cost. Data assumes reinvestment of dividends and capital gains, and none of the charts reflect the deduction of taxes that a shareholder would pay on fund distributions or the redemption of fund shares. To obtain performance data current to the most recent month end, please call 1-800-345-2021 or visit americancentury.com. For additional information about the fund, please consult the prospectus.
| | |
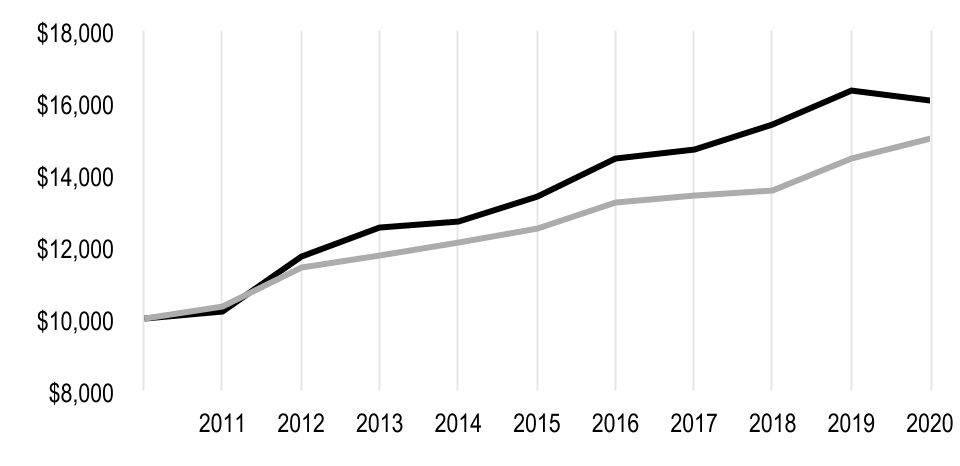
Growth of $10,000 Over 10 Years |
| $10,000 investment made May 31, 2010 |
| Performance for other share classes will vary due to differences in fee structure. |
| | | | | |
| Value on May 31, 2020 | |
| Investor Class — $16,045 |
| |
| Bloomberg Barclays Municipal Bond Index — $14,998 |
| |
Ending value of Investor Class would have been lower if a portion of the fees had not been waived.
Since S&P Municipal Bond 50% Investment Grade/50% High Yield Index total return data is only available from November 2011, it is not included in the line chart.
| | | | | | | | | | | | | | |
Total Annual Fund Operating Expenses | | | | |
| Investor Class | I Class | Y Class | A Class | C Class |
| 0.60% | 0.40% | 0.37% | 0.85% | 1.60% |
The total annual fund operating expenses shown is as stated in the fund’s prospectus current as of the date of this report. The prospectus may vary from the expense ratio shown elsewhere in this report because it is based on a different time period, includes acquired fund fees and expenses, and, if applicable, does not include fee waivers or expense reimbursements.
Data presented reflect past performance. Past performance is no guarantee of future results. Current performance may be higher or lower than the performance shown. Total returns for periods less than one year are not annualized. Investment return and principal value will fluctuate, and redemption value may be more or less than original cost. Data assumes reinvestment of dividends and capital gains, and none of the charts reflect the deduction of taxes that a shareholder would pay on fund distributions or the redemption of fund shares. To obtain performance data current to the most recent month end, please call 1-800-345-2021 or visit americancentury.com. For additional information about the fund, please consult the prospectus.
Portfolio Managers: Steven Permut, Joseph Gotelli and Alan Kruss
Performance Summary
High-Yield Municipal returned -1.64%* for the 12 months ended May 31, 2020. By comparison, the S&P Municipal Bond 50% Investment Grade/50% High Yield Index returned 1.30%. Fund returns reflect operating expenses, while index returns do not.
Fund and index returns primarily reflect the wholesale aversion to riskier assets, including high-yield municipal bonds (munis), during March and April 2020, as the coronavirus pandemic abruptly halted economic activity. Through the first half of the period, the broad investment-grade muni market posted modest gains yet lagged U.S. Treasuries, which benefited from a dovish Federal Reserve (Fed). The central bank cut rates three times in 2019—in July, September and October—driving Treasury yields lower. High-yield munis generally outperformed, aided by investor demand for yield. Along with all but the safest-haven assets, investment-grade and high-yield munis plunged in early 2020 as the COVID-19 pandemic swept across the U.S. The market rebounded sharply in May, bolstered by monetary and fiscal responses to the crisis and a renewed risk-on mindset.
The steep sell-off in March reflected a global flight to quality, soaring volatility and sinking market liquidity. The Fed responded quickly by cutting short-term rates to near 0% and resurrecting a host of financial crisis-era programs to help boost liquidity and help stabilize the financial markets. These efforts, along with Congress’ $2 trillion fiscal rescue package, provided some relief to munis by the end of March. In early April, the Fed directly addressed muni market woes by establishing the $500 billion Municipal Liquidity Facility, which provides loans to states and municipalities. The Fed subsequently modified the program to expand eligibility and help ensure that municipalities are able to meet short-term borrowing needs. This unprecedented move provided additional support to the muni market, as it helped restore supply and demand for munis at the end of the reporting period.
Downgrades Likely, But Defaults Less So
State and local finances across the U.S. remained relatively healthy from the start of the reporting period through early 2020. However, costs related to the COVID-19 pandemic tapped states, counties and municipalities as they scrambled to secure medical equipment, medicine and support for first responders. The Coronavirus Aid, Relief and Economic Security Act, which President Donald Trump signed into law on March 27, earmarked funds to offset a large portion of those expenses. In the final days of the reporting period, demonstrations in response to the death of George Floyd occurred across the U.S. While the unrest likely will pressure local and state budgets, we believe the total financial impact will be fairly limited.
Although we believe downgrades will occur across credit markets in general, we don’t expect a wave of defaults as most state and local governments entered the crisis with record levels of reserves and available liquidity; state and local governments possess multiple levers to avoid default, including tax increases, spending reductions and the ability to shift funds; and support from the federal government remains likely given the essential services provided by states and municipalities. Ultimately, the biggest risks we see state and local governments facing are tied to
declining revenues causing budgetary stress, potentially leading to more downgrades. The extent of the challenges hinge on the duration of the economic downturn and the challenges involved in returning to normal.
*All fund returns referenced in this commentary are for Investor Class shares. Fund returns would have been lower if a portion of the fees had not been waived. Performance for other share classes will vary due to differences in fee structure; when Investor Class performance exceeds that of the index, other share classes may not. See page 3 for returns for all share classes.
Sector Allocation, Security Selection Detracted
Sector allocation hindered relative performance over the 12-month period. Overweight allocations, relative to the index, to continuing care retirement communities weighed on results as the pandemic grew, as did investments in student housing and charter schools. Underweight exposure in higher-quality areas, such as prerefunded bonds and state general obligation (GO) bonds, also detracted. Allocations in multifamily housing and corporate muni sectors supplied a modest lift.
Security selection also detracted from results overall, largely due to lagging investments in special tax issues and private universities. Selections among high-quality state and local GO bonds also detracted from relative performance. Positive security selection among continuing care retirement communities and corporate munis helped mitigate these negative effects.
In addition, our bias toward lower-quality munis detracted from performance relative to the index, which contains an equal mix of investment-grade and high-yield munis. Lower-quality munis generally underperformed investment-grade securities for the 12-month period, largely due to the sharp sell-off of riskier securities in early 2020.
Yield Curve Approach Proved Advantageous
Our yield-curve positioning, featuring a longer duration than the index, provided a considerable relative lift through the second half of the period. The strategy paid off as longer-maturity yields declined sharply.
Portfolio Positioning
Given the steep sell-off of high-yield munis in March and April, we believe select sectors should continue to offer value. For example, late in the reporting period, we found opportunities to purchase what we believe are attractive credits that had been excessively punished during the market turmoil.
Although COVID-19 remains a concern and a key uncertainty, the stability that the Fed’s Municipal Liquidity Facility provides will likely support a broad spectrum of muni issues—either directly or indirectly. Additionally, municipal funding needs could contribute to increased supply in the coming months. We believe the recent recovery in demand and a recognition that defaults likely will remain few and fragmented should extend further support for munis. As always, fundamental credit research will drive our investment decisions.
| | | | | |
| MAY 31, 2020 | |
Portfolio at a Glance | |
| Weighted Average Life to Maturity | 18.2 years |
| Average Duration (Modified) | 7.3 years |
| |
Top Five States and Territories | % of net assets |
| New York | 10.7% |
| Illinois | 9.5% |
| Texas | 7.5% |
| Arizona | 6.3% |
| Florida | 6.3% |
| | |
Top Five Sectors | % of fund investments |
| Special Tax | 17% |
| Retirement Community | 15% |
| Charter School | 11% |
| General Obligation (GO) - Local | 9% |
| Hospital | 7% |
| | |
Types of Investments in Portfolio | % of net assets |
| Municipal Securities | 95.2% |
| Affiliated Funds | 1.5% |
| Exchange-Traded Funds | 1.0% |
| Other Assets and Liabilities | 2.3% |
Fund shareholders may incur two types of costs: (1) transaction costs, including sales charges (loads) on purchase payments and redemption/exchange fees; and (2) ongoing costs, including management fees; distribution and service (12b-1) fees; and other fund expenses. This example is intended to help you understand your ongoing costs (in dollars) of investing in your fund and to compare these costs with the ongoing cost of investing in other mutual funds.
The example is based on an investment of $1,000 made at the beginning of the period and held for the entire period from December 1, 2019 to May 31, 2020.
Actual Expenses
The table provides information about actual account values and actual expenses for each class. You may use the information, together with the amount you invested, to estimate the expenses that you paid over the period. First, identify the share class you own. Then simply divide your account value by $1,000 (for example, an $8,600 account value divided by $1,000 = 8.6), then multiply the result by the number under the heading “Expenses Paid During Period” to estimate the expenses you paid on your account during this period.
If you hold Investor Class shares of any American Century Investments fund, or I Class shares of the American Century Diversified Bond Fund, in an American Century Investments account (i.e., not through a financial intermediary or employer-sponsored retirement plan account), American Century Investments may charge you a $25.00 annual account maintenance fee if the value of those shares is less than $10,000. We will redeem shares automatically in one of your accounts to pay the $25.00 fee. In determining your total eligible investment amount, we will include your investments in all personal accounts (including American Century Investments brokerage accounts) registered under your Social Security number. Personal accounts include individual accounts, joint accounts, UGMA/UTMA accounts, personal trusts, Coverdell Education Savings Accounts and IRAs (including traditional, Roth, Rollover, SEP-, SARSEP- and SIMPLE-IRAs), and certain other retirement accounts. If you have only business, business retirement, employer-sponsored or American Century Investments brokerage accounts, you are currently not subject to this fee. If you are subject to the account maintenance fee, your account value could be reduced by the fee amount.
Hypothetical Example for Comparison Purposes
The table also provides information about hypothetical account values and hypothetical expenses based on the actual expense ratio of each class of your fund and an assumed rate of return of 5% per year before expenses, which is not the actual return of a fund’s share class. The hypothetical account values and expenses may not be used to estimate the actual ending account balance or expenses you paid for the period. You may use this information to compare the ongoing costs of investing in your fund and other funds. To do so, compare this 5% hypothetical example with the 5% hypothetical examples that appear in the shareholder reports of the other funds.
Please note that the expenses shown in the table are meant to highlight your ongoing costs only and do not reflect any transactional costs, such as sales charges (loads) or redemption/exchange fees. Therefore, the table is useful in comparing ongoing costs only, and will not help you determine the relative total costs of owning different funds. In addition, if these transactional costs were included, your costs would have been higher.
| | | | | | | | | | | | | | |
| | Beginning
Account Value
12/1/19 | Ending
Account Value
5/31/20 | Expenses Paid During Period(1) 12/1/19 - 5/31/20 | Annualized Expense Ratio(1) |
Actual | | | | |
| Investor Class | $1,000 | $953.30 | $2.93 | 0.60% |
| I Class | $1,000 | $954.20 | $1.95 | 0.40% |
| Y Class | $1,000 | $954.40 | $1.81 | 0.37% |
| A Class | $1,000 | $952.10 | $4.15 | 0.85% |
| C Class | $1,000 | $948.50 | $7.79 | 1.60% |
| Hypothetical | | | | |
| Investor Class | $1,000 | $1,022.00 | $3.03 | 0.60% |
| I Class | $1,000 | $1,023.00 | $2.02 | 0.40% |
| Y Class | $1,000 | $1,023.15 | $1.87 | 0.37% |
| A Class | $1,000 | $1,020.75 | $4.29 | 0.85% |
| C Class | $1,000 | $1,017.00 | $8.07 | 1.60% |
(1)Expenses are equal to the class's annualized expense ratio listed in the table above, multiplied by the average account value over the period, multiplied by 183, the number of days in the most recent fiscal half-year, divided by 366, to reflect the one-half year period. Annualized expense ratio reflects actual expenses, including any applicable fee waivers or expense reimbursements and excluding any acquired fund fees and expenses.
MAY 31, 2020
| | | | | | | | |
| Principal Amount | Value |
| MUNICIPAL SECURITIES — 95.2% | | |
| Alabama — 1.1% | | |
| Jefferson County Sewer Rev., 6.50%, 10/1/53 | $ | 2,000,000 | | $ | 2,305,940 | |
| Southeast Alabama Gas Supply District Rev., VRN, 4.00%, 6/1/49 (GA: Morgan Stanley) | 5,000,000 | | 5,376,300 | |
| | 7,682,240 | |
| Alaska — 0.4% | | |
| Northern Tobacco Securitization Corp. Rev., 5.00%, 6/1/46 | 2,500,000 | | 2,500,075 | |
| Arizona — 6.3% | | |
Arizona Industrial Development Authority Rev., (BASIS Schools, Inc. Obligated Group), 5.00%, 7/1/51(1) | 2,065,000 | | 2,036,048 | |
Arizona Industrial Development Authority Rev., (Doral Academy of Nevada), 5.00%, 7/15/49(1) | 1,675,000 | | 1,612,774 | |
Arizona Industrial Development Authority Rev., (Kaizen Education Foundation), 5.70%, 7/1/47(1) | 2,000,000 | | 2,046,180 | |
Arizona Industrial Development Authority Rev., (Odyssey Preparatory Academy, Inc.), 5.50%, 7/1/52(1) | 5,000,000 | | 5,129,350 | |
Arizona Industrial Development Authority Rev., (Pinecrest Academy of Nevada), 4.00%, 7/15/50(1) | 1,600,000 | | 1,317,856 | |
| Florence Town, Inc. Industrial Development Authority Rev., (Legacy Traditional School Series 2013 Obligated Group), 6.00%, 7/1/43 | 1,000,000 | | 1,042,660 | |
| Industrial Development Authority of the City of Phoenix Rev., (AZ GFF Tiyan LLC), 5.375%, 2/1/41 | 840,000 | | 848,459 | |
Industrial Development Authority of the City of Phoenix Rev., (BASIS Schools, Inc. Obligated Group), 5.00%, 7/1/45(1) | 1,500,000 | | 1,493,565 | |
Industrial Development Authority of the City of Phoenix Rev., (BASIS Schools, Inc. Obligated Group), 5.00%, 7/1/46(1) | 1,500,000 | | 1,491,285 | |
Industrial Development Authority of the City of Phoenix Rev., (Legacy Traditional School Obligated Group), 6.75%, 7/1/44(1) | 2,000,000 | | 2,185,420 | |
Industrial Development Authority of the City of Phoenix Rev., (Legacy Traditional School Obligated Group), 5.00%, 7/1/46(1) | 500,000 | | 500,240 | |
Industrial Development Authority of the City of Phoenix Rev., (Leman Academy of Excellence Obligated Group), 5.25%, 7/1/48(1) | 1,000,000 | | 992,690 | |
Industrial Development Authority of the City of Phoenix Rev., (Leman Academy of Excellence Obligated Group), 5.25%, 7/1/53(1) | 1,000,000 | | 984,520 | |
Industrial Development Authority of the City of Phoenix Rev., (Leman Academy of Excellence, Inc.), 5.00%, 7/1/54(1) | 1,000,000 | | 943,860 | |
| Industrial Development Authority of the City of Phoenix Rev., (Villa Montessori, Inc.), 5.00%, 7/1/35 | 500,000 | | 533,155 | |
| Industrial Development Authority of the City of Phoenix Rev., (Villa Montessori, Inc.), 5.00%, 7/1/45 | 1,000,000 | | 1,047,030 | |
Industrial Development Authority of the County of Pima Rev., (American Leadership Academy, Inc.), 5.625%, 6/15/45(1) | 2,000,000 | | 1,998,620 | |
Industrial Development Authority of the County of Pima Rev., (American Leadership Academy, Inc.), 5.00%, 6/15/47(1) | 1,325,000 | | 1,201,232 | |
Industrial Development Authority of the County of Pima Rev., (American Leadership Academy, Inc.), 5.00%, 6/15/52(1) | 1,325,000 | | 1,183,795 | |
Maricopa County Industrial Development Authority Rev., (Benjamin Franklin Charter School Ltd.), 6.00%, 7/1/52(1) | 4,000,000 | | 4,224,920 | |
Maricopa County Industrial Development Authority Rev., (Legacy Traditional School Obligated Group), 5.00%, 7/1/49(1) | 2,450,000 | | 2,442,454 | |
Maricopa County Industrial Development Authority Rev., (Paragon Management, Inc.), 5.00%, 7/1/47(1) | 1,000,000 | | 970,650 | |
Sundance Community Facilities District Rev., 7.125%, 7/1/27(1) | 208,000 | | 207,979 | |
| | | | | | | | |
| Principal Amount | Value |
Sundance Community Facilities District Special Assessment,
6.50%, 7/1/29 | $ | 144,000 | | $ | 140,149 | |
Tempe Industrial Development Authority Rev., (Mirabella at ASU, Inc.), 5.35%, 10/1/25(1) | 1,000,000 | | 999,460 | |
Tempe Industrial Development Authority Rev., (Mirabella at ASU, Inc.), 6.00%, 10/1/37(1) | 500,000 | | 488,380 | |
Tempe Industrial Development Authority Rev., (Mirabella at ASU, Inc.), 6.125%, 10/1/47(1) | 4,500,000 | | 4,351,995 | |
| | 42,414,726 | |
| California — 1.9% | | |
California County Tobacco Securitization Agency Rev., (Alameda County Tobacco Securitization Corp.), 0.00%, 6/1/50(2) | 8,000,000 | | 1,281,360 | |
| California County Tobacco Securitization Agency Rev., (Los Angeles County Securitization Corp.), 5.45%, 6/1/28 | 2,000,000 | | 2,001,080 | |
California Statewide Communities Development Authority Rev., (Loma Linda University Medical Center Obligated Group), 5.00%, 12/1/36(1) | 500,000 | | 516,465 | |
California Statewide Communities Development Authority Rev., (Loma Linda University Medical Center Obligated Group), 5.00%, 12/1/41(1) | 500,000 | | 513,360 | |
California Statewide Communities Development Authority Rev., (Loma Linda University Medical Center Obligated Group), 5.00%, 12/1/46(1) | 1,000,000 | | 1,020,630 | |
Foothill-Eastern Transportation Corridor Agency Rev.,
6.50%, 1/15/43 | 500,000 | | 564,705 | |
| Foothill-Eastern Transportation Corridor Agency Rev., Capital Appreciation, VRN, 0.00%, 1/15/42 | 500,000 | | 524,180 | |
| Golden State Tobacco Securitization Corp. Rev., 5.30%, 6/1/37 | 1,000,000 | | 1,012,470 | |
Golden State Tobacco Securitization Corp. Rev., Capital Appreciation, 0.00%, 6/1/47(2) | 5,000,000 | | 987,300 | |
| River Islands Public Financing Authority Special Tax, 5.50%, 9/1/45 | 1,500,000 | | 1,594,650 | |
San Francisco City & County Redevelopment Agency Successor Agency Special Tax, Capital Appreciation, 0.00%, 8/1/43(2) | 3,500,000 | | 963,830 | |
| Sunnyvale Special Tax, 7.75%, 8/1/32 | 1,500,000 | | 1,504,455 | |
| | 12,484,485 | |
| Colorado — 3.6% | | |
| Belleview Station Metropolitan District No. 2 GO, 5.00%, 12/1/36 | 1,000,000 | | 968,150 | |
| Belleview Station Metropolitan District No. 2 GO, 5.125%, 12/1/46 | 2,000,000 | | 1,904,040 | |
| Brighton Crossing Metropolitan District No. 4 GO, 4.00%, 12/1/27 | 510,000 | | 504,145 | |
| Brighton Crossing Metropolitan District No. 4 GO, 5.00%, 12/1/37 | 525,000 | | 528,255 | |
| Brighton Crossing Metropolitan District No. 4 GO, 5.00%, 12/1/47 | 1,220,000 | | 1,189,744 | |
| Central Platte Valley Metropolitan District GO, 5.00%, 12/1/43 | 1,000,000 | | 1,013,110 | |
| Clear Creek Station Metropolitan District No. 2 GO, 5.00%, 12/1/47 | 1,000,000 | | 935,370 | |
Colorado Health Facilities Authority Rev., (Frasier Meadows
Manor, Inc.), 5.25%, 5/15/37 | 500,000 | | 480,985 | |
Colorado Health Facilities Authority Rev., (Frasier Meadows
Manor, Inc.), 5.25%, 5/15/47 | 2,000,000 | | 1,828,080 | |
| Copper Ridge Metropolitan District Rev., 5.00%, 12/1/39 | 2,500,000 | | 2,303,900 | |
| Copper Ridge Metropolitan District Rev., 5.00%, 12/1/43 | 1,000,000 | | 898,030 | |
| Cornerstar Metropolitan District GO, 4.50%, 12/1/27 | 500,000 | | 499,235 | |
| Denver International Business Center Metropolitan District No. 1 GO, 6.00%, 12/1/48 | 2,290,000 | | 2,239,895 | |
Denver Urban Renewal Authority Tax Allocation, 5.25%, 12/1/39(1) | 1,900,000 | | 1,836,996 | |
Gardens on Havana Metropolitan District No. 3 Rev.,
3.625%, 12/1/21 | 500,000 | | 500,200 | |
| Leyden Rock Metropolitan District No. 10 GO, 5.00%, 12/1/45 | 1,250,000 | | 1,248,462 | |
| One Horse Business Improvement District Rev., 6.00%, 6/1/24 | 750,000 | | 750,593 | |
| | | | | | | | |
| Principal Amount | Value |
| Regional Transportation District Rev., (Denver Transit Partners LLC), 6.00%, 1/15/41 | $ | 1,000,000 | | $ | 1,002,060 | |
| Southlands Metropolitan District No. 1 GO, 5.00%, 12/1/37 | 500,000 | | 512,285 | |
| Southlands Metropolitan District No. 1 GO, 5.00%, 12/1/47 | 1,000,000 | | 1,008,080 | |
Vauxmont Metropolitan District GO, 5.00%, 12/1/50 (AGM)(3) | 1,500,000 | | 1,798,170 | |
| Water Valley Metropolitan District No. 1 GO, 5.25%, 12/1/40 | 300,000 | | 302,298 | |
| | 24,252,083 | |
| Connecticut — 0.6% | | |
Connecticut State Health & Educational Facilities Authority Rev., (Griffin Health Obligated Group), 5.00%, 7/1/50(1) | 3,750,000 | | 3,920,700 | |
| Delaware — 0.7% | | |
| Delaware State Economic Development Authority Rev., (Delmarva Power & Light Co.), 5.40%, 2/1/31 | 1,500,000 | | 1,508,445 | |
Town of Millsboro Special Tax, 5.25%, 7/1/48(1) | 3,000,000 | | 2,835,930 | |
| | 4,344,375 | |
| District of Columbia — 0.7% | | |
District of Columbia Tobacco Settlement Financing Corp. Rev., Capital Appreciation, 0.00%, 6/15/46(2) | 15,000,000 | | 1,678,200 | |
| Metropolitan Washington Airports Authority Dulles Toll Road Rev., 4.00%, 10/1/44 | 3,000,000 | | 3,066,570 | |
| | 4,744,770 | |
| Florida — 6.3% | | |
| Atlantic Beach Health Care Facilities Rev., (Naval Continuing Care Retirement Foundation Obligated Group), 3.25%, 11/15/24 | 2,155,000 | | 2,089,639 | |
| Babcock Ranch Community Independent Special District Special Assessment, 5.25%, 11/1/46 | 250,000 | | 257,458 | |
Capital Trust Agency, Inc. Rev., (Franklin Academy - Cooper City Campus), 5.00%, 12/15/50(1) | 1,000,000 | | 984,580 | |
Capital Trust Agency, Inc. Rev., (Franklin Academy - Cooper City Campus), 5.00%, 12/15/55(1) | 1,005,000 | | 981,151 | |
| Celebration Pointe Community Development District Special Assessment, 5.125%, 5/1/45 | 720,000 | | 729,000 | |
Celebration Pointe Community Development District Special Assessment, 5.00%, 5/1/48(1) | 1,905,000 | | 1,908,562 | |
| Escambia County Health Facilities Authority Rev., (Baptist Health Care Corp. Obligated Group), 4.00%, 8/15/45 | 2,700,000 | | 2,792,232 | |
| Escambia County Health Facilities Authority Rev., (Baptist Health Care Corp. Obligated Group), 4.00%, 8/15/50 | 2,300,000 | | 2,363,733 | |
Lake County Rev., (Educational Charter Foundation of Florida, Inc.), 5.00%, 1/15/49(1) | 800,000 | | 776,264 | |
Lake County Rev., (Educational Charter Foundation of Florida, Inc.), 5.00%, 1/15/54(1) | 850,000 | | 816,561 | |
| Miami Beach Redevelopment Agency Tax Allocation, 5.00%, 2/1/27 | 1,000,000 | | 1,153,950 | |
| Miami-Dade County Educational Facilities Authority Rev., (University of Miami), 5.00%, 4/1/30 | 1,250,000 | | 1,402,587 | |
| Miami-Dade County Industrial Development Authority Rev., (Pinecrest Academy, Inc.), 5.25%, 9/15/44 | 950,000 | | 998,554 | |
| Northern Palm Beach County Improvement District Special Assessment, 5.00%, 8/1/46 | 2,000,000 | | 2,106,560 | |
| Pinellas County Industrial Development Authority Rev., (Drs. Kiran & Pallavi Patel 2017 Foundation for Global Understanding, Inc.), 5.00%, 7/1/29 | 3,150,000 | | 3,258,297 | |
| Seminole County Industrial Development Authority Rev., (CCRC Development Corp. Obligated Group), 3.75%, 11/15/25 | 2,000,000 | | 1,743,260 | |
| Seminole County Industrial Development Authority Rev., (CCRC Development Corp. Obligated Group), 4.25%, 11/15/26 | 3,000,000 | | 2,615,610 | |
| Seminole County Industrial Development Authority Rev., (CCRC Development Corp. Obligated Group), 5.75%, 11/15/54 | 2,000,000 | | 1,542,520 | |
| | | | | | | | |
| Principal Amount | Value |
Tallahassee Rev., (Tallahassee Memorial HealthCare, Inc.),
5.00%, 12/1/24 | $ | 1,225,000 | | $ | 1,394,491 | |
| Tomoka Community Development District Special Assessment, 5.50%, 5/1/35 | 2,500,000 | | 2,601,425 | |
| Village Community Development District No. 10 Special Assessment, 6.00%, 5/1/44 | 420,000 | | 458,249 | |
| Village Community Development District No. 12 Special Assessment, 3.625%, 5/1/31 | 1,940,000 | | 1,950,748 | |
Village Community Development District No. 12 Special Assessment, 4.375%, 5/1/50(1) | 2,710,000 | | 2,770,894 | |
| Village Community Development District No. 13 Special Assessment, 3.70%, 5/1/50 | 2,000,000 | | 1,902,520 | |
| Village Community Development District No. 8 Special Assessment, 6.125%, 5/1/39 | 715,000 | | 716,745 | |
| Winter Garden Village at Fowler Groves Community Development District Special Assessment, 4.125%, 5/1/37 | 1,995,000 | | 1,960,347 | |
| | 42,275,937 | |
| Georgia — 2.6% | | |
| Atlanta Department of Aviation Rev., (Atlanta Airport Passenger Facility Charge), 5.00%, 7/1/36 | 5,000,000 | | 6,141,750 | |
| Development Authority of White County Rev., (Truett-Mcconnell University, Inc. Obligated Group), 5.00%, 10/1/29 | 1,285,000 | | 1,260,521 | |
| Development Authority of White County Rev., (Truett-Mcconnell University, Inc. Obligated Group), 5.125%, 10/1/39 | 2,000,000 | | 1,826,800 | |
| Development Authority of White County Rev., (Truett-Mcconnell University, Inc. Obligated Group), 5.25%, 10/1/49 | 4,000,000 | | 3,528,040 | |
| Main Street Natural Gas, Inc. Rev., 5.00%, 5/15/49 (GA: Macquarie Group Ltd.) | 1,500,000 | | 1,902,975 | |
Marietta Development Authority Rev., (Life University, Inc.), 5.00%, 11/1/37(1) | 1,500,000 | | 1,503,615 | |
Rockdale County Development Authority Rev., (Pratt Paper LLC), 4.00%, 1/1/38 (GA: Pratt Industries, Inc.)(1) | 1,500,000 | | 1,475,655 | |
| | 17,639,356 | |
| Guam — 0.2% | | |
| Guam Government Department of Education COP, 6.625%, 12/1/30 | 1,000,000 | | 1,015,110 | |
| Idaho — 0.5% | | |
| Idaho Health Facilities Authority Rev., (Partners In Healthcare, Inc.), 5.50%, 11/1/45 | 3,250,000 | | 3,393,065 | |
| Illinois — 9.5% | | |
| Chicago GO, 5.00%, 1/1/27 | 1,265,000 | | 1,323,026 | |
| Chicago GO, 5.00%, 1/1/28 | 2,000,000 | | 2,094,760 | |
| Chicago GO, 5.00%, 1/1/29 | 2,000,000 | | 2,095,240 | |
| Chicago GO, 5.625%, 1/1/29 | 2,500,000 | | 2,683,700 | |
| Chicago GO, 5.50%, 1/1/39 | 2,000,000 | | 2,045,160 | |
| Chicago GO, 5.00%, 1/1/40 | 2,500,000 | | 2,486,700 | |
| Chicago Board of Education GO, 5.00%, 12/1/42 | 3,815,000 | | 3,668,771 | |
| Chicago Board of Education GO, 5.00%, 12/1/46 | 2,500,000 | | 2,365,000 | |
| Chicago Board of Education GO, 6.50%, 12/1/46 | 1,000,000 | | 1,070,720 | |
| Chicago Midway International Airport Rev., 5.00%, 1/1/26 | 2,200,000 | | 2,379,674 | |
| Cook County Community High School District No. 212 Leyden Rev., 5.00%, 12/1/28 (BAM) | 2,385,000 | | 2,834,191 | |
| Illinois Finance Authority Rev., 5.00%, 11/1/49 | 1,150,000 | | 1,000,488 | |
| Illinois Finance Authority Rev., (Ascension Health Credit Group), 4.00%, 2/15/36 | 2,400,000 | | 2,619,432 | |
| Illinois Finance Authority Rev., (Chicago Charter School Foundation), 5.00%, 12/1/47 | 3,500,000 | | 3,580,290 | |
Illinois Finance Authority Rev., (Intrinsic Schools), 6.00%, 12/1/45(1) | 2,000,000 | | 2,079,520 | |
| | | | | | | | |
| Principal Amount | Value |
Illinois Finance Authority Rev., (Plymouth Place, Inc.),
5.25%, 5/15/50 | $ | 2,000,000 | | $ | 1,782,360 | |
| Illinois Finance Authority Rev., (Westminster Village, Inc. Obligated Group), 5.50%, 5/1/53 | 2,500,000 | | 2,271,600 | |
| Northern Illinois University Rev., 4.00%, 4/1/38 (BAM) | 1,150,000 | | 1,207,316 | |
| Northern Illinois University Rev., 4.00%, 4/1/41 (BAM) | 750,000 | | 780,615 | |
| State of Illinois GO, 5.00%, 10/1/25 | 3,000,000 | | 3,063,090 | |
| State of Illinois GO, 5.00%, 12/1/25 | 3,000,000 | | 3,065,010 | |
| State of Illinois GO, 5.00%, 2/1/26 | 1,000,000 | | 1,017,190 | |
| State of Illinois GO, 5.125%, 12/1/29 | 3,000,000 | | 3,060,780 | |
| State of Illinois GO, 5.00%, 10/1/33 | 900,000 | | 912,177 | |
| State of Illinois GO, 5.00%, 3/1/36 | 2,100,000 | | 2,103,318 | |
| State of Illinois GO, 5.50%, 7/1/38 | 1,000,000 | | 1,020,850 | |
| State of Illinois GO, 5.00%, 2/1/39 | 3,000,000 | | 3,002,790 | |
| State of Illinois GO, 5.50%, 5/1/39 | 985,000 | | 1,034,880 | |
| State of Illinois GO, 5.75%, 5/1/45 | 2,400,000 | | 2,562,456 | |
| Western Illinois Economic Development Authority Rev., (Memorial Hospital Association), 4.00%, 6/1/36 | 2,000,000 | | 2,075,540 | |
| | 63,286,644 | |
| Iowa — 1.0% | | |
| Iowa Finance Authority Rev., (Lifespace Communities, Inc. Obligated Group), 5.00%, 5/15/48 | 4,720,000 | | 4,468,613 | |
| Iowa Finance Authority Rev., (Lifespace Communities, Inc. Obligated Group), 2.875%, 5/15/49 | 1,500,000 | | 1,443,090 | |
| Iowa Tobacco Settlement Authority Rev., 5.625%, 6/1/46 | 1,000,000 | | 1,013,200 | |
| | 6,924,903 | |
| Kansas — 1.4% | | |
| Kansas Development Finance Authority Rev., (Village Shalom Obligated Group), 4.00%, 11/15/25 | 9,500,000 | | 8,730,975 | |
| Wichita Rev., (K-96 Greenwich STAR Bond), 3.00%, 9/1/23 | 945,000 | | 950,264 | |
| | 9,681,239 | |
| Kentucky — 2.6% | | |
| Christian County Rev., (Jennie Stuart Medical Center Obligated Group), 5.50%, 2/1/44 | 1,335,000 | | 1,451,572 | |
Kentucky Public Energy Authority Rev., VRN, 4.00%, 12/1/49
(GA: Morgan Stanley) | 7,500,000 | | 8,182,050 | |
Kentucky Public Energy Authority Rev., VRN, 4.00%, 12/1/49
(GA: Morgan Stanley) | 3,000,000 | | 3,270,090 | |
| Paducah Electric Plant Board Rev., 5.00%, 10/1/30 (AGM) | 3,500,000 | | 4,342,555 | |
| | 17,246,267 | |
| Louisiana — 0.7% | | |
St. James Parish Rev., (NuStar Logistics LP), VRN, 6.10%, 12/1/40(1) | 1,250,000 | | 1,367,450 | |
St. James Parish Rev., (NuStar Logistics LP), VRN, 5.85%, 8/1/41(1) | 1,000,000 | | 1,056,150 | |
| St. John the Baptist Rev., (Marathon Oil Corp.), VRN, 2.00%, 6/1/37 | 1,125,000 | | 1,058,704 | |
| St. John the Baptist Rev., (Marathon Oil Corp.), VRN, 2.20%, 6/1/37 | 1,500,000 | | 1,317,480 | |
| | 4,799,784 | |
| Maryland — 1.5% | | |
| Baltimore Rev., 5.125%, 6/1/43 | 1,500,000 | | 1,442,220 | |
| Brunswick Special Tax, 5.00%, 7/1/36 | 1,450,000 | | 1,455,960 | |
| Maryland Economic Development Corp. Rev., (Ports America Chesapeake LLC), 5.00%, 6/1/25 | 1,000,000 | | 1,078,130 | |
| Maryland Economic Development Corp. Rev., (Ports America Chesapeake LLC), 5.00%, 6/1/27 | 1,000,000 | | 1,083,390 | |
| Prince George's County Rev., (Collington Episcopal Life Care Community, Inc.), 5.25%, 4/1/37 | 1,500,000 | | 1,399,755 | |
| | | | | | | | |
| Principal Amount | Value |
Prince George's County Tax Allocation, 5.25%, 7/1/48(1) | $ | 2,000,000 | | $ | 2,001,340 | |
Rockville Rev., (King Farm Presbyterian Retirement
Community, Inc.), 3.50%, 11/1/26 | 1,825,000 | | 1,716,467 | |
| | 10,177,262 | |
| Michigan — 2.8% | | |
| Calhoun County Hospital Finance Authority Rev., (Ella EM Brown Charitable Circle), 5.00%, 2/15/47 | 2,500,000 | | 2,710,700 | |
| Flint Hospital Building Authority Rev., (Hurley Medical Center), 4.00%, 7/1/41 | 2,500,000 | | 2,617,375 | |
| Kentwood Economic Development Corp. Rev., (Holland Home Obligated Group), 5.625%, 11/15/41 | 1,750,000 | | 1,779,488 | |
| Michigan Finance Authority Rev., (Lawrence Technological University), 5.00%, 2/1/47 | 2,195,000 | | 2,053,883 | |
Michigan Finance Authority Rev., (Thomas M Cooley Law School), 6.75%, 7/1/44(1) | 6,500,000 | | 6,529,315 | |
| Michigan Tobacco Settlement Finance Authority Rev., (Michigan Finance Authority), 6.00%, 6/1/48 | 3,000,000 | | 3,000,060 | |
| | 18,690,821 | |
| Minnesota — 0.6% | | |
| Crookston Rev., (Riverview Healthcare Association), 5.00%, 5/1/51 | 4,100,000 | | 4,017,754 | |
| Mississippi — 0.3% | | |
Mississippi Hospital Equipment & Facilities Authority Rev., (North Mississippi Medical Center Obligated Group), 5.00%, 10/1/38(3) | 800,000 | | 945,872 | |
Mississippi Hospital Equipment & Facilities Authority Rev., (North Mississippi Medical Center Obligated Group), 5.00%, 10/1/39(3) | 850,000 | | 1,002,388 | |
| | 1,948,260 | |
| Missouri — 3.1% | | |
| Health & Educational Facilities Authority of the State of Missouri Rev., (Lutheran Senior Services Obligated Group), 2.875%, 2/1/34 | 2,000,000 | | 1,936,580 | |
| Health & Educational Facilities Authority of the State of Missouri Rev., (Lutheran Senior Services Obligated Group), 6.00%, 2/1/41 | 1,250,000 | | 1,269,187 | |
| Industrial Development Authority of the City of St. Louis Missouri Rev., 4.75%, 11/15/47 | 2,500,000 | | 2,062,650 | |
| Kirkwood Industrial Development Authority Rev., (Ashfield Active Living and Wellness Communities, Inc.), 5.25%, 5/15/30 | 2,515,000 | | 2,522,193 | |
| Kirkwood Industrial Development Authority Rev., (Ashfield Active Living and Wellness Communities, Inc.), 5.25%, 5/15/37 | 1,000,000 | | 950,430 | |
Lees Summit Tax Allocation, 4.875%, 11/1/37(1) | 3,500,000 | | 3,051,160 | |
| St. Louis County Industrial Development Authority Rev., (Friendship Village St. Louis Obligated Group), 5.25%, 9/1/53 | 5,000,000 | | 4,508,300 | |
| St. Louis County Industrial Development Authority Rev., (Nazareth Living Center), 5.125%, 8/15/45 | 3,600,000 | | 3,293,208 | |
| St. Louis County Industrial Development Authority Rev., (Ranken-Jordan Pediatric Speciality Hospital), 5.00%, 11/15/46 | 1,000,000 | | 967,220 | |
| | 20,560,928 | |
| Nevada — 2.6% | | |
| Clark County Special Assessment, 5.00%, 8/1/30 | 1,385,000 | | 1,428,101 | |
| Clark County Special Assessment, 5.00%, 8/1/32 | 360,000 | | 368,359 | |
| Clark County Special Assessment, 5.00%, 8/1/35 | 660,000 | | 672,619 | |
Henderson Local Improvement Districts Special Assessment,
4.00%, 9/1/23 | 2,030,000 | | 2,047,763 | |
Henderson Local Improvement Districts Special Assessment,
6.10%, 3/1/24 | 660,000 | | 663,538 | |
| Las Vegas Special Improvement District No. 812 Special Assessment, 5.00%, 12/1/35 | 985,000 | | 1,007,409 | |
| Las Vegas Special Improvement District No. 814 Special Assessment, 4.00%, 6/1/49 | 850,000 | | 740,537 | |
| | | | | | | | |
| Principal Amount | Value |
Nevada Department of Business & Industry Rev., (Doral Academy of Nevada), 5.00%, 7/15/27(1) | $ | 335,000 | | $ | 347,683 | |
Nevada Department of Business & Industry Rev., (Doral Academy of Nevada), 5.00%, 7/15/37(1) | 1,000,000 | | 1,001,730 | |
Nevada Department of Business & Industry Rev., (Doral Academy of Nevada), 5.00%, 7/15/47(1) | 1,400,000 | | 1,353,534 | |
| North Las Vegas Special Assessment, (North Las Vegas Special Improvement District No. 64 Valley Vista), 4.25%, 6/1/34 | 600,000 | | 561,408 | |
| North Las Vegas Special Assessment, (North Las Vegas Special Improvement District No. 64 Valley Vista), 4.50%, 6/1/39 | 750,000 | | 707,865 | |
| North Las Vegas Special Assessment, (North Las Vegas Special Improvement District No. 64 Valley Vista), 4.625%, 6/1/43 | 600,000 | | 566,322 | |
| North Las Vegas Special Assessment, (North Las Vegas Special Improvement District No. 64 Valley Vista), 4.625%, 6/1/49 | 1,000,000 | | 925,640 | |
Reno Rev., (Washoe County Sales Tax Rev.), Capital Appreciation, 0.00%, 7/1/58(1)(2) | 9,500,000 | | 1,029,420 | |
Reno Rev., (Washoe County Sales Tax Rev.), Capital Appreciation, 0.00%, 7/1/58(1)(2) | 13,000,000 | | 1,149,200 | |
Sparks Rev., 2.75%, 6/15/28(1) | 3,000,000 | | 2,805,390 | |
| | 17,376,518 | |
| New Jersey — 3.5% | | |
| New Jersey Economic Development Authority Rev., 5.00%, 11/1/24 | 5,000,000 | | 5,295,900 | |
| New Jersey Economic Development Authority Rev., 5.00%, 6/15/40 | 1,625,000 | | 1,657,370 | |
New Jersey Economic Development Authority Rev., (Beloved Community Charter School, Inc.), 5.00%, 6/15/49(1) | 1,105,000 | | 1,107,254 | |
New Jersey Economic Development Authority Rev., (Beloved Community Charter School, Inc.), 5.00%, 6/15/54(1) | 725,000 | | 714,481 | |
| New Jersey Economic Development Authority Rev., (Port Newark Container Terminal LLC), 5.00%, 10/1/47 | 5,000,000 | | 5,224,200 | |
| New Jersey Educational Facilities Authority Rev., (College of Saint Elizabeth), 5.00%, 7/1/46 | 2,500,000 | | 2,292,250 | |
New Jersey Transportation Trust Fund Authority Rev.,
5.00%, 6/15/44 | 5,000,000 | | 5,154,900 | |
| Tobacco Settlement Financing Corp. Rev., 5.25%, 6/1/46 | 2,000,000 | | 2,234,920 | |
| | 23,681,275 | |
| New Mexico — 0.4% | | |
Lower Petroglyphs Public Improvement District Special Tax,
5.00%, 10/1/33 | 500,000 | | 508,250 | |
Lower Petroglyphs Public Improvement District Special Tax,
5.00%, 10/1/38 | 450,000 | | 452,093 | |
Lower Petroglyphs Public Improvement District Special Tax,
5.00%, 10/1/48 | 1,200,000 | | 1,195,272 | |
| Santa Fe Rev., (El Castillo Retirement Residences Obligated Group), 2.625%, 5/15/25 | 800,000 | | 726,072 | |
| | 2,881,687 | |
| New York — 10.7% | | |
| Buffalo & Erie County Industrial Land Development Corp. Rev., (Orchard Park CCRC, Inc.), 5.00%, 11/15/37 | 1,500,000 | | 1,502,085 | |
| Build NYC Resource Corp. Rev., (Metropolitan College of New York), 5.25%, 11/1/34 | 750,000 | | 778,035 | |
| Build NYC Resource Corp. Rev., (Metropolitan College of New York), 5.50%, 11/1/44 | 1,000,000 | | 1,031,110 | |
Build NYC Resource Corp. Rev., (Metropolitan Lighthouse Charter School), 5.00%, 6/1/32(1) | 625,000 | | 646,613 | |
Build NYC Resource Corp. Rev., (Metropolitan Lighthouse Charter School), 5.00%, 6/1/37(1) | 500,000 | | 506,180 | |
Build NYC Resource Corp. Rev., (Metropolitan Lighthouse Charter School), 5.00%, 6/1/47(1) | 1,000,000 | | 994,130 | |
| | | | | | | | |
| Principal Amount | Value |
Build NYC Resource Corp. Rev., (Metropolitan Lighthouse Charter School), 5.00%, 6/1/52(1) | $ | 1,000,000 | | $ | 985,860 | |
| Glen Cove Local Economic Assistance Corp. Rev., 5.00%, 1/1/56 | 1,500,000 | | 1,477,845 | |
| Metropolitan Transportation Authority Rev., 5.25%, 11/15/55 | 5,000,000 | | 5,508,900 | |
| New York City GO, 5.00%, 4/1/45 | 10,000,000 | | 11,953,400 | |
New York City GO, VRDN, 0.06%, 6/1/20 (SBBPA: Barclays
Bank plc) | 5,000,000 | | 5,000,000 | |
| New York City GO, VRDN, 0.07%, 6/1/20 (SBBPA: JPMorgan Chase Bank N.A.) | 2,500,000 | | 2,500,000 | |
| New York City Industrial Development Agency Rev., (TrIPs Obligated Group), 5.00%, 7/1/28 | 1,000,000 | | 1,025,130 | |
| New York City Transitional Finance Authority Future Tax Secured Rev., VRDN, 0.06%, 6/1/20 (SBBPA: Barclays Bank plc) | 2,070,000 | | 2,070,000 | |
| New York City Transitional Finance Authority Future Tax Secured Rev., VRDN, 0.07%, 6/1/20 (SBBPA: Bank of America N.A.) | 2,325,000 | | 2,325,000 | |
| New York City Water & Sewer System Rev., 5.00%, 6/15/49 | 5,000,000 | | 6,166,900 | |
| New York City Water & Sewer System Rev., VRDN, 0.06%, 6/1/20 (SBBPA: Barclays Bank plc) | 2,600,000 | | 2,600,000 | |
| New York Counties Tobacco Trust Rev., 4.00%, 6/1/51 | 1,500,000 | | 1,224,345 | |
| New York Counties Tobacco Trust Rev., 5.00%, 6/1/51 | 1,000,000 | | 989,120 | |
New York State Dormitory Authority Rev., 5.00%, 9/15/28, Prerefunded at 100% of Par(4) | 5,000 | | 6,819 | |
| New York State Dormitory Authority Rev., 5.00%, 3/15/48 | 9,995,000 | | 12,138,428 | |
New York State Dormitory Authority Rev., (Orange Regional Medical Center Obligated Group), 5.00%, 12/1/27(1) | 1,000,000 | | 1,183,690 | |
| New York State Urban Development Corp. Rev., (State of New York Personal Income Tax Rev.), 5.00%, 3/15/45 | 6,260,000 | | 7,595,508 | |
| Yonkers Economic Development Corp. Rev., (Charter School of Educational Excellence), 5.00%, 10/15/39 | 320,000 | | 321,408 | |
| Yonkers Economic Development Corp. Rev., (Charter School of Educational Excellence), 5.00%, 10/15/49 | 640,000 | | 622,675 | |
| Yonkers Economic Development Corp. Rev., (Charter School of Educational Excellence), 5.00%, 10/15/54 | 465,000 | | 447,990 | |
| | 71,601,171 | |
| North Carolina — 1.1% | | |
| North Carolina Medical Care Commission Rev., (Maryfield, Inc.), 5.00%, 10/1/35 | 1,000,000 | | 892,280 | |
North Carolina Medical Care Commission Rev., (Moravian
Home, Inc.), 5.00%, 10/1/48 | 3,000,000 | | 2,664,060 | |
| North Carolina Medical Care Commission Rev., (Presbyterian Home at Charlotte, Inc.), 5.00%, 7/1/49 | 1,500,000 | | 1,514,115 | |
| North Carolina Medical Care Commission Rev., (Southminster, Inc.), 5.00%, 10/1/37 | 1,500,000 | | 1,452,585 | |
| North Carolina Medical Care Commission Rev., (United Church Homes & Services Obligated Group), 5.00%, 9/1/23 | 610,000 | | 614,313 | |
| North Carolina Medical Care Commission Rev., (United Church Homes & Services Obligated Group), 5.00%, 9/1/24 | 280,000 | | 282,108 | |
| | 7,419,461 | |
| Ohio — 6.3% | | |
Buckeye Tobacco Settlement Financing Authority Rev.,
5.00%, 6/1/55 | 18,000,000 | | 18,192,060 | |
Buckeye Tobacco Settlement Financing Authority Rev., Capital Appreciation, 0.00%, 6/1/57(2) | 15,000,000 | | 1,940,400 | |
| Centerville Rev., (Graceworks Lutheran Services), 5.00%, 11/1/25 | 1,420,000 | | 1,446,895 | |
| Cleveland-Cuyahoga County Port Authority Rev., (Playhouse Square Foundation), 5.50%, 12/1/53 | 2,500,000 | | 2,487,475 | |
| Columbus-Franklin County Finance Authority Rev., (Ohio Dominican University), 6.50%, 3/1/48 | 6,000,000 | | 6,140,280 | |
| | | | | | | | |
| Principal Amount | Value |
| Cuyahoga County Rev., (MetroHealth System), 5.00%, 2/15/28 | $ | 1,250,000 | | $ | 1,403,187 | |
| Muskingum County Rev., (Genesis Healthcare System Obligated Group), 5.00%, 2/15/44 | 2,500,000 | | 2,545,725 | |
| Northeast Ohio Regional Sewer District Rev., 4.00%, 11/15/37 | 1,000,000 | | 1,202,680 | |
Ohio Air Quality Development Authority Rev., (AMG Vanadium LLC), 5.00%, 7/1/49 (GA: AMG Advanced Metallurgicl)(1) | 3,000,000 | | 2,875,740 | |
Ohio Air Quality Development Authority Rev., (Pratt Paper, Inc.), 4.25%, 1/15/38 (GA: Pratt Industries, Inc.)(1) | 1,000,000 | | 1,007,310 | |
Ohio Air Quality Development Authority Rev., (Pratt Paper, Inc.), 4.50%, 1/15/48 (GA: Pratt Industries, Inc.)(1) | 1,000,000 | | 1,007,150 | |
| Ohio Higher Educational Facility Commission Rev., (Cleveland Institute of Art), 5.50%, 12/1/53 | 1,900,000 | | 1,827,040 | |
| | 42,075,942 | |
| Oregon — 0.2% | | |
| Clackamas County Hospital Facility Authority Rev., (Mary's Woods at Marylhurst, Inc.), 2.80%, 5/15/24 | 555,000 | | 552,524 | |
| Clackamas County Hospital Facility Authority Rev., (Mary's Woods at Marylhurst, Inc.), 3.20%, 5/15/25 | 775,000 | | 770,079 | |
| | 1,322,603 | |
| Pennsylvania — 4.4% | | |
Berks County Municipal Authority Rev., (Alvernia University),
5.00%, 10/1/49 | 1,225,000 | | 1,165,281 | |
| Chester County Health & Education Facilities Authority Rev., (Simpson Senior Services Obligated Group), 5.25%, 12/1/45 | 1,400,000 | | 1,292,900 | |
| Chester County Health & Education Facilities Authority Rev., (Simpson Senior Services Obligated Group), 5.00%, 12/1/51 | 3,000,000 | | 2,600,370 | |
| Chester County Industrial Development Authority Rev., (Renaissance Academy Charter School), 5.00%, 10/1/44 | 1,215,000 | | 1,258,813 | |
Chester County Industrial Development Authority Special Assessment, (Woodlands at Greystone Neighborhood Improvement District), 5.00%, 3/1/38(1) | 525,000 | | 492,618 | |
Chester County Industrial Development Authority Special Assessment, (Woodlands at Greystone Neighborhood Improvement District), 5.125%, 3/1/48(1) | 1,050,000 | | 955,395 | |
| Crawford County Hospital Authority Rev., (Meadville Medical Center Obligated Group), 6.00%, 6/1/46 | 1,500,000 | | 1,603,395 | |
Dauphin County General Authority Rev., (Harrisburg University of Science & Technology), 5.125%, 10/15/41(1) | 3,000,000 | | 2,601,540 | |
| Franklin County Industrial Development Authority Rev., (Menno-Haven, Inc. Obligated Group), 5.00%, 12/1/48 | 1,170,000 | | 1,012,600 | |
Hospitals & Higher Education Facilities Authority of Philadelphia Rev., (Temple University Health System Obligated Group),
5.625%, 7/1/42 | 2,500,000 | | 2,604,925 | |
| Lancaster County Hospital Authority Rev., (Brethren Village Obligated Group), 5.125%, 7/1/37 | 1,000,000 | | 940,820 | |
| Montgomery County Industrial Development Authority Rev., (Albert Einstein Healthcare Network Obligated Group), 5.25%, 1/15/45 | 1,250,000 | | 1,319,650 | |
Pennsylvania Economic Development Financing Authority Rev., (Covanta Holding Corp.), 3.25%, 8/1/39(1) | 1,000,000 | | 834,880 | |
| Philadelphia GO, 5.00%, 7/15/38 | 1,500,000 | | 1,706,970 | |
| Philadelphia Authority for Industrial Development Rev., (First Philadelphia Preparatory Charter School), 7.25%, 6/15/43 | 1,500,000 | | 1,643,715 | |
| Philadelphia Authority for Industrial Development Rev., (KIPP Philadelphia Charter School), 4.00%, 4/1/26 | 405,000 | | 403,315 | |
| Philadelphia Authority for Industrial Development Rev., (KIPP Philadelphia Charter School), 5.00%, 4/1/46 | 2,000,000 | | 1,865,400 | |
| School District of Philadelphia GO, 5.00%, 9/1/25 | 2,500,000 | | 3,000,925 | |
| Scranton-Lackawanna Health & Welfare Authority Rev., (Marywood University), 5.00%, 6/1/36 | 1,000,000 | | 973,160 | |
| | | | | | | | |
| Principal Amount | Value |
| Scranton-Lackawanna Health & Welfare Authority Rev., (Marywood University), 5.00%, 6/1/46 | $ | 1,050,000 | | $ | 966,956 | |
| | 29,243,628 | |
| Rhode Island — 0.5% | | |
| Rhode Island Health & Educational Building Corp. Rev., (Care New England Health System Obligated Group), 5.00%, 9/1/36 | 2,125,000 | | 2,174,236 | |
| Tobacco Settlement Financing Corp. Rev., 5.00%, 6/1/50 | 1,000,000 | | 1,047,520 | |
| | 3,221,756 | |
| South Carolina — 0.5% | | |
| Berkeley County Special Assessment, (Berkeley County Nexton Improvement District), 4.375%, 11/1/49 | 1,500,000 | | 1,263,870 | |
South Carolina Jobs-Economic Development Authority Rev., (South Carolina Episcopal Home at Still Hopes Obligated Group),
5.00%, 4/1/48 | 1,000,000 | | 902,810 | |
| South Carolina Jobs-Economic Development Authority Rev., (Upstate Senior Living, Inc. Obligated Group), 5.00%, 11/15/42 | 585,000 | | 542,552 | |
| South Carolina Jobs-Economic Development Authority Rev., (Upstate Senior Living, Inc. Obligated Group), 5.00%, 11/15/54 | 1,000,000 | | 889,400 | |
| | 3,598,632 | |
| Tennessee — 1.3% | | |
| Metropolitan Nashville Airport Authority Rev., 5.00%, 7/1/49 | 2,000,000 | | 2,391,720 | |
Nashville Metropolitan Development & Housing Agency Tax Allocation, 5.125%, 6/1/36(1) | 500,000 | | 502,495 | |
| Tennessee Energy Acquisition Corp. Rev., VRN, 4.00%, 11/1/49 (GA: Goldman Sachs Group, Inc.) | 5,500,000 | | 6,112,095 | |
| | 9,006,310 | |
| Texas — 7.5% | | |
| Arlington Higher Education Finance Corp. Rev., (Leadership Prep School), 5.00%, 6/15/36 | 700,000 | | 689,367 | |
| Arlington Higher Education Finance Corp. Rev., (Leadership Prep School), 5.00%, 6/15/46 | 1,325,000 | | 1,240,796 | |
| Board of Managers Joint Guadalupe County-City of Seguin Hospital Rev., 5.00%, 12/1/40 | 1,000,000 | | 1,040,350 | |
| Board of Managers Joint Guadalupe County-City of Seguin Hospital Rev., 5.00%, 12/1/45 | 2,000,000 | | 2,042,060 | |
| Clifton Higher Education Finance Corp. Rev., (International American Education Federation, Inc.), 6.125%, 8/15/48 | 9,950,000 | | 10,638,142 | |
| Harris County Cultural Education Facilities Finance Corp. Rev., (Brazos Presbyterian Homes, Inc.), 5.00%, 1/1/37 | 1,750,000 | | 1,681,277 | |
Mission Economic Development Corp. Rev., (Natgasoline LLC), 4.625%, 10/1/31(1) | 2,500,000 | | 2,523,775 | |
New Hope Cultural Education Facilities Finance Corp. Rev.,
(CHF-Collegiate Housing Corpus Christi II LLC), 5.00%, 4/1/31 | 1,615,000 | | 1,562,432 | |
New Hope Cultural Education Facilities Finance Corp. Rev.,
(CHF-Collegiate Housing Corpus Christi II LLC), 5.00%, 4/1/48 | 1,850,000 | | 1,596,550 | |
New Hope Cultural Education Facilities Finance Corp. Rev.,
(CHF-Collegiate Housing Island Campus LLC), 5.00%, 4/1/24 | 1,385,000 | | 1,410,498 | |
New Hope Cultural Education Facilities Finance Corp. Rev.,
(CHF-Collegiate Housing Island Campus LLC), 5.00%, 4/1/25 | 1,505,000 | | 1,531,368 | |
New Hope Cultural Education Facilities Finance Corp. Rev.,
(CHF-Collegiate Housing Island Campus LLC), 5.00%, 4/1/26 | 1,000,000 | | 1,008,480 | |
New Hope Cultural Education Facilities Finance Corp. Rev.,
(CHF-Collegiate Housing Island Campus LLC), 5.00%, 4/1/27 | 1,260,000 | | 1,262,810 | |
New Hope Cultural Education Facilities Finance Corp. Rev.,
(CHF-Collegiate Housing Island Campus LLC), 5.00%, 4/1/28 | 1,120,000 | | 1,114,904 | |
New Hope Cultural Education Facilities Finance Corp. Rev.,
(CHF-Collegiate Housing Island Campus LLC), 5.00%, 4/1/29 | 570,000 | | 560,384 | |
New Hope Cultural Education Facilities Finance Corp. Rev.,
(CHF-Collegiate Housing Island Campus LLC), 5.00%, 4/1/37 | 2,750,000 | | 2,479,785 | |
| | |
| | | | | | | | |
| Principal Amount | Value |
New Hope Cultural Education Facilities Finance Corp. Rev.,
(CHF-Collegiate Housing San Antonio I LLC), 5.00%, 4/1/25 | $ | 290,000 | | $ | 298,436 | |
New Hope Cultural Education Facilities Finance Corp. Rev.,
(CHF-Collegiate Housing San Antonio I LLC), 5.00%, 4/1/26 | 390,000 | | 400,768 | |
New Hope Cultural Education Facilities Finance Corp. Rev.,
(CHF-Collegiate Housing San Antonio I LLC), 5.00%, 4/1/31 | 1,300,000 | | 1,314,235 | |
New Hope Cultural Education Facilities Finance Corp. Rev.,
(CHF-Collegiate Housing San Antonio I LLC), 5.00%, 4/1/36 | 1,000,000 | | 979,420 | |
New Hope Cultural Education Facilities Finance Corp. Rev.,
(MRC Crestview), 4.00%, 11/15/26 | 2,000,000 | | 1,858,380 | |
New Hope Cultural Education Facilities Finance Corp. Rev.,
(MRC Senior Living), 3.25%, 11/15/22 | 115,000 | | 106,452 | |
| North East Texas Regional Mobility Authority Rev., 5.00%, 1/1/31 | 1,805,000 | | 1,948,028 | |
| Pottsboro Higher Education Finance Corp. Rev., (Imagine International Academy of North Texas), 5.00%, 8/15/46 | 1,000,000 | | 968,700 | |
| Tarrant County Cultural Education Facilities Finance Corp. Rev., (Buckner Senior Living, Inc.), 6.75%, 11/15/47 | 5,095,000 | | 5,044,509 | |
Texas Private Activity Bond Surface Transportation Corp. Rev.,
(LBJ Infrastructure Group LLC), 7.00%, 6/30/40 | 3,000,000 | | 3,015,060 | |
| Texas Private Activity Bond Surface Transportation Corp. Rev., (NTE Mobility Partners Segments 3 LLC), 5.00%, 6/30/58 | 2,000,000 | | 2,202,120 | |
| | 50,519,086 | |
| Vermont — 0.2% | | |
| Vermont Educational & Health Buildings Financing Agency Rev., (Southwestern Vermont Medical Center, Inc.), VRDN, 0.13%, 6/1/20 (LOC: TD Bank N.A.) | 1,000,000 | | 1,000,000 | |
| Virginia — 2.8% | | |
Cherry Hill Community Development Authority Special Assessment, 5.40%, 3/1/45(1) | 1,000,000 | | 961,650 | |
| Danville Industrial Development Authority Rev., (Averett University Obligated Group), 5.00%, 10/1/47 | 2,500,000 | | 2,265,275 | |
| Dullles Town Center Community Development Authority Special Assessment, 4.25%, 3/1/26 | 1,750,000 | | 1,714,072 | |
| Henrico County Economic Development Authority Rev., (LifeSpire of Virginia Obligated Group), 5.00%, 12/1/37 | 765,000 | | 722,367 | |
| Henrico County Economic Development Authority Rev., (LifeSpire of Virginia Obligated Group), 5.00%, 12/1/47 | 2,200,000 | | 1,976,194 | |
Lower Magnolia Green Community Development Authority Special Assessment, 5.00%, 3/1/45(1) | 980,000 | | 895,740 | |
| Lynchburg Economic Development Authority Rev., (Centra Health Obligated Group), VRDN, 0.06%, 6/1/20 (LOC: Branch Banking & Trust) | 1,700,000 | | 1,700,000 | |
| Mosaic District Community Development Authority Tax Allocation, 6.875%, 3/1/36 | 1,000,000 | | 1,017,980 | |
Peninsula Town Center Community Development Authority Special Assessment, 5.00%, 9/1/37(1) | 2,000,000 | | 2,002,380 | |
Peninsula Town Center Community Development Authority Special Assessment, 5.00%, 9/1/45(1) | 2,250,000 | | 2,243,115 | |
Prince William County Industrial Development Authority Rev., (Westminster Presbyterian Retirement Community, Inc.),
5.00%, 1/1/26 | 1,165,000 | | 1,205,623 | |
| Tobacco Settlement Financing Corp. Rev., 5.00%, 6/1/47 | 1,000,000 | | 995,410 | |
Virginia Small Business Financing Authority Rev., (Covanta Holding Corp.), VRN, 5.00%, 1/1/48(1) | 1,000,000 | | 1,011,330 | |
| | 18,711,136 | |
| Washington — 2.5% | | |
Energy Northwest Electric Rev., (Bonneville Power Administration), 5.00%, 7/1/31(3) | 7,610,000 | | 10,457,129 | |
Washington State Housing Finance Commission Rev., (Bayview Manor Homes Obligated Group), 4.00%, 7/1/26(1) | 795,000 | | 756,936 | |
| | |
| | | | | | | | |
| Principal Amount/Shares | Value |
Washington State Housing Finance Commission Rev., (Lutheran Retirement Home of Greater Seattle Obligated Group), 3.125%, 7/1/23(1) | $ | 1,095,000 | | $ | 1,026,606 | |
Washington State Housing Finance Commission Rev., (Lutheran Retirement Home of Greater Seattle Obligated Group), 5.00%, 7/1/38(1) | 830,000 | | 734,940 | |
Washington State Housing Finance Commission Rev., (Lutheran Retirement Home of Greater Seattle Obligated Group), 5.00%, 7/1/48(1) | 1,900,000 | | 1,591,763 | |
Washington State Housing Finance Commission Rev., (Spokane United Methodist Homes Obligated Group), 7.50%, 1/1/49(1) | 2,000,000 | | 2,104,420 | |
| | 16,671,794 | |
| West Virginia — 0.2% | | |
Monongalia County Commission Special District Rev., 5.50%, 6/1/37(1) | 1,050,000 | | 1,058,484 | |
Monongalia County Commission Special District Rev., 5.75%, 6/1/43(1) | 500,000 | | 505,155 | |
| | 1,563,639 | |
| Wisconsin — 2.1% | | |
Public Finance Authority Rev., (Bancroft Neurohealth Obligated Group), 5.125%, 6/1/48(1) | 1,000,000 | | 944,020 | |
Public Finance Authority Rev., (Bancroft Neurohealth/Bancroft Rehabilitation Services Obligated Group), 5.00%, 6/1/24(1) | 1,575,000 | | 1,604,090 | |
Public Finance Authority Rev., (Beyond Boone LLC), 4.00%,
7/1/50 (AGM) | 700,000 | | 744,387 | |
Public Finance Authority Rev., (Beyond Boone LLC), 4.00%,
7/1/55 (AGM) | 1,000,000 | | 1,059,800 | |
Public Finance Authority Rev., (Beyond Boone LLC), 4.00%,
7/1/59 (AGM) | 1,350,000 | | 1,430,730 | |
Public Finance Authority Rev., (North Carolina Leadership Charter Academy, Inc.), 5.00%, 6/15/49(1) | 520,000 | | 492,581 | |
Public Finance Authority Rev., (North Carolina Leadership Charter Academy, Inc.), 5.00%, 6/15/54(1) | 455,000 | | 422,786 | |
| Public Finance Authority Rev., (Roseman University of Health Sciences), 5.50%, 4/1/32 | 2,000,000 | | 2,022,720 | |
Public Finance Authority Rev., (Roseman University of Health Sciences), 5.00%, 4/1/50(1) | 1,000,000 | | 931,180 | |
Public Finance Authority Rev., (Southminster, Inc.), 5.00%, 10/1/48(1) | 2,750,000 | | 2,542,430 | |
Wisconsin Health & Educational Facilities Authority Rev.,
(State Camillus Health System Obligated Group), 5.00%, 11/1/54 | 2,000,000 | | 1,770,680 | |
| | 13,965,404 | |
TOTAL MUNICIPAL SECURITIES
(Cost $646,100,019) | | 637,860,826 | |
AFFILIATED FUNDS(5) — 1.5% | | |
American Century Diversified Municipal Bond ETF
(Cost $10,134,293) | 196,300 | | 10,201,711 | |
| EXCHANGE-TRADED FUNDS — 1.0% | | |
VanEck Vectors High-Yield Municipal Index ETF
(Cost $6,699,154) | 116,400 | | 6,725,592 | |
TOTAL INVESTMENT SECURITIES — 97.7%
(Cost $662,933,466) | | 654,788,129 | |
| OTHER ASSETS AND LIABILITIES — 2.3% | | 15,110,928 | |
| TOTAL NET ASSETS — 100.0% | | $ | 669,899,057 | |
| | | | | | | | |
| NOTES TO SCHEDULE OF INVESTMENTS | | |
| AGM | - | Assured Guaranty Municipal Corporation |
| BAM | - | Build America Mutual Assurance Company |
| COP | - | Certificates of Participation |
| GA | - | Guaranty Agreement |
| GO | - | General Obligation |
| LOC | - | Letter of Credit |
| SBBPA | - | Standby Bond Purchase Agreement |
| VRDN | - | Variable Rate Demand Note. The instrument may be payable upon demand and adjusts periodically based upon the terms set forth in the security's offering documents. The rate shown is effective at the period end and the reference rate and spread, if any, is indicated. The date of the demand feature is disclosed. |
| VRN | - | Variable Rate Note. The rate adjusts periodically based upon the terms set forth in the security’s offering documents. The rate shown is effective at the period end and the reference rate and spread, if any, is indicated. The security's effective maturity date may be shorter than the final maturity date shown. |
(1)Security was purchased pursuant to Rule 144A under the Securities Act of 1933 and may be sold in transactions exempt from registration, normally to qualified institutional investors. The aggregate value of these securities at the period end was $125,205,245, which represented 18.7% of total net assets.
(2)Security is a zero-coupon bond. Zero-coupon securities are issued at a substantial discount from their value at maturity.
(3)When-issued security. The issue price and yield are fixed on the date of the commitment, but payment and delivery are scheduled for a future date.
(4)Escrowed to maturity in U.S. government securities or state and local government securities.
(5)Investments are funds within the American Century Investments family of funds and are considered affiliated funds.
See Notes to Financial Statements.
| | |
| Statement of Assets and Liabilities |
| | | | | |
| MAY 31, 2020 | |
| Assets | |
| Investment securities - unaffiliated, at value (cost of $652,799,173) | $ | 644,586,418 | |
| Investment securities - affiliated, at value (cost of $10,134,293) | 10,201,711 | |
| Total investment securities, at value (cost of $662,933,466) | 654,788,129 | |
| Cash | 390,291 | |
| Receivable for investments sold | 27,104,286 | |
| Receivable for capital shares sold | 675,235 | |
| Interest receivable | 8,782,901 | |
| 691,740,842 | |
| |
| Liabilities | |
| Payable for investments purchased | 19,841,693 | |
| Payable for capital shares redeemed | 1,563,147 | |
| Accrued management fees | 263,476 | |
| Distribution and service fees payable | 16,035 | |
| Dividends payable | 157,434 | |
| 21,841,785 | |
| |
| Net Assets | $ | 669,899,057 | |
| |
| Net Assets Consist of: | |
| Capital paid in | $ | 679,376,993 | |
| Distributable earnings | (9,477,936) | |
| $ | 669,899,057 | |
| | | | | | | | | | | |
| | Net Assets | Shares Outstanding | Net Asset Value Per Share |
| Investor Class | $268,023,412 | | 28,692,134 | | $9.34 |
| I Class | $320,784,618 | | 34,342,188 | | $9.34 |
| Y Class | $36,453,408 | | 3,904,011 | | $9.34 |
| A Class | $33,837,571 | | 3,622,777 | | $9.34* |
| C Class | $10,800,048 | | 1,156,724 | | $9.34 |
*Maximum offering price $9.78 (net asset value divided by 0.955).
See Notes to Financial Statements.
| | | | | |
| YEAR ENDED MAY 31, 2020 | |
| Investment Income (Loss) | |
| Income: | |
| Interest | $ | 29,281,031 | |
| Income distributions from affiliated funds | 235,251 | |
| 29,516,282 | |
| Expenses: | |
| Management fees | 3,559,185 | |
| Distribution and service fees: | |
| A Class | 92,442 | |
| C Class | 119,290 | |
| Trustees' fees and expenses | 55,483 | |
| Other expenses | 4,334 | |
| 3,830,734 | |
Fees waived(1) | (31,202) | |
| 3,799,532 | |
| |
| Net investment income (loss) | 25,716,750 | |
| |
| Realized and Unrealized Gain (Loss) | |
Net realized gain (loss) on investment transactions (including $(4,461)
from affiliated funds) | 1,699,477 | |
Change in net unrealized appreciation (depreciation) on investments
(including $(24,831) from affiliated funds) | (42,684,974) | |
| |
| Net realized and unrealized gain (loss) | (40,985,497) | |
| |
| Net Increase (Decrease) in Net Assets Resulting from Operations | $ | (15,268,747) | |
(1)Amount consists of $12,856, $14,678, $1,576, $1,582 and $510 for Investor Class, I Class, Y Class, A Class and C Class, respectively.
See Notes to Financial Statements.
| | |
| Statement of Changes in Net Assets |
| | | | | | | | |
| YEARS ENDED MAY 31, 2020 AND MAY 31, 2019 | | |
| Increase (Decrease) in Net Assets | May 31, 2020 | May 31, 2019 |
| Operations | | |
| Net investment income (loss) | $ | 25,716,750 | | $ | 24,716,679 | |
| Net realized gain (loss) | 1,699,477 | | (1,729,451) | |
| Change in net unrealized appreciation (depreciation) | (42,684,974) | | 17,390,514 | |
| Net increase (decrease) in net assets resulting from operations | (15,268,747) | | 40,377,742 | |
| | |
| Distributions to Shareholders | | |
| From earnings: | | |
| Investor Class | (11,338,625) | | (10,885,111) | |
| I Class | (13,589,468) | | (11,284,720) | |
| Y Class | (1,473,433) | | (1,026,866) | |
| A Class | (1,298,303) | | (1,233,647) | |
| C Class | (329,389) | | (366,041) | |
| Decrease in net assets from distributions | (28,029,218) | | (24,796,385) | |
| | |
| Capital Share Transactions | | |
| Net increase (decrease) in net assets from capital share transactions (Note 5) | (2,268,280) | | 103,936,229 | |
| | |
| Net increase (decrease) in net assets | (45,566,245) | | 119,517,586 | |
| | |
| Net Assets | | |
| Beginning of period | 715,465,302 | | 595,947,716 | |
| End of period | $ | 669,899,057 | | $ | 715,465,302 | |
| | |
| | |
See Notes to Financial Statements.
| | |
| Notes to Financial Statements |
MAY 31, 2020
1. Organization
American Century Municipal Trust (the trust) is registered under the Investment Company Act of 1940, as amended (the 1940 Act), as an open-end management investment company and is organized as a Massachusetts business trust. High-Yield Municipal Fund (the fund) is one fund in a series issued by the trust. The fund’s investment objective is to seek high current income that is exempt from federal income tax. The fund also seeks capital appreciation as a secondary objective.
The fund offers the Investor Class, I Class, Y Class, A Class and C Class. The A Class may incur an initial sales charge. The A Class and C Class may be subject to a contingent deferred sales charge.
2. Significant Accounting Policies
The following is a summary of significant accounting policies consistently followed by the fund in preparation of its financial statements. The fund is an investment company and follows accounting and reporting guidance in accordance with accounting principles generally accepted in the United States of America. This may require management to make certain estimates and assumptions at the date of the financial statements. Actual results could differ from these estimates. Management evaluated the impact of events or transactions occurring through the date the financial statements were issued that would merit recognition or disclosure.
Investment Valuations — The fund determines the fair value of its investments and computes its net asset value per share at the close of regular trading (usually 4 p.m. Eastern time) on the New York Stock Exchange (NYSE) on each day the NYSE is open. The Board of Trustees has adopted valuation policies and procedures to guide the investment advisor in the fund’s investment valuation process and to provide methodologies for the oversight of the fund’s pricing function.
Fixed income securities are valued at the evaluated mean as provided by independent pricing services or at the mean of the most recent bid and asked prices as provided by investment dealers. Municipal securities are valued using market models that consider trade data, quotations from dealers and active market makers, relevant yield curve and spread data, creditworthiness, trade data or market information on comparable securities, and other relevant security specific information.
Open-end management investment companies are valued at the reported net asset value per share.
If the fund determines that the market price for an investment is not readily available or the valuation methods mentioned above do not reflect an investment’s fair value, such investment is valued as determined in good faith by the Board of Trustees or its delegate, in accordance with policies and procedures adopted by the Board of Trustees. In its determination of fair value, the fund may review several factors including, but not limited to, market information regarding the specific investment or comparable investments and correlation with other investment types, futures indices or general market indicators. Circumstances that may cause the fund to use these procedures to value an investment include, but are not limited to: an investment has been declared in default or is distressed; trading in a security has been suspended during the trading day or a security is not actively trading on its principal exchange; prices received from a regular pricing source are deemed unreliable; or there is a foreign market holiday and no trading occurred.
The fund monitors for significant events occurring after the close of an investment’s primary exchange but before the fund’s net asset value per share is determined. Significant events may include, but are not limited to: corporate announcements and transactions; governmental action and political unrest that could impact a specific investment or an investment sector; or armed conflicts, natural disasters and similar events that could affect investments in a specific country or region.
Security Transactions — Security transactions are accounted for as of the trade date. Net realized gains and losses are determined on the identified cost basis, which is also used for federal income tax purposes.
Investment Income — Interest income is recorded on the accrual basis and includes accretion of discounts and amortization of premiums. Income and capital gain distributions, if any, from the affiliated funds are recorded as of the ex-dividend date. Distributions received on securities that represent a return of capital or long-term capital gain are recorded as a reduction of cost of investments and/or as a realized gain. The fund may estimate the components of distributions received that may be considered nontaxable distributions or long-term capital gain distributions for income tax purposes.
Segregated Assets — In accordance with the 1940 Act, the fund segregates assets on its books and records to cover certain types of investment securities and other financial instruments. American Century Investment Management, Inc. (ACIM) (the investment advisor) monitors, on a daily basis, the securities segregated to ensure the fund designates a sufficient amount of liquid assets, marked-to-market daily. The fund may also receive assets or be required to pledge assets at the custodian bank or with a broker for collateral requirements.
Income Tax Status — It is the fund’s policy to distribute substantially all net investment income and net realized gains to shareholders and to otherwise qualify as a regulated investment company under provisions of the Internal Revenue Code. Accordingly, no provision has been made for income taxes. The fund files U.S. federal, state, local and non-U.S. tax returns as applicable. The fund's tax returns are subject to examination by the relevant taxing authority until expiration of the applicable statute of limitations, which is generally three years from the date of filing but can be longer in certain jurisdictions. At this time, management believes there are no uncertain tax positions which, based on their technical merit, would not be sustained upon examination and for which it is reasonably possible that the total amounts of unrecognized tax benefits will significantly change in the next twelve months.
Multiple Class — All shares of the fund represent an equal pro rata interest in the net assets of the class to which such shares belong, and have identical voting, dividend, liquidation and other rights and the same terms and conditions, except for class specific expenses and exclusive rights to vote on matters affecting only individual classes. Income, non-class specific expenses, and realized and unrealized capital gains and losses of the fund are allocated to each class of shares based on their relative net assets.
Distributions to Shareholders — Distributions from net investment income, if any, are declared daily and paid monthly. Distributions from net realized gains, if any, are generally declared and paid annually.
Indemnifications — Under the trust’s organizational documents, its officers and trustees are indemnified against certain liabilities arising out of the performance of their duties to the fund. In addition, in the normal course of business, the fund enters into contracts that provide general indemnifications. The maximum exposure under these arrangements is unknown as this would involve future claims that may be made against a fund. The risk of material loss from such claims is considered by management to be remote.
3. Fees and Transactions with Related Parties
Certain officers and trustees of the trust are also officers and/or directors of American Century Companies, Inc. (ACC). The trust's investment advisor, ACIM, the trust's distributor, American Century Investment Services, Inc. (ACIS), and the trust's transfer agent, American Century Services, LLC, are wholly owned, directly or indirectly, by ACC.
Management Fees — The trust has entered into a management agreement with ACIM, under which ACIM provides the fund with investment advisory and management services in exchange for a single, unified management fee (the fee) per class. The agreement provides that ACIM will pay all expenses of managing and operating the fund, except brokerage expenses, taxes, interest, fees and expenses of the independent trustees (including legal counsel fees), extraordinary expenses, and expenses incurred in connection with the provision of shareholder services and distribution services under a plan adopted pursuant to Rule 12b-1 under the 1940 Act. The fee is computed and accrued daily based on each class’s daily net assets and paid monthly in arrears. The difference in the fee among the classes is a result of their separate arrangements for non-Rule 12b-1 shareholder services. It is not the result of any difference in advisory or custodial fees or other expenses related to the management of the fund’s assets, which do not vary by class. The fee consists of (1) an Investment Category Fee based on the daily net assets of the fund and certain other accounts managed by the investment advisor that are in the same broad investment category as the fund and (2) a Complex Fee based on the assets of all the funds in the American Century Investments family of funds. The investment advisor will waive the portion of the fund's management fee equal to the expenses attributable to the management fees of the American Century Investments funds in which the fund invests. The amount of this waiver will fluctuate depending on the fund's daily allocation to other American Century Investments funds. This waiver is expected to remain in effect permanently and it cannot be terminated without the approval of the Board of Trustees. The impact of this waiver to the ratio of operating expenses to average net assets was less than 0.005% for each class for the period ended May 31, 2020.
The Investment Category Fee range, the Complex Fee range and the effective annual management fee for each class for the period ended May 31, 2020 are as follows:
| | | | | | | | | | | |
| Investment Category Fee Range | Complex Fee Range | Effective Annual Management Fee |
| Investor Class | 0.2925%
to 0.4100% | 0.2500% to 0.3100% | 0.59% |
| I Class | | 0.0500% to 0.1100% | 0.39% |
| Y Class | | 0.0200% to 0.0800% | 0.36% |
| A Class | | 0.2500% to 0.3100% | 0.59% |
| C Class | | 0.2500% to 0.3100% | 0.59% |
Distribution and Service Fees — The Board of Trustees has adopted a separate Master Distribution and Individual Shareholder Services Plan for each of the A Class and C Class (collectively the plans), pursuant to Rule 12b-1 of the 1940 Act. The plans provide that the A Class will pay ACIS an annual distribution and service fee of 0.25%. The plans provide that the C Class will pay ACIS an annual distribution and service fee of 1.00%, of which 0.25% is paid for individual shareholder services and 0.75% is paid for distribution services. The fees are computed and accrued daily based on each class’s daily net assets and paid monthly in arrears. The fees are used to pay financial intermediaries for distribution and individual shareholder services. Fees incurred under the plans during the period ended May 31, 2020 are detailed in the Statement of Operations.
Trustees’ Fees and Expenses — The Board of Trustees is responsible for overseeing the investment advisor’s management and operations of the fund. The trustees receive detailed information about the fund and its investment advisor regularly throughout the year, and meet at least quarterly with management of the investment advisor to review reports about fund operations. The fund’s officers do not receive compensation from the fund.
Interfund Transactions — The fund may enter into security transactions with other American Century Investments funds and other client accounts of the investment advisor, in accordance with the 1940 Act rules and procedures adopted by the Board of Trustees. The rules and procedures require, among other things, that these transactions be effected at the independent current market price of the security. During the period, the interfund purchases and sales were $22,005,000 and $50,955,000, respectively. The interfund transactions had no effect on the Statement of Operations in net realized gain (loss) on investment transactions.
4. Investment Transactions
Purchases and sales of investment securities, excluding short-term investments, for the period ended May 31, 2020 were $545,976,495 and $558,103,925, respectively.
5. Capital Share Transactions
Transactions in shares of the fund were as follows (unlimited number of shares authorized):
| | | | | | | | | | | | | | |
| Year ended
May 31, 2020 | | Year ended
May 31, 2019 | |
| Shares | Amount | Shares | Amount |
| Investor Class | | | | |
| Sold | 12,875,134 | | $ | 127,505,706 | | 12,479,809 | | $ | 119,706,847 | |
| Issued in reinvestment of distributions | 1,017,276 | | 10,010,143 | | 1,005,340 | | 9,651,589 | |
| Redeemed | (14,546,468) | | (139,837,689) | | (19,009,309) | | (182,669,942) | |
| (654,058) | | (2,321,840) | | (5,524,160) | | (53,311,506) | |
| I Class | | | | |
| Sold | 15,621,866 | | 152,009,996 | | 22,280,236 | | 213,987,792 | |
| Issued in reinvestment of distributions | 1,310,975 | | 12,894,499 | | 1,112,215 | | 10,682,075 | |
| Redeemed | (17,522,373) | | (169,513,702) | | (8,697,880) | | (83,605,430) | |
| (589,532) | | (4,609,207) | | 14,694,571 | | 141,064,437 | |
| Y Class | | | | |
| Sold | 2,088,916 | | 20,522,909 | | 2,441,370 | | 23,458,997 | |
| Issued in reinvestment of distributions | 149,369 | | 1,466,779 | | 107,671 | | 1,026,866 | |
| Redeemed | (1,578,716) | | (14,995,547) | | (1,039,771) | | (9,931,459) | |
| 659,569 | | 6,994,141 | | 1,509,270 | | 14,554,404 | |
| A Class | | | | |
| Sold | 617,221 | | 6,195,238 | | 762,941 | | 7,332,847 | |
| Issued in reinvestment of distributions | 110,943 | | 1,089,911 | | 106,900 | | 1,026,026 | |
| Redeemed | (838,588) | | (8,238,162) | | (463,926) | | (4,457,580) | |
| (110,424) | | (953,013) | | 405,915 | | 3,901,293 | |
| C Class | | | | |
| Sold | 173,852 | | 1,723,151 | | 329,519 | | 3,140,412 | |
| Issued in reinvestment of distributions | 26,038 | | 255,825 | | 30,293 | | 290,621 | |
| Redeemed | (344,183) | | (3,357,337) | | (593,747) | | (5,703,432) | |
| (144,293) | | (1,378,361) | | (233,935) | | (2,272,399) | |
| Net increase (decrease) | (838,738) | | $ | (2,268,280) | | 10,851,661 | | $ | 103,936,229 | |
6. Affiliated Fund Transactions
A summary of transactions for each affiliated fund for the period ended May 31, 2020 follows (amounts in thousands):
| | | | | | | | | | | | | | | | | | | | | | | | | | |
Affiliated Fund(1) | Beginning
Value | Purchase
Cost | Sales Cost | Change in Net
Unrealized
Appreciation
(Depreciation) | Ending
Value | Ending
Shares | Net Realized
Gain (Loss) | Distributions
Received(2) |
| American Century Diversified Municipal Bond ETF | $ | 7,016 | | $ | 3,722 | | $ | 511 | | $ | (25) | | $ | 10,202 | | 196 | | $ | (4) | | $ | 235 | |
| | | | | | | | |
(1)Investments are funds within the American Century Investments family of funds and are considered affiliated funds. Additional information and attributes of each affiliated fund are available at americancentury.com.
(2)Distributions received includes distributions from net investment income and from capital gains, if any.
7. Investments in Affiliated Funds
The fund does not invest in an affiliated fund for the purpose of exercising management or control; however, investments by the fund within its investment strategy may represent a significant portion of an affiliated fund's net assets.
8. Fair Value Measurements
The fund’s investments valuation process is based on several considerations and may use multiple inputs to determine the fair value of the investments held by the fund. In conformity with accounting principles generally accepted in the United States of America, the inputs used to determine a valuation are classified into three broad levels.
• Level 1 valuation inputs consist of unadjusted quoted prices in an active market for identical investments.
• Level 2 valuation inputs consist of direct or indirect observable market data (including quoted prices for comparable investments, evaluations of subsequent market events, interest rates, prepayment speeds, credit risk, etc.). These inputs also consist of quoted prices for identical investments initially expressed in local currencies that are adjusted through translation into U.S. dollars.
• Level 3 valuation inputs consist of unobservable data (including a fund’s own assumptions).
The level classification is based on the lowest level input that is significant to the fair valuation measurement. The valuation inputs are not necessarily an indication of the risks associated with investing in these securities or other financial instruments.
The following is a summary of the level classifications as of period end. The Schedule of Investments provides additional information on the fund’s portfolio holdings.
| | | | | | | | | | | |
| Level 1 | Level 2 | Level 3 |
| Assets | | | |
| Investment Securities | | | |
| Municipal Securities | — | | $ | 637,860,826 | | — | |
| Affiliated Funds | $ | 10,201,711 | | — | | — | |
| Exchange-Traded Funds | 6,725,592 | | — | | — | |
| $ | 16,927,303 | | $ | 637,860,826 | | — | |
9. Risk Factors
The value of the fund’s shares will go up and down, sometimes rapidly or unpredictably, based on the performance of the securities owned by the fund and other factors generally affecting the securities market. Market risks, including political, regulatory, economic and social developments, can affect the value of the fund’s investments. Natural disasters, public health emergencies, terrorism and other unforeseeable events may lead to increased market volatility and may have adverse long-term effects on world economies and markets generally.
The fund invests in lower-rated debt securities, which are subject to substantial risks including liquidity risk and credit risk.
10. Federal Tax Information
The tax character of distributions paid during the years ended May 31, 2020 and May 31, 2019 were as follows:
| | | | | | | | |
| 2020 | 2019 |
| Distributions Paid From | | |
| Exempt income | $ | 25,882,577 | | $ | 24,796,385 | |
| Taxable ordinary income | $ | 1,816,500 | | — | |
| Long-term capital gains | $ | 330,141 | | — | |
The book-basis character of distributions made during the year from net investment income or net realized gains may differ from their ultimate characterization for federal income tax purposes. These differences reflect the differing character of certain income items and net realized gains and losses for financial statement and tax purposes, and may result in reclassification among certain capital accounts on the financial statements.
As of period end, the federal tax cost of investments and the components of distributable earnings on a tax-basis were as follows:
| | | | | |
| Federal tax cost of investments | $ | 662,933,466 | |
| Gross tax appreciation of investments | $ | 15,932,453 | |
| Gross tax depreciation of investments | (24,077,790) | |
| Net tax appreciation (depreciation) of investments | $ | (8,145,337) | |
| Other book-to-tax adjustments | $ | (157,433) | |
| Undistributed exempt income | — | |
| Post-October capital loss deferral | $ | (1,175,166) | |
The cost of investments for federal income tax purposes was the same as the cost for financial reporting purposes.
Loss deferrals represent certain qualified losses that the fund has elected to treat as having been incurred in the following fiscal year for federal income tax purposes.
11. Recently Issued Accounting Standards
In March 2017, the Financial Accounting Standards Board (FASB) issued Accounting Standards Update No. 2017-08, “Receivables - Nonrefundable Fees and Other Costs (Subtopic 310-20), Premium Amortization on Purchased Callable Debt Securities” (ASU 2017-08). ASU 2017-08 amends the amortization period for certain purchased callable debt securities held at a premium, shortening such period to the earliest call date. The amendments are effective for fiscal years, and interim periods within those fiscal years, beginning after December 15, 2018. The adoption of ASU 2017-08 did not materially impact the financial statements.
| | | | | | | | | | | | | | | | | | | | | | | | | | | | | | | | | | | | | | | | | |
| For a Share Outstanding Throughout the Years Ended May 31 (except as noted) | | | | | | | | | | | | | |
| Per-Share Data | | | | | | | | | | Ratios and Supplemental Data | | | |
| | Income From Investment Operations: | | | Distributions From: | | | | | Ratio to Average Net Assets of: | | | |
| Net Asset
Value,
Beginning
of Period | Net
Investment
Income
(Loss)(1) | Net
Realized
and
Unrealized
Gain (Loss) | Total From
Investment
Operations | Net Investment Income | Net Realized Gains | Total Distributions | Net Asset
Value,
End
of Period | Total
Return(2) | Operating
Expenses | Net
Investment
Income
(Loss) | Portfolio
Turnover
Rate | Net
Assets,
End of
Period
(in thousands) |
| Investor Class | | | | | | | | | | | | | |
| 2020 | $9.86 | 0.34 | (0.49) | (0.15) | (0.34) | (0.03) | (0.37) | $9.34 | (1.64)% | 0.60% | 3.45% | 75% | $268,023 | |
| 2019 | $9.66 | 0.36 | 0.21 | 0.57 | (0.37) | — | (0.37) | $9.86 | 6.03% | 0.60% | 3.80% | 57% | $289,403 | |
| 2018 | $9.56 | 0.36 | 0.10 | 0.46 | (0.36) | — | (0.36) | $9.66 | 4.87% | 0.60% | 3.74% | 49% | $336,797 | |
| 2017 | $9.73 | 0.33 | (0.17) | 0.16 | (0.33) | — | (0.33) | $9.56 | 1.75% | 0.60% | 3.51% | 80% | $347,732 | |
| 2016 | $9.36 | 0.35 | 0.37 | 0.72 | (0.35) | — | (0.35) | $9.73 | 7.90% | 0.60% | 3.72% | 41% | $357,757 | |
| I Class | | | | | | | | | | | | | |
| 2020 | $9.86 | 0.36 | (0.49) | (0.13) | (0.36) | (0.03) | (0.39) | $9.34 | (1.45)% | 0.40% | 3.65% | 75% | $320,785 | |
| 2019 | $9.66 | 0.38 | 0.20 | 0.58 | (0.38) | — | (0.38) | $9.86 | 6.24% | 0.40% | 4.00% | 57% | $344,454 | |
| 2018 | $9.56 | 0.38 | 0.10 | 0.48 | (0.38) | — | (0.38) | $9.66 | 5.08% | 0.40% | 3.94% | 49% | $195,453 | |
| 2017 | $9.73 | 0.36 | (0.18) | 0.18 | (0.35) | — | (0.35) | $9.56 | 1.95% | 0.40% | 3.71% | 80% | $118,346 | |
| 2016 | $9.36 | 0.37 | 0.37 | 0.74 | (0.37) | — | (0.37) | $9.73 | 8.12% | 0.40% | 3.92% | 41% | $33,660 | |
| Y Class | | | | | | | | | | | | | |
| 2020 | $9.86 | 0.36 | (0.49) | (0.13) | (0.36) | (0.03) | (0.39) | $9.34 | (1.42)% | 0.37% | 3.68% | 75% | $36,453 | |
| 2019 | $9.65 | 0.39 | 0.21 | 0.60 | (0.39) | — | (0.39) | $9.86 | 6.38% | 0.37% | 4.03% | 57% | $31,979 | |
| 2018 | $9.56 | 0.38 | 0.09 | 0.47 | (0.38) | — | (0.38) | $9.65 | 5.00% | 0.37% | 3.97% | 49% | $16,750 | |
2017(3) | $9.40 | 0.05 | 0.16 | 0.21 | (0.05) | — | (0.05) | $9.56 | 2.25% | 0.37%(4) | 3.88%(4) | 80%(5) | $5 | |
| | | | | | | | | | | | | | | | | | | | | | | | | | | | | | | | | | | | | | | | | |
| For a Share Outstanding Throughout the Years Ended May 31 (except as noted) | | | | | | | | | | | | | |
| Per-Share Data | | | | | | | | | | Ratios and Supplemental Data | | | |
| | Income From Investment Operations: | | | Distributions From: | | | | | Ratio to Average Net Assets of: | | | |
| Net Asset
Value,
Beginning
of Period | Net
Investment
Income
(Loss)(1) | Net
Realized
and
Unrealized
Gain (Loss) | Total From
Investment
Operations | Net Investment Income | Net Realized Gains | Total Distributions | Net Asset
Value,
End
of Period | Total
Return(2) | Operating
Expenses | Net
Investment
Income
(Loss) | Portfolio
Turnover
Rate | Net
Assets,
End of
Period
(in thousands) |
| A Class | | | | | | | | | | | | | |
| 2020 | $9.86 | 0.31 | (0.49) | (0.18) | (0.31) | (0.03) | (0.34) | $9.34 | (1.89)% | 0.85% | 3.20% | 75% | $33,838 | |
| 2019 | $9.66 | 0.34 | 0.20 | 0.54 | (0.34) | — | (0.34) | $9.86 | 5.77% | 0.85% | 3.55% | 57% | $36,807 | |
| 2018 | $9.56 | 0.34 | 0.09 | 0.43 | (0.33) | — | (0.33) | $9.66 | 4.61% | 0.85% | 3.49% | 49% | $32,130 | |
| 2017 | $9.73 | 0.31 | (0.17) | 0.14 | (0.31) | — | (0.31) | $9.56 | 1.50% | 0.85% | 3.26% | 80% | $33,286 | |
| 2016 | $9.36 | 0.33 | 0.37 | 0.70 | (0.33) | — | (0.33) | $9.73 | 7.64% | 0.85% | 3.47% | 41% | $91,271 | |
| C Class | | | | | | | | | | | | | |
| 2020 | $9.86 | 0.24 | (0.49) | (0.25) | (0.24) | (0.03) | (0.27) | $9.34 | (2.62)% | 1.60% | 2.45% | 75% | $10,800 | |
| 2019 | $9.65 | 0.27 | 0.21 | 0.48 | (0.27) | — | (0.27) | $9.86 | 5.09% | 1.60% | 2.80% | 57% | $12,822 | |
| 2018 | $9.56 | 0.26 | 0.09 | 0.35 | (0.26) | — | (0.26) | $9.65 | 3.72% | 1.60% | 2.74% | 49% | $14,817 | |
| 2017 | $9.72 | 0.24 | (0.16) | 0.08 | (0.24) | — | (0.24) | $9.56 | 0.85% | 1.60% | 2.51% | 80% | $18,898 | |
| 2016 | $9.35 | 0.26 | 0.37 | 0.63 | (0.26) | — | (0.26) | $9.72 | 6.84% | 1.60% | 2.72% | 41% | $25,767 | |
| | |
| Notes to Financial Highlights |
(1)Computed using average shares outstanding throughout the period.
(2)Total returns are calculated based on the net asset value of the last business day and do not reflect applicable sales charges, if any. Total returns for periods less than one year are not annualized.
(3)April 10, 2017 (commencement of sale) through May 31, 2017.
(4)Annualized.
(5)Portfolio turnover is calculated at the fund level. Percentage indicated was calculated for the year ended May 31, 2017.
See Notes to Financial Statements.
| | |
| Report of Independent Registered Public Accounting Firm |
To the Board of Trustees of American Century Municipal Trust and Shareholders of High-Yield Municipal Fund
Opinion on the Financial Statements
We have audited the accompanying statement of assets and liabilities, including the schedule of investments, of High-Yield Municipal Fund (one of the funds constituting American Century Municipal Trust, referred to hereafter as the “Fund”) as of May 31, 2020, the related statement of operations for the year ended May 31, 2020, the statement of changes in net assets for each of the two years in the period ended May 31, 2020, including the related notes, and the financial highlights for each of the periods indicated therein (collectively referred to as the “financial statements”). In our opinion, the financial statements present fairly, in all material respects, the financial position of the Fund as of May 31, 2020, the results of its operations for the year then ended, the changes in its net assets for each of the two years in the period ended May 31, 2020 and the financial highlights for each of the periods indicated therein in conformity with accounting principles generally accepted in the United States of America.
Basis for Opinion
These financial statements are the responsibility of the Fund’s management. Our responsibility is to express an opinion on the Fund’s financial statements based on our audits. We are a public accounting firm registered with the Public Company Accounting Oversight Board (United States) (PCAOB) and are required to be independent with respect to the Fund in accordance with the U.S. federal securities laws and the applicable rules and regulations of the Securities and Exchange Commission and the PCAOB.
We conducted our audits of these financial statements in accordance with the standards of the PCAOB. Those standards require that we plan and perform the audit to obtain reasonable assurance about whether the financial statements are free of material misstatement, whether due to error or fraud.
Our audits included performing procedures to assess the risks of material misstatement of the financial statements, whether due to error or fraud, and performing procedures that respond to those risks. Such procedures included examining, on a test basis, evidence regarding the amounts and disclosures in the financial statements. Our audits also included evaluating the accounting principles used and significant estimates made by management, as well as evaluating the overall presentation of the financial statements. Our procedures included confirmation of securities owned as of May 31, 2020 by correspondence with the custodian and brokers. We believe that our audits provide a reasonable basis for our opinion.
/s/ PricewaterhouseCoopers LLP
Kansas City, Missouri
July 21, 2020
We have served as the auditor of one or more investment companies in American Century Investments since 1997.
Board of Trustees
The individuals listed below serve as trustees of the funds. Each trustee will continue to serve in this capacity until death, retirement, resignation or removal from office. The board has adopted a mandatory retirement age for trustees who are not “interested persons,” as that term is defined in the Investment Company Act (independent trustees). Independent trustees shall retire on December 31 of the year in which they reach their 75th birthday; provided, however, that on or after January 1, 2022, independent trustees shall retire on December 31 of the year in which they reach their 76th birthday.
Mr. Thomas is an “interested person” because he currently serves as President and Chief Executive Officer of American Century Companies, Inc. (ACC), the parent company of American Century Investment Management, Inc. (ACIM or the advisor). The other trustees (more than three-fourths of the total number) are independent. They are not employees, directors or officers of, and have no financial interest in, ACC or any of its wholly owned, direct or indirect, subsidiaries, including ACIM, American Century Investment Services, Inc. (ACIS) and American Century Services, LLC (ACS), and they do not have any other affiliations, positions or relationships that would cause them to be considered “interested persons” under the Investment Company Act. The trustees serve in this capacity for eight (in the case of Jonathan S. Thomas, 16; and Ronald J. Gilson, 9) registered investment companies in the American Century Investments family of funds.
The following table presents additional information about the trustees. The mailing address for each trustee other than Mr. Thomas is 1665 Charleston Road, Mountain View, California 94043. The mailing address for Mr. Thomas is 4500 Main Street, Kansas City, Missouri 64111.
| | | | | | | | | | | | | | | | | |
Name
(Year of Birth) | Position(s) Held with Funds | Length of Time Served | Principal Occupation(s) During Past 5 Years | Number of American Century Portfolios Overseen by Trustee | Other Directorships Held During Past 5 Years |
| Independent Trustees | | | | | |
Tanya S. Beder
(1955) | Trustee | Since 2011 | Chairman and CEO, SBCC Group Inc. (independent advisory services) (2006 to present) | 40 | CYS Investments, Inc.; Kirby Corporation: Nabors Industries Ltd. |
Jeremy I. Bulow
(1954) | Trustee | Since 2011 | Professor of Economics, Stanford University, Graduate School of Business (1979 to present) | 40 | None |
Anne Casscells
(1958) | Trustee | Since 2016 | Co-Chief Executive Officer and Chief Investment Officer, Aetos Alternatives Management (investment advisory firm) (2001 to present); Lecturer in Accounting, Stanford University, Graduate School of Business (2009 to 2017) | 40 | None |
Ronald J. Gilson
(1946) | Trustee and Chairman of the Board | Since 1995
(Chairman since 2005) | Charles J. Meyers Professor of Law and Business, Emeritus, Stanford Law School (1979 to 2016); Marc and Eva Stern Professor of Law and Business, Columbia University School of Law (1992 to present) | 59 | None |
| | | | | | | | | | | | | | | | | |
Name
(Year of Birth) | Position(s) Held with Funds | Length of Time Served | Principal Occupation(s) During Past 5 Years | Number of American Century Portfolios Overseen by Trustee | Other Directorships Held During Past 5 Years |
| Independent Trustees | | | | | |
Frederick L. A. Grauer
(1946) | Trustee | Since 2008 | Senior Advisor, Credit
Sesame, Inc. (credit
monitoring firm) (2018 to
present); Senior Advisor,
Course Hero (an
educational technology
company) (2015 to present) | 40 | None |
Jonathan D. Levin
(1972) | | | Philip H. Knight Professor and Dean, Graduate School of Business, Stanford University (2016 to present); Professor, Stanford University, (2000 to present) | 40 | None |
Peter F. Pervere
(1947) | Trustee | Since 2007 | Retired | 40 | None |
John B. Shoven
(1947) | Trustee | Since 2002 | Charles R. Schwab Professor of Economics, Stanford University (1973 to present, emeritus since 2019) | 40 | Cadence Design Systems; Exponent; Financial Engines |
| Interested Trustee | | | | | |
Jonathan S. Thomas
(1963) | Trustee | Since 2007 | President and Chief Executive Officer, ACC (2007 to present). Also serves as Chief Executive Officer, ACS; Executive Vice President, ACIM; Director, ACC, ACIM and other ACC subsidiaries | 122 | None |
The Statement of Additional Information has additional information about the fund's trustees and is available without charge, upon request, by calling 1-800-345-2021.
Officers
The following table presents certain information about the executive officers of the funds. Each officer serves as an officer for 16 (in the case of Robert J. Leach, 15) investment companies in the American Century family of funds, unless otherwise noted. No officer is compensated for his or her service as an officer of the funds. The listed officers are interested persons of the funds and are appointed or re-appointed on an annual basis. The mailing address for each of the officers listed below is 4500 Main Street, Kansas City, Missouri 64111.
| | | | | | | | |
Name
(Year of Birth) | Offices with the Funds | Principal Occupation(s) During the Past Five Years |
Patrick Bannigan
(1965) | President since 2019 | Executive Vice President and Director, ACC (2012 to present); Chief Financial Officer, Chief Accounting Officer and Treasurer, ACC (2015 to present). Also serves as President, ACS; Vice President, ACIM; Chief Financial Officer, Chief Accounting Officer and/or Director, ACIM, ACS and other ACC subsidiaries |
R. Wes Campbell
(1974) | Chief Financial Officer
and Treasurer since 2018 | Vice President, ACS (2020 to present); Investment Operations and Investment Accounting, ACS (2000 to present) |
Amy D. Shelton
(1964) | Chief Compliance Officer and Vice President since 2014 | Chief Compliance Officer, American Century funds, (2014 to present); Chief Compliance Officer, ACIM (2014 to present); Chief Compliance Officer, ACIS (2009 to present). Also serves as Vice President, ACIS |
Charles A. Etherington
(1957) | General Counsel since 2007 and Senior Vice President since 2006 | Attorney, ACC (1994 to present); Vice President, ACC (2005 to present); General Counsel, ACC (2007 to present). Also serves as General Counsel, ACIM, ACS, ACIS and other ACC subsidiaries; and Senior Vice President, ACIM and ACS |
C. Jean Wade
(1964) | Vice President since 2012 | Senior Vice President, ACS (2017 to present); Vice President, ACS (2000 to 2017) |
Robert J. Leach
(1966) | Vice President since 2006 | Vice President, ACS (2000 to present) |
David H. Reinmiller
(1963) | Vice President since 2000 | Attorney, ACC (1994 to present). Also serves as Vice President, ACIM and ACS |
Ward D. Stauffer
(1960) | Secretary since 2005 | Attorney, ACC (2003 to present) |
| | |
| Liquidity Risk Management Program |
The Fund has adopted a liquidity risk management program (the “program”). The Fund’s Board of Trustees (the "Board") has designated American Century Investment Management, Inc. (“ACIM”) as the administrator of the program. Personnel of ACIM or its affiliates conduct the day-to-day operation of the program pursuant to policies and procedures administered by those members of the ACIM’s Investment Oversight Committee who are members of the ACIM’s Investment Management and Global Analytics departments.
Under the program, ACIM manages the Fund’s liquidity risk, which is the risk that the Fund could not meet shareholder redemption requests without significant dilution of remaining shareholders’ interests in the Fund. This risk is managed by monitoring the degree of liquidity of the Fund’s investments, limiting the amount of the Fund’s illiquid investments, and utilizing various risk management tools and facilities available to the Fund for meeting shareholder redemptions, among other means. ACIM’s process of determining the degree of liquidity of the Fund’s investments is supported by one or more third-party liquidity assessment vendors.
The Board reviewed a report prepared by ACIM regarding the operation and effectiveness of the program for the period December 1, 2018 through December 31, 2019. No significant liquidity events impacting the Fund were noted in the report. In addition, ACIM provided its assessment that the program had been effective in managing the Fund’s liquidity risk.
Retirement Account Information
As required by law, distributions you receive from certain retirement accounts are subject to federal income tax withholding, unless you elect not to have withholding apply*. Tax will be withheld on the total amount withdrawn even though you may be receiving amounts that are not subject to withholding, such as nondeductible contributions. In such case, excess amounts of withholding could occur. You may adjust your withholding election so that a greater or lesser amount will be withheld.
If you don’t want us to withhold on this amount, you must notify us to not withhold the federal income tax. You may notify us in writing or in certain situations by telephone or through other electronic means. For systematic withdrawals, your withholding election will remain in effect until revoked or changed by filing a new election. You have the right to revoke your election at any time and change your withholding percentage for future distributions.
Remember, even if you elect not to have income tax withheld, you are liable for paying income tax on the taxable portion of your withdrawal. If you elect not to have income tax withheld or you don’t have enough income tax withheld, you may be responsible for payment of estimated tax. You may incur penalties under the estimated tax rules if your withholding and estimated tax payments are not sufficient. You can reduce or defer the income tax on a distribution by directly or indirectly rolling such distribution over to another IRA or eligible plan. You should consult your tax advisor for additional information.
State tax will be withheld if, at the time of your distribution, your address is within one of the mandatory withholding states and you have federal income tax withheld (or as otherwise required by state law). State taxes will be withheld from your distribution in accordance with the respective state rules.
*Some 403(b), 457 and qualified retirement plan distributions may be subject to 20% mandatory withholding, as they are subject to special tax and withholding rules. Your plan administrator or plan sponsor is required to provide you with a special tax notice explaining those rules at the time you request a distribution. If applicable, federal and/or state taxes may be withheld from your distribution amount.
Proxy Voting Policies
Descriptions of the principles and policies that the fund's investment advisor uses in exercising the voting rights associated with the securities purchased and/or held by the fund are available without charge, upon request, by calling 1-800-345-2021 or visiting American Century Investments’ website at americancentury.com/proxy. A description of the policies is also available on the Securities and Exchange Commission’s website at sec.gov. Information regarding how the investment advisor voted proxies relating to portfolio securities during the most recent 12-month period ended June 30 is available on americancentury.com/proxy. It is also available at sec.gov.
Quarterly Portfolio Disclosure
The fund files its complete schedule of portfolio holdings with the Securities and Exchange
Commission (SEC) for the first and third quarters of each fiscal year as an exhibit to its reports on
Form N-PORT. The fund’s Form N-PORT reports are available on the SEC’s website at sec.gov.
The fund also makes its complete schedule of portfolio holdings for the most recent quarter of its
fiscal year available on its website at americancentury.com and, upon request, by calling
1-800-345-2021.
Other Tax Information
The following information is provided pursuant to provisions of the Internal Revenue Code.
The fund hereby designates $330,141, or up to the maximum amount allowable, as long-term capital gain distributions (20% rate gain distributions) for the fiscal year ended May 31, 2020.
The fund hereby designates $1,816,500 as qualified short-term capital gain distributions for purposes of Internal Revenue Code Section 871 for the fiscal year ended May 31, 2020.
The fund designates $25,766,120 as exempt interest dividends for the fiscal year ended May 31, 2020.
| | | | | | | | |
| | |
| | |
| Contact Us | americancentury.com | |
| Automated Information Line | 1-800-345-8765 | |
| Investor Services Representative | 1-800-345-2021
or 816-531-5575 | |
| Investors Using Advisors | 1-800-378-9878 | |
| Business, Not-For-Profit, Employer-Sponsored Retirement Plans | 1-800-345-3533 | |
| Banks and Trust Companies, Broker-Dealers, Financial Professionals, Insurance Companies | 1-800-345-6488 | |
| Telecommunications Relay Service for the Deaf | 711 | |
| | |
| American Century Municipal Trust | | |
| | |
Investment Advisor: American Century Investment Management, Inc. Kansas City, Missouri | | |
| | |
| This report and the statements it contains are submitted for the general information of our shareholders. The report is not authorized for distribution to prospective investors unless preceded or accompanied by an effective prospectus. | | |
| | |
©2020 American Century Proprietary Holdings, Inc. All rights reserved.
CL-ANN-92644 2007 | | |
| | | | | |
| |
| Annual Report |
| |
| May 31, 2020 |
| |
| Intermediate-Term Tax-Free Bond Fund |
| Investor Class (TWTIX) |
| I Class (AXBIX) |
| Y Class (ATBYX) |
| A Class (TWWOX) |
| C Class (TWTCX) |
Beginning on January 1, 2021, as permitted by regulations adopted by the Securities and Exchange Commission, paper copies of the fund’s shareholder reports like this one will no longer be sent by mail, unless you specifically request paper copies of the reports from the fund or from your financial intermediary, such as a broker-dealer or bank. Instead, the reports will be made available on a website, and you will be notified by mail each time a report is posted and provided with a website link to access the report.
If you already elected to receive shareholder reports electronically, you will not be affected by this change and you need not take any action. You may elect to receive shareholder reports and other communications from the fund or your financial intermediary electronically by calling or sending an email request to your appropriate contacts as listed on the back cover of this report.
You may elect to receive all future reports in paper free of charge. You can inform the fund or your financial intermediary that you wish to continue receiving paper copies of your shareholder reports by calling or sending an email request to your appropriate contacts as listed on the back cover of this report. Your election to receive reports in paper will apply to all funds held with the fund complex/your financial intermediary.
| | | | | |
| President’s Letter | |
| Performance | |
| Portfolio Commentary | |
| Fund Characteristics | |
| Shareholder Fee Example | |
| Schedule of Investments | |
| Statement of Assets and Liabilities | |
| Statement of Operations | |
| Statement of Changes in Net Assets | |
| Notes to Financial Statements | |
| Financial Highlights | |
| Report of Independent Registered Public Accounting Firm | |
| Management | |
| |
| |
| Liquidity Risk Management Program | |
| Additional Information | |
Any opinions expressed in this report reflect those of the author as of the date of the report, and do not necessarily represent the opinions of American Century Investments® or any other person in the American Century Investments organization. Any such opinions are subject to change at any time based upon market or other conditions and American Century Investments disclaims any responsibility to update such opinions. These opinions may not be relied upon as investment advice and, because investment decisions made by American Century Investments funds are based on numerous factors, may not be relied upon as an indication of trading intent on behalf of any American Century Investments fund. Security examples are used for representational purposes only and are not intended as recommendations to purchase or sell securities. Performance information for comparative indices and securities is provided to American Century Investments by third party vendors. To the best of American Century Investments’ knowledge, such information is accurate at the time of printing.
Jonathan Thomas
Dear Investor:
Thank you for reviewing this annual report for the period ended May 31, 2020. Annual reports help convey important information about fund returns, including market factors that affected performance during the reporting period. For additional investment insights, please visit americancentury.com.
Pandemic Rattled Markets, But Most Munis Persevered
Through the first several months of the reporting period, municipal bonds (munis) generally advanced, as U.S. bond yields declined amid dovish Federal Reserve (Fed) policy. In July 2019, growing concerns about global economic risks and U.S.-China trade disputes prompted the Fed to cut short-term interest rates for the first time in 10 years. The Fed followed up with additional rate cuts in September and October, driving bond yields lower. Munis also benefited from stable credit fundamentals and favorable supply/demand dynamics.
Market sentiment abruptly changed in late February. The COVID-19 outbreak rapidly spread throughout the world, triggering stay-at-home orders, business shutdowns and recession fears. Risk assets, including munis, sold off sharply in a global flight to the safest, highest-quality securities. The Fed and the U.S. federal government stepped in quickly and aggressively to provide financial relief to companies, municipalities and individuals. As part of its efforts to stabilize the financial system, the Fed relaunched quantitative easing and added munis to the bond-buying plan. This unprecedented move helped investment-grade munis generate their best monthly performance since January 2009. The May rally was enough to push the broad asset class back into positive-return territory for the 12-month period. High-yield munis, which suffered greater losses in the market sell-off, declined for the reporting period.
As COVID-19 infection rates are slowing, much of the U.S. economy is reopening. Nevertheless, the return to pre-pandemic life will take time and patience. In the meantime, investors likely will face periods of economic and political uncertainty and heightened market volatility. While these influences can be unsettling, they tend to be temporary.
We appreciate your confidence in us during these extraordinary times. We have a long history of helping clients weather unpredictable markets, and we’re confident we will meet today's challenges.
Sincerely,
Jonathan Thomas
President and Chief Executive Officer
American Century Investments
| | | | | | | | | | | | | | | | | | | | |
| Total Returns as of May 31, 2020 | | | | | | |
| | | | Average Annual Returns | | | |
| | Ticker Symbol | 1 year | 5 years | 10 years | Since
Inception | Inception Date |
| Investor Class | TWTIX | 2.09% | 2.81% | 3.10% | — | 3/2/87 |
| S&P Intermediate Term National AMT-Free Municipal Bond Index | — | 3.68% | 3.23% | 3.43% | — | — |
| I Class | AXBIX | 2.30% | 3.01% | 3.32% | — | 4/15/03 |
| Y Class | ATBYX | 2.33% | — | — | 3.48% | 4/10/17 |
| A Class | TWWOX | | | | | 3/1/10 |
| No sales charge | | 1.75% | 2.53% | 2.85% | — | |
| With sales charge | | -2.82% | 1.60% | 2.38% | — | |
| C Class | TWTCX | 0.99% | 1.77% | 2.08% | — | 3/1/10 |
Average annual returns since inception are presented when ten years of performance history is not available.
Sales charges include initial sales charges and contingent deferred sales charges (CDSCs), as applicable. A Class shares have a 4.50% maximum initial sales charge and may be subject to a maximum CDSC of 1.00%. C Class shares redeemed within 12 months of purchase are subject to a maximum CDSC of 1.00%. The SEC requires that mutual funds provide performance information net of maximum sales charges in all cases where charges could be applied.
Data presented reflect past performance. Past performance is no guarantee of future results. Current performance may be higher or lower than the performance shown. Total returns for periods less than one year are not annualized. Investment return and principal value will fluctuate, and redemption value may be more or less than original cost. Data assumes reinvestment of dividends and capital gains, and none of the charts reflect the deduction of taxes that a shareholder would pay on fund distributions or the redemption of fund shares. To obtain performance data current to the most recent month end, please call 1-800-345-2021 or visit americancentury.com. For additional information about the fund, please consult the prospectus.
| | |
Growth of $10,000 Over 10 Years |
| $10,000 investment made May 31, 2010 |
| Performance for other share classes will vary due to differences in fee structure. |
| | | | | |
| Value on May 31, 2020 | |
| Investor Class — $13,578 |
| |
| S&P Intermediate Term National AMT-Free Municipal Bond Index — $14,012 |
| |
| | | | | | | | | | | | | | |
Total Annual Fund Operating Expenses | | | | |
| Investor Class | I Class | Y Class | A Class | C Class |
| 0.47% | 0.27% | 0.24% | 0.72% | 1.47% |
The total annual fund operating expenses shown is as stated in the fund’s prospectus current as of the date of this report. The prospectus may vary from the expense ratio shown elsewhere in this report because it is based on a different time period, includes acquired fund fees and expenses, and, if applicable, does not include fee waivers or expense reimbursements.
Data presented reflect past performance. Past performance is no guarantee of future results. Current performance may be higher or lower than the performance shown. Total returns for periods less than one year are not annualized. Investment return and principal value will fluctuate, and redemption value may be more or less than original cost. Data assumes reinvestment of dividends and capital gains, and none of the charts reflect the deduction of taxes that a shareholder would pay on fund distributions or the redemption of fund shares. To obtain performance data current to the most recent month end, please call 1-800-345-2021 or visit americancentury.com. For additional information about the fund, please consult the prospectus.
Portfolio Managers: Alan Kruss, Joseph Gotelli and Steven Permut
Performance Summary
Intermediate-Term Tax-Free Bond returned 2.09%* for the 12 months ended May 31, 2020. By comparison, the S&P Intermediate Term National AMT-Free Municipal Bond Index returned 3.68%. Fund returns reflect operating expenses, while index returns do not.
The fund and index generated positive returns during the period despite historic volatility and a deep market sell-off in March and April 2020 that impacted nearly all asset classes with the exception of Treasuries as the coronavirus pandemic abruptly halted economic activity. Through the first half of the period, the broad municipal bond (muni) market posted modest gains yet lagged U.S. Treasuries, which benefited from a dovish Federal Reserve (Fed). The central bank cut rates three times in 2019—in July, September and October—driving Treasury yields lower. Along with all but the safest-haven assets, munis plunged in early 2020 as the COVID-19 pandemic swept across the U.S. The market rebounded sharply in May, bolstered by monetary and fiscal responses to the crisis and a renewed risk-on mindset.
The steep sell-off in March reflected a global flight to quality, soaring volatility and sinking market liquidity. The Fed responded quickly by cutting short-term rates to near 0% and resurrecting a host of financial crisis-era programs to help boost liquidity and help stabilize the financial markets. These efforts, along with Congress’ $2 trillion fiscal rescue package, provided some relief to munis by the end of March. In early April, the Fed directly addressed muni market woes by establishing the $500 billion Municipal Liquidity Facility, which provides loans to states and municipalities. The Fed subsequently modified the program to expand eligibility and help ensure that municipalities are able to meet short-term borrowing needs. This unprecedented move provided additional support to the muni market, as it helped restore supply and demand for munis at the end of the reporting period.
Downgrades Likely, But Defaults Less So
Although state and local finances across the U.S. were relatively healthy at the start of 2020, costs related to the COVID-19 pandemic tapped states, counties and municipalities as they scrambled to secure medical equipment, medicine and support for first responders. The Coronavirus Aid, Relief and Economic Security Act, which President Donald Trump signed into law on March 27, provides funds to offset a large portion of those expenses. In the final days of the period, demonstrations in response to the death of George Floyd occurred across the U.S., and while the unrest likely will affect local and state budgets, we believe the total financial impact will be fairly limited.
Although we believe downgrades will occur across credit markets in general, we don’t expect a wave of defaults as most state and local governments entered the crisis with record levels of reserves and available liquidity; state and local governments possess multiple levers to avoid default, including tax increases, spending reductions and the ability to shift funds; and support from the federal government remains likely given the essential services provided by states and municipalities. Ultimately, the biggest risks we see state and local governments facing are tied to declining revenues causing budgetary stress, potentially leading to more downgrades. The extent of the challenges hinge on the duration of the economic downturn and the challenges involved in returning to normal.
*All fund returns referenced in this commentary are for Investor Class shares. Performance for other share classes will vary due to differences in fee structure; when Investor Class performance exceeds that of the index, other share classes may not. See page 3 for returns for all share classes.
Sector Allocation, Security Selection Detracted
Sector allocation hindered relative performance over the 12-month period. Out-of-index allocations to hospitals and continuing care retirement communities weighed on results as the pandemic grew. Underweight exposure, relative to the index, in higher-quality areas, such as prerefunded bonds and state general obligation bonds, also detracted. Allocations in transportation and special tax sectors supplied a modest lift.
Yield Curve Approach Proved Advantageous
Our yield-curve positioning, featuring a longer duration than the index, provided a considerable relative lift through the second half of the period. The strategy paid off as longer-maturity yields declined sharply.
Portfolio Positioning
On the heels of May’s robust rally, we expect more muted advances through the balance of 2020. Although the economy is in the process of restarting, COVID-19 remains a concern and a key uncertainty. We anticipate a rocky road until the November election, after which, debates over higher tax rates could extend the turbulence.
Municipal funding needs could contribute to increased supply in the coming months. We believe the recent recovery in demand and a recognition that defaults likely will remain few and fragmented should extend support for munis.
As always, fundamental credit research will drive our investment decisions. For example, late in the reporting period, we found opportunities to purchase what we believe are attractive credits that had been excessively punished during the market turmoil. We also exited some positions in the higher education sector, which may face greater risks due to COVID-19 fallout. Overall, we ended the period with a slight bias toward lower-rated, higher-yielding investment-grade munis and maintained a slightly longer duration in anticipation of ongoing economic challenges.
| | | | | |
| MAY 31, 2020 | |
Portfolio at a Glance | |
| Weighted Average Life to Maturity | 9.7 years |
| Average Duration (Modified) | 5.0 years |
| | |
Top Five States and Territories | % of net assets |
| Illinois | 12.3% |
| Texas | 11.8% |
| New York | 9.9% |
| Pennsylvania | 7.8% |
| California | 5.1% |
| | |
Top Five Sectors | % of fund investments |
| General Obligation (GO) - Local | 13% |
| Hospital | 13% |
| Special Tax | 12% |
| Water & Sewer | 9% |
| Corporate Municipal | 7% |
| | |
Types of Investments in Portfolio | % of net assets |
| Municipal Securities | 99.8% |
| Exchange-Traded Funds | 0.5% |
| Other Assets and Liabilities | (0.3)% |
Fund shareholders may incur two types of costs: (1) transaction costs, including sales charges (loads) on purchase payments and redemption/exchange fees; and (2) ongoing costs, including management fees; distribution and service (12b-1) fees; and other fund expenses. This example is intended to help you understand your ongoing costs (in dollars) of investing in your fund and to compare these costs with the ongoing cost of investing in other mutual funds.
The example is based on an investment of $1,000 made at the beginning of the period and held for the entire period from December 1, 2019 to May 31, 2020.
Actual Expenses
The table provides information about actual account values and actual expenses for each class. You may use the information, together with the amount you invested, to estimate the expenses that you paid over the period. First, identify the share class you own. Then simply divide your account value by $1,000 (for example, an $8,600 account value divided by $1,000 = 8.6), then multiply the result by the number under the heading “Expenses Paid During Period” to estimate the expenses you paid on your account during this period.
If you hold Investor Class shares of any American Century Investments fund, or I Class shares of the American Century Diversified Bond Fund, in an American Century Investments account (i.e., not through a financial intermediary or employer-sponsored retirement plan account), American Century Investments may charge you a $25.00 annual account maintenance fee if the value of those shares is less than $10,000. We will redeem shares automatically in one of your accounts to pay the $25.00 fee. In determining your total eligible investment amount, we will include your investments in all personal accounts (including American Century Investments brokerage accounts) registered under your Social Security number. Personal accounts include individual accounts, joint accounts, UGMA/UTMA accounts, personal trusts, Coverdell Education Savings Accounts and IRAs (including traditional, Roth, Rollover, SEP-, SARSEP- and SIMPLE-IRAs), and certain other retirement accounts. If you have only business, business retirement, employer-sponsored or American Century Investments brokerage accounts, you are currently not subject to this fee. If you are subject to the account maintenance fee, your account value could be reduced by the fee amount.
Hypothetical Example for Comparison Purposes
The table also provides information about hypothetical account values and hypothetical expenses based on the actual expense ratio of each class of your fund and an assumed rate of return of 5% per year before expenses, which is not the actual return of a fund’s share class. The hypothetical account values and expenses may not be used to estimate the actual ending account balance or expenses you paid for the period. You may use this information to compare the ongoing costs of investing in your fund and other funds. To do so, compare this 5% hypothetical example with the 5% hypothetical examples that appear in the shareholder reports of the other funds.
Please note that the expenses shown in the table are meant to highlight your ongoing costs only and do not reflect any transactional costs, such as sales charges (loads) or redemption/exchange fees. Therefore, the table is useful in comparing ongoing costs only, and will not help you determine the relative total costs of owning different funds. In addition, if these transactional costs were included, your costs would have been higher.
| | | | | | | | | | | | | | |
| | Beginning
Account Value
12/1/19 | Ending
Account Value
5/31/20 | Expenses Paid During Period(1) 12/1/19 - 5/31/20 | Annualized Expense Ratio(1) |
Actual | | | | |
| Investor Class | $1,000 | $999.70 | | $2.35 | 0.47% |
| I Class | $1,000 | $1,000.70 | | $1.35 | 0.27% |
| Y Class | $1,000 | $1,000.90 | | $1.20 | 0.24% |
| A Class | $1,000 | $998.50 | | $3.60 | 0.72% |
| C Class | $1,000 | $994.80 | | $7.33 | 1.47% |
Hypothetical | | | | |
| Investor Class | $1,000 | $1,022.65 | | $2.38 | 0.47% |
| I Class | $1,000 | $1,023.65 | | $1.37 | 0.27% |
| Y Class | $1,000 | $1,023.80 | | $1.21 | 0.24% |
| A Class | $1,000 | $1,021.40 | | $3.64 | 0.72% |
| C Class | $1,000 | $1,017.65 | | $7.42 | 1.47% |
(1)Expenses are equal to the class's annualized expense ratio listed in the table above, multiplied by the average account value over the period, multiplied by 183, the number of days in the most recent fiscal half-year, divided by 366, to reflect the one-half year period. Annualized expense ratio reflects actual expenses, including any applicable fee waivers or expense reimbursements and excluding any acquired fund fees and expenses.
MAY 31, 2020
| | | | | | | | |
| Principal Amount | Value |
| MUNICIPAL SECURITIES — 99.8% | | |
| Alabama — 1.2% | | |
| Black Belt Energy Gas District Rev., VRN, 4.00%, 12/1/48 (GA: Goldman Sachs & Company) | $ | 10,000,000 | | $ | 10,775,500 | |
| Houston County Health Care Authority Rev., 5.00%, 10/1/24 | 1,000,000 | | 1,136,780 | |
| Houston County Health Care Authority Rev., 5.00%, 10/1/25 | 1,000,000 | | 1,161,160 | |
| Houston County Health Care Authority Rev., 5.00%, 10/1/30 | 2,000,000 | | 2,301,460 | |
| Infirmary Health System Special Care Facilities Financing Authority of Mobile Rev., (Infirmary Health System Obligated Group), 5.00%, 2/1/26 | 5,925,000 | | 7,026,872 | |
| Southeast Alabama Gas Supply District Rev., VRN, 4.00%, 6/1/49 (GA: Morgan Stanley) | 20,000,000 | | 21,505,200 | |
| University of South Alabama Rev., 4.00%, 4/1/35 (AGM) | 1,025,000 | | 1,185,771 | |
| University of South Alabama Rev., 4.00%, 4/1/37 (AGM) | 1,735,000 | | 1,988,952 | |
| University of South Alabama Rev., 4.00%, 4/1/38 (AGM) | 1,000,000 | | 1,142,280 | |
| | 48,223,975 | |
| Alaska — 0.2% | | |
| State of Alaska International Airports System Rev., 5.00%, 10/1/32 | 3,560,000 | | 4,121,946 | |
| Valdez Rev., (BP Pipelines Alaska, Inc.), 5.00%, 1/1/21 (GA: BP plc) | 2,600,000 | | 2,648,854 | |
| | 6,770,800 | |
| Arizona — 3.2% | | |
| Arizona Health Facilities Authority Rev., (Banner Health Obligated Group), VRN, 1.77%, (67% of the 3-month LIBOR plus 0.81%), 1/1/37 | 7,500,000 | | 7,032,900 | |
| Arizona Industrial Development Authority Rev., 3.625%, 5/20/33 | 6,440,745 | | 6,462,772 | |
Arizona Industrial Development Authority Rev., (BASIS Schools, Inc. Obligated Group), 4.00%, 7/1/21(1) | 165,000 | | 165,759 | |
Arizona Industrial Development Authority Rev., (BASIS Schools, Inc. Obligated Group), 3.00%, 7/1/22(1) | 105,000 | | 103,580 | |
Arizona Industrial Development Authority Rev., (BASIS Schools, Inc. Obligated Group), 5.00%, 7/1/26(1) | 500,000 | | 525,910 | |
Arizona Industrial Development Authority Rev., (BASIS Schools, Inc. Obligated Group), 4.00%, 7/1/27(1) | 400,000 | | 396,100 | |
Arizona Industrial Development Authority Rev., (BASIS Schools, Inc. Obligated Group), 5.00%, 7/1/37(1) | 600,000 | | 608,904 | |
Arizona Industrial Development Authority Rev., (BASIS Schools, Inc. Obligated Group), 5.00%, 7/1/47(1) | 855,000 | | 848,690 | |
Arizona Industrial Development Authority Rev., (Pinecrest Academy of Nevada), 4.00%, 7/15/30(1) | 625,000 | | 621,888 | |
Arizona Industrial Development Authority Rev., (Pinecrest Academy of Nevada), 4.00%, 7/15/40(1) | 725,000 | | 636,166 | |
| Arizona Industrial Development Authority Rev., (Provident Group-NCCU Properties LLC), 5.00%, 6/1/28 (BAM) | 300,000 | | 367,056 | |
| Arizona Industrial Development Authority Rev., (Provident Group-NCCU Properties LLC), 5.00%, 6/1/29 (BAM) | 250,000 | | 310,548 | |
| Arizona Industrial Development Authority Rev., (Provident Group-NCCU Properties LLC), 5.00%, 6/1/31 (BAM) | 625,000 | | 766,138 | |
| Arizona Industrial Development Authority Rev., (Provident Group-NCCU Properties LLC), 5.00%, 6/1/32 (BAM) | 300,000 | | 364,071 | |
| Arizona Industrial Development Authority Rev., (Provident Group-NCCU Properties LLC), 5.00%, 6/1/33 (BAM) | 300,000 | | 361,701 | |
| Arizona Industrial Development Authority Rev., (Provident Group-NCCU Properties LLC), 4.00%, 6/1/34 (BAM) | 250,000 | | 275,123 | |
| | | | | | | | |
| Principal Amount | Value |
| Arizona Industrial Development Authority Rev., (Provident Group-NCCU Properties LLC), 5.00%, 6/1/35 (BAM) | $ | 525,000 | | $ | 628,021 | |
| Arizona Industrial Development Authority Rev., (Provident Group-NCCU Properties LLC), 5.00%, 6/1/36 (BAM) | 1,655,000 | | 1,970,873 | |
| Arizona Industrial Development Authority Rev., (Provident Group-NCCU Properties LLC), 5.00%, 6/1/37 (BAM) | 1,550,000 | | 1,839,431 | |
| Arizona Industrial Development Authority Rev., (Provident Group-NCCU Properties LLC), 4.00%, 6/1/39 (BAM) | 500,000 | | 541,855 | |
Industrial Development Authority of the City of Phoenix Rev., (BASIS Schools, Inc. Obligated Group), 4.00%, 7/1/25(1) | 6,400,000 | | 6,416,704 | |
| Industrial Development Authority of the City of Phoenix Rev., (Downtown Phoenix Student Housing LLC), 5.00%, 7/1/23 | 100,000 | | 104,015 | |
| Industrial Development Authority of the City of Phoenix Rev., (Downtown Phoenix Student Housing LLC), 5.00%, 7/1/24 | 500,000 | | 524,010 | |
| Industrial Development Authority of the City of Phoenix Rev., (Downtown Phoenix Student Housing LLC), 5.00%, 7/1/26 | 200,000 | | 211,246 | |
| Industrial Development Authority of the City of Phoenix Rev., (Downtown Phoenix Student Housing LLC), 5.00%, 7/1/27 | 300,000 | | 317,004 | |
| Industrial Development Authority of the City of Phoenix Rev., (Downtown Phoenix Student Housing LLC), 5.00%, 7/1/28 | 215,000 | | 227,582 | |
| Industrial Development Authority of the City of Phoenix Rev., (Downtown Phoenix Student Housing LLC), 5.00%, 7/1/30 | 700,000 | | 733,614 | |
| Industrial Development Authority of the City of Phoenix Rev., (Downtown Phoenix Student Housing LLC), 5.00%, 7/1/32 | 700,000 | | 723,947 | |
| Industrial Development Authority of the City of Phoenix Rev., (Downtown Phoenix Student Housing LLC), 5.00%, 7/1/33 | 300,000 | | 308,214 | |
| Industrial Development Authority of the City of Phoenix Rev., (Downtown Phoenix Student Housing LLC), 5.00%, 7/1/37 | 1,000,000 | | 1,015,230 | |
| Industrial Development Authority of the City of Phoenix Rev., (Downtown Phoenix Student Housing LLC), 5.00%, 7/1/42 | 1,250,000 | | 1,266,112 | |
| Industrial Development Authority of the City of Phoenix Rev., (GreatHearts Arizona), 5.00%, 7/1/36 | 1,875,000 | | 2,001,187 | |
| Industrial Development Authority of the City of Phoenix Rev., (GreatHearts Arizona), 5.00%, 7/1/41 | 1,200,000 | | 1,269,084 | |
| Industrial Development Authority of the City of Phoenix Rev., (GreatHearts Arizona), 5.00%, 7/1/46 | 1,300,000 | | 1,367,158 | |
Industrial Development Authority of the City of Phoenix Rev., (Legacy Traditional School Obligated Group), 5.00%, 7/1/31(1) | 10,965,000 | | 11,353,709 | |
Industrial Development Authority of the County of Pima Rev., (American Leadership Academy, Inc.), 4.00%, 6/15/22(1) | 475,000 | | 471,879 | |
Industrial Development Authority of the County of Pima Rev., (American Leadership Academy, Inc.), 4.125%, 6/15/29(1) | 4,905,000 | | 4,623,208 | |
Industrial Development Authority of the County of Pima Rev., (American Leadership Academy, Inc.), 4.75%, 6/15/37(1) | 4,500,000 | | 4,139,100 | |
Industrial Development Authority of the County of Pima Rev., (American Leadership Academy, Inc.), 5.00%, 6/15/47(1) | 7,075,000 | | 6,414,124 | |
Industrial Development Authority of the County of Pima Rev., (American Leadership Academy, Inc.), 5.00%, 6/15/52(1) | 2,240,000 | | 2,001,283 | |
| Industrial Development Authority of the County of Yavapai Rev., (Yavapai Community Hospital Association), 5.00%, 8/1/27 | 900,000 | | 1,067,949 | |
| Industrial Development Authority of the County of Yavapai Rev., (Yavapai Community Hospital Association), 5.00%, 8/1/28 | 800,000 | | 946,232 | |
| Industrial Development Authority of the County of Yavapai Rev., (Yavapai Community Hospital Association), 5.00%, 8/1/29 | 650,000 | | 765,642 | |
| Industrial Development Authority of the County of Yavapai Rev., (Yavapai Community Hospital Association), 5.00%, 8/1/30 | 1,625,000 | | 1,904,955 | |
| Industrial Development Authority of the County of Yavapai Rev., (Yavapai Community Hospital Association), 5.00%, 8/1/31 | 1,500,000 | | 1,745,040 | |
| La Paz County Industrial Development Authority Rev., (Harmony Public Schools), 5.00%, 2/15/28 | 370,000 | | 411,484 | |
| | | | | | | | |
| Principal Amount | Value |
| La Paz County Industrial Development Authority Rev., (Harmony Public Schools), 5.00%, 2/15/38 | $ | 780,000 | | $ | 845,005 | |
| La Paz County Industrial Development Authority Rev., (Harmony Public Schools), 5.00%, 2/15/48 | 1,000,000 | | 1,065,820 | |
| Maricopa County Industrial Development Authority Rev., (Banner Health Obligated Group), VRN, 0.71%, (MUNIPSA plus 0.57%), 1/1/35 | 3,890,000 | | 3,821,186 | |
Maricopa County Industrial Development Authority Rev., (Legacy Traditional School Obligated Group), 4.00%, 7/1/29(1) | 1,000,000 | | 987,970 | |
Maricopa County Industrial Development Authority Rev., (Legacy Traditional School Obligated Group), 5.00%, 7/1/39(1) | 1,855,000 | | 1,881,564 | |
Maricopa County Industrial Development Authority Rev., (Legacy Traditional School Obligated Group), 5.00%, 7/1/49(1) | 3,500,000 | | 3,489,220 | |
| Maricopa County Industrial Development Authority Rev., (Scottsdale Healthcare Hospitals Obligated Group), VRN, 0.94%, (MUNIPSA plus 0.80%), 9/1/48 | 7,735,000 | | 7,637,539 | |
| McAllister Academic Village LLC Rev., (Arizona State University), 5.00%, 7/1/25 | 700,000 | | 847,945 | |
| McAllister Academic Village LLC Rev., (Arizona State University), 5.00%, 7/1/26 | 600,000 | | 746,226 | |
| McAllister Academic Village LLC Rev., (Arizona State University), 5.00%, 7/1/27 | 1,000,000 | | 1,244,480 | |
| Phoenix Civic Improvement Corp. Rev., 5.00%, 7/1/22 | 1,250,000 | | 1,374,575 | |
| Salt River Project Agricultural Improvement & Power District Rev., 5.00%, 1/1/30 | 10,000,000 | | 13,098,800 | |
| Salt Verde Financial Corp. Rev., 5.00%, 12/1/37 (GA: Citigroup Global Markets) | 10,030,000 | | 13,093,764 | |
| | 127,291,292 | |
| Arkansas — 0.1% | | |
| Baxter County Rev., (Baxter County Regional Hospital, Inc.), 5.00%, 9/1/23 | 1,000,000 | | 1,099,700 | |
| Baxter County Rev., (Baxter County Regional Hospital, Inc.), 5.00%, 9/1/24 | 1,360,000 | | 1,531,129 | |
| Baxter County Rev., (Baxter County Regional Hospital, Inc.), 5.00%, 9/1/25 | 1,155,000 | | 1,326,540 | |
| | 3,957,369 | |
| California — 5.1% | | |
| Alameda Corridor Transportation Authority Rev., 4.00%, 10/1/21 | 700,000 | | 721,546 | |
| Alameda Corridor Transportation Authority Rev., 5.00%, 10/1/24 | 1,000,000 | | 1,086,120 | |
| Alameda Corridor Transportation Authority Rev., 5.00%, 10/1/36 | 7,065,000 | | 7,649,275 | |
| Anaheim Public Financing Authority Rev., 5.00%, 5/1/27 | 1,725,000 | | 1,923,496 | |
| Anaheim Public Financing Authority Rev., 5.00%, 5/1/30 | 1,750,000 | | 1,935,447 | |
| Anaheim Public Financing Authority Rev., 5.00%, 5/1/31 | 2,000,000 | | 2,200,960 | |
| Anaheim Public Financing Authority Rev., 5.00%, 5/1/32 | 2,000,000 | | 2,188,900 | |
| Anaheim Public Financing Authority Rev., 5.00%, 5/1/33 | 1,800,000 | | 1,960,218 | |
Anaheim Public Financing Authority Rev., Capital Appreciation, 0.00%, 9/1/25 (AGM)(2) | 2,000,000 | | 1,905,620 | |
| Bay Area Toll Authority Rev., VRN, 1.24%, (MUNIPSA plus 1.10%), 4/1/45 | 3,750,000 | | 3,737,850 | |
| California County Tobacco Securitization Agency Rev., (Los Angeles County Securitization Corp.), 5.45%, 6/1/28 | 2,000,000 | | 2,001,080 | |
| California Health Facilities Financing Authority Rev., (Providence St. Joseph Health Obligated Group), 5.00%, 7/1/37 | 1,810,000 | | 1,987,543 | |
California Municipal Finance Authority Rev., (California Baptist University), 4.00%, 11/1/21(1) | 405,000 | | 407,296 | |
California Municipal Finance Authority Rev., (California Baptist University), 4.00%, 11/1/26(1) | 1,750,000 | | 1,772,277 | |
| California Municipal Finance Authority Rev., (Northbay Healthcare Group Obligated Group), 5.00%, 11/1/23 | 600,000 | | 657,324 | |
| | | | | | | | |
| Principal Amount | Value |
| California Municipal Finance Authority Rev., (Northbay Healthcare Group Obligated Group), 5.00%, 11/1/24 | $ | 1,000,000 | | $ | 1,116,390 | |
| California Municipal Finance Authority Rev., (Northbay Healthcare Group Obligated Group), 5.00%, 11/1/25 | 1,000,000 | | 1,132,620 | |
| California Municipal Finance Authority Rev., (Northbay Healthcare Group Obligated Group), 5.00%, 11/1/26 | 1,000,000 | | 1,145,220 | |
| California State Public Works Board Rev., 5.00%, 4/1/25 | 5,000,000 | | 5,413,550 | |
| California Statewide Communities Development Authority Rev., (CHF-Irvine LLC), 5.00%, 5/15/25 | 1,500,000 | | 1,642,155 | |
| California Statewide Communities Development Authority Rev., (CHF-Irvine LLC), 5.00%, 5/15/26 | 1,500,000 | | 1,657,245 | |
| California Statewide Communities Development Authority Rev., (CHF-Irvine LLC), 5.00%, 5/15/27 | 1,000,000 | | 1,099,120 | |
California Statewide Communities Development Authority Rev., (Lancer Educational Housing LLC), 4.00%, 6/1/26(1) | 2,385,000 | | 2,346,291 | |
California Statewide Communities Development Authority Rev., (Loma Linda University Medical Center Obligated Group), 5.00%, 12/1/31(1) | 1,350,000 | | 1,418,418 | |
California Statewide Communities Development Authority Rev., (Loma Linda University Medical Center Obligated Group), 5.00%, 12/1/36(1) | 6,255,000 | | 6,460,977 | |
| California Statewide Communities Development Authority Rev., (Loma Linda University Medical Center Obligated Group), 5.25%, 12/1/44 | 8,000,000 | | 8,226,880 | |
Clovis Unified School District GO, Capital Appreciation, 0.00%, 8/1/29 (NATL)(2) | 2,530,000 | | 2,197,254 | |
| Foothill-Eastern Transportation Corridor Agency Rev., VRN, 5.50%, 1/15/53 | 4,000,000 | | 4,231,640 | |
| Golden State Tobacco Securitization Corp. Rev., 5.00%, 6/1/22 | 2,500,000 | | 2,686,400 | |
| Golden State Tobacco Securitization Corp. Rev., 5.00%, 6/1/24 | 2,500,000 | | 2,851,825 | |
| Golden State Tobacco Securitization Corp. Rev., 5.00%, 6/1/30 | 1,750,000 | | 1,941,450 | |
| Golden State Tobacco Securitization Corp. Rev., 3.50%, 6/1/36 | 1,430,000 | | 1,433,432 | |
| Inland Valley Development Agency Tax Allocation, 5.25%, 9/1/37 | 2,225,000 | | 2,457,268 | |
| Inland Valley Development Agency Tax Allocation, 5.00%, 9/1/44 | 2,555,000 | | 2,776,340 | |
| Irvine Special Tax, 4.00%, 9/1/27 | 1,455,000 | | 1,587,740 | |
| Jurupa Public Financing Authority Special Tax, 5.00%, 9/1/26 | 1,485,000 | | 1,727,916 | |
| Jurupa Public Financing Authority Special Tax, 5.00%, 9/1/28 | 1,250,000 | | 1,452,213 | |
| Jurupa Public Financing Authority Special Tax, 5.00%, 9/1/29 | 1,060,000 | | 1,230,522 | |
| Kern County COP, 5.00%, 11/1/21 (AGM) | 2,875,000 | | 3,058,310 | |
| Kern County COP, 5.00%, 11/1/22 (AGM) | 2,915,000 | | 3,246,610 | |
| Los Angeles County COP, 5.00%, 9/1/20 | 900,000 | | 910,305 | |
| Los Angeles Department of Water Rev., 5.00%, 7/1/20 | 1,000,000 | | 1,003,900 | |
| Los Angeles Department of Water Rev., VRDN, 0.05%, 6/1/20 (SBBPA: Toronto-Dominion Bank) | 5,465,000 | | 5,465,000 | |
Morongo Band of Mission Indians Rev., 5.00%, 10/1/42(1) | 3,150,000 | | 2,836,449 | |
| Oakland Unified School District / Alameda County GO, 5.00%, 8/1/26 | 1,025,000 | | 1,214,236 | |
| Oakland Unified School District / Alameda County GO, 5.00%, 8/1/27 | 1,295,000 | | 1,529,369 | |
| Oakland Unified School District / Alameda County GO, 5.00%, 8/1/28 | 1,000,000 | | 1,178,270 | |
| Oakland Unified School District / Alameda County GO, 5.00%, 8/1/34 | 1,000,000 | | 1,163,910 | |
| Oakland Unified School District / Alameda County GO, 5.00%, 8/1/35 | 800,000 | | 929,712 | |
Palomar Health COP, (Palomar Health Obligated Group), 6.00%, 11/1/20, Prerefunded at 100% of Par(3) | 5,985,000 | | 6,123,194 | |
| Palomar Health Rev., (Palomar Health Obligated Group), 5.00%, 11/1/20 | 1,375,000 | | 1,397,014 | |
| | | | | | | | |
| Principal Amount | Value |
| Palomar Health Rev., (Palomar Health Obligated Group), 5.00%, 11/1/22 | $ | 2,500,000 | | $ | 2,727,300 | |
| Palomar Health Rev., (Palomar Health Obligated Group), 5.00%, 11/1/23 | 2,500,000 | | 2,813,650 | |
| Palomar Health Rev., (Palomar Health Obligated Group), 5.00%, 11/1/25 | 2,095,000 | | 2,471,932 | |
| Palomar Health Rev., (Palomar Health Obligated Group), 5.00%, 11/1/26 | 2,000,000 | | 2,408,540 | |
| Palomar Health Rev., (Palomar Health Obligated Group), 5.00%, 11/1/28 | 3,500,000 | | 4,159,960 | |
| Palomar Health Rev., (Palomar Health Obligated Group), 5.00%, 11/1/30 | 3,325,000 | | 3,892,976 | |
| Palomar Health Rev., (Palomar Health Obligated Group), 5.00%, 11/1/31 | 2,125,000 | | 2,460,984 | |
| Plumas Unified School District GO, 5.25%, 8/1/20 (AGM) | 1,000,000 | | 1,007,970 | |
Poway Unified School District GO, Capital Appreciation, 0.00%, 8/1/41(2) | 5,110,000 | | 3,060,430 | |
| Poway Unified School District Public Financing Authority Special Tax, 4.00%, 9/1/20 | 300,000 | | 302,898 | |
| Poway Unified School District Public Financing Authority Special Tax, 5.00%, 9/1/22 | 325,000 | | 359,587 | |
| Poway Unified School District Public Financing Authority Special Tax, 5.00%, 9/1/23 | 1,155,000 | | 1,329,752 | |
| Poway Unified School District Public Financing Authority Special Tax, 5.00%, 9/1/24 | 620,000 | | 740,237 | |
| Poway Unified School District Public Financing Authority Special Tax, 5.00%, 9/1/25 | 1,035,000 | | 1,276,300 | |
| San Buenaventura Rev., (Community Memorial Health System), 7.50%, 12/1/41 | 4,050,000 | | 4,120,308 | |
San Diego Public Facilities Financing Authority Water Rev., 5.00%, 8/1/20, Prerefunded at 100% of Par(3) | 2,000,000 | | 2,015,580 | |
| San Joaquin Hills Transportation Corridor Agency Rev., 5.00%, 1/15/29 | 6,000,000 | | 6,689,220 | |
| State of California GO, 5.00%, 12/1/26 | 3,955,000 | | 4,547,222 | |
| State of California GO, 5.00%, 2/1/27 | 10,000,000 | | 11,140,100 | |
| State of California GO, 5.00%, 11/1/27 | 5,000,000 | | 5,719,400 | |
| State of California GO, 5.00%, 2/1/28 | 10,000,000 | | 11,126,000 | |
| State of California GO, 4.00%, 9/1/32 | 5,000,000 | | 5,802,750 | |
| Twin Rivers Unified School District COP, VRN, 3.20%, 6/1/41 (AGM) | 5,305,000 | | 5,305,000 | |
| | 205,902,193 | |
| Colorado — 2.9% | | |
| Adams County COP, 5.00%, 12/1/25 | 2,720,000 | | 3,367,006 | |
| Adams County COP, 4.00%, 12/1/26 | 2,250,000 | | 2,624,715 | |
| Adams County COP, 4.00%, 12/1/27 | 1,310,000 | | 1,516,849 | |
| Arapahoe County School District No. 6 Littleton GO, 5.50%, 12/1/43 | 3,000,000 | | 3,888,420 | |
| Aurora Rev., (Children's Hospital Colorado Obligated Group), 5.00%, 12/1/40 | 1,250,000 | | 1,252,312 | |
| City & County of Denver Airport System Rev., 5.00%, 11/15/21 | 2,500,000 | | 2,547,125 | |
| City & County of Denver Airport System Rev., 5.00%, 11/15/43 | 7,500,000 | | 8,166,150 | |
| Colorado Educational & Cultural Facilities Authority Rev., (Alexander Dawson School at Rainbow Mountain LLC), 4.00%, 5/15/21 | 1,865,000 | | 1,918,824 | |
| Colorado Educational & Cultural Facilities Authority Rev., (Alexander Dawson School at Rainbow Mountain LLC), 4.00%, 5/15/22 | 2,100,000 | | 2,221,947 | |
| Colorado Educational & Cultural Facilities Authority Rev., (Alexander Dawson School at Rainbow Mountain LLC), 4.00%, 5/15/23 | 2,085,000 | | 2,253,093 | |
| Colorado Educational & Cultural Facilities Authority Rev., (Regis University), 5.00%, 10/1/22 | 1,935,000 | | 2,061,781 | |
| | | | | | | | |
| Principal Amount | Value |
| Colorado Educational & Cultural Facilities Authority Rev., (Regis University), 5.00%, 10/1/23 | $ | 2,060,000 | | $ | 2,239,405 | |
| Colorado Educational & Cultural Facilities Authority Rev., (Regis University), 5.00%, 10/1/24 | 2,165,000 | | 2,395,226 | |
| Colorado Health Facilities Authority Rev., (Adventist Health System / Sunbelt Obligated Group), VRN, 5.00%, 11/15/36 | 2,000,000 | | 2,310,060 | |
| Colorado Health Facilities Authority Rev., (Adventist Health System / Sunbelt Obligated Group), VRN, 5.00%, 11/15/49 | 5,000,000 | | 6,175,950 | |
| Colorado Health Facilities Authority Rev., (CommonSpirit Health Obligated Group), VRN, 5.00%, 8/1/49 | 2,000,000 | | 2,251,420 | |
| Colorado Health Facilities Authority Rev., (CommonSpirit Health Obligated Group), VRN, 5.00%, 8/1/49 | 2,000,000 | | 2,299,840 | |
| Colorado Health Facilities Authority Rev., (Covenant Retirement Communities Obligated Group), 5.00%, 12/1/35 | 1,250,000 | | 1,276,575 | |
| Colorado Health Facilities Authority Rev., (Frasier Meadows Manor, Inc.), 5.00%, 5/15/21 | 325,000 | | 325,023 | |
| Colorado Health Facilities Authority Rev., (Frasier Meadows Manor, Inc.), 5.00%, 5/15/22 | 400,000 | | 399,916 | |
| Colorado Health Facilities Authority Rev., (Frasier Meadows Manor, Inc.), 5.00%, 5/15/23 | 800,000 | | 798,680 | |
| Colorado Health Facilities Authority Rev., (Frasier Meadows Manor, Inc.), 5.00%, 5/15/24 | 515,000 | | 513,527 | |
| Colorado Health Facilities Authority Rev., (Frasier Meadows Manor, Inc.), 5.00%, 5/15/25 | 350,000 | | 348,474 | |
| Colorado Health Facilities Authority Rev., (Frasier Meadows Manor, Inc.), 5.00%, 5/15/26 | 390,000 | | 387,418 | |
| Colorado Health Facilities Authority Rev., (Frasier Meadows Manor, Inc.), 5.00%, 5/15/27 | 400,000 | | 395,140 | |
| Colorado Health Facilities Authority Rev., (Frasier Meadows Manor, Inc.), 5.25%, 5/15/28 | 250,000 | | 249,993 | |
| Colorado Health Facilities Authority Rev., (Frasier Meadows Manor, Inc.), 5.25%, 5/15/29 | 2,160,000 | | 2,153,844 | |
| Colorado Health Facilities Authority Rev., (Frasier Meadows Manor, Inc.), 5.25%, 5/15/32 | 600,000 | | 590,058 | |
| Colorado Health Facilities Authority Rev., (Sanford Obligated Group), 4.00%, 11/1/39 | 2,000,000 | | 2,148,460 | |
| Colorado Health Facilities Authority Rev., (Sanford Obligated Group), 5.00%, 11/1/39 | 4,875,000 | | 5,701,995 | |
| Colorado Health Facilities Authority Rev., (Valley View Hospital Association), 5.00%, 5/15/28 | 690,000 | | 832,016 | |
| Colorado Health Facilities Authority Rev., (Valley View Hospital Association), 5.00%, 5/15/30 | 710,000 | | 847,868 | |
| Colorado Health Facilities Authority Rev., (Valley View Hospital Association), 5.00%, 5/15/32 | 495,000 | | 582,575 | |
| Colorado Health Facilities Authority Rev., (Valley View Hospital Association), 5.00%, 5/15/40 | 1,000,000 | | 1,108,450 | |
| Colorado Health Facilities Authority Rev., (Valley View Hospital Association), 5.00%, 5/15/45 | 1,000,000 | | 1,098,340 | |
| Denver Convention Center Hotel Authority Rev., 5.00%, 12/1/28 | 2,300,000 | | 2,417,967 | |
| Denver Convention Center Hotel Authority Rev., 5.00%, 12/1/30 | 2,000,000 | | 2,086,340 | |
| Denver Convention Center Hotel Authority Rev., 5.00%, 12/1/31 | 1,500,000 | | 1,564,155 | |
| E-470 Public Highway Authority Rev., VRN, 0.54%, (67% of the 1-month LIBOR plus 0.42%), 9/1/39 | 3,000,000 | | 2,967,780 | |
| E-470 Public Highway Authority Rev., VRN, 1.16%, (67% of the 1-month LIBOR plus 1.05%), 9/1/39 | 1,000,000 | | 996,980 | |
| Interlocken Metropolitan District GO, 5.00%, 12/1/26 (AGM) | 500,000 | | 626,970 | |
| Interlocken Metropolitan District GO, 5.00%, 12/1/27 (AGM) | 1,000,000 | | 1,281,780 | |
| Interlocken Metropolitan District GO, 5.00%, 12/1/28 (AGM) | 750,000 | | 982,200 | |
| Jefferson County School District R-1 COP, 5.00%, 12/15/22 | 1,000,000 | | 1,117,410 | |
| | | | | | | | |
| Principal Amount | Value |
| Jefferson County School District R-1 COP, 5.00%, 12/15/23 | $ | 200,000 | | $ | 232,160 | |
| Park Creek Metropolitan District Rev., 5.00%, 12/1/31 | 1,235,000 | | 1,571,859 | |
| Park Creek Metropolitan District Rev., 5.00%, 12/1/34 | 1,465,000 | | 1,836,231 | |
| Park Creek Metropolitan District Rev., 5.00%, 12/1/35 | 1,540,000 | | 1,921,704 | |
| Park Creek Metropolitan District Rev., 5.00%, 12/1/37 | 1,000,000 | | 1,165,330 | |
| Park Creek Metropolitan District Rev., 5.00%, 12/1/37 | 1,700,000 | | 2,099,024 | |
| Park Creek Metropolitan District Rev., 5.00%, 12/1/38 | 1,785,000 | | 2,182,002 | |
| Park Creek Metropolitan District Rev., 5.00%, 12/1/45 | 3,875,000 | | 4,460,939 | |
Regional Transportation District COP, 5.50%, 6/1/20, Prerefunded at 100% of Par(3) | 170,000 | | 170,000 | |
| Regional Transportation District Rev., (Denver Transit Partners LLC), 5.00%, 7/15/20 | 2,895,000 | | 2,897,229 | |
| Regional Transportation District Rev., (Denver Transit Partners LLC), 5.00%, 1/15/21 | 1,400,000 | | 1,401,078 | |
| Regional Transportation District Rev., (Denver Transit Partners LLC), 5.00%, 7/15/21 | 1,400,000 | | 1,401,078 | |
| Regional Transportation District Rev., (Denver Transit Partners LLC), 5.00%, 1/15/22 | 1,400,000 | | 1,401,078 | |
| Regional Transportation District Rev., (Denver Transit Partners LLC), 5.00%, 7/15/22 | 1,500,000 | | 1,501,155 | |
| Regional Transportation District Rev., (Denver Transit Partners LLC), 6.00%, 1/15/41 | 1,220,000 | | 1,222,513 | |
| South Sloan's Lake Metropolitan District No. 2 GO, 4.00%, 12/1/39 (AGM) | 700,000 | | 794,150 | |
| South Sloan's Lake Metropolitan District No. 2 GO, 4.00%, 12/1/44 (AGM) | 750,000 | | 840,172 | |
Vauxmont Metropolitan District GO, 5.00%, 12/1/21 (AGM)(4) | 155,000 | | 162,505 | |
Vauxmont Metropolitan District GO, 5.00%, 12/1/22 (AGM)(4) | 165,000 | | 179,075 | |
Vauxmont Metropolitan District GO, 5.00%, 12/1/23 (AGM)(4) | 190,000 | | 212,849 | |
| Vauxmont Metropolitan District GO, 5.00%, 12/15/23 (AGM) | 120,000 | | 136,523 | |
Vauxmont Metropolitan District GO, 5.00%, 12/1/24 (AGM)(4) | 200,000 | | 230,524 | |
| Vauxmont Metropolitan District GO, 5.00%, 12/15/24 (AGM) | 135,000 | | 157,845 | |
Vauxmont Metropolitan District GO, 5.00%, 12/1/25 (AGM)(4) | 180,000 | | 212,117 | |
| Vauxmont Metropolitan District GO, 5.00%, 12/15/25 (AGM) | 125,000 | | 148,708 | |
Vauxmont Metropolitan District GO, 5.00%, 12/1/26 (AGM)(4) | 195,000 | | 234,788 | |
| Vauxmont Metropolitan District GO, 5.00%, 12/15/26 (AGM) | 135,000 | | 159,925 | |
Vauxmont Metropolitan District GO, 5.00%, 12/1/27 (AGM)(4) | 200,000 | | 245,162 | |
| Vauxmont Metropolitan District GO, 5.00%, 12/15/27 (AGM) | 130,000 | | 153,572 | |
Vauxmont Metropolitan District GO, 5.00%, 12/1/28 (AGM)(4) | 210,000 | | 262,326 | |
| Vauxmont Metropolitan District GO, 5.00%, 12/15/28 (AGM) | 125,000 | | 147,261 | |
Vauxmont Metropolitan District GO, 5.00%, 12/1/29 (AGM)(4) | 215,000 | | 272,850 | |
| Vauxmont Metropolitan District GO, 5.00%, 12/15/29 (AGM) | 125,000 | | 146,761 | |
Vauxmont Metropolitan District GO, 5.00%, 12/1/30 (AGM)(4) | 215,000 | | 270,999 | |
| Vauxmont Metropolitan District GO, 5.00%, 12/15/30 (AGM) | 125,000 | | 146,223 | |
Vauxmont Metropolitan District GO, 5.00%, 12/1/31 (AGM)(4) | 230,000 | | 287,762 | |
| Vauxmont Metropolitan District GO, 5.00%, 12/15/31 (AGM) | 135,000 | | 157,284 | |
Vauxmont Metropolitan District GO, 5.00%, 12/1/32 (AGM)(4) | 500,000 | | 620,975 | |
| Vauxmont Metropolitan District GO, 5.00%, 12/15/32 (AGM) | 160,000 | | 185,675 | |
Vauxmont Metropolitan District GO, 5.00%, 12/1/33 (AGM)(4) | 505,000 | | 624,079 | |
Vauxmont Metropolitan District GO, 5.00%, 12/1/34 (AGM)(4) | 285,000 | | 350,784 | |
Vauxmont Metropolitan District GO, 5.00%, 12/1/35 (AGM)(4) | 100,000 | | 122,501 | |
| | 116,216,832 | |
| Connecticut — 1.7% | | |
| Bridgeport GO, 5.00%, 7/15/26 (BAM) | 500,000 | | 606,880 | |
| | | | | | | | |
| Principal Amount | Value |
| Bridgeport GO, 5.00%, 8/15/26 | $ | 3,000,000 | | $ | 3,540,600 | |
| Bridgeport GO, 5.00%, 8/15/27 | 4,490,000 | | 5,368,962 | |
| Bridgeport GO, 5.00%, 7/15/28 (BAM) | 600,000 | | 751,368 | |
| Bridgeport GO, 5.00%, 8/15/30 (BAM) | 1,500,000 | | 1,859,700 | |
| Bridgeport GO, 5.00%, 2/1/31 (BAM) | 500,000 | | 624,270 | |
| Bridgeport GO, 5.00%, 7/15/31 (BAM) | 1,280,000 | | 1,575,002 | |
| Bridgeport GO, 5.00%, 2/1/33 (BAM) | 1,000,000 | | 1,231,180 | |
| Bridgeport GO, 5.00%, 7/15/35 (BAM) | 1,000,000 | | 1,206,030 | |
| Bridgeport GO, 5.00%, 7/15/36 (BAM) | 645,000 | | 774,761 | |
| Bridgeport GO, 5.00%, 7/15/37 (BAM) | 1,730,000 | | 2,071,485 | |
| Bridgeport GO, 5.00%, 2/1/38 (BAM) | 1,000,000 | | 1,207,320 | |
| Bridgeport GO, 5.00%, 2/1/39 (BAM) | 1,470,000 | | 1,769,645 | |
| Connecticut State Health & Educational Facilities Authority Rev., (Covenant Retirement Communities Obligated Group), 5.00%, 12/1/30 | 1,000,000 | | 1,058,140 | |
| Connecticut State Health & Educational Facilities Authority Rev., (Covenant Retirement Communities Obligated Group), 5.00%, 12/1/32 | 1,030,000 | | 1,079,368 | |
| Connecticut State Health & Educational Facilities Authority Rev., (Covenant Retirement Communities Obligated Group), 5.00%, 12/1/33 | 1,000,000 | | 1,042,870 | |
| Connecticut State Health & Educational Facilities Authority Rev., (Covenant Retirement Communities Obligated Group), 5.00%, 12/1/35 | 1,000,000 | | 1,033,560 | |
Connecticut State Health & Educational Facilities Authority Rev., (Griffin Health Obligated Group), 5.00%, 7/1/28(1) | 990,000 | | 1,186,713 | |
Connecticut State Health & Educational Facilities Authority Rev., (Griffin Health Obligated Group), 5.00%, 7/1/30(1) | 285,000 | | 334,807 | |
Connecticut State Health & Educational Facilities Authority Rev., (Griffin Health Obligated Group), 5.00%, 7/1/31(1) | 1,065,000 | | 1,233,526 | |
| Connecticut State Health & Educational Facilities Authority Rev., (Masonicare Corp. Obligated Group), 4.00%, 7/1/20 | 1,000,000 | | 999,510 | |
| Connecticut State Health & Educational Facilities Authority Rev., (Masonicare Corp. Obligated Group), 4.00%, 7/1/21 | 1,000,000 | | 993,420 | |
| Connecticut State Health & Educational Facilities Authority Rev., (Masonicare Corp. Obligated Group), 5.00%, 7/1/22 | 2,665,000 | | 2,680,217 | |
| Connecticut State Health & Educational Facilities Authority Rev., (Quinnipiac University), 5.00%, 7/1/28 | 5,270,000 | | 6,065,928 | |
| Connecticut State Health & Educational Facilities Authority Rev., (Sacred Heart University, Inc.), 5.00%, 7/1/30 | 600,000 | | 701,604 | |
| Connecticut State Health & Educational Facilities Authority Rev., (Sacred Heart University, Inc.), 5.00%, 7/1/31 | 500,000 | | 580,070 | |
| Connecticut State Health & Educational Facilities Authority Rev., (Sacred Heart University, Inc.), 5.00%, 7/1/32 | 1,100,000 | | 1,265,121 | |
| Connecticut State Health & Educational Facilities Authority Rev., (Sacred Heart University, Inc.), 5.00%, 7/1/34 | 350,000 | | 397,985 | |
| Connecticut State Health & Educational Facilities Authority Rev., (Sacred Heart University, Inc.), 5.00%, 7/1/35 | 400,000 | | 453,112 | |
| Connecticut State Health & Educational Facilities Authority Rev., (University of New Haven, Inc.), 5.00%, 7/1/31 | 1,400,000 | | 1,496,180 | |
| Connecticut State Health & Educational Facilities Authority Rev., (University of New Haven, Inc.), 5.00%, 7/1/32 | 1,000,000 | | 1,060,660 | |
| Connecticut State Health & Educational Facilities Authority Rev., (University of New Haven, Inc.), 5.00%, 7/1/33 | 1,175,000 | | 1,236,041 | |
Harbor Point Infrastructure Improvement District Tax Allocation, 5.00%, 4/1/22(1) | 2,640,000 | | 2,721,338 | |
Harbor Point Infrastructure Improvement District Tax Allocation, 5.00%, 4/1/39(1) | 5,000,000 | | 5,175,050 | |
| New Haven GO, 5.00%, 8/1/23 (AGM) | 8,565,000 | | 9,449,422 | |
| | | | | | | | |
| Principal Amount | Value |
| State of Connecticut Special Tax Rev., 5.00%, 8/1/28 | $ | 2,000,000 | | $ | 2,346,240 | |
| | 67,178,085 | |
| District of Columbia — 1.2% | | |
| District of Columbia GO, 5.00%, 6/1/20 | 3,000,000 | | 3,000,000 | |
| District of Columbia GO, 5.00%, 10/15/35 | 15,000,000 | | 19,622,400 | |
| District of Columbia GO, 5.00%, 10/15/44 | 8,000,000 | | 10,178,080 | |
District of Columbia Rev., (Georgetown University), 5.00%, 4/1/23(3) | 1,000,000 | | 1,130,250 | |
District of Columbia Rev., (Georgetown University), 5.00%, 4/1/24(3) | 1,000,000 | | 1,173,850 | |
| District of Columbia Rev., (Georgetown University), 5.00%, 4/1/25 | 1,750,000 | | 2,000,442 | |
| District of Columbia Water & Sewer Authority Rev., VRN, 1.75%, 10/1/54 | 3,785,000 | | 3,850,064 | |
| Metropolitan Washington Airports Authority Dulles Toll Road Rev., 5.00%, 10/1/33 | 1,250,000 | | 1,436,737 | |
| Metropolitan Washington Airports Authority Dulles Toll Road Rev., 5.00%, 10/1/34 | 1,250,000 | | 1,431,288 | |
| Metropolitan Washington Airports Authority Dulles Toll Road Rev., 4.00%, 10/1/35 | 1,250,000 | | 1,312,063 | |
| Metropolitan Washington Airports Authority Dulles Toll Road Rev., 4.00%, 10/1/36 | 1,250,000 | | 1,306,625 | |
| Metropolitan Washington Airports Authority Dulles Toll Road Rev., 4.00%, 10/1/37 | 1,500,000 | | 1,562,640 | |
| Metropolitan Washington Airports Authority Dulles Toll Road Rev., 4.00%, 10/1/38 | 1,000,000 | | 1,038,530 | |
| Metropolitan Washington Airports Authority Dulles Toll Road Rev., 4.00%, 10/1/39 | 250,000 | | 258,970 | |
| | 49,301,939 | |
| Florida — 4.7% | | |
| Atlantic Beach Health Care Facilities Rev., (Naval Continuing Care Retirement Foundation Obligated Group), 3.00%, 11/15/23 | 3,800,000 | | 3,696,450 | |
| Broward County Airport System Rev., 5.00%, 10/1/24 | 2,750,000 | | 2,988,535 | |
| Broward County Airport System Rev., 5.00%, 10/1/25 | 1,000,000 | | 1,086,500 | |
| Citizens Property Insurance Corp. Rev., 5.00%, 6/1/20 | 6,050,000 | | 6,050,000 | |
| Citizens Property Insurance Corp. Rev., 5.00%, 6/1/22 | 8,000,000 | | 8,670,640 | |
| Escambia County Health Facilities Authority Rev., (Baptist Health Care Corp. Obligated Group), 4.00%, 8/15/45 | 7,945,000 | | 8,216,401 | |
| Florida Governmental Utility Authority Rev., 4.00%, 10/1/34 (AGM) | 1,250,000 | | 1,520,687 | |
| Florida Governmental Utility Authority Rev., 4.00%, 10/1/35 (AGM) | 1,270,000 | | 1,537,335 | |
| Florida Governmental Utility Authority Rev., 4.00%, 10/1/36 (AGM) | 1,600,000 | | 1,928,176 | |
| Florida Governmental Utility Authority Rev., 4.00%, 10/1/38 (AGM) | 1,000,000 | | 1,196,810 | |
| Florida Governmental Utility Authority Rev., 4.00%, 10/1/40 (AGM) | 1,000,000 | | 1,190,620 | |
| Florida Higher Educational Facilities Financial Authority Rev., (Nova Southeastern University, Inc.), 5.00%, 4/1/29 | 1,000,000 | | 1,133,800 | |
| Florida Higher Educational Facilities Financial Authority Rev., (Nova Southeastern University, Inc.), 5.00%, 4/1/30 | 750,000 | | 846,608 | |
| Florida Higher Educational Facilities Financial Authority Rev., (Nova Southeastern University, Inc.), 5.00%, 4/1/31 | 1,250,000 | | 1,403,900 | |
| Florida Higher Educational Facilities Financial Authority Rev., (Ringling College of Art & Design, Inc.), 5.00%, 3/1/29 | 1,965,000 | | 2,103,906 | |
| Florida Higher Educational Facilities Financial Authority Rev., (Ringling College of Art & Design, Inc.), 5.00%, 3/1/32 | 2,215,000 | | 2,329,161 | |
| Florida Higher Educational Facilities Financial Authority Rev., (Ringling College of Art & Design, Inc.), 5.00%, 3/1/34 | 2,395,000 | | 2,497,554 | |
| Fort Myers Rev., 4.00%, 12/1/29 | 170,000 | | 195,794 | |
| Fort Myers Rev., 4.00%, 12/1/30 | 150,000 | | 170,454 | |
| Fort Myers Rev., 4.00%, 12/1/31 | 650,000 | | 726,694 | |
| Gainesville Utilities System Rev., 5.00%, 10/1/22 | 1,000,000 | | 1,107,010 | |
| | | | | | | | |
| Principal Amount | Value |
| Gainesville Utilities System Rev., 5.00%, 10/1/24 | $ | 2,000,000 | | $ | 2,382,300 | |
| Halifax Hospital Medical Center Rev., (Halifax Hospital Medical Center Obligated Group), 5.00%, 6/1/30 | 1,750,000 | | 2,045,452 | |
| Halifax Hospital Medical Center Rev., (Halifax Hospital Medical Center Obligated Group), 3.375%, 6/1/31 | 1,500,000 | | 1,603,950 | |
| Lee County Transportation Facilities Rev., 5.00%, 10/1/26 (AGM) | 2,250,000 | | 2,657,835 | |
| Lee County Transportation Facilities Rev., 5.00%, 10/1/27 (AGM) | 2,550,000 | | 3,006,220 | |
| Manatee County School District COP, 5.00%, 7/1/24 (BAM) | 875,000 | | 1,026,638 | |
| Manatee County School District COP, 5.00%, 7/1/25 (BAM) | 1,400,000 | | 1,693,552 | |
| Manatee County School District COP, 5.00%, 7/1/26 (BAM) | 750,000 | | 931,778 | |
| Manatee County School District COP, 5.00%, 7/1/27 (BAM) | 1,215,000 | | 1,494,122 | |
| Miami-Dade County Aviation Rev., 5.00%, 10/1/37 | 2,500,000 | | 2,780,000 | |
| Miami-Dade County Aviation Rev., 5.00%, 10/1/41 | 3,000,000 | | 3,038,940 | |
| Miami-Dade County Expressway Authority Rev., 5.00%, 7/1/27 | 1,500,000 | | 1,711,770 | |
| Miami-Dade County Expressway Authority Rev., 5.00%, 7/1/29 | 800,000 | | 908,520 | |
| Miami-Dade County Expressway Authority Rev., 5.00%, 7/1/30 | 1,610,000 | | 1,822,262 | |
| Miami-Dade County Expressway Authority Rev., 5.00%, 7/1/30 | 1,835,000 | | 2,076,926 | |
| Miami-Dade County Expressway Authority Rev., 5.00%, 7/1/31 | 1,000,000 | | 1,128,040 | |
| Miami-Dade County Expressway Authority Rev., 5.00%, 7/1/31 | 1,500,000 | | 1,692,060 | |
| Miami-Dade County Water & Sewer System Rev., 5.00%, 10/1/37 | 5,000,000 | | 6,304,150 | |
| Miami-Dade County Water & Sewer System Rev., 5.00%, 10/1/38 | 5,000,000 | | 6,285,850 | |
| Mid-Bay Bridge Authority Rev., 5.00%, 10/1/25 | 1,065,000 | | 1,167,517 | |
| Monroe County School District Rev., 5.00%, 10/1/22 (AGM) | 400,000 | | 442,704 | |
| Monroe County School District Rev., 5.00%, 10/1/23 (AGM) | 500,000 | | 575,490 | |
| Monroe County School District Rev., 5.00%, 10/1/24 (AGM) | 500,000 | | 595,815 | |
| Myrtle Creek Improvement District Special Assessment, 4.00%, 5/1/27 (BAM) | 995,000 | | 1,105,744 | |
| Orlando Rev., 5.00%, 11/1/31 (AGM) | 5,000,000 | | 5,859,000 | |
| Orlando Rev., 5.00%, 11/1/32 (AGM) | 2,500,000 | | 2,911,500 | |
| Orlando Utilities Commission Rev., 5.00%, 10/1/22 | 1,750,000 | | 1,944,197 | |
| Osceola County Transportation Rev., 5.00%, 10/1/32 | 400,000 | | 481,696 | |
| Osceola County Transportation Rev., 5.00%, 10/1/33 | 695,000 | | 833,444 | |
| Osceola County Transportation Rev., 5.00%, 10/1/34 | 250,000 | | 298,608 | |
| Osceola County Transportation Rev., 5.00%, 10/1/37 | 740,000 | | 873,378 | |
| Osceola County Transportation Rev., 5.00%, 10/1/38 | 700,000 | | 823,319 | |
| Osceola County Transportation Rev., 5.00%, 10/1/39 | 1,000,000 | | 1,173,260 | |
Osceola County Transportation Rev., Capital Appreciation, 0.00%, 10/1/35(2) | 1,200,000 | | 690,060 | |
Osceola County Transportation Rev., Capital Appreciation, 0.00%, 10/1/36(2) | 3,000,000 | | 1,647,030 | |
Osceola County Transportation Rev., Capital Appreciation, 0.00%, 10/1/38(2) | 1,500,000 | | 748,290 | |
Osceola County Transportation Rev., Capital Appreciation, 0.00%, 10/1/39(2) | 1,800,000 | | 853,128 | |
| Palm Beach County Health Facilities Authority Rev., (Baptist Health South Florida Obligated Group), 5.00%, 8/15/31 | 500,000 | | 613,270 | |
| Palm Beach County Health Facilities Authority Rev., (Baptist Health South Florida Obligated Group), 5.00%, 8/15/32 | 500,000 | | 608,575 | |
| Palm Beach County Health Facilities Authority Rev., (Baptist Health South Florida Obligated Group), 5.00%, 8/15/33 | 1,000,000 | | 1,209,940 | |
| Palm Beach County Health Facilities Authority Rev., (Baptist Health South Florida Obligated Group), 5.00%, 8/15/34 | 600,000 | | 723,396 | |
| Palm Beach County Health Facilities Authority Rev., (Baptist Health South Florida Obligated Group), 5.00%, 8/15/35 | 1,000,000 | | 1,199,940 | |
| Palm Beach County Health Facilities Authority Rev., (Baptist Health South Florida Obligated Group), 5.00%, 8/15/36 | 1,000,000 | | 1,194,710 | |
| | | | | | | | |
| Principal Amount | Value |
| Palm Beach County Health Facilities Authority Rev., (Baptist Health South Florida Obligated Group), 5.00%, 8/15/37 | $ | 1,000,000 | | $ | 1,190,570 | |
| Palm Beach County Health Facilities Authority Rev., (Lifespace Communities, Inc. Obligated Group), 5.00%, 5/15/33 | 1,000,000 | | 987,780 | |
| Palm Beach County Health Facilities Authority Rev., (Lifespace Communities, Inc. Obligated Group), 5.00%, 5/15/34 | 2,170,000 | | 2,137,819 | |
| Palm Beach County Health Facilities Authority Rev., (Lifespace Communities, Inc. Obligated Group), 5.00%, 5/15/35 | 4,665,000 | | 4,578,231 | |
| Palm Beach County Health Facilities Authority Rev., (Lifespace Communities, Inc. Obligated Group), 5.00%, 5/15/36 | 1,535,000 | | 1,497,070 | |
| Palm Beach County Health Facilities Authority Rev., (Lifespace Communities, Inc. Obligated Group), 5.00%, 5/15/37 | 1,000,000 | | 973,230 | |
| Pinellas County Industrial Development Authority Rev., (Drs. Kiran & Pallavi Patel 2017 Foundation for Global Understanding, Inc.), 5.00%, 7/1/29 | 1,200,000 | | 1,241,256 | |
| Pinellas County Industrial Development Authority Rev., (Drs. Kiran & Pallavi Patel 2017 Foundation for Global Understanding, Inc.), 5.00%, 7/1/39 | 14,165,000 | | 13,911,588 | |
| Sarasota County Health Facilities Authority Rev., (Southwest Florida Retirement Center, Inc. Obligated Group), 5.00%, 1/1/37 | 1,350,000 | | 1,274,319 | |
| Sarasota County Health Facilities Authority Rev., (Southwest Florida Retirement Center, Inc. Obligated Group), 5.00%, 1/1/42 | 1,000,000 | | 915,980 | |
| Sarasota County Health Facilities Authority Rev., (Southwest Florida Retirement Center, Inc. Obligated Group), 5.00%, 1/1/47 | 2,000,000 | | 1,801,860 | |
| School District of Broward County COP, 5.00%, 7/1/26 | 2,170,000 | | 2,342,754 | |
| South Florida Water Management District COP, 5.00%, 10/1/28 | 3,000,000 | | 3,663,180 | |
| South Florida Water Management District COP, 5.00%, 10/1/30 | 3,305,000 | | 3,998,158 | |
| Tallahassee Rev., (Tallahassee Memorial HealthCare, Inc.), 5.00%, 12/1/36 | 800,000 | | 877,560 | |
| Tallahassee Rev., (Tallahassee Memorial HealthCare, Inc.), 5.00%, 12/1/41 | 1,000,000 | | 1,087,090 | |
| Town of Davie Rev., (Nova Southeastern University, Inc.), 5.00%, 4/1/34 | 1,110,000 | | 1,260,094 | |
| Town of Davie Rev., (Nova Southeastern University, Inc.), 5.00%, 4/1/35 | 2,355,000 | | 2,664,706 | |
| Town of Davie Rev., (Nova Southeastern University, Inc.), 5.00%, 4/1/36 | 3,995,000 | | 4,508,158 | |
| Venice Rev., (Southwest Florida Retirement Center, Inc. Obligated Group), 5.00%, 1/1/37 | 1,000,000 | | 987,760 | |
Village Community Development District No. 12 Special Assessment, 3.25%, 5/1/23(1) | 645,000 | | 649,457 | |
Village Community Development District No. 12 Special Assessment, 3.80%, 5/1/28(1) | 2,235,000 | | 2,287,969 | |
Village Community Development District No. 12 Special Assessment, 4.00%, 5/1/33(1) | 1,990,000 | | 2,031,949 | |
| Village Community Development District No. 13 Special Assessment, 2.625%, 5/1/24 | 500,000 | | 492,025 | |
| Village Community Development District No. 13 Special Assessment, 3.00%, 5/1/29 | 1,000,000 | | 976,220 | |
| Village Community Development District No. 13 Special Assessment, 3.375%, 5/1/34 | 3,250,000 | | 3,149,640 | |
| Volusia County Educational Facility Authority Rev., (Embry-Riddle Aeronautical University, Inc.), 5.00%, 10/15/28 | 1,000,000 | | 1,169,960 | |
| Volusia County Educational Facility Authority Rev., (Embry-Riddle Aeronautical University, Inc.), 5.00%, 10/15/29 | 1,200,000 | | 1,396,956 | |
| Volusia County Educational Facility Authority Rev., (Embry-Riddle Aeronautical University, Inc.), 5.00%, 10/15/34 | 1,045,000 | | 1,183,985 | |
| Volusia County Educational Facility Authority Rev., (Embry-Riddle Aeronautical University, Inc.), 5.00%, 10/15/35 | 1,095,000 | | 1,235,817 | |
| | 190,234,552 | |
| | | | | | | | |
| Principal Amount | Value |
| Georgia — 2.3% | | |
| Atlanta Tax Allocation, 5.00%, 1/1/21 | $ | 200,000 | | $ | 200,622 | |
| Atlanta Tax Allocation, 5.00%, 1/1/21 | 750,000 | | 768,068 | |
| Atlanta Tax Allocation, 5.00%, 12/1/23 | 2,000,000 | | 2,280,100 | |
| Atlanta Tax Allocation, 5.00%, 12/1/24 | 900,000 | | 1,057,725 | |
| Atlanta Department of Aviation Rev., (Atlanta Airport Passenger Facility Charge), 5.00%, 7/1/36 | 10,000,000 | | 12,283,500 | |
| Atlanta Water & Wastewater Rev., 4.00%, 11/1/33 | 1,500,000 | | 1,859,580 | |
| Atlanta Water & Wastewater Rev., 4.00%, 11/1/34 | 1,785,000 | | 2,194,925 | |
| Atlanta Water & Wastewater Rev., 4.00%, 11/1/35 | 1,750,000 | | 2,135,980 | |
| Georgia Municipal Association, Inc. COP, 5.00%, 12/1/29 | 1,100,000 | | 1,419,407 | |
| Georgia Municipal Association, Inc. COP, 5.00%, 12/1/34 | 1,000,000 | | 1,253,410 | |
| Main Street Natural Gas, Inc. Rev., 5.00%, 5/15/35 (GA: Macquarie Group Ltd.) | 2,000,000 | | 2,426,960 | |
| Main Street Natural Gas, Inc. Rev., 5.00%, 5/15/36 (GA: Macquarie Group Ltd.) | 2,500,000 | | 3,036,350 | |
| Main Street Natural Gas, Inc. Rev., VRN, 4.00%, 4/1/48 (LIQ FAC: Royal Bank of Canada) | 12,500,000 | | 13,540,500 | |
| Main Street Natural Gas, Inc. Rev., VRN, 0.71%, (MUNIPSA plus 0.57%), 8/1/48 (LIQ FAC: Royal Bank of Canada) | 10,000,000 | | 9,707,600 | |
| Main Street Natural Gas, Inc. Rev., VRN, 1.08%, (67% of the 1-month LIBOR plus 0.83%), 8/1/48 (LIQ FAC: Royal Bank of Canada) | 10,000,000 | | 9,703,100 | |
| Main Street Natural Gas, Inc. Rev., VRN, 4.00%, 8/1/49 (GA: TD Bank N.A.) | 6,000,000 | | 6,691,020 | |
| Main Street Natural Gas, Inc. Rev., VRN, 4.00%, 3/1/50 (GA: Citigroup Global Markets) | 17,800,000 | | 19,647,640 | |
| Private Colleges & Universities Authority Rev., (Savannah College of Art & Design, Inc.), 5.00%, 4/1/44 | 1,500,000 | | 1,607,850 | |
| | 91,814,337 | |
| Guam — 0.1% | | |
| Guam Government Department of Education COP, 6.875%, 12/1/40 | 1,500,000 | | 1,523,685 | |
| Guam Government Power Authority Rev., 5.00%, 10/1/20 (AGM) | 1,000,000 | | 1,015,070 | |
| Guam Government Power Authority Rev., 5.00%, 10/1/26 (AGM) | 2,000,000 | | 2,155,600 | |
| Guam Government Power Authority Rev., 5.00%, 10/1/27 (AGM) | 1,000,000 | | 1,076,540 | |
| | 5,770,895 | |
| Hawaii — 0.6% | | |
Hawai'i Pacific Health Rev., (Hawai'i Pacific Health Obligated Group), 5.75%, 7/1/20, Prerefunded at 100% of Par(3) | 1,000,000 | | 1,004,470 | |
| State of Hawaii GO, 5.00%, 8/1/23 | 2,305,000 | | 2,649,252 | |
| State of Hawaii GO, 5.00%, 1/1/35 | 8,000,000 | | 10,261,600 | |
| State of Hawaii GO, 5.00%, 1/1/36 | 7,000,000 | | 8,938,860 | |
| | 22,854,182 | |
| Idaho — 0.1% | | |
Idaho Health Facilities Authority Rev., (St. Luke's Health System Obligated Group), 5.00%, 7/1/20, Prerefunded at 100% of Par (AGM)(3) | 500,000 | | 501,920 | |
| Idaho Housing & Finance Association Rev., 5.00%, 7/15/29 | 3,000,000 | | 3,144,450 | |
| | 3,646,370 | |
| Illinois — 12.3% | | |
| Adams County School District No. 172 GO, 5.00%, 2/1/24 (AGM) | 1,175,000 | | 1,351,274 | |
| Adams County School District No. 172 GO, 5.00%, 2/1/24 (BAM) | 1,030,000 | | 1,184,521 | |
| Adams County School District No. 172 GO, 5.00%, 2/1/25 (BAM) | 1,000,000 | | 1,185,820 | |
| Adams County School District No. 172 GO, 5.00%, 2/1/26 (BAM) | 1,000,000 | | 1,217,460 | |
| Adams County School District No. 172 GO, 5.00%, 2/1/28 (AGM) | 1,670,000 | | 2,021,902 | |
| Adams County School District No. 172 GO, 4.00%, 2/1/30 (AGM) | 1,000,000 | | 1,122,000 | |
| | | | | | | | |
| Principal Amount | Value |
| Chicago GO, 5.00%, 1/1/30 | $ | 6,600,000 | | $ | 6,899,970 | |
| Chicago GO, 5.25%, 1/1/32 | 5,000,000 | | 5,105,750 | |
| Chicago GO, 6.00%, 1/1/38 | 5,000,000 | | 5,364,050 | |
| Chicago Board of Education GO, 5.00%, 12/1/27 (AGM) | 15,000,000 | | 17,518,500 | |
| Chicago Board of Education GO, 5.00%, 12/1/33 (AGM) | 1,250,000 | | 1,434,138 | |
| Chicago Midway International Airport Rev., 5.00%, 1/1/21 | 800,000 | | 816,352 | |
| Chicago Midway International Airport Rev., 5.00%, 1/1/22 | 600,000 | | 632,964 | |
| Chicago O'Hare International Airport Rev., 5.00%, 1/1/23 | 1,500,000 | | 1,639,215 | |
| Chicago O'Hare International Airport Rev., 5.00%, 1/1/24 | 4,000,000 | | 4,498,520 | |
| Chicago O'Hare International Airport Rev., 5.00%, 1/1/29 | 9,200,000 | | 10,448,624 | |
| Chicago O'Hare International Airport Rev., 5.00%, 1/1/36 | 2,250,000 | | 2,647,462 | |
| Chicago O'Hare International Airport Rev., 5.00%, 1/1/37 | 3,000,000 | | 3,519,300 | |
| Chicago O'Hare International Airport Rev., 5.00%, 1/1/38 | 3,250,000 | | 3,797,852 | |
| Chicago Transit Authority Rev., 5.00%, 6/1/22 | 3,000,000 | | 3,217,980 | |
| Chicago Transit Authority Rev., 5.00%, 6/1/23 | 4,150,000 | | 4,591,560 | |
| Chicago Transit Authority Rev., 5.00%, 6/1/24 | 1,000,000 | | 1,137,880 | |
| Chicago Transit Authority Rev., 5.00%, 6/1/25 | 2,000,000 | | 2,332,500 | |
| Chicago Wastewater Transmission Rev., 5.00%, 1/1/29 | 1,100,000 | | 1,229,327 | |
| Chicago Wastewater Transmission Rev., 5.00%, 1/1/29 | 3,245,000 | | 3,909,187 | |
| Chicago Wastewater Transmission Rev., 5.00%, 1/1/30 | 3,420,000 | | 4,100,546 | |
| Chicago Wastewater Transmission Rev., 5.00%, 1/1/31 | 1,000,000 | | 1,111,660 | |
| Chicago Wastewater Transmission Rev., 5.00%, 1/1/31 | 3,555,000 | | 4,240,795 | |
| Chicago Wastewater Transmission Rev., 5.00%, 1/1/32 | 1,000,000 | | 1,107,990 | |
| Chicago Wastewater Transmission Rev., 5.00%, 1/1/34 | 755,000 | | 853,565 | |
| Chicago Wastewater Transmission Rev., 5.00%, 1/1/35 | 755,000 | | 851,451 | |
| Chicago Wastewater Transmission Rev., 5.00%, 1/1/39 | 2,300,000 | | 2,514,084 | |
| Chicago Wastewater Transmission Rev., 5.00%, 1/1/39 | 1,510,000 | | 1,688,875 | |
| Chicago Waterworks Rev., 5.00%, 11/1/23 | 3,750,000 | | 4,151,400 | |
| Chicago Waterworks Rev., 5.00%, 11/1/24 | 10,000,000 | | 11,335,000 | |
| Chicago Waterworks Rev., 5.00%, 11/1/25 | 5,000,000 | | 5,781,350 | |
| Chicago Waterworks Rev., 5.00%, 11/1/26 | 2,000,000 | | 2,352,560 | |
| Chicago Waterworks Rev., 5.00%, 11/1/27 | 2,250,000 | | 2,532,757 | |
| Chicago Waterworks Rev., 5.00%, 11/1/32 (AGM) | 1,570,000 | | 1,814,653 | |
| Chicago Waterworks Rev., 5.00%, 11/1/39 | 2,550,000 | | 2,710,803 | |
| Cook County GO, 5.00%, 11/15/21 | 600,000 | | 618,222 | |
| Cook County GO, 5.00%, 11/15/25 | 3,600,000 | | 3,876,984 | |
| Cook County GO, 5.00%, 11/15/27 | 2,800,000 | | 3,006,332 | |
| Cook County GO, 5.00%, 11/15/28 | 1,000,000 | | 1,069,860 | |
| Cook County GO, 5.00%, 11/15/29 | 3,270,000 | | 3,482,877 | |
| Cook County GO, 5.00%, 11/15/31 | 2,350,000 | | 2,477,581 | |
| Cook County GO, 5.00%, 11/15/34 | 2,000,000 | | 2,083,660 | |
| Cook County GO, 5.00%, 11/15/35 | 1,800,000 | | 1,868,904 | |
| Cook County Community High School District No. 212 Leyden Rev., 5.00%, 12/1/23 (BAM) | 1,000,000 | | 1,148,240 | |
| Cook County Community High School District No. 212 Leyden Rev., 5.00%, 12/1/25 (BAM) | 1,800,000 | | 2,146,950 | |
| Cook County Community High School District No. 212 Leyden Rev., 5.00%, 12/1/27 (BAM) | 1,190,000 | | 1,415,874 | |
| Cook County High School District No. 205 Thornton Township GO, 5.00%, 12/1/22 (BAM) | 2,000,000 | | 2,202,360 | |
| Cook County High School District No. 205 Thornton Township GO, 5.00%, 12/1/23 (BAM) | 3,000,000 | | 3,415,680 | |
| | | | | | | | |
| Principal Amount | Value |
| Cook County High School District No. 205 Thornton Township GO, 5.00%, 12/1/24 (BAM) | $ | 4,000,000 | | $ | 4,693,280 | |
| Cook County High School District No. 209 Proviso Township GO, 5.00%, 12/1/24 (BAM) | 2,475,000 | | 2,921,886 | |
| Cook County High School District No. 209 Proviso Township GO, 5.00%, 12/1/25 (BAM) | 1,115,000 | | 1,352,629 | |
| Cook County High School District No. 209 Proviso Township GO, 5.00%, 12/1/26 (BAM) | 1,150,000 | | 1,429,749 | |
| Decatur GO, 5.00%, 3/1/24 (AGM) | 1,000,000 | | 1,151,540 | |
| Decatur GO, 5.00%, 3/1/25 (AGM) | 1,045,000 | | 1,240,551 | |
| Decatur GO, 5.00%, 3/1/26 (AGM) | 1,000,000 | | 1,218,030 | |
| Decatur GO, 5.00%, 3/1/27 (AGM) | 1,080,000 | | 1,321,542 | |
| Decatur GO, 5.00%, 3/1/28 (AGM) | 1,205,000 | | 1,471,486 | |
| Decatur GO, 5.00%, 3/1/29 (AGM) | 1,265,000 | | 1,541,592 | |
| Decatur GO, 5.00%, 3/1/30 (AGM) | 1,330,000 | | 1,616,668 | |
| Decatur GO, 5.00%, 3/1/31 (AGM) | 1,395,000 | | 1,689,624 | |
| Decatur GO, 5.00%, 3/1/33 (AGM) | 1,545,000 | | 1,860,813 | |
| Governors State University COP, 5.00%, 7/1/22 (BAM) | 320,000 | | 345,683 | |
| Governors State University COP, 5.00%, 7/1/23 (BAM) | 400,000 | | 446,204 | |
| Governors State University COP, 5.00%, 7/1/24 (BAM) | 400,000 | | 459,560 | |
| Governors State University COP, 5.00%, 7/1/25 (BAM) | 400,000 | | 471,620 | |
| Governors State University COP, 5.00%, 7/1/26 (BAM) | 350,000 | | 421,939 | |
| Governors State University COP, 5.00%, 7/1/27 (BAM) | 395,000 | | 486,522 | |
| Governors State University COP, 5.00%, 7/1/28 (BAM) | 750,000 | | 919,373 | |
| Illinois Finance Authority Rev., (Advocate Health Care Network Obligated Group), 5.00%, 5/1/22 | 1,170,000 | | 1,274,387 | |
| Illinois Finance Authority Rev., (Advocate Health Care Network Obligated Group), 5.00%, 5/1/22 | 330,000 | | 355,285 | |
| Illinois Finance Authority Rev., (Ascension Health Credit Group), 4.00%, 2/15/36 | 7,600,000 | | 8,294,868 | |
| Illinois Finance Authority Rev., (Ascension Health Credit Group), 5.00%, 2/15/41 | 1,500,000 | | 1,742,100 | |
| Illinois Finance Authority Rev., (Carle Foundation Obligated Group), 6.00%, 8/15/41 | 2,000,000 | | 2,099,980 | |
| Illinois Finance Authority Rev., (CHF-Chicago LLC), 5.00%, 2/15/37 | 1,000,000 | | 1,015,640 | |
| Illinois Finance Authority Rev., (CHF-Chicago LLC), 5.00%, 2/15/47 | 2,000,000 | | 1,988,180 | |
| Illinois Finance Authority Rev., (Chicago Charter School Foundation), 5.00%, 12/1/26 | 1,085,000 | | 1,178,256 | |
| Illinois Finance Authority Rev., (Chicago Charter School Foundation), 5.00%, 12/1/27 | 500,000 | | 544,695 | |
| Illinois Finance Authority Rev., (Chicago Charter School Foundation), 5.00%, 12/1/29 | 315,000 | | 340,219 | |
| Illinois Finance Authority Rev., (Chicago Charter School Foundation), 5.00%, 12/1/30 | 500,000 | | 536,695 | |
| Illinois Finance Authority Rev., (Chicago Charter School Foundation), 5.00%, 12/1/31 | 570,000 | | 607,745 | |
| Illinois Finance Authority Rev., (Chicago Charter School Foundation), 5.00%, 12/1/32 | 500,000 | | 529,905 | |
| Illinois Finance Authority Rev., (Chicago Charter School Foundation), 5.00%, 12/1/37 | 1,500,000 | | 1,563,300 | |
| Illinois Finance Authority Rev., (DePaul University), 4.00%, 10/1/31 | 750,000 | | 787,073 | |
| Illinois Finance Authority Rev., (Illinois Wesleyan University), 5.00%, 9/1/23 | 1,175,000 | | 1,277,401 | |
| Illinois Finance Authority Rev., (Illinois Wesleyan University), 5.00%, 9/1/24 | 1,235,000 | | 1,370,134 | |
| Illinois Finance Authority Rev., (Illinois Wesleyan University), 5.00%, 9/1/25 | 1,295,000 | | 1,461,161 | |
| | | | | | | | |
| Principal Amount | Value |
| Illinois Finance Authority Rev., (Illinois Wesleyan University), 5.00%, 9/1/29 | $ | 1,575,000 | | $ | 1,788,476 | |
| Illinois Finance Authority Rev., (Illinois Wesleyan University), 4.00%, 9/1/41 | 2,550,000 | | 2,642,718 | |
| Illinois Finance Authority Rev., (Illinois Wesleyan University), 5.00%, 9/1/46 | 2,000,000 | | 2,170,360 | |
| Illinois Finance Authority Rev., (Memorial Health Obligated Group), 5.00%, 4/1/32 | 2,370,000 | | 2,909,483 | |
| Illinois Finance Authority Rev., (Memorial Health Obligated Group), 5.00%, 4/1/33 | 2,055,000 | | 2,506,031 | |
| Illinois Finance Authority Rev., (Memorial Health Obligated Group), 5.00%, 4/1/34 | 4,370,000 | | 5,309,725 | |
| Illinois Finance Authority Rev., (Mercy Health Corp. Obligated Group), 5.00%, 12/1/24 | 2,000,000 | | 2,268,380 | |
| Illinois Finance Authority Rev., (Mercy Health Corp. Obligated Group), 5.00%, 12/1/26 | 2,715,000 | | 3,158,305 | |
| Illinois Finance Authority Rev., (Mercy Health Corp. Obligated Group), 4.00%, 12/1/30 | 5,000,000 | | 5,388,400 | |
| Illinois Finance Authority Rev., (Rosalind Franklin University of Medicine & Science), 5.00%, 8/1/24 | 245,000 | | 262,907 | |
| Illinois Finance Authority Rev., (Rosalind Franklin University of Medicine & Science), 5.00%, 8/1/25 | 700,000 | | 758,023 | |
| Illinois Finance Authority Rev., (Rosalind Franklin University of Medicine & Science), 5.00%, 8/1/29 | 325,000 | | 352,108 | |
| Illinois Finance Authority Rev., (Rosalind Franklin University of Medicine & Science), 5.00%, 8/1/31 | 690,000 | | 737,672 | |
| Illinois Finance Authority Rev., (Rosalind Franklin University of Medicine & Science), 5.00%, 8/1/42 | 750,000 | | 773,813 | |
| Illinois Finance Authority Rev., (Rush University Medical Center Obligated Group), 5.00%, 11/15/29 | 5,000,000 | | 5,729,150 | |
| Illinois Finance Authority Rev., (Rush University Medical Center Obligated Group), 5.00%, 11/15/29 | 5,475,000 | | 6,273,419 | |
| Illinois Finance Authority Rev., (State of Illinois Water Revolving Fund - Clean Water Program), 5.00%, 7/1/33 | 10,000,000 | | 12,957,200 | |
Illinois Finance Authority Rev., (Swedish Covenant Hospital Obligated Group), 5.00%, 8/15/20(3) | 1,045,000 | | 1,055,095 | |
Illinois Finance Authority Rev., (Swedish Covenant Hospital Obligated Group), 5.00%, 8/15/22(3) | 825,000 | | 909,678 | |
Illinois Finance Authority Rev., (Swedish Covenant Hospital Obligated Group), 5.00%, 8/15/23(3) | 1,000,000 | | 1,147,270 | |
| Illinois Sports Facilities Authority Rev., 5.00%, 6/15/28 (BAM) | 1,000,000 | | 1,160,530 | |
| Illinois Sports Facilities Authority Rev., 5.00%, 6/15/29 (BAM) | 1,000,000 | | 1,171,620 | |
| Illinois Sports Facilities Authority Rev., 5.00%, 6/15/30 (BAM) | 500,000 | | 581,970 | |
| Illinois State Toll Highway Authority Rev., 5.00%, 1/1/28 | 1,250,000 | | 1,581,575 | |
| Illinois State Toll Highway Authority Rev., 5.00%, 1/1/29 | 1,550,000 | | 1,921,163 | |
| Illinois State Toll Highway Authority Rev., 5.00%, 1/1/30 | 1,000,000 | | 1,232,830 | |
| Illinois State Toll Highway Authority Rev., 5.00%, 1/1/30 | 3,000,000 | | 3,945,720 | |
| Illinois State Toll Highway Authority Rev., 5.00%, 1/1/31 | 1,000,000 | | 1,225,750 | |
| Illinois State Toll Highway Authority Rev., 5.00%, 1/1/31 | 2,500,000 | | 3,195,900 | |
| Illinois State Toll Highway Authority Rev., 5.00%, 1/1/33 | 1,200,000 | | 1,452,624 | |
| Illinois State Toll Highway Authority Rev., 5.00%, 1/1/34 | 2,500,000 | | 3,014,375 | |
| Illinois State Toll Highway Authority Rev., 5.00%, 1/1/36 | 15,200,000 | | 17,406,584 | |
| Illinois State Toll Highway Authority Rev., 5.00%, 1/1/39 | 2,500,000 | | 2,771,800 | |
| Kane County School District No. 131 Aurora East Side GO, 4.00%, 12/1/28 (AGM) | 770,000 | | 944,174 | |
| Kane County School District No. 131 Aurora East Side GO, 4.00%, 12/1/30 (AGM) | 450,000 | | 543,699 | |
| Kane County School District No. 131 Aurora East Side GO, 4.00%, 12/1/33 (AGM) | 250,000 | | 295,505 | |
| | | | | | | | |
| Principal Amount | Value |
| Kane County School District No. 131 Aurora East Side GO, 4.00%, 12/1/34 (AGM) | $ | 200,000 | | $ | 235,142 | |
| Kane County School District No. 131 Aurora East Side GO, 4.00%, 12/1/38 (AGM) | 580,000 | | 669,975 | |
| Kane County School District No. 131 Aurora East Side GO, 4.00%, 12/1/39 (AGM) | 550,000 | | 633,837 | |
| Northern Illinois University Rev., 5.00%, 4/1/29 (BAM) | 1,025,000 | | 1,238,846 | |
| Northern Illinois University Rev., 5.00%, 4/1/31 (BAM) | 1,075,000 | | 1,293,085 | |
| Northern Illinois University Rev., 5.00%, 4/1/33 (BAM) | 1,400,000 | | 1,658,314 | |
| Northern Illinois University Rev., 4.00%, 4/1/35 (BAM) | 1,000,000 | | 1,063,050 | |
| Northern Illinois University Rev., 4.00%, 4/1/37 (BAM) | 1,425,000 | | 1,501,309 | |
| Railsplitter Tobacco Settlement Authority Rev., 5.25%, 6/1/21 | 10,000,000 | | 10,405,300 | |
| Railsplitter Tobacco Settlement Authority Rev., 5.00%, 6/1/22 | 5,000,000 | | 5,374,600 | |
| Railsplitter Tobacco Settlement Authority Rev., 5.00%, 6/1/27 | 3,000,000 | | 3,564,210 | |
| Regional Transportation Authority Rev., 7.20%, 11/1/20 (Ambac) | 125,000 | | 127,884 | |
| Springfield Electric Rev., 5.00%, 3/1/21 | 1,000,000 | | 1,032,900 | |
| Springfield Electric Rev., 5.00%, 3/1/22 | 1,750,000 | | 1,883,298 | |
| Springfield Electric Rev., 5.00%, 3/1/23 | 1,245,000 | | 1,393,690 | |
| Springfield Electric Rev., 5.00%, 3/1/24 | 2,000,000 | | 2,315,920 | |
| State of Illinois GO, 5.00%, 5/1/22 | 5,000,000 | | 5,082,750 | |
| State of Illinois GO, 5.00%, 11/1/23 | 5,000,000 | | 5,105,050 | |
| State of Illinois GO, 5.00%, 10/1/24 | 3,000,000 | | 3,058,230 | |
| State of Illinois GO, 5.00%, 11/1/24 | 12,715,000 | | 12,966,503 | |
| State of Illinois GO, 5.00%, 11/1/25 | 3,000,000 | | 3,064,020 | |
| State of Illinois GO, 5.00%, 2/1/26 | 4,000,000 | | 4,068,760 | |
| State of Illinois GO, 5.00%, 11/1/27 | 15,000,000 | | 15,278,400 | |
| State of Illinois GO, 5.125%, 12/1/29 | 17,000,000 | | 17,344,420 | |
| State of Illinois GO, 5.50%, 5/1/30 | 2,500,000 | | 2,650,825 | |
| State of Illinois GO, 5.00%, 10/1/33 | 2,100,000 | | 2,128,413 | |
| State of Illinois GO, 5.50%, 7/1/38 | 5,000,000 | | 5,104,250 | |
| State of Illinois GO, 5.00%, 2/1/39 | 3,000,000 | | 3,002,790 | |
| State of Illinois GO, 5.00%, 5/1/39 | 6,080,000 | | 6,086,141 | |
| State of Illinois GO, 5.50%, 5/1/39 | 1,475,000 | | 1,549,694 | |
| State of Illinois GO, 5.00%, 12/1/39 | 5,000,000 | | 5,009,300 | |
| Upper Illinois River Valley Development Authority Rev., (Morris Hospital Obligated Group), 5.00%, 12/1/30 | 1,275,000 | | 1,556,597 | |
| Upper Illinois River Valley Development Authority Rev., (Morris Hospital Obligated Group), 5.00%, 12/1/31 | 1,560,000 | | 1,878,068 | |
| Upper Illinois River Valley Development Authority Rev., (Morris Hospital Obligated Group), 5.00%, 12/1/32 | 1,110,000 | | 1,327,216 | |
| Village of Bellwood GO, 5.00%, 12/1/21 (AGM) | 1,000,000 | | 1,063,930 | |
| Village of Bellwood GO, 5.00%, 12/1/22 (AGM) | 1,050,000 | | 1,145,057 | |
| Village of Bellwood GO, 5.00%, 12/1/23 (AGM) | 1,000,000 | | 1,123,490 | |
| Village of Bellwood GO, 5.00%, 12/1/24 (AGM) | 800,000 | | 923,040 | |
| Village of Bellwood GO, 5.00%, 12/1/25 (AGM) | 1,500,000 | | 1,770,360 | |
| Village of Bellwood GO, 5.00%, 12/1/26 (AGM) | 1,000,000 | | 1,204,290 | |
| Village of Bellwood GO, 5.00%, 12/1/28 (AGM) | 1,000,000 | | 1,197,480 | |
| Village of Crestwood GO, 4.00%, 12/15/20 (BAM) | 835,000 | | 850,489 | |
| Village of Crestwood GO, 4.00%, 12/15/22 (BAM) | 600,000 | | 648,324 | |
| Village of Crestwood GO, 5.00%, 12/15/24 (BAM) | 750,000 | | 858,915 | |
| Village of Crestwood GO, 5.00%, 12/15/26 (BAM) | 1,000,000 | | 1,138,840 | |
| Village of Crestwood GO, 5.00%, 12/15/28 (BAM) | 905,000 | | 1,025,582 | |
| Village of Romeoville Rev., (Lewis University), 5.00%, 10/1/36 | 2,075,000 | | 2,153,020 | |
| Village of Romeoville Rev., (Lewis University), 5.00%, 10/1/39 | 2,250,000 | | 2,322,562 | |
| | | | | | | | |
| Principal Amount | Value |
| Village of Romeoville Rev., (Lewis University), 4.125%, 10/1/46 | $ | 2,250,000 | | $ | 2,064,758 | |
| Western Illinois University Rev., 4.00%, 4/1/27 (BAM) | 1,390,000 | | 1,603,462 | |
| Western Illinois University Rev., 4.00%, 4/1/28 (BAM) | 1,455,000 | | 1,696,297 | |
| Western Illinois University Rev., 4.00%, 4/1/29 (BAM) | 1,565,000 | | 1,841,066 | |
| Western Illinois University Rev., 5.00%, 4/1/31 (BAM) | 1,100,000 | | 1,396,219 | |
| Western Illinois University Rev., 4.00%, 4/1/32 (BAM) | 1,000,000 | | 1,158,800 | |
| Will County Community High School District No. 210 Lincoln-Way GO, 4.00%, 1/1/22 (AGM) | 700,000 | | 724,563 | |
| Will County Community High School District No. 210 Lincoln-Way GO, 4.00%, 1/1/34 (AGM) | 650,000 | | 716,690 | |
| Will County Community Unit School District No. 201-U Crete-Monee GO, 5.00%, 1/1/27 (AGM) | 6,280,000 | | 7,691,367 | |
| Will County Community Unit School District No. 201-U Crete-Monee GO, 4.00%, 1/1/32 (AGM) | 1,390,000 | | 1,530,779 | |
| Will County Community Unit School District No. 201-U Crete-Monee GO, 4.00%, 1/1/35 (AGM) | 1,000,000 | | 1,086,930 | |
| Will County Community Unit School District No. 201-U Crete-Monee GO, 4.00%, 1/1/36 (AGM) | 1,365,000 | | 1,476,834 | |
| | 491,422,399 | |
| Indiana — 1.3% | | |
| Indiana Finance Authority Rev., 5.00%, 2/1/23 | 1,735,000 | | 1,917,244 | |
| Indiana Finance Authority Rev., 5.00%, 2/1/24 | 2,200,000 | | 2,510,354 | |
| Indiana Finance Authority Rev., 5.00%, 2/1/26 | 3,030,000 | | 3,593,671 | |
| Indiana Finance Authority Rev., 5.00%, 2/1/27 | 1,120,000 | | 1,364,294 | |
| Indiana Finance Authority Rev., 5.25%, 2/1/27 | 2,000,000 | | 2,386,380 | |
| Indiana Finance Authority Rev., 5.00%, 2/1/28 | 2,005,000 | | 2,433,890 | |
| Indiana Finance Authority Rev., 5.00%, 2/1/29 | 2,500,000 | | 3,018,100 | |
| Indiana Finance Authority Rev., (CWA Authority, Inc.), 5.25%, 10/1/23 | 2,645,000 | | 2,816,475 | |
| Indiana Finance Authority Rev., (CWA Authority, Inc.), 5.25%, 10/1/24 | 3,025,000 | | 3,220,687 | |
| Indiana Finance Authority Rev., (CWA Authority, Inc.), 5.25%, 10/1/25 | 1,750,000 | | 1,862,980 | |
| Indiana Finance Authority Rev., (Franciscan Alliance, Inc. Obligated Group), VRDN, 0.06%, 6/1/20 (LOC: Barclays Bank plc) | 1,460,000 | | 1,460,000 | |
| Indiana Finance Authority Rev., (Good Samaritan Hospital Obligated Group), 5.50%, 4/1/28 | 1,880,000 | | 2,209,094 | |
| Indiana Finance Authority Rev., (Good Samaritan Hospital Obligated Group), 5.50%, 4/1/29 | 1,000,000 | | 1,167,840 | |
| Indiana Finance Authority Rev., (Good Samaritan Hospital Obligated Group), 5.50%, 4/1/30 | 1,030,000 | | 1,194,584 | |
| Indiana Finance Authority Rev., (Good Samaritan Hospital Obligated Group), 5.50%, 4/1/31 | 1,050,000 | | 1,212,320 | |
| Indiana Finance Authority Rev., (Indiana University Health, Inc. Obligated Group), VRN, 0.42%, (MUNIPSA plus 0.28%), 12/1/46 | 5,000,000 | | 4,966,650 | |
| Indiana Finance Authority Rev., (Methodist Hospitals, Inc.), 5.00%, 9/15/20 | 1,000,000 | | 1,009,320 | |
| Indiana Finance Authority Rev., (Methodist Hospitals, Inc.), 5.00%, 9/15/22 | 1,300,000 | | 1,393,912 | |
| Indiana Finance Authority Rev., (Methodist Hospitals, Inc.), 5.00%, 9/15/24 | 1,000,000 | | 1,126,760 | |
| Indiana Finance Authority Rev., (Methodist Hospitals, Inc.), 5.00%, 9/15/25 | 1,150,000 | | 1,290,565 | |
| Indiana Finance Authority Rev., (Methodist Hospitals, Inc.), 5.00%, 9/15/27 | 1,250,000 | | 1,389,887 | |
| Indiana Finance Authority Rev., (Methodist Hospitals, Inc.), 5.00%, 9/15/29 | 1,465,000 | | 1,616,950 | |
| | | | | | | | |
| Principal Amount | Value |
| Indiana Finance Authority Rev., (Methodist Hospitals, Inc.), 5.00%, 9/15/31 | $ | 1,250,000 | | $ | 1,367,262 | |
| Indiana Finance Authority Rev., (Parkview Health System Obligated Group), VRN, 0.69%, (MUNIPSA plus 0.55%), 11/1/39 | 5,000,000 | | 4,923,100 | |
| | 51,452,319 | |
Kansas† | | |
| Wyandotte County-Kansas City Unified Government Utility System Rev., 5.00%, 9/1/21 | 800,000 | | 846,768 | |
| Wyandotte County-Kansas City Unified Government Utility System Rev., 5.00%, 9/1/23 | 895,000 | | 1,026,019 | |
| | 1,872,787 | |
| Kentucky — 2.5% | | |
| Ashland Rev., (Ashland Hospital Corp. Obligated Group), 4.00%, 2/1/21 | 535,000 | | 543,041 | |
| Ashland Rev., (Ashland Hospital Corp. Obligated Group), 5.00%, 2/1/28 | 600,000 | | 714,750 | |
| Ashland Rev., (Ashland Hospital Corp. Obligated Group), 5.00%, 2/1/29 | 265,000 | | 318,938 | |
| Ashland Rev., (Ashland Hospital Corp. Obligated Group), 5.00%, 2/1/32 | 900,000 | | 1,070,163 | |
| Ashland Rev., (Ashland Hospital Corp. Obligated Group), 4.00%, 2/1/33 | 580,000 | | 608,878 | |
| Ashland Rev., (Ashland Hospital Corp. Obligated Group), 4.00%, 2/1/34 | 500,000 | | 521,650 | |
| Ashland Rev., (Ashland Hospital Corp. Obligated Group), 4.00%, 2/1/35 | 465,000 | | 482,172 | |
| Ashland Rev., (Ashland Hospital Corp. Obligated Group), 4.00%, 2/1/36 | 380,000 | | 391,472 | |
| Ashland Rev., (Ashland Hospital Corp. Obligated Group), 4.00%, 2/1/38 | 745,000 | | 759,244 | |
| Christian County Rev., (Jennie Stuart Medical Center Obligated Group), 5.00%, 2/1/26 | 1,915,000 | | 2,103,130 | |
| Christian County Rev., (Jennie Stuart Medical Center Obligated Group), 5.50%, 2/1/44 | 3,665,000 | | 3,985,028 | |
| Kenton County Airport Board Rev., 5.00%, 1/1/23 | 825,000 | | 909,101 | |
| Kenton County Airport Board Rev., 5.00%, 1/1/24 | 750,000 | | 853,620 | |
| Kenton County Airport Board Rev., 5.00%, 1/1/26 | 1,330,000 | | 1,595,960 | |
| Kentucky Economic Development Finance Authority Rev., (Owensboro Health, Inc. Obligated Group), 5.00%, 6/1/21 | 750,000 | | 767,978 | |
| Kentucky Economic Development Finance Authority Rev., (Owensboro Health, Inc. Obligated Group), 5.00%, 6/1/22 | 1,000,000 | | 1,046,170 | |
| Kentucky Economic Development Finance Authority Rev., (Owensboro Health, Inc. Obligated Group), 5.00%, 6/1/23 | 1,620,000 | | 1,726,353 | |
| Kentucky Economic Development Finance Authority Rev., (Owensboro Health, Inc. Obligated Group), 5.00%, 6/1/24 | 2,000,000 | | 2,164,660 | |
| Kentucky Economic Development Finance Authority Rev., (Owensboro Health, Inc. Obligated Group), 5.00%, 6/1/25 | 1,350,000 | | 1,479,586 | |
| Kentucky Public Energy Authority Rev., VRN, 4.00%, 4/1/48 (GA: Morgan Stanley) | 10,000,000 | | 10,733,800 | |
| Kentucky Public Energy Authority Rev., VRN, 4.00%, 1/1/49 (GA: BP Corp. North America, Inc.) | 15,000,000 | | 16,063,650 | |
| Kentucky Public Energy Authority Rev., VRN, 4.00%, 12/1/49 (GA: Morgan Stanley) | 14,750,000 | | 16,091,365 | |
| Kentucky Public Energy Authority Rev., VRN, 4.00%, 12/1/49 (GA: Morgan Stanley) | 17,000,000 | | 18,530,510 | |
| Kentucky State Property & Building Commission Rev., 5.00%, 5/1/31 (BAM) | 2,000,000 | | 2,404,660 | |
| Kentucky State Property & Building Commission Rev., 5.00%, 5/1/33 (BAM) | 1,750,000 | | 2,072,945 | |
| | | | | | | | |
| Principal Amount | Value |
| Kentucky Turnpike Authority Rev., 5.00%, 7/1/20 | $ | 1,500,000 | | $ | 1,505,850 | |
| Paducah Electric Plant Board Rev., 5.00%, 10/1/24 (AGM) | 1,500,000 | | 1,771,890 | |
| Paducah Electric Plant Board Rev., 5.00%, 10/1/25 (AGM) | 1,500,000 | | 1,823,385 | |
| Paducah Electric Plant Board Rev., 5.00%, 10/1/26 (AGM) | 1,100,000 | | 1,371,106 | |
| Paducah Electric Plant Board Rev., 5.00%, 10/1/27 (AGM) | 2,000,000 | | 2,505,140 | |
| Paducah Electric Plant Board Rev., 5.00%, 10/1/28 (AGM) | 2,245,000 | | 2,805,352 | |
| Paducah Electric Plant Board Rev., 5.00%, 10/1/30 (AGM) | 1,500,000 | | 1,861,095 | |
| | 101,582,642 | |
| Louisiana — 2.0% | | |
| Greater Ouachita Water Co. Rev., 5.00%, 9/1/29 (BAM) | 500,000 | | 658,540 | |
| Greater Ouachita Water Co. Rev., 4.00%, 9/1/30 (BAM) | 400,000 | | 486,772 | |
| Greater Ouachita Water Co. Rev., 4.00%, 9/1/31 (BAM) | 500,000 | | 604,005 | |
| Greater Ouachita Water Co. Rev., 4.00%, 9/1/32 (BAM) | 1,000,000 | | 1,198,450 | |
| Greater Ouachita Water Co. Rev., 4.00%, 9/1/33 (BAM) | 500,000 | | 595,620 | |
| Greater Ouachita Water Co. Rev., 4.00%, 9/1/34 (BAM) | 500,000 | | 593,385 | |
| Greater Ouachita Water Co. Rev., 4.00%, 9/1/35 (BAM) | 500,000 | | 590,455 | |
| Greater Ouachita Water Co. Rev., 4.00%, 9/1/36 (BAM) | 350,000 | | 411,464 | |
| Greater Ouachita Water Co. Rev., 4.00%, 9/1/37 (BAM) | 250,000 | | 292,845 | |
| Jefferson Sales Tax District Rev., 4.00%, 12/1/36 (AGM) | 6,745,000 | | 7,900,284 | |
| Jefferson Sales Tax District Rev., 4.00%, 12/1/37 (AGM) | 5,000,000 | | 5,840,050 | |
| Jefferson Sales Tax District Rev., 4.00%, 12/1/38 (AGM) | 5,000,000 | | 5,820,950 | |
| Louisiana Local Government Environmental Facilities & Community Development Authority Rev., (University of Louisiana at Lafayette), 5.00%, 10/1/43 (AGM) | 2,010,000 | | 2,250,175 | |
| Louisiana Local Government Environmental Facilities & Community Development Authority Rev., (University of Louisiana at Lafayette), 5.00%, 10/1/48 (AGM) | 5,765,000 | | 6,418,866 | |
| Louisiana Public Facilities Authority Rev., (Entergy Louisiana LLC), 3.375%, 9/1/28 | 10,000,000 | | 10,127,100 | |
| Louisiana Public Facilities Authority Rev., (Lafayette General Health System, Inc. Obligated Group), 5.00%, 11/1/45 | 6,000,000 | | 6,421,200 | |
| Louisiana Public Facilities Authority Rev., (Ochsner Clinic Foundation), 5.00%, 5/15/29 | 990,000 | | 1,142,262 | |
| Louisiana Public Facilities Authority Rev., (Ochsner Clinic Foundation), 5.00%, 5/15/30 | 990,000 | | 1,135,827 | |
| New Orleans GO, 5.00%, 12/1/21 | 6,000,000 | | 6,423,780 | |
| New Orleans Aviation Board Rev., (Parking Facilities Corp.), 5.00%, 10/1/26 (AGM) | 500,000 | | 614,605 | |
| New Orleans Aviation Board Rev., (Parking Facilities Corp.), 5.00%, 10/1/29 (AGM) | 800,000 | | 1,012,080 | |
| New Orleans Aviation Board Rev., (Parking Facilities Corp.), 5.00%, 10/1/30 (AGM) | 350,000 | | 438,480 | |
| New Orleans Aviation Board Rev., (Parking Facilities Corp.), 5.00%, 10/1/31 (AGM) | 1,100,000 | | 1,364,187 | |
| New Orleans Aviation Board Rev., (Parking Facilities Corp.), 5.00%, 10/1/32 (AGM) | 1,200,000 | | 1,472,712 | |
| New Orleans Aviation Board Rev., (Parking Facilities Corp.), 5.00%, 10/1/34 (AGM) | 1,200,000 | | 1,460,184 | |
| New Orleans Sewerage Service Rev., 5.00%, 6/1/21 | 400,000 | | 418,088 | |
| New Orleans Sewerage Service Rev., 5.00%, 6/1/23 | 250,000 | | 282,030 | |
| New Orleans Sewerage Service Rev., 5.00%, 6/1/24 | 200,000 | | 233,428 | |
| Regional Transit Authority Rev., 5.00%, 12/1/20 (AGM) | 1,250,000 | | 1,280,187 | |
| Shreveport Water & Sewer Rev., 4.00%, 12/1/37 (AGM) | 790,000 | | 918,628 | |
| Shreveport Water & Sewer Rev., 4.00%, 12/1/44 (AGM) | 800,000 | | 912,016 | |
| St. John the Baptist Rev., (Marathon Oil Corp.), VRN, 2.00%, 6/1/37 | 1,450,000 | | 1,364,551 | |
| | | | | | | | |
| Principal Amount | Value |
| St. John the Baptist Rev., (Marathon Oil Corp.), VRN, 2.10%, 6/1/37 | $ | 9,000,000 | | $ | 8,253,360 | |
| | 78,936,566 | |
| Maryland — 1.6% | | |
| Baltimore Rev., 4.25%, 6/1/26 | 1,750,000 | | 1,734,477 | |
| Baltimore Rev., 4.00%, 9/1/27 | 625,000 | | 617,613 | |
| Baltimore Rev., 4.75%, 6/1/31 | 1,500,000 | | 1,459,905 | |
| Baltimore Rev., 5.00%, 9/1/38 | 1,600,000 | | 1,600,096 | |
| Baltimore Rev., (Baltimore MD Water Utility Fund), 4.00%, 7/1/34 | 2,500,000 | | 2,970,850 | |
| Baltimore Rev., (Baltimore MD Water Utility Fund), 4.00%, 7/1/34 | 2,275,000 | | 2,703,473 | |
| Baltimore Rev., (Baltimore MD Water Utility Fund), 4.00%, 7/1/35 | 1,750,000 | | 2,069,410 | |
| Baltimore Rev., (Baltimore MD Water Utility Fund), 4.00%, 7/1/35 | 3,310,000 | | 3,914,141 | |
| Baltimore Rev., (Baltimore MD Water Utility Fund), 4.00%, 7/1/36 | 2,675,000 | | 3,136,491 | |
| Baltimore Rev., (Baltimore MD Water Utility Fund), 4.00%, 7/1/36 | 1,440,000 | | 1,688,429 | |
| Baltimore Rev., (Baltimore MD Water Utility Fund), 4.00%, 7/1/37 | 1,500,000 | | 1,747,035 | |
| Baltimore Rev., (Baltimore MD Water Utility Fund), 4.00%, 7/1/37 | 1,465,000 | | 1,706,271 | |
| Baltimore County Rev., (Riderwood Village Obligated Group), 4.00%, 1/1/35 | 600,000 | | 644,970 | |
| Baltimore County Rev., (Riderwood Village Obligated Group), 4.00%, 1/1/36 | 650,000 | | 695,929 | |
| Baltimore County Rev., (Riderwood Village Obligated Group), 4.00%, 1/1/37 | 750,000 | | 797,880 | |
| Baltimore County Rev., (Riderwood Village Obligated Group), 4.00%, 1/1/38 | 700,000 | | 743,505 | |
| Baltimore County Rev., (Riderwood Village Obligated Group), 4.00%, 1/1/39 | 1,000,000 | | 1,057,920 | |
| Baltimore County Rev., (Riderwood Village Obligated Group), 4.00%, 1/1/40 | 725,000 | | 764,549 | |
| Maryland Economic Development Corp. Rev., 4.00%, 7/1/24 (AGM) | 300,000 | | 330,003 | |
| Maryland Economic Development Corp. Rev., 4.00%, 7/1/25 (AGM) | 330,000 | | 369,141 | |
| Maryland Economic Development Corp. Rev., 4.00%, 7/1/26 (AGM) | 375,000 | | 424,958 | |
| Maryland Economic Development Corp. Rev., 5.00%, 6/1/35 (AGM) | 1,230,000 | | 1,406,468 | |
| Maryland Economic Development Corp. Rev., 5.00%, 6/1/43 (AGM) | 1,000,000 | | 1,122,520 | |
| Maryland Economic Development Corp. Rev., (Ports America Chesapeake LLC), 5.00%, 6/1/32 | 500,000 | | 526,155 | |
| Maryland Economic Development Corp. Rev., (Ports America Chesapeake LLC), 5.00%, 6/1/35 | 2,000,000 | | 2,075,260 | |
| Maryland Economic Development Corp. Rev., (West Village & Millennium Hall Student Housing at Towson University), 5.00%, 7/1/25 | 200,000 | | 223,868 | |
| Maryland Economic Development Corp. Rev., (West Village & Millennium Hall Student Housing at Towson University), 5.00%, 7/1/26 | 175,000 | | 198,144 | |
| Maryland Economic Development Corp. Rev., (West Village & Millennium Hall Student Housing at Towson University), 5.00%, 7/1/27 | 120,000 | | 137,383 | |
| Maryland Economic Development Corp. Rev., (West Village & Millennium Hall Student Housing at Towson University), 5.00%, 7/1/28 | 130,000 | | 147,698 | |
| Maryland Economic Development Corp. Rev., (West Village & Millennium Hall Student Housing at Towson University), 5.00%, 7/1/29 | 175,000 | | 197,096 | |
| Maryland Economic Development Corp. Rev., (West Village & Millennium Hall Student Housing at Towson University), 5.00%, 7/1/30 | 250,000 | | 279,160 | |
| Maryland Economic Development Corp. Rev., (West Village & Millennium Hall Student Housing at Towson University), 5.00%, 7/1/31 | 300,000 | | 332,472 | |
| Maryland Economic Development Corp. Rev., (West Village & Millennium Hall Student Housing at Towson University), 5.00%, 7/1/32 | 325,000 | | 356,756 | |
| | | | | | | | |
| Principal Amount | Value |
| Maryland Health & Higher Educational Facilities Authority Rev., (Adventist Healthcare Obligated Group), 5.00%, 1/1/21 | $ | 500,000 | | $ | 509,165 | |
| Maryland Health & Higher Educational Facilities Authority Rev., (Adventist Healthcare Obligated Group), 5.50%, 1/1/46 | 3,585,000 | | 3,855,954 | |
| Maryland Health & Higher Educational Facilities Authority Rev., (Maryland Institute College of Art), 5.00%, 6/1/32 | 460,000 | | 514,105 | |
| Maryland Health & Higher Educational Facilities Authority Rev., (Maryland Institute College of Art), 5.00%, 6/1/34 | 675,000 | | 748,494 | |
| Maryland Health & Higher Educational Facilities Authority Rev., (Maryland Institute College of Art), 5.00%, 6/1/42 | 1,000,000 | | 1,088,320 | |
| Maryland Health & Higher Educational Facilities Authority Rev., (Mercy Medical Center Obligated Group), 4.00%, 7/1/42 | 4,700,000 | | 4,873,571 | |
| Maryland Stadium Authority Rev., 5.00%, 5/1/22 | 1,480,000 | | 1,595,751 | |
| Maryland Stadium Authority Rev., 5.00%, 5/1/26 | 2,550,000 | | 3,050,310 | |
| Prince George's County Rev., (Collington Episcopal Life Care Community, Inc.), 5.00%, 4/1/21 | 1,850,000 | | 1,852,849 | |
| Prince George's County Rev., (Collington Episcopal Life Care Community, Inc.), 5.00%, 4/1/22 | 1,945,000 | | 1,948,229 | |
| Prince George's County Rev., (Collington Episcopal Life Care Community, Inc.), 5.00%, 4/1/23 | 2,045,000 | | 2,047,004 | |
| Prince George's County Rev., (Collington Episcopal Life Care Community, Inc.), 5.00%, 4/1/24 | 2,150,000 | | 2,149,849 | |
| | 62,413,627 | |
| Massachusetts — 2.0% | | |
| Massachusetts GO, 5.00%, 1/1/37 | 10,000,000 | | 12,888,100 | |
| Massachusetts GO, VRN, 1.70%, 8/1/43 | 5,500,000 | | 5,651,140 | |
| Massachusetts Development Finance Agency Rev., (Emerson College), 5.00%, 1/1/22 | 570,000 | | 592,840 | |
| Massachusetts Development Finance Agency Rev., (Emerson College), 5.00%, 1/1/23 | 400,000 | | 424,432 | |
| Massachusetts Development Finance Agency Rev., (Emerson College), 5.00%, 1/1/25 | 525,000 | | 575,442 | |
| Massachusetts Development Finance Agency Rev., (Emerson College), 5.00%, 1/1/26 | 550,000 | | 610,423 | |
| Massachusetts Development Finance Agency Rev., (Emerson College), 5.00%, 1/1/28 | 4,540,000 | | 5,134,286 | |
| Massachusetts Development Finance Agency Rev., (Emerson College), 5.00%, 1/1/30 | 4,120,000 | | 4,618,026 | |
| Massachusetts Development Finance Agency Rev., (Emerson College), 5.00%, 1/1/31 | 475,000 | | 522,386 | |
| Massachusetts Development Finance Agency Rev., (Emerson College), 5.00%, 1/1/31 | 5,005,000 | | 5,571,216 | |
Massachusetts Development Finance Agency Rev., (NewBridge on the Charles, Inc.), 5.00%, 10/1/37(1) | 1,000,000 | | 1,014,020 | |
Massachusetts Development Finance Agency Rev., (NewBridge on the Charles, Inc.), 5.00%, 10/1/47(1) | 1,000,000 | | 988,180 | |
| Massachusetts Development Finance Agency Rev., (Provident Commonwealth Education Resources, Inc.), 5.00%, 10/1/20 | 500,000 | | 503,050 | |
| Massachusetts Development Finance Agency Rev., (Provident Commonwealth Education Resources, Inc.), 5.00%, 10/1/21 | 555,000 | | 568,253 | |
| Massachusetts Development Finance Agency Rev., (Provident Commonwealth Education Resources, Inc.), 5.00%, 10/1/22 | 1,370,000 | | 1,416,470 | |
| Massachusetts Development Finance Agency Rev., (Provident Commonwealth Education Resources, Inc.), 5.00%, 10/1/23 | 2,210,000 | | 2,306,886 | |
| Massachusetts Development Finance Agency Rev., (Provident Commonwealth Education Resources, Inc.), 5.00%, 10/1/30 | 1,130,000 | | 1,170,827 | |
| Massachusetts Development Finance Agency Rev., (Provident Commonwealth Education Resources, Inc.), 5.00%, 10/1/31 | 1,200,000 | | 1,236,660 | |
| Massachusetts Development Finance Agency Rev., (Suffolk University), 5.00%, 7/1/31 | 620,000 | | 695,572 | |
| | | | | | | | |
| Principal Amount | Value |
| Massachusetts Development Finance Agency Rev., (Suffolk University), 5.00%, 7/1/32 | $ | 775,000 | | $ | 860,940 | |
| Massachusetts Development Finance Agency Rev., (Suffolk University), 5.00%, 7/1/33 | 775,000 | | 851,849 | |
| Massachusetts Development Finance Agency Rev., (Suffolk University), 5.00%, 7/1/34 | 550,000 | | 603,020 | |
| Massachusetts Development Finance Agency Rev., (Suffolk University), 5.00%, 7/1/35 | 470,000 | | 513,677 | |
| Massachusetts Development Finance Agency Rev., (Suffolk University), 5.00%, 7/1/36 | 445,000 | | 483,519 | |
| Massachusetts Development Finance Agency Rev., (Suffolk University), 5.00%, 7/1/37 | 605,000 | | 654,652 | |
| Massachusetts Development Finance Agency Rev., (Trustees of Boston University), VRN, 5.00%, 10/1/42 | 5,000,000 | | 5,611,600 | |
| Massachusetts Development Finance Agency Rev., (UMass Memorial Health Care Obligated Group), 5.00%, 7/1/41 | 1,850,000 | | 2,006,603 | |
| Massachusetts Development Finance Agency Rev., (Wellforce Obligated Group), 5.00%, 7/1/32 | 1,875,000 | | 2,212,781 | |
| Massachusetts Development Finance Agency Rev., (Wellforce Obligated Group), 5.00%, 7/1/34 | 1,330,000 | | 1,544,316 | |
| Massachusetts Development Finance Agency Rev., (Wellforce Obligated Group), 5.00%, 7/1/44 | 1,300,000 | | 1,450,995 | |
| Massachusetts Health & Educational Facilities Authority Rev., (UMass Memorial Health Care Obligated Group), 5.00%, 7/1/21 | 1,050,000 | | 1,053,266 | |
| Massachusetts Port Authority Rev., 4.00%, 7/1/22 | 2,655,000 | | 2,826,088 | |
| Massachusetts School Building Authority Rev., 5.00%, 8/15/30 | 8,000,000 | | 8,745,840 | |
| Massachusetts School Building Authority Rev., 5.00%, 8/15/30 | 3,575,000 | | 3,908,297 | |
| | 79,815,652 | |
| Michigan — 3.1% | | |
| Calhoun County Hospital Finance Authority Rev., (Ella EM Brown Charitable Circle), 5.00%, 2/15/24 | 870,000 | | 967,397 | |
| Calhoun County Hospital Finance Authority Rev., (Ella EM Brown Charitable Circle), 5.00%, 2/15/25 | 1,470,000 | | 1,670,890 | |
| Calhoun County Hospital Finance Authority Rev., (Ella EM Brown Charitable Circle), 5.00%, 2/15/26 | 1,575,000 | | 1,818,101 | |
| Calhoun County Hospital Finance Authority Rev., (Ella EM Brown Charitable Circle), 5.00%, 2/15/27 | 1,655,000 | | 1,941,580 | |
| Calhoun County Hospital Finance Authority Rev., (Ella EM Brown Charitable Circle), 5.00%, 2/15/29 | 1,825,000 | | 2,118,515 | |
| Calhoun County Hospital Finance Authority Rev., (Ella EM Brown Charitable Circle), 5.00%, 2/15/33 | 1,970,000 | | 2,226,041 | |
| Calhoun County Hospital Finance Authority Rev., (Ella EM Brown Charitable Circle), 5.00%, 2/15/34 | 1,830,000 | | 2,061,275 | |
| Calhoun County Hospital Finance Authority Rev., (Ella EM Brown Charitable Circle), 5.00%, 2/15/35 | 2,445,000 | | 2,737,031 | |
| Calhoun County Hospital Finance Authority Rev., (Ella EM Brown Charitable Circle), 5.00%, 2/15/36 | 2,565,000 | | 2,861,257 | |
| Detroit City School District GO, 5.00%, 5/1/28 (Q-SBLF) | 6,500,000 | | 6,996,795 | |
| Detroit City School District GO, 5.00%, 5/1/31 (Q-SBLF) | 5,000,000 | | 5,358,400 | |
| Detroit Downtown Development Authority Tax Allocation, 5.00%, 7/1/20 (AGM) | 1,200,000 | | 1,204,284 | |
| Detroit Downtown Development Authority Tax Allocation, 5.00%, 7/1/21 (AGM) | 200,000 | | 209,462 | |
| Detroit Downtown Development Authority Tax Allocation, 5.00%, 7/1/22 (AGM) | 300,000 | | 327,135 | |
| Detroit Downtown Development Authority Tax Allocation, 5.00%, 7/1/22 (AGM) | 500,000 | | 545,225 | |
| Detroit Downtown Development Authority Tax Allocation, 5.00%, 7/1/23 (AGM) | 400,000 | | 452,576 | |
| | | | | | | | |
| Principal Amount | Value |
| Detroit Downtown Development Authority Tax Allocation, 5.00%, 7/1/24 (AGM) | $ | 850,000 | | $ | 992,817 | |
| Detroit Downtown Development Authority Tax Allocation, 5.00%, 7/1/24 (AGM) | 750,000 | | 876,015 | |
| Detroit Downtown Development Authority Tax Allocation, 5.00%, 7/1/25 (AGM) | 550,000 | | 638,803 | |
| Detroit Downtown Development Authority Tax Allocation, 5.00%, 7/1/25 (AGM) | 500,000 | | 580,730 | |
| Detroit Downtown Development Authority Tax Allocation, 5.00%, 7/1/26 (AGM) | 600,000 | | 696,090 | |
| Detroit Downtown Development Authority Tax Allocation, 5.00%, 7/1/27 (AGM) | 1,250,000 | | 1,446,387 | |
| Detroit Downtown Development Authority Tax Allocation, 5.00%, 7/1/28 (AGM) | 1,600,000 | | 1,845,840 | |
| Detroit Downtown Development Authority Tax Allocation, 5.00%, 7/1/30 (AGM) | 1,255,000 | | 1,441,330 | |
| Detroit Downtown Development Authority Tax Allocation, 5.00%, 7/1/31 (AGM) | 1,625,000 | | 1,862,770 | |
| Detroit Sewage Disposal System Rev., (Great Lakes Water Authority Sewage Disposal System Rev.), 5.25%, 7/1/39 | 19,250,000 | | 20,707,417 | |
Detroit Water Supply System Rev., (Great Lakes Water Authority Water Supply System Rev.), 5.00%, 7/1/21, Prerefunded at 100% of Par(3) | 1,000,000 | | 1,051,220 | |
Lincoln Consolidated School District GO, 5.00%, 5/1/21 (AGM
Q-SBLF) | 1,000,000 | | 1,040,690 | |
Lincoln Consolidated School District GO, 5.00%, 5/1/22 (AGM
Q-SBLF) | 500,000 | | 541,800 | |
Lincoln Consolidated School District GO, 5.00%, 5/1/23 (AGM
Q-SBLF) | 1,000,000 | | 1,135,010 | |
Lincoln Consolidated School District GO, 5.00%, 5/1/24 (AGM
Q-SBLF) | 1,000,000 | | 1,177,950 | |
Lincoln Consolidated School District GO, 5.00%, 5/1/25 (AGM
Q-SBLF) | 1,000,000 | | 1,209,840 | |
Lincoln Consolidated School District GO, 5.00%, 5/1/33 (AGM
Q-SBLF) | 1,480,000 | | 1,787,115 | |
Lincoln Consolidated School District GO, 5.00%, 5/1/34 (AGM
Q-SBLF) | 1,630,000 | | 1,966,187 | |
| Michigan Finance Authority Rev., 5.00%, 10/1/27 | 3,030,000 | | 3,575,097 | |
| Michigan Finance Authority Rev., 5.00%, 10/1/28 | 3,465,000 | | 4,078,236 | |
| Michigan Finance Authority Rev., (Beaumont Health Obligated Group), 4.00%, 11/1/46 | 5,000,000 | | 5,273,150 | |
| Michigan Finance Authority Rev., (Great Lakes Water Authority Sewage Disposal System Rev.), 5.00%, 7/1/33 | 2,000,000 | | 2,241,800 | |
| Michigan Finance Authority Rev., (Great Lakes Water Authority Water Supply System Rev.), 5.00%, 7/1/34 | 1,500,000 | | 1,678,230 | |
| Michigan Finance Authority Rev., (MidMichigan Obligated Group), 5.00%, 6/1/25 | 1,000,000 | | 1,145,280 | |
| Michigan Finance Authority Rev., (MidMichigan Obligated Group), 5.00%, 6/1/27 | 1,400,000 | | 1,587,712 | |
| Michigan Finance Authority Rev., (MidMichigan Obligated Group), 5.00%, 6/1/28 | 1,250,000 | | 1,414,663 | |
| Michigan Finance Authority Rev., (MidMichigan Obligated Group), 5.00%, 6/1/29 | 1,565,000 | | 1,766,353 | |
| Michigan State Building Authority Rev., 5.00%, 4/15/25 | 1,750,000 | | 2,123,677 | |
| Michigan State Building Authority Rev., 5.00%, 4/15/26 | 750,000 | | 934,980 | |
| Michigan Strategic Fund Rev., (DTE Electric Co.), VRN, 1.45%, 8/1/29 | 1,375,000 | | 1,383,663 | |
| Port Huron Area School District GO, 4.00%, 5/1/30 (AGM) | 1,080,000 | | 1,238,749 | |
| Port Huron Area School District GO, 4.00%, 5/1/31 (AGM) | 2,005,000 | | 2,279,104 | |
| Saginaw Water Supply System Rev., 4.00%, 7/1/20 (AGM) | 350,000 | | 351,089 | |
| | | | | | | | |
| Principal Amount | Value |
| Saginaw Water Supply System Rev., 4.00%, 7/1/22 (AGM) | $ | 1,335,000 | | $ | 1,433,376 | |
| Saginaw Water Supply System Rev., 4.00%, 7/1/24 (AGM) | 1,380,000 | | 1,566,700 | |
| Saginaw Water Supply System Rev., 4.00%, 7/1/26 (AGM) | 1,530,000 | | 1,811,474 | |
| Warren Consolidated Schools GO, 4.00%, 5/1/22 (AGM) | 1,645,000 | | 1,759,426 | |
| Warren Consolidated Schools GO, 4.00%, 5/1/26 (AGM) | 1,100,000 | | 1,285,009 | |
| Wayne County Airport Authority Rev., 5.00%, 12/1/30 | 1,000,000 | | 1,124,070 | |
| Wayne County Airport Authority Rev., 5.00%, 12/1/31 | 650,000 | | 728,273 | |
| Wayne County Airport Authority Rev., 5.00%, 12/1/32 | 1,175,000 | | 1,311,688 | |
| Wayne County Airport Authority Rev., 5.00%, 12/1/34 | 1,150,000 | | 1,278,570 | |
| Ypsilanti School District GO, (Ypsilanti Community Schools), 5.00%, 5/1/21 (Q-SBLF) | 510,000 | | 530,660 | |
| Ypsilanti School District GO, (Ypsilanti Community Schools), 5.00%, 5/1/23 (Q-SBLF) | 1,070,000 | | 1,205,462 | |
| Ypsilanti School District GO, (Ypsilanti Community Schools), 5.00%, 5/1/24 (Q-SBLF) | 2,000,000 | | 2,327,920 | |
| Ypsilanti School District GO, (Ypsilanti Community Schools), 5.00%, 5/1/28 (Q-SBLF) | 2,455,000 | | 3,052,866 | |
| | 124,981,252 | |
| Minnesota — 0.5% | | |
| Duluth Economic Development Authority Rev., (Essentia Health Obligated Group), 5.00%, 2/15/33 | 1,000,000 | | 1,151,440 | |
| Duluth Economic Development Authority Rev., (Essentia Health Obligated Group), 5.00%, 2/15/37 | 1,000,000 | | 1,138,810 | |
| Duluth Independent School District No. 709 COP, 5.00%, 2/1/21 (SD CRED PROG) | 300,000 | | 308,505 | |
| Duluth Independent School District No. 709 COP, 5.00%, 2/1/22 (SD CRED PROG) | 325,000 | | 347,906 | |
| Duluth Independent School District No. 709 COP, 5.00%, 2/1/23 (SD CRED PROG) | 380,000 | | 422,149 | |
| Duluth Independent School District No. 709 COP, 5.00%, 2/1/24 (SD CRED PROG) | 420,000 | | 482,681 | |
| Duluth Independent School District No. 709 COP, 5.00%, 2/1/25 (SD CRED PROG) | 375,000 | | 444,304 | |
| Duluth Independent School District No. 709 COP, 5.00%, 2/1/26 (SD CRED PROG) | 395,000 | | 480,411 | |
| Duluth Independent School District No. 709 COP, 5.00%, 2/1/27 (SD CRED PROG) | 370,000 | | 461,053 | |
| Duluth Independent School District No. 709 COP, 5.00%, 2/1/28 (SD CRED PROG) | 350,000 | | 446,600 | |
| Maple Grove Rev., (Maple Grove Hospital Corp.), 5.00%, 5/1/23 | 500,000 | | 548,210 | |
| Maple Grove Rev., (Maple Grove Hospital Corp.), 5.00%, 5/1/24 | 1,200,000 | | 1,348,260 | |
| Maple Grove Rev., (Maple Grove Hospital Corp.), 5.00%, 5/1/25 | 800,000 | | 915,264 | |
| Minnesota Higher Education Facilities Authority Rev., (College of Saint Benedict), 4.00%, 3/1/43 | 1,000,000 | | 931,650 | |
| Minnesota Higher Education Facilities Authority Rev., (College of State Scholastica, Inc.), 4.00%, 12/1/29 | 140,000 | | 146,488 | |
| Minnesota Higher Education Facilities Authority Rev., (College of State Scholastica, Inc.), 4.00%, 12/1/32 | 400,000 | | 404,216 | |
| Minnesota Higher Education Facilities Authority Rev., (College of State Scholastica, Inc.), 4.00%, 12/1/33 | 500,000 | | 500,340 | |
| Minnesota Higher Education Facilities Authority Rev., (College of State Scholastica, Inc.), 4.00%, 12/1/40 | 950,000 | | 911,297 | |
| Rochester Rev., (Mayo Clinic), VRN, 4.50%, 11/15/38 | 6,000,000 | | 6,295,860 | |
| St. Cloud Rev., (CentraCare Health System Obligated Group), 5.00%, 5/1/28 | 2,000,000 | | 2,353,680 | |
| St. Cloud Rev., (CentraCare Health System Obligated Group), 5.00%, 5/1/30 | 1,000,000 | | 1,167,050 | |
| | 21,206,174 | |
| | | | | | | | |
| Principal Amount | Value |
| Mississippi — 0.6% | | |
| Gulfport Rev., (Memorial Hospital at Gulfport), 5.00%, 7/1/20 | $ | 645,000 | | $ | 647,006 | |
| Gulfport Rev., (Memorial Hospital at Gulfport), 5.00%, 7/1/21 | 1,000,000 | | 1,041,630 | |
| Gulfport Rev., (Memorial Hospital at Gulfport), 5.00%, 7/1/22 | 1,000,000 | | 1,078,970 | |
| Gulfport Rev., (Memorial Hospital at Gulfport), 5.00%, 7/1/23 | 1,500,000 | | 1,671,330 | |
| Gulfport Rev., (Memorial Hospital at Gulfport), 5.00%, 7/1/30 | 2,000,000 | | 2,328,680 | |
| Gulfport Rev., (Memorial Hospital at Gulfport), 5.00%, 7/1/31 | 1,000,000 | | 1,152,600 | |
| Jackson Water & Sewer System Rev., 4.00%, 9/1/20 (BAM) | 625,000 | | 629,906 | |
| Jackson Water & Sewer System Rev., 4.00%, 9/1/22 (BAM) | 550,000 | | 588,121 | |
| Jackson Water & Sewer System Rev., 4.00%, 9/1/23 (BAM) | 580,000 | | 636,167 | |
| Mississippi Business Finance Corp. Rev., (Chevron USA, Inc.), VRDN, 0.07%, 6/1/20 (GA: Chevron Corp.) | 2,000,000 | | 2,000,000 | |
| Mississippi Development Bank Rev., (City of Jackson MS Water & Sewer System Rev.), 6.875%, 12/1/40 (AGM) | 4,250,000 | | 5,018,868 | |
Mississippi Hospital Equipment & Facilities Authority Rev., (North Mississippi Medical Center Obligated Group), 5.00%, 10/1/33(4) | 685,000 | | 825,678 | |
Mississippi Hospital Equipment & Facilities Authority Rev., (North Mississippi Medical Center Obligated Group), 5.00%, 10/1/34(4) | 700,000 | | 840,602 | |
Mississippi Hospital Equipment & Facilities Authority Rev., (North Mississippi Medical Center Obligated Group), 5.00%, 10/1/35(4) | 600,000 | | 717,108 | |
Mississippi Hospital Equipment & Facilities Authority Rev., (North Mississippi Medical Center Obligated Group), 5.00%, 10/1/36(4) | 650,000 | | 773,578 | |
Mississippi Hospital Equipment & Facilities Authority Rev., (North Mississippi Medical Center Obligated Group), 5.00%, 10/1/37(4) | 750,000 | | 889,530 | |
| State of Mississippi GO, VRN, 0.58%, (67% of the 1-month LIBOR plus 0.33%), 9/1/27 | 2,480,000 | | 2,473,056 | |
| | 23,312,830 | |
| Missouri — 0.8% | | |
| Cape Girardeau County Industrial Development Authority Rev., (SoutheastHEALTH Obligated Group), 5.00%, 3/1/22 | 1,170,000 | | 1,225,107 | |
| Cape Girardeau County Industrial Development Authority Rev., (SoutheastHEALTH Obligated Group), 5.00%, 3/1/23 | 600,000 | | 641,388 | |
| Cape Girardeau County Industrial Development Authority Rev., (SoutheastHEALTH Obligated Group), 5.00%, 3/1/24 | 1,000,000 | | 1,092,240 | |
| Cape Girardeau County Industrial Development Authority Rev., (SoutheastHEALTH Obligated Group), 5.00%, 3/1/26 | 805,000 | | 902,139 | |
| Cape Girardeau County Industrial Development Authority Rev., (SoutheastHEALTH Obligated Group), 5.00%, 3/1/27 | 1,100,000 | | 1,243,517 | |
| Cape Girardeau County Industrial Development Authority Rev., (SoutheastHEALTH Obligated Group), 5.00%, 3/1/30 | 1,355,000 | | 1,481,543 | |
| Cape Girardeau County Industrial Development Authority Rev., (SoutheastHEALTH Obligated Group), 5.00%, 3/1/31 | 1,255,000 | | 1,365,202 | |
| Health & Educational Facilities Authority of the State of Missouri Rev., (Heartland Health Obligated Group), 5.00%, 2/15/31 | 650,000 | | 813,163 | |
| Health & Educational Facilities Authority of the State of Missouri Rev., (Heartland Health Obligated Group), 5.00%, 2/15/32 | 1,000,000 | | 1,241,930 | |
| Health & Educational Facilities Authority of the State of Missouri Rev., (Heartland Health Obligated Group), 5.00%, 2/15/33 | 750,000 | | 925,170 | |
| Health & Educational Facilities Authority of the State of Missouri Rev., (Heartland Health Obligated Group), 5.00%, 2/15/35 | 915,000 | | 1,119,512 | |
| Health & Educational Facilities Authority of the State of Missouri Rev., (Heartland Health Obligated Group), 4.00%, 2/15/37 | 500,000 | | 567,535 | |
| Health & Educational Facilities Authority of the State of Missouri Rev., (Mercy Health), 5.00%, 6/1/29 | 4,500,000 | | 5,706,990 | |
| Kansas City Sanitary Sewer System Rev., 5.00%, 1/1/22 | 450,000 | | 484,366 | |
| Kansas City Sanitary Sewer System Rev., 5.00%, 1/1/24 | 600,000 | | 697,146 | |
| Kansas City Sanitary Sewer System Rev., 5.00%, 1/1/26 | 540,000 | | 667,332 | |
| Kansas City Sanitary Sewer System Rev., 5.00%, 1/1/28 | 250,000 | | 325,962 | |
| | | | | | | | |
| Principal Amount | Value |
| Kansas City Sanitary Sewer System Rev., 5.00%, 1/1/29 | $ | 500,000 | | $ | 649,080 | |
| Kansas City Sanitary Sewer System Rev., 5.00%, 1/1/31 | 525,000 | | 673,937 | |
| Kansas City Sanitary Sewer System Rev., 5.00%, 1/1/33 | 475,000 | | 600,552 | |
| Missouri State Environmental Improvement & Energy Resources Authority Rev., 5.00%, 1/1/23 | 290,000 | | 325,740 | |
| Missouri State Environmental Improvement & Energy Resources Authority Rev., 5.00%, 7/1/23 | 400,000 | | 458,256 | |
| Missouri State Environmental Improvement & Energy Resources Authority Rev., 5.00%, 1/1/24 | 690,000 | | 805,741 | |
| Missouri State Environmental Improvement & Energy Resources Authority Rev., 5.00%, 1/1/25 | 990,000 | | 1,191,366 | |
| St. Louis County Industrial Development Authority Rev., (Friendship Village St. Louis Obligated Group), 5.00%, 9/1/26 | 500,000 | | 500,225 | |
| St. Louis County Industrial Development Authority Rev., (Friendship Village St. Louis Obligated Group), 5.00%, 9/1/27 | 965,000 | | 961,449 | |
| St. Louis County Industrial Development Authority Rev., (Friendship Village St. Louis Obligated Group), 5.00%, 9/1/28 | 630,000 | | 625,754 | |
| St. Louis County Industrial Development Authority Rev., (Friendship Village St. Louis Obligated Group), 5.00%, 9/1/38 | 3,000,000 | | 2,795,640 | |
| St. Louis County Industrial Development Authority Rev., (Ranken-Jordan Pediatric Speciality Hospital), 5.00%, 11/15/41 | 1,000,000 | | 985,740 | |
| | 31,073,722 | |
| Nebraska — 0.7% | | |
| Central Plains Energy Project Rev., 5.00%, 9/1/22 (GA: Goldman Sachs Group, Inc.) | 2,500,000 | | 2,676,600 | |
| Central Plains Energy Project Rev., 5.00%, 9/1/31 (GA: Goldman Sachs Group, Inc.) | 2,000,000 | | 2,502,260 | |
| Central Plains Energy Project Rev., VRN, 4.00%, 12/1/49 (LIQ FAC: Royal Bank of Canada) | 5,000,000 | | 5,616,250 | |
| Central Plains Energy Project Rev., VRN, 5.00%, 3/1/50 (GA: Goldman Sachs Group, Inc.) | 10,000,000 | | 11,111,200 | |
| Douglas County Hospital Authority No. 3 Rev., (Nebraska Methodist Health Obligated Group), 5.00%, 11/1/45 | 4,100,000 | | 4,536,650 | |
| | 26,442,960 | |
| Nevada — 0.7% | | |
| Carson City Rev., (Carson Tahoe Regional Healthcare Obligated Group), 5.00%, 9/1/30 | 750,000 | | 840,742 | |
| Carson City Rev., (Carson Tahoe Regional Healthcare Obligated Group), 5.00%, 9/1/32 | 735,000 | | 809,228 | |
| Carson City Rev., (Carson Tahoe Regional Healthcare Obligated Group), 5.00%, 9/1/34 | 765,000 | | 830,790 | |
| Clark County Department of Aviation Rev., 5.00%, 7/1/21 | 5,000,000 | | 5,218,250 | |
| Henderson Local Improvement Districts Special Assessment, 4.00%, 9/1/21 | 1,320,000 | | 1,329,530 | |
| Henderson Local Improvement Districts Special Assessment, 4.00%, 9/1/22 | 2,150,000 | | 2,172,016 | |
| Henderson Local Improvement Districts Special Assessment, 4.00%, 9/1/24 | 1,890,000 | | 1,904,213 | |
| Henderson Public Improvement Trust Rev., (Touro College and University System Obligated Group), 5.25%, 1/1/29 | 1,270,000 | | 1,394,854 | |
| Henderson Public Improvement Trust Rev., (Touro College and University System Obligated Group), 5.25%, 1/1/32 | 1,840,000 | | 1,980,686 | |
| Las Vegas Convention & Visitors Authority Rev., 4.00%, 7/1/32 | 3,810,000 | | 3,930,358 | |
| Las Vegas Redevelopment Agency Tax Allocation, 5.00%, 6/15/22 | 890,000 | | 955,112 | |
| Las Vegas Special Improvement District No. 814 Special Assessment, 4.00%, 6/1/39 | 500,000 | | 462,870 | |
| Las Vegas Special Improvement District No. 814 Special Assessment, 4.00%, 6/1/44 | 550,000 | | 490,584 | |
| Reno Rev., (Washoe County Sales Tax Rev.), 5.00%, 6/1/20 | 1,000,000 | | 1,000,000 | |
| | | | | | | | |
| Principal Amount | Value |
| Reno Rev., (Washoe County Sales Tax Rev.), 5.00%, 6/1/29 | $ | 1,485,000 | | $ | 1,720,803 | |
| Reno Rev., (Washoe County Sales Tax Rev.), 5.00%, 6/1/34 | 1,010,000 | | 1,136,917 | |
| Reno Rev., (Washoe County Sales Tax Rev.), 4.00%, 6/1/43 | 1,000,000 | | 1,016,680 | |
Sparks Rev., 2.50%, 6/15/24(1) | 1,080,000 | | 1,052,784 | |
| | 28,246,417 | |
| New Hampshire — 0.4% | | |
| New Hampshire Business Finance Authority Rev., 4.125%, 1/20/34 | 14,636,138 | | 15,004,822 | |
| New Jersey — 5.0% | | |
| New Jersey Economic Development Authority Rev., 5.25%, 12/15/20 (Ambac) | 5,000,000 | | 5,053,700 | |
| New Jersey Economic Development Authority Rev., 4.00%, 7/1/22 | 3,000,000 | | 3,034,440 | |
| New Jersey Economic Development Authority Rev., 5.00%, 6/15/23 | 2,335,000 | | 2,436,222 | |
| New Jersey Economic Development Authority Rev., 5.00%, 7/1/23 (BAM) | 5,125,000 | | 5,450,540 | |
| New Jersey Economic Development Authority Rev., 5.00%, 6/15/24 | 4,015,000 | | 4,239,157 | |
| New Jersey Economic Development Authority Rev., 5.00%, 6/15/25 | 5,000,000 | | 5,270,500 | |
| New Jersey Economic Development Authority Rev., 5.00%, 6/15/26 | 5,000,000 | | 5,252,150 | |
| New Jersey Economic Development Authority Rev., 5.50%, 6/15/27 | 5,000,000 | | 5,523,100 | |
| New Jersey Economic Development Authority Rev., 5.00%, 7/1/27 (BAM) | 3,000,000 | | 3,338,910 | |
| New Jersey Economic Development Authority Rev., 5.00%, 7/1/28 (BAM) | 6,000,000 | | 6,654,600 | |
| New Jersey Economic Development Authority Rev., 5.00%, 6/15/31 | 4,790,000 | | 5,196,288 | |
| New Jersey Economic Development Authority Rev., 5.00%, 7/1/33 | 1,000,000 | | 1,051,870 | |
| New Jersey Economic Development Authority Rev., (Provident Group-Montclair Properties LLC), 5.00%, 6/1/24 (AGM) | 1,000,000 | | 1,144,590 | |
| New Jersey Economic Development Authority Rev., (Provident Group-Montclair Properties LLC), 5.00%, 6/1/25 (AGM) | 1,005,000 | | 1,180,543 | |
| New Jersey Economic Development Authority Rev., (Provident Group-Montclair Properties LLC), 5.00%, 6/1/26 (AGM) | 1,000,000 | | 1,200,100 | |
| New Jersey Economic Development Authority Rev., (Provident Group-Montclair Properties LLC), 5.00%, 6/1/27 (AGM) | 1,100,000 | | 1,348,336 | |
| New Jersey Economic Development Authority Rev., (State of New Jersey Department of the Treasury), 5.25%, 6/15/40 | 3,310,000 | | 3,427,538 | |
| New Jersey Educational Facilities Authority Rev., (College of Saint Elizabeth), 5.00%, 7/1/21 | 225,000 | | 226,098 | |
| New Jersey Educational Facilities Authority Rev., (College of Saint Elizabeth), 5.00%, 7/1/26 | 2,105,000 | | 2,153,752 | |
| New Jersey Educational Facilities Authority Rev., (New Jersey City University), 5.00%, 7/1/25 (AGM) | 2,360,000 | | 2,709,964 | |
| New Jersey Educational Facilities Authority Rev., (New Jersey City University), 5.00%, 7/1/26 (AGM) | 1,500,000 | | 1,747,485 | |
| New Jersey Educational Facilities Authority Rev., (New Jersey City University), 5.00%, 7/1/27 (AGM) | 2,575,000 | | 2,987,335 | |
| New Jersey Health Care Facilities Financing Authority Rev., (St. Joseph's Healthcare System Obligated Group), 5.00%, 7/1/25 | 1,750,000 | | 2,004,030 | |
| New Jersey Health Care Facilities Financing Authority Rev., (Trinitas Regional Medical Center Obligated Group), 5.00%, 7/1/26 | 1,500,000 | | 1,793,835 | |
| New Jersey Health Care Facilities Financing Authority Rev., (Trinitas Regional Medical Center Obligated Group), 5.00%, 7/1/27 | 1,500,000 | | 1,786,320 | |
| New Jersey Transportation Trust Fund Authority Rev., 5.00%, 6/15/20 | 4,200,000 | | 4,203,528 | |
| New Jersey Transportation Trust Fund Authority Rev., 5.00%, 6/15/21 | 3,000,000 | | 3,072,180 | |
| New Jersey Transportation Trust Fund Authority Rev., 5.25%, 12/15/21 (NATL) | 6,850,000 | | 7,038,033 | |
| New Jersey Transportation Trust Fund Authority Rev., 5.25%, 12/15/23 (Ambac) | 2,210,000 | | 2,336,235 | |
| | | | | | | | |
| Principal Amount | Value |
| New Jersey Transportation Trust Fund Authority Rev., 5.00%, 6/15/27 | $ | 2,000,000 | | $ | 2,184,500 | |
| New Jersey Transportation Trust Fund Authority Rev., 5.00%, 6/15/29 | 2,770,000 | | 3,019,549 | |
| New Jersey Transportation Trust Fund Authority Rev., 5.00%, 6/15/29 | 5,500,000 | | 5,694,480 | |
| New Jersey Transportation Trust Fund Authority Rev., 5.25%, 6/15/30 | 5,000,000 | | 5,071,600 | |
| New Jersey Transportation Trust Fund Authority Rev., 5.00%, 6/15/31 | 2,000,000 | | 2,142,600 | |
| New Jersey Transportation Trust Fund Authority Rev., 5.00%, 6/15/31 | 3,500,000 | | 3,770,655 | |
| New Jersey Transportation Trust Fund Authority Rev., 5.00%, 12/15/31 | 6,000,000 | | 6,482,940 | |
| New Jersey Transportation Trust Fund Authority Rev., 5.00%, 6/15/32 | 3,000,000 | | 3,206,370 | |
| New Jersey Transportation Trust Fund Authority Rev., 5.00%, 6/15/35 | 4,000,000 | | 4,200,720 | |
| New Jersey Transportation Trust Fund Authority Rev., 5.00%, 12/15/35 | 17,500,000 | | 18,339,475 | |
| New Jersey Transportation Trust Fund Authority Rev., 5.00%, 6/15/38 | 7,000,000 | | 7,150,920 | |
| New Jersey Transportation Trust Fund Authority Rev., 5.00%, 6/15/44 | 5,000,000 | | 5,062,000 | |
| New Jersey Turnpike Authority Rev., 5.00%, 1/1/27 | 5,200,000 | | 5,980,988 | |
| New Jersey Turnpike Authority Rev., 5.00%, 1/1/33 | 5,215,000 | | 5,876,158 | |
| South Jersey Port Corp. Rev., 5.00%, 1/1/27 | 1,030,000 | | 1,099,700 | |
| South Jersey Port Corp. Rev., 5.00%, 1/1/30 | 2,360,000 | | 2,503,016 | |
| South Jersey Port Corp. Rev., 5.00%, 1/1/31 | 1,670,000 | | 1,762,702 | |
| Tobacco Settlement Financing Corp. Rev., 5.00%, 6/1/29 | 2,775,000 | | 3,399,847 | |
| Tobacco Settlement Financing Corp. Rev., 5.00%, 6/1/30 | 3,000,000 | | 3,653,820 | |
| Tobacco Settlement Financing Corp. Rev., 5.00%, 6/1/31 | 3,000,000 | | 3,632,490 | |
| Tobacco Settlement Financing Corp. Rev., 5.00%, 6/1/32 | 4,630,000 | | 5,566,001 | |
| Tobacco Settlement Financing Corp. Rev., 5.00%, 6/1/33 | 5,005,000 | | 5,978,923 | |
| | 198,640,833 | |
| New Mexico — 0.4% | | |
| Farmington Rev., (Public Service Co. of New Mexico), VRN, 2.125%, 6/1/40 | 3,000,000 | | 2,997,210 | |
| New Mexico Hospital Equipment Loan Council Rev., (Haverland Carter Lifestyle Obligated Group), 2.25%, 7/1/23 | 1,425,000 | | 1,334,869 | |
| New Mexico Hospital Equipment Loan Council Rev., (Presbyterian Healthcare Services Obligated Group), 5.00%, 8/1/23 | 1,625,000 | | 1,831,407 | |
| New Mexico Hospital Equipment Loan Council Rev., (Presbyterian Healthcare Services Obligated Group), 5.00%, 8/1/26 | 1,000,000 | | 1,183,520 | |
| New Mexico Hospital Equipment Loan Council Rev., (Presbyterian Healthcare Services Obligated Group), VRDN, 0.05%, 6/1/20 (SBBPA: Wells Fargo Bank N.A.) | 8,400,000 | | 8,400,000 | |
| Santa Fe Rev., (El Castillo Retirement Residences Obligated Group), 2.25%, 5/15/24 | 600,000 | | 547,524 | |
| | 16,294,530 | |
| New York — 9.9% | | |
| Albany Capital Resource Corp. Rev., (Empire Commons Student Housing, Inc.), 5.00%, 5/1/28 | 400,000 | | 448,572 | |
| Albany Capital Resource Corp. Rev., (Empire Commons Student Housing, Inc.), 5.00%, 5/1/30 | 350,000 | | 389,270 | |
| Albany Capital Resource Corp. Rev., (Empire Commons Student Housing, Inc.), 5.00%, 5/1/31 | 350,000 | | 387,265 | |
| Brooklyn Arena Local Development Corp. Rev., (Brooklyn Events Center LLC), 4.00%, 7/15/29 (AGM) | 2,000,000 | | 2,175,440 | |
| | | | | | | | |
| Principal Amount | Value |
| Hempstead Town Local Development Corp. Rev., (Hofstra University), 5.00%, 7/1/24 | $ | 1,465,000 | | $ | 1,519,806 | |
| Hempstead Town Local Development Corp. Rev., (Hofstra University), 5.00%, 7/1/26 | 1,130,000 | | 1,168,070 | |
| Hempstead Town Local Development Corp. Rev., (Hofstra University), 5.00%, 7/1/27 | 1,320,000 | | 1,363,336 | |
| Hempstead Town Local Development Corp. Rev., (Molloy College), 5.00%, 7/1/21 | 430,000 | | 444,934 | |
| Hempstead Town Local Development Corp. Rev., (Molloy College), 5.00%, 7/1/22 | 1,365,000 | | 1,451,254 | |
| Hempstead Town Local Development Corp. Rev., (Molloy College), 5.00%, 7/1/24 | 1,500,000 | | 1,667,625 | |
| Hempstead Town Local Development Corp. Rev., (Molloy College), 5.00%, 7/1/26 | 830,000 | | 946,582 | |
| Hempstead Town Local Development Corp. Rev., (Molloy College), 5.00%, 7/1/28 | 1,825,000 | | 2,088,530 | |
| Hempstead Town Local Development Corp. Rev., (Molloy College), 5.00%, 7/1/31 | 900,000 | | 1,006,947 | |
| Long Island Power Authority Rev., 5.00%, 5/1/21 | 2,385,000 | | 2,482,284 | |
| Long Island Power Authority Rev., 5.00%, 9/1/34 | 11,410,000 | | 13,107,237 | |
| Long Island Power Authority Rev., 5.00%, 9/1/35 | 3,500,000 | | 4,015,935 | |
| Metropolitan Transportation Authority Rev., 4.00%, 2/1/22 | 20,000,000 | | 20,066,200 | |
| Metropolitan Transportation Authority Rev., 5.00%, 9/1/22 | 15,000,000 | | 15,409,350 | |
| Metropolitan Transportation Authority Rev., 5.00%, 11/15/31 | 9,710,000 | | 10,327,944 | |
| Metropolitan Transportation Authority Rev., 5.00%, 11/15/31 | 6,830,000 | | 7,436,777 | |
| Metropolitan Transportation Authority Rev., 5.00%, 11/15/50 | 3,000,000 | | 3,241,710 | |
| Metropolitan Transportation Authority Rev., VRN, 0.59%, (MUNIPSA plus 0.45%), 11/15/44 | 7,000,000 | | 6,683,740 | |
| Metropolitan Transportation Authority Rev., VRN, 5.00%, 11/15/45 | 5,000,000 | | 5,437,100 | |
| Nassau County Interim Finance Authority Rev., 5.00%, 11/15/21 | 120,000 | | 120,436 | |
| Nassau County Interim Finance Authority Rev., 5.00%, 11/15/23 | 100,000 | | 100,355 | |
| Nassau County Local Economic Assistance Corp. Rev., (Catholic Health Services of Long Island Obligated Group), 5.00%, 7/1/22 | 850,000 | | 917,124 | |
| New York City GO, 5.00%, 8/1/22 | 7,565,000 | | 8,330,805 | |
| New York City GO, 5.00%, 8/1/25 | 1,700,000 | | 2,012,477 | |
| New York City GO, 5.00%, 8/1/25 | 13,605,000 | | 16,480,009 | |
| New York City GO, 5.00%, 8/1/26 | 5,370,000 | | 6,343,581 | |
| New York City GO, 5.00%, 8/1/32 | 2,000,000 | | 2,533,800 | |
| New York City GO, 5.00%, 8/1/33 | 500,000 | | 628,855 | |
| New York City GO, 5.00%, 8/1/33 | 1,000,000 | | 1,257,710 | |
| New York City GO, 5.00%, 8/1/34 | 2,215,000 | | 2,774,509 | |
| New York City GO, VRDN, 0.06%, 6/1/20 (SBBPA: Barclays Bank plc) | 2,785,000 | | 2,785,000 | |
| New York City GO, VRDN, 0.06%, 6/1/20 (SBBPA: Barclays Bank plc) | 16,365,000 | | 16,365,000 | |
| New York City GO, VRDN, 0.07%, 6/1/20 (LOC: Bank of America N.A.) | 1,800,000 | | 1,800,000 | |
| New York City GO, VRDN, 0.07%, 6/1/20 (SBBPA: JPMorgan Chase Bank N.A.) | 2,770,000 | | 2,770,000 | |
| New York City Transitional Finance Authority Future Tax Secured Rev., 5.00%, 11/1/26 | 5,000,000 | | 5,987,550 | |
| New York City Transitional Finance Authority Future Tax Secured Rev., 5.00%, 5/1/28 | 10,000,000 | | 11,191,900 | |
| New York City Transitional Finance Authority Future Tax Secured Rev., 5.00%, 8/1/29 | 10,000,000 | | 11,973,100 | |
| New York City Transitional Finance Authority Future Tax Secured Rev., 5.00%, 11/1/35 | 12,500,000 | | 15,802,500 | |
| | | | | | | | |
| Principal Amount | Value |
| New York City Transitional Finance Authority Future Tax Secured Rev., 5.00%, 11/1/39 | $ | 4,200,000 | | $ | 4,272,870 | |
| New York City Transitional Finance Authority Future Tax Secured Rev., VRDN, 0.06%, 6/1/20 (SBBPA: Barclays Bank plc) | 3,185,000 | | 3,185,000 | |
| New York City Transitional Finance Authority Future Tax Secured Rev., VRDN, 0.06%, 6/1/20 (SBBPA: Barclays Bank plc) | 3,400,000 | | 3,400,000 | |
| New York City Transitional Finance Authority Future Tax Secured Rev., VRDN, 0.06%, 6/1/20 (SBBPA: Barclays Bank plc) | 750,000 | | 750,000 | |
| New York City Transitional Finance Authority Future Tax Secured Rev., VRDN, 0.07%, 6/1/20 (SBBPA: Bank of America N.A.) | 10,000,000 | | 10,000,000 | |
| New York City Water & Sewer System Rev., 5.00%, 6/15/30 | 10,000,000 | | 13,888,400 | |
| New York City Water & Sewer System Rev., 4.00%, 6/15/40 | 10,030,000 | | 11,857,466 | |
| New York City Water & Sewer System Rev., VRDN, 0.07%, 6/1/20 (SBBPA: JPMorgan Chase Bank N.A.) | 2,700,000 | | 2,700,000 | |
| New York City Water & Sewer System Rev., VRDN, 0.08%, 6/1/20 (SBBPA: State Street Bank & Trust Co.) | 12,520,000 | | 12,520,000 | |
New York Convention Center Development Corp. Rev., Capital Appreciation, 0.00%, 11/15/37(2) | 3,000,000 | | 1,578,630 | |
| New York Liberty Development Corp. Rev., (Goldman Sachs Headquarters LLC), 5.25%, 10/1/35 | 9,795,000 | | 12,875,430 | |
New York State Dormitory Authority Rev., (Orange Regional Medical Center Obligated Group), 4.00%, 12/1/20(1) | 800,000 | | 809,232 | |
New York State Dormitory Authority Rev., (Orange Regional Medical Center Obligated Group), 4.00%, 12/1/21(1) | 1,100,000 | | 1,137,642 | |
New York State Dormitory Authority Rev., (Orange Regional Medical Center Obligated Group), 5.00%, 12/1/22(1) | 900,000 | | 971,766 | |
New York State Dormitory Authority Rev., (Orange Regional Medical Center Obligated Group), 5.00%, 12/1/24(1) | 2,600,000 | | 2,948,894 | |
New York State Dormitory Authority Rev., (Orange Regional Medical Center Obligated Group), 5.00%, 12/1/25(1) | 1,300,000 | | 1,503,151 | |
| New York State Dormitory Authority Rev., (State of New York Personal Income Tax Rev.), 5.00%, 2/15/34 | 4,005,000 | | 5,186,555 | |
| New York State Dormitory Authority Rev., (State of New York Personal Income Tax Rev.), 5.00%, 2/15/35 | 4,155,000 | | 5,373,329 | |
| New York State Dormitory Authority Rev., (State of New York Personal Income Tax Rev.), 5.00%, 3/15/36 | 10,000,000 | | 12,567,400 | |
| New York State Environmental Facilities Corp. Rev., (New York City Municipal Water Finance Authority), 5.00%, 6/15/32 | 3,000,000 | | 3,968,610 | |
| New York State Thruway Authority Rev., 5.00%, 1/1/28 | 5,000,000 | | 5,802,500 | |
| New York State Thruway Authority Rev., 5.00%, 1/1/29 | 10,000,000 | | 11,580,900 | |
| New York State Thruway Authority Rev., 4.00%, 1/1/37 | 4,980,000 | | 5,521,525 | |
| New York State Thruway Authority Rev., 4.00%, 1/1/38 | 3,000,000 | | 3,311,730 | |
| Oneida County Local Development Corp. Rev., (Utica College), 4.00%, 7/1/39 | 750,000 | | 717,427 | |
| Port Authority of New York & New Jersey Rev., 5.00%, 9/1/34 | 5,000,000 | | 6,242,100 | |
| Tompkins County Development Corp. Rev., (Kendal at Ithaca, Inc.), 4.00%, 7/1/29 | 500,000 | | 493,245 | |
| Tompkins County Development Corp. Rev., (Kendal at Ithaca, Inc.), 5.00%, 7/1/29 | 730,000 | | 759,163 | |
| Tompkins County Development Corp. Rev., (Kendal at Ithaca, Inc.), 5.00%, 7/1/34 | 1,000,000 | | 1,024,030 | |
| Tompkins County Development Corp. Rev., (Kendal at Ithaca, Inc.), 5.00%, 7/1/44 | 1,010,000 | | 1,019,231 | |
| Triborough Bridge & Tunnel Authority Rev., 5.00%, 11/15/27 | 3,000,000 | | 3,814,020 | |
| Triborough Bridge & Tunnel Authority Rev., 5.00%, 11/15/28 | 2,500,000 | | 3,245,175 | |
| Triborough Bridge & Tunnel Authority Rev., 5.00%, 11/15/29 | 700,000 | | 829,479 | |
| Triborough Bridge & Tunnel Authority Rev., 5.00%, 11/15/30 | 3,030,000 | | 3,364,694 | |
Troy Capital Resource Corp. Rev., (Rensselaer Polytechnic Institute), 5.00%, 9/1/34(4) | 1,875,000 | | 2,258,925 | |
| | | | | | | | |
| Principal Amount | Value |
Troy Capital Resource Corp. Rev., (Rensselaer Polytechnic Institute), 5.00%, 9/1/36(4) | $ | 2,755,000 | | $ | 3,286,522 | |
Troy Capital Resource Corp. Rev., (Rensselaer Polytechnic Institute), 5.00%, 9/1/37(4) | 1,500,000 | | 1,782,660 | |
Troy Capital Resource Corp. Rev., (Rensselaer Polytechnic Institute), 5.00%, 9/1/38(4) | 1,300,000 | | 1,539,694 | |
| TSASC, Inc. Rev., 5.00%, 6/1/20 | 2,000,000 | | 2,000,000 | |
| TSASC, Inc. Rev., 5.00%, 6/1/21 | 2,000,000 | | 2,064,780 | |
| TSASC, Inc. Rev., 5.00%, 6/1/22 | 1,000,000 | | 1,063,610 | |
| TSASC, Inc. Rev., 5.00%, 6/1/23 | 2,000,000 | | 2,185,500 | |
| Westchester County Local Development Corp. Rev., (Pace University), 5.50%, 5/1/42 | 3,345,000 | | 3,609,322 | |
| Westchester Tobacco Asset Securitization Rev., 5.00%, 6/1/20 | 500,000 | | 500,000 | |
| Westchester Tobacco Asset Securitization Rev., 5.00%, 6/1/21 | 500,000 | | 512,165 | |
| Westchester Tobacco Asset Securitization Rev., 5.00%, 6/1/22 | 1,935,000 | | 2,024,649 | |
| Westchester Tobacco Asset Securitization Rev., 5.00%, 6/1/23 | 2,000,000 | | 2,133,380 | |
| | 397,621,420 | |
| North Carolina — 1.3% | | |
| Charlotte-Mecklenburg Hospital Authority Rev., (Carolinas Healthcare System Obligated Group), 5.00%, 1/15/28 | 1,000,000 | | 1,260,580 | |
| Charlotte-Mecklenburg Hospital Authority Rev., (Carolinas Healthcare System Obligated Group), 5.00%, 1/15/29 | 1,500,000 | | 1,926,885 | |
| Charlotte-Mecklenburg Hospital Authority Rev., (Carolinas Healthcare System Obligated Group), 5.00%, 1/15/30 | 1,340,000 | | 1,715,950 | |
| Greensboro Combined Water & Sewer System Rev., 5.25%, 6/1/20 | 2,060,000 | | 2,060,000 | |
| North Carolina Capital Facilities Finance Agency Rev., (Meredith College), 4.00%, 6/1/34 | 1,000,000 | | 1,013,180 | |
| North Carolina Medical Care Commission Rev., (Deerfield Episcopal Retirement Community, Inc.), 5.00%, 11/1/37 | 1,750,000 | | 1,905,872 | |
| North Carolina Medical Care Commission Rev., (Pines at Davidson, Inc. Obligated Group), 5.00%, 1/1/34 | 1,000,000 | | 1,039,460 | |
| North Carolina Medical Care Commission Rev., (Presbyterian Home at Charlotte, Inc.), 3.00%, 7/1/26 | 590,000 | | 561,179 | |
| North Carolina Medical Care Commission Rev., (Presbyterian Home at Charlotte, Inc.), 4.00%, 7/1/28 | 1,815,000 | | 1,809,991 | |
| North Carolina Medical Care Commission Rev., (Presbyterian Home at Charlotte, Inc.), 4.00%, 7/1/30 | 1,035,000 | | 1,021,452 | |
| North Carolina Medical Care Commission Rev., (Presbyterian Home at Charlotte, Inc.), 5.00%, 7/1/31 | 1,075,000 | | 1,141,005 | |
| North Carolina Medical Care Commission Rev., (Presbyterian Home at Charlotte, Inc.), 5.00%, 7/1/32 | 1,115,000 | | 1,177,418 | |
| North Carolina Medical Care Commission Rev., (Presbyterian Home at Charlotte, Inc.), 5.00%, 7/1/34 | 1,230,000 | | 1,280,036 | |
| North Carolina Medical Care Commission Rev., (United Methodist Retirement Homes, Inc. Obligated Group), 5.00%, 10/1/35 | 5,000,000 | | 5,023,900 | |
| North Carolina Medical Care Commission Rev., (United Methodist Retirement Homes, Inc. Obligated Group), 5.00%, 10/1/37 | 2,100,000 | | 2,095,023 | |
| North Carolina Medical Care Commission Rev., (Wake Forest Baptist Obligated Group), VRN, 2.20%, 12/1/48 | 5,000,000 | | 5,073,300 | |
| North Carolina Turnpike Authority Rev., 5.00%, 1/1/21 | 790,000 | | 810,722 | |
| North Carolina Turnpike Authority Rev., 5.00%, 1/1/22 | 700,000 | | 749,525 | |
| Raleigh Durham Airport Authority Rev., 5.00%, 5/1/21 | 360,000 | | 373,975 | |
| Raleigh Durham Airport Authority Rev., 5.00%, 5/1/22 | 760,000 | | 820,952 | |
| State of North Carolina Rev., 5.00%, 3/1/34 | 15,000,000 | | 19,342,500 | |
| | 52,202,905 | |
| Ohio — 2.5% | | |
| Buckeye Tobacco Settlement Financing Authority Rev., 5.00%, 6/1/35 | 1,000,000 | | 1,239,740 | |
| | | | | | | | |
| Principal Amount | Value |
| Buckeye Tobacco Settlement Financing Authority Rev., 5.00%, 6/1/36 | $ | 2,000,000 | | $ | 2,467,320 | |
| Buckeye Tobacco Settlement Financing Authority Rev., 4.00%, 6/1/38 | 1,000,000 | | 1,120,560 | |
| Buckeye Tobacco Settlement Financing Authority Rev., 4.00%, 6/1/39 | 1,000,000 | | 1,116,970 | |
| Buckeye Tobacco Settlement Financing Authority Rev., 4.00%, 6/1/48 | 6,000,000 | | 6,349,920 | |
| Cleveland Rev., 5.00%, 5/15/21 | 1,475,000 | | 1,542,643 | |
| Cleveland Rev., 5.00%, 5/15/23 | 1,305,000 | | 1,478,056 | |
Cleveland Airport System Rev., 5.00%, 1/1/22, Prerefunded at 100% of Par (AGM)(3) | 4,000,000 | | 4,304,800 | |
Cleveland Airport System Rev., 5.00%, 1/1/22, Prerefunded at 100% of Par (AGM)(3) | 3,560,000 | | 3,831,272 | |
Cleveland Airport System Rev., 5.00%, 1/1/22, Prerefunded at 100% of Par(3) | 2,500,000 | | 2,690,500 | |
Cleveland Airport System Rev., 5.00%, 1/1/22, Prerefunded at 100% of Par(3) | 2,530,000 | | 2,722,786 | |
| Cleveland Airport System Rev., 5.00%, 1/1/22 (AGM) | 1,635,000 | | 1,735,683 | |
| Cleveland Airport System Rev., 5.00%, 1/1/23 (AGM) | 1,510,000 | | 1,652,574 | |
| Cleveland Airport System Rev., 5.00%, 1/1/24 (AGM) | 1,075,000 | | 1,210,579 | |
| Cleveland Airport System Rev., 5.00%, 1/1/31 (AGM) | 750,000 | | 851,438 | |
| Cleveland-Cuyahoga County Port Authority Rev., (Euclid Avenue Development Corp.), 5.00%, 8/1/39 | 5,000,000 | | 5,287,300 | |
| Cleveland-Cuyahoga County Port Authority Rev., (Playhouse Square Foundation), 5.00%, 12/1/28 | 1,250,000 | | 1,272,438 | |
| Cleveland-Cuyahoga County Port Authority Rev., (Playhouse Square Foundation), 5.00%, 12/1/33 | 1,625,000 | | 1,624,919 | |
| Cuyahoga County Rev., (MetroHealth System), 5.00%, 2/15/23 | 1,500,000 | | 1,626,585 | |
| Cuyahoga County Rev., (MetroHealth System), 5.00%, 2/15/24 | 1,750,000 | | 1,945,912 | |
| Cuyahoga County Rev., (MetroHealth System), 5.00%, 2/15/25 | 1,350,000 | | 1,534,491 | |
| Cuyahoga County Rev., (MetroHealth System), 5.00%, 2/15/26 | 2,000,000 | | 2,308,700 | |
| Cuyahoga County Rev., (MetroHealth System), 5.00%, 2/15/27 | 1,600,000 | | 1,877,056 | |
| Cuyahoga County Rev., (MetroHealth System), 5.00%, 2/15/28 | 1,750,000 | | 1,964,462 | |
| Kent State University Rev., 4.00%, 5/1/23 | 1,800,000 | | 1,964,484 | |
| Miami University/Oxford Rev., 5.00%, 9/1/25 | 4,440,000 | | 4,698,541 | |
| Northeast Ohio Regional Sewer District Rev., 4.00%, 11/15/36 | 2,000,000 | | 2,412,120 | |
| Ohio Higher Educational Facility Commission Rev., (Case Western Reserve University), 6.50%, 10/1/20 | 145,000 | | 147,617 | |
| Ohio Higher Educational Facility Commission Rev., (Otterbein University), 5.00%, 12/1/21 | 1,055,000 | | 1,103,847 | |
| Ohio Higher Educational Facility Commission Rev., (Otterbein University), 5.00%, 12/1/22 | 1,090,000 | | 1,166,682 | |
| Ohio Higher Educational Facility Commission Rev., (Otterbein University), 5.00%, 12/1/23 | 1,170,000 | | 1,277,570 | |
| Ohio Higher Educational Facility Commission Rev., (Otterbein University), 5.00%, 12/1/24 | 1,230,000 | | 1,363,640 | |
| Ohio Higher Educational Facility Commission Rev., (Otterbein University), 5.00%, 12/1/25 | 1,290,000 | | 1,446,567 | |
| Ohio Higher Educational Facility Commission Rev., (Otterbein University), 5.00%, 12/1/28 | 1,505,000 | | 1,683,102 | |
| Ohio Water Development Authority Water Pollution Control Loan Fund Rev., 5.00%, 6/1/29 | 20,000,000 | | 27,082,600 | |
| State of Ohio Rev., 5.00%, 12/15/22 | 2,500,000 | | 2,796,900 | |
| | 100,900,374 | |
| Oklahoma — 0.5% | | |
| Oklahoma Development Finance Authority Rev., (INTEGRIS Health Obligated Group), 5.00%, 8/15/25 | 1,500,000 | | 1,729,440 | |
| | | | | | | | |
| Principal Amount | Value |
| Oklahoma Development Finance Authority Rev., (INTEGRIS Health Obligated Group), 5.00%, 8/15/26 | $ | 1,000,000 | | $ | 1,141,370 | |
| Oklahoma Development Finance Authority Rev., (INTEGRIS Health Obligated Group), 5.00%, 8/15/27 | 1,000,000 | | 1,134,220 | |
| Tulsa Airports Improvement Trust Rev., 5.00%, 6/1/21 | 950,000 | | 989,263 | |
| Tulsa Airports Improvement Trust Rev., 5.00%, 6/1/22 | 1,000,000 | | 1,068,970 | |
| Tulsa Airports Improvement Trust Rev., 5.00%, 6/1/23 | 1,025,000 | | 1,128,648 | |
| Tulsa Airports Improvement Trust Rev., 5.00%, 6/1/24 | 1,050,000 | | 1,188,222 | |
| Tulsa Airports Improvement Trust Rev., 5.00%, 6/1/25 | 1,085,000 | | 1,257,450 | |
| Tulsa Airports Improvement Trust Rev., 5.00%, 6/1/26 | 1,030,000 | | 1,219,232 | |
| Tulsa Airports Improvement Trust Rev., 5.00%, 6/1/27 | 1,005,000 | | 1,213,397 | |
| Tulsa County Industrial Authority Rev., (Montereau, Inc.), 5.00%, 11/15/23 | 250,000 | | 256,038 | |
| Tulsa County Industrial Authority Rev., (Montereau, Inc.), 5.00%, 11/15/24 | 1,665,000 | | 1,713,102 | |
| Tulsa County Industrial Authority Rev., (Montereau, Inc.), 5.00%, 11/15/26 | 500,000 | | 516,965 | |
| Tulsa County Industrial Authority Rev., (Montereau, Inc.), 5.00%, 11/15/28 | 600,000 | | 617,274 | |
| Tulsa County Industrial Authority Rev., (Montereau, Inc.), 5.00%, 11/15/29 | 1,000,000 | | 1,023,710 | |
| Tulsa Industrial Authority Rev., (University of Tulsa), 5.00%, 10/1/22 | 1,270,000 | | 1,353,210 | |
| Tulsa Industrial Authority Rev., (University of Tulsa), 5.00%, 10/1/24 | 1,000,000 | | 1,106,770 | |
| | 18,657,281 | |
| Oregon — 0.4% | | |
| Clackamas County Hospital Facility Authority Rev., (Willamette View, Inc.), 5.00%, 11/15/32 | 500,000 | | 523,080 | |
| Clackamas County Hospital Facility Authority Rev., (Willamette View, Inc.), 5.00%, 11/15/37 | 500,000 | | 512,805 | |
| Clackamas County Hospital Facility Authority Rev., (Willamette View, Inc.), 5.00%, 11/15/47 | 3,900,000 | | 3,911,934 | |
| Forest Grove Rev., (Oak Tree Foundation, Inc.), 5.00%, 3/1/22 | 1,040,000 | | 1,063,317 | |
| Forest Grove Rev., (Oak Tree Foundation, Inc.), 5.00%, 3/1/23 | 350,000 | | 358,631 | |
| Forest Grove Rev., (Oak Tree Foundation, Inc.), 5.00%, 3/1/24 | 250,000 | | 257,375 | |
| Forest Grove Rev., (Oak Tree Foundation, Inc.), 5.00%, 3/1/25 | 200,000 | | 206,114 | |
| Klamath Falls Intercommunity Hospital Authority Rev., (Sky Lakes Medical Center, Inc.), 4.00%, 9/1/22 | 325,000 | | 345,423 | |
| Klamath Falls Intercommunity Hospital Authority Rev., (Sky Lakes Medical Center, Inc.), 4.00%, 9/1/23 | 600,000 | | 652,872 | |
| Klamath Falls Intercommunity Hospital Authority Rev., (Sky Lakes Medical Center, Inc.), 4.00%, 9/1/24 | 475,000 | | 527,791 | |
| Klamath Falls Intercommunity Hospital Authority Rev., (Sky Lakes Medical Center, Inc.), 4.00%, 9/1/25 | 275,000 | | 309,513 | |
| Klamath Falls Intercommunity Hospital Authority Rev., (Sky Lakes Medical Center, Inc.), 4.00%, 9/1/26 | 240,000 | | 273,818 | |
| Klamath Falls Intercommunity Hospital Authority Rev., (Sky Lakes Medical Center, Inc.), 5.00%, 9/1/27 | 200,000 | | 237,736 | |
| Klamath Falls Intercommunity Hospital Authority Rev., (Sky Lakes Medical Center, Inc.), 5.00%, 9/1/28 | 265,000 | | 313,951 | |
| Klamath Falls Intercommunity Hospital Authority Rev., (Sky Lakes Medical Center, Inc.), 5.00%, 9/1/29 | 235,000 | | 277,227 | |
| Klamath Falls Intercommunity Hospital Authority Rev., (Sky Lakes Medical Center, Inc.), 5.00%, 9/1/30 | 200,000 | | 234,798 | |
| State of Oregon GO, 5.00%, 8/1/20 | 1,000,000 | | 1,008,090 | |
| State of Oregon GO, 5.00%, 5/1/21 | 1,500,000 | | 1,567,410 | |
| State of Oregon GO, 5.00%, 8/1/24 | 1,000,000 | | 1,192,340 | |
Warm Springs Reservation Confederated Tribe Rev., 5.00%, 11/1/32(1) | 500,000 | | 620,565 | |
| | | | | | | | |
| Principal Amount | Value |
Warm Springs Reservation Confederated Tribe Rev., 5.00%, 11/1/33(1) | $ | 500,000 | | $ | 615,125 | |
Warm Springs Reservation Confederated Tribe Rev., 5.00%, 11/1/34(1) | 500,000 | | 610,985 | |
Warm Springs Reservation Confederated Tribe Rev., 5.00%, 11/1/36(1) | 600,000 | | 724,722 | |
Warm Springs Reservation Confederated Tribe Rev., 5.00%, 11/1/39(1) | 800,000 | | 957,840 | |
| | 17,303,462 | |
| Pennsylvania — 7.8% | | |
| Allegheny County Higher Education Building Authority Rev., 4.00%, 3/1/33 | 400,000 | | 423,376 | |
| Allegheny County Higher Education Building Authority Rev., (Duquesne University of the Holy Spirit), 4.00%, 3/1/30 | 1,230,000 | | 1,324,304 | |
| Allegheny County Higher Education Building Authority Rev., (Duquesne University of the Holy Spirit), 4.00%, 3/1/31 | 2,000,000 | | 2,143,520 | |
| Allegheny County Higher Education Building Authority Rev., (Duquesne University of the Holy Spirit), 4.00%, 3/1/32 | 600,000 | | 639,720 | |
| Allegheny County Higher Education Building Authority Rev., (Robert Morris University), 5.00%, 10/15/47 | 1,625,000 | | 1,627,876 | |
| Allegheny County Hospital Development Authority Rev., (UPMC Obligated Group), 5.00%, 7/15/31 | 1,355,000 | | 1,654,319 | |
| Allegheny County Hospital Development Authority Rev., (UPMC Obligated Group), 5.00%, 7/15/32 | 1,500,000 | | 1,817,235 | |
| Allegheny County Hospital Development Authority Rev., (UPMC Obligated Group), 5.00%, 7/15/33 | 1,800,000 | | 2,165,634 | |
| Allegheny County Hospital Development Authority Rev., (UPMC Obligated Group), 5.00%, 7/15/34 | 1,250,000 | | 1,499,963 | |
| Berks County Municipal Authority Rev., (Tower Health Obligated Group), VRN, 5.00%, 2/1/40 | 5,000,000 | | 5,530,300 | |
| Capital Region Water Rev., 5.00%, 7/15/24 (BAM) | 750,000 | | 880,403 | |
| Capital Region Water Rev., 5.00%, 7/15/29 (BAM) | 400,000 | | 495,580 | |
| Coatesville School District GO, 4.00%, 8/1/20 (AGM) | 250,000 | | 251,435 | |
| Coatesville School District GO, 5.00%, 8/1/21 (AGM) | 1,000,000 | | 1,052,030 | |
| Coatesville School District GO, 5.00%, 8/1/22 (AGM) | 875,000 | | 955,596 | |
| Coatesville School District GO, 5.00%, 8/1/24 (AGM) | 1,000,000 | | 1,169,700 | |
| Commonwealth Financing Authority Rev., 5.00%, 6/1/30 | 2,500,000 | | 3,068,600 | |
| Commonwealth Financing Authority Rev., 5.00%, 6/1/31 | 2,000,000 | | 2,436,840 | |
| Commonwealth Financing Authority Rev., 5.00%, 6/1/32 | 2,000,000 | | 2,416,360 | |
| Crawford County Industrial Development Authority Rev., (Allegheny College), 5.00%, 5/1/28 | 1,370,000 | | 1,545,045 | |
| Crawford County Industrial Development Authority Rev., (Allegheny College), 5.00%, 5/1/29 | 1,440,000 | | 1,617,898 | |
| Crawford County Industrial Development Authority Rev., (Allegheny College), 5.00%, 5/1/30 | 1,510,000 | | 1,688,875 | |
| Crawford County Industrial Development Authority Rev., (Allegheny College), 5.00%, 5/1/31 | 1,465,000 | | 1,631,043 | |
| Cumberland County Municipal Authority Rev., (Dickinson College), 5.00%, 5/1/28 | 1,000,000 | | 1,221,990 | |
| Cumberland County Municipal Authority Rev., (Dickinson College), 5.00%, 5/1/29 | 1,420,000 | | 1,728,623 | |
| Dauphin County General Authority Rev., (UPMC Obligated Group), 5.00%, 6/1/24 | 525,000 | | 603,120 | |
| Dauphin County General Authority Rev., (UPMC Obligated Group), 5.00%, 6/1/25 | 750,000 | | 883,785 | |
| Dauphin County General Authority Rev., (UPMC Obligated Group), 5.00%, 6/1/26 | 650,000 | | 781,716 | |
| Erie Higher Education Building Authority Rev., (Gannon University), 5.00%, 5/1/27 | 1,040,000 | | 1,100,434 | |
| | | | | | | | |
| Principal Amount | Value |
| Erie Higher Education Building Authority Rev., (Gannon University), 5.00%, 5/1/28 | $ | 1,095,000 | | $ | 1,154,108 | |
| Erie Higher Education Building Authority Rev., (Gannon University), 5.00%, 5/1/29 | 1,150,000 | | 1,206,902 | |
| Erie Higher Education Building Authority Rev., (Gannon University), 5.00%, 5/1/30 | 1,205,000 | | 1,256,755 | |
| Erie Higher Education Building Authority Rev., (Gannon University), 5.00%, 5/1/31 | 1,265,000 | | 1,312,513 | |
| General Authority of Southcentral Pennsylvania Rev., (WellSpan Health Obligated Group), 5.00%, 6/1/44 | 5,000,000 | | 5,516,000 | |
| General Authority of Southcentral Pennsylvania Rev., (WellSpan Health Obligated Group), VRN, 0.74%, (MUNIPSA plus 0.60%), 6/1/49 | 6,750,000 | | 6,638,355 | |
| Hospitals & Higher Education Facilities Authority of Philadelphia Rev., (Temple University Health System Obligated Group), 5.00%, 7/1/29 | 2,000,000 | | 2,244,280 | |
| Hospitals & Higher Education Facilities Authority of Philadelphia Rev., (Temple University Health System Obligated Group), 5.00%, 7/1/30 | 2,500,000 | | 2,790,400 | |
| Hospitals & Higher Education Facilities Authority of Philadelphia Rev., (Temple University Health System Obligated Group), 5.00%, 7/1/32 | 1,000,000 | | 1,103,230 | |
| Hospitals & Higher Education Facilities Authority of Philadelphia Rev., (Temple University Health System Obligated Group), 5.00%, 7/1/33 | 1,300,000 | | 1,424,423 | |
| Lehigh County Rev., (Lehigh Valley Health Network Obligated Group), 5.00%, 7/1/26 | 1,800,000 | | 2,152,602 | |
| Lehigh County Rev., (Lehigh Valley Health Network Obligated Group), 5.00%, 7/1/28 | 3,250,000 | | 4,017,260 | |
| Luzerne County GO, 5.00%, 12/15/21 (AGM) | 1,200,000 | | 1,283,484 | |
| Luzerne County GO, 5.00%, 12/15/24 (AGM) | 1,100,000 | | 1,300,101 | |
| Luzerne County GO, 5.00%, 12/15/25 (AGM) | 1,000,000 | | 1,214,270 | |
| Luzerne County GO, 5.00%, 12/15/27 (AGM) | 900,000 | | 1,147,221 | |
| Luzerne County Industrial Development Authority Rev., 5.00%, 12/15/27 (AGM) | 1,000,000 | | 1,209,480 | |
| Monroe County Hospital Authority Rev., (Lehigh Valley Health Network Obligated Group), 5.00%, 7/1/21 | 700,000 | | 732,886 | |
| Monroe County Hospital Authority Rev., (Lehigh Valley Health Network Obligated Group), 5.00%, 7/1/24 | 530,000 | | 610,518 | |
| Montgomery County Higher Education & Health Authority Rev., (Thomas Jefferson University Obligated Group), VRN, 0.86%, (MUNIPSA plus 0.72%), 9/1/51 | 10,000,000 | | 10,000,100 | |
| Northampton County General Purpose Authority Rev., (St. Luke's Hospital Obligated Group), VRN, 1.30%, (70% of the 1-month LIBOR plus 1.04%), 8/15/48 | 3,000,000 | | 2,969,430 | |
| Pennsylvania COP, 5.00%, 7/1/29 | 600,000 | | 769,062 | |
| Pennsylvania COP, 5.00%, 7/1/30 | 750,000 | | 955,725 | |
| Pennsylvania COP, 5.00%, 7/1/31 | 850,000 | | 1,076,746 | |
| Pennsylvania COP, 5.00%, 7/1/35 | 450,000 | | 559,125 | |
| Pennsylvania GO, 5.00%, 2/1/25 (AGM) | 6,035,000 | | 7,310,135 | |
| Pennsylvania GO, 5.00%, 3/15/25 | 12,005,000 | | 14,504,921 | |
| Pennsylvania GO, 5.00%, 9/15/25 (AGM-CR) | 5,000,000 | | 6,175,650 | |
| Pennsylvania Higher Educational Facilities Authority Rev., (Drexel University), 5.00%, 5/1/24 | 470,000 | | 522,598 | |
| Pennsylvania Higher Educational Facilities Authority Rev., (Drexel University), 5.00%, 5/1/25 | 700,000 | | 792,421 | |
| Pennsylvania Higher Educational Facilities Authority Rev., (Drexel University), 5.00%, 5/1/26 | 675,000 | | 778,511 | |
| Pennsylvania Higher Educational Facilities Authority Rev., (Drexel University), 5.00%, 5/1/27 | 750,000 | | 861,233 | |
| | | | | | | | |
| Principal Amount | Value |
| Pennsylvania Higher Educational Facilities Authority Rev., (Temple University of The Commonwealth System of Higher Education), 5.00%, 4/1/25 | $ | 1,000,000 | | $ | 1,077,740 | |
| Pennsylvania Higher Educational Facilities Authority Rev., (Temple University of The Commonwealth System of Higher Education), 5.00%, 4/1/26 | 1,000,000 | | 1,076,980 | |
| Pennsylvania Higher Educational Facilities Authority Rev., (Temple University of The Commonwealth System of Higher Education), 5.00%, 4/1/27 | 1,250,000 | | 1,334,875 | |
| Pennsylvania Higher Educational Facilities Authority Rev., (University of Pennsylvania Health System Obligated Group), 5.00%, 8/15/20 | 1,600,000 | | 1,614,336 | |
Pennsylvania Turnpike Commission Rev., 5.00%, 12/1/24, Prerefunded at 100% of Par(3) | 945,000 | | 1,135,276 | |
| Pennsylvania Turnpike Commission Rev., 5.00%, 12/1/24 | 4,000,000 | | 4,645,480 | |
| Pennsylvania Turnpike Commission Rev., 5.00%, 12/1/25 | 3,900,000 | | 4,639,167 | |
| Pennsylvania Turnpike Commission Rev., 5.00%, 12/1/26 | 1,850,000 | | 2,204,774 | |
| Pennsylvania Turnpike Commission Rev., 5.00%, 12/1/28 | 1,000,000 | | 1,186,880 | |
| Pennsylvania Turnpike Commission Rev., 5.00%, 12/1/32 | 6,505,000 | | 7,359,887 | |
| Pennsylvania Turnpike Commission Rev., 5.25%, 12/1/39 | 5,000,000 | | 5,630,250 | |
| Pennsylvania Turnpike Commission Rev., Capital Appreciation, VRN, 0.00%, 12/1/44 | 2,000,000 | | 2,160,300 | |
| Pennsylvania Turnpike Commission Rev., VRN, 0.74%, (MUNIPSA plus 0.60%), 12/1/23 | 5,000,000 | | 4,899,650 | |
| Pennsylvania Turnpike Commission Rev., VRN, 0.84%, (MUNIPSA plus 0.70%), 12/1/23 | 10,000,000 | | 9,821,800 | |
| Philadelphia GO, 5.00%, 8/1/20 | 2,500,000 | | 2,517,875 | |
| Philadelphia GO, 5.00%, 8/1/21 | 3,000,000 | | 3,151,050 | |
| Philadelphia GO, 5.00%, 8/1/22 | 2,500,000 | | 2,729,700 | |
| Philadelphia Authority for Industrial Development Rev., (Philadelphia), 5.00%, 12/1/24 (AGM) | 1,305,000 | | 1,553,341 | |
| Philadelphia Authority for Industrial Development Rev., (Philadelphia), 5.00%, 12/1/27 (AGM) | 1,000,000 | | 1,268,320 | |
| Philadelphia Authority for Industrial Development Rev., (Philadelphia), 5.00%, 12/1/29 (AGM) | 1,465,000 | | 1,855,056 | |
| Philadelphia Authority for Industrial Development Rev., (Philadelphia), 5.00%, 12/1/30 (AGM) | 2,960,000 | | 3,730,162 | |
| Philadelphia Authority for Industrial Development Rev., (Philadelphia), 5.00%, 12/1/31 (AGM) | 1,610,000 | | 2,013,305 | |
| Philadelphia Authority for Industrial Development Rev., (Philadelphia), 5.00%, 12/1/32 (AGM) | 1,800,000 | | 2,236,392 | |
| Philadelphia Municipal Authority Rev., 5.00%, 4/1/21 | 1,000,000 | | 1,036,990 | |
| Philadelphia Municipal Authority Rev., 5.00%, 4/1/22 | 715,000 | | 773,144 | |
| Philadelphia Municipal Authority Rev., 5.00%, 4/1/23 | 1,260,000 | | 1,415,572 | |
| Philadelphia Municipal Authority Rev., 5.00%, 4/1/24 | 1,500,000 | | 1,739,295 | |
| Philadelphia Municipal Authority Rev., 5.00%, 4/1/25 | 1,700,000 | | 2,032,656 | |
| Philadelphia Municipal Authority Rev., 5.00%, 4/1/26 | 1,750,000 | | 2,149,070 | |
| Pittsburgh GO, 5.00%, 9/1/25 | 3,000,000 | | 3,305,670 | |
| Pittsburgh GO, 5.00%, 9/1/26 | 1,000,000 | | 1,100,710 | |
| Pittsburgh Water & Sewer Authority Rev., 5.00%, 9/1/30 (AGM) | 745,000 | | 995,849 | |
| Pittsburgh Water & Sewer Authority Rev., 5.00%, 9/1/31 (AGM) | 1,000,000 | | 1,322,010 | |
| Pittsburgh Water & Sewer Authority Rev., 5.00%, 9/1/32 (AGM) | 550,000 | | 720,924 | |
| Pittsburgh Water & Sewer Authority Rev., 5.00%, 9/1/32 (AGM) | 1,000,000 | | 1,385,580 | |
| Pittsburgh Water & Sewer Authority Rev., 5.00%, 9/1/33 (AGM) | 750,000 | | 977,303 | |
| Pittsburgh Water & Sewer Authority Rev., 5.00%, 9/1/33 (AGM) | 1,000,000 | | 1,402,840 | |
| Pittsburgh Water & Sewer Authority Rev., 5.00%, 9/1/34 (AGM) | 1,000,000 | | 1,298,290 | |
| | | | | | | | |
| Principal Amount | Value |
| Pittsburgh Water & Sewer Authority Rev., VRN, 0.95%, (70% of the 1-month LIBOR plus 0.64%), 9/1/40 (AGM) | $ | 5,000,000 | | $ | 4,975,750 | |
| Reading GO, 4.00%, 11/1/20 (BAM) | 1,170,000 | | 1,186,169 | |
| Reading GO, 5.00%, 11/1/22 (BAM) | 425,000 | | 468,682 | |
| Reading GO, 5.00%, 11/1/23 (BAM) | 1,345,000 | | 1,534,591 | |
| Reading GO, 5.00%, 11/1/25 (BAM) | 1,225,000 | | 1,482,973 | |
| Reading GO, 5.00%, 11/1/25 (BAM) | 1,760,000 | | 2,130,638 | |
| Reading GO, 5.00%, 11/1/26 (BAM) | 1,555,000 | | 1,929,304 | |
| Reading GO, 5.00%, 11/1/27 (BAM) | 1,630,000 | | 2,071,714 | |
| Reading GO, 5.00%, 11/1/28 (BAM) | 1,000,000 | | 1,267,420 | |
| Reading GO, 5.00%, 11/1/29 (BAM) | 1,795,000 | | 2,267,731 | |
| Reading School District GO, 5.00%, 3/1/21 (AGM) | 425,000 | | 439,408 | |
| Reading School District GO, 5.00%, 3/1/23 (AGM) | 670,000 | | 750,601 | |
| Reading School District GO, 5.00%, 3/1/28 (AGM) | 1,025,000 | | 1,289,440 | |
| Reading School District GO, 5.00%, 3/1/35 (AGM) | 2,000,000 | | 2,431,780 | |
| Reading School District GO, 5.00%, 3/1/37 (AGM) | 1,500,000 | | 1,799,250 | |
| Reading School District GO, 5.00%, 3/1/38 (AGM) | 1,500,000 | | 1,789,425 | |
| School District of Philadelphia GO, 5.00%, 9/1/20 | 500,000 | | 505,230 | |
| School District of Philadelphia GO, 5.00%, 9/1/22 | 5,000,000 | | 5,464,600 | |
| School District of Philadelphia GO, 5.00%, 9/1/26 | 2,200,000 | | 2,704,812 | |
| School District of Philadelphia GO, 5.00%, 9/1/27 | 500,000 | | 629,380 | |
| School District of Philadelphia GO, 5.00%, 9/1/28 | 475,000 | | 611,396 | |
| School District of Philadelphia GO, 5.00%, 9/1/29 | 1,225,000 | | 1,545,338 | |
| School District of Philadelphia GO, 5.00%, 9/1/30 | 3,000,000 | | 3,761,130 | |
| School District of Philadelphia GO, 5.00%, 9/1/33 | 1,625,000 | | 1,999,351 | |
| Scranton School District GO, 5.00%, 6/1/20 | 630,000 | | 630,000 | |
| Scranton School District GO, 5.00%, 6/1/21 | 1,355,000 | | 1,411,964 | |
| Scranton School District GO, 5.00%, 6/1/24 | 2,235,000 | | 2,586,543 | |
| Scranton School District GO, 5.00%, 12/1/32 (BAM) | 1,000,000 | | 1,235,620 | |
| Scranton School District GO, 5.00%, 12/1/34 (BAM) | 1,650,000 | | 2,029,896 | |
| Scranton School District GO, 5.00%, 12/1/35 (BAM) | 750,000 | | 919,020 | |
| Scranton-Lackawanna Health & Welfare Authority Rev., (Marywood University), 5.00%, 6/1/46 | 4,200,000 | | 3,867,822 | |
| Scranton-Lackawanna Health & Welfare Authority Rev., (University of Scranton), 5.00%, 11/1/23 | 500,000 | | 529,450 | |
| Scranton-Lackawanna Health & Welfare Authority Rev., (University of Scranton), 5.00%, 11/1/24 | 600,000 | | 642,912 | |
| Scranton-Lackawanna Health & Welfare Authority Rev., (University of Scranton), 5.00%, 11/1/25 | 625,000 | | 675,506 | |
| Scranton-Lackawanna Health & Welfare Authority Rev., (University of Scranton), 5.00%, 11/1/26 | 920,000 | | 998,108 | |
| Scranton-Lackawanna Health & Welfare Authority Rev., (University of Scranton), 5.00%, 11/1/27 | 805,000 | | 869,295 | |
| Scranton-Lackawanna Health & Welfare Authority Rev., (University of Scranton), 5.00%, 11/1/28 | 785,000 | | 844,056 | |
| Scranton-Lackawanna Health & Welfare Authority Rev., (University of Scranton), 5.00%, 11/1/29 | 1,000,000 | | 1,070,810 | |
| Scranton-Lackawanna Health & Welfare Authority Rev., (University of Scranton), 5.00%, 11/1/30 | 700,000 | | 746,165 | |
| Scranton-Lackawanna Health & Welfare Authority Rev., (University of Scranton), 5.00%, 11/1/31 | 700,000 | | 742,525 | |
| State Public School Building Authority Rev., (School District of Philadelphia), 5.00%, 6/1/25 | 4,000,000 | | 4,758,320 | |
| University of Pittsburgh of the Commonwealth System of Higher Education Rev., VRN, 0.38%, (MUNIPSA plus 0.24%), 9/15/21 | 10,000,000 | | 9,917,800 | |
| | | | | | | | |
| Principal Amount | Value |
| University of Pittsburgh of the Commonwealth System of Higher Education Rev., VRN, 0.50%, (MUNIPSA plus 0.36%), 2/15/24 | $ | 10,000,000 | | $ | 9,902,600 | |
| | 310,858,789 | |
| Rhode Island — 1.0% | | |
| Providence Public Building Authority Rev., 5.00%, 9/15/27 (AGM) | 1,635,000 | | 2,065,136 | |
| Providence Public Building Authority Rev., 5.00%, 9/15/29 (AGM) | 1,810,000 | | 2,266,102 | |
| Providence Public Building Authority Rev., 5.00%, 9/15/32 (AGM) | 2,000,000 | | 2,459,980 | |
| Providence Public Building Authority Rev., (Providence), 4.00%, 9/15/24 (AGM) | 2,620,000 | | 2,945,954 | |
| Providence Public Building Authority Rev., (Providence), 5.00%, 9/15/25 (AGM) | 2,785,000 | | 3,336,681 | |
| Providence Public Building Authority Rev., (Providence), 5.00%, 9/15/26 (AGM) | 3,480,000 | | 4,268,324 | |
| Providence Public Building Authority Rev., (Providence), 5.00%, 9/15/27 (AGM) | 4,185,000 | | 5,252,803 | |
| Providence Public Building Authority Rev., (Providence), 5.00%, 9/15/32 (AGM) | 2,175,000 | | 2,780,933 | |
| Providence Public Building Authority Rev., (Providence), 4.00%, 9/15/33 (AGM) | 5,620,000 | | 6,530,665 | |
| Rhode Island Commerce Corp. Rev., 5.00%, 6/15/24 | 1,000,000 | | 1,164,230 | |
| Rhode Island Commerce Corp. Rev., (Rhode Island Airport Corp.), 5.00%, 7/1/27 | 450,000 | | 512,163 | |
| Rhode Island Commerce Corp. Rev., (Rhode Island Airport Corp.), 5.00%, 7/1/29 | 500,000 | | 565,055 | |
| Rhode Island Commerce Corp. Rev., (Rhode Island Airport Corp.), 5.00%, 7/1/31 | 500,000 | | 557,655 | |
| Rhode Island Health & Educational Building Corp. Rev., (Lifespan Obligated Group), 5.00%, 5/15/23 | 2,250,000 | | 2,441,092 | |
| Rhode Island Health & Educational Building Corp. Rev., (Lifespan Obligated Group), 5.00%, 5/15/24 | 2,000,000 | | 2,219,300 | |
| | 39,366,073 | |
| South Carolina — 0.7% | | |
| Berkeley County Special Assessment, (Berkeley County Nexton Improvement District), 4.00%, 11/1/30 | 425,000 | | 396,381 | |
| Berkeley County Special Assessment, (Berkeley County Nexton Improvement District), 4.25%, 11/1/40 | 1,000,000 | | 876,870 | |
| Charleston Educational Excellence Finance Corp. Rev., (Charleston County School District), 5.00%, 12/1/24 | 1,750,000 | | 2,019,727 | |
| Charleston Educational Excellence Finance Corp. Rev., (Charleston County School District), 5.00%, 12/1/25 | 2,945,000 | | 3,386,662 | |
| Greenwood Fifty Schools Facilities, Inc. Rev., 5.00%, 12/1/21 (BAM) | 1,000,000 | | 1,062,540 | |
| Greenwood Fifty Schools Facilities, Inc. Rev., 5.00%, 12/1/27 (BAM) | 5,000,000 | | 5,912,750 | |
| Myrtle Beach Tax Allocation, 5.00%, 10/1/23 | 250,000 | | 284,003 | |
| Myrtle Beach Tax Allocation, 5.00%, 10/1/25 | 1,145,000 | | 1,379,908 | |
| Myrtle Beach Tax Allocation, 5.00%, 10/1/26 | 450,000 | | 555,615 | |
| South Carolina Jobs-Economic Development Authority Rev., (Bon Secours Mercy Health, Inc.), VRN, 5.00%, 12/1/48 | 7,500,000 | | 8,754,375 | |
| South Carolina Jobs-Economic Development Authority Rev., (Conway Hospital, Inc. Obligated Group), 5.25%, 7/1/47 | 3,750,000 | | 4,243,012 | |
| | 28,871,843 | |
| Tennessee — 1.0% | | |
| Knox County Health Educational & Housing Facility Board Rev., (University Health System Obligated Group), 4.00%, 4/1/21 | 1,050,000 | | 1,068,847 | |
| Knox County Health Educational & Housing Facility Board Rev., (University Health System Obligated Group), 5.00%, 4/1/22 | 500,000 | | 528,330 | |
| Metropolitan Nashville Airport Authority Rev., 4.00%, 7/1/25 | 375,000 | | 424,380 | |
| Metropolitan Nashville Airport Authority Rev., 4.00%, 7/1/26 | 650,000 | | 727,773 | |
| Metropolitan Nashville Airport Authority Rev., 4.00%, 7/1/27 | 415,000 | | 461,862 | |
| | | | | | | | |
| Principal Amount | Value |
| Metropolitan Nashville Airport Authority Rev., 5.00%, 7/1/28 | $ | 375,000 | | $ | 435,338 | |
| Metropolitan Nashville Airport Authority Rev., 5.00%, 7/1/29 | 475,000 | | 549,670 | |
| Metropolitan Nashville Airport Authority Rev., 5.00%, 7/1/30 | 475,000 | | 547,423 | |
| Tennergy Corp. Rev., VRN, 5.00%, 2/1/50 (LIQ FAC: Royal Bank of Canada) | 12,000,000 | | 13,772,760 | |
| Tennessee Energy Acquisition Corp. Rev., VRN, 4.00%, 11/1/49 (GA: Goldman Sachs Group, Inc.) | 20,000,000 | | 22,225,800 | |
| | 40,742,183 | |
| Texas — 11.8% | | |
| Arlington Special Tax, 5.00%, 2/15/28 (BAM) | 1,425,000 | | 1,718,650 | |
| Arlington Special Tax, 5.00%, 2/15/30 (BAM) | 1,000,000 | | 1,190,100 | |
| Arlington Special Tax, 5.00%, 2/15/31 (BAM) | 1,100,000 | | 1,301,542 | |
| Arlington Special Tax, 5.00%, 2/15/32 (BAM) | 1,000,000 | | 1,175,520 | |
| Arlington Special Tax, 5.00%, 2/15/33 (BAM) | 1,000,000 | | 1,168,420 | |
| Arlington Higher Education Finance Corp. Rev., 4.00%, 8/15/33 (PSF-GTD) | 1,300,000 | | 1,559,961 | |
| Arlington Higher Education Finance Corp. Rev., 4.00%, 8/15/35 (PSF-GTD) | 1,685,000 | | 2,004,594 | |
| Arlington Higher Education Finance Corp. Rev., 4.00%, 8/15/36 (PSF-GTD) | 1,250,000 | | 1,480,350 | |
| Arlington Higher Education Finance Corp. Rev., 4.00%, 8/15/37 (PSF-GTD) | 1,500,000 | | 1,764,480 | |
| Arlington Higher Education Finance Corp. Rev., 4.00%, 8/15/38 (PSF-GTD) | 1,875,000 | | 2,196,656 | |
| Arlington Higher Education Finance Corp. Rev., 4.00%, 8/15/39 (PSF-GTD) | 3,250,000 | | 3,793,855 | |
| Arlington Higher Education Finance Corp. Rev., (Great Hearts America - Texas), 4.00%, 8/15/32 (PSF-GTD) | 200,000 | | 240,718 | |
| Arlington Higher Education Finance Corp. Rev., (Great Hearts America - Texas), 4.00%, 8/15/33 (PSF-GTD) | 380,000 | | 454,556 | |
| Arlington Higher Education Finance Corp. Rev., (Great Hearts America - Texas), 4.00%, 8/15/34 (PSF-GTD) | 330,000 | | 393,294 | |
| Arlington Higher Education Finance Corp. Rev., (Great Hearts America - Texas), 4.00%, 8/15/35 (PSF-GTD) | 500,000 | | 592,970 | |
| Arlington Higher Education Finance Corp. Rev., (Great Hearts America - Texas), 4.00%, 8/15/36 (PSF-GTD) | 375,000 | | 442,714 | |
| Arlington Higher Education Finance Corp. Rev., (Great Hearts America - Texas), 4.00%, 8/15/37 (PSF-GTD) | 550,000 | | 646,976 | |
| Arlington Higher Education Finance Corp. Rev., (Great Hearts America - Texas), 4.00%, 8/15/38 (PSF-GTD) | 900,000 | | 1,055,223 | |
| Arlington Higher Education Finance Corp. Rev., (Great Hearts America - Texas), 4.00%, 8/15/39 (PSF-GTD) | 465,000 | | 543,664 | |
| Arlington Higher Education Finance Corp. Rev., (Uplift Education), 5.00%, 12/1/36 | 1,315,000 | | 1,396,543 | |
Arlington Independent School District GO, 4.00%,
2/15/39 (PSF-GTD) | 6,755,000 | | 8,101,339 | |
| Austin Convention Enterprises, Inc. Rev., 5.00%, 1/1/21 | 750,000 | | 749,250 | |
| Austin Convention Enterprises, Inc. Rev., 5.00%, 1/1/21 | 800,000 | | 798,744 | |
| Austin Convention Enterprises, Inc. Rev., 5.00%, 1/1/22 | 650,000 | | 647,647 | |
| Austin Convention Enterprises, Inc. Rev., 5.00%, 1/1/23 | 650,000 | | 645,808 | |
| Austin Convention Enterprises, Inc. Rev., 5.00%, 1/1/23 | 750,000 | | 743,738 | |
| Austin Convention Enterprises, Inc. Rev., 5.00%, 1/1/24 | 1,500,000 | | 1,489,890 | |
| Austin Convention Enterprises, Inc. Rev., 5.00%, 1/1/25 | 800,000 | | 782,616 | |
| Austin Independent School District GO, 4.00%, 8/1/34 (PSF-GTD) | 4,875,000 | | 5,819,190 | |
| Austin Independent School District GO, 4.00%, 8/1/35 (PSF-GTD) | 6,000,000 | | 7,120,020 | |
| Austin Independent School District GO, 4.00%, 8/1/36 (PSF-GTD) | 4,750,000 | | 5,601,485 | |
| | | | | | | | |
| Principal Amount | Value |
| Bexar County Health Facilities Development Corp. Rev., (Army Retirement Residence Obligated Group), 5.00%, 7/15/25 | $ | 275,000 | | $ | 281,842 | |
| Bexar County Health Facilities Development Corp. Rev., (Army Retirement Residence Obligated Group), 5.00%, 7/15/26 | 250,000 | | 256,073 | |
| Bexar County Health Facilities Development Corp. Rev., (Army Retirement Residence Obligated Group), 5.00%, 7/15/26 | 1,000,000 | | 1,024,290 | |
| Bexar County Health Facilities Development Corp. Rev., (Army Retirement Residence Obligated Group), 4.00%, 7/15/31 | 1,500,000 | | 1,395,015 | |
| Bexar County Health Facilities Development Corp. Rev., (Army Retirement Residence Obligated Group), 5.00%, 7/15/33 | 1,500,000 | | 1,506,870 | |
| Central Texas Regional Mobility Authority Rev., 5.00%, 1/1/21 | 860,000 | | 872,900 | |
Central Texas Regional Mobility Authority Rev., 6.00%, 1/1/21, Prerefunded at 100% of Par(3) | 2,500,000 | | 2,583,025 | |
| Central Texas Regional Mobility Authority Rev., 5.00%, 1/1/22 | 2,000,000 | | 2,080,140 | |
| Central Texas Regional Mobility Authority Rev., 5.00%, 1/1/23 | 2,000,000 | | 2,127,480 | |
| Central Texas Regional Mobility Authority Rev., 5.00%, 1/1/29 | 2,000,000 | | 2,220,300 | |
| Central Texas Regional Mobility Authority Rev., 5.00%, 1/1/45 | 2,000,000 | | 2,159,720 | |
| Central Texas Turnpike System Rev., 5.00%, 8/15/42 | 2,050,000 | | 2,156,005 | |
Clear Creek Independent School District GO, 4.00%, 2/15/37
(PSF-GTD) | 1,620,000 | | 1,905,833 | |
Clear Creek Independent School District GO, 4.00%,
2/15/38 (PSF-GTD) | 2,605,000 | | 3,051,471 | |
Clear Creek Independent School District GO, 4.00%,
2/15/39 (PSF-GTD) | 3,500,000 | | 4,083,345 | |
Clear Creek Independent School District GO, 4.00%,
2/15/40 (PSF-GTD) | 2,500,000 | | 2,907,075 | |
Clear Creek Independent School District GO, 4.00%,
2/15/41 (PSF-GTD) | 3,000,000 | | 3,475,020 | |
| Clifton Higher Education Finance Corp. Rev., (IDEA Public Schools), 4.00%, 8/15/20 | 1,395,000 | | 1,405,253 | |
| Clifton Higher Education Finance Corp. Rev., (IDEA Public Schools), 4.00%, 8/15/22 | 1,000,000 | | 1,056,510 | |
| Clifton Higher Education Finance Corp. Rev., (IDEA Public Schools), 5.00%, 8/15/26 | 1,010,000 | | 1,187,477 | |
| Clifton Higher Education Finance Corp. Rev., (IDEA Public Schools), 5.00%, 8/15/27 | 1,100,000 | | 1,285,911 | |
| Clifton Higher Education Finance Corp. Rev., (IDEA Public Schools), 5.00%, 8/15/28 | 500,000 | | 582,285 | |
| Clifton Higher Education Finance Corp. Rev., (IDEA Public Schools), 5.00%, 8/15/39 (PSF-GTD) | 1,500,000 | | 1,718,475 | |
| Dallas Area Rapid Transit Rev., 5.00%, 12/1/32 | 2,750,000 | | 3,594,387 | |
| Dallas Area Rapid Transit Rev., 5.00%, 12/1/33 | 2,500,000 | | 3,250,950 | |
| Dallas Area Rapid Transit Rev., 4.00%, 12/1/34 | 1,800,000 | | 2,180,214 | |
| Dallas Area Rapid Transit Rev., 5.00%, 12/1/34 | 5,250,000 | | 6,798,592 | |
| Dallas Area Rapid Transit Rev., 4.00%, 12/1/35 | 1,000,000 | | 1,204,900 | |
| Dallas Area Rapid Transit Rev., 4.00%, 12/1/36 | 1,680,000 | | 2,015,093 | |
| Dallas Area Rapid Transit Rev., 4.00%, 12/1/37 | 2,235,000 | | 2,670,713 | |
| Dallas Area Rapid Transit Rev., 4.00%, 12/1/38 | 3,000,000 | | 3,572,580 | |
Dallas Independent School District GO, VRN, 5.00%,
2/15/36 (PSF-GTD) | 3,975,000 | | 4,267,282 | |
| Dallas/Fort Worth International Airport Rev., 5.00%, 11/1/20 | 6,000,000 | | 6,099,300 | |
| Dallas/Fort Worth International Airport Rev., 5.00%, 11/1/20 | 750,000 | | 762,413 | |
| Dallas/Fort Worth International Airport Rev., 5.00%, 11/1/21 | 4,500,000 | | 4,573,755 | |
| Dallas/Fort Worth International Airport Rev., 5.00%, 11/1/21 | 500,000 | | 527,860 | |
| Dallas/Fort Worth International Airport Rev., 5.00%, 11/1/22 | 400,000 | | 436,168 | |
| Dallas/Fort Worth International Airport Rev., 5.00%, 11/1/23 | 645,000 | | 724,541 | |
| | | | | | | | |
| Principal Amount | Value |
| Denton County Fresh Water Supply District No. 6 GO, 4.00%, 2/15/21 (BAM) | $ | 400,000 | | $ | 409,148 | |
| Denton County Fresh Water Supply District No. 6 GO, 4.00%, 2/15/22 (BAM) | 305,000 | | 321,738 | |
| Denton County Fresh Water Supply District No. 6 GO, 4.00%, 2/15/23 (BAM) | 400,000 | | 436,100 | |
| Denton County Fresh Water Supply District No. 6 GO, 4.00%, 2/15/24 (BAM) | 480,000 | | 537,667 | |
| Denton County Fresh Water Supply District No. 6 GO, 4.00%, 2/15/25 (BAM) | 240,000 | | 275,321 | |
| Denton County Fresh Water Supply District No. 6 GO, 4.00%, 2/15/26 (BAM) | 200,000 | | 227,352 | |
| El Paso Water & Sewer Rev., 4.00%, 3/1/29 | 1,160,000 | | 1,362,582 | |
| El Paso Water & Sewer Rev., 4.00%, 3/1/30 | 500,000 | | 584,875 | |
Fort Bend Independent School District GO, 4.00%,
2/15/34 (PSF-GTD) | 3,000,000 | | 3,572,400 | |
| Frisco Independent School District GO, 4.00%, 8/15/39 (PSF-GTD) | 3,000,000 | | 3,582,750 | |
| Garland Independent School District GO, 5.00%, 2/15/24 (PSF-GTD) | 7,790,000 | | 9,116,170 | |
| Grand Parkway Transportation Corp. Rev., 5.00%, 2/1/23 | 8,000,000 | | 8,683,680 | |
| Grand Parkway Transportation Corp. Rev., 5.125%, 10/1/43 | 2,250,000 | | 2,319,345 | |
| Harris County Rev., (Harris County Toll Road Authority), 5.00%, 8/15/25 | 3,170,000 | | 3,880,112 | |
| Harris County Rev., (Harris County Toll Road Authority), 5.00%, 8/15/26 | 1,660,000 | | 2,028,055 | |
| Harris County Rev., (Harris County Toll Road Authority), 5.00%, 8/15/27 | 1,500,000 | | 1,828,275 | |
| Harris County Rev., (Harris County Toll Road Authority), 5.00%, 8/15/28 | 1,000,000 | | 1,218,280 | |
| Harris County Rev., (Harris County Toll Road Authority), 5.00%, 8/15/29 | 1,000,000 | | 1,215,430 | |
| Harris County Cultural Education Facilities Finance Corp. Rev., (Brazos Presbyterian Homes, Inc.), 5.00%, 1/1/27 | 1,000,000 | | 1,014,910 | |
| Harris County Cultural Education Facilities Finance Corp. Rev., (Brazos Presbyterian Homes, Inc.), 4.00%, 1/1/31 | 1,745,000 | | 1,586,798 | |
| Harris County Cultural Education Facilities Finance Corp. Rev., (Brazos Presbyterian Homes, Inc.), 5.00%, 1/1/37 | 1,000,000 | | 960,730 | |
| Harris County-Houston Sports Authority Rev., 5.00%, 11/15/20 | 1,220,000 | | 1,227,503 | |
| Harris County-Houston Sports Authority Rev., 5.00%, 11/15/21 | 900,000 | | 917,019 | |
| Harris County-Houston Sports Authority Rev., 5.00%, 11/15/23 | 850,000 | | 881,629 | |
| Harris County-Houston Sports Authority Rev., 5.00%, 11/15/24 | 700,000 | | 730,576 | |
| Harris County-Houston Sports Authority Rev., 5.00%, 11/15/25 | 760,000 | | 789,762 | |
| Harris County-Houston Sports Authority Rev., 5.00%, 11/15/26 | 1,000,000 | | 1,034,800 | |
| Harris County-Houston Sports Authority Rev., 5.00%, 11/15/27 | 510,000 | | 525,249 | |
| Harris County-Houston Sports Authority Rev., 5.00%, 11/15/29 | 2,300,000 | | 2,355,131 | |
| Harris County-Houston Sports Authority Rev., 5.00%, 11/15/30 | 1,000,000 | | 1,020,380 | |
| Harris County-Houston Sports Authority Rev., 5.00%, 11/15/32 | 485,000 | | 491,111 | |
| Harris County-Houston Sports Authority Rev., 5.00%, 11/15/33 | 1,000,000 | | 1,009,920 | |
| Houston Airport System Rev., 5.00%, 7/1/23 | 2,560,000 | | 2,756,659 | |
| Houston Airport System Rev., 5.00%, 7/1/24 | 4,000,000 | | 4,302,960 | |
| Houston Community College System Rev., 4.00%, 4/15/31 | 1,000,000 | | 1,146,220 | |
| Houston Hotel Occupancy Tax & Special Rev., 5.00%, 9/1/25 | 1,000,000 | | 1,012,380 | |
| Houston Hotel Occupancy Tax & Special Rev., 5.00%, 9/1/27 | 2,050,000 | | 2,050,348 | |
| Houston Hotel Occupancy Tax & Special Rev., 5.00%, 9/1/28 | 710,000 | | 710,099 | |
Houston Independent School District GO, VRN, 2.40%,
6/1/36 (PSF-GTD) | 8,000,000 | | 8,138,960 | |
| Hurst-Euless-Bedford Independent School District GO, 4.00%, 8/15/34 (PSF-GTD) | 2,000,000 | | 2,431,720 | |
| | | | | | | | |
| Principal Amount | Value |
| Hurst-Euless-Bedford Independent School District GO, 4.00%, 8/15/35 (PSF-GTD) | $ | 1,400,000 | | $ | 1,694,574 | |
| Hurst-Euless-Bedford Independent School District GO, 4.00%, 8/15/37 (PSF-GTD) | 1,500,000 | | 1,802,220 | |
| Hurst-Euless-Bedford Independent School District GO, 4.00%, 8/15/38 (PSF-GTD) | 1,000,000 | | 1,197,890 | |
| Hurst-Euless-Bedford Independent School District GO, 4.00%, 8/15/39 (PSF-GTD) | 1,500,000 | | 1,792,245 | |
| Irving Hospital Authority Rev., 5.00%, 10/15/20 | 500,000 | | 508,085 | |
| Irving Hospital Authority Rev., 5.00%, 10/15/22 | 250,000 | | 273,010 | |
| Irving Hospital Authority Rev., 5.00%, 10/15/23 | 490,000 | | 552,651 | |
| Irving Hospital Authority Rev., 5.00%, 10/15/25 | 250,000 | | 297,688 | |
| Irving Hospital Authority Rev., VRN, 1.24%, (MUNIPSA plus 1.10%), 10/15/44 | 1,750,000 | | 1,706,827 | |
| Lower Colorado River Authority Rev., (LCRA Transmission Services Corp.), 5.00%, 5/15/22 | 1,000,000 | | 1,002,010 | |
| Lower Colorado River Authority Rev., (LCRA Transmission Services Corp.), 5.00%, 5/15/23 | 3,435,000 | | 3,441,904 | |
| Lower Colorado River Authority Rev., (LCRA Transmission Services Corp.), 5.00%, 5/15/24 | 2,000,000 | | 2,004,020 | |
| Memorial City Redevelopment Authority Tax Allocation, 5.00%, 9/1/25 (AGM) | 890,000 | | 1,078,458 | |
| Memorial City Redevelopment Authority Tax Allocation, 5.00%, 9/1/27 (AGM) | 1,050,000 | | 1,328,345 | |
| Memorial City Redevelopment Authority Tax Allocation, 5.00%, 9/1/28 (AGM) | 1,250,000 | | 1,611,200 | |
| Metropolitan Transit Authority of Harris County Rev., 5.00%, 11/1/26 | 2,000,000 | | 2,490,440 | |
New Hope Cultural Education Facilities Finance Corp. Rev.,
(CHF-Collegiate Housing Denton LLC), 5.00%, 7/1/29 (AGM) | 700,000 | | 830,501 | |
New Hope Cultural Education Facilities Finance Corp. Rev.,
(CHF-Collegiate Housing Denton LLC), 5.00%, 7/1/31 (AGM) | 460,000 | | 539,198 | |
New Hope Cultural Education Facilities Finance Corp. Rev.,
(CHF-Collegiate Housing Denton LLC), 5.00%, 7/1/38 (AGM) | 500,000 | | 567,820 | |
New Hope Cultural Education Facilities Finance Corp. Rev.,
(CHF-Collegiate Housing Island Campus LLC), 5.00%, 4/1/29 | 1,000,000 | | 983,130 | |
New Hope Cultural Education Facilities Finance Corp. Rev.,
(CHF-Collegiate Housing Island Campus LLC), 5.00%, 4/1/32 | 1,670,000 | | 1,588,187 | |
New Hope Cultural Education Facilities Finance Corp. Rev.,
(CHF-Collegiate Housing Island Campus LLC), 5.00%, 4/1/37 | 1,000,000 | | 901,740 | |
New Hope Cultural Education Facilities Finance Corp. Rev.,
(CHF-Collegiate Housing Island Campus LLC), 5.00%, 4/1/42 | 1,000,000 | | 870,330 | |
| North East Texas Regional Mobility Authority Rev., 5.00%, 1/1/28 | 2,610,000 | | 2,862,961 | |
| North Texas Tollway Authority Rev., 5.00%, 1/1/24 | 3,500,000 | | 4,027,555 | |
| North Texas Tollway Authority Rev., 5.00%, 1/1/27 | 1,000,000 | | 1,178,130 | |
| North Texas Tollway Authority Rev., 5.00%, 1/1/28 | 3,000,000 | | 3,197,520 | |
| North Texas Tollway Authority Rev., 5.00%, 1/1/29 | 2,500,000 | | 2,658,475 | |
| North Texas Tollway Authority Rev., 5.00%, 1/1/30 | 6,310,000 | | 6,696,677 | |
| North Texas Tollway Authority Rev., 5.00%, 1/1/30 | 1,250,000 | | 1,456,275 | |
| North Texas Tollway Authority Rev., 5.00%, 1/1/31 | 1,250,000 | | 1,449,887 | |
| North Texas Tollway Authority Rev., 5.00%, 1/1/32 | 3,500,000 | | 4,128,110 | |
| North Texas Tollway Authority Rev., 5.00%, 1/1/36 | 2,000,000 | | 2,107,980 | |
| North Texas Tollway Authority Rev., 5.00%, 1/1/40 | 2,110,000 | | 2,272,892 | |
| Old Spanish Trail-Alemda Corridors Redevelopment Authority Tax Allocation, 4.00%, 9/1/34 (BAM) | 1,400,000 | | 1,636,404 | |
| Old Spanish Trail-Alemda Corridors Redevelopment Authority Tax Allocation, 4.00%, 9/1/35 (BAM) | 1,070,000 | | 1,243,319 | |
| Old Spanish Trail-Alemda Corridors Redevelopment Authority Tax Allocation, 4.00%, 9/1/36 (BAM) | 1,130,000 | | 1,303,037 | |
| | | | | | | | |
| Principal Amount | Value |
| Old Spanish Trail-Alemda Corridors Redevelopment Authority Tax Allocation, 4.00%, 9/1/37 (BAM) | $ | 1,325,000 | | $ | 1,517,509 | |
| Pharr San Juan Alamo Independent School District GO, 4.00%, 2/1/33 (PSF-GTD) | 1,325,000 | | 1,546,089 | |
| Pharr San Juan Alamo Independent School District GO, 4.00%, 2/1/34 (PSF-GTD) | 1,250,000 | | 1,448,125 | |
| Pharr San Juan Alamo Independent School District GO, 4.00%, 2/1/35 (PSF-GTD) | 1,000,000 | | 1,154,120 | |
| San Antonio Electric & Gas Systems Rev., 5.00%, 2/1/43 | 4,350,000 | | 4,774,299 | |
San Antonio Independent School District GO, 4.00%,
8/15/36 (PSF-GTD) | 4,000,000 | | 4,749,960 | |
| San Antonio Water System Rev., 5.00%, 5/15/34 | 6,500,000 | | 8,625,435 | |
| San Antonio Water System Rev., VRN, 2.00%, 5/1/44 | 4,000,000 | | 4,126,320 | |
| Tarrant County Cultural Education Facilities Finance Corp. Rev., (Methodist Hospitals of Dallas Obligated Group), VRDN, 0.06%, 6/1/20 (LOC: TD Bank N.A.) | 5,200,000 | | 5,200,000 | |
| Tarrant County Cultural Education Facilities Finance Corp. Rev., (Texas Health Resources Obligated Group), 5.00%, 2/15/24 | 2,000,000 | | 2,309,280 | |
| Texas Municipal Gas Acquisition & Supply Corp. I Rev., 6.25%, 12/15/26 (GA: Merrill Lynch & Co.) | 5,100,000 | | 5,862,654 | |
| Texas Public Finance Authority Rev., (Texas Southern University), 5.00%, 5/1/23 (BAM) | 2,255,000 | | 2,473,780 | |
| Texas Public Finance Authority Rev., (Texas Southern University), 5.00%, 5/1/24 (BAM) | 2,365,000 | | 2,663,889 | |
| Texas Public Finance Authority Rev., (Texas Southern University), 5.00%, 5/1/25 (BAM) | 1,520,000 | | 1,752,104 | |
| Texas Public Finance Authority Rev., (Texas Southern University), 5.00%, 5/1/28 (BAM) | 1,000,000 | | 1,168,890 | |
| Texas Public Finance Authority Rev., (Texas Southern University), 4.00%, 5/1/29 (BAM) | 1,500,000 | | 1,649,490 | |
| Texas Transportation Commission State Highway Fund Rev., VRN, 4.00%, 4/1/26 | 2,000,000 | | 2,079,080 | |
| Texas Water Development Board Rev., 5.00%, 4/15/31 | 9,910,000 | | 13,144,327 | |
Texas Water Development Board Rev., 5.00%, 8/1/32(4) | 5,000,000 | | 6,831,700 | |
Texas Water Development Board Rev., 5.00%, 8/1/33(4) | 3,755,000 | | 5,087,687 | |
Texas Water Development Board Rev., 4.00%, 8/1/34(4) | 2,500,000 | | 3,112,925 | |
| Texas Water Development Board Rev., 5.00%, 10/15/38 | 14,540,000 | | 18,659,618 | |
| Texas Water Development Board Rev., (State Water Implementation Rev. Fund for Texas), 5.00%, 4/15/31 | 4,750,000 | | 6,452,115 | |
| Texas Water Development Board Rev., (State Water Implementation Rev. Fund for Texas), 5.00%, 4/15/32 | 5,000,000 | | 6,742,350 | |
| University of Houston Rev., 5.00%, 2/15/27 | 8,100,000 | | 9,964,215 | |
| University of North Texas System Rev., 5.00%, 4/15/27 | 5,770,000 | | 6,888,688 | |
| University of Texas System Rev., 5.00%, 8/15/30 | 10,000,000 | | 13,932,600 | |
| University of Texas System Rev., 5.00%, 8/15/34 | 15,000,000 | | 19,683,900 | |
| Uptown Development Authority Tax Allocation, 5.00%, 9/1/33 | 720,000 | | 824,350 | |
| Uptown Development Authority Tax Allocation, 5.00%, 9/1/34 | 1,570,000 | | 1,786,079 | |
| Uptown Development Authority Tax Allocation, 5.00%, 9/1/34 | 1,255,000 | | 1,401,910 | |
| Uptown Development Authority Tax Allocation, 5.00%, 9/1/35 | 3,950,000 | | 4,411,834 | |
| Uptown Development Authority Tax Allocation, 5.00%, 9/1/36 | 4,100,000 | | 4,571,459 | |
| Waller Consolidated Independent School District GO, 4.00%, 2/15/44 (PSF-GTD) | 7,000,000 | | 8,501,570 | |
| | 470,695,766 | |
| Utah — 0.1% | | |
| Salt Lake County Rev., (Westminster College), 5.00%, 10/1/26 | 1,050,000 | | 1,188,610 | |
| Salt Lake County Rev., (Westminster College), 5.00%, 10/1/27 | 2,145,000 | | 2,414,541 | |
| St. George Electric Rev., 5.00%, 6/1/24 (AGM) | 1,000,000 | | 1,177,950 | |
| | | | | | | | |
| Principal Amount | Value |
| St. George Electric Rev., 5.00%, 6/1/27 (AGM) | $ | 1,000,000 | | $ | 1,238,920 | |
| | 6,020,021 | |
| Vermont — 0.4% | | |
| Burlington Airport Rev., 5.00%, 7/1/24 (AGM) | 500,000 | | 541,775 | |
| Burlington Airport Rev., 5.00%, 7/1/30 (AGM) | 750,000 | | 855,570 | |
| Vermont Educational & Health Buildings Financing Agency Rev., (Champlain College, Inc.), 5.00%, 10/15/24 | 1,400,000 | | 1,520,820 | |
| Vermont Educational & Health Buildings Financing Agency Rev., (Champlain College, Inc.), 5.00%, 10/15/25 | 615,000 | | 673,031 | |
| Vermont Educational & Health Buildings Financing Agency Rev., (Champlain College, Inc.), 5.00%, 10/15/26 | 1,000,000 | | 1,098,770 | |
| Vermont Educational & Health Buildings Financing Agency Rev., (Champlain College, Inc.), 5.00%, 10/15/27 | 785,000 | | 856,341 | |
| Vermont Educational & Health Buildings Financing Agency Rev., (Champlain College, Inc.), 5.00%, 10/15/28 | 1,000,000 | | 1,082,350 | |
| Vermont Educational & Health Buildings Financing Agency Rev., (Champlain College, Inc.), 5.00%, 10/15/29 | 900,000 | | 966,708 | |
| Vermont Educational & Health Buildings Financing Agency Rev., (Champlain College, Inc.), 5.00%, 10/15/30 | 500,000 | | 532,710 | |
| Vermont Educational & Health Buildings Financing Agency Rev., (Southwestern Vermont Medical Center, Inc.), VRDN, 0.13%, 6/1/20 (LOC: TD Bank N.A.) | 1,550,000 | | 1,550,000 | |
| Vermont Educational & Health Buildings Financing Agency Rev., (University of Vermont Health Network Obligated Group), 5.00%, 12/1/31 | 4,000,000 | | 4,618,760 | |
| | 14,296,835 | |
| Virginia — 0.5% | | |
| Greater Richmond Convention Center Authority Rev., 5.00%, 6/15/24 | 3,000,000 | | 3,310,230 | |
| Greater Richmond Convention Center Authority Rev., 5.00%, 6/15/25 | 1,660,000 | | 1,863,831 | |
| Hanover County Economic Development Authority Rev., (Covenant Woods), 5.00%, 7/1/38 | 250,000 | | 237,155 | |
| Hanover County Economic Development Authority Rev., (Covenant Woods), 5.00%, 7/1/48 | 700,000 | | 642,719 | |
| Lexington Industrial Development Authority Rev., (Lexington Retirement Community, Inc.), 4.00%, 1/1/31 | 675,000 | | 621,081 | |
Peninsula Town Center Community Development Authority Special Assessment, 4.00%, 9/1/23(1) | 445,000 | | 438,058 | |
Peninsula Town Center Community Development Authority Special Assessment, 4.50%, 9/1/28(1) | 725,000 | | 715,133 | |
Peninsula Town Center Community Development Authority Special Assessment, 5.00%, 9/1/37(1) | 1,500,000 | | 1,501,785 | |
| Stafford County Economic Development Authority Rev., (Mary Washington Healthcare Obligated Group), 5.00%, 6/15/24 | 650,000 | | 744,764 | |
| Stafford County Economic Development Authority Rev., (Mary Washington Healthcare Obligated Group), 5.00%, 6/15/25 | 1,000,000 | | 1,170,380 | |
| Stafford County Economic Development Authority Rev., (Mary Washington Healthcare Obligated Group), 5.00%, 6/15/28 | 1,000,000 | | 1,179,810 | |
| Stafford County Economic Development Authority Rev., (Mary Washington Healthcare Obligated Group), 5.00%, 6/15/30 | 700,000 | | 818,741 | |
| Virginia Beach Development Authority Rev., (Westminster-Canterbury on Chesapeake Bay Obligated Group), 5.00%, 9/1/22 | 450,000 | | 471,825 | |
| Virginia Beach Development Authority Rev., (Westminster-Canterbury on Chesapeake Bay Obligated Group), 5.00%, 9/1/24 | 500,000 | | 540,705 | |
| Virginia Beach Development Authority Rev., (Westminster-Canterbury on Chesapeake Bay Obligated Group), 5.00%, 9/1/26 | 450,000 | | 487,035 | |
| Virginia Beach Development Authority Rev., (Westminster-Canterbury on Chesapeake Bay Obligated Group), 5.00%, 9/1/28 | 750,000 | | 816,900 | |
| | | | | | | | |
| Principal Amount | Value |
| Virginia Beach Development Authority Rev., (Westminster-Canterbury on Chesapeake Bay Obligated Group), 5.00%, 9/1/29 | $ | 1,000,000 | | $ | 1,086,180 | |
| Virginia Small Business Financing Authority Rev., (Hampton University), 5.25%, 10/1/29 | 3,000,000 | | 3,562,980 | |
| | 20,209,312 | |
| Washington — 3.7% | | |
Energy Northwest Rev., (Bonneville Power Administration), 5.00%, 7/1/32(4) | 2,000,000 | | 2,724,720 | |
Energy Northwest Rev., (Bonneville Power Administration), 5.00%, 7/1/33(4) | 2,000,000 | | 2,705,780 | |
| Energy Northwest Rev., (Bonneville Power Administration), 5.00%, 7/1/35 | 7,000,000 | | 9,203,810 | |
| Energy Northwest Rev., (Bonneville Power Administration), 5.00%, 7/1/36 | 11,000,000 | | 14,397,900 | |
| Port of Seattle Rev., 5.00%, 6/1/22 | 1,000,000 | | 1,002,220 | |
| Seattle Water System Rev., 5.00%, 5/1/22 | 10,000,000 | | 10,918,500 | |
| State of Washington GO, 5.00%, 7/1/27 | 10,000,000 | | 12,039,100 | |
| State of Washington GO, 5.00%, 8/1/29 | 18,795,000 | | 22,915,616 | |
State of Washington GO, 5.00%, 6/1/34(4) | 1,500,000 | | 1,952,700 | |
| State of Washington GO, 5.00%, 8/1/34 | 11,845,000 | | 15,675,791 | |
| State of Washington GO, 5.00%, 6/1/35 | 9,785,000 | | 12,824,612 | |
State of Washington GO, 5.00%, 6/1/35(4) | 1,500,000 | | 1,943,190 | |
| Tobacco Settlement Authority Rev., 5.00%, 6/1/22 | 2,250,000 | | 2,361,623 | |
| Tobacco Settlement Authority Rev., 5.00%, 6/1/23 | 2,000,000 | | 2,145,800 | |
| Tobacco Settlement Authority Rev., 5.00%, 6/1/24 | 3,000,000 | | 3,214,890 | |
| Washington Health Care Facilities Authority Rev., (CommonSpirit Health Obligated Group), VRN, 5.00%, 8/1/49 | 2,000,000 | | 2,201,080 | |
| Washington Health Care Facilities Authority Rev., (CommonSpirit Health Obligated Group), VRN, 5.00%, 8/1/49 | 10,000,000 | | 11,257,100 | |
| Washington Health Care Facilities Authority Rev., (CommonSpirit Health Obligated Group), VRN, 5.00%, 8/1/49 | 2,250,000 | | 2,587,320 | |
| Washington Health Care Facilities Authority Rev., (Fred Hutchinson Cancer Research Center), VRN, 1.19%, (MUNIPSA plus 1.05%), 1/1/42 | 2,000,000 | | 2,003,200 | |
| Washington Health Care Facilities Authority Rev., (Fred Hutchinson Cancer Research Center), VRN, 1.21%, (67% of the 1-month LIBOR plus 1.10%), 1/1/42 | 2,000,000 | | 2,000,500 | |
| Washington Health Care Facilities Authority Rev., (Seattle Children's Hospital Obligated Group), 5.00%, 10/1/29 | 6,500,000 | | 7,625,865 | |
| Washington Health Care Facilities Authority Rev., (Yakima Valley Memorial Hospital Association Obligated Group), 5.00%, 12/1/46 | 5,000,000 | | 5,410,600 | |
| | 149,111,917 | |
| Wisconsin — 0.9% | | |
| Public Finance Authority Rev., (Beyond Boone LLC), 5.00%, 7/1/31 (AGM) | 690,000 | | 830,808 | |
| Public Finance Authority Rev., (Beyond Boone LLC), 5.00%, 7/1/32 (AGM) | 740,000 | | 884,766 | |
| Public Finance Authority Rev., (Beyond Boone LLC), 4.00%, 7/1/33 (AGM) | 330,000 | | 364,389 | |
| Public Finance Authority Rev., (Beyond Boone LLC), 5.00%, 7/1/33 (AGM) | 750,000 | | 891,615 | |
| Public Finance Authority Rev., (Beyond Boone LLC), 4.00%, 7/1/35 (AGM) | 300,000 | | 328,800 | |
| Public Finance Authority Rev., (Beyond Boone LLC), 4.00%, 7/1/37 (AGM) | 300,000 | | 326,391 | |
| Public Finance Authority Rev., (Beyond Boone LLC), 4.00%, 7/1/39 (AGM) | 325,000 | | 351,637 | |
| Public Finance Authority Rev., (Beyond Boone LLC), 5.00%, 7/1/44 (AGM) | 1,000,000 | | 1,152,950 | |
| | | | | | | | |
| Principal Amount/Shares | Value |
| Public Finance Authority Rev., (Beyond Boone LLC), 4.00%, 7/1/45 (AGM) | $ | 600,000 | | $ | 641,064 | |
| Public Finance Authority Rev., (CHF-Wilmington LLC), 5.00%, 7/1/31 (AGM) | 925,000 | | 1,113,765 | |
| Public Finance Authority Rev., (CHF-Wilmington LLC), 5.00%, 7/1/32 (AGM) | 2,540,000 | | 3,036,900 | |
| Public Finance Authority Rev., (CHF-Wilmington LLC), 5.00%, 7/1/33 (AGM) | 2,665,000 | | 3,168,206 | |
| Public Finance Authority Rev., (CHF-Wilmington LLC), 5.00%, 7/1/34 (AGM) | 2,800,000 | | 3,318,728 | |
| Public Finance Authority Rev., (Gannon University), 5.00%, 5/1/42 | 1,100,000 | | 1,108,316 | |
| Public Finance Authority Rev., (Gannon University), 5.00%, 5/1/47 | 1,100,000 | | 1,102,167 | |
| Public Finance Authority Rev., (Guilford College), 5.00%, 1/1/38 | 4,335,000 | | 4,130,085 | |
| Public Finance Authority Rev., (Northwest Nazarene University), 5.00%, 10/1/43 | 5,305,000 | | 5,468,500 | |
| Public Finance Authority Rev., (Renown Regional Medical Center Obligated Group), 5.00%, 6/1/23 | 1,375,000 | | 1,528,161 | |
| Public Finance Authority Rev., (Renown Regional Medical Center Obligated Group), 5.00%, 6/1/24 | 1,000,000 | | 1,144,590 | |
| Public Finance Authority Rev., (Renown Regional Medical Center Obligated Group), 5.00%, 6/1/25 | 1,500,000 | | 1,754,100 | |
Public Finance Authority Rev., (Roseman University of Health Sciences), 3.00%, 4/1/25(1) | 425,000 | | 399,521 | |
Public Finance Authority Rev., (Roseman University of Health Sciences), 5.00%, 4/1/30(1) | 500,000 | | 514,050 | |
Public Finance Authority Rev., (Roseman University of Health Sciences), 5.00%, 4/1/40(1) | 1,175,000 | | 1,137,576 | |
Wisconsin Health & Educational Facilities Authority Rev., (Rocketship Education Obligated Group), 5.25%, 6/1/40(1) | 3,580,000 | | 3,540,692 | |
| | 38,237,777 | |
TOTAL MUNICIPAL SECURITIES
(Cost $3,864,989,700) | | 3,996,958,311 | |
| EXCHANGE-TRADED FUNDS — 0.5% | | |
VanEck Vectors High-Yield Municipal Index ETF
(Cost $20,207,709) | 349,500 | | 20,194,110 | |
TOTAL INVESTMENT SECURITIES — 100.3%
(Cost $3,885,197,409) | | 4,017,152,421 | |
| OTHER ASSETS AND LIABILITIES — (0.3)% | | (13,520,666) | |
| TOTAL NET ASSETS — 100.0% | | $ | 4,003,631,755 | |
| | | | | | | | |
| NOTES TO SCHEDULE OF INVESTMENTS | | |
| AGM | - | Assured Guaranty Municipal Corporation |
| AGM-CR | - | Assured Guaranty Municipal Corporation - Custodian Receipts |
| BAM | - | Build America Mutual Assurance Company |
| COP | - | Certificates of Participation |
| GA | - | Guaranty Agreement |
| GO | - | General Obligation |
| LIBOR | - | London Interbank Offered Rate |
| LIQ FAC | - | Liquidity Facilities |
| LOC | - | Letter of Credit |
| MUNIPSA | - | SIFMA Municipal Swap Index |
| NATL | - | National Public Finance Guarantee Corporation |
| PSF-GTD | - | Permanent School Fund Guaranteed |
| Q-SBLF | - | Qualified School Board Loan Fund |
| SBBPA | - | Standby Bond Purchase Agreement |
| VRDN | - | Variable Rate Demand Note. The instrument may be payable upon demand and adjusts periodically based upon the terms set forth in the security's offering documents. The rate shown is effective at the period end and the reference rate and spread, if any, is indicated. The date of the demand feature is disclosed. |
| VRN | - | Variable Rate Note. The rate adjusts periodically based upon the terms set forth in the security’s offering documents. The rate shown is effective at the period end and the reference rate and spread, if any, is indicated. The security's effective maturity date may be shorter than the final maturity date shown. |
†Category is less than 0.05% of total net assets.
(1)Security was purchased pursuant to Rule 144A under the Securities Act of 1933 and may be sold in transactions exempt from registration, normally to qualified institutional investors. The aggregate value of these securities at the period end was $98,749,996, which represented 2.5% of total net assets.
(2)Security is a zero-coupon bond. Zero-coupon securities are issued at a substantial discount from their value at maturity.
(3)Escrowed to maturity in U.S. government securities or state and local government securities.
(4)When-issued security. The issue price and yield are fixed on the date of the commitment, but payment and delivery are scheduled for a future date.
See Notes to Financial Statements.
| | |
| Statement of Assets and Liabilities |
| | | | | |
| MAY 31, 2020 | |
| Assets | |
| Investment securities, at value (cost of $3,885,197,409) | $ | 4,017,152,421 | |
| Cash | 227,142 | |
| Receivable for investments sold | 4,561,881 | |
| Receivable for capital shares sold | 3,609,457 | |
| Interest and dividends receivable | 49,321,561 | |
| 4,074,872,462 | |
| |
| Liabilities | |
| Payable for investments purchased | 64,724,276 |
| Payable for capital shares redeemed | 4,567,761 |
| Accrued management fees | 1,031,891 |
| Distribution and service fees payable | 13,261 |
| Dividends payable | 903,518 |
| 71,240,707 |
| |
| Net Assets | $ | 4,003,631,755 | |
| |
| Net Assets Consist of: | |
| Capital paid in | $ | 3,888,534,409 | |
| Distributable earnings | 115,097,346 | |
| $ | 4,003,631,755 | |
| | | | | | | | | | | |
| | Net Assets | Shares Outstanding | Net Asset Value Per Share |
| Investor Class | $1,094,741,558 | 95,594,962 | | $11.45 |
| I Class | $1,102,092,908 | 96,206,425 | | $11.46 |
| Y Class | $1,768,681,918 | 154,498,024 | | $11.45 |
| A Class | $29,854,386 | 2,606,363 | | $11.45* |
| C Class | $8,260,985 | 721,817 | | $11.44 |
*Maximum offering price $11.99 (net asset value divided by 0.955).
See Notes to Financial Statements.
| | | | | |
| YEAR ENDED MAY 31, 2020 | |
| Investment Income (Loss) | |
| Income: | |
| Interest | $ | 115,724,450 | |
| Dividends | 194,480 | |
| 115,918,930 | |
| Expenses: | |
| Management fees | 12,627,470 | |
| Distribution and service fees: | |
| A Class | 73,179 | |
| C Class | 88,485 | |
| Trustees' fees and expenses | 303,547 | |
| Other expenses | 14,309 | |
| 13,106,990 | |
| |
| Net investment income (loss) | 102,811,940 | |
| |
| Realized and Unrealized Gain (Loss) | |
| Net realized gain (loss) on investment transactions | (6,146,292) | |
| Change in net unrealized appreciation (depreciation) on investments | (23,171,816) | |
| |
| Net realized and unrealized gain (loss) | (29,318,108) | |
| |
| Net Increase (Decrease) in Net Assets Resulting from Operations | $ | 73,493,832 | |
See Notes to Financial Statements.
| | |
| Statement of Changes in Net Assets |
| | | | | | | | |
| YEARS ENDED MAY 31, 2020 AND MAY 31, 2019 | | |
| Increase (Decrease) in Net Assets | May 31, 2020 | May 31, 2019 |
| Operations | | |
| Net investment income (loss) | $ | 102,811,940 | | $ | 100,104,124 | |
| Net realized gain (loss) | (6,146,292) | | (2,181,747) | |
| Change in net unrealized appreciation (depreciation) | (23,171,816) | | 104,807,477 | |
| Net increase (decrease) in net assets resulting from operations | 73,493,832 | | 202,729,854 | |
| | |
| Distributions to Shareholders | | |
| From earnings: | | |
| Investor Class | (29,189,331) | (33,112,538) |
| I Class | (36,454,382) | (32,225,028) |
| Y Class | (36,375,204) | (33,850,191) | |
| A Class | (635,210) | (770,907) |
| C Class | (125,749) | (177,682) |
| Decrease in net assets from distributions | (102,779,876) | (100,136,346) |
| | |
| Capital Share Transactions | | |
| Net increase (decrease) in net assets from capital share transactions (Note 5) | 158,911,668 | | 312,698,459 | |
| | |
| Net increase (decrease) in net assets | 129,625,624 | | 415,291,967 | |
| | |
| Net Assets | | |
| Beginning of period | 3,874,006,131 | | 3,458,714,164 | |
| End of period | $ | 4,003,631,755 | | $ | 3,874,006,131 | |
| | |
| | |
See Notes to Financial Statements.
| | |
| Notes to Financial Statements |
MAY 31, 2020
1. Organization
American Century Municipal Trust (the trust) is registered under the Investment Company Act of 1940, as amended (the 1940 Act), as an open-end management investment company and is organized as a Massachusetts business trust. Intermediate-Term Tax-Free Bond Fund (the fund) is one fund in a series issued by the trust. The fund’s investment objective is to seek safety of principal and high current income that is exempt from federal income tax.
The fund offers the Investor Class, I Class, Y Class, A Class and C Class. The A Class may incur an initial sales charge. The A Class and C Class may be subject to a contingent deferred sales charge.
2. Significant Accounting Policies
The following is a summary of significant accounting policies consistently followed by the fund in preparation of its financial statements. The fund is an investment company and follows accounting and reporting guidance in accordance with accounting principles generally accepted in the United States of America. This may require management to make certain estimates and assumptions at the date of the financial statements. Actual results could differ from these estimates. Management evaluated the impact of events or transactions occurring through the date the financial statements were issued that would merit recognition or disclosure.
Investment Valuations — The fund determines the fair value of its investments and computes its net asset value per share at the close of regular trading (usually 4 p.m. Eastern time) on the New York Stock Exchange (NYSE) on each day the NYSE is open. The Board of Trustees has adopted valuation policies and procedures to guide the investment advisor in the fund’s investment valuation process and to provide methodologies for the oversight of the fund’s pricing function.
Fixed income securities are valued at the evaluated mean as provided by independent pricing services or at the mean of the most recent bid and asked prices as provided by investment dealers. Municipal securities are valued using market models that consider trade data, quotations from dealers and active market makers, relevant yield curve and spread data, creditworthiness, trade data or market information on comparable securities, and other relevant security specific information.
Open-end management investment companies are valued at the reported net asset value per share.
If the fund determines that the market price for an investment is not readily available or the valuation methods mentioned above do not reflect an investment’s fair value, such investment is valued as determined in good faith by the Board of Trustees or its delegate, in accordance with policies and procedures adopted by the Board of Trustees. In its determination of fair value, the fund may review several factors including, but not limited to, market information regarding the specific investment or comparable investments and correlation with other investment types, futures indices or general market indicators. Circumstances that may cause the fund to use these procedures to value an investment include, but are not limited to: an investment has been declared in default or is distressed; trading in a security has been suspended during the trading day or a security is not actively trading on its principal exchange; prices received from a regular pricing source are deemed unreliable; or there is a foreign market holiday and no trading occurred.
The fund monitors for significant events occurring after the close of an investment’s primary exchange but before the fund’s net asset value per share is determined. Significant events may include, but are not limited to: corporate announcements and transactions; governmental action and political unrest that could impact a specific investment or an investment sector; or armed conflicts, natural disasters and similar events that could affect investments in a specific country or region.
Security Transactions — Security transactions are accounted for as of the trade date. Net realized gains and losses are determined on the identified cost basis, which is also used for federal income tax purposes.
Investment Income — Interest income is recorded on the accrual basis and includes accretion of discounts and amortization of premiums. Dividend income less foreign taxes withheld, if any, is recorded as of the ex-dividend date. Distributions received on securities that represent a return of capital or long-term capital gain are recorded as a reduction of cost of investments and/or as a realized gain. The fund may estimate the components of distributions received that may be considered nontaxable distributions or long-term capital gain distributions for income tax purposes.
Segregated Assets — In accordance with the 1940 Act, the fund segregates assets on its books and records to cover certain types of investment securities and other financial instruments. American Century Investment Management, Inc. (ACIM) (the investment advisor) monitors, on a daily basis, the securities segregated to ensure the fund designates a sufficient amount of liquid assets, marked-to-market daily. The fund may also receive assets or be required to pledge assets at the custodian bank or with a broker for collateral requirements.
Income Tax Status — It is the fund’s policy to distribute substantially all net investment income and net realized gains to shareholders and to otherwise qualify as a regulated investment company under provisions of the Internal Revenue Code. Accordingly, no provision has been made for income taxes. The fund files U.S. federal, state, local and non-U.S. tax returns as applicable. The fund's tax returns are subject to examination by the relevant taxing authority until expiration of the applicable statute of limitations, which is generally three years from the date of filing but can be longer in certain jurisdictions. At this time, management believes there are no uncertain tax positions which, based on their technical merit, would not be sustained upon examination and for which it is reasonably possible that the total amounts of unrecognized tax benefits will significantly change in the next twelve months.
Multiple Class — All shares of the fund represent an equal pro rata interest in the net assets of the class to which such shares belong, and have identical voting, dividend, liquidation and other rights and the same terms and conditions, except for class specific expenses and exclusive rights to vote on matters affecting only individual classes. Income, non-class specific expenses, and realized and unrealized capital gains and losses of the fund are allocated to each class of shares based on their relative net assets.
Distributions to Shareholders — Distributions from net investment income, if any, are declared daily and paid monthly. Distributions from net realized gains, if any, are generally declared and paid annually.
Indemnifications — Under the trust’s organizational documents, its officers and trustees are indemnified against certain liabilities arising out of the performance of their duties to the fund. In addition, in the normal course of business, the fund enters into contracts that provide general indemnifications. The maximum exposure under these arrangements is unknown as this would involve future claims that may be made against a fund. The risk of material loss from such claims is considered by management to be remote.
3. Fees and Transactions with Related Parties
Certain officers and trustees of the trust are also officers and/or directors of American Century Companies, Inc. (ACC). The trust's investment advisor, ACIM, the trust's distributor, American Century Investment Services, Inc. (ACIS), and the trust's transfer agent, American Century Services, LLC, are wholly owned, directly or indirectly, by ACC.
Management Fees — The trust has entered into a management agreement with ACIM, under which ACIM provides the fund with investment advisory and management services in exchange for a single, unified management fee (the fee) per class. The agreement provides that ACIM will pay all expenses of managing and operating the fund, except brokerage expenses, taxes, interest, fees and expenses of the independent trustees (including legal counsel fees), extraordinary expenses, and expenses incurred in connection with the provision of shareholder services and distribution services under a plan adopted pursuant to Rule 12b-1 under the 1940 Act. The fee is computed and accrued daily based on each class's daily net assets and paid monthly in arrears. The difference in the fee among the classes is a result of their separate arrangements for non-Rule 12b-1 shareholder services. It is not the result of any difference in advisory or custodial fees or other expenses related to the management of the fund’s assets, which do not vary by class. The fee consists of (1) an Investment Category Fee based on the daily net assets of the fund and certain other accounts managed by the investment advisor that are in the same broad investment category as the fund and (2) a Complex Fee based on the assets of all the funds in the American Century Investments family of funds.
The Investment Category Fee range, the Complex Fee range and the effective annual management fee for each class for the period ended May 31, 2020 are as follows:
| | | | | | | | | | | |
| Investment Category Fee Range | Complex Fee Range | Effective Annual Management Fee |
| Investor Class | 0.1625%
to 0.2800% | 0.2500% to 0.3100% | 0.46% |
| I Class | | 0.0500% to 0.1100% | 0.26% |
| Y Class | | 0.0200% to 0.0800% | 0.23% |
| A Class | | 0.2500% to 0.3100% | 0.46% |
| C Class | | 0.2500% to 0.3100% | 0.46% |
Distribution and Service Fees — The Board of Trustees has adopted a separate Master Distribution and Individual Shareholder Services Plan for each of the A Class and C Class (collectively the plans), pursuant to Rule 12b-1 of the 1940 Act. The plans provide that the A Class will pay ACIS an annual distribution and service fee of 0.25%. The plans provide that the C Class will pay ACIS an annual distribution and service fee of 1.00%, of which 0.25% is paid for individual shareholder services and 0.75% is paid for distribution services. The fees are computed and accrued daily based on each class’s daily net assets and paid monthly in arrears. The fees are used to pay financial intermediaries for distribution and individual shareholder services. Fees incurred under the plans during the period ended May 31, 2020 are detailed in the Statement of Operations.
Trustees’ Fees and Expenses — The Board of Trustees is responsible for overseeing the investment advisor’s management and operations of the fund. The trustees receive detailed information about the fund and its investment advisor regularly throughout the year, and meet at least quarterly with management of the investment advisor to review reports about fund operations. The fund’s officers do not receive compensation from the fund.
Interfund Transactions — The fund may enter into security transactions with other American Century Investments funds and other client accounts of the investment advisor, in accordance with the 1940 Act rules and procedures adopted by the Board of Trustees. The rules and procedures require, among other things, that these transactions be effected at the independent current market price of the security. During the period, the interfund purchases and sales were $63,255,000 and $56,650,000, respectively. The interfund transactions had no effect on the Statement of Operations in net realized gain (loss) on investment transactions.
4. Investment Transactions
Purchases and sales of investment securities, excluding short-term investments, for the period ended May 31, 2020 were $2,165,994,192 and $1,955,903,949, respectively.
5. Capital Share Transactions
Transactions in shares of the fund were as follows (unlimited number of shares authorized):
| | | | | | | | | | | | | | |
| Year ended
May 31, 2020 | | Year ended
May 31, 2019 | |
| Shares | Amount | Shares | Amount |
| Investor Class | | | | |
| Sold | 20,583,514 | | $ | 237,608,370 | | 27,838,038 | | $ | 311,207,805 | |
| Issued in reinvestment of distributions | 2,383,075 | | 27,580,187 | | 2,827,758 | | 31,684,324 | |
| Redeemed | (32,536,959) | | (371,516,071) | | (51,428,750) | | (574,077,773) | |
| (9,570,370) | | (106,327,514) | | (20,762,954) | | (231,185,644) | |
| I Class | | | | |
| Sold | 46,936,172 | | 543,063,993 | | 72,650,556 | | 811,629,441 | |
| Issued in reinvestment of distributions | 2,386,050 | | 27,617,594 | | 2,277,388 | | 25,555,530 | |
| Redeemed | (71,945,933) | | (817,725,720) | | (34,073,442) | | (379,725,098) | |
| (22,623,711) | | (247,044,133) | | 40,854,502 | | 457,459,873 | |
| Y Class | | | | |
| Sold | 71,370,664 | | 815,169,823 | | 29,442,054 | | 330,066,982 | |
| Issued in reinvestment of distributions | 3,082,960 | | 35,638,964 | | 3,011,044 | | 33,736,047 | |
| Redeemed | (29,816,498) | | (340,049,485) | | (23,407,337) | | (261,397,109) | |
| 44,637,126 | | 510,759,302 | | 9,045,761 | | 102,405,920 | |
| A Class | | | | |
| Sold | 971,809 | | 11,223,337 | | 530,886 | | 5,945,006 | |
| Issued in reinvestment of distributions | 53,336 | | 617,004 | | 67,450 | | 755,090 | |
| Redeemed | (803,743) | | (9,250,977) | | (1,734,806) | | (19,352,025) | |
| 221,402 | | 2,589,364 | | (1,136,470) | | (12,651,929) | |
| C Class | | | | |
| Sold | 121,965 | | 1,405,506 | | 78,309 | | 873,338 | |
| Issued in reinvestment of distributions | 9,183 | | 106,183 | | 13,727 | | 153,608 | |
| Redeemed | (223,811) | | (2,577,040) | | (390,641) | | (4,356,707) | |
| (92,663) | | (1,065,351) | | (298,605) | | (3,329,761) | |
| Net increase (decrease) | 12,571,784 | | $ | 158,911,668 | | 27,702,234 | | $ | 312,698,459 | |
6. Fair Value Measurements
The fund’s investments valuation process is based on several considerations and may use multiple inputs to determine the fair value of the investments held by the fund. In conformity with accounting principles generally accepted in the United States of America, the inputs used to determine a valuation are classified into three broad levels.
•Level 1 valuation inputs consist of unadjusted quoted prices in an active market for identical investments.
•Level 2 valuation inputs consist of direct or indirect observable market data (including quoted prices for comparable investments, evaluations of subsequent market events, interest rates, prepayment speeds, credit risk, etc.). These inputs also consist of quoted prices for identical investments initially expressed in local currencies that are adjusted through translation into U.S. dollars.
•Level 3 valuation inputs consist of unobservable data (including a fund’s own assumptions).
The level classification is based on the lowest level input that is significant to the fair valuation measurement. The valuation inputs are not necessarily an indication of the risks associated with investing in these securities or other financial instruments.
The following is a summary of the level classifications as of period end. The Schedule of Investments provides additional information on the fund’s portfolio holdings.
| | | | | | | | | | | |
| | Level 1 | Level 2 | Level 3 |
| Assets | | | |
| Investment Securities | | | |
| Municipal Securities | — | | $ | 3,996,958,311 | | — | |
| Exchange-Traded Funds | $ | 20,194,110 | | — | | — | |
| $ | 20,194,110 | | $ | 3,996,958,311 | | — | |
7. Risk Factors
The value of the fund’s shares will go up and down, sometimes rapidly or unpredictably, based on the performance of the securities owned by the fund and other factors generally affecting the securities market. Market risks, including political, regulatory, economic and social developments, can affect the value of the fund’s investments. Natural disasters, public health emergencies, terrorism and other unforeseeable events may lead to increased market volatility and may have adverse long-term effects on world economies and markets generally.
The fund may invest in instruments that have variable or floating coupon rates based on the London Interbank Offered Rate (LIBOR). LIBOR is a benchmark interest rate intended to be representative of the rate at which certain major international banks lend to one another over short-terms. LIBOR will be phased out by the end of 2021. Uncertainty remains regarding a replacement rate or rates for LIBOR. The transition process may lead to increased volatility or illiquidity in markets for instruments that rely on LIBOR. This could result in a change to the value of such instruments.
8. Federal Tax Information
The tax character of distributions paid during the years ended May 31, 2020 and May 31, 2019 were as follows:
| | | | | | | | |
| 2020 | 2019 |
| Distributions Paid From | | |
| Exempt income | $ | 102,779,876 | | $ | 100,136,346 | |
| Long-term capital gains | — | | — | |
The book-basis character of distributions made during the year from net investment income or net realized gains may differ from their ultimate characterization for federal income tax purposes. These differences reflect the differing character of certain income items and net realized gains and losses for financial statement and tax purposes, and may result in reclassification among certain capital accounts on the financial statements.
As of period end, the federal tax cost of investments and the components of distributable earnings on a tax-basis were as follows:
| | | | | |
| Federal tax cost of investments | $ | 3,885,197,409 | |
| Gross tax appreciation of investments | $ | 164,547,954 | |
| Gross tax depreciation of investments | (32,592,942) | |
| Net tax appreciation (depreciation) of investments | $ | 131,955,012 | |
| Undistributed exempt income | — | |
| Accumulated short-term capital losses | $ | (16,857,666) | |
The cost of investments for federal income tax purposes was the same as the cost for financial reporting purposes.
Accumulated capital losses represent net capital loss carryovers that may be used to offset future realized capital gains for federal income tax purposes. The capital loss carryovers may be carried forward for an unlimited period. Future capital loss carryover utilization in any given year may be subject to Internal Revenue Code limitations.
9. Recently Issued Accounting Standards
In March 2017, the Financial Accounting Standards Board (FASB) issued Accounting Standards Update No. 2017-08, “Receivables - Nonrefundable Fees and Other Costs (Subtopic 310-20), Premium Amortization on Purchased Callable Debt Securities” (ASU 2017-08). ASU 2017-08 amends the amortization period for certain purchased callable debt securities held at a premium, shortening such period to the earliest call date. The amendments are effective for fiscal years, and interim periods within those fiscal years, beginning after December 15, 2018. The adoption of ASU 2017-08 did not materially impact the financial statements.
| | | | | | | | | | | | | | | | | | | | | | | | | | | | | | | | | | | |
| For a Share Outstanding Throughout the Years Ended May 31 (except as noted) | | | | | | | | | | | |
| Per-Share Data | | | | | | | | Ratios and Supplemental Data | | | |
| | Income From Investment Operations: | | | | | | Ratio to Average Net Assets of: | | | |
| Net Asset
Value,
Beginning
of Period | Net
Investment
Income
(Loss)(1) | Net
Realized
and
Unrealized
Gain (Loss) | Total From
Investment
Operations | Distributions From Net
Investment
Income | Net Asset
Value,
End
of Period | Total
Return(2) | Operating
Expenses | Net
Investment
Income
(Loss) | Portfolio
Turnover
Rate | Net
Assets,
End of
Period
(in thousands) |
| Investor Class | | | | | | | | | | | |
| 2020 | $11.49 | 0.28 | (0.04) | 0.24 | (0.28) | $11.45 | 2.09% | 0.47% | 2.43% | 49% | $1,094,742 | |
| 2019 | $11.18 | 0.30 | 0.31 | 0.61 | (0.30) | $11.49 | 5.57% | 0.47% | 2.69% | 40% | $1,208,725 | |
| 2018 | $11.37 | 0.30 | (0.19) | 0.11 | (0.30) | $11.18 | 0.95% | 0.47% | 2.63% | 36% | $1,408,019 | |
| 2017 | $11.56 | 0.29 | (0.19) | 0.10 | (0.29) | $11.37 | 0.87% | 0.47% | 2.52% | 54% | $1,559,408 | |
| 2016 | $11.33 | 0.29 | 0.23 | 0.52 | (0.29) | $11.56 | 4.66% | 0.47% | 2.55% | 32% | $1,624,065 | |
| I Class | | | | | | | | | | | |
| 2020 | $11.50 | 0.30 | (0.04) | 0.26 | (0.30) | $11.46 | 2.30% | 0.27% | 2.63% | 49% | $1,102,093 | |
| 2019 | $11.18 | 0.32 | 0.32 | 0.64 | (0.32) | $11.50 | 5.87% | 0.27% | 2.89% | 40% | $1,366,170 | |
| 2018 | $11.38 | 0.32 | (0.20) | 0.12 | (0.32) | $11.18 | 1.07% | 0.27% | 2.83% | 36% | $872,018 | |
| 2017 | $11.56 | 0.31 | (0.18) | 0.13 | (0.31) | $11.38 | 1.16% | 0.27% | 2.72% | 54% | $1,604,320 | |
| 2016 | $11.34 | 0.31 | 0.22 | 0.53 | (0.31) | $11.56 | 4.77% | 0.27% | 2.75% | 32% | $1,633,080 | |
| Y Class | | | | | | | | | | | |
| 2020 | $11.49 | 0.31 | (0.04) | 0.27 | (0.31) | $11.45 | 2.33% | 0.24% | 2.66% | 49% | $1,768,682 | |
| 2019 | $11.18 | 0.33 | 0.31 | 0.64 | (0.33) | $11.49 | 5.81% | 0.24% | 2.92% | 40% | $1,262,340 | |
| 2018 | $11.37 | 0.32 | (0.19) | 0.13 | (0.32) | $11.18 | 1.19% | 0.24% | 2.86% | 36% | $1,126,861 | |
2017(3) | $11.23 | 0.04 | 0.14 | 0.18 | (0.04) | $11.37 | 1.65% | 0.24%(4) | 2.83%(4) | 54%(5) | $5 | |
| | | | | | | | | | | | | | | | | | | | | | | | | | | | | | | | | | | |
| For a Share Outstanding Throughout the Years Ended May 31 (except as noted) | | | | | | | | | | | |
| Per-Share Data | | | | | | | | Ratios and Supplemental Data | | | |
| | Income From Investment Operations: | | | | | | Ratio to Average Net Assets of: | | | |
| Net Asset
Value,
Beginning
of Period | Net
Investment
Income
(Loss)(1) | Net
Realized
and
Unrealized
Gain (Loss) | Total From
Investment
Operations | Distributions From Net
Investment
Income | Net Asset
Value,
End
of Period | Total
Return(2) | Operating
Expenses | Net
Investment
Income
(Loss) | Portfolio
Turnover
Rate | Net
Assets,
End of
Period
(in thousands) |
| A Class | | | | | | | | | | | |
| 2020 | $11.50 | 0.25 | (0.05) | 0.20 | (0.25) | $11.45 | 1.75% | 0.72% | 2.18% | 49% | $29,854 | |
| 2019 | $11.18 | 0.27 | 0.32 | 0.59 | (0.27) | $11.50 | 5.40% | 0.72% | 2.44% | 40% | $27,415 | |
| 2018 | $11.38 | 0.27 | (0.20) | 0.07 | (0.27) | $11.18 | 0.61% | 0.72% | 2.38% | 36% | $39,379 | |
| 2017 | $11.56 | 0.26 | (0.18) | 0.08 | (0.26) | $11.38 | 0.70% | 0.72% | 2.27% | 54% | $59,168 | |
| 2016 | $11.34 | 0.26 | 0.22 | 0.48 | (0.26) | $11.56 | 4.30% | 0.72% | 2.30% | 32% | $70,224 | |
| C Class | | | | | | | | | | | |
| 2020 | $11.49 | 0.16 | (0.05) | 0.11 | (0.16) | $11.44 | 0.99% | 1.47% | 1.43% | 49% | $8,261 | |
| 2019 | $11.17 | 0.19 | 0.32 | 0.51 | (0.19) | $11.49 | 4.61% | 1.47% | 1.69% | 40% | $9,356 | |
| 2018 | $11.37 | 0.18 | (0.20) | (0.02) | (0.18) | $11.17 | (0.14)% | 1.47% | 1.63% | 36% | $12,437 | |
| 2017 | $11.55 | 0.17 | (0.18) | (0.01) | (0.17) | $11.37 | (0.05)% | 1.47% | 1.52% | 54% | $14,572 | |
| 2016 | $11.33 | 0.18 | 0.22 | 0.40 | (0.18) | $11.55 | 3.53% | 1.47% | 1.55% | 32% | $16,425 | |
| | |
| Notes to Financial Highlights |
(1)Computed using average shares outstanding throughout the period.
(2)Total returns are calculated based on the net asset value of the last business day and do not reflect applicable sales charges, if any. Total returns for periods less than one year are not annualized.
(3)April 10, 2017 (commencement of sale) through May 31, 2017.
(4)Annualized.
(5)Portfolio turnover is calculated at the fund level. Percentage indicated was calculated for the year ended May 31,2017.
See Notes to Financial Statements.
| | |
| Report of Independent Registered Public Accounting Firm |
To the Board of Trustees of American Century Municipal Trust and Shareholders of Intermediate-Term Tax-Free Bond Fund
Opinion on the Financial Statements
We have audited the accompanying statement of assets and liabilities, including the schedule of investments, of Intermediate-Term Tax-Free Bond Fund (one of the funds constituting American Century Municipal Trust, referred to hereafter as the “Fund”) as of May 31, 2020, the related statement of operations for the year ended May 31, 2020, the statement of changes in net assets for each of the two years in the period ended May 31, 2020, including the related notes, and the financial highlights for each of the periods indicated therein (collectively referred to as the “financial statements”). In our opinion, the financial statements present fairly, in all material respects, the financial position of the Fund as of May 31, 2020, the results of its operations for the year then ended, the changes in its net assets for each of the two years in the period ended May 31, 2020 and the financial highlights for each of the periods indicated therein in conformity with accounting principles generally accepted in the United States of America.
Basis for Opinion
These financial statements are the responsibility of the Fund’s management. Our responsibility is to express an opinion on the Fund’s financial statements based on our audits. We are a public accounting firm registered with the Public Company Accounting Oversight Board (United States) (PCAOB) and are required to be independent with respect to the Fund in accordance with the U.S. federal securities laws and the applicable rules and regulations of the Securities and Exchange Commission and the PCAOB.
We conducted our audits of these financial statements in accordance with the standards of the PCAOB. Those standards require that we plan and perform the audit to obtain reasonable assurance about whether the financial statements are free of material misstatement, whether due to error or fraud.
Our audits included performing procedures to assess the risks of material misstatement of the financial statements, whether due to error or fraud, and performing procedures that respond to those risks. Such procedures included examining, on a test basis, evidence regarding the amounts and disclosures in the financial statements. Our audits also included evaluating the accounting principles used and significant estimates made by management, as well as evaluating the overall presentation of the financial statements. Our procedures included confirmation of securities owned as of May 31, 2020 by correspondence with the custodian and brokers; when replies were not received from brokers, we performed other auditing procedures. We believe that our audits provide a reasonable basis for our opinion.
/s/ PricewaterhouseCoopers LLP
Kansas City, Missouri
July 21, 2020
We have served as the auditor of one or more investment companies in American Century Investments since 1997.
Board of Trustees
The individuals listed below serve as trustees of the funds. Each trustee will continue to serve in this capacity until death, retirement, resignation or removal from office. The board has adopted a mandatory retirement age for trustees who are not “interested persons,” as that term is defined in the Investment Company Act (independent trustees). Independent trustees shall retire on December 31 of the year in which they reach their 75th birthday; provided, however, that on or after January 1, 2022, independent trustees shall retire on December 31 of the year in which they reach their 76th birthday.
Mr. Thomas is an “interested person” because he currently serves as President and Chief Executive Officer of American Century Companies, Inc. (ACC), the parent company of American Century Investment Management, Inc. (ACIM or the advisor). The other trustees (more than three-fourths of the total number) are independent. They are not employees, directors or officers of, and have no financial interest in, ACC or any of its wholly owned, direct or indirect, subsidiaries, including ACIM, American Century Investment Services, Inc. (ACIS) and American Century Services, LLC (ACS), and they do not have any other affiliations, positions or relationships that would cause them to be considered “interested persons” under the Investment Company Act. The trustees serve in this capacity for eight (in the case of Jonathan S. Thomas, 16; and Ronald J. Gilson, 9) registered investment companies in the American Century Investments family of funds.
The following table presents additional information about the trustees. The mailing address for each trustee other than Mr. Thomas is 1665 Charleston Road, Mountain View, California 94043. The mailing address for Mr. Thomas is 4500 Main Street, Kansas City, Missouri 64111.
| | | | | | | | | | | | | | | | | |
Name
(Year of Birth) | Position(s) Held with Funds | Length of Time Served | Principal Occupation(s) During Past 5 Years | Number of American Century Portfolios Overseen by Trustee | Other Directorships Held During Past 5 Years |
| Independent Trustees | | | | | |
Tanya S. Beder
(1955) | Trustee | Since 2011 | Chairman and CEO, SBCC Group Inc. (independent advisory services) (2006 to present) | 40 | CYS Investments, Inc.; Kirby Corporation: Nabors Industries Ltd. |
Jeremy I. Bulow
(1954) | Trustee | Since 2011 | Professor of Economics, Stanford University, Graduate School of Business (1979 to present) | 40 | None |
Anne Casscells
(1958) | Trustee | Since 2016 | Co-Chief Executive Officer and Chief Investment Officer, Aetos Alternatives Management (investment advisory firm) (2001 to present); Lecturer in Accounting, Stanford University, Graduate School of Business (2009 to 2017) | 40 | None |
Ronald J. Gilson
(1946) | Trustee and Chairman of the Board | Since 1995
(Chairman since 2005) | Charles J. Meyers Professor of Law and Business, Emeritus, Stanford Law School (1979 to 2016); Marc and Eva Stern Professor of Law and Business, Columbia University School of Law (1992 to present) | 59 | None |
| | | | | | | | | | | | | | | | | |
Name
(Year of Birth) | Position(s) Held with Funds | Length of Time Served | Principal Occupation(s) During Past 5 Years | Number of American Century Portfolios Overseen by Trustee | Other Directorships Held During Past 5 Years |
| Independent Trustees | | | | | |
Frederick L. A. Grauer
(1946) | Trustee | Since 2008 | Senior Advisor, Credit
Sesame, Inc. (credit
monitoring firm) (2018 to
present); Senior Advisor,
Course Hero (an
educational technology
company) (2015 to present) | 40 | None |
Jonathan D. Levin
(1972) | Trustee | Since 2016 | Philip H. Knight Professor and Dean, Graduate School of Business, Stanford University (2016 to present); Professor, Stanford University, (2000 to present) | 40 | None |
Peter F. Pervere
(1947) | Trustee | Since 2007 | Retired | 40 | None |
John B. Shoven
(1947) | Trustee | Since 2002 | Charles R. Schwab Professor of Economics, Stanford University (1973 to present, emeritus since 2019) | 40 | Cadence Design Systems; Exponent; Financial Engines |
| Interested Trustee | | | | | |
Jonathan S. Thomas
(1963) | Trustee | Since 2007 | President and Chief Executive Officer, ACC (2007 to present). Also serves as Chief Executive Officer, ACS; Executive Vice President, ACIM; Director, ACC, ACIM and other ACC subsidiaries | 122 | None |
The Statement of Additional Information has additional information about the fund's trustees and is available without charge, upon request, by calling 1-800-345-2021.
Officers
The following table presents certain information about the executive officers of the funds. Each officer serves as an officer for 16 (in the case of Robert J. Leach, 15) investment companies in the American Century family of funds, unless otherwise noted. No officer is compensated for his or her service as an officer of the funds. The listed officers are interested persons of the funds and are appointed or re-appointed on an annual basis. The mailing address for each of the officers listed below is 4500 Main Street, Kansas City, Missouri 64111.
| | | | | | | | |
Name
(Year of Birth) | Offices with the Funds | Principal Occupation(s) During the Past Five Years |
Patrick Bannigan
(1965) | President since 2019 | Executive Vice President and Director, ACC (2012 to present); Chief Financial Officer, Chief Accounting Officer and Treasurer, ACC (2015 to present). Also serves as President, ACS; Vice President, ACIM; Chief Financial Officer, Chief Accounting Officer and/or Director, ACIM, ACS and other ACC subsidiaries |
R. Wes Campbell
(1974) | Chief Financial Officer
and Treasurer since 2018 | Vice President, ACS (2020 to present); Investment Operations and Investment Accounting, ACS (2000 to present) |
Amy D. Shelton
(1964) | Chief Compliance Officer and Vice President since 2014 | Chief Compliance Officer, American Century funds, (2014 to present); Chief Compliance Officer, ACIM (2014 to present); Chief Compliance Officer, ACIS (2009 to present). Also serves as Vice President, ACIS |
Charles A. Etherington
(1957) | General Counsel since 2007 and Senior Vice President since 2006 | Attorney, ACC (1994 to present); Vice President, ACC (2005 to present); General Counsel, ACC (2007 to present). Also serves as General Counsel, ACIM, ACS, ACIS and other ACC subsidiaries; and Senior Vice President, ACIM and ACS |
C. Jean Wade
(1964) | Vice President since 2012 | Senior Vice President, ACS (2017 to present); Vice President, ACS (2000 to 2017) |
Robert J. Leach
(1966) | Vice President since 2006 | Vice President, ACS (2000 to present) |
David H. Reinmiller
(1963) | Vice President since 2000 | Attorney, ACC (1994 to present). Also serves as Vice President, ACIM and ACS |
Ward D. Stauffer
(1960) | Secretary since 2005 | Attorney, ACC (2003 to present) |
| | |
| Liquidity Risk Management Program |
The Fund has adopted a liquidity risk management program (the “program”). The Fund’s Board of Trustees (the "Board") has designated American Century Investment Management, Inc. (“ACIM”) as the administrator of the program. Personnel of ACIM or its affiliates conduct the day-to-day operation of the program pursuant to policies and procedures administered by those members of the ACIM’s Investment Oversight Committee who are members of the ACIM’s Investment Management and Global Analytics departments.
Under the program, ACIM manages the Fund’s liquidity risk, which is the risk that the Fund could not meet shareholder redemption requests without significant dilution of remaining shareholders’ interests in the Fund. This risk is managed by monitoring the degree of liquidity of the Fund’s investments, limiting the amount of the Fund’s illiquid investments, and utilizing various risk management tools and facilities available to the Fund for meeting shareholder redemptions, among other means. ACIM’s process of determining the degree of liquidity of the Fund’s investments is supported by one or more third-party liquidity assessment vendors.
The Board reviewed a report prepared by ACIM regarding the operation and effectiveness of the program for the period December 1, 2018 through December 31, 2019. No significant liquidity events impacting the Fund were noted in the report. In addition, ACIM provided its assessment that the program had been effective in managing the Fund’s liquidity risk.
Retirement Account Information
As required by law, distributions you receive from certain retirement accounts are subject to federal income tax withholding, unless you elect not to have withholding apply*. Tax will be withheld on the total amount withdrawn even though you may be receiving amounts that are not subject to withholding, such as nondeductible contributions. In such case, excess amounts of withholding could occur. You may adjust your withholding election so that a greater or lesser amount will be withheld.
If you don’t want us to withhold on this amount, you must notify us to not withhold the federal income tax. You may notify us in writing or in certain situations by telephone or through other electronic means. For systematic withdrawals, your withholding election will remain in effect until revoked or changed by filing a new election. You have the right to revoke your election at any time and change your withholding percentage for future distributions.
Remember, even if you elect not to have income tax withheld, you are liable for paying income tax on the taxable portion of your withdrawal. If you elect not to have income tax withheld or you don’t have enough income tax withheld, you may be responsible for payment of estimated tax. You may incur penalties under the estimated tax rules if your withholding and estimated tax payments are not sufficient. You can reduce or defer the income tax on a distribution by directly or indirectly rolling such distribution over to another IRA or eligible plan. You should consult your tax advisor for additional information.
State tax will be withheld if, at the time of your distribution, your address is within one of the mandatory withholding states and you have federal income tax withheld (or as otherwise required by state law). State taxes will be withheld from your distribution in accordance with the respective state rules.
*Some 403(b), 457 and qualified retirement plan distributions may be subject to 20% mandatory withholding, as they are subject to special tax and withholding rules. Your plan administrator or plan sponsor is required to provide you with a special tax notice explaining those rules at the time you request a distribution. If applicable, federal and/or state taxes may be withheld from your distribution amount.
Proxy Voting Policies
Descriptions of the principles and policies that the fund's investment advisor uses in exercising the voting rights associated with the securities purchased and/or held by the fund are available without charge, upon request, by calling 1-800-345-2021 or visiting American Century Investments’ website at americancentury.com/proxy. A description of the policies is also available on the Securities and Exchange Commission’s website at sec.gov. Information regarding how the investment advisor voted proxies relating to portfolio securities during the most recent 12-month period ended June 30 is available on americancentury.com/proxy. It is also available at sec.gov.
Quarterly Portfolio Disclosure
The fund files its complete schedule of portfolio holdings with the Securities and Exchange
Commission (SEC) for the first and third quarters of each fiscal year as an exhibit to its reports on
Form N-PORT. The fund’s Form N-PORT reports are available on the SEC’s website at sec.gov.
The fund also makes its complete schedule of portfolio holdings for the most recent quarter of its
fiscal year available on its website at americancentury.com and, upon request, by calling
1-800-345-2021.
Other Tax Information
The following information is provided pursuant to provisions of the Internal Revenue Code.
The fund designates $102,138,804 as exempt interest dividends for the fiscal year ended May 31, 2020.
| | | | | | | | |
| | |
| | |
| Contact Us | americancentury.com | |
| Automated Information Line | 1-800-345-8765 | |
| Investor Services Representative | 1-800-345-2021
or 816-531-5575 | |
| Investors Using Advisors | 1-800-378-9878 | |
| Business, Not-For-Profit, Employer-Sponsored Retirement Plans | 1-800-345-3533 | |
| Banks and Trust Companies, Broker-Dealers, Financial Professionals, Insurance Companies | 1-800-345-6488 | |
| Telecommunications Relay Service for the Deaf | 711 | |
| | |
| American Century Municipal Trust | | |
| | |
Investment Advisor: American Century Investment Management, Inc. Kansas City, Missouri | | |
| | |
| This report and the statements it contains are submitted for the general information of our shareholders. The report is not authorized for distribution to prospective investors unless preceded or accompanied by an effective prospectus. | | |
| | |
©2020 American Century Proprietary Holdings, Inc. All rights reserved.
CL-ANN-92645 2007 | | |
| | | | | |
| |
| Annual Report |
| |
| May 31, 2020 |
| |
| Tax-Free Money Market Fund |
| Investor Class (BNTXX) |
Beginning on January 1, 2021, as permitted by regulations adopted by the Securities and Exchange Commission, paper copies of the fund’s shareholder reports like this one will no longer be sent by mail, unless you specifically request paper copies of the reports from the fund or from your financial intermediary, such as a broker-dealer or bank. Instead, the reports will be made available on a website, and you will be notified by mail each time a report is posted and provided with a website link to access the report.
If you already elected to receive shareholder reports electronically, you will not be affected by this change and you need not take any action. You may elect to receive shareholder reports and other communications from the fund or your financial intermediary electronically by calling or sending an email request to your appropriate contacts as listed on the back cover of this report.
You may elect to receive all future reports in paper free of charge. You can inform the fund or your financial intermediary that you wish to continue receiving paper copies of your shareholder reports by calling or sending an email request to your appropriate contacts as listed on the back cover of this report. Your election to receive reports in paper will apply to all funds held with the fund complex/your financial intermediary.
| | | | | |
| President’s Letter | |
| Performance | |
| Fund Characteristics | |
| Shareholder Fee Example | |
| Schedule of Investments | |
| Statement of Assets and Liabilities | |
| Statement of Operations | |
| Statement of Changes in Net Assets | |
| Notes to Financial Statements | |
| Financial Highlights | |
| Report of Independent Registered Public Accounting Firm | |
| Management | |
| |
| |
| Liquidity Risk Management Program | |
| Additional Information | |
Any opinions expressed in this report reflect those of the author as of the date of the report, and do not necessarily represent the opinions of American Century Investments® or any other person in the American Century Investments organization. Any such opinions are subject to change at any time based upon market or other conditions and American Century Investments disclaims any responsibility to update such opinions. These opinions may not be relied upon as investment advice and, because investment decisions made by American Century Investments funds are based on numerous factors, may not be relied upon as an indication of trading intent on behalf of any American Century Investments fund. Security examples are used for representational purposes only and are not intended as recommendations to purchase or sell securities. Performance information for comparative indices and securities is provided to American Century Investments by third party vendors. To the best of American Century Investments’ knowledge, such information is accurate at the time of printing.
Jonathan Thomas
Dear Investor:
Thank you for reviewing this annual report for the period ended May 31, 2020. Annual reports help convey important information about fund returns, including market factors that affected performance during the reporting period. For additional investment insights, please visit americancentury.com.
Pandemic Rattled Markets, But Most Munis Persevered
Through the first several months of the reporting period, municipal bonds (munis) generally advanced, as U.S. bond yields declined amid dovish Federal Reserve (Fed) policy. In July 2019, growing concerns about global economic risks and U.S.-China trade disputes prompted the Fed to cut short-term interest rates for the first time in 10 years. The Fed followed up with additional rate cuts in September and October, driving bond yields lower. Munis also benefited from stable credit fundamentals and favorable supply/demand dynamics.
Market sentiment abruptly changed in late February. The COVID-19 outbreak rapidly spread throughout the world, triggering stay-at-home orders, business shutdowns and recession fears. Risk assets, including munis, sold off sharply in a global flight to the safest, highest-quality securities. The Fed and the U.S. federal government stepped in quickly and aggressively to provide financial relief to companies, municipalities and individuals. As part of its efforts to stabilize the financial system, the Fed relaunched quantitative easing and added munis to the bond-buying plan. This unprecedented move helped investment-grade munis generate their best monthly performance since January 2009. The May rally was enough to push the broad asset class back into positive-return territory for the 12-month period. High-yield munis, which suffered greater losses in the market sell-off, declined for the reporting period.
As COVID-19 infection rates are slowing, much of the U.S. economy is reopening. Nevertheless, the return to pre-pandemic life will take time and patience. In the meantime, investors likely will face periods of economic and political uncertainty and heightened market volatility. While these influences can be unsettling, they tend to be temporary.
We appreciate your confidence in us during these extraordinary times. We have a long history of helping clients weather unpredictable markets, and we’re confident we will meet today's challenges.
Sincerely,
Jonathan Thomas
President and Chief Executive Officer
American Century Investments
| | | | | | | | | | | | | | | | | | | |
| Total Returns as of May 31, 2020 | | | | | | | |
| | | | | Average Annual Returns | | | |
| Ticker Symbol | | 1 year | 5 years | 10 years | | Inception Date |
| Investor Class | BNTXX | | 0.91% | 0.60% | 0.32% | | 7/31/84 |
Fund returns would have been lower if a portion of the fees had not been waived.
| | | | | |
Total Annual Fund Operating Expenses | |
| Investor Class | 0.50% |
The total annual fund operating expenses shown is as stated in the fund’s prospectus current as of the date of this report. The prospectus may vary from the expense ratio shown elsewhere in this report because it is based on a different time period, includes acquired fund fees and expenses, and, if applicable, does not include fee waivers or expense reimbursements.
Data presented reflect past performance. Past performance is no guarantee of future results. Current performance may be higher or lower than the performance shown. Total returns for periods less than one year are not annualized. To obtain performance data current to the most recent month end, please call 1-800-345-2021 or visit americancentury.com. For additional information about the fund, please consult the prospectus.
You could lose money by investing in the fund. Although the fund seeks to preserve the value of your investment at $1.00 per share, it cannot guarantee it will do so. The fund may impose a fee upon sale of your shares or may temporarily suspend your ability to sell shares if the fund’s liquidity falls below required minimums because of market conditions or other factors. An investment in the fund is not insured or guaranteed by the Federal Deposit Insurance Corporation or any other government agency. The fund’s sponsor has no legal obligation to provide financial support to the fund, and you should not expect that the sponsor will provide financial support to the fund at any time.
The 7-day current yield more closely reflects the current earnings of the fund than the total return.
| | | | | |
| MAY 31, 2020 | |
| 7-Day Current Yield | |
After waiver(1) | 0.01% |
| Before waiver | (0.25)% |
| 7-Day Effective Yield | |
After waiver(1) | 0.01% |
| (1) Yields would have been lower if a portion of the fees had not been waived | |
| |
Portfolio at a Glance | |
| Weighted Average Maturity | 12 days |
| Weighted Average Life | 14 days |
| | |
Portfolio Composition by Maturity | % of fund investments |
| 1-30 days | 94% |
| 31-90 days | 3% |
| 91-180 days | 3% |
| More than 180 days | — |
Fund shareholders may incur two types of costs: (1) transaction costs, including sales charges (loads) on purchase payments and redemption/exchange fees; and (2) ongoing costs, including management fees; distribution and service (12b-1) fees; and other fund expenses. This example is intended to help you understand your ongoing costs (in dollars) of investing in your fund and to compare these costs with the ongoing cost of investing in other mutual funds.
The example is based on an investment of $1,000 made at the beginning of the period and held for the entire period from December 1, 2019 to May 31, 2020.
Actual Expenses
The table provides information about actual account values and actual expenses for each class. You may use the information, together with the amount you invested, to estimate the expenses that you paid over the period. First, identify the share class you own. Then simply divide your account value by $1,000 (for example, an $8,600 account value divided by $1,000 = 8.6), then multiply the result by the number under the heading “Expenses Paid During Period” to estimate the expenses you paid on your account during this period.
If you hold Investor Class shares of any American Century Investments fund, or I Class shares of the American Century Diversified Bond Fund, in an American Century Investments account (i.e., not through a financial intermediary or employer-sponsored retirement plan account), American Century Investments may charge you a $25.00 annual account maintenance fee if the value of those shares is less than $10,000. We will redeem shares automatically in one of your accounts to pay the $25.00 fee. In determining your total eligible investment amount, we will include your investments in all personal accounts (including American Century Investments brokerage accounts) registered under your Social Security number. Personal accounts include individual accounts, joint accounts, UGMA/UTMA accounts, personal trusts, Coverdell Education Savings Accounts and IRAs (including traditional, Roth, Rollover, SEP-, SARSEP- and SIMPLE-IRAs), and certain other retirement accounts. If you have only business, business retirement, employer-sponsored or American Century Investments brokerage accounts, you are currently not subject to this fee. If you are subject to the account maintenance fee, your account value could be reduced by the fee amount.
Hypothetical Example for Comparison Purposes
The table also provides information about hypothetical account values and hypothetical expenses based on the actual expense ratio of each class of your fund and an assumed rate of return of 5% per year before expenses, which is not the actual return of a fund’s share class. The hypothetical account values and expenses may not be used to estimate the actual ending account balance or expenses you paid for the period. You may use this information to compare the ongoing costs of investing in your fund and other funds. To do so, compare this 5% hypothetical example with the 5% hypothetical examples that appear in the shareholder reports of the other funds.
Please note that the expenses shown in the table are meant to highlight your ongoing costs only and do not reflect any transactional costs, such as sales charges (loads) or redemption/exchange fees. Therefore, the table is useful in comparing ongoing costs only, and will not help you determine the relative total costs of owning different funds. In addition, if these transactional costs were included, your costs would have been higher.
| | | | | | | | | | | | | | |
| | Beginning
Account Value
12/1/19 | Ending
Account Value
5/31/20 | Expenses Paid
During Period(1)
12/1/19 - 5/31/20 | Annualized
Expense Ratio(1) |
Actual | | | | |
| Investor Class | $1,000 | $1,004.20 | $2.25 | 0.45% |
Hypothetical | | | | |
| Investor Class | $1,000 | $1,022.75 | $2.28 | 0.45% |
(1)Expenses are equal to the class's annualized expense ratio listed in the table above, multiplied by the average account value over the period, multiplied by 183, the number of days in the most recent fiscal half-year, divided by 366, to reflect the one-half year period. Annualized expense ratio reflects actual expenses, including any applicable fee waivers or expense reimbursements and excluding any acquired fund fees and expenses.
MAY 31, 2020
| | | | | | | | |
| Principal Amount | Value |
| MUNICIPAL SECURITIES — 98.6% | | |
| Alaska — 4.1% | | |
| State of Alaska International Airports System Rev., VRDN, 0.15%, 6/5/20 (LOC: State Street Bank & Trust Co.) | $ | 6,500,000 | | $ | 6,500,000 | |
| Arizona — 2.5% | | |
Tender Option Bond Trust Receipts/Certificates Rev., VRDN, 0.22%, 6/5/20 (LIQ FAC: Bank of America N.A.)(GA: Bank of America N.A.)(1) | 4,000,000 | | 4,000,000 | |
| California — 10.1% | | |
| California Statewide Communities Development Authority Rev., (Kelvin Court LP), VRDN, 0.25%, 6/5/20 (LOC: FNMA)(LIQ FAC: FNMA) | 4,300,000 | | 4,300,000 | |
| California Statewide Communities Development Authority Rev., (Salvation Army San Francisco Silvercrest LP), VRDN, 0.23%, 6/5/20 (LOC: FNMA)(LIQ FAC: FNMA) | 3,900,000 | | 3,900,000 | |
| California Statewide Communities Development Authority Rev., (Sarich Family Living Trust), VRDN, 0.36%, 6/5/20 (LOC: Bank of the West) | 1,200,000 | | 1,200,000 | |
| California Statewide Communities Development Authority Rev., (Uptown Newport Building Owner LP), VRDN, 0.20%, 6/5/20 (LOC: East West Bank, Zions Bank and FHLB) | 800,000 | | 800,000 | |
| Metropolitan Water District of Southern California Rev., VRN, 0.39%, (MUNIPSA plus 0.25%), 7/1/37 | 1,000,000 | | 1,000,000 | |
| State of California Department of Water Resources, 0.25%, 9/9/20 | 5,000,000 | | 5,000,000 | |
| | 16,200,000 | |
| Colorado — 0.6% | | |
| Jefferson County Rev., (Rocky Mountain Butterfly Consortium), VRDN, 0.24%, 6/4/20 (LOC: Wells Fargo Bank N.A.) | 885,000 | | 885,000 | |
| Delaware — 1.0% | | |
| Delaware State Economic Development Authority Rev., (YMCA of Delaware), VRDN, 0.13%, 6/5/20 (LOC: PNC Bank N.A.) | 1,590,000 | | 1,590,000 | |
| District of Columbia — 0.4% | | |
| District of Columbia Rev., (Pew Charitable Trusts), VRDN, 0.12%, 6/5/20 (LOC: PNC Bank N.A.) | 720,000 | | 720,000 | |
| Florida — 3.7% | | |
| Alachua County Housing Finance Authority Rev., (Santa Fe Apartments II Ltd.), VRDN, 0.16%, 6/5/20 (LOC: FNMA)(LIQ FAC: FNMA) | 700,000 | | 700,000 | |
| Hillsborough County Housing Finance Authority Rev., (Brandywine Housing Ltd.), VRDN, 0.22%, 6/5/20 (LOC: Citibank N.A.) | 620,000 | | 620,000 | |
| Hillsborough County Industrial Development Authority Rev., (Corbett Preparatory School of IDS, Inc.), VRDN, 0.32%, 6/5/20 (LOC: Bank of America N.A.) | 1,200,000 | | 1,200,000 | |
| Pinellas County Health Facilities Authority Rev., (Hospice of the Florida Suncoast, Inc.), VRDN, 0.19%, 6/5/20 (LOC: Wells Fargo Bank N.A.) | 800,000 | | 800,000 | |
| Sunshine State Governmental Financing Commission Rev., VRDN, 0.17%, 6/5/20 (LOC: MUFG Union Bank N.A.) | 2,600,000 | | 2,600,000 | |
| | 5,920,000 | |
| Georgia — 1.6% | | |
| Paulding County Hospital Authority Rev., (WellStar Health System Obligated Group), VRDN, 0.16%, 6/5/20 (LOC: Bank of America N.A.) | 1,500,000 | | 1,500,000 | |
| | | | | | | | |
| Principal Amount | Value |
| Valdosta-Lowndes County Industrial Development Authority Rev., (Steeda Autosports, Inc.), VRDN, 0.29%, 6/5/20 (LOC: Bank of America N.A.) | $ | 1,110,000 | | $ | 1,110,000 | |
| | 2,610,000 | |
| Illinois — 21.2% | | |
| Du Page County Rev., (Morton Arboretum), VRDN, 0.12%, 6/5/20 (LOC: Northern Trust Company) | 700,000 | | 700,000 | |
| Illinois Educational Facilities Authority Rev., (Lincoln Park Society), VRDN, 0.17%, 6/5/20 (LOC: Citibank N.A.) | 1,400,000 | | 1,400,000 | |
| Illinois Finance Authority Rev., (Advocate Health Care Network Obligated Group), VRDN, 0.15%, 6/5/20 (SBBPA: Northern Trust Company) | 3,220,000 | | 3,220,000 | |
| Illinois Finance Authority Rev., (Hospital Sisters Services Obligated Group), VRDN, 0.12%, 6/5/20 (LOC: Bank of Montreal) | 1,200,000 | | 1,200,000 | |
| Illinois Finance Authority Rev., (Illinois Wesleyan University), VRDN, 0.12%, 6/5/20 (LOC: PNC Bank N.A.) | 500,000 | | 500,000 | |
| Illinois Finance Authority Rev., (Uniform Law Foundation), VRDN, 0.15%, 6/5/20 (LOC: PNC Bank N.A.) | 2,740,000 | | 2,740,000 | |
| Illinois Housing Development Authority Rev., (Rome Meadows Associates III LP), VRDN, 0.53%, 6/5/20 (LOC: First National Bank and FHLB) | 1,510,000 | | 1,510,000 | |
| Illinois Housing Development Authority Rev., (Woodlawn Six LP), VRDN, 0.15%, 6/5/20 (LOC: FHLMC) | 6,395,000 | | 6,395,000 | |
| Lake County Rev., (Whispering Oaks Associates LP), VRDN, 0.16%, 6/5/20 (LIQ FAC: FHLMC) | 1,600,000 | | 1,600,000 | |
| Southwestern Illinois Development Authority Rev., (Waste Management, Inc.), VRDN, 0.20%, 6/5/20 (LOC: JPMorgan Chase Bank N.A.) | 4,300,000 | | 4,300,000 | |
Tender Option Bond Trust Receipts/Certificates GO, VRDN, 0.20%, 6/5/20 (AGM-CR)(LOC: Barclays Bank plc)(GA: Barclays Bank plc)(1) | 5,000,000 | | 5,000,000 | |
Tender Option Bond Trust Receipts/Certificates Rev., VRDN, 0.29%, 6/5/20 (LOC: Barclays Bank plc)(GA: Barclays Bank plc)(1) | 5,250,000 | | 5,250,000 | |
| | 33,815,000 | |
| Indiana — 1.1% | | |
Indiana Development Finance Authority Rev., (TTP, Inc.), VRDN, 0.36%, 6/5/20 (LOC: U.S. Bank N.A.)(1) | 1,050,000 | | 1,050,000 | |
| Indianapolis Rev., VRDN, 0.10%, 6/1/20 (LOC: U.S. Bank N.A.) | 775,000 | | 775,000 | |
| | 1,825,000 | |
| Iowa — 3.5% | | |
| Iowa Finance Authority Rev., (Geneseo Communications, Inc.), VRDN, 0.18%, 6/5/20 (LOC: Great Western Bank and U.S. Bank N.A.) | 5,545,000 | | 5,545,000 | |
| Kentucky — 0.3% | | |
| Hardin County Water District No. 1 Rev., Series 2002, VRDN, 0.17%, 6/5/20 (LOC: Cecilian Bank and FHLB) | 540,000 | | 540,000 | |
| Louisiana — 6.1% | | |
| Calcasieu Parish Industrial Development Board, Inc. Rev., (Hydroserve Westlake LLC), VRDN, 0.25%, 6/5/20 (LOC: JPMorgan Chase Bank N.A.) | 3,500,000 | | 3,500,000 | |
| East Baton Rouge Parish Industrial Development Board, Inc. Rev., (Exxon Mobil Corp.), VRDN, 0.07%, 6/1/20 | 800,000 | | 800,000 | |
| East Baton Rouge Parish Industrial Development Board, Inc. Rev., (Exxon Mobil Corp.), VRDN, 0.07%, 6/1/20 | 843,000 | | 843,000 | |
| Louisiana Housing Corp. Rev., (Reserve at Jefferson Crossing LLC), VRDN, 0.13%, 6/5/20 (LOC: FHLMC) | 1,560,000 | | 1,560,000 | |
| Terrebonne Economic Development Authority Rev., (Buquet Distributing Co, Inc.), VRDN, 1.14%, 6/5/20 (LOC: Community Bank and FHLB) | 3,020,000 | | 3,020,000 | |
| | 9,723,000 | |
| | | | | | | | |
| Principal Amount | Value |
| Maryland — 2.5% | | |
| Washington Suburban Sanitary Commission Rev., VRDN, 0.15%, 6/5/20 (CNTY GTD)(SBBPA: TD Bank N.A.) | $ | 3,000,000 | | $ | 3,000,000 | |
| Washington Suburban Sanitary Commission Rev., VRDN, 0.17%, 6/5/20 (CNTY GTD)(SBBPA: State Street Bank & Trust Co.) | 1,005,000 | | 1,005,000 | |
| | 4,005,000 | |
| Michigan — 1.0% | | |
Tender Option Bond Trust Receipts/Certificates Rev., VRDN, 0.18%, 6/5/20 (LIQ FAC: Barclays Bank plc)(1) | 1,635,000 | | 1,635,000 | |
| Minnesota — 3.3% | | |
| St. Paul Port Authority Rev., (Bigos-Sibley Tower LLC), VRDN, 0.26%, 6/5/20 (LIQ FAC: FHLMC) | 5,335,000 | | 5,334,962 | |
| Mississippi — 3.7% | | |
| Mississippi Business Finance Corp. Rev., (Chevron USA, Inc.), VRDN, 0.14%, 6/5/20 (GA: Chevron Corp.) | 1,100,000 | | 1,100,000 | |
| Mississippi Business Finance Corp. Rev., (Jackson Heart Realty LLC), VRDN, 0.18%, 6/5/20 (LOC: Trustmark National Bank and FHLB) | 2,825,000 | | 2,825,000 | |
| Mississippi Business Finance Corp. Rev., Series 2010 B (Chevron USA Inc.), VRDN, 0.14%, 6/5/20 (GA: Chevron Corp.) | 2,000,000 | | 2,000,000 | |
| | 5,925,000 | |
| Missouri — 0.4% | | |
| Wright City Rev., (MB Realty LLC), VRDN, 0.29%, 6/5/20 (LOC: Bank of America N.A.) | 580,000 | | 580,000 | |
| Nevada — 1.3% | | |
Tender Option Bond Trust Receipts/Certificates COP, VRDN, 0.21%, 6/5/20 (LIQ FAC: Barclays Bank plc)(1) | 2,000,000 | | 2,000,000 | |
| New Mexico — 0.4% | | |
| New Mexico Mortgage Finance Authority Rev., (Villas de San Ignacio LP), VRDN, 0.16%, 6/5/20 (LOC: FHLMC) | 650,000 | | 650,000 | |
| New York — 3.5% | | |
| Erie County Industrial Development Agency (The) Rev., (Our Lady of Victory Renaissance Corp.), VRDN, 0.19%, 6/5/20 (LOC: HSBC Bank USA N.A.) | 300,000 | | 300,000 | |
| Metropolitan Transportation Authority Rev., VRDN, 0.13%, 6/5/20 (LOC: PNC Bank N.A.) | 1,900,000 | | 1,900,000 | |
| Metropolitan Transportation Authority Rev., VRDN, 0.13%, 6/5/20 (LOC: PNC Bank N.A.) | 1,600,000 | | 1,600,000 | |
| New York City Transitional Finance Authority Future Tax Secured Rev., VRDN, 0.06%, 6/1/20 (SBBPA: Barclays Bank plc) | 300,000 | | 300,000 | |
| New York City Water & Sewer System Rev., VRDN, 0.13%, 6/5/20 (SBBPA: PNC Bank N.A.) | 625,000 | | 625,000 | |
| North Amityville Fire Co., Inc. Rev., VRDN, 0.34%, 6/5/20 (LOC: Citibank N.A.) | 800,000 | | 800,000 | |
| | 5,525,000 | |
| North Carolina — 0.9% | | |
| Lower Cape Fear Water & Sewer Authority Rev., VRDN, 0.16%, 6/5/20 (LOC: Cooperatieve Rabobank U.A.) | 855,000 | | 855,000 | |
| North Carolina Capital Facilities Finance Agency Rev., (Lees-McRae College, Inc.), VRDN, 0.24%, 6/5/20 (LOC: Branch Banking & Trust) | 560,000 | | 560,000 | |
| | 1,415,000 | |
| Ohio — 1.0% | | |
| Hamilton County Rev., (Children's Home of Cincinnati Ohio), VRDN, 0.16%, 6/5/20 (LOC: U.S. Bank N.A.) | 850,000 | | 850,000 | |
| State of Ohio Rev., VRDN, 0.30%, 6/5/20 (LOC: PNC Bank N.A.) (GA: Patheon, Inc.) | 740,000 | | 740,000 | |
| | 1,590,000 | |
| | | | | | | | |
| Principal Amount | Value |
| Pennsylvania — 0.8% | | |
Tender Option Bond Trust Receipts/Certificates Rev., VRDN, 0.24%, 6/5/20 (LOC: Barclays Bank plc)(LIQ FAC: Barclays Bank plc)(1) | $ | 1,230,000 | | $ | 1,230,000 | |
| Rhode Island — 2.2% | | |
| Rhode Island Health & Educational Building Corp. Rev., (Bryant University), VRDN, 0.17%, 6/5/20 (LOC: TD Bank N.A.) | 2,865,000 | | 2,865,000 | |
| Rhode Island Health & Educational Building Corp. Rev., (New England Institute of Technology), VRDN, 0.16%, 6/5/20 (LOC: TD Bank N.A.) | 660,000 | | 660,000 | |
| | 3,525,000 | |
| South Carolina — 0.4% | | |
| South Carolina State Housing Finance & Development Authority Rev., (Brookside Crossing LLC), VRDN, 0.16%, 6/5/20 (LOC: FHLMC)(LIQ FAC: FHLMC) | 600,000 | | 600,000 | |
| Tennessee — 5.5% | | |
| Clarksville Public Building Authority Rev., VRDN, 0.16%, 6/5/20 (LOC: Bank of America N.A.) | 920,000 | | 920,000 | |
Clarksville Public Building Authority Rev., VRDN, 0.16%, 6/5/20 (LOC: Bank of America N.A.) (Acquired 12/2/19 -1/6/20, Cost $1,120,000)(2) | 1,120,000 | | 1,120,000 | |
| Metropolitan Government Nashville & Davidson County Industrial Development Board Rev., (Starwood Properties Four LLC), VRDN, 0.16%, 6/5/20 (LOC: FNMA)(LIQ FAC: FNMA) | 1,025,000 | | 1,025,000 | |
Tender Option Bond Trust Receipts/Certificates Rev., VRDN, 0.26%, 6/5/20 (LIQ FAC: JPMorgan Chase Bank N.A.)(1) | 5,000,000 | | 5,000,000 | |
Wilson County Sports Authority Rev., VRDN, 0.13%, 6/5/20 (LOC: PNC Bank N.A.) (Acquired 3/24/20 Cost $800,000)(2) | 800,000 | | 800,000 | |
| | 8,865,000 | |
| Texas — 7.9% | | |
| Harris County Hospital District Rev., VRDN, 0.18%, 6/5/20 (LOC: JPMorgan Chase Bank N.A.) | 1,015,000 | | 1,015,000 | |
| Mission Economic Development Corp. Rev., VRDN, 0.29%, 6/5/20 (LOC: Wells Fargo Bank N.A.) | 2,410,000 | | 2,410,000 | |
| Port of Port Arthur Navigation District Rev., (Chevron Corp.), VRDN, 0.07%, 6/1/20 | 1,000,000 | | 1,000,000 | |
| State of Texas GO, VRDN, 0.12%, 6/5/20 (SBBPA: FHLB) | 775,000 | | 775,000 | |
| State of Texas GO, VRDN, 0.20%, 6/5/20 (SBBPA: State Street Bank & Trust Co.) | 1,780,000 | | 1,780,000 | |
| State of Texas GO, VRDN, 0.20%, 6/5/20 (LIQ FAC: State Street Bank & Trust Co.) | 600,000 | | 600,000 | |
| State of Texas Rev., 4.00%, 8/27/20 | 3,000,000 | | 3,019,371 | |
| University of Texas System Rev., VRDN, 0.11%, 6/5/20 | 2,000,000 | | 2,000,000 | |
| | 12,599,371 | |
| Washington — 2.8% | | |
| Pierce County Economic Development Corp. Rev., (Sumner Leasing LLC), VRDN, 0.29%, 6/5/20 (LOC: FHLB and Homestreet Bank) | 1,400,000 | | 1,400,000 | |
| Port of Chehalis Industrial Development Corp. Rev., (JLT Holding LLC), VRDN, 0.24%, 6/5/20 (LOC: Wells Fargo Bank N.A.) | 855,000 | | 855,000 | |
| Washington State Housing Finance Commission Rev., (Block 24 LLC), VRDN, 0.15%, 6/5/20 (LIQ FAC: FHLMC) | 2,190,000 | | 2,190,000 | |
| | 4,445,000 | |
| West Virginia — 1.5% | | |
| West Virginia Hospital Finance Authority Rev., (West Virginia United Health System Obligated Group), VRDN, 0.12%, 6/5/20 (LOC: PNC Bank N.A.) | 2,350,000 | | 2,350,000 | |
| Wisconsin — 3.3% | | |
| Wisconsin Health & Educational Facilities Authority Rev., (Aspirus, Inc. Obligated Group), VRDN, 0.15%, 6/5/20 (LOC: JPMorgan Chase Bank N.A.) | 1,100,000 | | 1,100,000 | |
| | | | | | | | |
| Principal Amount | Value |
| Wisconsin Housing & Economic Development Authority Rev., VRDN, 0.14%, 6/5/20 (Housing and Urban Development Loan)(LOC: Bank of America N.A.) | $ | 1,000,000 | | $ | 1,000,000 | |
| Wisconsin Housing & Economic Development Authority Rev., VRDN, 0.18%, 6/5/20 (Housing and Urban Development Loan)(LOC: Bank of America N.A.) | 500,000 | | 500,000 | |
| Wisconsin Housing & Economic Development Authority Rev., VRDN, 0.19%, 6/5/20 (GO of Authority Housing and Urban Development Loan)(LOC: Bank of America N.A.) | 2,670,000 | | 2,670,000 | |
| | 5,270,000 | |
| TOTAL INVESTMENT SECURITIES — 98.6% | | 157,417,333 | |
| OTHER ASSETS AND LIABILITIES — 1.4% | | 2,274,150 | |
| TOTAL NET ASSETS — 100.0% | | $ | 159,691,483 | |
| | | | | | | | |
| NOTES TO SCHEDULE OF INVESTMENTS | | |
| AGM-CR | - | Assured Guaranty Municipal Corporation - Custodian Receipts |
| CNTY GTD | - | County Guaranteed |
| COP | - | Certificates of Participation |
| FHLB | - | Federal Home Loan Bank |
| FHLMC | - | Federal Home Loan Mortgage Corporation |
| FNMA | - | Federal National Mortgage Association |
| GA | - | Guaranty Agreement |
| GO | - | General Obligation |
| LIQ FAC | - | Liquidity Facilities |
| LOC | - | Letter of Credit |
| MUNIPSA | - | SIFMA Municipal Swap Index |
| SBBPA | - | Standby Bond Purchase Agreement |
| VRDN | - | Variable Rate Demand Note. The instrument may be payable upon demand and adjusts periodically based upon the terms set forth in the security's offering documents. The rate shown is effective at the period end and the reference rate and spread, if any, is indicated. The date of the demand feature is disclosed. |
| VRN | - | Variable Rate Note. The rate adjusts periodically based upon the terms set forth in the security’s offering documents. The rate shown is effective at the period end and the reference rate and spread, if any, is indicated. The security's effective maturity date may be shorter than the final maturity date shown. |
(1)Security was purchased pursuant to Rule 144A under the Securities Act of 1933 and may be sold in transactions exempt from registration, normally to qualified institutional investors. The aggregate value of these securities at the period end was $25,165,000, which represented 15.8% of total net assets.
(2)Restricted security that may not be offered for public sale without being registered with the Securities and Exchange Commission and/or may be subject to resale, redemption or transferability restrictions. The aggregate value of these securities at the period end was $1,920,000, which represented 1.2% of total net assets.
See Notes to Financial Statements.
| | |
| Statement of Assets and Liabilities |
| | | | | |
| MAY 31, 2020 | |
| Assets | |
| Investment securities, at value (amortized cost and cost for federal income tax purposes) | $ | 157,417,333 | |
| Cash | 12,462 | |
| Receivable for investments sold | 1,895,003 | |
| Receivable for capital shares sold | 167,397 | |
| Interest receivable | 247,533 | |
| 159,739,728 | |
| |
| Liabilities | |
| Payable for capital shares redeemed | 13,129 | |
| Accrued management fees | 35,106 | |
| Dividends payable | 10 | |
| 48,245 | |
| |
| Net Assets | $ | 159,691,483 | |
| |
| Investor Class Capital Shares | |
| Shares outstanding (unlimited number of shares authorized) | 159,711,314 | |
| |
| Net Asset Value Per Share | $ | 1.00 | |
| |
| Net Assets Consist of: | |
| Capital paid in | $ | 159,691,483 | |
See Notes to Financial Statements.
| | | | | |
| YEAR ENDED MAY 31, 2020 | |
| Investment Income (Loss) | |
| Income: | |
| Interest | $ | 1,916,383 | |
| |
| Expenses: | |
| Management fees | 687,565 | |
| Trustees' fees and expenses | 10,606 | |
| Other expenses | 4,286 | |
| 702,457 | |
| Fees waived | (40,404) | |
| 662,053 | |
| |
| Net investment income (loss) | 1,254,330 | |
| |
| |
| |
| Net Increase (Decrease) in Net Assets Resulting from Operations | $ | 1,254,330 | |
See Notes to Financial Statements.
| | |
| Statement of Changes in Net Assets |
| | | | | | | | |
| YEARS ENDED MAY 31, 2020 AND MAY 31, 2019 | | |
| Increase (Decrease) in Net Assets | May 31, 2020 | May 31, 2019 |
| Operations | | |
| Net investment income (loss) | $ | 1,254,330 | | $ | 1,497,354 | |
| | |
| Distributions to Shareholders | | |
| From earnings | (1,254,330) | | (1,508,964) | |
| | |
| Capital Share Transactions | | |
| Proceeds from shares sold | 160,467,538 | | 65,491,820 | |
| Proceeds from reinvestment of distributions | 1,233,495 | | 1,500,721 | |
| Payments for shares redeemed | (131,168,408) | | (76,068,701) | |
| Net increase (decrease) in net assets from capital share transactions | 30,532,625 | | (9,076,160) | |
| | |
| Net increase (decrease) in net assets | 30,532,625 | | (9,087,770) | |
| | |
| Net Assets | | |
| Beginning of period | 129,158,858 | | 138,246,628 | |
| End of period | $ | 159,691,483 | | $ | 129,158,858 | |
| | |
| | |
| | |
| Transactions in Shares of the Fund | | |
| Sold | 160,467,538 | | 65,491,820 | |
| Issued in reinvestment of distributions | 1,233,495 | | 1,500,721 | |
| Redeemed | (131,168,408) | | (76,068,701) | |
| Net increase (decrease) in shares of the fund | 30,532,625 | | (9,076,160) | |
See Notes to Financial Statements.
| | |
| Notes to Financial Statements |
MAY 31, 2020
1. Organization
American Century Municipal Trust (the trust) is registered under the Investment Company Act of 1940, as amended (the 1940 Act), as an open-end management investment company and is organized as a Massachusetts business trust. Tax-Free Money Market Fund (the fund) is one fund in a series issued by the trust. The fund’s investment objective is to seek safety of principal and high current income that is exempt from federal income tax.
2. Significant Accounting Policies
The following is a summary of significant accounting policies consistently followed by the fund in preparation of its financial statements. The fund is an investment company and follows accounting and reporting guidance in accordance with accounting principles generally accepted in the United States of America. This may require management to make certain estimates and assumptions at the date of the financial statements. Actual results could differ from these estimates. Management evaluated the impact of events or transactions occurring through the date the financial statements were issued that would merit recognition or disclosure.
Investment Valuations — The fund determines the fair value of its investments and computes its net asset value per share at the close of regular trading (usually 4 p.m. Eastern time) on the New York Stock Exchange (NYSE) on each day the NYSE is open. Investments are generally valued at amortized cost, which approximates fair value. If the fund determines that the amortized cost does not reflect an investment’s fair value, such investment is valued as determined in good faith by the Board of Trustees or its delegate, in accordance with policies and procedures adopted by the Board of Trustees.
Security Transactions — Security transactions are accounted for as of the trade date. Net realized gains and losses are determined on the identified cost basis, which is also used for federal income tax purposes.
Investment Income — Interest income is recorded on the accrual basis and includes accretion of discounts and amortization of premiums.
Income Tax Status — It is the fund’s policy to distribute substantially all net investment income and net realized gains to shareholders and to otherwise qualify as a regulated investment company under provisions of the Internal Revenue Code. Accordingly, no provision has been made for income taxes. The fund files U.S. federal, state, local and non-U.S. tax returns as applicable. The fund's tax returns are subject to examination by the relevant taxing authority until expiration of the applicable statute of limitations, which is generally three years from the date of filing but can be longer in certain jurisdictions. At this time, management believes there are no uncertain tax positions which, based on their technical merit, would not be sustained upon examination and for which it is reasonably possible that the total amounts of unrecognized tax benefits will significantly change in the next twelve months.
Distributions to Shareholders — Distributions from net investment income, if any, are declared daily and paid monthly. The fund may make capital gains distributions to comply with the distribution requirements of the Internal Revenue Code.
Indemnifications — Under the trust’s organizational documents, its officers and trustees are indemnified against certain liabilities arising out of the performance of their duties to the fund. In addition, in the normal course of business, the fund enters into contracts that provide general indemnifications. The maximum exposure under these arrangements is unknown as this would involve future claims that may be made against a fund. The risk of material loss from such claims is considered by management to be remote.
3. Fees and Transactions with Related Parties
Certain officers and trustees of the trust are also officers and/or directors of American Century Companies, Inc. (ACC). The trust's investment advisor, American Century Investment Management, Inc. (ACIM), the trust's distributor, American Century Investment Services, Inc., and the trust's transfer agent, American Century Services, LLC, are wholly owned, directly or indirectly, by ACC.
Management Fees — The trust has entered into a management agreement with ACIM, under which ACIM provides the fund with investment advisory and management services in exchange for a single, unified management fee (the fee). The agreement provides that ACIM will pay all expenses of managing and operating the fund, except brokerage expenses, taxes, interest, fees and expenses of the independent trustees (including legal counsel fees), and extraordinary expenses. The fee is computed and accrued daily based on the daily net assets of the fund and paid monthly in arrears. The fee consists of (1) an Investment Category Fee based on the daily net assets of the fund and certain other accounts managed by the investment advisor that are in the same broad investment category as the fund and (2) a Complex Fee based on the assets of all the funds in the American Century Investments family of funds. In order to maintain a positive yield, ACIM may voluntarily waive a portion of the management fee on a daily basis. The fee waiver may be revised or terminated at any time by the investment advisor without notice. The rates for the Investment Category Fee range from 0.1570% to 0.2700% and the rates for the Complex Fee range from 0.2500% to 0.3100%. The effective annual management fee for the period ended May 31, 2020 was 0.49% before waiver and 0.46% after waiver.
Trustees’ Fees and Expenses — The Board of Trustees is responsible for overseeing the investment advisor’s management and operations of the fund. The trustees receive detailed information about the fund and its investment advisor regularly throughout the year, and meet at least quarterly with management of the investment advisor to review reports about fund operations. The fund’s officers do not receive compensation from the fund.
Interfund Transactions — The fund may enter into security transactions with other American Century Investments funds and other client accounts of the investment advisor, in accordance with the 1940 Act rules and procedures adopted by the Board of Trustees. The rules and procedures require, among other things, that these transactions be effected at the independent current market price of the security. During the period, the interfund purchases and sales were $24,975,000 and $23,530,000, respectively. The interfund transactions had no effect on the Statement of Operations in net realized gain (loss) on investment transactions.
4. Fair Value Measurements
The fund’s investments valuation process is based on several considerations and may use multiple inputs to determine the fair value of the investments held by the fund. In conformity with accounting principles generally accepted in the United States of America, the inputs used to determine a valuation are classified into three broad levels.
• Level 1 valuation inputs consist of unadjusted quoted prices in an active market for identical investments.
• Level 2 valuation inputs consist of direct or indirect observable market data (including quoted prices for comparable investments, evaluations of subsequent market events, interest rates, prepayment speeds, credit risk, etc.). These inputs also consist of quoted prices for identical investments initially expressed in local currencies that are adjusted through translation into U.S. dollars.
• Level 3 valuation inputs consist of unobservable data (including a fund’s own assumptions).
The level classification is based on the lowest level input that is significant to the fair valuation measurement. The valuation inputs are not necessarily an indication of the risks associated with investing in these securities or other financial instruments.
As of period end, the fund’s investment securities were classified as Level 2. The Schedule of Investments provides additional information on the fund’s portfolio holdings.
5. Federal Tax Information
The tax character of distributions paid during the years ended May 31, 2020 and May 31, 2019 were as follows:
| | | | | | | | |
| 2020 | 2019 |
| Distributions Paid From | | |
| Exempt income | $ | 1,254,330 | | $ | 1,497,354 | |
| Long-term capital gains | — | | $ | 11,610 | |
The book-basis character of distributions made during the year from net investment income or net realized gains may differ from their ultimate characterization for federal income tax purposes. These differences reflect the differing character of certain income items and net realized gains and losses for financial statement and tax purposes, and may result in reclassification among certain capital accounts on the financial statements.
6. Recently Issued Accounting Standards
In March 2017, the Financial Accounting Standards Board (FASB) issued Accounting Standards Update No. 2017-08, “Receivables - Nonrefundable Fees and Other Costs (Subtopic 310-20), Premium Amortization on Purchased Callable Debt Securities” (ASU 2017-08). ASU 2017-08 amends the amortization period for certain purchased callable debt securities held at a premium, shortening such period to the earliest call date. The amendments are effective for fiscal years, and interim periods within those fiscal years, beginning after December 15, 2018. The adoption of ASU 2017-08 did not materially impact the financial statements.
| | | | | | | | | | | | | | | | | | | | | | | | | | | | | | | | | | | | | | | | | | | | |
| For a Share Outstanding Throughout the Years Ended May 31 (except as noted) | | | | | | | | | | | | | | |
| Per-Share Data | | | | | | | | | | Ratios and Supplemental Data | | | | |
| | | Income From Investment Operations: | | | Distributions From: | | | | | Ratio to Average Net Assets of: | | | | |
| | Net
Asset Value, Beginning
of Period | Net
Investment
Income
(Loss) | Net
Realized
and
Unrealized Gain (Loss) | Total
From
Investment
Operations | Net Investment Income | Net Realized Gains | Total Distributions | Net Asset Value,
End of Period | Total Return(1) | Operating
Expenses | Operating
Expenses
(before
expense waiver) | Net
Investment
Income
(Loss) | Net Investment Income (Loss) (before expense waiver) | Net Assets,
End of Period
(in thousands) |
| Investor Class | | | | | | | | | | | | | | |
| 2020 | $1.00 | 0.01 | — | 0.01 | (0.01) | — | (0.01) | $1.00 | 0.91% | 0.47% | 0.50% | 0.90% | 0.87% | $159,691 | |
| 2019 | $1.00 | 0.01 | — | 0.01 | (0.01) | —(2) | (0.01) | $1.00 | 1.12% | 0.50% | 0.50% | 1.11% | 1.11% | $129,159 | |
| 2018 | $1.00 | 0.01 | —(2) | 0.01 | (0.01) | — | (0.01) | $1.00 | 0.69% | 0.50% | 0.50% | 0.69% | 0.69% | $138,247 | |
| 2017 | $1.00 | —(2) | — | —(2) | —(2) | —(2) | —(2) | $1.00 | 0.28% | 0.50% | 0.50% | 0.27% | 0.27% | $137,390 | |
| 2016 | $1.00 | —(2) | —(2) | —(2) | —(2) | — | —(2) | $1.00 | 0.02% | 0.23% | 0.50% | 0.02% | (0.25)% | $153,686 | |
| | |
| Notes to Financial Highlights |
(1)Total returns are calculated based on the net asset value of the last business day. Total returns for periods less than one year are not annualized.
(2)Per-share amount was less than $0.005.
See Notes to Financial Statements.
| | |
| Report of Independent Registered Public Accounting Firm |
To the Board of Trustees of American Century Municipal Trust and Shareholders of Tax-Free Money Market Fund
Opinion on the Financial Statements
We have audited the accompanying statement of assets and liabilities, including the schedule of investments, of Tax-Free Money Market Fund (one of the funds constituting American Century Municipal Trust, referred to hereafter as the “Fund”) as of May 31, 2020, the related statement of operations for the year ended May 31, 2020, the statement of changes in net assets for each of the two years in the period ended May 31, 2020, including the related notes, and the financial highlights for each of the five years in the period ended May 31, 2020 (collectively referred to as the “financial statements”). In our opinion, the financial statements present fairly, in all material respects, the financial position of the Fund as of May 31, 2020, the results of its operations for the year then ended, the changes in its net assets for each of the two years in the period ended May 31, 2020 and the financial highlights for each of the five years in the period ended May 31, 2020 in conformity with accounting principles generally accepted in the United States of America.
Basis for Opinion
These financial statements are the responsibility of the Fund’s management. Our responsibility is to express an opinion on the Fund’s financial statements based on our audits. We are a public accounting firm registered with the Public Company Accounting Oversight Board (United States) (PCAOB) and are required to be independent with respect to the Fund in accordance with the U.S. federal securities laws and the applicable rules and regulations of the Securities and Exchange Commission and the PCAOB.
We conducted our audits of these financial statements in accordance with the standards of the PCAOB. Those standards require that we plan and perform the audit to obtain reasonable assurance about whether the financial statements are free of material misstatement, whether due to error or fraud.
Our audits included performing procedures to assess the risks of material misstatement of the financial statements, whether due to error or fraud, and performing procedures that respond to those risks. Such procedures included examining, on a test basis, evidence regarding the amounts and disclosures in the financial statements. Our audits also included evaluating the accounting principles used and significant estimates made by management, as well as evaluating the overall presentation of the financial statements. Our procedures included confirmation of securities owned as of May 31, 2020 by correspondence with the custodian. We believe that our audits provide a reasonable basis for our opinion.
/s/ PricewaterhouseCoopers LLP
Kansas City, Missouri
July 21, 2020
We have served as the auditor of one or more investment companies in American Century Investments since 1997.
Board of Trustees
The individuals listed below serve as trustees of the funds. Each trustee will continue to serve in this capacity until death, retirement, resignation or removal from office. The board has adopted a mandatory retirement age for trustees who are not “interested persons,” as that term is defined in the Investment Company Act (independent trustees). Independent trustees shall retire on December 31 of the year in which they reach their 75th birthday; provided, however, that on or after January 1, 2022, independent trustees shall retire on December 31 of the year in which they reach their 76th birthday.
Mr. Thomas is an “interested person” because he currently serves as President and Chief Executive Officer of American Century Companies, Inc. (ACC), the parent company of American Century Investment Management, Inc. (ACIM or the advisor). The other trustees (more than three-fourths of the total number) are independent. They are not employees, directors or officers of, and have no financial interest in, ACC or any of its wholly owned, direct or indirect, subsidiaries, including ACIM, American Century Investment Services, Inc. (ACIS) and American Century Services, LLC (ACS), and they do not have any other affiliations, positions or relationships that would cause them to be considered “interested persons” under the Investment Company Act. The trustees serve in this capacity for eight (in the case of Jonathan S. Thomas, 16; and Ronald J. Gilson, 9) registered investment companies in the American Century Investments family of funds.
The following table presents additional information about the trustees. The mailing address for each trustee other than Mr. Thomas is 1665 Charleston Road, Mountain View, California 94043. The mailing address for Mr. Thomas is 4500 Main Street, Kansas City, Missouri 64111.
| | | | | | | | | | | | | | | | | |
Name
(Year of Birth) | Position(s) Held with Funds | Length of Time Served | Principal Occupation(s) During Past 5 Years | Number of American Century Portfolios Overseen by Trustee | Other Directorships Held During Past 5 Years |
| Independent Trustees | | | | | |
Tanya S. Beder
(1955) | Trustee | Since 2011 | Chairman and CEO, SBCC Group Inc. (independent advisory services) (2006 to present) | 40 | CYS Investments, Inc.; Kirby Corporation: Nabors Industries Ltd. |
Jeremy I. Bulow
(1954) | Trustee | Since 2011 | Professor of Economics, Stanford University, Graduate School of Business (1979 to present) | 40 | None |
Anne Casscells
(1958) | Trustee | Since 2016 | Co-Chief Executive Officer and Chief Investment Officer, Aetos Alternatives Management (investment advisory firm) (2001 to present); Lecturer in Accounting, Stanford University, Graduate School of Business (2009 to 2017) | 40 | None |
Ronald J. Gilson
(1946) | Trustee and Chairman of the Board | Since 1995
(Chairman since 2005) | Charles J. Meyers Professor of Law and Business, Emeritus, Stanford Law School (1979 to 2016); Marc and Eva Stern Professor of Law and Business, Columbia University School of Law (1992 to present) | 59 | None |
| | | | | | | | | | | | | | | | | |
Name
(Year of Birth) | Position(s) Held with Funds | Length of Time Served | Principal Occupation(s) During Past 5 Years | Number of American Century Portfolios Overseen by Trustee | Other Directorships Held During Past 5 Years |
| Independent Trustees | | | | | |
Frederick L. A. Grauer
(1946) | Trustee | Since 2008 | Senior Advisor, Credit
Sesame, Inc. (credit
monitoring firm) (2018 to
present); Senior Advisor,
Course Hero (an
educational technology
company) (2015 to present) | 40 | None |
Jonathan D. Levin
(1972) | Trustee | Since 2016 | Philip H. Knight Professor and Dean, Graduate School of Business, Stanford University (2016 to present); Professor, Stanford University, (2000 to present) | 40 | None |
Peter F. Pervere
(1947) | Trustee | Since 2007 | Retired | 40 | None |
John B. Shoven
(1947) | Trustee | Since 2002 | Charles R. Schwab Professor of Economics, Stanford University (1973 to present, emeritus since 2019) | 40 | Cadence Design Systems; Exponent; Financial Engines |
| Interested Trustee | | | | | |
Jonathan S. Thomas
(1963) | Trustee | Since 2007 | President and Chief Executive Officer, ACC (2007 to present). Also serves as Chief Executive Officer, ACS; Executive Vice President, ACIM; Director, ACC, ACIM and other ACC subsidiaries | 122 | None |
The Statement of Additional Information has additional information about the fund's trustees and is available without charge, upon request, by calling 1-800-345-2021.
Officers
The following table presents certain information about the executive officers of the funds. Each officer serves as an officer for 16 (in the case of Robert J. Leach, 15) investment companies in the American Century family of funds, unless otherwise noted. No officer is compensated for his or her service as an officer of the funds. The listed officers are interested persons of the funds and are appointed or re-appointed on an annual basis. The mailing address for each of the officers listed below is 4500 Main Street, Kansas City, Missouri 64111.
| | | | | | | | |
Name
(Year of Birth) | Offices with the Funds | Principal Occupation(s) During the Past Five Years |
Patrick Bannigan
(1965) | President since 2019 | Executive Vice President and Director, ACC (2012 to present); Chief Financial Officer, Chief Accounting Officer and Treasurer, ACC (2015 to present). Also serves as President, ACS; Vice President, ACIM; Chief Financial Officer, Chief Accounting Officer and/or Director, ACIM, ACS and other ACC subsidiaries |
R. Wes Campbell
(1974) | Chief Financial Officer
and Treasurer since 2018 | Vice President, ACS (2020 to present); Investment Operations and Investment Accounting, ACS (2000 to present) |
Amy D. Shelton
(1964) | Chief Compliance Officer and Vice President since 2014 | Chief Compliance Officer, American Century funds, (2014 to present); Chief Compliance Officer, ACIM (2014 to present); Chief Compliance Officer, ACIS (2009 to present). Also serves as Vice President, ACIS |
Charles A. Etherington
(1957) | General Counsel since 2007 and Senior Vice President since 2006 | Attorney, ACC (1994 to present); Vice President, ACC (2005 to present); General Counsel, ACC (2007 to present). Also serves as General Counsel, ACIM, ACS, ACIS and other ACC subsidiaries; and Senior Vice President, ACIM and ACS |
C. Jean Wade
(1964) | Vice President since 2012 | Senior Vice President, ACS (2017 to present); Vice President, ACS (2000 to 2017) |
Robert J. Leach
(1966) | Vice President since 2006 | Vice President, ACS (2000 to present) |
David H. Reinmiller
(1963) | Vice President since 2000 | Attorney, ACC (1994 to present). Also serves as Vice President, ACIM and ACS |
Ward D. Stauffer
(1960) | Secretary since 2005 | Attorney, ACC (2003 to present) |
| | |
| Liquidity Risk Management Program |
The Fund has adopted a liquidity risk management program (the “program”). The Fund’s Board of Trustees (the "Board") has designated American Century Investment Management, Inc. (“ACIM”) as the administrator of the program. Personnel of ACIM or its affiliates conduct the day-to-day operation of the program pursuant to policies and procedures administered by those members of the ACIM’s Investment Oversight Committee who are members of the ACIM’s Investment Management and Global Analytics departments.
Under the program, ACIM manages the Fund’s liquidity risk, which is the risk that the Fund could not meet shareholder redemption requests without significant dilution of remaining shareholders’ interests in the Fund. This risk is managed by monitoring the degree of liquidity of the Fund’s investments, limiting the amount of the Fund’s illiquid investments, and utilizing various risk management tools and facilities available to the Fund for meeting shareholder redemptions, among other means. ACIM’s process of determining the degree of liquidity of the Fund’s investments is supported by one or more third-party liquidity assessment vendors.
The Board reviewed a report prepared by ACIM regarding the operation and effectiveness of the program for the period December 1, 2018 through December 31, 2019. No significant liquidity events impacting the Fund were noted in the report. In addition, ACIM provided its assessment that the program had been effective in managing the Fund’s liquidity risk.
Retirement Account Information
As required by law, distributions you receive from certain retirement accounts are subject to federal income tax withholding, unless you elect not to have withholding apply*. Tax will be withheld on the total amount withdrawn even though you may be receiving amounts that are not subject to withholding, such as nondeductible contributions. In such case, excess amounts of withholding could occur. You may adjust your withholding election so that a greater or lesser amount will be withheld.
If you don’t want us to withhold on this amount, you must notify us to not withhold the federal income tax. You may notify us in writing or in certain situations by telephone or through other electronic means. For systematic withdrawals, your withholding election will remain in effect until revoked or changed by filing a new election. You have the right to revoke your election at any time and change your withholding percentage for future distributions.
Remember, even if you elect not to have income tax withheld, you are liable for paying income tax on the taxable portion of your withdrawal. If you elect not to have income tax withheld or you don’t have enough income tax withheld, you may be responsible for payment of estimated tax. You may incur penalties under the estimated tax rules if your withholding and estimated tax payments are not sufficient. You can reduce or defer the income tax on a distribution by directly or indirectly rolling such distribution over to another IRA or eligible plan. You should consult your tax advisor for additional information.
State tax will be withheld if, at the time of your distribution, your address is within one of the mandatory withholding states and you have federal income tax withheld (or as otherwise required by state law). State taxes will be withheld from your distribution in accordance with the respective state rules.
*Some 403(b), 457 and qualified retirement plan distributions may be subject to 20% mandatory withholding, as they are subject to special tax and withholding rules. Your plan administrator or plan sponsor is required to provide you with a special tax notice explaining those rules at the time you request a distribution. If applicable, federal and/or state taxes may be withheld from your distribution amount.
Proxy Voting Policies
Descriptions of the principles and policies that the fund's investment advisor uses in exercising the voting rights associated with the securities purchased and/or held by the fund are available without charge, upon request, by calling 1-800-345-2021 or visiting American Century Investments’ website at americancentury.com/proxy. A description of the policies is also available on the Securities and Exchange Commission’s website at sec.gov. Information regarding how the investment advisor voted proxies relating to portfolio securities during the most recent 12-month period ended June 30 is available on americancentury.com/proxy. It is also available at sec.gov.
Quarterly Portfolio Disclosure
The fund files its complete schedule of portfolio holdings with the Securities and Exchange
Commission (SEC) for the first and third quarters of each fiscal year as an exhibit to its reports on
Form N-PORT. The fund’s Form N-PORT reports are available on the SEC’s website at sec.gov.
The fund also makes its complete schedule of portfolio holdings for the most recent quarter of its
fiscal year available on its website at americancentury.com and, upon request, by calling
1-800-345-2021.
Other Tax Information
The following information is provided pursuant to provisions of the Internal Revenue Code.
The fund designates $1,254,330 as exempt interest dividends for the fiscal year ended May 31, 2020.
| | | | | | | | |
| | |
| | |
| Contact Us | americancentury.com | |
| Automated Information Line | 1-800-345-8765 | |
| Investor Services Representative | 1-800-345-2021
or 816-531-5575 | |
| Investors Using Advisors | 1-800-378-9878 | |
| Business, Not-For-Profit, Employer-Sponsored Retirement Plans | 1-800-345-3533 | |
| Banks and Trust Companies, Broker-Dealers, Financial Professionals, Insurance Companies | 1-800-345-6488 | |
| Telecommunications Relay Service for the Deaf | 711 | |
| | |
| American Century Municipal Trust | | |
| | |
Investment Advisor: American Century Investment Management, Inc. Kansas City, Missouri | | |
| | |
| This report and the statements it contains are submitted for the general information of our shareholders. The report is not authorized for distribution to prospective investors unless preceded or accompanied by an effective prospectus. | | |
| | |
©2020 American Century Proprietary Holdings, Inc. All rights reserved.
CL-ANN-92646 2007 | | |
ITEM 2. CODE OF ETHICS.
(a) The registrant has adopted a Code of Ethics for Senior Financial Officers that applies to the registrant’s principal executive officer, principal financial officer, principal accounting officer, and persons performing similar functions.
(b) No response required.
(c) None.
(d) None.
(e) Not applicable.
(f) The registrant’s Code of Ethics for Senior Financial Officers was filed as Exhibit 12 (a)(1) to American Century Asset Allocation Portfolios, Inc.’s Annual Certified Shareholder Report on Form N-CSR, File No. 811-21591, on September 29, 2005, and is incorporated herein by reference.
ITEM 3. AUDIT COMMITTEE FINANCIAL EXPERT.
(a)(1) The registrant's board has determined that the registrant has at least one audit committee financial expert serving on its audit committee.
(a)(2) Tanya S. Beder, Anne Casscells, Peter F. Pervere and Ronald J. Gilson are the registrant's designated audit committee financial experts. They are "independent" as defined in Item 3 of Form N-CSR.
(a)(3) Not applicable.
(b) No response required.
(c) No response required.
(d) No response required.
ITEM 4. PRINCIPAL ACCOUNTANT FEES AND SERVICES.
(a) Audit Fees.
The aggregate fees billed for each of the last two fiscal years for professional services rendered by the principal accountant for the audit of the registrant’s annual financial statements or services that are normally provided by the accountant in connection with statutory and regulatory filings or engagements for those fiscal years were as follows:
FY 2019: $84,472
FY 2020: $87,177
(b) Audit-Related Fees.
The aggregate fees billed in each of the last two fiscal years for assurance and related services by the principal accountant that are reasonably related to the performance of the audit of the registrant’s financial statements and are not reported under paragraph (a) of this Item were as follows:
For services rendered to the registrant:
Fees required to be approved pursuant to paragraph (c)(7)(ii) of Rule 2-01 of Regulation S-X (relating to certain engagements for non-audit services with the registrant’s investment adviser and its affiliates):
(c) Tax Fees.
The aggregate fees billed in each of the last two fiscal years for professional services rendered by the principal accountant for tax compliance, tax advice, and tax planning were as follows:
For services rendered to the registrant:
FY 2019: $0
FY 2020: $0
Fees required to be approved pursuant to paragraph (c)(7)(ii) of Rule 2-01 of Regulation S-X (relating to certain engagements for non-audit services with the registrant’s investment adviser and its affiliates):
FY 2019: $0
FY 2020: $0
(d) All Other Fees.
The aggregate fees billed in each of the last two fiscal years for products and services provided by the principal accountant, other than the services reported in paragraphs (a) through (c) of this Item were as follows:
For services rendered to the registrant:
Fees required to be approved pursuant to paragraph (c)(7)(ii) of Rule 2-01 of Regulation S-X (relating to certain engagements for non-audit services with the registrant’s investment adviser and its affiliates):
(e)(1) In accordance with paragraph (c)(7)(i)(A) of Rule 2-01 of Regulation S-X, before the accountant is engaged by the registrant to render audit or non-audit services, the engagement is approved by the registrant’s audit committee. Pursuant to paragraph (c)(7)(ii) of Rule 2-01 of Regulation S-X, the registrant’s audit committee also pre-approves its accountant’s engagements for non-audit services with the registrant’s investment adviser, its parent
company, and any entity controlled by, or under common control with the investment adviser that provides ongoing services to the registrant, if the engagement relates directly to the operations and financial reporting of the registrant.
(e)(2) All services described in each of paragraphs (b) through (d) of this Item were pre-approved before the engagement by the registrant’s audit committee pursuant to paragraph (c)(7)(i)(A) of Rule 2-01 of Regulation S-X. Consequently, none of such services were required to be approved by the audit committee pursuant to paragraph (c)(7)(i)(C).
(f) The percentage of hours expended on the principal accountant’s engagement to audit the registrant’s financial statements for the most recent fiscal year that were attributed to work performed by persons other than the principal accountant’s full-time, permanent employees was less than 50%.
(g) The aggregate non-audit fees billed by the registrant’s accountant for services rendered to the registrant, and rendered to the registrant’s investment adviser (not including any sub-adviser whose role is primarily portfolio management and is subcontracted with or overseen by another investment adviser), and any entity controlling, controlled by, or under common control with the adviser that provides ongoing services to the registrant for each of the last two fiscal years of the registrant were as follows:
FY 2019: $181,197
FY 2020: $147,500
(h) The registrant’s investment adviser and accountant have notified the registrant’s audit committee of all non-audit services that were rendered by the registrant’s accountant to the registrant’s investment adviser, its parent company, and any entity controlled by, or under common control with the investment adviser that provides services to the registrant, which services were not required to be pre-approved pursuant to paragraph (c)(7)(ii) of Rule 2-01 of Regulation S-X. The notification provided to the registrant’s audit committee included sufficient details regarding such services to allow the registrant’s audit committee to consider the continuing independence of its principal accountant.
ITEM 5. AUDIT COMMITTEE OF LISTED REGISTRANTS.
Not applicable.
ITEM 6. INVESTMENTS.
(a) The schedule of investments is included as part of the report to stockholders filed under Item 1 of this Form.
(b) Not applicable.
ITEM 7. DISCLOSURE OF PROXY VOTING POLICIES AND PROCEDURES FOR CLOSED-END MANAGEMENT INVESTMENT COMPANIES.
Not applicable.
ITEM 8. PORTFOLIO MANAGERS OF CLOSED-END MANAGEMENT INVESTMENT COMPANIES.
Not applicable.
ITEM 9. PURCHASES OF EQUITY SECURITIES BY CLOSED-END MANAGEMENT INVESTMENT COMPANY AND AFFILIATED PURCHASERS.
Not applicable.
ITEM 10. SUBMISSION OF MATTERS TO A VOTE OF SECURITY HOLDERS.
During the reporting period, there were no material changes to the procedures by which shareholders may recommend nominees to the registrant’s board.
ITEM 11. CONTROLS AND PROCEDURES.
(a) The registrant's principal executive officer and principal financial officer have concluded that the registrant's disclosure controls and procedures (as defined in Rule 30a-3(c) under the Investment Company Act of 1940) are effective based on their evaluation of these controls and procedures as of a date within 90 days of the filing date of this report.
(b) There were no changes in the registrant's internal control over financial reporting (as defined in Rule 30a-3(d) under the Investment Company Act of 1940) that occurred during the period covered by this report that have materially affected, or are reasonably likely to materially affect, the registrant's internal control over financial reporting.
ITEM 12. DISCLOSURE OF SECURITIES LENDING ACTIVITIES FOR CLOSED-END MANAGEMENT INVESTMENT COMPANIES.
Not applicable.
ITEM 13. EXHIBITS.
(a)(1) Registrant’s Code of Ethics for Senior Financial Officers, which is the subject of the disclosure required by Item 2 of Form N-CSR, was filed as Exhibit 12(a)(1) to American Century Asset Allocation Portfolios, Inc.’s Certified Shareholder Report on Form N-CSR, File No. 811-21591, on September 29, 2005.
(a)(3) Not applicable.
(a)(4) Not applicable.
SIGNATURES
Pursuant to the requirements of the Securities Exchange Act of 1934 and the Investment Company Act of 1940, the registrant has duly caused this report to be signed on its behalf by the undersigned, thereunto duly authorized.
| | | | | | | | | | | | | | |
| Registrant: | American Century Municipal Trust | | | |
| | | | |
| By: | /s/ Patrick Bannigan | | | |
| Name: | Patrick Bannigan | | |
| Title: | President | | |
| | | | |
| Date: | July 24, 2020 | | | |
Pursuant to the requirements of the Securities Exchange Act of 1934 and the Investment Company Act of 1940, this report has been signed below by the following persons on behalf of the registrant and in the capacities and on the dates indicated.
| | | | | | | | | | | |
| By: | /s/ Patrick Bannigan | | |
| Name: Patrick Bannigan | | |
| Title: President | | |
| (principal executive officer) | | |
| | | |
| Date: | July 24, 2020 | | |
| | | | | | | | | | | |
| By: | /s/ R. Wes Campbell | | |
| Name: R. Wes Campbell | | |
| Title: Treasurer and | | |
| Chief Financial Officer | | |
| (principal financial officer) | | |
| | | |
| Date: | July 24, 2020 | | |