UNITED STATES
SECURITIES AND EXCHANGE COMMISSION
Washington, D.C. 20549
FORM N-CSR
CERTIFIED SHAREHOLDER REPORT OF REGISTERED
MANAGEMENT INVESTMENT COMPANIES
Investment Company Act file number: | 811-04024 |
Dryden California Municipal Fund
| Exact name of registrant as specified in charter: |
Gateway Center 3, 100 Mulberry Street, Newark, New Jersey 07102 | ||
| Address of principal executive offices: | ||
Deborah A. Docs
Gateway Center 3,
100 Mulberry Street,
Newark, New Jersey 07102
| Name and address of agent for service: |
Registrant’s telephone number, including area code: 800-225-1852
Date of fiscal year end: 8/31/2009
Date of reporting period: 8/31/2009
Item 1 – Reports to Stockholders


| AUGUST 31, 2009 | ANNUAL REPORT |
Dryden California Municipal Fund/California Income Series
FUND TYPE
Municipal bond
OBJECTIVE
Maximize current income that is exempt from California state and federal income taxes, consistent with the preservation of capital
This report is not authorized for distribution to prospective investors unless preceded or accompanied by a current prospectus.
The views expressed in this report and information about the Fund’s portfolio holdings are for the period covered by this report and are subject to change thereafter.
JennisonDryden, Dryden, Prudential Financial and the Rock Prudential logo are registered service marks of The Prudential Insurance Company of America, Newark, NJ, and its affiliates.

October 15, 2009
Dear Shareholder:
We hope you find the annual report for the Dryden California Municipal Fund/California Income Series informative and useful. Because of ongoing market volatility, we understand that this is a difficult time to be an investor. While it is impossible to predict what the future holds, we continue to believe a prudent response to uncertainty is to maintain a diversified portfolio, including stock and bond mutual funds consistent with your tolerance for risk, time horizon, and financial goals.
A diversified asset allocation offers two potential advantages: it limits your exposure to any particular asset class, plus it provides a better opportunity to invest some of your assets in the right place at the right time. Your financial professional can help you create a diversified investment plan that may include mutual funds covering all the basic asset classes and that reflects your personal investor profile and risk tolerance. Keep in mind that diversification and asset allocation strategies do not assure a profit or protect against loss in declining markets.
JennisonDryden Mutual Funds give you a wide range of choices that can help you make progress toward your financial goals. Our funds offer the experience, resources, and professional discipline of four leading asset managers. JennisonDryden equity funds are advised by Jennison Associates LLC, Quantitative Management Associates LLC (QMA), or Prudential Real Estate Investors. Prudential Investment Management, Inc. (PIM) advises the JennisonDryden fixed income and money market funds through its unit Prudential Fixed Income Management. Jennison Associates, QMA, and PIM are registered investment advisers and Prudential Financial companies. Prudential Real Estate Investors is a unit of PIM.
Thank you for choosing JennisonDryden Mutual Funds.
Sincerely,

Judy A. Rice, President
Dryden California Municipal Fund/California Income Series
| Dryden California Municipal Fund/California Income Series | 1 |
Your Fund’s Performance
Fund objective
The investment objective of the Dryden California Municipal Fund/California Income Series is to maximize current income that is exempt from California state and federal income taxes, consistent with the preservation of capital. There can be no assurance that the Fund will achieve its investment objective.
Performance data quoted represent past performance. Past performance does not guarantee future results. The investment return and principal value of an investment will fluctuate, so that an investor’s shares, when redeemed, may be worth more or less than their original cost. Current performance may be lower or higher than the past performance data quoted. An investor may obtain performance data as of the most recent month-end by visiting our website at www.jennisondryden.com or by calling (800) 225-1852. The maximum initial sales charge is 4.00% (Class A shares). Gross operating expenses: Class A, 0.94%; Class B, 1.14%; Class C, 1.64%; Class Z, 0.64%. Net operating expenses apply to: Class A, 0.89%; Class B, 1.14%; Class C, 1.39%; Class Z, 0.64%, after contractual reduction through 12/31/2010.
| Cumulative Total Returns as of 8/31/09 | |||||||||
| One Year | Five Years | Ten Years | |||||||
Class A | 2.94 | % | 18.17 | % | 57.52 | % | |||
Class B | 2.69 | 16.71 | 53.65 | ||||||
Class C | 2.45 | 15.30 | 49.92 | ||||||
Class Z | 3.21 | 19.70 | 61.55 | ||||||
Barclays Capital Municipal Bond Index1 | 5.67 | 22.55 | 69.22 | ||||||
Lipper California (CA) Muni Debt Funds Avg.2 | 0.78 | 12.84 | 48.72 | ||||||
| Average Annual Total Returns3 as of 9/30/09 | |||||||||
| One Year | Five Years | Ten Years | |||||||
Class A | 9.05 | % | 3.50 | % | 4.73 | % | |||
Class B | 8.32 | 3.92 | 4.90 | ||||||
Class C | 12.05 | 3.83 | 4.64 | ||||||
Class Z | 13.88 | 4.61 | 5.43 | ||||||
Barclays Capital Municipal Bond Index1 | 14.85 | 4.78 | 5.77 | ||||||
Lipper California (CA) Muni Debt Funds Avg.2 | 13.07 | 3.50 | 4.65 | ||||||
| 2 | Visit our website at www.jennisondryden.com |
| Distributions and Yields as of 8/31/09 | ||||||||||||
| Total Distributions Paid for 12 Months | 30-Day SEC Yield | Taxable Equivalent 30-Day Yield4 at Federal Tax Rates of | ||||||||||
| 33% | 35% | |||||||||||
Class A | $ | 0.50 | 3.85 | % | 6.34 | % | 6.53 | % | ||||
Class B | 0.48 | 3.76 | 6.19 | 6.38 | ||||||||
Class C | 0.45 | 3.51 | 5.78 | 5.95 | ||||||||
Class Z | 0.53 | 4.25 | 6.99 | 7.21 | ||||||||
The cumulative total returns do not reflect the deduction of applicable sales charges. If reflected, the applicable sales charges would reduce the cumulative total returns performance quoted. Class A shares are subject to a maximum front-end sales charge of 4.00%. Under certain circumstances, Class A shares may be subject to a contingent deferred sales charge (CDSC) of 1%. Class B and Class C shares are subject to a maximum CDSC of 5% and 1%, respectively. Class Z shares are not subject to a sales charge.
Source: Prudential Investments LLC and Lipper Inc. Performance figures may reflect fee waivers and/or expense reimbursements. In the absence of such fee waivers and/or expense reimbursements, total returns would be lower.
1The Barclays Capital Municipal Bond Index is an unmanaged index of over 39,000 long-term investment-grade municipal bonds. It gives a broad look at how long-term investment-grade municipal bonds have performed.
2The Lipper CA Muni Debt Funds Average (Lipper Average) represents returns based on an average return of all funds in the Lipper CA Muni Debt Funds category for the periods noted. Funds in the Lipper Average limit their assets to those securities that are exempt from taxation in California.
3The average annual total returns take into account applicable sales charges. Class A, Class B, and Class C shares are subject to an annual distribution and service (12b-1) fee of up to 0.30%, 0.50%, and 1.00%, respectively. Approximately seven years after purchase, Class B shares will automatically convert to Class A shares on a quarterly basis. Class Z shares are not subject to a 12b-1 fee. The returns in the tables do not reflect the deduction of taxes that a shareholder would pay on Fund distributions or following the redemption of Fund shares.
4Taxable equivalent yields reflect federal and applicable state tax rates.
Investors cannot invest directly in an index. The returns for the Barclays Capital Municipal Bond Index would be lower if they included the effects of sales charges, operating expenses of a mutual fund, or taxes. Returns for the Lipper Average reflect the deduction of operating expenses, but not sales charges or taxes.
| Dryden California Municipal Fund/California Income Series | 3 |
Your Fund’s Performance (continued)
| Five Largest Issues expressed as a percentage of net assets as of 8/31/09 | |||
So. California Pub. Pwr. Auth. Rev., Palo Verde Proj., Ser. C, 7/01/16, 2.99% | 6.5 | % | |
Orange Cnty. Loc. Trans. Auth., Sales Tax Rev., 2/14/11, 6.20% | 4.5 | ||
Sacramento City Fin. Auth., Tax Alloc. Comb. Proj., Ser. B, 11/01/16, 5.58% | 1.9 | ||
California Hsg. Fin. Agy. Rev., Home Mtge. –83, Ser. A, 2/01/15, 7.81% | 1.8 | ||
Sacramento City Fin. Auth., Tax Alloc. Comb. Proj., Ser. B, 11/01/17, 5.92% | 1.7 |
Issues are subject to change.
| Credit Quality* expressed as a percentage of net assets as of 8/31/09 | |||
Aaa | 4.2 | % | |
Aa | 36.9 | ||
A | 24.7 | ||
Baa | 24.6 | ||
Not Rated | 10.2 | ||
Total Investments | 100.6 | ||
Liabilities in excess of other assets | –0.6 | ||
Net Assets | 100.0 | % | |
*Source: Moody’s rating, defaulting to S&P when not rated by Moody’s.
Credit quality is subject to change.
| 4 | Visit our website at www.jennisondryden.com |
Strategy and Performance Overview
How did the Fund perform?
The California Income Series’ Class A shares posted a 2.94% total return for the year ended August 31, 2009, lagging the 5.67% total return of the Barclays Capital Municipal Bond Index (the Index) but outperforming the 0.78% total return of the Lipper California Municipal Debt Funds Average.
How is the Fund managed?
The Fund is managed by Prudential Fixed Income Management, which employs a team-based approach in which research plays a crucial role. Senior investment professionals develop a quarterly market outlook that provides an overall view on the economy, interest rates, risk levels in the major bond markets, and the yield curve. The latter is a single-line graph that depicts yields on bonds of the same credit quality from the shortest to the longest maturities.
The quarterly market outlook helps set broad investment strategies for the Fund, which invests largely in bonds of California issuers of which normally at least 70% are rated investment grade and up to 30% can be rated below investment grade. In deciding which bonds to buy and sell, portfolio managers work closely with a team of four credit research analysts, each of which has more than 15 years of experience analyzing tax-exempt bonds.
What were conditions like in the municipal bond market?
During the reporting period that began September 1, 2008, the tax-exempt bond market initially suffered one of the worst routs in its history. However, municipal bond prices turned higher as the Federal Reserve (the Fed) and the U.S. Department of the Treasury took bold steps to save the nation’s financial system.
Support was necessary as a bursting housing bubble caused mortgage delinquencies and foreclosures in the United States to soar. Vast amounts of bonds backed primarily by subprime mortgages and higher-quality loans known as “Alternative-A” mortgages tumbled in value, threatening the viability of financial institutions around the world that invested in them. A major casualty of the mortgage-driven credit crisis was Lehman Brothers Holdings Inc., which filed the largest bankruptcy in the history of the United States in September 2008.
Turmoil in the financial markets sparked a flight to quality in which investors fled to ultra-safe U.S. Treasury securities and sold stocks and bonds. As municipal bond prices sank in the autumn of 2008, their yields rose, as bond prices move inversely to yields. By early December, municipal bonds had become very inexpensive relative to comparable Treasury securities on a historical basis. This attracted bargain hunters, who began pushing up municipal bond prices later in the month.
| Dryden California Municipal Fund/California Income Series | 5 |
Strategy and Performance Overview (continued)
What helped fuel the recovery in the municipal bond market?
During much of the remainder of the reporting period, a broad rally swept municipal bond prices higher. Tax-exempt bond prices gained in January as bondholders reinvested monies received from coupon payments and debt securities that had matured. Another positive for municipal bonds were aggressive steps taken by the Fed and the U.S. Treasury to try to boost economic growth. For example, a $787 billion economic stimulus plan signed into law in early 2009 included a Build America Bond program in which state and local governments can issue taxable bonds through the end of 2010 to finance construction of schools, roads, and other capital projects.
Build America Bonds pay interest that is subject to federal income tax and therefore, offer a higher yield than comparable tax-exempt bonds. However, the federal government pays issuers of Build America Bonds a subsidy equal to 35% of their interest costs, thereby lowering the borrowing costs of issuers. State and local governments issued large amounts of Build America Bonds, particularly longer-dated ones. The Build America Bond program siphoned away issuance from the tax-exempt bond market in the face of very strong investor demand for tax-advantaged assets. This helped boost tax-exempt bond prices. As rising bond prices pushed down bond yields, the slope of the municipal bond yield curve became flatter during 2009.
How did the California tax-exempt bond market perform?
The California municipal bond market underperformed the broader tax-exempt market for the reporting period. This was one of the major reasons that the Fund, which invests primarily in bonds of California issuers, underperformed the Index, which tracks the broader municipal bond market.
It was very difficult for California lawmakers to pass the state budget for the 2010 fiscal year that began July 1, 2009 due to the sheer size of the state’s subprime mortgage problem and its negative impact on the economy. Another hindrance was the constitutional restraints on the state’s budget process and tax and spending policies. California is one of a few states requiring a two-thirds majority vote in the legislature to pass its budget.
California voters in a special election in May 2009 had rejected about $5 billion in measures that would have created revenue enhancements, thereby exacerbating the state’s budgetary problems. This necessitated massive cuts in state spending that affected all levels of government in California. Governor Arnold Schwarzenegger urged lawmakers to enact reforms that would create structural balance in the budget, a key to minimizing overall revenue declines during economic downturns.
Indicative of the severity of the situation, California was forced to issue IOUs to pay various vendors. This was not the first time the state had to take such an action but this
| 6 | Visit our website at www.jennisondryden.com |
may well have been the worst situation in 50 years. Amid the legislative friction and enormous financial problems, three public credit rating agencies downgraded the state of California general obligation (G.O.) bonds, which are backed by the full faith and credit of the State. The rating was cut from A1 to Baa1 by Moody’s Investor Service, from A-plus to single-A by Standard & Poor’s, and from A-plus to BBB by Fitch Ratings.
How was the Fund affected by its sector allocation strategy?
The Fund maintained a portfolio of bonds drawn from transportation, healthcare, G.O. bonds, and other sectors of the California tax-exempt market in order to spread risk. The state of California issued billions of dollars of G.O. bonds during the reporting period, some in the form of Build America Bonds. The Fund does not invest in Build America Bonds, but it had a smaller exposure than the Index to the state’s tax-exempt G.O. bonds. This benefited the Fund’s performance relative to the Index because the bonds did not perform as well as the broader tax-exempt market.
The Fund’s largest sector concentration continued to be in special tax/assessment district bonds, which are used to help finance the development of public infrastructure for residential communities in California. Interest and principal on the bonds are paid by special taxes levied on parcels of land.
As conditions in the credit and real estate markets rapidly deteriorated in the early months of the reporting period, prices of special tax/assessment district bonds slid sharply, particularly lower-quality bonds. However, their prices improved along with the broader municipal bond market in 2009. The Fund continued to benefit from favorable security selection within the sector that emphasized bonds of well-established districts and avoided districts in the early stages of development.
What else had a key impact on the Fund’s performance?
As the credit crisis worsened in the fall of 2008, prices of long-term tax-exempt bonds tumbled the most, pushing their yields sharply higher. The rise in yields caused the slope of the municipal bond yield curve to become unusually steep. The Fund began to increase its exposure to long-term tax-exempt bonds because Prudential Fixed Income Management believed the municipal bond yield curve would flatten if market conditions improved in 2009.
As previously discussed, municipal bond prices gained early in 2009 as money from coupon payments and maturing bonds was reinvested in the municipal bond market. Once the Build America Bond program got underway and fewer long-term tax-exempt bonds were issued, investors snapped up whatever long-term tax-exempt bonds were available, driving their prices higher and yields lower. The declining yields caused the slope of the municipal bond yield curve to flatten as anticipated.
| Dryden California Municipal Fund/California Income Series | 7 |
Fees and Expenses (Unaudited)
As a shareholder of the Fund, you incur two types of costs: (1) transaction costs, including sales charges (loads) on purchase payments and redemptions, as applicable, and (2) ongoing costs, including management fees, distribution and/or service (12b-1) fees, and other Fund expenses, as applicable. This example is intended to help you understand your ongoing costs (in dollars) of investing in the Fund and to compare these costs with the ongoing costs of investing in other mutual funds.
The example is based on an investment of $1,000 invested on March 1, 2009, at the beginning of the period, and held through the six-month period ended August 31, 2009. The example is for illustrative purposes only; you should consult the Prospectus for information on initial and subsequent minimum investment requirements.
The Fund’s transfer agent may charge additional fees to holders of certain accounts that are not included in the expenses shown in the table on the following page. These fees apply to individual retirement accounts (IRAs) and Section 403(b) accounts. As of the close of the six-month period covered by the table, IRA fees included an annual maintenance fee of $15 per account (subject to a maximum annual maintenance fee of $25 for all accounts held by the same shareholder). Section 403(b) accounts are charged an annual $25 fiduciary maintenance fee. Some of the fees may vary in amount, or may be waived, based on your total account balance or the number of JennisonDryden funds, including the Fund, that you own. You should consider the additional fees that were charged to your Fund account over the six-month period when you estimate the total ongoing expenses paid over the period and the impact of these fees on your ending account value, as these additional expenses are not reflected in the information provided in the expense table. Additional fees have the effect of reducing investment returns.
Actual Expenses
The first line for each share class in the table on the following page provides information about actual account values and actual expenses. You may use the information on this line, together with the amount you invested, to estimate the expenses that you paid over the period. Simply divide your account value by $1,000 (for example, an $8,600 account value ÷ $1,000 = 8.6), then multiply the result by the number on the first line under the heading “Expenses Paid During the Six-Month Period” to estimate the expenses you paid on your account during this period.
Hypothetical Example for Comparison Purposes
The second line for each share class in the table on the following page provides information about hypothetical account values and hypothetical expenses based on the Fund’s actual expense ratio and an assumed rate of return of 5% per year before
| 8 | Visit our website at www.jennisondryden.com |
expenses, which is not the Fund’s actual return. The hypothetical account values and expenses should not be used to estimate the actual ending account balance or expenses you paid for the period. You may use this information to compare the ongoing costs of investing in the Fund and other funds. To do so, compare this 5% hypothetical example with the 5% hypothetical examples that appear in the shareholder reports of the other funds.
Please note that the expenses shown in the table are meant to highlight your ongoing costs only and do not reflect any transactional costs such as sales charges (loads). Therefore, the second line for each share class in the table is useful in comparing ongoing costs only and will not help you determine the relative total costs of owning different funds. In addition, if these transactional costs were included, your costs would have been higher.
| Dryden California Municipal Fund/ California Income Series | Beginning Account Value March 1, 2009 | Ending Account Value August 31, 2009 | Annualized Expense Ratio Based on the Six-Month Period | Expenses Paid During the Six-Month Period* | ||||||||||
| Class A | Actual | $ | 1,000.00 | $ | 1,060.10 | 0.89 | % | $ | 4.62 | |||||
| Hypothetical | $ | 1,000.00 | $ | 1,020.72 | 0.89 | % | $ | 4.53 | ||||||
| Class B | Actual | $ | 1,000.00 | $ | 1,058.80 | 1.14 | % | $ | 5.92 | |||||
| Hypothetical | $ | 1,000.00 | $ | 1,019.46 | 1.14 | % | $ | 5.80 | ||||||
| Class C | Actual | $ | 1,000.00 | $ | 1,057.50 | 1.39 | % | $ | 7.21 | |||||
| Hypothetical | $ | 1,000.00 | $ | 1,018.20 | 1.39 | % | $ | 7.07 | ||||||
| Class Z | Actual | $ | 1,000.00 | $ | 1,061.50 | 0.64 | % | $ | 3.33 | |||||
| Hypothetical | $ | 1,000.00 | $ | 1,021.98 | 0.64 | % | $ | 3.26 | ||||||
* Fund expenses (net of fee waivers or subsidies, if any) for each share class are equal to the annualized expense ratio for each share class (provided in the table), multiplied by the average account value over the period, multiplied by the 184 days in the six-month period ended August 31, 2009, and divided by the 365 days in the Fund’s fiscal year ended August 31, 2009 (to reflect the six-month period). Expenses presented in the table include the expenses of any underlying portfolios in which the Fund may invest.
| Dryden California Municipal Fund/California Income Series | 9 |
Portfolio of Investments
as of August 31, 2009
| Description (a) | Moody’s (Unaudited) | Interest Rate | Maturity Date | Principal Amount (000) | Value (Note 1) | |||||||
LONG-TERM INVESTMENTS 99.5% | ||||||||||||
Municipal Bonds | ||||||||||||
Abag Fin. Auth. For Nonprofit Corp. Rev., | ||||||||||||
San Diego Hosp. Assoc., Ser. C | A3 | 5.375% | 3/01/21 | $ | 1,665 | $ | 1,636,312 | |||||
Sharp Healthcare | A3 | 6.250 | 8/01/39 | 1,000 | 1,010,970 | |||||||
California County Tobacco Securitization Agcy. Rev., | ||||||||||||
Convertible, C.A.B.S. (Converts to 5.25% on 12/01/10) | Baa3 | 1.900(h) | 6/01/21 | 1,000 | 801,260 | |||||||
Tobacco Conv. Bonds | NR | 5.100 | 6/01/28 | 1,035 | 879,160 | |||||||
California Ed. Facs. Auth. Rev., Rfdg., Claremont McKenna College | ||||||||||||
Univ. Southern CA, Ser. A | Aa1 | 5.000 | 10/01/38 | 2,000 | 2,043,860 | |||||||
Univ. Southern CA, Ser. A | Aa1 | 5.250 | 10/01/38 | 1,500 | 1,581,915 | |||||||
California Edl. Facs. Auth. Rev., | ||||||||||||
Calif. Inst. of Technology | Aa1 | 5.000 | 11/01/39 | 2,000 | 2,069,180 | |||||||
Stanford Univ., Ser. T-5 | Aaa | 5.000 | 3/15/23 | 500 | 581,140 | |||||||
California Health Facs. Fin. Auth. Rev., | ||||||||||||
Catholic Healthcare West, Ser. A | A2 | 6.000 | 7/01/39 | 2,000 | 1,997,040 | |||||||
Cedars Sinai Med. Ctr., Rfdg. | A2 | 5.000 | 11/15/21 | 2,000 | 2,004,080 | |||||||
Providence Health Svcs., Ser. B | Aa2 | 5.500 | 10/01/39 | 1,500 | 1,489,005 | |||||||
Providence Health, Ser. C | Aa2 | 6.500 | 10/01/38 | 1,000 | 1,084,820 | |||||||
Scripps Health, Ser. A | A1 | 5.000 | 10/01/22 | 500 | 494,305 | |||||||
St. Joseph Health Sys., Ser. A | A1 | 5.750 | 7/01/39 | 1,000 | 1,006,630 | |||||||
California Hsg. Fin. Agcy. Rev., Home Mtge.-83, Ser. A, C.A.B.S. | Aa3 | 7.810(h) | 2/01/15 | 5,590 | 3,689,903 | |||||||
California Infrastructure & Econ. Dev. Rev., | ||||||||||||
Scripps Research Inst., Ser. A | Aa3 | 5.750 | 7/01/30 | 1,500 | 1,508,250 | |||||||
Bk. Rev. & Econ. Dev. Walt. Dis. Fam. Musm., Walt & Lilly Disney | A1 | 5.250 | 2/01/38 | 2,000 | 1,890,080 | |||||||
California Municipal Fin. Auth. Ed. Rev. Amer. Heritage Ed. Foundation Proj., Ser. A | BBB-(c) | 5.250 | 6/01/26 | 1,100 | 891,220 | |||||||
See Notes to Financial Statements.
| Dryden California Municipal Fund/California Income Series | 11 |
Portfolio of Investments
as of August 31, 2009 continued
| Description (a) | Moody’s (Unaudited) | Interest Rate | Maturity Date | Principal Amount (000) | Value (Note 1) | |||||||
Municipal Bonds (cont’d.) | ||||||||||||
California Poll. Ctrl. Fin. Auth. | ||||||||||||
Pacific Gas-D-Rmkt. Rfdg., A.M.T., F.G.I.C. | A3 | 4.750% | 12/01/23 | $ | 2,500 | $ | 2,229,725 | |||||
Wste. Disp. Rev., Wste. Mgmt., Inc. Proj., Ser. B, A.M.T. | BBB(c) | 5.000 | 7/01/27 | 500 | 439,685 | |||||||
California Rural Home Mtge. Fin. Auth., Sngl. Fam. Mtge. Rev., Mtge. Bkd. Secs., Ser. D, F.N.M.A., G.N.M.A., A.M.T. | AAA(c) | 6.000 | 12/01/31 | 60 | 59,780 | |||||||
California St. Dept. Wtr. Res. Pwr. Rev., | ||||||||||||
Central VY Proj., Ser. AF | Aa2 | 5.000 | 12/01/29 | 1,500 | 1,591,095 | |||||||
Central VY Proj., Ser. A | Aa2 | 5.000 | 12/01/29 | 2,000 | 2,111,520 | |||||||
California St., G.O. | Baa1 | 5.000 | 11/01/37 | 1,000 | 947,900 | |||||||
California St., G.O. | Baa1 | 6.000 | 4/01/38 | 3,000 | 3,165,270 | |||||||
California St. G.O. Unrefunded Balance | Baa1 | 5.500 | 4/01/30 | 5 | 5,068 | |||||||
California St. Pub. Wks. Brd., Lease Rev., | ||||||||||||
Dept. General Service, Ser. J | Baa2 | 5.250 | 6/01/28 | 750 | 714,683 | |||||||
Mental Health Coalinga, Ser. A | Baa2 | 5.500 | 6/01/18 | 2,000 | 2,064,080 | |||||||
California Statewide Cmntys. Dev. Auth. Rev., Drew Sch. | NR | 5.300 | 10/01/37 | 1,000 | 680,880 | |||||||
Irvine LLC, U.C.I. East Rfdg. | Baa2 | 5.000 | 5/15/32 | 2,000 | 1,642,180 | |||||||
Kaiser Permanente, Ser. A | A+(c) | 5.000 | 4/01/19 | 2,000 | 2,081,020 | |||||||
Kaiser Permanente, Ser. C | A+(c) | 5.250 | 8/01/31 | 1,000 | 960,960 | |||||||
Spl. Tax No. 97-1, C.A.B.S. | NR | 8.560(h) | 9/01/22 | 4,440 | 1,493,350 | |||||||
Sr. Living-Southn. Calif. Presbyterian Homes | BBB(c) | 7.250 | 11/15/41 | 500 | 508,570 | |||||||
St. Joseph. F. Rmkt. F.S.A. | Aa3 | 5.250 | 7/01/21 | 2,500 | 2,662,475 | |||||||
Windrush Sch. | NR | 5.500 | 7/01/37 | 1,000 | 703,310 | |||||||
Chico Redev. Agcy. Tax Alloc., Chico Amended & Merged Redev., A.M.B.A.C. | A(c) | 5.000 | 4/01/30 | 1,445 | 1,255,416 | |||||||
Chula Vista Calif. Indl. Dev. Rev., San Diego Gas-D-Rmkt | Aa3 | 5.875 | 1/01/34 | 1,000 | 1,024,120 | |||||||
Chula Vista Dev. Agcy. Rev., Rfdg. Tax Alloc. Sub. Bayfront, Ser. B | NR | 5.250 | 10/01/27 | 1,540 | 1,176,098 | |||||||
Chula Vista Ind. Dev. Rev., San Diego Gas, A.M.T. | Aa3 | 5.000 | 12/01/27 | 1,000 | 889,900 | |||||||
See Notes to Financial Statements.
| 12 | Visit our website at www.jennisondryden.com |
| Description (a) | Moody’s (Unaudited) | Interest Rate | Maturity Date | Principal Amount (000) | Value (Note 1) | |||||||
Municipal Bonds (cont’d.) | ||||||||||||
Coronado Cmnty. Dev. Agcy. Tax Alloc., Dev. Proj., A.M.B.A.C. | A(c) | 5.000% | 9/01/24 | $ | 2,000 | $ | 1,843,040 | |||||
Corona-Norco Uni. Sch. Dist. Spl. Tax, Cmnty. Facs. Dist. No. 98-1, NATL | Baa1 | 5.000 | 9/01/22 | 1,060 | 1,093,962 | |||||||
El Dorado Cnty., Spl. Tax, Cmnty. Facs., | ||||||||||||
Dist. No. 92-1 | NR | 6.125 | 9/01/16 | 1,000 | 969,910 | |||||||
Dist. No. 92-1 | NR | 6.250 | 9/01/29 | 475 | 410,476 | |||||||
El Dorado Irr. Dist. Partn., Ser. A, C.O.P. | Aa2 | 5.750 | 8/01/39 | 1,000 | 1,026,510 | |||||||
Elsinore Valley Municipal Water Dist. C.O.P., B.H.A.C. | Aa1 | 5.000 | 7/01/29 | 1,000 | 1,045,700 | |||||||
Folsom Spl.Tax, Cmnty. Facs., Dist. No. 7, Broadstone | NR | 6.000 | 9/01/24 | 2,450 | 2,050,748 | |||||||
Folsom Spl. Tax, Unrefunded Balance, Facs. Dist. No. 10 | NR | 6.875 | 9/01/19 | 1,230 | 1,202,706 | |||||||
Foothill/Eastern Trans. Corr. Agcy. Rev., Toll Rd., | ||||||||||||
Convertible C.A.B.S. | Baa3 | 5.875 | 1/15/28 | 2,890 | 2,409,855 | |||||||
Sr. Lien, Ser. A (Pre-refunded date 1/01/10)(e)(f) | Aaa | 7.150 | 1/01/13 | 2,750 | 2,866,573 | |||||||
Glendale Redev. Agcy. Tax Alloc., Central Glendale Redev. Proj., NATL | Baa1 | 5.250 | 12/01/19 | 3,275 | 3,214,707 | |||||||
Golden St. Tobacco Securitization Corp. Calif. Tobacco Settlement Rev., | ||||||||||||
Asset-Bkd., Sr. Ser. A-1 | Baa3 | 5.750 | 6/01/47 | 2,000 | 1,551,980 | |||||||
Enhanced Asset Bkd., Ser. A | Baa2 | 5.000 | 6/01/45 | 1,000 | 857,270 | |||||||
Golden St. Tobacco Securitization Rev., Asset-Bkd., | ||||||||||||
Ser. 2003-A-1 (Pre-refunded date 6/1/13)(e) | Aaa | 6.750 | 6/01/39 | 2,700 | 3,178,899 | |||||||
Ser. A, Convertible C.A.B.S., | ||||||||||||
A.M.B.A.C. (Converts to 4.60% on 6/1/10) | Baa2 | 1.510(h) | 6/01/23 | 3,000 | 2,440,830 | |||||||
Golden West Sch. Fin. Auth., Rev., Rfdg. Ser. A., C.A.B.S., NATL | Baa1 | 5.310(h) | 2/01/19 | 2,110 | 1,295,350 | |||||||
See Notes to Financial Statements.
| Dryden California Municipal Fund/California Income Series | 13 |
Portfolio of Investments
as of August 31, 2009 continued
| Description (a) | Moody’s (Unaudited) | Interest Rate | Maturity Date | Principal Amount (000) | Value (Note 1) | |||||||
Municipal Bonds (cont’d.) | ||||||||||||
Guam Govt. Ltd. Oblig. Rev., Section 30, Ser. A | BBB-(c) | 5.750% | 12/01/34 | $ | 500 | $ | 503,025 | |||||
La Mesa-Spring Valley Sch. Dist., G.O., Election of 2002, Ser. B, C.A.B.S., NATL | A1 | 5.950(h) | 8/01/23 | 2,000 | 884,420 | |||||||
La Quinta Redev. Agcy. Tax Alloc., NATL Rfdg. Proj. Area No. 1 | Baa1 | 7.300 | 9/01/11 | 1,000 | 1,075,860 | |||||||
Lincoln Impt. Bond Act of 1915, Pub. Rev., Fin. Auth., Twelve Bridges | NR | 6.200 | 9/02/25 | 2,535 | 2,224,437 | |||||||
Long Beach Hbr. Rev., Rfdg., Ser. A, A.M.T., NATL | Aa2 | 6.000 | 5/15/19 | 3,000 | 3,277,920 | |||||||
Long Beach Redev. Agcy., Dist. No. 3, Spl. Tax Rev. Pine Ave. | NR | 6.375 | 9/01/23 | 3,000 | 2,686,620 | |||||||
Los Angeles Calif. Cmnty. College Dist. | Aa2 | 5.000 | 8/01/33 | 3,250 | 3,282,468 | |||||||
Los Angeles Calif. Cmnty. College Dist., 2008 Election, Ser. A, G.O. | Aa2 | 6.000 | 8/01/33 | 2,000 | 2,210,300 | |||||||
Los Angeles Dept. of Wtr. & Pwr. Rev., Ser. A | Aa3 | 5.000 | 7/01/39 | 1,000 | 1,009,590 | |||||||
Los Angeles Dept. of Wtr. & Pwr. Wtrwks. Rev., Ser. A | Aa3 | 5.375 | 7/01/38 | 1,530 | 1,583,810 | |||||||
Metro. Wtr. Dist. of Southern California Waterworks Rev., | ||||||||||||
Linked, S.A.V.R.S., R.I.B.S. | Aa2 | 5.750 | 8/10/18 | 2,000 | 2,209,420 | |||||||
Unrefunded Balance Ser. A | Aa2 | 5.750 | 7/01/21 | 2,240 | 2,666,944 | |||||||
Metro. Wtr. Dist. Southn. Calif. Rfdg., Ser. C | Aa2 | 5.000 | 7/01/35 | 1,000 | 1,027,310 | |||||||
M-S-R Energy Auth. Calif., Ser. A | A(c) | 6.500 | 11/01/39 | 1,000 | 1,005,050 | |||||||
Ontario Special Assessment Impvt. Bond Act of 1915, Assmt. Dist. 100C, Cmnty. Ctr. III | NR | 8.000 | 9/02/11 | 305 | 315,654 | |||||||
Orange Cnty. Loc. Trans. Auth., Sales Tax Rev., | ||||||||||||
Linked, S.A.V.R.S. & R.I.B.S., A.M.B.A.C., T.C.R.S. | Aa2 | 6.200 | 2/14/11 | 9,000 | 9,217,170 | |||||||
Spl. Tax Rev., Linked, S.A.V.R.S., R.I.B.S.(g) | Aa2 | 10.997(d) | 2/14/11 | 1,500 | 1,572,390 | |||||||
See Notes to Financial Statements.
| 14 | Visit our website at www.jennisondryden.com |
| Description (a) | Moody’s (Unaudited) | Interest Rate | Maturity Date | Principal Amount (000) | Value (Note 1) | |||||||
Municipal Bonds (cont’d.) | ||||||||||||
Perris Cmnty. Facs. Dist., Spec. Tax No. 01-2 Avalon, Ser. A | NR | 6.250% | 9/01/23 | $ | 2,000 | $ | 1,732,600 | |||||
Pico Rivera Wtr. Auth. Rev., Wtr. Sys. Proj., Ser. A, NATL | Baa1 | 5.500 | 5/01/29 | 1,500 | 1,659,150 | |||||||
Pittsburg Redev. Agcy. Tax Alloc., Los Medanos Cmnty. Dev. Proj., | ||||||||||||
A.M.B.A.C., C.A.B.S. | NR | 6.520(h) | 8/01/26 | 1,375 | 472,120 | |||||||
Ser. B, F.S.A. (Pre-refunded date 8/01/13)(e) | Aa3 | 5.800 | 8/01/34 | 2,700 | 3,210,354 | |||||||
Port Oakland, A.M.T. | ||||||||||||
Inter. Lien, Ser. A, NATL, A.M.T., Rfdg. | A2 | 5.000 | 11/01/29 | 3,000 | 2,706,690 | |||||||
Ser. K (Pre-refunded date 5/01/10)(e) | A1 | 5.750 | 11/01/16 | 25 | 25,763 | |||||||
Poway Cmnty., Facs., Dist. No. 88-1, Pkwy. Bus. Ctr. | NR | 6.750 | 8/15/15 | 1,000 | 1,010,850 | |||||||
Puerto Rico Comwlth. Hwy. & Trans. Auth. Rev., Ser. G, F.G.I.C. | Baa3 | 5.250 | 7/01/17 | 1,260 | 1,268,379 | |||||||
Puerto Rico Electric Pwr. Auth. Pwr. Ser. TT | A3 | 5.000 | 7/01/22 | 750 | 751,395 | |||||||
Puerto Rico Pub. Bldgs. Auth. Rev., Gtd. Rfdg., | ||||||||||||
Govt. Facs., Ser 04K F.S.A. | Aa3 | 5.250 | 7/01/27 | 500 | 510,750 | |||||||
Govt. Facs., Ser. P | Baa3 | 6.750 | 7/01/36 | 250 | 259,423 | |||||||
Puerto Rico Sales Tax Fing. Corp. Sales Tax Rev., | ||||||||||||
First Sub, Ser. A | A2 | 5.750 | 8/01/37 | 400 | 410,004 | |||||||
First Sub, Ser. A | A2 | 6.000 | 8/01/42 | 700 | 729,155 | |||||||
Rancho Mirage Jt. Pwrs. Fing. Auth. Rev., Eisenhower Med. Ctr., Ser. A | A3 | 5.000 | 7/01/47 | 2,500 | 2,139,125 | |||||||
Redding Elec. Sys. Rev., C.O.P., | ||||||||||||
Linked S.A.V.R.S. & R.I.B.S., NATL | ||||||||||||
Partial E.T.M.(e) | Baa1 | 6.368 | 7/01/22 | 100 | 117,028 | |||||||
NATL, Partial E.T.M.(e)(g) | Baa1 | 10.482(d) | 7/01/22 | 2,455 | 3,291,075 | |||||||
Redondo Beach Unified School Dist. | AA-(c) | 4.750 | 8/01/33 | 2,500 | 2,447,425 | |||||||
See Notes to Financial Statements.
| Dryden California Municipal Fund/California Income Series | 15 |
Portfolio of Investments
as of August 31, 2009 continued
| Description (a) | Moody’s (Unaudited) | Interest Rate | Maturity Date | Principal Amount (000) | Value (Note 1) | |||||||
Municipal Bonds (cont’d.) | ||||||||||||
Rocklin Uni. Sch. Dist., Ser. C, G.O., C.A.B.S., NATL | Baa1 | 4.490%(h) | 8/01/16 | $ | 1,400 | $ | 1,032,850 | |||||
Sacramento City Fin. Auth., Ser. B, C.A.B.S., NATL | Baa1 | 5.920(h) | 11/01/17 | 5,695 | 3,558,464 | |||||||
Sacramento City Fin. Auth., Tax Alloc. Comb. Proj., Ser. B, NATL, C.A.B.S. | Baa1 | 5.580(h) | 11/01/16 | 5,700 | 3,842,484 | |||||||
Sacramento Cnty. Santn. Dist. Fing. Auth. Rev., Var.-Regl., Ser. B, NATL, Fltg. | Aa3 | 0.977(d) | 12/01/35 | 1,000 | 701,250 | |||||||
San Bernardino Cmnty. College Dist., Election 2002, Ser. A, G.O. | Aa3 | 6.250 | 8/01/33 | 1,750 | 1,956,063 | |||||||
San Diego Redev., Agcy., Tax Alloc., North Bay Redev. | Baa1 | 5.875 | 9/01/29 | 3,000 | 2,902,440 | |||||||
San Diego Regl. Bldg. Auth. Lease Rev., Ctny. Operations Ctr. & Annex A | A1 | 5.375 | 2/01/36 | 1,000 | 1,024,830 | |||||||
San Diego Uni. Sch. Dist., Election of 1998, Ser. B, G.O., NATL | Aa2 | 6.000 | 7/01/19 | 1,000 | 1,189,000 | |||||||
San Diego. Cnty. Calif. Wtr. Auth. Wtr. Rev. Ser. 2008 A- Cops, C.O.P. | Aa3 | 5.000 | 5/01/38 | 2,500 | 2,515,550 | |||||||
San Francisco Calif. City & Cnty. Redev. Fing. Auth. Tax Alloc. Mission Bay North Redev., Ser. C | A-(c) | 6.500 | 8/01/39 | 1,000 | 1,003,550 | |||||||
San Francisco City & Cnty. Arpts. Commn. Intl. Arpt. Second. Ser. 34E, Rfdg., F.S.A., A.M.T. | Aa3 | 5.750 | 5/01/21 | 1,500 | 1,573,605 | |||||||
San Joaquin Hills Trans. Corridor Agcy., Toll Rd. Rev., Jr. Lien, C.A.B.S., E.T.M.(e)(f) | Aaa | 1.040(h) | 1/01/11 | 2,000 | 1,972,520 | |||||||
San Jose CA, Library & Parks Proj. | Aa1 | 5.000 | 9/01/33 | 2,200 | 2,285,514 | |||||||
San Jose Evergreen Cmnty. College Dist. Election 2004, Ser. B, F.S.A., G.O. | Aa2 | 4.270(h) | 9/01/17 | 1,000 | 715,820 | |||||||
See Notes to Financial Statements.
| 16 | Visit our website at www.jennisondryden.com |
| Description (a) | Moody’s (Unaudited) | Interest Rate | Maturity Date | Principal Amount (000) | Value (Note 1) | |||||||
Municipal Bonds (cont’d.) | ||||||||||||
San Leandro Cmnty. Facs., Spl. Tax, Dist. No.1 | NR | 6.500% | 9/01/25 | $ | 2,160 | $ | 1,909,418 | |||||
San Mateo Cnty CA Jt. Pwrs. Fin. Auth. | Aa3 | 5.000 | 7/15/33 | 1,000 | 984,870 | |||||||
Santa Margarita, Dana Point Auth., Impv. Rev., Dists., 3-3A-4 & 4A, Ser. B, NATL | Baa1 | 7.250 | 8/01/14 | 2,000 | 2,303,020 | |||||||
Santa Maria Joint Union H.S. Dist., Election of 2004, C.A.B.S., G.O., NATL | A2 | 6.560(h) | 8/01/29 | 1,250 | 345,750 | |||||||
Santa Monica Cmnty. College Dist. Election 2002, Ser. A, NATL, G.O., C.A.B.S. | Aa2 | 6.260(h) | 8/01/28 | 1,055 | 334,213 | |||||||
South Bayside Waste Mgmt. Auth. Calif. Solid Waste Enterprise Shoreway Environmental | A3 | 6.000 | 9/01/36 | 500 | 504,110 | |||||||
Southern California Pub. Pwr. Auth. Rev., | ||||||||||||
Palo Verde Proj., Ser. C, A.M.B.A.C., E.T.M., Rfdg., C.A.B.S.(e) | A1 | 2.990(h) | 7/01/16 | 16,325 | 13,323,811 | |||||||
PNC GIC Proj. Rev. | A2 | 6.750 | 7/01/13 | 1,000 | 1,171,980 | |||||||
Sulphur Springs Uni. Sch. Dist., Ser. A, G.O., NATL, C.A.B.S. | Baa1 | 2.160(h) | 9/01/11 | 3,000 | 2,874,390 | |||||||
Tobacco Securization Auth. Northn. Calif. Rev., Asset-Bkd. Tobacco Settlement, Ser. A | Baa3 | 5.500 | 6/01/45 | 2,000 | 1,466,680 | |||||||
Torrance Hosp. Rev., Torrance Mem. Med. Ctr., Ser. A | A1 | 6.000 | 6/01/22 | 2,000 | 2,050,620 | |||||||
Tuolumne Wind Proj. Auth. Calif. Rev., Tuolumne Co. Proj., Ser. A | A1 | 5.625 | 1/01/29 | 1,000 | 1,024,350 | |||||||
University Calif. Revs., Gen., Ser. Q | Aa1 | 5.000 | 5/15/34 | 1,000 | 1,017,590 | |||||||
University Calif. Revs., Ser. O | Aa1 | 5.750 | 5/15/34 | 1,250 | 1,368,600 | |||||||
University of CA Rev., Unrefunded, Bal.-UCLA Med., Ctr., Ser. A, A.M.B.A.C. | NR | 5.250 | 5/15/30 | 1,000 | 951,450 | |||||||
Valley Health Sys., Hosp. Rev., Impt. Proj., Ser. A(g) | C(c) | 6.500 | 5/15/25 | 130 | 71,422 | |||||||
See Notes to Financial Statements.
| Dryden California Municipal Fund/California Income Series | 17 |
Portfolio of Investments
as of August 31, 2009 continued
| Description (a) | Moody’s (Unaudited) | Interest Rate | Maturity Date | Principal Amount (000) | Value (Note 1) | ||||||||
Municipal Bonds (cont’d.) | |||||||||||||
Ventura Cnty. CA Cmnty. College | Aa3 | 5.500% | 8/01/33 | $ | 2,000 | $ | 2,072,600 | ||||||
Vernon Calif. Elec. Sys. Rev., Ser. A | A3 | 5.125 | 8/01/21 | 1,500 | 1,495,170 | ||||||||
Virgin Islands Pub. Fin. Auth. Rev., Matching Fd. Ln., Diago, Ser. A | Baa3 | 6.750 | 10/01/37 | 250 | 253,832 | ||||||||
Total long-term investments | 203,816,221 | ||||||||||||
SHORT-TERM INVESTMENTS 1.1% | |||||||||||||
Municipal Bonds | |||||||||||||
California Infrastructure & Economic Dev. Bk. Rev., Jewish Cmnty. Ctr., Ser. A, F.R.D.D.(b) | A-1+(c) | 0.120 | 9/01/09 | 700 | 700,000 | ||||||||
Sacramento Cnty. Calif. Santn. Dist. Fing. Auth. Rev., Var. Rfdg., Sub Lien, Santn. Dist., Ser. C F.R.D.D.(b) | VMIG1 | 0.120 | 9/01/09 | 400 | 400,000 | ||||||||
Sacramento Cnty. Santn. Dist. Auth. Rev., F.R.D.D.(b) | VMIG1 | 0.120 | 9/01/09 | 500 | 500,000 | ||||||||
Santa Clara Calif. Elec. Rev., Var. Sub., Ser. A F.R.D.D.(b) | A-1(c) | 0.120 | 9/01/09 | 600 | 600,000 | ||||||||
Total short-term investments | 2,200,000 | ||||||||||||
Total Investments 100.6% | 206,016,221 | ||||||||||||
Liabilities in excess of other assets(i) (0.6)% | (1,237,433 | ) | |||||||||||
Net Assets 100.0% | $ | 204,778,788 | |||||||||||
See Notes to Financial Statements.
| 18 | Visit our website at www.jennisondryden.com |
| * | The ratings reflected are as of August 31, 2009. Ratings of certain bonds may have changed subsequent to that date. |
| † | The Fund’s current Statement of Additional Information contains a description of Moody’s and Standard & Poor’s ratings. |
| (a) | The following abbreviations are used in the portfolio descriptions: |
A.M.B.A.C.—American Municipal Bond Assurance Corporation.
A.M.T.—Alternative Minimum Tax.
B.H.A.C.—Berkshire Hathaway Assurance Corp.
C.A.B.S.—Capital Appreciation Bonds.
C.O.P.—Certificates of Participation.
E.T.M.—Escrowed to Maturity.
F.G.I.C.—Federal Guaranty Insurance Company.
F.N.M.A.—Federal National Mortgage Association.
F.R.D.D.—Floating Rate (Daily) Demand Note
F.S.A.—Financial Security Assurance.
G.I.C.—Group Insurance Commission
G.N.M.A.—Government National Mortgage Association.
G.O.—General Obligation.
NATL—National Public Finance Guaranty Corp.
R.I.B.S.—Residual Interest Bearing Securities.
S.A.V.R.S.—Select Auction Variable Rate Securities.
T.C.R.S.—Transferable Custodial Receipts.
NR—Not Rated by Moody’s or Standard & Poor’s.
| (b) | For purposes of amortized cost valuation, the maturity date of Floating Rate Demand Notes is considered to be the later of the next date on which the security can be redeemed at par, or the next date on which the rate of interest is adjusted. |
| (c) | Standard & Poor’s rating. |
| (d) | Inverse floating rate bond. The coupon is inversely indexed to a floating interest rate. The rate shown is the rate at August 31, 2009. |
| (e) | All or partial escrowed to maturity and pre-refunded securities are secured by escrowed cash and/or U.S. guaranteed obligations. |
| (f) | All or portion of security segregated as collateral for financial futures contracts. |
| (g) | Indicates a security that has been deemed illiquid. |
| (h) | Represents a zero coupon bond or step bond. Rate shown reflects the effective yield at the time of purchase. |
| (i) | Liabilities in excess of other assets include net unrealized depreciation on financial futures contracts as follows: |
See Notes to Financial Statements.
| Dryden California Municipal Fund/California Income Series | 19 |
Portfolio of Investments
as of August 31, 2009 continued
Open futures contracts outstanding at August 31, 2009:
| Number of Contracts | Type | Expiration Date | Value at Trade Date | Value at August 31, 2009 | Unrealized Appreciation (Depreciation) | |||||||||
| Short Position: | ||||||||||||||
| 74 | U.S. Treasury 10 Yr. Notes | Dec. 2009 | $ | 8,611,290 | $ | 8,674,187 | $ | (62,897 | ) | |||||
Various inputs are used in determining the value of the Fund’s investments. These inputs are summarized in the three broad levels listed below.
Level 1—quoted prices in active markets for identical securities
Level 2—other significant observable inputs (including quoted prices for similar securities, interest rates, prepayment speeds, credit risk, etc.)
Level 3—significant unobservable inputs (including the Fund’s own assumptions in determining the fair value of investments)
The following is a summary of the inputs used as of August 31, 2009 in valuing the Fund’s assets carried at fair value:
Investments in Securities | Level 1 | Level 2 | Level 3 | |||||||
Municipal Bonds | $ | — | $ | 206,016,221 | $ | — | ||||
| — | 206,016,221 | — | ||||||||
Other Financial Instruments* | (62,897 | ) | — | — | ||||||
Total | $ | (62,897 | ) | $ | 206,016,221 | $ | — | |||
| * | Other financial instruments are derivative instruments not reflected in the Portfolio of Investments, such as futures, forwards and swap contracts, which are valued at the unrealized appreciation/depreciation on the instrument. |
As of August 31, 2008 and August 31, 2009, the Fund did not use any significant unobservable inputs (Level 3) in determining the value of investments.
See Notes to Financial Statements.
| 20 | Visit our website at www.jennisondryden.com |
The industry classification of portfolio holdings and liabilities in excess of other assets shown as a percentage of net assets as of August 31, 2009 was as follows:
Special Tax/Assessment District | 25.3 | % | |
Pre-Refunded | 13.7 | ||
General Obligation | 12.6 | ||
Healthcare | 10.8 | ||
Water & Sewer | 8.9 | ||
Education | 6.0 | ||
Transportation | 5.5 | ||
Lease Backed Certificates of Participation | 3.5 | ||
Power | 3.2 | ||
Tobacco | 2.3 | ||
Corporate Backed IDB & PCR | 2.2 | ||
Other | 1.9 | ||
Housing | 1.8 | ||
Tobacco Appropriated | 1.6 | ||
Short-Term Investments | 1.1 | ||
Solid Waste/Resource Recovery | 0.2 | ||
| 100.6 | |||
Liabilities in excess of other assets | (0.6 | ) | |
Net Assets | 100.0 | % | |
Industry classification is subject to change.
The Fund invested in derivative instruments during the reporting period. The primary types of risk associated with derivative instruments are commodity risk, credit risk, equity risk, foreign exchange risk and interest rate risk. The effect of such derivative instruments on the Fund’s financial position and financial performance as reflected in the Statement of Assets and Liabilities and Statement of Operations is presented in the summary below.
Fair values of derivative Instruments as of August 31, 2009 as presented in the Statement of Assets and Liabilities:
Derivatives not designated as hedging instruments, | Asset Derivatives | Liability Derivatives | ||||||||
| Balance Sheet Location | Fair Value | Balance Sheet Location | Fair Value | |||||||
Interest rate contracts | — | — | Due to broker - variation margin | $ | 62,897 | * | ||||
| * | Includes cumulative appreciation/depreciation on futures contracts as reported in Portfolio of Investments. Only unsettled variation margin receivable (payable) is reported within the Statement of Assets and Liabilities. |
See Notes to Financial Statements.
| Dryden California Municipal Fund/California Income Series | 21 |
The effects of derivative instruments on the Statement of Operations for the year ended August 31, 2009 are as follows:
Amount of Realized Gain (Loss) on Derivatives Recognized | |||
Derivatives not designated as hedging instruments, carried at fair value | Futures | ||
Interest rate contracts | $ | 887,408 | |
Net Change in Unrealized Appreciation (Depreciation) on Derivatives Recognized in Income | ||||
Derivatives not designated as hedging instruments, carried at fair value | Futures | |||
Interest rate contracts | $ | (260,015 | ) | |
See Notes to Financial Statements.
| 22 | Visit our website at www.jennisondryden.com |
Financial Statements
| AUGUST 31, 2009 | ANNUAL REPORT |
Dryden California Municipal Fund/California Income Series
Statement of Assets and Liabilities
as of August 31, 2009
Assets | |||
Unaffiliated investments, at value (cost $202,933,215) | $ | 206,016,221 | |
Cash | 75,863 | ||
Interest receivable | 2,287,856 | ||
Receivable for Fund shares sold | 507,135 | ||
Total assets | 208,887,075 | ||
Liabilities | |||
Payable for investments purchased | 3,325,520 | ||
Payable for Fund shares reacquired | 281,794 | ||
Dividends payable | 156,046 | ||
Accrued expenses | 145,288 | ||
Management fee payable | 85,598 | ||
Distribution fee payable | 48,773 | ||
Due to broker—variation margin | 30,775 | ||
Deferred trustees’ fees | 26,098 | ||
Affiliated transfer agent fee payable | 8,395 | ||
Total liabilities | 4,108,287 | ||
Net Assets | $ | 204,778,788 | |
Net assets were comprised of: | |||
Shares of beneficial interest, at par | $ | 201,957 | |
Paid-in capital in excess of par | 199,730,146 | ||
| 199,932,103 | |||
Undistributed net investment income | 34,315 | ||
Accumulated net realized gain on investment and financial futures transactions | 1,792,261 | ||
Net unrealized appreciation on investments and financial futures | 3,020,109 | ||
Net assets, August 31, 2009 | $ | 204,778,788 | |
See Notes to Financial Statements.
| 24 | Visit our website at www.jennisondryden.com |
Class A | |||
Net asset value and redemption price per share | $ | 10.14 | |
Maximum sales charge (4.00% of offering price) | 0.42 | ||
Maximum offering price to public | $ | 10.56 | |
Class B | |||
Net asset value, offering price and redemption price per share | $ | 10.14 | |
Class C | |||
Net asset value, offering price and redemption price per share | $ | 10.14 | |
Class Z | |||
Net asset value, offering price and redemption price per share | $ | 10.14 | |
See Notes to Financial Statements.
| Dryden California Municipal Fund/California Income Series | 25 |
Statement of Operations
Year Ended August 31, 2009
Net Investment Income | ||||
Income | ||||
Unaffiliated interest | $ | 11,520,454 | ||
Expenses | ||||
Management fee | 1,009,867 | |||
Distribution fee—Class A | 425,660 | |||
Distribution fee—Class B | 49,610 | |||
Distribution fee—Class C | 98,790 | |||
Custodian’s fees and expenses | 70,000 | |||
Transfer agent’s fees and expenses (including affiliated expense of $38,800) (Note 3) | 62,000 | |||
Registration fees | 46,000 | |||
Audit fee | 29,000 | |||
Reports to shareholders | 25,000 | |||
Legal fees and expenses | 17,000 | |||
Trustees’ fees | 15,000 | |||
Insurance expense | 4,000 | |||
Miscellaneous | 10,379 | |||
Total expenses | 1,862,306 | |||
Less: Custodian fee credit (Note 1) | (248 | ) | ||
Net expenses | 1,862,058 | |||
Net investment income | 9,658,396 | |||
Realized And Unrealized Gain (Loss) On Investments | ||||
Net realized gain on: | ||||
Investment transactions | 721,743 | |||
Financial futures transactions | 887,408 | |||
| 1,609,151 | ||||
Net change in unrealized appreciation (depreciation) on: | ||||
Investments | (6,268,796 | ) | ||
Financial futures contracts | (260,015 | ) | ||
| (6,528,811 | ) | |||
Net loss on investments | (4,919,660 | ) | ||
Net Increase In Net Assets Resulting From Operations | $ | 4,738,736 | ||
See Notes to Financial Statements.
| 26 | Visit our website at www.jennisondryden.com |
Statement of Changes in Net Assets
| Year Ended August 31, | ||||||||
| 2009 | 2008 | |||||||
Increase (Decrease) In Net Assets | ||||||||
Operations | ||||||||
Net investment income | $ | 9,658,396 | $ | 9,448,127 | ||||
Net realized gain on investment and financial futures transactions | 1,609,151 | 958,852 | ||||||
Net change in unrealized appreciation (depreciation) on investments and financial futures | (6,528,811 | ) | (3,187,296 | ) | ||||
Net increase in net assets resulting from operations | 4,738,736 | 7,219,683 | ||||||
Dividends and distributions (Note 1) | ||||||||
Dividends from net investment income | ||||||||
Class A | (8,032,676 | ) | (8,573,551 | ) | ||||
Class B | (443,331 | ) | (644,735 | ) | ||||
Class C | (555,760 | ) | (378,234 | ) | ||||
Class Z | (427,986 | ) | (321,228 | ) | ||||
| (9,459,753 | ) | (9,917,748 | ) | |||||
Distributions from net realized gains | ||||||||
Class A | (735,441 | ) | (1,094,036 | ) | ||||
Class B | (47,423 | ) | (94,528 | ) | ||||
Class C | (51,917 | ) | (52,362 | ) | ||||
Class Z | (35,930 | ) | (32,343 | ) | ||||
| (870,711 | ) | (1,273,269 | ) | |||||
Series share transactions (Net of share conversions) (Note 6) | ||||||||
Net proceeds from shares sold | 19,655,481 | 26,679,751 | ||||||
Net asset value of shares issued in reinvestment of dividends and distributions | 5,748,249 | 6,366,686 | ||||||
Cost of shares reacquired | (40,335,338 | ) | (32,805,170 | ) | ||||
Net increase (decrease) in net assets from Fund share transactions | (14,931,608 | ) | 241,267 | |||||
Total decrease | (20,523,336 | ) | (3,730,067 | ) | ||||
Net Assets | ||||||||
Beginning of year | 225,302,124 | 229,032,191 | ||||||
End of year(a) | $ | 204,778,788 | $ | 225,302,124 | ||||
(a) Includes undistributed net investment income of: | $ | 34,315 | $ | 34,315 | ||||
See Notes to Financial Statements.
| Dryden California Municipal Fund/California Income Series | 27 |
Notes to Financial Statements
Dryden California Municipal Fund—California Income Series (the “Fund”), is registered under the Investment Company Act of 1940, as amended, as an open-end management investment company. The Fund was organized as a Massachusetts business trust on May 18, 1984. The Fund commenced investment operations on December 3, 1990. The Fund is diversified and seeks to achieve its investment objective of obtaining the maximum amount of income exempt from federal and California state income taxes with the minimum of risk consistent with the preservation of capital. The Fund will invest primarily in investment grade municipal obligations but may also invest a portion of its assets in lower-quality municipal obligations or in non-rated securities which are of comparable quality. The ability of the issuers of the securities held by the Fund to meet their obligations may be affected by economic developments in a specific state, industry or region.
Note 1. Accounting Policies
The following is a summary of significant accounting policies followed by the Fund in preparation of its financial statements.
Securities Valuations: The Fund values municipal securities (including commitments to purchase such securities on a “when-issued” basis) as of the close of trading on the New York Stock Exchange, on the basis of prices provided by a pricing service which uses information with respect to transactions in comparable securities and various relationships between securities in determining values. Certain fixed income securities for which daily market quotations are not readily available may be valued with reference to fixed income securities whose prices are more readily available, pursuant to guidelines established by Board of Trustees. Prices may be obtained from independent pricing services which use information provided by market makers or estimates of market values obtained from yield data relating to investments or securities with similar characteristics. Securities for which reliable market quotations are not readily available, or for which the pricing service does not provide a valuation methodology, or does not present fair value, are valued at fair value in accordance with Board of Trustees’ approved fair valuation procedures. Options on securities and indices traded on an exchange are valued at their last sales price as of the close of trading on an applicable exchange, or if there was no sale, at the mean between the most recently quoted bit and asked prices on such exchanges. Futures contracts and options thereon traded on an exchange or board of trade are valued at the last sale price at the close of trading on such exchange or board of trade or, if there was no
| 28 | Visit our website at www.jennisondryden.com |
sale on the applicable exchange or board of trade on such day, at the mean between the most recently quoted prices on such exchange or board of trade or at the last bid price in the absence of an asked price.
When determining the fair valuation of securities some of the factors influencing the valuation include, the nature of any restrictions on disposition of the securities; assessment of the general liquidity of the securities; the issuer’s financial condition and the markets in which it does business; the cost of the investment; the size of the holding and the capitalization of issuer; the prices of any recent transactions or bids/offers for such securities or any comparable securities; any available analyst media or other reports or information deemed reliable by the investment adviser regarding the issuer or the markets or industry in which it operates. Using fair value to price securities may result in a value that is different from a security’s most recent closing price and from the price used by other mutual funds to calculate their net asset values.
Investments in mutual funds are valued at their net asset value as of the close of the New York Stock Exchange on the date of valuation.
Short-term debt securities, which mature in sixty days or less are valued at amortized cost, which approximates market value. The amortized cost method involves valuing a security at its cost on the date of purchase and thereafter assuming a constant amortization to maturity of the difference between the principal amount due at maturity and cost. Short-term debt securities which mature in more than sixty days are valued at current market quotations.
Restricted Securities: The Fund may hold up to 15% of its net assets in illiquid securities, including those which are restricted as to disposition under securities law (“restricted securities”). Certain issues of restricted securities held by the Fund at the end of the fiscal period include registration rights under which the Fund may demand registration by the issuers, of which the Fund may bear the cost of such registration. Restricted securities, sometimes referred to as private placements, are valued pursuant to the valuation procedures noted above.
Financial Futures Contracts: A financial futures contract is an agreement to purchase (long) or sell (short) an agreed amount of securities at a set price for delivery on a future date. Upon entering into a financial futures contract, the Fund is required to pledge to the broker an amount of cash and/or other assets equal to a certain percentage of the contract amount. This amount is known as the “initial margin”.
Subsequent payments, known as “variation margin,” are made or received by the Fund each day, depending on the daily fluctuations in the value of the underlying
| Dryden California Municipal Fund/California Income Series | 29 |
Notes to Financial Statements
continued
security. Such variation margin is recorded for financial statement purposes on a daily basis as unrealized gain or loss and is presented in the Statement of Assets and Liabilities. When the contract expires or is closed, the gain or loss is realized and is presented in the Statement of Operations as net realized gain or loss on financial futures transactions.
The Fund invests in financial futures contracts in order to hedge its existing portfolio securities or securities the Fund intends to purchase, against fluctuations in value caused by changes in prevailing interest rates, value of equities or foreign currency exchange rates. Should interest rates move unexpectedly, the Fund may not achieve the anticipated benefits of the financial futures contracts and may realize a loss. The use of futures transactions involves the risk of imperfect correlation in movements in the price of futures contracts, interest rates and the underlying hedged assets.
Financial future contracts, involve element of market risk in excess of the amounts reflected in the Statement of Assets and Liabilities.
Inverse Floaters: The Fund invests in variable rate securities commonly called “inverse floaters”. The interest rates on these securities have an inverse relationship to the interest rate of other securities or the value of an index. Changes in interest rates on the other security or index inversely affect the rate paid on the inverse floater, and the inverse floater’s price will be more volatile than that of a fixed-rate bond. Additionally, some of these securities contain a “leverage factor” whereby the interest rate moves inversely by a “factor” to the benchmark rate. Certain interest rate movements and other market factors can substantially affect the liquidity of inverse floating rate notes.
Floating-Rate Notes Issued in Conjunction with Securities Held: The Fund invests in inverse floating rate securities (“inverse floaters”) that pay interest at a rate that varies inversely with short-term interest rates. Certain of these securities may be leveraged, whereby the interest rate varies inversely at a multiple of the change in short-term rates. As interest rates rise, inverse floaters produce less current income. The price of such securities is more volatile than comparable fixed rate securities.
When the Fund enters into agreements to create inverse floaters and floater note securities (also known as Tender Option Bond Transactions), the Fund transfers a fixed rate bond to a broker for cash. At the same time the Fund buys (receives) a residual interest in a trust (the “trust”) set up by the broker, often referred to as an
| 30 | Visit our website at www.jennisondryden.com |
inverse floating rate obligation (inverse floaters). Generally, the broker deposits a fixed rate bond (the “fixed rate bond”) into the trust with the same CUSIP number as the fixed rate bond sold to the broker by the Fund. The “trust” also issues floating rate notes (“floating rate notes”), which are sold to third parties. The floating rate notes have interest rates that reset weekly. The inverse floater held by the Fund gives the Fund the right (1) to cause the holders of the floating rate notes to tender their notes at par, and (2) to have the broker transfer the fixed rate bond held by the trust to the Fund thereby collapsing the trust. In accordance with FAS Statement No. 140, the Fund accounts for the transaction described above as funded leverage by including the fixed rate bond in its Portfolio of Investments, and accounts for the floating rate notes as a liability under the caption “payable for floating rate notes issued” in the Fund’s “Statement of Assets and Liabilities.” Interest expense related to the Fund’s liability in connection with the floating rate notes held by third parties is recorded as incurred. The interest expense is under the caption “interest expenses related to inverse floaters” in the Fund’s “Statement of Operations” and is also included in the Fund’s expense ratio.
The Fund’s investment policies and restrictions permit investments in inverse floating rate securities. Inverse floaters held by the Fund are securities exempt from registration under Rule 144A of the Securities Act of 1933.
The Fund may also invest in inverse floaters without transferring a fixed rate bond into a trust, which is not accounted for as funded leverage.
When-Issued/Delayed Delivery Securities: Securities purchased or sold on a when-issued or delayed-delivery basis may be settled a month or more after trade date; interest income is not accrued until settlement date. At the time a Fund enters into such transactions, it instructs the custodian to segregate assets with a current value at least equal to the amount of its when-issued or delayed-delivery purchase commitments.
Securities Transactions and Net Investment Income: Securities transactions are recorded on the trade date. Realized gains or losses on sales of securities are calculated on the identified cost basis. Interest income, including amortization of premium and accretion of discount on debt securities, as required, is recorded on the accrual basis. Expenses are recorded on the accrual basis, which may require the use of certain estimates by management. The Fund amortizes premiums and accretes discounts on purchases of debt securities as adjustments to interest income.
Net investment income or loss (other than distribution fees which are charged directly to the respective class) and unrealized and realized gains or losses, are allocated daily to each class of shares based upon the relative proportion of net assets of each class at the beginning of the day.
| Dryden California Municipal Fund/California Income Series | 31 |
Notes to Financial Statements
continued
Dividends and Distributions: The Fund declares daily dividends from net investment income and pay monthly. Distributions of net capital gains, if any, are made at least annually.
Dividends and distributions to shareholders, which are determined in accordance with federal income tax regulation and which may differ from generally accepted accounting principles, are recorded on the ex-dividend date. Permanent book/tax differences relating to income and gains are reclassified amongst net investment income, accumulated net realized gain or loss and paid-in-capital in excess of par, as appropriate.
Custody Fee Credits: The Fund has an arrangement with its custodian bank, whereby uninvested monies earn credits which reduce the fees charged by the custodian. Such custody fee credits are presented as a reduction of gross expenses in the accompanying Statement of Operations.
Taxes: For federal income tax purposes, it is the Fund’s policy to meet the requirements of the Internal Revenue Code applicable to regulated investment companies and to distribute all of its net income and capital gains, if any, to shareholders. Therefore, no federal income tax provision is required.
Estimates: The preparation of the financial statements requires management to make estimates and assumptions that affect the reported amounts and disclosures in the financial statements. Actual results could differ from those estimates.
Note 2. Agreements
The Fund has a management agreement with Prudential Investments LLC (“PI”). Pursuant to this agreement, PI has responsibility for all investment advisory services and supervises the subadviser’s performance of such services. PI has entered into a subadvisory agreement with The Prudential Investment Management, Inc. (“PIM”). The subadvisory agreement provides that PIM furnishes investment advisory services in connection with the management of the Fund. In connection therewith, PIM is obligated to keep certain books and records of the Fund. PI pays for the services of PIM, the cost of compensation of officers of the Fund, occupancy and certain clerical and bookkeeping costs of the Fund. The Fund bears all other costs and expenses.
The management fee paid to PI is accrued daily and payable monthly, at an annual rate of .50 of 1% of the Fund’s average daily net assets up to and including $1 billion
| 32 | Visit our website at www.jennisondryden.com |
and .45% of the Fund’s average daily net assets in excess of $1 billion. The effective management fee rate was .50 of 1% for the year ended August 31, 2009.
The Fund has a distribution agreement with Prudential Investment Management Services LLC (“PIMS”), which acts as the distributor of the Class A, Class B, Class C and Class Z shares of the Fund. The Fund compensates PIMS for distributing and servicing the Fund’s Class A, Class B and Class C shares, pursuant to plans of distribution (the “Class A, B and C Plans”), regardless of expenses actually incurred by PIMS. The distribution fees for Class A, Class B and Class C shares are accrued daily and payable monthly. No distribution or service fees are paid to PIMS as distributor of the Class Z shares of the Fund.
Pursuant to the Class A, Class B and Class C Plans, the Fund compensates PIMS for distribution-related activities at an annual rate of up to .30 of 1%, .50 of 1% and 1% of the average daily net assets of the Class A, B and C shares, respectively. PIMS has contractually agreed to limit such fees to .25 of 1% and .75 of 1% of the Class A and Class C shares, respectively for the year ended August 31, 2009.
PIMS has advised the Fund that it received approximately $109,800 in front-end sales charges resulting from sales of Class A shares, during the year ended August 31, 2009. From these fees, PIMS paid a substantial part of such sales charges to affiliated broker-dealers which in turn paid commissions to sales persons and incurred other distribution costs.
PIMS has advised the Fund that, for the year ended August 31, 2009, it received approximately $28,500, $19,600 and $4,600 in contingent deferred sales charges imposed upon redemptions by certain Class A, Class B and Class C shareholders, respectively.
PI, PIMS and PIM are indirect wholly owned subsidiaries of Prudential Financial, Inc. (“Prudential”).
The Fund, along with other affiliated registered investment companies (the “Funds”), is a party to a Syndicated Credit Agreement (“SCA”) with two banks. The SCA provides for a commitment of $500 million. Interest on any borrowings under the SCA is incurred at contracted market rates and a commitment fee for the unused amount is accrued daily and paid quarterly. Effective October 22,2009, the Funds renewed the SCA with the banks. The commitment under the renewed SCA continues to be $500 million. The Funds pay a commitment fee of .15 of 1% of the unused portion of the renewed SCA. The expiration date of the renewed SCA will be October 20, 2010. For the period October 24, 2008 through October 21, 2009, the Funds paid a commitment fee of .13 of 1% of the unused portion of the agreement.
| Dryden California Municipal Fund/California Income Series | 33 |
Notes to Financial Statements
continued
The purpose of the SCA is to provide as an alternative source of temporary funding for capital share redemptions.
The Fund did not borrow any amounts pursuant to the SCA during the year ended August 31, 2009.
Note 3. Other Transactions with Affiliates
Prudential Mutual Fund Services LLC (“PMFS”), an affiliate of PI and an indirect wholly owned subsidiary of Prudential, serves as the Fund’s transfer agent. Transfer agent fees and expenses in the Statement of Operations include certain out-of-pocket expenses paid to nonaffiliates.
The Fund pays networking fees to affiliated and unaffiliated broker/dealers, including fees related to the services of Wells Fargo Advisors, LLC (“Wells Fargo”) and First Clearing, LLC (“First Clearing”) affiliates of Pl. These networking fees are payments made to broker/dealers that clear mutual fund transactions through a national clearing system. For the year ended August 31, 2009, the Fund incurred approximately $33,400 in total networking fees, of which approximately $9,200 was paid to First Clearing. The Fund did not pay any amounts to Wells Fargo during the year ended August 31, 2009. These amounts are included in transfer agent’s fees and expenses in the Statement of Operations.
Note 4. Portfolio Securities
Purchases and sales of portfolio securities of the Fund excluding short-term investments, for the year ended August 31, 2009 were $59,462,565 and $74,997,551, respectively.
Note 5. Distributions and Tax Information
Distributions to shareholders, which are determined in accordance with federal income tax regulations and which may differ from generally accepted accounting principles, are recorded on the ex-dividend date. In order to present undistributed net investment income, accumulated net realized gain on investment and financial futures transactions and paid-in capital in excess of par on the Statement of Assets and
| 34 | Visit our website at www.jennisondryden.com |
Liabilities that more closely represent their tax character, certain adjustments have been made to undistributed net investment income and accumulated net realized gain on investment and financial futures transactions. For the year ended August 31, 2009, the adjustments were to decrease undistributed net investment income and increase accumulated net realized gain on investment and financial futures transactions by $198,643 due to the difference in the treatment of accreting market discount between financial and tax reporting. Net investment income, net realized gains and net assets were not affected by this change.
Tax character of distributions paid during the year ended August 31, 2009 were:
Tax-Exempt Income | Long-Term | Total Distributions | ||
| $9,459,753 | $870,711 | $10,330,464 |
Tax character of distributions paid during the year ended August 31, 2008 were:
Tax-Exempt Income | Long-Term | Total Distributions | ||
| $9,917,748 | $1,275,876 | $11,193,624 |
As of August 31, 2009, the components of distributable earnings on a tax basis were $216,458 of tax-exempt income (includes a timing difference of $156,046 for dividends payable), $532,346 of ordinary income and $502,689 of long-term capital gains, respectively.
The United States federal income tax basis of the Fund’s investments and the net unrealized appreciation as of August 31, 2009 were as follows:
Tax Basis | Appreciation | Depreciation | Net | |||
| $202,238,889 | $11,411,451 | $(7,634,119) | $3,777,332 |
The difference between book basis and tax basis was primarily attributable to the difference in the treatment of accreting market discount for book and tax purposes.
Management has analyzed the Fund’s tax positions taken on federal income tax returns for all open tax years and has concluded that as of August 31, 2009, no provision for income tax would be required in the Fund’s financial statements. The Fund’s federal and state income and federal excise tax returns for tax years for which the applicable statutes of limitations have not expired are subject to examination by the Internal Revenue Service and state departments of revenue.
| Dryden California Municipal Fund/California Income Series | 35 |
Notes to Financial Statements
continued
Note 6. Capital
The Fund offers Class A, Class B, Class C and Class Z shares. Class A shares are subject to a maximum front-end sales charge of 4%. All investors who purchase Class A shares in an amount of $1 million or more are not subject to an initial sales charge but are subject to a contingent deferred sales charge (CDSC) of 1%, if they sell these shares within 12 months of purchase, including investors who purchase their shares through broker-dealers affiliated with Prudential Financial, Inc. Class B shares and sold with a CDSC which declines from 5% to zero depending on the period of time the shares are held. Class C shares sold within 12 months of purchase are subject to a CDSC of 1%. Class B shares automatically convert to Class A shares on a quarterly basis approximately seven years after purchase. A special exchange privilege is also available for shareholders who qualify to purchase Class A shares at net asset value. Class Z shares are not subject to any sales or redemption charge and are offered exclusively for sale to a limited group of investors.
The Fund has authorized an unlimited number of shares of beneficial interest for each class at $.01 par value per share.
Transactions in shares of beneficial interest for the year ended August 31, 2009 and 2008 were as follows:
Class A | Shares | Amount | |||||
Year ended August 31, 2009: | |||||||
Shares sold | 834,365 | $ | 8,135,981 | ||||
Shares issued in reinvestment of dividends and distributions | 486,700 | 4,741,688 | |||||
Shares reacquired | (3,225,392 | ) | (31,423,539 | ) | |||
Net increase (decrease) in shares outstanding before conversion | (1,904,327 | ) | (18,545,870 | ) | |||
Shares issued upon conversion from Class B | 415,797 | 4,048,404 | |||||
Net increase (decrease) in shares outstanding | (1,488,530 | ) | $ | (14,497,466 | ) | ||
Year ended August 31, 2008: | |||||||
Shares sold | 1,311,526 | $ | 13,772,760 | ||||
Shares issued in reinvestment of dividends and distributions | 510,263 | 5,354,226 | |||||
Shares reacquired | (2,401,709 | ) | (25,225,218 | ) | |||
Net increase (decrease) in shares outstanding before conversion | (579,920 | ) | (6,098,232 | ) | |||
Shares issued upon conversion from Class B | 432,623 | 4,537,729 | |||||
Net increase (decrease) in shares outstanding | (147,297 | ) | $ | (1,560,503 | ) | ||
| 36 | Visit our website at www.jennisondryden.com |
Class B | Shares | Amount | |||||
Year ended August 31, 2009: | |||||||
Shares sold | 168,490 | $ | 1,655,747 | ||||
Shares issued in reinvestment of dividends and distributions | 30,803 | 300,049 | |||||
Shares reacquired | (191,182 | ) | (1,852,282 | ) | |||
Net increase (decrease) in shares outstanding before conversion | 8,111 | 103,514 | |||||
Shares issued upon conversion into Class A | (415,524 | ) | (4,048,404 | ) | |||
Net increase (decrease) in shares outstanding | (407,413 | ) | $ | (3,944,890 | ) | ||
Year ended August 31, 2008: | |||||||
Shares sold | 198,220 | $ | 2,061,908 | ||||
Shares issued in reinvestment of dividends and distributions | 39,905 | 419,330 | |||||
Shares reacquired | (352,306 | ) | (3,707,999 | ) | |||
Net increase (decrease) in shares outstanding before conversion | (114,181 | ) | (1,226,761 | ) | |||
Shares reacquired upon conversion into Class A | (432,320 | ) | (4,537,729 | ) | |||
Net increase (decrease) in shares outstanding | (546,501 | ) | $ | (5,764,490 | ) | ||
Class C | |||||||
Year ended August 31, 2009: | |||||||
Shares sold | 502,832 | $ | 4,891,852 | ||||
Shares issued in reinvestment of dividends and distributions | 40,102 | 390,999 | |||||
Shares reacquired | (249,642 | ) | (2,435,067 | ) | |||
Net increase (decrease) in shares outstanding | 293,292 | $ | 2,847,784 | ||||
Year ended August 31, 2008: | |||||||
Shares sold | 504,439 | $ | 5,261,343 | ||||
Shares issued in reinvestment of dividends and distributions | 27,786 | 291,449 | |||||
Shares reacquired | (169,783 | ) | (1,786,383 | ) | |||
Net increase (decrease) in shares outstanding | 362,442 | $ | 3,766,409 | ||||
Class Z | |||||||
Year ended August 31, 2009: | |||||||
Shares sold | 505,959 | $ | 4,971,901 | ||||
Shares issued in reinvestment of dividends and distributions | 32,334 | 315,513 | |||||
Shares reacquired | (474,418 | ) | (4,624,450 | ) | |||
Net increase (decrease) in shares outstanding | 63,875 | $ | 662,964 | ||||
Year ended August 31, 2008: | |||||||
Shares sold | 533,408 | $ | 5,583,740 | ||||
Shares issued in reinvestment of dividends and distributions | 28,792 | 301,681 | |||||
Shares reacquired | (198,103 | ) | (2,085,570 | ) | |||
Net increase (decrease) in shares outstanding | 364,097 | $ | 3,799,851 | ||||
| Dryden California Municipal Fund/California Income Series | 37 |
Notes to Financial Statements
continued
Note 7. Subsequent Events
Management has evaluated the impact of all subsequent events on the Fund through October 26, 2009, the date the financial statements were issued, and has determined that there were no subsequent events requiring recognition or disclosure in the financial statements.
Note 8. New Accounting Pronouncements
In June 2009, FASB released Statement of Financial Accounting Standard No. 166, Accounting for Transfers of Financial Assets (FAS 166) and Statement of Financial Accounting Standard 167, Amendments to FASB Interpretation No. 46(R) (FAS 167), which change the ways entities account for securitizations and special purpose entities. FAS 166 will require more information about transfers of financial assets, including securitization transactions, and where entities have continuing exposure to the risks related to transferred financial assets. It eliminates the concept of a “qualifying special-purpose entity,” changes the requirements for derecognizing financial assets, and requires additional disclosures. FAS 167 changes how a company determines when an entity that is insufficiently capitalized or is not controlled through voting (or similar rights) should be consolidated. The application of FAS 166 and FAS 167 is required for fiscal years beginning after November 15, 2009 and interim periods within those fiscal years. At this time, management is evaluating the implications of FAS 166 and FAS 167 and their impact on the financial statements has not been determined.
| 38 | Visit our website at www.jennisondryden.com |
Financial Highlights
| AUGUST 31, 2009 | ANNUAL REPORT |
Dryden California Municipal Fund/California Income Series
Financial Highlights
| Class A | ||||
| Year Ended August 31, 2009 | ||||
Per Share Operating Performance: | ||||
Net Asset Value, Beginning Of Year | $ | 10.37 | ||
Income (loss) from investment operations: | ||||
Net investment income | .47 | |||
Net realized and unrealized gain (loss) on investments and financial futures | (.20 | ) | ||
Total from investment operations | .27 | |||
Less Dividends and Distributions: | ||||
Dividends from net investment income | (.46 | ) | ||
Distributions from net realized gains | (.04 | ) | ||
Total dividends and distributions | (.50 | ) | ||
Net asset value, end of year | $ | 10.14 | ||
Total Return(a): | 2.94 | % | ||
Ratios/Supplemental Data: | ||||
Net assets, end of year (000) | $ | 171,357 | ||
Average net assets (000) | $ | 170,257 | ||
Ratios to average net assets: | ||||
Expenses, including distribution and service (12b-1) fees(b) | .89 | % | ||
Expenses, excluding distribution and service (12b-1) fees | .64 | % | ||
Net investment income | 4.82 | % | ||
For Class A, B, C, and Z shares: | ||||
Portfolio turnover rate | 30 | %(d) | ||
| (a) | Total investment return does not consider the effects of sales loads. Total investment return is calculated assuming a purchase of a share on the first day and a sale on the last day of each year reported and includes reinvestment of dividends and distributions. Total investment returns may reflect adjustments to conform to generally accepted accounting principles. |
| (b) | The distributor of the Fund has contractually agreed to limit its distribution and service (12b-1) fees to .25 of 1% of the average daily net assets of the Class A shares. |
| (c) | The expense ratio reflects the interest and fees expenses related to the liability for the floating rate notes issued in conjunction with the inverse floater securities. The total expense ratio excluding interest expense and fees is .87% and .89% and the expense ratio excluding 12b-1 and interest expense and fees is .62% and .64% for the years ended August 31, 2008 and 2007, respectively. |
| (d) | The portfolio turnover rate including variable rate demand notes was 53% for the year ended August 31, 2009. |
See Notes to Financial Statements.
| 40 | Visit our website at www.jennisondryden.com |
| Class A | ||||||||||||||
| Year Ended August 31, | ||||||||||||||
| 2008 | 2007 | 2006 | 2005 | |||||||||||
| $ | 10.55 | $ | 10.94 | $ | 11.14 | $ | 10.95 | |||||||
| .45 | .47 | .48 | .46 | |||||||||||
| (.10 | ) | (.30 | ) | (.14 | ) | .19 | ||||||||
| .35 | .17 | .34 | .65 | |||||||||||
| (.47 | ) | (.46 | ) | (.47 | ) | (.46 | ) | |||||||
| (.06 | ) | (.10 | ) | (.07 | ) | — | ||||||||
| (.53 | ) | (.56 | ) | (.54 | ) | (.46 | ) | |||||||
| $ | 10.37 | $ | 10.55 | $ | 10.94 | $ | 11.14 | |||||||
| 3.31 | % | 1.55 | % | 3.18 | % | 6.02 | % | |||||||
| $ | 190,613 | $ | 195,617 | $ | 136,509 | $ | 141,564 | |||||||
| $ | 192,969 | $ | 183,767 | $ | 140,306 | $ | 141,287 | |||||||
| .87 | %(c) | .92 | %(c) | .94 | % | .93 | % | |||||||
| .62 | %(c) | .67 | %(c) | .69 | % | .68 | % | |||||||
| 4.23 | % | 4.40 | % | 4.33 | % | 4.15 | % | |||||||
| 41 | % | 43 | % | 40 | % | 11 | % | |||||||
See Notes to Financial Statements.
| Dryden California Municipal Fund/California Income Series | 41 |
Financial Highlights
continued
| Class B | ||||
| Year Ended August 31, 2009 | ||||
Per Share Operating Performance: | ||||
Net Asset Value, Beginning Of Year | $ | 10.37 | ||
Income (loss) from investment operations: | ||||
Net investment income | .45 | |||
Net realized and unrealized gain (loss) on investments and financial futures | (.20 | ) | ||
Total from investment operations | .25 | |||
Less Dividends and Distributions: | ||||
Dividends from net investment income | (.44 | ) | ||
Distributions from net realized gains | (.04 | ) | ||
Total dividends and distributions | (.48 | ) | ||
Net asset value, end of year | $ | 10.14 | ||
Total Return(a): | 2.69 | % | ||
Ratios/Supplemental Data: | ||||
Net assets, end of year (000) | $ | 8,861 | ||
Average net assets (000) | $ | 9,922 | ||
Ratios to average net assets: | ||||
Expenses, including distribution and service (12b-1) fees | 1.14 | % | ||
Expenses, excluding distribution and service (12b-1) fees | .64 | % | ||
Net investment income | 4.57 | % | ||
| (a) | Total investment return does not consider the effects of sales loads. Total investment return is calculated assuming a purchase of a share on the first day and a sale on the last day of each year reported and includes reinvestment of dividends and distributions. Total investment returns may reflect adjustments to conform to generally accepted accounting principles. |
| (b) | The expense ratio reflects the interest and fees expenses related to the liability for the floating rate notes issued in conjunction with the inverse floater securities. The total expense ratio excluding interest expense and fees is 1.12% and 1.14% and the expense ratio excluding 12b-1 and interest expense and fees is .62% and .64% for the years ended August 31, 2008 and 2007, respectively. |
See Notes to Financial Statements.
| 42 | Visit our website at www.jennisondryden.com |
| Class B | ||||||||||||||
| Year Ended August 31, | ||||||||||||||
| 2008 | 2007 | 2006 | 2005 | |||||||||||
| $ | 10.55 | $ | 10.94 | $ | 11.14 | $ | 10.95 | |||||||
| .42 | .45 | .45 | .43 | |||||||||||
| (.10 | ) | (.30 | ) | (.14 | ) | .19 | ||||||||
| .32 | .15 | .31 | .62 | |||||||||||
| (.44 | ) | (.44 | ) | (.44 | ) | (.43 | ) | |||||||
| (.06 | ) | (.10 | ) | (.07 | ) | — | ||||||||
| (.50 | ) | (.54 | ) | (.51 | ) | (.43 | ) | |||||||
| $ | 10.37 | $ | 10.55 | $ | 10.94 | $ | 11.14 | |||||||
| 3.06 | % | 1.29 | % | 2.92 | % | 5.76 | % | |||||||
| $ | 13,283 | $ | 19,291 | $ | 21,264 | $ | 35,061 | |||||||
| $ | 15,408 | $ | 20,405 | $ | 25,830 | $ | 40,894 | |||||||
| 1.12 | %(b) | 1.17 | %(b) | 1.19 | % | 1.18 | % | |||||||
| .62 | %(b) | .67 | %(b) | .69 | % | .68 | % | |||||||
| 3.98 | % | 4.13 | % | 4.08 | % | 3.90 | % | |||||||
See Notes to Financial Statements.
| Dryden California Municipal Fund/California Income Series | 43 |
Financial Highlights
continued
| Class C | ||||
| Year Ended August 31, 2009 | ||||
Per Share Operating Performance: | ||||
Net Asset Value, Beginning Of Year | $ | 10.37 | ||
Income (loss) from investment operations: | ||||
Net investment income | .42 | |||
Net realized and unrealized gain (loss) on investments and financial futures | (.20 | ) | ||
Total from investment operations | .22 | |||
Less Dividends and Distributions: | ||||
Dividends from net investment income | (.41 | ) | ||
Distributions from net realized gains | (.04 | ) | ||
Total dividends and distributions | (.45 | ) | ||
Net asset value, end of year | $ | 10.14 | ||
Total Return(a): | 2.45 | % | ||
Ratios/Supplemental Data: | ||||
Net assets, end of year (000) | $ | 14,804 | ||
Average net assets (000) | $ | 13,172 | ||
Ratios to average net assets: | ||||
Expenses, including distribution and service (12b-1) fees(b) | 1.39 | % | ||
Expenses, excluding distribution and service (12b-1) fees | .64 | % | ||
Net investment income | 4.32 | % | ||
| (a) | Total investment return does not consider the effects of sales loads. Total investment return is calculated assuming a purchase of a share on the first day and a sale on the last day of each year reported and includes reinvestment of dividends and distributions. Total investment returns may reflect adjustments to conform to generally accepted accounting principles. |
| (b) | The distributor of the Fund has contractually agreed to limit its distribution and service (12b-1) fees to .75 of 1% of the average daily net assets of the Class C shares. |
| (c) | The expense ratio reflects the interest and fees expenses related to the liability for the floating rate notes issued in conjunction with the inverse floater securities. The total expense ratio excluding interest expense and fees is 1.37% and 1.39% and the expense ratio excluding 12b-1 and interest expense and fees is .62% and .64% for the years ended August 31, 2008 and 2007, respectively. |
See Notes to Financial Statements.
| 44 | Visit our website at www.jennisondryden.com |
| Class C | ||||||||||||||
| Year Ended August 31, | ||||||||||||||
| 2008 | 2007 | 2006 | 2005 | |||||||||||
| $ | 10.55 | $ | 10.94 | $ | 11.14 | $ | 10.95 | |||||||
| .40 | .42 | .42 | .40 | |||||||||||
| (.10 | ) | (.30 | ) | (.14 | ) | .19 | ||||||||
| .30 | .12 | .28 | .59 | |||||||||||
| (.42 | ) | (.41 | ) | (.41 | ) | (.40 | ) | |||||||
| (.06 | ) | (.10 | ) | (.07 | ) | — | ||||||||
| (.48 | ) | (.51 | ) | (.48 | ) | (.40 | ) | |||||||
| $ | 10.37 | $ | 10.55 | $ | 10.94 | $ | 11.14 | |||||||
| 2.82 | % | 1.04 | % | 2.66 | % | 5.50 | % | |||||||
| $ | 12,094 | $ | 8,488 | $ | 8,059 | $ | 8,251 | |||||||
| $ | 9,567 | $ | 8,497 | $ | 8,182 | $ | 8,726 | |||||||
| 1.37 | %(c) | 1.42 | %(c) | 1.44 | % | 1.43 | % | |||||||
| .62 | %(c) | .67 | %(c) | .69 | % | .68 | % | |||||||
| 3.74 | % | 3.90 | % | 3.83 | % | 3.66 | % | |||||||
See Notes to Financial Statements.
| Dryden California Municipal Fund/California Income Series | 45 |
Financial Highlights
continued
| Class Z | ||||
| Year Ended August 31,2009 | ||||
Per Share Operating Performance: | ||||
Net Asset Value, Beginning Of Year | $ | 10.37 | ||
Income (loss) from investment operations: | ||||
Net investment income | .50 | |||
Net realized and unrealized gain (loss) on investments and financial futures | (.20 | ) | ||
Total from investment operations | .30 | |||
Less Dividends and Distributions: | ||||
Dividends from net investment income | (.49 | ) | ||
Distributions from net realized gains | (.04 | ) | ||
Total dividends and distributions | (.53 | ) | ||
Net asset value, end of year | $ | 10.14 | ||
Total Return(a): | 3.21 | % | ||
Ratios/Supplemental Data: | ||||
Net assets, end of year (000) | $ | 9,757 | ||
Average net assets (000) | $ | 8,616 | ||
Ratios to average net assets: | ||||
Expenses, including distribution and service (12b-1) fees | .64 | % | ||
Expenses, excluding distribution and service (12b-1) fees | .64 | % | ||
Net investment income | 5.07 | % | ||
| (a) | Total investment return is calculated assuming a purchase of a share on the first day and a sale on the last day of each year reported and includes reinvestment of dividends and distributions. Total investment returns may reflect adjustments to conform to generally accepted accounting principles. |
| (b) | The expense ratio reflects the interest and fees expenses related to the liability for the floating rate notes issued in conjunction with the inverse floater securities. The total expense ratio excluding interest expense and fees is .62% and .64% and the expense ratio excluding 12b-1 and interest expense and fees is .62% and .64% for the years ended August 31, 2008 and 2007, respectively. |
See Notes to Financial Statements.
| 46 | Visit our website at www.jennisondryden.com |
| Class Z | ||||||||||||||
| Year Ended August 31, | ||||||||||||||
| 2008 | 2007 | 2006 | 2005 | |||||||||||
| $ | 10.56 | $ | 10.95 | $ | 11.14 | $ | 10.95 | |||||||
| .48 | .50 | .50 | .48 | |||||||||||
| (.11 | ) | (.30 | ) | (.12 | ) | .19 | ||||||||
| .37 | .20 | .38 | .67 | |||||||||||
| (.50 | ) | (.49 | ) | (.50 | ) | (.48 | ) | |||||||
| (.06 | ) | (.10 | ) | (.07 | ) | — | ||||||||
| (.56 | ) | (.59 | ) | (.57 | ) | (.48 | ) | |||||||
| $ | 10.37 | $ | 10.56 | $ | 10.95 | $ | 11.14 | |||||||
| 3.49 | % | 1.80 | % | 3.53 | % | 6.29 | % | |||||||
| $ | 9,312 | $ | 5,636 | $ | 4,985 | $ | 4,737 | |||||||
| $ | 6,821 | $ | 5,566 | $ | 4,925 | $ | 5,101 | |||||||
| .62 | %(b) | .67 | %(b) | .69 | % | .68 | % | |||||||
| .62 | %(b) | .67 | %(b) | .69 | % | .68 | % | |||||||
| 4.50 | % | 4.64 | % | 4.58 | % | 4.39 | % | |||||||
See Notes to Financial Statements.
| Dryden California Municipal Fund/California Income Series | 47 |
Report of Independent Registered Public Accounting Firm
The Board of Directors and Shareholders
Dryden California Municipal Fund—California Income Series:
We have audited the accompanying statement of assets and liabilities of the Dryden California Municipal Fund—California Income Series (hereafter referred to as the “Fund”), including the portfolio of investments, as of August 31, 2009, and the related statement of operations for the year then ended, the statement of changes in net assets for each of the years in the two-year period then ended and the financial highlights for each of the years in the five-year period then ended. These financial statements and financial highlights are the responsibility of the Fund’s management. Our responsibility is to express an opinion on these financial statements and financial highlights based on our audits.
We conducted our audits in accordance with the standards of the Public Company Accounting Oversight Board (United States). Those standards require that we plan and perform the audit to obtain reasonable assurance about whether the financial statements and financial highlights are free of material misstatement. An audit includes examining, on a test basis, evidence supporting the amounts and disclosures in the financial statements. Our procedures included confirmation of securities owned as of August 31, 2009, by correspondence with the custodian, transfer agent and brokers or by other appropriate auditing procedures where replies from brokers were not received. An audit also includes assessing the accounting principles used and significant estimates made by management, as well as evaluating the overall financial statement presentation. We believe that our audits provide a reasonable basis for our opinion.
In our opinion, the financial statements and financial highlights referred to above present fairly, in all material respects, the financial position of the Fund as of August 31, 2009, and the results of its operations for the year then ended and the changes in its net assets for each of the years in the two-year period then ended and the financial highlights for each of the years in the five-year period then ended, in conformity with U.S. generally accepted accounting principles.

New York, New York
October 26, 2009
| 48 | Visit our website at www.jennisondryden.com |
Federal Income Tax Information
(Unaudited)
We are required by the Internal Revenue Code of 1986, as amended (“the Code”), to advise you within 60 days of the Series’ fiscal year end (August 31, 2009) as to the federal income tax status of dividends and distributions paid during such fiscal year. We are advising you that during its fiscal year ended August 31, 2009, the Fund designates the maximum amount allowable per share, but not less than $0.462 per Class A shares, $0.438 per Class B shares, $0.414 per Class C shares and $0.487 per Class Z shares as exempt-interest dividends in accordance with Section 852(b)(5) of the Internal Revenue Code. In addition, the Fund designates the maximum amount allowable per share, but not less than $0.042 per Class A, B, C and Z shares, as a capital gain distribution in accordance with Section 852(b)(3)(C) of the Internal Revenue Code.
In January 2010, you will be advised on IRS Form 1099 DIV and/or 1099 INT or substitute forms as to the federal tax status of the dividends and distributions received by you in calendar 2009.
| Dryden California Municipal Fund/California Income Series | 49 |
MANAGEMENT OF THE FUND
(Unaudited)
Information about Fund Directors/Trustees (referred to herein as “Board Members”) and Fund Officers is set forth below. Board Members who are not deemed to be “interested persons,” as defined in the 1940 Act, are referred to as “Independent Board Members.” Board Members who are deemed to be “interested persons” are referred to as “Interested Board Members.” The Board Members are responsible for the overall supervision of the operations of the Fund and perform the various duties imposed on the directors or trustees of investment companies by the 1940 Act.
Independent Board Members (1) | ||||
Name, Address, Age Position(s) Portfolios Overseen
|
Principal Occupation(s) During Past Five Years |
Other Directorships Held | ||
Kevin J. Bannon (57) Board Member Portfolios Overseen: 57 |
Managing Director (since April 2008) of Highmount Capital LLC (registered investment adviser); formerly Executive Vice President and Chief Investment Officer (April 1993-August 2007) of Bank of New York Company; President (May 2003-May 2007) of BNY Hamilton Family of Mutual Funds.
|
Director of Urstadt Biddle Properties (since September 2008). | ||
Linda W. Bynoe (57) Board Member Portfolios Overseen: 57 |
President and Chief Executive Officer (since March 1995) of Telemat Ltd. (management consulting); formerly Vice President at Morgan Stanley & Co (broker-dealer). |
Director of Simon Property Group, Inc. (real estate investment trust) (since May 2003); Anixter International (communication products distributor) (since January 2006); Director of Northern Trust Corporation (banking) (since April 2006).
| ||
David E.A. Carson (75) Board Member Portfolios Overseen: 57 |
Director (since May 2008) of Liberty Bank; Director (since October 2007) of ICI Mutual Insurance Company; formerly President, Chairman and Chief Executive Officer of People’s Bank (1987-2000).
|
None. | ||
Michael S. Hyland, CFA (64) Board Member Portfolios Overseen: 57 |
Independent Consultant (since February 2005); formerly Senior Managing Director (July 2001-February 2005) of Bear Stearns & Co, Inc.; Global Partner, INVESCO (1999-2001); Managing Director and President Salomon Brothers Asset Management (1989-1999).
|
None. | ||
Robert E. La Blanc (75) Board Member Portfolios Overseen: 57
|
President (since 1981) of Robert E. La Blanc Associates, Inc. (telecommunications). |
Director of CA, Inc. (since 2002) (software company); FiberNet Telecom Group, Inc. (since 2003) (telecom company).
| ||
Visit our website at www.jennisondryden.com
Douglas H. McCorkindale (70) Board Member Portfolios Overseen: 57 | Formerly Chairman (February 2001-June 2006), Chief Executive Officer (June 2000-July 2005), President (September 1997-July 2005) and Vice Chairman (March 1984-May 2000) of Gannett Co. Inc. (publishing and media).
| Director of Continental Airlines, Inc. (since May 1993); Director of Lockheed Martin Corp. (aerospace and defense) (since May 2001). | ||
Stephen P. Munn (67) Board Member Portfolios Overseen: 57 |
Lead Director (since 2007) and formerly Chairman (1993-2007) of Carlisle Companies Incorporated (manufacturer of industrial products).
|
None. | ||
Richard A. Redeker (66) Board Member Portfolios Overseen: 57
|
Retired Mutual Fund Executive (36 years); Management Consultant; Director of Penn Tank Lines, Inc. (since 1999).
|
None. | ||
Robin B. Smith (70) Board Member & Independent Chair Portfolios Overseen: 57 |
Chairman of the Board (since January 2003) of Publishers Clearing House (direct marketing); formerly Chairman and Chief Executive Officer (August 1996-January 2003) of Publishers Clearing House.
|
Formerly Director of BellSouth Corporation (telecommunications) (1992-2006). | ||
Stephen G. Stoneburn (66) Board Member Portfolios Overseen: 57 |
President and Chief Executive Officer (since June 1996) of Quadrant Media Corp. (publishing company); formerly President (June 1995-June 1996) of Argus Integrated Media, Inc.; Senior Vice President and Managing Director (January 1993-1995) of Cowles Business Media; Senior Vice President of Fairchild Publications, Inc (1975-1989).
|
None. | ||
Interested Board Member (1) | ||||
Judy A. Rice (61) Board Member & President Portfolios Overseen: 57 |
President, Chief Executive Officer, Chief Operating Officer and Officer-In-Charge (since February 2003) of Prudential Investments LLC; President, Chief Executive Officer and Officer-In-Charge (since April 2003) of Prudential Mutual Fund Services LLC; Executive Vice President (since December 2008) of Prudential Investment Management Services LLC; formerly Vice President (February 1999-April 2006) of Prudential Investment Management Services LLC; formerly President, Chief Executive Officer, Chief Operating Officer and Officer-In-Charge (May 2003-June 2005) and Director (May 2003-March 2006) and Executive Vice President (June 2005- March 2006) of AST Investment Services, Inc.; Member of Board of Governors of the Investment Company Institute. |
None. | ||
Dryden California Municipal Fund/California Income Series
| 1 | The year in which each individual joined the Fund’s Board is as follows: |
Kevin J. Bannon, 2008; Linda W. Bynoe, 2005; David E.A. Carson, 2003; Michael S. Hyland, 2008; Robert E. La Blanc, 2003; Douglas H. McCorkindale, 2003, Stephen P. Munn, 2008; Richard A. Redeker, 1993; Robin B. Smith, 2003; Stephen G. Stoneburn, 2003; Judy A. Rice, Board Member since 2000 and President since 2003.
Fund Officers(a)(1) | ||
Name, Address and Age Position with Fund
|
Principal Occupation(s) During Past Five Years | |
Scott E. Benjamin (36) Vice President |
Executive Vice President (since June 2009) of Prudential Investments LLC and Prudential Investment Management Services LLC; Senior Vice President Product Development and Marketing, Prudential Investments (since February 2006); Vice President Product Development and Product Management, Prudential Investments (2003-2006).
| |
Kathryn L. Quirk (56) Chief Legal Officer |
Vice President and Corporate Counsel (since September 2004) of Prudential; Executive Vice President, Chief Legal Officer and Secretary (since July 2005) of PI and Prudential Mutual Fund Services LLC; Vice President and Corporate Counsel (since June 2005) and Secretary (since February 2006) of AST Investment Services, Inc.; formerly Senior Vice President and Assistant Secretary (November 2004-August 2005) of PI; formerly Assistant Secretary (June 2005-February 2006) of AST Investment Services, Inc.; formerly Managing Director, General Counsel, Chief Compliance Officer, Chief Risk Officer and Corporate Secretary (1997-2002) of Zurich Scudder Investments, Inc.
| |
Deborah A. Docs (51) Secretary |
Vice President and Corporate Counsel (since January 2001) of Prudential; Vice President (since December 1996) and Assistant Secretary (since March 1999) of PI; formerly Vice President and Assistant Secretary (May 2003-June 2005) of AST Investment Services, Inc.
| |
Jonathan D. Shain (51) Assistant Secretary |
Vice President and Corporate Counsel (since August 1998) of Prudential; Vice President and Assistant Secretary (since May 2001) of PI; Vice President and Assistant Secretary (since February 2001) of PMFS; formerly Vice President and Assistant Secretary (May 2003-June 2005) of AST Investment Services, Inc.
| |
Claudia DiGiacomo (35) Assistant Secretary |
Vice President and Corporate Counsel (since January 2005) of Prudential; Vice President and Assistant Secretary of PI (since December 2005); Associate at Sidley Austin Brown & Wood LLP (1999-2004).
| |
John P. Schwartz (38) Assistant Secretary |
Vice President and Corporate Counsel (since April 2005) of Prudential; Vice President and Assistant Secretary of PI (since December 2005); Associate at Sidley Austin Brown & Wood LLP (1997-2005).
| |
Andrew R. French (46) Assistant Secretary |
Director and Corporate Counsel (since May 2006) of Prudential; Vice President and Assistant Secretary (since January 2007) of PI; Vice President and Assistant Secretary (since January 2007) of PMFS; formerly Senior Legal Analyst of Prudential Mutual Fund Law Department (1997-2006).
| |
Timothy J. Knierim (50) Chief Compliance Officer |
Chief Compliance Officer of Prudential Investment Management, Inc. (since July 2007); formerly Chief Risk Officer of PIM and PI (2002-2007) and formerly Chief Ethics Officer of PIM and PI (2006-2007).
| |
Valerie M. Simpson (51) Deputy Chief Compliance Officer |
Chief Compliance Officer (since April 2007) of PI and AST Investment Services, Inc.; formerly Vice President-Financial Reporting (June 1999-March 2006) for Prudential Life and Annuities Finance.
| |
Visit our website at www.jennisondryden.com
Theresa C. Thompson (47) Deputy Chief Compliance Officer
| Vice President, Compliance, PI (since April 2004); and Director, Compliance, PI (2001-2004). | |
Noreen M. Fierro (45) Anti-Money Laundering Compliance Officer |
Vice President, Corporate Compliance (since May 2006) of Prudential; formerly Corporate Vice President, Associate General Counsel (April 2002-May 2005) of UBS Financial Services, Inc., in their Money Laundering Prevention Group; Senior Manager (May 2005-May 2006) of Deloitte Financial Advisory Services, LLP, in their Forensic and Dispute Services, Anti-Money Laundering Group.
| |
Grace C. Torres (50) Treasurer and Principal Financial and Accounting Officer |
Assistant Treasurer (since March 1999) and Senior Vice President (since September 1999) of PI; Assistant Treasurer (since May 2003) and Vice President (since June 2005) of AST Investment Services, Inc.; Senior Vice President and Assistant Treasurer (since May 2003) of Prudential Annuities Advisory Services, Inc.; formerly Senior Vice President (May 2003-June 2005) of AST Investment Services, Inc.
| |
M. Sadiq Peshimam (45) Assistant Treasurer
|
Vice President (since 2005) and Director (2000-2005) within Prudential Mutual Fund Administration.
| |
Peter Parrella (51) Assistant Treasurer
|
Vice President (since 2007) and Director (2004-2007) within Prudential Mutual Fund Administration; formerly Tax Manager at SSB Citi Fund Management LLC (1997-2004).
|
| (a) | Excludes interested Board Members who also serve as President or Vice President. |
| 1 | The year in which each individual became an Officer of the Fund is as follows: |
Scott E. Benjamin, 2009; Kathryn L. Quirk, 2005; Deborah A. Docs, 1998; Jonathan D. Shain, 2004; Claudia DiGiacomo, 2005; John P. Schwartz, 2006; Andrew R. French, 2006; Timothy J. Knierim, 2007; Valerie M. Simpson, 2007; Theresa C. Thompson, 2008; Noreen M. Fierro, 2006; Grace C. Torres, 1996; Peter Parrella, 2007; M. Sadiq Peshimam, 2006.
Explanatory Notes
| • | Board Members are deemed to be “Interested,” as defined in the 1940 Act, by reason of their affiliation with Prudential Investments LLC and/or an affiliate of Prudential Investments LLC. |
| • | Unless otherwise noted, the address of all Board Members and Officers is c/o Prudential Investments LLC, Gateway Center Three, 100 Mulberry Street, Newark, New Jersey 07102. |
| • | There is no set term of office for Board Members or Officers. The Board Members have adopted a retirement policy, which calls for the retirement of Board Members on December 31st of the year in which they reach the age of 75. |
| • | “Other Directorships Held” includes only directorships of companies required to register or file reports with the SEC under the Securities Exchange Act of 1934 (that is, “public companies”) or other investment companies registered under the 1940 Act. |
| • | “Portfolios Overseen” includes all investment companies managed by Prudential Investments LLC. The investment companies for which PI serves as manager include the JennisonDryden Funds, Strategic Partners Funds, The Prudential Variable Contract Accounts, The Target Portfolio Trust, The Prudential Series Fund, Prudential’s Gibraltar Fund, Inc. and the Advanced Series Trust. |
Dryden California Municipal Fund/California Income Series
Approval of Advisory Agreements
The Fund’s Board of Trustees
The Board of Trustees (the “Board”) of the California Income Series (the “Fund”)1 consists of 11 individuals, 10 of whom are not “interested persons” of the Fund, as defined in the Investment Company Act of 1940, as amended (the “1940 Act”) (the “Independent Trustees”). The Board is responsible for the oversight of the Fund and its operations, and performs the various duties imposed on the directors of investment companies by the 1940 Act. The Independent Trustees have retained independent legal counsel to assist them in connection with their duties. the Chair of the Board is an Independent Trustee. The Board has established three standing committees: the Audit Committee, the Nominating and Governance Committee, and the JennisonDryden Investment Committee. Each committee is chaired by, and composed of, Independent Trustees.
Annual Approval of the Fund’s Advisory Agreements
As required under the 1940 Act, the Board determines annually whether to renew the Fund’s management agreement with Prudential Investments LLC (“PI”) and the Fund’s subadvisory agreement with Prudential Investment Management, Inc. (“PIM”). In considering the renewal of the agreements, the Board, including all of the Independent Directors, met on June 2-4, 2009 and approved the renewal of the agreements through July 31, 2010, after concluding that renewal of the agreements was in the best interests of the Fund and its shareholders.
In advance of the meetings, the Board requested and received materials relating to the agreements, and had the opportunity to ask questions and request further information in connection with its consideration. Among other things, the Board considered comparisons with other mutual funds in relevant Peer Universes and Peer Groups. The mutual funds included in each Peer Universe or Peer Group were objectively determined by Lipper Inc., an independent provider of mutual fund data. The comparisons placed the Fund in various quartiles over the one-, three-, five-, and ten-year periods ending December 31, 2008, with the first quartile being the best 25% of the mutual funds (for performance, the best performing mutual funds and, for expenses, the lowest cost mutual funds).
In approving the agreements, the Board, including the Independent Trustees advised by independent legal counsel, considered the factors it deemed relevant, including the nature, quality and extent of services provided by PI and the subadviser, the performance of the Fund, the profitability of PI and its affiliates, expenses and fees, and the potential for economies of scale that may be shared with the Fund and its
| 1 | California Income Series is a series of Dryden California Municipal Fund. |
| Dryden California Municipal Fund/California Income Series |
Approval of Advisory Agreements (continued)
shareholders. In their deliberations, the Trustees did not identify any single factor which alone was responsible for the Board’s decision to approve the agreements with respect to the Fund. In connection with its deliberations, the Board considered information provided by PI throughout the year at regular Board meetings, presentations from portfolio managers and other information, as well as information furnished at or in advance of the meetings on June 2-4, 2009.
The Trustees determined that the overall arrangements between the Fund and PI, which serves as the Fund’s investment manager pursuant to a management agreement with the Fund, and between PI and PIM, which serves as subadviser pursuant to the terms of a subadvisory agreement with PI, are fair and reasonable in light of the services performed, fees charged and such other matters as the Trustees considered relevant in the exercise of their business judgment.
The material factors and conclusions that formed the basis for the Trustees’ determinations to approve the renewal of the agreements are discussed separately below.
Nature, Quality, and Extent of Services
The Board requested and received information regarding the nature, quality and extent of services provided to the Fund by PI and PIM. The Board considered the services provided by PI, including but not limited to the oversight of the subadviser, as well as the provision of fund recordkeeping, compliance, and other services to the Fund. With respect to PI’s oversight of the subadviser, the Board noted that PI’s Strategic Investment Research Group (“SIRG”), which is a business unit of PI, is responsible for monitoring and reporting to PI’s senior management on the performance and operations of the subadviser. The Board also considered that PI pays the salaries of all of the officers and non-independent Trustees of the Fund. The Board also considered the investment subadvisory services provided by PIM, as well as compliance with the Fund’s investment restrictions, policies and procedures. The Board considered PI’s evaluation of the subadviser as well as PI’s recommendation, based on its review of the subadviser, to renew the subadvisory agreement.
The Board reviewed the qualifications, backgrounds and responsibilities of PI’s senior management responsible for the oversight of the Fund and the subadviser, and also reviewed the qualifications, backgrounds and responsibilities of the subadviser’s portfolio managers who are responsible for the day-to-day management of the Fund. The Board was provided with information pertaining to PI’s and PIM’s organizational structure, senior management, investment operations, and other relevant information pertaining to both PI and PIM. The Board also noted that it received favorable compliance reports from the Fund’s Chief Compliance Officer (“CCO”) as to both PI and PIM.
| Visit our website at www.jennisondryden.com |
The Board concluded that it was satisfied with the nature, extent and quality of the investment management services provided by PI and the subadvisory services provided to the Fund by PIM, and that there was a reasonable basis on which to conclude that the Fund benefits from the services provided by PI and PIM under the management and subadvisory agreements.
Performance of the Fund
The Board received and considered information about the Fund’s historical performance. The Board noted that the Fund’s gross performance in relation to its Peer Universe (the Lipper California Municipal Debt Funds Performance Universe) was in the first quartile for the three-, five-, and ten-year periods, and was in the second quartile for the one-year period. The Board also noted that the Fund outperformed its benchmark index over the ten-year period, though it underperformed its benchmark index over the one-, three-, and five-year periods. The Board concluded that, in light of the Fund’s competitive performance vis-à-vis its Peer Universe, it would be in the interest of the Fund and its shareholders for the Fund to renew the agreements.
Fees and Expenses
The Board considered that the Fund’s actual management fee (which reflects any subsidies, expense caps or waivers) ranked in the Expense Group’s third quartile, and that the Fund’s net total expenses ranked in the fourth quartile. The Board also considered that the Fund’s fourth quartile ranking for total expenses was reflective, in part, of its relatively small asset size.
As part of its review of the Fund’s management fee, the Board considered that the management fee arrangements for the Fund represented the result of several years of review and discussion between the Board and PI. In its review, the Board considered such things as the difficulty in managing the Fund, the size of the Fund, fees of competitors, Fund performance, expenses of service providers and such other aspects that the Trustees deemed important in the exercise of their business judgment. The Board concluded that the management fees and total expenses were reasonable in light of the services provided
Costs of Services and Profits Realized by PI
The Board was provided with information on the profitability of PI and its affiliates in serving as the Fund’s investment manager. The Board discussed with PI the methodology utilized in assembling the information regarding profitability and considered its reasonableness. The Board recognized that it is difficult to make
| Dryden California Municipal Fund/California Income Series |
Approval of Advisory Agreements (continued)
comparisons of profitability from fund management contracts because comparative information is not generally publicly available and is affected by numerous factors, including the structure of the particular adviser, the types of funds it manages, its business mix, numerous assumptions regarding allocations and the adviser’s capital structure and cost of capital. The Board did not separately consider the profitability of the subadviser, an affiliate of PI, as its profitability was reflected in the profitability report for PI. Taking these factors into account, the Board concluded that the profitability of PI and its affiliates in relation to the services rendered was not unreasonable.
Economies of Scale
The Board noted that the management fee schedule for the Fund includes breakpoints, which have the effect of decreasing the fee rate as assets increase, but at the current level of assets the Fund does not realize the effect of those rate reductions. The Board received and discussed information concerning whether PI realizes economies of scale as the Fund’s assets grow beyond current levels. The Board took note that the Fund’s fee structure would result in benefits to Fund shareholders when (and if) assets reach the levels at which the fee rate is reduced. These benefits will accrue whether or not PI is then realizing any economies of scale.
Other Benefits to PI and PIM
The Board considered potential ancillary benefits that might be received by PI and PIM and their affiliates as a result of their relationship with the Fund. The Board concluded that potential benefits to be derived by PI included transfer agency fees received by the Fund’s transfer agent (which is affiliated with PI), as well as benefits to the reputation or other intangible benefits resulting from PI’s association with the Fund. The Board concluded that the potential benefits to be derived by PIM included those generally resulting from an increase in assets under management, specifically, potential access to additional research resources and benefits to the reputation. The Board concluded that the benefits derived by PI and PIM were consistent with the types of benefits generally derived by investment managers and subadvisers to mutual funds.
After full consideration of these factors, the Board concluded that the approval of the agreements was in the best interest of the Fund and its shareholders.
| Visit our website at www.jennisondryden.com |
Growth of a $10,000 Investment
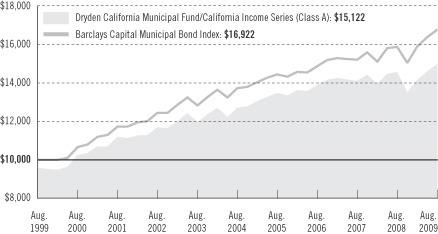
| Average Annual Total Returns (With Sales Charges) as of 8/31/09 | |||||||||
| One Year | Five Years | Ten Years | |||||||
Class A | –1.18 | % | 2.56 | % | 4.22 | % | |||
Class B | –2.20 | 2.97 | 4.39 | ||||||
Class C | 1.47 | 2.89 | 4.13 | ||||||
Class Z | 3.21 | 3.66 | 4.91 | ||||||
| Average Annual Total Returns (Without Sales Charges) as of 8/31/09 | |||||||||
| One Year | Five Years | Ten Years | |||||||
Class A | 2.94 | % | 3.40 | % | 4.65 | % | |||
Class B | 2.69 | 3.14 | 4.39 | ||||||
Class C | 2.45 | 2.89 | 4.13 | ||||||
Class Z | 3.21 | 3.66 | 4.91 | ||||||
Performance data quoted represent past performance. Past performance does not guarantee future results. The investment return and principal value of an investment will fluctuate, so that an investor’s shares, when redeemed, may be worth more or less than their original cost. Current performance may be lower or higher than the past performance data quoted. An investor may obtain performance data as of the most recent month-end by visiting our website at www.jennisondryden.com or by calling (800) 225-1852. The maximum initial sales charge is 4.00% (Class A shares). Gross operating expenses: Class A, 0.94%; Class B, 1.14%; Class C, 1.64%; Class Z, 0.64%. Net operating expenses apply to: Class A, 0.89%; Class B, 1.14%; Class C, 1.39%; Class Z, 0.64%, after contractual reduction through 12/31/2010.
| Visit our website at www.jennisondryden.com |
Source: Prudential Investments LLC and Lipper Inc.
The graph compares a $10,000 investment in the Dryden California Municipal Fund/California Income Series (Class A shares) with a similar investment in the Barclays Capital Municipal Bond Index by portraying the initial account values at the beginning of the 10-year period for Class A shares (August 31, 1999) and the account values at the end of the current fiscal year (August 31, 2009), as measured on a quarterly basis. For purposes of the graph, and unless otherwise indicated, it has been assumed that (a) the maximum applicable front-end sales charge was deducted from the initial $10,000 investment in Class A shares; (b) all recurring fees (including management fees) were deducted; and (c) all dividends and distributions were reinvested. The line graph provides information for Class A shares only. As indicated in the tables provided earlier, performance for Class B, Class C, and Class Z shares will vary due to the differing charges and expenses applicable to each share class (as indicated in the following paragraphs). Without a distribution and service (12b-1) fee waiver of 0.05% for Class A shares through August 31, 2009, the returns shown in the graph and for Class A shares in the tables would have been lower.
The Barclays Capital Municipal Bond Index is an unmanaged index of over 39,000 long-term investment-grade municipal bonds. It gives a broad look at how long-term investment-grade municipal bonds have performed. The Index’s total returns include the reinvestment of all dividends, but do not include the effects of sales charges, operating expenses of a mutual fund, or taxes. The returns for the Index would be lower if they included the effects of sales charges, operating expenses, or taxes. The securities that comprise the Index may differ substantially from the securities in the Fund. This is not the only index that may be used to characterize performance of municipal bond funds. Other indexes may portray different comparative performance. Investors cannot invest directly in an index.
Class A shares are subject to a maximum front-end sales charge of 4.00% and a 12b-1 fee of up to 0.30% annually. Investors who purchase Class A shares in an amount of $1 million or more do not pay a front-end sales charge, but are subject to a contingent deferred sales charge (CDSC) of 1% for shares sold within 12 months of purchase. Class B shares are subject to a declining CDSC of 5%, 4%, 3%, 2%, 1%, and 1%, respectively for the first six years after purchase and a 12b-1 fee of up to 0.50% annually. Approximately seven years after purchase, Class B shares will automatically convert to Class A shares on a quarterly basis. Class C shares are subject to a CDSC of 1% for 12 months from the date of purchase and the annual 12b-1 fee will remain up to 1%. Class Z shares are not subject to a sales charge or 12b-1 fee. The returns on investment in the graph and the returns in the tables do not reflect the deduction of taxes that a shareholder would pay on Fund distributions or following the redemption of Fund shares.
| Dryden California Municipal Fund/California Income Series |
| n MAIL | n TELEPHONE | n WEBSITE | ||
Gateway Center Three 100 Mulberry Street Newark, NJ 07102 | (800) 225-1852 | www.jennisondryden.com |
| PROXY VOTING |
| The Board of Trustees of the Fund has delegated to the Fund’s investment subadviser the responsibility for voting any proxies and maintaining proxy recordkeeping with respect to the Fund. A description of these proxy voting policies and procedures is available without charge, upon request, by calling (800) 225-1852 or by visiting the Securities and Exchange Commission’s website at www.sec.gov. Information regarding how the Fund voted proxies relating to portfolio securities during the most recent 12-month period ended June 30 is available on the Fund’s website and on the Commission’s website. |
| TRUSTEES |
| Kevin J. Bannon • Linda W. Bynoe • David E.A. Carson • Michael S. Hyland • Robert E. La Blanc • Douglas H. McCorkindale • Stephen P. Munn • Richard A. Redeker • Judy A. Rice • Robin B. Smith • Stephen G. Stoneburn |
| OFFICERS |
| Judy A. Rice, President • Scott E. Benjamin, Vice President • Grace C. Torres, Treasurer and Principal Financial and Accounting Officer • Kathryn L. Quirk, Chief Legal Officer • Deborah A. Docs, Secretary • Timothy J. Knierim, Chief Compliance Officer • Valerie M. Simpson, Deputy Chief Compliance Officer • Theresa C. Thompson, Deputy Chief Compliance Officer • Noreen M. Fierro, Anti-Money Laundering Compliance Officer • Jonathan D. Shain, Assistant Secretary • Claudia DiGiacomo, Assistant Secretary • John P. Schwartz, Assistant Secretary • Andrew R. French, Assistant Secretary • M. Sadiq Peshimam, Assistant Treasurer • Peter Parrella, Assistant Treasurer |
| MANAGER | Prudential Investments LLC | Gateway Center Three 100 Mulberry Street Newark, NJ 07102 | ||
| ||||
| INVESTMENT SUBADVISER | Prudential Investment Management, Inc. | Gateway Center Two 100 Mulberry Street Newark, NJ 07102 | ||
| ||||
| DISTRIBUTOR | Prudential Investment Management Services LLC | Gateway Center Three 100 Mulberry Street | ||
| ||||
| CUSTODIAN | The Bank of New York Mellon | One Wall Street New York, NY 10286 | ||
| ||||
| TRANSFER AGENT | Prudential Mutual Fund Services LLC | PO Box 9658 Providence, RI 02940 | ||
| ||||
| INDEPENDENT REGISTERED PUBLIC ACCOUNTING FIRM | KPMG LLP | 345 Park Avenue New York, NY 10154 | ||
| ||||
| FUND COUNSEL | Willkie Farr & Gallagher LLP | 787 Seventh Avenue New York, NY 10019 | ||
| An investor should consider the investment objectives, risks, charges, and expenses of the Fund carefully before investing. The prospectus for the Fund contains this and other information about the Fund. An investor may obtain a prospectus by visiting our website at www.jennisondryden.com or by calling (800) 225-1852. The prospectus should be read carefully before investing. |
| E-DELIVERY |
| To receive your mutual fund documents online, go to www.prudential.com/edelivery/mutualfunds and enroll. Instead of receiving printed documents by mail, you will receive notification via e-mail when new materials are available. You can cancel your enrollment or change your e-mail address at any time by visiting the website address above. |
| SHAREHOLDER COMMUNICATIONS WITH TRUSTEES |
| Shareholders can communicate directly with the Board of Trustees by writing to the Chair of the Board, Dryden California Municipal Fund/California Income Series, Prudential Investments, Attn: Board of Trustees, 100 Mulberry Street, Gateway Center Three, Newark, NJ 07102. Shareholders can communicate directly with an individual Trustee by writing to the same address. Communications are not screened before being delivered to the addressee. |
| AVAILABILITY OF PORTFOLIO SCHEDULE |
| The Fund files its complete schedule of portfolio holdings with the Securities and Exchange Commission for the first and third quarters of each fiscal year on Form N-Q. The Fund’s Forms N-Q are available on the Commission’s website at www.sec.gov. The Fund’s Forms N-Q may also be reviewed and copied at the Commission’s Public Reference Room in Washington, D.C. Information on the operation and location of the Public Reference Room may be obtained by calling (202) 551-8090. The Fund’s schedule of portfolio holdings is also available on the Fund’s website as of the end of each fiscal quarter. |
| The Fund’s Statement of Additional Information contains additional information about the Fund’s Trustees and is available without charge, upon request, by calling (800) 225-1852. |
Mutual Funds:
| ARE NOT INSURED BY THE FDIC OR ANY FEDERAL GOVERNMENT AGENCY | MAY LOSE VALUE | ARE NOT A DEPOSIT OF OR GUARANTEED BY ANY BANK OR ANY BANK AFFILIATE |

| Dryden California Municipal Fund/California Income Series | ||||||||||||
| Share Class | A | B | C | Z | ||||||||
NASDAQ | PBCAX | PCAIX | PCICX | PCIZX | ||||||||
CUSIP | 262433105 | 262433204 | 262433303 | 262433402 | ||||||||
MF146E 0163415-00001-00

Item 2 – Code of Ethics—See Exhibit (a)
As of the end of the period covered by this report, the registrant has adopted a code of ethics (the “Section 406 Standards for Investment Companies – Ethical Standards for Principal Executive and Financial Officers”) that applies to the registrant’s Principal Executive Officer and Principal Financial Officer; the registrant’s Principal Financial Officer also serves as the Principal Accounting Officer.
The registrant hereby undertakes to provide any person, without charge, upon request, a copy of the code of ethics. To request a copy of the code of ethics, contact the registrant 800-225-1852, and ask for a copy of the Section 406 Standards for Investment Companies – Ethical Standards for Principal Executive and Financial Officers.
Item 3 – Audit Committee Financial Expert –
The registrant’s Board has determined that Mr. David E. A. Carson, member of the Board’s Audit Committee is an “audit committee financial expert,” and that he is “independent,” for purposes of this Item.
Item 4 – Principal Accountant Fees and Services –
(a) Audit Fees
For the fiscal years ended August 31, 2009 and August 31, 2008, KPMG LLP (“KPMG”), the Registrant’s principal accountant, billed the Registrant $28,742 and $28,742, respectively, for professional services rendered for the audit of the Registrant’s annual financial statements or services that are normally provided in connection with statutory and regulatory filings.
(b) Audit-Related Fees
During the fiscal year ended August 31, 2009, KPMG, the Registrant’s principal accountant, billed the Registrant $1,558 for professional services rendered in connection with agreed upon procedures performed related to a custody conversion. Not applicable for the fiscal year ended August 31, 2008.
(c) Tax Fees
None.
(d) All Other Fees
Not applicable for the fiscal year ended August 31, 2009. During the fiscal year ended August 31, 2008, KPMG, the Registrant’s principal accountant, billed the Registrant $6,167 for professional services rendered in connection with work performed related to inverse floating rate securities.
(e) (1) Audit Committee Pre-Approval Policies and Procedures
THE PRUDENTIAL MUTUAL FUNDS
AUDIT COMMITTEE POLICY
on
Pre-Approval of Services Provided by the Independent Accountants
The Audit Committee of each Prudential Mutual Fund is charged with the responsibility to monitor the independence of the Fund’s independent accountants. As part of this responsibility, the Audit Committee must pre-approve any independent accounting firm’s engagement to render audit and/or permissible non-audit services, as required by law. In evaluating a proposed engagement of the independent accountants, the Audit Committee will assess the effect that the engagement might reasonably be expected to have on the accountant’s independence. The Committee’s evaluation will be based on:
| • | a review of the nature of the professional services expected to be provided, |
| • | a review of the safeguards put into place by the accounting firm to safeguard independence, and |
| • | periodic meetings with the accounting firm. |
Policy for Audit and Non-Audit Services Provided to the Funds
On an annual basis, the scope of audits for each Fund, audit fees and expenses, and audit-related and non-audit services (and fees proposed in respect thereof) proposed to be performed by the Fund’s independent accountants will be presented by the Treasurer and the independent accountants to the Audit Committee for review and, as appropriate, approval prior to the initiation of such services. Such presentation shall be accompanied by confirmation by both the Treasurer and the independent accountants that the proposed services will not adversely affect the independence of the independent accountants. Proposed services shall be described in sufficient detail to enable the Audit Committee to assess the appropriateness of such services and fees, and the compatibility of the provision of such services with the auditor’s independence. The Committee shall receive periodic reports on the progress of the audit and other services which are approved by the Committee or by the Committee Chair pursuant to authority delegated in this Policy.
The categories of services enumerated under “Audit Services”, “Audit-related Services”, and “Tax Services” are intended to provide guidance to the Treasurer and the independent accountants as to those categories of services which the Committee believes are generally consistent with the independence of the independent accountants and which the Committee (or the Committee Chair) would expect upon the presentation of specific proposals to pre-approve. The enumerated categories are not intended as an exclusive list of audit, audit-related or tax services, which the Committee (or the Committee Chair) would consider for pre-approval.
Audit Services
The following categories of audit services are considered to be consistent with the role of the Fund’s independent accountants:
| • | Annual Fund financial statement audits |
| • | Seed audits (related to new product filings, as required) |
| • | SEC and regulatory filings and consents |
Audit-related Services
The following categories of audit-related services are considered to be consistent with the role of the Fund’s independent accountants:
| • | Accounting consultations |
| • | Fund merger support services |
| • | Agreed Upon Procedure Reports |
| • | Attestation Reports |
| • | Other Internal Control Reports |
Individual audit-related services that fall within one of these categories and are not presented to the Audit Committee as part of the annual pre-approval process will be subject to pre-approval by the Committee Chair (or any other Committee member on whom this responsibility has been delegated) so long as the estimated fee for those services does not exceed $50,000.
Tax Services
The following categories of tax services are considered to be consistent with the role of the Fund’s independent accountants:
| • | Tax compliance services related to the filing or amendment of the following: |
| • | Federal, state and local income tax compliance; and, |
| • | Sales and use tax compliance |
| • | Timely RIC qualification reviews |
| • | Tax distribution analysis and planning |
| • | Tax authority examination services |
| • | Tax appeals support services |
| • | Accounting methods studies |
| • | Fund merger support services |
| • | Tax consulting services and related projects |
Individual tax services that fall within one of these categories and are not presented to the Audit Committee as part of the annual pre-approval process will be subject to pre-approval by the Committee Chair (or any other Committee member on whom this responsibility has been delegated) so long as the estimated fee for those services does not exceed $50,000.
Other Non-audit Services
Certain non-audit services that the independent accountants are legally permitted to render will be subject to pre-approval by the Committee or by one or more Committee members to whom the Committee has delegated this authority and who will report to the full Committee any pre-approval decisions made pursuant to this Policy. Non-audit services presented for pre-approval pursuant to this paragraph will be accompanied by a confirmation from both the Treasurer and the independent accountants that the proposed services will not adversely affect the independence of the independent accountants.
Proscribed Services
The Fund’s independent accountants will not render services in the following categories of non-audit services:
| • | Bookkeeping or other services related to the accounting records or financial statements of the Fund |
| • | Financial information systems design and implementation |
| • | Appraisal or valuation services, fairness opinions, or contribution-in-kind reports |
| • | Actuarial services |
| • | Internal audit outsourcing services |
| • | Management functions or human resources |
| • | Broker or dealer, investment adviser, or investment banking services |
| • | Legal services and expert services unrelated to the audit |
| • | Any other service that the Public Company Accounting Oversight Board determines, by regulation, is impermissible. |
Pre-approval of Non-Audit Services Provided to Other Entities Within the Prudential Fund Complex
Certain non-audit services provided to Prudential Investments LLC or any of its affiliates that also provide ongoing services to the Prudential Mutual Funds will be subject to pre-approval by the Audit Committee. The only non-audit services provided to these entities that will require pre-approval are those related directly to the operations and financial reporting of the Funds. Individual projects that are not presented to the Audit Committee as part of the annual pre-approval process will be subject to pre-approval by the Committee Chair (or any other Committee member on whom this responsibility has been delegated) so long as the estimated fee for those services does not exceed $50,000. Services presented for pre-approval pursuant to this paragraph will be accompanied by a confirmation from both the Treasurer and the independent accountants that the proposed services will not adversely affect the independence of the independent accountants.
Although the Audit Committee will not pre-approve all services provided to Prudential Investments LLC and its affiliates, the Committee will receive an annual report from the Fund’s independent accounting firm showing the aggregate fees for all services provided to Prudential Investments and its affiliates.
(e) (2) Percentage of services referred to in 4(b) – 4(d) that were approved by the audit committee –
One hundred percent of the services described in Item 4(b) and Item 4(d) was approved by the audit committee.
| (f) | Percentage of hours expended attributable to work performed by other than full time employees of principal accountant if greater than 50%. |
The percentage of hours expended on the principal accountant’s engagement to audit the registrant’s financial statements for the most recent fiscal year that were attributed to work performed by persons other than the principal accountant’s full-time, permanent employees was 0%.
(g) Non-Audit Fees
Not applicable to Registrant for the fiscal years 2009 and 2008. The aggregate non-audit fees billed by KPMG for services rendered to the registrant’s investment adviser and any entity controlling, controlled by, or under common control with the investment adviser that provides ongoing services to the registrant for the fiscal years 2009 and 2008 was $0 and $0, respectively.
(h) Principal Accountant’s Independence
Not applicable as KPMG has not provided non-audit services to the registrant’s investment adviser and any entity controlling, controlled by, or under common control with the investment adviser that provides ongoing services to the registrant that were not pre-approved pursuant to Rule 2-01(c)(7)(ii) of Regulation S-X.
Item 5 – Audit Committee of Listed Registrants – Not applicable.
Item 6 – Schedule of Investments – The schedule is included as part of the report to shareholders filed under Item 1 of this Form.
Item 7 – Disclosure of Proxy Voting Policies and Procedures for Closed-End Management Investment Companies – Not applicable.
Item 8 – Portfolio Managers of Closed-End Management Investment Companies – Not applicable.
Item 9 – Purchases of Equity Securities by Closed-End Management Investment Company and Affiliated Purchasers – Not applicable.
Item 10 – Submission of Matters to a Vote of Security Holders – Not applicable.
Item 11 – Controls and Procedures
| (a) | It is the conclusion of the registrant’s principal executive officer and principal financial officer that the effectiveness of the registrant’s current disclosure controls and procedures (such disclosure controls and procedures having been evaluated within 90 days of the date of this filing) provide reasonable assurance that the information required to be disclosed by the registrant has been recorded, processed, summarized and reported within the time period specified in the Commission’s rules and forms and that the information required to be disclosed by the registrant has been accumulated and communicated to the registrant’s principal executive officer and principal financial officer in order to allow timely decisions regarding required disclosure. |
| (b) | There has been no significant change in the registrant’s internal control over financial reporting that occurred during the registrant’s most recent fiscal quarter of the period covered by this report that has materially affected, or is likely to materially affect, the registrant’s internal control over financial reporting. |
Item 12 – Exhibits
| (a) | (1) | Code of Ethics – Attached hereto as Exhibit EX-99.CODE-ETH | ||
| (2) | Certifications pursuant to Section 302 of the Sarbanes-Oxley Act – Attached hereto as Exhibit EX-99.CERT. | |||
| (3) | Any written solicitation to purchase securities under Rule 23c-1. – Not applicable. | |||
| (b) | Certifications pursuant to Section 906 of the Sarbanes-Oxley Act – Attached hereto as Exhibit EX-99.906CERT. | |||
SIGNATURES
Pursuant to the requirements of the Securities Exchange Act of 1934 and the Investment Company Act of 1940, the registrant has duly caused this report to be signed on its behalf by the undersigned, thereunto duly authorized.
| (Registrant) | Dryden California Municipal Fund |
| By (Signature and Title)* | /s/ Deborah A. Docs | |
Deborah A. Docs Secretary | ||
| Date | October 22, 2009 | |
Pursuant to the requirements of the Securities Exchange Act of 1934 and the Investment Company Act of 1940, this report has been signed below by the following persons on behalf of the registrant and in the capacities and on the dates indicated.
| By (Signature and Title)* | /s/ Judy A. Rice | |
| Judy A. Rice | ||
| President and Principal Executive Officer |
| Date | October 22, 2009 | |
| By (Signature and Title)* | /s/ Grace C. Torres | |
| Grace C. Torres | ||
| Treasurer and Principal Financial Officer | ||
| Date | October 22, 2009 | |
| * | Print the name and title of each signing officer under his or her signature. |