UNITED STATES
SECURITIES AND EXCHANGE COMMISSION
Washington, D.C. 20549
FORM N-CSR
CERTIFIED SHAREHOLDER REPORT OF REGISTERED
MANAGEMENT INVESTMENT COMPANIES
| Investment Company Act file number: | 811-04024 | |
| Exact name of registrant as specified in charter: | Prudential Investment Portfolios 6 | |
| Address of principal executive offices: | Gateway Center 3, | |
| 100 Mulberry Street, | ||
| Newark, New Jersey 07102 | ||
| Name and address of agent for service: | Deborah A. Docs | |
| Gateway Center 3, | ||
| 100 Mulberry Street, | ||
| Newark, New Jersey 07102 | ||
| Registrant’s telephone number, including area code: | 800-225-1852 | |
| Date of fiscal year end: | 8/31/2013 | |
| Date of reporting period: | 8/31/2013 | |
Item 1 – Reports to Stockholders

PRUDENTIAL INVESTMENTS»MUTUAL FUNDS
PRUDENTIAL CALIFORNIA MUNI INCOME FUND
ANNUAL REPORT · AUGUST 31, 2013
Fund Type
Municipal Bond
Objective
Maximize current income that is exempt from California state and federal income taxes, consistent with the preservation of capital
This report is not authorized for distribution to prospective investors unless preceded or accompanied by a current prospectus.
The views expressed in this report and information about the Fund’s portfolio holdings are for the period covered by this report and are subject to change thereafter.
Mutual funds are distributed by Prudential Investment Management Services LLC (PIMS). Prudential Fixed Income is a unit of Prudential Investment Management, Inc. (PIM), a registered investment adviser. PIMS and PIM are Prudential Financial companies. © 2013 Prudential Financial, Inc., and its related entities. Prudential Investments, Prudential, the Prudential logo, Bring Your Challenges, and the Rock symbol are service marks of Prudential Financial, Inc., and its related entities, registered in many jurisdictions worldwide.

|  |

October 15, 2013
Dear Shareholder:
We hope you find the annual report for the Prudential California Muni Income Fund informative and useful. The report covers performance for the 12-month period that ended August 31, 2013.
We recognize that ongoing market volatility may make it a difficult time to be an investor. We continue to believe a prudent response to uncertainty is to maintain a diversified portfolio of funds consistent with your tolerance for risk, time horizon, and financial goals.
Your financial advisor can help you create a diversified investment plan that may include funds covering all the basic asset classes and that reflects your personal investor profile and risk tolerance. Keep in mind, however, that diversification and asset allocation strategies do not assure a profit or protect against loss in declining markets.
Prudential Investments® is dedicated to helping you solve your toughest investment challenges—whether it’s capital growth, reliable income, or protection from market volatility and other risks. We offer the expertise of Prudential Financial’s affiliated asset managers* that strive to be leaders in a broad range of funds to help you stay on course to the future you envision. They also manage money for major corporations and pension funds around the world, which means you benefit from the same expertise, innovation, and attention to risk demanded by today’s most sophisticated investors.
Thank you for choosing the Prudential Investments family of funds.
Sincerely,

Stuart S. Parker, President
Prudential California Muni Income Fund
*Most of Prudential Investments’ equity funds are advised by Jennison Associates LLC, Quantitative Management Associates LLC (QMA), or Prudential Real Estate Investors. Prudential Investments’ fixed income and money market funds are advised by Prudential Investment Management, Inc. (PIM) through its Prudential Fixed Income unit. Jennison Associates, QMA, and PIM are registered investment advisers and Prudential Financial companies. Prudential Real Estate Investors is a unit of PIM.
| Prudential California Muni Income Fund | 1 |
Your Fund’s Performance (Unaudited)
Performance data quoted represent past performance. Past performance does not guarantee future results. The investment return and principal value of an investment will fluctuate, so that an investor’s shares, when redeemed, may be worth more or less than their original cost. Current performance may be lower or higher than the past performance data quoted. An investor may obtain performance data as of the most recent month-end by visiting our website at www.prudentialfunds.com or by calling (800) 225-1852.
Cumulative Total Returns (Without Sales Charges) as of 8/31/13 |
| |||||||||||
| One Year | Five Years | Ten Years | ||||||||||
Class A | –4.15 | % | 23.39 | % | 50.91 | % | ||||||
Class B | –4.39 | 21.88 | 47.20 | |||||||||
Class C | –4.86 | 19.61 | 42.71 | |||||||||
Class Z | –3.90 | 25.13 | 54.99 | |||||||||
Barclays Municipal Bond Index | –3.70 | 24.75 | 54.96 | |||||||||
Lipper California (CA) Municipal Debt Funds Average | –4.68 | 22.42 | 46.59 | |||||||||
Average Annual Total Returns (With Sales Charges) as of 9/30/13 |
| |||||||||||
| One Year | Five Years | Ten Years | ||||||||||
Class A | –6.65 | % | 4.89 | % | 3.68 | |||||||
Class B | –7.68 | 5.33 | 3.85 | |||||||||
Class C | –4.42 | 5.09 | 3.52 | |||||||||
Class Z | –2.43 | 6.02 | 4.39 | |||||||||
Barclays Municipal Bond Index | –2.21 | 5.98 | 4.40 | |||||||||
Lipper California (CA) Municipal Debt Funds Average | –2.98 | 5.85 | 3.85 | |||||||||
Average Annual Total Returns (With Sales Charges) as of 8/31/13 |
| |||||||||||
| One Year | Five Years | Ten Years | ||||||||||
Class A | –7.98 | % | 3.45 | % | 3.78 | % | ||||||
Class B | –9.00 | 3.87 | 3.94 | |||||||||
Class C | –5.78 | 3.65 | 3.62 | |||||||||
Class Z | –3.90 | 4.59 | 4.48 | |||||||||
Average Annual Total Returns (Without Sales Charges) as of 8/31/13 |
| |||||||||||
| One Year | Five Years | Ten Years | ||||||||||
Class A | –4.15 | % | 4.29 | % | 4.20 | % | ||||||
Class B | –4.39 | 4.04 | 3.94 | |||||||||
Class C | –4.86 | 3.65 | 3.62 | |||||||||
Class Z | –3.90 | 4.59 | 4.48 | |||||||||
| 2 | Visit our website at www.prudentialfunds.com |
Growth of a $10,000 Investment
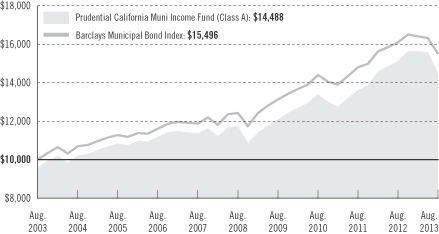
The graph compares a $10,000 investment in the Fund’s Class A shares with a similar investment in the Barclays Municipal Bond Index by portraying the initial account values at the beginning of the 10-year period for Class A shares (August 31, 2003) and the account values at the end of the current fiscal year (August 31, 2013), as measured on a quarterly basis. For purposes of the graph, and unless otherwise indicated, it has been assumed that (a) the maximum applicable front-end sales charge was deducted from the initial $10,000 investment in Class A shares; (b) all recurring fees (including management fees) were deducted; and (c) all dividends and distributions were reinvested. The line graph provides information for Class A shares only. As indicated in the tables provided earlier, performance for Class B, Class C, and Class Z shares will vary due to the differing charges and expenses applicable to each share class (as indicated in the following paragraphs). Without waiver of fees and/or expense reimbursements, if any, the returns would have been lower.
Source: Prudential Investments LLC and Lipper Inc.
The returns in the tables reflect the share class expense structure in effect at the close of the fiscal period.
Past performance does not predict future performance. Total returns and the ending account values in the graphs include changes in share price and reinvestment of dividends and capital gains distributions in a hypothetical investment for the periods shown. The Fund’s total returns do not reflect the deduction of income taxes on an individual’s investment. Taxes may reduce your actual investment returns on income or gains paid by the Fund or any gains you may realize if you sell your shares.
| Prudential California Muni Income Fund | 3 |
Your Fund’s Performance (continued)
The average annual total returns take into account applicable sales charges, which are described for each share class in the table below.
| Class A | Class B | Class C | Class Z | |||||
Maximum initial sales charge | 4.00% of the public offering price | None | None | None | ||||
Contingent deferred sales charge (CDSC) (as a percentage of the lower of original purchase price or sale proceeds) | 1% on sales of $1 million or more made within 12 months of purchase | 5% (Yr. 1) 4% (Yr. 2) 3% (Yr. 3) 2% (Yr. 4) 1% (Yr. 5/6) 0% (Yr. 7) | 1% on sales made within 12 months of purchase | None | ||||
Annual distribution and service (12b-1) fees (shown as a percentage of average daily net assets) | .30% (.25% currently) | .50% | 1% | None |
Benchmark Definitions
Barclays Municipal Bond Index
The Barclays Municipal Bond Index (the Index) is an unmanaged index of over 39,000 long-term investment-grade municipal bonds. It gives a broad look at how long-term investment-grade municipal bonds have performed.
Lipper California (CA) Municipal Debt Funds Average
The Lipper California Municipal Debt Funds Average (Lipper Average) represents returns based on an average return of all funds in the Lipper California Municipal Debt Funds category for the periods noted. Funds in the Lipper Average limit their assets to those securities that are exempt from taxation in California.
Investors cannot invest directly in an index or average. The returns for the Index would be lower if they included the effects of sales charges, operating expenses of a mutual fund, or taxes. Returns for the Lipper Average reflect the deduction of operating expenses, but not sales charges or taxes.
Five Largest Issues expressed as a percentage of net assets as of 8/31/13 | ||||
Southern California Pub. Pwr. Auth. Rev., Palo Verde Proj., Ser. C, A.M.B.A.C., E.T.M., C.A.B.S., Rfdg., 1.770%, 07/01/16 | 6.6 | % | ||
Golden St. Tob. Securitization Rev., Asset-Bkd., Sr., Ser. A-1, 4.500%, 06/01/27 | 2.5 | |||
Sacramento City Fin. Auth., Tax Alloc. Comb. Proj., Ser. B, C.A.B.S., N.A.T.L., 3.540%, 11/01/16 | 2.5 | |||
California St., Var. Purp., GO, 5.000%, 09/01/41 | 2.4 | |||
Sacramento City Fin. Auth., Ser. B, C.A.B.S., N.A.T.L., 3.270%, 11/01/17 | 2.4 |
Issues are subject to change.
| 4 | Visit our website at www.prudentialfunds.com |
Distributions and Yields as of 8/31/13 |
| |||||||||||||||
| Total Distributions Paid for 12 Months | 30-Day SEC Yield | Taxable Equivalent 30-Day Yield* at Federal Tax Rates of | ||||||||||||||
| 38.8% | 43.4% | |||||||||||||||
Class A | $ | 0.43 | 3.31 | % | 6.17 | % | 6.67 | % | ||||||||
Class B | 0.40 | 3.19 | 5.94 | 6.43 | ||||||||||||
Class C | 0.34 | 2.69 | 5.01 | 5.42 | ||||||||||||
Class Z | 0.45 | 3.70 | 6.89 | 7.45 | ||||||||||||
*Some investors may be subject to the federal alternative minimum tax (AMT). Taxable equivalent yields reflect federal and applicable state tax rates.
Credit Quality* expressed as a percentage of net assets as of 8/31/13 | ||||
Aaa | 0.6 | % | ||
Aa | 25.8 | |||
A | 32.7 | |||
Baa | 19.4 | |||
Ba | 2.2 | |||
B | 5.6 | |||
Not Rated | 12.3 | |||
Total Investments | 98.6 | |||
Other assets in excess of liabilities | 1.4 | |||
Net Assets | 100.0 | % | ||
|
|
*Source: Moody’s rating, defaulting to S&P when not rated by Moody’s.
Credit quality is subject to change.
| Prudential California Muni Income Fund | 5 |
Strategy and Performance Overview
How did the Fund perform?
The Prudential California Muni Income Fund’s Class A shares declined 4.15% for the 12-months ended August 31, 2013, underperforming the 3.70% decline of the Barclays Municipal Bond Index (the Index), but outperforming the 4.68% decline of the Lipper California Municipal Debt Funds Average.
What were conditions like in the municipal bond market?
Municipal securities started the reporting period with strong returns but declined considerably after May 3, 2013, in response to a surprisingly strong labor report indicating an improving economic outlook. In addition, at their June meeting, Federal Reserve (“Fed”) officials suggested that tapering of asset purchases under the Fed’s asset purchase program could begin by year-end.
| • | During the fourth quarter of 2012, municipal bonds generated robust results, driven by solid investor demand and limited supply. Municipal bonds continued to offer investors an attractive, higher income alternative in the ultra-low interest rate environment. |
| • | U.S. budget negotiations were front and center during the final weeks of 2012. And while there was some concern that a budget resolution would reduce the value of municipal bond tax exemption, that fear was not realized. In fact municipal bond tax exemption became more valuable as personal income tax rates for top wage earners increased to 39.6% from 35%. In the first quarter of 2013, municipal securities underperformed U.S. Treasuries as interest rates crept up and technical factors, such as supply and demand, weighed on the market. During late March 2013 and into April, the market was pressured by steady outflows as investors withdrew funds to meet tax obligations. |
| • | Interest rates rose after Federal Reserve Chair Ben Bernanke indicated in June 2013 that the U.S. central bank might begin reducing purchases under its asset purchase programs. Treasury yields climbed and their prices, which move in the opposite direction of yields, declined. Municipal yields rose at a faster pace than Treasuries as flows out of municipal bond mutual funds accelerated. |
| • | Municipal fund outflows were further fueled by the news in July 2013 that the City of Detroit had filed for bankruptcy protection. Despite the magnitude of this filing and the impact on the market, the view is that such filings remain the exception, not the rule. |
| • | Early in the reporting period, investors had responded negatively when all three credit rating agencies had downgraded the general obligation debt of Puerto Rico, which continues to struggle with a weak economy, high debt levels, and large structural budget gaps. A relatively large issuance of Puerto |
| 6 | Visit our website at www.prudentialfunds.com |
Rico Electric Authority debt in August 2013 led to wider spreads and higher yields for all Puerto Rico issuers. |
| • | June and July are typically large reinvestment months in the municipal market, but the negative credit headlines kept investor capital on the sidelines. In fact municipal yields continued their move higher, especially on the long end. By the end of the reporting period, the relative value provided by higher municipal yields attracted crossover buyers, generally non-traditional buyers such as institutions that would not benefit from municipals’ tax exemption. |
| • | Issuance declined during the reporting period overall as interest rates rose and the number of refunding deals declined. In a refunding deal, an issuer reduces its interest expense by redeeming outstanding bonds and issuing new bonds at a lower interest rate. |
| • | In general, state and local governments continued to generate higher revenues through increased tax receipts, which provided for timely balanced budgets. Unfunded pension obligations remain a broader long-term concern. |
How did the California tax-exempt bond market perform?
California’s economic recovery strengthened during the reporting period and its economy grew faster overall than the broad U.S. economy.
| • | Home prices continued to increase, not only in the more economically healthy coastal communities, but also in the Central Valley and Inland Empire where the downturn had been most severe. |
| • | New jobs were added statewide and across most industries during the reporting period. Though California’s unemployment rate remained elevated (8.9% in August 2013 versus a national unemployment rate of 7.3%), many observers expect state employment to return to 2008 levels by the end of 2014. |
| • | California has made significant progress in reducing its budget gap, primarily through recurring expenditure cuts in its fiscal 2012 and 2013 budgets. Its fiscal 2014 budget benefits from the passage in November 2012 of Proposition 30, which temporarily raises income and sales tax rates. Although the state began 2013 with a $1.6 billion budget deficit, the 2014 budget anticipates a $1 billion surplus and forecasts substantial repair of the General Fund by 2017. As a result of its improved economic and fiscal outlook, California received several credit-rating upgrades during the reporting period. |
| • | California faces challenges to its fiscal balance, including the short-term impact of federal budget cuts and the cost of expanding Medicaid under the |
| Prudential California Muni Income Fund | 7 |
Strategy and Performance Overview (continued)
Affordable Care Act. In addition, temporary revenue increases expire in 2016 and 2018, creating the potential for new budget gaps. In addition, California continues to have substantial unfunded retirement system liabilities of approximately $154 billion. |
What types of municipal bonds contributed negatively to the Fund’s performance?
Conditions in the municipal bond market were challenging as sellers outnumbered buyers for the reporting period overall. The Fund maintained a portfolio of tax-exempt bonds drawn from sectors within the municipal market to spread risk and take advantage of potential opportunities.
| • | The Fund’s position in Puerto Rican municipal debt, which is not represented in the Index, detracted from performance. Approximately half of the Fund’s investments in Puerto Rican bonds are in the higher-rated sales tax bonds. |
| • | The Fund’s overweight in tobacco bonds relative to the Index dampened performance. Tobacco bonds are backed by payments from tobacco companies participating in the Master Settlement Agreement. |
| • | An overweight versus the Index in hospital bonds, which underperformed during the reporting period, detracted from returns. |
What other factors contributed negatively to performance?
| • | The Fund’s overweight in longer-term municipal bonds, versus those in the Index, was the most significant detractor from performance. As spreads (the difference in yields) between longer-term municipal bonds and intermediate- and shorter-term maturities widened, the prices of longer-term municipal bonds declined. |
What factors contributed positively to the Fund’s performance?
| • | The Fund benefited from its overweight in pre-refunded bonds, which are widely considered to be the safest of all municipal bonds. A pre-refunded bond is backed by high credit quality collateral, usually ultra-safe Treasury securities. |
| • | The Fund held futures contracts on U.S. Treasuries to shorten the portfolio’s duration, which reduced its sensitivity to changes in the level of rates. Overall, this strategy had a positive impact on performance as interest rates rose during the reporting period. |
| 8 | Visit our website at www.prudentialfunds.com |
Fees and Expenses (Unaudited)
As a shareholder of the Fund, you incur two types of costs: (1) transaction costs, including sales charges (loads) on purchase payments and redemptions, as applicable, and (2) ongoing costs, including management fees, distribution and/or service (12b-1) fees, and other Fund expenses, as applicable. This example is intended to help you understand your ongoing costs (in dollars) of investing in the Fund and to compare these costs with the ongoing costs of investing in other mutual funds.
The example is based on an investment of $1,000 invested on March 1, 2013, at the beginning of the period, and held through the six-month period ended August 31, 2013. The example is for illustrative purposes only; you should consult the Prospectus for information on initial and subsequent minimum investment requirements.
Actual Expenses
The first line for each share class in the table on the following page provides information about actual account values and actual expenses. You may use the information on this line, together with the amount you invested, to estimate the expenses that you paid over the period. Simply divide your account value by $1,000 (for example, an $8,600 account value ÷ $1,000 = 8.6), then multiply the result by the number on the first line under the heading “Expenses Paid During the Six-Month Period” to estimate the expenses you paid on your account during this period.
Hypothetical Example for Comparison Purposes
The second line for each share class in the table on the following page provides information about hypothetical account values and hypothetical expenses based on the Fund’s actual expense ratio and an assumed rate of return of 5% per year before expenses, which is not the Fund’s actual return. The hypothetical account values and expenses should not be used to estimate the actual ending account balance or expenses you paid for the period. You may use this information to compare the ongoing costs of investing in the Fund and other funds. To do so, compare this 5% hypothetical example with the 5% hypothetical examples that appear in the shareholder reports of the other funds.
The Fund’s transfer agent may charge additional fees to holders of certain accounts that are not included in the expenses shown in the table on the following page. These fees apply to individual retirement accounts (IRAs) and Section 403(b) accounts. As of the close of the six-month period covered by the table, IRA fees included an annual maintenance fee of $15 per account (subject to a maximum annual maintenance fee of $25 for all accounts held by the same shareholder). Section 403(b) accounts are charged an annual $25 fiduciary maintenance fee. Some of the fees may vary in amount, or may be waived, based on your total account balance or the number of
| Prudential California Muni Income Fund | 9 |
Fees and Expenses (continued)
Prudential Investments funds, including the Fund, that you own. You should consider the additional fees that were charged to your Fund account over the six-month period when you estimate the total ongoing expenses paid over the period and the impact of these fees on your ending account value, as these additional expenses are not reflected in the information provided in the expense table. Additional fees have the effect of reducing investment returns.
Please note that the expenses shown in the table are meant to highlight your ongoing costs only and do not reflect any transactional costs such as sales charges (loads). Therefore, the second line for each share class in the table is useful in comparing ongoing costs only and will not help you determine the relative total costs of owning different funds. In addition, if these transactional costs were included, your costs would have been higher.
| Prudential California Muni Income Fund | Beginning Account Value March 31, 2013 | Ending Account Value August 31, 2013 | Annualized Expense Ratio Based on the Six-Month Period | Expenses Paid During the Six-Month Period* | ||||||||||||||
| Class A | Actual | $ | 1,000.00 | $ | 927.30 | 0.92 | % | $ | 4.47 | |||||||||
| Hypothetical | $ | 1,000.00 | $ | 1,020.57 | 0.92 | % | $ | 4.69 | ||||||||||
| Class B | Actual | $ | 1,000.00 | $ | 926.10 | 1.17 | % | $ | 5.68 | |||||||||
| Hypothetical | $ | 1,000.00 | $ | 1,019.31 | 1.17 | % | $ | 5.96 | ||||||||||
| Class C | Actual | $ | 1,000.00 | $ | 923.70 | 1.67 | % | $ | 8.10 | |||||||||
| Hypothetical | $ | 1,000.00 | $ | 1,016.79 | 1.67 | % | $ | 8.49 | ||||||||||
| Class Z | Actual | $ | 1,000.00 | $ | 929.30 | 0.67 | % | $ | 3.26 | |||||||||
| Hypothetical | $ | 1,000.00 | $ | 1,021.83 | 0.67 | % | $ | 3.41 | ||||||||||
*Fund expenses (net of fee waivers or subsidies, if any) for each share class are equal to the annualized expense ratio for each share class (provided in the table), multiplied by the average account value over the period, multiplied by the 184 days in the six-month period ended August 31, 2013, and divided by the 365 days in the Fund’s fiscal year ended August 31, 2013 (to reflect the six-month period). Expenses presented in the table include the expenses of any underlying portfolios in which the Fund may invest.
| 10 | Visit our website at www.prudentialfunds.com |
The Fund’s annual expense ratios for the year ended August 31, 2013 are as follows:
Class | Gross Operating Expenses | Net Operating Expenses | ||
A | 0.96% | 0.91% | ||
B | 1.16% | 1.16% | ||
C | 1.66% | 1.66% | ||
Z | 0.66% | 0.66% |
Net operating expenses shown above reflect fee waivers and/or expense reimbursements. Additional information on Fund expenses and any fee waivers and/or expense reimbursements can be found in the “Financial Highlights” tables in this report and in the Notes to the Financial Statements in this report.
| Prudential California Muni Income Fund | 11 |
Portfolio of Investments
as of August 31, 2013
| Description | Moody’s Ratings† (Unaudited) | Interest Rate | Maturity Date | Principal Amount (000)# | Value (Note 1) | |||||||||||
LONG-TERM INVESTMENTS 98.6% | ||||||||||||||||
MUNICIPAL BONDS | ||||||||||||||||
Abag Fin. Auth. For Nonprofit | BBB(a) | 6.125% | 07/01/41 | 475 | $ | 491,820 | ||||||||||
Abag Fin. Auth. For Nonprofit | BBB(a) | 5.000 | 07/01/42 | 1,250 | 1,087,125 | |||||||||||
Abag Fin. Auth. For Nonprofit | A1 | 6.250 | 08/01/39 | 1,000 | 1,084,610 | |||||||||||
California Cnty. Tob. | B2 | 5.250 | 06/01/21 | 1,550 | 1,477,227 | |||||||||||
California Cnty. Tob. Securitization Corp., Tob. Conv. Bonds, Ser. B (Converted to Fixed on 12/01/08) | NR | 5.100 | 06/01/28 | 1,035 | 870,911 | |||||||||||
California Edl. Facs. Auth. Rev., Loyola Marymount Univ., Ser. A | A2 | 5.125 | 10/01/40 | 1,000 | 1,001,250 | |||||||||||
California Hlth. Facs. Fin. Auth. Rev., Adventist Hlth. Sys. West, Ser., A | A(a) | 4.000 | 03/01/33 | 735 | 603,354 | |||||||||||
California Hlth. Facs. Fin. Auth. Rev., City of Hope, Ser. A | A1 | 5.000 | 11/15/39 | 1,150 | 1,087,337 | |||||||||||
California Hlth. Facs. Fin. Auth. Rev., Episcopal Home, Ser. B, Rfdg. (Pre-refunded date 02/01/20)(c) | A(a) | 6.000 | 02/01/32 | 1,000 | 1,221,270 | |||||||||||
California Hlth. Facs. Fin. Auth. Rev., Providence Hlth., Ser. B | Aa2 | 5.500 | 10/01/39 | 1,500 | 1,579,245 | |||||||||||
See Notes to Financial Statements.
| Prudential California Muni Income Fund | 13 |
Portfolio of Investments
as of August 31, 2013 continued
| Description | Moody’s Ratings† (Unaudited) | Interest Rate | Maturity Date | Principal Amount (000)# | Value (Note 1) | |||||||||||
MUNICIPAL BONDS (Continued) | ||||||||||||||||
California Hlth. Facs. Fin. Auth. Rev., Providence Hlth., Ser. C (Pre-refunded date 10/01/18)(c) | NR | 6.500% | 10/01/38 | 20 | $ | 24,799 | ||||||||||
California Hlth. Facs. Fin. Auth. Rev., Providence Hlth., Ser. C, Unrefunded Balance | Aa2 | 6.500 | 10/01/38 | 980 | 1,113,535 | |||||||||||
California Hlth. Facs. Fin. Auth. Rev., Scripps Hlth., Ser. A | Aa3 | 5.000 | 11/15/40 | 1,000 | 956,950 | |||||||||||
California Hlth. Facs. Fin. Auth. Rev., Scripps Hlth., Ser. A, Rfdg. | Aa3 | 5.000 | 10/01/22 | 500 | 546,125 | |||||||||||
California Hlth. Facs. Fin. Auth. Rev., Scripps Hlth., Ser. A, Rfdg. | Aa3 | 5.000 | 11/15/36 | 1,200 | 1,166,196 | |||||||||||
California Hlth. Facs. Fin. Auth. Rev., St. Joseph Hlth. Sys., Ser. A | A1 | 5.750 | 07/01/39 | 1,000 | 1,076,120 | |||||||||||
California Hlth. Facs. Fin. Auth. Rev., Stanford Hosp., Ser. A-3, Rfdg. | Aa3 | 5.500 | 11/15/40 | 500 | 516,960 | |||||||||||
California Hlth. Facs. Fin. Auth. Rev., Stanford Hosp., Ser. B, Rfdg. | Aa3 | 5.000 | 11/15/36 | 2,000 | 1,933,220 | |||||||||||
California Hlth. Facs. Fin. Auth. Rev., Sutter Hlth., Ser. D, Rfdg. | Aa3 | 5.250 | 08/15/31 | 1,000 | 1,034,800 | |||||||||||
California Infrastructure & Econ. Dev. Rev., Bk. Dev. Walt. Dis. Fam. Musm., Walt & Lilly Disney | A1 | 5.250 | 02/01/38 | 2,000 | 2,000,680 | |||||||||||
California Muni. Fin. Auth. Ed. Rev., Amern. Heritage Ed. Foundation Proj., Ser. A | BB-(a) | 5.250 | 06/01/26 | 1,100 | 964,194 | |||||||||||
California Poll. Ctrl. Fin. Auth. Wtr. Facs. Rev., Amern. Wtr. Cap. Corp. Proj., 144A | Baa1 | 5.250 | 08/01/40 | 1,250 | 1,186,150 | |||||||||||
California St., | A1 | 5.500 | 04/01/30 | 5 | 5,100 | |||||||||||
See Notes to Financial Statements.
| 14 |
| Description | Moody’s Ratings† (Unaudited) | Interest Rate | Maturity Date | Principal Amount (000)# | Value (Note 1) | |||||||||||
MUNICIPAL BONDS (Continued) | ||||||||||||||||
California St., Var. Purp., GO | A1 | 5.000% | 10/01/29 | 1,500 | $ | 1,541,085 | ||||||||||
California St., Var. Purp., GO | A1 | 5.000 | 09/01/41 | 5,000 | 4,962,750 | |||||||||||
California St., Var. Purp., GO | A1 | 5.000 | 10/01/41 | 1,250 | 1,240,612 | |||||||||||
California St., Var. Purp., GO | A1 | 5.250 | 04/01/35 | 1,250 | 1,280,312 | |||||||||||
California St., Var. Purp., GO | A1 | 5.250 | 11/01/40 | 750 | 760,223 | |||||||||||
California St., Var. Purp., GO | A1 | 5.500 | 11/01/39 | 1,000 | 1,043,980 | |||||||||||
California St., Var. Purp., GO | A1 | 5.500 | 03/01/40 | 2,000 | 2,066,140 | |||||||||||
California St., Var. Purp., GO | A1 | 6.000 | 03/01/33 | 2,750 | 3,095,675 | |||||||||||
California St., Var. Purp., GO | A1 | 6.000 | 04/01/38 | 3,000 | 3,318,120 | |||||||||||
California St., Var. Purp., GO | A1 | 6.000 | 11/01/39 | 1,500 | 1,672,020 | |||||||||||
California St. Dept. Wtr. Res. | Aa1 | 5.000 | 12/01/29 | 2,000 | 2,145,380 | |||||||||||
California St. Dept. Wtr. Res. Pwr. Rev., Central VY Proj., Ser. AF | Aa1 | 5.000 | 12/01/29 | 1,500 | 1,578,615 | |||||||||||
California St. Pub. Wks. Brd. Lease Rev., Dept. General Service, Ser. D | A2 | 5.250 | 06/01/28 | 750 | 751,463 | |||||||||||
California St. Pub. Wks. Brd. Lease Rev., Judicial Council Projs., Ser. D | A2 | 5.000 | 12/01/31 | 1,000 | 991,650 | |||||||||||
California St. Pub. Wks. Brd. Lease Rev., Var. Cap. Proj., Ser. A | A2 | 5.125 | 10/01/31 | 1,000 | 1,003,570 | |||||||||||
California St. Pub. Wks. Brd. Lease Rev., Var. Cap. Proj., Ser. G-1 | A2 | 5.750 | 10/01/30 | 750 | 804,758 | |||||||||||
California St. Pub. Wks. Brd. Lease Rev., Var. Cap. Proj., Sub. Ser. I-1 | A2 | 6.375 | 11/01/34 | 750 | 862,313 | |||||||||||
California St. Univ. Rev., | Aa2 | 5.000 | 11/01/37 | 1,250 | 1,265,800 | |||||||||||
California Statewide Cmntys. Dev. Auth. Rev., Aspire Pub. Schs., Sch. Fac. Rev. | NR | 6.000 | 07/01/30 | 1,000 | 990,510 | |||||||||||
California Statewide Cmntys. Dev. Auth. Rev., Cottage Hlth. | A+(a) | 5.000 | 11/01/40 | 600 | 581,754 | |||||||||||
See Notes to Financial Statements.
| Prudential California Muni Income Fund | 15 |
Portfolio of Investments
as of August 31, 2013 continued
| Description | Moody’s Ratings† (Unaudited) | Interest Rate | Maturity Date | Principal Amount (000)# | Value (Note 1) | |||||||||||
MUNICIPAL BONDS (Continued) | ||||||||||||||||
California Statewide Cmntys. Dev. Auth. Rev., Episcopal Cmntys. & Svcs., Rfdg. | NR | 5.000% | 05/15/42 | 1,000 | $ | 848,140 | ||||||||||
California Statewide Cmntys. Dev. Auth. Rev., Irvine LLC, UCI East, Rfdg. | Baa2 | 5.000 | 05/15/32 | 2,000 | 1,915,440 | |||||||||||
California Statewide Cmntys. Dev. Auth. Rev., Polytechnic Sch. | A1 | 5.000 | 12/01/34 | 2,000 | 1,992,060 | |||||||||||
California Statewide Cmntys. Dev. Auth. Rev., | BBB-(a) | 7.250 | 11/15/41 | 500 | 534,870 | |||||||||||
California Statewide Cmntys. Dev. Auth. Rev., | NR | 6.230(d) | 09/01/22 | 3,200 | 1,841,984 | |||||||||||
California Statewide Cmntys. Dev. Auth. Rev., | Aa3 | 6.000 | 08/15/42 | 2,000 | 2,199,700 | |||||||||||
Chico Redev. Agy. Tax Alloc., Chico Amended & Merged Redev., A.M.B.A.C. | A+(a) | 5.000 | 04/01/30 | 2,000 | 1,892,020 | |||||||||||
Chula Vista Calif. Indl. Dev. Rev., San Diego Gas-D-Rmkt. | Aa3 | 5.875 | 01/01/34 | 1,000 | 1,087,990 | |||||||||||
Chula Vista Dev. Agy. Rev., | NR | 5.250 | 10/01/27 | 1,540 | 1,433,894 | |||||||||||
Chula Vista Mun. Fing. Auth., | BBB+(a) | 5.000 | 09/01/34 | 1,495 | 1,392,009 | |||||||||||
Coronado Cmnty. Dev. Agy. Tax Alloc., Dev. Proj., A.M.B.A.C. | AA-(a) | 5.000 | 09/01/24 | 2,000 | 2,023,620 | |||||||||||
El Dorado Irr. Dist. Partn., | A1 | 5.750 | 08/01/39 | 1,000 | 1,032,020 | |||||||||||
Foothill-De Anza Cmnty. College Dist., Ser. C, GO | Aaa | 5.000 | 08/01/40 | 1,250 | 1,273,687 | |||||||||||
Foothill/Eastern Trans. Corridor Agy. Toll Rd. Rev., | Baa3 | 5.875 | 01/15/28 | 2,890 | 2,904,045 | |||||||||||
Golden St. Tob. Securitization Rev., Asset Bkd., Ser. A-1 | B3 | 5.750 | 06/01/47 | 1,500 | 1,101,075 | |||||||||||
See Notes to Financial Statements.
| 16 |
| Description | Moody’s Ratings† (Unaudited) | Interest Rate | Maturity Date | Principal Amount (000)# | Value (Note 1) | |||||||||||
MUNICIPAL BONDS (Continued) | ||||||||||||||||
Golden St. Tob. Securitization Rev., Asset-Bkd., Sr., Ser. A-1 | B3 | 4.500% | 06/01/27 | 6,170 | $ | 5,182,923 | ||||||||||
Golden St. Tob. Securitization Rev., Enhanced Asset Bkd., Ser. A | A2 | 4.000 | 06/01/30 | 1,235 | 1,053,183 | |||||||||||
Golden St. Tob. Securitization Rev., Enhanced Asset Bkd., Ser. A | A2 | 5.000 | 06/01/45 | 1,000 | 914,080 | |||||||||||
Golden St. Tob. Securitization Rev., Ser. A, Conv., C.A.B.S., A.M.B.A.C. (Converted to Fixed on 06/01/10) | A2 | 4.600 | 06/01/23 | 3,000 | 3,040,710 | |||||||||||
Golden West Sch. Fin. Auth. Rev., Ser. A., C.A.B.S., N.A.T.L., Rfdg. | Baa1 | 4.350(d) | 02/01/19 | 2,110 | 1,671,352 | |||||||||||
Guam Gov’t. Ltd. Oblig. Rev., | BBB+(a) | 5.750 | 12/01/34 | 500 | 510,465 | |||||||||||
Guam Intl. Arpt. Auth. Rev., | Baa2 | 6.375 | 10/01/43 | 500 | 495,010 | |||||||||||
La Mesa-Spring Valley Sch. Dist., GO, Election of 2002, Ser. B, C.A.B.S., N.A.T.L. | A1 | 4.630(d) | 08/01/23 | 2,000 | 1,269,820 | |||||||||||
Lincoln Calif. Pub. Fing., Twelve Bridges Sub. Dist., | NR | 6.000 | 09/02/27 | 1,000 | 992,520 | |||||||||||
Long Beach Bond Fin. Auth. Natural Gas Purchase Rev., | Baa2 | 5.000 | 11/15/35 | 1,625 | 1,531,302 | |||||||||||
Long Beach Bond Fin. Auth. Natural Gas Purchase Rev., Ser. A | Baa2 | 5.250 | 11/15/19 | 580 | 636,776 | |||||||||||
Long Beach Bond Fin. Auth. Natural Gas Purchase Rev., Ser. A | Baa2 | 5.500 | 11/15/30 | 870 | 904,409 | |||||||||||
Long Beach Bond Fin. Auth. Natural Gas Purchase Rev., Ser. A | Baa2 | 5.500 | 11/15/32 | 345 | 355,336 | |||||||||||
See Notes to Financial Statements.
| Prudential California Muni Income Fund | 17 |
Portfolio of Investments
as of August 31, 2013 continued
| Description | Moody’s Ratings† (Unaudited) | Interest Rate | Maturity Date | Principal Amount (000)# | Value (Note 1) | |||||||||||
MUNICIPAL BONDS (Continued) | ||||||||||||||||
Long Beach Bond Fin. Auth. Natural Gas Purchase Rev., Ser. A | Baa2 | 5.500% | 11/15/37 | 1,290 | $ | 1,281,344 | ||||||||||
Long Beach Hbr. Rev., Ser. A, A.M.T., N.A.T.L., Rfdg. | Aa2 | 6.000 | 05/15/19 | 3,000 | 3,581,460 | |||||||||||
Los Angeles Calif. Cmnty. College Dist., Election of 2003, Ser. F-1, GO | Aa1 | 5.000 | 08/01/33 | 3,250 | 3,274,407 | |||||||||||
Los Angeles Calif. Cmnty. College Dist., Election of 2008, Ser. A, GO | Aa1 | 6.000 | 08/01/33 | 2,000 | 2,282,480 | |||||||||||
Los Angeles Calif. Dept. Arpts. Rev., Ser. A | Aa3 | 5.000 | 05/15/34 | 1,000 | 1,015,460 | |||||||||||
Los Angeles Dept. of Wtr. & Pwr. Rev., Pwr. Sys., Ser. A | Aa3 | 5.000 | 07/01/39 | 1,000 | 1,007,850 | |||||||||||
Los Angeles Dept. of Wtr. & Pwr. Wtrwks. Rev., Ser. A | Aa2 | 5.375 | 07/01/38 | 1,530 | 1,633,642 | |||||||||||
M-S-R Energy Auth. Calif., | A-(a) | 6.500 | 11/01/39 | 1,000 | 1,090,700 | |||||||||||
M-S-R Energy Auth. Calif., | A-(a) | 6.500 | 11/01/39 | 500 | 545,350 | |||||||||||
Metro. Wtr. Dist. of Southern | Aa1 | 5.750 | 08/10/18 | 2,000 | 2,317,060 | |||||||||||
Metro. Wtr. Dist. of Southern | Aa1 | 5.750 | 07/01/21 | 2,240 | 2,652,138 | |||||||||||
Orange Cmnty. Facs. Dist. Spl. Tax No. 91-2, Serrano Heights Pub. Impvt., Rfdg. | A(a) | 3.500 | 10/01/29 | 1,595 | 1,324,743 | |||||||||||
Orange Cnty. Trans. Auth. Rev., Express Lane Sr. Lien 91, Rfdg. | A1 | 5.000 | 08/15/29 | 1,000 | 1,031,650 | |||||||||||
Palomar Pomerado Healthcare Dist. Calif., C.O.P. | Baa3 | 6.000 | 11/01/41 | 1,200 | 1,137,588 | |||||||||||
Perris Cmnty. Facs. Dist., Spl. Tax, No. 01-2 Avalon, Ser. A | NR | 6.250 | 09/01/23 | 2,000 | 2,020,640 | |||||||||||
See Notes to Financial Statements.
| 18 |
| Description | Moody’s Ratings† (Unaudited) | Interest Rate | Maturity Date | Principal Amount (000)# | Value (Note 1) | |||||||||||
MUNICIPAL BONDS (Continued) | ||||||||||||||||
Pittsburg Redev. Agy. Tax Alloc., Los Medanos Cmnty. Dev. Proj., A.M.B.A.C., C.A.B.S. | BBB+(a) | 6.020%(d) | 08/01/26 | 1,375 | $ | 638,756 | ||||||||||
Port of Oakland, | A3 | 5.000 | 11/01/29 | 3,000 | 3,014,340 | |||||||||||
Port of Oakland, | A2 | 5.125 | 05/01/30 | 1,000 | 985,060 | |||||||||||
Port of Oakland, | A2 | 5.000 | 05/01/33 | 1,750 | 1,659,595 | |||||||||||
Puerto Rico Comnwlth., Aqueduct & Swr. Auth. Rev., Sr. Lien, Ser. A, Rfdg. | Ba1 | 5.750 | 07/01/37 | 390 | 284,220 | |||||||||||
Puerto Rico Comnwlth., | Ba1 | 6.000 | 07/01/47 | 325 | 235,086 | |||||||||||
Puerto Rico Comwlth., Pub. | Baa3 | 5.500 | 07/01/39 | 1,000 | 727,710 | |||||||||||
Puerto Rico Comwlth., Pub. Impvt., Ser. C, GO, Rfdg. | Baa3 | 6.000 | 07/01/39 | 400 | 312,768 | |||||||||||
Puerto Rico Elec. Pwr. Auth. | Baa3 | 5.250 | 07/01/40 | 1,000 | 698,020 | |||||||||||
Puerto Rico Pub. Bldgs. Auth. | Baa3 | 6.750 | 07/01/36 | 250 | 217,415 | |||||||||||
Puerto Rico Sales Tax Fin. Corp. Sales Tax Rev., First Sub., Ser. A | A3 | 5.500 | 08/01/42 | 750 | 608,858 | |||||||||||
Puerto Rico Sales Tax Fin. Corp. Sales Tax Rev., First Sub., Ser. A | A3 | 5.750 | 08/01/37 | 400 | 342,732 | |||||||||||
Puerto Rico Sales Tax Fin. Corp. Sales Tax Rev., First Sub., Ser. A | A3 | 6.000 | 08/01/42 | 700 | 621,488 | |||||||||||
Puerto Rico Sales Tax Fin. Corp. Sales Tax Rev., First Sub., Ser. A-1 | A3 | 5.250 | 08/01/43 | 500 | 388,880 | |||||||||||
See Notes to Financial Statements.
| Prudential California Muni Income Fund | 19 |
Portfolio of Investments
as of August 31, 2013 continued
| Description | Moody’s Ratings† (Unaudited) | Interest Rate | Maturity Date | Principal Amount (000)# | Value (Note 1) | |||||||||||
MUNICIPAL BONDS (Continued) | ||||||||||||||||
Puerto Rico Sales Tax Fin. Corp. Sales Tax Rev., Sr. Lien, Ser. C | Aa3 | 5.250% | 08/01/40 | 750 | $ | 647,633 | ||||||||||
Rancho Cordova Cmnty. Facs. Dist. Spl. Tax, Sunridge Anatolia 2003-1, Rfdg. | NR | 5.000 | 09/01/37 | 550 | 489,462 | |||||||||||
Redding Elec. Sys. Rev., C.O.P., Linked S.A.V.R.S., R.I.B.S., N.A.T.L., E.T.M., Rfdg.(c) | Baa1 | 6.368 | 07/01/22 | 75 | 90,611 | |||||||||||
Redding Elec. Sys. Rev., C.O.P., Linked S.A.V.R.S., R.I.B.S., N.A.T.L., E.T.M., Rfdg.(b)(c)(e)(f) | Baa1 | 12.239 | 07/01/22 | 1,900 | 2,690,970 | |||||||||||
Riverside Cnty. Calif. Redev. Agy. Tax. Alloc. Intst. 215 Corridor, Ser. E | Ba1 | 6.500 | 10/01/40 | 1,000 | 1,049,600 | |||||||||||
Riverside Cnty. Trans. Commission Rev., | BBB-(a) | 5.750 | 06/01/44 | 500 | 483,855 | |||||||||||
Rocklin Uni. Sch. Dist., | Baa1 | 1.780(d) | 08/01/16 | 1,400 | 1,329,538 | |||||||||||
Sacramento City Fin. Auth., | Baa1 | 3.270(d) | 11/01/17 | 5,695 | 4,919,455 | |||||||||||
Sacramento City Fin. Auth., Tax Alloc. Comb. Proj., | Baa1 | 3.540(d) | 11/01/16 | 5,700 | 5,143,338 | |||||||||||
Sacramento Cnty. Santn. Dist. Fing. Auth. Rev., | Aa3 | 0.714(b) | 12/01/35 | 1,000 | 783,410 | |||||||||||
San Buenaventura Calif. Rev., | Ba2 | 7.500 | 12/01/41 | 500 | 538,085 | |||||||||||
San Buenaventura Calif. Rev., | Ba2 | 8.000 | 12/01/26 | 500 | 568,630 | |||||||||||
San Diego Cmnty. College Dist., Election of 2006, GO | Aa1 | 5.000 | 08/01/41 | 1,500 | 1,525,440 | |||||||||||
San Diego Cnty. Regl. Arpt. Auth., A.M.T., Sr. Ser. B | A1 | 5.000 | 07/01/43 | 3,000 | 2,760,540 | |||||||||||
See Notes to Financial Statements.
| 20 |
| Description | Moody’s Ratings† (Unaudited) | Interest Rate | Maturity Date | Principal Amount (000)# | Value (Note 1) | |||||||||||
MUNICIPAL BONDS (Continued) | ||||||||||||||||
San Diego Redev. Agy. Tax Alloc., North Bay Redev. | Baa3 | 5.875% | 09/01/29 | 3,000 | $ | 2,999,910 | ||||||||||
San Diego Regl. Bldg. Auth., | Aa3 | 5.375 | 02/01/36 | 1,000 | 1,057,130 | |||||||||||
San Diego Uni. Sch. Dist., Election of 1998, | Aa3 | 6.000 | 07/01/19 | 1,000 | 1,206,150 | |||||||||||
San Francisco Calif. City & Cnty. Redev. Fing. Auth., | A-(a) | 6.500 | 08/01/39 | 1,000 | 1,080,770 | |||||||||||
San Francisco City & Cnty. Airports Commission, | A1 | 5.250 | 05/01/33 | 500 | 503,355 | |||||||||||
San Francisco City & Cnty. Airports Commission, | A1 | 5.000 | 05/01/31 | 1,000 | 984,940 | |||||||||||
San Francisco City & Cnty. Airports Commission, | A1 | 5.000 | 05/01/25 | 1,555 | 1,616,827 | |||||||||||
San Francisco City & Cnty. Airports Commission, | A1 | 5.000 | 05/01/28 | 1,000 | 1,006,900 | |||||||||||
San Jose Calif., Library & Park Proj., GO | Aa1 | 5.000 | 09/01/33 | 2,200 | 2,276,274 | |||||||||||
San Jose Calif. Redev. Agy. Tax Alloc., Merged Area Redev. Proj., Hsg. Set Aside, | Ba1 | 5.500 | 08/01/35 | 1,000 | 1,006,230 | |||||||||||
San Jose Evergreen Cmnty. College Dist. Election of 2004, Ser. B, A.G.C., C.A.B.S., GO | Aa1 | 2.120(d) | 09/01/17 | 1,000 | 918,920 | |||||||||||
San Leandro Cmnty. Facs., Spl. Tax Dist. No. 1 | NR | 6.500 | 09/01/25 | 2,160 | 2,161,318 | |||||||||||
San Mateo Cnty. Calif., Jt. Pwrs. Fin. Auth., Ser. A | Aa2 | 5.000 | 07/15/33 | 1,000 | 1,006,390 | |||||||||||
See Notes to Financial Statements.
| Prudential California Muni Income Fund | 21 |
Portfolio of Investments
as of August 31, 2013 continued
| Description | Moody’s Ratings† (Unaudited) | Interest Rate | Maturity Date | Principal Amount (000)# | Value (Note 1) | |||||||||||
MUNICIPAL BONDS (Continued) | ||||||||||||||||
Santa Margarita Dana Point Auth. Impt. Rev., Dists., 3, 3A, 4, 4A, Ser. B, N.A.T.L. | Baa1 | 7.250% | 08/01/14 | 2,000 | $ | 2,102,720 | ||||||||||
Santa Margarita Wtr. Dist. Spl. Tax, Cmnty. Facs. Dist. No. 2013-1 | NR | 5.625 | 09/01/36 | 325 | 320,258 | |||||||||||
Santa Maria Joint Union H.S. Dist., Election of 2004, C.A.B.S., GO, N.A.T.L. | Aa3 | 5.910(d) | 08/01/29 | 1,250 | 494,575 | |||||||||||
Santa Monica Cmnty. College Dist. Election of 2002, Ser. A, GO, N.A.T.L., C.A.B.S. | Aa2 | 5.040(d) | 08/01/28 | 1,055 | 502,032 | |||||||||||
South Bayside Waste Mgmt. Auth. Calif., Solid Waste Enterprise Shoreway Environmental, Ser. A | A3 | 6.000 | 09/01/36 | 500 | 515,205 | |||||||||||
Southern California Pub. Pwr. Auth. Rev., Palo Verde Proj., Ser. C, A.M.B.A.C., E.T.M., C.A.B.S., Rfdg.(c) | NR | 1.770(d) | 07/01/16 | 14,460 | 13,753,484 | |||||||||||
Tob. Securitization Auth. Northn. Calif. Rev., | B3 | 5.500 | 06/01/45 | 2,000 | 1,495,080 | |||||||||||
Tob. Securitization Auth. Northn. Calif. Rev., | B3 | 4.750 | 06/01/23 | 2,855 | 2,532,099 | |||||||||||
Torrance Hosp. Rev., | A2 | 6.000 | 06/01/22 | 2,000 | 2,007,820 | |||||||||||
Tuolumne Wind Proj. Auth. Calif. Rev., Tuolumne Co. Proj., Ser. A | A2 | 5.625 | 01/01/29 | 1,000 | 1,085,360 | |||||||||||
University Calif. Rev. Gen., Ser. O | Aa1 | 5.750 | 05/15/34 | 1,250 | 1,401,975 | |||||||||||
University Calif. Rev. Gen., Ser. Q | Aa1 | 5.000 | 05/15/34 | 1,000 | 1,032,650 | |||||||||||
See Notes to Financial Statements.
| 22 |
| Description | Moody’s Ratings† (Unaudited) | Interest Rate | Maturity Date | Principal Amount (000)# | Value (Note 1) | |||||||||||
MUNICIPAL BONDS (Continued) | ||||||||||||||||
Ventura Cnty. Cmnty. College, GO, Ser. C | Aa2 | 5.500% | 08/01/33 | 2,000 | $ | 2,194,460 | ||||||||||
Ventura Cnty. Pub. Fing. Auth. Lease Rev., Ser. A | Aa3 | 5.000 | 11/01/43 | 2,000 | 1,915,800 | |||||||||||
Virgin Islands Pub. Fin. Auth. Rev., Matching Fd. Ln., Diago, Ser. A | Baa3 | 6.750 | 10/01/37 | 250 | 272,358 | |||||||||||
|
| |||||||||||||||
TOTAL INVESTMENTS 98.6% | 206,419,145 | |||||||||||||||
Other assets in excess of liabilities(g) 1.4% | 2,881,790 | |||||||||||||||
|
| |||||||||||||||
NET ASSETS 100.0% | $209,300,935 | |||||||||||||||
|
| |||||||||||||||
The following abbreviations are used in the Portfolio descriptions:
144A—Security was purchased pursuant to Rule 144A under the Securities Act of 1933 and may not be resold subject to that rule except to qualified institutional buyers. Unless otherwise noted, 144A securities are deemed to be liquid.
A.G.C.—Assured Guaranty Corp.
A.M.B.A.C.—American Municipal Bond Assurance Corp.
A.M.T.—Alternative Minimum Tax
C.A.B.S.—Capital Appreciation Bonds
C.O.P.—Certificates of Participation
E.T.M.—Escrowed to Maturity
GO—General Obligation
I.D.B.—Industrial Development Bond
N.A.T.L.—National Public Finance Guaranty Corp.
NR—Not Rated by Moody’s or Standard & Poor’s
P.C.R.—Pollution Control Revenue
R.I.B.S.—Residual Interest Bonds
S.A.V.R.S.—Select Auction Variable Rate Securities
| † | The ratings reflected are as of August 31, 2013. Ratings of certain bonds may have changed subsequent to that date. The Fund’s current Statement of Additional Information contains a description of Moody’s and Standard & Poor’s ratings. |
| # | Principal amount or notional amount shown in U.S. dollars unless otherwise stated. |
| (a) | Standard & Poor’s Rating. |
| (b) | Variable rate instrument. The interest rate shown reflects the rate in effect at August 31, 2013. |
| (c) | All or partial escrowed to maturity and pre-refunded issues are secured by escrowed cash and/or U.S. guaranteed obligations. |
| (d) | Represents zero coupon bond or step coupon bond. Rate shown reflects the effective yield on August 31, 2013. |
| (e) | Inverse floating rate bond. The coupon is inversely indexed to a floating interest rate. The rate shown is the rate at August 31, 2013. |
See Notes to Financial Statements.
| Prudential California Muni Income Fund | 23 |
Portfolio of Investments
as of August 31, 2013 continued
| (f) | Indicates a security or securities that have been deemed illiquid. |
| (g) | Includes net unrealized appreciation (depreciation) on the following derivative contracts held at reporting period end: |
Open futures contracts outstanding at August 31, 2013:
| Number of Contracts | Type | Expiration Date | Value at Trade Date | Value at August 31, 2013 | Unrealized Depreciation(1) | |||||||||||||||
| Short Positions: | ||||||||||||||||||||
| 8 | 10 Year U.S. Treasury Notes | Dec. 2013 | $ | 993,373 | $ | 994,250 | $ | (877 | ) | |||||||||||
| 22 | U.S. Long Treasury Bonds | Dec. 2013 | 2,875,582 | 2,901,937 | (26,355 | ) | ||||||||||||||
|
| |||||||||||||||||||
| $ | (27,232 | ) | ||||||||||||||||||
|
| |||||||||||||||||||
| (1) | Cash of $170,800 has been segregated to cover requirement for open futures contracts as of August 31, 2013. |
Various inputs are used in determining the value of the Fund’s investments. These inputs are summarized in the three broad levels listed below.
Level 1—quoted prices generally in active markets for identical securities.
Level 2—other significant observable inputs including, but not limited to, quoted prices for similar securities, interest rates and yield curves, prepayment speeds, foreign currency exchange rates, and amortized cost.
Level 3—significant unobservable inputs for securities valued in accordance with Board approved fair valuation procedures.
The following is a summary of the inputs used as of August 31, 2013 in valuing such portfolio securities:
| Level 1 | Level 2 | Level 3 | ||||||||||
Investments in Securities | ||||||||||||
Municipal Bonds | $ | — | $ | 206,419,145 | $ | — | ||||||
Other Financial Instruments* | ||||||||||||
Futures Contracts | (27,232 | ) | — | — | ||||||||
|
|
|
|
|
| |||||||
Total | $ | (27,232 | ) | $ | 206,419,145 | $ | — | |||||
|
|
|
|
|
| |||||||
| * | Other financial instruments are derivative instruments not reflected in the Portfolio of Investments, such as futures, forwards and swaps contracts, which are recorded at the unrealized appreciation/depreciation of the instrument. |
See Notes to Financial Statements.
| 24 |
The industry classification of portfolio holdings and other assets in excess of liabilities shown as a percentage of net assets as of August 31, 2013 were as follows:
General Obligation | 19.4 | % | ||
Special Tax/Assessment District | 18.3 | |||
Health Care | 10.8 | |||
Transportation | 10.5 | |||
Pre-Refunded | 8.5 | |||
Tobacco | 6.0 | |||
Water & Sewer | 6.0 | |||
Lease Backed Certificate of Participation | 5.0 | |||
Education | 4.9 | |||
Power | 4.4 | % | ||
Tobacco Appropriated | 2.4 | |||
Corporate Backed I.D.B. & P.C.R. | 1.1 | |||
Other Muni | 1.0 | |||
Solid Waste/Resource Recovery | 0.3 | |||
|
| |||
| 98.6 | ||||
Other assets in excess of liabilities | 1.4 | |||
|
| |||
| 100.0 | % | |||
|
|
Industry classification is subject to change.
The Fund invested in derivative instruments during the reporting period. The primary type of risk associated with these derivative instruments is interest rate risk. The effect of such derivative instruments on the Fund’s financial position and financial performance as reflected in the Statement of Assets and Liabilities and Statement of Operations is presented in the summary below.
Fair values of derivative instruments as of August 31, 2013 as presented in the Statement of Assets and Liabilities:
Derivatives not accounted for | Asset Derivatives | Liability Derivatives | ||||||||||
Balance | Fair Value | Balance | Fair Value | |||||||||
| Interest rate contracts | — | $ | — | Due to broker—variation margin | $ | 27,232 | * | |||||
|
|
|
| |||||||||
| * | Includes cumulative appreciation/depreciation as reported in schedule of open futures. Only unsettled variation margin receivable (payable) is reported within the Statement of Assets and Liabilities. |
The effects of derivative instruments on the Statement of Operations for the year ended August 31, 2013 are as follows:
Amount of Realized Gain or (Loss) on Derivatives Recognized in Income | ||||
Derivatives not accounted for as hedging | Futures | |||
Interest rate contracts | $ | 335,058 | ||
|
| |||
See Notes to Financial Statements.
| Prudential California Muni Income Fund | 25 |
Portfolio of Investments
as of August 31, 2013 continued
Change in Unrealized Appreciation or (Depreciation) on Derivatives Recognized in Income | ||||
Derivatives not accounted for as hedging | Futures | |||
Interest rate contracts | $ | 154,689 | ||
|
| |||
For the year ended August 31, 2013, the Fund’s average value at trade date for futures short positions was $5,412,861.
See Notes to Financial Statements.
| 26 |
PRUDENTIAL INVESTMENTS»MUTUAL FUNDS
FINANCIAL STATEMENTS
ANNUAL REPORT · AUGUST 31, 2013
Prudential California Muni Income Fund
Statement of Assets & Liabilities
as of August 31, 2013
Assets | ||||
Investments at value: | ||||
Unaffiliated investments (cost $203,171,763) | $ | 206,419,145 | ||
Cash | 1,606,629 | |||
Deposit with broker | 170,800 | |||
Interest receivable | 2,532,443 | |||
Receivable for Fund shares sold | 70,974 | |||
Prepaid expenses | 3,250 | |||
|
| |||
Total assets | 210,803,241 | |||
|
| |||
Liabilities | ||||
Payable for Fund shares reacquired | 541,908 | |||
Payable for investments purchased | 493,065 | |||
Dividends payable | 196,159 | |||
Accrued expenses | 108,105 | |||
Management fee payable | 91,475 | |||
Distribution fee payable | 53,763 | |||
Deferred trustees’ fees | 11,015 | |||
Due to broker—variation margin | 3,966 | |||
Affiliated transfer agent fee payable | 2,850 | |||
|
| |||
Total liabilities | 1,502,306 | |||
|
| |||
Net Assets | $ | 209,300,935 | ||
|
| |||
Net assets were comprised of: | ||||
Shares of beneficial interest, at par | $ | 205,655 | ||
Paid-in capital in excess of par | 206,489,571 | |||
|
| |||
| 206,695,226 | ||||
Undistributed net investment income | 193,500 | |||
Accumulated net realized loss on investment transactions | (807,941 | ) | ||
Net unrealized appreciation on investments | 3,220,150 | |||
|
| |||
Net assets, August 31, 2013 | $ | 209,300,935 | ||
|
| |||
See Notes to Financial Statements.
| 28 |
Class A | ||||
Net asset value and redemption price per share | $ | 10.18 | ||
Maximum sales charge (4.00% of offering price) | .42 | |||
|
| |||
Maximum offering price to public | $ | 10.60 | ||
|
| |||
Class B | ||||
Net asset value, offering price and redemption price per share | $ | 10.18 | ||
|
| |||
Class C | ||||
Net asset value, offering price and redemption price per share | $ | 10.18 | ||
|
| |||
Class Z | ||||
Net asset value, offering price and redemption price per share | $ | 10.18 | ||
|
| |||
See Notes to Financial Statements.
| Prudential California Muni Income Fund | 29 |
Statement of Operations
Year Ended August 31, 2013
Net Income | ||||
Income | ||||
Interest income | $ | 11,454,705 | ||
|
| |||
Expenses | ||||
Management fee | 1,182,170 | |||
Distribution fee—Class A | 403,203 | |||
Distribution fee—Class B | 35,304 | |||
Distribution fee—Class C | 248,099 | |||
Transfer agent’s fees and expenses (including affiliated expense of $15,000) (Note 3) | 121,000 | |||
Custodian’s fees and expenses | 81,000 | |||
Registration fees | 52,000 | |||
Legal fees and expenses | 38,000 | |||
Audit fee | 33,000 | |||
Shareholders’ reports | 26,000 | |||
Trustees’ fees | 14,000 | |||
Insurance | 4,000 | |||
Miscellaneous | 10,690 | |||
|
| |||
Total expenses | 2,248,466 | |||
Less: Custody fee credit (Note 1) | (280 | ) | ||
|
| |||
Net expenses | 2,248,186 | |||
|
| |||
Net investment income | 9,206,519 | |||
|
| |||
Realized And Unrealized Gain (Loss) On Investments | ||||
Net realized gain (loss) on: | ||||
Investment transactions | (669,013 | ) | ||
Financial futures transactions | 335,058 | |||
|
| |||
| (333,955 | ) | |||
|
| |||
Net change in unrealized appreciation (depreciation) on: | ||||
Investments | (18,950,234 | ) | ||
Financial futures contracts | 154,689 | |||
|
| |||
| (18,795,545 | ) | |||
|
| |||
Net loss on investment transactions | (19,129,500 | ) | ||
|
| |||
Net Decrease In Net Assets Resulting From Operations | $ | (9,922,981 | ) | |
|
| |||
See Notes to Financial Statements.
| 30 |
Statement of Changes in Net Assets
| Year Ended August 31, | ||||||||
| 2013 | 2012 | |||||||
Increase (Decrease) In Net Assets | ||||||||
Operations | ||||||||
Net investment income | $ | 9,206,519 | $ | 8,761,661 | ||||
Net realized loss on investment transactions | (333,955 | ) | (27,755 | ) | ||||
Net change in unrealized appreciation (depreciation) on investments | (18,795,545 | ) | 13,100,874 | |||||
|
|
|
| |||||
Net increase (decrease) in net assets resulting from operations | (9,922,981 | ) | 21,834,780 | |||||
|
|
|
| |||||
Dividends from net investment income (Note 1) | ||||||||
Class A | (6,242,841 | ) | (6,618,788 | ) | ||||
Class B | (255,966 | ) | (259,793 | ) | ||||
Class C | (774,757 | ) | (698,728 | ) | ||||
Class Z | (1,783,835 | ) | (1,198,362 | ) | ||||
|
|
|
| |||||
| (9,057,399 | ) | (8,775,671 | ) | |||||
|
|
|
| |||||
Fund share transactions (Net of share conversions) (Note 6) | ||||||||
Net proceeds from shares sold | 62,415,756 | 31,106,880 | ||||||
Net asset value of shares issued in reinvestment of dividends | 6,569,180 | 6,540,661 | ||||||
Cost of shares reacquired | (58,686,328 | ) | (34,171,028 | ) | ||||
|
|
|
| |||||
Net increase in net assets from Fund share transactions | 10,298,608 | 3,476,513 | ||||||
|
|
|
| |||||
Total increase (decrease) | (8,681,772 | ) | 16,535,622 | |||||
Net Assets: | ||||||||
Beginning of year | 217,982,707 | 201,447,085 | ||||||
|
|
|
| |||||
End of year(a) | $ | 209,300,935 | $ | 217,982,707 | ||||
|
|
|
| |||||
(a) Includes undistributed net investment income of: | $ | 193,500 | $ | 103,638 | ||||
|
|
|
| |||||
See Notes to Financial Statements.
| Prudential California Muni Income Fund | 31 |
Notes to Financial Statements
Prudential California Muni Income Fund (the “Fund”), is an open-end management investment company, registered under the Investment Company Act of 1940, as amended, (the “1940 Act”). The Fund was organized as a Massachusetts business trust on May 18, 1984. The Fund commenced investment operations on December 3, 1990. The investment objective of the Fund is to maximize current income that is exempt from California state and federal income taxes, consistent with the preservation of capital.
Note 1. Accounting Policies
The following is a summary of significant accounting policies followed by the Fund in the preparation of the financial statements.
Securities Valuation: The Fund holds portfolio securities and other assets that are fair valued at the close of each day the New York Stock Exchange (“NYSE”) is open for trading. Fair value is the price that would be received to sell an asset or paid to transfer a liability in an orderly transaction between market participants on the measurement date. The Board of Trustees (the “Board”) has delegated fair valuation responsibilities to Prudential Investments LLC (“PI” or “Manager”) through the adoption of Valuation Procedures for valuation of the Fund’s securities. Under the current Valuation Procedures, a Valuation Committee is established and responsible for supervising the valuation of portfolio securities and other assets. The Valuation Procedures allow the Fund to utilize independent pricing vendor services, quotations from market makers and other valuation methods in events when market quotations are not readily available or not representative of the fair value of the securities. A record of the Valuation Committee’s actions is subject to review, approval and ratification by the Board at its next regularly scheduled quarterly meeting.
Various inputs are used in determining the value of the Fund’s investments, which are summarized in the three broad level hierarchies based on any observable inputs used as described in the table following the Portfolio of Investments. The valuation methodologies and significant inputs used in determining the fair value of securities and other assets classified as Level 1, Level 2 and Level 3 of the hierarchy are as follows:
Common stocks, exchange-traded funds and financial derivative instruments (including futures contracts and certain options and swap contracts on securities),
| 32 |
that are traded on a national securities exchange are valued at the last sale price as of the close of trading on the applicable exchange. Securities traded via NASDAQ are valued at the NASDAQ official closing price. To the extent these securities are valued at the last sale price or NASDAQ official closing price, they are classified as Level 1 of the fair value hierarchy.
In the event there is no sale or official closing price on such day, these securities are valued at the mean between the last reported bid and asked prices, or at the last bid price in absence of an asked price. These securities are classified as Level 2 of the fair value hierarchy as these inputs are considered as significant other observable inputs to the valuation.
Common stocks traded on foreign securities exchanges are valued using pricing vendor services that provide model prices derived using adjustment factors based on information such as local closing price, relevant general and sector indices, currency fluctuations, depositary receipts, and futures, as applicable. Securities valued using such model prices are classified as Level 2 in the fair value hierarchy, as the adjustment factors are observable and considered to be significant to the valuation.
Investments in open-end, non-exchange-traded mutual funds are valued at their net asset values as of the close of the NYSE on the date of valuation. These securities are classified as Level 1 as they have the ability to be purchased or sold at their net asset values on the date of valuation.
Fixed income securities traded in the over-the-counter market, such as corporate bonds, municipal bonds, U.S. Government agencies issues and guaranteed obligations, U.S. Treasury obligations and sovereign issues are usually valued at prices provided by approved independent pricing vendors. The pricing vendors provide these prices usually after evaluating observable inputs including yield curves, credit rating, yield spreads, default rates, cash flows as well as broker/dealer quotations and reported trades. Securities valued using such vendor prices are classified as Level 2 of the fair value hierarchy.
Asset-backed and mortgage-related securities are usually valued by approved independent pricing vendors. The pricing vendors provide the prices using their internal pricing models with inputs from deal terms, tranche level attributes, yield curves, prepayment speeds, default rates and broker/dealer quotes. Securities valued using such vendor prices are classified as Level 2 of the fair value hierarchy.
Over-the-counter financial derivative instruments, such as option contracts, foreign currency contracts and swaps agreements, are usually valued using pricing vendor
| Prudential California Muni Income Fund | 33 |
Notes to Financial Statements
continued
services, which derive the valuation based on underlying asset prices, indices, spreads, interest rates, exchange rates and other inputs. These instruments are categorized as Level 2 of the fair value hierarchy.
Securities and other assets that cannot be priced using the methods described above are valued with pricing methodologies approved by the Board of Trustees. In the event there are unobservable inputs used when determining such valuations, the securities will be classified as Level 3 of the fair value hierarchy.
When determining the fair value of securities, some of the factors influencing the valuation include: the nature of any restrictions on disposition of the securities; assessment of the general liquidity of the securities; the issuer’s financial condition and the markets in which it does business; the cost of the investment; the size of the holding and the capitalization of the issuer; the prices of any recent transactions or bids/offers for such securities or any comparable securities; any available analyst media or other reports or information deemed reliable by the investment adviser regarding the issuer or the markets or industry in which it operates. Using fair value to price securities may result in a value that is different from a security’s most recent closing price and from the price used by other mutual funds to calculate their net asset values.
Restricted and Illiquid Securities: The Fund may invest up to 15% of its net assets in illiquid securities. Illiquid securities are those that, because of the absence of a readily available market or due to legal or contractual restrictions on resale, cannot be sold within seven days in the ordinary course of business at approximately the amount at which the Fund has valued the investment. Therefore, the Fund may find it difficult to sell illiquid securities at the time considered most advantageous by its Subadviser and may incur expenses that would not be incurred in the sale of securities that were freely marketable. Certain securities that would otherwise be considered illiquid because of legal restrictions on resale to the general public may be traded among qualified institutional buyers under Rule 144A of the Securities Act of 1933. These Rule 144A securities, as well as commercial paper that is sold in private placements under Section 4(2) of the Securities Act, may be deemed liquid by the Fund’s Subadviser under the guidelines adopted by the Fund. However, the liquidity of the Fund’s investments in Rule 144A securities could be impaired if trading does not develop or declines.
| 34 |
Financial Futures Contracts: A financial futures contract is an agreement to purchase (long) or sell (short) an agreed amount of securities at a set price for delivery on a future date. Upon entering into a financial futures contract, the Fund is required to pledge to the broker an amount of cash and/or other assets equal to a certain percentage of the contract amount. This amount is known as the “initial margin.” Subsequent payments, known as “variation margin,” are made or received by the Fund each day, depending on the daily fluctuations in the value of the underlying security. Such variation margin is recorded for financial statement purposes on a daily basis as unrealized gain or loss. When the contract expires or is closed, the gain or loss is realized and is presented in the Statement of Operations as net realized gain (loss) on financial futures contracts.
The Fund invested in financial futures contracts in order to hedge existing portfolio securities, or securities the Fund intends to purchase, against fluctuations in value caused by changes in prevailing interest rates and manage yield curve and duration. The Fund may not achieve the anticipated benefits of the financial futures contracts and may realize a loss. The use of futures transactions involves the risk of imperfect correlation in movements in the price of futures contracts, interest rates and the underlying hedged assets. Financial futures contracts involve elements of risk in excess of the amounts reflected on the Statement of Assets and Liabilities.
With exchange-traded futures contracts, there is minimal counterparty credit risk to the Fund since the exchanges’ clearinghouse acts as counterparty to all exchange traded futures and guarantees the futures contracts against default.
Floating-Rate Notes Issued in Conjunction with Securities Held: The Fund may invest in inverse floating rate securities (“inverse floaters”) that pay interest at a rate that varies inversely with short-term interest rates. Certain securities may be leveraged, whereby the interest rate varies inversely at a multiple of the change in short-term rates. As interest rates rise, inverse floaters produce less current income. The price of such securities is more volatile than comparable fixed rate securities.
When the Fund enters into agreements to create inverse floaters and floater note securities (also known as Tender Option Bond Transactions), the Fund transfers a fixed rate bond to a broker for cash. At the same time the Fund buys (receives) a residual interest in a trust (the “trust”) set up by the broker, often referred to as an inverse floating rate obligation (inverse floaters). Generally, the broker deposits a fixed rate bond (the “fixed rate bond”) into the trust with the same CUSIP number as the fixed rate bond sold to the broker by the Fund. The “trust” also issues floating rate notes (“floating rate notes”), which are sold to third parties. The floating rate notes have interest rates that reset weekly. The inverse floater held by the Fund gives the
| Prudential California Muni Income Fund | 35 |
Notes to Financial Statements
continued
Fund the right (1) to cause the holders of the floating rate notes to tender their notes at par, and (2) to have the broker transfer the fixed rate bond held by the trust to the Fund thereby collapsing the trust. The Fund accounts for the transaction described above as funded leverage by including the fixed rate bond in its Portfolio of Investments, and accounts for the floating rate notes as a liability under the caption “payable for floating rate notes issued” in the Fund’s “Statement of Assets and Liabilities.” Interest expense related to the Fund’s liability in connection with the floating rate notes held by third parties is recorded as incurred. The interest expense is under the caption “interest expenses related to inverse floaters” in the Fund’s “Statement of Operations” and is also included in the Fund’s expense ratio. For the year ended August 31, 2013, the Fund did not enter into any Tender Option Bond Transactions.
The Fund may also invest in inverse floaters without transferring a fixed rate bond into a trust, which is not accounted for as funded leverage. The interest rates on these securities have an inverse relationship to the interest rate of other securities or the value of an index. Changes in interest rates on the other security or index inversely affect the rate paid on the inverse floater, and the inverse floater’s price will be more volatile than that of a fixed-rate bond. Additionally, some of these securities contain a “leverage factor” whereby the interest rate moves inversely by a “factor” to the benchmark rate. Certain interest rate movements and other market factors can substantially affect the liquidity of inverse floating rate notes. The Fund’s investment policies and restrictions permit investments in inverse floating rate securities. Inverse floaters held by the Fund are securities exempt from registration under Rule 144A of the Securities Act of 1933.
When-Issued/Delayed Delivery Securities: Securities purchased or sold on a when-issued or delayed-delivery basis may be settled a month or more after trade date; interest income is not accrued until settlement date. At the time a Fund enters into such transactions, it instructs the custodian to segregate assets with a current value at least equal to the amount of its when-issued or delayed-delivery purchase commitments.
Securities Transactions and Net Investment Income: Securities transactions are recorded on the trade date. Realized gains or losses on sales of portfolio securities are calculated on the identified cost basis. Interest income, including amortization of premium and accretion of discount on debt securities, as required, is recorded on the
| 36 |
accrual basis as an adjustments to interest income. Expenses are recorded on an accrual basis, which may require the use of certain estimates by management, that may differ from actual.
Net investment income or loss (other than distribution fees, which are charged directly to the respective class) and unrealized and realized gains or losses, are allocated daily to each class of shares based upon the relative proportion of adjusted net assets of each class at the beginning of the day.
Dividends and Distributions: The Fund declares daily dividends from net investment income. Payment of dividends is made monthly. Distributions of net realized capital gains, if any, are made annually. Dividends and distributions to shareholders, which are determined in accordance with federal income tax regulations and which may differ from generally accepted accounting principles, are recorded on the ex-dividend date. Permanent book/tax differences relating to income and gains are reclassified amongst undistributed net investment income, accumulated net realized gain or loss and paid-in capital in excess of par, as appropriate.
Custody Fee Credits: The Fund has an arrangement with its custodian bank, whereby uninvested monies earn credits which reduce the fees charged by the custodian. Such custody fee credits, if any, are presented as a reduction of gross expenses in the accompanying Statement of Operations.
Taxes: It is the Fund’s policy to continue to meet the requirements of the Internal Revenue Code applicable to regulated investment companies and to distribute all of its taxable net investment income and capital gains, if any, to its shareholders. Therefore, no federal income tax provision is required.
Estimates: The preparation of the financial statements requires management to make estimates and assumptions that affect the reported amounts and disclosures in the financial statements. Actual results could differ from those estimates.
Note 2. Agreements
The Fund has a management agreement with Prudential Investments LLC (“PI”). Pursuant to this agreement, PI has responsibility for all investment advisory services and supervises the subadvisor’s performance of such services. PI has entered into a subadvisory agreement with Prudential Investment Management, Inc. (“PIM”). The subadvisory agreement provides that PIM furnishes investment advisory services in connection with the management of the Fund. In connection therewith, PIM is
| Prudential California Muni Income Fund | 37 |
Notes to Financial Statements
continued
obligated to keep certain books and records of the Fund. PI pays for the services of PIM, the cost of compensation of officers of the Fund, occupancy and certain clerical and bookkeeping costs of the Fund. The Fund bears all other costs and expenses.
The management fee paid to PI is accrued daily and payable monthly, at an annual rate of .50% of the Fund’s average daily net assets up to and including $1 billion and .45% of the Fund’s average daily net assets in excess of $1 billion. The effective management fee rate was .50% of the Fund’s average daily net assets for the year ended August 31, 2013.
The Fund has a distribution agreement with Prudential Investment Management Services LLC (“PIMS”), which acts as the distributor of the Class A, Class B, Class C and Class Z shares of the Fund. The Fund compensates PIMS for distributing and servicing the Fund’s Class A, Class B and Class C shares, pursuant to plans of distribution (the “Class A, B and C Plans”), regardless of expenses actually incurred by PIMS. The distribution fees for Class A, Class B and Class C shares are accrued daily and payable monthly. No distribution or service fees are paid to PIMS as distributor of the Class Z shares of the Fund.
Pursuant to the Class A, Class B and Class C Plans, the Fund compensates PIMS for distribution-related activities at an annual rate of up to .30%, .50% and 1% of the average daily net assets of the Class A, B and C shares, respectively. For the year ended August 31, 2013, PIMS has contractually agreed to limit such fees to .25% of the Class A shares.
PIMS has advised the Fund that it received $123,588 in front-end sales charges resulting from sales of Class A shares, during the year ended August 31, 2013. From these fees, PIMS paid a substantial part of such sales charges to affiliated broker-dealers which in turn paid commissions to sales persons and incurred other distribution costs.
PIMS has advised the Fund that, for the year ended August 31, 2013, it received $13,550, $18,268 and $9,679 in contingent deferred sales charges imposed upon redemptions by certain Class A, Class B and Class C shareholders, respectively.
PI, PIM and PIMS are indirect wholly owned subsidiaries of Prudential Financial, Inc. (“Prudential”).
| 38 |
Note 3. Other Transactions with Affiliates
Prudential Mutual Fund Services LLC (“PMFS”), an affiliate of PI and an indirect, wholly-owned subsidiary of Prudential, serves as the Fund’s transfer agent. Transfer agent fees and expenses in the Statement of Operations include certain out-of-pocket expenses paid to non-affiliates, where applicable.
Note 4. Portfolio Securities
Purchases and sales of portfolio securities, other than short-term investments, for the year ended August 31, 2013, aggregated $105,559,621 and $97,217,051, respectively. Although floating rate daily demand notes are shown as short-term investments in the Portfolio of Investments due to frequent reset of coupon rates, they have long-term maturities and are included in these purchase and sale amounts. As of the year ended August 31, 2013, the Fund had no floating rate demand note.
Note 5. Tax Information
Distributions to shareholders, which are determined in accordance with federal income tax regulations and which may differ from generally accepted accounting principles, are recorded on the ex-dividend date. In order to present undistributed net investment income, accumulated net realized loss on investment transactions and paid-in capital in excess of par on the Statement of Assets and Liabilities that more closely represent their tax character, certain adjustments have been made to undistributed net investment income and accumulated net realized loss on investment transactions. For the year ended August 31, 2013, the adjustments were to decrease undistributed net investment income and decrease accumulated net realized loss on investment transactions by $59,258 due to the difference in the treatment of accreting market discount between financial and tax reporting and other book to tax differences. Net investment income, net realized loss on investments and net assets were not affected by this change.
For the year ended August 31, 2013, the tax character of dividends paid as reflected in the Statement of Changes in Net Assets were $7,451 of ordinary income and $9,049,948 of tax-exempt income. For the year ended August 31, 2012, the tax character of dividends paid as reflected in the Statement of Changes in Net Assets were $184,953 of ordinary income and $8,590,718 of tax-exempt income.
As of August 31, 2013, the components of distributable earnings on a tax basis were $338,670 of tax-exempt income (includes timing difference of $196,159 for dividends payable) and $62,004 of ordinary income.
| Prudential California Muni Income Fund | 39 |
Notes to Financial Statements
continued
The United States federal income tax basis of the Fund’s investments and the net unrealized appreciation as of August 31, 2013 were as follows:
Tax Basis | Appreciation | Depreciation | Net Unrealized Appreciation | |||
| $202,193,548 | $11,869,646 | $(7,644,049) | $4,225,597 |
The difference between book basis and tax basis is primarily attributable to the difference in the treatment of accreting market discount for book and tax purposes.
Under the Regulated Investment Company Modernization Act of 2010 (the “Act”), the Fund is permitted to carryforward capital losses incurred in the fiscal year ended August 31, 2012 and August 31, 2013 (“post-enactment losses”) for an unlimited period. Post-enactment losses are required to be utilized before the utilization of losses incurred prior to the effective date of the Act. As a result of this ordering rule, capital loss carryforwards related to taxable years ending before August 31, 2012 (“pre-enactment losses”) may have an increased likelihood to expire unused. The Fund utilized approximately $388,000 of its post-enactment losses to offset net taxable gains realized in the fiscal year ended August 31, 2013. Additionally, post-enactment capital losses that are carried forward will retain their character as either short-term or long-term capital losses rather than being considered all short-term as under previous law. No capital gains distributions are expected to be paid to shareholders until net gains have been realized in excess of such losses. As of August 31, 2013, the pre and post-enactment losses were approximately:
Post-Enactment Losses: | $ | 287,000 | ||
|
| |||
Pre-Enactment Losses: | ||||
Expiring 2019 | $ | 926,000 | ||
|
|
The Fund elected to treat post-October capital losses of approximately $600,000 as having been incurred in the following fiscal year (August 31, 2014).
Management has analyzed the Fund’s tax positions taken on federal income tax returns for all open tax years and has concluded that no provision for income tax is required in the Fund’s financial statements for the current reporting period. The Fund’s federal and state income and federal excise tax returns for tax years for which
| 40 |
the applicable statutes of limitations have not expired are subject to examination by the Internal Revenue Service and state departments of revenue.
Note 6. Capital
The Fund offers Class A, Class B, Class C and Class Z shares. Class A shares are subject to a maximum front-end sales charge of 4%. All investors who purchase Class A shares in an amount of $1 million or more and sell these shares within 12 months of purchase are subject to a contingent deferred sales charge (“CDSC”) of 1%. The Class A CDSC is waived for purchases by certain retirement and/or benefit plans. Class B shares are sold with a CDSC which declines from 5% to zero depending on the period of time the shares are held. Class B shares automatically convert to Class A shares on a quarterly basis approximately seven years after purchase. Class C shares sold within 12 months of purchase are subject to a CDSC of 1%. A special exchange privilege is also available for shareholders who qualify to purchase Class A shares at net asset value. Class Z shares are not subject to any sales or redemption charge and are offered exclusively for sale to a limited group of investors.
Under certain circumstances, an exchange may be made from specified share classes of the Fund to one or more other share classes of the Fund as presented in the table of transactions in shares of beneficial interest.
The Fund is permitted to issue an unlimited number of full and fractional shares in separate series, currently designated as the Prudential California Muni Income Fund. The Prudential California Muni Income Fund is authorized to issue an unlimited number of shares, divided into four classes, designated Class A, Class B, Class C and Class Z.
The Fund has authorized an unlimited number of shares of beneficial interest for each class at $.01 par value per share.
| Prudential California Muni Income Fund | 41 |
Notes to Financial Statements
continued
Transactions in shares of beneficial interest were as follows:
Class A | Shares | Amount | ||||||
Year ended August 31, 2013: | ||||||||
Shares sold | 2,416,992 | $ | 26,889,887 | |||||
Shares issued in reinvestment of dividends | 455,730 | 4,986,614 | ||||||
Shares reacquired | (3,005,922 | ) | (32,684,378 | ) | ||||
|
|
|
| |||||
Net increase (decrease) in shares outstanding before conversion | (133,200 | ) | (807,877 | ) | ||||
Shares issued upon conversion from Class B and Class Z | 49,694 | 527,277 | ||||||
Shares reacquired upon conversion into Class Z | (86,309 | ) | (953,389 | ) | ||||
|
|
|
| |||||
Net increase (decrease) in shares outstanding | (169,815 | ) | $ | (1,233,989 | ) | |||
|
|
|
| |||||
Year ended August 31, 2012: | ||||||||
Shares sold | 942,686 | $ | 10,190,329 | |||||
Shares issued in reinvestment of dividends | 482,638 | 5,200,141 | ||||||
Shares reacquired | (1,925,478 | ) | (20,754,048 | ) | ||||
|
|
|
| |||||
Net increase (decrease) in shares outstanding before conversion | (500,154 | ) | (5,363,578 | ) | ||||
Shares issued upon conversion from Class B and Class Z | 60,050 | 633,752 | ||||||
Shares reacquired upon conversion into Class Z | (32,295 | ) | (348,045 | ) | ||||
|
|
|
| |||||
Net increase (decrease) in shares outstanding | (472,399 | ) | $ | (5,077,871 | ) | |||
|
|
|
| |||||
Class B | ||||||||
Year ended August 31, 2013: | ||||||||
Shares sold | 184,681 | $ | 2,038,359 | |||||
Shares issued in reinvestment of dividends | 17,541 | 191,841 | ||||||
Shares reacquired | (119,311 | ) | (1,309,037 | ) | ||||
|
|
|
| |||||
Net increase (decrease) in shares outstanding before conversion | 82,911 | 921,163 | ||||||
Shares reacquired upon conversion into Class A | (13,959 | ) | (152,887 | ) | ||||
|
|
|
| |||||
Net increase (decrease) in shares outstanding | 68,952 | $ | 768,276 | |||||
|
|
|
| |||||
Year ended August 31, 2012: | ||||||||
Shares sold | 179,469 | $ | 1,942,600 | |||||
Shares issued in reinvestment of dividends | 16,611 | 179,006 | ||||||
Shares reacquired | (196,707 | ) | (2,137,099 | ) | ||||
|
|
|
| |||||
Net increase (decrease) in shares outstanding before conversion | (627 | ) | (15,493 | ) | ||||
Shares reacquired upon conversion into Class A | (59,775 | ) | (631,045 | ) | ||||
|
|
|
| |||||
Net increase (decrease) in shares outstanding | (60,402 | ) | $ | (646,538 | ) | |||
|
|
|
| |||||
| 42 |
Class C | Shares | Amount | ||||||
Year ended August 31, 2013: | ||||||||
Shares sold | 690,706 | $ | 7,672,461 | |||||
Shares issued in reinvestment of dividends | 52,348 | 572,174 | ||||||
Shares reacquired | (533,378 | ) | (5,736,456 | ) | ||||
|
|
|
| |||||
Net increase (decrease) in shares outstanding before conversion | 209,676 | 2,508,179 | ||||||
Shares reacquired upon conversion into Class Z | (29,003 | ) | (315,630 | ) | ||||
|
|
|
| |||||
Net increase (decrease) in shares outstanding | 180,673 | $ | 2,192,549 | |||||
|
|
|
| |||||
Year ended August 31, 2012: | ||||||||
Shares sold | 513,154 | $ | 5,518,333 | |||||
Shares issued in reinvestment of dividends | 45,530 | 491,285 | ||||||
Shares reacquired | (230,562 | ) | (2,489,646 | ) | ||||
|
|
|
| |||||
Net increase (decrease) in shares outstanding before conversion | 328,122 | 3,519,972 | ||||||
Shares reacquired upon conversion into Class Z | (6,117 | ) | (67,344 | ) | ||||
|
|
|
| |||||
Net increase (decrease) in shares outstanding | 322,005 | $ | 3,452,628 | |||||
|
|
|
| |||||
Class Z | ||||||||
Year ended August 31, 2013: | ||||||||
Shares sold | 2,324,059 | $ | 25,815,049 | |||||
Shares issued in reinvestment of dividends | 74,619 | 818,551 | ||||||
Shares reacquired | (1,738,758 | ) | (18,956,457 | ) | ||||
|
|
|
| |||||
Net increase (decrease) in shares outstanding before conversion | 659,920 | 7,677,143 | ||||||
Shares issued upon conversion from Class A and Class C | 117,499 | 1,269,019 | ||||||
Shares reacquired upon conversion into Class A | (35,730 | ) | (374,390 | ) | ||||
|
|
|
| |||||
Net increase (decrease) in shares outstanding | 741,689 | $ | 8,571,772 | |||||
|
|
|
| |||||
Year ended August 31, 2012: | ||||||||
Shares sold | 1,245,402 | $ | 13,455,618 | |||||
Shares issued in reinvestment of dividends | 62,019 | 670,229 | ||||||
Shares reacquired | (815,458 | ) | (8,790,235 | ) | ||||
|
|
|
| |||||
Net increase (decrease) in shares outstanding before conversion | 491,963 | 5,335,612 | ||||||
Shares issued upon conversion from Class A and Class C | 38,388 | 415,389 | ||||||
Shares reacquired upon conversion into Class A | (249 | ) | (2,707 | ) | ||||
|
|
|
| |||||
Net increase (decrease) in shares outstanding | 530,102 | $ | 5,748,294 | |||||
|
|
|
| |||||
Note 7. Borrowings
The Fund, along with other affiliated registered investment companies (the “Funds”), is a party to a Syndicated Credit Agreement (“SCA”) with a group of banks. The purpose of the SCA is to provide an alternative source of temporary funding for capital share redemptions. The SCA provides for a commitment of $900 million for the period November 15, 2012 through November 14, 2013. The Funds pay an annualized commitment fee of 0.08% on the unused portion of the SCA. Prior to
| Prudential California Muni Income Fund | 43 |
Notes to Financial Statements
continued
November 15, 2012, the Funds had another Syndicated Credit Agreement with substantially similar terms. Interest on any borrowings under the SCA is paid at contracted market rates. The commitment fee for the unused amount is accrued daily and paid quarterly.
The Fund did not utilize the SCA during the year ended August 31, 2013.
Note 8. New Accounting Pronouncement
In January 2013, the Financial Accounting Standards Board (“FASB”) issued Accounting Standards Update (“ASU”) No. 2013-01 “Clarifying the Scope of Disclosures about Offsetting Assets and Liabilities” which replaced ASU No. 2011-11 “Disclosures about Offsetting Assets and Liabilities”. The updates create new disclosure requirements requiring entities to disclose both gross and net information for derivatives and other financial instruments that are either offset in the Statement of Assets and Liabilities or subject to an enforceable master netting arrangement or similar agreement. The disclosure requirements are effective for annual reporting periods beginning on or after January 1, 2013 and interim periods within those annual periods. Management is currently evaluating the application of ASU No. 2013-01 and its impact, if any, on the Fund’s financial statements.
| 44 |
Financial Highlights
| Class A Shares | ||||||||||||||||||||
| Year Ended August 31, | ||||||||||||||||||||
| 2013 | 2012 | 2011 | 2010 | 2009 | ||||||||||||||||
| Per Share Operating Performance: | ||||||||||||||||||||
| Net Asset Value, Beginning Of Year | $11.04 | $10.37 | $10.70 | $10.14 | $10.37 | |||||||||||||||
| Income (loss) from investment operations: | ||||||||||||||||||||
| Net investment income | .43 | .45 | .46 | .48 | .47 | |||||||||||||||
| Net realized and unrealized gain (loss) on investment transactions | (.86 | ) | .67 | (.32 | ) | .60 | (.20 | ) | ||||||||||||
| Total from investment operations | (.43 | ) | 1.12 | .14 | 1.08 | .27 | ||||||||||||||
| Less Dividends and Distributions: | ||||||||||||||||||||
| Dividends from net investment income | (.43 | ) | (.45 | ) | (.47 | ) | (.47 | ) | (.46 | ) | ||||||||||
| Distributions from net realized gains | - | - | - | (.05 | ) | (.04 | ) | |||||||||||||
| Total dividends and distributions | (.43 | ) | (.45 | ) | (.47 | ) | (.52 | ) | (.50 | ) | ||||||||||
| Capital Contributions(e): | - | - | - | - | (d) | - | ||||||||||||||
| Net asset value, end of year | $10.18 | $11.04 | $10.37 | $10.70 | $10.14 | |||||||||||||||
| Total Return(a): | (4.15)% | 11.06% | 1.48% | 10.96% | 2.94% | |||||||||||||||
| Ratios/Supplemental Data: | ||||||||||||||||||||
| Net assets, end of year (000) | $143,901 | $157,985 | $153,302 | $176,414 | $171,357 | |||||||||||||||
| Average net assets (000) | $161,292 | $156,959 | $158,860 | $173,193 | $170,257 | |||||||||||||||
| Ratios to average net assets: | ||||||||||||||||||||
| Expenses(b) | .91% | .92% | .92% | .90% | .89% | |||||||||||||||
| Net investment income | 3.93% | 4.21% | 4.55% | 4.60% | 4.82% | |||||||||||||||
| Portfolio turnover rate | 21% | (c) | 18% | (c) | 11% | (c) | 19% | (c) | 30% | (c) | ||||||||||
(a) Total return does not consider the effects of sales loads. Total return is calculated assuming a purchase of a share on the first day and a sale on the last day of each year reported and includes reinvestment of dividends and distributions. Total returns may reflect adjustments to conform to generally accepted accounting principles.
(b) The distributor of the Fund has contractually agreed to limit its distribution and service (12b-1) fees to ..25% of the average daily net assets of the Class A Shares.
(c) The portfolio turnover rate including variable rate demand notes was 42%, 35%, 27%, 38% and 53% for the years ended August 31, 2013, 2012, 2011, 2010 and 2009, respectively.
(d) Less than $.005 per share.
(e) The Fund received payment of $4,464 related to a former affiliate’s settlement of regulatory proceedings involving allegations of improper trading in Fund shares during the fiscal year ended August 31, 2010. The Fund was not involved in the proceedings or in calculation of the amount of settlement.
See Notes to Financial Statements.
| Prudential California Muni Income Fund | 45 |
Financial Highlights
continued
| Class B Shares | ||||||||||||||||||||
| Year Ended August 31, | ||||||||||||||||||||
| 2013 | 2012 | 2011 | 2010 | 2009 | ||||||||||||||||
| Per Share Operating Performance: | ||||||||||||||||||||
| Net Asset Value, Beginning Of Year | $11.04 | $10.37 | $10.70 | $10.14 | $10.37 | |||||||||||||||
| Income (loss) from investment operations: | ||||||||||||||||||||
| Net investment income | .40 | .43 | .44 | .45 | .45 | |||||||||||||||
| Net realized and unrealized gain (loss) on investment transactions | (.86 | ) | .67 | (.33 | ) | .60 | (.20 | ) | ||||||||||||
| Total from investment operations | (.46 | ) | 1.10 | .11 | 1.05 | .25 | ||||||||||||||
| Less Dividends and Distributions: | ||||||||||||||||||||
| Dividends from net investment income | (.40 | ) | (.43 | ) | (.44 | ) | (.44 | ) | (.44 | ) | ||||||||||
| Distributions from net realized gains | - | - | - | (.05 | ) | (.04 | ) | |||||||||||||
| Total dividends and distributions | (.40 | ) | (.43 | ) | (.44 | ) | (.49 | ) | (.48 | ) | ||||||||||
| Capital Contributions(d): | - | - | - | - | (c) | - | ||||||||||||||
| Net asset value, end of year | $10.18 | $11.04 | $10.37 | $10.70 | $10.14 | |||||||||||||||
| Total Return(a): | (4.39)% | 10.78% | 1.24% | 10.68% | 2.69% | |||||||||||||||
| Ratios/Supplemental Data: | ||||||||||||||||||||
| Net assets, end of year (000) | $6,650 | $6,453 | $6,688 | $7,444 | $8,861 | |||||||||||||||
| Average net assets (000) | $7,061 | $6,552 | $6,627 | $7,692 | $9,922 | |||||||||||||||
| Ratios to average net assets: | ||||||||||||||||||||
| Expenses | 1.16% | 1.17% | 1.17% | 1.15% | 1.14% | |||||||||||||||
| Net investment income | 3.69% | 3.96% | 4.30% | 4.35% | 4.57% | |||||||||||||||
| Portfolio turnover rate | 21% | (b) | 18% | (b) | 11% | (b) | 19% | (b) | 30% | (b) | ||||||||||
(a) Total return does not consider the effects of sales loads. Total return is calculated assuming a purchase of a share on the first day and a sale on the last day of each year reported and includes reinvestment of dividends and distributions. Total returns may reflect adjustments to conform to generally accepted accounting principles.
(b) The portfolio turnover rate including variable rate demand notes was 42%, 35%, 27%, 38% and 53% for the years ended August 31, 2013, 2012, 2011, 2010 and 2009, respectively.
(c) Less than $.005 per share.
(d) The Fund received payment of $4,464 related to a former affiliate’s settlement of regulatory proceedings involving allegations of improper trading in Fund shares during the fiscal year ended August 31, 2010. The Fund was not involved in the proceedings or in calculation of the amount of settlement.
See Notes to Financial Statements.
| 46 |
| Class C Shares | ||||||||||||||||||||
| Year Ended August 31, | ||||||||||||||||||||
| 2013 | 2012 | 2011 | 2010 | 2009 | ||||||||||||||||
| Per Share Operating Performance: | ||||||||||||||||||||
| Net Asset Value, Beginning Of Year | $11.04 | $10.37 | $10.70 | $10.14 | $10.37 | |||||||||||||||
| Income (loss) from investment operations: | ||||||||||||||||||||
| Net investment income | .35 | .37 | .40 | .43 | .42 | |||||||||||||||
| Net realized and unrealized gain (loss) on investment transactions | (.87 | ) | .67 | (.33 | ) | .60 | (.20 | ) | ||||||||||||
| Total from investment operations | (.52 | ) | 1.04 | .07 | 1.03 | .22 | ||||||||||||||
| Less Dividends and Distributions: | ||||||||||||||||||||
| Dividends from net investment income | (.34 | ) | (.37 | ) | (.40 | ) | (.42 | ) | (.41 | ) | ||||||||||
| Distributions from net realized gains | - | - | - | (.05 | ) | (.04 | ) | |||||||||||||
| Total dividends and distributions | (.34 | ) | (.37 | ) | (.40 | ) | (.47 | ) | (.45 | ) | ||||||||||
| Capital Contributions(e): | - | - | - | - | (d) | - | ||||||||||||||
| Net asset value, end of year | $10.18 | $11.04 | $10.37 | $10.70 | $10.14 | |||||||||||||||
| Total Return(a): | (4.86)% | 10.24% | .81% | 10.42% | 2.45% | |||||||||||||||
| Ratios/Supplemental Data: | ||||||||||||||||||||
| Net assets, end of year (000) | $22,315 | $22,212 | $17,526 | $19,902 | $14,804 | |||||||||||||||
| Average net assets (000) | $24,809 | $20,195 | $17,612 | $16,699 | $13,172 | |||||||||||||||
| Ratios to average net assets: | ||||||||||||||||||||
| Expenses(b) | 1.66% | 1.67% | 1.58% | 1.40% | 1.39% | |||||||||||||||
| Net investment income | 3.19% | 3.46% | 3.88% | 4.10% | 4.32% | |||||||||||||||
| Portfolio turnover rate | 21% | (c) | 18% | (c) | 11% | (c) | 19% | (c) | 30% | (c) | ||||||||||
(a) Total return does not consider the effects of sales loads. Total return is calculated assuming a purchase of a share on the first day and a sale on the last day of each year reported and includes reinvestment of dividends and distributions. Total returns may reflect adjustments to conform to generally accepted accounting principles.
(b) The distributor of the Fund has contractually agreed to limit its distribution and service (12b-1) fees to ..75% of the average daily net assets of the Class C shares through December 31, 2010.
(c) The portfolio turnover rate including variable rate demand notes was 42%, 35%, 27%, 38% and 53% for the years ended August 31, 2013, 2012, 2011, 2010 and 2009, respectively.
(d) Less than $.005 per share.
(e) The Fund received payment of $4,464 related to a former affiliate’s settlement of regulatory proceedings involving allegations of improper trading in Fund shares during the fiscal year ended August 31, 2010. The Fund was not involved in the proceedings or in calculation of the amount of settlement.
See Notes to Financial Statements.
| Prudential California Muni Income Fund | 47 |
Financial Highlights
continued
| Class Z Shares | ||||||||||||||||||||
| Year Ended August 31, | ||||||||||||||||||||
| 2013 | 2012 | 2011 | 2010 | 2009 | ||||||||||||||||
| Per Share Operating Performance: | ||||||||||||||||||||
| Net Asset Value, Beginning Of Year | $11.05 | $10.38 | $10.71 | $10.14 | $10.37 | |||||||||||||||
| Income (loss) from investment operations: | ||||||||||||||||||||
| Net investment income | .46 | .48 | .49 | .50 | .50 | |||||||||||||||
| Net realized and unrealized gain (loss) on investment transactions | (.88 | ) | .67 | (.32 | ) | .62 | (.20 | ) | ||||||||||||
| Total from investment operations | (.42 | ) | 1.15 | .17 | 1.12 | .30 | ||||||||||||||
| Less Dividends and Distributions: | ||||||||||||||||||||
| Dividends from net investment income | (.45 | ) | (.48 | ) | (.50 | ) | (.50 | ) | (.49 | ) | ||||||||||
| Distributions from net realized gains | - | - | - | (.05 | ) | (.04 | ) | |||||||||||||
| Total dividends and distributions | (.45 | ) | (.48 | ) | (.50 | ) | (.55 | ) | (.53 | ) | ||||||||||
| Capital Contributions(d): | - | - | - | - | (c) | - | ||||||||||||||
| Net asset value, end of year | $10.18 | $11.05 | $10.38 | $10.71 | $10.14 | |||||||||||||||
| Total Return(a): | (3.99)% | 11.34% | 1.74% | 11.37% | 3.21% | |||||||||||||||
| Ratios/Supplemental Data: | ||||||||||||||||||||
| Net assets, end of year (000) | $36,435 | $31,332 | $23,932 | $19,205 | $9,757 | |||||||||||||||
| Average net assets (000) | $43,284 | $26,847 | $19,328 | $14,668 | $8,616 | |||||||||||||||
| Ratios to average net assets: | ||||||||||||||||||||
| Expenses | .66% | .67% | .67% | .65% | .64% | |||||||||||||||
| Net investment income | 4.18% | 4.46% | 4.79% | 4.84% | 5.07% | |||||||||||||||
| Portfolio turnover rate | 21% | (b) | 18% | (b) | 11% | (b) | 19% | (b) | 30% | (b) | ||||||||||
(a) Total return is calculated assuming a purchase of a share on the first day and a sale on the last day of each year reported and includes reinvestment of dividends and distributions. Total returns may reflect adjustments to conform to generally accepted accounting principles.
(b) The portfolio turnover rate including variable rate demand notes was 42%, 35%, 27%, 38% and 53% for the years ended August 31, 2013, 2012, 2011, 2010 and 2009, respectively.
(c) Less than $.005 per share.
(d) The Fund received payment of $4,464 related to a former affiliate’s settlement of regulatory proceedings involving allegations of improper trading in Fund shares during the fiscal year ended August 31, 2010. The Fund was not involved in the proceedings or in calculation of the amount of settlement.
See Notes to Financial Statements.
| 48 |
Report of Independent Registered Public
Accounting Firm
The Board of Trustees and Shareholders
Prudential Investment Portfolios 6:
We have audited the accompanying statement of assets and liabilities of the Prudential California Muni Income Fund of Prudential Investment Portfolios 6 (hereafter referred to as the “Fund”), including the portfolio of investments, as of August 31, 2013, and the related statement of operations for the year then ended, the statement of changes in net assets for each of the years in the two-year period then ended and the financial highlights for each of the years in the five-year period then ended. These financial statements and financial highlights are the responsibility of the Fund’s management. Our responsibility is to express an opinion on these financial statements and financial highlights based on our audit.
We conducted our audits in accordance with the standards of the Public Company Accounting Oversight Board (United States). Those standards require that we plan and perform the audit to obtain reasonable assurance about whether the financial statements and financial highlights are free of material misstatement. An audit includes examining, on a test basis, evidence supporting the amounts and disclosures in the financial statements. Our procedures included confirmation of securities owned as of August 31, 2013, by correspondence with the custodian, transfer agent and brokers or by other appropriate auditing procedures when replies from brokers were not received. An audit also includes assessing the accounting principles used and significant estimates made by management, as well as evaluating the overall financial statement presentation. We believe that our audits provide a reasonable basis for our opinion.
In our opinion, the financial statements and financial highlights referred to above present fairly, in all material respects, the financial position of the Fund as of August 31, 2013, and the results of its operations for the year then ended, the changes in its net assets for each of the years in the two-year period then ended and the financial highlights for each of the years in the five-year period then ended, in conformity with U.S. generally accepted accounting principles.

New York, New York
October 25, 2013
| Prudential California Muni Income Fund | 49 |
Tax Information
(Unaudited)
During the fiscal year ended August 31, 2013, the Fund reports the maximum amount allowable per share but not less than the following amounts as exempt-interest dividends in accordance with Section 852(b)(5) of the Internal Revenue Code.
| Per Share | ||||||||||||||||
| Class A | Class B | Class C | Class Z | |||||||||||||
Tax-Exempt Dividends | $ | .426 | $ | .398 | $ | .344 | $ | .453 | ||||||||
|
|
|
|
|
|
|
| |||||||||
In January 2014, you will be advised on IRS Form 1099-DIV and/or 1099-INT, if applicable, or substitute forms as to the federal tax status of the dividends received in calendar year 2013.
For more detailed information regarding your state and local taxes, you should contact your tax adviser or the state/local taxing authorities.
| 50 |
INFORMATION ABOUT BOARD MEMBERS AND OFFICERS
(Unaudited)
Information about Board Members and Officers of the Fund is set forth below. Board Members who are not deemed to be “interested persons” of the Fund, as defined in the 1940 Act, are referred to as “Independent Board Members.” Board Members who are deemed to be “interested persons” of the Fund are referred to as “Interested Board Members.” The Board Members are responsible for the overall supervision of the operations of the Fund and perform the various duties imposed on the directors of investment companies by the 1940 Act. The Board in turn elects the Officers, who are responsible for administering the day-to-day operations of the Fund.
Independent Board Members(1) | ||||
Name, Address, Age Position(s) Portfolios Overseen | Principal Occupation(s) During Past Five Years | Other Directorships Held | ||
Ellen S. Alberding (55) Board Member Portfolios Overseen: 64 | President and Board Member, The Joyce Foundation (charitable foundation) (since 2002); Vice Chair, City Colleges of Chicago (community college system) (since 2011); Trustee, Skills for America’s Future (national initiative to connect employers to community colleges) (since 2011); Trustee, National Park Foundation (charitable foundation for national park system) (since 2009); Trustee, Economic Club of Chicago (since 2009). | None. | ||
Kevin J. Bannon (61) Board Member Portfolios Overseen: 64 | Managing Director (since April 2008) and Chief Investment Officer (since October 2008) of Highmount Capital LLC (registered investment adviser); formerly Executive Vice President and Chief Investment Officer (April 1993-August 2007) of Bank of New York Company; President (May 2003-May 2007) of BNY Hamilton Family of Mutual Funds. | Director of Urstadt Biddle Properties (since September 2008). | ||
Linda W. Bynoe (61) Board Member Portfolios Overseen: 64 | President and Chief Executive Officer (since March 1995) and formerly Chief Operating Officer (December 1989-February 1995) of Telemat Ltd. (management consulting); formerly Vice President (January 1985-June 1989) at Morgan Stanley & Co (broker-dealer). | Director of Simon Property Group, Inc. (retail real estate) (May 2003-May 2012); Director of Anixter International, Inc. (communication products distributor) (since January 2006); Director of Northern Trust Corporation (financial services) (since April 2006); Trustee of Equity Residential (residential real estate) (since December 2009). | ||
Prudential California Muni Income Fund
Independent Board Members(1) | ||||
Name, Address, Age Position(s) Portfolios Overseen | Principal Occupation(s) During Past Five Years | Other Directorships Held | ||
Keith F. Hartstein (57) Board Member Portfolios Overseen: 64 | Formerly President and Chief Executive Officer (2005-2012), Senior Vice President (2004-2005), Senior Vice President of Sales and Marketing (1997-2004), and various executive management positions (1990-1997), John Hancock Funds, LLC (asset management); Chairman, Investment Company Institute’s Sales Force Marketing Committee (2003-2008). | None. | ||
Michael S. Hyland, CFA (68) Board Member Portfolios Overseen: 64 | Independent Consultant (since February 2005); formerly Senior Managing Director (July 2001-February 2005) of Bear Stearns & Co, Inc.; Global Partner, INVESCO (1999-2001); Managing Director and President of Salomon Brothers Asset Management (1989-1999). | None. | ||
Douglas H. McCorkindale (74) Board Member Portfolios Overseen: 64 | Formerly Chairman (February 2001-June 2006), Chief Executive Officer (June 2000-July 2005), President (September 1997-July 2005) and Vice Chairman (March 1984-May 2000) of Gannett Co. Inc. (publishing and media). | Director of Lockheed Martin Corp. (aerospace and defense) (since May 2001). | ||
Stephen P. Munn (71) Board Member Portfolios Overseen: 64 | Lead Director (since 2007) and formerly Chairman (1993-2007) of Carlisle Companies Incorporated (manufacturer of industrial products). | Lead Director (since 2007) of Carlisle Companies Incorporated (manufacturer of industrial products). | ||
James E. Quinn (61) Board Member Portfolios Overseen: 64 | Formerly President (2003-2012) and Director (2003-2008), and Vice Chairman and Director (1998-2003), Tiffany & Company (jewelry retailing); Director, Mutual of America Capital Management Corporation (asset management) (since 1996); Director, Hofstra University (since 2008); Vice Chairman, Museum of the City of New York (since 1984). | Director of Deckers Outdoor Corporation (footwear manufacturer) (since 2011). | ||
Richard A. Redeker (70) Board Member & Independent Chair Portfolios Overseen: 64 | Retired Mutual Fund Senior Executive (44 years); Management Consultant; Independent Directors Council (organization of 2,800 Independent Mutual Fund Directors)-Executive Committee, Chair of Policy Steering Committee, Governing Council. | None. | ||
Visit our website at www.prudentialfunds.com
Independent Board Members(1) | ||||
Name, Address, Age Position(s) Portfolios Overseen | Principal Occupation(s) During Past Five Years | Other Directorships Held | ||
Robin B. Smith (74) Board Member Portfolios Overseen: 64 | Chairman of the Board (since January 2003) of Publishers Clearing House (direct marketing); Member of the Board of Directors of ADLPartner (marketing) (since December 2010); formerly Chairman and Chief Executive Officer (August 1996-January 2003) of Publishers Clearing House. | Formerly Director of BellSouth Corporation (telecommunications) (1992-2006). | ||
Stephen G. Stoneburn (70) Board Member Portfolios Overseen: 64 | Chairman, (since July 2011), President and Chief Executive Officer (since June 1996) of Quadrant Media Corp. (publishing company); formerly President (June 1995-June 1996) of Argus Integrated Media, Inc.; Senior Vice President and Managing Director (January 1993-1995) of Cowles Business Media; Senior Vice President of Fairchild Publications, Inc. (1975-1989). | None. | ||
Interested Board Members(1) | ||||
Name, Address, Age Position(s) Portfolios Overseen | Principal Occupation(s) During Past Five Years | Other Directorships Held | ||
Stuart S. Parker (51) Board Member & President Portfolios Overseen: 59 | President of Prudential Investments LLC (since January 2012); Executive Vice President of Prudential Investment Management Services LLC (since December 2012); Executive Vice President of Jennison Associates LLC and Head of Retail Distribution of Prudential Investments LLC (June 2005-December 2011). | None. | ||
Scott E. Benjamin (40) Board Member & Vice President Portfolios Overseen: 64 | Executive Vice President (since June 2009) of Prudential Investments LLC; Executive Vice President (June 2009-June 2012) and Vice President (since June 2012) of Prudential Investment Management Services LLC; Executive Vice President (since September 2009) of AST Investment Services, Inc.; Senior Vice President of Product Development and Marketing, Prudential Investments (since February 2006); Vice President of Product Development and Product Management, Prudential Investments (2003-2006). | None. | ||
Prudential California Muni Income Fund
| (1) | The year in which each individual joined the Fund’s Board is as follows: |
Ellen S. Alberding, 2013; Kevin J. Bannon, 2008; Linda W. Bynoe, 2005; Keith F. Hartstein, 2013; Michael S. Hyland, 2008; Douglas H. McCorkindale, 2003, Stephen P. Munn, 2008; James E. Quinn, 2013; Richard A. Redeker, 1993; Robin B. Smith, 2003; Stephen G. Stoneburn, 2003; Stuart S. Parker, Board Member and President since 2012; Scott E. Benjamin, Board Member since 2010 and Vice President since 2009.
Fund Officers(a) | ||||
Name, Address and Age Position with Fund | Principal Occupation(s) During Past Five Years | Length of Service as Fund Officer | ||
Raymond A. O’Hara (58) Chief Legal Officer | Vice President and Corporate Counsel (since July 2010) of Prudential Insurance Company of America (Prudential); Vice President (March 2011-Present) of Pruco Life Insurance Company and Pruco Life Insurance Company of New Jersey; Vice President and Corporate Counsel (March 2011-Present) of Prudential Annuities Life Assurance Corporation; Chief Legal Officer of Prudential Investments LLC (since June 2012); Chief Legal Officer of Prudential Mutual Fund Services LLC (since June 2012) and Corporate Counsel of AST Investment Services, Inc. (since June 2012); formerly Assistant Vice President and Corporate Counsel (September 2008-July 2010) of The Hartford Financial Services Group, Inc.; formerly Associate (September 1980-December 1987) and Partner (January 1988–August 2008) of Blazzard & Hasenauer, P.C. (formerly, Blazzard, Grodd & Hasenauer, P.C.). | Since 2012 | ||
Deborah A. Docs (55) Secretary | Vice President and Corporate Counsel (since January 2001) of Prudential; Vice President (since December 1996) and Assistant Secretary (since March 1999) of Prudential Investments LLC; formerly Vice President and Assistant Secretary (May 2003-June 2005) of AST Investment Services, Inc. | Since 2004 | ||
Jonathan D. Shain (55) Assistant Secretary | Vice President and Corporate Counsel (since August 1998) of Prudential; Vice President and Assistant Secretary (since May 2001) of Prudential Investments LLC; Vice President and Assistant Secretary (since February 2001) of Prudential Mutual Fund Services LLC; formerly Vice President and Assistant Secretary (May 2003-June 2005) of AST Investment Services, Inc. | Since 2005 | ||
Claudia DiGiacomo (39) Assistant Secretary | Vice President and Corporate Counsel (since January 2005) of Prudential; Vice President and Assistant Secretary of Prudential Investments LLC (since December 2005); Associate at Sidley Austin Brown & Wood LLP (1999-2004). | Since 2005 | ||
Andrew R. French (50) Assistant Secretary | Vice President and Corporate Counsel (since February 2010) of Prudential; formerly Director and Corporate Counsel (2006-2010) of Prudential; Vice President and Assistant Secretary (since January 2007) of Prudential Investments LLC; Vice President and Assistant Secretary (since January 2007) of Prudential Mutual Fund Services LLC. | Since 2006 | ||
Visit our website at www.prudentialfunds.com
Fund Officers(a) | ||||
Name, Address and Age Position with Fund | Principal Occupation(s) During Past Five Years | Length of Service as Fund Officer | ||
Amanda S. Ryan (35) Assistant Secretary | Director and Corporate Counsel (since March 2012) of Prudential; Director and Assistant Secretary (since June 2012) of Prudential Investments LLC; Associate at Ropes & Gray LLP (2008-2012). | Since 2012 | ||
Bruce Karpati (43) Chief Compliance Officer | Chief Compliance Officer of the Prudential Investments Funds, Target Funds, Advanced Series Trust, the Prudential Series Fund and Prudential’s Gibraltar Fund, Inc. (May 2013 - Present); formerly National Chief (May 2012 - May 2013) and Co-Chief (January 2010 - May 2012) of the Asset Management Unit, Division of Enforcement, of the U.S. Securities and Exchange Commission; Assistant Regional Director (January 2005 - January 2010) of the U.S. Securities and Exchange Commission. | Since 2013 | ||
Theresa C. Thompson (51) Deputy Chief Compliance Officer | Vice President, Compliance, Prudential Investments LLC (since April 2004); and Director, Compliance, Prudential Investments LLC (2001-2004). | Since 2008 | ||
Richard W. Kinville (45) Anti-Money Laundering Compliance Officer | Vice President, Corporate Compliance, Anti-Money Laundering Unit (since January 2005) of Prudential; committee member of the American Council of Life Insurers Anti-Money Laundering and Critical Infrastructure Committee (since January 2007); formerly Investigator and Supervisor in the Special Investigations Unit for the New York Central Mutual Fire Insurance Company (August 1994-January 1999); Investigator in AXA Financial’s Internal Audit Department and Manager in AXA’s Anti-Money Laundering Office (January 1999-January 2005); first chair of the American Council of Life Insurers Anti-Money Laundering and Critical Infrastructure Committee (June 2007-December 2009). | Since 2011 | ||
Grace C. Torres (54) Treasurer and Principal Financial and Accounting Officer | Assistant Treasurer (since March 1999) and Senior Vice President (since September 1999) of Prudential Investments LLC; Assistant Treasurer (since May 2003) and Vice President (since June 2005) of AST Investment Services, Inc.; Senior Vice President and Assistant Treasurer (since May 2003) of Prudential Annuities Advisory Services, Inc.; formerly Senior Vice President (May 2003-June 2005) of AST Investment Services, Inc. | Since 1998 | ||
M. Sadiq Peshimam (49) Assistant Treasurer | Vice President (since 2005) of Prudential Investments LLC. | Since 2006 | ||
Peter Parrella (55) Assistant Treasurer | Vice President (since 2007) and Director (2004-2007) within Prudential Mutual Fund Administration; formerly Tax Manager at SSB Citi Fund Management LLC (1997-2004). | Since 2007 | ||
| (a) | Excludes Mr. Parker and Mr. Benjamin, interested Board Members who also serve as President and Vice President, respectively. |
Prudential California Muni Income Fund
| (1) | The year in which each individual became an Officer of the Fund is as follows: |
Raymond A. O’Hara, 2012; Deborah A. Docs, 1998; Jonathan D. Shain, 2004; Claudia DiGiacomo, 2005; Andrew R. French, 2006; Amanda S. Ryan, 2012; Timothy J. Knierim, 2007; Valerie M. Simpson, 2007; Theresa C. Thompson, 2008; Richard W. Kinville, 2011; Grace C. Torres, 1996; Peter Parrella, 2007; M. Sadiq Peshimam, 2006.
Explanatory Notes to Tables:
| • | Board Members are deemed to be “Interested,” as defined in the 1940 Act, by reason of their affiliation with Prudential Investments LLC and/or an affiliate of Prudential Investments LLC. |
| • | Unless otherwise noted, the address of all Board Members and Officers is c/o Prudential Investments LLC, Gateway Center Three, 100 Mulberry Street, Newark, New Jersey 07102-4077. |
| • | There is no set term of office for Board Members or Officers. The Board Members have adopted a retirement policy, which calls for the retirement of Board Members on December 31 of the year in which they reach the age of 75. |
| • | “Other Directorships Held” includes only directorships of companies required to register or file reports with the SEC under the 1934 Act (that is, “public companies”) or other investment companies registered under the 1940 Act. |
| • | “Portfolios Overseen” includes all investment companies managed by Prudential Investments LLC. The investment companies for which Prudential Investments LLC serves as manager include the Prudential Investments Mutual Funds, The Prudential Variable Contract Accounts, Target Mutual Funds, Prudential Short Duration High Yield Fund, Inc., Prudential Global Short Duration High Yield Fund, Inc., The Prudential Series Fund, Prudential’s Gibraltar Fund, Inc. and the Advanced Series Trust. |
Visit our website at www.prudentialfunds.com
Approval of Advisory Agreements
The Fund’s Board of Trustees
The Board of Trustees (the “Board”) of the Prudential California Muni Income Fund (the “Fund”)1 consists of ten individuals, eight of whom are not “interested persons” of the Fund, as defined in the Investment Company Act of 1940, as amended (the “1940 Act”) (the “Independent Trustees”).2 The Board is responsible for the oversight of the Fund and its operations, and performs the various duties imposed on the directors of investment companies by the 1940 Act. The Independent Trustees have retained independent legal counsel to assist them in connection with their duties. The Chair of the Board is an Independent Trustee. The Board has established three standing committees: the Audit Committee, the Nominating and Governance Committee, and the Investment Committee. Each committee is chaired by, and composed of, Independent Trustees.
Annual Approval of the Fund’s Advisory Agreements
As required under the 1940 Act, the Board determines annually whether to renew the Fund’s management agreement with Prudential Investments LLC (“PI”) and the Fund’s subadvisory agreement with Prudential Investment Management, Inc. (“PIM”). In considering the renewal of the agreements, the Board, including all of the Independent Trustees, met on June 4-6, 2013 and approved the renewal of the agreements through July 31, 2014, after concluding that the renewal of the agreements was in the best interests of the Fund and its shareholders.
In advance of the meetings, the Board requested and received materials relating to the agreements, and had the opportunity to ask questions and request further information in connection with its consideration. Among other things, the Board considered comparative fee information from PI and PIM. Also, the Board considered comparisons with other mutual funds in relevant Peer Universes and Peer Groups, as is further discussed below.
In approving the agreements, the Board, including the Independent Trustees advised by independent legal counsel, considered the factors it deemed relevant, including the nature, quality and extent of services provided by PI and the subadviser, the performance of the Fund, the profitability of PI and its affiliates, expenses and fees, and the potential for economies of scale that may be shared with the Fund and its shareholders as the Fund’s assets grow. In their deliberations, the Trustees did not identify any single factor which alone was responsible for the Board’s decision to approve the agreements with respect to the Fund. In connection with its deliberations, the Board considered information provided by PI throughout the year at regular Board
| 1 | Prudential California Muni Income Fund is the sole outstanding series of Prudential Investment Portfolios 6. |
| 2 | Ms. Alberding and Messrs. Hartstein and Quinn were elected to the Board effective September 1, 2013. |
Prudential California Muni Income Fund
Approval of Advisory Agreements (continued)
meetings, presentations from portfolio managers and other information, as well as information furnished at or in advance of the meetings on June 4-6, 2013.
The Trustees determined that the overall arrangements between the Fund and PI, which serves as the Fund’s investment manager pursuant to a management agreement with the Fund, and between PI and PIM, which serves as subadviser pursuant to the terms of a subadvisory agreement with PI, are in the best interests of the Fund and its shareholders in light of the services performed, fees charged and such other matters as the Trustees considered relevant in the exercise of their business judgment.
The material factors and conclusions that formed the basis for the Trustees’ determinations to approve the renewal of the agreements are discussed separately below.
Nature, Quality, and Extent of Services
The Board requested and received information regarding the nature, quality and extent of services provided to the Fund by PI and PIM. The Board considered the services provided by PI, including but not limited to the oversight of the subadviser, as well as the provision of fund recordkeeping, compliance, and other services to the Fund. With respect to PI’s oversight of the subadviser, the Board noted that PI’s Strategic Investment Research Group (“SIRG”), which is a business unit of PI, is responsible for monitoring and reporting to PI’s senior management on the performance and operations of the subadviser. The Board also considered that PI pays the salaries of all of the officers and non-independent Trustees of the Fund. The Board also considered the investment subadvisory services provided by PIM, as well as compliance with the Fund’s investment restrictions, policies and procedures. The Board considered PI’s evaluation of the subadviser as well as PI’s recommendation, based on its review of the subadviser, to renew the subadvisory agreement.
The Board considered the qualifications, backgrounds and responsibilities of PI’s senior management responsible for the oversight of the Fund and the subadviser, and also considered the qualifications, backgrounds and responsibilities of the subadviser’s portfolio managers who are responsible for the day-to-day management of the Fund. The Board was provided with information pertaining to PI’s and PIM’s organizational structure, senior management, investment operations, and other relevant information pertaining to both PI and PIM. The Board also noted that it received favorable compliance reports from the Fund’s Chief Compliance Officer (“CCO”) as to both PI and PIM.
The Board concluded that it was satisfied with the nature, extent and quality of the investment management services provided by PI and the subadvisory services
Visit our website at www.prudentialfunds.com
provided to the Fund by PIM, and that there was a reasonable basis on which to conclude that the Fund benefits from the services provided by PI and PIM under the management and subadvisory agreements.
Costs of Services and Profits Realized by PI
The Board was provided with information on the profitability of PI and its affiliates in serving as the Fund’s investment manager. The Board discussed with PI the methodology utilized in assembling the information regarding profitability and considered its reasonableness. The Board recognized that it is difficult to make comparisons of profitability from fund management contracts because comparative information is not generally publicly available and is affected by numerous factors, including the structure of the particular adviser, the types of funds it manages, its business mix, numerous assumptions regarding allocations and the adviser’s capital structure and cost of capital. However, the Board considered that the cost of services provided by PI during the year ended December 31, 2012 exceeded the management fees paid by PI, resulting in an operating loss to PI. The Board also separately considered information regarding the profitability of the subadviser, an affiliate of PI. Taking these factors into account, the Board concluded that the profitability of PI and its affiliates in relation to the services rendered was not unreasonable.
Economies of Scale
The Board noted that the management fee schedule for the Fund includes breakpoints, which have the effect of decreasing the fee rate as assets increase, but at the current level of assets the Fund does not realize the effect of those rate reductions. The Board received and discussed information concerning whether PI realizes economies of scale as the Fund’s assets grow beyond current levels. The Board took note that the Fund’s fee structure would result in benefits to Fund shareholders when (and if) assets reach the levels at which the fee rate is reduced. These benefits will accrue whether or not PI is then realizing any economies of scale. The Board recognized the inherent limitations of any analysis of economies of scale, stemming largely from the Board’s understanding that most of PI’s costs are not specific to any individual funds, but rather are incurred across a variety of products and services.
Other Benefits to PI and PIM
The Board considered potential ancillary benefits that might be received by PI and PIM and their affiliates as a result of their relationship with the Fund. The Board concluded that potential benefits to be derived by PI included fees received by affiliates of PI for serving as the Fund’s securities lending agent, transfer agency fees received by the Fund’s transfer agent (which is affiliated with PI), as well as benefits to its reputation or other intangible benefits resulting from PI’s association with the Fund.
Prudential California Muni Income Fund
Approval of Advisory Agreements (continued)
The Board concluded that the potential benefits to be derived by PIM included those generally resulting from an increase in assets under management, specifically, potential access to additional research resources and benefits to its reputation. The Board concluded that the benefits derived by PI and PIM were consistent with the types of benefits generally derived by investment managers and subadvisers to mutual funds.
Performance of the Fund / Fees and Expenses
The Board considered certain additional specific factors and made related conclusions relating to the historical performance of the Fund for the one-, three-, five- and ten-year periods ended December 31, 2012.
The Board also considered the Fund’s actual management fee, as well as the Fund’s net total expense ratio, for the fiscal year ended August 31, 2012. The Board considered the management fee for the Fund as compared to the management fee charged by PI to other funds and the fee charged by other advisers to comparable mutual funds in a Peer Group. The actual management fee represents the fee rate actually paid by Fund shareholders and includes any fee waivers or reimbursements. The net total expense ratio for the Fund represents the actual expense ratio incurred by Fund shareholders.
The mutual funds included in the Peer Universe (the Lipper California Municipal Debt Funds Performance Universe) and the Peer Group were objectively determined by Lipper Inc. (“Lipper”), an independent provider of mutual fund data. The comparisons placed the Fund in various quartiles, with the first quartile being the best 25% of the mutual funds (for performance, the best performing mutual funds and, for expenses, the lowest cost mutual funds).
The section below summarizes key factors considered by the Board and the Board’s conclusions regarding the Fund’s performance, fees and overall expenses. The table sets forth gross performance comparisons (which do not reflect the impact on performance of fund expenses, or any subsidies, expense caps or waivers that may be applicable) with the Peer Universe, actual management fees with the Peer Group (which reflect the impact of any subsidies or fee waivers), and net total expenses with the Peer Group, each of which were key factors considered by the Board.
| Performance | 1 Year | 3 Years | 5 Years | 10 Years | ||||
3rd Quartile | 3rd Quartile | 2nd Quartile | 2nd Quartile | |||||
| Actual Management Fees: 3rd Quartile | ||||||||
| Net Total Expenses: 4th Quartile | ||||||||
| • | The Board noted that the Fund outperformed its benchmark index over all periods. |
Visit our website at www.prudentialfunds.com
| • | The Board considered that the Fund’s actual management fee was only 2 basis points higher than the median. |
| • | The Board concluded that, in light of the Fund’s competitive performance against its benchmark index over all periods and against its Peer Universe over longer time periods, it would be in the best interests of the Fund and its shareholders to renew the agreements. |
| • | The Board concluded that the management fees (including subadvisory fees) and total expenses were reasonable in light of the services provided. |
* * *
After full consideration of these factors, the Board concluded that the approval of the agreements was in the best interests of the Fund and its shareholders.
Prudential California Muni Income Fund
| n MAIL | n TELEPHONE | n WEBSITE | ||
Gateway Center Three 100 Mulberry Street Newark, NJ 07102 | (800) 225-1852 | www.prudentialfunds.com |
| PROXY VOTING |
| The Board of Trustees of the Fund has delegated to the Fund’s investment subadviser the responsibility for voting any proxies and maintaining proxy recordkeeping with respect to the Fund. A description of these proxy voting policies and procedures is available without charge, upon request, by calling (800) 225-1852. Information regarding how the Fund voted proxies relating to portfolio securities during the most recent 12-month period ended June 30 is available on the Fund’s website and on the Securities and Exchange Commission’s website. |
| TRUSTEES |
| Ellen S. Alberding • Kevin J. Bannon • Scott E. Benjamin • Linda W. Bynoe • Keith F. Hartstein • Michael S. Hyland • Douglas H. McCorkindale • Stephen P. Munn • Stuart S. Parker • James E. Quinn • Richard A. Redeker • Robin B. Smith • Stephen G. Stoneburn |
| OFFICERS |
| Stuart S. Parker, President • Scott E. Benjamin, Vice President • Grace C. Torres, Treasurer and Principal Financial and Accounting Officer • Raymond A. O’Hara, Chief Legal Officer • Deborah A. Docs, Secretary • Bruce Karpati, Chief Compliance Officer • Theresa C. Thompson, Deputy Chief Compliance Officer • Richard W. Kinville, Anti-Money Laundering Compliance Officer • Jonathan D. Shain, Assistant Secretary • Claudia DiGiacomo, Assistant Secretary • Amanda S. Ryan, Assistant Secretary • Andrew R. French, Assistant Secretary • M. Sadiq Peshimam, Assistant Treasurer • Peter Parrella, Assistant Treasurer |
| MANAGER | Prudential Investments LLC | Gateway Center Three 100 Mulberry Street Newark, NJ 07102 | ||
| ||||
| INVESTMENT SUBADVISER | Prudential Investment Management, Inc. | Gateway Center Two 100 Mulberry Street Newark, NJ 07102 | ||
| ||||
| DISTRIBUTOR | Prudential Investment Management Services LLC | Gateway Center Three 100 Mulberry Street | ||
| ||||
| CUSTODIAN | The Bank of New York Mellon | One Wall Street New York, NY 10286 | ||
| ||||
| TRANSFER AGENT | Prudential Mutual Fund Services LLC | PO Box 9658 Providence, RI 02940 | ||
| ||||
| INDEPENDENT REGISTERED PUBLIC ACCOUNTING FIRM | KPMG LLP | 345 Park Avenue New York, NY 10154 | ||
| ||||
| FUND COUNSEL | Willkie Farr & Gallagher LLP | 787 Seventh Avenue New York, NY 10019 | ||
| An investor should consider the investment objectives, risks, charges, and expenses of the Fund carefully before investing. The prospectus and summary prospectus contain this and other information about the Fund. An investor may obtain a prospectus and summary prospectus by visiting our website at www.prudentialfunds.com or by calling (800) 225-1852. The prospectus and summary prospectus should be read carefully before investing. |
| E-DELIVERY |
| To receive your mutual fund documents online, go to www.prudentialfunds.com/edelivery and enroll. Instead of receiving printed documents by mail, you will receive notification via email when new materials are available. You can cancel your enrollment or change your email address at any time by visiting the website address above. |
| SHAREHOLDER COMMUNICATIONS WITH TRUSTEES |
| Shareholders can communicate directly with the Board of Trustees by writing to the Chair of the Board, Prudential California Muni Income Fund, Prudential Investments, Attn: Board of Trustees, 100 Mulberry Street, Gateway Center Three, Newark, NJ 07102. Shareholders can communicate directly with an individual Trustee by writing to the same address. Communications are not screened before being delivered to the addressee. |
| AVAILABILITY OF PORTFOLIO SCHEDULE |
| The Fund files its complete schedule of portfolio holdings with the Securities and Exchange Commission for the first and third quarters of each fiscal year on Form N-Q. The Fund’s Forms N-Q are available on the Commission’s website at www.sec.gov. The Fund’s Forms N-Q may also be reviewed and copied at the Commission’s Public Reference Room in Washington, D.C. Information on the operation and location of the Public Reference Room may be obtained by calling 1-800-SEC-0330. The Fund’s schedule of portfolio holdings is also available on the Fund’s website as of the end of each month. |
| The Fund’s Statement of Additional Information contains additional information about the Fund’s Trustees and is available without charge, upon request, by calling (800) 225-1852. |
Mutual Funds:
| ARE NOT INSURED BY THE FDIC OR ANY FEDERAL GOVERNMENT AGENCY | MAY LOSE VALUE | ARE NOT A DEPOSIT OF OR GUARANTEED BY ANY BANK OR ANY BANK AFFILIATE |
PRUDENTIAL CALIFORNIA MUNI INCOME FUND
| SHARE CLASS | A | B | C | Z | ||||
| NASDAQ | PBCAX | PCAIX | PCICX | PCIZX | ||||
| CUSIP | 74440X100 | 74440X209 | 74440X308 | 74440X407 |
MF146E 0252494-00001-00
Item 2 – Code of Ethics — See Exhibit (a)
As of the end of the period covered by this report, the registrant has adopted a code of ethics (the “Section 406 Standards for Investment Companies – Ethical Standards for Principal Executive and Financial Officers”) that applies to the registrant’s Principal Executive Officer and Principal Financial Officer; the registrant’s Principal Financial Officer also serves as the Principal Accounting Officer.
The registrant hereby undertakes to provide any person, without charge, upon request, a copy of the code of ethics. To request a copy of the code of ethics, contact the registrant 800-225-1852, and ask for a copy of the Section 406 Standards for Investment Companies - Ethical Standards for Principal Executive and Financial Officers.
Item 3 – Audit Committee Financial Expert –
The registrant’s Board has determined that Mr. Stephen P. Munn, member of the Board’s Audit Committee is an “audit committee financial expert,” and that he is “independent,” for purposes of this Item.
Item 4 – Principal Accountant Fees and Services –
(a) Audit Fees
For the fiscal years ended August 31, 2013 and August 31, 2012, KPMG LLP (“KPMG”), the Registrant’s principal accountant, billed the Registrant $32,500 and $32,500, respectively, for professional services rendered for the audit of the Registrant’s annual financial statements or services that are normally provided in connection with statutory and regulatory filings.
(b) Audit-Related Fees
None.
(c) Tax Fees
Not applicable for the fiscal year ended August 31, 2013. During the fiscal year ended August 31, 2012, KPMG billed the Registrant $179 for professional services rendered in connection with agreed upon procedures performed related to the receipt of payments pursuant to certain fair fund settlement orders.
(d) All Other Fees
None.
(e) (1) Audit Committee Pre-Approval Policies and Procedures
THE PRUDENTIAL MUTUAL FUNDS
AUDIT COMMITTEE POLICY
on
Pre-Approval of Services Provided by the Independent Accountants
The Audit Committee of each Prudential Mutual Fund is charged with the responsibility to monitor the independence of the Fund’s independent accountants. As part of this responsibility, the Audit Committee must pre-approve any independent accounting firm’s engagement to render audit and/or permissible non-audit services, as required by law. In evaluating a proposed engagement of the independent accountants, the Audit Committee will assess the effect that the engagement might reasonably be expected to have on the accountant’s independence. The Committee’s evaluation will be based on:
| • | a review of the nature of the professional services expected to be provided, |
| • | a review of the safeguards put into place by the accounting firm to safeguard independence, and |
| • | periodic meetings with the accounting firm. |
Policy for Audit and Non-Audit Services Provided to the Funds
On an annual basis, the scope of audits for each Fund, audit fees and expenses, and audit-related and non-audit services (and fees proposed in respect thereof) proposed to be performed by the Fund’s independent accountants will be presented by the Treasurer and the independent accountants to the Audit Committee for review and, as appropriate, approval prior to the initiation of such services. Such presentation shall be accompanied by confirmation by both the Treasurer and the independent accountants that the proposed services will not adversely affect the independence of the independent accountants. Proposed services shall be described in sufficient detail to enable the Audit Committee to assess the appropriateness of such services and fees, and the compatibility of the provision of such services with the auditor’s independence. The Committee shall receive periodic reports on the progress of the audit and other services which are approved by the Committee or by the Committee Chair pursuant to authority delegated in this Policy.
The categories of services enumerated under “Audit Services”, “Audit-related Services”, and “Tax Services” are intended to provide guidance to the Treasurer and the independent accountants as to those categories of services which the Committee believes are generally consistent with the independence of the independent accountants and which the Committee (or the Committee Chair) would expect upon the presentation of specific proposals to pre-approve. The enumerated categories are not intended as an exclusive list of audit, audit-related or tax services, which the Committee (or the Committee Chair) would consider for pre-approval.
Audit Services
The following categories of audit services are considered to be consistent with the role of the Fund’s independent accountants:
| • | Annual Fund financial statement audits |
| • | Seed audits (related to new product filings, as required) |
| • | SEC and regulatory filings and consents |
Audit-related Services
The following categories of audit-related services are considered to be consistent with the role of the Fund’s independent accountants:
| • | Accounting consultations |
| • | Fund merger support services |
| • | Agreed Upon Procedure Reports |
| • | Attestation Reports |
| • | Other Internal Control Reports |
Individual audit-related services that fall within one of these categories and are not presented to the Audit Committee as part of the annual pre-approval process will be subject to pre-approval by the Committee Chair (or any other Committee member on whom this responsibility has been delegated) so long as the estimated fee for those services does not exceed $50,000.
Tax Services
The following categories of tax services are considered to be consistent with the role of the Fund’s independent accountants:
| • | Tax compliance services related to the filing or amendment of the following: |
| • | Federal, state and local income tax compliance; and, |
| • | Sales and use tax compliance |
| • | Timely RIC qualification reviews |
| • | Tax distribution analysis and planning |
| • | Tax authority examination services |
| • | Tax appeals support services |
| • | Accounting methods studies |
| • | Fund merger support services |
| • | Tax consulting services and related projects |
Individual tax services that fall within one of these categories and are not presented to the Audit Committee as part of the annual pre-approval process will be subject to pre-approval by the Committee Chair (or any other Committee member on whom this responsibility has been delegated) so long as the estimated fee for those services does not exceed $50,000.
Other Non-audit Services
Certain non-audit services that the independent accountants are legally permitted to render will be subject to pre-approval by the Committee or by one or more Committee members to whom the Committee has delegated this authority and who will report to the full Committee any pre-approval decisions made pursuant to this Policy. Non-audit services presented for pre-approval pursuant to this paragraph will be accompanied by a confirmation from both the Treasurer and the independent accountants that the proposed services will not adversely affect the independence of the independent accountants.
Proscribed Services
The Fund’s independent accountants will not render services in the following categories of non-audit services:
| • | Bookkeeping or other services related to the accounting records or financial statements of the Fund |
| • | Financial information systems design and implementation |
| • | Appraisal or valuation services, fairness opinions, or contribution-in-kind reports |
| • | Actuarial services |
| • | Internal audit outsourcing services |
| • | Management functions or human resources |
| • | Broker or dealer, investment adviser, or investment banking services |
| • | Legal services and expert services unrelated to the audit |
| • | Any other service that the Public Company Accounting Oversight Board determines, by regulation, is impermissible. |
Pre-approval of Non-Audit Services Provided to Other Entities Within the Prudential Fund Complex
Certain non-audit services provided to Prudential Investments LLC or any of its affiliates that also provide ongoing services to the Prudential Mutual Funds will be subject to pre-approval by the Audit Committee. The only non-audit services provided to these entities that will require pre-approval are those related directly to the operations and financial reporting of the Funds. Individual projects that are not presented to the Audit Committee as part of the annual pre-approval process will be subject to pre-approval by the Committee Chair (or any other Committee member on whom this responsibility has been delegated) so long as the estimated fee for those services does not exceed $50,000. Services presented for pre-approval pursuant to this paragraph will be accompanied by a confirmation from both the Treasurer and the independent accountants that the proposed services will not adversely affect the independence of the independent accountants.
Although the Audit Committee will not pre-approve all services provided to Prudential Investments LLC and its affiliates, the Committee will receive an annual report from the Fund’s independent accounting firm showing the aggregate fees for all services provided to Prudential Investments and its affiliates.
| (e) | (2) Percentage of services referred to in 4(b) – 4(d) that were approved by the audit committee – |
One hundred percent of the services described in Item 4(c) was approved by the audit committee.
(f) Percentage of hours expended attributable to work performed by other than full time employees of principal accountant if greater than 50%.
The percentage of hours expended on the principal accountant’s engagement to audit the registrant’s financial statements for the most recent fiscal year that were attributed to work performed by persons other than the principal accountant’s full-time, permanent employees was 0%.
(g) Non-Audit Fees
Not applicable to Registrant for the fiscal years 2013 and 2012. The aggregate non-audit fees billed by KPMG for services rendered to the registrant’s investment adviser and any entity controlling, controlled by, or under common control with the investment adviser that provides ongoing services to the registrant for the fiscal years 2013 and 2012 was $0 and $0, respectively.
(h) Principal Accountant’s Independence
Not applicable as KPMG has not provided non-audit services to the registrant’s investment adviser and any entity controlling, controlled by, or under common control with the investment adviser that provides ongoing services to the registrant that were not pre-approved pursuant to Rule 2-01(c)(7)(ii) of Regulation S-X.
Item 5 – Audit Committee of Listed Registrants – Not applicable.
Item 6 – Schedule of Investments – The schedule is included as part of the report to shareholders filed under Item 1 of this Form.
| Item 7 – | Disclosure of Proxy Voting Policies and Procedures for Closed-End Management Investment Companies – Not applicable. |
| Item 8 – | Portfolio Managers of Closed-End Management Investment Companies – Not applicable. |
| Item 9 – | Purchases of Equity Securities by Closed-End Management Investment Company and Affiliated Purchasers – Not applicable. |
Item 10 – Submission of Matters to a Vote of Security Holders – Not applicable.
Item 11 – Controls and Procedures
| (a) | It is the conclusion of the registrant’s principal executive officer and principal financial officer that the effectiveness of the registrant’s current disclosure controls and procedures (such disclosure controls and procedures having been evaluated within 90 days of the date of this filing) provide reasonable assurance that the information required to be disclosed by the registrant has been recorded, processed, summarized and reported within the time period specified in the Commission’s rules and forms and that the information required to be disclosed by the registrant has been accumulated and communicated to the registrant’s principal executive officer and principal financial officer in order to allow timely decisions regarding required disclosure. |
| (b) | There has been no significant change in the registrant’s internal control over financial reporting that occurred during the registrant’s most recent fiscal quarter of the period covered by this report that has materially affected, or is likely to materially affect, the registrant’s internal control over financial reporting. |
Item 12 – Exhibits
(a) (1) Code of Ethics – Attached hereto as Exhibit EX-99.CODE-ETH
| (2) | Certifications pursuant to Section 302 of the Sarbanes-Oxley Act – Attached hereto as Exhibit EX-99.CERT. |
| (3) | Any written solicitation to purchase securities under Rule 23c-1. – Not applicable. |
(b) Certifications pursuant to Section 906 of the Sarbanes-Oxley Act – Attached hereto as Exhibit EX-99.906CERT.
SIGNATURES
Pursuant to the requirements of the Securities Exchange Act of 1934 and the Investment Company Act of 1940, the registrant has duly caused this report to be signed on its behalf by the undersigned, thereunto duly authorized.
Registrant: Prudential Investment Portfolios 6
| By: | /s/ Deborah A. Docs | |
| Deborah A. Docs | ||
| Secretary | ||
| Date: | October 21, 2013 | |
Pursuant to the requirements of the Securities Exchange Act of 1934 and the Investment Company Act of 1940, this report has been signed below by the following persons on behalf of the registrant and in the capacities and on the dates indicated.
| By: | /s/ Stuart S. Parker | |
| Stuart S. Parker | ||
| President and Principal Executive Officer | ||
| Date: | October 21, 2013 | |
| By: | /s/ Grace C. Torres | |
| Grace C. Torres | ||
| Treasurer and Principal Financial Officer | ||
| Date: | October 21, 2013 | |